Embed Size (px)
Citation preview

Forecasting using R 1
Forecasting using R
Rob J Hyndman
Introduction to Forecasting

Resources
SlidesExercisesTextbookUseful links
robjhyndman.com/eindhoven
Forecasting using R 2

Brief bioProfessor of Statistics, Monash UniversityEditor-in-Chief, International Journal of Forecasting
How my forecasting methodology is used:Pharmaceutical Benefits SchemeCancer incidence and mortalityElectricity demandAgeing populationFertilizer sales
Forecasting using R 3
robjhyndman.com

Brief bioProfessor of Statistics, Monash UniversityEditor-in-Chief, International Journal of Forecasting
How my forecasting methodology is used:Pharmaceutical Benefits SchemeCancer incidence and mortalityElectricity demandAgeing populationFertilizer sales
Forecasting using R 3
robjhyndman.com

Assumptions
This is not an introduction to R. I assume you arebroadly comfortable with R code and the RStudioenvironment.This is not a statistics course. I assume you arefamiliar with concepts such as the mean, standarddeviation, quantiles, regression, normal distribution,likelihood, etc.This is not a theory course. I am not going to deriveanything. I will teach you forecasting tools, when touse them and how to use them most effectively.
Forecasting using R 4

Key reference
Hyndman, R. J. & Athanasopoulos, G. (2014)Forecasting: principles and practice.
OTexts.org/fpp/
Free and onlineData sets in associated R packageR code for examples
Forecasting using R 5

Key reference
Hyndman, R. J. & Athanasopoulos, G. (2014)Forecasting: principles and practice.
OTexts.org/fpp/
Free and onlineData sets in associated R packageR code for examples
Forecasting using R 5
Key reference
Hyndman, R. J. & Athanasopoulos, G. (2014)Forecasting: principles and practice.
OTexts.org/fpp/
Free and onlineData sets in associated R packageR code for examples
Forecasting using R 5

Poll: How experienced are you inforecasting
1 Guru: I wrote the book, done it for decades, now I dothe conference circuit.
2 Expert: It has been my full time job for more than adecade.
3 Skilled: I have been doing it for years.4 Comfortable: I understand it and have done it.5 Learner: I am still learning.6 Beginner: I have heard of it and would like to learn
more.7 Unknown: What is forecasting? Is that what the
weather people do?
Forecasting using R 6

Poll: How proficient are you in using R?
1 Guru: The R core team come to me for advice.2 Expert: I have written several packages on CRAN.3 Skilled: I use it regularly and it is an important part of
my job.4 Comfortable: I use it often and am comfortable with
the tool.5 User: I use it sometimes, but I am often searching
around for the right function.6 Learner: I have used it a few times.7 Beginner: I’ve managed to download and install it.8 Unknown: Why are you speaking like a pirate?
Forecasting using R 7

Which version of R are you using?Version:(try getRversion() if you don’t know)
R 3.3.1R 3.2.xR 2.15.xSomething older.
EditionStandard RStandard R with RStudioRevolution R: Community, Enterprise Workstation orServerSomething else?
Forecasting using R 8

Install required packages
install.packages("fpp", dependencies=TRUE)
Forecasting using R 9

Approximate outlineDay Topic Chapter
1.1 Time series graphics 21.2 The forecaster’s toolbox 21.3 Seasonality and trends 61.4 Exponential smoothing 7
2.1 ETS state space models 72.2 Transformations 22.3 Stationarity and differencing 82.4 Non-seasonal ARIMA models 82.5 Seasonal ARIMA models 8
3.1 Time series cross-validation 23.2 Dynamic regression 93.3 Hierarchical forecasting 93.4 Advanced models 9
Forecasting using R 10

CASE STUDY 1: Paperware company
Forecasting using R 11
Problem: Want forecasts of each ofhundreds of items. Series can be stationary,trended or seasonal. They currently have alarge forecasting program written in-housebut it doesn’t seem to produce sensibleforecasts. They want me to tell them what iswrong and fix it.
Additional information
Program written in COBOL making numerical calculations limited.It is not possible to do any optimisation.Their programmer has little experience in numerical computing.They employ no statisticians and want the program to produceforecasts automatically.

CASE STUDY 1: Paperware companyMethods currently used
A 12 month averageC 6 month averageE straight line regression over last 12 monthsG straight line regression over last 6 monthsH average slope between last year’s and this
year’s values.(Equivalent to differencing at lag 12 and takingmean.)
I Same as H except over 6 months.K I couldn’t understand the explanation.Forecasting using R 12

CASE STUDY 2: PBS
Forecasting using R 13

CASE STUDY 2: PBS
The Pharmaceutical Benefits Scheme (PBS) is theAustralian government drugs subsidy scheme.
Many drugs bought from pharmacies are subsidisedto allow more equitable access to modern drugs.The cost to government is determined by the numberand types of drugs purchased. Currently nearly 1% ofGDP.The total cost is budgeted based on forecasts of drugusage.
Forecasting using R 14

CASE STUDY 2: PBS
Forecasting using R 15

CASE STUDY 2: PBSIn 2001: $4.5 billion budget, under-forecasted by$800~million.Thousands of products. Seasonal demand.Subject to covert marketing, volatile products,uncontrollable expenditure.Although monthly data available for 10 years, dataare aggregated to annual values, and only the firstthree years are used in estimating the forecasts.All forecasts being done with the FORECAST functionin MS-Excel!
Problem: How to do the forecasting better?
Forecasting using R 16
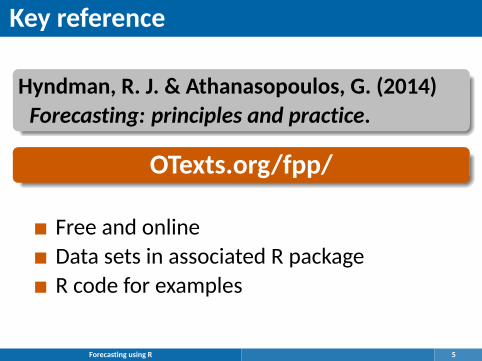
CASE STUDY 3: Airline
Forecasting using R 17

CASE STUDY 3: Airline
0
10
20
30
1988 1989 1990 1991 1992 1993Year
Tho
usan
ds
Economy class passengers: Melbourne−Sydney
Forecasting using R 18

CASE STUDY 3: Airline
0
10
20
30
1988 1989 1990 1991 1992 1993Year
Tho
usan
ds
Economy class passengers: Melbourne−Sydney
Forecasting using R 19
Not the real data! Oris it?

CASE STUDY 3: Airline
Problem: how to forecast passenger traffic on majorroutes?Additional information
They can provide a large amount of data on previousroutes.Traffic is affected by school holidays, special eventssuch as the Grand Prix, advertising campaigns,competition behaviour, etc.They have a highly capable team of people who areable to do most of the computing.
Forecasting using R 20


![Forecasting using R - Rob J. Hyndman · Forecasting using R Box-Cox transformations 12. Automated Box-Cox transformations (BoxCox.lambda (elec)) ## [1] 0.2654076 This attempts to](https://img.pdfslide.net/doc/110x75/60acaadd2a416c65a226ae6a/forecasting-using-r-rob-j-hyndman-forecasting-using-r-box-cox-transformations.jpg)


![Forecasting using - Rob J Hyndman exponential smoothing Forecasting using R Simple exponential smoothing 9 animation by animate[2012/05/24] Simple exponential smoothing Optimization](https://img.pdfslide.net/doc/110x75/5aae58377f8b9a07498bfac5/forecasting-using-rob-j-hyndman-exponential-smoothing-forecasting-using-r-simple.jpg)