Embed Size (px)
Citation preview

Forecasts of Price Level Change Adjustors – 2016 Update
Note to Society of Local Government Managers
September 2016
www.berl.co.nz

Author(s): Dr Ganesh Nana and Konrad Hurren
All work is done, and services rendered at the request of, and for the purposes of the client only. Neither
BERL nor any of its employees accepts any responsibility on any grounds whatsoever, including negligence, to
any other person.
While every effort is made by BERL to ensure that the information, opinions and forecasts provided to the
client are accurate and reliable, BERL shall not be liable for any adverse consequences of the client’s
decisions made in reliance of any report provided by BERL, nor shall BERL be held to have given or implied
any warranty as to whether any report provided by BERL will assist in the performance of the client’s
functions.
©BERL Reference No: #5685 September 2016
Forecasts of Price Level Change Adjustors – 2016 Update September 2016
Making sense of the numbers i
Making sense of the numbers
This report contains forecasts for price level change adjustors for local authorities (LAs) to use in their budget
processes consistent with their Long Term Plans (LTPs). It incorporates the latest actual data to June 2016 and
forecasts the adjustors to June 2027. It continues the work undertaken over previous years.
Using the adjustors
As previously, differences in classifications of activities between councils lead to a degree of subjectivity in
terms of how to apply the adjustors to council expenditures. Last year’s report outlined suggested council
activities and how they might map across to the five adjustors. Using this information, councils can map their
expenditure items (or categories) to appropriate ‘category’ adjustors, and apply the relevant forecast change.
Alternatively, councils can (should they wish) directly use the forecasts for the eight individual price indices,
applying them to relevant expenditure items.
Forecasts
Similar to last year’s picture, the overall forecasts across the five adjustors remain relatively muted when
compared to those of earlier periods.
This is a reflection of a subdued inflationary picture both globally and domestically. It is broadly agreed that
the global economy is in a significant low inflationary period; with the US and Europe in particular close to
deflation. Faltering growth in China, and slow growth in the Eurozone have made for a subdued year; however,
growth in the United States economy is modestly more promising and may offset this somewhat.
With the Christchurch rebuild continuing to slow, the ongoing low level of dairy payouts and the difficult global
picture, there are few sources of sustained inflationary pressures ahead. In line with this context for the New
Zealand economy, these forecasts for price level adjustors present a subdued inflationary outlook for the local
government sector.
Forecasts of Price Level Change Adjustors – 2016 Update September 2016
Contents ii
Contents
1 Introduction .............................................................................................................. 1
1.1 Category adjustors and related price indices .......................................................................................1
1.2 Overall Local Government Cost Index ..................................................................................................2
1.3 LGCI vs CPI ..............................................................................................................................................2
1.4 Individual price indices ..........................................................................................................................3
2 The economic context for the adjustor forecasts .................................................. 4
2.1 General price inflation ...........................................................................................................................4
2.2 NZ macroeconomic picture ...................................................................................................................5
2.3 Global macroeconomic situation ..........................................................................................................6
3 Forecast for adjustors .............................................................................................. 8
3.1 Forecasted category adjustors ..............................................................................................................8
4 Forecast for overall LGCI ........................................................................................ 10
5 Forecasts for eight price indices ............................................................................ 13
Appendix A Equations to explain and forecast eight price indices .......................... 15
Forecasts of Price Level Change Adjustors – 2016 Update September 2016
Contents iii
Tables
Table 1: Category adjustors and related price indices ................................................................................................1
Table 2: Forecast of economic driver variables ...........................................................................................................4
Table 3: Adjustors: Index Jun 2016 = 1000 ..................................................................................................................8
Table 4: Adjustors: % per annum change ....................................................................................................................9
Table 5: Adjustors: Cumulative % change from Jun 2016 ...........................................................................................9
Table 6: LGCI, Index value (Jun 2016 = 1000) ........................................................................................................... 10
Table 7: LGCI, annual average % change ................................................................................................................... 11
Table 8: LGCI, cumulative % change from Jun 2016 ................................................................................................. 12
Table 9: Forecasts for eight price indices, annual average % change ..................................................................... 13
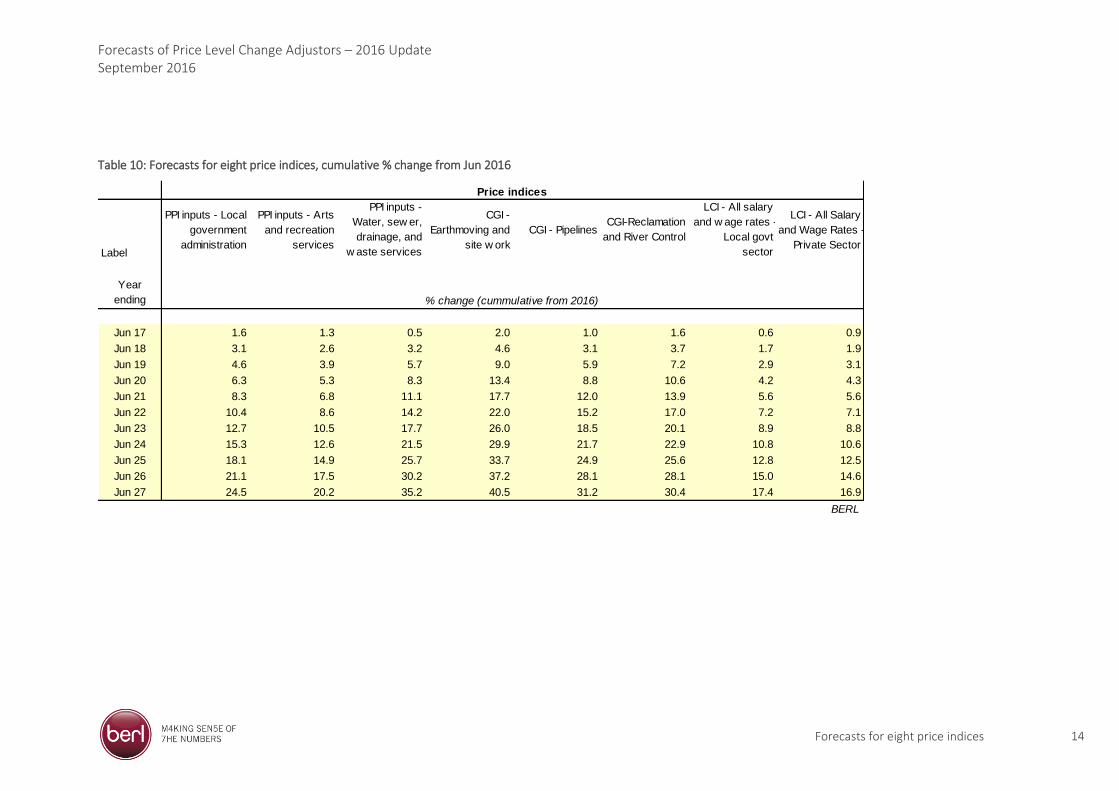
Table 10: Forecasts for eight price indices, cumulative % change from Jun 2016 ................................................. 14
Figures
Figure 1: Average price inflation in New Zealand retail sector ...................................................................................5
Figure 2: Annual GDP and employment growth ..........................................................................................................6
Forecasts of Price Level Change Adjustors – 2016 Update September 2016
Introduction 1
1 Introduction
These notes have been prepared for the Society of Local Government Managers (SOLGM). This document
contains provisional updates of forecasts for price level change adjustors for local authorities (LAs) to use in
their budget processes consistent with their Long-term Plans (LTP). It incorporates the latest actual data to
June 2016 and forecasts the adjustors to June 2026.
Our earlier reports (2005 to 2014) outlined the approach and methodology and discussed alternative adjustors
and reasons why the particular adjustors were chosen for forecasting. Last year a full review of the LGCI and its
subcomponents (i.e. the cost adjustor categories and their associated price indices) was undertaken. This
resulted in some revisions to the adjustors used and the relevant weighting distributions of the LGCI. This
review was undertaken by analysing the Annual Reports for the year ended June 2014 for a sample selection of
12 councils representing a cross-section of the local government sector. A breakdown of this review is
provided in Section 2 of the BERL report titled Forecasts of Price Level Change Adjustors – 2015 Update #5597.
The forecasts provide a medium-term view of the likely movement of the adjustors, rather than the movement
over the next year or two. There will always be unexpected reasons why individual costs might rise faster or
slower in a particular year. However, this does not necessarily mean that the medium-term forecast will, or
should, be adjusted. There will always be regional differences in the rate of change for a particular adjustor.
These adjustors are therefore forecasts at the national level and councils may need to consider if they have
further information to show why a difference might occur at the regional level.
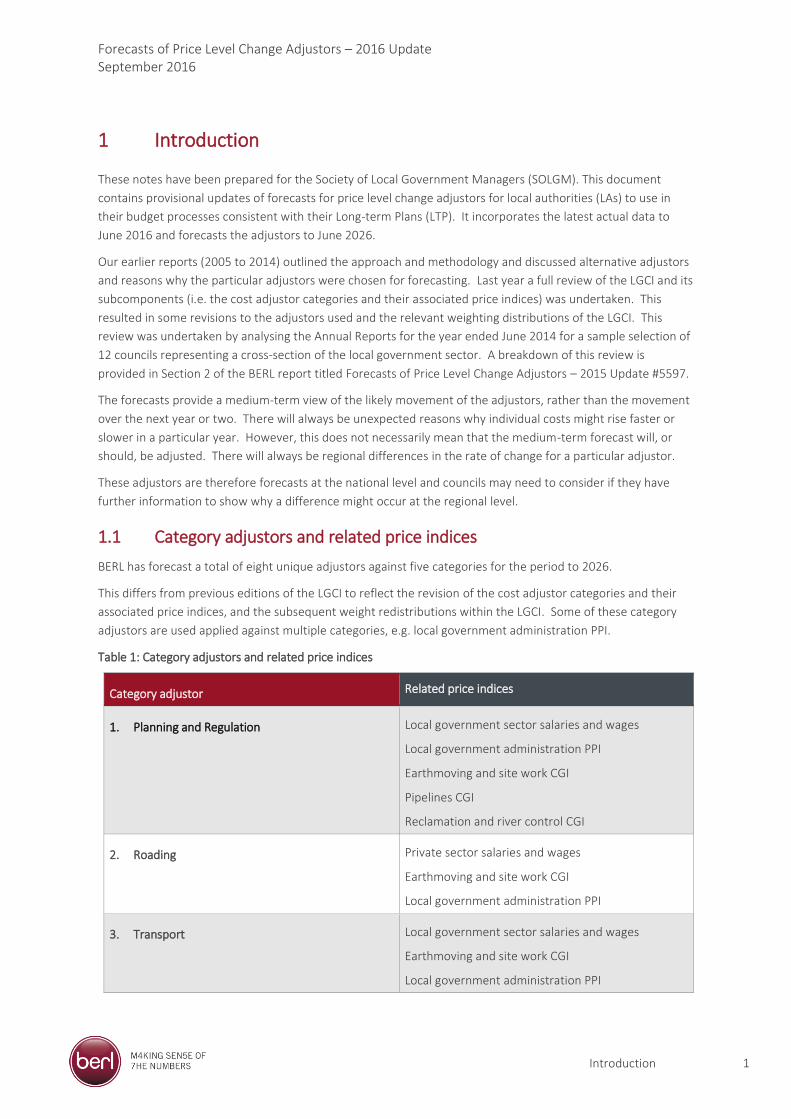
1.1 Category adjustors and related price indices
BERL has forecast a total of eight unique adjustors against five categories for the period to 2026.
This differs from previous editions of the LGCI to reflect the revision of the cost adjustor categories and their
associated price indices, and the subsequent weight redistributions within the LGCI. Some of these category
adjustors are used applied against multiple categories, e.g. local government administration PPI.
Table 1: Category adjustors and related price indices
Category adjustor Related price indices
1. Planning and Regulation Local government sector salaries and wages
Local government administration PPI
Earthmoving and site work CGI
Pipelines CGI
Reclamation and river control CGI
2. Roading
Private sector salaries and wages
Earthmoving and site work CGI
Local government administration PPI
3. Transport Local government sector salaries and wages
Earthmoving and site work CGI
Local government administration PPI
Forecasts of Price Level Change Adjustors – 2016 Update September 2016
Introduction 2
4. Community Activities
Local government sector salaries and wages
Earthmoving and site work CGI
Arts and recreation services PPI
5. Water and Environmental Management Local government sector salaries and wages
Earthmoving and site work CGI
Pipelines CGI
Reclamation and river control CGI
Water, sewer, drainage, and waste services PPI
1.2 Overall Local Government Cost Index
These notes also contain forecasts for an overall cost index for local authorities (LGCI). This index has been
developed by BERL and is reported in ‘A Local Government Cost Index for New Zealand’, BERL reference #4877.
The LGCI is based on the cost structures of local authorities and includes operating expenditure (Opex) and
capital expenditure (Capex) variables.
The operating expenditure of the LGCI includes:
purchases of goods and services, grants and donations, and all other expenditure;
employee costs, which includes wages and salaries; and
interest paid, which includes interest paid on local government debts and is covered by the mortgage
interest component of the CPI.
The capital expenditure of the LGCI includes:
transport, which includes spending on transport projects and in particular roading;
infrastructure spending associated with the three waters; including water supply, wastewater, and
stormwater;
capital expenditure on community facilities such as pools, parks and reserves; and
other, which is capital expenditure not captured elsewhere.
1.3 LGCI vs CPI
An important point to note is the distinction between the LGCI and the Consumers Price Index (CPI). The main
distinction is in the composition of the basket of goods and services that each measures. The basket of goods
and services in the CPI represents the overall expenditure pattern of New Zealand households. These include
items such as food, health, clothing and footwear, and health. Such items are not directly relevant to, and do
not reflect the expenditure of LAs; hence the construction of the LGCI.
The LGCI is intended to reflect the selection and relative importance of the goods and services which represent
broadly the expenditure pattern of LAs in New Zealand. This basket thus includes more directly relevant items
including capital expenditure on pipelines, and earthmoving and site works, and operating expenditure such as
local government sector salary and wage rates.

Forecasts of Price Level Change Adjustors – 2016 Update September 2016
Introduction 3
1.4 Individual price indices
We have maintained and updated a separate local government wage indicator as per previous LGCI reports.
These are provided in section 5, along with forecasts for each of the individual price indices that together make
up the set of adjustors.
Forecasts of Price Level Change Adjustors – 2016 Update September 2016
The economic context for the adjustor forecasts 4
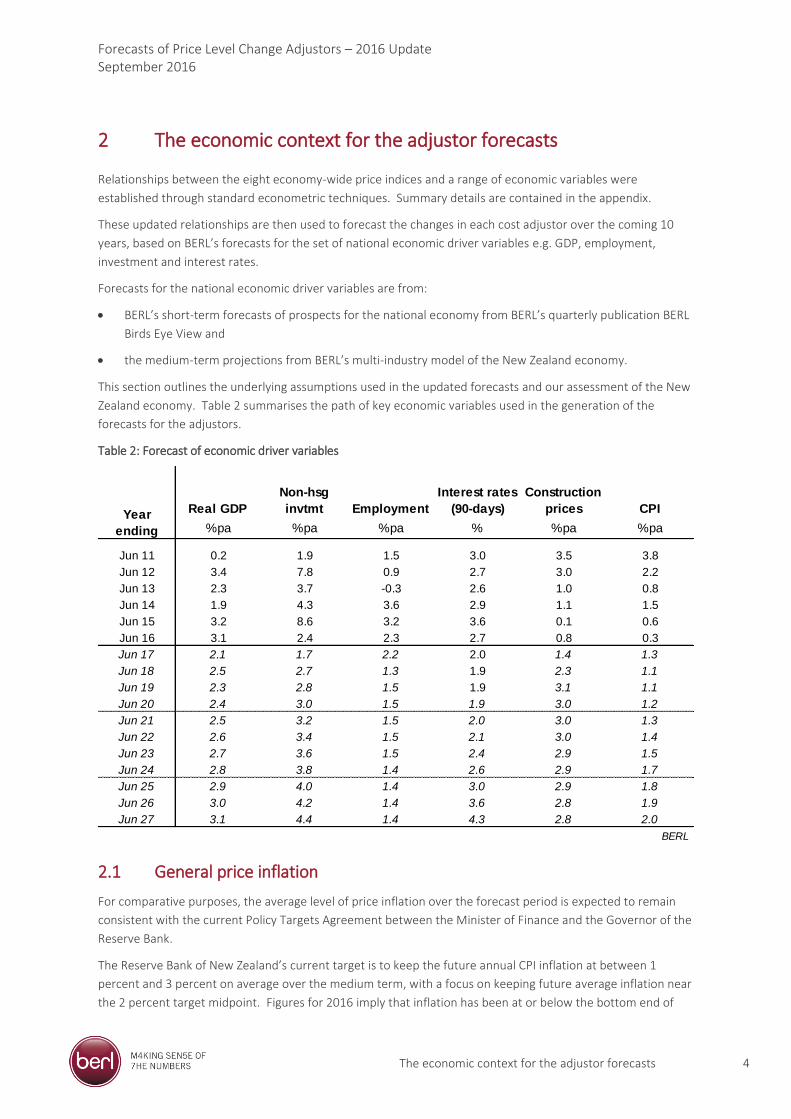
2 The economic context for the adjustor forecasts
Relationships between the eight economy-wide price indices and a range of economic variables were
established through standard econometric techniques. Summary details are contained in the appendix.
These updated relationships are then used to forecast the changes in each cost adjustor over the coming 10
years, based on BERL’s forecasts for the set of national economic driver variables e.g. GDP, employment,
investment and interest rates.
Forecasts for the national economic driver variables are from:
BERL’s short-term forecasts of prospects for the national economy from BERL’s quarterly publication BERL
Birds Eye View and
the medium-term projections from BERL’s multi-industry model of the New Zealand economy.
This section outlines the underlying assumptions used in the updated forecasts and our assessment of the New
Zealand economy. Table 2 summarises the path of key economic variables used in the generation of the
forecasts for the adjustors.
Table 2: Forecast of economic driver variables
2.1 General price inflation
For comparative purposes, the average level of price inflation over the forecast period is expected to remain
consistent with the current Policy Targets Agreement between the Minister of Finance and the Governor of the
Reserve Bank.
The Reserve Bank of New Zealand’s current target is to keep the future annual CPI inflation at between 1
percent and 3 percent on average over the medium term, with a focus on keeping future average inflation near
the 2 percent target midpoint. Figures for 2016 imply that inflation has been at or below the bottom end of
Real GDP
Non-hsg
invtmt Employment
Interest rates
(90-days)
Construction
prices CPI
%pa %pa %pa % %pa %pa
Jun 11 0.2 1.9 1.5 3.0 3.5 3.8
Jun 12 3.4 7.8 0.9 2.7 3.0 2.2
Jun 13 2.3 3.7 -0.3 2.6 1.0 0.8
Jun 14 1.9 4.3 3.6 2.9 1.1 1.5
Jun 15 3.2 8.6 3.2 3.6 0.1 0.6
Jun 16 3.1 2.4 2.3 2.7 0.8 0.3
Jun 17 2.1 1.7 2.2 2.0 1.4 1.3
Jun 18 2.5 2.7 1.3 1.9 2.3 1.1
Jun 19 2.3 2.8 1.5 1.9 3.1 1.1
Jun 20 2.4 3.0 1.5 1.9 3.0 1.2
Jun 21 2.5 3.2 1.5 2.0 3.0 1.3
Jun 22 2.6 3.4 1.5 2.1 3.0 1.4
Jun 23 2.7 3.6 1.5 2.4 2.9 1.5
Jun 24 2.8 3.8 1.4 2.6 2.9 1.7
Jun 25 2.9 4.0 1.4 3.0 2.9 1.8
Jun 26 3.0 4.2 1.4 3.6 2.8 1.9
Jun 27 3.1 4.4 1.4 4.3 2.8 2.0
BERL
Year
ending
Forecasts of Price Level Change Adjustors – 2016 Update September 2016
The economic context for the adjustor forecasts 5
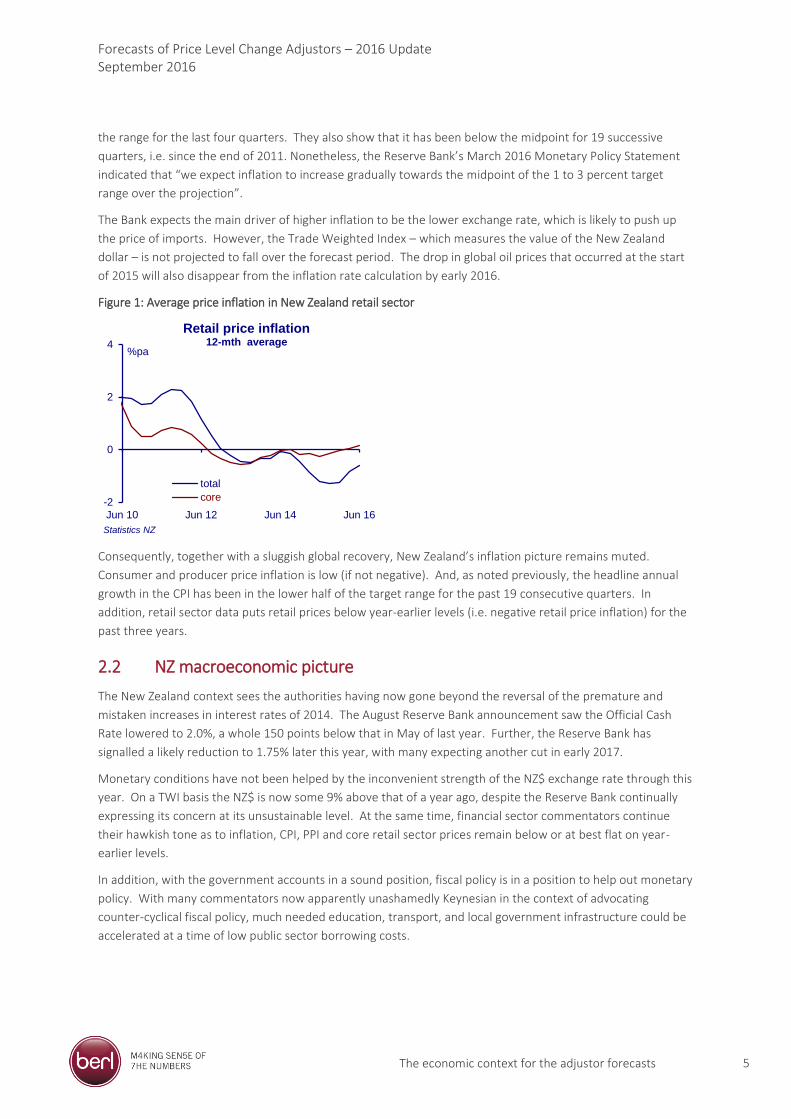
the range for the last four quarters. They also show that it has been below the midpoint for 19 successive
quarters, i.e. since the end of 2011. Nonetheless, the Reserve Bank’s March 2016 Monetary Policy Statement
indicated that “we expect inflation to increase gradually towards the midpoint of the 1 to 3 percent target
range over the projection”.
The Bank expects the main driver of higher inflation to be the lower exchange rate, which is likely to push up
the price of imports. However, the Trade Weighted Index – which measures the value of the New Zealand
dollar – is not projected to fall over the forecast period. The drop in global oil prices that occurred at the start
of 2015 will also disappear from the inflation rate calculation by early 2016.
Figure 1: Average price inflation in New Zealand retail sector
Consequently, together with a sluggish global recovery, New Zealand’s inflation picture remains muted.
Consumer and producer price inflation is low (if not negative). And, as noted previously, the headline annual
growth in the CPI has been in the lower half of the target range for the past 19 consecutive quarters. In
addition, retail sector data puts retail prices below year-earlier levels (i.e. negative retail price inflation) for the
past three years.
2.2 NZ macroeconomic picture
The New Zealand context sees the authorities having now gone beyond the reversal of the premature and
mistaken increases in interest rates of 2014. The August Reserve Bank announcement saw the Official Cash
Rate lowered to 2.0%, a whole 150 points below that in May of last year. Further, the Reserve Bank has
signalled a likely reduction to 1.75% later this year, with many expecting another cut in early 2017.
Monetary conditions have not been helped by the inconvenient strength of the NZ$ exchange rate through this
year. On a TWI basis the NZ$ is now some 9% above that of a year ago, despite the Reserve Bank continually
expressing its concern at its unsustainable level. At the same time, financial sector commentators continue
their hawkish tone as to inflation, CPI, PPI and core retail sector prices remain below or at best flat on year-
earlier levels.
In addition, with the government accounts in a sound position, fiscal policy is in a position to help out monetary
policy. With many commentators now apparently unashamedly Keynesian in the context of advocating
counter-cyclical fiscal policy, much needed education, transport, and local government infrastructure could be
accelerated at a time of low public sector borrowing costs.
-2
0
2
4
Jun 10 Jun 12 Jun 14 Jun 16
%pa
Statistics NZ
Retail price inflation12-mth average
total
core
Forecasts of Price Level Change Adjustors – 2016 Update September 2016
The economic context for the adjustor forecasts 6
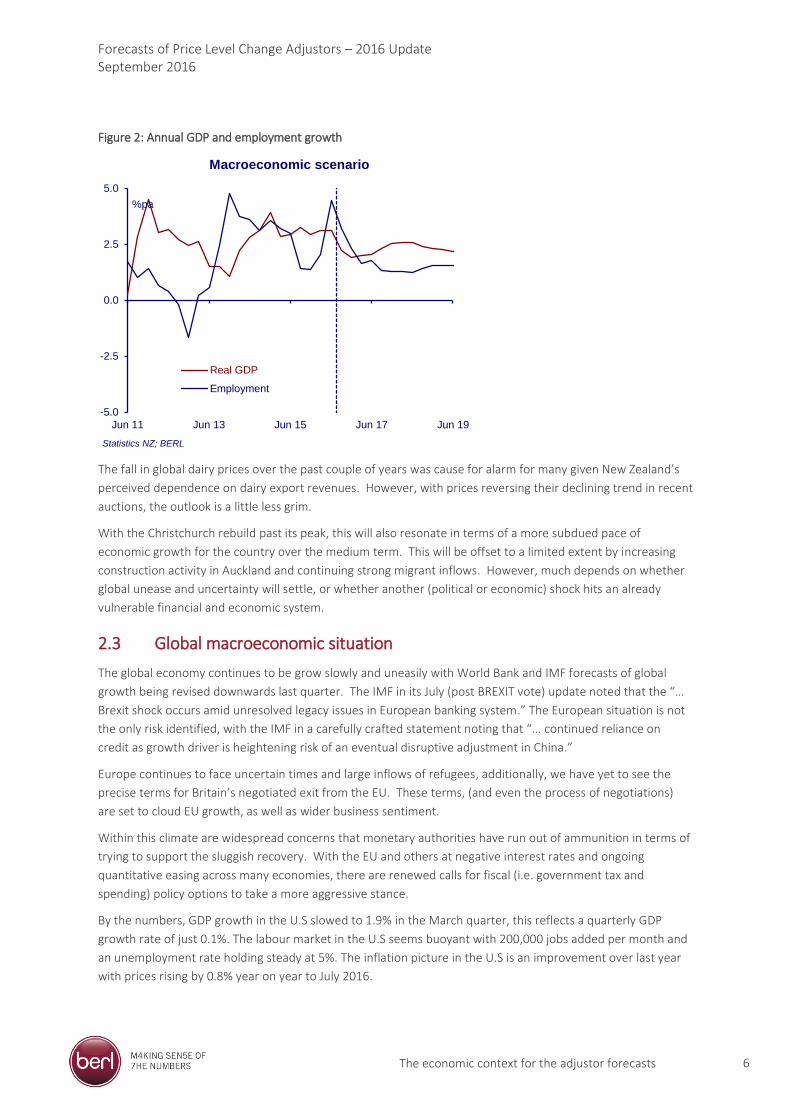
Figure 2: Annual GDP and employment growth
The fall in global dairy prices over the past couple of years was cause for alarm for many given New Zealand’s
perceived dependence on dairy export revenues. However, with prices reversing their declining trend in recent
auctions, the outlook is a little less grim.
With the Christchurch rebuild past its peak, this will also resonate in terms of a more subdued pace of
economic growth for the country over the medium term. This will be offset to a limited extent by increasing
construction activity in Auckland and continuing strong migrant inflows. However, much depends on whether
global unease and uncertainty will settle, or whether another (political or economic) shock hits an already
vulnerable financial and economic system.
2.3 Global macroeconomic situation
The global economy continues to be grow slowly and uneasily with World Bank and IMF forecasts of global
growth being revised downwards last quarter. The IMF in its July (post BREXIT vote) update noted that the “…
Brexit shock occurs amid unresolved legacy issues in European banking system.” The European situation is not
the only risk identified, with the IMF in a carefully crafted statement noting that “… continued reliance on
credit as growth driver is heightening risk of an eventual disruptive adjustment in China.”
Europe continues to face uncertain times and large inflows of refugees, additionally, we have yet to see the
precise terms for Britain’s negotiated exit from the EU. These terms, (and even the process of negotiations)
are set to cloud EU growth, as well as wider business sentiment.
Within this climate are widespread concerns that monetary authorities have run out of ammunition in terms of
trying to support the sluggish recovery. With the EU and others at negative interest rates and ongoing
quantitative easing across many economies, there are renewed calls for fiscal (i.e. government tax and
spending) policy options to take a more aggressive stance.
By the numbers, GDP growth in the U.S slowed to 1.9% in the March quarter, this reflects a quarterly GDP
growth rate of just 0.1%. The labour market in the U.S seems buoyant with 200,000 jobs added per month and
an unemployment rate holding steady at 5%. The inflation picture in the U.S is an improvement over last year
with prices rising by 0.8% year on year to July 2016.
-5.0
-2.5
0.0
2.5
5.0
Jun 11 Jun 13 Jun 15 Jun 17 Jun 19
%pa
Statistics NZ; BERL
Macroeconomic scenario
Real GDP
Employment
Forecasts of Price Level Change Adjustors – 2016 Update September 2016
The economic context for the adjustor forecasts 7
Forecasts suggest that the US economy will strengthen its current growth pattern over the next two years, with
annual GDP growth between 1.5 to 2.0%, which combined with unemployment predicted to fall below 5
percent, will see the US buying more goods and services from the rest of the world.
China’s faltering economic growth has been concerning, with the Chinese government surprising global
markets by devaluing the Yuan by 1.9 percent last year. Also, weaker than expected factory activity has been
reported due to declining domestic and export demand for manufactured goods. The Chinese economy grew
by 6.7% in the year to June 2016. China still holds its official target of 7.0% GDP growth annually however the
IMF forecasts Chinese growth to slow to 6.3% by year’s end.
The EU, particularly the main members, has continued their slow but sure growth out of the last recession,
with an increase of 1.7 percent for the year. The UK has continued their run of strong positive growth with a
2.1 percent increase for the year, lower than the annual increase of 2.6 percent for the year to June 2015.
Germany has seen its annual GDP growth remain at 1.6 percent for the year to June 2016, after dropping down
to just 1.0 percent in the year to March 2015. The unemployment rate in EU remains high, though there are
signs of improvement. The official EU unemployment rate is 8.7% with Greece the highest at 24% and Germany
lowest at 4.2%.
Forecasts for the Euro zone are expecting that GDP growth for Europe will almost reach 2 percent in 2016, with
GDP growth in Germany climbing back to 1.9 percent in 2016.
Australian GDP growth has picked up, now at 3.1% to March 2016, Australia has managed to stop its rising
unemployment. Despite this recent uptick, signs are pointing to the Australian economy to continue its slow
down, with iron ore prices still below $50 a tonne, well down on the $100+ a tonne last seen at the start of
2014, low investment in the mining industry, and Chinese GDP growth and imports declining.
Forecasts have Australia bouncing back in 2016 with GDP growth once again growing by almost 3 percent per
annum, and unemployment remaining below 6 percent.
Forecasts of Price Level Change Adjustors – 2016 Update September 2016
Forecast for adjustors 8
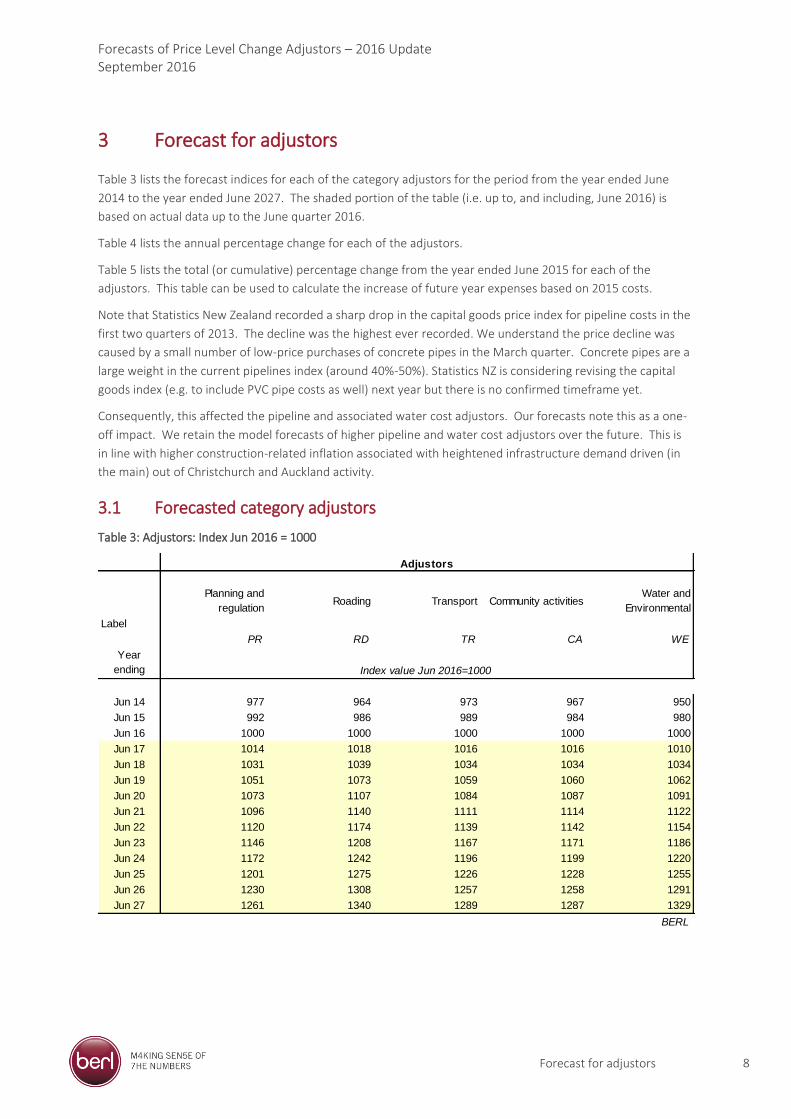
3 Forecast for adjustors
Table 3 lists the forecast indices for each of the category adjustors for the period from the year ended June
2014 to the year ended June 2027. The shaded portion of the table (i.e. up to, and including, June 2016) is
based on actual data up to the June quarter 2016.
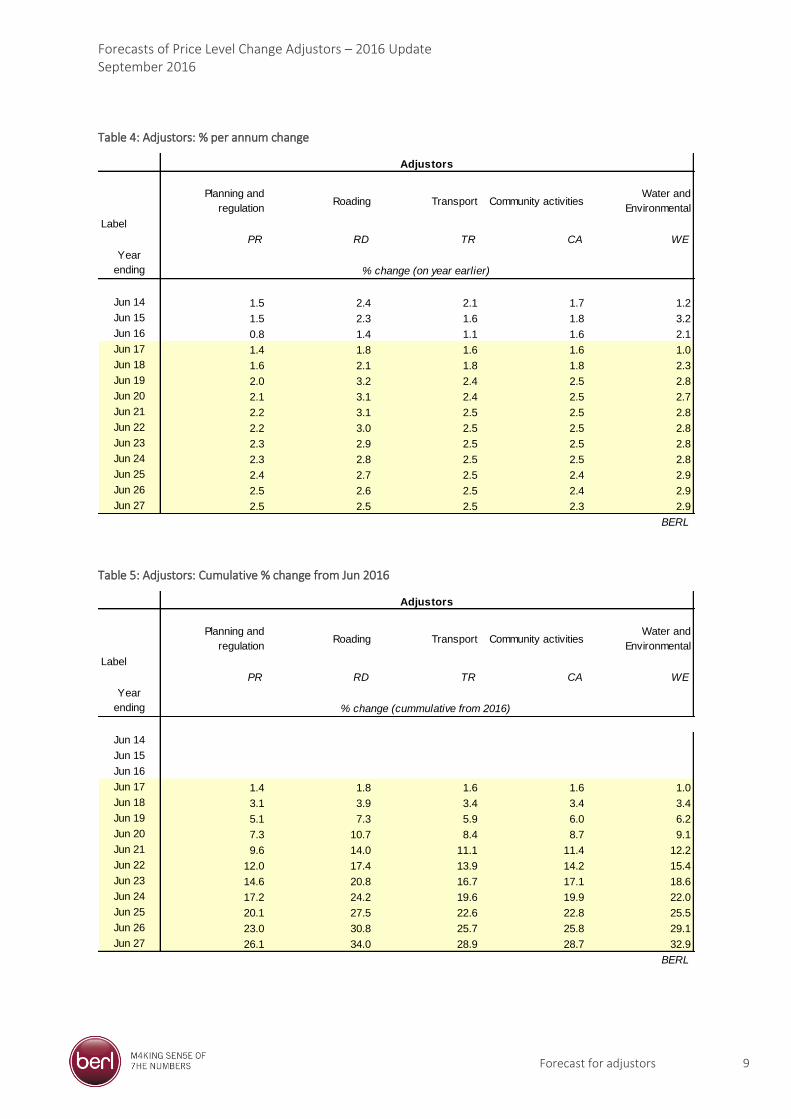
Table 4 lists the annual percentage change for each of the adjustors.
Table 5 lists the total (or cumulative) percentage change from the year ended June 2015 for each of the
adjustors. This table can be used to calculate the increase of future year expenses based on 2015 costs.
Note that Statistics New Zealand recorded a sharp drop in the capital goods price index for pipeline costs in the
first two quarters of 2013. The decline was the highest ever recorded. We understand the price decline was
caused by a small number of low-price purchases of concrete pipes in the March quarter. Concrete pipes are a
large weight in the current pipelines index (around 40%-50%). Statistics NZ is considering revising the capital
goods index (e.g. to include PVC pipe costs as well) next year but there is no confirmed timeframe yet.
Consequently, this affected the pipeline and associated water cost adjustors. Our forecasts note this as a one-
off impact. We retain the model forecasts of higher pipeline and water cost adjustors over the future. This is
in line with higher construction-related inflation associated with heightened infrastructure demand driven (in
the main) out of Christchurch and Auckland activity.
3.1 Forecasted category adjustors
Table 3: Adjustors: Index Jun 2016 = 1000
Label
Planning and
regulationRoading Transport Community activities
Water and
Environmental
PR RD TR CA WE
Jun 14 977 964 973 967 950
Jun 15 992 986 989 984 980
Jun 16 1000 1000 1000 1000 1000
Jun 17 1014 1018 1016 1016 1010
Jun 18 1031 1039 1034 1034 1034
Jun 19 1051 1073 1059 1060 1062
Jun 20 1073 1107 1084 1087 1091
Jun 21 1096 1140 1111 1114 1122
Jun 22 1120 1174 1139 1142 1154
Jun 23 1146 1208 1167 1171 1186
Jun 24 1172 1242 1196 1199 1220
Jun 25 1201 1275 1226 1228 1255
Jun 26 1230 1308 1257 1258 1291
Jun 27 1261 1340 1289 1287 1329
BERL
Year
ending Index value Jun 2016=1000
Adjustors
Forecasts of Price Level Change Adjustors – 2016 Update September 2016
Forecast for adjustors 9
Table 4: Adjustors: % per annum change
Table 5: Adjustors: Cumulative % change from Jun 2016
Label
Planning and
regulationRoading Transport Community activities
Water and
Environmental
PR RD TR CA WE
Jun 14 1.5 2.4 2.1 1.7 1.2
Jun 15 1.5 2.3 1.6 1.8 3.2
Jun 16 0.8 1.4 1.1 1.6 2.1
Jun 17 1.4 1.8 1.6 1.6 1.0
Jun 18 1.6 2.1 1.8 1.8 2.3
Jun 19 2.0 3.2 2.4 2.5 2.8
Jun 20 2.1 3.1 2.4 2.5 2.7
Jun 21 2.2 3.1 2.5 2.5 2.8
Jun 22 2.2 3.0 2.5 2.5 2.8
Jun 23 2.3 2.9 2.5 2.5 2.8
Jun 24 2.3 2.8 2.5 2.5 2.8
Jun 25 2.4 2.7 2.5 2.4 2.9
Jun 26 2.5 2.6 2.5 2.4 2.9
Jun 27 2.5 2.5 2.5 2.3 2.9
BERL
Year
ending % change (on year earlier)
Adjustors
Label
Planning and
regulationRoading Transport Community activities
Water and
Environmental
PR RD TR CA WE
Jun 14
Jun 15
Jun 16
Jun 17 1.4 1.8 1.6 1.6 1.0
Jun 18 3.1 3.9 3.4 3.4 3.4
Jun 19 5.1 7.3 5.9 6.0 6.2
Jun 20 7.3 10.7 8.4 8.7 9.1
Jun 21 9.6 14.0 11.1 11.4 12.2
Jun 22 12.0 17.4 13.9 14.2 15.4
Jun 23 14.6 20.8 16.7 17.1 18.6
Jun 24 17.2 24.2 19.6 19.9 22.0
Jun 25 20.1 27.5 22.6 22.8 25.5
Jun 26 23.0 30.8 25.7 25.8 29.1
Jun 27 26.1 34.0 28.9 28.7 32.9
BERL
Year
ending % change (cummulative from 2016)
Adjustors
Forecasts of Price Level Change Adjustors – 2016 Update September 2016
Forecast for overall LGCI 10
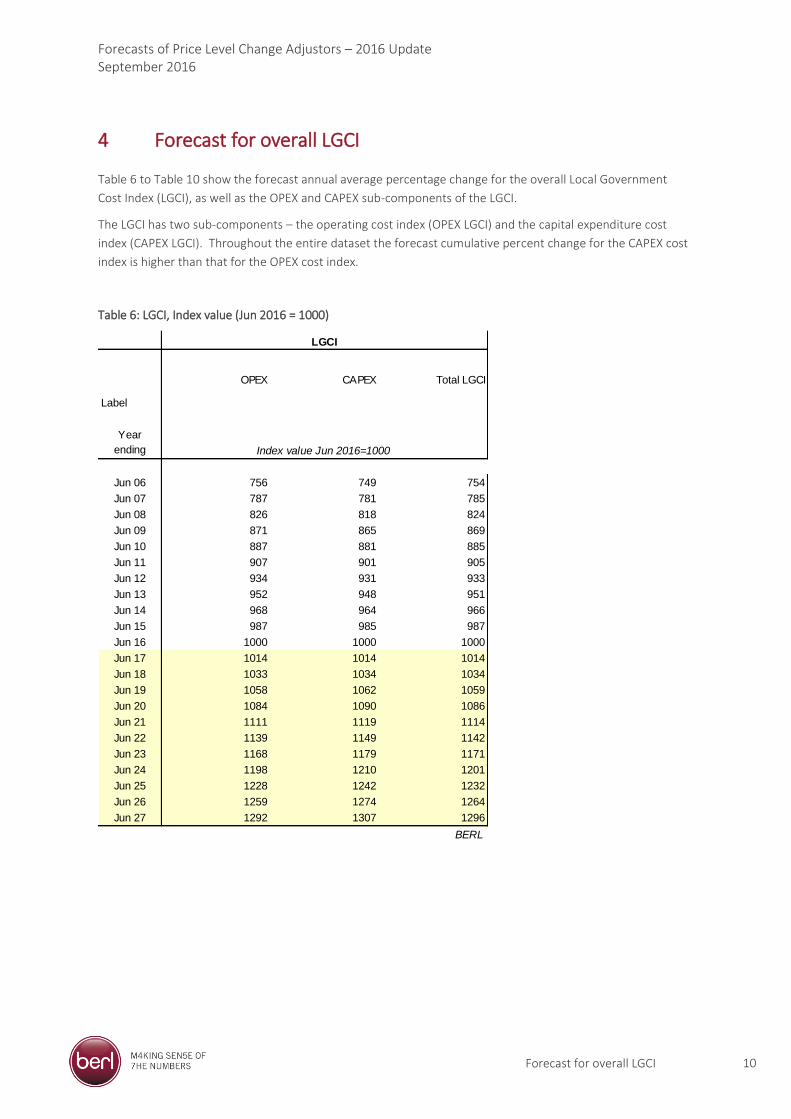
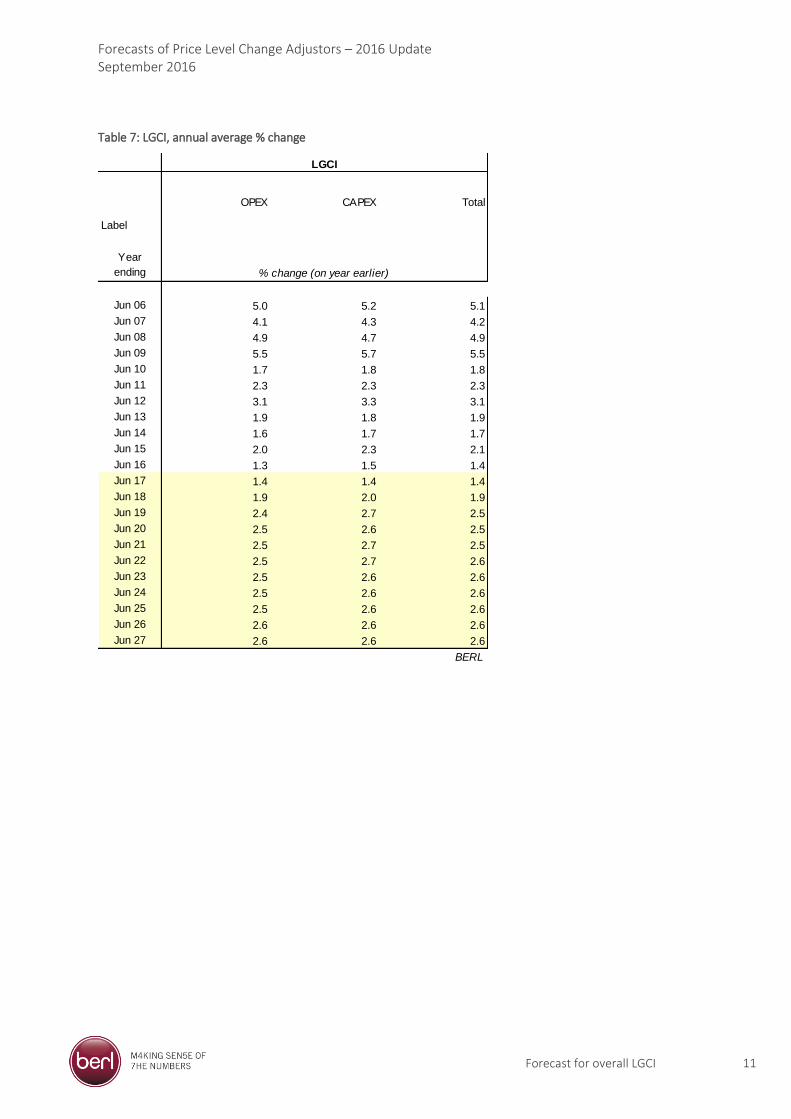
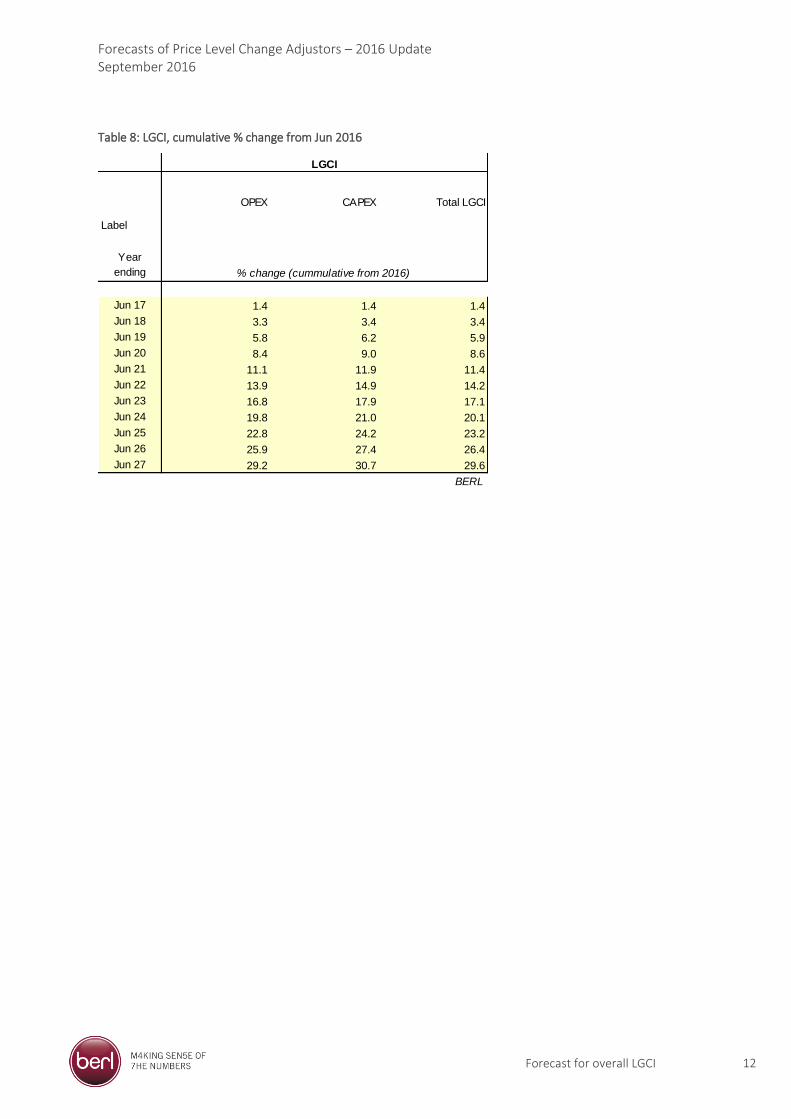
4 Forecast for overall LGCI
Table 6 to Table 10 show the forecast annual average percentage change for the overall Local Government
Cost Index (LGCI), as well as the OPEX and CAPEX sub-components of the LGCI.
The LGCI has two sub-components – the operating cost index (OPEX LGCI) and the capital expenditure cost
index (CAPEX LGCI). Throughout the entire dataset the forecast cumulative percent change for the CAPEX cost
index is higher than that for the OPEX cost index.
Table 6: LGCI, Index value (Jun 2016 = 1000)
Label
OPEX CAPEX Total LGCI
Jun 06 756 749 754
Jun 07 787 781 785
Jun 08 826 818 824
Jun 09 871 865 869
Jun 10 887 881 885
Jun 11 907 901 905
Jun 12 934 931 933
Jun 13 952 948 951
Jun 14 968 964 966
Jun 15 987 985 987
Jun 16 1000 1000 1000
Jun 17 1014 1014 1014
Jun 18 1033 1034 1034
Jun 19 1058 1062 1059
Jun 20 1084 1090 1086
Jun 21 1111 1119 1114
Jun 22 1139 1149 1142
Jun 23 1168 1179 1171
Jun 24 1198 1210 1201
Jun 25 1228 1242 1232
Jun 26 1259 1274 1264
Jun 27 1292 1307 1296
BERL
Year
ending Index value Jun 2016=1000
LGCI
Forecasts of Price Level Change Adjustors – 2016 Update September 2016
Forecast for overall LGCI 11
Table 7: LGCI, annual average % change
Label
OPEX CAPEX Total
Jun 06 5.0 5.2 5.1
Jun 07 4.1 4.3 4.2
Jun 08 4.9 4.7 4.9
Jun 09 5.5 5.7 5.5
Jun 10 1.7 1.8 1.8
Jun 11 2.3 2.3 2.3
Jun 12 3.1 3.3 3.1
Jun 13 1.9 1.8 1.9
Jun 14 1.6 1.7 1.7
Jun 15 2.0 2.3 2.1
Jun 16 1.3 1.5 1.4
Jun 17 1.4 1.4 1.4
Jun 18 1.9 2.0 1.9
Jun 19 2.4 2.7 2.5
Jun 20 2.5 2.6 2.5
Jun 21 2.5 2.7 2.5
Jun 22 2.5 2.7 2.6
Jun 23 2.5 2.6 2.6
Jun 24 2.5 2.6 2.6
Jun 25 2.5 2.6 2.6
Jun 26 2.6 2.6 2.6
Jun 27 2.6 2.6 2.6
BERL
Year
ending % change (on year earlier)
LGCI
Forecasts of Price Level Change Adjustors – 2016 Update September 2016
Forecast for overall LGCI 12
Table 8: LGCI, cumulative % change from Jun 2016
Label
OPEX CAPEX Total LGCI
Jun 17 1.4 1.4 1.4
Jun 18 3.3 3.4 3.4
Jun 19 5.8 6.2 5.9
Jun 20 8.4 9.0 8.6
Jun 21 11.1 11.9 11.4
Jun 22 13.9 14.9 14.2
Jun 23 16.8 17.9 17.1
Jun 24 19.8 21.0 20.1
Jun 25 22.8 24.2 23.2
Jun 26 25.9 27.4 26.4
Jun 27 29.2 30.7 29.6
BERL
% change (cummulative from 2016)
LGCI
Year
ending
Forecasts of Price Level Change Adjustors – 2016 Update September 2016
Forecasts for eight price indices 13
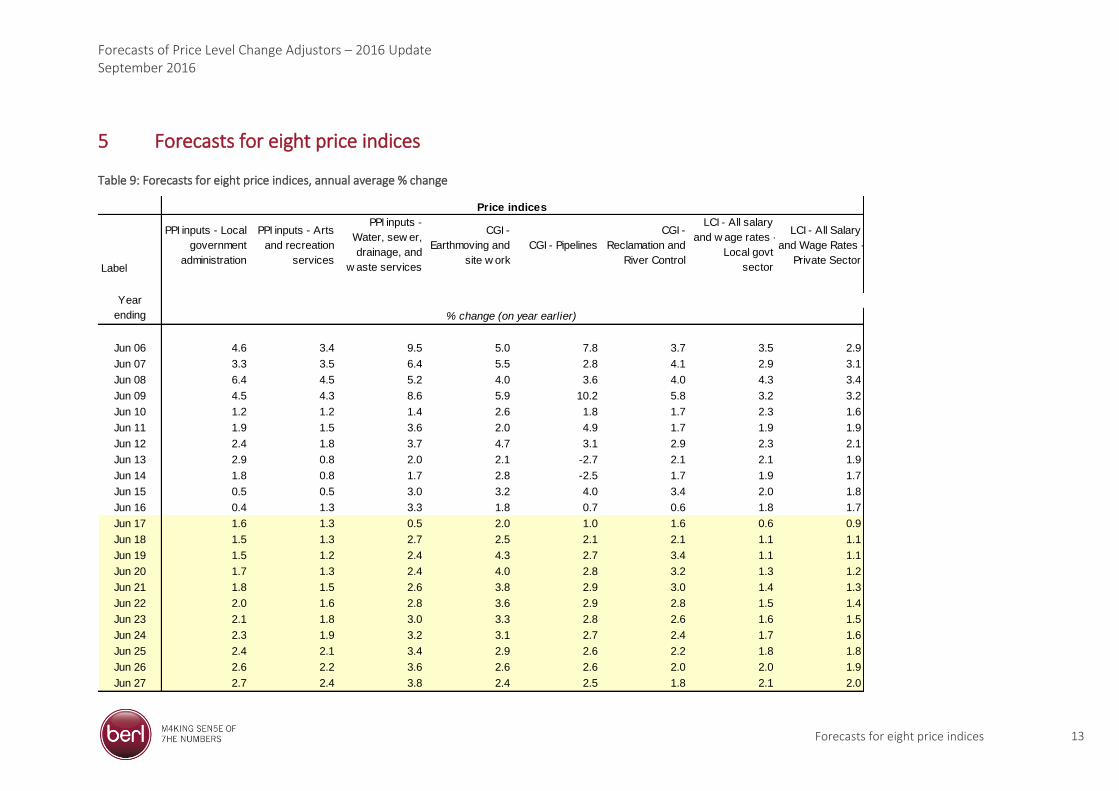
5 Forecasts for eight price indices
Table 9: Forecasts for eight price indices, annual average % change
Label
PPI inputs - Local
government
administration
PPI inputs - Arts
and recreation
services
PPI inputs -
Water, sew er,
drainage, and
w aste services
CGI -
Earthmoving and
site w ork
CGI - Pipelines
CGI -
Reclamation and
River Control
LCI - All salary
and w age rates -
Local govt
sector
LCI - All Salary
and Wage Rates -
Private Sector
Jun 06 4.6 3.4 9.5 5.0 7.8 3.7 3.5 2.9
Jun 07 3.3 3.5 6.4 5.5 2.8 4.1 2.9 3.1
Jun 08 6.4 4.5 5.2 4.0 3.6 4.0 4.3 3.4
Jun 09 4.5 4.3 8.6 5.9 10.2 5.8 3.2 3.2
Jun 10 1.2 1.2 1.4 2.6 1.8 1.7 2.3 1.6
Jun 11 1.9 1.5 3.6 2.0 4.9 1.7 1.9 1.9
Jun 12 2.4 1.8 3.7 4.7 3.1 2.9 2.3 2.1
Jun 13 2.9 0.8 2.0 2.1 -2.7 2.1 2.1 1.9
Jun 14 1.8 0.8 1.7 2.8 -2.5 1.7 1.9 1.7
Jun 15 0.5 0.5 3.0 3.2 4.0 3.4 2.0 1.8
Jun 16 0.4 1.3 3.3 1.8 0.7 0.6 1.8 1.7
Jun 17 1.6 1.3 0.5 2.0 1.0 1.6 0.6 0.9
Jun 18 1.5 1.3 2.7 2.5 2.1 2.1 1.1 1.1
Jun 19 1.5 1.2 2.4 4.3 2.7 3.4 1.1 1.1
Jun 20 1.7 1.3 2.4 4.0 2.8 3.2 1.3 1.2
Jun 21 1.8 1.5 2.6 3.8 2.9 3.0 1.4 1.3
Jun 22 2.0 1.6 2.8 3.6 2.9 2.8 1.5 1.4
Jun 23 2.1 1.8 3.0 3.3 2.8 2.6 1.6 1.5
Jun 24 2.3 1.9 3.2 3.1 2.7 2.4 1.7 1.6
Jun 25 2.4 2.1 3.4 2.9 2.6 2.2 1.8 1.8
Jun 26 2.6 2.2 3.6 2.6 2.6 2.0 2.0 1.9
Jun 27 2.7 2.4 3.8 2.4 2.5 1.8 2.1 2.0
Year
ending
Price indices
% change (on year earlier)
Forecasts of Price Level Change Adjustors – 2016 Update September 2016
Forecasts for eight price indices 14
Table 10: Forecasts for eight price indices, cumulative % change from Jun 2016
Label
PPI inputs - Local
government
administration
PPI inputs - Arts
and recreation
services
PPI inputs -
Water, sew er,
drainage, and
w aste services
CGI -
Earthmoving and
site w ork
CGI - PipelinesCGI-Reclamation
and River Control
LCI - All salary
and w age rates -
Local govt
sector
LCI - All Salary
and Wage Rates -
Private Sector
Jun 16 0.4 1.3 3.3 1.8 0.7 0.6 1.8 1.7
Jun 17 1.6 1.3 0.5 2.0 1.0 1.6 0.6 0.9
Jun 18 3.1 2.6 3.2 4.6 3.1 3.7 1.7 1.9
Jun 19 4.6 3.9 5.7 9.0 5.9 7.2 2.9 3.1
Jun 20 6.3 5.3 8.3 13.4 8.8 10.6 4.2 4.3
Jun 21 8.3 6.8 11.1 17.7 12.0 13.9 5.6 5.6
Jun 22 10.4 8.6 14.2 22.0 15.2 17.0 7.2 7.1
Jun 23 12.7 10.5 17.7 26.0 18.5 20.1 8.9 8.8
Jun 24 15.3 12.6 21.5 29.9 21.7 22.9 10.8 10.6
Jun 25 18.1 14.9 25.7 33.7 24.9 25.6 12.8 12.5
Jun 26 21.1 17.5 30.2 37.2 28.1 28.1 15.0 14.6
Jun 27 24.5 20.2 35.2 40.5 31.2 30.4 17.4 16.9
BERL
Year
ending
Price indices
% change (cummulative from 2016)
Forecasts of Price Level Change Adjustors – 2016 Update September 2016
Appendix A Equations to explain and forecast eight price indices 15
Appendix A Equations to explain and forecast eight price indices
The charts in this appendix illustrate the performance of our estimated equations, for each of the adjustors,
when compared to the actual data over the period June 1997 to June 2016.
The estimation process is used to develop and then confirm a robust equation that can be used to generate
forecasts. The confirmation process tests the fit of the estimated equation with the actual path of the adjustor
over a period of time.
In each of the figures below, the dashed line (labelled predicted) indicates the estimated path of the adjustor
as calculated by our estimated equation. The solid line (labelled actual) indicates the actual path of the
adjustor as derived from the relevant official Statistics New Zealand data series.
The equations for each of the price indices are given below each chart
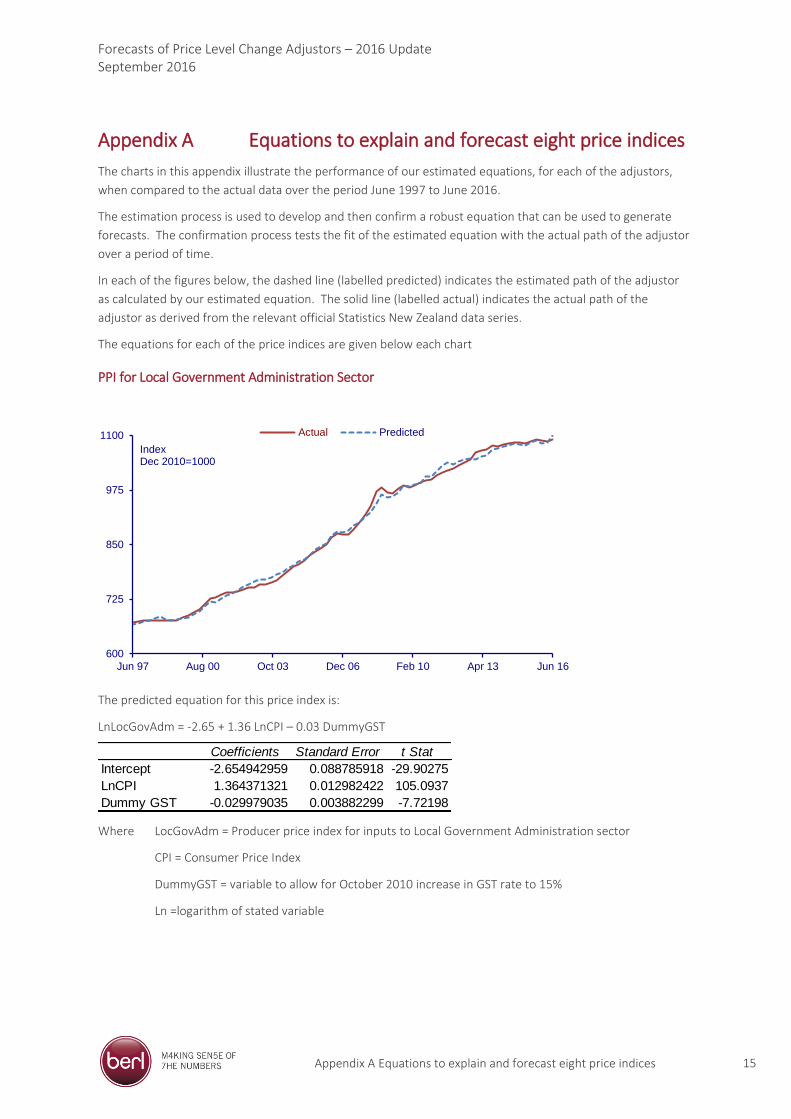
PPI for Local Government Administration Sector
The predicted equation for this price index is:
LnLocGovAdm = -2.65 + 1.36 LnCPI – 0.03 DummyGST
Where LocGovAdm = Producer price index for inputs to Local Government Administration sector
CPI = Consumer Price Index
DummyGST = variable to allow for October 2010 increase in GST rate to 15%
Ln =logarithm of stated variable
600
725
850
975
1100
Jun 97 Aug 00 Oct 03 Dec 06 Feb 10 Apr 13 Jun 16
Index Dec 2010=1000
Actual Predicted
Coefficients Standard Error t Stat
Intercept -2.654942959 0.088785918 -29.90275
LnCPI 1.364371321 0.012982422 105.0937
Dummy GST -0.029979035 0.003882299 -7.72198
Forecasts of Price Level Change Adjustors – 2016 Update September 2016
Appendix A Equations to explain and forecast eight price indices 16
PPI for Arts and Recreation Services Sector
The predicted equation for this price index is:
LnArtsrec = -1.29 + 1.17 LnCPI – 0.01 LnIRT – 0.05 DummyGST
Where Artsrec = Producer price index for inputs to Arts and Recreation Services sector
CPI = Consumer Price Index
IRT = 90-day interest rate
DummyGST = variable to allow for October 2010 increase in GST rate to 15%
Ln =logarithm of stated variable
600
725
850
975
1100
Jun 97 Aug 00 Oct 03 Dec 06 Feb 10 Apr 13 Jun 16
Index Dec 2010=1000
Actual Predicted
Coefficients Standard Error t Stat
Intercept -1.29139675 0.063974021 -20.18626822
LnCPI 1.173140082 0.009101372 128.8970597
LnIRT -0.010006428 0.002669269 -3.74875262
Dummy GST -0.050648616 0.002861635 -17.69918659
Forecasts of Price Level Change Adjustors – 2016 Update September 2016
Appendix A Equations to explain and forecast eight price indices 17
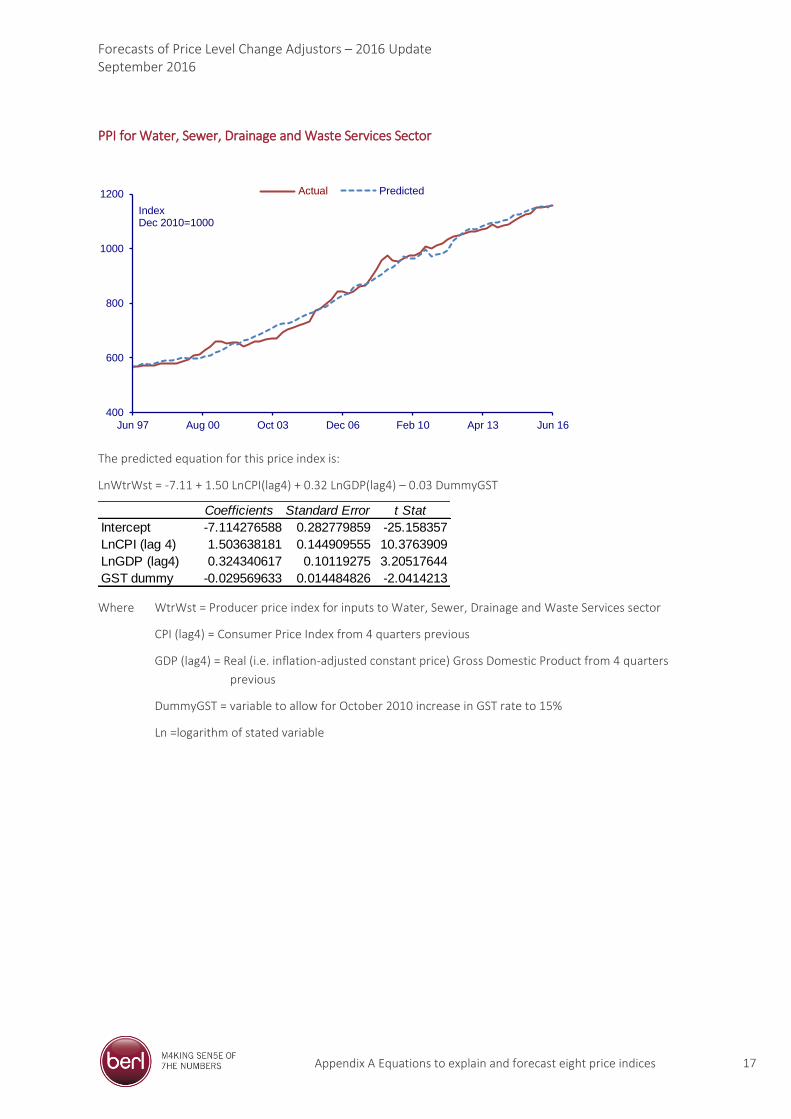
PPI for Water, Sewer, Drainage and Waste Services Sector
The predicted equation for this price index is:
LnWtrWst = -7.11 + 1.50 LnCPI(lag4) + 0.32 LnGDP(lag4) – 0.03 DummyGST
Where WtrWst = Producer price index for inputs to Water, Sewer, Drainage and Waste Services sector
CPI (lag4) = Consumer Price Index from 4 quarters previous
GDP (lag4) = Real (i.e. inflation-adjusted constant price) Gross Domestic Product from 4 quarters
previous
DummyGST = variable to allow for October 2010 increase in GST rate to 15%
Ln =logarithm of stated variable
400
600
800
1000
1200
Jun 97 Aug 00 Oct 03 Dec 06 Feb 10 Apr 13 Jun 16
Index Dec 2010=1000
Actual Predicted
Coefficients Standard Error t Stat
Intercept -7.114276588 0.282779859 -25.158357
LnCPI (lag 4) 1.503638181 0.144909555 10.3763909
LnGDP (lag4) 0.324340617 0.10119275 3.20517644
GST dummy -0.029569633 0.014484826 -2.0414213
Forecasts of Price Level Change Adjustors – 2016 Update September 2016
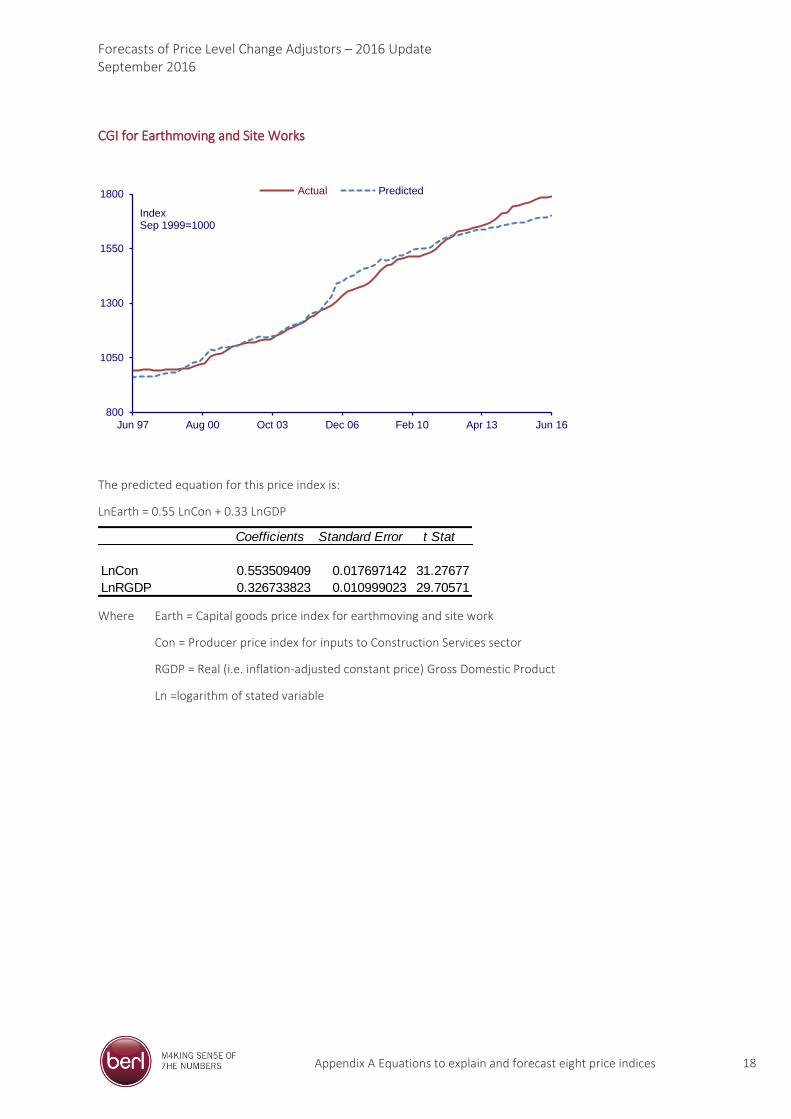
Appendix A Equations to explain and forecast eight price indices 18
CGI for Earthmoving and Site Works
The predicted equation for this price index is:
LnEarth = 0.55 LnCon + 0.33 LnGDP
Where Earth = Capital goods price index for earthmoving and site work
Con = Producer price index for inputs to Construction Services sector
RGDP = Real (i.e. inflation-adjusted constant price) Gross Domestic Product
Ln =logarithm of stated variable
800
1050
1300
1550
1800
Jun 97 Aug 00 Oct 03 Dec 06 Feb 10 Apr 13 Jun 16
IndexSep 1999=1000
Actual Predicted
Coefficients Standard Error t Stat
LnCon 0.553509409 0.017697142 31.27677
LnRGDP 0.326733823 0.010999023 29.70571
Forecasts of Price Level Change Adjustors – 2016 Update September 2016
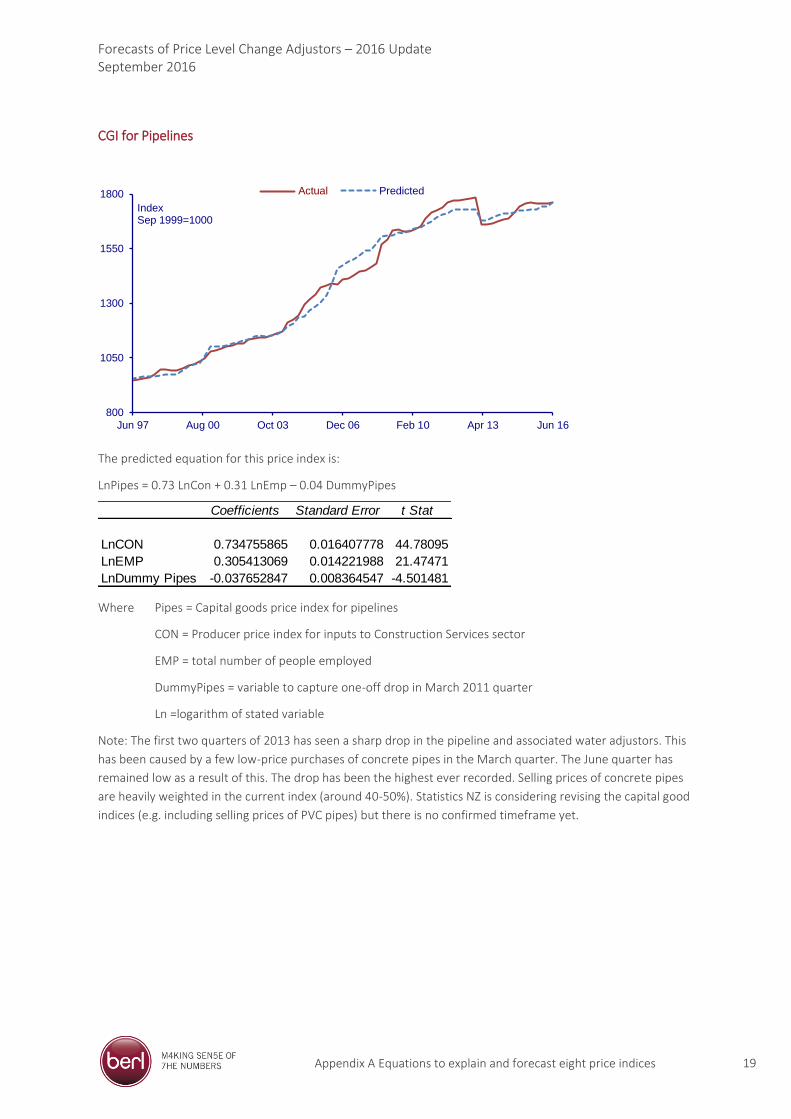
Appendix A Equations to explain and forecast eight price indices 19
CGI for Pipelines
The predicted equation for this price index is:
LnPipes = 0.73 LnCon + 0.31 LnEmp – 0.04 DummyPipes
Where Pipes = Capital goods price index for pipelines
CON = Producer price index for inputs to Construction Services sector
EMP = total number of people employed
DummyPipes = variable to capture one-off drop in March 2011 quarter
Ln =logarithm of stated variable
Note: The first two quarters of 2013 has seen a sharp drop in the pipeline and associated water adjustors. This
has been caused by a few low-price purchases of concrete pipes in the March quarter. The June quarter has
remained low as a result of this. The drop has been the highest ever recorded. Selling prices of concrete pipes
are heavily weighted in the current index (around 40-50%). Statistics NZ is considering revising the capital good
indices (e.g. including selling prices of PVC pipes) but there is no confirmed timeframe yet.
800
1050
1300
1550
1800
Jun 97 Aug 00 Oct 03 Dec 06 Feb 10 Apr 13 Jun 16
Index Sep 1999=1000
Actual Predicted
Coefficients Standard Error t Stat
LnCON 0.734755865 0.016407778 44.78095
LnEMP 0.305413069 0.014221988 21.47471
LnDummy Pipes -0.037652847 0.008364547 -4.501481
Forecasts of Price Level Change Adjustors – 2016 Update September 2016
Appendix A Equations to explain and forecast eight price indices 20
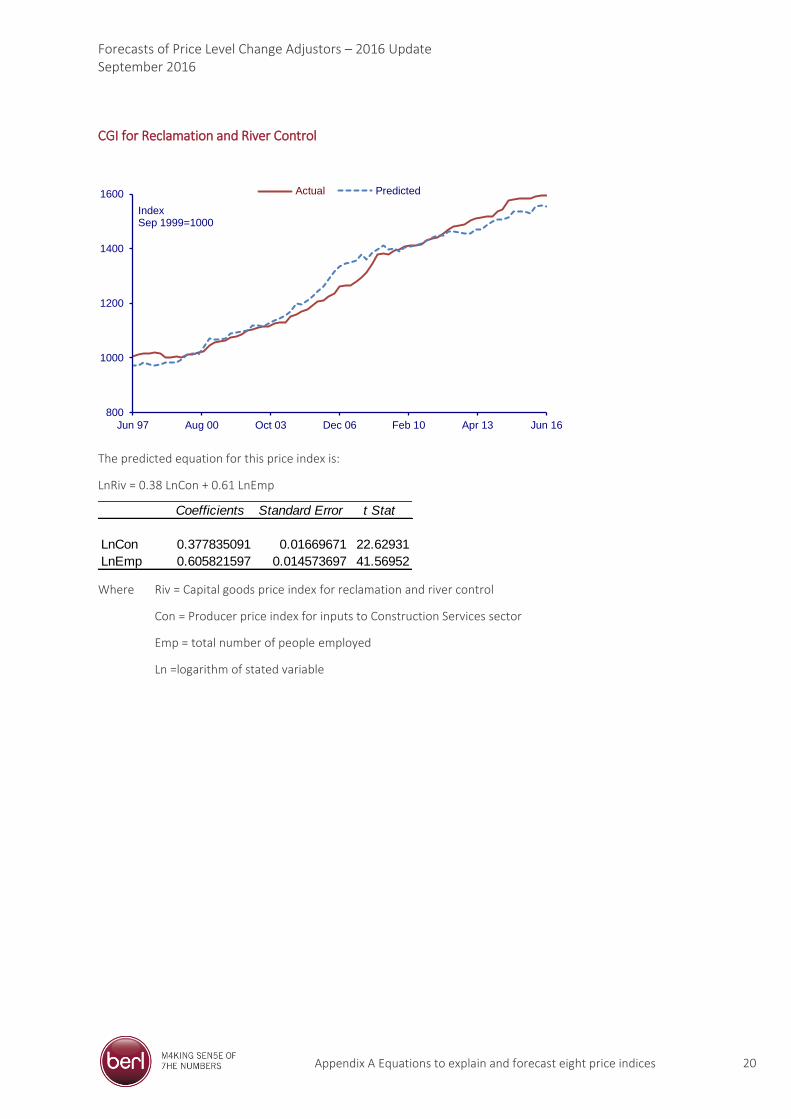
CGI for Reclamation and River Control
The predicted equation for this price index is:
LnRiv = 0.38 LnCon + 0.61 LnEmp
Where Riv = Capital goods price index for reclamation and river control
Con = Producer price index for inputs to Construction Services sector
Emp = total number of people employed
Ln =logarithm of stated variable
800
1000
1200
1400
1600
Jun 97 Aug 00 Oct 03 Dec 06 Feb 10 Apr 13 Jun 16
Index Sep 1999=1000
Actual Predicted
Coefficients Standard Error t Stat
LnCon 0.377835091 0.01669671 22.62931
LnEmp 0.605821597 0.014573697 41.56952
Forecasts of Price Level Change Adjustors – 2016 Update September 2016
Appendix A Equations to explain and forecast eight price indices 21
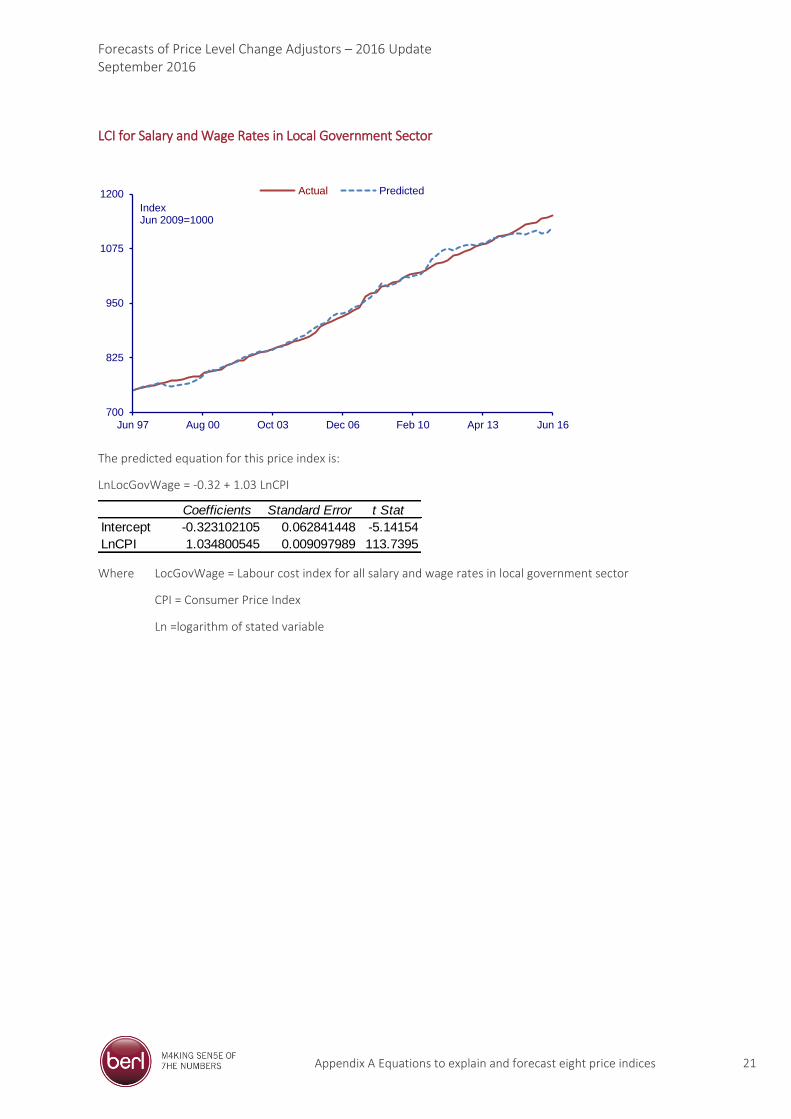
LCI for Salary and Wage Rates in Local Government Sector
The predicted equation for this price index is:
LnLocGovWage = -0.32 + 1.03 LnCPI
Where LocGovWage = Labour cost index for all salary and wage rates in local government sector
CPI = Consumer Price Index
Ln =logarithm of stated variable
700
825
950
1075
1200
Jun 97 Aug 00 Oct 03 Dec 06 Feb 10 Apr 13 Jun 16
Index Jun 2009=1000
Actual Predicted
Coefficients Standard Error t Stat
Intercept -0.323102105 0.062841448 -5.14154
LnCPI 1.034800545 0.009097989 113.7395
Forecasts of Price Level Change Adjustors – 2016 Update September 2016
Appendix A Equations to explain and forecast eight price indices 22
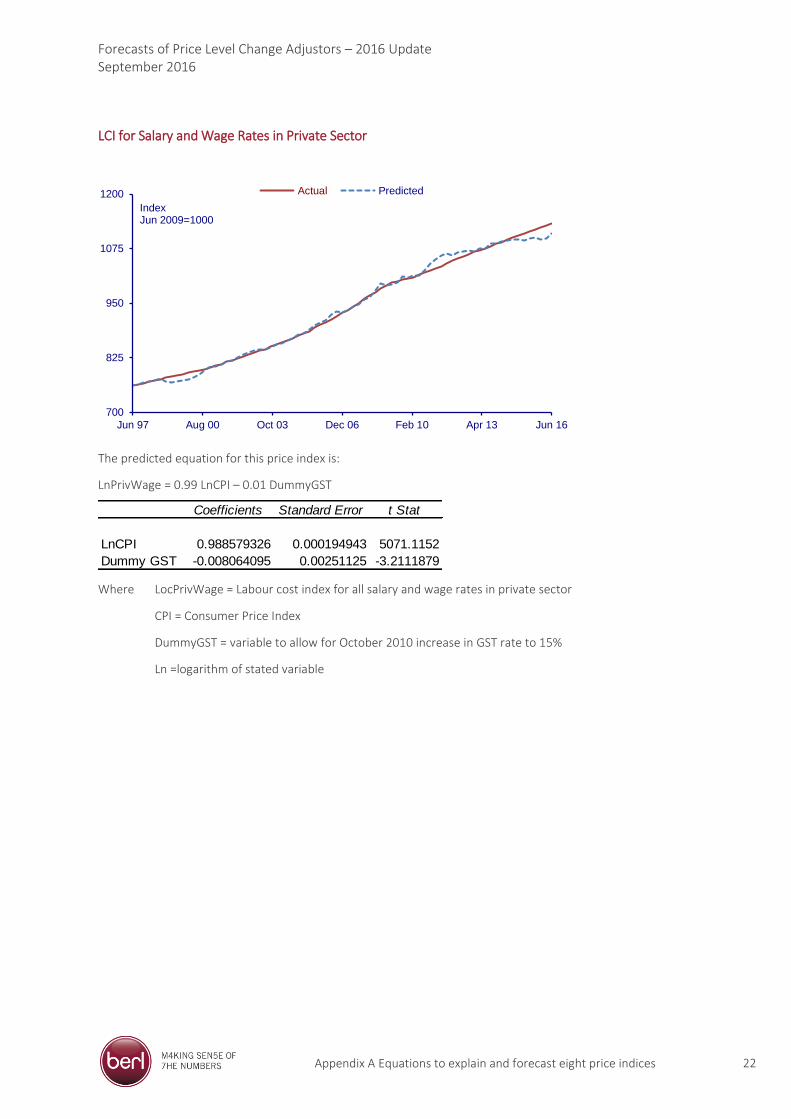
LCI for Salary and Wage Rates in Private Sector
The predicted equation for this price index is:
LnPrivWage = 0.99 LnCPI – 0.01 DummyGST
Where LocPrivWage = Labour cost index for all salary and wage rates in private sector
CPI = Consumer Price Index
DummyGST = variable to allow for October 2010 increase in GST rate to 15%
Ln =logarithm of stated variable
700
825
950
1075
1200
Jun 97 Aug 00 Oct 03 Dec 06 Feb 10 Apr 13 Jun 16
Index Jun 2009=1000
Actual Predicted
Coefficients Standard Error t Stat
LnCPI 0.988579326 0.000194943 5071.1152
Dummy GST -0.008064095 0.00251125 -3.2111879