Embed Size (px)
Citation preview

Foreign Central Bank Activities in U.S. Futures Markets
Raymond P. H. Fishe
Michel A. Robe
and
Aaron D. Smith*
This draft: October 2, 2014
ABSTRACT
We analyze the daily positions of 31 foreign Central Banks in U.S. interest rate futures markets
between 2003 and 2011 for targeted hedging or informed profit-making decisions. Central Bank
positions before the financial crisis of 2007-2009 are consistent with hedging some underlying balance
sheet exposure. During and after the crisis, the pattern suggests an attempt to enhance returns. In
particular, Central Banks held and profited from directional positions in 5- and 10-year T-Note futures
in a manner indicative of a non-hedging strategy. We also examine whether Central Bank position
changes are synchronized in the sense that they tend to occur simultaneously. We identify differences
before and after the onset of the financial crisis: Euro-linked Central Banks become more
synchronized, whereas non-European Central Banks show no significant change during the crisis. We
also document that Central Bank positions generally account for a small fraction of the overall size of
the futures markets, so it is unlikely that these institutions’ goal is to influence U.S. interest rates.
Keywords: Central Banks, Reserve management, Interest-rate derivatives, Hedging,
Speculation, Financial crisis, Synchronized trading
JEL classification: E58, G11, G01
*Fishe: U.S. Commodity Futures Trading Commission (CFTC) and Department of Finance, Robins School of Business, University of Richmond,
Richmond, VA 23173. Tel: (+1) 804-287-1269. Email: [email protected]. Robe: CFTC and Department of Finance, Kogod School of Business, American University, Washington, D.C. 20016. Tel: (+1) 202-885-1880. Email: [email protected]. Smith: Department of
Agricultural and Resource Economics, University of California at Davis, Davis, CA 95616. Email: [email protected]. Tel: (+1) 530-
752‐2138. We thank an anonymous referee for useful suggestions. We thank a number of individuals including senior officials at several Foreign Central Banks for helpful discussions; participants at the 2012 IFABS Conference in Valencia, Spain, at the Fourth World Bank – Bank for International Settlements (BIS) Public Investors Conference in Washington, DC and at research seminars at the Banque de France, the CFTC and
American University, for useful remarks; Jim Moser, Margie Sweet, Chris Whacker and Steve Cho, for helping us with historical CFTC data;
Inci Ötker-Robe, Karl Habermeier and their staffs at the International Monetary Fund (IMF), for providing comprehensive time series of de facto foreign exchange regimes; Toby Kearn and Yang Liu, for helping summarize public data on Central Bank reserves; and Casey Petroff, for overall
research assistance. Corresponding author: Raymond P. H. Fishe.
CFTC Disclaimer: The research presented in this paper was co-authored by Aaron Smith, a former CFTC contractor who performed work under a CFTC OCE
contract (contract CFCE-11-CO-1128), and Michel Robe and Raymond Fishe, who are both CFTC limited-term consultants. The Office of the Chief Economist and
CFTC economists produce original research on a broad range of topics relevant to the CFTC’s mandate to regulate commodity futures markets, commodity options
markets, and the expanded mandate to regulate the swaps markets pursuant to the Dodd-Frank Wall Street Reform and Consumer Protection Act. These papers are
often presented at conferences and many of these papers are later published by peer-review and other scholarly outlets. The analyses and conclusions expressed in this
paper are those of the authors and do not reflect the views of other members of the Office of the Chief Economist, other Commission staff or the Commission itself.
Errors and omissions, if any, are the authors’ sole responsibility.

1
Foreign Central Bank Activities in U.S. Futures Markets
1. INTRODUCTION
Most Central Banks disclose little information about their activities in derivatives markets.
When there is public disclosure, it usually occurs in annual reports, is limited in scope, and often
claims hedging as a motive for derivatives positions. Only a few Central Banks admit that they
seek to enhance returns with such positions. We investigate these claims by testing whether
Central Banks’ actual positions in U.S. interest-rate futures markets are consistent with targeted
hedging or, alternatively, speculative activities. We pay special attention to trading during the
financial crisis of 2007-2009 because low interest rates and macroeconomic uncertainty in that
period may have caused greater risk taking, perhaps due to reserve managers’ incentive schemes1
or the need to fund government treasuries.2
We also ask whether the 2007-2009 financial crises brought about greater synchronization of
Central Banks’ futures trading. Although several papers investigate how Central Banks changed
their reserve holdings after the onset of the crisis, our interest is in whether the financial crisis
influenced their incentive to use derivatives, leading to more synchronized behavior in futures
markets.3 Importantly, while a single Central Bank’s futures trades may have a benign effect on
prices, if a set of those institutions react in similar ways to exogenous shocks, then the combined
effects may be of consequence to other market participants and to market regulators.
1 For example, Scalia and Sahel (2012, p. 1) document “the existence of risk-shifting behavior by (European Central
Bank or ECB-linked) reserve managers related to their year-to-date ranking: interim losers increase relative risk in
the second half of the year, in the same way as mutual fund managers.” These authors show that those managers’
risk-taking incentives are magnified by the annual frequency of reports to the ECB Governing Council and,
consequently, the nature of the managers’ reputational reward structure. More generally, Remolona and Schrijvers
(2004, p. 97) argue that, in an environment “of historically low yields on highly-rated government securities, Central
Bank reserves managers seek instruments with higher yields in an effort to enhance returns.” 2 Usually, Central Banks return net surpluses to their own governments’ treasury, which may encourage profit-
making to reduce political pressure on bank managers. Dominguez, Hashimoto and Ito (2012, p. 389) argue that the
Bank of Japan (and possibly the People’s Bank of China) engage(s) in carry trades for a profit-making motive. 3 See, for example, Dominguez (2012), Steiner (2013) and references cited therein.

2
To investigate Central Bank futures trading, we create a comprehensive, trader-level dataset
of the daily positions of all 31 foreign Central Banks that held reportable positions in U.S.
interest rate futures markets for the years 2003-2011. These unique, non-public data are from the
U.S. Commodity Futures Trading Commission (CFTC), which keeps records on the end-of-day
positions of all large traders in futures markets. This information is confidential, so we present
our analysis in a way consistent with the CFTC’s privacy rules.
We also analyze the publicly available data on foreign reserves and the notional or market
values of derivatives holdings for Central Banks. This public information comes from surveys by
the International Monetary Fund (IMF) and individual Central Banks’ own annual reports. Of
more than 70 Central Banks that voluntarily provided foreign reserves data for dissemination by
the IMF in 2011, only 22 reported derivatives use. Of the 31 Central Banks in our CFTC sample,
more than 10 are absent from the IMF dataset, which suggests significant under-reporting in the
IMF data. While helpful, the IMF database does not provide information on notional values,
breakdowns between over-the-counter (OTC) vs. exchange-traded positions, or on underlying
assets. By itself, it is inadequate to assess a Central Bank’s purpose for trading derivatives.
To supplement the IMF data, we examine the annual reports of 70 Central Banks between
2005 and 2010. Some Central Banks reveal extensive facts about their derivatives positions,
including notional and market values, the types of derivative instruments used (forwards, futures,
options, swaps, etc.) and periodic gains and losses. The least transparent Central Banks do not
mention derivatives at all, even though it is understood by market participants that they use such
instruments in reserve management. The remaining Banks do not offer any rationale for why
they hold derivative positions. In all cases, the annual reports are accounting statements and
show only stocks at a certain time or aggregate flows over a year.

3
To gain additional insight into Central Bank motives, we use the CFTC-sourced dataset on
daily positions in the four interest rate futures markets most used by the Central Banks in our
sample: Eurodollars as well as 2-, 5- and 10-year Treasury notes. The daily magnitude of Central
Banks’ U.S. futures positions, while large individually, are generally small compared to the
overall market, which suggests no intention to affect U.S. interest rates. Accordingly, we
investigate alternative reasons for Central Banks’ use of these markets.
We argue that pure hedgers might adjust their futures positions in response to volatility
changes but would not adjust them consistently in response to changes in the price level. Using
this argument as the basis of a test, we find mixed evidence that Central Bank positions are
consistent with hedging some underlying balance sheet exposure. Before the crisis, a hedging
motive has support, but during and after the 2007-2009 financial crisis, our results suggest an
attempt to enhance returns on foreign reserve assets. The latter result is most prominent for five-
and 10-year T-Note futures, in which Central Banks changed positions in the same direction as
prices during and after the crisis. The results that challenge the hedging motive are even stronger
for Euro-linked Central Banks, whose interest rate futures positions were more profitable than
other Central Banks’ during the crisis period. We address possible reasons why our test could
falsely reject hedging (e.g., if Banks experienced repeated unexpected balance sheet changes),
but we argue that these reasons are not sufficient to explain our results.
We also find differences in the degree of co-movement or synchronization of Central Banks
positions before and after the onset of the 2007-2009 financial crises. Only Euro-linked Central
Banks became more synchronized in their trading during the crisis period—consistent with the
notion that they were affected by common shocks or, perhaps, coordinated their policy actions.

4
Overall, our results clarify the claims made in public documents about Central Banks’
hedging motives. We establish that the hedging motive is present, but during the crisis profit-
linked actions and common reactions to shocks also explain individual Banks’ futures positions.
The remainder of the paper is structured as follows. Section 2 outlines the related literature.
Section 3 analyzes the information contained in public documents. Section 4 discusses our
empirical methodology. Section 5 describes the trader-level information from the CFTC and the
data used in our analyses. Sections 6 presents the results and Section 7 offers our conclusions.
2. RELATED LITERATURE
The present paper contributes to the literature on Central Bank policy as well as the research
on hedging balance sheet risk. Dominguez, Hashimoto and Ito (2012, p. 395) note that
“researchers would like data on the types of securities (by currency, maturity, and risk-class) and
types of deposits (by currency, type of financial institution taking deposits, and domestic or
foreign) held in Forex (reserves) in order to analyze portfolio management of foreign currency
reserves and intervention policy. However, in most countries, this kind of detailed information is
not made public.” Our analysis is partly a response to this observation. We focus on specific
derivative markets in which we know the contractual details and can follow the actual holdings
of Central Banks. Therefore, while we make inferences from only one part of the Banks’ balance
sheets, it is a part that explicitly reveals their risk exposure.
Our paper is closely connected to the 20 case studies published by the International Monetary
Fund (IMF, 2003a, 2003b) and to Blejer and Schumacher (2000). These case studies shed light
on official reserves management practices in IMF member countries but offer a limited analysis
of derivatives data. Blejer and Schumacher (2000) focus on derivative use “as policy tools, i.e.,

5
operations designed to influence variables such as the exchange rate or the interest rate (p. 4).”
These authors’ portfolio analysis is hypothetical, however, due to data limitations.
This paper is part of a growing body of research on foreign reserve management. Generally,
it is argued that Central Banks do not try to influence asset prices in that context. Dominguez et
al. (2012), Scalia and Sahel (2012), and Dominguez, Fatum and Vacek (2013) are recent
advances. The extant papers, in contrast to ours, generally abstract from the use of derivatives by
Central Banks. Indeed, a lack of data has meant that investigations of derivative use has been
limited to theoretical analyses, such as those of Caballero and Panageas (2005) or Claessens and
Kreuser (2007), or analyses of how derivatives may help improve reserve risk management.
Our analysis is also connected to the finance literature on hedging by banks and corporations.
Booth, Smith and Stolz (1984) provide an early survey of the literature on derivatives trading by
financial institutions. Purnanandam (2007) argues that most such trading is tied to hedging. He
analyzes “the effects of bank characteristics and macroeconomic shocks on interest rate risk
management behavior of commercial banks” (p. 1769). Financial distress is a key issue in this
context, but is not directly relevant to the hedging motives of Central Banks.
At non-financial firms, there is considerable survey evidence that managers’ market views
affect their risk management decisions.4 Econometric studies by Brown (2001), Adam and
Fernando (2006), Brown, Crabb and Haushalter (2006), Chernenko and Faulkender (2011) and
Beber and Fabbri (2012) find evidence of “selective hedging” (Stulz, 1996) or outright
speculative behavior by corporate managers. Using uniquely detailed information to calculate
profits and losses from derivative positions, we document both hedging and speculative interest-
rate futures trading by Central Banks.
4 See Dolde (1993) or Bodnar, Hayt and Marston (1998) for U.S. firms, or Glaum (2002) for German firms.
6
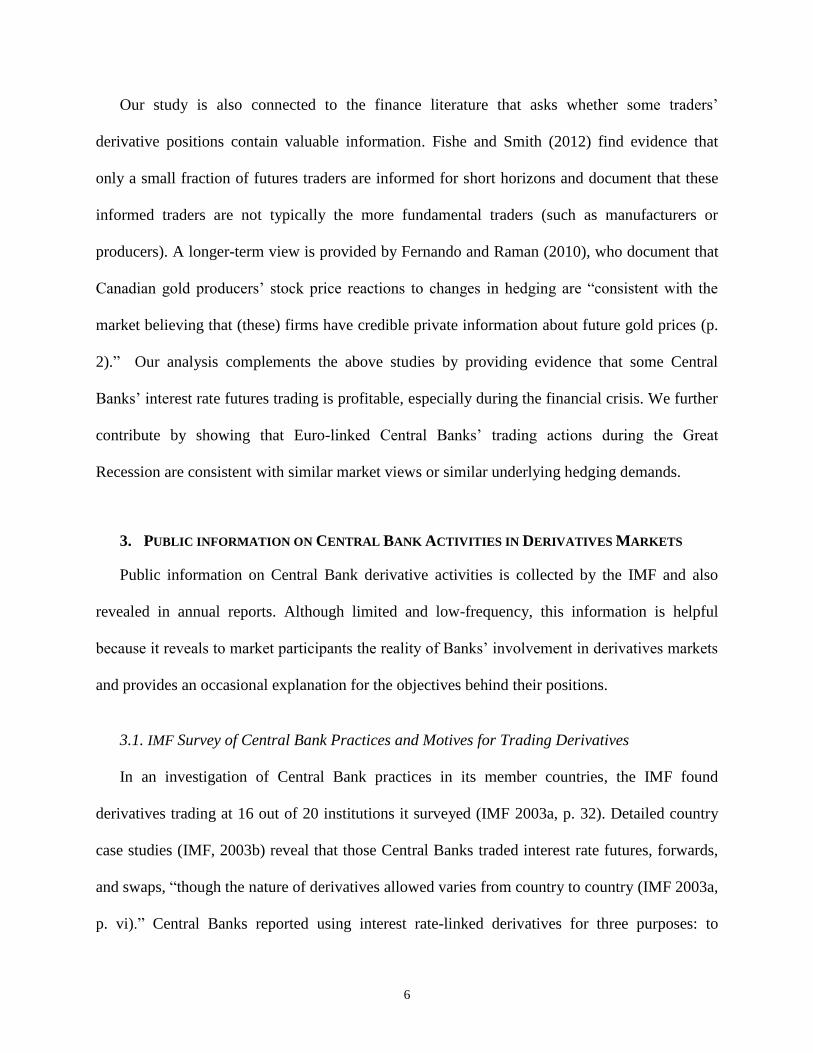
Our study is also connected to the finance literature that asks whether some traders’
derivative positions contain valuable information. Fishe and Smith (2012) find evidence that
only a small fraction of futures traders are informed for short horizons and document that these
informed traders are not typically the more fundamental traders (such as manufacturers or
producers). A longer-term view is provided by Fernando and Raman (2010), who document that
Canadian gold producers’ stock price reactions to changes in hedging are “consistent with the
market believing that (these) firms have credible private information about future gold prices (p.
2).” Our analysis complements the above studies by providing evidence that some Central
Banks’ interest rate futures trading is profitable, especially during the financial crisis. We further
contribute by showing that Euro-linked Central Banks’ trading actions during the Great
Recession are consistent with similar market views or similar underlying hedging demands.
3. PUBLIC INFORMATION ON CENTRAL BANK ACTIVITIES IN DERIVATIVES MARKETS
Public information on Central Bank derivative activities is collected by the IMF and also
revealed in annual reports. Although limited and low-frequency, this information is helpful
because it reveals to market participants the reality of Banks’ involvement in derivatives markets
and provides an occasional explanation for the objectives behind their positions.
3.1. IMF Survey of Central Bank Practices and Motives for Trading Derivatives
In an investigation of Central Bank practices in its member countries, the IMF found
derivatives trading at 16 out of 20 institutions it surveyed (IMF 2003a, p. 32). Detailed country
case studies (IMF, 2003b) reveal that those Central Banks traded interest rate futures, forwards,
and swaps, “though the nature of derivatives allowed varies from country to country (IMF 2003a,
p. vi).” Central Banks reported using interest rate-linked derivatives for three purposes: to

7
manage risk, synthetically replicate portfolio positions with more liquid instruments or improve
the risk-return profile of the Central Bank’s existing reserves portfolios.
While informative, the IMF survey does not provide cardinal measures of the magnitude of
the derivatives positions held by Central Banks. To fill this void, the IMF developed a monthly
dataset on foreign exchange reserves and financial derivative holdings (Section 3.2), which we
supplement using Central Banks’ own annual reports (Section 3.3).
3.2. IMF database of Official Reserves and Derivatives Positions
As Pihlman and van der Hoorn (2010, p. 11) remark, “[the] most extensive and consistent
dataset available on reserve levels and composition is collected by the IMF. This dataset consists
of reserve data from countries that voluntarily subscribe to the Special Data Dissemination
Standard (SDDS) and report the data according to a common template.”5 Two features of the
IMF’s SDDS dataset make it informative for this study.6 First, amounts are all expressed in U.S.
dollars, allowing for meaningful cross-country comparisons. Second, the reporting template
provides information on the market values of derivatives positions.
Figure 1 shows that the number of Central Banks reporting foreign reserves information in
the IMF’s public database (blue line) has increased substantially since 2000. As of the end of
2011, information was available for 72 foreign Central Banks (vs. fewer than 40 at the end of
2000), including almost all of the largest institutions. Figure 1 (green line), however, shows that
less than one third of Central Banks reported derivatives positions with non-zero market values
in each year in the last decade.
5 See International Monetary Fund, “Dissemination Standards Bulletin Board: Special Data Dissemination
Standards,” available online at http://dsbb.imf.org/Pages/SDDS/Home.aspx 6 The SDDS dataset has one major disadvantage for our goals because it excludes any breakdown of Central Bank
positions by underlying asset or market (exchange-traded vs. OTC). This missing information rules out identifying
the underlying purposes of Central Banks’ derivatives trading.

8
A more detailed analysis of the SDDS dataset shows that 53 of these 72 Central Banks either
did not provide complete information or did not use financial derivatives. Of the 19 banks that
did provide complete information, only 10 report exposure in any year exceeding (plus or minus)
one percent of foreign currency reserves (with extremes ranging from -9.93 percent to 17.57
percent). These data suggest that not many Central Banks are involved in derivative markets.
Yet, the fact that we found 31 Central Banks in our CFTC sample (including some institutions
absent from the public SDDS data) suggests a substantial reporting bias in the IMF database.
Overall, the public SDDS database highlights that selected Central Banks use derivatives in
their operations. To examine which derivatives they use, how much, and possibly why, we turn
next to Central Banks’ annual reports.
3.3. Derivatives Information in Central Bank Annual Reports
We collect the annual reports of all non-U.S. Central Banks listed in the IMF’s SDDS dataset
for fiscal years 2005 to 2010 and add two large Central Banks not in that dataset: the People’s
Republic of China and Taiwan-ROC (“SDDS+2”).7 After eliminating reports that could not be
obtained in English, our sample size ranges from 67 (2005) to 70 (2010) institutions.
The qualitative information we collect is whether the annual report discusses any derivatives
activities and whether, in the affirmative, the institution provides one or more purposes for
trading. Our approach is to search each annual report for derivatives-related terms such as (i)
“derivative,” “futures,” “option,” “forward,” “swap” and “CFD”; (ii) “exchange-traded,” “over-
the-counter” and “OTC”; (iii) “hedging,” “foreign (exchange) reserves” and “risk management,”
(iv) “risk-return,” “speculation,” “trade-offs” and “opportunistic”. For each hit, we read and
interpret the material before and after the search term’s occurrence.
7 Most Central Banks provide these annual reports on their websites. When this information was not available
electronically, we obtained hard copies from Central Banks’ public relation offices.

9
The quantitative information collected includes the notional and fair values of Central Bank
derivatives positions, separated by instrument and market when provided. To find these data, we
peruse the financial statements for evidence of derivatives trading, income or notional positions.
Table 1 provides counts of the information extracted from these annual reports. Table 2
examines the type of derivatives held and the stated purposes for trading, using 2009 as the
reference year.
Blinder et al. (2008) state that Central Banks have “become remarkably more transparent in
the last ten to fifteen years and are placing much greater weight on their communications” (p.
911). Consistent with this idea, we find that discussions of Central Banks’ derivatives positions
in their annual reports have become more detailed over time. In Table 1, the left half of Panel A
shows that a shrinking number of Banks say nothing about their derivatives activities.8
Approximately 75 to 80 percent of these Banks do mention trading derivatives—a figure
consistent with the proportion of Banks reporting affirmatively in the IMF survey (IMF, 2003b).
Only three Central Banks state explicitly that they do not trade any derivatives at all.
The most transparent Central Banks’ provide annual snapshots of substantial positions in
interest rate and foreign exchange-based instruments with some data on duration of the
underlying asset class. In most other cases, the annual reports provide limited information about
the magnitudes of such positions. Still, Panel B in Table 1 shows that, in any given year, at most
three Central Banks that report using derivatives fail to specify the underlying asset. All the other
Central Banks in our “SDDS+2” sample specify an underlying instrument: approximately 45%
say that they trade interest rate derivatives and 60% report trading foreign exchange derivatives.
The annual reports of over 60% of all Central Banks either are silent or make only vague
statements about a reason for using derivatives. As Table 1 shows, when a purpose is expressed,
8 In 2009, for example, the annual reports of China and Mexico make no mention of using derivatives.

10
the vast majority claim to trade for risk management or hedging purposes.9 Whether they trade
interest rate derivatives or foreign exchange derivatives, only a handful of Banks acknowledge
seeking to enhance returns or to synthetically replicate non-derivative financial instruments.10
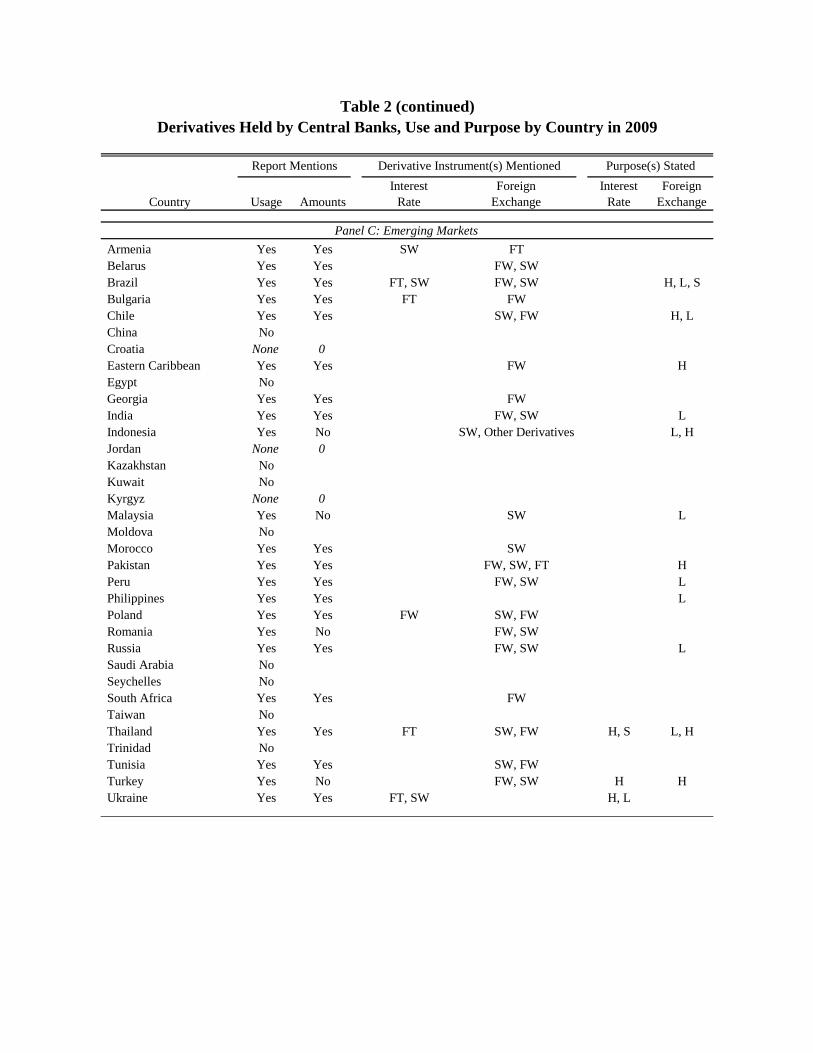
To further understand how derivatives usage varies among Central Banks, Table 2
summarizes the textual information in the annual reports for fiscal year 2009. The sample is the
same as in Table 1 (“SDDS+2”), but Table 2 splits the data between “Euro-linked” (Panel A:
Eurozone national Banks, European Central Bank and Central Banks whose countries belong to
the European Exchange Rate Mechanism but have not adopted the Euro); “Other OECD
Members and Advanced Economies” (Panel B); and “Emerging Markets” (Panel C). We use a
similar partitioning in the analyses of CFTC daily position data in Sections 4 to 6 below.
Table 2 shows that advanced economies’ Central Banks provide more information about
derivatives use. Only two Banks from “Other OECD” countries make no reference to derivatives
(Korea, Mexico) – although two others (Germany, Singapore) refer to derivatives in only the
most general terms as part of a discussion of accounting valuation principles.11
In contrast, Panel
C in Table 2 shows that almost 30 percent of emerging markets’ Central Banks (10 out of 34,
including large countries such as China and Egypt) make no mention of using derivatives.12
Among the Central Banks in Table 2, Norges Bank (Norway), Sveriges Bank (Sweden), the
Reserve Banks of New Zealand and Australia, and the Banque de France are among the
9 For example, the European Central Bank’s (ECB) 2009 report mentions using interest rates futures (plus currency
forwards and various swaps) “as part of the management of the ECB’s foreign reserves and own funds” (p. 221). 10
For example, the Reserve Bank of South Africa mentions that “the purpose of risk management emanating from
reserves management operations is to protect the value of the country’s gold and foreign exchange reserves … while
opportunistically taking positions to enhance returns” (emphasis added). Online statement accessed on September
22, 2014: http://www.resbank.co.za/ReservesManagement/Pages/Reserves-management-framework.aspx 11
The Bundesbank’s 2009 report mentions derivatives in a general statement that “swaps, futures, forward rate
agreements and other interest rate instruments shall be accounted for and valued on an item-by-item basis” (p. 147). 12
We do not count references either to swaps with domestic banks meant to solve liquidity issues or to bilateral
swaps between Central Banks (such as those between the U.S. Federal Reserve and a number of foreign Central
Banks during the 2008-2011 financial crisis).

11
institutions providing detailed information on their end-of-year positions in various derivatives
as well as explicit information on their futures market activities.
Table 2 shows that all the Central Banks (55) that report trading derivatives in 2009 mention
using over-the-counter instruments such as forwards or swaps. About 60 percent (21 out of 36)
of the Banks in advanced economies (Panels A and B) also mention using futures with much of
the trading involving interest rate futures – some domestic, but mostly foreign. In contrast, very
few (4 out of 34) Central Banks from emerging markets report trading futures. Options are only
mentioned in the reports of a few institutions. Also, confirming the results in Table 1, most
Banks discuss hedging (or liquidity) motives for derivatives positions.
In sum, the public information on Central Banks’ derivatives positions has become more
detailed over time. Still, what information is contained in annual reports is available at too low a
frequency to test for the motives and profitability of Central Bank trading. To this end, we turn to
the data on Central Bank positions in U.S. futures markets collected daily by the CFTC.
4. METHODOLOGY
We investigate three characteristics of Central Banks’ futures positions in an attempt to
isolate their purpose. First, we consider whether their positions yield consistent profits. Certainly,
Central Banks have access to superior information about their own actions that may affect
market prices (e.g., Sarno and Taylor, 2001). Although the size of their futures positions seems
large, it is small relative to the size of these markets, so Central Banks could disguise their
actions and use these markets to their advantage. Conversely, if hedging some balance sheet
holdings is the goal, we might find consistently negative or positive profits from futures

12
positions (depending on the underlying being hedged and the interest rate environment). Section
4.1 devises a method to explore the daily profitability of Central Banks’ futures positions.
Second, Section 4.2 proposes a test for hedging activity. The overall goal of hedging is to
reduce or eliminate the effects of price fluctuations on underlying asset (or liability) values. Our
test addresses whether Central Bank’s futures positions are systematically affected by market
price changes. If they are, there is evidence against a hedging purpose.
Lastly, the CFTC daily position data allow us to look for evidence of synchronized Central
Banks reactions to common external shocks. Because futures market positions are a limited part
of balance sheets, we cannot conclude synchronization in Banks’ overall activities or policies.
Section 4.3 explains the tests that we use to examine if Banks’ futures trades are synchronized.
4.1 Profits from positions and net trading
Central Bank participation in listed futures markets may be aimed at hedging specific interest
rate risks on their balance sheet, particularly during the 2007-09 Recession when these Banks’
loan portfolios expanded. To examine this question, we evaluate the profitability of Central Bank
positions and net daily trading both during and outside of the crisis period.
To compute profits, we first characterize the structure of our position data in light of the fact
that it represents end-of-day holdings. Suppose a Central Bank begins day t with position 𝑥0,𝑡𝑘 in
contract k and makes Jk trades to end the day with position, 𝑥𝐽𝑘,𝑡𝑘 , where for ease of exposition a
positive value indicates a long position and a negative value indicates a short position. Let
{𝑥0,𝑡𝑘 , 𝑥1,𝑡
𝑘 , 𝑥2,𝑡𝑘 , … , 𝑥𝐽𝑘,𝑡
𝑘 } denote the sequence of positions held by the bank during the day. Our
dataset contains the daily open interest positions of reporting traders in each contract in each
market, which means that we observe 𝑥0,𝑡𝑘 and 𝑥𝐽𝑘,𝑡
𝑘 but do not observe intraday position changes.

13
Next, we show how we can represent daily profits as a function of observables and a single
unobserved variable that we can approximate.
Aggregating over all trades (j=1, 2,…, J) and contracts (k=1, 2,…, K) on day t, we write the
Bank’s daily profit as
𝜋𝑡∗ = ∑ ∑ 𝑥𝑗,𝑡
𝑘 (𝑝𝑗+1,𝑡𝑘 − 𝑝𝑗,𝑡
𝑘 ),𝐽𝑘𝑗=0
𝐾𝑘=1 (1)
where 𝑝𝑗,𝑡𝑘 denotes the price of contract k at the time of trade j. The initial day t price, 𝑝0,𝑡
𝑘 ,
equals the previous day’s closing price and the final price, 𝑝𝐽𝑘+1,𝑡𝑘 , is the day t closing price. We
rewrite equation (1) as
𝜋𝑡∗ = ∑ 𝑥0,𝑡
𝑘 (𝑝𝐽𝑘+1,𝑡𝑘 − 𝑝0,𝑡
𝑘 ) +𝐾𝑘=1 (𝑥𝐽𝑘,𝑡
𝑘 − 𝑥0,𝑡𝑘 )(𝑝𝐽𝑘+1,𝑡
𝑘 − 𝑝∗,𝑡𝑘 ), (2)
where
𝑝∗,𝑡𝑘 =
∑ (𝑥𝑗,𝑡𝑘 − 𝑥𝑗−1,𝑡
𝑘 )𝑝𝑗,𝑡𝑘𝐽𝑘
𝑗=1
∑ (𝑥𝑗,𝑡𝑘 − 𝑥𝑗−1,𝑡
𝑘 )𝐽𝑘
𝑗=1
represents a reference price. It is a size-weighted average of trade prices for a given trader and is
defined only if ∑ (𝑥𝑗,𝑡𝑘 − 𝑥𝑗−1,𝑡
𝑘 ) ≠ 0,𝐽𝑘𝑗=1 i.e., if the closing open interest differs from day t-1 to t.
Equation (2) represents daily profits as a function of observables and a single unobserved
variable, 𝑝∗,𝑡𝑘 . Because the j subscript is redundant in (2), we consolidate notation and write
𝜋𝑡∗ = ∑ 𝑥𝑡−1
𝑘 ∆𝑝𝑡𝑘 +𝐾
𝑘=1 ∆𝑥𝑡𝑘(𝑝𝑡
𝑘 − 𝑝∗,𝑡𝑘 ), (3)
where ∆𝑝𝑡𝑘 = 𝑝𝑡
𝑘 − 𝑝𝑡−1𝑘 denotes the change in closing price between day t-1 and t for the k
th
expiration and ∆𝑥𝑡𝑘 = 𝑥𝑡
𝑘 − 𝑥𝑡−1𝑘 denotes the change in closing open interest position between
day t-1 and t. We compute daily trading profits using (3). As proxy for 𝑝∗,𝑡𝑘 , we use the midpoint
of the high and low prices observed during the day.

14
4.2 Hedging tests
If a Central Bank is hedging an underlying position, then changes in its futures positions
should be driven by changes in the sensitivity of its cash flow to U.S. interest rates (Faulkender
2005). This sensitivity is in turn driven by volatility: the more volatile are interest rates, the more
volatile should a Bank’s cash flows be.13
In contrast, a Bank that believes it can predict future
price changes, or follows a momentum or contrarian strategy, will change positions in response
to price changes. Fishe, Janzen, and Smith (2014) show that speculative traders who disagree on
the fundamental price will exhibit position changes that are correlated with price changes.
The key observation here is that price changes should not affect position changes in a pure
futures hedge. This observation suggests a first-order test for hedging behavior. We estimate the
regression model
∆𝑄𝑡𝑓
= 𝛼 + 𝛽∆𝑃𝑡 + 𝛾∆𝑉𝑡 + 𝜀𝑡 (4)
where ∆𝑄𝑡𝑓is the change in futures position, ∆𝑉𝑡 is the change in volatility of interest rates on day
t, ∆𝑃𝑡 is the change in the futures price and 𝜀𝑡 is an i.i.d. error term. In our estimation, we make
each of these terms into relative changes, e.g., change in futures price relative to the previous
(event time) futures price. The null hypothesis that a Bank is hedging is 𝐻𝑜: 𝛽 = 0.
Note that if the size of a Bank’s underlying position is correlated with prices, then we may
reject the null hypothesis even though it is hedging. We explore this possibility in Section 6.2.
13
If a Central Bank were following a minimum-variance rule, it would also adjust the hedge when the hedge ratio
changes -- which may be due to changes in the variance of futures or spot prices or the correlation between cash and
futures prices. Because spot and futures prices are highly correlated (typically greater than 0.94), position changes in
our context are more likely due to changes in the variance of futures prices than changes in the correlation.

15
4.3 Co-movement/Synchronization
To investigate co-movement or synchronization, we study the timing of changes in Central
Banks’ positions. Specifically, we test if contemporaneous changes in Banks’ positions occur
more than suggested by randomness. Fisher and Konieczny (FK, 2000) and Cavallo (2011)
suggest such synchronization tests for retail prices. We adapt the FK methodology to examine
Central Banks’ actions in futures markets. The FK index of synchronization, adapted to position
changes in a given futures contract, may be written as:
𝐹𝐾 = √∑ (𝑞𝑡−��)2𝑇
𝑡=1 𝑇⁄
��(1−��)=
√𝑠𝑞𝑡2
√��(1−��) (5)
where 𝑞𝑡 represents the proportion of Central Banks that changed their holdings in a given
futures at time t. The mean of 𝑞𝑡 is given by �� = ∑ 𝑞𝑡𝑇𝑡=1 𝑇⁄ with 𝑠𝑞𝑡
2 representing the sample
variance defined over T periods.
The intuition here is that if all Central Banks act simultaneously, they all change their
positions (𝑞𝑡 = 1) or none of them change their positions (𝑞𝑡 = 0). In that case, 𝑞𝑡 is a binary
variable and the sample variance, 𝑠𝑞𝑡2 , equals ��(1 − ��). As such, FK equals one in the case of full
synchronization. A complete lack of synchronization is referred to as a “staggering” of position
changes. Full staggering is characterized by 𝑞𝑡 = �� ∀𝑡, which implies FK = 0. In other words, if
Central Banks change positions such that a constant proportion 𝐸(��) = 𝜃 of all Banks change
their holdings every period, then there is no synchronization, just randomness.
Further insight into the structural basis of the FK measure is provided by Dias et al. (2005),
who model a set of participants as one of two types: either fully synchronized or fully non-
synchronized. These authors show that FK is a method-of-moments estimator of the proportion

16
of synchronized participants. Thus, we can interpret FK to measure the fraction of Central Banks
acting in a synchronized manner in U.S. futures markets.
To implement the FK calculation, we examine changes in Central Bank positions on a
weekly basis. We use a weekly measure because a daily measure could miss some synchronized
actions due to trading decisions’ arising in different time zones. On a given day, we aggregate
the same-side positions across expirations, which gives a total long (𝑥𝑖𝑡𝐿 ) and total short (𝑥𝑖𝑡
𝑆 ) for
bank i at the end of week t and allows us to compute the total net position 𝑥𝑖𝑡 = 𝑥𝑖𝑡𝐿 − 𝑥𝑖𝑡
𝑆 .
We develop two directional measures of trading:
𝑏𝑖𝑡𝐿 = 1 iff ∆𝑥𝑖𝑡 > 0; 𝑏𝑖𝑡
𝐿 = 0 otherwise, and
𝑏𝑖𝑡𝑆 = 1 iff ∆𝑥𝑖𝑡 < 0; 𝑏𝑖𝑡
𝑆 = 0 otherwise,
where ∆𝑥𝑖𝑡 ≡ 𝑥𝑖𝑡 − 𝑥𝑖𝑡−1. These two statistics define binary variables that indicate whether the
net position change in week t is directed towards long-side or short-side profitability.
Specifically, if a Central Bank increases a long futures position, then that is a profitable decision
if the futures price subsequently increases. Similarly, if a Central Bank decreases a short futures
position, that decision is also profitable in terms of opportunity cost provided the futures price
subsequently increases. Both changes together would result in 𝑏𝑖𝑡𝐿 = 1 𝑎𝑛𝑑 𝑏𝑖𝑡
𝑆 = 0 in the data
for bank i. Because banks remain neutral in some weeks, it is not always the case that 𝑏𝑖𝑡𝐿 = 1 −
𝑏𝑖𝑡𝑆 . We define these statistics in terms of position changes rather than levels because, if the
trading of different Central Banks is synchronized, then we would expect their actions to be
consistent with a specific direction in futures prices, regardless of the their initial holdings.
We calculate the proportion of Central Banks who changed their holdings (𝑞𝑡) for the two
directional measures specified above. Specifically, 𝑞𝑡𝐿 =
1
𝑚𝑡∑ 𝑏𝑖𝑡
𝐿𝑚𝑡𝑖=1 and 𝑞𝑡
𝑆 =1
𝑚𝑡∑ 𝑏𝑖𝑡
𝑆𝑚𝑡𝑖=1 , where
mt is the count of Banks holding positions in the futures market during week t. From these

17
measures, we compute long-side (𝐹𝐾𝐿) and short-side (𝐹𝐾𝑆) synchronization indices. This
approach yields a better statistic if such synchronization is asymmetric, i.e., Banks synchronize
on one side (e.g., interest rates increasing) and not the other (e.g., interest rates decreasing).
If Central Banks’ futures position changes are not synchronized, then we would expect
position changes to appear staggered through time.14
If they appear uniform across Banks, then
FK is expected to equal zero for either the long-side or short-side direction calculation. The null
hypothesis consistent with staggering of trade decisions is 𝐻𝑜: 𝐸(𝑞𝑡) = 𝜃, ∀𝑡. Under this null, a
constant proportion (𝜃) of Central Banks may randomly change positions each period. Dias et al.
(2005) show that this hypothesis may be tested using a 𝜒2 goodness-of-fit statistic. The
appropriate test statistic has the form:
𝑄 = ∑𝑁(𝑞𝑡−��)2
��(1−��)𝑇𝑡=1 = (𝑁𝑇)𝐹𝐾2 (6)
where, under the null, 𝑄 ~ 𝜒(𝑇−1)2 . Rejecting this null provides additional support for the view
that at least some Central Banks’ futures trades are synchronized.
5. CFTC POSITION DATA
We construct a database of end-of-day positions in interest-rate futures contracts. The raw
data originate from the CFTC’s Large Trader Reporting System, which represents more than 85
percent of the open interest in these interest rate futures markets. The volume that is not covered
by this dataset is for consistently smaller traders; all large traders are captured by the reporting
requirements. The CFTC provided data from July 2003 to December 2011.
14
Calvo (1983) and Taylor (1980, 1999) develop two macroeconomic models that embed sticky behavior by firms
that results in staggered price setting. Kiley (2002) offers a comparison of these two models. For our purposes, we
extend these concepts to sticky trade decisions, which then can result in staggered position changes through time.

18
5.1 Sample
We use information from the Bank for International Settlements (BIS) to identify alternative
Central Bank names and the CFTC’s list of “ultimate” position owners to find Central Banks in
the CFTC data. This procedure identifies 31 Central Banks from around the world holding
derivatives positions large enough to be reported at some point in our sample period.15
Several sample characteristics are worth noting. First, very few of those Central Banks trade
options on futures. Instead, most take (outright or spread) positions in futures markets. We
therefore focus our efforts on futures positions. Second, not all Central Banks are active in all
futures markets, and not all Banks active in a given market are active in that market at all times.
More than 10 of the 72 Central Banks in the IMF’s SDDS database whose annual reports never
mention activities in futures markets have reportable U.S. futures positions for at least part of the
past decade. Conversely, several of the Central Banks reporting non-zero market values for their
derivatives positions in the SDDS dataset are not observed in our CFTC sample. This situation
may arise because the positions held in U.S. exchange-traded contracts are too small for
reporting, because those positions are managed by an independent portfolio manager or because
the Central Bank only trades OTC contracts or non-U.S. futures.
Third, the positions held range from just large enough to be reported to substantial. However,
Table 3 shows that even when Central Bank positions are substantial, they typically account for
only a small percentage (less than 1% on average) of the overall open interest. Lastly, Central
Bank positions are concentrated in four interest-rate futures: Eurodollars (17 Central Banks) and
2-year (23 Central Banks), 5-year (22 Central Banks) and 10-year (22 Central Banks) Treasury
15
Conversations with officials from some smaller Central Banks reveal that their institutions take positions via
trades through financial intermediaries. Because it is the intermediary that controls the trading in such cases, such
Central Banks are not in our CFTC dataset. As a result, the number of “31” Central Banks in U.S. interest rate
futures markets understates the true number of Central Banks that hold positions in U.S. futures markets.

19
Notes. Other interest rate futures are traded by fewer Central Banks (e.g., Treasury Bonds for
eight Central Banks; 30-day Federal Funds for seven Central Banks) and, in each case, are
generally less actively traded than these four main contracts. In contrast, a minuscule number of
Central Banks take large positions in other U.S. futures markets.16
We focus therefore on
Eurodollars, as well as 2-year, 5-year and 10-year T-Notes futures.
5.2 Summary statistics
Table 3 provides summary statistics for our sample of Central Banks. We report means and
medians for end-of-day futures positions and for the change in positions for both long and short
sides of the market. We also show statistics for the count of expirations, the percentage of time
remaining in a contract and the percent of open interest relative to total open interest. These data
are reported for each of the four instruments in our sample. Except for the percent of total open
interest, mean and median statistics are computed by first calculating the averages and medians
across days for each participant and then summarizing across participants. Our statistics thus
reflect a representative bank rather than a representative day and so are not distorted by
participants that trade more frequently. For the percent of total open interest, the calculation is
made daily over all banks and the mean and median statistics are computed across days.
Table 3 reveals that Central Banks hold fairly large positions in these contracts. On the high
side, the nominal value of the average Eurodollar long position is $6.8 billion, and on the low
side the nominal value of the average short position in 5-year Treasury Notes is $262.9 million.
16
Generally, at most one Central Bank in our sample takes reportable positions in futures contracts on the main
currencies, commodities (gold, wheat, corn or coffee), or U.S. equity indices.

20
Similarly, the daily change in positions is meaningful across these contracts with changes in long
positions tending to be larger than changes in short positions (except for 2-year Notes).17
Expiration counts and the time remaining in a contract suggest that Central Banks typically
hold the nearby contracts in the Treasury complex. For Eurodollars, the time remaining in a
contract is fairly low—both mean and median. Expiration counts also suggest that Central Banks
hold spread or butterfly Eurodollar futures positions.
Although Bank positions are monetarily significant, on average they are not meaningful
given the size of these markets. Thus, the purpose behind such positions is likely not to influence
U.S. interest rates. In effect, the small size of these holdings relative to the market as a whole
suggests that participation in these markets is likely driven by an internal calculation based on
how policy decisions may affect a Banks’ overall balance sheet or by portfolio management
considerations for foreign reserve assets.
6. ANALYSIS
This section presents the results of the tests developed in Section 4. We investigate the
profitability of Central Banks’ positions and trading (6.1), their purposes for using interest-rate
futures (6.2) and the possible synchronization of their trading activities (6.3).
6.1 Central Bank profits from holding futures contracts
Table 4 shows the estimated daily average profits from Central Bank positions and net
trading summarized by futures contract and across all contracts. The amounts shown are profits
for long and short positions combined. Overall, Central Banks lost money on their futures market
17
Daily position changes do not correspond to trade sizes because participants may make many trades on both sides
on the market during the day. The position changes reported here constitute the end-of-day changes in open interest.

21
positions. For Eurodollars and 2-year Treasury notes, losses occurred on average both during and
outside the recession of 2007-09. However, their profitability in 5-year and 10-year notes
differed between the recession and non-recession periods.
For the sub-sample of Euro-linked Central Banks, we find consistent overall losses for the
period excluding the recession of 2007-09. During the recession, those Banks show positive
average daily profits on their Treasury Notes positions, particular 5-year notes. This period
witnessed declining interest rates, so holding larger long positions would generate this result.
As to the hedging motive, the overall profit column supports the statements of Central Banks
in their annual reports. Specifically, no Bank would persist in holding or taking positions for
losses in these markets if there was no material offset somewhere on its balance sheet. However,
some contracts—5-year and 10-year Notes—and the group of Euro-linked Banks may reveal a
different motive. For these contracts and Banks, substantial profits are found during various
periods. Thus, a speculative motive may also be at work for selected Central Banks.
6.2 Dynamic hedging tests
The results in Table 4 are indicative of Central Bank profits and motives but do not involve a
statistical test for hedging. Next, we apply the hedging test described in Section 4.2.
Table 5 shows hedging test results for the entire sample period by commodity. Observations
are for each Central Bank over time, so we use a pooled cross-section time-series model with a
fixed parameter structure. For each bank, we only include daily observations for which the net
position change was nonzero and there is no weighing by the size of a Bank’s position. The
dependent variable is the ratio of the change in net long positions (long minus short) divided by
the total of long and short positions. Price changes are measured using close-to-close prices
between the included observations.

22
We compute the variance of futures prices using the prices of options on futures. We
calculate option-implied volatilities using the formula that the Chicago Mercantile Exchange
(CME) uses for its VIX calculation, which is in standard deviation units. For each trading day we
use the nearest-to-maturity option with more than one month to expiration (e.g., for the October
expiration in Treasury bonds, we use the December expiration options contract), and we omit
any option contracts with zero volume on the relevant trading day. We conduct robustness
checks of our hedging tests using an implied volatility series from the Commodity Research
Bureau, which is based on Black’s formula and the two nearest-to-the-money puts and calls.18
The lower (DW-lower) and upper (DW-upper) Durbin-Watson p-values are shown for an AR(1)
model at the bottom of the table. The results in Table 5 support the view that Central Banks use
futures markets for hedging purposes, because the coefficient on the price change tends to be
statistically insignificant. The exception is the 10-year Note, which exhibits a significant positive
coefficient on the price change variable.
In Table 6, we re-estimate our model by partitioning the sample into before, during, and after
the Great Recession period. These three sub-periods are the “Pre-Crisis,” defined as July 2003 to
November 2007; “Crisis,” defined as December 2007 through June 2009, i.e., as the period
during which the United States was in a recession as identified by the National Bureau of
Economic Research; and “Post-Crisis,” defined as July 2009 to December 2011.
Panel A in Table 6 shows that this partitioning of the sample has meaningful effects on these
hedging tests. For every commodity, the relative price change variable is statistically significant
during the crisis period and insignificant during the pre-crisis period. The positive sign indicates
18
The Commodity Research Bureau does not cover our entire sample period. Still, our results are robust to using
this alternative measure in that, for the overlapping period, our results are substantially the same for both series.
Hence, we report our findings using the VIX calculation. We confirm the stationarity of these relative-change
variables using the adjusted Dickey-Fuller test and the Kwiatkowski, Phillips, Schmidt, and Shin (KPSS) test for the
full sample and each sub-sample.

23
that Central Banks appear to use a momentum strategy; that is, they increase their net long
positions when prices are increasing.
As an alternative to the momentum interpretation of these results, the findings shown in
Table 6 (Panel A) could be consistent with a hedging story if there were repeated, unexpected
changes in interest rates. Suppose, for example, that during the crisis, Central Banks want to
hedge the income stream on their short-term, dollar-denominated assets. As interest rates drop,
Central Bank income drops. In order to protect against further decreases in income, Central Bank
managers who had hedged only part of their exposure might increase their net long positions in
interest rate futures. This story, however, requires that unexpected interest-based losses
contemporaneously increase the incentive to hedge against further losses. The findings of Scalia
and Sahel (2012), though, suggest that foreign reserve managers (like most asset managers) tend
to respond to losses by increasing their exposure to risk.
Another possible story is that, as long-term interest rates dropped amid the financial crisis,
the fear of possible capital losses in the event that rates rebounded might have led reserve
managers to increase the hedge. Because T-Note futures prices and interest rates are inversely
related, however, we would expect the signs of the regression coefficients to be the opposite of
those in Table 6 (Panel A). A third possibility is linked to the flow of dollar-denominated assets
onto Central Banks’ balance sheets. If foreign reserves’ growth is inversely related to the level of
U.S. interest rates and unexpected flows arise, then hedging positions may change, which creates
a correlation with price changes.
Although the coefficients in Panel A may admit a hedging strategy, such an explanation
requires a sequence of unexpected price changes. The post-crisis period results in Panel A
question these stories. The post-crisis coefficients confirm the significant positive relationship

24
between positions and relative price changes for all commodities except 2-year notes. For
Eurodollars in particular, the relative price change coefficient indicates that these effects
increased by an order of magnitude. A hedging explanation may still be viable, but it is more
difficult to believe that balance sheet changes were unexpected at this point. Given Central
Banks’ access to information during the crisis and afterwards, these post-crisis significant effects
suggest that informed, strategic trading may be a better explanation for our findings.
Euro-linked Central Banks make up approximately one-third of our sample and constitute a
reasonably homogeneous sub-group. We therefore re-estimated the hedging test for that sub-
group of Banks. These results are shown in Panel B in Table 6. The results generally confirm the
full sample findings, except that now the pre-crisis coefficient on the relative price change
variable is significant for Eurodollars, 2-year and 10-year Notes, suggesting a possible non-
hedging motive in certain contracts prior to the crisis for these Banks. Combined with the
previous observations for Panel A, these findings lean towards a speculative motive for futures
positions, possibly because of information relevant to particular contracts.
To better understand the idiosyncratic features of these different Central Banks, we re-
estimate the hedging-test model on each Bank separately. Because we are using daily frequency
data, a few Banks drop out of our sample as they do not have enough variation for reliable
estimation. The final sample contains 28 Central Banks. We report the sign of the relative price
change variable and its p-value in Table 7. The R2 range and the count of significant (5% level)
coefficients for each commodity are shown at the bottom of this table.
The significance counts at the bottom of Table 7 indicate that our findings are too frequent to
be generated by chance. Thus, we are statistically confident that many of these Central Banks are
adjusting futures positions coincident with price changes, which is not standard if they have

25
adopted an effective hedging strategy. Importantly, the inconsistency in the sign of the
coefficient on the relative price change variable suggests either quite different hedging
instruments (assets versus liabilities) or selective use of information. Because some Central
Banks show futures profits, the selective use of information motive cannot be readily dismissed.
Overall, these tests suggest that hedging is unlikely to be the sole purpose for Central Bank
positions in U.S. futures markets.
6.3 Rolling Measure of Synchronization
We compute the FK synchronization measure for a one-year moving window starting in
2004. We roll this calculation forward using one week increments to the end of the sample.
Figure 2 shows the pattern of synchronization for the long- and short-side versions of the FK
measure. It shows some synchronization of position changes, particularly for long side holdings,
but the degree of participation is at most around 50%.19
The plot makes it clear that after mid-2006, there was a decline in synchronization on the
short-side with a peak of 55% reached for the period ending July 2006 and a trough reached for
the period ending October 2010 (22%). Rapid declines are observed from periods ending July
2006 to November 2006 (44%) and for April 2007 (49%) to July 2007 (39%), while fairly steady
synchronization arises between the periods ending August 2005 to July 2006 and July 2007 to
October 2008, with the latter being at a reduced participation rate. The evidence here suggests
19
In the FK calculation, T is fixed but the number of Central Banks with positions may vary somewhat within a
given year. To investigate any biases that arise because of this variation, we (i) exclude observations where there are
less than five Banks in a given week; (ii) evaluate the FK calculation using only observations with an equal number
of Banks and (iii) use the minimum, median and average number of participating Banks to compute the chi-squared
test of staggered changes in positions. All of these robustness checks lead to the same general observations about
the synchronization of Banks’ net trading decisions.

26
that participation on the short-side decreased during the 2007-09 Recession (which, for this
rolling forward calculation, is for the period ending December 2008 to June 2010).
In contrast, the long-side measure shows greater fluctuation in synchronization than the
short-side measure. There appears to be fairly high synchronization (>50%) between the period
ending July 2006 to February 2007. In addition, sustained synchronization arises at a somewhat
lower level (~45%) during the period ending December 2008 to January 2010, which overlaps
the 2007-09 Recession and continues six months beyond its official end date.
Because of the limited number of Banks in our global sample, we cannot systematically
isolate each region to analyze if Banks in that region are more synchronized than the global
sample. An exception, however, are Central Banks whose currencies are linked to the Euro. This
group of Banks’ participation in these futures contracts leads to a sufficiently large sample to use
our methods while preserving trader confidentiality (n=10).
Figure 3 shows the rolling calculation of the FK synchronization measure based on a sample
of Euro-related Banks. To have sufficient size, this sample begins in October 2006. A noticeably
different level of participation is observed for Euro-linked Banks for the entire period and during
the 2007-09 Recession. At the beginning of the 2007-09 Recession, about 75% of Euro-linked
Banks synchronized long-side net position changes and about 65% synchronized short-side net
position changes. These rates increased steadily during the 2007-09 Recession, reaching a peak
of 92% long-side participation and 87% short-side participation in September 2009 (which
effectively covers the second half of the Great Recession).
6.4 Staggered Position Changes
The patterns appearing in Figures 2 and 3 shows higher levels of synchronization during the
2007-09 Recession for Europe-linked Banks than are found in our global sample of Central

27
Banks. To weigh this evidence, we examine whether we can reject the staggered-price
hypothesis for these data. Figures 4 and 5 provide a plot of the one-tail p-values for this chi-
square goodness-of-fit test. Figure 4 shows all Central Banks and Figure 5 is for the sample
using only Euro-linked Banks. The p-values are shown for each annual sample rolling forward
weekly, identical to the sample definition used to calculate the FK measure.
Figure 4 shows that the long-side synchronization observations from Figure 2 are generally
supported. The two periods with relatively high levels of long-side participation by Central
Banks correspond to periods during which we can reject the hypothesis of staggered position
changes arising at a constant rate. The short-side results in Figure 4 suggest that while there is a
prolonged period of relatively high synchronization near the beginning of our sample, we cannot
reject the position change staggering hypothesis – which lowers the weight that we place of the
implications of the observed FK measure. Although there are brief periods of significance for the
short-side measure of position change staggering, they do present a picture to support the view
that globally, foreign reserve managers within Central Banks react similarly in an increasing-
interest rate environment.
In contrast, Figure 5 offers consistent support for the view that Europe-linked Banks’ long-
side net position changes were synchronized during the 2007-09 recession and (for a limited
period) that short-side changes were, too. Figure 5 shows a fairly sustained period (April/May
2009 to July 2010) in which we can reject the position change staggering hypothesis on the long
side. During this interval of time, the short side also provides support for synchronization of net
trade decisions (period ending November 2009 to June 2010).

28
7. CONCLUSIONS
We provide the first position-level evidence on derivative use by Central Banks in financial
markets where there is no a priori reason to believe that their goal is to influence asset prices.
We exploit a unique, comprehensive, non-public dataset of individual traders’ daily positions in
U.S. interest-rate futures markets between 2003 and 2011 to test the rationale for such positions
provided from limited public data – mostly the information contained in their annual reports.
On average, the actual trading behavior of the 31 Central Banks in our sample seems
consistent with the hedging purposes mentioned by the vast majority of those institutions.
However, an analysis using sub-samples (around the Great Recession and by country group)
provides evidence of non-hedging motives for Central Bank derivatives holdings. During and
after the 2007-09 financial crisis, Central Banks (especially Euro-linked institutions) held, and
profited from, directional positions in 5- and 10-year T-Note futures, which is indicative of a
non-hedging strategy. We also find evidence that amid the 2007-09 Great Recession and
financial crisis, foreign reserve managers from a number of Central Banks reacted in a
synchronized manner to the crisis.

29
REFERENCES
Adam, Tim R. and Chitru S. Fernando, 2006, “Hedging, Speculation, and Shareholder Value,” Journal of
Financial Economics 81, 283–309.
Bank for International Settlements, 2010, Portfolio and risk management for central banks and sovereign
wealth funds. BIS Paper No 58 - Proceedings of a joint conference organized by the BIS, the ECB
and the World Bank in Basel, 2–3 November 2010.
Beber, Alessandro and Daniela Fabbri, 2012, “Who Times the Foreign Exchange Market? Corporate
Speculation and CEO Characteristics,” Journal of Corporate Finance, 18(5), 1065–1087.
Blejer, Mario I. and Liliana B. Schumacher, 2000, “Central Banks Use of Derivatives and Other
Contingent Liabilities: Analytical Issues and Policy Implications,” IMF Working Paper No. 00/66,
March. Available at SSRN: http://ssrn.com/abstract=879558
Blinder, Alan S., Michael Ehrmann, Marcel Fratzscher, Jakob de Haan, and David-Jan Jansen, 2008,
“Central Bank Communication and Monetary Policy: A Survey of Theory and Evidence,” Journal of
Economic Literature 46(4), 910–45.
Bodnar, Gordon M., Gregory S. Hayt, and Richard C. Marston, 1998, “Wharton Survey of Derivatives
Usage by U.S. Non-Financial Firms,” Financial Management 27(4), 70–91.
Booth, James R., Richard L. Smith, and Richard W. Stolz, 1984, “The Use of Interest Rate Futures by
Financial Institutions,” Journal of Bank Research 15, 15–20.
Brown, Gregory, 2001, “Managing Foreign Exchange Risk with Derivatives.,” Journal of Financial
Economics 60, pp. 401–48.
Brown, Gregory W., Peter R. Crabb, and David Haushalter, 2006, “Are Firms Successful at Selective
Hedging?” Journal of Business 79, 2925–2949.
Caballero, Ricardo J. and Stavros Panageas, 2005, “Contingent Reserves Management: an Applied
Framework," Economía Chilena, 8(2), 45–56.
Calvo, Guillermo, 1983, “Staggered Prices in a Utility Maximizing Framework,” Journal of Monetary
Economics 12, 383–98.
Cavallo, Alberto, 2011, “Scraped Data and Sticky Prices”, Working paper, MIT Sloan School of
Management.
Chernenko, Sergey and Michael W. Faulkender, 2011, “The Two Sides of Derivatives Usage: Hedging
and Speculating with Interest Rate Swaps,” Journal of Financial and Quantitative Analysis, 46(6),
1727–1754.
Claessens, Stijn and Jerome Kreuser, 2007, “Strategic Foreign Reserves Risk Management: Analytical
Framework.” Annals of Operations Research, 152 (1), 79–113.
Dias, D.A., Robalo Marques, C., Neves, P.D., and J.M.C. Santos Silva, 2005, “On the Fisher-Konieczny
Index of Price Changes Synchronization,” Economics Letters, 87(2), 279–283.

30
Dolde, Walter, 1993, “The Trajectory of Corporate Risk Management,” Journal of Applied Corporate
Finance 6, pp. 33–41.
Dominguez, Kathryn M.E., 2012, “Foreign Reserve Management during the Global Financial Crisis,”
Journal of International Money and Finance, 31(8), 2017‐2037.
Dominguez, Kathryn M.E., Rasmus Fatum, and Pavel Vacek, 2013, “Do Sales of Foreign Exchange
Reserves Lead to Currency Appreciation?” Journal of Money, Credit and Banking, 45(5), 867-890.
Dominguez, Kathryn M.E., Yuko Hashimoto, and Takatoshi Ito, 2012. “International Reserves and the
Global Financial Crisis.” Journal of International Economics, 88 (2), 388–406.
Faulkender, Michael W., 2005, “Hedging or Market Timing? Selecting the Interest Rate Exposure of
Corporate Debt,” Journal of Finance 60, 931–962.
Fernando, Chitru S. and Vikas Raman, 2010, “Is Hedging Bad News? Evidence from Corporate Hedging
Announcements,” Paper presented at the 2010 EFA meetings.
Fishe, Raymond P.H. and Aaron D. Smith, 2012, “Identifying Informed Traders in Futures Markets,”
Journal of Financial Markets, 15(3), 329–359.
Fishe, Raymond P. H., Joseph P. Janzen, and Aaron Smith, 2014, “Hedging and Speculative Trading in
Agricultural Futures Markets,” American Journal of Agricultural Economics, 96 (2): 542-556.
Fisher, Timothy C.G., and Jerzy D. Konieczny, 2000, “Synchronization of Price Changes by
Multiproduct Firms: Evidence from Canadian Newspaper Prices,” Economic Letters 68, 271–77.
Glaum, Martin, 2002, “The Determinants of Selective Exchange Risk Management – Evidence from
German Non-Financial Corporations,” Journal of Applied Corporate Finance 14(4), 108–121.
______, 2003a. IMF Guidelines for Foreign Exchange Reserve Management: Summary of Practices.
International Monetary Fund, Washington, DC, April. Available online at:
http://www.imf.org/external/pubs/ft/ferm/guidelines/2005/part1.pdf
______, 2003b. IMF Guidelines for Foreign Exchange Reserve Management: Country Case Studies.
International Monetary Fund, Washington, DC, April. Available online:
http://www.imf.org/external/pubs/ft/ferm/guidelines/2005/part2.pdf
Kiley, Michael T., 2002, “Partial Adjustment and Staggered Price Setting,” Journal of Money, Credit, and
Banking 34(2), 283–298.
Pihlman, Jukka and Han van der Hoorn, 2010, “Procyclicality in Central Bank Reserve Management:
Evidence from the Crisis,” IMF Working Paper No. 10/150, Washington, DC, June. Available
online: http://ssrn.com/abstract=1653185
Purnanandam, Amiyatosh, 2007, “Interest Rate Derivatives at Commercial Banks: An Empirical
Investigation,” Journal of Monetary Economics 54(6), 1769–1808.

31
Remolona, Eli M. and Martijn A. Schrijvers, 2004, “Reaching for Yield: Selected Issues for Reserves
Managers.” In Risk Management for Central Bank Foreign Reserves, Carlos Bernadell, Pierre
Cardon, Joachim Coche, Francis X. Diebold and Simone Manganelli, Eds. European Central Bank:
Frankfurt am Main, Germany
Sarno, Lucio and Mark Taylor, 2001, “Official Intervention in the Foreign Exchange Market: Is It
Effective and, If so, How Does It Work?” Journal of Economic Literature, 39(3), 839–868.
Scalia, Antonio and Benjamin Sahel (2012). “Ranking, Risk-Taking and Effort: An Analysis of the
ECB’s Foreign Reserves Management.” European Central Bank Working Paper No. 1377, February
2012. Available at: http://ssrn.com/abstract=2014843.
Steiner, Andreas, 2013 “How Central Banks Prepare for Financial Crises – An Empirical Analysis of the
Effects of Crises and Globalisation on International Reserves,” Journal of International Money and
Finance, 33, 208–234.
Stulz, Rene M., 1996, “Rethinking Risk Management,” Journal of Applied Corporate Finance 9, pp. 8–
24.
Taylor, John B., 1980, “Aggregate Dynamics and Staggered Contracts,” Journal of Political Economy
88(1), 1–23.
______, 1999, “Staggered Price and Wage Setting in Macroeconomics,” in: J.B. Taylor and M.
Woodford, Eds., Handbook of Macroeconomics, Vol. 1 (North-Holland, Amsterdam) 1009–1050.

No
Derivatives
CB Holds
Derivatives Hedging Speculation Hedging Speculation
2005 67 3 46 18 17 2 20 2
2006 68 3 47 18 16 1 22 1
2007 69 2 48 19 17 1 21 2
2008 69 2 50 17 16 2 23 2
2009 70 3 55 12 17 1 24 3
2010 70 1 55 14 17 2 25 2
Instrument Purpose Instrument Purpose Amounts Instrument Purpose Amounts
2005 3 1 30 18 19 44 22 33
2006 3 1 30 17 20 45 27 33
2007 1 1 31 19 22 46 26 36
2008 3 1 28 18 20 51 37 38
2009 1 1 31 19 22 53 36 39
2010 2 1 30 18 22 51 33 36
Annual Report Provides
Information Annual
Report is
Silent
This table summarizes information contained in the annual reports published by Central Banks from 2005 to 2010 regarding
derivatives activities. The sample comprises those Central Banks reporting financial information to the International
Monetary Fund (IMF) for public dissemination as part of the Fund’s online SDDS database and two major Central Banks
not included in that database. We exclude Central Banks whose annual reports could not be obtained in English. Panel A
shows the sample size, the count of Banks the report derivative holdings or no holdings, the number of Banks providing no
derivatives information, and the reported motives for derivatives positions if available. Panel B uses the Central Banks that
report derivative holdings to show the types derivatives they trade. The first two columns focus on the three Central Banks
that report using derivatives without specifying the contract markets in which they hold positions. The next six columns
shows the kind of information provided by these reports for interest rate and foreign currency derivatives.
Derivative Use from Central Banks’ Annual Reports
Table 1
Motives for trading…Interest
Rate Derivatives
Motives for trading…Foreign
Exchange Derivatives
Annual
ReportYear Sample Size
Panel A: Overview
Panel B: Underlying Instruments
Annual
ReportYear
Unspecified Underlying
Asset(s)…mentions Mentions Interest Rate Derivatives… Mentions Foreign Exchange Derivatives…

Country Usage Amounts
Interest
Rate
Foreign
Exchange
Interest
Rate
Foreign
Exchange
Austria Yes Yes SW SW, FW L
Belgium Yes Yes FT SW, FW H L
Cyprus Yes Yes FW, SW H
Denmark Yes Yes SW FW, SW, FT H, L
Estonia Yes Yes SW, FT FW, SW H H
European Central Bank Yes Yes FT, SW SW, FW H H, L
Finland Yes Yes SW FT, FW, SW
France Yes Yes FT, SW FW, OP, SW C H, L
Germany (a) No
Greece Yes No FW, SW L
Ireland Yes Yes FW
Italy Yes Yes FT FW, SW
Latvia Yes Yes FT FW, SW, FT H H
Lithuania Yes Yes FT FW, SW H H
Luxembourg Yes Yes FT H
Malta Yes Yes FT FW, SW H H, L
Netherlands Yes Yes SW FW, SW L H, L
Portugal Yes Yes FT, SW FW, SW H H
Slovakia Yes Yes FT SW
Slovenia Yes Yes SW L
Spain Yes Yes FT FW, SW L
Australia Yes Yes FT SW H L, H
Canada No
Czech Republic Yes Yes FT, SW FW, SW L
Hungary Yes Yes SW, FT OP, SW H
Iceland Yes Yes FW, SW
Israel Yes Yes FT SW, OP, FT, FW
Japan Yes No SW L
Korea No
Mexico No
New Zeland Yes Yes FT, SW FW, SW S, H H, L
Norway Yes Yes FT, SW SW, FT H, L H, L
Singapore (a) No L
Sweden Yes Yes FW, SW
Switzerland Yes Yes FT, SW, FW FW, OP, SW H H, S, L
United Kingdom Yes Yes SW, Bond FT SW, FW H H, L
Panel A: Euro-Related Countries
Panel B: Other OECD and Advanced Economies
Table 2
Derivatives Held by Central Banks, Use and Purpose by Country in 2009
This table reports information about the usage of derivative contracts based on annual reports in 2009 by 70
Central banks in the Euro-related countries, other OECD member and advanced countries, and countries in
emerging markets. Note that Chile and Estonia did not become members of the OECD until 2010, and hence
are not listed among OECD countries. Israel and Singapore, though not members of the OECD in 2009, are
nevertheless listed among other "advanced economies" as per the MSCI listings for that year. The first
column shows whether a report provides any information about whether a Central Bank uses derivatives
(“Yes”), does not use them ("No"), or provides no information (“None”). For the 55 Central Banks that report
using derivatives, the second column shows whether the report provides information about the amounts
involved (either notional or fair values). For both interest rate and foreign exchange derivatives, the next four
columns show whether the report states that it uses forwards (FW), futures (FT), swaps (SW), or options
(OP), and whether its purposes are for hedging (H), liquidity (L), or speculation (S). The (a) entries mean that
derivatives are referenced in general terms but there is no affirmative statement of their use.
Report Mentions Derivative Instrument(s) Mentioned Purpose(s) Stated
Country Usage Amounts
Interest
Rate
Foreign
Exchange
Interest
Rate
Foreign
Exchange
Armenia Yes Yes SW FT
Belarus Yes Yes FW, SW
Brazil Yes Yes FT, SW FW, SW H, L, S
Bulgaria Yes Yes FT FW
Chile Yes Yes SW, FW H, L
China No
Croatia None 0
Eastern Caribbean Yes Yes FW H
Egypt No
Georgia Yes Yes FW
India Yes Yes FW, SW L
Indonesia Yes No SW, Other Derivatives L, H
Jordan None 0
Kazakhstan No
Kuwait No
Kyrgyz None 0
Malaysia Yes No SW L
Moldova No
Morocco Yes Yes SW
Pakistan Yes Yes FW, SW, FT H
Peru Yes Yes FW, SW L
Philippines Yes Yes L
Poland Yes Yes FW SW, FW
Romania Yes No FW, SW
Russia Yes Yes FW, SW L
Saudi Arabia No
Seychelles No
South Africa Yes Yes FW
Taiwan No
Thailand Yes Yes FT SW, FW H, S L, H
Trinidad No
Tunisia Yes Yes SW, FW
Turkey Yes No FW, SW H H
Ukraine Yes Yes FT, SW H, L
Table 2 (continued)
Derivatives Held by Central Banks, Use and Purpose by Country in 2009
Report Mentions Derivative Instrument(s) Mentioned Purpose(s) Stated
Panel C: Emerging Markets

Variable Eurodollars Two-Year Five-Year Ten-Year
Panel A: Means
Futures Long Positions 6,851 2,573 2,962 3,049
Futures Short Positions 4,366 4,769 2,629 2,755
Net Change in Long Positions 1,171 1,705 2,514 2,395
Net Change in Short Positions 710 2,740 1,742 1,386
Expiration Count 4.06 1.02 1.02 1.04
Time Remaining in Contract 12.1% 44.7% 37.6% 29.8%
Percent of Total Open Interest 0.40% 0.70% 1.10% 0.70%
Panel B: Medians
Futures Long Positions 3,725 2,454 2,000 2,313
Futures Short Positions 2,498 1,626 1,450 2,125
Net Change in Long Positions 321 508 650 786
Net Change in Short Positions 192 640 471 500
Expiration Count 2.00 1.00 1.00 1.00
Time Remaining in Contract 10.5% 43.9% 36.5% 28.7%
Percent of Total Open Interest 0.25% 0.49% 0.77% 0.39%
Table 3
Summary Statistics for Central Banks' Futures Positions
Summary statistics are shown for end-of-day futures positions and the change in positions
by long and short sides, the count of expirations, the percentage of time remaining in a
contract, and the percent of open interest relative to total open interest for Eurodollars, Two-
Year, Five-Year and Ten-Year Treasury Note contracts. Except for the percent of total open
interest, these statistics are computed by first calculating the average and medians across
days for a given participant and are then summarized across participants to reduce skewness
biases created by participants with higher participation rates and open interest levels. For the
percent of total open interest, the calculation is made daily, and the mean and median are
computed across days in the sample.
Treasury Note Futures

Sample Coverage Overall Eurodollars Two-Year Five-Year Ten-Year
All Central Banks
All Periods (12,033)$ (8,772)$ (83,828)$ 24,714$ 39,184$
2007-09 Recession (17,335)$ (49,288)$ (62,040)$ (75,051)$ 208,398$
Excl. 2007-09 Recession (10,809)$ (2,005)$ (92,092)$ 49,214$ (1,896)$
Euro-related Central Banks
All Periods (16,964)$ (13,698)$ (32,565)$ 27,422$ (45,786)$
2007-09 Recession 20,020$ n.a. 1,140$ 174,698$ 4,039$
Excl. 2007-09 Recession (20,471)$ (13,698)$ (45,854)$ 12,711$ (50,500)$
Position and Net Trading Profits
This table reports the average daily position and net trading profits for the sample of all Central banks by
period and futures instrument. Profits for the sub-sample of Euro-related Central banks are shown
separately. This sub-sample includes some but not all of the Euro-related banks shown in Table 3. Net
trading profits during a given day use the midpoint of the high and low price as the reference trade price
in Equation (2) in the text. Profits combine both long and short positions across all expirations with
holdings on a given day. The 2007-09 Recession is defined using the NBER dating calendar and
represents the period December 2007 to June 2009.
Treasury Note Futures
Table 4

Variables Eurodollars Two Year Five Year Ten Year
Intercept 1.444 1.082 0.597 0.761
0.047 0.048 0.120 0.025
Relative Price Change 80.96 -1.56 1.30 97.65
0.770 0.982 0.974 0.008
Relative Change in VIX -4.572 0.019 0.184 -7.577
0.118 0.975 0.844 0.010
Sample Size 1,330 3,142 2,240 3,036
R-Squared 0.2% 0.1% 0.1% 0.4%
DW-lower 0.585 0.558 0.552 0.533
DW-upper 0.415 0.442 0.448 0.468
Treasury Note Futures
We test for evidence of hedging using the sample of central banks from August 2003 to December
2011. Results are provided for position changes in four futures markets: Eurodollars and Two-,
Five-, and Ten-year treasury note futures. These effects are measured using trade frequency data
defined for each bank individually. That is, on a given day, positions are summed across all
expirations for each central bank. Days are then ordered in sequence and an observation is retained
in the sample if it shows a position change from the previous day. A model is estimated for each
commodity. The dependent variable is the ratio of the change in net long positions (long minus
short) divided by the total of long and short positions. Price changes are measured using close-to-
close prices between the included observation days, the VIX index is computed using options on
futures in each commodity market following the procedures used to compute the CME VIX. The
lower (DW-lower) and upper (DW-upper) Durbin-Watson p-values are shown for an AR(1) model
at the bottom of the table. The p-values for the coefficients are shown in italics below each
coefficient estimate.
Table 5
Central Bank Hedging Behavior

Variables Pre-Crisis Crisis* Post-Crisis Pre-Crisis Crisis Post-Crisis Pre-Crisis Crisis Post-Crisis Pre-Crisis Crisis Post-Crisis
Intercept 2.711 1.242 0.058 1.775 0.104 1.205 0.912 0.379 0.087 0.741 1.967 0.146
0.050 0.404 0.018 0.184 0.044 0.141 0.274 0.368 0.017 0.002 0.247 0.029
Relative Price Change 222.09 33.09 115.37 95.38 92.39 -14.64 -168.38 190.14 7.73 0.69 373.67 49.94
0.716 0.037 0.000 0.816 0.000 0.823 0.167 0.000 0.006 0.983 0.028 0.000
Relative Change in VIX -7.496 0.466 -0.109 -0.776 0.038 0.687 1.329 0.231 -0.047 -4.230 -22.870 -0.641
0.141 0.177 0.317 0.699 0.351 0.535 0.661 0.834 0.468 0.047 0.058 0.315
Sample Size 700 76 553 1,092 938 1,112 1,000 506 734 1,446 570 1,020
R-Squared 0.3% 44.9% 24.1% 0.0% 7.1% 0.0% 0.2% 3.3% 1.1% 0.3% 1.3% 6.2%
DW-lower 0.593 0.726 0.460 0.532 0.774 0.561 0.545 0.394 0.921 0.711 0.492 0.730
DW-upper 0.407 0.274 0.540 0.467 0.226 0.439 0.455 0.606 0.079 0.290 0.508 0.270
Panel A: All Central Banks
Table 6
Central Bank Hedging Behavior Before, During, and After the Financial Crisis
Ten-Yr T-Notes
We test for evidence of hedging using the sample of Central Banks in the futures markets before, during, and after the financial crisis of 2007-09. Panel A shows results for all Central Banks
combined and Panel B shows results for only Euro-related Central Banks. The analysis is divided into three sub-periods: "Pre-Crisis" defined as July 2003 to November 2007; "Crisis"
defined as December 2007 through June 2009, i.e., as the period during which the United States were in a recession as identified by the National Bureau of Economic Research; and "Post-
Crisis" defined as July 2009 to December 2011. Results are provided for position changes in four futures markets: Eurodollars; Two-, Five-, and Ten-year U.S. Treasury Notes. The effects
are measured using trade frequency data defined for each bank individually. That is, on a given day, positions are summed across all expirations for each CB. Days are then ordered in
sequence, and an observation is retained in the sample if it shows a position change from the previous day. A model is estimated for each commodity. The dependent variable is the ratio of
the change in net long positions (long minus short) divided by the total of long and short positions. Price changes are measured using close-to-close prices between the included observation
days. The VIX index is computed using options on futures in each commodity market following the procedures used to compute the CME VIX. The lower (DW-lower) and upper (DW-
upper) Durbin-Watson p-values are shown for an AR(1) model at the bottom of the table. Regressions marked with an asterisk ("*") are estimated after correcting for an AR(1) structure.
The p-values for the coefficients are shown in italics below each coefficient estimate.
Eurodollars Two-Yr T-Notes Five-Yr T-Notes

Variables Pre-Crisis Crisis* Post-Crisis* Pre-Crisis Crisis* Post-Crisis* Pre-Crisis Crisis Post-Crisis* Pre-Crisis Crisis Post-Crisis
Intercept 0.494 -0.016 0.039 0.140 0.071 0.153 1.476 0.051 0.163 0.666 0.253 0.080
0.153 0.718 0.119 0.081 0.182 0.000 0.309 0.158 0.037 0.016 0.160 0.516
Relative Price Change -473.00 45.81 146.04 -241.61 158.81 3.87 -231.05 -5.54 0.13 121.58 11.21 142.01
0.002 0.002 0.000 0.000 0.000 0.264 0.294 0.051 0.984 0.000 0.480 0.000
Relative Change in VIX -2.314 0.300 -0.273 0.133 -0.044 -0.052 2.822 0.039 -0.085 3.007 0.575 -1.152
0.095 0.192 0.039 0.237 0.341 0.420 0.668 0.738 0.568 0.232 0.659 0.250
Sample Size 549 60 437 601 470 668 575 132 261 715 193 431
R-squared 2.3% 15.8% 38.6% 10.5% 28.5% 2.1% 0.2% 2.9% 1.1% 1.9% 0.5% 22.3%
DW-lower 0.530 0.050 0.001 0.780 0.001 0.432 0.547 0.881 0.543 0.647 0.798 0.611
DW-upper 0.470 0.995 0.998 0.221 0.999 0.568 0.453 0.120 0.456 0.353 0.202 0.389
Table 6 (continued)
Central Bank Hedging Behavior Before, During, and After the Financial Crisis
Eurodollars Two-Yr T-Notes Five-Yr T-Notes Ten-Yr T-Notes
Panel B: Euro-related Central Banks

Central Bank
Relative
Price
Change p-value
Relative
Price
Change p-value
Relative
Price
Change p-value
Relative
Price
Change p-value
CB #1 pos 0.501 pos 0.008 pos 0.101
CB #2 pos 0.001 neg 0.921 pos 0.776
CB #3 pos 0.001 neg 0.555 neg 0.521 neg 0.009
CB #4 pos 0.036 neg 0.704 neg 0.580
CB #5 pos 0.103 pos 0.007 neg 0.796 pos 0.013
CB #6 neg 0.060 neg 0.044
CB #7 pos 0.018 pos 0.130
CB #8 neg 0.001 pos 0.361 pos 0.445
CB #9 neg 0.001
CB #10 pos 0.832 neg 0.363 neg 0.001 neg 0.029
CB #11 neg 0.001 neg 0.001 neg 0.166 pos 0.001
CB #12 pos 0.001 pos 0.542 pos 0.597 pos 0.001
CB #13 pos 0.367 pos 0.547
CB #14 pos 0.198 pos 0.248 pos 0.001
CB #15 neg 0.001 neg 0.849 neg 0.442 pos 0.069
CB #16 neg 0.418 neg 0.738
CB #17 neg 0.024 neg 0.131 neg 0.613
CB #18 neg 0.001 pos 0.001 neg 0.046
CB #19 neg 0.260 pos 0.057 neg 0.001 neg 0.967
CB #20 pos 0.378
CB #21 pos 0.501 neg 0.216 pos 0.001 pos 0.102
CB #22 pos 0.903
CB #23 pos 0.001 pos 0.461
CB #24 neg 0.089 pos 0.686 pos 0.767
CB #25 neg 0.363
CB #26 pos 0.093
CB #27 pos 0.775 pos 0.961
CB #28 neg 0.424
Significant @ 5%
R-Squared range
6 / 13 8 / 24 6 / 20 7 / 17
1.4% - 91.5% 0.1% - 92.1% 0.1% - 60.4% 0.3% - 89.9%
Table 7
Individual Central Bank Hedging Decisions
We refine the test for hedging by estimating results for each Central Bank separately. The specification and
estimation approach are the same as Table 5. We report the sign of the price change variable and its p-value. The
dependent variable is the ratio of the change in the net long positions (long minus short) divided by the total of
long and short positions and each regression includes the relative price change variable and the relative change
in price volatility as measured by the VIX. The R-squared range and the count of significant (5% level)
coefficients for each commodity out of all tested banks are shown at the bottom of the table.
Eurodollars 2-Yr Notes 5-Yr Notes 10-Yr Notes

Central Banks Reporting Information to IMF-SDSS, 2000 to 2011
Figure 1. The top line plots the number of foreign Central Banks that voluntarily report
foreign reserves information for monthly publication by the International Monetary
Fund’s (IMF) Special Data Dissemination Standard (SDDS) database. The middle curve
(solid line) displays how many of those Banks that include some information on their
derivatives use. The bottom curve (dashed line) shows that less than a third of the total
report non-zero derivatives positions. (Source: IMF).
0
10
20
30
40
50
60
70
80 Count (FCB voluntarily reporting foreign reserve data to SDDS)
Count (FCB mentioning derivatives positions in IMF's SDDS)
Count (FCB reporting non-zero derivatives mkt values in IMF's SDDS)

Figure 2. The FK measure of synchronization is shown for long- and short-side net trading
decisions using all Central Banks with positions in 2-, 5- and 10-year Treasury Notes and 90-
day Eurodollar futures contracts. The annual calculation begins in 2004 and rolls forward
weekly until the end of 2010. The date axis shows the period ending for each calculation.
Calculations using data during the 2007-09 Recession (Dec. 2007 to June 2009) are then
defined by the period ending December 2008 to June 2010.
20.00%
25.00%
30.00%
35.00%
40.00%
45.00%
50.00%
55.00%
60.00%
Aug-04 Feb-05 Sep-05 Mar-06 Oct-06 Apr-07 Nov-07 Jun-08 Dec-08 Jul-09 Jan-10 Aug-10 Feb-11 Sep-11
Ending Period
Long and Short Synchronization Measure for Central Banks One-Year Sample Rolling Forward Weekly, 2004-2010
FK Long FK Short

Figure 3. The FK measure of synchronization is shown for long- and short-side net trading
decisions using only Euro-related Central Banks with positions in 2-, 5- and 10-year Treasury
Notes and 90-day Eurodollar futures contracts. Because of limitations in Bank participation, the
calculation of the FK measure begins in October 2006 and rolls forward weekly until the end of
2010. The date axis shows the period ending for each calculation. Calculations using data
during the 2007-09 Recession (Dec. 2007 to June 2009) are then defined by the period ending
December 2008 to June 2010.
20.00%
30.00%
40.00%
50.00%
60.00%
70.00%
80.00%
90.00%
100.00%
Jun-07 Oct-07 Feb-08 Jun-08 Sep-08 Jan-09 May-09 Sep-09 Jan-10 May-10 Sep-10 Jan-11 May-11
Ending Period
Synchronization Measures for Euro-Related Banks One-Year Sample Rolling Forward Weekly, 2006:Q4 to 2010
FK Long FK Short

Figure 4. The p-value of the Q statistic is shown for long- and short-side net trading decisions
using all Central Banks with positions in 2-, 5- and 10-year Treasury Notes and 90-day
Eurodollar futures contracts. The date axis shows the period ending for each calculation.
Calculations using data during the 2007-09 Recession (Dec. 2007 to June 2009) are then
defined for the period ending December 2008 to June 2010.
000
000
000
000
000
001
001
001
001
001
001
Aug-04 Feb-05 Sep-05 Mar-06 Oct-06 Apr-07 Nov-07 Jun-08 Dec-08 Jul-09 Jan-10 Aug-10 Feb-11 Sep-11
Ending Period
One-Tail Significance Test for Staggered Trades - All Banks One-Year Sample Rolling Forward Weekly, 2004-2010
Sig - Long Sig - Short

Figure 5. The p-value of the Q statistic is shown for long- and short-side net trading decisions
using Euro-related Banks with positions in 2-, 5- and 10-year Treasury Notes and 90-day
Eurodollar futures contracts. The date axis shows the period ending for each calculation.
Calculations using data during the 2007-09 Recession (Dec. 2007 to June 2009) are then
defined for the period ending December 2008 to June 2010.
000
000
000
000
000
001
001
001
001
001
001
Jun-07 Oct-07 Feb-08 Jun-08 Sep-08 Jan-09 May-09 Sep-09 Jan-10 May-10 Sep-10 Jan-11 May-11
Ending Period
One-Tail Significance for Staggered Trades by Euro Banks One-Year Sample Rolling Forward Weekly, 2006:Q4 to 2010
Sig - Long Sig - Short