Embed Size (px)
Citation preview
CA’ FOSCARI UNIVERSITY OF VENICE
MASTER DEGREE IN BUSINESS ADMINISTRATION
Foreign Direct Investment,
Attractiveness and Competition
among ASEAN Countries
Case studies: Cambodia, Lao, Thailand and Vietnam
Supervisor: Ch.ma Prof.ssa Francesca Zantomio
Graduand: Matteo Griggio
Matriculation number: 860939
Academic Year: 2016 – 2017
1
Index
Introduction .......................................................................................................................... 8
1 Foreign Direct Investment ........................................................................................... 11
1.1 Taxing and Subsidizing FDI .................................................................................. 12
1.1.1 Subsidies and Countervailing Measures ........................................................ 13
1.1.2 Simultaneous Taxes and Subsidies ............................................................... 14
1.2 The Role of FDI Taxation in Affecting Firms’ Decisions ........................................ 15
1.3 FDI Determinants Composition ............................................................................. 18
1.4 Codes and Laws on Foreign Investments ............................................................. 20
1.4.1 National Foreign Investment Policies ............................................................. 21
1.4.2 Approval of Foreign Applications .................................................................... 22
1.5 Supervision of Foreign Investments ...................................................................... 23
1.5.1 Disclosure of Information................................................................................ 24
1.6 Free Zones and Limitations .................................................................................. 25
1.6.1 Effects of FTAs on FDI ................................................................................... 26
1.6.2 Limitations on Foreign Equity ......................................................................... 28
1.7 Foreign Investment Guarantees ........................................................................... 29
1.7.1 Protection of the Subsidiary ........................................................................... 31
1.8 Securities Regulations .......................................................................................... 32
1.8.1 Issuance of Securities .................................................................................... 33
1.8.2 Insider Trading Regulations ........................................................................... 34
1.8.3 Takeover Regulations .................................................................................... 35
1.8.4 Enforcement of Securities Regulations Internationally ................................... 36
1.9 Customs Valuation ................................................................................................ 37
1.9.1 Technical Barriers and Investment Measures ................................................ 38
1.9.2 The Case of Agriculture ................................................................................. 39
1.10 Concluding Remarks ......................................................................................... 40
2
2 The Association of South-East Asia Nations – ASEAN ............................................... 41
2.1 ASEAN Macroeconomics ..................................................................................... 43
2.1.1 Gross Domestic Product ................................................................................ 43
2.1.2 Employment and Labour Participation ........................................................... 46
2.1.3 Interests, Inflation and Exchange Rates ......................................................... 50
2.1.4 ASEAN Trade Balance ................................................................................... 52
2.1.5 Total Trade with Selected Partners ................................................................ 56
2.2 FDI and Economic Growth in ASEAN ................................................................... 57
2.3 Determinants of FDI in ASEAN ............................................................................. 64
2.3.1 FDI Determinants of Service Sector in ASEAN .............................................. 66
2.4 FDI Restrictiveness Index in ASEAN .................................................................... 67
2.4.1 FDI Restrictiveness Index Updates ................................................................ 68
2.4.2 FDI Restrictiveness by Sector ........................................................................ 72
2.4.3 FDI Restrictiveness Index: Manufacturing ...................................................... 73
2.4.4 FDI Restrictiveness Index in Services ............................................................ 74
2.4.5 Importance of Services FDI ............................................................................ 79
2.4.6 Policy Effects and Remarks ........................................................................... 80
2.5 The ACFTA Agreement ........................................................................................ 82
2.5.1 FDI Development in China and ASEAN ......................................................... 84
2.5.2 Impact of ACFTA on FDI ................................................................................ 85
2.6 Taxation in ASEAN ............................................................................................... 87
2.6.1 Indirect Taxation: VAT and GST .................................................................... 88
2.6.2 Personal Income Taxation Rates ................................................................... 94
2.6.3 Withholding Tax ............................................................................................. 95
2.6.4 Corporate Income Taxation ............................................................................ 96
2.6.5 Future Development of Taxation in ASEAN ................................................... 98
2.7 Concluding Remarks ............................................................................................ 98
3
3 Strategies of the Emerging Countries: Cambodia and Lao ....................................... 100
3.1 Cambodia Economic Outlook ............................................................................. 103
3.2 Cambodian Incentives and SEZ ......................................................................... 106
3.2.1 Investment Incentives Granted to a Qualified Investment Project ................ 106
3.2.2 Projects Eligible for Incentives and SEZs ..................................................... 107
3.2.3 Additional Incentives to the SEZ .................................................................. 110
3.3 Lao Economic Outlook ........................................................................................ 111
3.3.1 The Trade and Investment Regime .............................................................. 114
3.3.2 Protection Policy .......................................................................................... 115
3.4 Lao Incentives and SEZs .................................................................................... 115
3.4.1 Investment Promotion Incentives ................................................................. 116
3.4.2 Further Promotion and Non-Tax Incentives.................................................. 117
3.5 The Importance of the Agricultural Sector in CLMV Countries ........................... 118
3.6 Agriculture in Cambodian Economy .................................................................... 120
3.6.1 Weak Information Systems in the Agriculture Sector ................................... 120
3.6.2 Limited Support and Ineffective Legal Framework ....................................... 121
3.6.3 Lack of Agri-business Financing and Insurance ........................................... 122
3.7 Agriculture in Lao Economy ................................................................................ 123
3.7.1 Economic Reform Pattern and Market Connections .................................... 124
3.8 Economic Corridors in the Greater Mekong Sub-Region .................................... 125
3.8.1 National Strategies ....................................................................................... 129
3.9 Automobile Industry in CLMV Countries ............................................................. 130
3.9.1 Current Situation of Auto-Parts Industry ....................................................... 132
3.10 Concluding Remarks ....................................................................................... 133
4 ASEAN hierarchies: Thailand and Vietnam Competitiveness ................................... 137
4.1 Vietnam Economic Outlook ................................................................................ 139
4.2 Statistics on Vietnamese Development .............................................................. 140
4
4.2.1 GDP at Current Prices ................................................................................. 140
4.2.2 Main Industrial Products and FDI Projects ................................................... 141
4.2.3 Investment at Current Prices and by Economic Activity ............................... 143
4.2.4 Vietnamese FDI Record FDI in 2015 ........................................................... 146
4.2.5 Manufacturing sector .................................................................................... 147
4.3 Vietnamese Incentives ........................................................................................ 147
4.3.1 CIT Incentives .............................................................................................. 149
4.3.2 Incentives on Import Taxes .......................................................................... 150
4.3.3 Incentives on Land Rental ............................................................................ 150
4.4 Vietnamese Labour Force Development ............................................................ 151
4.5 Thailand Economic Outlook ................................................................................ 153
4.5.1 Thai Outward FDI ......................................................................................... 154
4.6 Thai Incentives for Qualified Investments ........................................................... 159
4.6.1 Human Capital and Training ......................................................................... 160
4.6.2 Tax Incentives for R&D ................................................................................ 160
4.6.3 Financial Assistance .................................................................................... 162
4.6.4 Special Economic Zones .............................................................................. 165
4.7 Concluding Remarks .......................................................................................... 168
Conclusions ..................................................................................................................... 170
Bibliography ..................................................................................................................... 173
5
Tables Index
Table 1. Population and GDP in 2015 ............................................................................... 44
Table 2. GDP Growth rate in ASEAN (2010-2015) ............................................................ 46
Table 3. Labour Force Participation ................................................................................... 48
Table 4. Employment by Sector ......................................................................................... 49
Table 5. Lending Rates ...................................................................................................... 50
Table 6. Inflation Rate, End-of-Period ................................................................................ 51
Table 7. Exchange Rate, Average of Period ...................................................................... 52
Table 8. Trade Balance with Selected Partners ................................................................. 54
Table 9. Trade Balance by ASEAN Members .................................................................... 55
Table 10. Trade Balance by ASEAN Members .................................................................. 56
Table 11. Total Trade with Selected Partners by ASEAN Members in 2015 ..................... 57
Table 12. Economic Growth Rate (1996-2004) .................................................................. 58
Table 13. Per Capita GDP at Current Market Prices (1996-2003) ..................................... 59
Table 14. FDI Approval in Million US$ (1996-2003) ........................................................... 60
Table 15. FDI Inflows ......................................................................................................... 61
Table 16. FDI Inflows by Host Countries............................................................................ 63
Table 17. FDI Inflows by Origin Countries ......................................................................... 64
Table 18. ACFTA Preferential Tariff Rates ........................................................................ 83
Table 19. Indirect Taxation Across ASEAN ....................................................................... 89
Table 20. Corporate Income Taxation in ASEAN (2012-16) .............................................. 97
Table 21. Structural Change of Economic Growth ........................................................... 105
Table 22. Duty Free Commodities ................................................................................... 107
Table 23. Minimum Conditions ........................................................................................ 108
Table 24. Incentives in the SEZs ..................................................................................... 109
Table 25. Growth in Percent of Lao’s GPD and Sectors .................................................. 111
Table 26. FDI and DDI by Sector in 2015 ........................................................................ 112
Table 27. FDI and DDI by Country in 2015 ...................................................................... 113
Table 28. Lao’s Export from 1995 to 2012 ....................................................................... 114
Table 29. Incentive on Corporate Income Taxation ......................................................... 117
Table 30. Gross Domestic Product at Current Prices by Economic Sectors .................... 140
Table 31. Most Important Industrial Productions .............................................................. 142
Table 32. Major FDI Projects Licensed in 2015 ............................................................... 143
6
Table 33. Investments by Types of Ownership ................................................................ 144
Table 34. Investments by Types of Ownership - Percentage ........................................... 145
Table 35. Annual Average Capital of Enterprises by Types of Enterprise ....................... 145
Table 36. Incentives on Land Rental ............................................................................... 151
Table 37. Outward FDI in selected ASEAN countries ...................................................... 156
Table 38. Measures under the Office of the Board of Investment .................................... 167
Figures Index
Figure 1. GDP per Capita in 2015 (in US$) ........................................................................ 45
Figure 2. Nominal GDP from 2010 to 2015 (in US$ million) ............................................... 45
Figure 3. Percentage of Unemployment (2012-2015) ........................................................ 47
Figure 4. ASEAN Trade Balance (US$ million) .................................................................. 53
Figure 5. FDI Inflows (in US$ million)................................................................................. 62
Figure 6. Changes in FDI Restrictiveness Index: Overall and AFTA ................................. 68
Figure 7. Overall FDI Restrictiveness Index (Including Services and Manufacturing):
Horizontal Commitments, AFTA + Actual, and AFTA. ....................................................... 69
Figure 8. Change in FDI Restrictiveness Index for Overall by Different Categories ........... 70
Figure 9. Changes in FDI Restrictiveness Index for ASEAN by Sector ............................. 71
Figure 10. Changes in FDI Restrictiveness Index for ASEAN by Sector .......................... 71
Figure 11. FDI Restrictiveness Index - Overall .................................................................. 72
Figure 12. FDI Restrictiveness Index - Overall .................................................................. 73
Figure 13. FDI Restrictiveness Index for Manufacturing (AFTA and AFTA + Actual) ......... 74
Figure 14. FDI Restrictiveness Index for ASEAN - AFAS .................................................. 75
Figure 15. FDI Restrictiveness Index by Categories for ASEAN - AFAS ........................... 76
Figure 16. FDI Restrictiveness Index by Sector for ASEAN - AFAS .................................. 77
Figure 17. FDI Restrictiveness Index by Sector for ASEAN - AFAS .................................. 77
Figure 18. FDI Restrictiveness Index for Services (AFAS and AFAS + Actual) ................. 78
Figure 19. Withholding tax rates in ASEAN ....................................................................... 96
Figure 20. Corporate Income Taxation in ASEAN (2012-16) ............................................. 97
Figure 21. FDI in Lao PDR and Cambodia ...................................................................... 101
Figure 22. FDI in Lao PDR, Cambodia and Thailand ....................................................... 101
Figure 23. FDI in Lao PDR, Cambodia and Vietnam ....................................................... 102
Figure 25. Map of Laotian SEZs ...................................................................................... 116
7
Figure 26. Economic Corridors in ASEAN ....................................................................... 126
Figure 27. FDI in Thailand ............................................................................................... 137
Figure 28. FDI in Vietnam ................................................................................................ 138
Figure 29. FDI in Thailand and Vietnam .......................................................................... 138
Figure 30. Employment in Agriculture and Non-Agricultural Sector ................................. 152
Figure 31. Thailand Outward FDI per Billion US$ (1994 – 2012) ..................................... 155
Figure 32. Map of Thai SEZs ........................................................................................... 166
8
Introduction
The foundation of Association of Southeast Asian Nations (ASEAN), in 1967, enhanced
the economic development and cooperation within the region, reaching in 2015 the
creation of ASEAN Economic Community, that represents a market of 2.6 trillion US$ and
over 600 million people. Since its creation, ASEAN economy was fostered by a continuous
increase in Foreign Direct Investment inflows. In 1972, inflows of foreign direct investment
reached 539 million US$, and a decade later, an increase of 500% was recorded.
The FDI kept on increasing, until the Asian financial crisis of 1998, which caused an
important drop of the 23%. Only important American investments counterbalanced the
negative effect and allowed FDI inflows to reach their maximum peak in 2003, with 20.2
billion US$. In 2008 the crisis hit ASEAN as well, because of its high level of dependence
with the worldwide financial markets. This event helped to re-shape hierarchies within the
community, with investors looking for costs minimization and governments trying to attract
inflows from neighbouring industries.
FDI attractiveness in ASEAN has boosted up a lot, thanks to the Free Trade Agreements
(FTAs) of the last twenty years. The first major FTA for Southeast Asian countries was the
ASEAN Free Trade Area (AFTA) in 1992, then a series of bilateral and regional FTAs have
been implemented. The principal ASEAN + 1 FTA so far has been the ASEAN-China Free
Trade Agreement, which gave birth to the third economic group worldwide, after NAFTA
and European Union.
In this thesis, we will start presenting Foreign Direct Investment and looking at ASEAN
macroeconomic situations, in the first and second chapter respectively. Since FDI flows
involve parties from different countries all over the world, they are ruled by the international
business law, which takes care of all the aspects related to foreign investments, from
securities to customs regulation. Looking at macroeconomics we can have a first hint of
the different economic situations and trends affecting South-East Asia. Particular attention
will be paid to different taxations and degrees of openness towards FDI, which represent
crucial aspects for multinationals’ strategies.
Then, we are going to analyse the endeavours carried on by the members of the ASEAN
community to attract and maximize FDI from all over the world, shaping the economic
geography of the region, characterized by different levels of wealth, development,
technology and labour force productivity. In particular, we will see how countries compete
among themselves in order to attract investors, designing incentive strategies.
9
Within ASEAN bloc, the differential among countries’ development and FDI attractiveness
is way much higher than what we can find within other economic communities, like
European Union. While Vietnam and Thailand are competing for enhancing the
manufacture of products with a certain technologic content, from automotive to bio-
technology, other countries such as Cambodia and Lao are still focused on developing
agriculture, tourism and building adequate infrastructures like roads, railways and airports.
Many differences are due to a diversity of factors such as the geographical position,
natural resources and recent political history.
In such an environment, ASEAN organisms must act like a supervisor. They must assure a
certain degree of competition among the players, but at the same time they cannot allow
members’ policies to damage neighbouring countries, like it is happening with the
exploitation of natural resources. In order to maximize its resources, on the inside, ASEAN
has to enhance connections and collaborations among nations, while towards the external,
it must act like a united entity and try to gain importance at a worldwide level.
From the point of view of businesses, ASEAN represents a very interesting target because
of its big internal market, the important agreements with neighbouring partners, and
outstanding growth rates, which cannot be found easily in other economic areas. Anyway,
tackling this market with important investments is very challenging and demanding
because of the wide differences among nations. While Singapore is an important financial
hub, thanks to its favourable taxation and treatments, some nations like Lao and
Cambodia are still linked to their communist political structures and struggle to come out
from poverty.
Anyway, macroeconomic differences are not the only aspect to be taken into account. Tax
rates and degrees of FDI openness are very different among nations, and even between
countries with similar levels of GDP or inward FDI, diversities are remarkable because of
the dynamicity and changes in hierarchies and national investment policies. For example,
as we will analyse in the third chapter, Lao and Cambodia are similar in their structures,
with agriculture representing the most important economic sector, anyway Lao’s reforms
allowed agricultural productions to be certified and reach international dealers, while
Cambodian regulations are barely enforced and fields still suffer from mines and chemicals
used during the continuous wars of the last century.
Even if Thailand is losing a part of manufacturing FDI, which is nowadays directed to
Vietnam, in the last chapter we will see that important investments and incentives have
been provided to the improvement of productivity through a higher content of technology

10
and scientific research. At the same time, Vietnam is still mainly focused on
manufacturing. In such a lively environment, businesses must go beyond what is stated by
figures and declarations of governmental agencies, they have to pay attention to the real
situations and what are the prospective scenarios in the medium term, in order to not
waste important resources.
11
1 Foreign Direct Investment
The Foreign Direct Investment (FDI) represents a combination of vital resources for
developing the economic path of a nation, especially the emerging ones. This mainly
occurs through the entrance of multinational enterprises (MNEs) that exert several
spillovers effects on the host countries. The principal form of spillover is represented by
the transfer of technology which enhances the productivity of capital stock and labour
force, global market access, technological growth and transfer of managerial skills. In the
last decades, this has become particularly important because of the development of
MNEs’ activity in the form of FDI, which has increased faster than any other global
transaction. In section 1.1 we will see how governments’ policies are affected by foreign
investments and, in sections 1.2 and 1.3, what are those factors determining investment
choices.
Foreign investments involve ownership by one “entity” (an individual, a business
organization, a partnership, or a governmental entity) of, at least, ten percent of the
controlling interest in a business which is not located in the entity’s home nation. At the
beginning of the 20th century, foreign investments were mainly involved in agricultural and
extractive industries, which produced primary commodities. Then, in the late 70s, the
political movements and post-independence period brought many countries to diversify
and reorganise the investments from agricultural sector to the manufacturing one; while, in
the late ‘80s, foreign investment was directed to service and non-manufacturing sector.
The development of FDI flows was boosted decisively by the establishment of World Trade
Organization (WTO) in 1995 and the implementation of General Agreement in Trade in
Services (GATS) (Kaliappan, Khamis and Ismail 2015).
As we have already said, FDI inflows comprehend interactions between parties from
different nations, so the international business law has to take care of all the aspects
concerning flows of investments passing through foreign countries. At first, investments
have to follow specific procedures and characteristics stated by international standards,
and after they must cope with the regulations of the national recipients (this will be
analysed in sections 1.4 and 1.5). The investors must demonstrate that the proposed
investment suites the guidelines of the law and the investment philosophy of the hosting
country. These regulations aim to enhance technical progress and local output, fostering
natives’ involvement and limiting the rivalry in sectors sufficiently attended by locals.
12
To do this, governments levy taxes on the gains of foreign investors, but at the same time
they provide subsidies or incentives in order to attract new investments in determined
economic sectors or geographical areas, throughout trade agreements with commercial
partners or Special Economic Zones (section 1.6). All these activities have to fit the legal
framework provided by the international business law, which sets the minimum guarantees
that hosting states have to observe with respect to the investors, and what are the rules
that these last ones have to follow (section 1.7).
Particular attention is paid on securities and customs (sections 1.8 and 1.9), which
represent the principal instruments that investors have at their disposal to move resources
and goods into foreign markets. Such a complex legal environment needs to be known
very well by companies that want to expand their activities towards new markets. In fact,
important efforts could be required just to cope with the legal feasibility of the projects in
those countries that are characterised by articulated bureaucracies.
1.1 Taxing and Subsidizing FDI
The majority of countries imposes taxes on the income of foreign investors, but at the
same time they provide subsidies and tax incentives that are designed to attract new
investments. Anyway, maximizing the resources that governments can get from FDI is
very difficult, because it requires to find the right trade-off between exploiting and attracting
new foreign investments. The measure of the subsidies and incentives to foster individual
businesses can be relevant in practice and some firms effectively receive a net subsidy
rather than merely paying reduced taxes, so the government often loses net revenues.
Such policies are thus commonly motivated because the benefit to domestic workers
generated by attracting new investors can overcome the fiscal cost for the government
(Sharma 2016).
The state is incentivised to tax firms that are inframarginal in their decision to locate in the
country because the tax burden will then fall on the profits of these firms. It also has an
incentive to subsidize foreign firms that are close to the margin in their location decision
because these subsidies increase domestic wages at a relatively low fiscal cost. A
government can use a uniform tax across firms combined with targeted subsidies to
ensure a net tax on inframarginal firms and a net subsidy on marginal ones.
13
The marginal subsidy generates benefits because of two main motivations. First, a
sufficiently small subsidy targeted towards marginal firms has a negligible fiscal cost. This
is ultimately the case, as such a subsidy is constructed to not provide windfall gains to
inframarginal firms. Second, the subsidy increases the domestic wage by attracting more
firms to the hosting nation. These two points together imply that the benefit to domestic
workers exceeds the fiscal cost of the subsidy, leading to an overall enhancement of the
state's welfare. (Sharma 2016).
Since the wage in the hosting nation is tied to the price of its domestic goods through a
free entry condition for domestic firms, an appreciation in the relative price of the domestic
goods allows the rise in labour demand to translate into an increase in the real wage. This
means that even a smaller nation can affect its terms-of-trade because the goods
produced in other countries are differentiated.
These taxes and subsidies are optimal for the host country but they introduce inefficiencies
from the standpoint of the world as a whole. Consequently, policy coordination in this
setting could simultaneously lead to reductions in taxes and subsidies. This is consistent
with some contradictory aspects of international tax coordination. Specifically, while
countries and sub-national jurisdictions often discuss potential attempts to reduce harmful
tax competition, bilateral tax agreements involve reductions in the withholding taxes
imposed on foreigners (Sharma 2016).
1.1.1 Subsidies and Countervailing Measures
A subsidy is a financial contribution made by a public body, that confers a benefit on an
enterprise, a group of enterprises, or an industry. When improperly used by a government
to promote its export trade to the detriment of another state, subsidies are forbidden by
General Agreement on Tariffs and Trade 1994 (GATT 1994).1 If subsidies have an
unreasonable impact on another country’s internal market, that country can impose
countervailing duties to offset their impact, but only if it follows certain conditions to ensure
that its reaction is justified, appropriate and not excessive (August, Mayer and Bixby
2013).
The SCM Agreement, Agreement on Subsidies and Countervailing Measures, states that
its disciplines apply only to those subsidies that target a specific enterprise or industry,
1 At first, General Agreement on Tariffs and Trade was signed by 23 states in 1947, in Geneva. It remained in effect until 1994, when 123 countries signed the Uruguay Round Agreements, that brought to the World Trade Organization one year later.
14
specific groups of enterprises or industries, or enterprises in a particular region. The
disciplines do not apply to non-specific subsidies and agricultural subsidies. Specific
subsidies are divided into two categories: prohibited subsidies (informally referred to as
red subsidies), and actionable (yellow) subsidies (August, Mayer and Bixby 2013).
Prohibited subsidies (red subsidies) are subsidies that either depend on a firm’s or
industry’s success in exporting its products or are contingent upon the use of
domestic instead of imported goods (e.g., subsidies based on so-called domestic
content rules). Red subsidies are presumed to be trade distorting, and WTO
member states are forbidden to grant or maintain them.
Actionable subsidies (yellow subsidies) are subsidies that may or may not be trade
distorting, depending on how they are applied. They are defined as specific
subsidies that injure a domestic industry of a different member nation, nullify or
impair benefits due to a diverse participant nation under GATT 1994, or cause or
threaten to cause “serious prejudice” to the interests of a different member. WTO
member states are discouraged, but not forbidden, from using actionable subsidies.
1.1.2 Simultaneous Taxes and Subsidies
Sharma’s study (2016) has shown that a tax on inframarginal firms and a subsidy to
marginal firms each improves welfare separately. To establish the optimality of the
subsidy, the analysis needs to take into account how the subsidy will affect tax revenue. In
particular, by increasing wages, the subsidy will reduce the profits of foreign firms and
thereby reduce tax revenues. A sufficiently small subsidy will improve welfare in the
presence of inframarginal taxes despite this fiscal externality. It is thus optimal for the host
country to simultaneously tax inframarginal firms and subsidize marginal ones. This is why,
usually, national policies lead to a net subsidy on targeted firms combined with a net tax
on untargeted firms.
Sharma (2016) also came to the conclusion that a tax on inframarginal firms raises
revenue at the expense of these firms' profits, while a subsidy on marginal firms can
increase domestic welfare by attracting foreign firms at a relatively low fiscal cost. So the
optimality of the subsidy provides a formalization of the common notion that the economic
15
activity generated in a jurisdiction by attracting mobile firms can have benefits to domestic
workers that exceed the fiscal cost to the government.
These strategies develop national welfare at the expense of those other countries which
lose the investments, and so are not the optimum looking at the entire world. Therefore,
here we understand why bilateral treaties entail reductions on taxes on foreign investors,
while policymakers are worried regarding the damages caused by the competition of
subsidies and tax incentives. In fact, consistently with these results, the European Union,
have eliminated certain withholding taxes on dividends and royalties within the region,
while, at the same time, setting up a State aid regime that curbs the use of preferential
subsidies.
1.2 The Role of FDI Taxation in Affecting Firms’ Decisions
After seeing how governments deal with subsidies and FDI taxation, let us switch to the
business perspective. Decisions by multinationals to undertake FDI are usually complex
since they involve strategic decisions, that are relevantly influenced by the taxation and
incentives of foreign countries. Dunning (1981, cited in de Mooij and Ederveen 2003)
states that for MNEs trying to maximize their value, FDI brings benefits if the so-called OLI
(Ownership, Location and Internalisation) conditions are met.
At first, there must be an advantage for the MNE related to ownership by local firms. This
could deal with tax issues, but also with specific technological or organisational knowledge
of the multinational. Secondly, producing abroad must be attractive for some comparative
locational advantage, if not, it would be more remunerative to export, rather than to invest.
Finally, it should be attractive to undertake activities within the firm, rather than getting
them from foreign companies. Furthermore, there is a close link between all three
conditions. For example, the ownership advantage (O) of a financial blueprint to avoid
corporate income tax is strongly linked with its internalisation (I) by the firm. In addition, the
host country location advantage (L) of a tax haven, can plausibly be transformed into an
ownership advantage (O) (Jones and Temouri 2016).
Taxes can affect all three OLI conditions. For example, they can affect the tax treatment of
a foreign firm, related to domestically owned firms. They can also determine the
attractiveness of a location for undertaking investments. Anyway, tax rates are only one of
many potential locational factors. Other factors include good infrastructures, size of the
16
markets, quality of labour force and the network advantages due the proximity to other
businesses (Jones and Temouri 2016).
The return to Foreign Direct Investment might be subject to double taxation. A foreign
subsidiary is always subject to Corporate Income Taxation in the hosting state and its
returns can be burdened once more under the CIT ruling the parent’s home country. Given
that the international double taxation discourages FDI, the majority of countries tries to
evade it through bilateral taxation treaties, modelled on the OECD (Organisation for
Economic Co-operation and Development) Model Tax Convention. In the European Union,
the Parent-Subsidiary Directive certifies that states can either assume an exemption or a
credit system to side-step double taxation inside the Union. The US and Japan chose the
credit scheme, while the majority of EU countries adopts the tax exemption system.
Under the exemption system (or territorial taxation), the foreign income which is taxed
within the host state, is exempted from taxes in the parent’s home state. Therefore,
revenues are subject to taxation only where the subsidiary is set. For example, a Dutch
enterprise which invests in a German subsidiary is subject to the German corporate
income tax alone. In this way, dividends in favour of the Dutch parent are not taxed in the
Netherlands. States adopting the exemption system differ regarding their application of
these exemptions. In some nations, firms can be exempted from taxation only if they
control a certain amount of capital share and when a minimum of foreign corporate income
tax is paid (de Mooij & Ederveen 2003).
In a credit system (worldwide taxation), tax liabilities in the host state of the subsidiary are
credited against taxes in the parent’s home state. Countries usually pose limits to foreign
taxation credits which can be claimed by enterprises. If foreign taxation exceeds tax
liabilities in the home state of the parent firm, there is an excess of foreign tax credit. In
such a situation, firms are usually allowed to ask for the same tax credit of the domestic
tax rate, so it turns to be exempt from taxation. In the case that the tax rate in the home
country of the parent overdoes the foreign tax payment, there is a deficit tax credit. Even
tax credit nations are different about the application of tax credits: for example, in the case
of an excess foreign credit, this can be compensated by deficit tax credits elsewhere or
whether compensation is allowed, by shifting in time the deficit of foreign credit (de Mooij
and Ederveen 2003).
States adopting foreign tax credits, usually allow the deferral of the taxation. In detail,
revenues coming from foreign associates, reinvested into the firm, are deferred till they are
repatriated through the payment of dividends. The fact that the parent company is subject
17
to CIT just on the moment of the repatriation, makes the effect of home country taxes less
relevant for investors who come from tax credit countries. Under credit systems, home and
host country taxations apply different incentives for FDI with respect to the exemption
systems. In fact, exempted investors are taxed only by host country rates, therefore, home
taxes do not influence FDI. On the contrary, credit investors will be subject to a worldwide
tax basis in the home country so, in this case, home country tax rates are significant.
The influence of the home-country tax rates depends on which way FDIs are financed, i.e.
transfers or retained earnings, and if there is an excess foreign tax credit. If the parent firm
is set in a nation which uses the exemption system, higher taxes discourage to invest in
that host country because of a lower net ROI. This is valid for that FDI which is financed
through equity transfers or retained earnings but not for debt-financed investments
because interests are usually deductible from the revenues of the company. Regarding
mergers and acquisitions, higher tax rates in the host nation are less relevant because
they affect domestic and foreign owners in the same way (de Mooij and Ederveen 2003).
If the parent is set in a nation which adopts the credit system, combined with tax deferral, a
higher tax rate in the host country implies a subtler effect on foreign investments. In detail,
whether MNEs find themselves in a position of credit excess, higher taxes in the host
nation are not counterbalanced by a higher domestic credit. Thereafter, the effects on FDI
in plant and equipment would result to be equal to the case of the exemption system.
By the way, if the MNEs are not in an excess credit position, a more elevated foreign tax
rate is remunerated by inferior tax liabilities on the parent company, therefore, higher taxes
in the host state would not have relevant effects on FDI. In case of M&As, the effect on
foreign ownership might also be positive, because foreign owners are protected from the
higher host country tax rates by the credit system (in contrast to local owners) and so,
locals could consider remunerative to trade their shares to foreign MNEs.
To summarize, a higher tax rate in the host country is likely to reduce FDI from exemption
countries. For investors from tax credit countries, anyway, higher taxes in a host country
can have ambiguous effects. On the one hand, it may reduce real investment to the extent
that parents are in an excess credit position. On the other hand, it can foster foreign
ownership of capital in the host country (de Mooij and Ederveen 2003).
18
1.3 FDI Determinants Composition
As we have just seen, taxation is one of the main determinants in MNEs strategies
undertaking FDI, but there are other factors making markets more or less FDI attractive.
There are different schemes that try to clarify what are the determinants affecting FDI.
Among the other characteristics we can find exchange rate effects, institutions, trade
protection and trade effect.
Exchange Rate Effects
The effects of exchange rates on FDI have been examined both from the volatility of
exchange ratios and from the changes in the bilateral levels. Before the study of Froot
and Stein in 1991 (cited in Blonigen, 2005), the common thought was that the probable
variations affecting the exchange rates would not modify firm’s decision to invest
abroad. In short, while the appreciation of a firm’s home nation’s coinage would
decrease the price of foreign resources, the projected nominal return would have
lowered at the same way for the homebased currency, without affecting the return rate.
In their study, the aforementioned authors set a currency appreciation in an imperfect
capital market, where it might increase foreign investment by a firm. Acting within
imperfect markets of capitals determines a decrease of internal capital costs with
respect to resources from the outside. So, a currency appreciation leads to an
increased business capital and gives the company cheaper resources than foreign
competitors, dealing with the devaluation.
Institutions and Political Environment
The institutional environment is a crucial factor for MNEs’ investment strategies. High
levels of corruption and insufficient legal guarantees represent a threat for business
activities in many developing countries like those in ASEAN. The fact is that an
eventual quantitative esteem of the institutional or political effects on foreign
investments is very difficult to obtain because of the illegal and sunk nature of the issue
itself, so there are not effective measurements (Blonigen 2005).
The topic of political instability is particularly relevant in Asia. If we think about the
cases of North Korea and the Islamic State, threats and limitations are evident. Even if
ASEAN community is living a period of peace and solidity, Myanmar is still recovering
from the recent years of the military regime and internal fights are still ongoing. In
19
Cambodia there are still problems of land distribution, since in the 70s the dictator Pol
Pot, leader of Khmer Rouge, abolished private property and wars continued until the
90s.
Trade Protection
The hypothesized link between FDI and trade protection is seen as fairly clear, with
higher trade protection that increases the convenience for firms to implement local
production through branches or subsidiaries rather than facing high trade costs of
exports. This kind of FDI is usually called tariff-jumping. Even in this case, it is hard to
give a quantitative measure of non-tariff forms of protection across industrial sectors
(Blonigen 2005). We will see that ASEAN itself, which stipulated numerous trade
agreements with other nations or communities, is used by foreign companies to enter
neighbouring market like China.
Trade Effects
Trade effects of foreign investments are closely embedded with the drivers of the
investment behaviour. Usually, the main reason behind FDI is the plan of substitution
for exports. In fact, they may imply higher trade barriers and relevant transference
expenses. Serving that geographical area through sales from foreign direct
investments consents to decrease such variable expenses, even if it could lead to
higher fixed costs. This is why firms implement this strategy only when the foreign
market’s demand for the MNE’s goods reaches a sufficient dimension (Blonigen 2005).
Moreover, even Dunning and Lundan (2008) described four further kinds of foreign direct
investment, depending on different determinants:
Market-seeking FDI. These kind of investments are put in action by companies that
try to provide their products to a determined area through local and regional
markets. They might be undertaken to defend or foster already existing markets, or
to tackle new ones. Market size of the host economy, barriers to the local markets,
and tariffs and transport costs also encourage this type of FDI.
Resource-seeking FDI. We can count three principal kinds of resource seekers. At
first, we can find those investments directed to find physical resources, like
20
minerals, metals, and so on. The second group comprehends MNEs looking for
cheap (unskilled or semi-skilled) labour force. The third kind of resource-seeking
investments is driven by the need for technological capability, management or
marketing expertise and organisational skills.
Efficiency-seeking FDI. This type of investment can differ in two ways. In one case,
the foreign investment aims at the exploitation of diverse degrees of accessibility
and costs of inputs in different nations. In the other case, the investment is directed
to nations with similar income levels and economic structures, with respect to the
country of origin, but it is conceived to exploit possible economies of scope and
scale, different capabilities of supply or differences in the tastes of the public.
Strategic asset-seeking FDI. These investments usually derive from the acquisition
of the resources of firms already present in targeted foreign markets. They are
usually aimed at the realisation of strategic objectives, that can bring to a
sustainable or advanced global competitiveness of the investor.
1.4 Codes and Laws on Foreign Investments
After seeing the economic reasons that stand behind Foreign Direct Investment, both by
the side of governments and companies, let us give a look to the regulatory framework.
Analysing the laws ruling investments worldwide is crucial because they deal with all the
problems arising from international exchanges and they are relevant because they set
constraints and guarantees for MNEs’ activities abroad, shaping their whole strategies.
The guidelines ruling foreign investments are usually stated in investment laws. In
socialist-oriented states, like many in South-East Asia, which permit foreign investment
only in the form of joint venture, the regulations are usually called joint venture laws. As
instance, Vietnam allowed only joint ventures, but since foreign investments are one of the
most important resources that a state can ask for, in 1987, new laws were released in
order to reduce taxes and encourage joint ventures to maximize the benefit for the country.
The new code also allowed full profit repatriation after taxation and it started protecting
foreign firms against government expropriation (August, Mayer and Bixby 2013).
21
Some nations do not have general regulations on investments but they put limitations on
investment in specific economic areas, such as media, in order to control them better.
Other countries have a composite set of rules controlling investment, governing technology
transfers, providing incentives and limiting foreign exchange such that the combination of
these laws functions as a kind of investment code. Frequently, these provisions are
combined into Bilateral Investment Treaties (BITs).
BITs outline foreign investment and the circumstances under which investors from one
country can invest in another one. The majority of BITs assures certain guarantees for
investments from one Contracting State in the area of the other. They usually include
agreements of equitable and fair treatment, provisions for repatriation of profits to the
home country and protection from expropriation. They even guarantee fund transfers, the
recouping of capital gains and providing for dispute settlement procedures too (August,
Mayer and Bixby 2013).
1.4.1 National Foreign Investment Policies
The regulations on foreign investments are different depending on the state, but the
purposes are the same worldwide. These include promoting local productivity and
technological development, encouraging local participation and minimizing foreign
competition in economic areas already served by local businesses. To achieve their
purpose, investment laws are meant to screen and regulate foreign investment
applications. These generally fall into three categories. The first is to encourage
investments through incentives and minimal regulations. The second is to use investment
incentives but also to require local participation quotas. The third is to allow foreign
investment subjects to local screening and supervision (August, Mayer and Bixby 2013).
Usually, foreign investors have to register and file their proposal with a central agency, set
up specifically to facilitate foreign investments. The central agency may conduct the
screening, or it may coordinate the process with other governmental units. In the
Philippines and South Korea, the central agency has a multidisciplinary staff that is
organised to assess most proposals independently.
The criteria for determining what proposals need to be screened vary significantly. A few
states may subject all foreign investment, or limit the controls over those whose projected
investment exceeds a certain amount of capital. The Board of Investment of Philippines,
as instance, screens all new investments and all expansions or additional investments in
22
existing firms that have foreign ownership of more than 40%. Certain kinds of foreign
investment proposals, such as investments in natural resource-based industries, require
the approval of specialized agencies, that formulate special criteria tailored to the
industries involved (August, Mayer and Bixby 2013; Luedde-Neurath 1984).
A foreign investment proposal is judged, in general, on its congruence with a country’s
national development objectives. In order to do that, foreign investors are required to
supply screening agencies with quite detailed information about their proposal. The
information typically includes financial and marketing plans, an employment scheme, the
extent of local inputs usage, the composition of the management and the relative
percentages of foreign and local control.
The investment application shall prove to the authority that the project fits the rules of the
investments law and it is compatible with the philosophy of the hosting country. Although
compliance with the statutory provisions is reasonably straightforward, conforming to the
regulatory philosophy can be difficult, because the regulatory authority is often secretive
and can and may not be sympathetic to foreign investors (August, Mayer and Bixby 2013).
1.4.2 Approval of Foreign Applications
After the screening, the host country shall approve or reject a foreign investor’s proposal. If
the proposal did not ask for the host to grant determined incentives and if the host state
does not claim any concession from the investor, the approval shall be communicated
from the competent agency. While, if the host state grants an incentive or the investor
agrees to some concession, the arrangement will be set out in a formal investment
agreement. Typically, the agreement will be governed by the host state’s contract laws and
possible disputes will be debated in that country’s courts, unless the parties have agreed
in a different way (August, Mayer and Bixby 2013; Thangavelu 2015).
International investors trying to set up a business activity might be restricted in the types of
investment forms they are permitted to choose. Most countries commonly wish foreigners
to limit themselves to businesses which have a local participation and disclose their
activities. Local participation can consist in forms of joint venture, that can be organized as
a partnership, a limited liability company, or a publicly traded stock corporation. Saudi
authorities, as instance, allow local branches without any Saudi participation, but the
company is not eligible for any incentive, but they are reserved to companies that have at
least 25% of Saudi ownership (August, Mayer and Bixby 2013).
23
Finally, some countries do not encourage companies to disclose their financial or other
activities. These are the so called tax havens, which try to collect foreign investment and
generally impose no disclosure requirements. By mandating secrecy, these countries,
such as the Bahamas, Bermuda and the Cayman Islands, pose a problem for many
industrialized democracies and the rule of law.
1.5 Supervision of Foreign Investments
After the first steps that are necessary to see if the foreign investor’s application copes
with the national regulation, further requirements have to be observed. For example, many
states ask investors to provide periodic reports during the start-up period, describing their
progress in importing capital, constructing facilities, hiring personnel and beginning
production. As instance, in Indonesia, during the construction and trial production period,
investors have to submit monthly reports to the Bank of Indonesia, so it can keep track the
amount of foreign currency brought into the country, and semi-annual reports to the
Investment Coordinating Board and this allows the board to supervise the operational
progress of the project (August, Mayer and Bixby 2013).
Once a foreign-owned enterprise is in full operation, it becomes subject to periodic
monitoring. This may involve the submission of information on various aspects of the
business activities and regular inspections to prove that it is in compliance with the local
regulation. If a central agency is responsible for supervising foreign investments, it will
conduct the inspections, otherwise, a variety of specialized agencies may be involved.
Investment regulations usually states that changes in the agreement have to be approved
by the host state. Investment laws and investment agreements usually require the host
state to act in good faith on requests for modification. This is also the rule applied by
courts and tribunals in cases where an investment law or agreement sets no standard.
Any foreign investor, a company or a natural person, is habitually entitled to have the
same right to run a business in the new country like local entities and companies. By the
way, foreigner entrepreneurs cannot take advantage of the fact that they are not present in
the host state, escaping full responsibilities regarding their investments. They are subject
to the same obligations as local entrepreneurs. Moreover, they are subdued to a normative
designed to prevent them from abusing their subsidiaries’ employees or creditors (August,
Mayer and Bixby 2013).
24
1.5.1 Disclosure of Information
All firms, either they are foreign subsidiaries or domestic enterprises, must comply with
different grades of disclosure. The reason companies are required to disclose information
about their organizational structure and their activities is the protection of the public (i.e.,
shareholders and creditors) from fraud and misrepresentation (August, Mayer and Bixby
2013; Healy and Palepu 2001).
There are two basic sets of disclosure rules: disclosure reports which must be made when
a company is first organized and periodic reports in order to update changes in the
organization and activities. In federal states, the constituent states enact the initial
disclosure rules, and the central government enacts the periodic disclosure laws. In unitary
states, both sets of rules are enacted by the national government. In common law
countries, a company’s Memorandum of Association and/or Articles of Incorporation is
filed with a registrar who maintains a copy that can be examined by the public. In civil law
countries, the organizational documents are inserted in the Commercial Register, that is
disclosed to the public.
Publicly traded companies have to provide more extensive information in their annual
reports, while privately held companies are usually required to file only limited information.
This is because the information asymmetry could harm small investors who have no
financial education and could suffer unbearable losses due to a company bankruptcy.
Foreign-owned corporations in some countries, such as Malaysia, are subject to the same
disclosure requirements as domestic companies. While in some others, they are also
subject to special additional reporting requirements (August, Mayer and Bixby 2013; Healy
and Palepu 2001).
Some attempts have been made to harmonize the information collected by different
countries. In 2001, the IASB (International Accounting Standards Board) was provided with
accounting standard-setting responsibilities and it is now responsible for the development
of a unified set of regulation, called International Financial Reporting Standards, IFRS. The
IFAC (International Federation of Accountants) has established international auditing
guidelines. Through its independent standard-setting boards, it develops regulations on
ethics, auditing, assurance, education, and public sector accounting standards (August,
Mayer and Bixby 2013).
25
1.6 Free Zones and Limitations
There are many instruments that local governments can use to attract FDI and as we will
see for ASEAN countries, a lot of nations decide to create ad hoc regulations for specific
geographical zones, in order to enhance their economic development. In fact, multinational
enterprises are often incentivised to invest in foreign economies by establishing their
business activities in the so-called free zones, geographical areas wherein goods may be
imported and exported free from customs tariffs and in which a variety of trade-related
activities may be carried on (from simple storage to manufacturing and retailing). August,
Mayer and Bixby (2013) categorized these zones by their geographical size and by the
kinds of activities that may be carried on within.
Free Zones Categorized by Size
Free zones vary greatly in size, from large multistate regions to small subzones. The
largest ones are called free trade areas (FTAs) and are made up of more states that have
agreed to let some or all of each other’s enterprises carry on their trades across and within
each state’s borders free from duties and other restrictions. For example, NAFTA and the
European Community represent FTAs. A nation may provide for its entire territory to open
up some or all of its economic sectors to international trade and, in the same way, it may
open certain regions.
The oldest type of free zone is the free city (or free port), in which a port city is opened to
international trade. A relatively modern example is Hong Kong, at least until the handover
of Hong Kong by Britain to the PRC. The free trade zone is the modern variant of the free
city. Rather than granting free trade status to an entire city, governments instead
designate smaller areas, usually within or near port cities, as free trade zones. In addition
to FTZs, some states also create special purpose subzones associated with those zones
to accommodate limited purpose trading activities, such as a single manufacturing plant.
Free Zones Categorized by Activities
The variety of activities which are allowed in a free zone includes storage, distribution,
manufacturing, and retailing; however, not all zones permit all of these actions. What is
permitted varies both according to the type of zones and the nation in which these are
located. Typically, the full range of these activities is allowed in a free trade zone, as, for
26
example, in U.S. FTZs. Examples of zones with a more limited range of activities are
export processing zones and free retail zones (August, Mayer and Bixby 2013).
• Export processing zones (EPZs)
EPZs are free zones where manufacturing facilities process raw materials, or
assemble parts imported from abroad and then export the finished product. For
customs purposes, the materials are treated as if they have never entered the host
country. Therefore, duties are not paid neither when they are imported, nor when
they are exported. EPZs result very popular especially in developing countries, that
is because their purpose is to incentivise multinational enterprises to hire local
people and to start joint venturers with local businesses. In ASEAN this kind of
zones is prevalent in Cambodia and Lao PDR.
• Free retail zones
Free retail zones (or duty-free zones) are frequent in international airports and
harbours and near the busiest border crossings. They address their offer to
travellers that are leaving the nation by selling them goods free of excise taxes.
• Bonded warehouses
Similar to the free zones, this kind of facilities is usually set at the entry ports of the
countries. Private and owned by transportation firms, they are areas where shippers
can keep goods from arrival to the time they leave the customs and they are given
to importers. They are not meant as sites for business, but they solve a problem
that customs authorities would face if they had to store foreign goods while they
were being administered for entering the country.
Furthermore, an importer using bonded warehouses has less probabilities to
escape from regulation, because customs forms have to be filled out when goods
enter and leave the warehouse. No manufacturing activities are allowed inside
bonded warehouses (August, Mayer and Bixby 2013).
1.6.1 Effects of FTAs on FDI
The establishment of free zones and other trade agreements is widely used among
economic communities, but let us see what are their real effects in shaping MNEs
international strategies. In order to better understand the effects that FTAs have on FDI, Li,
27
Scollay and Maani (2016) started their analysis from two types of multinationals. FDI
theory can differentiate MNEs in horizontal and vertical multinationals. The horizontal ones
set up foreign subsidiaries to produce and furnish different markets with similar demand,
while the vertical multinationals establish different production stages in different countries
in order to minimize production costs.
Markusen (2002), cited in Li, Scollay and Maani (2016), combined the two types into a
“knowledge capital” model, that claims the presence of scale economies rising from the
joint-input nature of knowledge capital through geographically separated production
facilities. In this model, horizontal multinationals try to save on trade costs, providing local
markets. The disadvantage of this strategy is represented by higher fixed costs than the
ones arising from exporting national firms.
Consequently, this kind of firms is likelier to be successful if markets are big enough to
generate economies of scale, costs of plant setting-up are low, and costs of trade are
elevated. Therefore, horizontal FDI and goods trade are substitutes. Dissimilarly, vertical
MNEs involve exchanges in intermediate goods between foreign subsidiaries and trade in
final goods between subsidiaries and the home country. They are likelier to succeed if the
home-to-host skilled-to-unskilled labour endowment ratio is high, and both costs of trading
and costs of plant setting-up are low.
Further authors began from the “knowledge capital” theory to more articulated models,
especially the Baltagi et al. (2007) one, which brings a two-stage production in a three-
nations framework. Here, four types of ‘complex’ FDI are possible, depending on the
combinations of relative factor endowments, transport costs, and economies of scale.
Considering d the home country, i the host country and j the third country, the investment
pattern of the home country can be:
horizontal - with plants set in d and i, and exports from d to j,
complex horizontal - with plants set in d and i, and exports from i to j,
vertical - with plants set in i and j, and exports from i to d,
complex vertical - with plants set in i and j, and exports from j to d.
Complex vertical FDIs are different from vertical FDIs in terms of the exporting country of
final goods. So, the emerging FDI is the export platform FDI. Export platform MNEs aim to
take advantage of local resources in i and supply another market through exportations.
28
Export platform MNEs are likelier to be established when host state presents advantages
in production costs or trade costs with third countries.
Trade and horizontal FDI become substitutes when give alternatives for businesses in d to
supply the host market i. Trade completes export platform FDI, because the aim of export
platform FDI is to ease exports to third countries. Trade also complements vertical FDI
because vertical FDI comprehend intensive trade in intermediate and final goods.
Complementarity between trade and FDI is nowadays getting more important thanks to the
higher division of production, and the improvement of distribution channels across nations
(Li, Scollay and Maani 2016).
A move towards a free trade area means that imperfectly competitive firms in the
integrating countries that sell their output to (and import intermediates from) other member
countries will face lower trade barriers, as compared to firms outside the free trade area.
This raises the profitability of firms located in the liberalizing nations, and shifts industry
toward them. So FDI could be attracted into free trade areas, as inside firms are more
profitable (Li, Scollay and Maani 2016).
1.6.2 Limitations on Foreign Equity
Besides the incentives that governments provide to attract new FDI, internal regulations
can include limits on foreign presence for those economic sectors that are considered
strategical for the national interest. Limitations typically deputy certain economic areas
entirely to the locals or the state itself; alternatively, they allow a partial ratio of foreign
capital; in some cases, they define specific sectors where majority or full foreign ownership
is permitted or even stimulated. Hereby we can see the types of limitations categorised by
August, Mayer and Bixby (2013).
• Restricted Sectors
Commonly, governments limit investments from abroad to prevent foreigners from
influencing national issues like politics, economy or social life. Australia, for
instance, limits foreign investment in its radio and television companies to 35%.
• Closed Sectors
Most states close certain economic sectors to foreign ownership. Habitually they
are public utilities, strategic industries, sufficiently developed sectors or
29
medium/small-scale industries that can be developed by domestic entrepreneurs.
For example, Mexico reserves the following industries to the state: petroleum and
other hydrocarbons, basic petrochemicals, nuclear energy, electric power and
postal services. In addition, the following industries are reserved for Mexicans or
Mexican companies: radio and television, railroads, urban and interurban land
transportation and retail gasoline sales.
• Geographic Limitations
Some governments restrict the physical zones where foreigners might establish
activities or possess properties. As instance, Indonesia forbids foreigners from
owning land. Moreover, some countries forbid FDI in every region. The faculty of a
state to limit investments from abroad in determined areas is observed by other
governments as a manifestation of the national sovereign authority.
• Foreign Priority Sectors
Foreign investments are usually fostered in economic areas where national
resources are scarcely advanced, investments can make occupation grow, and the
export trade has scope for an increase. Developing countries let foreign
participation in innovative industries and in those productions which are capital
intensive, require a high degree of technology, are addressed to the export, or
present a high level of local value added. Tanzania, for example, encourages
foreign participation in agriculture and livestock development, natural resources,
manufacturing, transit trade with neighbouring nations, and high technology.
1.7 Foreign Investment Guarantees
Besides the incentives and subsidies, a host country provides guarantees to investors
from abroad, to attract them to its soil. Guarantees are arranged either by default when an
investment application is approved or certified by the appropriate host state agency or on
an ad hoc basis. For August, Mayer and Bixby (2013) the most important ones are:
• Compensation in the event of nationalization of a foreign-owned enterprise and
repatriation of the payments made;
30
• Repatriation of the proceeds upon the sale of the enterprise;
• Repatriation of profits, dividends and other forms of current income;
• Repatriation of the principal and interests from loans;
• Stabilization of taxes and other regulations.
Particular guarantees are found in the constitutions, legislation, policy statements, and
administrative practices. Constitutional provisions deal with the compensation of investors
in the case of nationalization or expropriation. These prescribe how properties have to be
taken and how they have to be paid for. The constitutions of Malaysia and the Philippines
say that a taking must be in the public interest, by means of a law or procedures
established by law, and that “fair,” “just,” or “adequate” compensation must be provided.
The guarantees in legislations usually are more detailed and more extensive than those of
the constitutions. For example, Indonesia’s Foreign Capital Investment Law states that
compensations should be mutually agreed according to the international laws and that any
disagreement must be solved by binding arbitration.
Foreign investment laws also deal with guarantees that are not often present in
constitutions, in particular repatriation guarantees, assurances of non-discrimination, and
stability clauses. The most common repatriation guarantees relate to the right of foreign
investors to remit profits and investment capital to their home country in the event of the
partial or complete termination of their enterprises. Less common are guarantees dealing
with the repatriation of other types of current income (like royalties, licensing fees and
other services) and to the remittance of the principal and interest from loans. In many
countries, monetary remittances abroad are subject to a variety of qualifications. August,
Mayer and Bixby (2013) sum up some of the most common:
The transfer of capital might be partly o completely restricted in case of very tight
foreign exchange situations;
Transfers might be limited for a certain time after the investment is made;
Transfers of income will be subject to the requirement of paying taxes and
complying with auditing requirements;
The transfer of proceeds from the sale or liquidation of an investment could be
subject to governmental approval.
31
Another type of assurances is non-discrimination guarantees. The constitutional
provisions, which treat them, generally are guarantees that foreign investors will be treated
in the same manner as national ones. Statutory provisions commonly state that equality of
treatment relates to ownership rights, taxation and social matters.
Stabilization clauses are a particular kind of guarantee provided by a few countries. These
clauses promise foreign investors that the host country will not change its tax, foreign
exchange, or other legal regime within a certain period of time, or that changes after the
establishment of an enterprise will not affect that enterprise. A stabilization clause could be
modified by the mutual agreement of the parties or by the changes in the surrounding
environment. Anyway, a stabilization clause is not able prevent a state from nationalizing
or expropriating a foreign investment because every state has the ultimate power to
nationalize property. The violation of a stabilization clause, however, may change the
character of a nationalization decree, from lawful to a breach of contract (August, Mayer
and Bixby 2013).
1.7.1 Protection of the Subsidiary
At the same time, the law of several countries provides some protection to subsidiaries
from the disadvantageous decisions of their parent company. In general, these provisions
try to preserve the capital basis and financial viability of the subsidiary. German law, for
example, combines and requires the parent company to compensate its subsidiaries for
any disadvantageous effects that result from its instructions. If a parent and its subsidiaries
enter into a formal contract of domination, this formal combine is subject to special rules.
The subsidiary is required to set up a special reserve; the amount of profits that can be
transferred to the parent is limited; and the parent company must assume the annual
losses of the subsidiary (August, Mayer and Bixby 2013).
Corporate law, securities regulations, or stock exchange rules often grant minority
shareholders appraisal rights or rights to minimum guaranteed dividends. Appraisal rights
are the rights of a dissenting shareholder to require the company to purchase his or her
shares at their fair market value. Parent companies are sometimes held responsible for the
debts of their subsidiaries or, in the event of liquidation of the subsidiary, the parent’s
claims will be subordinated to those of other creditors. Like minority shareholders,
creditors are often entitled to bring actions to enjoin a subsidiary from complying with the
instructions of a parent. In addition, the host state may intervene, through the appointment
32
of a temporary or permanent administrator to operate the subsidiary, to protect the
interests of the minority shareholders and local creditors.
Investment laws usually establish a variety of penalties for foreign investors who violate
the law or fail to comply with an investment agreement. Violators may be subject to
penalties ranging from fines to the suspension of their right to engage in business or to the
revocation of the facilities they were granted (August, Mayer and Bixby 2013).
1.8 Securities Regulations
After this analysis on legal environment and FDI determinants, particular attention is to be
given to securities regulation, which can affect MNEs strategies all around the world. In
fact, businesses raise much of their operating capital by issuing securities and trading in
foreign share markets is part of many investors’ strategy all around the world. This is why it
is fundamental for national governments to regulate securities transactions. This activity
includes defining the form that securities take, overseeing the markets in which securities
are traded, establishing disclosure requirements to protect buyers and sellers, adopting
clearance and settlement procedures, limiting insider trading and regulating takeovers.
Most countries authorize the use of both registered and bearer securities. Some, however,
insist that stock certificates must be registered securities. Bearer securities commonly
have coupons attached to them that can be detached so that the bearer can send them to
the issuer to collect dividends or interest as they come due (August, Mayer and Bixby
2013; Healy and Palepu 2001).
Most nations limit the entities who may trade in securities. Typically, these are brokers and
dealers who have registered with a commission that oversees traders and exchanges.
Additionally, banks, lawyers, accountants, and other experts are commonly allowed to
provide advice about securities transactions, but only if this is incidental to their principal
business. Securities brokers and dealers have grouped together in many countries to form
securities exchanges, that is, marketplaces where member brokers and dealers buy and
sell securities on behalf of investors. These marketplaces exist because they make it
easier for securities’ issuers to find investors and for investors to exchange their securities
(August, Mayer and Bixby 2013).
33
1.8.1 Issuance of Securities
In order for a corporation to offer securities to the public, it must prepare and register a
prospectus to accompany the offer. A prospectus is a printed statement setting out a full
disclosure of all relevant facts relating to the securities and the issuer. The contents of
prospectuses are generally similar from state to state and they require:
history of the issuer and a description of its purpose;
description of the issuer’s business and its present and anticipated course;
current financial statement with significant transactions;
profits earned and dividends paid for the previous years.
Prospectuses must be signed by the officers and directors of the issuer and by any
promoters and underwriters who may be involved. Then, a prospectus must be registered.
In some countries a prospectus is submitted to the listing committee of the securities
exchange on which it will be offered; in others it is filed with a national supervisory agency.
During the waiting period, an issuer may offer its securities orally, by distributing a
preliminary prospectus (called a red herring prospectus), and by means of a limited
advertisement (known as a tombstone advertisement) that identifies the security, its price,
and who will execute orders. Only after the listing committee or supervisory agency
approves the prospectus, the sale of the securities can take place (August, Mayer and
Bixby 2013; Healy and Palepu 2001).
Certain kinds of securities and certain transactions are exempt from registration. Exempt
securities typically include those issued by governmental bodies, by banks, and by not-for-
profit corporations. Exempt transactions commonly include non-public offerings and limited
offerings. Securities may be offered on a foreign exchange so long as they are registered
locally. To simplify this process, many countries allow an issuer to use the same
prospectus it registered in its home country.
Clearance and settlement is the procedure by which a buyer turns over the purchase price
and the seller turns over the securities in a securities transaction. This procedure differs
from country to country. A securities transaction is actually a contract to be performed in
the future, at the time the buyer delivers the purchase price and the seller delivers the debt
or equity certificate.
34
In most developing countries the buyer’s and seller’s brokers must get together and make
an actual trade. Although sales are settled within five business days in developed
countries, the settlement process can take several weeks in developing countries. The
Emerging Markets Clearing Corporation provides trade matching, clearance, settlement,
and risk management services to global dealers, interdealer brokers, and correspondent
clearing firms involved in emerging markets debt instruments (August, Mayer and Bixby
2013).
1.8.2 Insider Trading Regulations
Insider trading occurs when someone takes advantage of material non-public information
about a corporation or the securities market to buy or sell securities for personal benefit.
Some countries regard insider trading as unjust and dishonest, but many others consider
insider trading as a normal business practice.
The U.S. prohibitions against insider trading forbid an insider who has access to material
non-public information from buying or selling shares for his own account when the person
knows that the information is unavailable to the counterpart of the dealing. In addition, a
tipper that has inside information that discloses to a tippee and the tippee who acts on that
information, knowing that it is not publicly available, are both liable for the profits made by
the tippee. Courts interpreting these provisions have held that information is material when
a reasonable investor would act upon it, and information becomes public once it becomes
available to the general public (August, Mayer and Bixby 2013).
Japan’s insider trading provisions are found in Article 58 of its Securities and Exchange
Law, making insider transactions voidable if they are based on deceit and making directors
liable for damages if their conduct amounts to bad faith or gross negligence. However,
Article 58 does not provide for civil remedies. Despite the existence of this legislation,
traditionally Japanese law did not view insider trading as improper, and its insider trading
provisions were seldom enforced. In the late 1980s, however, several scandals brought
about calls for reform; and in 1988 the Securities Exchange Law was amended. In 2006,
Japan’s Upper House of Parliament passed legislation bringing stiffer penalties for insider
trading, market manipulation, and accounting fraud.
In 1983, the Council of Europe reviewed national regulations to examine the deficiencies in
international law with respect to insider trading. The colloquy led to the appointment of a
Committee of Experts to draft a convention on insider trading. On April 20, 1989, the
35
council formally adopted the Convention on Insider Trading and opened it for signature
(August, Mayer and Bixby 2013).
The convention’s purpose is to assist the regulatory agencies of its signatory states by
establishing a mechanism for the exchange of information so that those agencies can
better supervise their securities markets. Since the internationalization of markets and the
ease of present-day communications, it focuses on uncovering the insider trading activities
on the market of a state by entities not resident in that state or acting through entities not
resident there. In essence, the convention allows one state to request the assistance of
another in uncovering conduct by an individual or individuals in the latter’s territory that
constitutes insider trading in the requesting state. The requesting state must make a full
disclosure of the facts that lead it to believe that insider trading has taken place, and it
must state what it will do with the information it receives (August, Mayer and Bixby 2013).
1.8.3 Takeover Regulations
Financiers became actively involved in foreign acquisitions, mergers, and takeovers in the
1980s. British, Canadian, and Japanese corporate raiders made headlines for bidding on
or taking over American entertainment, liquor, and publishing businesses. The reason
foreign raiders were generally successful in the United States but unsuccessful elsewhere
is that securities regulations outside the United States are biased against takeovers.
Common barriers to takeover attempts are restrictions on share transferability, cross-
ownership of shares, and restrictions on the voting rights of publicly held shares.
In the United States and the United Kingdom, stock exchange listing requirements prohibit
restrictions on the transferability of shares of publicly held companies. In Canada, instead,
publicly offered shares may contain restrictions prohibiting their sale to non-Canadians.
Cross-ownership of shares is the placing of large blocks of stock in friendly hands to
protect against a hostile takeover. Voting restrictions on publicly held shares also inhibit
takeovers. Continental European corporation statutes impose caps on the total percentage
of shares any one owner may vote.
In contrast to the countries with takeover barriers, the countries with an active acquisition
marketplace (notably the United Kingdom and the United States) have legislation or
exchange rules that directly regulate the takeover process. The goal of such regulations is
neutrality: to put the raider and the management of the target company on a roughly equal
footing (August, Mayer and Bixby 2013).
36
1.8.4 Enforcement of Securities Regulations Internationally
International cooperation in the enforcement of securities regulations is a relatively recent
development. In 1961, the OECD adopted a Code of Liberalization of Capital Movements,
which it hoped would abolish stock exchange restrictions among its member states. But
the code had no effective enforcement provisions, and the OECD member states, in
practice, ignored it. Until the 1980s, no other attempts were made to establish any formal
mechanism of international cooperation. Then the U.S. started pushing its major trading
partners to enter into cooperative agreements, and the Council of Europe began working
on an insider trading convention.
The U.S. Securities and Exchange Commission (SEC) was among the first securities
regulators to receive the legal authority to assist their foreign counterparts in investigations
of securities fraud. The SEC can now assist foreign securities authorities in their
investigations using a number of tools, including exercising the SEC’s compulsory powers
to obtain documents and testimony, even if the supervised conduct is not a violation of the
American law. The SEC has the ability to provide access to non-public information in its
files with foreign persons. The commission could provide such non-public information in its
possession to specified foreign persons. The authority requesting this kind of information
must establish and maintain such safeguards as are necessary and appropriate to protect
the confidentiality of files (August, Mayer and Bixby 2013).
The SEC has approached enforcement-related information-sharing on a multilateral,
bilateral, and ad hoc basis. Multilateral and bilateral information sharing arrangements
operate on the basis of Memoranda of Understanding (MOU) between securities
authorities. Such MOUs delineate the terms of information-sharing between and among
MOU signatories and create a framework for regular and predictable cooperation in
securities law enforcement. Multilateral and bilateral MOUs detail the scope and terms of
information-sharing among securities regulators (August, Mayer and Bixby 2013).
One important example of the many attempts to apply securities regulations internationally
has been the enforcement of U.S. securities laws extraterritorially. Consideration of this is
especially important because U.S. laws apply to a much wider range of activities than
those of any other country. The U.S. Securities Act of 1933 requires companies to disclose
their financial standing before issuing new shares. The Securities and Exchange Act of
1934 requires managers and owners of large percentages of stock to disclose their
ownership interests, and it forbids insider trading and other fraudulent securities
37
transactions. The Williams Act requires corporate raiders to disclose their finances and
their reasons for making a takeover bid.
To ensure that persons operating outside the United States do not avoid these laws, the
SEC and the U.S. Department of Justice have regularly instituted suits involving non-
resident aliens. This has forced courts to determine if the U.S. securities laws give them
the necessary jurisdiction to hear these cases. The principle of nationality objective
territoriality jurisdiction can potentially subject non-U.S. companies to U.S. securities laws
where the activities of those companies have an “effect” on U.S. markets. Especially
significant are the “foreign-cubed” securities litigation: where there are foreign plaintiffs
who bought shares in a foreign company on a foreign exchange (August, Mayer and Bixby
2013).
1.9 Customs Valuation
Even if not directly connected to Foreign Direct Investment’s regulations, customs play a
central role in shaping multinational enterprises’ strategies. When goods cross an
international frontier, they are charged with a tariff that is based on a percentage of their
value. If it is costly or difficult to enter products and resources into a market or move them
out, a nation would not be interesting from the point of view of those companies that could
bring remunerative investments. In order to enhance trade and attract foreign investors,
custom duties are eased throughout treaties with commercial partners and procedures are
lightened and harmonised thanks to international standards and procedures.
The Agreement on Implementation of GATT 1994 (Customs Valuation Code) is designed
to harmonize the methods used by WTO member states to determine the value of those
goods. Its detailed rules are meant to provide for a fair, neutral, and uniform system of
customs valuation. A primary method and fall-back methods are established. The primary
method of customs valuation is to figure the transaction value of the imported item. This is
based on the price that is corresponded when the items are exported, plus certain
amounts reflecting packing costs, commissions paid by the buyer, any royalties or license
fees paid by the buyer, and any disposal or usage proceeds that accrue to the vendor
(August, Mayer and Bixby 2013).
If the transaction value of imported items cannot be fairly determined, then fall-back
methods are used. The first fall-back method involves determining the transactional worth
38
of identical products exchanged for export to the importing country during the current
period. If this value cannot be established, then the second method is to determine the
transaction value of similar items sold for export to the importing country at about the same
time. Third, if not even one of these values is ascertainable, the deductive method is used.
Here, the customs value is based on the price paid for the highest number of units sold to
unrelated persons in the importing country at about the same time.
Under the fourth method, the computed value is derived from the sum of the cost or value
of the materials, including the cost of fabrication or processing; the profit and overhead
that customarily apply to the particular goods in the exporting country; and charges for
handling, transportation, and insurance. Finally, if none of these methods can be applied, a
derived value is used. This is determined by applying whichever of the other methods best
fits and adjusting it to the particular circumstances (August, Mayer and Bixby 2013).
1.9.1 Technical Barriers and Investment Measures
The TBT Agreement (Agreement on Technical Barriers to Trade) regulates the way WTO
members conceive and apply technical rules to guarantee that they provide an appropriate
level of protection for the life and health of humans, animals, and plants, as well as for the
environment; prevent deceptive practices; and do not create pointless impediments to
trade. Technical regulations are mandatory laws and provisions specifying the
characteristics of products; the processes and production methods for creating products;
and the terminology, symbols, packaging, marking, or labelling requirements for products,
processes, or production methods (August, Mayer and Bixby 2013).
The Agreement on Trade-Related Investment Measures (TRIMs Agreement) is aimed at
facilitating foreign investment and eliminating some of the provisions commonly found in
foreign investment laws that distort or reduce international trade. In particular, the
agreement forbids provisions in investment laws that discriminate unfavourably against
foreigners (i.e., that do not accord them “national treatment”) and that impose quantitative
restrictions on the use of foreign products by foreign-owned local enterprises.
Examples include requirements that a foreign-owned enterprise must purchase or use a
certain amount or proportion of domestic products (“local contents requirements”) and
requirements that restrict the volume or value of an enterprise’s imports by linking them to
the volume or value of its exports (“trade-balancing requirements”) or by correlating an
39
enterprise’s access to foreign exchange to its foreign exchange earnings (“foreign
exchange balancing restrictions”) (August, Mayer and Bixby 2013).
1.9.2 The Case of Agriculture
Particularly interesting, even for the issues that we will discuss in chapter 3 about Lao and
Cambodia, is the case of agriculture, which has always been one of the most difficult items
on the WTO agenda. As we will see, effective politics on agricultural productions and their
access to international circuits are factors that can be crucial for those economies that still
rely a lot on the primary sector.
All nations want to protect and assist their farmers, and many governments provide them
with substantial financial subsidies. This, obviously, distorts the free market, and has a
substantial effect on the prices of agricultural goods around the world. The reduction or
elimination of the subsidies is one of the central and most difficult matters. While the EU
and the United States have attempted to obtain tariff reductions from other nations for their
exports, other countries and regional groups have demanded that the EU and the United
States substantially reduce their agricultural subsidies in return. The Agreement on
Agriculture establishes guidelines for reforming the trade in agriculture. Its ultimate goal is
the establishment of a market-oriented system for trade in agricultural products that is free
of restrictions and distortions (August, Mayer and Bixby 2013).
Upon becoming members of the WTO and parties to the Agreement on Agriculture, states
agreed to convert their existing non-tariff barriers upon agricultural imports into equivalent
customs tariffs. The process for doing this involved taking the difference in internal and
external prices and making appropriate adjustments (for differences in quality or variety
and for other elements that provided protection to domestic producers). These tariff rates
were then incorporated into a Schedule of Concessions that each member state deposited
with the GATT Secretariat to be appended to GATT 1994 along with its commitment to
reduce its tariff rates during the implementation period.
On average, agricultural tariffs were decreased by 24% for developing countries and by
36% for developed nations. Of course, domestic agricultural support measures can
sometimes restrict or distort trade. Developed countries decided to reduce the monetary
impact of measures with this effect by 20% and developing countries by 13.3%. Anyway,
not all support measures distort trade and to do this, they must satisfy two basic
40
requirements: they must be publicly funded programs and they must not provide price
supports to producers (August, Mayer and Bixby 2013).
Export subsidies for agricultural products can similarly restrict or distort trade. As with
domestic support measures, the developed states have agreed to reduce export subsidies
by 36% and developing states by 24% during the implementation period. These measures
are defined in the Agreement on Agriculture as subsidies that are contingent upon export
performance (August, Mayer and Bixby 2013).
1.10 Concluding Remarks
As we can understand, FDI represents a trivial issue both by governments’ and by
companies’ point of view. States have to balance their incentives and subsidies, if not new
companies could represent a net cost. Moreover, they have to set up an adequate
legislative environment, which comprehends every aspect of foreign investors activity. An
important example is provided by Myanmar, which despite its important internal market
and its proximity to India, cannot enhance its economic development because of a
confused political situation and a lack of effective regulations.
For what concerns companies, deep analyses have to be carried on before entering a
foreign market and these cannot be limited to the taxation rates. A lot of macro- and micro-
economic factors can determine the attractiveness of a specific market. As we will see for
Cambodia and Lao, their macroeconomic situation is not very different but the effective
enforcement of specific rules can determine the success of their agricultural sector. Then
there is the whole legal framework to be kept in mind.
In fact, the treatment that local governments reserve to foreign investors can vary a lot
throughout all the aspects of investor’s activities. International business law sets rules at a
worldwide level, but specific requirements, limitations and approvals are stated by local
regulators. In the following chapter we will see these themes, especially FDI determinants,
subsidies and taxation, applied to the ASEAN case, with all the characteristics of the
states of South-East Asia.
41
2 The Association of South-East Asia Nations – ASEAN
Nations in a geographic region may agree on general guidelines for investments in the
area. One example is the Association of Southeast Asia Nations. The ASEAN region is a
leading recipient of FDI flows in the developing world and its countries have undertaken
collective as well as individual measures to attract new investments. Individual nations
created specific policies to recover from the economic crisis of 1997-98, and this is
particularly evident looking at the different taxations and degrees of openness to FDI; but
at the same time member countries are collectively promoting ASEAN as a single
investment area, seizing free trade agreements and enhancing communitarian laws
(August, Mayer and Bixby 2013).
The Association of Southeast Asian Nations was established in 1967 in Bangkok, by
Indonesia, Malaysia, Philippines, Singapore and Thailand. Then, Brunei Darussalam
joined it in 1984, followed by Vietnam in 1995, Lao PDR and Myanmar in 1997, and
Cambodia in 1999, making up what today are the ten member states of ASEAN. This
cooperation enhanced the economic amalgamation of the region by creating, in 2015, the
ASEAN Economic Community (AEC), forming a market of 2.6 trillion US$ and achieving
the free movement of products, services, skilled workers and investments.
The other major economic integration schemes include the ASEAN Investment Area (AIA),
the ASEAN Free Trade Area (AFTA), the ASEAN Mekong Basin Development
Cooperation (AMBDC), and many others. The AIA Council is the Ministerial body, under
the ASEAN Economic Ministers, responsible for overseeing the implementation of the
ASEAN Comprehensive Investment Agreement (ACIA), ASEAN’s main economic
instrument to realise a free and open investment regime. It is composed of Ministers from
the ten Member States responsible for investment and the Secretary-General of ASEAN,
who signed the Framework Agreement on the AIA on 7 October 1998, in Manila (ASEAN
2017). The AIA aims to foster investments in the region through the following measures:
Implementing coordinated ASEAN investment cooperation and facilitation
programmes;
Granting immediate national treatment, with some exceptions as specified in the
Temporary Exclusion List and the Sensitive List;
42
Immediate opening up of all industries for investment, with some exceptions as
specified in the Temporary Exclusion List and the Sensitive List;
Providing a more streamlined and simplified investment process;
Actively involving the private sector in the AIA development process;
Providing transparency in investment policies, rules, procedures and administrative
processes;
Promoting freer flows of capital, skilled labour, professional expertise and
technology amongst the member countries;
Eliminating investment barriers and liberalizing investment rules and policies in the
sectors covered by the Agreement.
The AIA has important implications for investment strategies and production activities in
the region. For example, it encourages investors to think increasingly in the regional terms
and to adopt a regional investment strategy and network of operations. Current and
potential investors will benefit from the AIA arrangements in the following ways:
greater investment access to industries and economic sectors as a result of the
opening up of industries under the AIA arrangements, if investors qualify as
ASEAN investors;
national treatment, if investors qualify as ASEAN investors;
greater transparency, information and awareness of investment opportunities in
the region;
more liberal and competitive investment regimes;
lower transaction costs for business operations across the region.
An ASEAN investor is defined as being equal to a national investor in terms of the equity
requirements of the member country in which the investment is made. Thus, a foreign firm
with a majority interest can avail itself of national treatment and investment market access
privileges, in addition to the other benefits provided under the AIA Agreement and other
regional economic schemes. Thanks to the agreements that ASEAN subscribed within its
member states and with other commercial partners, businesses are choosing South-East
Asia as their hub for activities in Pacific Asia and Oceania. (ASEAN 2017).
43
Throughout the chapter 2, we will give a glance to ASEAN macroeconomics in section 2.1,
with particular attention to FDI and growth rates in section 2.2. In sections and 2.3 and 2.4,
we will see what are the specific determinants of FDI in ASEAN and how different levels of
FDI openness affect business environment in different nations. In section 2.5 we will
detach the importance of ASEAN – China Free Trade Agreement and, finally, we will
analyse the different tax rates within the cluster.
2.1 ASEAN Macroeconomics
Here we have some data which can help understand the macroeconomic situation that
ASEAN is living and what are the main differences among countries.
2.1.1 Gross Domestic Product
Let us start our analysis with the population of the different members and their GDP at
current prices and per capita. Usually, ASEAN countries are distinguished in two main
blocks: CLMV (Cambodia, Lao PDR, Myanmar and Vietnam) and the remaining six
countries of the region (Brunei, Indonesia, Malaysia, Philippines, Singapore and Thailand).
As we can see from the figures, the first group represents the poorest countries, which are
way less developed and industrialised than the second one, that produces around the 90%
of the total ASEAN GDP.
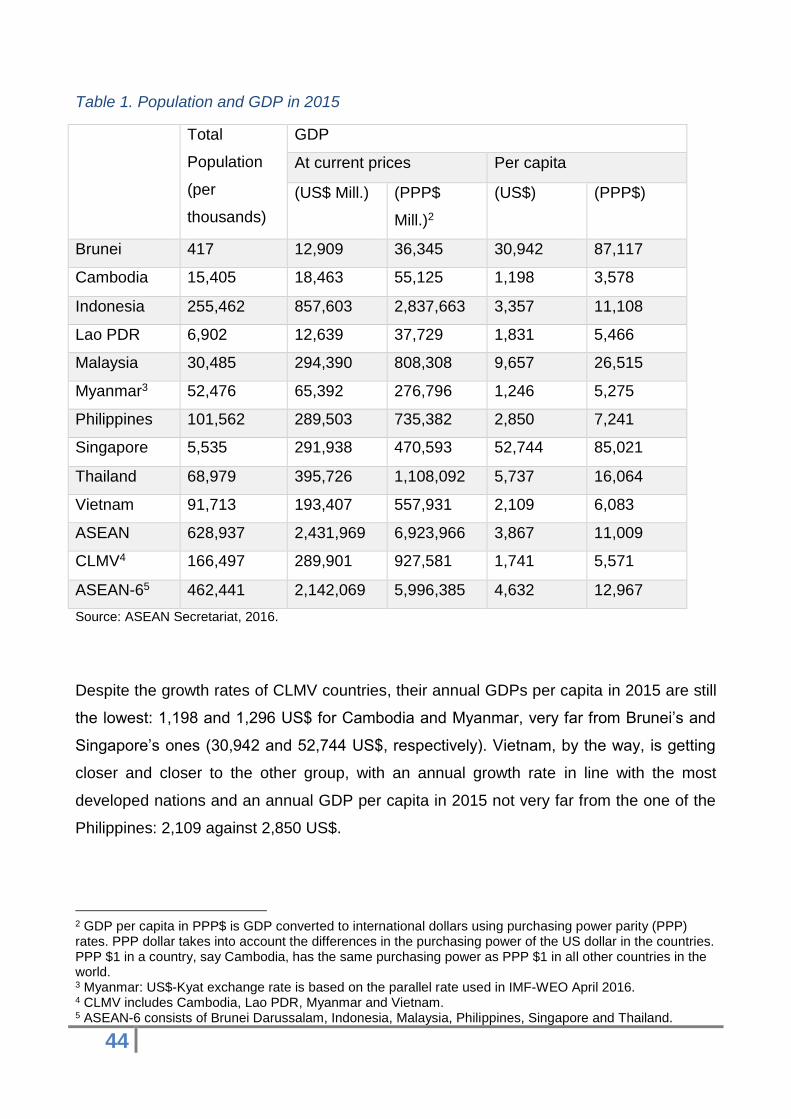
44
Table 1. Population and GDP in 2015
Total
Population
(per
thousands)
GDP
At current prices Per capita
(US$ Mill.) (PPP$
Mill.)2
(US$) (PPP$)
Brunei 417 12,909 36,345 30,942 87,117
Cambodia 15,405 18,463 55,125 1,198 3,578
Indonesia 255,462 857,603 2,837,663 3,357 11,108
Lao PDR 6,902 12,639 37,729 1,831 5,466
Malaysia 30,485 294,390 808,308 9,657 26,515
Myanmar3 52,476 65,392 276,796 1,246 5,275
Philippines 101,562 289,503 735,382 2,850 7,241
Singapore 5,535 291,938 470,593 52,744 85,021
Thailand 68,979 395,726 1,108,092 5,737 16,064
Vietnam 91,713 193,407 557,931 2,109 6,083
ASEAN 628,937 2,431,969 6,923,966 3,867 11,009
CLMV4 166,497 289,901 927,581 1,741 5,571
ASEAN-65 462,441 2,142,069 5,996,385 4,632 12,967
Source: ASEAN Secretariat, 2016.
Despite the growth rates of CLMV countries, their annual GDPs per capita in 2015 are still
the lowest: 1,198 and 1,296 US$ for Cambodia and Myanmar, very far from Brunei’s and
Singapore’s ones (30,942 and 52,744 US$, respectively). Vietnam, by the way, is getting
closer and closer to the other group, with an annual growth rate in line with the most
developed nations and an annual GDP per capita in 2015 not very far from the one of the
Philippines: 2,109 against 2,850 US$.
2 GDP per capita in PPP$ is GDP converted to international dollars using purchasing power parity (PPP) rates. PPP dollar takes into account the differences in the purchasing power of the US dollar in the countries. PPP $1 in a country, say Cambodia, has the same purchasing power as PPP $1 in all other countries in the world. 3 Myanmar: US$-Kyat exchange rate is based on the parallel rate used in IMF-WEO April 2016. 4 CLMV includes Cambodia, Lao PDR, Myanmar and Vietnam. 5 ASEAN-6 consists of Brunei Darussalam, Indonesia, Malaysia, Philippines, Singapore and Thailand.
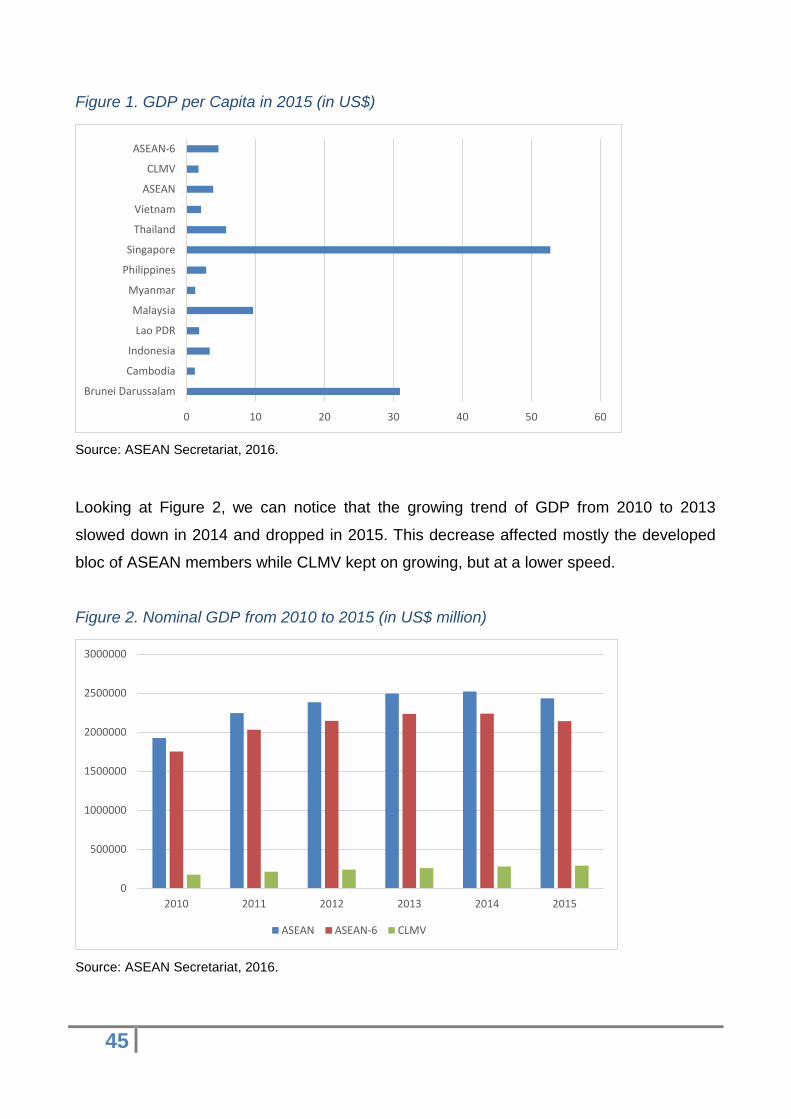
45
Figure 1. GDP per Capita in 2015 (in US$)
Source: ASEAN Secretariat, 2016.
Looking at Figure 2, we can notice that the growing trend of GDP from 2010 to 2013
slowed down in 2014 and dropped in 2015. This decrease affected mostly the developed
bloc of ASEAN members while CLMV kept on growing, but at a lower speed.
Figure 2. Nominal GDP from 2010 to 2015 (in US$ million)
Source: ASEAN Secretariat, 2016.
0 10 20 30 40 50 60
Brunei Darussalam
Cambodia
Indonesia
Lao PDR
Malaysia
Myanmar
Philippines
Singapore
Thailand
Vietnam
ASEAN
CLMV
ASEAN-6
0
500000
1000000
1500000
2000000
2500000
3000000
2010 2011 2012 2013 2014 2015
ASEAN ASEAN-6 CLMV
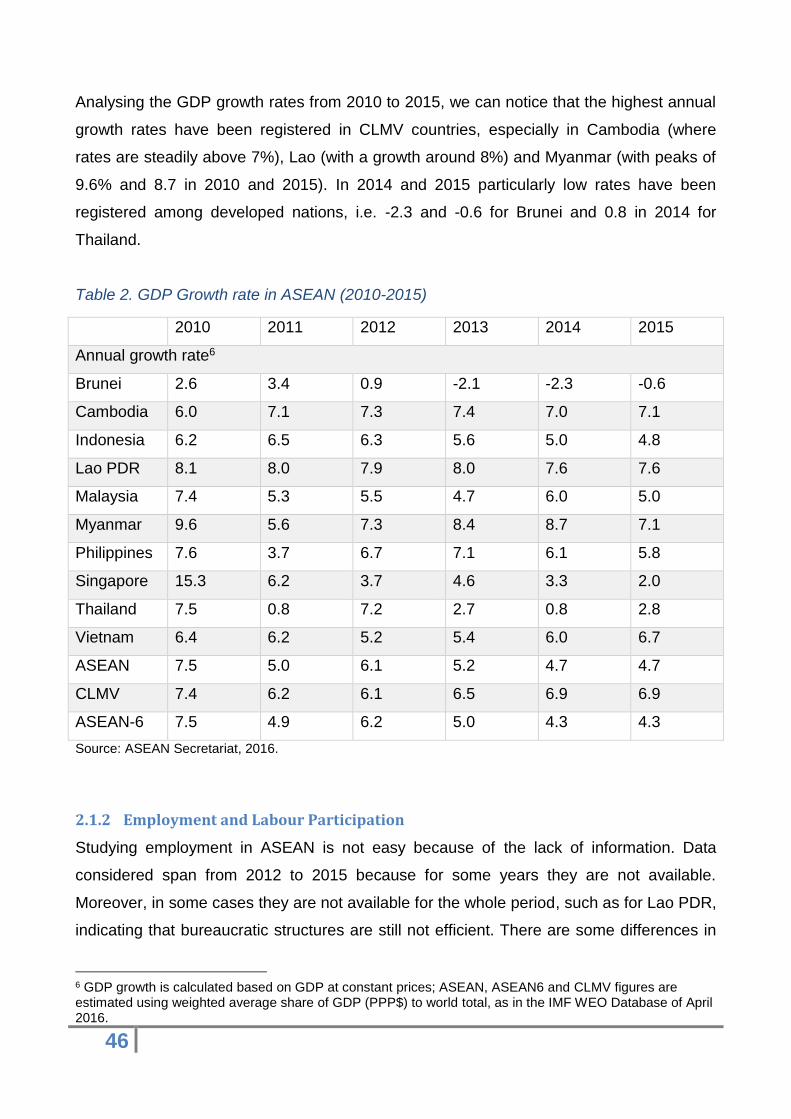
46
Analysing the GDP growth rates from 2010 to 2015, we can notice that the highest annual
growth rates have been registered in CLMV countries, especially in Cambodia (where
rates are steadily above 7%), Lao (with a growth around 8%) and Myanmar (with peaks of
9.6% and 8.7 in 2010 and 2015). In 2014 and 2015 particularly low rates have been
registered among developed nations, i.e. -2.3 and -0.6 for Brunei and 0.8 in 2014 for
Thailand.
Table 2. GDP Growth rate in ASEAN (2010-2015)
2010 2011 2012 2013 2014 2015
Annual growth rate6
Brunei 2.6 3.4 0.9 -2.1 -2.3 -0.6
Cambodia 6.0 7.1 7.3 7.4 7.0 7.1
Indonesia 6.2 6.5 6.3 5.6 5.0 4.8
Lao PDR 8.1 8.0 7.9 8.0 7.6 7.6
Malaysia 7.4 5.3 5.5 4.7 6.0 5.0
Myanmar 9.6 5.6 7.3 8.4 8.7 7.1
Philippines 7.6 3.7 6.7 7.1 6.1 5.8
Singapore 15.3 6.2 3.7 4.6 3.3 2.0
Thailand 7.5 0.8 7.2 2.7 0.8 2.8
Vietnam 6.4 6.2 5.2 5.4 6.0 6.7
ASEAN 7.5 5.0 6.1 5.2 4.7 4.7
CLMV 7.4 6.2 6.1 6.5 6.9 6.9
ASEAN-6 7.5 4.9 6.2 5.0 4.3 4.3
Source: ASEAN Secretariat, 2016.
2.1.2 Employment and Labour Participation
Studying employment in ASEAN is not easy because of the lack of information. Data
considered span from 2012 to 2015 because for some years they are not available.
Moreover, in some cases they are not available for the whole period, such as for Lao PDR,
indicating that bureaucratic structures are still not efficient. There are some differences in
6 GDP growth is calculated based on GDP at constant prices; ASEAN, ASEAN6 and CLMV figures are estimated using weighted average share of GDP (PPP$) to world total, as in the IMF WEO Database of April 2016.
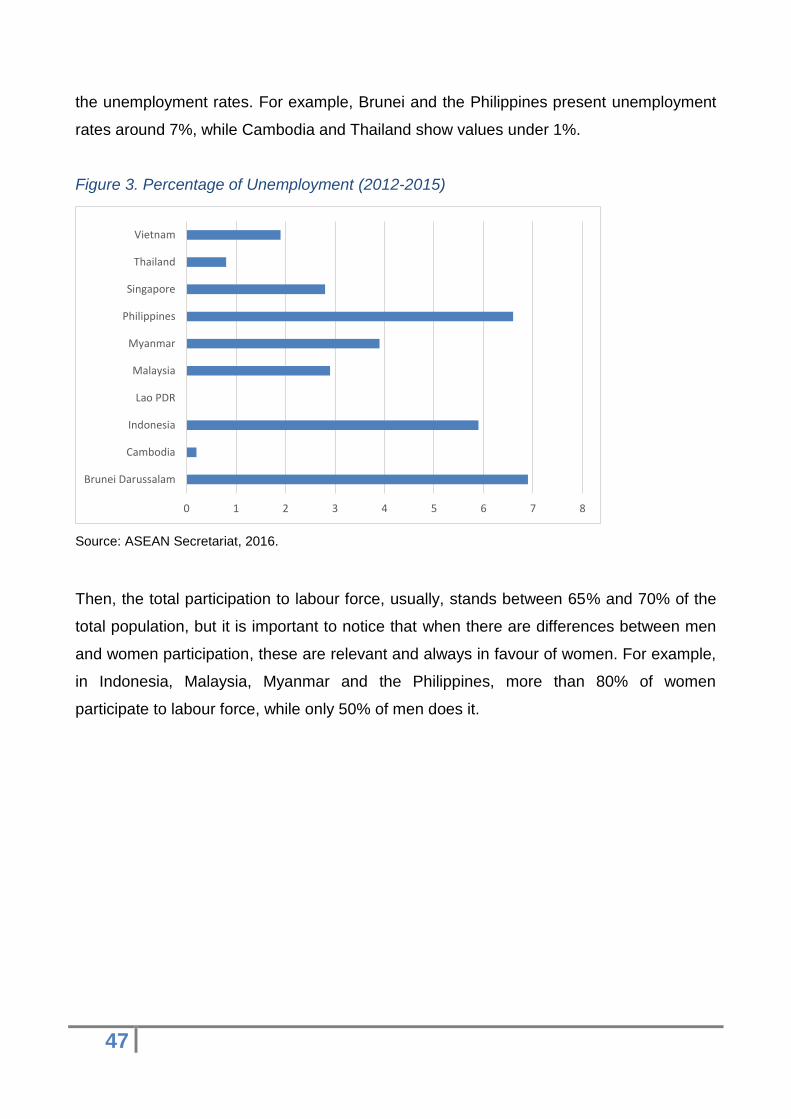
47
the unemployment rates. For example, Brunei and the Philippines present unemployment
rates around 7%, while Cambodia and Thailand show values under 1%.
Figure 3. Percentage of Unemployment (2012-2015)
Source: ASEAN Secretariat, 2016.
Then, the total participation to labour force, usually, stands between 65% and 70% of the
total population, but it is important to notice that when there are differences between men
and women participation, these are relevant and always in favour of women. For example,
in Indonesia, Malaysia, Myanmar and the Philippines, more than 80% of women
participate to labour force, while only 50% of men does it.
0 1 2 3 4 5 6 7 8
Brunei Darussalam
Cambodia
Indonesia
Lao PDR
Malaysia
Myanmar
Philippines
Singapore
Thailand
Vietnam
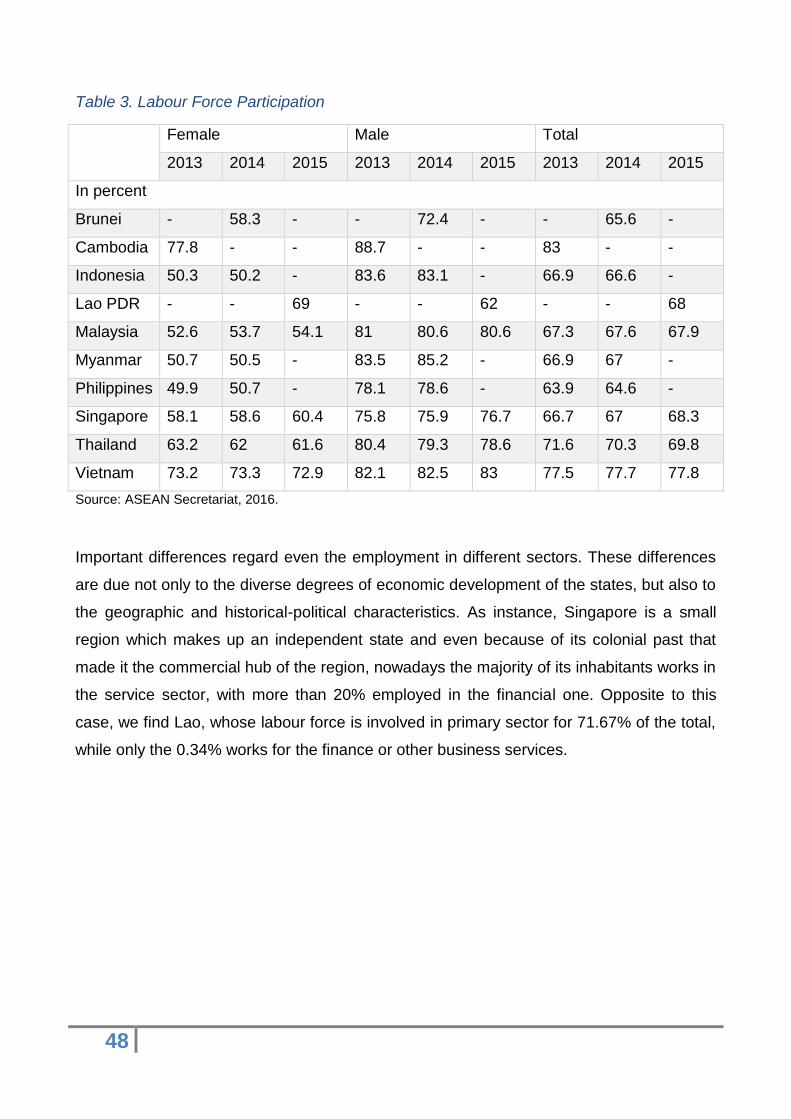
48
Table 3. Labour Force Participation
Female Male Total
2013 2014 2015 2013 2014 2015 2013 2014 2015
In percent
Brunei - 58.3 - - 72.4 - - 65.6 -
Cambodia 77.8 - - 88.7 - - 83 - -
Indonesia 50.3 50.2 - 83.6 83.1 - 66.9 66.6 -
Lao PDR - - 69 - - 62 - - 68
Malaysia 52.6 53.7 54.1 81 80.6 80.6 67.3 67.6 67.9
Myanmar 50.7 50.5 - 83.5 85.2 - 66.9 67 -
Philippines 49.9 50.7 - 78.1 78.6 - 63.9 64.6 -
Singapore 58.1 58.6 60.4 75.8 75.9 76.7 66.7 67 68.3
Thailand 63.2 62 61.6 80.4 79.3 78.6 71.6 70.3 69.8
Vietnam 73.2 73.3 72.9 82.1 82.5 83 77.5 77.7 77.8
Source: ASEAN Secretariat, 2016.
Important differences regard even the employment in different sectors. These differences
are due not only to the diverse degrees of economic development of the states, but also to
the geographic and historical-political characteristics. As instance, Singapore is a small
region which makes up an independent state and even because of its colonial past that
made it the commercial hub of the region, nowadays the majority of its inhabitants works in
the service sector, with more than 20% employed in the financial one. Opposite to this
case, we find Lao, whose labour force is involved in primary sector for 71.67% of the total,
while only the 0.34% works for the finance or other business services.
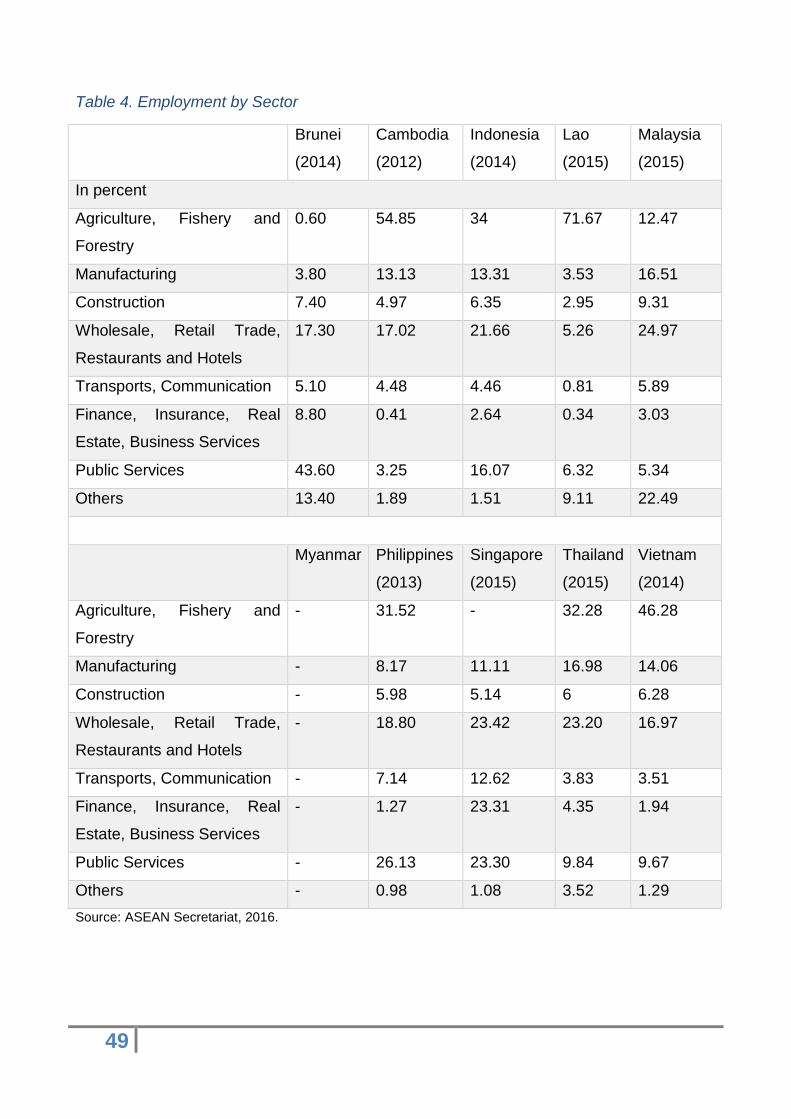
49
Table 4. Employment by Sector
Brunei
(2014)
Cambodia
(2012)
Indonesia
(2014)
Lao
(2015)
Malaysia
(2015)
In percent
Agriculture, Fishery and
Forestry
0.60 54.85 34 71.67 12.47
Manufacturing 3.80 13.13 13.31 3.53 16.51
Construction 7.40 4.97 6.35 2.95 9.31
Wholesale, Retail Trade,
Restaurants and Hotels
17.30 17.02 21.66 5.26 24.97
Transports, Communication 5.10 4.48 4.46 0.81 5.89
Finance, Insurance, Real
Estate, Business Services
8.80 0.41 2.64 0.34 3.03
Public Services 43.60 3.25 16.07 6.32 5.34
Others 13.40 1.89 1.51 9.11 22.49
Myanmar Philippines
(2013)
Singapore
(2015)
Thailand
(2015)
Vietnam
(2014)
Agriculture, Fishery and
Forestry
- 31.52 - 32.28 46.28
Manufacturing - 8.17 11.11 16.98 14.06
Construction - 5.98 5.14 6 6.28
Wholesale, Retail Trade,
Restaurants and Hotels
- 18.80 23.42 23.20 16.97
Transports, Communication - 7.14 12.62 3.83 3.51
Finance, Insurance, Real
Estate, Business Services
- 1.27 23.31 4.35 1.94
Public Services - 26.13 23.30 9.84 9.67
Others - 0.98 1.08 3.52 1.29
Source: ASEAN Secretariat, 2016.
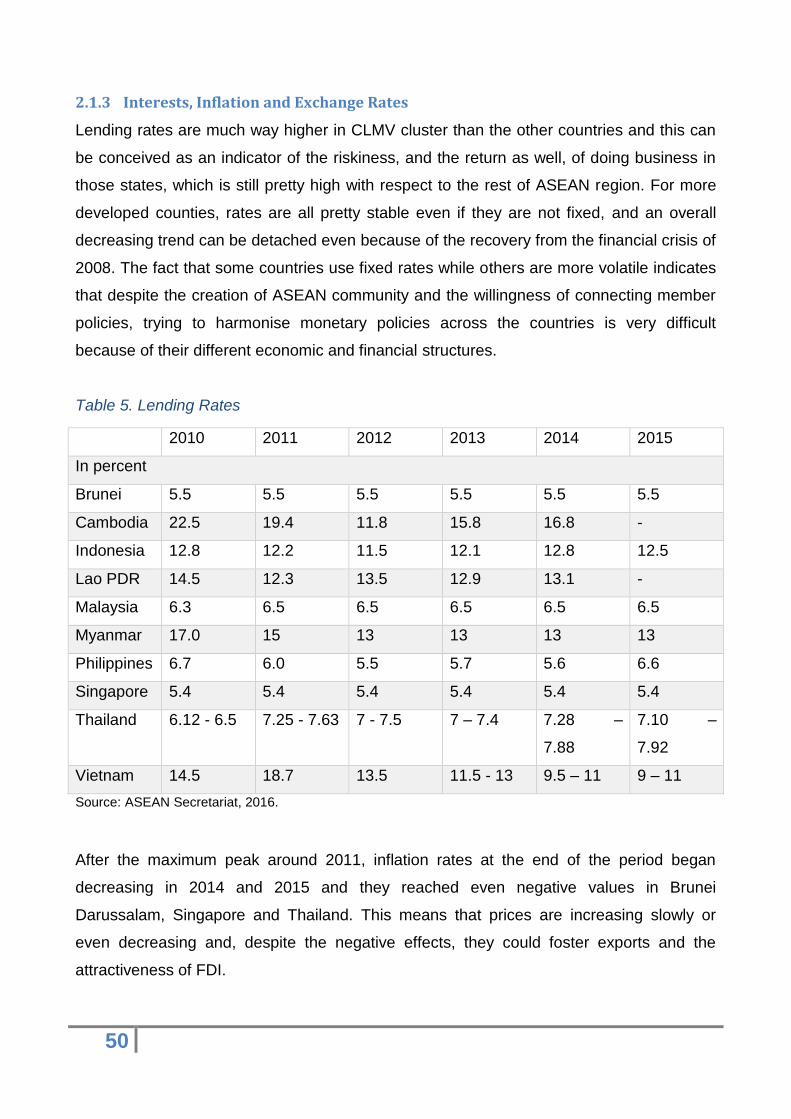
50
2.1.3 Interests, Inflation and Exchange Rates
Lending rates are much way higher in CLMV cluster than the other countries and this can
be conceived as an indicator of the riskiness, and the return as well, of doing business in
those states, which is still pretty high with respect to the rest of ASEAN region. For more
developed counties, rates are all pretty stable even if they are not fixed, and an overall
decreasing trend can be detached even because of the recovery from the financial crisis of
2008. The fact that some countries use fixed rates while others are more volatile indicates
that despite the creation of ASEAN community and the willingness of connecting member
policies, trying to harmonise monetary policies across the countries is very difficult
because of their different economic and financial structures.
Table 5. Lending Rates
2010 2011 2012 2013 2014 2015
In percent
Brunei 5.5 5.5 5.5 5.5 5.5 5.5
Cambodia 22.5 19.4 11.8 15.8 16.8 -
Indonesia 12.8 12.2 11.5 12.1 12.8 12.5
Lao PDR 14.5 12.3 13.5 12.9 13.1 -
Malaysia 6.3 6.5 6.5 6.5 6.5 6.5
Myanmar 17.0 15 13 13 13 13
Philippines 6.7 6.0 5.5 5.7 5.6 6.6
Singapore 5.4 5.4 5.4 5.4 5.4 5.4
Thailand 6.12 - 6.5 7.25 - 7.63 7 - 7.5 7 – 7.4 7.28 –
7.88
7.10 –
7.92
Vietnam 14.5 18.7 13.5 11.5 - 13 9.5 – 11 9 – 11
Source: ASEAN Secretariat, 2016.
After the maximum peak around 2011, inflation rates at the end of the period began
decreasing in 2014 and 2015 and they reached even negative values in Brunei
Darussalam, Singapore and Thailand. This means that prices are increasing slowly or
even decreasing and, despite the negative effects, they could foster exports and the
attractiveness of FDI.
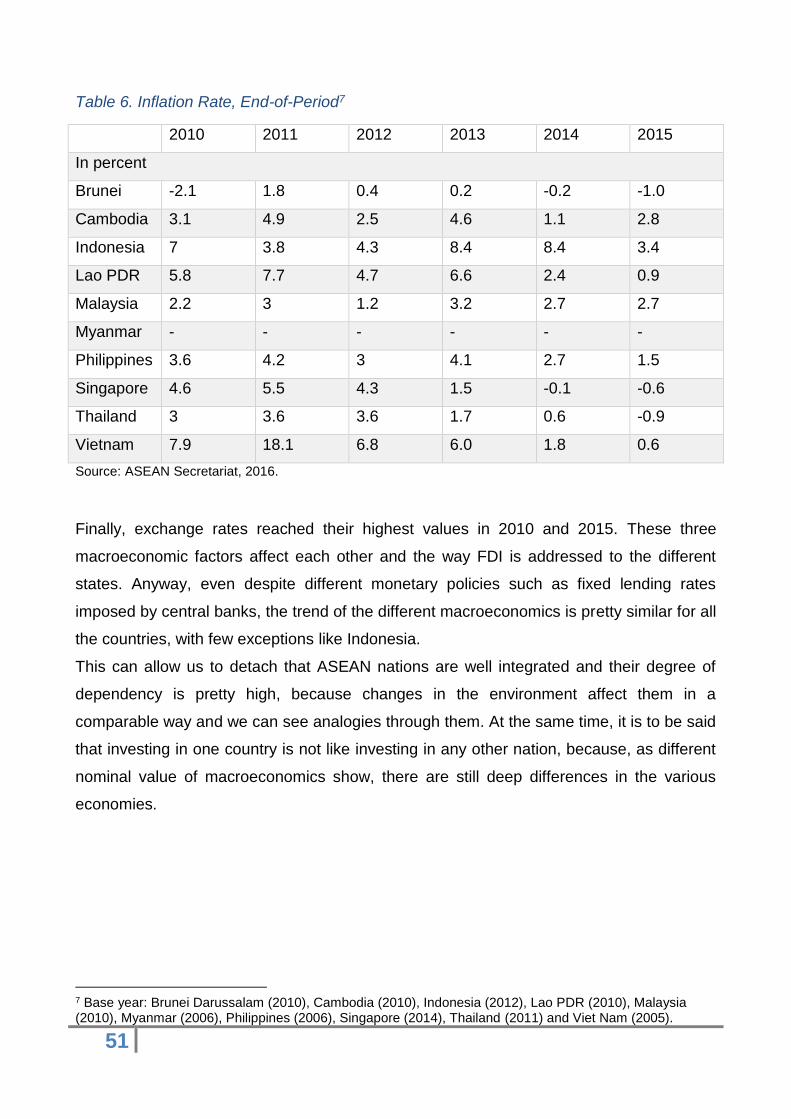
51
Table 6. Inflation Rate, End-of-Period7
2010 2011 2012 2013 2014 2015
In percent
Brunei -2.1 1.8 0.4 0.2 -0.2 -1.0
Cambodia 3.1 4.9 2.5 4.6 1.1 2.8
Indonesia 7 3.8 4.3 8.4 8.4 3.4
Lao PDR 5.8 7.7 4.7 6.6 2.4 0.9
Malaysia 2.2 3 1.2 3.2 2.7 2.7
Myanmar - - - - - -
Philippines 3.6 4.2 3 4.1 2.7 1.5
Singapore 4.6 5.5 4.3 1.5 -0.1 -0.6
Thailand 3 3.6 3.6 1.7 0.6 -0.9
Vietnam 7.9 18.1 6.8 6.0 1.8 0.6
Source: ASEAN Secretariat, 2016.
Finally, exchange rates reached their highest values in 2010 and 2015. These three
macroeconomic factors affect each other and the way FDI is addressed to the different
states. Anyway, even despite different monetary policies such as fixed lending rates
imposed by central banks, the trend of the different macroeconomics is pretty similar for all
the countries, with few exceptions like Indonesia.
This can allow us to detach that ASEAN nations are well integrated and their degree of
dependency is pretty high, because changes in the environment affect them in a
comparable way and we can see analogies through them. At the same time, it is to be said
that investing in one country is not like investing in any other nation, because, as different
nominal value of macroeconomics show, there are still deep differences in the various
economies.
7 Base year: Brunei Darussalam (2010), Cambodia (2010), Indonesia (2012), Lao PDR (2010), Malaysia (2010), Myanmar (2006), Philippines (2006), Singapore (2014), Thailand (2011) and Viet Nam (2005).
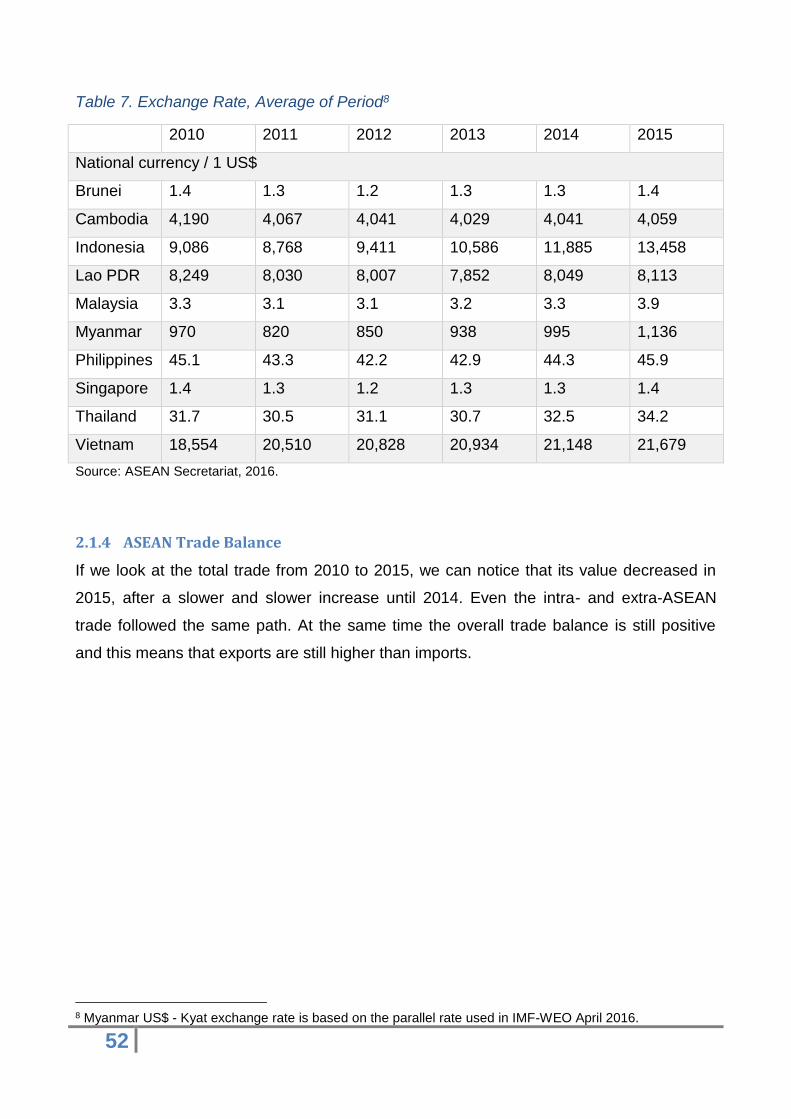
52
Table 7. Exchange Rate, Average of Period8
2010 2011 2012 2013 2014 2015
National currency / 1 US$
Brunei 1.4 1.3 1.2 1.3 1.3 1.4
Cambodia 4,190 4,067 4,041 4,029 4,041 4,059
Indonesia 9,086 8,768 9,411 10,586 11,885 13,458
Lao PDR 8,249 8,030 8,007 7,852 8,049 8,113
Malaysia 3.3 3.1 3.1 3.2 3.3 3.9
Myanmar 970 820 850 938 995 1,136
Philippines 45.1 43.3 42.2 42.9 44.3 45.9
Singapore 1.4 1.3 1.2 1.3 1.3 1.4
Thailand 31.7 30.5 31.1 30.7 32.5 34.2
Vietnam 18,554 20,510 20,828 20,934 21,148 21,679
Source: ASEAN Secretariat, 2016.
2.1.4 ASEAN Trade Balance
If we look at the total trade from 2010 to 2015, we can notice that its value decreased in
2015, after a slower and slower increase until 2014. Even the intra- and extra-ASEAN
trade followed the same path. At the same time the overall trade balance is still positive
and this means that exports are still higher than imports.
8 Myanmar US$ - Kyat exchange rate is based on the parallel rate used in IMF-WEO April 2016.
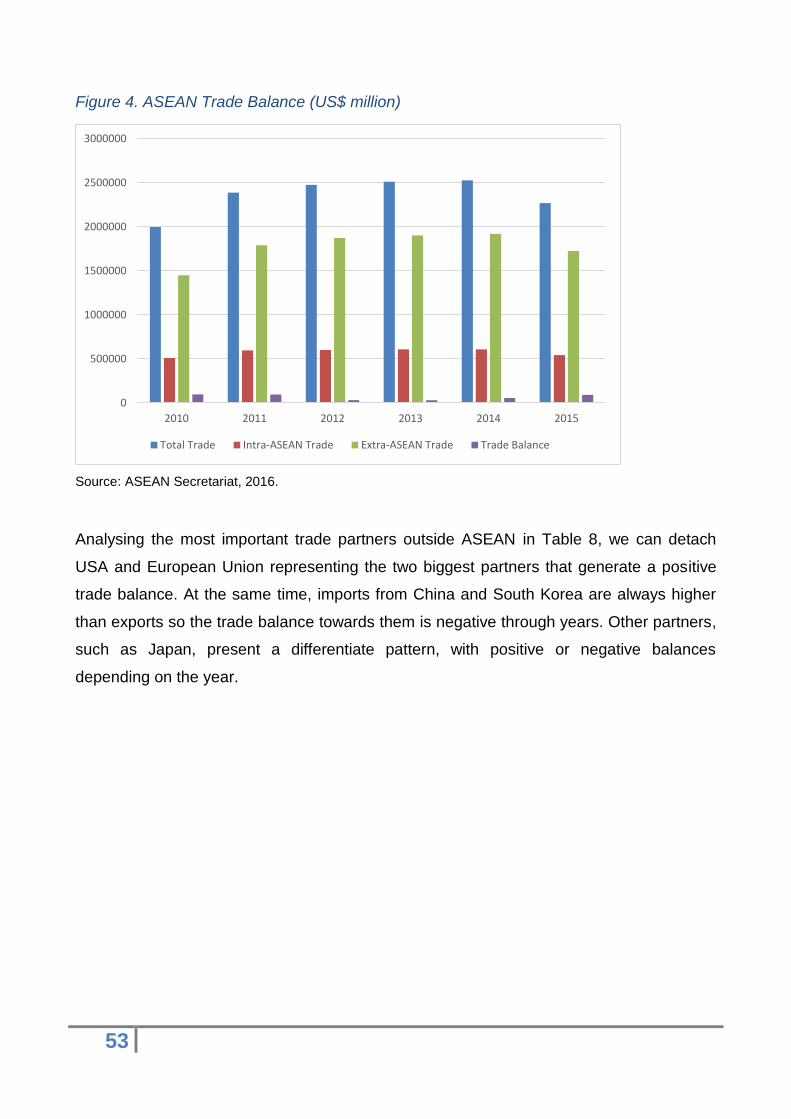
53
Figure 4. ASEAN Trade Balance (US$ million)
Source: ASEAN Secretariat, 2016.
Analysing the most important trade partners outside ASEAN in Table 8, we can detach
USA and European Union representing the two biggest partners that generate a positive
trade balance. At the same time, imports from China and South Korea are always higher
than exports so the trade balance towards them is negative through years. Other partners,
such as Japan, present a differentiate pattern, with positive or negative balances
depending on the year.
0
500000
1000000
1500000
2000000
2500000
3000000
2010 2011 2012 2013 2014 2015
Total Trade Intra-ASEAN Trade Extra-ASEAN Trade Trade Balance

54
Table 8. Trade Balance with Selected Partners
Unit/Scale 2010 2011 2012 2013 2014 2015
Japan US$ million -831 17,516 -9,870 4,959 11,406 -10,714
Trade balance
as % to exports
-0.8 12.0 -7.8 4.0 9.5 -9.4
USA US$ million 14,260 13,795 16,044 22,164 32,321 45,990
Trade balance
as % to exports
14.2 13.0 14.9 19.4 26.4 35.6
EU-28 US$ million 21,572 18,848 7,184 2,640 -1,841 27,474
Trade balance
as % to exports
18.7 14.9 5.8 2.1 -1.8 21.5
China US$ million -6,021 -24,953 -35,701 -45,417 -65,713 -77,592
Trade balance
as % to exports
-5.3 -19.6 -25.2 -29.8 -43.7 -57.9
South-
Korea
US$ million -8,666 -15,706 -20,970 -29,317 -28,191 -30,893
Trade balance
as % to exports
-19.3 -28.9 -38.1 -55.5 -54.6 -67.5
India US$ million 16,598 16,831 16,295 16,009 18,944 19,592
Trade balance
as % to exports
46.1 39.6 37 38.2 43.7 50.2
Canada US$ million 536 -183 818 1,028 1,785 2,139
Trade balance
as % to exports
10.3 -3.4 12.4 14.2 23.9 30.9
New
Zealand
US$ million 1,156 909 1,899 1,583 2,055 1,542
Trade balance
as % to exports
27.2 19.9 34.1 27.8 32.2 31.2
Russia US$ million -3,879 -8,610 -8,407 -9,463 -11,713 -5,403
Trade balance
as % to exports
-149.8 -323.8 -172.4 -180.5 -216.3 -135.4
Source: ASEAN Secretariat, 2016.
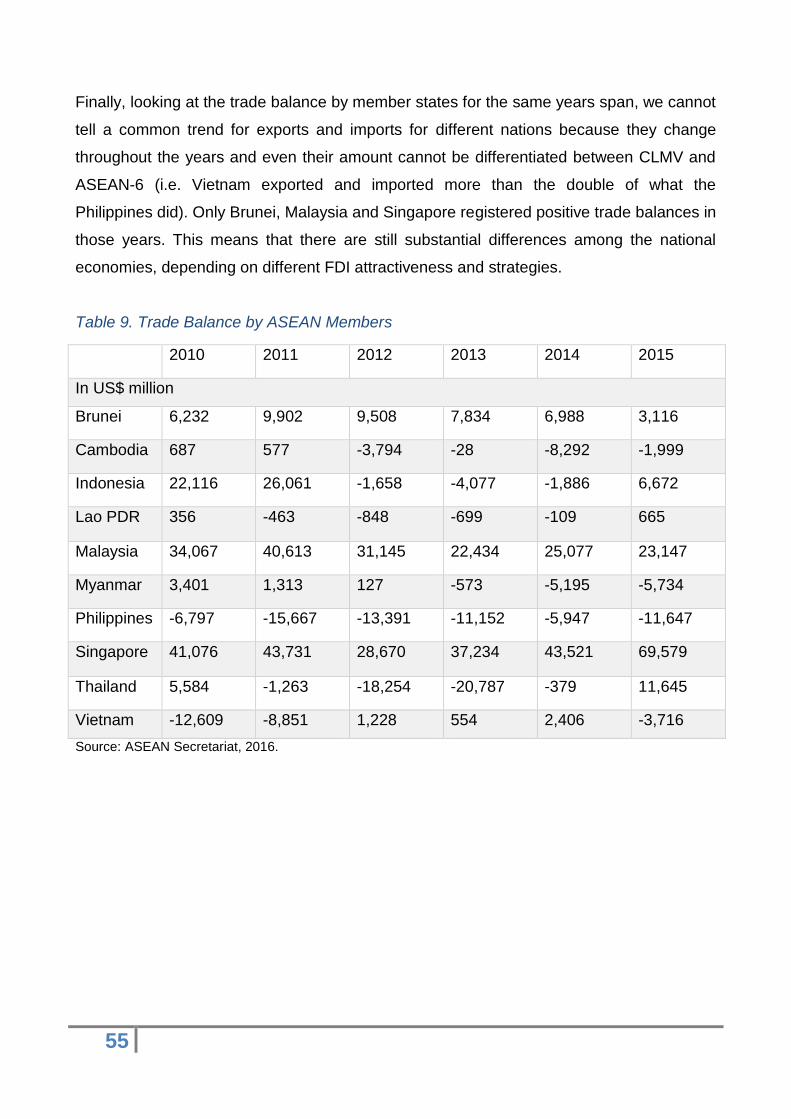
55
Finally, looking at the trade balance by member states for the same years span, we cannot
tell a common trend for exports and imports for different nations because they change
throughout the years and even their amount cannot be differentiated between CLMV and
ASEAN-6 (i.e. Vietnam exported and imported more than the double of what the
Philippines did). Only Brunei, Malaysia and Singapore registered positive trade balances in
those years. This means that there are still substantial differences among the national
economies, depending on different FDI attractiveness and strategies.
Table 9. Trade Balance by ASEAN Members
2010 2011 2012 2013 2014 2015
In US$ million
Brunei 6,232 9,902 9,508 7,834 6,988 3,116
Cambodia 687 577 -3,794 -28 -8,292 -1,999
Indonesia 22,116 26,061 -1,658 -4,077 -1,886 6,672
Lao PDR 356 -463 -848 -699 -109 665
Malaysia 34,067 40,613 31,145 22,434 25,077 23,147
Myanmar 3,401 1,313 127 -573 -5,195 -5,734
Philippines -6,797 -15,667 -13,391 -11,152 -5,947 -11,647
Singapore 41,076 43,731 28,670 37,234 43,521 69,579
Thailand 5,584 -1,263 -18,254 -20,787 -379 11,645
Vietnam -12,609 -8,851 1,228 554 2,406 -3,716
Source: ASEAN Secretariat, 2016.
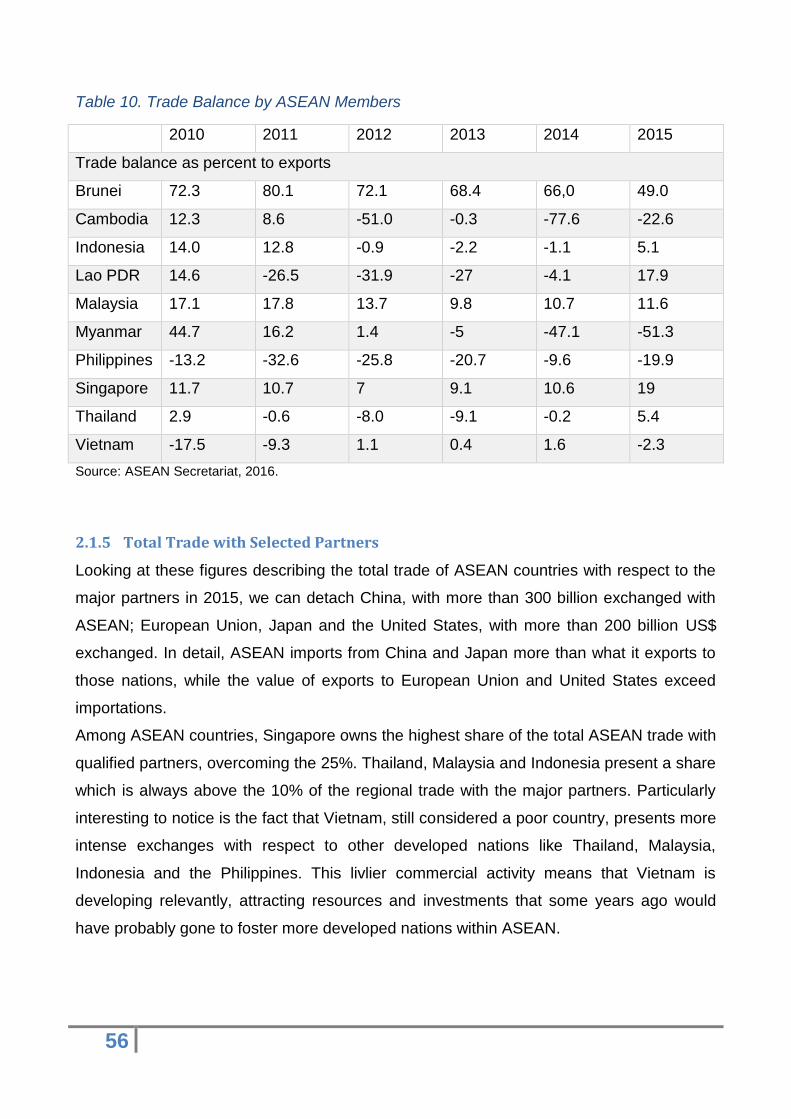
56
Table 10. Trade Balance by ASEAN Members
2010 2011 2012 2013 2014 2015
Trade balance as percent to exports
Brunei 72.3 80.1 72.1 68.4 66,0 49.0
Cambodia 12.3 8.6 -51.0 -0.3 -77.6 -22.6
Indonesia 14.0 12.8 -0.9 -2.2 -1.1 5.1
Lao PDR 14.6 -26.5 -31.9 -27 -4.1 17.9
Malaysia 17.1 17.8 13.7 9.8 10.7 11.6
Myanmar 44.7 16.2 1.4 -5 -47.1 -51.3
Philippines -13.2 -32.6 -25.8 -20.7 -9.6 -19.9
Singapore 11.7 10.7 7 9.1 10.6 19
Thailand 2.9 -0.6 -8.0 -9.1 -0.2 5.4
Vietnam -17.5 -9.3 1.1 0.4 1.6 -2.3
Source: ASEAN Secretariat, 2016.
2.1.5 Total Trade with Selected Partners
Looking at these figures describing the total trade of ASEAN countries with respect to the
major partners in 2015, we can detach China, with more than 300 billion exchanged with
ASEAN; European Union, Japan and the United States, with more than 200 billion US$
exchanged. In detail, ASEAN imports from China and Japan more than what it exports to
those nations, while the value of exports to European Union and United States exceed
importations.
Among ASEAN countries, Singapore owns the highest share of the total ASEAN trade with
qualified partners, overcoming the 25%. Thailand, Malaysia and Indonesia present a share
which is always above the 10% of the regional trade with the major partners. Particularly
interesting to notice is the fact that Vietnam, still considered a poor country, presents more
intense exchanges with respect to other developed nations like Thailand, Malaysia,
Indonesia and the Philippines. This livlier commercial activity means that Vietnam is
developing relevantly, attracting resources and investments that some years ago would
have probably gone to foster more developed nations within ASEAN.
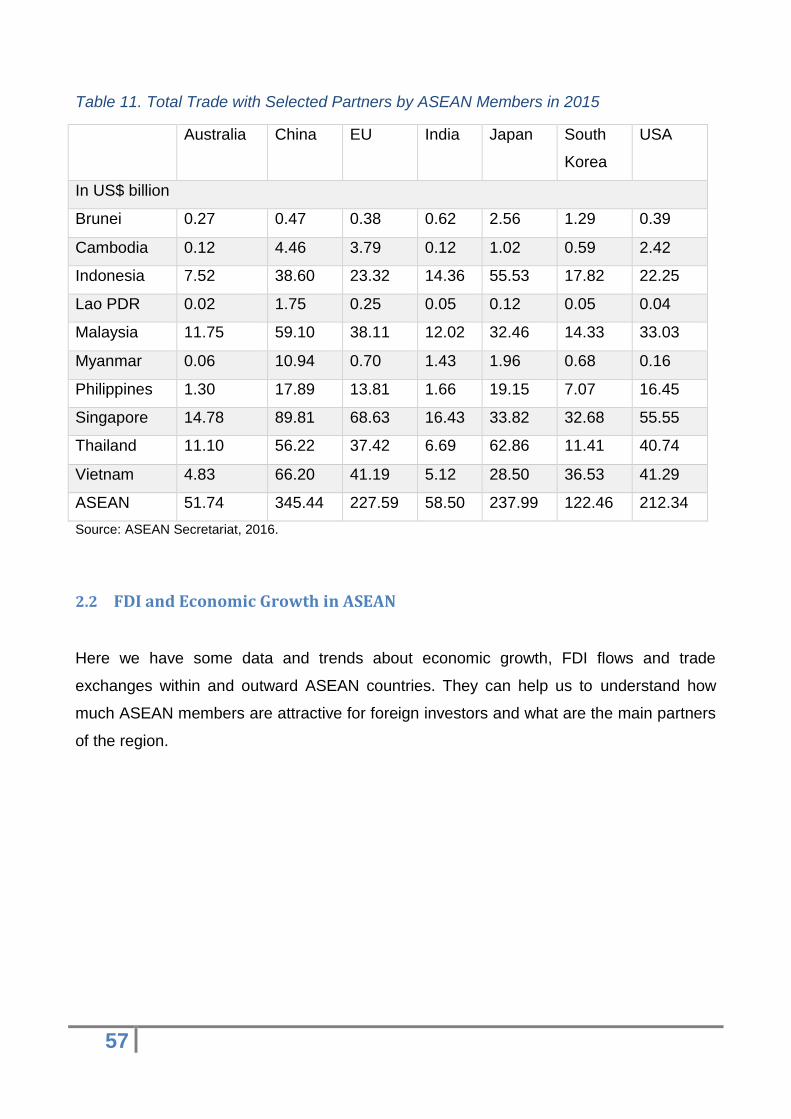
57
Table 11. Total Trade with Selected Partners by ASEAN Members in 2015
Australia China EU India Japan South
Korea
USA
In US$ billion
Brunei 0.27 0.47 0.38 0.62 2.56 1.29 0.39
Cambodia 0.12 4.46 3.79 0.12 1.02 0.59 2.42
Indonesia 7.52 38.60 23.32 14.36 55.53 17.82 22.25
Lao PDR 0.02 1.75 0.25 0.05 0.12 0.05 0.04
Malaysia 11.75 59.10 38.11 12.02 32.46 14.33 33.03
Myanmar 0.06 10.94 0.70 1.43 1.96 0.68 0.16
Philippines 1.30 17.89 13.81 1.66 19.15 7.07 16.45
Singapore 14.78 89.81 68.63 16.43 33.82 32.68 55.55
Thailand 11.10 56.22 37.42 6.69 62.86 11.41 40.74
Vietnam 4.83 66.20 41.19 5.12 28.50 36.53 41.29
ASEAN 51.74 345.44 227.59 58.50 237.99 122.46 212.34
Source: ASEAN Secretariat, 2016.
2.2 FDI and Economic Growth in ASEAN
Here we have some data and trends about economic growth, FDI flows and trade
exchanges within and outward ASEAN countries. They can help us to understand how
much ASEAN members are attractive for foreign investors and what are the main partners
of the region.
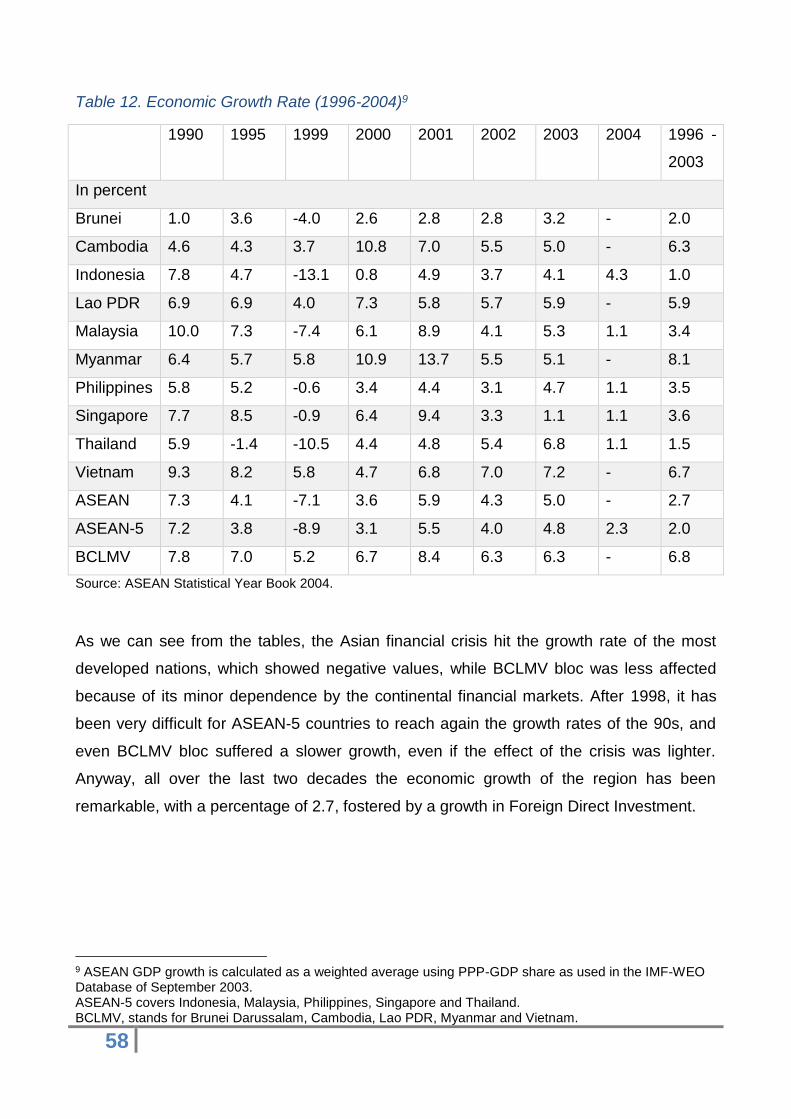
58
Table 12. Economic Growth Rate (1996-2004)9
1990 1995 1999 2000 2001 2002 2003 2004 1996 -
2003
In percent
Brunei 1.0 3.6 -4.0 2.6 2.8 2.8 3.2 - 2.0
Cambodia 4.6 4.3 3.7 10.8 7.0 5.5 5.0 - 6.3
Indonesia 7.8 4.7 -13.1 0.8 4.9 3.7 4.1 4.3 1.0
Lao PDR 6.9 6.9 4.0 7.3 5.8 5.7 5.9 - 5.9
Malaysia 10.0 7.3 -7.4 6.1 8.9 4.1 5.3 1.1 3.4
Myanmar 6.4 5.7 5.8 10.9 13.7 5.5 5.1 - 8.1
Philippines 5.8 5.2 -0.6 3.4 4.4 3.1 4.7 1.1 3.5
Singapore 7.7 8.5 -0.9 6.4 9.4 3.3 1.1 1.1 3.6
Thailand 5.9 -1.4 -10.5 4.4 4.8 5.4 6.8 1.1 1.5
Vietnam 9.3 8.2 5.8 4.7 6.8 7.0 7.2 - 6.7
ASEAN 7.3 4.1 -7.1 3.6 5.9 4.3 5.0 - 2.7
ASEAN-5 7.2 3.8 -8.9 3.1 5.5 4.0 4.8 2.3 2.0
BCLMV 7.8 7.0 5.2 6.7 8.4 6.3 6.3 - 6.8
Source: ASEAN Statistical Year Book 2004.
As we can see from the tables, the Asian financial crisis hit the growth rate of the most
developed nations, which showed negative values, while BCLMV bloc was less affected
because of its minor dependence by the continental financial markets. After 1998, it has
been very difficult for ASEAN-5 countries to reach again the growth rates of the 90s, and
even BCLMV bloc suffered a slower growth, even if the effect of the crisis was lighter.
Anyway, all over the last two decades the economic growth of the region has been
remarkable, with a percentage of 2.7, fostered by a growth in Foreign Direct Investment.
9 ASEAN GDP growth is calculated as a weighted average using PPP-GDP share as used in the IMF-WEO Database of September 2003. ASEAN-5 covers Indonesia, Malaysia, Philippines, Singapore and Thailand. BCLMV, stands for Brunei Darussalam, Cambodia, Lao PDR, Myanmar and Vietnam.
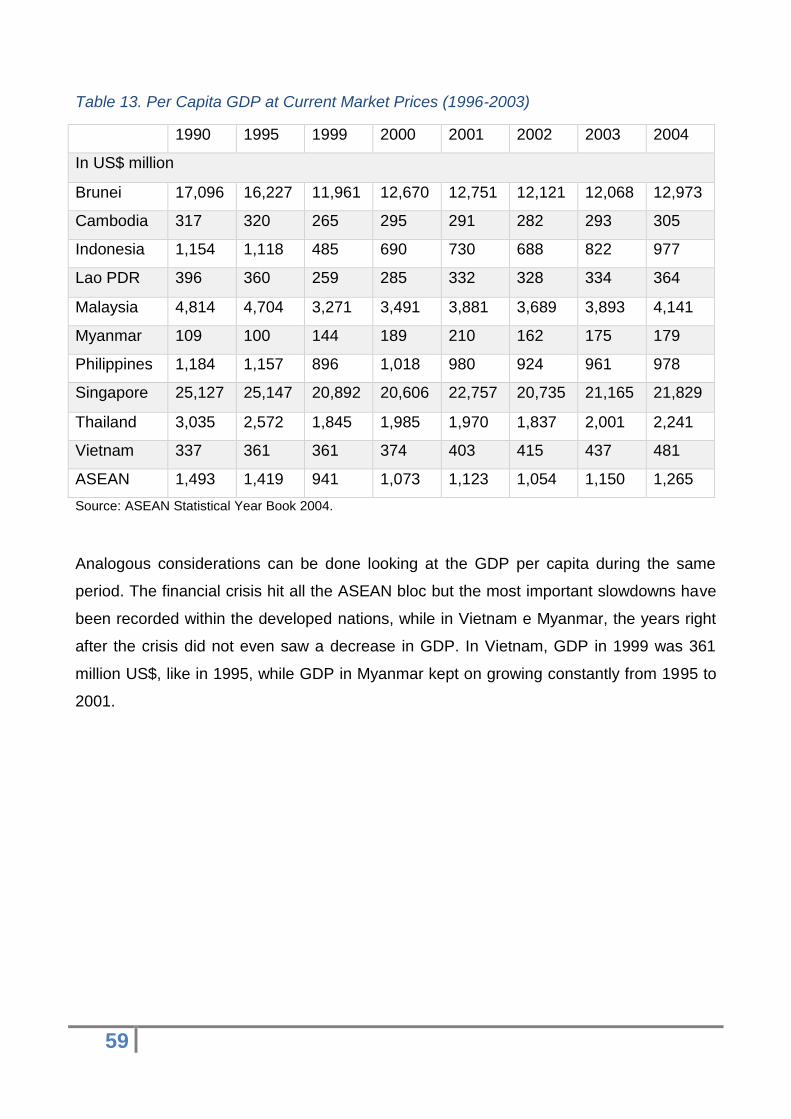
59
Table 13. Per Capita GDP at Current Market Prices (1996-2003)
1990 1995 1999 2000 2001 2002 2003 2004
In US$ million
Brunei 17,096 16,227 11,961 12,670 12,751 12,121 12,068 12,973
Cambodia 317 320 265 295 291 282 293 305
Indonesia 1,154 1,118 485 690 730 688 822 977
Lao PDR 396 360 259 285 332 328 334 364
Malaysia 4,814 4,704 3,271 3,491 3,881 3,689 3,893 4,141
Myanmar 109 100 144 189 210 162 175 179
Philippines 1,184 1,157 896 1,018 980 924 961 978
Singapore 25,127 25,147 20,892 20,606 22,757 20,735 21,165 21,829
Thailand 3,035 2,572 1,845 1,985 1,970 1,837 2,001 2,241
Vietnam 337 361 361 374 403 415 437 481
ASEAN 1,493 1,419 941 1,073 1,123 1,054 1,150 1,265
Source: ASEAN Statistical Year Book 2004.
Analogous considerations can be done looking at the GDP per capita during the same
period. The financial crisis hit all the ASEAN bloc but the most important slowdowns have
been recorded within the developed nations, while in Vietnam e Myanmar, the years right
after the crisis did not even saw a decrease in GDP. In Vietnam, GDP in 1999 was 361
million US$, like in 1995, while GDP in Myanmar kept on growing constantly from 1995 to
2001.
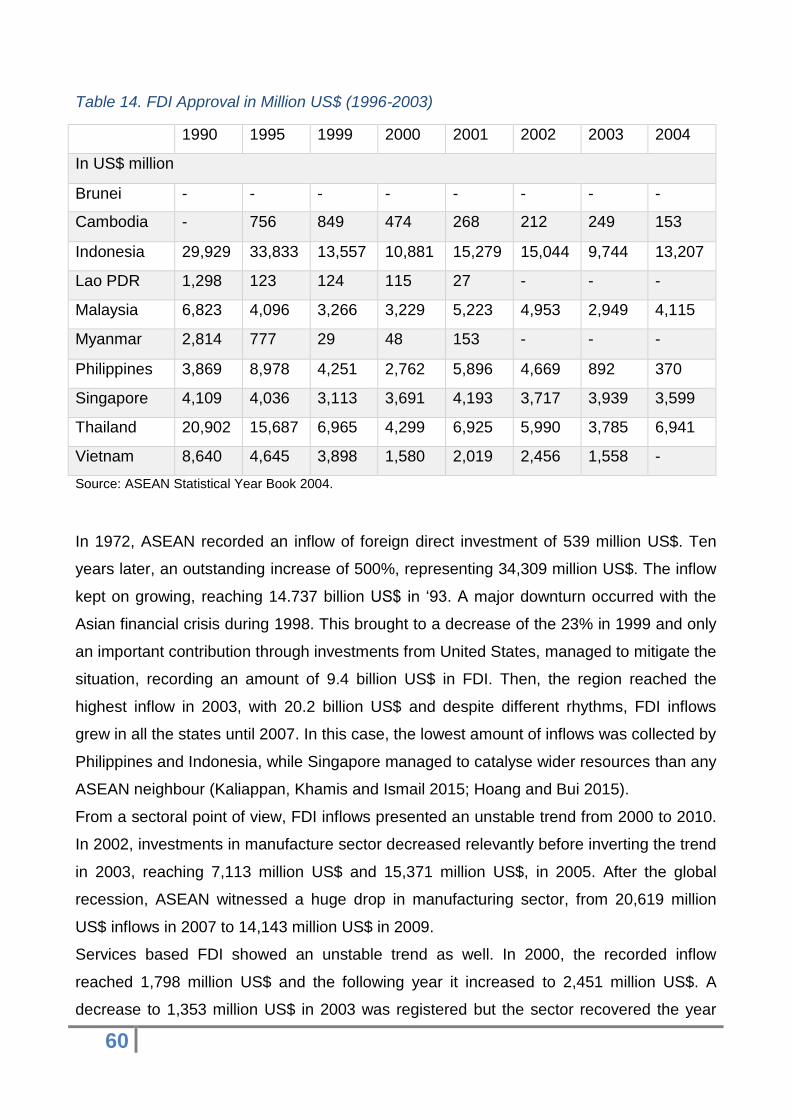
60
Table 14. FDI Approval in Million US$ (1996-2003)
1990 1995 1999 2000 2001 2002 2003 2004
In US$ million
Brunei - - - - - - - -
Cambodia - 756 849 474 268 212 249 153
Indonesia 29,929 33,833 13,557 10,881 15,279 15,044 9,744 13,207
Lao PDR 1,298 123 124 115 27 - - -
Malaysia 6,823 4,096 3,266 3,229 5,223 4,953 2,949 4,115
Myanmar 2,814 777 29 48 153 - - -
Philippines 3,869 8,978 4,251 2,762 5,896 4,669 892 370
Singapore 4,109 4,036 3,113 3,691 4,193 3,717 3,939 3,599
Thailand 20,902 15,687 6,965 4,299 6,925 5,990 3,785 6,941
Vietnam 8,640 4,645 3,898 1,580 2,019 2,456 1,558 -
Source: ASEAN Statistical Year Book 2004.
In 1972, ASEAN recorded an inflow of foreign direct investment of 539 million US$. Ten
years later, an outstanding increase of 500%, representing 34,309 million US$. The inflow
kept on growing, reaching 14.737 billion US$ in ‘93. A major downturn occurred with the
Asian financial crisis during 1998. This brought to a decrease of the 23% in 1999 and only
an important contribution through investments from United States, managed to mitigate the
situation, recording an amount of 9.4 billion US$ in FDI. Then, the region reached the
highest inflow in 2003, with 20.2 billion US$ and despite different rhythms, FDI inflows
grew in all the states until 2007. In this case, the lowest amount of inflows was collected by
Philippines and Indonesia, while Singapore managed to catalyse wider resources than any
ASEAN neighbour (Kaliappan, Khamis and Ismail 2015; Hoang and Bui 2015).
From a sectoral point of view, FDI inflows presented an unstable trend from 2000 to 2010.
In 2002, investments in manufacture sector decreased relevantly before inverting the trend
in 2003, reaching 7,113 million US$ and 15,371 million US$, in 2005. After the global
recession, ASEAN witnessed a huge drop in manufacturing sector, from 20,619 million
US$ inflows in 2007 to 14,143 million US$ in 2009.
Services based FDI showed an unstable trend as well. In 2000, the recorded inflow
reached 1,798 million US$ and the following year it increased to 2,451 million US$. A
decrease to 1,353 million US$ in 2003 was registered but the sector recovered the year
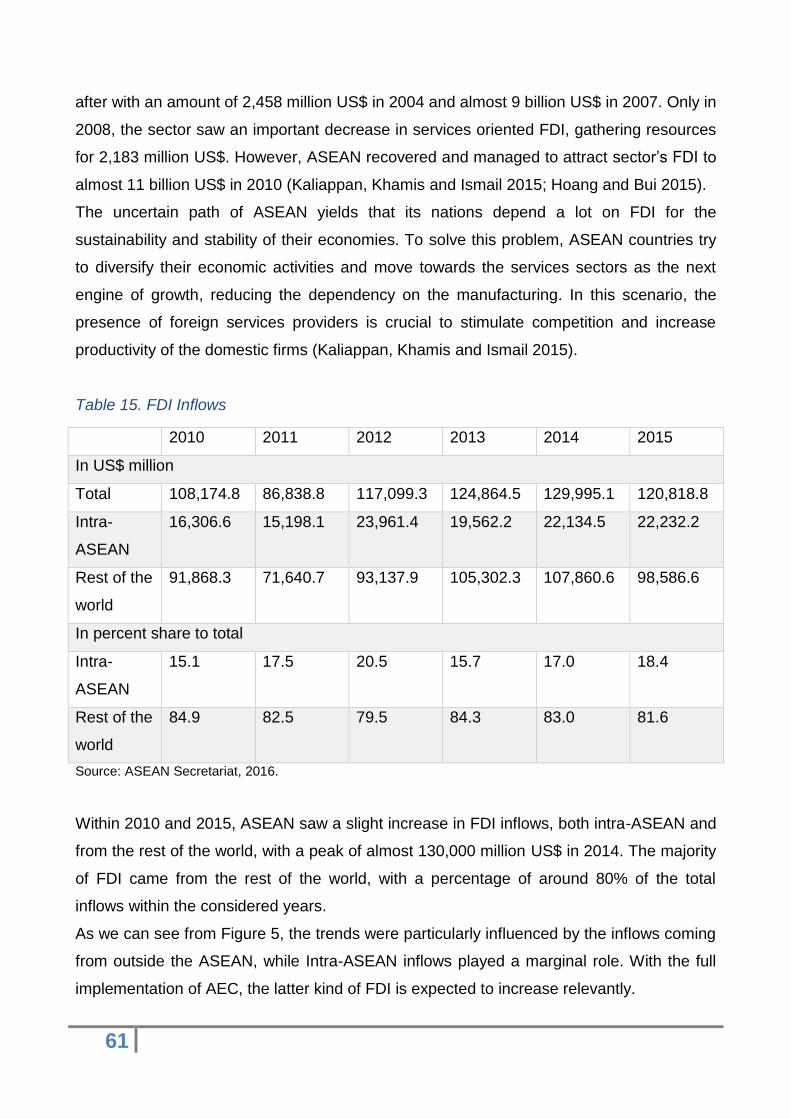
61
after with an amount of 2,458 million US$ in 2004 and almost 9 billion US$ in 2007. Only in
2008, the sector saw an important decrease in services oriented FDI, gathering resources
for 2,183 million US$. However, ASEAN recovered and managed to attract sector’s FDI to
almost 11 billion US$ in 2010 (Kaliappan, Khamis and Ismail 2015; Hoang and Bui 2015).
The uncertain path of ASEAN yields that its nations depend a lot on FDI for the
sustainability and stability of their economies. To solve this problem, ASEAN countries try
to diversify their economic activities and move towards the services sectors as the next
engine of growth, reducing the dependency on the manufacturing. In this scenario, the
presence of foreign services providers is crucial to stimulate competition and increase
productivity of the domestic firms (Kaliappan, Khamis and Ismail 2015).
Table 15. FDI Inflows
2010 2011 2012 2013 2014 2015
In US$ million
Total 108,174.8 86,838.8 117,099.3 124,864.5 129,995.1 120,818.8
Intra-
ASEAN
16,306.6 15,198.1 23,961.4 19,562.2 22,134.5 22,232.2
Rest of the
world
91,868.3 71,640.7 93,137.9 105,302.3 107,860.6 98,586.6
In percent share to total
Intra-
ASEAN
15.1 17.5 20.5 15.7 17.0 18.4
Rest of the
world
84.9 82.5 79.5 84.3 83.0 81.6
Source: ASEAN Secretariat, 2016.
Within 2010 and 2015, ASEAN saw a slight increase in FDI inflows, both intra-ASEAN and
from the rest of the world, with a peak of almost 130,000 million US$ in 2014. The majority
of FDI came from the rest of the world, with a percentage of around 80% of the total
inflows within the considered years.
As we can see from Figure 5, the trends were particularly influenced by the inflows coming
from outside the ASEAN, while Intra-ASEAN inflows played a marginal role. With the full
implementation of AEC, the latter kind of FDI is expected to increase relevantly.
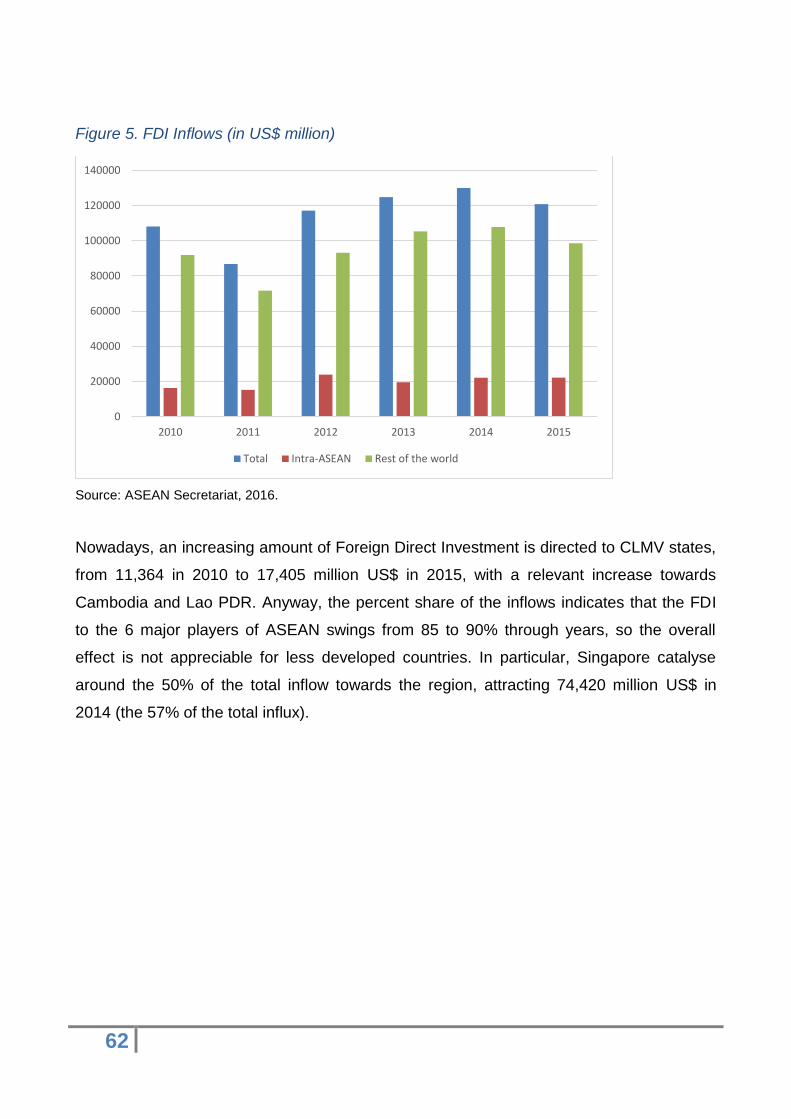
62
Figure 5. FDI Inflows (in US$ million)
Source: ASEAN Secretariat, 2016.
Nowadays, an increasing amount of Foreign Direct Investment is directed to CLMV states,
from 11,364 in 2010 to 17,405 million US$ in 2015, with a relevant increase towards
Cambodia and Lao PDR. Anyway, the percent share of the inflows indicates that the FDI
to the 6 major players of ASEAN swings from 85 to 90% through years, so the overall
effect is not appreciable for less developed countries. In particular, Singapore catalyse
around the 50% of the total inflow towards the region, attracting 74,420 million US$ in
2014 (the 57% of the total influx).
0
20000
40000
60000
80000
100000
120000
140000
2010 2011 2012 2013 2014 2015
Total Intra-ASEAN Rest of the world
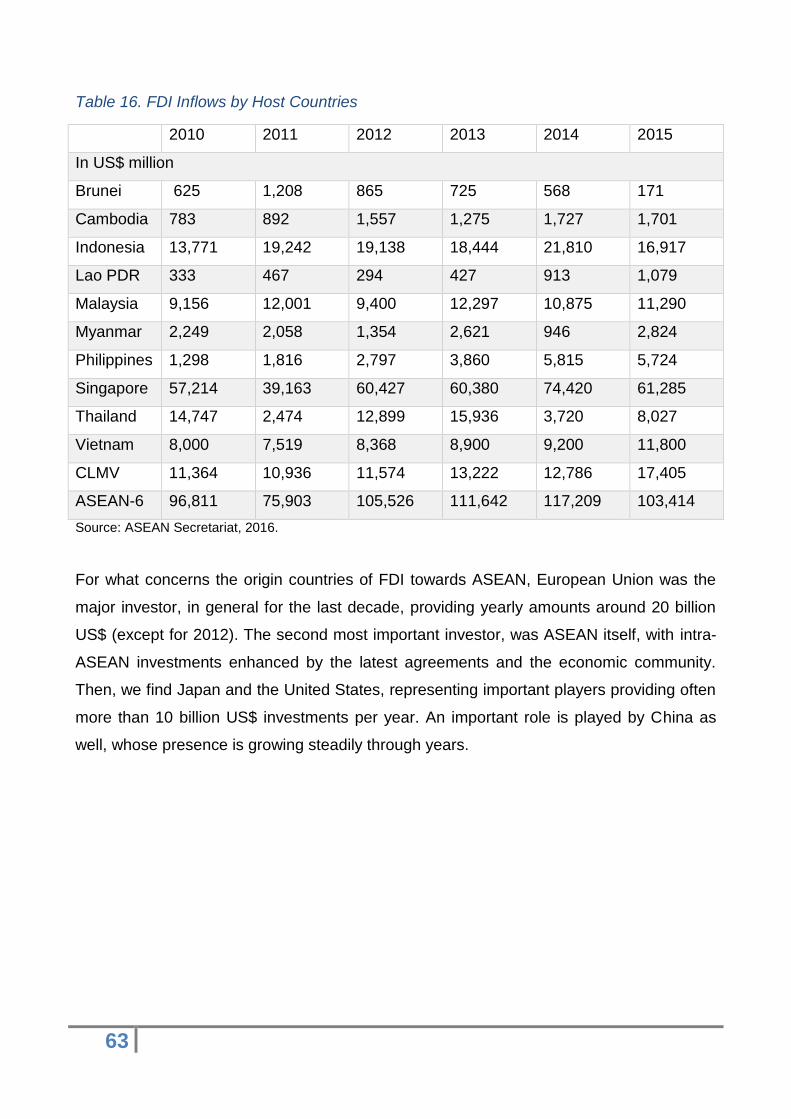
63
Table 16. FDI Inflows by Host Countries
2010 2011 2012 2013 2014 2015
In US$ million
Brunei 625 1,208 865 725 568 171
Cambodia 783 892 1,557 1,275 1,727 1,701
Indonesia 13,771 19,242 19,138 18,444 21,810 16,917
Lao PDR 333 467 294 427 913 1,079
Malaysia 9,156 12,001 9,400 12,297 10,875 11,290
Myanmar 2,249 2,058 1,354 2,621 946 2,824
Philippines 1,298 1,816 2,797 3,860 5,815 5,724
Singapore 57,214 39,163 60,427 60,380 74,420 61,285
Thailand 14,747 2,474 12,899 15,936 3,720 8,027
Vietnam 8,000 7,519 8,368 8,900 9,200 11,800
CLMV 11,364 10,936 11,574 13,222 12,786 17,405
ASEAN-6 96,811 75,903 105,526 111,642 117,209 103,414
Source: ASEAN Secretariat, 2016.
For what concerns the origin countries of FDI towards ASEAN, European Union was the
major investor, in general for the last decade, providing yearly amounts around 20 billion
US$ (except for 2012). The second most important investor, was ASEAN itself, with intra-
ASEAN investments enhanced by the latest agreements and the economic community.
Then, we find Japan and the United States, representing important players providing often
more than 10 billion US$ investments per year. An important role is played by China as
well, whose presence is growing steadily through years.
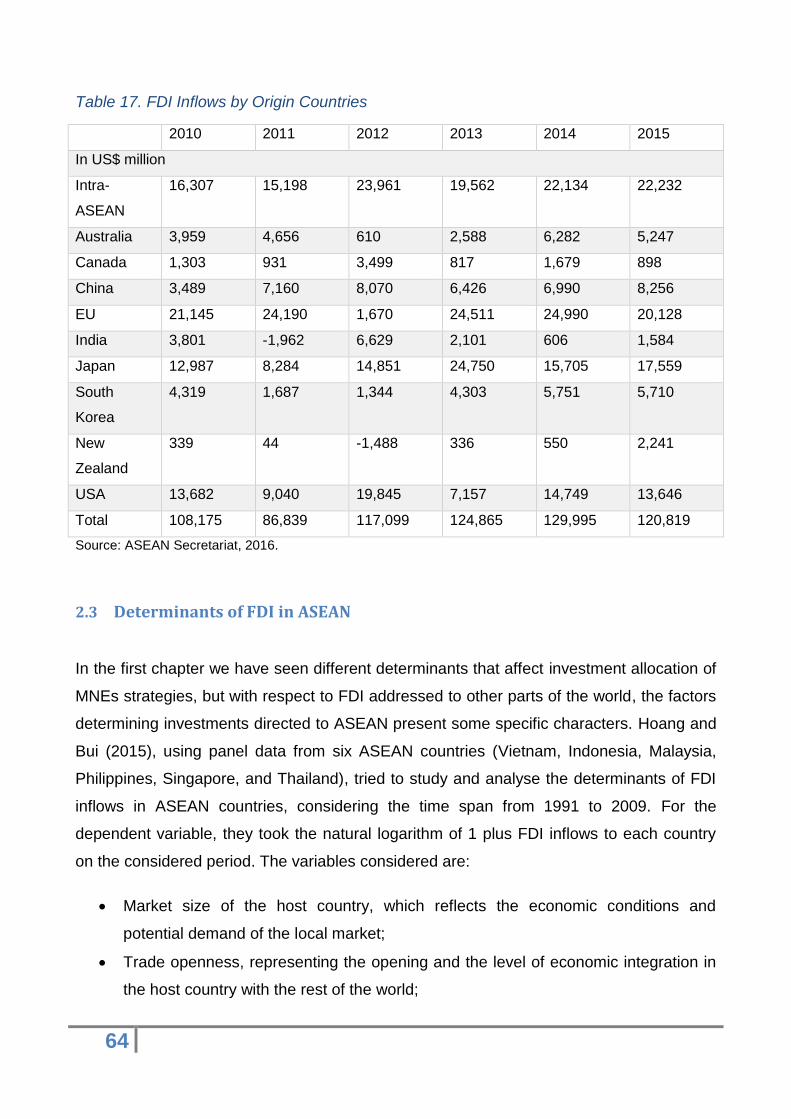
64
Table 17. FDI Inflows by Origin Countries
2010 2011 2012 2013 2014 2015
In US$ million
Intra-
ASEAN
16,307 15,198 23,961 19,562 22,134 22,232
Australia 3,959 4,656 610 2,588 6,282 5,247
Canada 1,303 931 3,499 817 1,679 898
China 3,489 7,160 8,070 6,426 6,990 8,256
EU 21,145 24,190 1,670 24,511 24,990 20,128
India 3,801 -1,962 6,629 2,101 606 1,584
Japan 12,987 8,284 14,851 24,750 15,705 17,559
South
Korea
4,319 1,687 1,344 4,303 5,751 5,710
New
Zealand
339 44 -1,488 336 550 2,241
USA 13,682 9,040 19,845 7,157 14,749 13,646
Total 108,175 86,839 117,099 124,865 129,995 120,819
Source: ASEAN Secretariat, 2016.
2.3 Determinants of FDI in ASEAN
In the first chapter we have seen different determinants that affect investment allocation of
MNEs strategies, but with respect to FDI addressed to other parts of the world, the factors
determining investments directed to ASEAN present some specific characters. Hoang and
Bui (2015), using panel data from six ASEAN countries (Vietnam, Indonesia, Malaysia,
Philippines, Singapore, and Thailand), tried to study and analyse the determinants of FDI
inflows in ASEAN countries, considering the time span from 1991 to 2009. For the
dependent variable, they took the natural logarithm of 1 plus FDI inflows to each country
on the considered period. The variables considered are:
Market size of the host country, which reflects the economic conditions and
potential demand of the local market;
Trade openness, representing the opening and the level of economic integration in
the host country with the rest of the world;
65
Labour cost, because it can directly influence the benefit for investors;
Interest rate because it reflects the cost of capital when investors want to use the
financial resources in the host country (the entry costs of production);
Labour productivity, that reflects the efficiency of labour in the economy;
Inflation rate, conceived as an indicator of macroeconomic instability;
Human Capital represents the quality of labour in host countries;
The financial development allows firms to get funding sources effectively;
Political stability which indicates the level of institutional quality and political risk;
Exchange rate, as a reflection of price competition.
The findings say that the size of the domestic market, the infrastructural development and
the degree of openness towards foreign trade are all aspects with helpful effects on FDI.
Real interest rates and exchange rate policies have an impact on FDI inflows, while the
degree of financial development and the inflation rate are not relevant from a statistical
point of view. Lastly, as we said in chapter 1, the institutional environment plays a crucial
role in affecting investment strategies. It is interesting to notice the influence of labour
components. The nominal cost of labour, the human capital and its productiveness have a
positive influence on FDI towards the region. This conclusion proposes that investors look
for skilled labour force and improved labour productivity rather than inexpensive nominal
labour costs.
These results from Hoang and Bui (2015) generate different policy consequences. First of
all, despite the importance of the domestic market dimensions, small ASEAN nations can
attract investment flows throughout the development of a better institutional environment.
A lower level of corruption and political stability are the two best manners to reduce the
risks and the uncertainty for foreign investors. Furthermore, they can also drag some
market exploration FDI by way of regional integration. This is why these countries are
trying to tighten the connections with neighbouring markets.
The findings also say that the underdeveloped ASEAN members, gathering small volumes
of FDI, must accelerate trade liberalisation, infrastructure development and regional
integration through the ASEAN contribution. Moreover, a weaker national currency with
respect to the U.S. dollar must be exploited efficiently for higher levels of export and FDI
inflows. Finally, a cheap labour force does not necessarily attract resources, because
66
investors require a certain level of labour productivity, therefore ASEAN nations should
concentrate on human capital development.
Ismail (2009) provided similar results, finding out that besides the market dimension, other
features like common borders and languages, macroeconomic factors such as lower
inflation rate, slightly higher exchange rate and good management of public resources are
among the key reasons which are able to catalyse investors’ attention. In addition to
economic factors like efficient telecommunication and infrastructure provisions, non-
economic and social factors, i.e. transparency and welfare policies aimed at empowering
people development, can gather higher FDI to the ASEAN as well.
2.3.1 FDI Determinants of Service Sector in ASEAN
Further peculiarities belong specifically to the determinants of FDI directed to service
sectors in ASEAN. Kaliappan, Khamis and Ismail (2015) investigated them using a static
linear panel data analysis, transforming all the variables into the natural logarithm. The
data for the empirical estimation cover the years from 2000 until 2010. The set of
considered dependent variables are market size, trade openness, inflation, human capital
and infrastructures for all the nations of ASEAN region. Their findings indicate that the
inflow of services FDI to ASEAN countries is positively determined by market size, trade
openness, human capital and infrastructure. Opposite, the relationship between
macroeconomic stability (indicated by inflation) and services FDI is found to be slightly
negative and insignificant.
The relationship between market size and services FDI can be explained by looking at the
motivations of FDI to the host country, which can be market-oriented FDI, or non-market
oriented FDI. Services-based FDI is more about market seeking FDI rather than an export-
oriented type of investment. Thus, many services based multinational firms established
their operations in foreign location because of the simultaneity requirement in production
and consumption of services. This means that a country with a large market size is likelier
to attract more services FDI inflows (Kaliappan, Khamis and Ismail 2015).
The significance of trade openness or the implementation of a liberal trade policy have
been observed in the case of ASEAN countries, where several nations abandoned import
substitution trade strategies in favour of a more open international trading regime in the
1980s. This initiative produced a positive outcome for most of the ASEAN countries,
67
especially, Indonesia, Thailand, Malaysia and Singapore which managed to attract a
substantial amount of foreign investment.
Host economies with relatively high level of human capital attract large amounts of FDI.
This argument applies to services based FDI and services sector as well. The supply of
many services requires physical interaction between individuals. Thus, skilled work force is
important to deal with different customers in services industries. The importance of
infrastructure integrating markets across nations, especially through the inflows of FDI, is
fundamental and their absences discourage foreign investors as it increases transaction
costs. In fact, foreign investors’ efficient operation depends highly on reliable utilities,
telecommunication system and infrastructure (Kaliappan, Khamis and Ismail 2015).
2.4 FDI Restrictiveness Index in ASEAN
As already mentioned, while ASEAN institutions act like one entity, pursuing benefits for
ASEAN countries as a whole community, among national regulations about FDI and its
treatments we can see important differences. Specifically, important differences are visible
in diverse degrees of openness toward foreign investments, and even in the way tax rates
affect investors in their strategic choices. Let us see how FDI restrictiveness could provide
useful information about national policymakers in ASEAN region. Thangavelu, in 2015,
provided some studies over FDI restrictiveness in ASEAN setting an index made up of six
areas:
national treatment;
market access or foreign ownership;
management and board of directors’ composition;
screening and approval procedure;
movement of investors;
performance requirements.
The results show that the liberalisation of the manufacturing sector is still possible in states
like Thailand and Vietnam. Furthermore, the findings show how services sector is not
keeping the pace of the manufacture in terms of liberalisation for multinational activities.
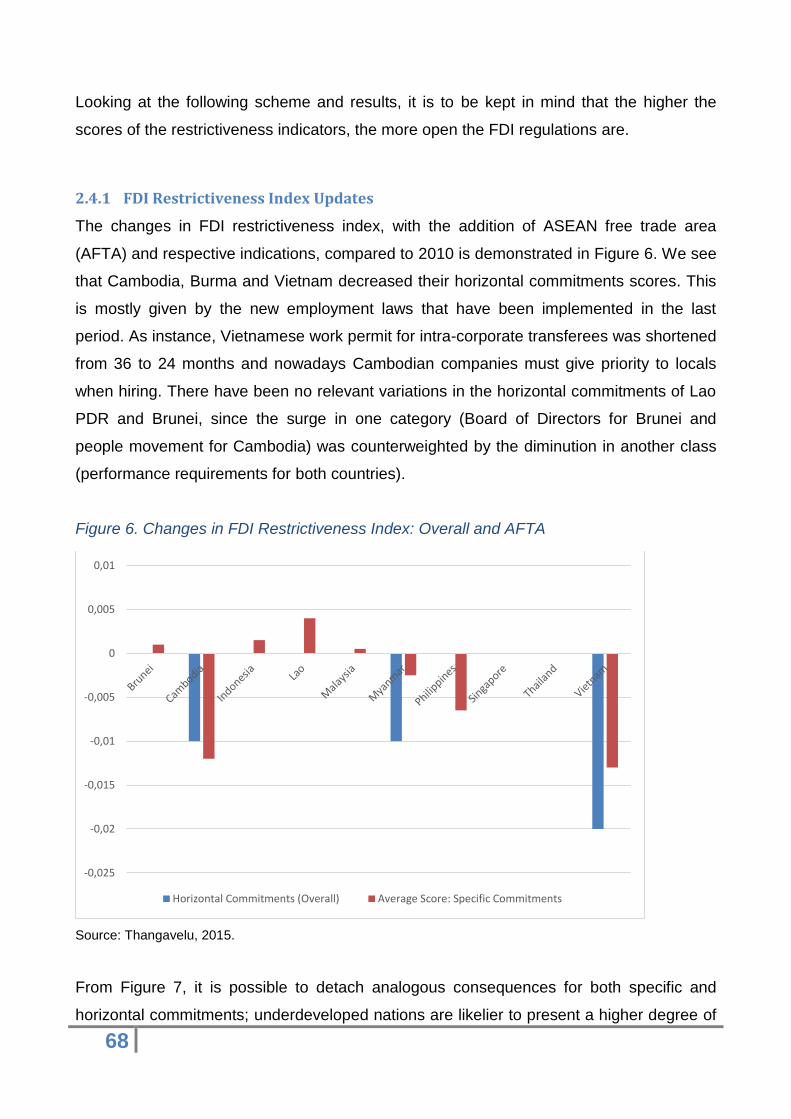
68
Looking at the following scheme and results, it is to be kept in mind that the higher the
scores of the restrictiveness indicators, the more open the FDI regulations are.
2.4.1 FDI Restrictiveness Index Updates
The changes in FDI restrictiveness index, with the addition of ASEAN free trade area
(AFTA) and respective indications, compared to 2010 is demonstrated in Figure 6. We see
that Cambodia, Burma and Vietnam decreased their horizontal commitments scores. This
is mostly given by the new employment laws that have been implemented in the last
period. As instance, Vietnamese work permit for intra-corporate transferees was shortened
from 36 to 24 months and nowadays Cambodian companies must give priority to locals
when hiring. There have been no relevant variations in the horizontal commitments of Lao
PDR and Brunei, since the surge in one category (Board of Directors for Brunei and
people movement for Cambodia) was counterweighted by the diminution in another class
(performance requirements for both countries).
Figure 6. Changes in FDI Restrictiveness Index: Overall and AFTA
Source: Thangavelu, 2015.
From Figure 7, it is possible to detach analogous consequences for both specific and
horizontal commitments; underdeveloped nations are likelier to present a higher degree of
-0,025
-0,02
-0,015
-0,01
-0,005
0
0,005
0,01
Horizontal Commitments (Overall) Average Score: Specific Commitments
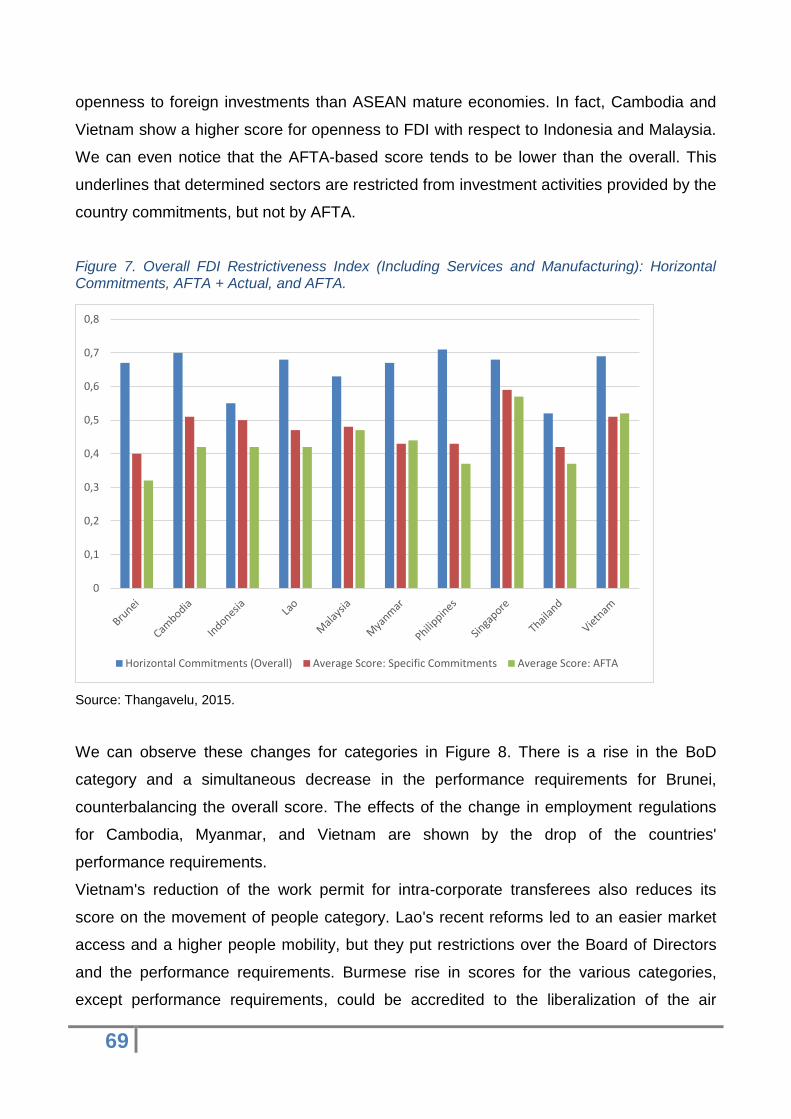
69
openness to foreign investments than ASEAN mature economies. In fact, Cambodia and
Vietnam show a higher score for openness to FDI with respect to Indonesia and Malaysia.
We can even notice that the AFTA-based score tends to be lower than the overall. This
underlines that determined sectors are restricted from investment activities provided by the
country commitments, but not by AFTA.
Figure 7. Overall FDI Restrictiveness Index (Including Services and Manufacturing): Horizontal Commitments, AFTA + Actual, and AFTA.
Source: Thangavelu, 2015.
We can observe these changes for categories in Figure 8. There is a rise in the BoD
category and a simultaneous decrease in the performance requirements for Brunei,
counterbalancing the overall score. The effects of the change in employment regulations
for Cambodia, Myanmar, and Vietnam are shown by the drop of the countries'
performance requirements.
Vietnam's reduction of the work permit for intra-corporate transferees also reduces its
score on the movement of people category. Lao's recent reforms led to an easier market
access and a higher people mobility, but they put restrictions over the Board of Directors
and the performance requirements. Burmese rise in scores for the various categories,
except performance requirements, could be accredited to the liberalization of the air
0
0,1
0,2
0,3
0,4
0,5
0,6
0,7
0,8
Horizontal Commitments (Overall) Average Score: Specific Commitments Average Score: AFTA
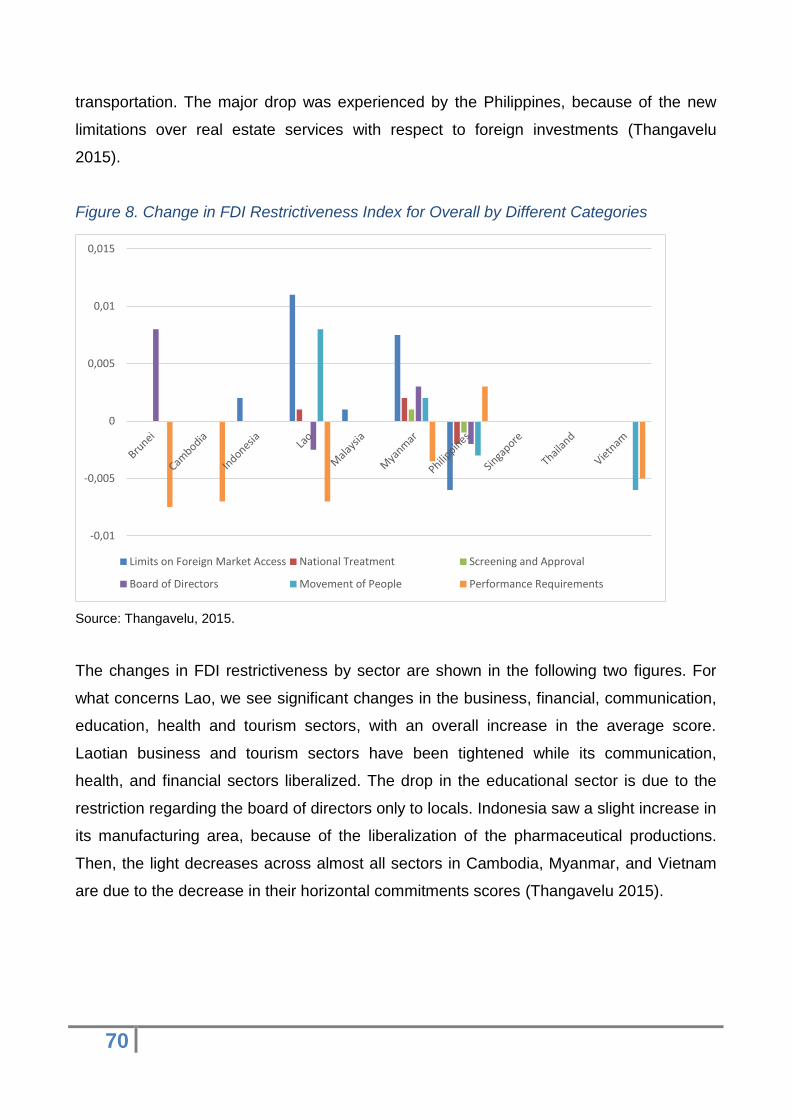
70
transportation. The major drop was experienced by the Philippines, because of the new
limitations over real estate services with respect to foreign investments (Thangavelu
2015).
Figure 8. Change in FDI Restrictiveness Index for Overall by Different Categories
Source: Thangavelu, 2015.
The changes in FDI restrictiveness by sector are shown in the following two figures. For
what concerns Lao, we see significant changes in the business, financial, communication,
education, health and tourism sectors, with an overall increase in the average score.
Laotian business and tourism sectors have been tightened while its communication,
health, and financial sectors liberalized. The drop in the educational sector is due to the
restriction regarding the board of directors only to locals. Indonesia saw a slight increase in
its manufacturing area, because of the liberalization of the pharmaceutical productions.
Then, the light decreases across almost all sectors in Cambodia, Myanmar, and Vietnam
are due to the decrease in their horizontal commitments scores (Thangavelu 2015).
-0,01
-0,005
0
0,005
0,01
0,015
Limits on Foreign Market Access National Treatment Screening and Approval
Board of Directors Movement of People Performance Requirements
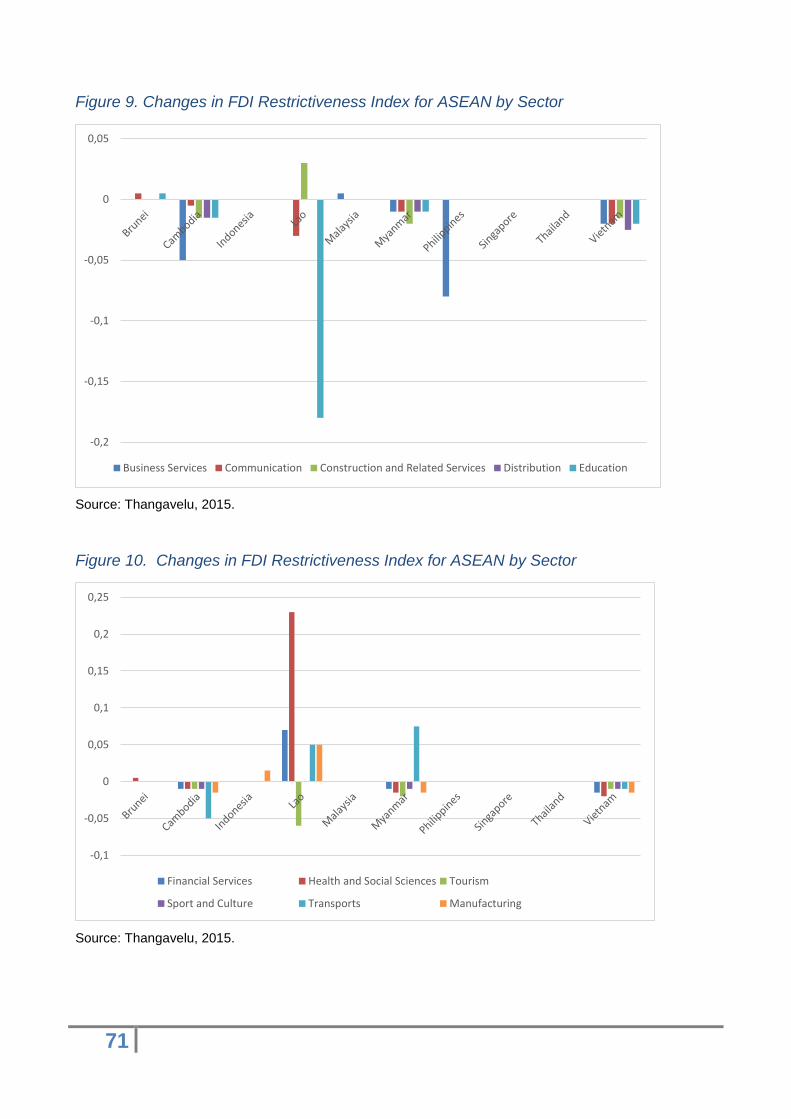
71
Figure 9. Changes in FDI Restrictiveness Index for ASEAN by Sector
Source: Thangavelu, 2015.
Figure 10. Changes in FDI Restrictiveness Index for ASEAN by Sector
Source: Thangavelu, 2015.
-0,2
-0,15
-0,1
-0,05
0
0,05
Business Services Communication Construction and Related Services Distribution Education
-0,1
-0,05
0
0,05
0,1
0,15
0,2
0,25
Financial Services Health and Social Sciences Tourism
Sport and Culture Transports Manufacturing
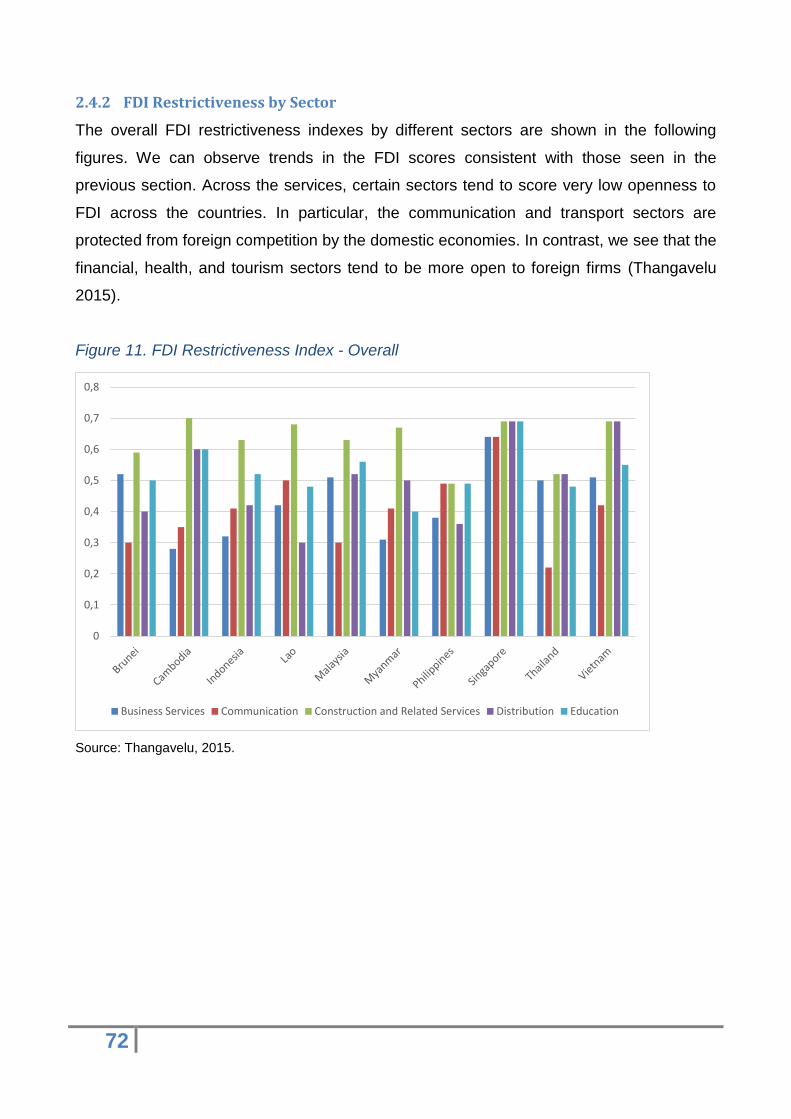
72
2.4.2 FDI Restrictiveness by Sector
The overall FDI restrictiveness indexes by different sectors are shown in the following
figures. We can observe trends in the FDI scores consistent with those seen in the
previous section. Across the services, certain sectors tend to score very low openness to
FDI across the countries. In particular, the communication and transport sectors are
protected from foreign competition by the domestic economies. In contrast, we see that the
financial, health, and tourism sectors tend to be more open to foreign firms (Thangavelu
2015).
Figure 11. FDI Restrictiveness Index - Overall
Source: Thangavelu, 2015.
0
0,1
0,2
0,3
0,4
0,5
0,6
0,7
0,8
Business Services Communication Construction and Related Services Distribution Education
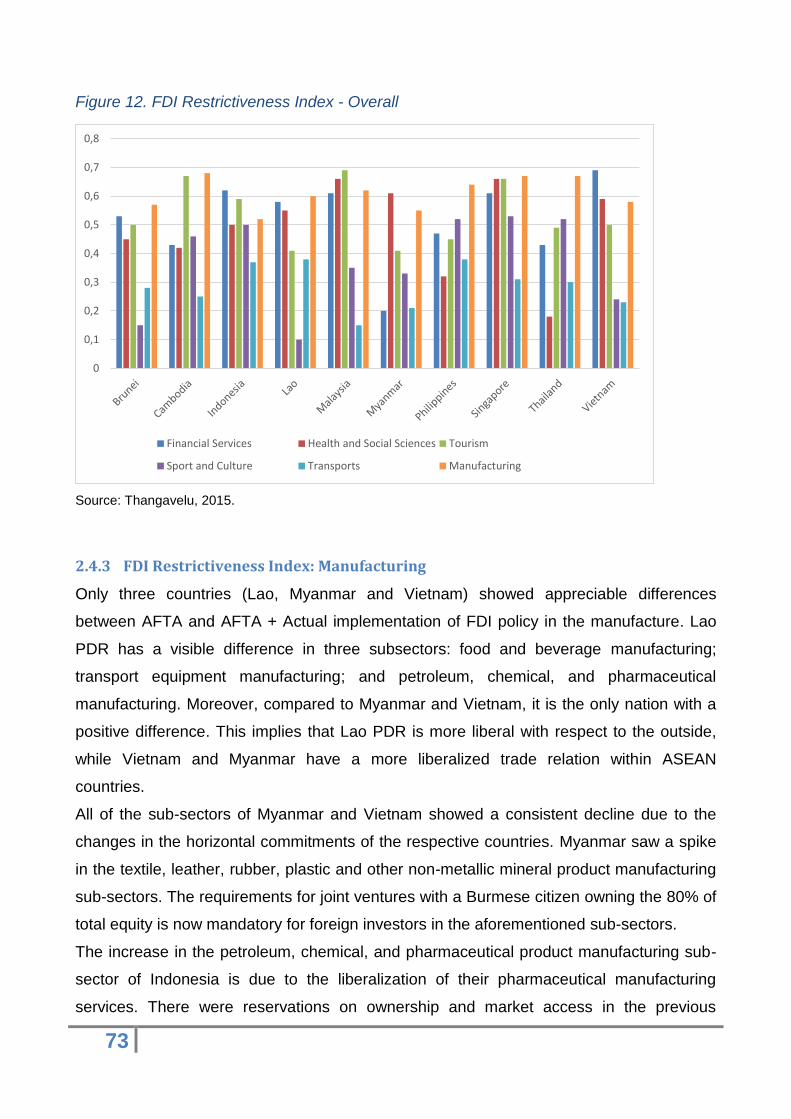
73
Figure 12. FDI Restrictiveness Index - Overall
Source: Thangavelu, 2015.
2.4.3 FDI Restrictiveness Index: Manufacturing
Only three countries (Lao, Myanmar and Vietnam) showed appreciable differences
between AFTA and AFTA + Actual implementation of FDI policy in the manufacture. Lao
PDR has a visible difference in three subsectors: food and beverage manufacturing;
transport equipment manufacturing; and petroleum, chemical, and pharmaceutical
manufacturing. Moreover, compared to Myanmar and Vietnam, it is the only nation with a
positive difference. This implies that Lao PDR is more liberal with respect to the outside,
while Vietnam and Myanmar have a more liberalized trade relation within ASEAN
countries.
All of the sub-sectors of Myanmar and Vietnam showed a consistent decline due to the
changes in the horizontal commitments of the respective countries. Myanmar saw a spike
in the textile, leather, rubber, plastic and other non-metallic mineral product manufacturing
sub-sectors. The requirements for joint ventures with a Burmese citizen owning the 80% of
total equity is now mandatory for foreign investors in the aforementioned sub-sectors.
The increase in the petroleum, chemical, and pharmaceutical product manufacturing sub-
sector of Indonesia is due to the liberalization of their pharmaceutical manufacturing
services. There were reservations on ownership and market access in the previous
0
0,1
0,2
0,3
0,4
0,5
0,6
0,7
0,8
Financial Services Health and Social Sciences Tourism
Sport and Culture Transports Manufacturing
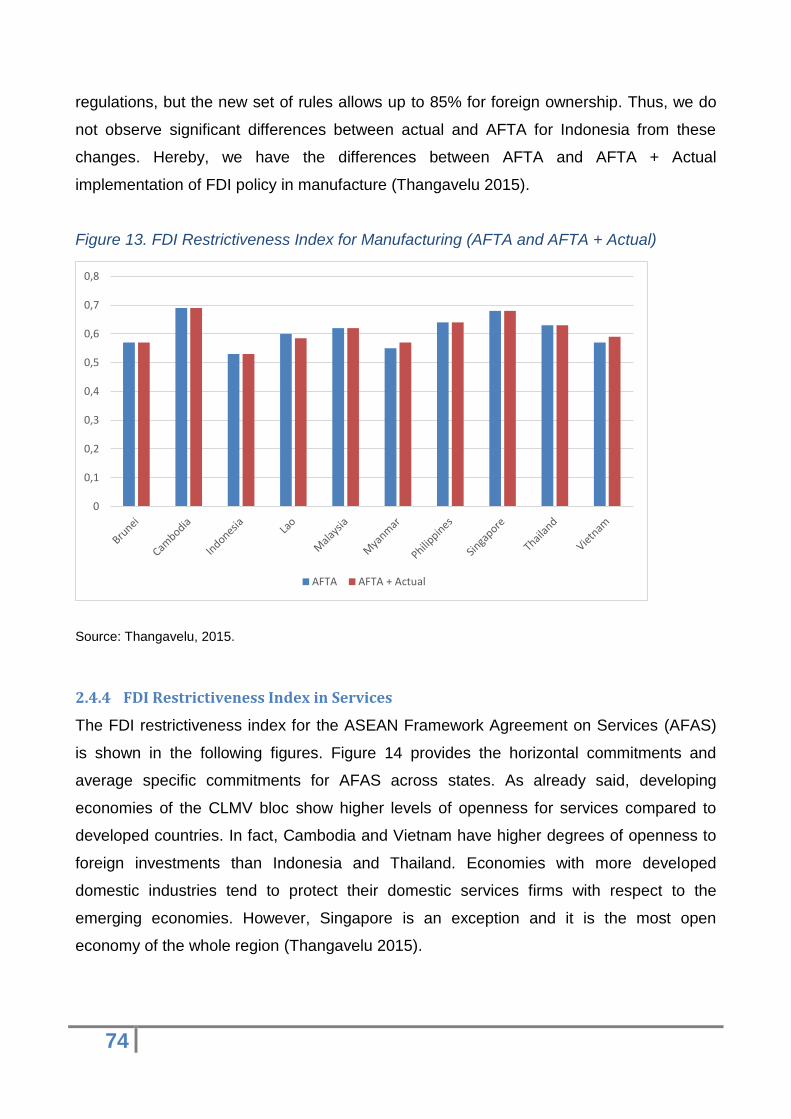
74
regulations, but the new set of rules allows up to 85% for foreign ownership. Thus, we do
not observe significant differences between actual and AFTA for Indonesia from these
changes. Hereby, we have the differences between AFTA and AFTA + Actual
implementation of FDI policy in manufacture (Thangavelu 2015).
Figure 13. FDI Restrictiveness Index for Manufacturing (AFTA and AFTA + Actual)
Source: Thangavelu, 2015.
2.4.4 FDI Restrictiveness Index in Services
The FDI restrictiveness index for the ASEAN Framework Agreement on Services (AFAS)
is shown in the following figures. Figure 14 provides the horizontal commitments and
average specific commitments for AFAS across states. As already said, developing
economies of the CLMV bloc show higher levels of openness for services compared to
developed countries. In fact, Cambodia and Vietnam have higher degrees of openness to
foreign investments than Indonesia and Thailand. Economies with more developed
domestic industries tend to protect their domestic services firms with respect to the
emerging economies. However, Singapore is an exception and it is the most open
economy of the whole region (Thangavelu 2015).
0
0,1
0,2
0,3
0,4
0,5
0,6
0,7
0,8
AFTA AFTA + Actual
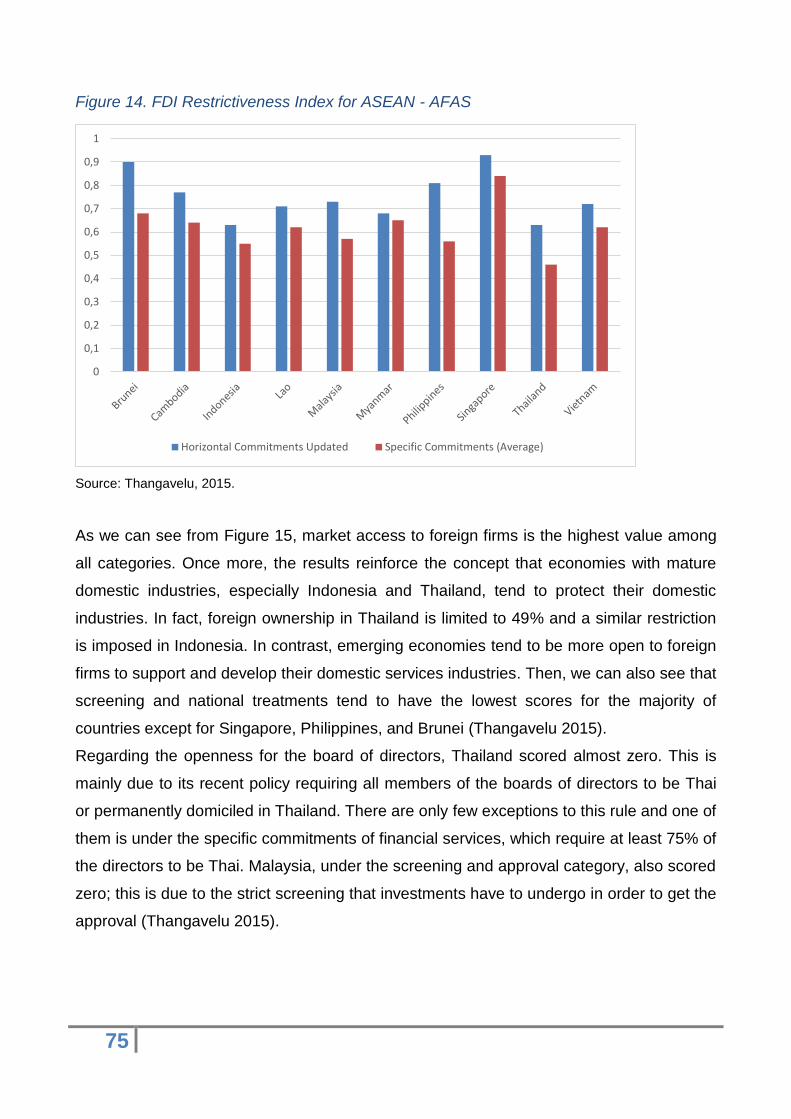
75
Figure 14. FDI Restrictiveness Index for ASEAN - AFAS
Source: Thangavelu, 2015.
As we can see from Figure 15, market access to foreign firms is the highest value among
all categories. Once more, the results reinforce the concept that economies with mature
domestic industries, especially Indonesia and Thailand, tend to protect their domestic
industries. In fact, foreign ownership in Thailand is limited to 49% and a similar restriction
is imposed in Indonesia. In contrast, emerging economies tend to be more open to foreign
firms to support and develop their domestic services industries. Then, we can also see that
screening and national treatments tend to have the lowest scores for the majority of
countries except for Singapore, Philippines, and Brunei (Thangavelu 2015).
Regarding the openness for the board of directors, Thailand scored almost zero. This is
mainly due to its recent policy requiring all members of the boards of directors to be Thai
or permanently domiciled in Thailand. There are only few exceptions to this rule and one of
them is under the specific commitments of financial services, which require at least 75% of
the directors to be Thai. Malaysia, under the screening and approval category, also scored
zero; this is due to the strict screening that investments have to undergo in order to get the
approval (Thangavelu 2015).
0
0,1
0,2
0,3
0,4
0,5
0,6
0,7
0,8
0,9
1
Horizontal Commitments Updated Specific Commitments (Average)
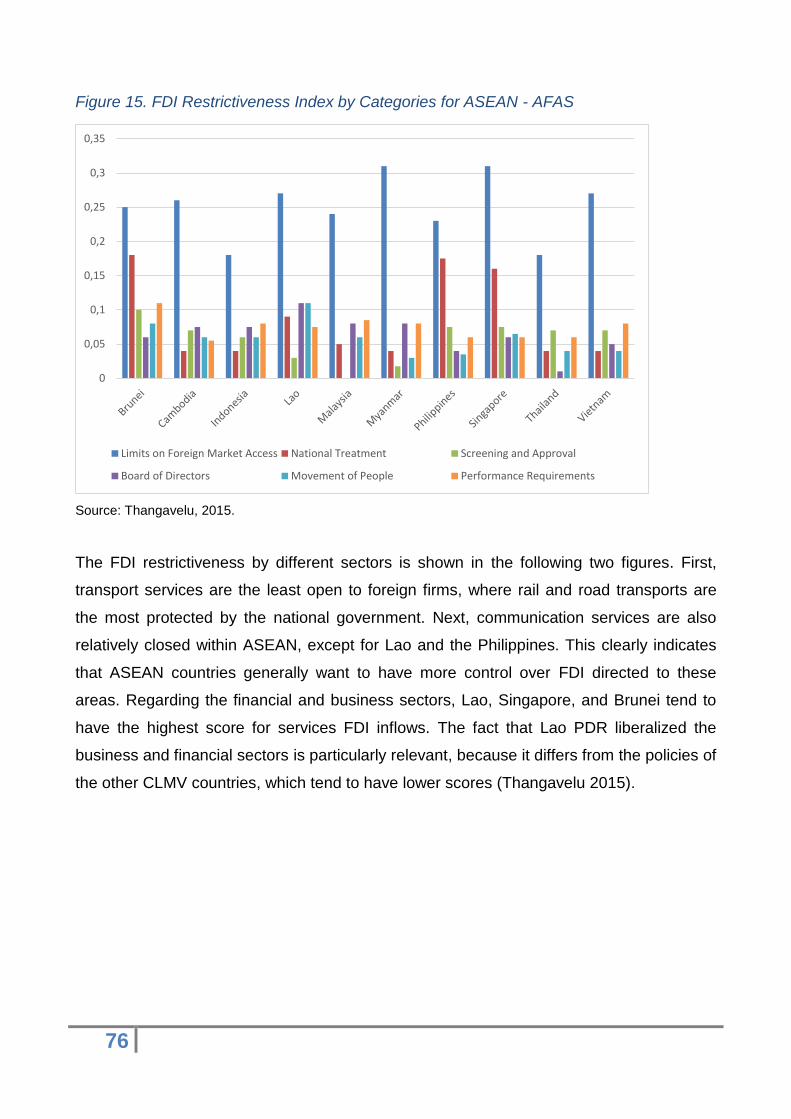
76
Figure 15. FDI Restrictiveness Index by Categories for ASEAN - AFAS
Source: Thangavelu, 2015.
The FDI restrictiveness by different sectors is shown in the following two figures. First,
transport services are the least open to foreign firms, where rail and road transports are
the most protected by the national government. Next, communication services are also
relatively closed within ASEAN, except for Lao and the Philippines. This clearly indicates
that ASEAN countries generally want to have more control over FDI directed to these
areas. Regarding the financial and business sectors, Lao, Singapore, and Brunei tend to
have the highest score for services FDI inflows. The fact that Lao PDR liberalized the
business and financial sectors is particularly relevant, because it differs from the policies of
the other CLMV countries, which tend to have lower scores (Thangavelu 2015).
0
0,05
0,1
0,15
0,2
0,25
0,3
0,35
Limits on Foreign Market Access National Treatment Screening and Approval
Board of Directors Movement of People Performance Requirements
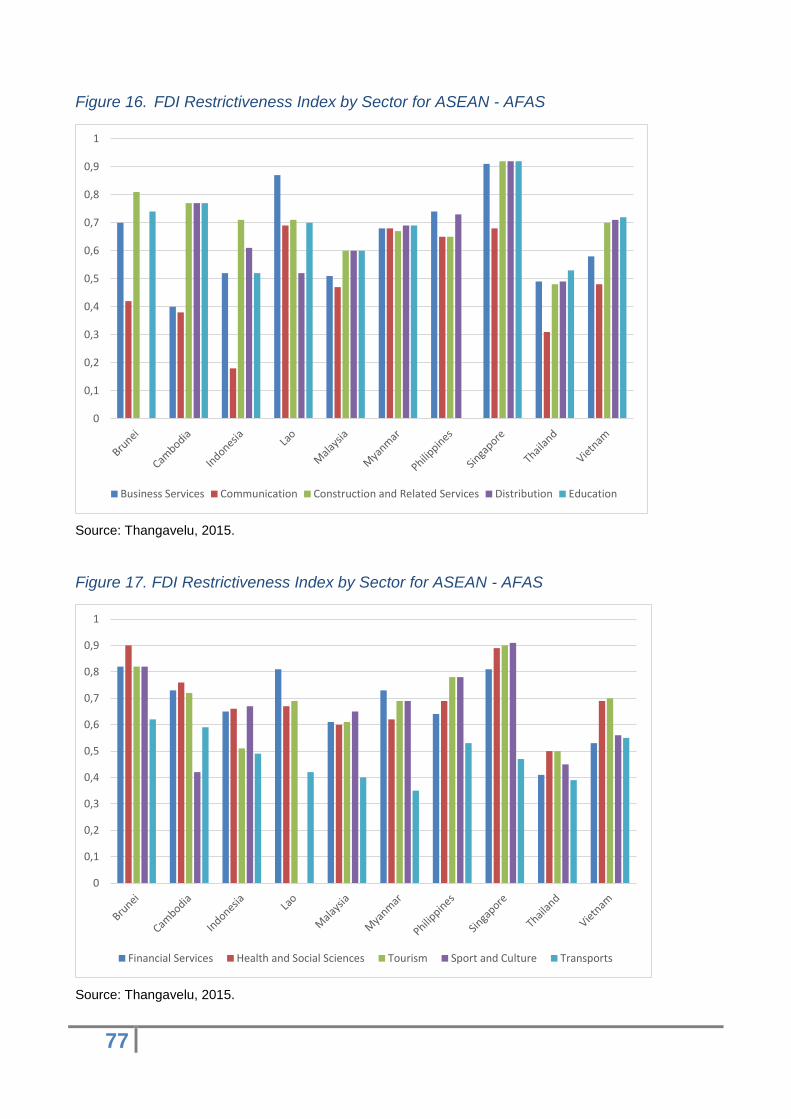
77
Figure 16. FDI Restrictiveness Index by Sector for ASEAN - AFAS
Source: Thangavelu, 2015.
Figure 17. FDI Restrictiveness Index by Sector for ASEAN - AFAS
Source: Thangavelu, 2015.
0
0,1
0,2
0,3
0,4
0,5
0,6
0,7
0,8
0,9
1
Business Services Communication Construction and Related Services Distribution Education
0
0,1
0,2
0,3
0,4
0,5
0,6
0,7
0,8
0,9
1
Financial Services Health and Social Sciences Tourism Sport and Culture Transports
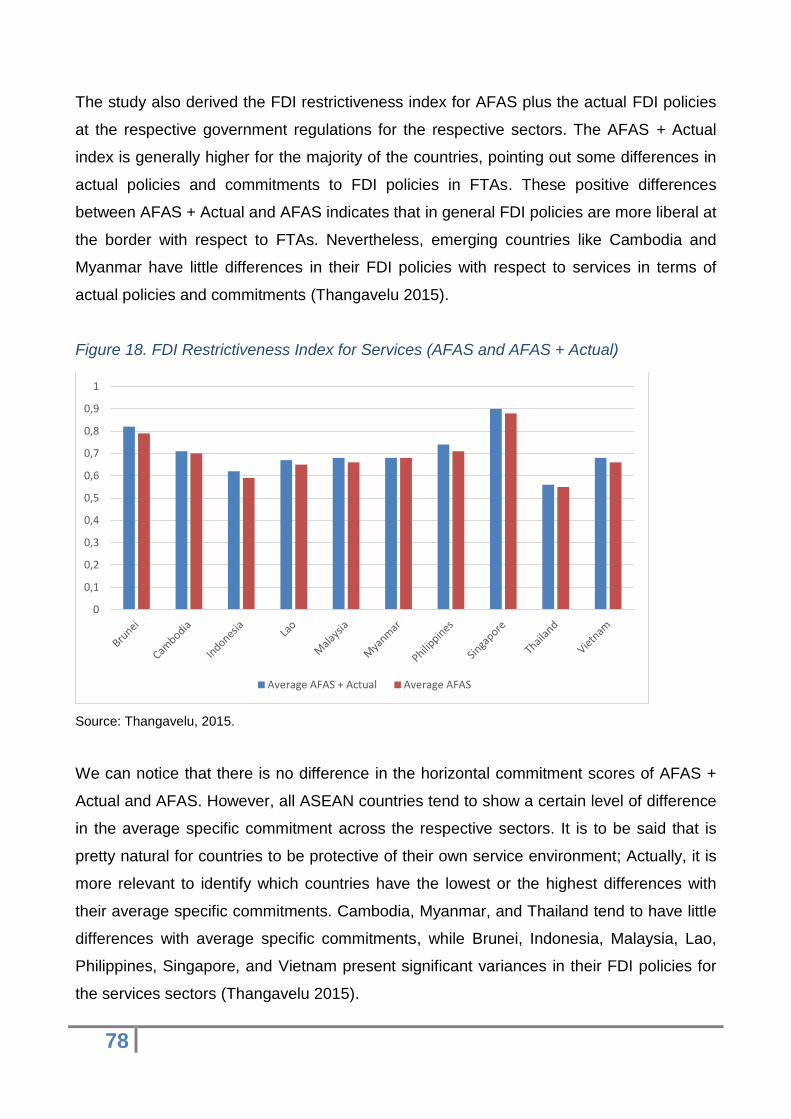
78
The study also derived the FDI restrictiveness index for AFAS plus the actual FDI policies
at the respective government regulations for the respective sectors. The AFAS + Actual
index is generally higher for the majority of the countries, pointing out some differences in
actual policies and commitments to FDI policies in FTAs. These positive differences
between AFAS + Actual and AFAS indicates that in general FDI policies are more liberal at
the border with respect to FTAs. Nevertheless, emerging countries like Cambodia and
Myanmar have little differences in their FDI policies with respect to services in terms of
actual policies and commitments (Thangavelu 2015).
Figure 18. FDI Restrictiveness Index for Services (AFAS and AFAS + Actual)
Source: Thangavelu, 2015.
We can notice that there is no difference in the horizontal commitment scores of AFAS +
Actual and AFAS. However, all ASEAN countries tend to show a certain level of difference
in the average specific commitment across the respective sectors. It is to be said that is
pretty natural for countries to be protective of their own service environment; Actually, it is
more relevant to identify which countries have the lowest or the highest differences with
their average specific commitments. Cambodia, Myanmar, and Thailand tend to have little
differences with average specific commitments, while Brunei, Indonesia, Malaysia, Lao,
Philippines, Singapore, and Vietnam present significant variances in their FDI policies for
the services sectors (Thangavelu 2015).
0
0,1
0,2
0,3
0,4
0,5
0,6
0,7
0,8
0,9
1
Average AFAS + Actual Average AFAS
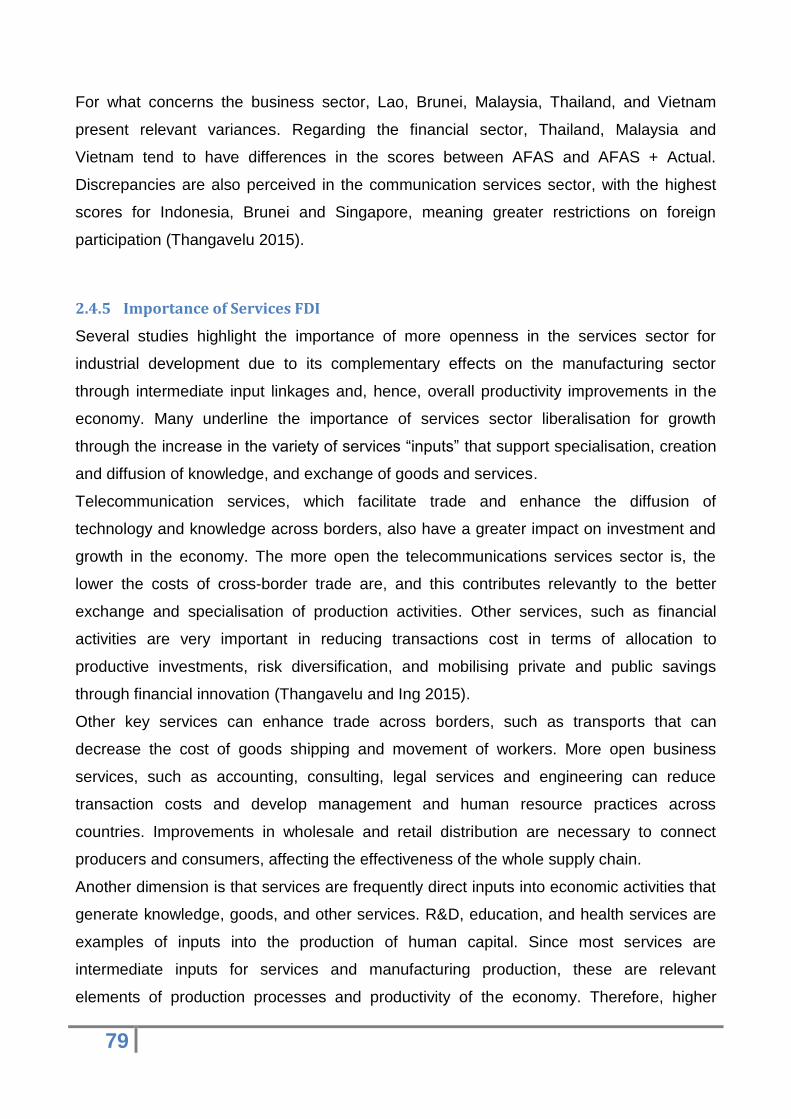
79
For what concerns the business sector, Lao, Brunei, Malaysia, Thailand, and Vietnam
present relevant variances. Regarding the financial sector, Thailand, Malaysia and
Vietnam tend to have differences in the scores between AFAS and AFAS + Actual.
Discrepancies are also perceived in the communication services sector, with the highest
scores for Indonesia, Brunei and Singapore, meaning greater restrictions on foreign
participation (Thangavelu 2015).
2.4.5 Importance of Services FDI
Several studies highlight the importance of more openness in the services sector for
industrial development due to its complementary effects on the manufacturing sector
through intermediate input linkages and, hence, overall productivity improvements in the
economy. Many underline the importance of services sector liberalisation for growth
through the increase in the variety of services “inputs” that support specialisation, creation
and diffusion of knowledge, and exchange of goods and services.
Telecommunication services, which facilitate trade and enhance the diffusion of
technology and knowledge across borders, also have a greater impact on investment and
growth in the economy. The more open the telecommunications services sector is, the
lower the costs of cross-border trade are, and this contributes relevantly to the better
exchange and specialisation of production activities. Other services, such as financial
activities are very important in reducing transactions cost in terms of allocation to
productive investments, risk diversification, and mobilising private and public savings
through financial innovation (Thangavelu and Ing 2015).
Other key services can enhance trade across borders, such as transports that can
decrease the cost of goods shipping and movement of workers. More open business
services, such as accounting, consulting, legal services and engineering can reduce
transaction costs and develop management and human resource practices across
countries. Improvements in wholesale and retail distribution are necessary to connect
producers and consumers, affecting the effectiveness of the whole supply chain.
Another dimension is that services are frequently direct inputs into economic activities that
generate knowledge, goods, and other services. R&D, education, and health services are
examples of inputs into the production of human capital. Since most services are
intermediate inputs for services and manufacturing production, these are relevant
elements of production processes and productivity of the economy. Therefore, higher
80
openness in these facilities creates economies of scale and scope for greater
improvements and specialisation in the regional production value and supply chains.
Moreover, outsourcing and fragmenting activities in manufacturing and services will
provide positive impacts on the growth of productivity in the services sector (Thangavelu
and Ing 2015).
Another fact, is that services increase with the growth of middle-income households in the
domestic economy (their income elasticities of demand tend to exceed one) and their
demand for specialised services increases as their income grows. Employment tends to
move from the manufacturing to the services sector as per capita income increases and
the economy moves to more developed levels. One critical issue is that the productive
contribution of the services sector to the overall economy is limited, due to their
technological capacity and limited potential growth for investment.
2.4.6 Policy Effects and Remarks
Let us try to sum up and comment what are the main remarks and possible effects of the
different levels of Foreign Direct Investment restrictiveness across ASEAN. In general, we
noticed that the manufacturing segment is more liberalized with respect to the services.
Anyway, developing economies have a more open policy towards foreign investments
compared to developed industries. In detail, Vietnam and Cambodia have adopted
significant policies to maintain their drive to liberalization and integration within the
economic community. For example, the modifications of employment regulations for
Myanmar, Cambodia and Vietnam were revealed by the decrease in the performance
requirements. Laotian latest reforms determined an easier access to the market, a more
fluent movement of people and a drop in the board of directors and performance
requirements (Thangavelu 2015).
At the same time, Malaysia, Thailand, Indonesia, and the Philippines have not progressed
further from their relatively higher investment base and this poses an important challenge
for their competitiveness. These countries have to liberalize their services sector as it will
become an important component of their growth. Across the service sectors, ASEAN
members show high protection over communication and transports, limiting foreign firms
and competition. Among the different categories of evaluation, screening and approval
show the lowest score, suggesting that greater control is imposed to manage the types of
industries that could locate and operate in the domestic economy. The highest degrees of
81
protection are held over the financial, business and communication services (Thangavelu
2015).
The current ASEAN plus one agreements are limited in services liberalisation; BITs could
be important to increase the market access and commercial presence of services activities
in the region. Some matters challenge the improvement the productivity of services sector
and FDI in the region, even thanks to improved agreements and treaties with existing
partners (Thangavelu and Ing 2015):
At first, innovation and competition in the services across the region have to be
improved. In this case, the trade facilitation and behind-border-issues are key to
increase innovation and competition of the services sector through better national
treatment and greater foreign ownership in the key domestic services sector.
Second, some countries have made tremendous improvements in human capital
development; however, much more needs to be done. While CLMV countries need
to address issues on basic education, more mature economies need to improve the
skills and training of their workers to maintain the relevance and contribution of their
labour force in the economy. Human capital and labour mobility are crucial for the
development and openness of the services sector in the region, because human
capital development and mobility of skilled workers will increase the impact of
services productivity and the contribution of services sector to the overall growth of
both domestic and regional economies.
Third, there are still infrastructure gaps in ASEAN, particularly in the services
sector. Both hard and soft infrastructures are important tools to enable trade and to
develop the services sector in the region. Improvements in the management
systems in ports could reduce dwell time; and the development of information and
communications technology and infrastructure will improve links for trade and
movement of goods that will enhance services trade.
Last, there is a huge data gap in the services sector in the region in terms of quality
of data and information which can be used to understand the key issues and guide
policy discussions on relevant topics such as productivity, innovation, and linkages
of the services sector and services trade in the region.
82
2.5 The ACFTA Agreement
The birth of the ASEAN bloc empowered the importance of the whole region, which
became an attractive commercial partner for many other economic players and
communities. In fact, opening up services for investments and trade has accelerated in
South-East Asia within the last two decades, characterised by a relevant increase in Free
Trade Agreements (FTAs). Such agreements played a central role in fostering investments
inflows in ASEAN from worldwide partners. The first major FTA for Southeast Asian
countries was the ASEAN Free Trade Area (AFTA) enacted in 1992. ASEAN member
countries also began to actively establish bilateral and regional FTAs. Indeed, ASEAN has
established five ASEAN + 1 FTAs with its six main trading partners: China (ACFTA), Japan
(AJCEP), Korea (AKFTA), India (AIFTA), and Australia - New Zealand (AANZFTA).
For ASEAN, the most important ASEAN + 1 free trade agreement so far has been the
ACFTA (ASEAN-China Free Trade Agreement, signed on the 4th of November 2002, in
Phnom Penh), which represents a remarkable point in the economic relations both for
China and ASEAN nations. The agreement gave birth to the third economic group
worldwide, after NAFTA and European Union.
The framework agreement stipulated in 2005 involves the description of tariff and non-tariff
reduction provisions for member countries. These tariff reduction provisions categorise
tariff lines into Normal and Sensitive Track. The amount of tariff lines in the Sensitive Track
must not overcome the limit of 10% of the total import value, decided upon trade statistics
of 2001. For what concerns the Normal Track, tariffs saw a regular elimination ending in
2010 for China and the ASEAN-5 plus Brunei and in 2015 for Cambodia, Lao, Myanmar
and Vietnam. The table hereby shows the reduction on tariffs scheduled for China and
ASEAN-5 plus Brunei (Li, Scollay and Maani 2016).
X represents the applied tariff rates, which are separated in 5 categories: X ≤ 5%, 5% < X
< 10%, 10% ≤ X < 15%, 15% ≤ X < 20% and X ≥ 20%. Starting from 2005, applied tariffs
were lowered to the minimum rate for each interval, made exception for the lowest group
with tariffs ≤ 5%. Further reductions were carried on in 2007 and 2009, until 2010 when
China and ASEAN-5 plus Brunei finally eliminated tariffs on 7000 goods categories for
90% of exchanged products. This is representative of the degree of market integration
reached by China and ASEAN.
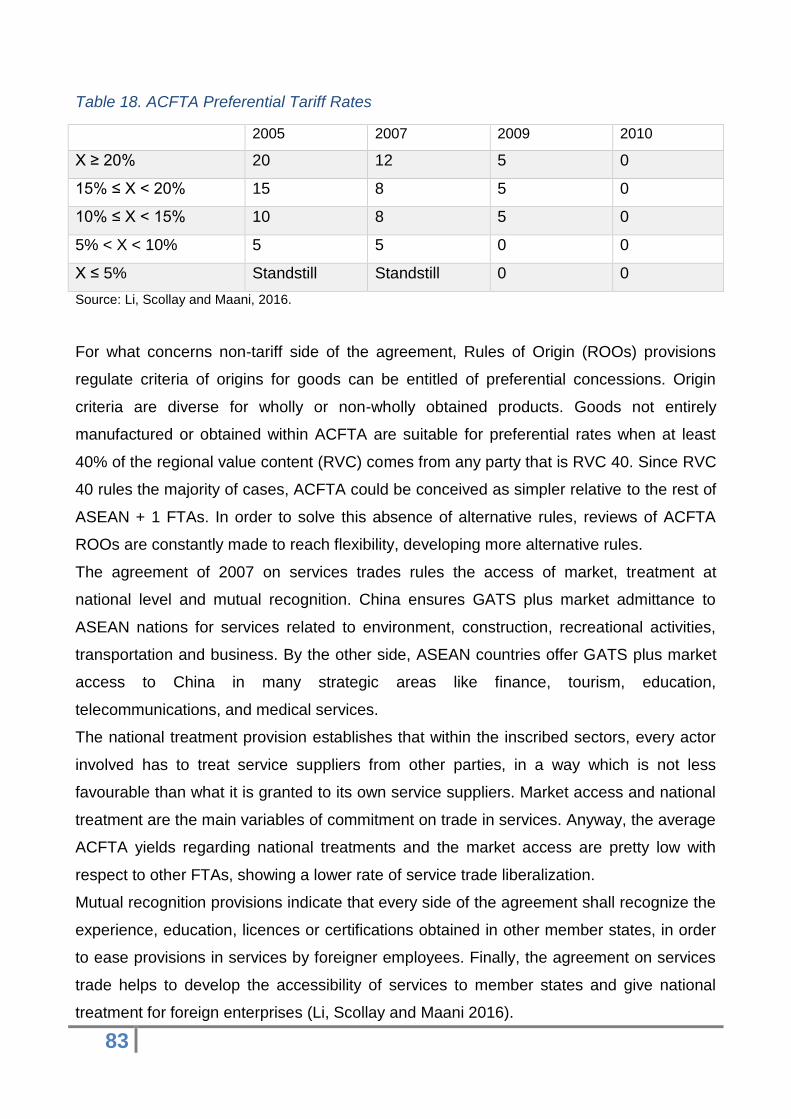
83
Table 18. ACFTA Preferential Tariff Rates
2005 2007 2009 2010
X ≥ 20% 20 12 5 0
15% ≤ X < 20% 15 8 5 0
10% ≤ X < 15% 10 8 5 0
5% < X < 10% 5 5 0 0
X ≤ 5% Standstill Standstill 0 0
Source: Li, Scollay and Maani, 2016.
For what concerns non-tariff side of the agreement, Rules of Origin (ROOs) provisions
regulate criteria of origins for goods can be entitled of preferential concessions. Origin
criteria are diverse for wholly or non-wholly obtained products. Goods not entirely
manufactured or obtained within ACFTA are suitable for preferential rates when at least
40% of the regional value content (RVC) comes from any party that is RVC 40. Since RVC
40 rules the majority of cases, ACFTA could be conceived as simpler relative to the rest of
ASEAN + 1 FTAs. In order to solve this absence of alternative rules, reviews of ACFTA
ROOs are constantly made to reach flexibility, developing more alternative rules.
The agreement of 2007 on services trades rules the access of market, treatment at
national level and mutual recognition. China ensures GATS plus market admittance to
ASEAN nations for services related to environment, construction, recreational activities,
transportation and business. By the other side, ASEAN countries offer GATS plus market
access to China in many strategic areas like finance, tourism, education,
telecommunications, and medical services.
The national treatment provision establishes that within the inscribed sectors, every actor
involved has to treat service suppliers from other parties, in a way which is not less
favourable than what it is granted to its own service suppliers. Market access and national
treatment are the main variables of commitment on trade in services. Anyway, the average
ACFTA yields regarding national treatments and the market access are pretty low with
respect to other FTAs, showing a lower rate of service trade liberalization.
Mutual recognition provisions indicate that every side of the agreement shall recognize the
experience, education, licences or certifications obtained in other member states, in order
to ease provisions in services by foreigner employees. Finally, the agreement on services
trade helps to develop the accessibility of services to member states and give national
treatment for foreign enterprises (Li, Scollay and Maani 2016).
84
2.5.1 FDI Development in China and ASEAN
In 2010, the overall GDP of China PDR and the ASEAN-6 reached 7.79 trillion dollars,
representing the 99% of the aggregated GDP of China and ASEAN nations and 12% of
the worldwide economy. Between 2000 and 2010, the GDP annual growth was 10.8% for
China and 5.5% for the ASEAN-6. Together with the fast economic growth, China and
ASEAN saw growing FDI inflows as well. Before 2005, FDI for both sides did not grow
rapidly, with FDI stocks in ASEAN increasing a little faster than China. Only after 2005,
FDI stocks of ASEAN started growing faster than the Chinese one and the pace between
the two was equalised only in 2007, with stock shares rising rapidly side by side. So far,
the share for ASEAN is more elevated than the one of China (Li, Scollay and Maani 2016).
The difference in growth rates of FDI stocks before and after 2005 could be due to
different factors. At first we find the implementation of ACFTA, because 2005 saw the
enforcement of the agreement on trade in goods. In fact, the quicker growth of FDI stock in
ASEAN could be due to the preferential access to the Chinese market provided by
ACFTA, improving ASEAN attractiveness to MNEs as a destination for FDI. The risen of
stock shares of both members after 2007, meanwhile, coincided with the large tariff
reduction of the year 2007 under the agreement on trade in goods. This may indicate a
positive correlation between ACFTA and FDI growth (Li, Scollay and Maani 2016).
Even if Chinese FDI stock is lower than ASEAN region, it is still higher than all ASEAN
economies but Singapore. Thailand, Malaysia and Indonesia represent the second level of
countries followed by Vietnam and finally the Philippines, the lowest FDI stock with respect
to China and the other members of ASEAN-6. In 2010, FDI stock of China was slightly
overtaken by Singapore, whose increase in FDI from 2005 to 2010 was due to the surge of
total FDI in ASEAN.
Another important grown in this period occurred in Indonesia. Before 2005, Indonesian
stock of FDI was smaller than the ones of Thailand and Malaysia. Right after 2005, until
2010, a relevant growth in FDI pushed Indonesia to the top of the rank of the second tier of
countries. Thailand, Vietnam and Malaysia saw relevant growths from 2005 to 2010 too, in
line with the rest of the ASEAN bloc (Li, Scollay and Maani 2016).
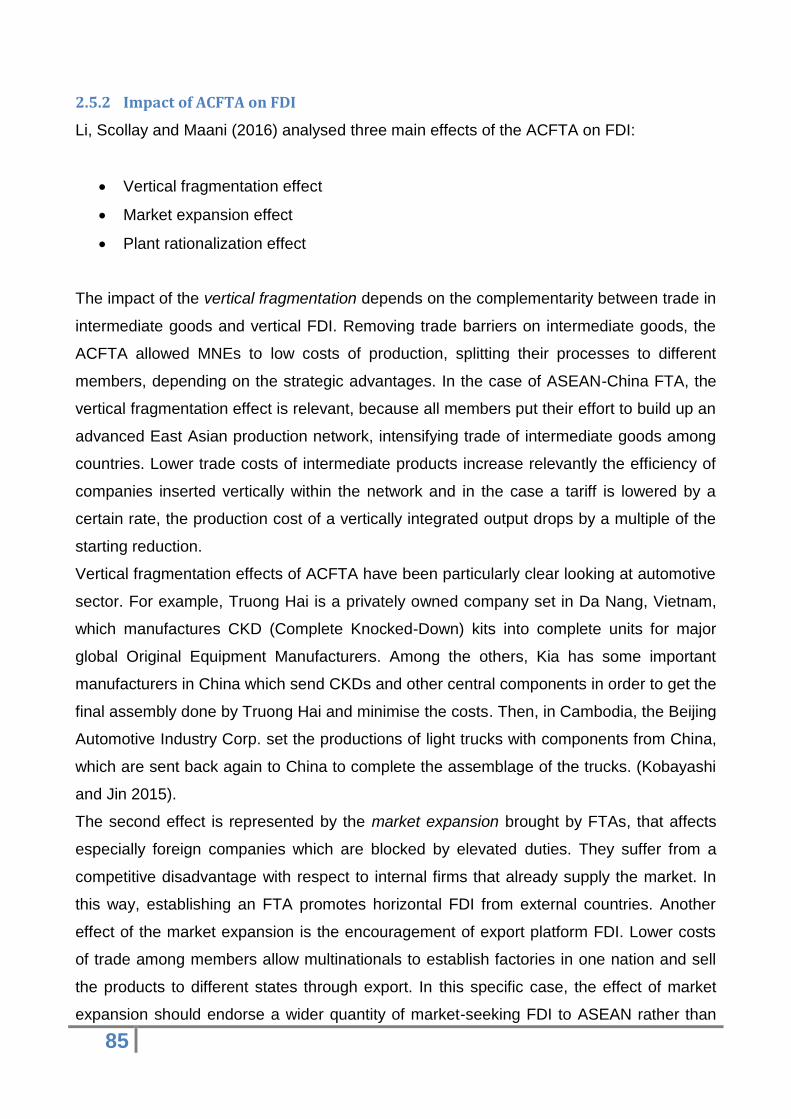
85
2.5.2 Impact of ACFTA on FDI
Li, Scollay and Maani (2016) analysed three main effects of the ACFTA on FDI:
Vertical fragmentation effect
Market expansion effect
Plant rationalization effect
The impact of the vertical fragmentation depends on the complementarity between trade in
intermediate goods and vertical FDI. Removing trade barriers on intermediate goods, the
ACFTA allowed MNEs to low costs of production, splitting their processes to different
members, depending on the strategic advantages. In the case of ASEAN-China FTA, the
vertical fragmentation effect is relevant, because all members put their effort to build up an
advanced East Asian production network, intensifying trade of intermediate goods among
countries. Lower trade costs of intermediate products increase relevantly the efficiency of
companies inserted vertically within the network and in the case a tariff is lowered by a
certain rate, the production cost of a vertically integrated output drops by a multiple of the
starting reduction.
Vertical fragmentation effects of ACFTA have been particularly clear looking at automotive
sector. For example, Truong Hai is a privately owned company set in Da Nang, Vietnam,
which manufactures CKD (Complete Knocked-Down) kits into complete units for major
global Original Equipment Manufacturers. Among the others, Kia has some important
manufacturers in China which send CKDs and other central components in order to get the
final assembly done by Truong Hai and minimise the costs. Then, in Cambodia, the Beijing
Automotive Industry Corp. set the productions of light trucks with components from China,
which are sent back again to China to complete the assemblage of the trucks. (Kobayashi
and Jin 2015).
The second effect is represented by the market expansion brought by FTAs, that affects
especially foreign companies which are blocked by elevated duties. They suffer from a
competitive disadvantage with respect to internal firms that already supply the market. In
this way, establishing an FTA promotes horizontal FDI from external countries. Another
effect of the market expansion is the encouragement of export platform FDI. Lower costs
of trade among members allow multinationals to establish factories in one nation and sell
the products to different states through export. In this specific case, the effect of market
expansion should endorse a wider quantity of market-seeking FDI to ASEAN rather than

86
China, because Chinese market is already way much bigger with respect to ASEAN and
the effect is less remarkable.
Preferential access to the vast Chinese market makes ASEAN countries more attractive
for foreign investors. This is the case of Ducati, the Italian motorbike producer, which
decided to set up a factory in Thailand, in 2014. The Thai plant is the second for
productiveness, with almost the 25% of the total production (the first is located in Borgo
Panigale, Italy, and third in Brazil). The strategic choice of setting the production in
Thailand depended on different factors: at first, Ducati already had an important appeal in
Thailand and the relevant size of the internal market allowed a further growth in domestic
sales; Thai manufacturing sector was technologically ready to host Ducati’s production; but
more importantly, thanks to the agreements with Asian and Oceanian partners, Thailand
allowed Ducati to serve crucial markets in a better way, such as for Australia, Japan and,
most of all, China (Ducati Thailand, 2017).
The last effect is called the plant rationalization effect, which represents the substitution of
horizontal FDI with trade. Because of lower costs of trade, MNEs develop production
plants in a smaller number of sites and provide other markets with their goods through
export, exploiting possible economies of scale and finally favouring export platform FDI.
This effect could be relevant on ASEAN-China FTA because of the high barriers among
countries before the FTA. By the way, the large geographical region and high
transportation costs within the trade area imply that this kind of effect is unlikely to be so
strong.
The final outcome of ACFTA might be considered positive both for fostering the
attractiveness of FDI in ASEAN and for Chinese market’s expansion, because of two main
motivations. At first, vertical fragmentation of ACFTA should be relevant, but plant
rationalization effects are not likely to be robust. Secondly, bilateral trade and FDI in the
region have a strong complementary relation. Since 2001, bilateral trade between China
and the ASEAN-6 grew constantly until 2008. In the same lass of time, FDI flows to China
and the ASEAN-6 grew slowly but steadily. FDI flows to China reached the peak in 2008,
while the peak of ASEAN’s FDI came only one year earlier (Li, Scollay and Maani 2016).
We can say that this FTA can help both sides, because it is going to increase the
complementarity between trade and FDI. While some MNEs can decide to substitute
horizontal FDI with trade, exploiting economies of scale, others can split the production
among different nations which present different levels of industrial technology but also
different taxations and labour costs, optimizing in this way the overall production cost. For
87
example, meanwhile countries like China and Thailand are getting specialized on
industries with a higher technologic content, nations like Lao, Cambodia and Myanmar
provide low cost labour force and fiscal incentives for the production of intermediate goods
which can be used for the manufacture of more complex products such as cars, electro
domestics and hi-tech devices.
2.6 Taxation in ASEAN
As anticipated in section 2.4, different levels of taxation characterise ASEAN members but
still, with respect to other economic clusters, tax rates are pretty low. Anyway, identifying
optimal tax treatments is way more complicated than selecting countries with lowest tax
rates. Even if the analysis of tax rates represents an important proxy of the costs of doing
business in different countries, further variables have to be taken into account, impacting
on overall taxation. In fact, time, compliances required when filing taxes and the
effectiveness of governmental tax strategies, can alter the capability of companies to
maximize profits.
Moreover, if we consider only one type of taxation, we cannot get a clear idea of the
overall strategy for different countries. For example, among the most developed countries
we can find the highest tax rates for personal or corporate income in the Philippines, and
the lowest ones in Singapore. At the same time, Singapore shows the highest rates for
withholding taxation, while Philippines the lowest one. Similar considerations can be done
within CLMV nations. Of course, this is due to different tax strategies, but an important role
is to be attributed to historical and political factors. In fact, nations like Vietnam, Lao PDR
and the Philippines are still linked to their communist structures and ideologies, while
Singapore has always been considered by businessmen for its special tax treatments.
Anyway, among the different factors that determine competitiveness within ASEAN
countries, tax rates can be used as an estimation for the treatment of foreign investment.
Corporate Income Taxation can be indicative of a state’s outlook on the private sector,
while international withholding tax is even more telling because it directly targets overseas
capital flows, so it provides information on a country’s FDI policy (Wrest and Brown 2016).
88
2.6.1 Indirect Taxation: VAT and GST
In ASEAN, governments use Value Added Tax (VAT) or Goods and Services Tax (GST)
as the main components of indirect taxation, even if some do not have indirect tax at all.
VAT rates vary importantly among countries, from governments which do not levy these
taxes at all, like Brunei, to the 12% rate in the Philippines. Recent years have witnessed a
rise of this kind of taxes, like the case of Malaysia introducing a GST system of 6% in 2015
(KPMG International 2016).
The study from KPMG (2016) highlighted some trends particularly evident in Asian-Pacific
zones. The first trend is the move to wider VAT and GST bases. The Organisation for
Economic Co-operation and Development highlights the fact that the majority of its 34
member countries increased their VAT or GST rates at least once during the period from
2009 to 2014. Anyway, reduced rates and other concessions have not been an effective
manner to protect lower income individuals and address the so-called regressivity of
indirect taxes, which is one of the main reasons given by policy makers for providing such
concessions. A recent OECD study shows that many of these reduced rates actually
benefit higher income households more than lower income households. A better way to
achieve equity and social objectives would be to remove reduced rates and provide more
targeted relief measures, such as income-tested benefits and tax credits (KPMG
International 2016).
A related trend is the shift from multiple rate VAT/GST systems to single rate systems. In
fact, many problems arise in VAT systems that either rely on excessive exemptions or
have multiple rates. Different international cases on everyday consumer transactions
emphasize the complexities which arise both from tax authorities and tax-payers. Another
trend is the progressive move to a global framework for applying VAT and GST to cross-
border flows of intangible and services. That global framework is expected to bring higher
consistency between nations in the VAT/GST treatment of international trade flows, based
on the destination principle that VAT and GST should be levied in the place where
services and goods are consumed, not where they originate. The destination principle
provides a very powerful response, in an indirect tax context, to the Base Erosion and
Profit Shifting debate that is ongoing in the corporate tax environment (KPMG International
2016).
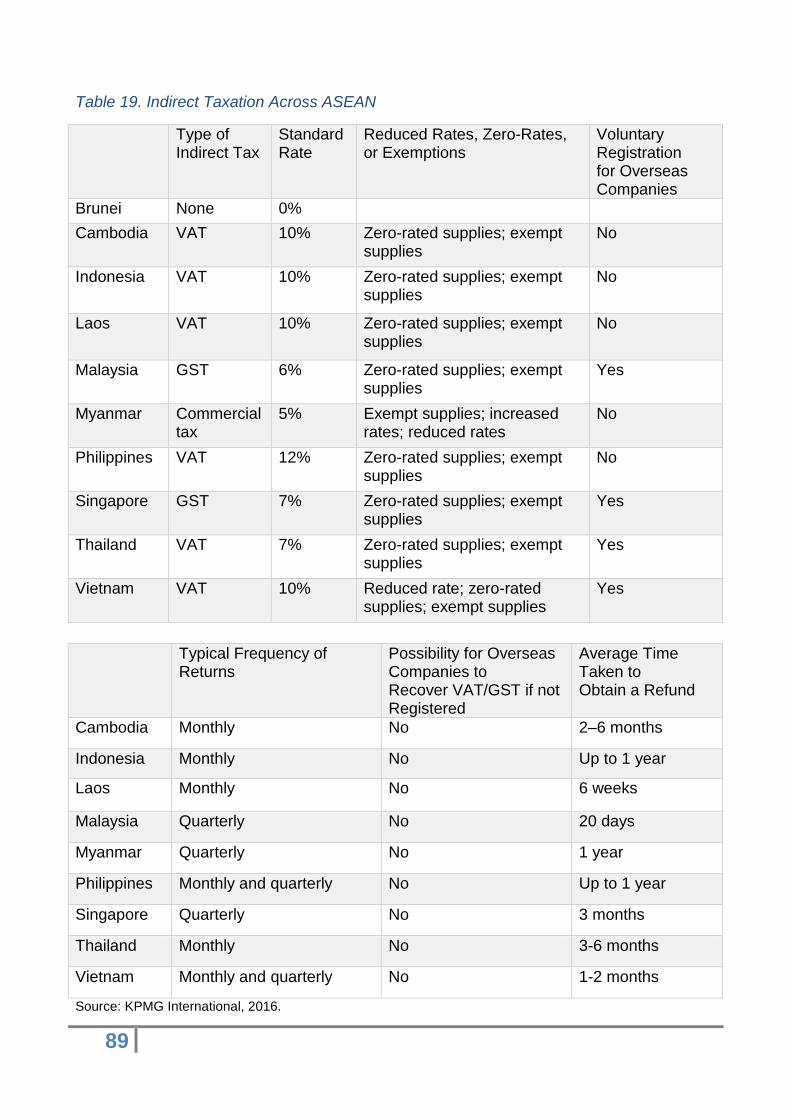
89
Table 19. Indirect Taxation Across ASEAN
Type of Indirect Tax
Standard Rate
Reduced Rates, Zero-Rates, or Exemptions
Voluntary Registration for Overseas Companies
Brunei None 0%
Cambodia VAT 10% Zero-rated supplies; exempt supplies
No
Indonesia VAT 10% Zero-rated supplies; exempt supplies
No
Laos VAT 10% Zero-rated supplies; exempt supplies
No
Malaysia GST 6% Zero-rated supplies; exempt supplies
Yes
Myanmar Commercial tax
5% Exempt supplies; increased rates; reduced rates
No
Philippines VAT 12% Zero-rated supplies; exempt supplies
No
Singapore GST 7% Zero-rated supplies; exempt supplies
Yes
Thailand VAT 7% Zero-rated supplies; exempt supplies
Yes
Vietnam VAT 10% Reduced rate; zero-rated supplies; exempt supplies
Yes
Typical Frequency of Returns
Possibility for Overseas Companies to Recover VAT/GST if not Registered
Average Time Taken to Obtain a Refund
Cambodia Monthly No 2–6 months
Indonesia Monthly No Up to 1 year
Laos Monthly No 6 weeks
Malaysia Quarterly No 20 days
Myanmar Quarterly No 1 year
Philippines Monthly and quarterly No Up to 1 year
Singapore Quarterly No 3 months
Thailand Monthly No 3-6 months
Vietnam Monthly and quarterly No 1-2 months
Source: KPMG International, 2016.
90
Hereby we can see the most important peculiarities of the indirect taxation in ASEAN
countries (KPMG International 2016).
Cambodia
Zero-rate treatment is reserved to exported goods, services, and certain charges in
relation to international transportation of people and goods. Also, this zero-rating is
applicable for any goods and services supplied by supporting industries’ Qualified
Investment Projects and contractors to particular export industries. Exemptions include
public postal services, medical goods and services, insurance services, wholly state-
owned public transportation services, importation of articles for personal use that are
exempt from customs duties, primary financial services, supplies of water for public
consumption and electricity and non-profit activities in the public interest.
Businesses are required to register, if they fall under one of the following criteria:
o any other enterprise with turnover in respect to goods sold exceeding 125 million
Cambodian Riel (KHR) or in respect to services exceeding 60 million KHR for the
preceding 3 consecutive months or in the next 3 consecutive months;
o all types of corporation, importer-exporter and investment enterprises;
o any enterprise which, at the beginning of any 3 consecutive months, has any
government contracts which will produce taxable turnover exceeding 30 million
KHR.
Indonesia
Zero-rate is applied to exports of goods and exports of certain services, including toll
manufacturing services, repair and maintenance services and construction services.
Import and deliveries of taxable goods, designated as strategic by the government, and
goods or other services, which support the achievement of national objectives, are
exempted.
VAT is not collected on deliveries of goods to a bonded zone, and deliveries of goods and
services to a free-trade zone. There are certain goods and services which are not subject
to VAT, for example: goods that are taken directly from their source (e.g. crude oil, natural
gas, coal), financial services (e.g. banking, insurance and finance lease), etc. Indonesian
91
taxpayers (companies and individuals) with annual turnover of more than 4.8 billion
Indonesian rupiah (IDR) are required to register.
Lao
Standard rate is applied on goods and services produced and consumed domestically or
being imported into Laos; services performed in Laos to overseas entities; and services
provided by overseas or non-resident entities in Laos. At the same time, zero-rate is
applied on goods and services for export. Business operators who have a minimum annual
business turnover of 400 million Lao kips (LAK) are required to register. Exempt supplies
include:
o certain imports related to air transport;
o specified financial services operations;
o crop seeds and animals for breeding, pesticides, vaccines, organic and chemical
fertilizers;
o specific medical services;
o certain educational operations;
o certain vehicles for specific purposes.
Malaysia
Zero-rated supplies include exports of goods and services, basic foods, certain
medicaments and medical gasses, supply of the first 300 units of electricity to domestic
users for a minimum period of 28 days per billing cycle and supplies of treated water to
domestic users. Exempt supplies include investment precious metal and financial services,
sale and lease of residential property, private health care and education, toll highways,
domestic public transport, and land for agricultural or religious purposes. Businesses with
an annual taxable turnover exceeding 500,000 Malaysian Ringgits (MYR) are required to
register.
Myanmar
Generally, 5% standard rate applies to most products and services. Commercial tax on
certain special items (such as beer, teak wood, precious stones and petroleum products
and vehicles) ranges from 3% to 120%. Tax rates on cigarettes, spirits and wine will also
92
vary based on their price. Basic products such as food and medicines are exempt. In
addition, certain services, such as contract manufacturing, education services, financial
services and public transportation, are also exempt. Anyone carrying out production,
manufacturing, services and importing goods into the country must register.
Philippines
Zero-rate transactions include:
o export sales;
o sales to any entity whose exemption under special laws or international agreements
to which the Philippines is a signatory effectively subjects such sale to zero-rate;
o foreign currency denominated sales;
o sales of services rendered to persons engaged in business conducted outside the
country or to a non-resident person not engaged in business who is outside the
nation when the services are performed.
Exempt transactions include particular residential sales or leases; educational services;
services rendered by regional HQs set within the nation by MNEs; transport of passengers
by international carriers doing business within the national boundaries; sale, importation or
lease of passenger or cargo vessels and aircraft, including engine, and parts for domestic
or international transport operations and sale or lease of goods or properties; or the
services different from the transactions mentioned where the gross annual sales or
receipts do not exceed the amount of 1,919,500 Philippine Pesos (PHP).
Singapore
Exempt supplies include the sale/lease of residential properties, supply of investment-
grade gold, silver and platinum and most financial services. Zero-rated supplies include
the following:
o provision of international services;
o supply of a prescribed tool or machine used in the manufacture of goods in
Singapore, including the development of prototypes of the tool or machine as well
as any services rendered directly in connection with the tool or machine to an
overseas person;
93
o goods supplied for use on board or installation on a qualifying ship;
o export of goods from Singapore;
o goods sold or leased to “Approved Marine Customers” for use or installation on a
commercial ship wholly for international travel.
A person is liable to register for GST when his taxable turnover has exceeded 1 million
Singapore dollars (SGD) in a 12-month period or he is currently making taxable supplies
and his annual taxable turnover is expected to exceed 1 million SGD in the following 12
months.
Thailand
Zero-rated supplies include the export of goods, bringing domestic goods into a duty-free
zone; provision of services performed in Thailand but used abroad; provision of services
for the manufacture of goods within a duty-free zone or provision of services within a duty-
free zone for the manufacturing of goods in Thailand for export; certain provision of
international transport services; sale of goods and provision of services to government
authorities under a foreign loan or assistance project and sale of goods; provision of
services between a bonded warehouse and other bonded warehouses or between a duty-
free zone and other duty-free zones.
Exemptions are provided for fertilizers, animal feeds, health care services, services of
international transport by land, educational services, services of domestic transport, rent of
all immovable property and the import of goods brought into a duty-free zone when re-
exported. A supplier carrying on the business of selling goods and providing services must
register if the annual tax base of its business exceeds 1.8 million Thai Baht (THB).
Vietnam
VAT registration is obligatory to all the entities producing taxable outputs within national
borders. For some transactions the supplier is not required to charge VAT but is generally
allowed to claim the input VAT associated with such transactions. These transactions
include payments of indemnities, disposal of assets owned by non VAT-registered owners,
some services rendered by foreign contractors, advertising or brokerage services, capital
contributions in the form of assets and receipts on behalf of a third party.
There are 28 categories of VAT-exempt supplies including agricultural resources, animal
feed, equipment used for agricultural activities, land transfers, life and medical insurances,
94
education, telecommunications, goods or materials for re-exportations and technology
transfer. The provision of essentialities like clean water, food, educational and medical
equipment and services related to science and technology can benefit from 5% VAT rate.
2.6.2 Personal Income Taxation Rates
Apart from Cambodia and Brunei, the first having a 20% rate and the second no Personal
Income Taxation in place, ASEAN countries adopt progressive taxation systems, with
rates varying importantly among the countries, with some capping their PIT at 45% and
others at 17%. In recent years, rates of individual income taxation have been following a
decreasing path. For example, in the last 20 years, Indonesia, Vietnam and Malaysia have
marginally lowered their PIT rates for the lowest income bands, but at the same time, to
meet up revenue constrains, they have increased taxation in upper tax brackets. Those
economies which started growing rapidly, had to create new tax bands to follow rising
incomes (Wrest and Brown 2016).
Let us see how tax rates change following the growth of the annual earnings per capita.10
Even if Brunei Darussalam does not levy any tax on personal income, in Cambodia, from
200$ to 300$, PIT tax rate is 5%; from 300$ to 2,000$, it is 10%; from 2,000$ to 3,000$,
15%; and from 3,000$ it measures 20%.
In Malaysia, for the bracket from 1,000$ to 5,000$, the tax rate is 1%; from 5,000$ to
8,500$, 5%; from 8,500$ to 12,000$, 10%; from 12,000$ to 17,000$, 16%; from 17,000$ to
24,000$, 21%; from 24,000$ to 60,000$, 24%; from 60,000$ to 95,000$, 24,5%; from
95,000$ to 145,000$, 25%; from 145,000$ to 240,000$, 26%; finally, starting from
240,000$ the tax rate is 28%.
In Myanmar, for personal incomes from 1,700$ to 4,200$, tax bracket measures 5%; from
4,200$ to 8,500$, 10%; from 8,500$ to 17,000$, 15%; from 17,000$ to 27,000$, 20%; from
27,000$, the tax rate reaches the 25% of the personal earnings.
For what concern Indonesia, the lowest tax bracket, starting from 0 US$, measures 6%,
from 3,500$ to 18,000$, it is 15%; from 18,000$ to 38,000$, 25%; from 38,000$ tax rate
starts being 30%.
10 These figures come from the report by Wrest and Brown (2016) and they are approximation coming from the different currencies.
95
About Lao PDR, from 100$ to 350$, tax levied measures 5% of the personal income; from
350$ to 750$, it measures 10%; from 750$ to 1,400$, it is 12%; from 1,400$ to 3,000$, it is
15%; from 3,000$ to 5,000$, it is 20%, and then it becomes 24%.
In the Philippines, to the first income bracket, from 0$ to 250$, the levied tax reaches 5%;
from 250$ to 650$, it is 10%; from 650$ to 1,400$, it is 15%; from 1,400$ to 3,000$, it is
20%; from 3,000$ to 5,200$, it is 25%; from 5,200$ to 12,000$, it is 30%, while after this
threshold it reaches 32%.
For Singapore, the first tax arises when the personal earnings overcome the 15,000$ per
year and it measures 2% until 23,000$; from 23,000$ to 30,000$, tax rate reaches 3.5%;
from 30,000$ to 60,000$, it is 7%; from 60,000$ to 90,000$, it is 11.5%; from 90,000$ to
120,000$, it is 15%; it becomes 18% from 120,000$ to 150,000$; from 150,000$ to
180,000$, it is 19%; from 180,000$ to 215,000$, it is 19.5%; from 215,000$ to 245,000$, it
is 20% and then it becomes 22%.
For what concerns Thailand’s Personal Income Taxation, 5% tax rate is levied on yearly
earnings from 4,200$ to 8,200$; a 10% is due if the earnings reach 13,000$; from 13,000$
to 21,000$, the rate is 15%; from 21,000$ to 28,000$, it is 20%; from 28,000$ to 55,000$,
it is 25%; from 55,000$ to 110,000$, it is 30%, and finally it turns to 35%.
About Vietnam, until 2,800$ every person pays a rate of 5%; from 2,800$ to 5,400$, the
tax rate is 10%; from 5,400$ to 9,500$, it reaches 15%; from 9,500$ to 17,000$, it is 20%;
from 17,000$ to 27,500$, it grows to 25%; from 27,500$ to 43,000$, it is 30% and then it
reaches the 35% (Wrest and Brown 2016).
2.6.3 Withholding Tax
Countries in ASEAN usually divide withholding tax into dividends, interests and royalties.
Similar to CIT, international withholding taxation became a relevant point of diversification
among tax jurisdictions. States like the Philippines (charging a withholding rate of 30% on
dividends) have become much more expensive with respect to those like Myanmar and
Vietnam, that only employ a 0% rate on dividend remittance. Here we have the three
withholding tax rates for each ASEAN member.
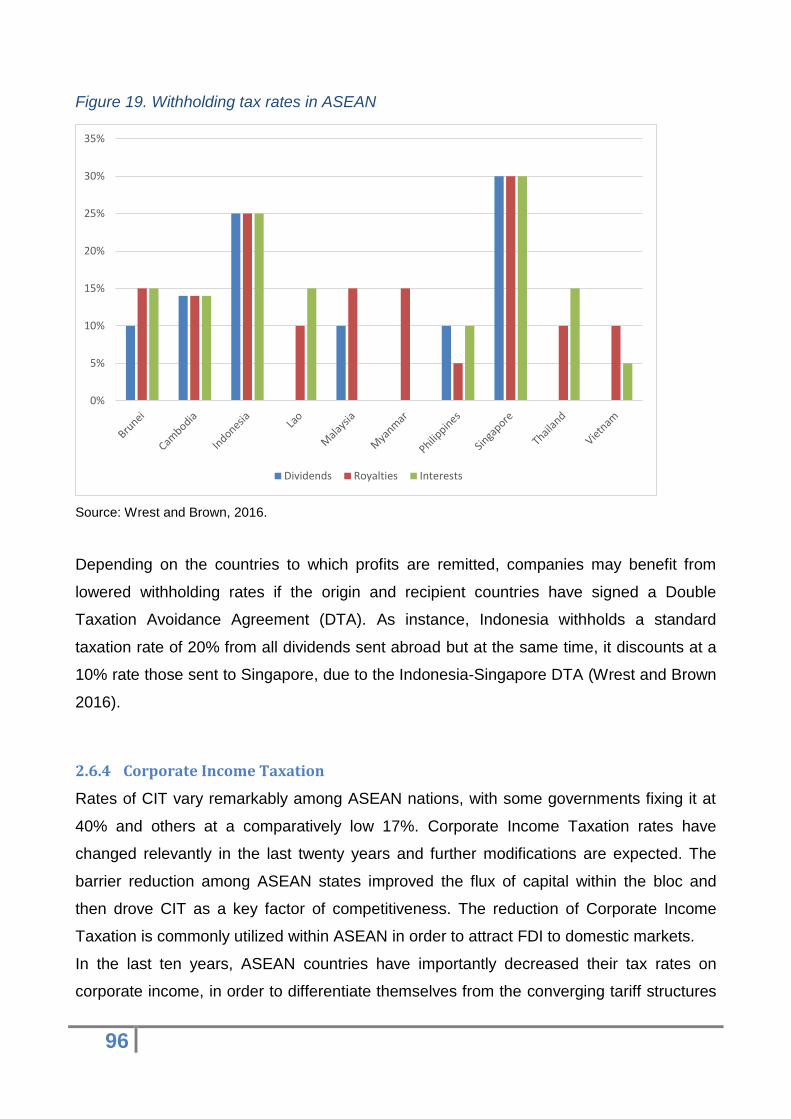
96
Figure 19. Withholding tax rates in ASEAN
Source: Wrest and Brown, 2016.
Depending on the countries to which profits are remitted, companies may benefit from
lowered withholding rates if the origin and recipient countries have signed a Double
Taxation Avoidance Agreement (DTA). As instance, Indonesia withholds a standard
taxation rate of 20% from all dividends sent abroad but at the same time, it discounts at a
10% rate those sent to Singapore, due to the Indonesia-Singapore DTA (Wrest and Brown
2016).
2.6.4 Corporate Income Taxation
Rates of CIT vary remarkably among ASEAN nations, with some governments fixing it at
40% and others at a comparatively low 17%. Corporate Income Taxation rates have
changed relevantly in the last twenty years and further modifications are expected. The
barrier reduction among ASEAN states improved the flux of capital within the bloc and
then drove CIT as a key factor of competitiveness. The reduction of Corporate Income
Taxation is commonly utilized within ASEAN in order to attract FDI to domestic markets.
In the last ten years, ASEAN countries have importantly decreased their tax rates on
corporate income, in order to differentiate themselves from the converging tariff structures
0%
5%
10%
15%
20%
25%
30%
35%
Dividends Royalties Interests
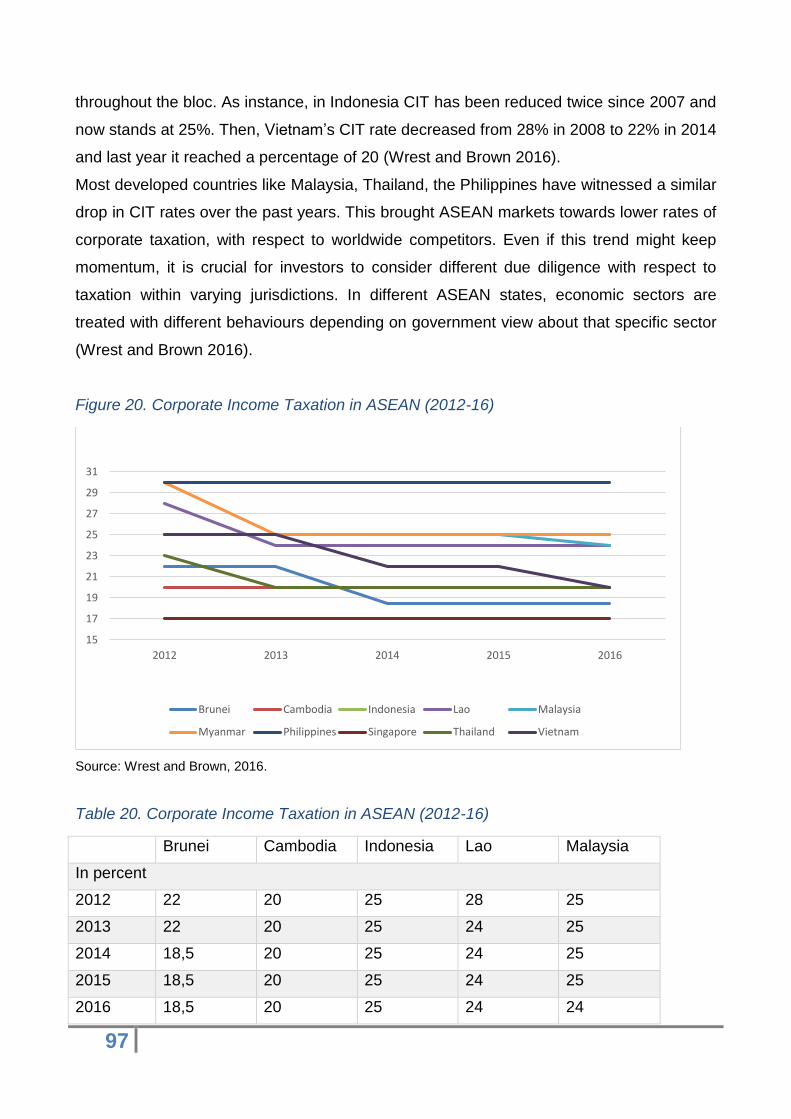
97
throughout the bloc. As instance, in Indonesia CIT has been reduced twice since 2007 and
now stands at 25%. Then, Vietnam’s CIT rate decreased from 28% in 2008 to 22% in 2014
and last year it reached a percentage of 20 (Wrest and Brown 2016).
Most developed countries like Malaysia, Thailand, the Philippines have witnessed a similar
drop in CIT rates over the past years. This brought ASEAN markets towards lower rates of
corporate taxation, with respect to worldwide competitors. Even if this trend might keep
momentum, it is crucial for investors to consider different due diligence with respect to
taxation within varying jurisdictions. In different ASEAN states, economic sectors are
treated with different behaviours depending on government view about that specific sector
(Wrest and Brown 2016).
Figure 20. Corporate Income Taxation in ASEAN (2012-16)
Source: Wrest and Brown, 2016.
Table 20. Corporate Income Taxation in ASEAN (2012-16)
Brunei Cambodia Indonesia Lao Malaysia
In percent
2012 22 20 25 28 25
2013 22 20 25 24 25
2014 18,5 20 25 24 25
2015 18,5 20 25 24 25
2016 18,5 20 25 24 24
15
17
19
21
23
25
27
29
31
2012 2013 2014 2015 2016
Brunei Cambodia Indonesia Lao Malaysia
Myanmar Philippines Singapore Thailand Vietnam
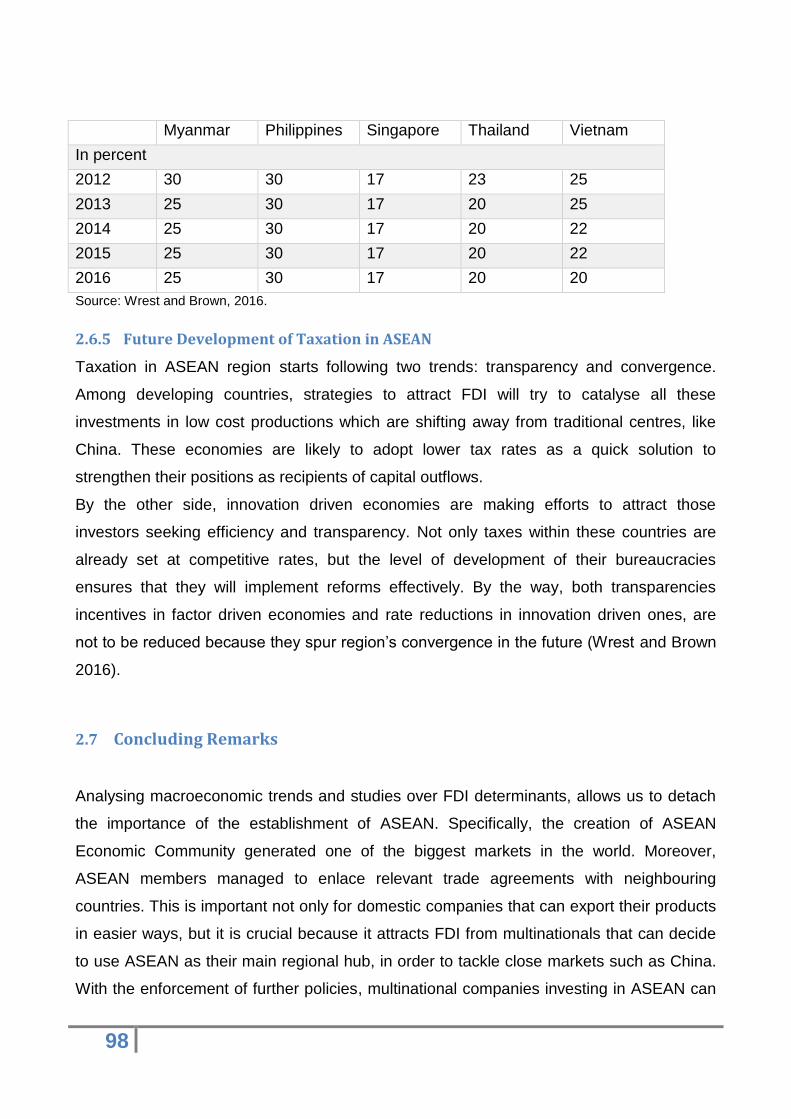
98
Myanmar Philippines Singapore Thailand Vietnam
In percent
2012 30 30 17 23 25
2013 25 30 17 20 25
2014 25 30 17 20 22
2015 25 30 17 20 22
2016 25 30 17 20 20
Source: Wrest and Brown, 2016.
2.6.5 Future Development of Taxation in ASEAN
Taxation in ASEAN region starts following two trends: transparency and convergence.
Among developing countries, strategies to attract FDI will try to catalyse all these
investments in low cost productions which are shifting away from traditional centres, like
China. These economies are likely to adopt lower tax rates as a quick solution to
strengthen their positions as recipients of capital outflows.
By the other side, innovation driven economies are making efforts to attract those
investors seeking efficiency and transparency. Not only taxes within these countries are
already set at competitive rates, but the level of development of their bureaucracies
ensures that they will implement reforms effectively. By the way, both transparencies
incentives in factor driven economies and rate reductions in innovation driven ones, are
not to be reduced because they spur region’s convergence in the future (Wrest and Brown
2016).
2.7 Concluding Remarks
Analysing macroeconomic trends and studies over FDI determinants, allows us to detach
the importance of the establishment of ASEAN. Specifically, the creation of ASEAN
Economic Community generated one of the biggest markets in the world. Moreover,
ASEAN members managed to enlace relevant trade agreements with neighbouring
countries. This is important not only for domestic companies that can export their products
in easier ways, but it is crucial because it attracts FDI from multinationals that can decide
to use ASEAN as their main regional hub, in order to tackle close markets such as China.
With the enforcement of further policies, multinational companies investing in ASEAN can
99
generate important returns right in the short run. What they really need to know before
entering the market is the wide range of differences across the community.
ASEAN countries’ major differences stand in the diverse levels of economic development,
which have been determined by geographical positions, natural resources, but most of all
by the recent historical and political facts. We can find Singapore which is the financial
heart of the region, whose economy relies exclusively on service sector and attracts the
vast majority of FDI, and by the other side communist nations such as Lao and Vietnam.
While Singapore maintained the privileged position coming from its colonial past, the win
of Northern Vietnam during the American war reinforced the communist regime, which
started looking at the outside only in the late part of the 80s. Looking at the diverse levels
of taxation and FDI openness across the nations, this difference is even clearer.
In such a situation, it would be very difficult and even dangerous to design common
policies for all the member states. What ASEAN organisms have to do is try to foster the
connections and relations across the countries, which are still divided and closed with
respect to their neighbourhoods, and try to enhance the development of the poorest
states. In fact, as far as these nations can benefit relevantly from modest investments,
ASEAN should provide resources because this would lead to an increased internal
demand exploitable even by the most developed nations. Finally, with respect to the
outside, ASEAN must act as a unified entity and take advantage of its growing and
interesting market to get more favourable agreements and gain importance in the
worldwide political arena.
100
3 Strategies of the Emerging Countries: Cambodia and Lao
Cambodia and Lao have always played a marginal role in South-East Asia economy and,
with Myanmar, they represent the poorest and less developed nations. An important help
came from the enforcement of the Mekong regional cooperation, which arose from the
post-colonial period of Indo-China and the political progresses. The U.N. Commission for
Asia and Far East set up the “Committee for Coordination on the Lower Mekong Basin” in
’57, which became the Mekong River Commission in 1995. During the 90s, as peace and
stability returned among the nations, cooperation programs were started, like the Greater
Mekong Sub-region program signed in ‘92 by Asian Development Bank to link Mekong
nations and boost their economies. Then, the entry of all CLMV countries in ASEAN
community during the 90s, brought the Lower Mekong Sub-region to reach the maximum
integration among the countries, boosting trades and commercial exchanges.
By the way, the economies of Cambodia, Lao, Myanmar and Vietnam are still strongly
related to investment coming from richer economies like China, Thailand, United States
and South Korea. Manufacture occupies the second position in Cambodia and Lao PDR,
while it is the third in Myanmar, even behind services. Only Vietnam has developed an
important manufacturing sector, while in the rest of CLMV bloc, agriculture still represents
the most significant sector. Along the chapter, the economic outlooks of Cambodia and
Lao will be provided in sections 3.1 and 3.3, respectively, while in sections 3.2 and 3.4 we
will give a brief look to the incentives and subsidies provided to the investors.
The labour-intensive manufacturing started gaining importance in CLM countries since
2010. In Lao and Myanmar, garment and textile industries are growing, while in Cambodia
the production of houseware manufacture is developing. These recent progresses in
labour-intensive manufacturing do not contribute as much as the primary sector does, but
the increasing production costs in China and Thailand could perpetrate the shift in
production towards CLM countries (Kobayashi and Jin 2015).

101
Figure 21. FDI in Lao PDR and Cambodia
Source: The World Bank, 2017.
As we can see from the graphics, in the early 2000s, FDI inflows to Lao and Cambodia
improved relevantly thanks to the empowerment of integrated policies and FTAs within the
nations of the region. Anyway, they are still pretty far from their neighbouring states,
Thailand and Vietnam. In particular, if Thailand is slowing down its growth, Vietnam keeps
enlarging the difference with them, maintaining the momentum.
Figure 22. FDI in Lao PDR, Cambodia and Thailand
Source: The World Bank, 2017.
$0
$200.000.000
$400.000.000
$600.000.000
$800.000.000
$1.000.000.000
$1.200.000.000
$1.400.000.000
$1.600.000.000
$1.800.000.000
$2.000.000.000
1996 - 2015
Cambodia
Lao
$0
$2.000.000.000
$4.000.000.000
$6.000.000.000
$8.000.000.000
$10.000.000.000
$12.000.000.000
$14.000.000.000
$16.000.000.000
$18.000.000.000
1996 - 2015
Thailand
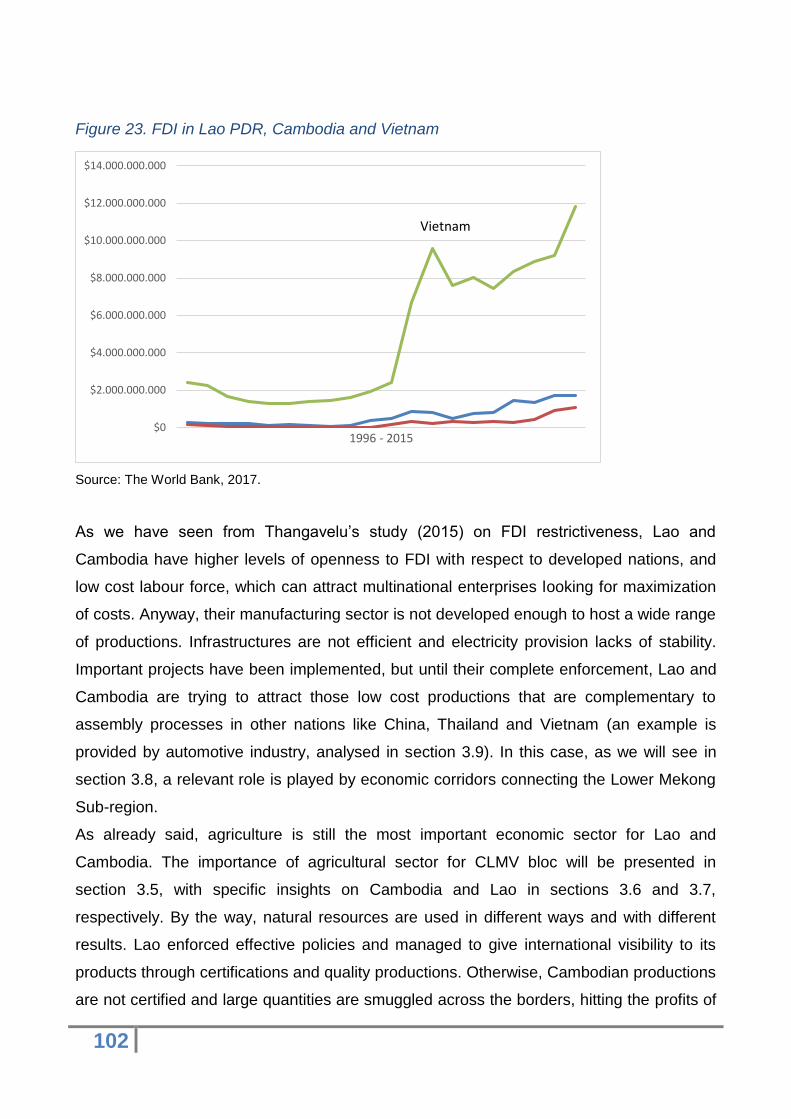
102
Figure 23. FDI in Lao PDR, Cambodia and Vietnam
Source: The World Bank, 2017.
As we have seen from Thangavelu’s study (2015) on FDI restrictiveness, Lao and
Cambodia have higher levels of openness to FDI with respect to developed nations, and
low cost labour force, which can attract multinational enterprises looking for maximization
of costs. Anyway, their manufacturing sector is not developed enough to host a wide range
of productions. Infrastructures are not efficient and electricity provision lacks of stability.
Important projects have been implemented, but until their complete enforcement, Lao and
Cambodia are trying to attract those low cost productions that are complementary to
assembly processes in other nations like China, Thailand and Vietnam (an example is
provided by automotive industry, analysed in section 3.9). In this case, as we will see in
section 3.8, a relevant role is played by economic corridors connecting the Lower Mekong
Sub-region.
As already said, agriculture is still the most important economic sector for Lao and
Cambodia. The importance of agricultural sector for CLMV bloc will be presented in
section 3.5, with specific insights on Cambodia and Lao in sections 3.6 and 3.7,
respectively. By the way, natural resources are used in different ways and with different
results. Lao enforced effective policies and managed to give international visibility to its
products through certifications and quality productions. Otherwise, Cambodian productions
are not certified and large quantities are smuggled across the borders, hitting the profits of
$0
$2.000.000.000
$4.000.000.000
$6.000.000.000
$8.000.000.000
$10.000.000.000
$12.000.000.000
$14.000.000.000
1996 - 2015
Vietnam
103
small land-owners. Then, there is the matter of hydric resources exploitation of the rivers
that are used by Lao to irrigate plantations and to produce electricity, but causes droughts
in Cambodia. In this cases ASEAN has to implement common policies in order to manage
natural resources fairly and maximize the outputs of agricultural productions, through
common projects, certifications, consortia and trade channels.
3.1 Cambodia Economic Outlook
The economic development of Cambodia is seriously marked by its history. After the
French domination, the excessive aerial bombardments of Vietnam war, then the violent
rule of Khmer Rouge and finally the Vietnamese domination and tensions with Thailand.
An example is given by extremely poor rights and difficult access to secure land. This
because Khmer Rouge’s abolition of private ownership in 1975 made land ownership an
issue. Nowadays, the government assigns ownership rights on a 99-year lease basis,
most of times after contestable verdicts. Almost the 60% of Supreme Court cases deals
with land disputes.
The agrarian economy is heavily supported by Mekong river and the country is exposed to
the arbitration actions of the upstream countries, especially Lao and China which can
dispose about Tonle Sap and Mekong rivers. Since these actors are exploiting these river
flows, especially Lao for plantations and electricity generation, Cambodia is running short
of hydric resources in these last years.
After the Paris Peace Agreement of 1991, the country became seriously dependent on
foreign aids. Official Development Assistance (ODA) overcame the 10% of the Gross
Domestic Product. Foreign Direct Investments had been largely overhauling ODA even in
2007. Moreover, Cambodia counts the highest ratio of NGO’s per person. These
continuous ODI streams imply that the domestic tax effort is pretty weak and, probably, the
government relies too much on foreign donors and NGOs to fund key public sectors like
education and healthcare. Donors’ presence affects even the distribution and the
development of the urban centres like the capital of Phnom Penh and Siem Reap, close to
Angkor Wat temples, because of the growing donors’ expenditure for structures and social
programs in those cities. There are even cases where some Cambodians receive donor
salaries which are 5 times higher than those of the public sector.
104
In 1994, the Council for the Development of Cambodia (CDC) enacted the Law on
Investment, and one year later the investment amount was 2.3 billion US$. In 2008,
approved investment increased to 10.89 billion US$, where 106.73 million US$ were
addressed to agriculture, while services and tourism sectors attracted 1.29 and 8.77 billion
US$ respectively. In 2015, investments reached 25.75 billion US$.
Of the total Foreign Direct Investment registered in the latest period, the largest amount
came from China (almost 24%), the source of important investments in the fields of
resource development, including rubber, and tourism. Then we find South Korea with more
than 10% of the total amount. The other relevant players are Malaysia, Taiwan, Hong
Kong, and Thailand, whose investments originate especially from garment and shoes
MNEs (Council for the development of Cambodia, 2016).
From 1993 to 2003, the economy saw a rapid growth with a yearly average of 7.6%,
overcoming the 10% from 2004 to 2007. Because of the global financial crisis of 2008, the
trends dropped from 6.7% in the same year to 0.1% in 2009. The 1997-98 Asian financial
crises did not provoke such a relevant impact on the national economy because of the
isolation from the regional financial markets. On the other side, the 2008 global recession
hit greatly during 2009, since the garments industry and tourism are heavily dependent on
the Western Markets. Short term capital flows fell, bringing to the failure of some building
plans in the capital city, to which banks were importantly exposed. This could be a cause
of National Bank’s cautiousness of enhancing International banking practices (Singh and
Das 2015).
As we have already seen, nominal GDP at current value amounted to approximately 15.35
billion US$ in 2013, 16.90 billion US$ in 2014 and around 18.46 billion US$ in 2015. GDP
per capita also increased steadily from 1,043 US$ in 2013 to more than 1,198 US$ in
2015. Inflation is still stable around 3% because of the heavy dollarization. Looking at the
past, manufacturing as a percentage of GDP reached about 15% yearly but it is strongly
dependent on garments, while agriculture has decreased from 55% to 33% in less than 25
years. Industry improved importantly from 2000 to 2005, but mining is still small despite
the positive trend. Taking into account the low income economy, Cambodia has a large
service sector, mostly because of tourism and connected activities like hotels,
transportations and restaurants (Singh and Das 2015).
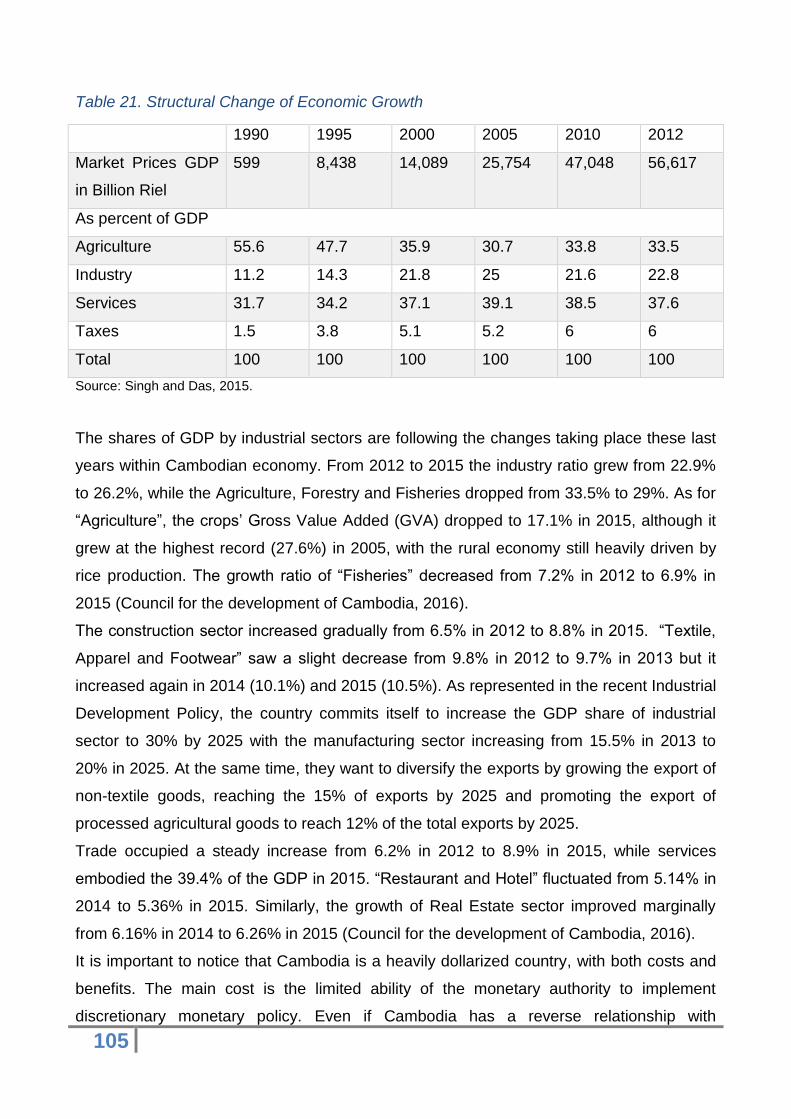
105
Table 21. Structural Change of Economic Growth
1990 1995 2000 2005 2010 2012
Market Prices GDP
in Billion Riel
599 8,438 14,089 25,754 47,048 56,617
As percent of GDP
Agriculture 55.6 47.7 35.9 30.7 33.8 33.5
Industry 11.2 14.3 21.8 25 21.6 22.8
Services 31.7 34.2 37.1 39.1 38.5 37.6
Taxes 1.5 3.8 5.1 5.2 6 6
Total 100 100 100 100 100 100
Source: Singh and Das, 2015.
The shares of GDP by industrial sectors are following the changes taking place these last
years within Cambodian economy. From 2012 to 2015 the industry ratio grew from 22.9%
to 26.2%, while the Agriculture, Forestry and Fisheries dropped from 33.5% to 29%. As for
“Agriculture”, the crops’ Gross Value Added (GVA) dropped to 17.1% in 2015, although it
grew at the highest record (27.6%) in 2005, with the rural economy still heavily driven by
rice production. The growth ratio of “Fisheries” decreased from 7.2% in 2012 to 6.9% in
2015 (Council for the development of Cambodia, 2016).
The construction sector increased gradually from 6.5% in 2012 to 8.8% in 2015. “Textile,
Apparel and Footwear” saw a slight decrease from 9.8% in 2012 to 9.7% in 2013 but it
increased again in 2014 (10.1%) and 2015 (10.5%). As represented in the recent Industrial
Development Policy, the country commits itself to increase the GDP share of industrial
sector to 30% by 2025 with the manufacturing sector increasing from 15.5% in 2013 to
20% in 2025. At the same time, they want to diversify the exports by growing the export of
non-textile goods, reaching the 15% of exports by 2025 and promoting the export of
processed agricultural goods to reach 12% of the total exports by 2025.
Trade occupied a steady increase from 6.2% in 2012 to 8.9% in 2015, while services
embodied the 39.4% of the GDP in 2015. “Restaurant and Hotel” fluctuated from 5.14% in
2014 to 5.36% in 2015. Similarly, the growth of Real Estate sector improved marginally
from 6.16% in 2014 to 6.26% in 2015 (Council for the development of Cambodia, 2016).
It is important to notice that Cambodia is a heavily dollarized country, with both costs and
benefits. The main cost is the limited ability of the monetary authority to implement
discretionary monetary policy. Even if Cambodia has a reverse relationship with
106
dollarization and inflation yet being heavily dollarized means having a fixed exchange rate.
Additionally, prices of many non-traded goods may also be set in US dollars and the
higher the percent of these non-traded products, the greater the rigidity of the real
exchange rate to nominal rate. Still, it should be noted that dollarization is more an effect
than a problem, the real problem is the underdevelopment of the financial system (Singh
and Das 2015).
3.2 Cambodian Incentives and SEZ
The core of Cambodian set of incentives is still focused on agriculture and manufacturing.
Anyhow, the major problem is not the target sector itself, but the lack of effective policies
and their full enforcement. Let us see in the following sections, what are the major
incentives that Cambodian government provides to eligible projects.
3.2.1 Investment Incentives Granted to a Qualified Investment Project
The Council for the Development of Cambodia (2017) states that Qualified Investment
Projects (QIPs) can benefit of the following incentives:
Profit tax exemption (Selective): the tax holiday period is composed of “Trigger
period” + 3 years + Priority Period (for a total maximum of 9 years).
– Maximum Trigger Period: starting from the emission of the Final Registration
Certificate and ending on the last day of the taxation year immediately preceding
the earlier of:
a. if the QIP generates a profit, the taxation year that the profit is first
generated;
b. if the QIP generates income from the Investment Activity with respect to the
sale of services and goods, the third taxation year after the taxation year in
which the income is generated.
– Priority Period: maximum of 3 years, depending on the investment capital and
kind of project.
Special depreciation (Selective): 40% special depreciation allowance on the value
of the tangible properties used in the processing or production.
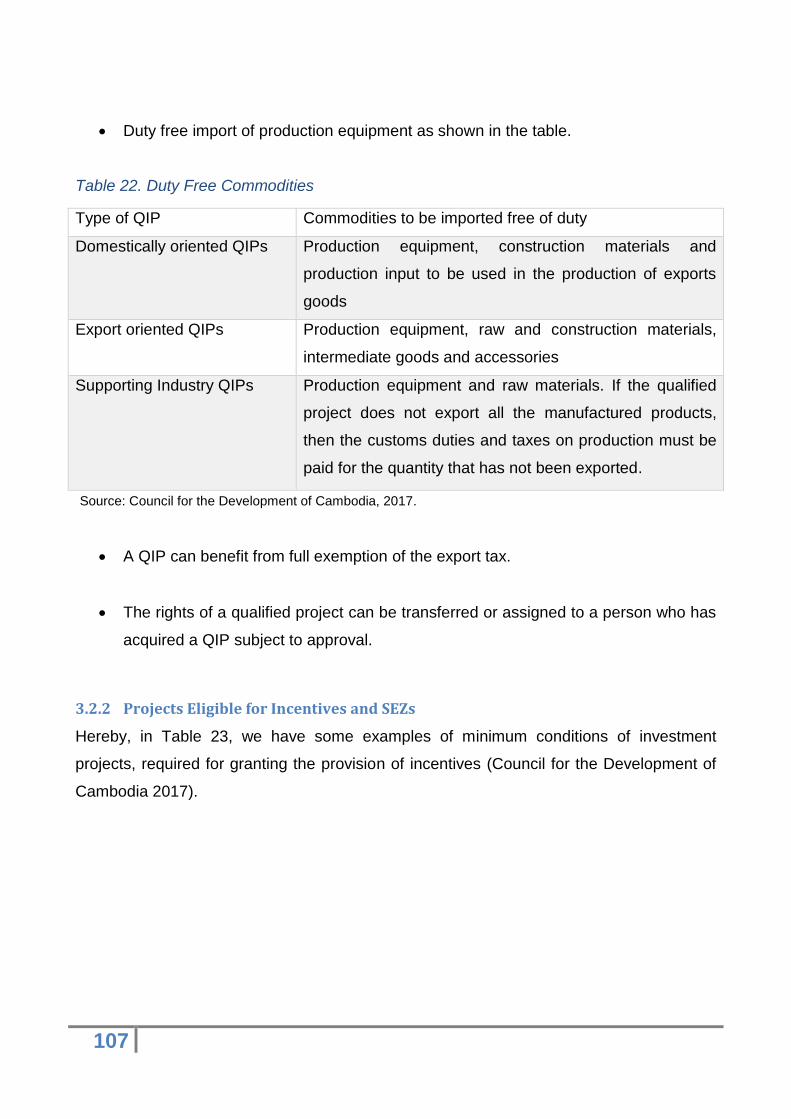
107
Duty free import of production equipment as shown in the table.
Table 22. Duty Free Commodities
Type of QIP Commodities to be imported free of duty
Domestically oriented QIPs Production equipment, construction materials and
production input to be used in the production of exports
goods
Export oriented QIPs Production equipment, raw and construction materials,
intermediate goods and accessories
Supporting Industry QIPs Production equipment and raw materials. If the qualified
project does not export all the manufactured products,
then the customs duties and taxes on production must be
paid for the quantity that has not been exported.
Source: Council for the Development of Cambodia, 2017.
A QIP can benefit from full exemption of the export tax.
The rights of a qualified project can be transferred or assigned to a person who has
acquired a QIP subject to approval.
3.2.2 Projects Eligible for Incentives and SEZs
Hereby, in Table 23, we have some examples of minimum conditions of investment
projects, required for granting the provision of incentives (Council for the Development of
Cambodia 2017).
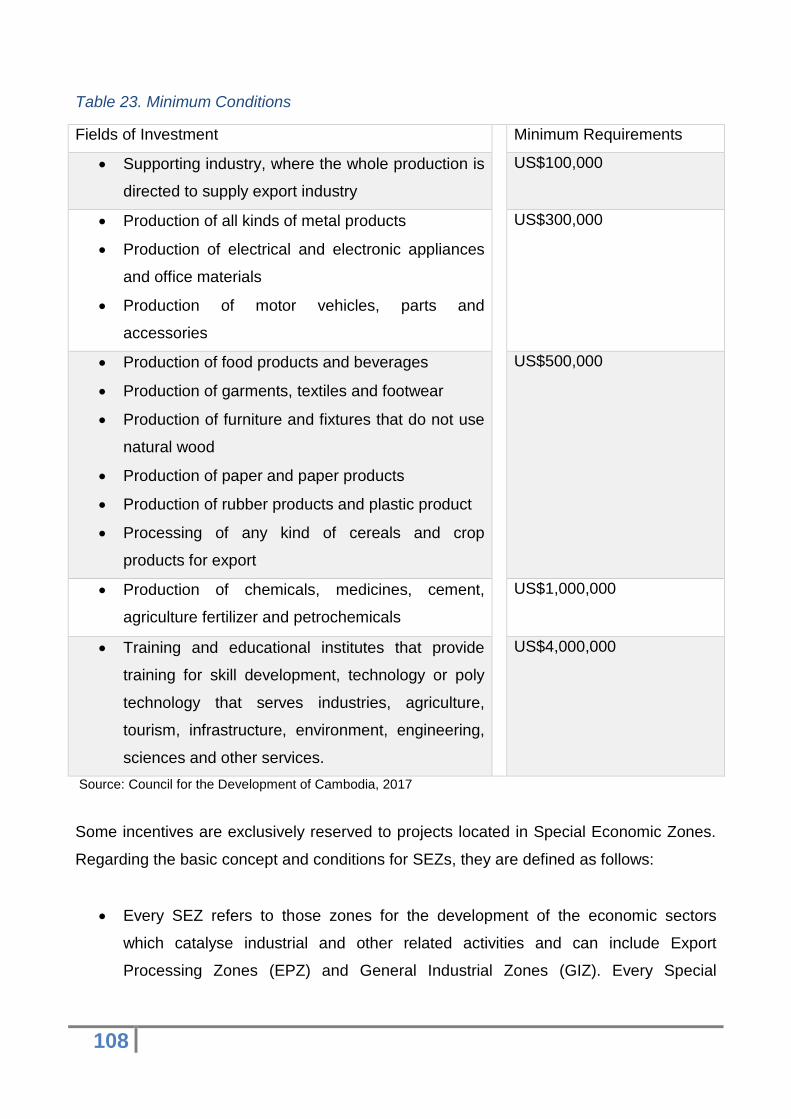
108
Table 23. Minimum Conditions
Fields of Investment Minimum Requirements
Supporting industry, where the whole production is
directed to supply export industry
US$100,000
Production of all kinds of metal products
Production of electrical and electronic appliances
and office materials
Production of motor vehicles, parts and
accessories
US$300,000
Production of food products and beverages
Production of garments, textiles and footwear
Production of furniture and fixtures that do not use
natural wood
Production of paper and paper products
Production of rubber products and plastic product
Processing of any kind of cereals and crop
products for export
US$500,000
Production of chemicals, medicines, cement,
agriculture fertilizer and petrochemicals
US$1,000,000
Training and educational institutes that provide
training for skill development, technology or poly
technology that serves industries, agriculture,
tourism, infrastructure, environment, engineering,
sciences and other services.
US$4,000,000
Source: Council for the Development of Cambodia, 2017
Some incentives are exclusively reserved to projects located in Special Economic Zones.
Regarding the basic concept and conditions for SEZs, they are defined as follows:
Every SEZ refers to those zones for the development of the economic sectors
which catalyse industrial and other related activities and can include Export
Processing Zones (EPZ) and General Industrial Zones (GIZ). Every Special
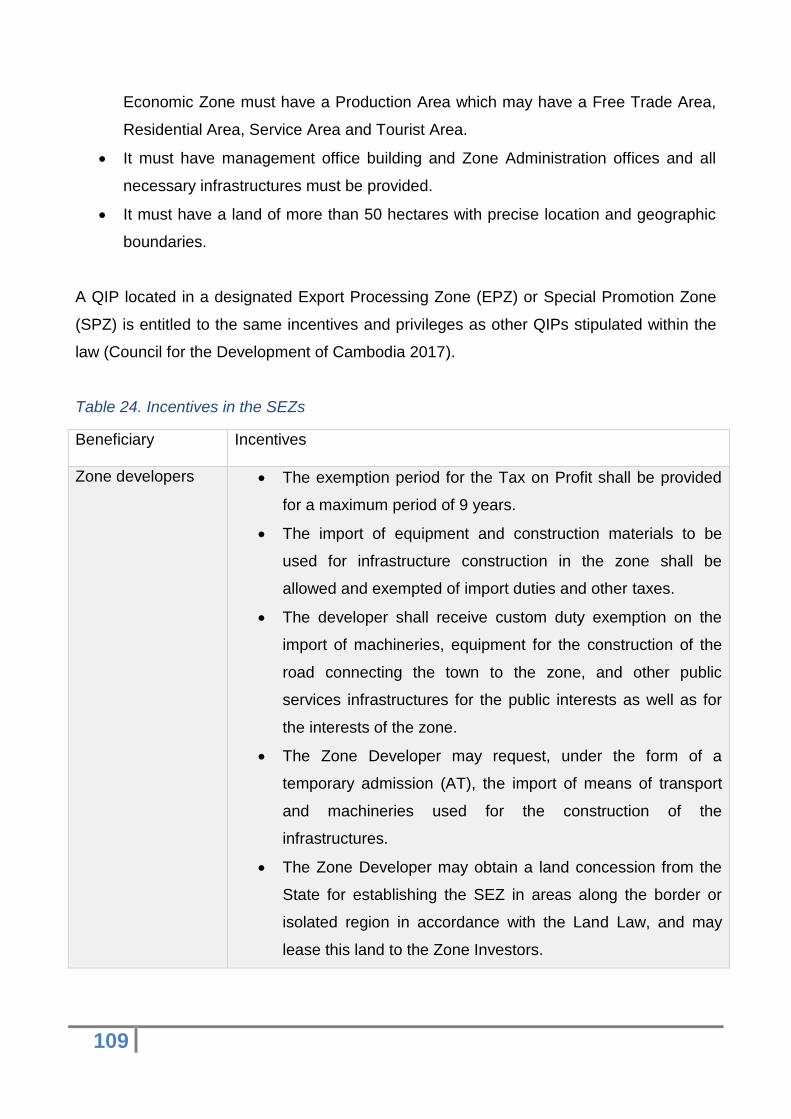
109
Economic Zone must have a Production Area which may have a Free Trade Area,
Residential Area, Service Area and Tourist Area.
It must have management office building and Zone Administration offices and all
necessary infrastructures must be provided.
It must have a land of more than 50 hectares with precise location and geographic
boundaries.
A QIP located in a designated Export Processing Zone (EPZ) or Special Promotion Zone
(SPZ) is entitled to the same incentives and privileges as other QIPs stipulated within the
law (Council for the Development of Cambodia 2017).
Table 24. Incentives in the SEZs
Beneficiary Incentives
Zone developers The exemption period for the Tax on Profit shall be provided
for a maximum period of 9 years.
The import of equipment and construction materials to be
used for infrastructure construction in the zone shall be
allowed and exempted of import duties and other taxes.
The developer shall receive custom duty exemption on the
import of machineries, equipment for the construction of the
road connecting the town to the zone, and other public
services infrastructures for the public interests as well as for
the interests of the zone.
The Zone Developer may request, under the form of a
temporary admission (AT), the import of means of transport
and machineries used for the construction of the
infrastructures.
The Zone Developer may obtain a land concession from the
State for establishing the SEZ in areas along the border or
isolated region in accordance with the Land Law, and may
lease this land to the Zone Investors.
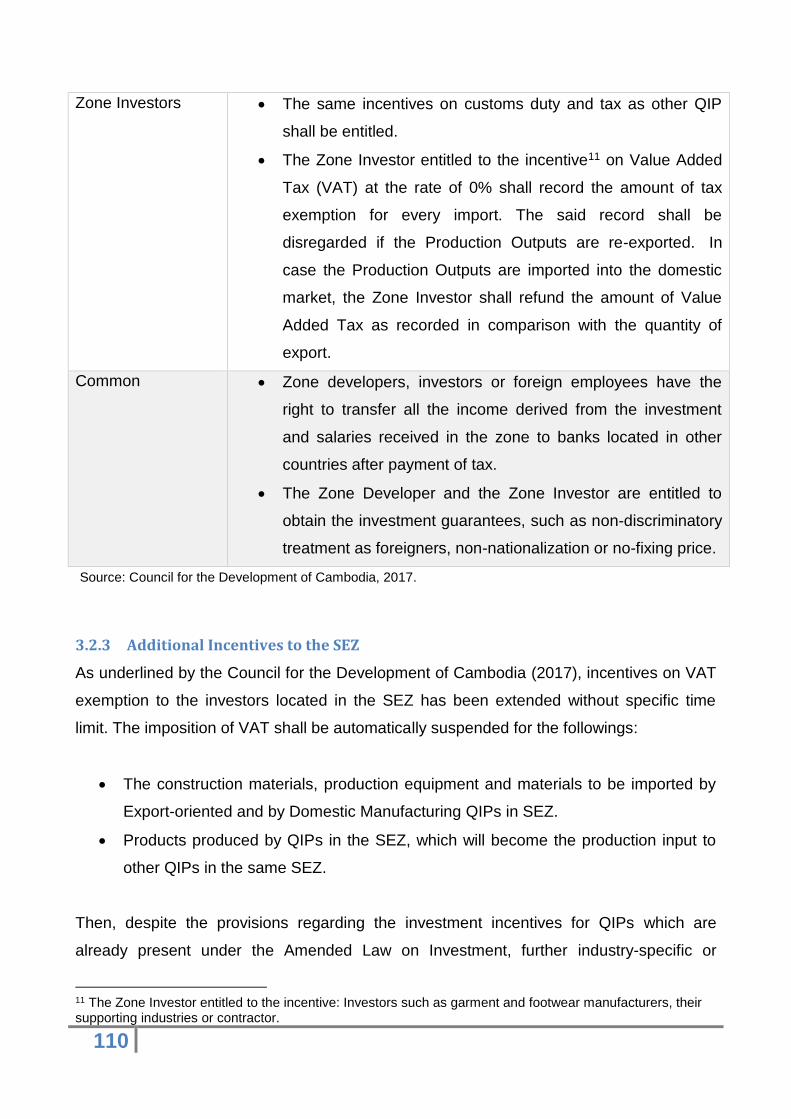
110
Zone Investors The same incentives on customs duty and tax as other QIP
shall be entitled.
The Zone Investor entitled to the incentive11 on Value Added
Tax (VAT) at the rate of 0% shall record the amount of tax
exemption for every import. The said record shall be
disregarded if the Production Outputs are re-exported. In
case the Production Outputs are imported into the domestic
market, the Zone Investor shall refund the amount of Value
Added Tax as recorded in comparison with the quantity of
export.
Common Zone developers, investors or foreign employees have the
right to transfer all the income derived from the investment
and salaries received in the zone to banks located in other
countries after payment of tax.
The Zone Developer and the Zone Investor are entitled to
obtain the investment guarantees, such as non-discriminatory
treatment as foreigners, non-nationalization or no-fixing price.
Source: Council for the Development of Cambodia, 2017.
3.2.3 Additional Incentives to the SEZ
As underlined by the Council for the Development of Cambodia (2017), incentives on VAT
exemption to the investors located in the SEZ has been extended without specific time
limit. The imposition of VAT shall be automatically suspended for the followings:
The construction materials, production equipment and materials to be imported by
Export-oriented and by Domestic Manufacturing QIPs in SEZ.
Products produced by QIPs in the SEZ, which will become the production input to
other QIPs in the same SEZ.
Then, despite the provisions regarding the investment incentives for QIPs which are
already present under the Amended Law on Investment, further industry-specific or
11 The Zone Investor entitled to the incentive: Investors such as garment and footwear manufacturers, their supporting industries or contractor.
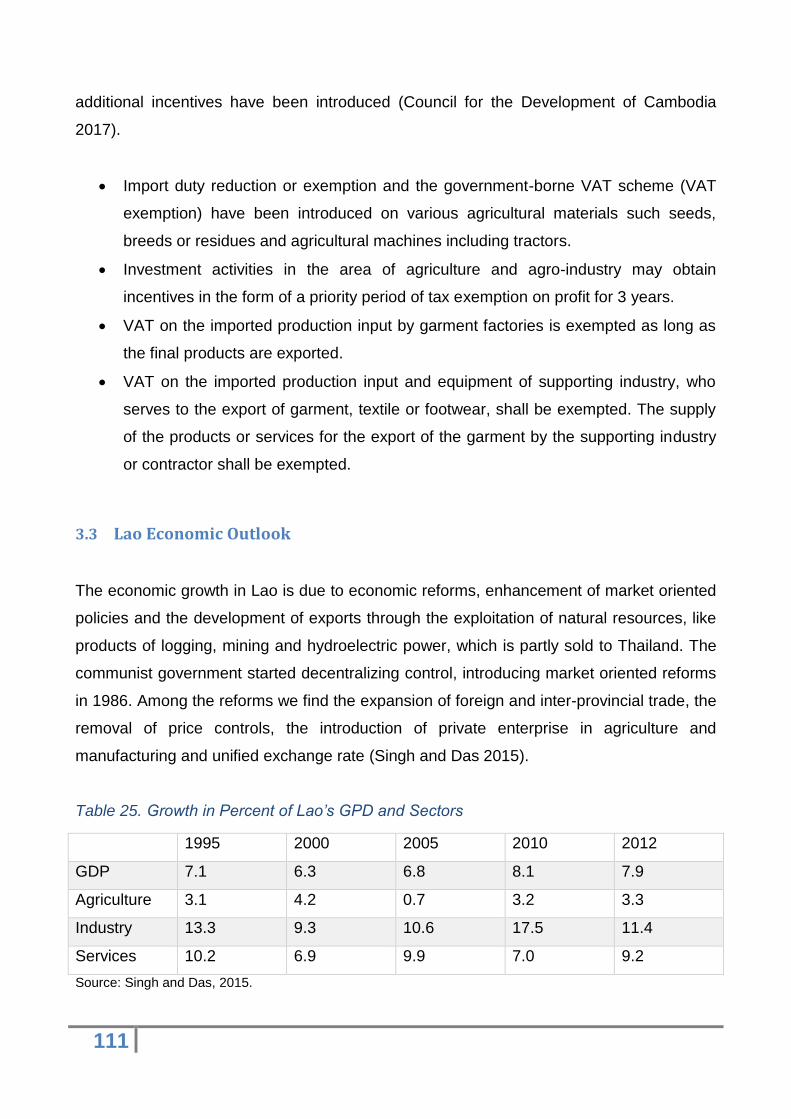
111
additional incentives have been introduced (Council for the Development of Cambodia
2017).
Import duty reduction or exemption and the government-borne VAT scheme (VAT
exemption) have been introduced on various agricultural materials such seeds,
breeds or residues and agricultural machines including tractors.
Investment activities in the area of agriculture and agro-industry may obtain
incentives in the form of a priority period of tax exemption on profit for 3 years.
VAT on the imported production input by garment factories is exempted as long as
the final products are exported.
VAT on the imported production input and equipment of supporting industry, who
serves to the export of garment, textile or footwear, shall be exempted. The supply
of the products or services for the export of the garment by the supporting industry
or contractor shall be exempted.
3.3 Lao Economic Outlook
The economic growth in Lao is due to economic reforms, enhancement of market oriented
policies and the development of exports through the exploitation of natural resources, like
products of logging, mining and hydroelectric power, which is partly sold to Thailand. The
communist government started decentralizing control, introducing market oriented reforms
in 1986. Among the reforms we find the expansion of foreign and inter-provincial trade, the
removal of price controls, the introduction of private enterprise in agriculture and
manufacturing and unified exchange rate (Singh and Das 2015).
Table 25. Growth in Percent of Lao’s GPD and Sectors
1995 2000 2005 2010 2012
GDP 7.1 6.3 6.8 8.1 7.9
Agriculture 3.1 4.2 0.7 3.2 3.3
Industry 13.3 9.3 10.6 17.5 11.4
Services 10.2 6.9 9.9 7.0 9.2
Source: Singh and Das, 2015.
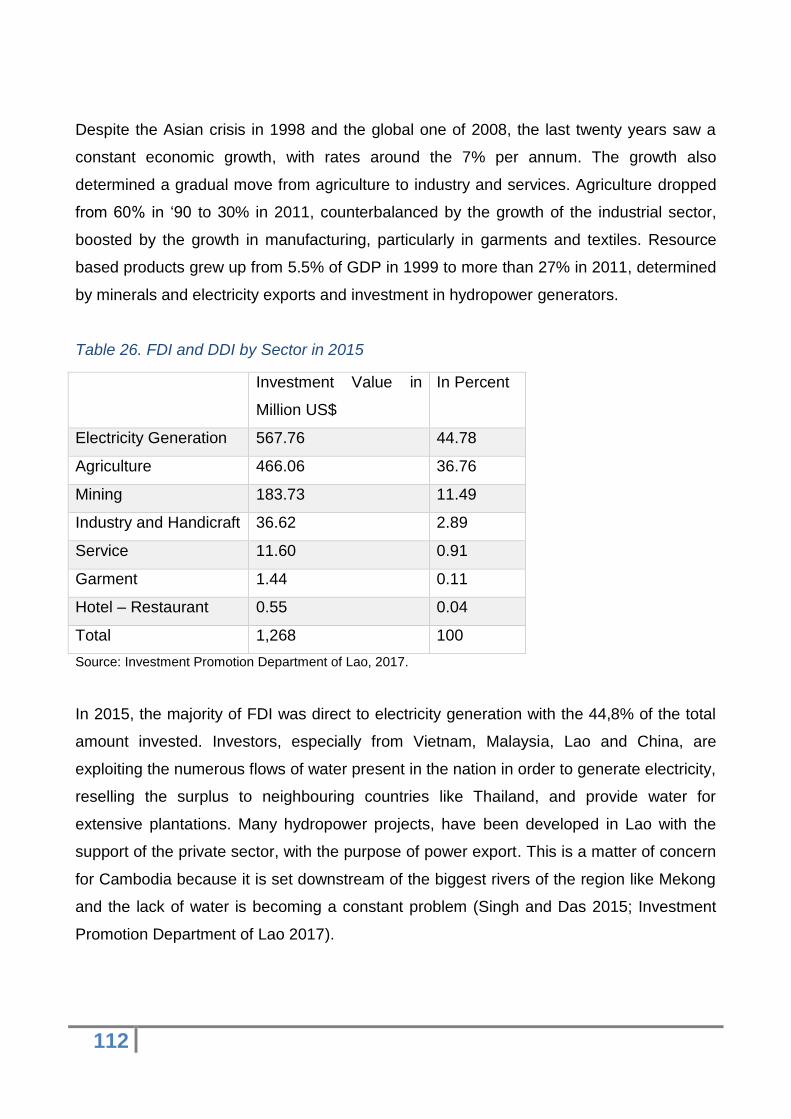
112
Despite the Asian crisis in 1998 and the global one of 2008, the last twenty years saw a
constant economic growth, with rates around the 7% per annum. The growth also
determined a gradual move from agriculture to industry and services. Agriculture dropped
from 60% in ‘90 to 30% in 2011, counterbalanced by the growth of the industrial sector,
boosted by the growth in manufacturing, particularly in garments and textiles. Resource
based products grew up from 5.5% of GDP in 1999 to more than 27% in 2011, determined
by minerals and electricity exports and investment in hydropower generators.
Table 26. FDI and DDI by Sector in 2015
Investment Value in
Million US$
In Percent
Electricity Generation 567.76 44.78
Agriculture 466.06 36.76
Mining 183.73 11.49
Industry and Handicraft 36.62 2.89
Service 11.60 0.91
Garment 1.44 0.11
Hotel – Restaurant 0.55 0.04
Total 1,268 100
Source: Investment Promotion Department of Lao, 2017.
In 2015, the majority of FDI was direct to electricity generation with the 44,8% of the total
amount invested. Investors, especially from Vietnam, Malaysia, Lao and China, are
exploiting the numerous flows of water present in the nation in order to generate electricity,
reselling the surplus to neighbouring countries like Thailand, and provide water for
extensive plantations. Many hydropower projects, have been developed in Lao with the
support of the private sector, with the purpose of power export. This is a matter of concern
for Cambodia because it is set downstream of the biggest rivers of the region like Mekong
and the lack of water is becoming a constant problem (Singh and Das 2015; Investment
Promotion Department of Lao 2017).
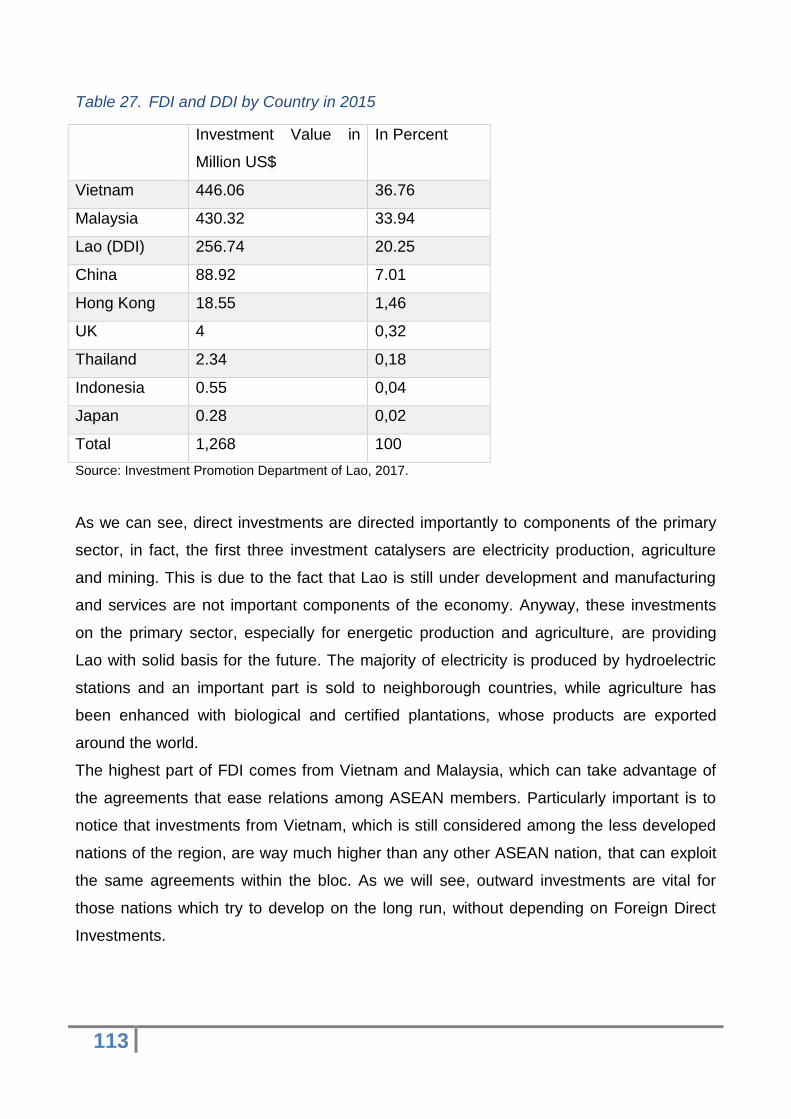
113
Table 27. FDI and DDI by Country in 2015
Investment Value in
Million US$
In Percent
Vietnam 446.06 36.76
Malaysia 430.32 33.94
Lao (DDI) 256.74 20.25
China 88.92 7.01
Hong Kong 18.55 1,46
UK 4 0,32
Thailand 2.34 0,18
Indonesia 0.55 0,04
Japan 0.28 0,02
Total 1,268 100
Source: Investment Promotion Department of Lao, 2017.
As we can see, direct investments are directed importantly to components of the primary
sector, in fact, the first three investment catalysers are electricity production, agriculture
and mining. This is due to the fact that Lao is still under development and manufacturing
and services are not important components of the economy. Anyway, these investments
on the primary sector, especially for energetic production and agriculture, are providing
Lao with solid basis for the future. The majority of electricity is produced by hydroelectric
stations and an important part is sold to neighborough countries, while agriculture has
been enhanced with biological and certified plantations, whose products are exported
around the world.
The highest part of FDI comes from Vietnam and Malaysia, which can take advantage of
the agreements that ease relations among ASEAN members. Particularly important is to
notice that investments from Vietnam, which is still considered among the less developed
nations of the region, are way much higher than any other ASEAN nation, that can exploit
the same agreements within the bloc. As we will see, outward investments are vital for
those nations which try to develop on the long run, without depending on Foreign Direct
Investments.
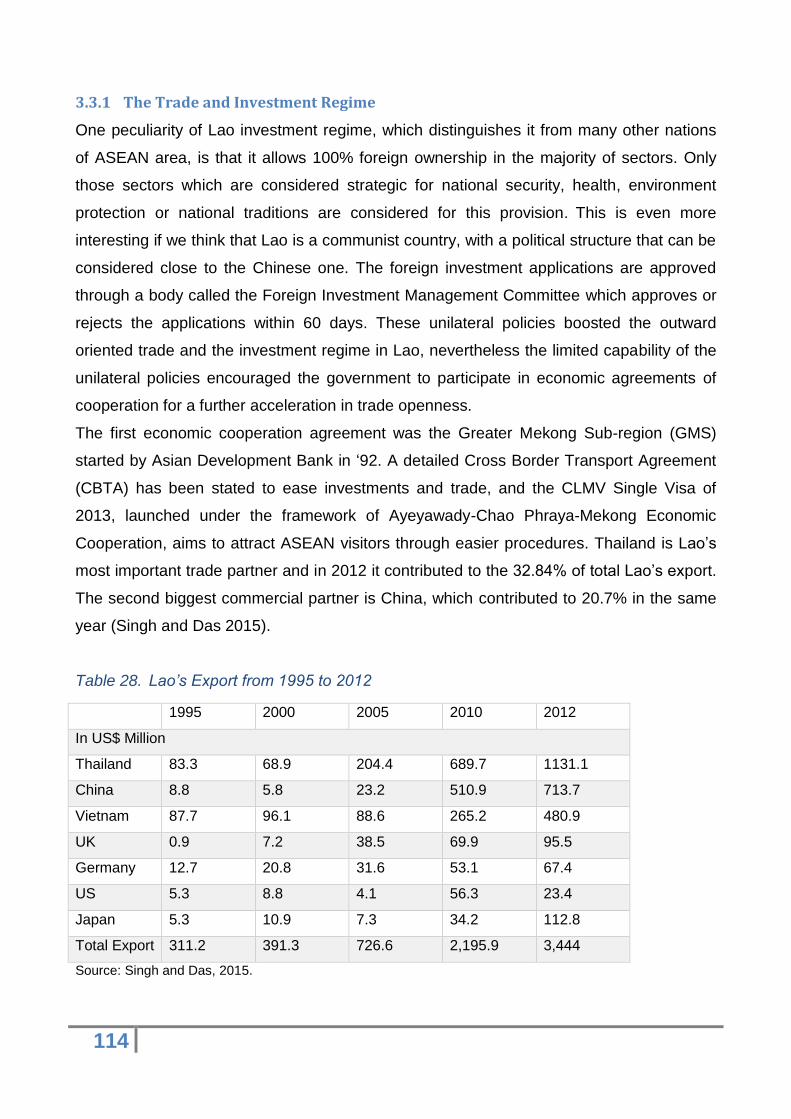
114
3.3.1 The Trade and Investment Regime
One peculiarity of Lao investment regime, which distinguishes it from many other nations
of ASEAN area, is that it allows 100% foreign ownership in the majority of sectors. Only
those sectors which are considered strategic for national security, health, environment
protection or national traditions are considered for this provision. This is even more
interesting if we think that Lao is a communist country, with a political structure that can be
considered close to the Chinese one. The foreign investment applications are approved
through a body called the Foreign Investment Management Committee which approves or
rejects the applications within 60 days. These unilateral policies boosted the outward
oriented trade and the investment regime in Lao, nevertheless the limited capability of the
unilateral policies encouraged the government to participate in economic agreements of
cooperation for a further acceleration in trade openness.
The first economic cooperation agreement was the Greater Mekong Sub-region (GMS)
started by Asian Development Bank in ‘92. A detailed Cross Border Transport Agreement
(CBTA) has been stated to ease investments and trade, and the CLMV Single Visa of
2013, launched under the framework of Ayeyawady-Chao Phraya-Mekong Economic
Cooperation, aims to attract ASEAN visitors through easier procedures. Thailand is Lao’s
most important trade partner and in 2012 it contributed to the 32.84% of total Lao’s export.
The second biggest commercial partner is China, which contributed to 20.7% in the same
year (Singh and Das 2015).
Table 28. Lao’s Export from 1995 to 2012
1995 2000 2005 2010 2012
In US$ Million
Thailand 83.3 68.9 204.4 689.7 1131.1
China 8.8 5.8 23.2 510.9 713.7
Vietnam 87.7 96.1 88.6 265.2 480.9
UK 0.9 7.2 38.5 69.9 95.5
Germany 12.7 20.8 31.6 53.1 67.4
US 5.3 8.8 4.1 56.3 23.4
Japan 5.3 10.9 7.3 34.2 112.8
Total Export 311.2 391.3 726.6 2,195.9 3,444
Source: Singh and Das, 2015.
115
3.3.2 Protection Policy
Lao, along with other new ASEAN members, acts on a two-tier tariff system with a different
Common Effective Preferential Tariff (CEPT) and favoured nation rate for each tariff line.
As a consequence, Lao had to subscribe many different FTAs to become part of the
ASEAN. The multiple rate system creates distortions and reduces welfare of an economy,
unlike the multilateralised single rate system, which avoid trade diversion and it has
become a necessity, recognizing the administrative capacity constraints.
The domestic absorption of the revenues coming from natural resources destabilises the
competitiveness of the traditionally traded goods industries. The levels of Lao foreign
exchange reserves increased from 3% of the GDP Share in 1992 to 11% in 2003 and did
not change relevantly until these years. Then, we have to notice that capacity of Lao PDR
to implement efficient and productive use of new sources of revenue is limited, therefore
caution and restraints should be implemented in the short run (Singh and Das 2015).
3.4 Lao Incentives and SEZs
Even if incentives provided by Lao are not that far with respect to the Cambodian ones,
they have been much more effective and their full enforcement brought remarkable results.
The major investment incentives provided by Lao PDR are represented by (Lao
Investment Promotion Department 2017):
Exemption from profit taxation in the following accounting year, if the net profit from
business activities is used for business operations;
Losses can be carried forward for three consecutive accounting years;
CIT exemption up to 10 years based on location (4 – 10 years for projects located in
zone 1, 2 – 6 years for zone 2 and 1 – 4 years for zone 3);
Exemption from import duties for imported raw material, equipment, vehicles and
spare parts directly used for production;
Exemption from import duties for exportation of general goods and products.
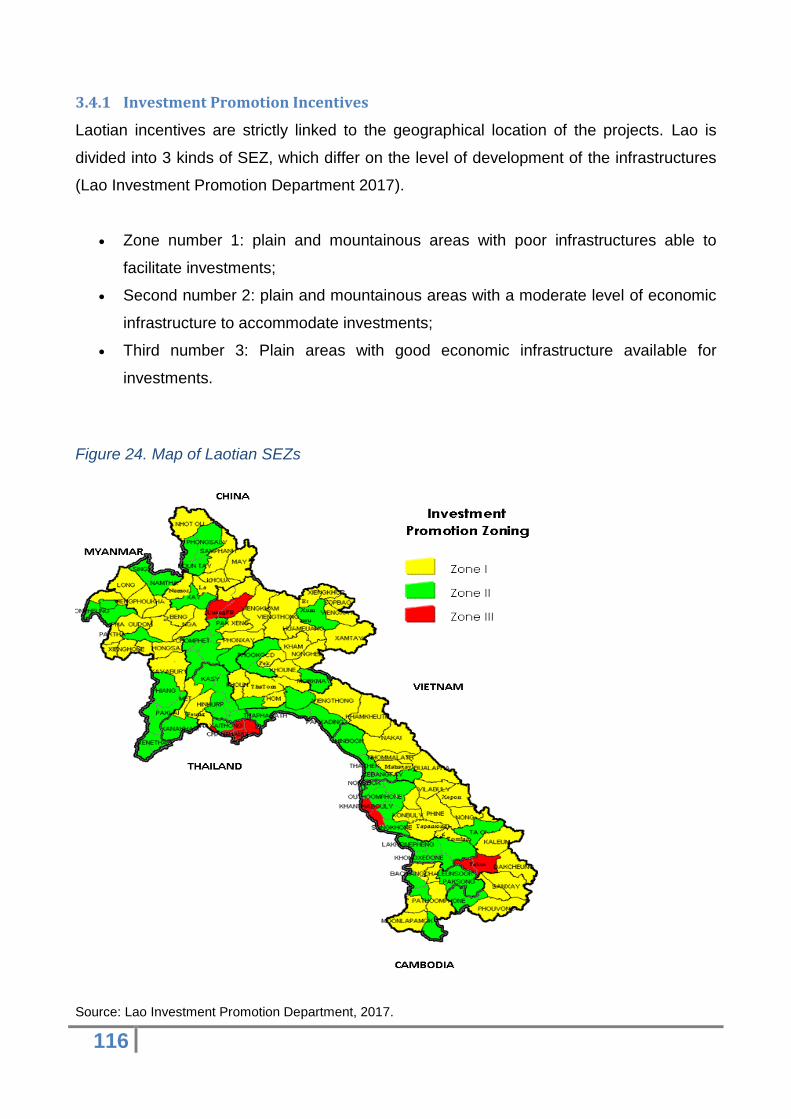
116
3.4.1 Investment Promotion Incentives
Laotian incentives are strictly linked to the geographical location of the projects. Lao is
divided into 3 kinds of SEZ, which differ on the level of development of the infrastructures
(Lao Investment Promotion Department 2017).
Zone number 1: plain and mountainous areas with poor infrastructures able to
facilitate investments;
Second number 2: plain and mountainous areas with a moderate level of economic
infrastructure to accommodate investments;
Third number 3: Plain areas with good economic infrastructure available for
investments.
Figure 24. Map of Laotian SEZs
Source: Lao Investment Promotion Department, 2017.

117
According to the Investment Promotion Law (IP Law), the promoted sectors are
agriculture, industry, handicraft and services. After the different SEZs, promoted sectors
activities are classified by the government into three further levels for every Special
Economic Zone. This further classification coincides to different tax exemption on
corporate income and depends on the specific field of investment.
Table 29. Incentive on Corporate Income Taxation
Lao Investment Promotion Department, 2017.
Specific exemptions are applied to investments for the development of schools, hospitals,
kindergartens, research centres, universities, colleges, universities and some public
utilities. They can obtain the exemption rental or land concession up to 15, 10 or 3 years
for zone 1, 2 or 3, respectively. Then, additional 5 years are provided for cooperate profits
tax exemption (Lao Investment Promotion Department 2017).
3.4.2 Further Promotion and Non-Tax Incentives
Regular Import duty rates stands between 3% and 40%, depending on the kind of the
imported goods. After profit tax incentives, investors are entitled to customs duty and tax
incentives, as follows (Lao Investment Promotion Department 2017):
• Exemption from import duties for the importation of raw material and equipment
directly used for production. However, exemption of import tax must observe
specific laws.
Promoted sectors Zone Level Years of Exemption
Agriculture
Industry
Handicraft
Service
1 I 10
II 6
III 4
2 I 8
II 4
III 2
3 I 4
II 2
III 1
118
• Exemption from export duties for general goods and products. The exportation of
natural resources and natural resources-made products must observe current
regulations. Then, importations of fuel are not exempted from taxes and duties.
• Exemption from profit tax in the next accounting year, if the net profit from business
activities is used for business expansion.
• If an investor suffers losses after completion of tax finalization with the tax office,
the investor is allowed to carry the loss forward to 3 consecutive accounting years.
After the period, remaining losses cannot be deducted. For SEZs, the provision of
incentive treatment must follow the compliance with the Decree on the
Establishment and Activities of respective zone.
Then, the government grants assurances against expropriation or nationalization without
any kind of compensation. The following incentives are granted to all foreign investors
(Lao Investment Promotion Department 2017):
• Permission to lease land, up to 20 years, from a Lao national and up to 50 years
from the government;
• Permission to own all improvements and structures on the leased land and
permission to dispose of the improvements or structures on it;
• Facilitation of visa and work permits for foreign skilled labour force if no Laotian is
available to work on the projects.
Laotian government does not provide any incentive for import protection and it does not
provide measures to restrict further entries to reduce competition.
3.5 The Importance of the Agricultural Sector in CLMV Countries
The CLMV economies became a part of the ASEAN in the second half of the 1990’s.
Despite the potential, the main challenge that CLMV faces is its development gap with the
older members of the ASEAN Community. During the second half of the 20th century,
political developments had a strong impact on these countries contributing to diverse
developments of the region.
119
The primary sector is the most important component of the sectoral composition in CLMV
countries. In fact, only Vietnam has a relevant manufacturing sector, but it plays a
secondary role in Lao and Cambodia, and it is the third sector in Burma, behind agriculture
and services. This fact can be seen in the trade products of these states as well. Products
from the primary sectors are their most important exports. For example, Lao is considered
the ASEAN’s battery because it can generate an important quantity of electricity and sell
part of it to Thailand. Finally, this implies that these economies lack in diversification
(Kobayashi and Jin 2015).
Anyway, the importance of labour-intensive manufacture is increasing in CLM bloc in the
last years. In Lao and Myanmar, garment and textile industry is growing, while in
Cambodia, there is an increase even in manufacturing houseware products and shoes.
Labour-intensive productions are still not contributing as the primary sectors but the
increasing wages in Thailand suggest that the tendency to shift productions to CLM
countries is going to continue (Kobayashi and Jin 2015).
Agriculture in CLMV states has been improving through last decades, but there are still
many challenges. Constant volatility in worldwide prices is pushing FDI from food-deficit
states to those nations having either a traditional surplus of food production or under-
utilized territory. Subsidizing small farmers beyond sustenance would contribute to poverty
reduction and food security for poorest nations of ASEAN. Moreover, green products are
an effective way to move from traditional agriculture to a market-oriented production,
allowing those poor countries to be a player of the retail marketing systems and global
agro-food value chains (Stillman and Rillo 2015).
Usually, medium and small landowners can be good stewards and innovators, but they are
generally short on resources and knowledge, so a cooperation between privates and
governments is necessary to ensure successful and equitable outputs for agri-business in
poorest communities. For example, Lao and Cambodia started experimenting agricultural
diversification towards industrial and high-value crops, with remarkable results, taking
advantage from existing projects in ASEAN neighbours like Thailand. As experienced by
Vietnam during recession years, agricultural sector is able to grow progressively despite of
the macroeconomic stagnation, contributing to net export surpluses. Consequently,
constant progresses in agricultural production are being pursued by CLMV nations
(Stillman and Rillo 2015).
120
3.6 Agriculture in Cambodian Economy
Fostering the agricultural production in Cambodia requires focusing on the major elements
of the value chains, which are production, processing and marketing. Productivity
constraints affecting Cambodian environment include limited availability of high-quality
seeds, elevated energy costs, inadequate infrastructure like irrigation and rural roads,
limited credit access, a lack of national branding, limited export promotion programs and
unsustainable agricultural and natural resource management practices. There is even a
need for educating farmers and supporting their organization through regulatory
framework. The most critical fact is represented by the absence of agro-processing
companies which are able to diversify agricultural productions and connect them to
domestic market and exportation (Stillman and Rillo 2015).
Governmental plan for agricultural productivity aims to increase productivity,
diversification, and commercialization throughout value chain improvement, implementing
the “National Strategic Plan on Green Development 2013–2030,” which makes general
provisions for increasing and sustaining agricultural productivity within a framework of
poverty reduction, food security, and environmental sustainability.
The national Policy on the Promotion of Diversified Agricultural Production and Green
Products Export coordinates initiatives with countries experiencing the same challenges,
like Lao PDR, Myanmar and Vietnam, in order to exploit synergies in markets accessibility
and productivity enhancement. These policy directives are emphasized in the
government’s Agriculture Sector Strategic Development Plan and makes improvement of
the agricultural sector its first aim, along with the further rehabilitation and construction of
physical infrastructure, private sector development and human resource development
(Stillman and Rillo 2015).
3.6.1 Weak Information Systems in the Agriculture Sector
Other challenges in fostering Cambodian agriculture can be identified in a lack of statistics
and poor commodities market data. There is a need for high-quality information, including
production and prices of agriculture commodities in Cambodia, since data which are
reported by authorities are not reliable. This brings uncertainty among policymakers,
traders, and farmers. Formal commodity markets are inactive or non-existent and this
absence slows down the business between buyers and sellers of Cambodian agricultural
121
commodities and obstructs information flow of supply, demand, prices, and processes
within agro-industry value chains.
Hence, the government has started an information program on agricultural commodity
prices. Yet, it has had partial success because of low quality data and narrow outreach to
the public. A further effort was the enactment of the very first Cambodian Agriculture
Census in 2013. Underinvestment mines the capability of conducting SPS monitoring,
preventing Cambodian agro-based goods to be exported to developed markets and
creating threats of unsafe agricultural products entering Cambodia. It also affects
compliance with the WTO and ASEAN. Just some products have a national standard:
milled rice, coffee powder, tapioca and cassava starch, soybeans, corn, dried chili, and
pepper (Stillman and Rillo 2015).
This lack of standards and their limited enforcement cause qualitative disparities of
domestic agricultural products and confusion in the domestic market. Another issue
mining policies effectiveness is the overlapping administrative responsibilities among
government agencies, like the Ministry of Commerce, the Ministry of Agriculture, Forestry
and Fisheries and the Ministry of Health (Stillman and Rillo 2015).
3.6.2 Limited Support and Ineffective Legal Framework
Cooperatives boost the bargaining power of farmers on the demand side, while contract
farming can be an effective method to control supply. Actually, these tools are limited in
Cambodian agriculture, even if formal provision have been implemented so far. Contract
farming seems to be successful only where monopsony conditions are present, due to the
difficult enforceability of legal agreements. Institutions are trying to promote cooperatives
in order to connect farmers to value chains through contract farming, but financial
resources for implementation are scarce. Despite the legal assurance brought in 2013 by
the law on farmers’ cooperatives, only its effective implementation can successfully
enhance cooperatives in the country (Stillman and Rillo 2015).
Ineffective legal framework, weak judicial system and the absence of enforcement
mechanisms represent a big issue for every sector in Cambodia. Corrupt practices are
widespread because of the lack of enforcement of laws and regulations and this is one of
the major constraints for all the Cambodian economic sector. For what concerns
agriculture, the enforcement of laws on seed management and since agriculture fertilizer
122
use is weak, it determined inflows of poor-quality agricultural inputs, including seeds and
fertilizers (Stillman and Rillo 2015).
3.6.3 Lack of Agri-business Financing and Insurance
The survey carried out by the World Bank in 2011 on the agri-business financing in
Cambodia (focusing on input suppliers, covering processors, machinery sellers, rice
sellers and crop collectors) disclosed that around the 90% of agri-businesses are owned
by families, where more than 20% of them have less than 50,000 US$ annual turnover and
over 20% have less than 500,000 US$ annual turnover. The majority deals with rice
selling, paddy processing, input and machinery sales and crop collecting.
Financial sector for the finance of agri-businesses turned out to be very limited. Only the
44% of the agri-businesses had bank accounts, and the 96% of them was with the four top
banks. Very few companies had accounts with microfinance institutions. Within the large
companies, only 83% owned bank accounts. About 64% had subscribed loans and the
75% of them, average size of 90,000 US$, were from banks (Stillman and Rillo 2015).
This showed that agri-businesses are largely self-financing entities. Only the 20% of
working capital of medium and large processing firms were funded through credit. Almost
91% of companies used their funds for their investments, while around 87% of companies
used their own funds to finance their working capital. In the end, informal lenders, family,
and friends are perceived by Cambodians to be better sources of finance than banks.
Microfinance has grown rapidly in Cambodia since microfinance institutions (MFIs) have
been introduced in the market. In 2011, MFIs owned almost 600 million US$ in loans
outstanding and 100 million US$ in deposits. Loans were mostly directed to farm
households and microenterprises. By the way, financial institutions do not play a relevant
role for Cambodian agricultural companies. In fact, the World Bank study revealed agri-
firms have low levels of assets to be leveraged, and usually their gross margins (their
average in 2011 was 10.5%) would not be always sufficient for the repayment of the credit.
Given all the assets of agricultural companies, around 110 million US$ of lending could be
provided and it could be also held by financial institutions; anyway, agri-businesses would
not be able to generate enough margins to pay back the debt. Then, business community
is even sceptic towards formal engagement, because they fear this can lead to taxation
and costly government inspections, distrusting financial institutions about their ability to
keep financial information confidential (Stillman and Rillo 2015).
123
So access to credit is difficult and avoided, and majority of farmers who borrow from
private money lenders or MFIs face annual interest rates that can range from 20% to 30%.
As a consequence of high interests, farmers ends up selling their production upon harvest,
generating an informal outflow of commodities to neighbouring states. Moreover, no
national insurance is provided to crop producers, making them vulnerable to natural
disasters, with the worst consequences for smallholder farmers. So far, only some disaster
relief schemes have been supported by the state in case of natural disasters, but such
provisions are very limited in coverage (Stillman and Rillo 2015).
The lack of value-adding agro-processing enterprises and the poor connections with the
market is the one of the most relevant defections which mines policies implementation for
productivity, diversified production, and export promotion. The resulting informal outflows
of unprocessed agricultural products to Thailand and Vietnam lead to a dramatic loss of
value added from the country. High operational costs represented by expensive and
unreliable electric energy, difficult transportation, and export costs, added to limited
working capital, are important issues faced by the Cambodian agro-industry. Finally, we
can say that Cambodia will be relegated to be a supplier of raw products for wealthier
neighbours, until effective efforts will be enhanced for the development of agriculture, even
throughout the right incentives and environmental conditions for FDI (Stillman and Rillo
2015).
3.7 Agriculture in Lao Economy
Despite of what is happening in Cambodia, agricultural sector is much more profitable,
contributing importantly to Lao’s GDP growth rate, and it is used as a tool for fighting
poverty. Therefore, the Laotian government has promoted investments in this sector from
both domestic and international investors. These investments have been increasing
remarkably since 2009, after the Asian financial crisis. The total value of public investment
in agriculture grew from 220.1 billion KN (around 54 million US$) in 2009 to 546.3 billion
KN (135 million US$) in 2012, with significant participation of FDI (Stillman and Rillo 2015).
Lao production system is moving to a commercial one. Rice is the main staple food in Lao
and, step by step, the country is reaching a sufficient domestic production, so imports of
rice from abroad are decreasing. Further agricultural goods are growing in production like
cassava, coffee, maize, sugarcane, rubber and tea. To maximize the added value of such

124
products, manufacture and processing industries, mainly producing for export, have being
developed. These industries represent important opportunities in terms of employment and
rural areas development thanks to the establishment of infrastructures.
The most famous agricultural products of the country are recognizable all over the world.
First of all, we find Lao’s coffee. Its production, in 2012, equalled around 25,000 tons and
18,000 tons were exported at a value of around 60 million US$. Through the last decade,
coffee production and export facilities have been developing even thanks to the help of
donor agencies, which provided capital and technical assistance. Major importers of this
product are Italy, Thailand, China, Vietnam, Japan, United States, France and Germany.
The government aims at increasing awareness internationally, meeting phytosanitary
measures and worldwide standards, like requirements stipulated by the WTO. Moreover, it
is enhancing measures to reach fair trade certification, in order to get international buyers
partnerships. Other important exports include maize, that generated an income of 55
million US$ in 2012, tea, cassava, soybeans, bananas, sesame and sugar (Stillman and
Rillo 2015).
3.7.1 Economic Reform Pattern and Market Connections
The key point of primary sector development in Lao is represented by the reforms that
have been undergone in the last two decades. They started in 1986 with the introduction of
the New Economic Mechanism. Then, between, 1990 and 1994, the adoption of a new
constitution provided stability and started attracting the first investments from outside, even
thanks to the relatively stable exchange rate. Asian financial crisis of 1998 triggered
financing problems and foreign exchange losses but right after, the 5-year recovery plan
brought improvements in regional integration and in economic growth (Stillman and Rillo
2015).
For what concerns primary sector, the National Agriculture and Forestry Extension Service
(NAFES) program tries to enhance agricultural productivity, accelerating the move to
mechanization, conservation and competitiveness. To do this, NAFES encompasses these
goals (Stillman and Rillo 2015):
• Supporting the education of farmers through technicalities, agricultural land
inventory and land-use plan to avoid problems in land management;
125
• Enhancing farmers’ organizations to provide support to agricultural community and
facilitate links with markets and the private sector;
• Engaging private sector to find new and potential outlets for the agricultural
production and improve the technological level of the sector;
• Enhancing research and development and human resource development to support
agricultural value chains in rural areas;
• Attracting and maximizing FDI value, enabling positive spillovers from larger farms
to small landowners.
In fostering the agricultural sector, Lao’s government should concentrate on improving
business trade and the farmer’s connections to the markets. At first, boosting trade and
business necessitates the application of proper legal frameworks, successful integration
into regional and global agreements and the subscription of all WTO’s agreements.
Investment should be promoted and channelled into technological innovation and
increasing levels of technical knowledge.
Allowing farmers to reach the markets gets vital as currently smallholder farmers cannot
sell their products efficiently because of the constraints coming from poor technical skills,
bargaining power and limited finance. The objectives stated in the NAFES are able to help
small farmers to enter markets thanks to education on quality control and safety standards,
helping them to reach bigger private entities and supporting commodities processing and
management. Finally, farmers can get added value through the process of “branding” their
products as Laotian goods (Stillman and Rillo 2015).
3.8 Economic Corridors in the Greater Mekong Sub-Region
Since the manufacture and service sectors are very underdeveloped, one of the most
effective project in fostering Laotian and Cambodian economies so far is represented by
the establishment of economic corridors in the Greater Mekong Sub-Region. They
connected the poorest nations to China, Thailand and Vietnam, enabling them to take
advantage of their trade flows. It did not just represent an improvement in infrastructures,
but the chance to represent an alternative for low cost productions in the ASEAN.
The creation of economic corridors was conceived for the first time in 1998, with the
implementation of the Great Mekong Sub-Region Economic Cooperation Program (GMS-
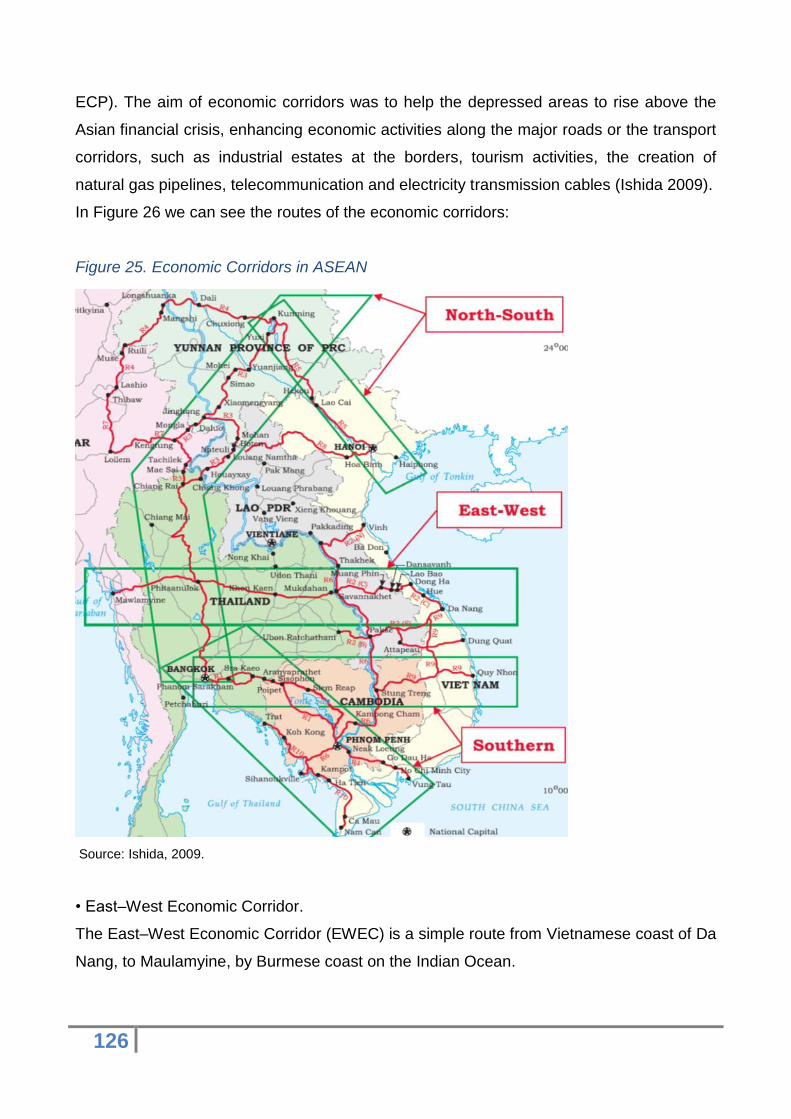
126
ECP). The aim of economic corridors was to help the depressed areas to rise above the
Asian financial crisis, enhancing economic activities along the major roads or the transport
corridors, such as industrial estates at the borders, tourism activities, the creation of
natural gas pipelines, telecommunication and electricity transmission cables (Ishida 2009).
In Figure 26 we can see the routes of the economic corridors:
Figure 25. Economic Corridors in ASEAN
Source: Ishida, 2009.
• East–West Economic Corridor.
The East–West Economic Corridor (EWEC) is a simple route from Vietnamese coast of Da
Nang, to Maulamyine, by Burmese coast on the Indian Ocean.
127
VIETNAM - Da Nang - Dongha – Laobao - LAO - Dengsavan - Savannakhet - THAILAND -
Mukdahan - Phitsanulok -Tak - Maesot – MYANMAR - Myawaddy - Paan - Mawlamyine
• North –South Economic Corridor.
The North-South Economic Corridor (NSEC) can follow different paths: Bangkok -
Kunming Road and Kunming - Hanoi - Haiphong Road. The route between Bangkok -
Kunming has two roads between Chiang Rai (Thailand) and Xiaomengyang (China), that
are the Laos Route and the Myanmar Route.
THAILAND Bangkok - Phitsanulok – Chiang Rai:
Lao Route: THAILAND Chiang Rai - Chiang Khong - LAO - Huayxai - Luangnamtha -
Boten - CHINA – Mohan - Xiaomengyang;
Myanmar Route: THAILAND Chiang Rai – Maesai - MYANMAR - Tachilek - Kyaingtong -
Mongla – CHINA - Daluo - Jinghong - Xiaomengyang;
Vietnam Route: CHINA Xiaomengyang - Simao - Kunming – Hekou – VIETNAM – Lao Cai
- Hanoi – Haiphong.
• Southern Economic Corridor.
The Southern Economic Corridor (SEC) has two roads connecting Sisophon to Phnom
Penh: National Road number 5 and number 6.
THAILAND Bangkok - Aranyaprathet - CAMBODIA - Poipet – Sisophon. Then the route
gets divided until Phnom Penh:
NR 5 Route: Sisophon –Battambang - Phnom Penh;
NR 6 Route: Sisophon –Siem Reap - Phnom Penh;
Phnom Penh - Bavet – VIETNAM – Mocbai - Ho Chi Minh City – Vungtau.
Later, other two sub-corridors have been added to the Southern Economic Corridor (SEC),
and the road from Bangkok to Vungtau became the central sub-corridor of the SEC. These
new corridors are:
128
• Southern Coastal Sub-corridor.
THAILAND Trat - CAMBODIA - Koh Kong - Kampot - Kep - Kampong Trach – VIETNAM -
Praek Chak - Hatien - Rachgia – Namcan.
• Northern Subcorridor.
CAMBODIA - Siem Reap - Stung Treng - Ban Lung - VIETNAM - Ou Ya Dav - Playku -
Quynhon.
With respect to the NSEC, the new route connecting Hanoi to Nanning (China) was
implemented after the signature of the agreement to add the Guangxi Zhuang
Autonomous Region to the GMS in 2005. Moreover, there are other important Chinese
cities (Guangzhou, Dongguan, and Shenzhen) on the extension of the road.
• New Route of the North-South Economic Corridor.
VIETNAM - Hanoi - Lang Song – CHINA - Pingxiang - Nanning
The economic corridors enhanced road transportations to firms which move their products
within China and ASEAN nations. Further, their development will link China and the
ASEAN bloc with the rest of Southern Asia. As we have already seen for ASEAN-China
Free Trade Agreement, economic corridors are fundamental to enhance vertical
fragmentation for businesses that want to delocalise part of their production in ASEAN,
where conditions are more favourable (Ishida 2009).
Looking at CLMV nations, the economic corridors of GMS can be exploited to improve the
economy of some zones especially thanks to their effect on border areas. In fact, border
areas of the Mekong Region saw many wars where opposing armies confronted each
other before the 1992 GMS-ECP inauguration. After the inauguration, these areas
attracted more attention because of their possible and strategical advantages.
As instance, by opening and connecting the border between a higher income nation and a
lower income country, some businesses can differ the sites of their production in order to
minimise the costs. For example, looking at the automotive industry, MNEs produce those
intermediate components which do not have a high technological content in less
developed countries, but the final product is assembled in more developed countries, such
as Thailand. Then, people and businesses from poorer countries can have access to the

129
supply of energy, telecommunication lines, water, and ports of the countries with better
infrastructures (Ishida 2009).
3.8.1 National Strategies
These corridors allowed Cambodia to develop Phnom Penh and Sihanoukville as one
combination. The advantages of Phnom Penh are represented by the largest population of
the country, its SEZ that has already been developed in 2008 and the presence of several
manufacturing companies in operation. On the other hand, Sihanoukville represents the
closest international port, but it is 220 km far. Thanks to the road connections, they can
complete each other. These two cities attract suitable industries, respectively.
As instance, industries whose transport cost per weight are lower (like precision industry)
or are labour-intensive, are suitable in Phnom Penh, because of the large disposal of
labour force. On the other hand, heavy industries like chemical products and steel and
iron, whose transport cost per weight is higher, are suitable in Sihanoukville. In addition,
the industries that can substitute import with domestic production can exploit
Sihanoukville’s port, because they can maintain their economies of scale by exporting to
foreign countries (Ishida 2009).
In Lao, Savannakhet, on the EWEC, and Luang Namtha, on the NSEC, developed thanks
to their strategical position of junctions along the corridors. Lao has such a low
concentration of population that even small cities can become important stops for fuel and
rest of transporters. On the other side, even if Vientiane is not set along a strategic path, it
has the largest population per area of the nation and an effective access to Thailand via
Friendship Bridge, which crosses Mekong; thus, the city is suitable for the manufacturing
industry. On the other hand, Savannakhet and Luang Namtha can increase their role as a
junction of major roads and can attract agro-based industries, which are pretty active in the
country (Ishida 2009).
For what concerns Vietnam, Ho Chi Minh, Hanoi, and their suburban areas have already
been developed through important FDIs. The supporting SEZ strategy is now shifting
towards the middle part of Vietnam, which includes Da Nang, Hue, Don Ha and Lao Bao,
developing the connection between the EWEC and the Da Nang port. A point of weakness
of this port is represented by the need for simplifying the cross-border processes, which
remains a challenge for Vietnam. For example, few transport operators in Lao, however,
do not use the Da Nang port. Among the reasons, there are the strict limits on the road
130
speed and the frequency of ship arrivals. The largest problem, however, is that it takes
more than one month for Vietnam to act on the vacant container order of a transport
operator in Lao. In contrast, Thailand’s turnaround is two or three days only (Ishida 2009).
3.9 Automobile Industry in CLMV Countries
An important example of integration and how effective ASEAN’s measures (such as the
economic corridors) have been, is provided by the automobile industry. More in detail, big
automobile constructors are choosing to diversify their production in different countries
within ASEAN bloc. Thanks to the Free Trade Agreements, economic corridors and better
infrastructures across nations, some businesses decided to produce in CLMV countries
basic and intermediate components with a low content of technology, and complete the
final assemblage in more developed countries like Thailand, China or sometimes Vietnam.
In this way they can exploit important economies of scale.
Lao and Cambodia do not attract outstanding amounts of manufacturing FDI, but they are
set right between Vietnam and Thailand, two of the main regional players for what
concerns automotive assemblage. This allows them to represent a valid alternative for
those productions which do not require skilled labour force or technological site
productions. Favourable tax treatments and regulations are already present, what can be
done is the improvement of infrastructures, transports, telecommunications and energetic
provisions.
As we have already seen, CLMV economies are still strongly related to their historical
partners and neighbouring countries like the U.S., China, Thailand and South Korea. Only
Vietnam has developed an important manufacturing sector, while in Cambodia, Myanmar
and Lao PDR agriculture still represents the most significant sector. In fact, a characteristic
of the automotive industry in CLMV bloc, is the presence of Chinese, European, Korean,
Japanese, U.S. and Malaysian original equipment manufacturers (OEMs) in Vietnam and
operations of completely knocked-down (CKD) assembling enterprises in Myanmar and
Cambodia. So far, there is no CKD assemblage plant in Lao. Thailand is still the regional
hub for automobiles assemblage, with a relevant presence of Japanese manufacturers like
Honda and Toyota.
About Korean car-makers, Kia Picanto is assembled from CKDs by the Vietnamese
THACO (Truong Hai Auto Corp.). Regarding Japanese OEMs, Toyota set up its
131
Vietnamese production in ‘96. Suzuki, in the same year, started the production of a small
truck. Honda, that was already one of the leading two-wheeler producers in Vietnam,
began four-wheeler production in 2006. China’s Chery contracted small car production to
Vietnamese companies Vinamotor and Vinaxuki. Turning to Western OEMs, General
Motors acquired the Vietnamese plant of bankrupt Daewoo and converted for its
production. In a similar way, Ford entered the market in 1997 and now they produce
sedans, SUVs and hatchbacks, while Mercedes-Benz uses the plant of a local company
for the assemblage of its cars (Kobayashi and Jin 2015).
Truong Hai and Tan Chong companies are remarkable cases. Truong Hai is a privately
owned Vietnamese company, and Tan Chong was founded by a Chinese Malaysian.
Though, both firms established their production around Da Nang, Vietnam, during the ‘90s
and both corporations manufacture CKD kits into complete units for major global OEMs.
Truong Hai gets technological assistance or knowledge transfer from its partners. Central
components come from abroad, as Kia sends CKD kits from South Korea and Mazda
ships components from China and Japan. The enterprise has even built an own port for
the delivery of CKD kits and other components. Tan Chong, instead, assemble CKD kits
for Nissan, sourced from ASEAN and India (Kobayashi and Jin 2015).
Cambodia and Myanmar have CKD-based assembly plants. In Cambodia, Hyundai set up
a joint venture with two local enterprises to product the H1 model from CKD kits in Koh
Kong industrial zone, next to Thailand. The Beijing Automotive Industry Corp. and a local
firm created Khmer First Car, set around Phnom Penh, which produces light trucks with
components from China. Ford turned into the first OEM to open a plant in Cambodia,
exactly in the Sihanoukville Special Economic Zone. This plant is run by a Thai automobile
distributor (RMA) and the Everest SUV is produced with components coming from
Thailand.
In Myanmar, the Chinese firms Chery and ZX Auto, the last one with a company affiliated
to Myanmar’s Ministry of Industry, produce compact cars and pickup trucks. Moreover, the
local firm Super Seven Star licensed projects from China to produce commercial vans by
CKD assemblage. Under the military period, Suzuki produced the mini truck Carry and the
small car Wagon R until ‘98. Because of the conflicts affecting the country, Suzuki stopped
the production, but in May 2013, they restarted the local production of the Carry. Suzuki
has positive feelings towards the market and started building a new plant in the Tirawa
SEZ in 2015 (Kobayashi and Jin 2015).
132
3.9.1 Current Situation of Auto-Parts Industry
A shared feature of the auto-parts industry in CLMV nations is that it is still not very
developed. Even if some parts suppliers have already set their production in these
countries, particularly in Vietnam, we can state that, compared to other ASEAN nations,
the segment is not so developed. Nevertheless, if we analyse the component producers’
strategies, the two-wheelers parts production results to be considerable. In effect, Vietnam
belongs to the top four nations in two-wheeler production and sales.
Then, suppliers presently focused on two-wheeler components production could even try
to enlarge their range of products shifting towards four-wheeler parts production. The wide
participation of Japanese two-wheeler producers in ASEAN is also the motivation why T-
Corp, producer of seat covers for Toyota cars and two-wheeler seats, established its
production in ’97 in Vietnam. Even if the firm previously supplied components for the two-
wheeler production of Yamaha, Suzuki and others, nowadays it mostly serves Toyota’s car
assemblage. Likewise, a shock absorber manufacturer, that started its activity in 1996,
exclusively supplied two-wheeler shock absorbers to Honda, but in 2012, the company set
up another factory producing parts for four-wheelers. Even if in Vietnam the major
components corporations were mostly Japanese, supplying Japanese OEMs, it is to be
said that South-Korean suppliers and OEMs enlarged their activities as well (Kobayashi
and Jin 2015).
Concerning the auto components production in Myanmar, Cambodia and Lao, it is to be
said that it is presently underdeveloped. Since vehicles production is led only through
CKDs, these activities depend on foreign imports for most of the elements and on
overseas inputs. Therefore, components producers with autonomous design competences
can scarcely be found. Perhaps the most relevant fact for industries in these nations is that
they share a border with Thailand, the hub of automobile manufacturing in ASEAN.
Henceforth, labour-intensive production steps are progressively led by satellite factories
set near the borders between Thailand and the other CLM countries.
In 2012, Sumitomo Electric and Yazaki, two important wire harness manufacturers,
established their plants near Thai border. Likewise, Denso set up a factory for labour-
intensive electronic components between the Thai-Cambodian border. In Burma, Asumo
and Inoue Kogyo began their activity in 2014. Other Chinese and Korean suppliers also
set up subsidiaries and relevant foreign direct investments in the sector came from Indian,
Indonesian, and Malaysian firms (Kobayashi and Jin 2015).
133
Consequently, we can also say that shifting labour-intensive production to Cambodia, Lao
and Myanmar satellite factories might be the trend for future industrial clusters. Thus,
despite the agglomeration of hi-tech components production and final assemblage end up
in Thailand and Indonesia, by on the other side, there is a progressive shifting of simpler
productions towards neighbouring CLM countries. We can state that labour-intensive parts
production in Thailand is already under pressure because of the higher costs and the
production of these parts will move towards poorer neighbouring countries.
Undoubtedly, the wide disposal of labour force and low wages characterizing CLMV
countries can be attractive, but stable electricity supply and adequate infrastructures are
essential for attracting manufacturers. Frequent black-outs not only interrupt production
but also threat quality standards. Concerning road infrastructures, not even main roads
have already been entirely asphalted and a sensitive improvement of the major roads of
the countries is vital for the development of industrial activity.
Another important issue is the education level of labours. Despite the cheapest wages of
ASEAN, CLMV workers show lower levels of physical endurance and productivity than
Thai workers. This is due to the low standards of education and life quality of the
inhabitants so, improved training, education and life quality should be enhanced by
governments to improve productivity. This low level of education reflects itself in a
shortage of skilled labour and managers, representing a severe issue in technology
transfer. Since foreign skilled workers are usually the ones taking care of technology
transfer and training, it is necessary to ease working visa procedures for skilled workers,
because granting them easier access would help all the industries with a higher
technological content in CLMV countries (Kobayashi and Jin 2015).
3.10 Concluding Remarks
As we have seen, ASEAN nations present very different degrees of development and
CLMV countries themselves, which are the developing ones, present a wide range of
characteristics. While Vietnam is reaching an important level of industrialization, an
important market such as Myanmar cannot exploit its potentialities yet. In fact, it shows the
demand of an important internal market and its geographical position makes it the bridge
between ASEAN and India. Anyway, the democratization of the country started only few
years ago, with the fall of the military junta in 2014, after years of political tensions and civil
134
wars, which are far from being ceased as minorities, like the Muslim one, are still
persecuted with violence and military actions.
In the middle of these situations, we can find Lao and Cambodia. Even if they are poor in
infrastructures, education of labour-force and natural resources such as oil, natural gas
and metals, they are able to attract a growing amount of FDI because of:
their very low-cost labour force;
a long lasting political stability;
a geographical position which allows them to connect bigger economies such as
Vietnam, Thailand and China;
low constraints and taxation for businesses;
natural resources that can provide relevant amount of renewable energy and
agricultural productions.
Primary sector is still the most important component in national GDPs, but forecasts are
relatively different for the two. In the last years, Lao set up effective policies which can
attract a wide amount of FDI in the sector. Natural resources like rivers and lakes are used
for the production of electricity, which surplus is sold to neighbouring countries. In
agriculture, the certification of products makes them recognisable and tradable all over the
world. A successful example is represented by plantations of coffee and tea: Lao’s
government offers incentives to northern populations for this kind of plantations and in this
way it is fighting poverty and replacing opium productions with products which are
purchased even by European MNEs. These measures allow the country to have a long
term attractiveness and high returns over FDI on agriculture (Stillman and Rillo 2015).
On the other side, Cambodia still relies on productions aimed at the self-sustenance.
National policies and the lack of their enforcement do not allow Cambodian products to be
recognisable and in many occasion they are sold to neighbouring countries at prices that
damage local producers. Moreover, last year the massive exploitation of hydric resources
for agriculture and electricity production in China and Lao, hit Cambodia with the hardest
droughts of the recent years. Then, twenty continuous years of wars (the American war
from early ‘70s, the following Civil war and the Vietnamese one, which ended in the ‘90s),
left to Cambodian country one of the highest concentration of mines in the world (Stillman
and Rillo 2015).
135
So, besides the enforcement of effective national strategies, a unified policy within ASEAN
nations is necessary for an effective and sustainable usage of natural resources for all the
members. At the same time, resources shall be used to repair all the damages brought by
wars carried on by dictators and regimes of the last century, which represent one of the
main cause of the poor developments of some countries.
Despite what happens for agriculture, the industrial sector is supported by a
complementary development policy, which permits even less industrialised nations to take
advantage of the manufacturing activities that are present in countries like Vietnam and
Thailand. In detail, Cambodia and Lao can benefit from their geographical position, since
they are set right in the middle of Vietnam and Thailand, and represent fundamental
corridors for goods manufactured in the region. Moreover, thanks to the establishment of
Special Economic Zones and the low costs characterising labour force, especially in the
border areas, these nations are attracting FDI addressed to the production of garments,
textiles, shoes and sport equipment. At the same time, they are also catalysing the
production of those basic and less technologic components, used in sectors that are
developed in neighbouring countries, such as automotive in Thailand or motorbikes
assembly in Vietnam.
In this way, even if their level of industrial development does not allow to enhance a
complete production of technological goods, they can still take advantage of the production
of multinational enterprises which set their activity in ASEAN. In this case, Cambodia is
advantaged with respect to Lao, because the former presents plain territories and some
ports by the ocean which ease connections with other countries. An example is
represented by the port of Sihanoukville, a city by the ocean and close to the Vietnamese
border, which became an important touristic location, but the suburbia gathers factories of
garments, textiles and shoes.
For what concern services, the major driver is tourism and even if the level of openness
towards service driven FDI is high in both countries, the majority of investments are
directed to Cambodia, with the only site of Angkor Wat which can attract around 20
millions of tourists per year and many more are expected in the next years thanks to
investments dedicated to the improvement of Siem Reap airport, which is going to receive
airplanes from outside ASEAN within 2020 (Council for the Development of Cambodia
2017).
In conclusion, despite similar economic development and macroeconomic situations, from
investors point of view, Cambodia is more attractive for the service sector because it has a
136
higher touristic appeal. Then, a higher disposal of labour force, the presence of important
ports and the geographical position, right in the middle of the connections between two
important centres like Bangkok and Ho Chi Minh City, make Cambodia more attractive
than Lao for manufacturing sites. On the other side, Lao is the only state of ASEAN which
empowered a consistent production of electrical power by renewable sources, selling part
of it abroad. It turned agriculture from a national dimension into a remunerative sector
where even foreign investors can gain from extensive plantations. Finally, its good
relations with neighbouring China make it a strategical site for doing business.
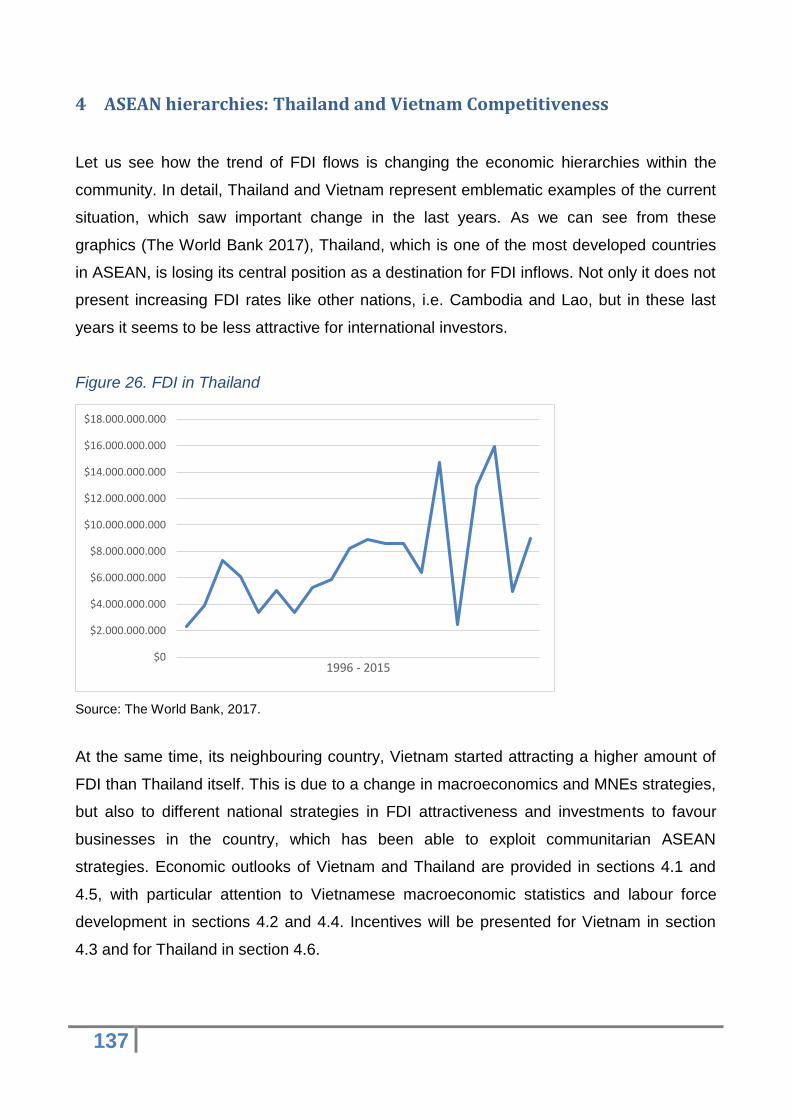
137
4 ASEAN hierarchies: Thailand and Vietnam Competitiveness
Let us see how the trend of FDI flows is changing the economic hierarchies within the
community. In detail, Thailand and Vietnam represent emblematic examples of the current
situation, which saw important change in the last years. As we can see from these
graphics (The World Bank 2017), Thailand, which is one of the most developed countries
in ASEAN, is losing its central position as a destination for FDI inflows. Not only it does not
present increasing FDI rates like other nations, i.e. Cambodia and Lao, but in these last
years it seems to be less attractive for international investors.
Figure 26. FDI in Thailand
Source: The World Bank, 2017.
At the same time, its neighbouring country, Vietnam started attracting a higher amount of
FDI than Thailand itself. This is due to a change in macroeconomics and MNEs strategies,
but also to different national strategies in FDI attractiveness and investments to favour
businesses in the country, which has been able to exploit communitarian ASEAN
strategies. Economic outlooks of Vietnam and Thailand are provided in sections 4.1 and
4.5, with particular attention to Vietnamese macroeconomic statistics and labour force
development in sections 4.2 and 4.4. Incentives will be presented for Vietnam in section
4.3 and for Thailand in section 4.6.
$0
$2.000.000.000
$4.000.000.000
$6.000.000.000
$8.000.000.000
$10.000.000.000
$12.000.000.000
$14.000.000.000
$16.000.000.000
$18.000.000.000
1996 - 2015
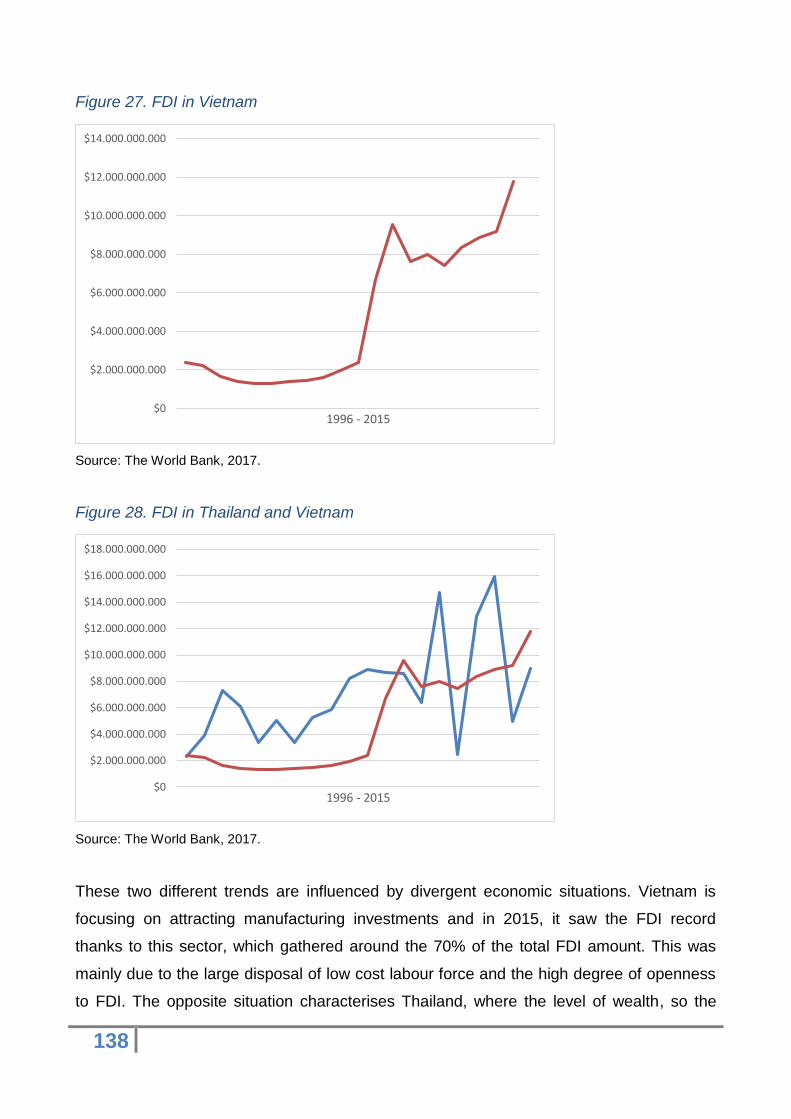
138
Figure 27. FDI in Vietnam
Source: The World Bank, 2017.
Figure 28. FDI in Thailand and Vietnam
Source: The World Bank, 2017.
These two different trends are influenced by divergent economic situations. Vietnam is
focusing on attracting manufacturing investments and in 2015, it saw the FDI record
thanks to this sector, which gathered around the 70% of the total FDI amount. This was
mainly due to the large disposal of low cost labour force and the high degree of openness
to FDI. The opposite situation characterises Thailand, where the level of wealth, so the
$0
$2.000.000.000
$4.000.000.000
$6.000.000.000
$8.000.000.000
$10.000.000.000
$12.000.000.000
$14.000.000.000
1996 - 2015
$0
$2.000.000.000
$4.000.000.000
$6.000.000.000
$8.000.000.000
$10.000.000.000
$12.000.000.000
$14.000.000.000
$16.000.000.000
$18.000.000.000
1996 - 2015
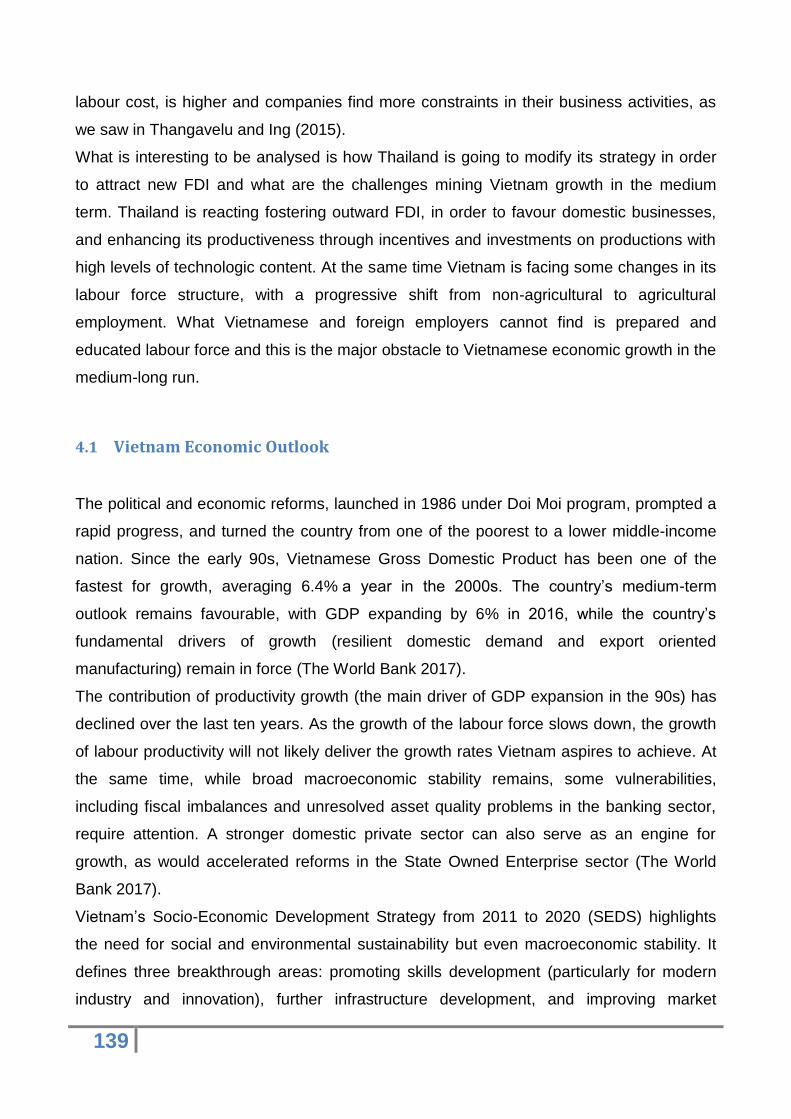
139
labour cost, is higher and companies find more constraints in their business activities, as
we saw in Thangavelu and Ing (2015).
What is interesting to be analysed is how Thailand is going to modify its strategy in order
to attract new FDI and what are the challenges mining Vietnam growth in the medium
term. Thailand is reacting fostering outward FDI, in order to favour domestic businesses,
and enhancing its productiveness through incentives and investments on productions with
high levels of technologic content. At the same time Vietnam is facing some changes in its
labour force structure, with a progressive shift from non-agricultural to agricultural
employment. What Vietnamese and foreign employers cannot find is prepared and
educated labour force and this is the major obstacle to Vietnamese economic growth in the
medium-long run.
4.1 Vietnam Economic Outlook
The political and economic reforms, launched in 1986 under Doi Moi program, prompted a
rapid progress, and turned the country from one of the poorest to a lower middle-income
nation. Since the early 90s, Vietnamese Gross Domestic Product has been one of the
fastest for growth, averaging 6.4% a year in the 2000s. The country’s medium-term
outlook remains favourable, with GDP expanding by 6% in 2016, while the country’s
fundamental drivers of growth (resilient domestic demand and export oriented
manufacturing) remain in force (The World Bank 2017).
The contribution of productivity growth (the main driver of GDP expansion in the 90s) has
declined over the last ten years. As the growth of the labour force slows down, the growth
of labour productivity will not likely deliver the growth rates Vietnam aspires to achieve. At
the same time, while broad macroeconomic stability remains, some vulnerabilities,
including fiscal imbalances and unresolved asset quality problems in the banking sector,
require attention. A stronger domestic private sector can also serve as an engine for
growth, as would accelerated reforms in the State Owned Enterprise sector (The World
Bank 2017).
Vietnam’s Socio-Economic Development Strategy from 2011 to 2020 (SEDS) highlights
the need for social and environmental sustainability but even macroeconomic stability. It
defines three breakthrough areas: promoting skills development (particularly for modern
industry and innovation), further infrastructure development, and improving market
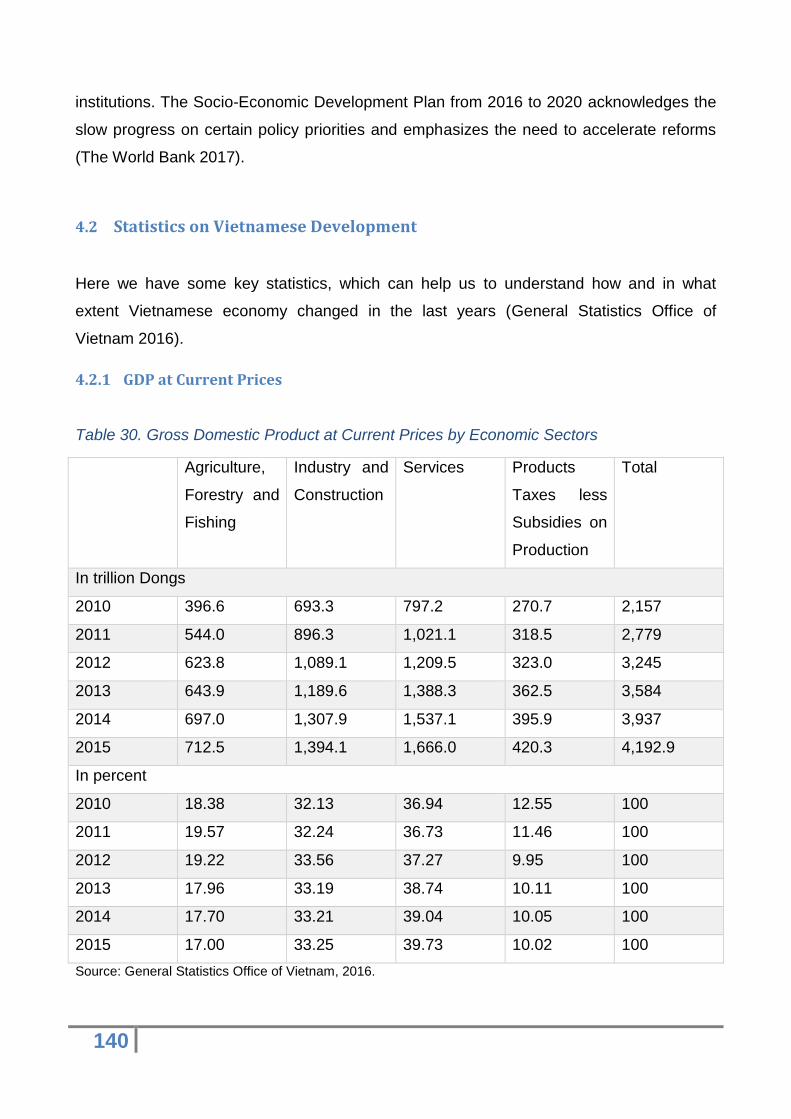
140
institutions. The Socio-Economic Development Plan from 2016 to 2020 acknowledges the
slow progress on certain policy priorities and emphasizes the need to accelerate reforms
(The World Bank 2017).
4.2 Statistics on Vietnamese Development
Here we have some key statistics, which can help us to understand how and in what
extent Vietnamese economy changed in the last years (General Statistics Office of
Vietnam 2016).
4.2.1 GDP at Current Prices
Table 30. Gross Domestic Product at Current Prices by Economic Sectors
Agriculture,
Forestry and
Fishing
Industry and
Construction
Services Products
Taxes less
Subsidies on
Production
Total
In trillion Dongs
2010 396.6 693.3 797.2 270.7 2,157
2011 544.0 896.3 1,021.1 318.5 2,779
2012 623.8 1,089.1 1,209.5 323.0 3,245
2013 643.9 1,189.6 1,388.3 362.5 3,584
2014 697.0 1,307.9 1,537.1 395.9 3,937
2015 712.5 1,394.1 1,666.0 420.3 4,192.9
In percent
2010 18.38 32.13 36.94 12.55 100
2011 19.57 32.24 36.73 11.46 100
2012 19.22 33.56 37.27 9.95 100
2013 17.96 33.19 38.74 10.11 100
2014 17.70 33.21 39.04 10.05 100
2015 17.00 33.25 39.73 10.02 100
Source: General Statistics Office of Vietnam, 2016.
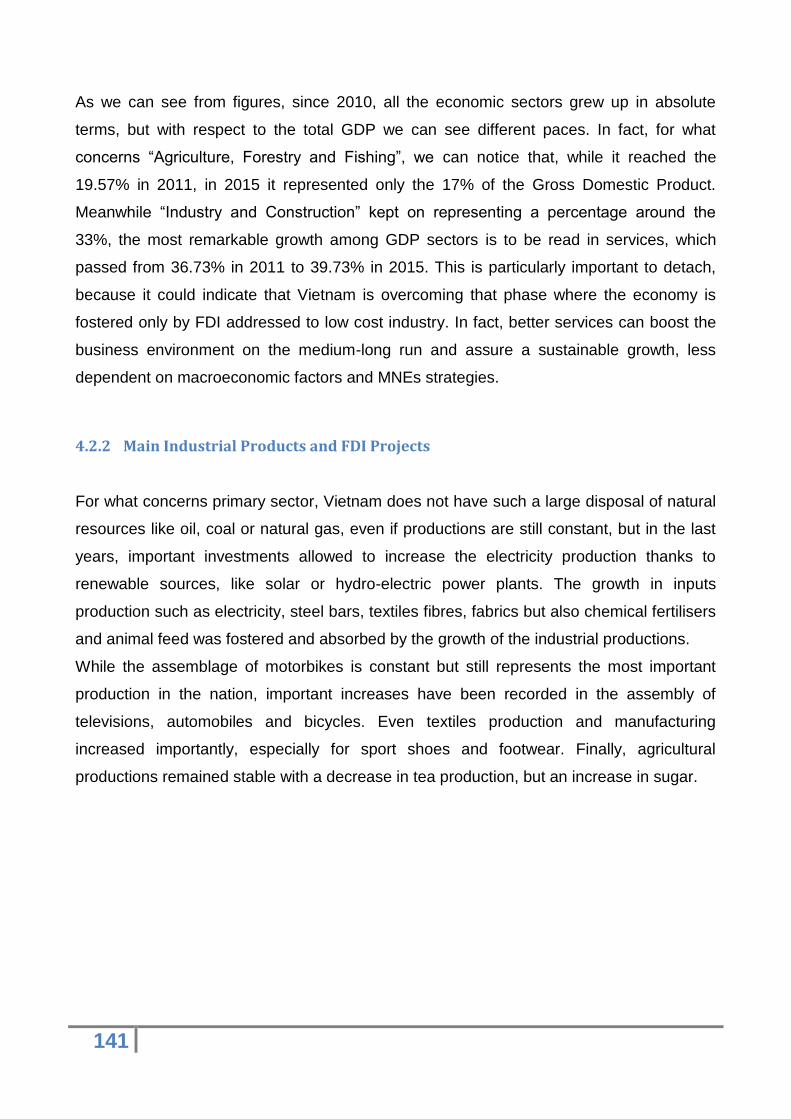
141
As we can see from figures, since 2010, all the economic sectors grew up in absolute
terms, but with respect to the total GDP we can see different paces. In fact, for what
concerns “Agriculture, Forestry and Fishing”, we can notice that, while it reached the
19.57% in 2011, in 2015 it represented only the 17% of the Gross Domestic Product.
Meanwhile “Industry and Construction” kept on representing a percentage around the
33%, the most remarkable growth among GDP sectors is to be read in services, which
passed from 36.73% in 2011 to 39.73% in 2015. This is particularly important to detach,
because it could indicate that Vietnam is overcoming that phase where the economy is
fostered only by FDI addressed to low cost industry. In fact, better services can boost the
business environment on the medium-long run and assure a sustainable growth, less
dependent on macroeconomic factors and MNEs strategies.
4.2.2 Main Industrial Products and FDI Projects
For what concerns primary sector, Vietnam does not have such a large disposal of natural
resources like oil, coal or natural gas, even if productions are still constant, but in the last
years, important investments allowed to increase the electricity production thanks to
renewable sources, like solar or hydro-electric power plants. The growth in inputs
production such as electricity, steel bars, textiles fibres, fabrics but also chemical fertilisers
and animal feed was fostered and absorbed by the growth of the industrial productions.
While the assemblage of motorbikes is constant but still represents the most important
production in the nation, important increases have been recorded in the assembly of
televisions, automobiles and bicycles. Even textiles production and manufacturing
increased importantly, especially for sport shoes and footwear. Finally, agricultural
productions remained stable with a decrease in tea production, but an increase in sugar.
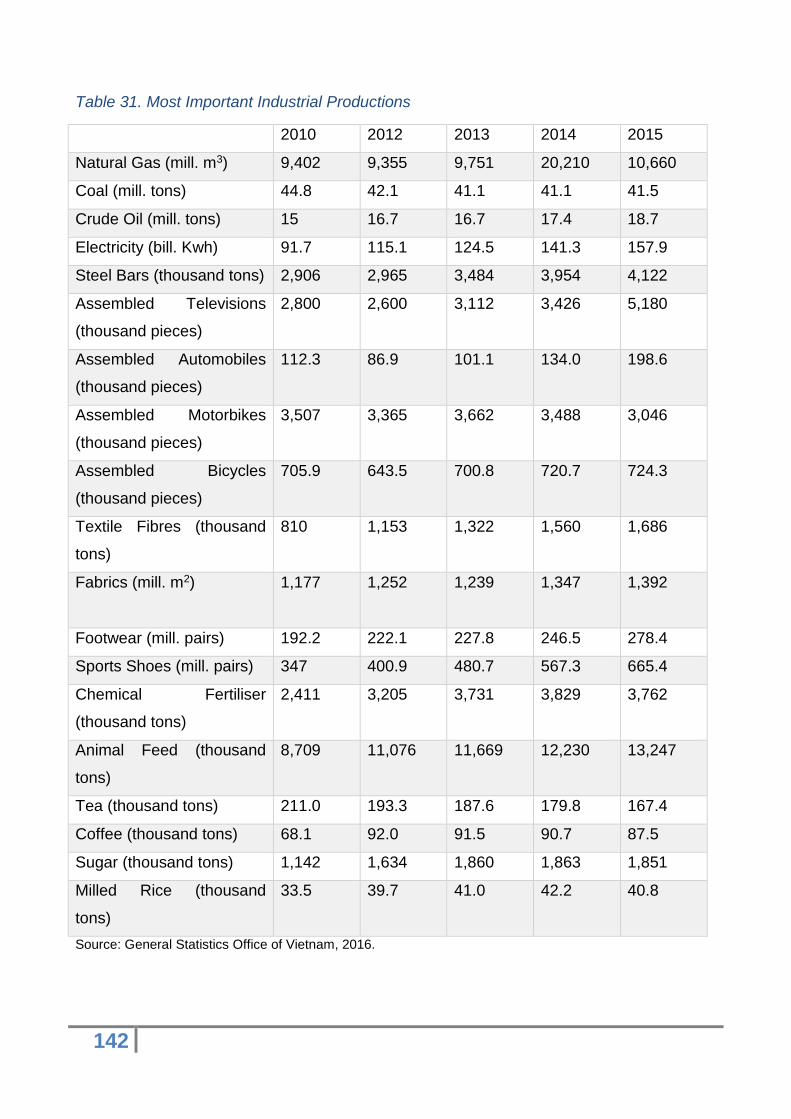
142
Table 31. Most Important Industrial Productions
2010 2012 2013 2014 2015
Natural Gas (mill. m3) 9,402 9,355 9,751 20,210 10,660
Coal (mill. tons) 44.8 42.1 41.1 41.1 41.5
Crude Oil (mill. tons) 15 16.7 16.7 17.4 18.7
Electricity (bill. Kwh) 91.7 115.1 124.5 141.3 157.9
Steel Bars (thousand tons) 2,906 2,965 3,484 3,954 4,122
Assembled Televisions
(thousand pieces)
2,800 2,600 3,112 3,426 5,180
Assembled Automobiles
(thousand pieces)
112.3 86.9 101.1 134.0 198.6
Assembled Motorbikes
(thousand pieces)
3,507 3,365 3,662 3,488 3,046
Assembled Bicycles
(thousand pieces)
705.9 643.5 700.8 720.7 724.3
Textile Fibres (thousand
tons)
810 1,153 1,322 1,560 1,686
Fabrics (mill. m2)
1,177 1,252 1,239 1,347 1,392
Footwear (mill. pairs) 192.2 222.1 227.8 246.5 278.4
Sports Shoes (mill. pairs) 347 400.9 480.7 567.3 665.4
Chemical Fertiliser
(thousand tons)
2,411 3,205 3,731 3,829 3,762
Animal Feed (thousand
tons)
8,709 11,076 11,669 12,230 13,247
Tea (thousand tons) 211.0 193.3 187.6 179.8 167.4
Coffee (thousand tons) 68.1 92.0 91.5 90.7 87.5
Sugar (thousand tons) 1,142 1,634 1,860 1,863 1,851
Milled Rice (thousand
tons)
33.5 39.7 41.0 42.2 40.8
Source: General Statistics Office of Vietnam, 2016.
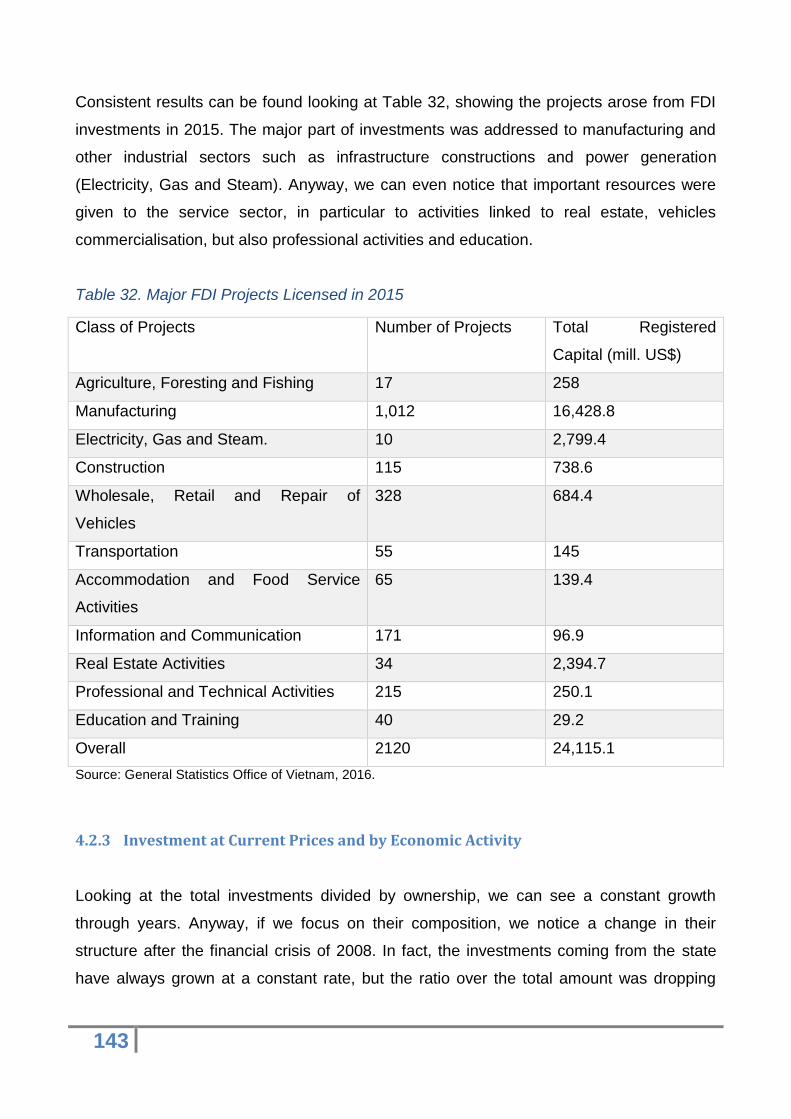
143
Consistent results can be found looking at Table 32, showing the projects arose from FDI
investments in 2015. The major part of investments was addressed to manufacturing and
other industrial sectors such as infrastructure constructions and power generation
(Electricity, Gas and Steam). Anyway, we can even notice that important resources were
given to the service sector, in particular to activities linked to real estate, vehicles
commercialisation, but also professional activities and education.
Table 32. Major FDI Projects Licensed in 2015
Class of Projects Number of Projects Total Registered
Capital (mill. US$)
Agriculture, Foresting and Fishing 17 258
Manufacturing 1,012 16,428.8
Electricity, Gas and Steam. 10 2,799.4
Construction 115 738.6
Wholesale, Retail and Repair of
Vehicles
328 684.4
Transportation 55 145
Accommodation and Food Service
Activities
65 139.4
Information and Communication 171 96.9
Real Estate Activities 34 2,394.7
Professional and Technical Activities 215 250.1
Education and Training 40 29.2
Overall 2120 24,115.1
Source: General Statistics Office of Vietnam, 2016.
4.2.3 Investment at Current Prices and by Economic Activity
Looking at the total investments divided by ownership, we can see a constant growth
through years. Anyway, if we focus on their composition, we notice a change in their
structure after the financial crisis of 2008. In fact, the investments coming from the state
have always grown at a constant rate, but the ratio over the total amount was dropping
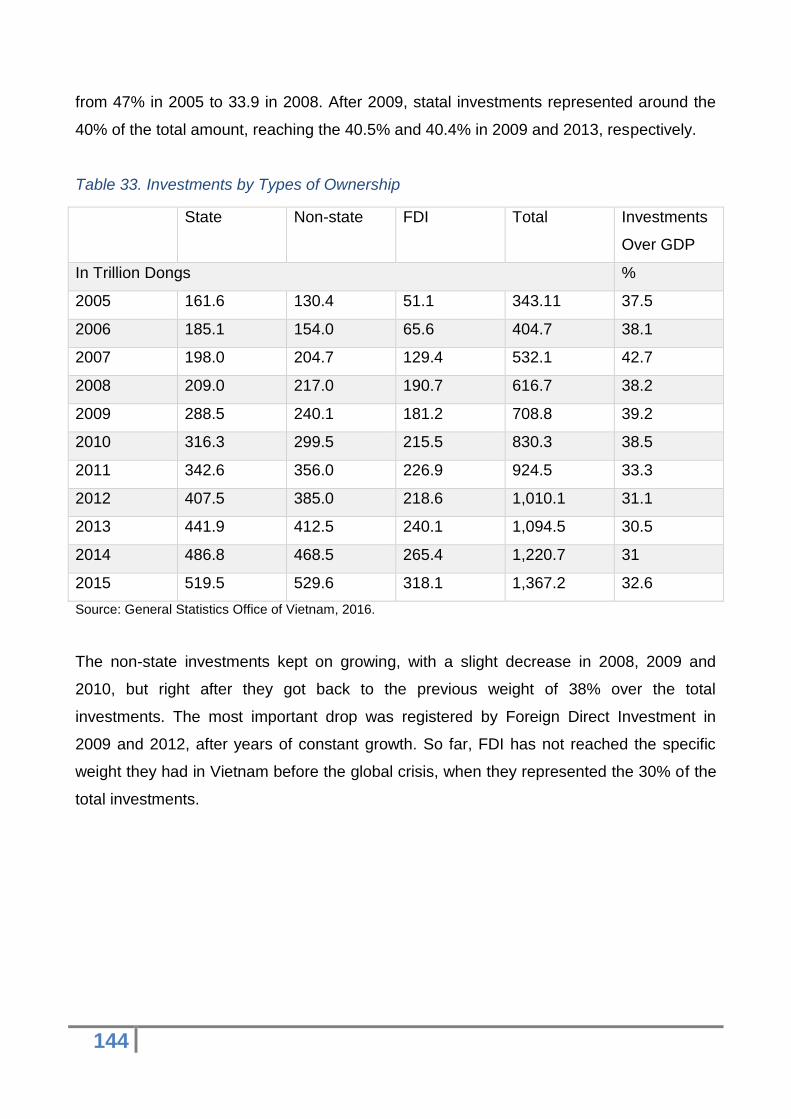
144
from 47% in 2005 to 33.9 in 2008. After 2009, statal investments represented around the
40% of the total amount, reaching the 40.5% and 40.4% in 2009 and 2013, respectively.
Table 33. Investments by Types of Ownership
State Non-state FDI Total Investments
Over GDP
In Trillion Dongs %
2005 161.6 130.4 51.1 343.11 37.5
2006 185.1 154.0 65.6 404.7 38.1
2007 198.0 204.7 129.4 532.1 42.7
2008 209.0 217.0 190.7 616.7 38.2
2009 288.5 240.1 181.2 708.8 39.2
2010 316.3 299.5 215.5 830.3 38.5
2011 342.6 356.0 226.9 924.5 33.3
2012 407.5 385.0 218.6 1,010.1 31.1
2013 441.9 412.5 240.1 1,094.5 30.5
2014 486.8 468.5 265.4 1,220.7 31
2015 519.5 529.6 318.1 1,367.2 32.6
Source: General Statistics Office of Vietnam, 2016.
The non-state investments kept on growing, with a slight decrease in 2008, 2009 and
2010, but right after they got back to the previous weight of 38% over the total
investments. The most important drop was registered by Foreign Direct Investment in
2009 and 2012, after years of constant growth. So far, FDI has not reached the specific
weight they had in Vietnam before the global crisis, when they represented the 30% of the
total investments.
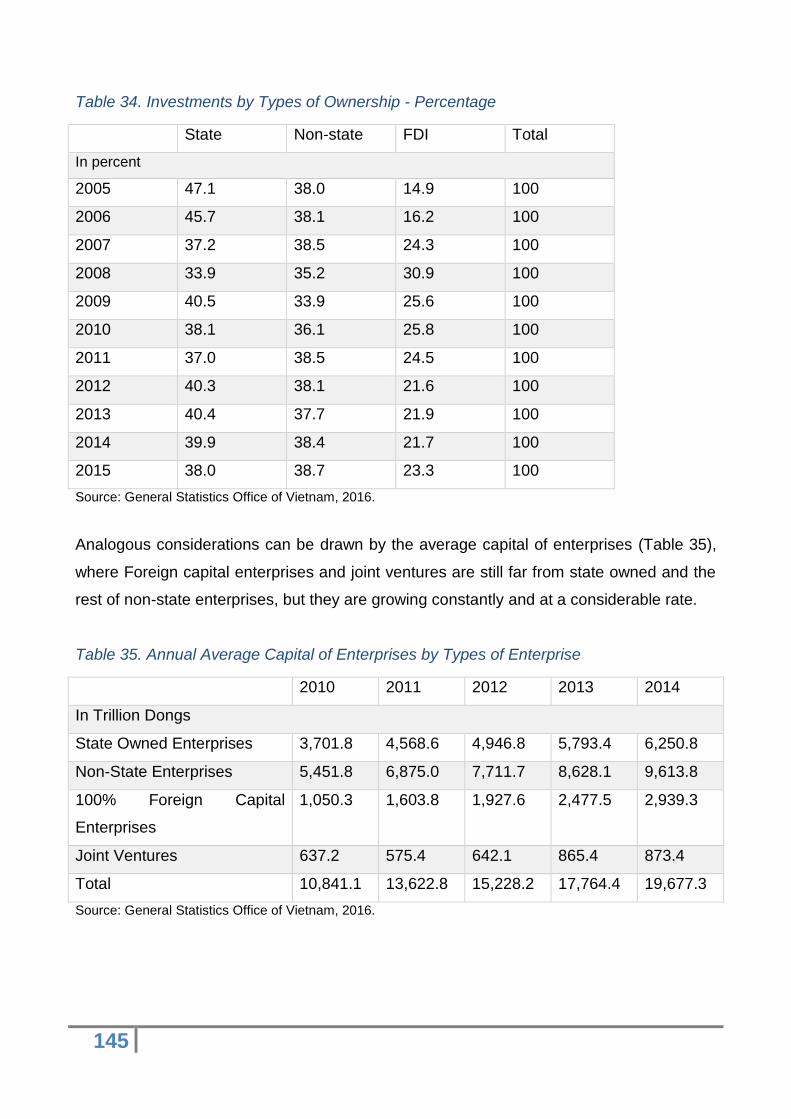
145
Table 34. Investments by Types of Ownership - Percentage
State Non-state FDI Total
In percent
2005 47.1 38.0 14.9 100
2006 45.7 38.1 16.2 100
2007 37.2 38.5 24.3 100
2008 33.9 35.2 30.9 100
2009 40.5 33.9 25.6 100
2010 38.1 36.1 25.8 100
2011 37.0 38.5 24.5 100
2012 40.3 38.1 21.6 100
2013 40.4 37.7 21.9 100
2014 39.9 38.4 21.7 100
2015 38.0 38.7 23.3 100
Source: General Statistics Office of Vietnam, 2016.
Analogous considerations can be drawn by the average capital of enterprises (Table 35),
where Foreign capital enterprises and joint ventures are still far from state owned and the
rest of non-state enterprises, but they are growing constantly and at a considerable rate.
Table 35. Annual Average Capital of Enterprises by Types of Enterprise
2010 2011 2012 2013 2014
In Trillion Dongs
State Owned Enterprises 3,701.8 4,568.6 4,946.8 5,793.4 6,250.8
Non-State Enterprises 5,451.8 6,875.0 7,711.7 8,628.1 9,613.8
100% Foreign Capital
Enterprises
1,050.3 1,603.8 1,927.6 2,477.5 2,939.3
Joint Ventures 637.2 575.4 642.1 865.4 873.4
Total 10,841.1 13,622.8 15,228.2 17,764.4 19,677.3
Source: General Statistics Office of Vietnam, 2016.
146
4.2.4 Vietnamese FDI Record FDI in 2015
Among the major investment incentives that helped Vietnamese development, we can find:
CIT exemption for the first 2 or 4 years, or 50% CIT reduction after the CIT
exemption period has expired.
Exemption from Import duty on imported machinery, equipment and raw materials.
Preferential tax rate of 10%, 15% and 20%, for projects involved in high-
technologies, supporting industries, agriculture and rural areas or Build-Operate-
Transfer schemes.
Exemption from land rental up to 3 years since the beginning of the project.
According to the General Statistics Office of Vietnam, in 2015, there were over 2,000 FDI
projects with a total capital of 12 billion US$, along with another 814 projects expanding
their investment to 7.2 billion US$ by the end of 2015, a year-on-year increase of
12.5%. One of the most significant FDI projects was the Samsung Ho Chi Minh Complex,
which received a licence to add 600 million US$ late last year (Foreign Investment Agency
2016).
This additional capital lifted total investment for Samsung in Saigon High-tech Park to 2
billion US$. The project spillovers are expected to improve human resources, develop
local supply systems, and increase domestic enterprises' competitive capability in joining
global supply chains. The Republic of Korea became the biggest investor in Vietnam with
a series of huge projects at a total capital of 2.67 billion US$.
The Vietnamese retail market is seen has having high potential thanks to the population of
more than 90 million and a growing economy. Many Korean, Japanese and Thai retail
groups have arrived in Vietnam, causing concern among local enterprises that foreign
commodities could dominate the market. What Vietnamese economists point out is the fact
that new investment incentives should avoid labour-intensive industries and focus on a
more technological content, because labour-intensive industry is based on the large
disposal of cheap labour force and it is not sustainable in the long run, with a general
improvement of the national wealth (Foreign Investment Agency 2016).
147
4.2.5 Manufacturing sector
With slowing economic growth and rising labour costs decreasing the profitability of
Chinese manufacturing operations, Vietnam has emerged as a popular destination of
choice for its low costs, economic reforms and its integration with important trading
partners. Such factors are making Vietnam a hub of many multinational manufacturers
especially for those with a China + 1 oriented production. The most recent Free Trade
Agreements, notably the Trans-Pacific Partnership and FTA with European Union, provide
even more opportunities for investors to take advantage of its cheap workforce and
proximity to Asian based supply chains.
In recent years, Vietnamese growth has reached record heights, reaching a 7% rate of
growth in the 4th quarter of 2015 from the previous year, with manufacturing gathering the
largest ratio of the overall investments, the 70.27% of the total. The labour force (over 15
years old) overcomes 53 million people and remains cheap. In 2015, the average monthly
wage in the manufacturing sector was around 190 US$, much lower than China (around
650 US$) and neighbours like Malaysia, Indonesia, Thailand and the Philippines. (Ministry
of Planning and Investment 2017).
Furthermore, modern Vietnam benefits from a renewed and favourable political
environment, since the communist government started easing restrictions on FDI and is
slowly opening the borders. It has also set up incentives for regions with social and
economic difficulties, coming up with more than 300 industrial zones (IZs) and export
processing zones (EPZs) (Ministry of Planning and Investment 2017).
Nevertheless, some manufacturing sectors are more vigorous than others. Thanks to its
central location in Asia and proximity to shipping routes, many manufacturers entering
Vietnam are export focused. In many circumstances, foreign investors can benefit from
exemption from both export and import duties, these ones on goods brought into the
country for their own use if they cannot be procured locally. Provisions include all
equipment, machinery, components, spare parts, raw materials and inputs for
manufacturing or construction (Ministry of Planning and Investment 2017).
4.3 Vietnamese Incentives
Despite the growing attention on hi-tech production and scientific research, the majority of
FDI incentives of Vietnam is direct to attract manufacturing investments, the ones that are
148
leading the economic growth of the country. As instance, some favourable incentives are
directed to garment, textile and footwear, mechanical assemblage, and other sectors
which do not require specialised or educated labour force. Differently from the majority of
other ASEAN nations, Vietnamese Special Economic Zones are not strictly defined in a
geographical way. It is a task of the Ministry of Planning and Investment to state if the
project is going to affect a region with economic and social difficulties, and SEZs or EPZ
are easily modified.
Incentives are provided through the exemption or reduction of tax rates; import duty
exemption for fixed assets; and reduction or exemption of land rental. Projects of
investment are eligible for incentives if the projects are addressed to the following areas or
cases (Ministry of Planning and Investment 2017):
high-tech activities and products, IT products, software products, digital contents
and all the activities carried out by hi-tech, science and technology companies;
R&D and production of new materials, renewable energy, productions with at least
30% of added value, and energy-saving products;
collection, treatment, recycling of waste;
products serving textile and garment industry, leather and footwear industry;
cultivation, processing of agriculture products, forestry products, aquaculture
products, production of plant varieties, animal breads, and biotechnology products;
investment in development and management of infrastructures, and development of
public passenger transportation in urban areas;
preschool education, compulsory education, vocational education;
healthcare structures and services, scientific research into preparation technology
and/or biotechnology serving creation of new medicines;
people's credit funds and microfinance institutions.
Investment incentives are even tight to the location where the project takes place. These
Special Economic Zones are represented by:
administrative divisions in disadvantaged area or extremely disadvantaged areas;
industrial or hi-tech parks and export-processing zones;
rural areas if the investment project employs at least 500 workers.
149
Moreover, we have to take into account that any project in which the capital investment is
6,000 billion Vietnamese Dongs (VND) or more, and the minimum amount of at least 6,000
billion VND is disbursed within 3 years from the day on which the investment registration
certificate or decision on investment policies is issued (Ministry of Planning and Investment
2017).
4.3.1 CIT Incentives
Criteria for entitlement to tax reductions and holidays are set out in the CIT regulations,
being granted to new investments on encouraged sectors, locations or the size of the
project (Ministry of Planning and Investment 2017).
Preferential 10% CIT rate:
For the entire operational period is applicable to enterprises operating in the sectors of
education and occupational training, health-care, culture, sport and the environment.
Within 15 years for new investment projects in areas with difficult socio-economic
conditions, in economic zones and in high-tech zones, and to new investment projects
in the sectors of high technology, scientific research and technological development,
but even for manufacturing productions supporting the garment, textile and footwear,
IT, automobiles assembly, mechanics sector.
Preferential 15% CIT rate:
within 10 years applied to incomes of the companies from breeding, farming,
processing of aquaculture and agriculture products in disadvantaged areas.
Preferential 17% CIT rate:
For the first 10 years it can be applied to projects in areas with socio-economic
difficulties; for the whole operational period is applicable to agricultural service co-
operatives and to people's credit funds.
Large manufacturing projects distributed within 3 years, with investment capital of at least
6,000 billion VND can qualify for CIT incentives if they present minimum revenues of
10,000 billion VND per annum for at least 3 years; or headcount of more than 3,000 for at
150
least 3 years. Large manufacturing projects are defined to include projects with investment
capital of at least 12,000 billion VND, disbursed within 5 years of being licensed. Additional
tax reductions are available for projects in manufacturing, construction and transportation
activities which employ more than a half of female staff or ethnic minorities (Ministry of
Planning and Investment 2017).
4.3.2 Incentives on Import Taxes
Exemption from import duty is granted to:
Goods imported to form fixed assets of qualified investment projects (which cannot
be produced in Vietnam);
Plant varieties and animal breeds permitted to be imported for the execution of
investment projects in the sectors of agriculture, forestry and fishery;
Goods temporarily imported for carrying out ODA projects;
Material and semi-finished products for implementing exports with foreigners;
Raw materials and supplies imported to directly serve the production of software
products, which cannot be domestically produced yet, are exempt from import duty;
Goods imported for direct use in scientific research and technological development,
including technologies, machinery, equipment, spare parts, supplies and means of
transport which cannot be domestically produced yet; scientific documents, books
and newspapers and journals and electronic scientific and technological information
sources are exempt from import duty.
Raw materials, supplies and accessories which cannot be domestically produced yet and
are imported for production activities of investment projects in domains in which
investment is specially encouraged, or in geographical areas with extremely difficult socio-
economic conditions, are exempt from import duty for 5 years (Ministry of Planning and
Investment 2017).
4.3.3 Incentives on Land Rental
The table below summarises the incentives on Land Rental (Ministry of Planning and
Investment 2017).
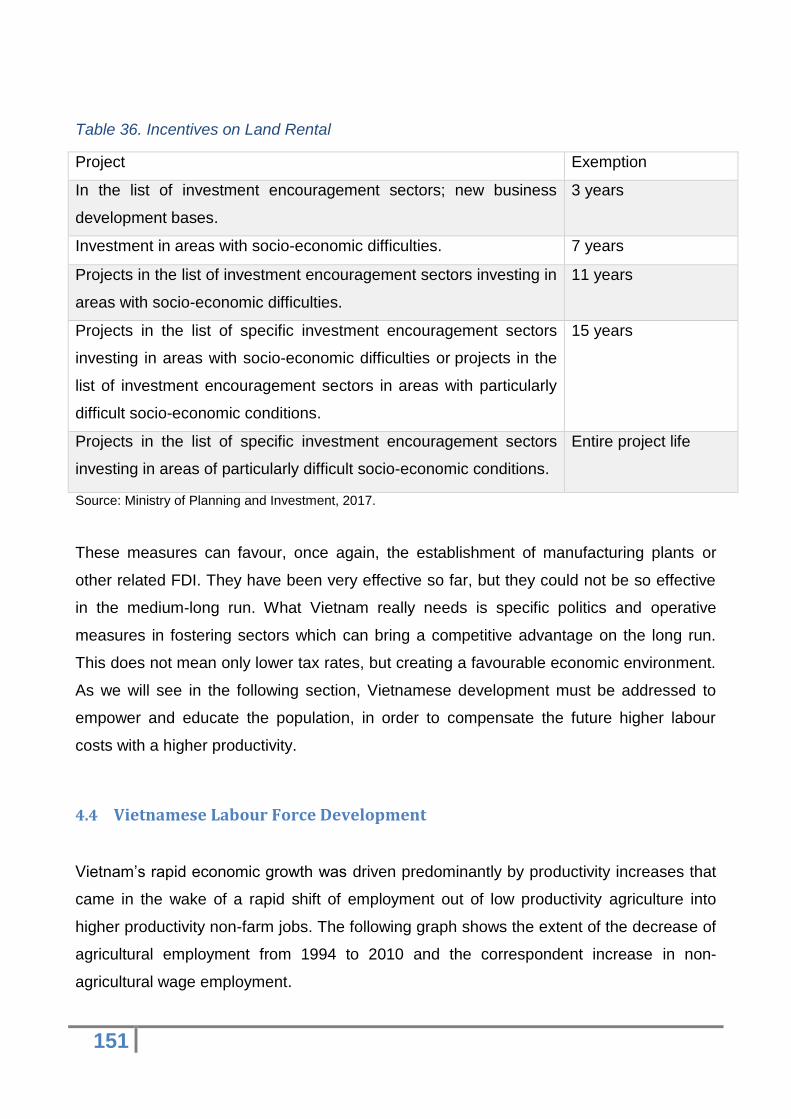
151
Table 36. Incentives on Land Rental
Project Exemption
In the list of investment encouragement sectors; new business
development bases.
3 years
Investment in areas with socio-economic difficulties. 7 years
Projects in the list of investment encouragement sectors investing in
areas with socio-economic difficulties.
11 years
Projects in the list of specific investment encouragement sectors
investing in areas with socio-economic difficulties or projects in the
list of investment encouragement sectors in areas with particularly
difficult socio-economic conditions.
15 years
Projects in the list of specific investment encouragement sectors
investing in areas of particularly difficult socio-economic conditions.
Entire project life
Source: Ministry of Planning and Investment, 2017.
These measures can favour, once again, the establishment of manufacturing plants or
other related FDI. They have been very effective so far, but they could not be so effective
in the medium-long run. What Vietnam really needs is specific politics and operative
measures in fostering sectors which can bring a competitive advantage on the long run.
This does not mean only lower tax rates, but creating a favourable economic environment.
As we will see in the following section, Vietnamese development must be addressed to
empower and educate the population, in order to compensate the future higher labour
costs with a higher productivity.
4.4 Vietnamese Labour Force Development
Vietnam’s rapid economic growth was driven predominantly by productivity increases that
came in the wake of a rapid shift of employment out of low productivity agriculture into
higher productivity non-farm jobs. The following graph shows the extent of the decrease of
agricultural employment from 1994 to 2010 and the correspondent increase in non-
agricultural wage employment.
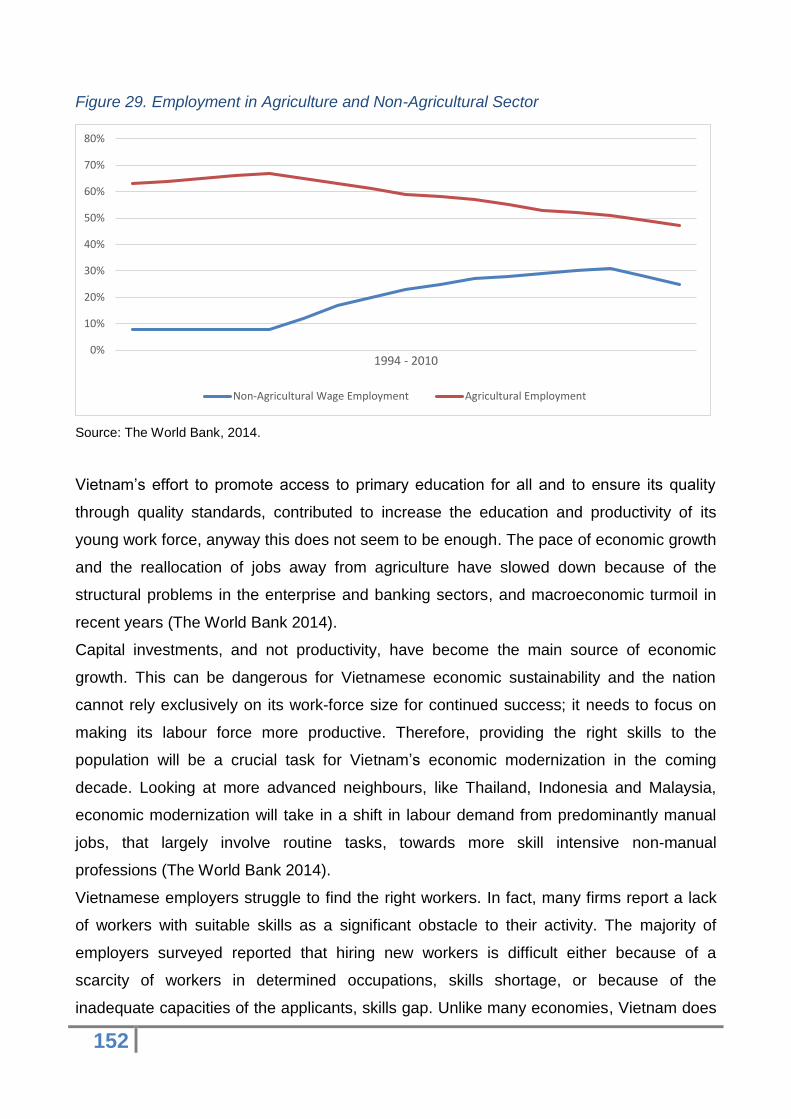
152
Figure 29. Employment in Agriculture and Non-Agricultural Sector
Source: The World Bank, 2014.
Vietnam’s effort to promote access to primary education for all and to ensure its quality
through quality standards, contributed to increase the education and productivity of its
young work force, anyway this does not seem to be enough. The pace of economic growth
and the reallocation of jobs away from agriculture have slowed down because of the
structural problems in the enterprise and banking sectors, and macroeconomic turmoil in
recent years (The World Bank 2014).
Capital investments, and not productivity, have become the main source of economic
growth. This can be dangerous for Vietnamese economic sustainability and the nation
cannot rely exclusively on its work-force size for continued success; it needs to focus on
making its labour force more productive. Therefore, providing the right skills to the
population will be a crucial task for Vietnam’s economic modernization in the coming
decade. Looking at more advanced neighbours, like Thailand, Indonesia and Malaysia,
economic modernization will take in a shift in labour demand from predominantly manual
jobs, that largely involve routine tasks, towards more skill intensive non-manual
professions (The World Bank 2014).
Vietnamese employers struggle to find the right workers. In fact, many firms report a lack
of workers with suitable skills as a significant obstacle to their activity. The majority of
employers surveyed reported that hiring new workers is difficult either because of a
scarcity of workers in determined occupations, skills shortage, or because of the
inadequate capacities of the applicants, skills gap. Unlike many economies, Vietnam does
0%
10%
20%
30%
40%
50%
60%
70%
80%
1994 - 2010
Non-Agricultural Wage Employment Agricultural Employment
153
not suffer from low-cost labour demand; its employers are seeking workers, but they
cannot find the workers that match the requested capabilities.
Employers recognise job-specific technical capabilities as the most important skills, but
they are even searching for cognitive and behavioural skills. As instance, besides job-
specific technical skills, working effectively in groups and solving problems are considered
important cognitive and behavioural capabilities for blue collars. At the same time,
employers hiring white collar workers are expecting them to solve problems, think critically
and present their work and solutions in a convincing way (The World Bank 2014).
Briefly, Vietnamese new scenarios require employees to have effective foundational
abilities, such as good reading skills. In order to be successful, employees also need
advanced capabilities, helping them to be reactive to changes in workplace environment.
Vietnam education system shows effectiveness in producing foundational skills, at the
same time, it faces greater challenges in producing the advanced skills demanded. This is
the major challenge that Vietnam is going to face in order to keep on attracting FDI,
because when companies find more attractive other nations with lower labour costs,
Vietnam will lose a big part of his FDI on manufacturing, without being able to replace it
with other investments in more technological sectors.
4.5 Thailand Economic Outlook
Inward FDI has been one of the most significant driving forces for Thailand’s economic
growth during the last decades. Thailand is an important production and assembly base for
many industries such as automobiles and hard-disk drives. As a result, the country attracts
tremendous investment from multinational enterprises from developed countries including
Japan, the European Union, and the United States. FDI is the crucial factor behind the
miraculous economic growth in Thailand and East Asian countries during the 1990s.
Jansen (1995, cited in Cheewatrakoolpong and Sabhasri, 2012) studied the impact of
inward FDI on the Thai economy and found out that inward FDI can stimulate growth via
investment and export channels. Similarly, Cheewatrakoolpong and Sabhasri (2012)
showed that inward FDI in Thailand significantly promotes employment, total factor
productivity (TFP), and economic growth.
However, Thailand has experienced a lack of operational workers for several years. This
problem comes from a mismatch between demand and supply in the labour market. While
154
the demand for workers that graduate from vocational school has been increasing
because of a rise in manufacturing bases in Thailand, a larger portion of the new
generation chooses to pursue a Bachelor’s or higher degree instead. Furthermore,
Thailand has increased the minimum salary of workers with a Bachelor’s degree to 15,000
THB per month (approximately 500 US$) in 2011.
This policy further drives students away from pursuing vocational study. According to the
World Bank (2012), Thailand faces the most severe problem of shortage in operational
workers and skilled labour when compared with other ASEAN countries. Additionally,
Thailand is turning to be an aging society. Comparing with other ASEAN countries,
Thailand has a more severe aging problem than all the others except for Singapore. The
aging problem in Thailand causes a decline in labour force and intensifies the lack of
operational workers (Cheewatrakoolpong and Boonprakaikawe 2015).
4.5.1 Thai Outward FDI
Besides the issues of the previous section, Thailand faces a sharp increase in the wage
rate and it has enacted a national minimum and uniform wage that mandates a daily rate
of nearly 10 US$ in 2013. The minimum wage rate was around 7.17 US$ in Bangkok and
5.40 US$ in provincial areas in 2011 and became 9.86 US$ and 7.44 US$ respectively in
2012. The increase in the national minimum wage severely affects labour-intensive
industries such as textiles, garments, electronics and leather wares. Both, the shortage in
operational workers and the higher wage rate, has led to a sharp increase in Thailand’s
outward FDI as in Figure 31. This pattern reveals the economic structure of Thailand
(Cheewatrakoolpong and Boonprakaikawe 2015).

155
Figure 30. Thailand Outward FDI per Billion US$ (1994 – 2012)
Source: Cheewatrakoolpong and Boonprakaikawe, 2015.
Apart from the change in the domestic economic structure, trade liberalization and
economic reforms in the Greater-Mekong Sub-regional (GMS) countries like trade
agreements and economic cooperation programs in ASEAN region represent important
driving force for Thai outward FDI. This put outward FDI into a spotlight of Thailand’s
policy and Board of Investment of Thailand (BOI) has started to pay attention to it.
In the Board of Investment’s (BOI) current five-year strategic plan (2013-2017), BOI
changes its mission from “promoting inbound investment” to “promoting both inbound and
outbound investment”. As a result, the BOI has set up Thailand Oversea Investment
Support Centre (TOISC) and Thai Overseas Investment (TOI) Plan: 2013-2017
(Cheewatrakoolpong and Boonprakaikawe 2015). However, when comparing with ASEAN
counterparts, Thailand still has a relatively low level of outward FDI as seen in table below.
0
10
20
30
40
50
60
1994 1995 1996 1997 1998 1999 2000 2001 2002 2003 2004 2005 2006 2007 2008 2009 2010 2011 2012
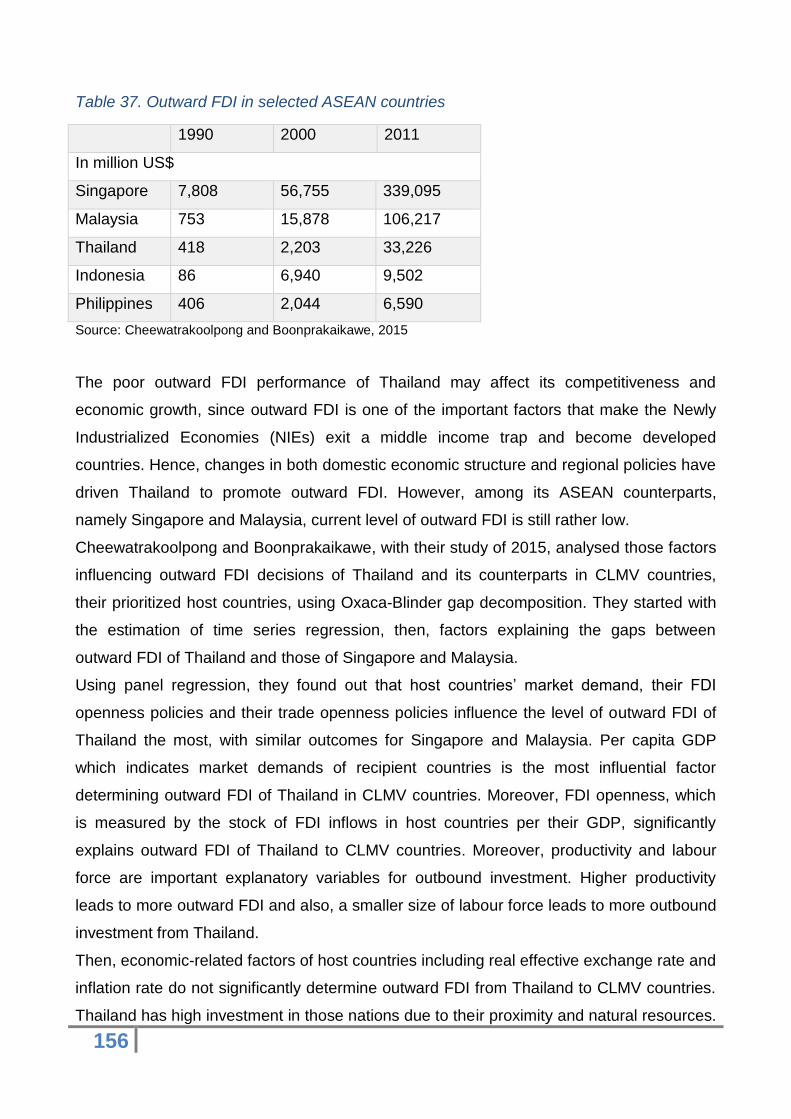
156
Table 37. Outward FDI in selected ASEAN countries
1990 2000 2011
In million US$
Singapore 7,808 56,755 339,095
Malaysia 753 15,878 106,217
Thailand 418 2,203 33,226
Indonesia 86 6,940 9,502
Philippines 406 2,044 6,590
Source: Cheewatrakoolpong and Boonprakaikawe, 2015
The poor outward FDI performance of Thailand may affect its competitiveness and
economic growth, since outward FDI is one of the important factors that make the Newly
Industrialized Economies (NIEs) exit a middle income trap and become developed
countries. Hence, changes in both domestic economic structure and regional policies have
driven Thailand to promote outward FDI. However, among its ASEAN counterparts,
namely Singapore and Malaysia, current level of outward FDI is still rather low.
Cheewatrakoolpong and Boonprakaikawe, with their study of 2015, analysed those factors
influencing outward FDI decisions of Thailand and its counterparts in CLMV countries,
their prioritized host countries, using Oxaca-Blinder gap decomposition. They started with
the estimation of time series regression, then, factors explaining the gaps between
outward FDI of Thailand and those of Singapore and Malaysia.
Using panel regression, they found out that host countries’ market demand, their FDI
openness policies and their trade openness policies influence the level of outward FDI of
Thailand the most, with similar outcomes for Singapore and Malaysia. Per capita GDP
which indicates market demands of recipient countries is the most influential factor
determining outward FDI of Thailand in CLMV countries. Moreover, FDI openness, which
is measured by the stock of FDI inflows in host countries per their GDP, significantly
explains outward FDI of Thailand to CLMV countries. Moreover, productivity and labour
force are important explanatory variables for outbound investment. Higher productivity
leads to more outward FDI and also, a smaller size of labour force leads to more outbound
investment from Thailand.
Then, economic-related factors of host countries including real effective exchange rate and
inflation rate do not significantly determine outward FDI from Thailand to CLMV countries.
Thailand has high investment in those nations due to their proximity and natural resources.
157
In case of Singapore, its income level, outward FDI promotion policy, its productivity level,
the value of its exchange rate and the level of the country’s trade openness contribute to
the level of Singapore’s outward FDI (Cheewatrakoolpong and Boonprakaikawe 2015).
As for Malaysia, the regression results indicate that the country’s income level and its
outward FDI promotion policy play the most important role in explaining its outbound
investment. Exchange rates of host countries may influence Malaysia’s outward FDI, as
well. When host countries have a lower value of currency compared with Malaysia,
Malaysia experiences more outward FDI. Finally, unlike previous estimations of Thailand
and Singapore, the level of FDI openness has no influence on Malaysia’s outward FDI to
CLMV countries.
The best explanatory variables between outward FDI of Thailand and Singapore are the
gaps between the two countries’ income level and the difference in their trade openness.
At the same time, considering the difference between outward FDI of Thailand and
Malaysia, the factors influencing such difference are outward FDI promotion policy and the
difference between the two countries’ national income level. However, host countries’
economic related factors have insignificant influence in determining outbound investment
from developed ASEAN countries to CLMV.
In conclusion, Oxaca-Blinder gap decomposition suggests that difference in national
income and implementation of outward FDI promotion policy contribute most to the
difference between outward FDI performance of Thailand and the other two selected
ASEAN countries. As a result, the introduction of effective outward FDI promotion policy in
Thailand may help the country to catch up with these ASEAN colleagues in term the
outward FDI performance, since the country has started its outward FDI promotion policy
in 2013 while its ASEAN counterparts have implemented such policies for several decades
(Cheewatrakoolpong and Boonprakaikawe 2015).
Here we have some measures that Singapore, through its International Enterprise (IE)
agency, enhanced in order to foster outward FDI and that could be helpful for Thailand
future development (Board of Investment 2017):
Information Provision and Supporting Service. IE provides extensive information
and assistance to Singaporean firms on sector and country basis, chasing
opportunities through leveraging international network and foreign government
policies.
158
Relations and Contacts. The agency helps to arrange meetings with potential
business partners and governmental agencies, fostering collaboration projects.
Financing. Project Finance International (PFI) is a group of private banks providing
loans with IE’s assistance in guaranteeing 70% of the loan. IE provides equity
financing of 2:1 only if firms can raise equity from third parties.
Government Proactive Support. Ministry of Trade and Industry and the Economic
Development Board take charge in creating a favourable environment thanks to tax
treaties and investors protection negotiations.
Training and Development. SPRING (a semi-government agency) and Singapore
Business Federation (private association) are leveraged to provide trainings and
educate businesses.
Among the measures that Thai government has already enhanced to support outward
Direct Investments, we can find (Board of Investment 2017):
the protection of foreign investments, through agreements for the promotion and
protection with partner countries;
fiscal measures, such as Double Taxation agreements and tax exemption on
dividends from offshore investments;
the provision of information and investment related services like training and
consulting services or exploration of opportunities for overseas investment;
financial measures, i.e. long term loans, risk guarantees and capital outflow,
provided in collaborations with EXIM Bank, commercial banks, Thai Credit
Guarantee Corporation and the Bank of Thailand.
It is to be said, anyway, that Thailand presents some specific factors which would require
specific solutions involving the internal companies’ environment. In fact, firms in Thailand’s
competitive sectors, such as food and hospitality, are relatively small, i.e. the largest firm in
the food industry accounts for only the 15% of the revenue of the top regional firm. Then,
Thai export sector is unlikely to drive outward FDI, because electronics and motors (which
accounts for the 32%) are often part of transnational corporations’ supply chains, and the
number of Thai transnational corporations is limited.
159
These weaknesses in value chain suggest that Thai outward FDI is unlikely to look like
newly industrialised economies, where manufacturing functions are relocated overseas,
while keeping R&D, branding and marketing within the national borders. Finally, domestic
banks tend to be localised. As instance, top 3 Malaysian banks’ foreign branches exceed
1,400 versus 50 for top 3 Thai banks (Board of Investment 2017).
4.6 Thai Incentives for Qualified Investments
After these considerations, it is important to analyse and understand even the policies that
Thai government has activated to attract new FDI. Besides the traditional incentives like
Special Economic Zones, it developed a policy with the purpose to enhance science, R&D,
technology and development and innovation. These new fields are vital because would
allow the nation to improve the productivity of labour force and attract those investments
which cannot be addressed to less developed countries like Vietnam.
In 2016, Thailand allocated 20.3 billion THB to increase R&D capabilities, as part of the
policy to boost its knowledge economy and provide new opportunities for investors. The
new policy highlights some separate targets to stimulate Thailand’s R&D capabilities
(Board of Investment 2016):
Increase funding of national research and development to 1% of national GDP. The
target ratio of public to private R&D investment is 30 to 70, in line with the rest of
other developing countries.
Support the use of R&D and innovation in national investment projects, including
projects in clean energy, electricity, automotive vehicles, rail systems, water and
waste management, as well as promoting domestic products and technology.
Review public sector strategies to create opportunities for domestic technology
development and in necessary occasions requiring the need to acquire foreign
materials and technologies, taking advantage of possible spillovers for future
technological self-reliance.
Supporting integrated science, technology, engineering, and math education to
meet the needs of sectors with skill shortages, connecting education to employment
and encouraging public sector research personnel to work with the private sector.
160
4.6.1 Human Capital and Training
The Revenue Department sets a 200% corporate income tax deduction for costs of
educating or training human capital. Conditions that must be respected are (Board of
Investment 2016):
• Training must be for the benefit of the company’s business.
• The training costs per person must stay within the range set by the Ministry of
Labour.
• Individuals that receive training must be employees of the company, and must be
legally registered with the company, as evidence of employment.
• A company that intends to provide training for their employees must have a policy in
place that will allow employees to maintain their employment at the company after
completion of the training.
4.6.2 Tax Incentives for R&D
Thailand’s Board of Investment (BOI) recently redesigned its incentives scheme. The new
incentives program rewards higher value investments in national knowledge based
economy. The conditions to be respected are:
• Scope of R&D activity includes basic research, applied research, pilot and
demonstration activities development.
• Revenues directly related to a promoted business or from downstream production
for commercial purposes, either carried by the promoted company or subcontractor,
must be regarded as revenue of the promoted business.
• Companies applying must provide the Board with the details and scope of such
research and development projects and information on projects’ researchers.
• Equipment machinery for which the investor wishes to apply this incentive must be
used for basic industrial research, applied research, or product quality testing. They
cannot be intended for manufacturing or to provide services.
• In order for the machinery or equipment to qualify for this incentive, the equipment
must be brand new with a life span of two or more years and have a minimum
original product cost of 100,000 THB.
161
• Projects expenses for salaries of R&D personnel must reach at least 1,500,000 per
year THB.
The government will allow companies to base their tax reduction on 3 times the cost of
their R&D expenses. Firms with an income lower than 50 million THB can deduct up to
60% of their income, while companies with income of more than 50 million THB, but lower
than 200 million THB, cannot deduct more than 9% of their income. Finally, firms with
incomes which are higher than 200 million THB cannot deduct more than 6% of their
income (Board of Investment 2016).
Looking at the single projects, they are eligible for the following merit-based incentives:
• Projects in R&D are guaranteed an 8-year CIT exemption without being subject to
an exemption cap, exemption of import duty on machinery or materials used in
manufacturing export products.
• One additional accounting year of CIT exemption is applied if qualified investments
or expenditures are at least 1% of the project’s total revenue of the first 3 years
combined, or not less than 200 million THB, whichever is less (the total period of
exemption must not exceed 8 years).
• Two additional accounting years of tax exemption are provided if qualified
investments are not less than 2% of the project’s total revenue of the first 3 years
combined, or not less than 400 million THB, whichever is less (the total period of
exemption must not exceed 8 years).
• Three further accounting years of corporate income tax exemption if qualified
investments or expenditures are not less than 3% of the project’s total revenue of
the first 3 years combined, or not less than 600 million THB, whichever is less (the
total period of exemption must not exceed 8 years).
• For new R&D equipment and machinery, the depreciation value is set at 40% of the
asset cost for the first year (depreciation tax for machinery is normally 20% for 5
years, with the balance to be depreciated over the following 4 years).
• Projects located in a promoted science and technology park or one that is approved
by the Board will receive an additional 50% reduction in corporate income tax for 5
years after the end of its corporate tax exemption period.
• Non–Tax incentive include permission to bring in expatriates, own land and take or
remit foreign currency abroad.
162
4.6.3 Financial Assistance
Established in 2003, NIA (National Innovation Agency) serves between private and public
agencies to boost innovation in Thai economy. The NIA currently offers grant programs for
firms with promising prototypes of technological products.
o Technology to Capital Program
This grant supports technological innovations that are in the testing or pilot phase. These
prototypes can be derived from patents or inventions that have been approved by the NIA.
At minimum, the technology or knowledge from the project must be usable to create
prototypes for actual production or usable for creating a pilot project from the R&D,
invention, patent/petty patent result.
The entity being supported must make a cash investment valued at no less than 25% of
the project expenditure. The NIA shall provide a grant of no more than 75% of the project
expenditure per project up to a limit of 5 million THB. The support duration is no more than
3 years. The requirements that have to be observed are:
• The innovative device or technology is already functional and can perform its
supposed role.
• The project must be certified or given financial support from an education institute,
research institute, research support agency or a widely recognized business
association; the certification must be in the form of a written document and signed
by an authorized person at the institute or agency.
• The technology or knowledge is derived from a patent or pending patent.
• This program can be for projects that have completed the laboratory phase and are
entering the commercial phase, or are prototypes, experimental units, pilot scales or
plants, and pre-commercial to full-scale trials.
• The technology has passed both commercial production and market feasibility
evaluation from no less than 3 unbiased senior experts from government agencies,
education institutes, research institutes, and research support agencies or well-
known business associations.
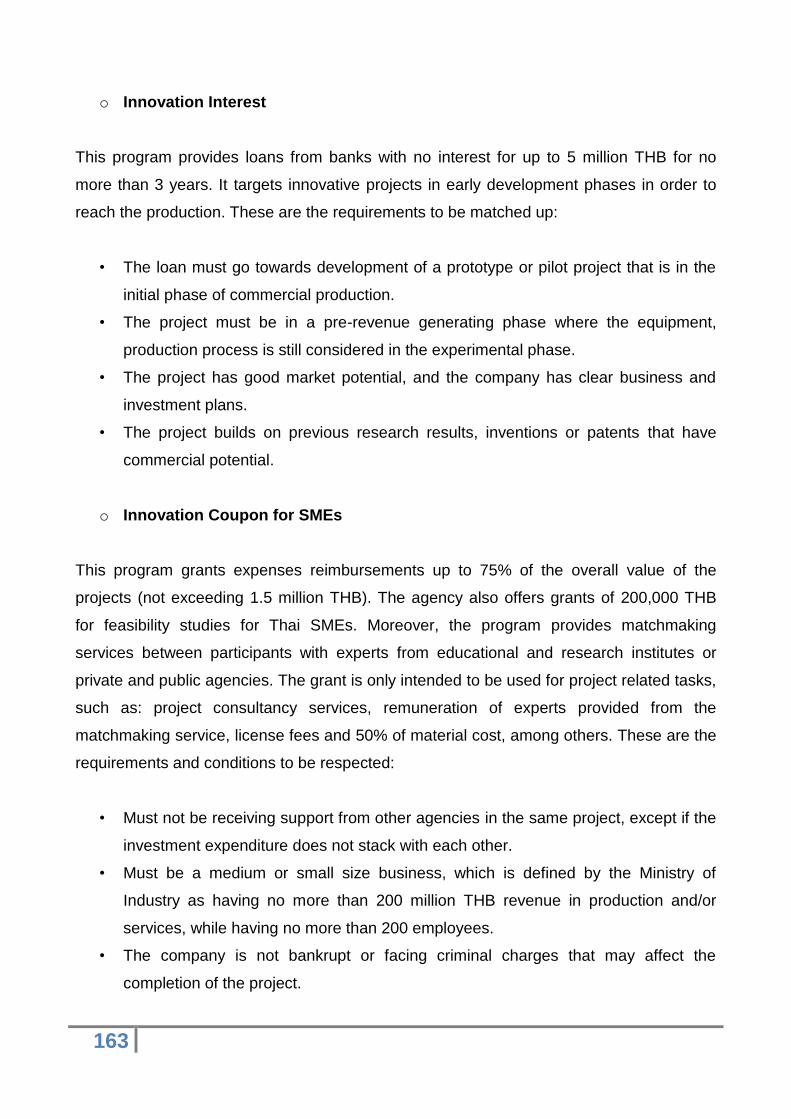
163
o Innovation Interest
This program provides loans from banks with no interest for up to 5 million THB for no
more than 3 years. It targets innovative projects in early development phases in order to
reach the production. These are the requirements to be matched up:
• The loan must go towards development of a prototype or pilot project that is in the
initial phase of commercial production.
• The project must be in a pre-revenue generating phase where the equipment,
production process is still considered in the experimental phase.
• The project has good market potential, and the company has clear business and
investment plans.
• The project builds on previous research results, inventions or patents that have
commercial potential.
o Innovation Coupon for SMEs
This program grants expenses reimbursements up to 75% of the overall value of the
projects (not exceeding 1.5 million THB). The agency also offers grants of 200,000 THB
for feasibility studies for Thai SMEs. Moreover, the program provides matchmaking
services between participants with experts from educational and research institutes or
private and public agencies. The grant is only intended to be used for project related tasks,
such as: project consultancy services, remuneration of experts provided from the
matchmaking service, license fees and 50% of material cost, among others. These are the
requirements and conditions to be respected:
• Must not be receiving support from other agencies in the same project, except if the
investment expenditure does not stack with each other.
• Must be a medium or small size business, which is defined by the Ministry of
Industry as having no more than 200 million THB revenue in production and/or
services, while having no more than 200 employees.
• The company is not bankrupt or facing criminal charges that may affect the
completion of the project.
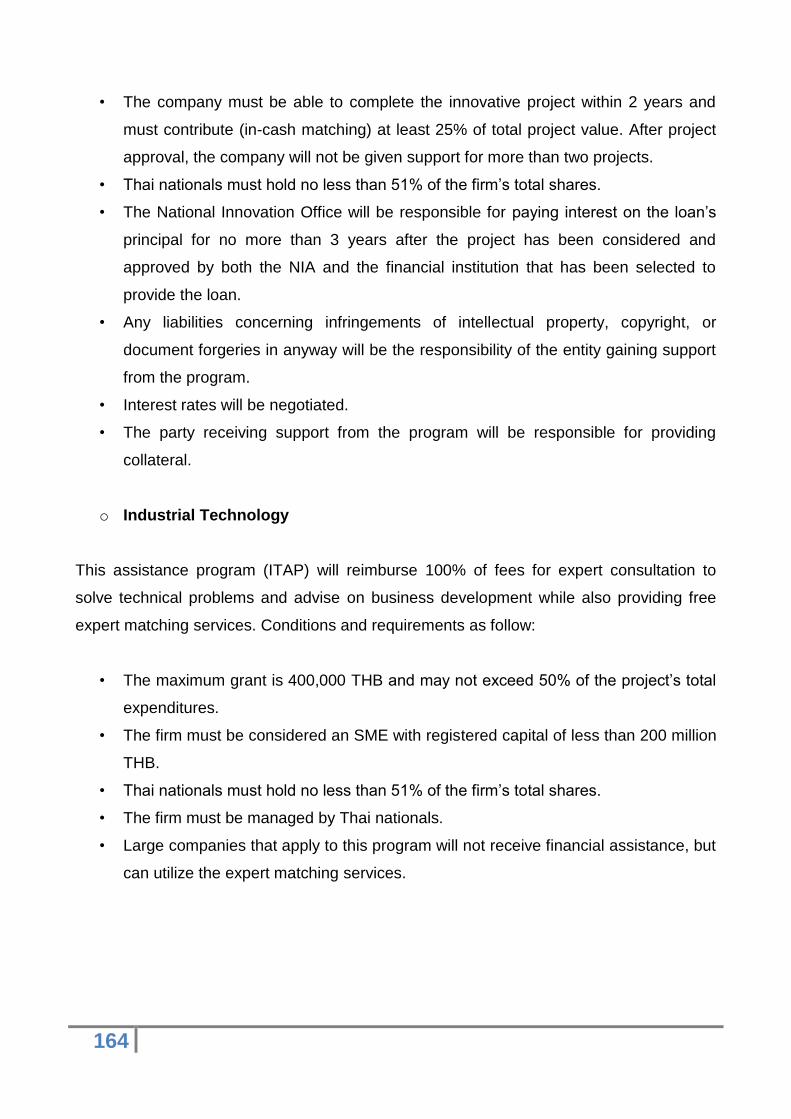
164
• The company must be able to complete the innovative project within 2 years and
must contribute (in-cash matching) at least 25% of total project value. After project
approval, the company will not be given support for more than two projects.
• Thai nationals must hold no less than 51% of the firm’s total shares.
• The National Innovation Office will be responsible for paying interest on the loan’s
principal for no more than 3 years after the project has been considered and
approved by both the NIA and the financial institution that has been selected to
provide the loan.
• Any liabilities concerning infringements of intellectual property, copyright, or
document forgeries in anyway will be the responsibility of the entity gaining support
from the program.
• Interest rates will be negotiated.
• The party receiving support from the program will be responsible for providing
collateral.
o Industrial Technology
This assistance program (ITAP) will reimburse 100% of fees for expert consultation to
solve technical problems and advise on business development while also providing free
expert matching services. Conditions and requirements as follow:
• The maximum grant is 400,000 THB and may not exceed 50% of the project’s total
expenditures.
• The firm must be considered an SME with registered capital of less than 200 million
THB.
• Thai nationals must hold no less than 51% of the firm’s total shares.
• The firm must be managed by Thai nationals.
• Large companies that apply to this program will not receive financial assistance, but
can utilize the expert matching services.
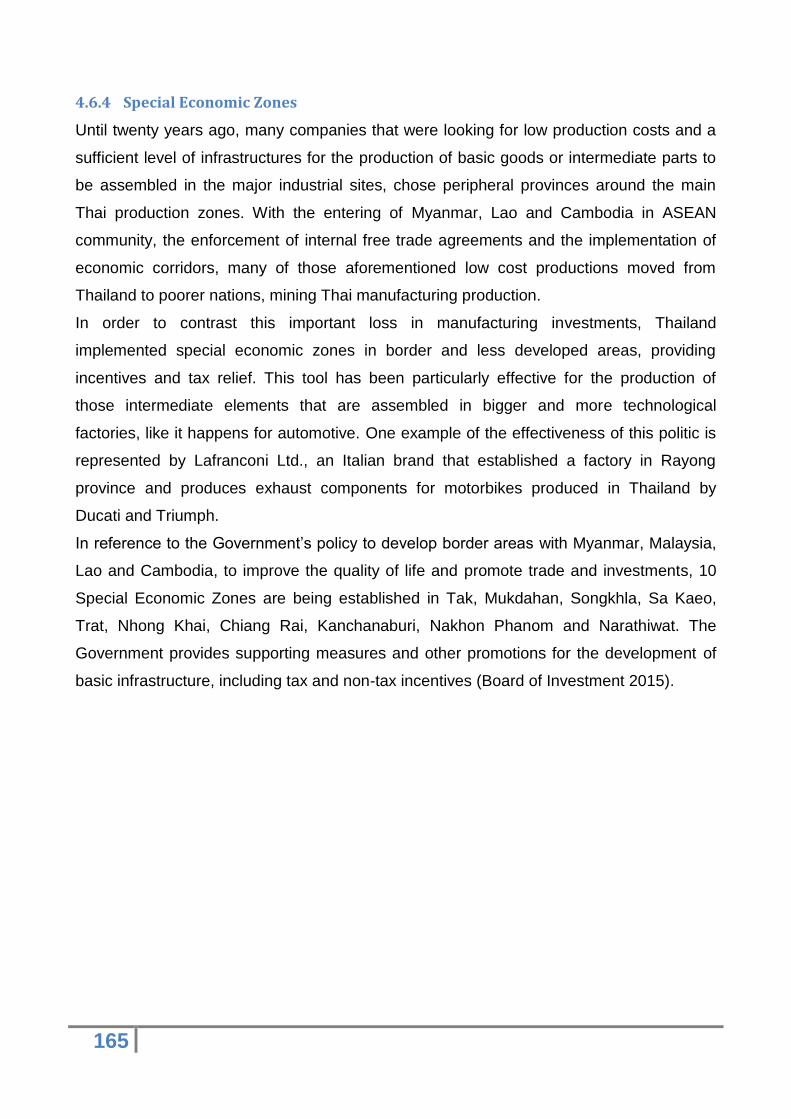
165
4.6.4 Special Economic Zones
Until twenty years ago, many companies that were looking for low production costs and a
sufficient level of infrastructures for the production of basic goods or intermediate parts to
be assembled in the major industrial sites, chose peripheral provinces around the main
Thai production zones. With the entering of Myanmar, Lao and Cambodia in ASEAN
community, the enforcement of internal free trade agreements and the implementation of
economic corridors, many of those aforementioned low cost productions moved from
Thailand to poorer nations, mining Thai manufacturing production.
In order to contrast this important loss in manufacturing investments, Thailand
implemented special economic zones in border and less developed areas, providing
incentives and tax relief. This tool has been particularly effective for the production of
those intermediate elements that are assembled in bigger and more technological
factories, like it happens for automotive. One example of the effectiveness of this politic is
represented by Lafranconi Ltd., an Italian brand that established a factory in Rayong
province and produces exhaust components for motorbikes produced in Thailand by
Ducati and Triumph.
In reference to the Government’s policy to develop border areas with Myanmar, Malaysia,
Lao and Cambodia, to improve the quality of life and promote trade and investments, 10
Special Economic Zones are being established in Tak, Mukdahan, Songkhla, Sa Kaeo,
Trat, Nhong Khai, Chiang Rai, Kanchanaburi, Nakhon Phanom and Narathiwat. The
Government provides supporting measures and other promotions for the development of
basic infrastructure, including tax and non-tax incentives (Board of Investment 2015).
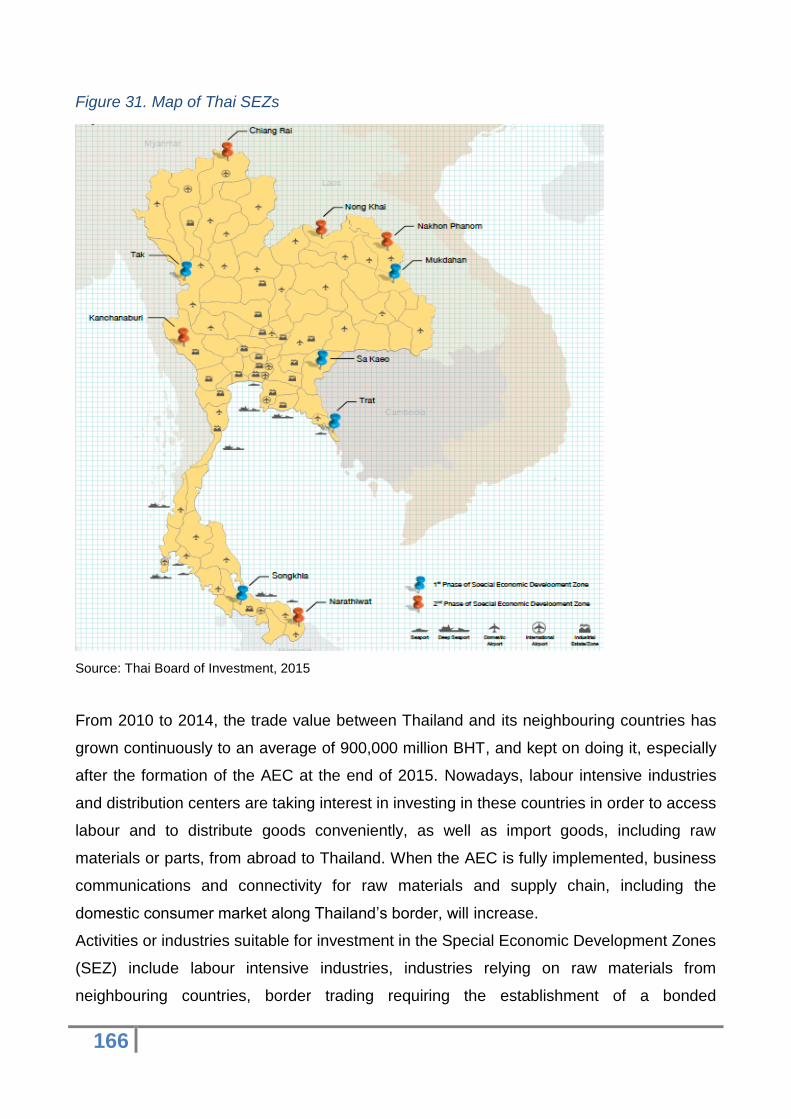
166
Figure 31. Map of Thai SEZs
Source: Thai Board of Investment, 2015
From 2010 to 2014, the trade value between Thailand and its neighbouring countries has
grown continuously to an average of 900,000 million BHT, and kept on doing it, especially
after the formation of the AEC at the end of 2015. Nowadays, labour intensive industries
and distribution centers are taking interest in investing in these countries in order to access
labour and to distribute goods conveniently, as well as import goods, including raw
materials or parts, from abroad to Thailand. When the AEC is fully implemented, business
communications and connectivity for raw materials and supply chain, including the
domestic consumer market along Thailand’s border, will increase.
Activities or industries suitable for investment in the Special Economic Development Zones
(SEZ) include labour intensive industries, industries relying on raw materials from
neighbouring countries, border trading requiring the establishment of a bonded
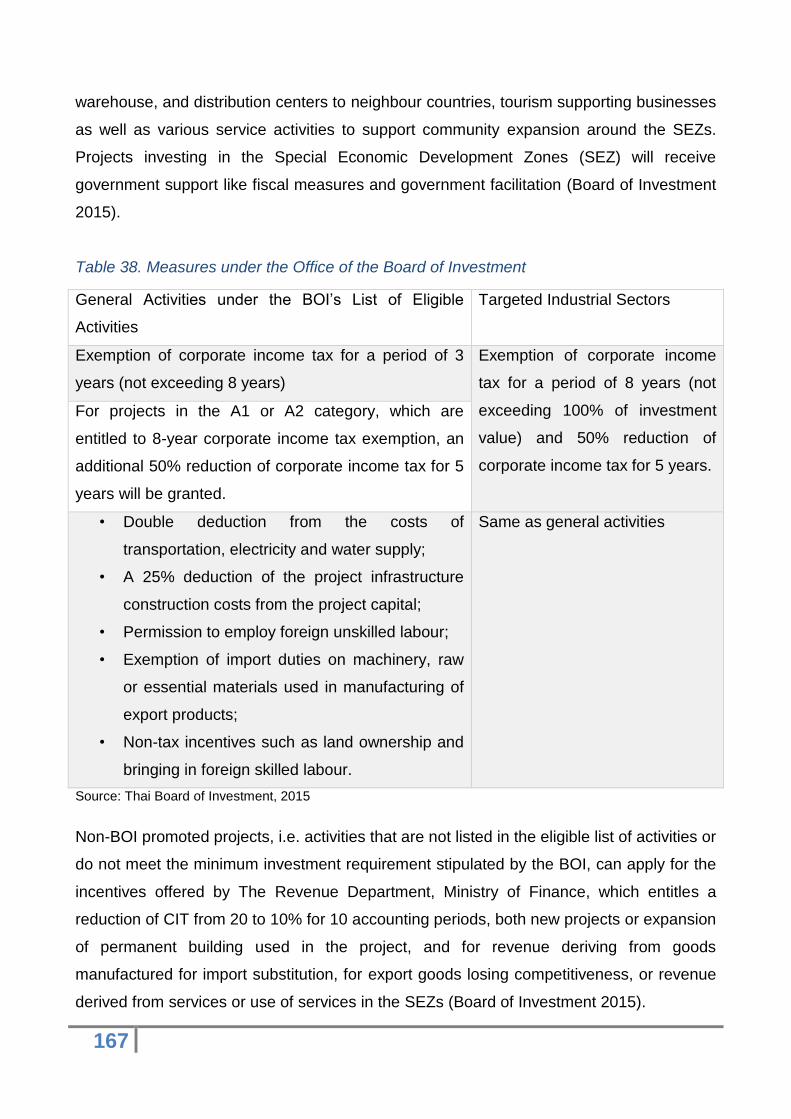
167
warehouse, and distribution centers to neighbour countries, tourism supporting businesses
as well as various service activities to support community expansion around the SEZs.
Projects investing in the Special Economic Development Zones (SEZ) will receive
government support like fiscal measures and government facilitation (Board of Investment
2015).
Table 38. Measures under the Office of the Board of Investment
General Activities under the BOI’s List of Eligible
Activities
Targeted Industrial Sectors
Exemption of corporate income tax for a period of 3
years (not exceeding 8 years)
Exemption of corporate income
tax for a period of 8 years (not
exceeding 100% of investment
value) and 50% reduction of
corporate income tax for 5 years.
For projects in the A1 or A2 category, which are
entitled to 8-year corporate income tax exemption, an
additional 50% reduction of corporate income tax for 5
years will be granted.
• Double deduction from the costs of
transportation, electricity and water supply;
• A 25% deduction of the project infrastructure
construction costs from the project capital;
• Permission to employ foreign unskilled labour;
• Exemption of import duties on machinery, raw
or essential materials used in manufacturing of
export products;
• Non-tax incentives such as land ownership and
bringing in foreign skilled labour.
Same as general activities
Source: Thai Board of Investment, 2015
Non-BOI promoted projects, i.e. activities that are not listed in the eligible list of activities or
do not meet the minimum investment requirement stipulated by the BOI, can apply for the
incentives offered by The Revenue Department, Ministry of Finance, which entitles a
reduction of CIT from 20 to 10% for 10 accounting periods, both new projects or expansion
of permanent building used in the project, and for revenue deriving from goods
manufactured for import substitution, for export goods losing competitiveness, or revenue
derived from services or use of services in the SEZs (Board of Investment 2015).
168
4.7 Concluding Remarks
Even if Vietnam is still considered a developing country in ASEAN, it is currently attracting
more investments and has a more relevant export volume than other countries such as
Philippines, Indonesia and Thailand itself, which was considered one of the major
industrialised players within Indo-Chinese peninsula. In detail, Vietnam is attractive
because of its low cost labour force, the geographical position by the Pacific Ocean, a high
degree of openness to FDI, but at the same time, improved infrastructures with respect to
other developing countries, a bigger internal market with respect to Lao and Cambodia
and, finally, a political situation which is way much stable than the Burmese one.
Since industrial productions in China became too costly, with respect to other developing
nations, an important amount of FDI has been directed to ASEAN region. The fact is that
while 10 years ago these resources would have reached Thai industrial zones, in the last
years a consistent part has been addressed to Vietnam. Even if Thailand is still the
regional leader in industrial production with an elevated technology content like the
automotive sector, Vietnam reforms and its political stability, attracted the instalment of
production sites for textiles, garments, shoes and even small engines motorbikes.
Thailand managed to preserve its independency during colonialism throughout commercial
agreements with European nations. Then, in the second half of the 20th century, it started
its liberalisation reforms, during the reign of King Rama IX, which brought it to an important
level of economic development. But in the last 20 years, especially because of political
instability and the financial crisis, Thailand lost is growth path and it is getting reached by
competitor countries. Thailand is now trying to enhance and attract resources in education,
science, R&D and technological industrial sectors like biotechnology, in order to attract
investments which can bring new knowledge and competencies that represent a
strategical advantage with respect to less developed nations. We cannot tell if the
implemented incentives are effective yet, anyway they seem to be directed towards the
right path, providing an alternative to the other competitor nations in ASEAN.
Moreover, as suggested by aforementioned studies, it should pay attention to the levels of
openness to FDI (especially for services) and enhance the promotion of outward FDI.
These two are crucial factors that can allow Thailand to move out from being a middle
income nation and reach higher levels of economic development, differentiating completely
from developing nations like Vietnam. As we have seen from Thangavelu’s study, Thailand
has lower levels of openness to FDI with respect to other nations and this limits not only
169
the arrive of investments in the short run, but it poses limits to the enhancement of a
favourable and stimulating business environment.
Then, even if they are less easy to notice, other motivations have to be found in the Thai
political situation which have been pretty instable during the last years. At the moment, the
military junta which seized power in May 2014, is carrying on a military-backed draft
constitution, postponing democratic elections and limiting personal freedom of speech and
protest, especially on social media. This situation brought new tensions, particularly with
Muslim minorities of the Southern provinces, which started to attack even touristic sites
(Pananond 2017). If we consider even the high levels of corruption, such an environment
cannot attract stable and consistent FDI, mining all the endeavours which have been done
so far.
If Thailand managed to create a more favourable business environment through political
stability, and service FDI openness, all the actions and reforms carried on for the
technological development would be even more effective and MNEs would consider the
nation the perfect hub for their regional activities. Moreover, consistent investments would
be addressed to those projects with high technological content that could not be replicated
in other states of the ASEAN community. In conclusion, Thailand has still many challenges
to face and it has no time to lose, but it seems like it can have the right characteristics to
re-gain competitiveness with respect to its competitors with a medium-long run strategy
that could bring substantial advantages.
170
Conclusions
With respect to European Union, ASEAN presents way much different levels of economic
development, but also different political structures, spanning from the highest living
standards of the liberal Singapore, to the poor communist state of Lao. In such an
environment, it is very difficult to elaborate a shared strategy that aims at satisfying all the
different necessities. At the same time, ASEAN agencies must take into account the
effects that national policies can cause over the rest of neighbouring countries.
The first steps of liberalisations, like creating the ASEAN Economic Community, allowing
all the members to have the same treatment within the bloc, was fundamental not only to
attract new FDI from MNEs, that can take advantage of the enlarged internal market, but
even for ASEAN companies, which can relevantly enlarge their scope of action without the
important investments required by the setting up of a multinational.
ASEAN strategies must be diversified in the extent that the most developed nations like
Thailand, Indonesia, Malaysia and the Philippines have to attract FDI addressed to high-
technology industries, developing and specialising in sectors whose knowledge and
technologies are not easy to be replicated or replaced. In order to do this, educational
system and scientific research must be empowered, assuring collaborations between
public and private sectors. Then, openness to services FDI must be enhanced because it
has positive effects all over the business environment and better services like the ones in
financial sector can maximize the potential of domestic business. Furthermore, outward
FDI must be incentivised by the governments because in this way, domestic businesses
can exploit all their potential and grow to a multinational dimension.
For the least developed countries of CLMV bloc, it is important to attract those industrial
productions that can be carried out without high levels of education of the labour force or
high investments in technologic equipment. While in developed countries like in European
Union, businesses usually set their productions in clusters or districts within limited
geographical areas, in ASEAN multinational enterprises which produce elevated quantities
of goods can take advantage of the economies of scale that arise from the diversification
of the production sites. As we have seen from the case of automotive sector, the
establishment of SEZs and the development of economic corridors have successfully
become important factors in MNEs’ strategies, because they find convenient to set the
production of basic components in border areas of countries like Lao and Cambodia, and
then assemble final products in Thai or Vietnamese plants.
171
Anyway, even if in the short or medium term this strategy can bring vital resources to
poorest areas, it is important to start empowering basic services such as education and
healthcare as soon as possible, and progressively enhance infrastructures and labour
force productivity. For example, even if labour costs are still low in countries such as Lao,
Cambodia and Vietnam, the growing levels of FDI are improving life conditions of the
population and so do wages and salaries. The same MNEs that today find attractive these
countries for production, in the future could find more remunerative to move their activities
to poorer sites like Myanmar, Bangladesh and so on.
Losing important ratios of FDI from companies which rely on low cost labour, can be
counterbalanced by a more favourable business environment. In this sense, many reforms
on taxation, liberalisation and trade agreements have brought outstanding results, with the
help of ASEAN community, but apart from industrial and commercial environment, a lot
has still to be done in terms of labour force productiveness and improved conditions for
business-making. To reach these goals, important investments must be directed to
education, research (both public and private), efficient infrastructures, but also a higher
degree of service openness, not only financial or assurance entities, even the basic ones
such as telecommunications or energy providers. In fact, it is impossible to set up a
business in zones where blackouts are frequent and internet connection is not available all
day long, no matter what the tax incentives or the labour costs are.
Additionally, ASEAN community has to put more attention on the primary sector.
Agriculture must not be seen in a dimension of self-sustenance for small landowners, like it
still happens in less developed countries. As Lao is doing, enhancing certifications and
promoting the cultivation of biological and local productions, can attract FDI and earnings
comparable to those addressed to industrialisation, with remarkable outcomes even by the
social side. The Golden Triangle across Myanmar, Thailand and Lao is still one of the
main sites for opium production in the world, but incentives for tea and coffee plantations,
even thanks to an important touristic promotion, are providing an effective alternative to
the illegal activity.
The crucial point lays in connecting the majority of agricultural producers to the global
markets. The offer of quality local products can be easily absorbed by the foreign markets,
but in order to make even small land-owners to take advantage of these possible gains,
ASEAN community must encourage the enforcement of certifications and the creation of
consortia, which can attract international dealers and buyers. Moreover, ASEAN must
control the usage of natural environment in a cross-national way, since nations that use
172
natural resources for agriculture or electricity production, can damage neighbouring states,
as we have seen for Lao and Cambodia.
In conclusion, multinational and domestic companies can find a favourable and profitable
environment for a wide range of sectors, but they have to pay attention to the different
characteristics of the countries. The big internal market, the large disposal of low cost
labour, the important trade partners, and the outstanding growth rates are only some of the
characteristics that make ASEAN interesting to worldwide businesses. Despite the
importance of macroeconomic factors fostering the market, in many nations relevant
opportunities have been created through the improvement of a technologic and productive
environment. MNEs must not look at ASEAN only for short term investments, but they
already have the possibility to set important projects for the medium-long run, based on
research and development.
173
Bibliography
ASEAN provides information about its history, organisms and members on its website
(July 2017): http://asean.org/
ASEAN Secretariat (2016). ASEAN community in figures 2016, Jakarta, Indonesia:
ASEAN Secretariat.
Available at: http://asean.org/resource/publications-2/
ASEAN (2004). ASEAN statistical yearbook, Jakarta, Indonesia: ASEAN Secretariat.
August, Mayer and Bixby (2013). International Business Law 6th edition, Washington:
Pearson.
Baltagi, B.H., Egger, P., and Pfaffermayr, M. (2007). Estimating models of complex FDI:
Are there third-country effects? Journal of Econometrics, 140 (1), 260 - 281.
DOI: http://dx.doi.org/10.1016/j.jeconom.2006.09.009
Blonigen, B. A. (2005). A review of the empirical literature on FDI determinants. Atlantic
Economic Journal, 33 (4), 383-403.
DOI: 10.1007/s11293-005-2868-9
Board of Investment of Thailand provides information about national incentives and the
economic environment on its website (August 2017):
http://www.boi.go.th/index.php?page=index
Board of Investment (2016). Support Measures for Activities Related to Science and
Technology Development, Bangkok: Thailand Board of Investment.
Board of Investment (2015). A Guide to Investment in the Special Economic Development
Zones, Bangkok: Thailand Board of Investment.
174
Cheewatrakoolpong, K., and Boonprakaikawe, J. (2015). Factors Influencing Outward FDI:
A Case Study of Thailand in Comparison with Singapore and Malaysia. Southeast Asian
Journal of Economics, 3 (2), 123 - 141.
Available at:
http://www.econ.chula.ac.th/public/publication/journal/2015/Kornkarun%20Cheewatrakoolp
ong%20Juntip%20Boonprakaikawe.pdf
Council for the Development of Cambodia provides information about national incentives
and the economic environment on its website (July 2017):
http://www.cambodiainvestment.gov.kh/why-invest-in-cambodia/investment-
enviroment/economic-trend.html
De Mooij, R. A., & Ederveen, S. (2003). Taxation and foreign direct investment: a
synthesis of empirical research. International tax and public finance, 10 (6), 673 - 693.
DOI: https://doi.org/10.1023/A:1026329920854
Ducati Thailand provides information about its history and plant on its website (August
2017): http://www.ducatithailand.com/index.do
Dunning, J. H., and Lundan, S. M. (2008). Multinational enterprises and the global
economy. Cheltenham: Edward Elgar.
Foreign Investment Agency (February 26, 2016). Vietnam welcomes record high FDI,
Vietnamplus [online].
Available at: http://fia.mpi.gov.vn/detail/4309/vietnam-welcomes-record-high-fdi
General Statistics Office (2015). Statistical Handbook of Vietnam, Hanoi: Statistical
Publishing House.
Healy, P. M., and Palepu, K. G. (2001). Information asymmetry, corporate disclosure, and
the capital markets: A review of the empirical disclosure literature. Journal of accounting
and economics, 31 (1), 405 - 440.
DOI: https://doi.org/10.1016/S0165-4101(01)00018-0
175
Hoang, H. and Bui, D. (2015). Determinants of foreign direct investment in ASEAN: A
panel approach. Management Science Letters, 5 (2), 213 - 222.
DOI: 10.5267/j.msl.2014.12.015
Investment Promotion Department of Lao provides information about national incentives
and the economic environment on its website (August 2017): http://www.investlaos.gov.la/
Ishida, M. (2009). Special economic zones and economic corridors. ERIA Discussion
Paper Series, 16.
Available at: https://core.ac.uk/download/pdf/9306181.pdf
Ismail, N.W. (2009). The determinants of foreign direct investment in ASEAN: A semi
gravity approach. Transition Studies Review, 16 (3), 710 - 722.
DOI: https://doi.org/10.1007/s11300-009-0103-0
Jones, C., and Temouri, Y. (2016). The determinants of tax haven FDI. Journal of World
Business, 51 (2), 237 - 250.
DOI: https://doi.org/10.1016/j.jwb.2015.09.001
Kaliappan, S., Khamis, K., and Ismail, N. (2015). Determinants of Services FDI Inflows in
ASEAN Countries. International Journal of Economics and Management, 9 (1), 45 - 69.
Available at:
http://psasir.upm.edu.my/39597/1/Determinants%20of%20services%20FDI%20inflows%2
0in%20Asean%20countries.pdf
Kobayashi, H., and Jin, Y. (2015). The CLMV Automobile and Auto Parts Industry. ERIA
Discussion Paper Series, 23.
Available at: http://www.eria.org/ERIA-DP-2015-23.pdf
KPMG International (2016). 2016 Asia Pacific indirect tax country guide, Zurich: KPMG
International.
Li, Q., Scollay, R., and Maani, S. (2016). Effects on China and ASEAN of the ASEAN -
China FTA: The FDI perspective. Journal of Asian Economics, 44, 1 - 19.
176
DOI: https://doi.org/10.1016/j.asieco.2016.05.001
Luedde‐Neurath, R. (1984). State intervention and foreign direct investment in South
Korea. IDS Bulletin, 15 (2), 18 - 25.
DOI: 10.1111/j.1759-5436.1984.mp15002004.x
Ministry of Planning and Investment of Vietnam provides information about national
incentives and the economic environment on its website (July 2017):
http://fia.mpi.gov.vn/news/125/FDI-Incentives/en
Pananond, P. (May 27, 2017). Thailand faces economic costs of social media censorship,
Nikkei Asian Review [online].
Available at: https://asia.nikkei.com/Viewpoints/Pavida-Pananond/Thailand-faces-
economic-costs-of-social-media-censorship
Sharma, R. (2016). Taxing and Subsidizing Foreign Investors (2016). Economics Faculty
Working Papers, 50. Available at: http://commons.colgate.edu/econ_facschol/50
Singh, R., and Das, R. (2015). Integrating CLMV into the ASEAN Economic Community:
Challenges and Opportunities, Proceedings of 4th International Conference on Global
Business Environment, 137 – 145.
Available at:
https://s3.amazonaws.com/academia.edu.documents/36512654/The_Positives_of_corss_
cultural_2014.pdf?AWSAccessKeyId=AKIAIWOWYYGZ2Y53UL3A&Expires=1506097312
&Signature=sEBffXCtlXpLut9DTP%2B4okLUDr8%3D&response-content-
disposition=inline%3B%20filename%3DThe_Positives_of_Cross-
Cultural_Interact.pdf#page=137
Stillman, G., and Rillo, A. (2015). Boosting Agriculture in the Lower Mekong, Tokyo: Asian
Development Bank Institute.
Thangavelu, S. M. (2015). FDI restrictiveness index for ASEAN: Implementation of AEC
blueprint measures. ERIA Discussion Paper Series, 43.
Available at: http://www.eria.org/ERIA-DP-2015-4.pdf

177
Thangavelu, S. M., and Ing, L. Y. (2015). Services Productivity and Trade Openness:
Case of ASEAN. ERIA Discussion Paper Series, 56, 195 – 222.
Available at: http://www.eria.org/RPR_FY2014_No.6_ed.1_Chapter_7.pdf
The World Bank provides data and schemes about FDI inflows on its website (July 2017):
https://data.worldbank.org/indicator/BX.KLT.DINV.CD.WD
The World Bank (2014). Skilling up Vietnam: Preparing the workforce for a modern market
economy, Hanoi: Vietnam Development Information Centre.
Wrest, S., and Brown, M. (2016). The 2016/17 ASEAN Tax Comparator, Singapore:
Dezan Shira & Associates.