Embed Size (px)
Citation preview
FOREIGN DIRECT INVESTMENT (FDI) IN SOUTHERN AFRICAN DEVELOPMENT COMMUNITY (SADC1) COUNTRIES
Paper Prepared for the Committee of the Central Bank Governors
In SADC
By
Reserve Bank of Zimbabwe
1SADC member states include: Angola, Botswana, Democratic Republic of Congo, Lesotho, Madagascar, Malawi, Mauritius, Mozambique, Namibia, Seychelles, South Africa, Swaziland, Tanzania, Zambia and Zimbabwe.
2
DISCLAIMER
The views expressed are those of the authors and do not necessarily represent those of the
members of the Committee of Central Bank Governors (CCBG) in the Southern African
Development Community (SADC). While every precaution is taken to ensure the accuracy of
information, the CCBG shall not be liable to any person for inaccurate information or opinions
contained herein. For any information concerning this paper please contact the following
persons:
Mr. Simon Nyarota, Senior Division Chief, Economic Research, Reserve Bank of Zimbabwe,
Mr. William Kavila, Chief Economist, Economic Research, Reserve Bank of Zimbabwe,
Mr. Nebson Mupunga, Principal Economist, Economic Reseach, Reserve Bank of Zimbabwe.
3
TABLE OF CONTENTS 1. SECTION 1: INTRODUCTION ........................................................................................................... 6
1.1. Background to the Study ................................................................................................................... 6
1.2. Justification and Objectives of the Study .......................................................................................... 7
1.3. Research Questions ........................................................................................................................... 8
1.4. Organization of the Paper .................................................................................................................. 9
2. SECTION II: FDI DYNAMICS IN SADC COUNTRIES ................................................................... 9
2.1. Stock of FDI in SADC Countries ...................................................................................................... 9
2.2. Trends in FDI Inflows in SADC ..................................................................................................... 10
2.3. Mode of Entry for FDI Inflows ....................................................................................................... 13
2.4. FDI Source Countries in SADC ...................................................................................................... 14
2.5. Factors Underlying FDI Trends ....................................................................................................... 15
2.6. Cost of doing business in SADC Countries..................................................................................... 17
2.7. Foreign Investment Restrictions ...................................................................................................... 18
2.8. Infrastructure Deficit ....................................................................................................................... 19
3. SECTION III: REVIEW OF THEORETICAL AND EMPIRICAL LITERATURE ......................... 20
3.1. Conceptual Framework of Foreign Direct Investment .................................................................... 21
3.2. Theoretical Framework for FDI ...................................................................................................... 21
3.3. Empirical Review of Literature ....................................................................................................... 22
4. SECTION IV: EMPIRICAL ANALYSIS ........................................................................................... 25
4.1. Model Variables .............................................................................................................................. 26
4.2. Role of Institutional Factors ............................................................................................................ 26
4.3. Role of Governance Indicators ........................................................................................................ 27
4.4. Data Sources and Estimation Procedure .......................................................................................... 28
5. SECTION V: RESULTS AND ANALYSIS....................................................................................... 29
5.1. Results of Regression Analysis ....................................................................................................... 29
5.2. Random Effects Regression Results ................................................................................................ 30
5.3. Conclusion ....................................................................................................................................... 32
5.4. Recommendations ........................................................................................................................... 33
4
LIST OF FIGURES
Figure 1: Comparison Of Share Of SADC Total FDI With Other Regional Groupings ............................. 10
Figure 2: FDI Inflows in SADC Countries .................................................................................................. 11
Figure 3:Average Net FDI Inflows USD Millions (2001-2012) ................................................................. 12
Figure 4: Total FDI from China and USA (2003-2011) .............................................................................. 14
LIST OF TABLES
Table 1: Cumulative Greenfields and Mergers and Acquisition (2005-2012) ............................................ 13
Table 2: List of Bilateral Investment Treaties (BITs) and International Investment Agrements (IIA’s) for
SADC Countries .......................................................................................................................................... 15
Table 3: Doing Business Rankings for SADC Countries 2012 ................................................................... 18
Table 4:Infrastructural indicators in Africa ................................................................................................. 20
Table 5:Table Correlation Matrix for the FDI and Its Determinants........................................................... 29
Table 6: Random effects Regression Results on FDI determinants in SADC ............................................ 30
Table 7: NET FDI Inflows in SADC Countries(US$ Million) ................................................................... 38
Table 8:Value of Greenfield Investment (US$ Million) ............................................................................. 39
Table 9:Number of Greenfield Investments(2005-2011) (US$ Million) .................................................... 40
Table 10:Value of cross border Mergers and Acquisitions(US$ Million) .................................................. 40
Table 11:Number of Cross Border Mergers and Acquisitions (US$ Million) ............................................ 41
5
ABSTRACT
This paper reviews the experiences of SADC countries in attracting foreign direct investment
(FDI) and explores the major determinants of FDI in the SADC region. A cross-country panel
regression analysis using data from 1996-2011 for SADC countries was applied to ascertain the
determinants of FDI. The estimation results from a panel of SADC member countries show that
agglomeration, credit to private sector, urban population share, trade openness, market size and
infrastructural development have a positive significant relationship with FDI inflows in the
region.
The major recommendation from the study is the need to improve both institutional and
governance indicators to create a conducive business environment for FDI. SADC member
countries need to deal with the high cost of financial intermediation as well as removing
restrictions on market seeking and locational advantage FDI. Member states also need to
strengthen regional integration and greater diversity on investment matters for the region to
benefit from synergetic effects of regional integration through the halo effect. Overall, attracting
FDI alone is not enough for sustainable economic development and poverty reduction. SADC
member countries need to have holistic policies in place, which should encompass equitable
distribution of income to reap full multiplier effects of FDI.
6
1. SECTION 1: INTRODUCTION
1.1. Background to the Study
Global competition for FDI has intensified, against the backdrop of continued global economic
and financial fragilities and inadequacy of domestic resources to meet investment needs in most
economies. Concomitantly, investment promotion strategies employed by countries to attract FDI
have also continued to change in a bolder and innovative manner. The increased competition for
FDI has seen a number of countries and regional blocs putting in place policies to enhance FDI
attraction at both country and regional level. Consistent with this, SADC has passed a number of
protocols and policies such as the Finance and Investment Protocol (FIP) and Free Trade Area
(FTA) in a bid to enhance the investment climate at regional and country level. Although these
policies are yet to be fully implemented, they have already taken root in enhancing the appeal of
SADC as an attractive investment destination.
Notwithstanding these developments, SADC member countries still face enormous challenges in
building a conducive environment for FDI, as reflected by varied and uneven patterns of FDI
flows within the region. Major challenges relate to adverse political developments and political
risks, lack of the requisite legisltation to protect investment, energy and infrastructural
bottlenecks, corruption and weak integration processes at the regional level. Some countries in
the region score very low in terms of institutional and governance indicator rankings, such as
doing business and government effectiveness. This has deterred potential FDI inflows and
negatively affected the regions’ growth potential, amid vast untapped resources.
Recommendations from various researchers2 point to the need to reduce the cost of doing
business and improving infrastructure such as roads, rail and telecommunications, necessary to
bring down the comparatively high investment costs for investors. Reports issued by multilateral
organizations, such as the World Bank (WB), and their rankings concerning the investment
climate of the respective country or region are an international dimension that also affects FDI
inflows in SADC. These rankings are seriously considered by investors when making a decision
about whether or not to invest in a particular sector in the region.
2 See for example, FDI in SADC Countries prepared by the Centre for Chinese studies
7
In addition, barriers to entry still exist in some SADC countries, where certain sectors are
reserved for indigenous people. In some cases, investors avoid investing in some SADC member
countries due to policy uncertainty and contradictions and high levels of corruption. Although
most SADC countries have improved their regulatory frameworks by permitting profit
repatriation and providing tax and other incentives to attract investment, the challenge remains on
the need to attract investment in high value added sectors.
The combination of the various schools of thought on factors affecting FDI in different
economies and its impact on economic development highlights the need for empirical research on
this subject matter. Against this backdrop, this study seeks to investigate why some SADC
countries continue to receive more FDI inflows compared to others, despite comparable resource
endowments and common policy stance and direction. The answer to this question calls for a
comprehensive analysis of the major factors driving FDI inflows in the SADC region.
1.2. Justification and Objectives of the Study
The importance of FDI to regional economic development and its contribution to poverty
reduction underscores the need for comprehensive analysis of the factors affecting it and
appropriate regulations and strategies to be instituted to enhance FDI attraction. Previous studies
on FDI have mainly centered on its potential benefits for developing countries in terms of job
creation, technology transfers, growth and development in developed and developing countries
(Asiedu, 2006 and Quazi, 2007).
Few studies have, however, concentrated on exploring why other countries in SADC have
managed to attract significant FDI than others, despite comparable resource endowments.
Additionally, the policies being pursued by SADC, such as the FIP and FTA are relatively new
and their impact on FDI are yet to be established3. It is expected that the knock-on effects of
lower tariffs and increased intra-regional competition introduced by the FIP, and FTA will have a
positive effect on FDI in SADC. This study utilizes recent data which captures the effect of these
SADC initiatives on FDI.
3SADC has passed a number of protocols and regional integration goals, such as the Financial
and Investment Protocol (FIP), approved in 2006 and the Regional Indicative Strategic Development Plan (RISDP), passed in 2003
8
This paper contributes to the existing debate on FDI by exploring FDI trends in SADC member
countries, including the major sources and constraints with a view to recommending appropriate
strategies for improving FDI in the region.
As such, the objectives of the study are to:
a) Critically examine the extent and nature of disparities in FDI flows in SADC Member States;
b) Understand why some countries in SADC are able to attract more FDI than others;
c) Examine the strategies and concerns of major investor countries in SADC;
d) Investigate the major determinants of FDI attraction in SADC; and
e) Make policy recommendations on how to improve FDI inflows in SADC.
The findings from this study will contribute to identifying opportunities for regional economies to
engage with potential investors in a way that enhances the spin-offs of FDI with potential for
ensuring sustainable economic growth and development.
1.3. Research Questions
In view of the different levels of FDI trends in SADC countries, the following key questions need
to be answered:
a) Why have some countries in the SADC region managed to attract more FDI than others?
b) Can regional integration increase the likelihood of FDI inflows in SADC countries, In other
words, do FTA and FIP have an impact on FDI because of a halo effect4, a larger market or
easier establishment of cross-border production networks?
c) What are the implications of the answers to the above questions for national and regional
policies?
4 It is the phenomenon whereby we assume that because people are good at doing A they will be good at doing B, C and D (or the reverse, because they are bad at doing A they will be bad at doing B, C and D). The phrase was first coined by Edward Thorndike, a psychologist who used it in a study published in 1920 to describe the way that commanding officers rated their soldiers. He found that officers usually judged their men as being either good right across the board or bad.
9
1.4. Organization of the Paper
The rest of the paper is organized as follows, Section 2, presents an overview of recent trends in
FDI in the SADC region over the past decade and highlights the major factors that contributed to
FDI patterns. Section 3, reviews the existing literature on FDI including the major determinates
of FDI, to developing economies. Section 4, highlights the methodology applied in the study and
specifies an econometric methodology for assessing the main determinants of FDI in the SADC
region. Section 5 presents and analyzes the results from the study and finally, Section 6
summarizes the study as well as provide some policy recommendations, implications and areas
for further research.
2. SECTION II: FDI DYNAMICS IN SADC COUNTRIES
2.1. Stock of FDI in SADC Countries
The stock of FDI in SADC countries increased considerably over the past three decades, from
around US$24.7 billion in 1980 to US$204 billion by 2011. This notwithstanding, FDI per capita
and the share of SADC FDI stock to total world FDI has remained relatively small, although
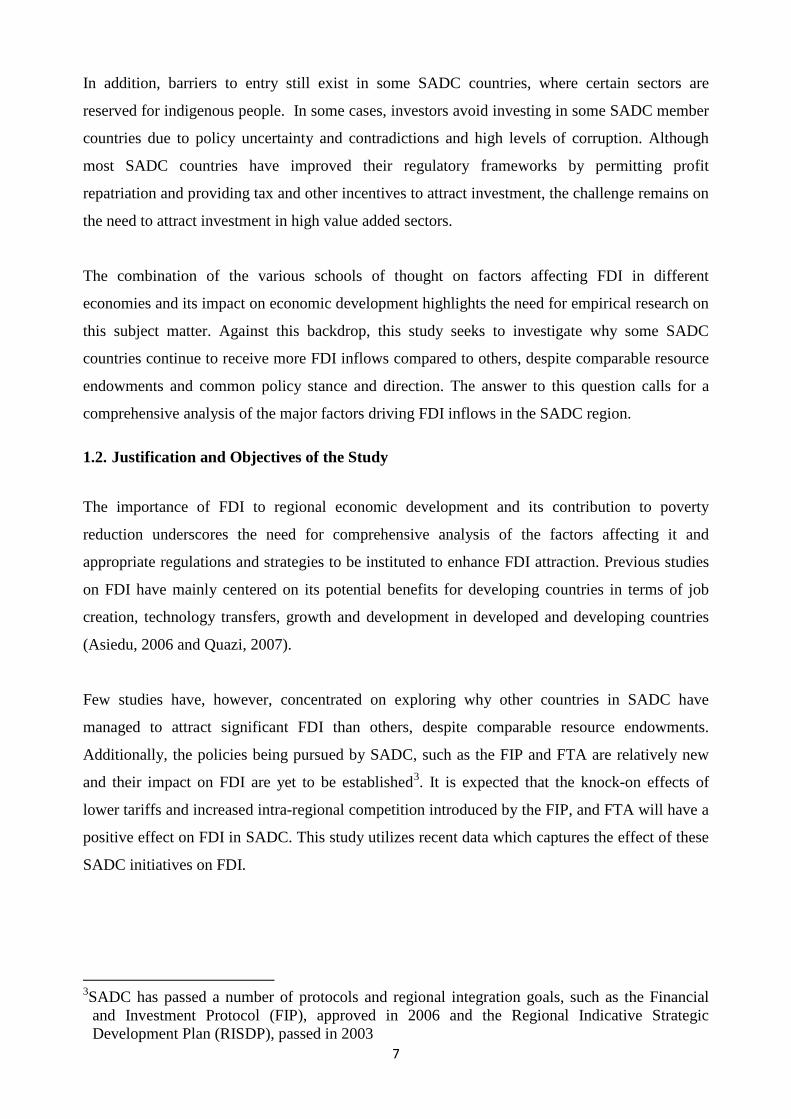
relatively high when compared to other regional blocs in Africa. Figure 1 below shows the trend
in the share of SADC FDI stock to total world FDI, compared to other regional economic blocs in
Africa.
10
Figure 1: Comparison of SADC Total FDI With Other Regional Groupings
0.0%
0.2%
0.4%
0.6%
0.8%
1.0%
1.2%
2000 2001 2002 2003 2004 2005 2006 2007 2008 2009 2010 2011 2012
Share of SADC FDI in Total Worl FDI
COMESA EAC ECOWAS SADC
Source: UNCTAD 2012
The trend indicates that SADC has increasingly become an attractive investment destination in
recent years. The trend slightly reversed in 2009, reflecting the effects of the global financial
crisis. SADC has, however, great potential of attracting increased FDI flows from emerging
economies, such as China, India and Brazil.
2.2. Trends in FDI Inflows in SADC
The SADC region’s performance with regard to attracting FDI5 was relatively poor throughout
the 1990s and early 2000s. During that time, most SADC countries had double-digit inflation
rates, which were not favourable to investors6. The low levels of FDI were also attributed to the
small size of domestic markets and other socio-economic issues, such as high levels of crime and
corruption. SADC, however, maintained an upward trend in FDI inflows from 2001 up to 2008,
before slowing down in 2009, mainly due to the effects of the global financial crisis.
FDI in most member states, notably, South Africa, Botswana, Angola, Democratic Republic of
Congo, Tanzania, Zambia, Namibia, Mozambique and Zimbabwe has mainly been resource
seeking as opposed to locational advantages and market seeking. An exception is Mauritius, 5SADC 2010, Finance and Investment Protocol Information brochure Report: 3.
6Muradzikwa, 2002 “Foreign direct investment in SADC”, Development Research Unit Working Paper 2
-
100.0
200.0
300.0
400.0
500.0
600.0
700.0
800.0
900.0
2000
2001
2002
2003
2004
2005
2006
2007
2008
2009
2010
2011
2012
FDI per Capita USD
COMESA ECOWAS
EAC SADC
11
which is not endowed with natural resources. The strength of Mauritius, however, lies in the
quality of its human resources. Mauritius has the highest adult literacy rate in Africa and is now
reaping the benefits of a strong commitment to free education for all initiated in the late 1970's.
Angola and South Africa topped the list of FDI destinations in SADC. South Africa's FDI is
dominated by mining and agricultural activities, whereas FDI in Angola is concentrated in the
petroleum extraction industry and mining. Recently Angola has embarked on divesifiaction in the
oil and non-oil sectors of the economy.
Angola has a wide range of mineral resources, which include diamond, iron, gold, phosphate,
manganese, copper, lead, zinc, uranium, titanium, beryllium, quartz, gypsum, marble and granite.
South Africa is one of the most sophisticated, diverse and promising emerging markets globally.
Strategically located at the tip of the African continent, South Africa is a key investment location,
both for the market opportunities that lie within its borders and for the opportunity that exists to
use the country as a gateway to the rest of the continent. The unique combination of a highly
developed first-world economic infrastructure and a huge emerging market economy has given
rise to a strong entrepreneurial and dynamic investment environment. South Africa is the
economic powerhouse of Africa and is a member of BRICS which also include Brazil, Russia,
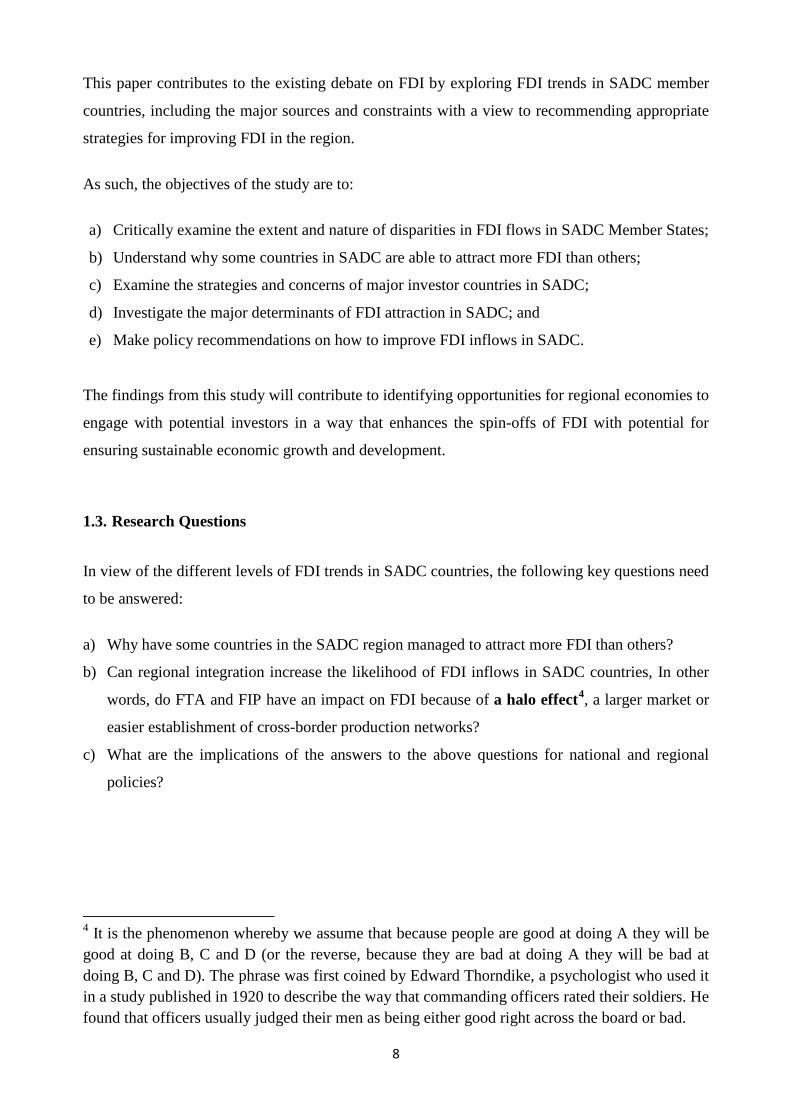
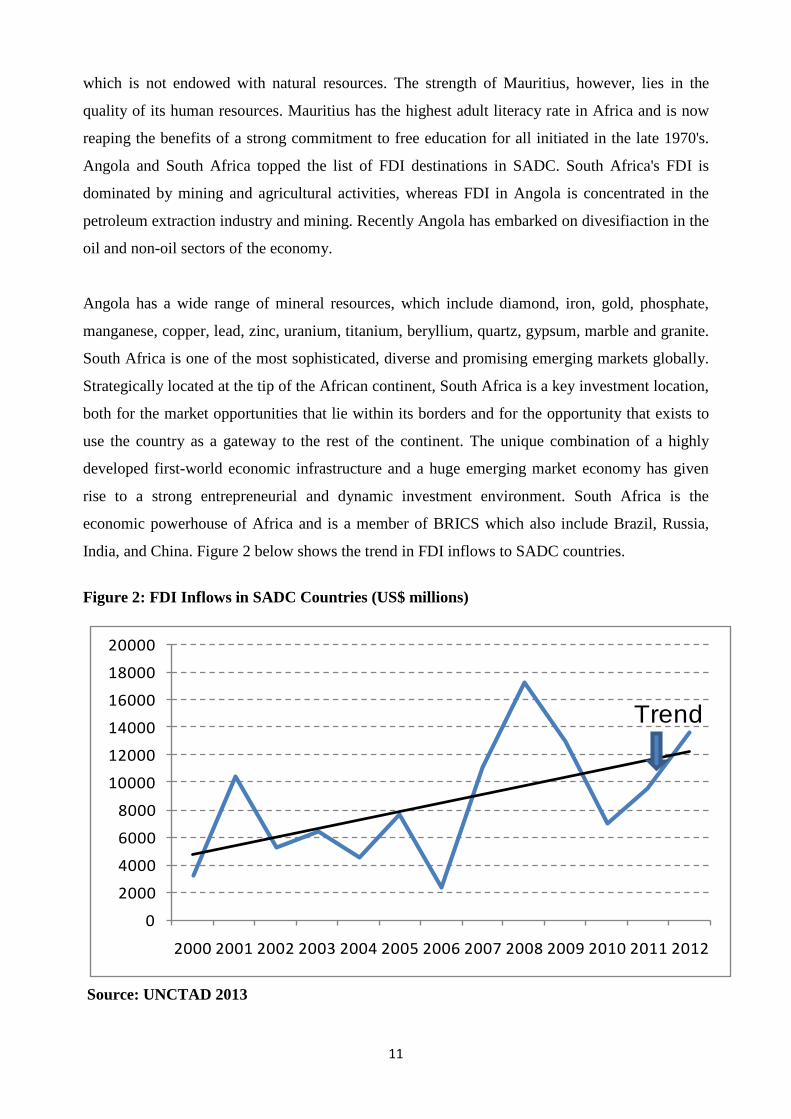
India, and China. Figure 2 below shows the trend in FDI inflows to SADC countries.
Figure 2: FDI Inflows in SADC Countries (US$ millions)
0
2000
4000
6000
8000
10000
12000
14000
16000
18000
20000
2000 2001 2002 2003 2004 2005 2006 2007 2008 2009 2010 2011 2012
Trend
Source: UNCTAD 2013
12
The trend depicts a general upward trend from the year 2000 onwards. The siginificant decline in
FDI flows to SADC in 2009 could also be attributed to a decision by Shell and BP to disinvest
from their downstream business activities, retailing, in particular and the effect of the global
financial crisis. The world investment report for 2011 notes that Shell announced plans to
withdraw from down-stream activities in 21 African countries, while on the other end BP
disinvested in five SADC countries.
A notable feature from the trend in FDI7 is that countries that made significant strides towards
privatisation of state-owned enterprises, such as Mozambique and Zambia, have been able to
attract substantial amounts of greenfield FDI that has provided the stimulus for growth in these
economies. In this respect, privatisation of state-owned enterprises could be seen as a catalyst for
FDI, which other SADC countries can carefully consider so as to improve the levels of FDI. In
Mozambique, FDI reached historical levels in 2011 amounting to more than US$2 billion and
investment was mainly in natural resource exploitation. The Mozambique government has been
implementing reforms on fiscal and financial sectors aimed at improving the business climate in
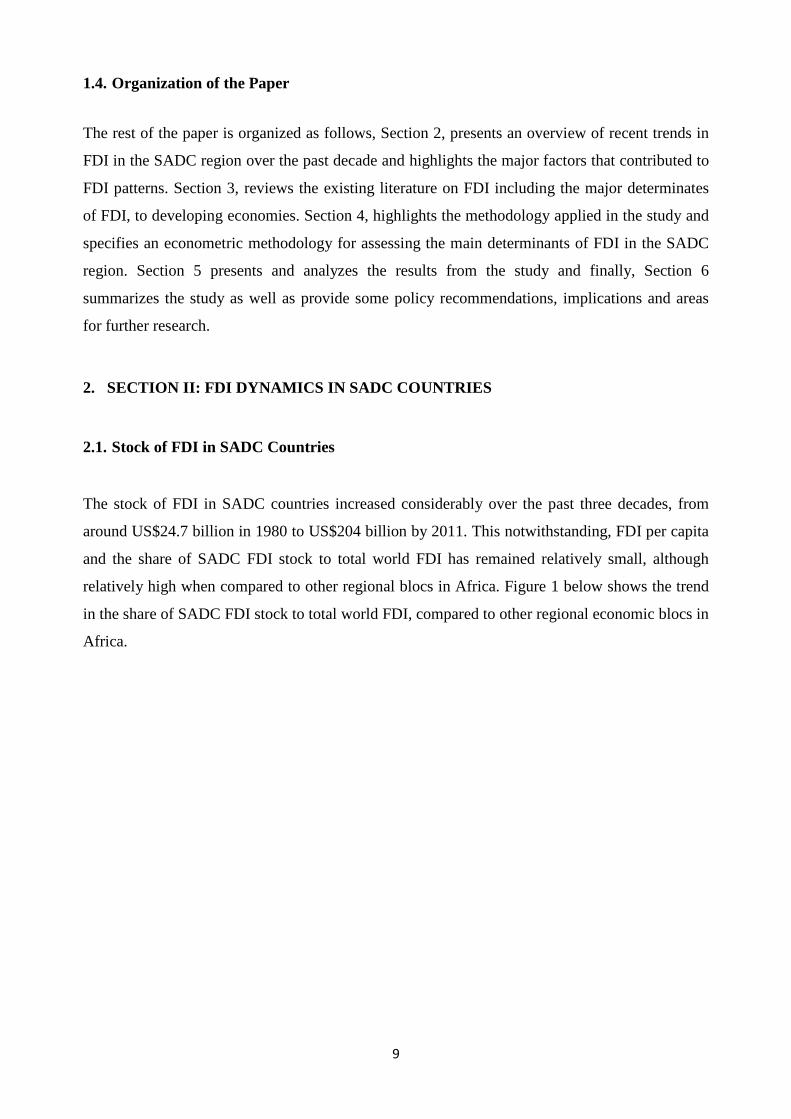
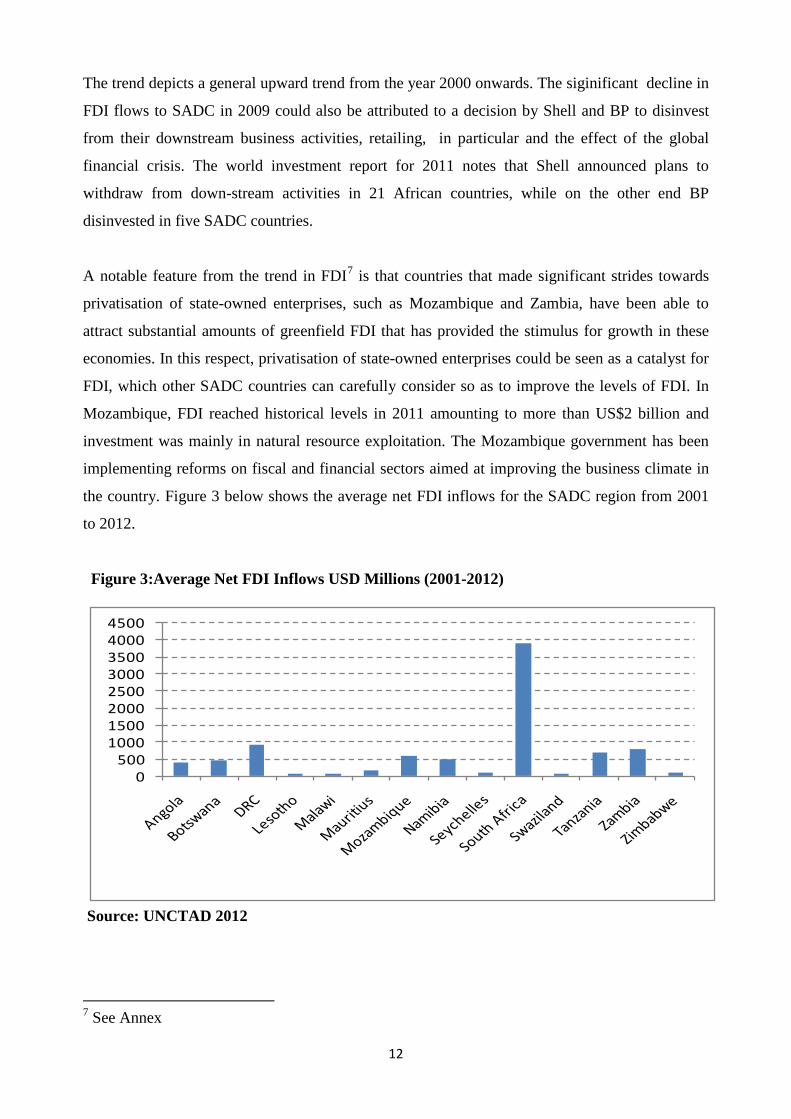
the country. Figure 3 below shows the average net FDI inflows for the SADC region from 2001
to 2012.
Figure 3:Average Net FDI Inflows USD Millions (2001-2012)
0500
10001500200025003000350040004500
Source: UNCTAD 2012
7 See Annex
13
2.3. Mode of Entry for FDI Inflows
FDI in the region has over the years been directed mainly to greenfield investments as opposed to
mergers and acquisitions. Between 2005 and 2012, a total of 1 921 greenfied investments were
approved in the 14 member countries excluding, Madagascar, with a total value of US$184.4
billion. This can be compared to investments through mergers and acquisitions, where a total of
443 projects with a value of US$31.9 billion were approved during the comparable period. This
indicates that the region has a lot of untapped business ventures, where FDI can be directed.
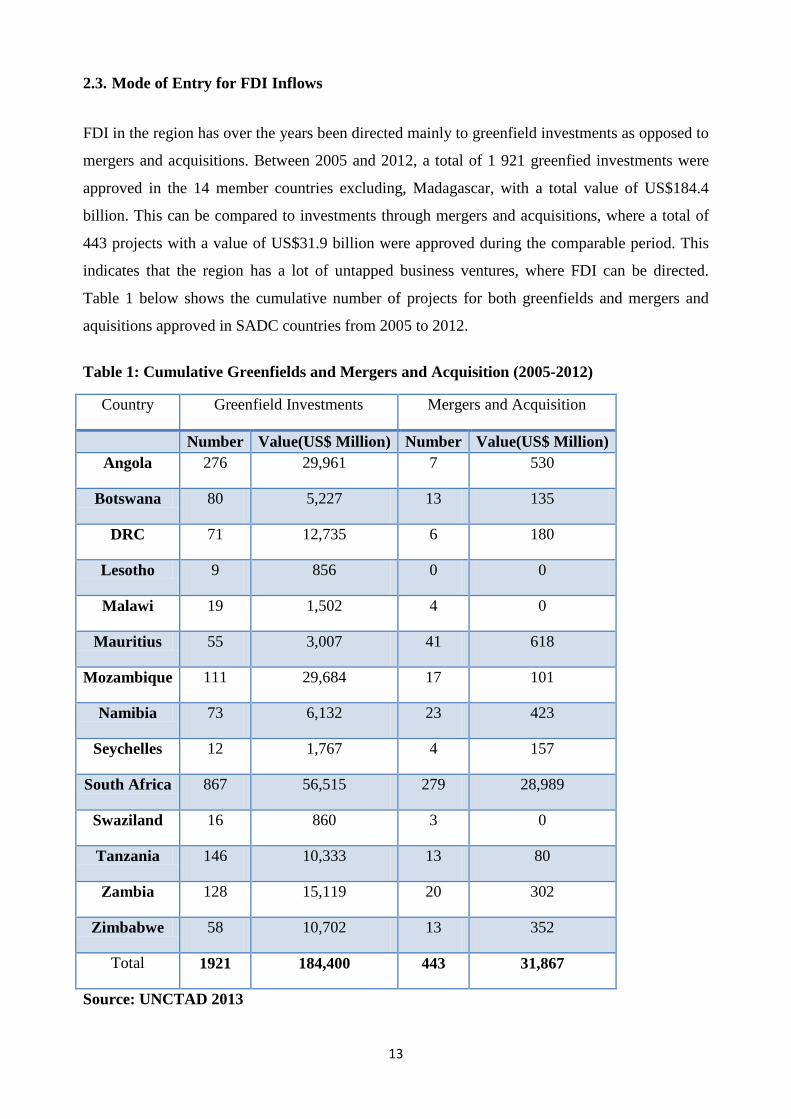
Table 1 below shows the cumulative number of projects for both greenfields and mergers and
aquisitions approved in SADC countries from 2005 to 2012.
Table 1: Cumulative Greenfields and Mergers and Acquisition (2005-2012)
Country Greenfield Investments Mergers and Acquisition
Number Value(US$ Million) Number Value(US$ Million) Angola 276 29,961 7 530
Botswana 80 5,227 13 135
DRC 71 12,735 6 180
Lesotho 9 856 0 0
Malawi 19 1,502 4 0
Mauritius 55 3,007 41 618
Mozambique 111 29,684 17 101
Namibia 73 6,132 23 423
Seychelles 12 1,767 4 157
South Africa 867 56,515 279 28,989
Swaziland 16 860 3 0
Tanzania 146 10,333 13 80
Zambia 128 15,119 20 302
Zimbabwe 58 10,702 13 352
Total 1921 184,400 443 31,867
Source: UNCTAD 2013
14
2.4. FDI Source Countries in SADC SADC has witnessed a dramatic change in FDI source countries over the years, with implications
on growth and employment creation. Historically, the major FDI source countries in the region
were the United States of America (USA), United Kingdom, and France. China has, however,
emerged as a major source of FDI in the SADC region in the new millennium8. According to the
Chinese Ministry of Commerce (MOFCOM), China was the fifth largest FDI source country in
the world with US$56.5 billion of global FDI inflows in 2009. This brought Chinese FDI total
stock to US$245.8 billion, invested mainly in the finance, mining and retail sectors.
In the SADC region, FDI inflows from China are mainly invested in the mining, agriculture,
telecommunications and manufacturing sectors. China has been expanding investments into
Southern Africa at a time when other traditional sources of FDI are holding back, citing the
impact of the global financial crisis. In Zimbabwe, the Chinese are also exploring investments in
the electricity, mining and manufacturing sectors. South Africa is also a dominant source of FDI
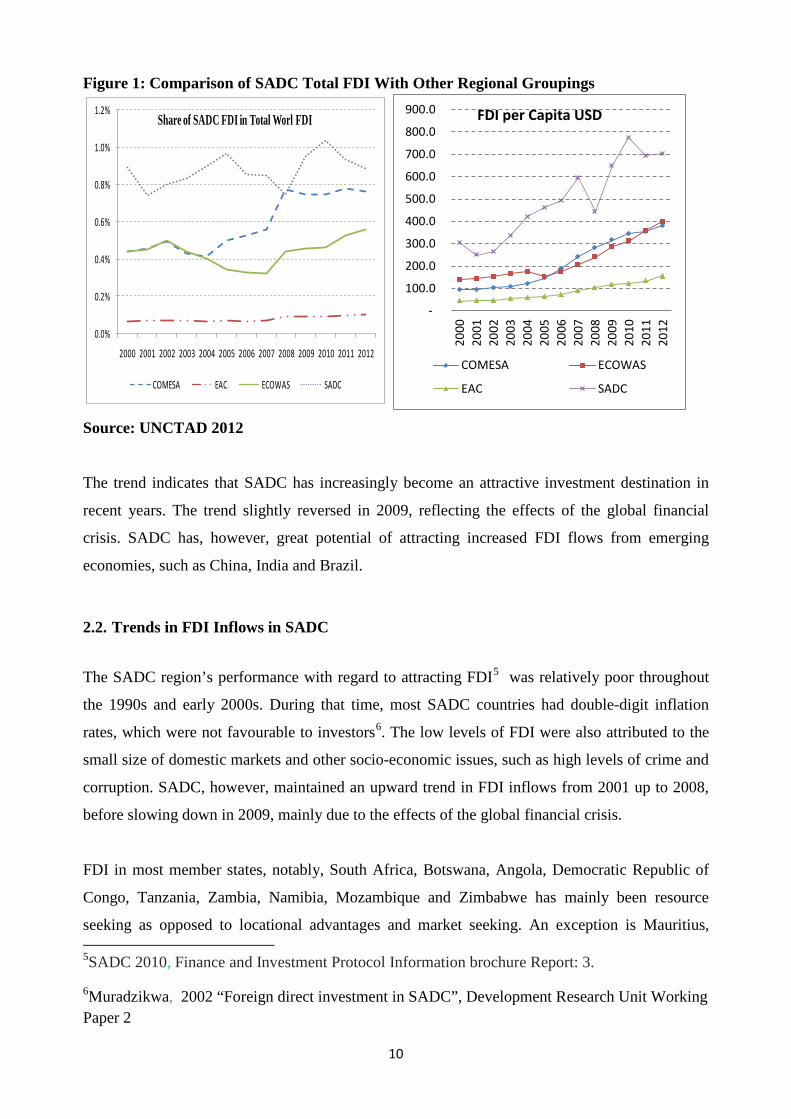
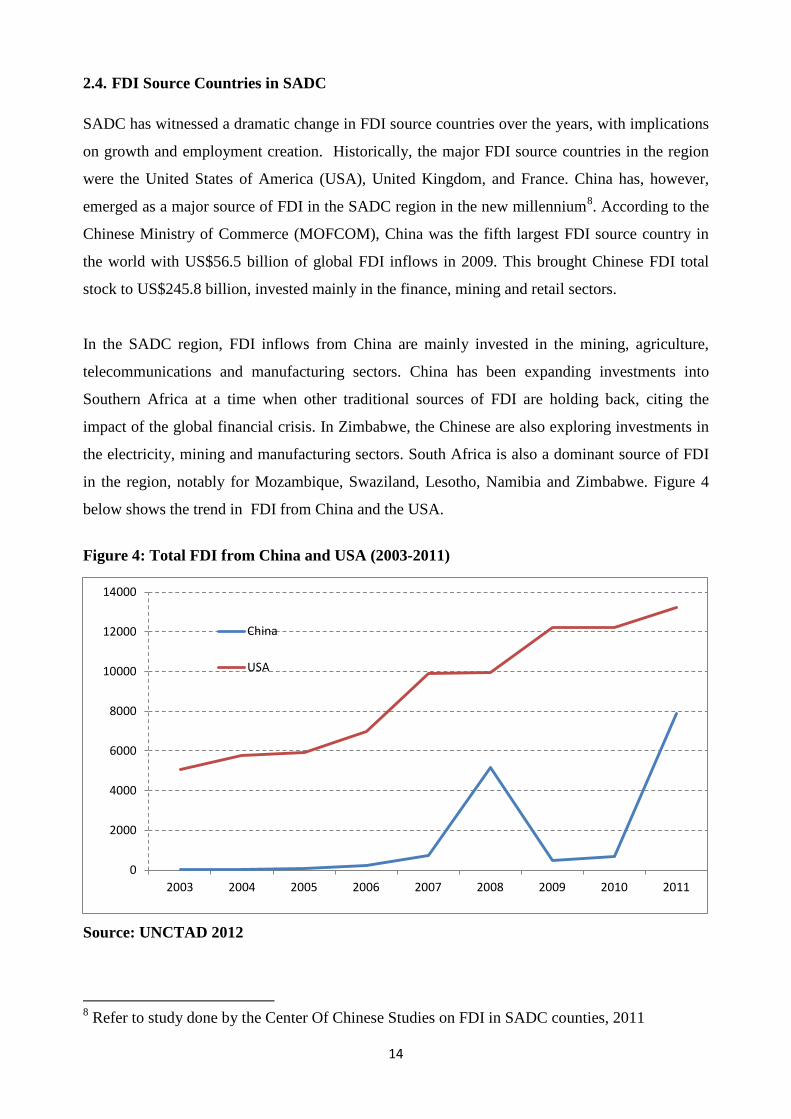
in the region, notably for Mozambique, Swaziland, Lesotho, Namibia and Zimbabwe. Figure 4
below shows the trend in FDI from China and the USA.
Figure 4: Total FDI from China and USA (2003-2011)
Source: UNCTAD 2012
8 Refer to study done by the Center Of Chinese Studies on FDI in SADC counties, 2011
0
2000
4000
6000
8000
10000
12000
14000
2003 2004 2005 2006 2007 2008 2009 2010 2011
China
USA
15
Since 1999, the Chinese government has been encouraging Chinese enterprises to invest abroad,
following its so-called Go Out or Going Global strategy. The Chinese 11th Five-Year Plan
period (2006-2010) saw the implementation of the going out strategy in its entirety. China
deliberately mixes assistance and trade preferences with investment policies in its South-South
cooperation. Critics point to the fact that most of Chinese FDI is invested in resource-rich
countries, a term which is mostly used to refer to countries with large oil and mineral reserves
such as gold, diamonds and copper.
2.5. Factors Underlying FDI Trends
The last decade has seen a rise in interest from businesses, organisations and governments
undertaking systematic political risk analysis when embarking on foreign projects in developing
economies. This risk analysis has seen a number of countries entering into various international
investment and bilateral investment agreements in order to safeguard their investments.
Consistent with this development, regional countries have entered into a number of various
investment agreements as shown in the table below.
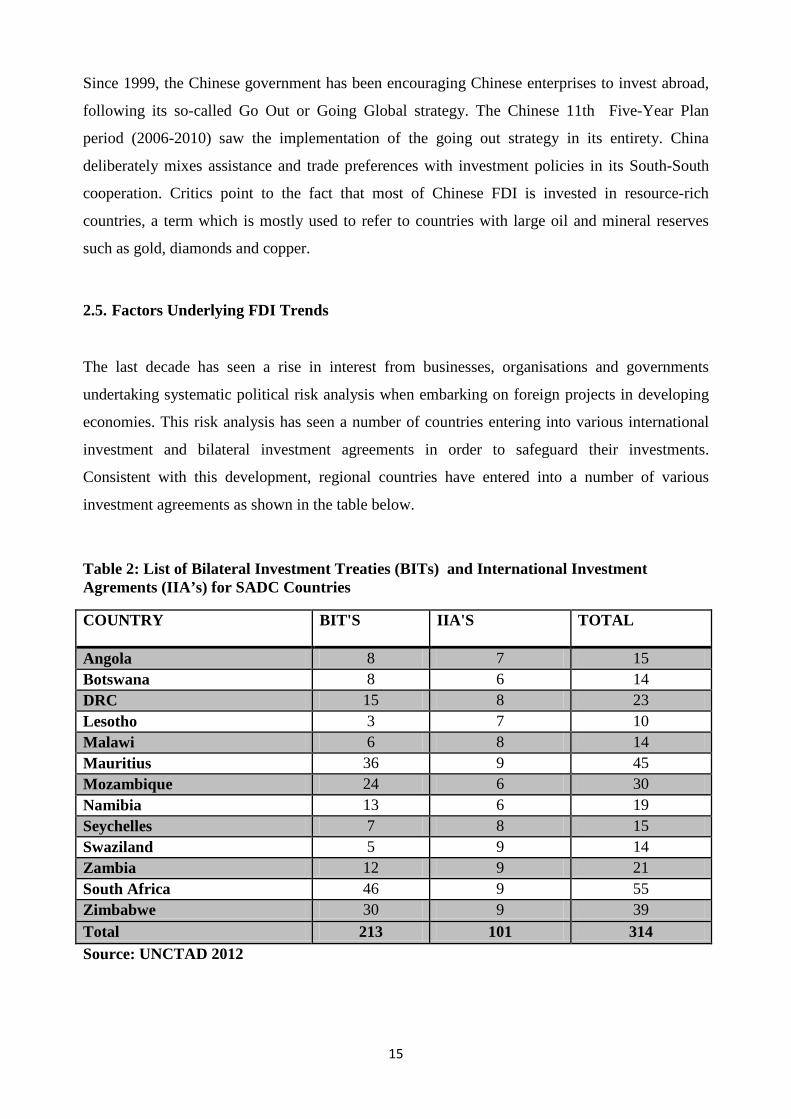
Table 2: List of Bilateral Investment Treaties (BITs) and International Investment Agrements (IIA’s) for SADC Countries
COUNTRY BIT'S IIA'S TOTAL
Angola 8 7 15 Botswana 8 6 14 DRC 15 8 23 Lesotho 3 7 10 Malawi 6 8 14 Mauritius 36 9 45 Mozambique 24 6 30 Namibia 13 6 19 Seychelles 7 8 15 Swaziland 5 9 14 Zambia 12 9 21 South Africa 46 9 55 Zimbabwe 30 9 39 Total 213 101 314 Source: UNCTAD 2012
16
The signing of bilateral investment treaties to protect foreign investments against political risks
has complemented the liberalization of FDI regimes. By December 2011, SADC countries had
signed 314 such treaties as shown in the table 2 above.
Besides political risks, there are other reasons why SADC does not appear to be a very attractive
destination for FDI. The amount of FDI inflows to the region also continues to be hampered by
poor infrastructure which hinders business growth and efficiency. A further limitation is the
perception by prospective foreign investors on the degree and level of corruption, law
enforcement on contracts and government ineffectiveness. Previous researches9 identified the
following as major foreign investor concerns in developing economies:
i. Macroeconomic instability;
ii. High levels of corruption;
iii. High cost of doing business;
iv. Foreign investment restrictions;
v. High degree of barriers to trade; and
vi. Ineffective governments and investment promotion strategies .
According to Schneider and Frey (1985), political instability and the frequent occurrences of
disorder create an unfavorable business climate which seriously erodes the risk-averse foreign
investors' confidence in the local investment climate and thereby repels FDI away. An analysis of
political stability and FDI in SADC member countries shows that those countries that have
exhibited stable macroeconomic and political stability have also achieved higher FDI growth. For
instance, Zambia’s attractive investment climate is underpinned by socio economic stability,
where the country is now dubbed as a beacon of peace in Africa, coupled with relative good
security and low crime levels. This is supported by immense investment opportunities in most
sectors with government’s pro-private sector investment in roads, electricity and other
infrastructure.
For instance, the Zambian government has been progressive in ensuring good governance and
fighting corruption. These efforts greatly contributed to Zambia being rated “B+” in the sovereign
credit rating by Standard & Poors, and Fitch in 2011. Further, over years of committed business
9 See Ang (2008), Onyeiwu and Shrestha (2004), and Asiedu (2002).
17
reforms, evidence of a favourable and improving investment climate has been observed with the
country’s World Bank Doing Business ranking improving.
The Zambian government has been aggressive in addressing the issue of reducing the cost of
doing business by improving infrastructure such as roads, telecommunications, energy and water.
Through the central bank, the Zambian government has also created a favorable macroeconomic
environment that has led to a downward trend in the cost of borrowing to improve access to long
term finance at lower interest rates.
Mauritius is another good example. It is one of the most open and financially sound economies
in sub-Saharan Africa. The success of the Mauritian economy is largely a result of its political
and socio-economic stability, coupled with good governance and its pro-investment policies.
Foreign investors judge that Mauritius, which is set against a beautiful tropical environment, is a
safe and attractive place to live in as well as a buoyant place to do business. Crime prevalence is
very low.
2.6. Cost of doing business in SADC Countries
Most SADC countries are rated lowly particularly with regards to starting business and other
institutional assessments. In terms of doing business and the UNCTAD’s inward performance10
ranking, SADC member countries still lag behind most developing economies.
10The FDI performance index captures a country’s relative success in attracting global FDI. If a country’s share of global inward FDI matches its relative share in global GDP, the country’s Inward FDI Performance Index is equal to one. A value greater than one indicates a larger share of FDI relative to GDP; a value less than one indicates a smaller share of FDI relative to GDP. A negative value means foreign investors disinvested in that period. The index is calculated using three-year averages to offset annual fluctuations in the data.
18
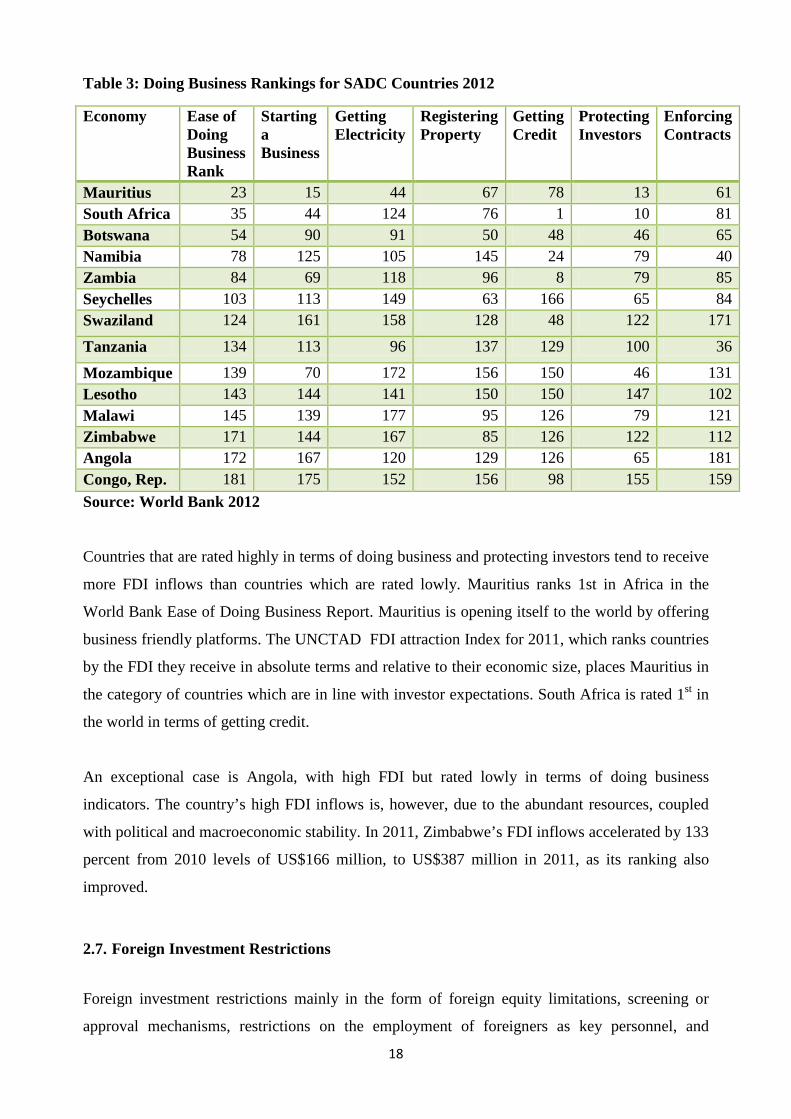
Table 3: Doing Business Rankings for SADC Countries 2012
Economy Ease of Doing Business Rank
Starting a Business
Getting Electricity
Registering Property
Getting Credit
Protecting Investors
Enforcing Contracts
Mauritius 23 15 44 67 78 13 61 South Africa 35 44 124 76 1 10 81 Botswana 54 90 91 50 48 46 65 Namibia 78 125 105 145 24 79 40 Zambia 84 69 118 96 8 79 85 Seychelles 103 113 149 63 166 65 84 Swaziland 124 161 158 128 48 122 171
Tanzania 134 113 96 137 129 100 36
Mozambique 139 70 172 156 150 46 131 Lesotho 143 144 141 150 150 147 102 Malawi 145 139 177 95 126 79 121 Zimbabwe 171 144 167 85 126 122 112 Angola 172 167 120 129 126 65 181 Congo, Rep. 181 175 152 156 98 155 159 Source: World Bank 2012
Countries that are rated highly in terms of doing business and protecting investors tend to receive
more FDI inflows than countries which are rated lowly. Mauritius ranks 1st in Africa in the
World Bank Ease of Doing Business Report. Mauritius is opening itself to the world by offering
business friendly platforms. The UNCTAD FDI attraction Index for 2011, which ranks countries
by the FDI they receive in absolute terms and relative to their economic size, places Mauritius in
the category of countries which are in line with investor expectations. South Africa is rated 1st in
the world in terms of getting credit.
An exceptional case is Angola, with high FDI but rated lowly in terms of doing business
indicators. The country’s high FDI inflows is, however, due to the abundant resources, coupled
with political and macroeconomic stability. In 2011, Zimbabwe’s FDI inflows accelerated by 133
percent from 2010 levels of US$166 million, to US$387 million in 2011, as its ranking also
improved.
2.7. Foreign Investment Restrictions
Foreign investment restrictions mainly in the form of foreign equity limitations, screening or
approval mechanisms, restrictions on the employment of foreigners as key personnel, and
19
operational restrictions prevalent in some member states have also been cited by researchers as
deterring potential FDI. In some countries, certain sectors are reserved for locals and this may
have some adverse implications on FDI.
Mozambique restricts foreign ownership in the fixed-line telecommunication subsector but allows
100 percent foreign ownership in mobile subsector. Only Zambia permits 100 percent foreign
ownership in the media sector. Mauritius and Zambia permit 100 percent foreign ownership in
telecommunications, while Tanzania has a restriction of 66 percent in insurance. Zimbabwe’s
Indigenization and Empowerment Act restricts foreign ownership to 49 percent in all sectors. The
indigenization and empowerment regulations in Zimbabwe have been cited by many analysts as a
major deterrent to FDI attraction.
The Black Economic Empowerment (BEE) in South Africa and Namibia provides for preferential
procurement to indigenous people. Lesotho restricts ownership of small-scale retail and services
businesses to local enteprenures. No foreign ownership, or even board directorship, by a non-
citizen is permitted at any level in these restricted businesses in Lesotho. There are, however, no
restrictions on foreign ownership in Angola and Malawi in all sectors of the economy.
Perennial policy uncertainties in some SADC member countries also affect investor decisions and
influence the level of investment and confidence of investors. The high degree of uncertainty
explains the huge capital outflows in the form of profit repatriation in some member countries.
The significant capital outflows in some member countries obscure them from realizing the full
potential benefits from FDI as significant financial resources are not deployed in the local
economy to boost other productive sectors.
2.8. Infrastructure Deficit
Infrastructural deficits have been cited by many researchers as causing a significant drawback to
attraction of FDI in the region. With the exception of South Africa, other countries still lag
behind on various dimensions of infrastructure development. Although SADC’s infrastructure
ranks consistently above the other Sub-Saharan African regions on all aggregate infrastructure
indicators, investors still advocate for more improvements.
Infrastructure development in SADC has been constrained by declining levels of public
investment on infrastructural projects, soaring debt burdens, sluggish economic growth, and
increased pressure on governments to reduce expenditure. Many governments find it easier, and
20
politically expedient to reduce on capital expenditure, including infrastructure, where they will
suffer less of a political backlash than if they were to reduce spending on the public service wage
bill.
Major improvements are required in areas such as access to improved sources of water and
sanitation, as well as electricity, where the differences between SADC and the Economic
Community of West African States (ECOWAS), the next-best performer in terms of aggregate
performance, are not significant. In terms of paved road density, fixed line telephone and internet
density, SADC performs significantly better than all the other regions. The table below shows the
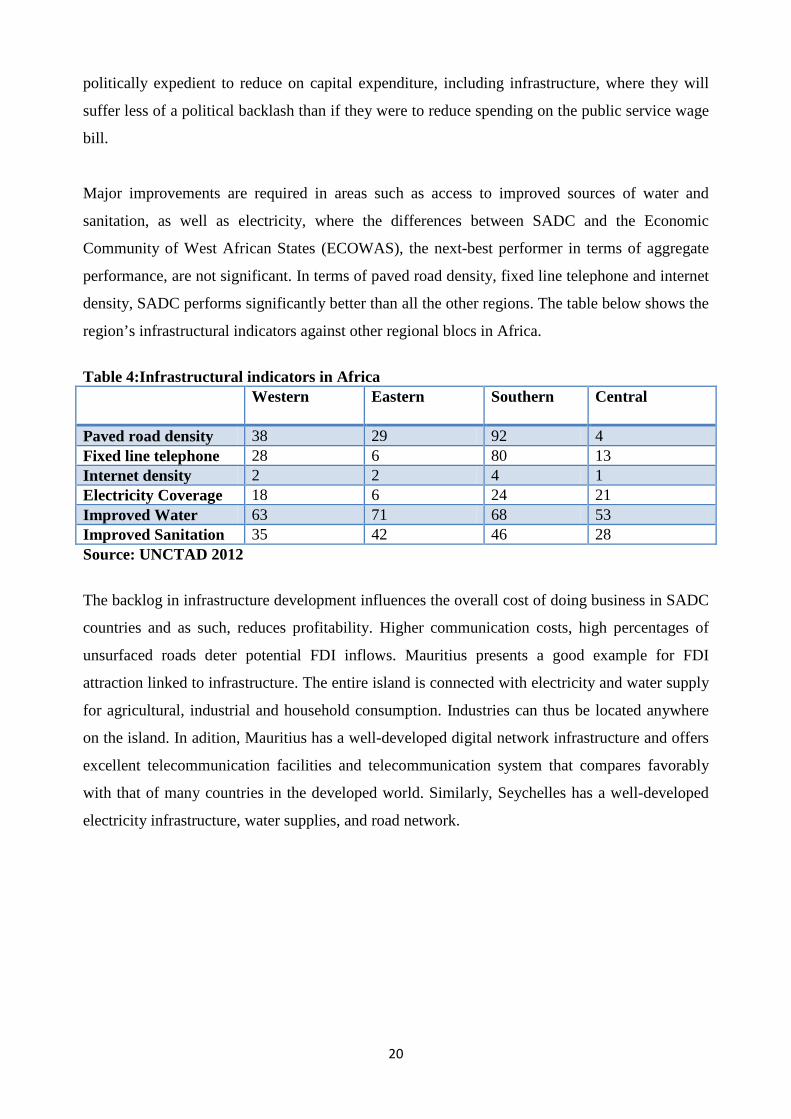
region’s infrastructural indicators against other regional blocs in Africa.
Table 4:Infrastructural indicators in Africa Western Eastern Southern Central
Paved road density 38 29 92 4 Fixed line telephone 28 6 80 13 Internet density 2 2 4 1 Electricity Coverage 18 6 24 21 Improved Water 63 71 68 53 Improved Sanitation 35 42 46 28 Source: UNCTAD 2012
The backlog in infrastructure development influences the overall cost of doing business in SADC
countries and as such, reduces profitability. Higher communication costs, high percentages of
unsurfaced roads deter potential FDI inflows. Mauritius presents a good example for FDI
attraction linked to infrastructure. The entire island is connected with electricity and water supply
for agricultural, industrial and household consumption. Industries can thus be located anywhere
on the island. In adition, Mauritius has a well-developed digital network infrastructure and offers
excellent telecommunication facilities and telecommunication system that compares favorably
with that of many countries in the developed world. Similarly, Seychelles has a well-developed
electricity infrastructure, water supplies, and road network.
21
3. SECTION III: REVIEW OF THEORETICAL AND EMPIRICAL LITERATURE
3.1. Conceptual Framework of Foreign Direct Investment According to the OECD11, foreign direct investment reflects the objective of obtaining a lasting
interest by a resident entity in one economy in an entity resident in an economy, other than that of
the investor. The lasting interest implies the existence of a long-term relationship between the
direct investor and the enterprise and a significant degree of influence on the management of the
enterprise. Accordingly, direct investment involves both the initial transaction between the two
entities and all subsequent capital transactions between them and among affiliated enterprises,
both incorporated and unincorporated.
3.2. Theoretical Framework for FDI The theoretical framework for FDI is mainly attributed to the eclectic approach by Dunning
(1981, 1988). The eclectic framework postulates that firms invest abroad in pusuit of Ownership
(O), Location (L) and Internalisation (I) advantages. This is usually referred to as the OLI
framework.
The owner-specific advantage of property rights/patents, expertise and other tangible assets allow
a firm to compete with others in the market it serves regardless of the disadvantage of being
foreign because it is able to have access to exploit and export natural resources and resource
based products that are available to it.
The location advantages are those that make the chosen foreign country a more attractive site
such as the country’s natural endowments, government regulation, labour, transport costs,
macroeconomic stability, trade barriers, gains in trade costs, and cultural factors, among other
things.
The internalisation advantage arises from exploiting imperfections in external markets, including
reduction in uncertainty and transaction costs in order to generate knowledge more efficiently as
well as reduction of state generated imperfections such as tariffs, foreign exchange controls and
subsidies.
11Refer to OCED Benchmark Definition For Foreign Direct Investment Guideline, 1996
22
When the O, L, and I advantages outweigh the costs and risks of producing abroad, FDI arises.
The eclectic, or OLI paradigm, suggests that the greater the O and I advantages possessed by
firms and the more the L advantages of creating, acquiring (or augmenting) and exploiting these
advantages from a location outside its home country, the more FDI will be undertaken. Where
firms possess substantial O and I advantages but the L advantages favour the home country, then
domestic investment will be preferred to FDI and foreign markets will be supplied by exports.
From the eclectic theory, the main motives for FDI according to Danning (1993) are thus:
• Resource seeking (to access raw materials, labour force, and physical infrastructure resources,
• Market seeking (horizontal strategy to access the country’s markets);
• Efficiency seeking (vertical strategy to take advantage of lower labour costs, especially in
developing countries); and
• Strategic-asset seeking (to access research and development, innovation, and advanced
technology.
Although the OLI paradigm does explain the existence of foreign investors, its main problem is
that it has difficulty explaining the recent trends in FDI such as the surge and concentration of
FDI among similar countries. Furthermore, no sound empirical models have been generated in
order to compare real data with the theory.
3.3. Empirical Review of Literature FDI has received more and more interest from economists and policymakers, owing to its
growing economic importance for both developed and developing countries. According to the
2010 World Investment Report, FDI inward flows accounted for 9.1 percent of Gross Fixed
Capital Formation in 200912, revealing the importance that these flows can have for economic
growth. A recent study by the Centre for Chinese Studies13 has noted that SADC member
countries can learn from one another for the benefit of making the region more attractive to FDI.
The SADC Secretariat can draw lessons from the increasing FDI inflows in some member states
and use this knowledge, to suggest adaptations to other member countries in order to make them
more attractive to FDI. The study recommended that Mauritius be used as a good example of
maximizing FDI potential.
12 See UNCTAD Investment Report 2010 13 Refer to the Study By Centre For Chinese Studies On Assessing China’s Role In Foreign
Direct Investment In Southern Africa 2011
23
Lederman et al (2010) used international data and a micro-data set of firms in thirteen (SADC
countries to investigate the benefits and determinants of FDI in the region and found that income
level, human capital, demographic structure, institutions, and economic track record affect FDI
inflows per capita. They also found some diferences between SADC and the rest of the world in
FDI behavior, namely, that in SADC, the income level and openness are less important in
explaining FDI behaviour. However, relative to other regions of the world, they found that
SADC's low FDI infows are explained by economic fundamentals such as previous growth rates,
average income, phone density, and the adult share of population.
Mauro (2000) used the gravity-model approach to analyze the impact of regional integration on
FDI. The variables considered include tariffs, non-tariff barriers and exchange rate variability. In
his gravity model the sample of home countries examined include France, Germany, Italy, UK,
Japan, South Korea, US and Canada, while a set of host countries for FDI is constituted by both
OECD and non-OECD members. The paper considered three years: 1988, 1993 and 1996. The
results show that FDI does not respond to changes in tariffs, which in turn suggests that the tariff-
jumping argument is not supported empirically. In other words, an increase in the tariff level has
no siginificant impact on FDI.
Mauro (2000) also finds that non-tariff barriers negatively affect FDI which could be explained
via the argument of market-accessibility and the existence of sunk costs. When foreign firms
invest in a host country, they incur sunk costs in setting up the affiliates and if they then cannot
access a larger market, not because of tariffs, but because of non tariff barriers, their losses can be
even greater than for the exporters. The major problem with this study is that it concentrates on
trade openness (tariff and non tariff barriers) only leaving out other important FDI determinants
such as market size, size of the labour force and political stability found to be significant by other
studies like Asiedu (2006), Obwona (2001), Walsh and Yu (2010).
Campos and Kinoshida (2003) examined the importance of agglomeration economies and
institutions vis-à-vis initial conditions and factor endowments in explaining the locational choice
of foreign investors. The study used panel data for 25 transition economies14 between 1990 and
12 The economies covered in the data are Bulgaria, Czech Republic, Estonia, Hungary, Latvia,
Lithuania, Poland, Romania, Slovak Republic, Slovenia, Ukraine, Armenia, Azerbaijan, Belarus, Georgia, Kazakhstan, Kyrgyz Republic, Moldova, the Russian Federation, Tajikistan, Turkmenistan, Ukraine, and Uzbekistan
24
1998. In order to test for agglomeration effects, the study relates current FDI stock to past FDI
stock and other explanatory variables and employed the generalized method of moments (GMM).
The study also examined the impact of macroeconomic variables: market size using GDP as a
proxy, trade openness and inflation. The study finds that the main determinants of FDI are
institutions, agglomeration, and trade openness.
Chiguvu (2009) analyzed the determinants of inward FDI in the SADC region for the period 1995
to 2007 using a panel data approach. The determinants of FDI in the SADC region considered in
his study are trade openness, inflation, government size, external debt, market size and growth,
labour availability, infrastructure quality, financial depth and corruption. Chiguvu (2009) like
Obwona (2000) used nominal total population as a proxy for labour availability in a country. His
main findings suggest that more open economies attract FDI. He also finds that major pull factors
of FDI are bigger markets, low inflation, lower external debt, and quality infrastructure. These
results confirm findings of other studies, Asiedu (2006), Campos and Kinoshida (2003), among
others.
Walsh and Yu (2010) find that primary sector FDI has no strong linkages to either
macroeconomic stability, level of development, or institutional quality, while clustering effects
appear important, with larger FDI stocks attracting greater additional inflows. This is intuitive, as
FDI decisions in, for example, mining or petroleum are primarily determined by the location of
those resources, with both equipment and labor easily transferable across borders. Secondary and
tertiary FDI benefits from agglomeration or clustering effects while FDI in services appears to be
more strongly impacted by macroeconomic conditions than FDI in manufacturing.
Futhermore, Walsh and Yu (2010) contend that a weaker real effective exchange rate draws more
manufacturing FDI into an economy, while it reduces the amount of tertiary FDI. Tertiary FDI
flows are also higher in more rapidly growing economies, than those which are more open. More
flexible labor markets and deeper financial markets attract more secondary FDI, while better
infrastructure and a more independent judiciary attract more tertiary FDI. Educational attainment
was found to have little relationship to either type of FDI.
25
Asiedu (2006) used a panel data for 22 countries15 in Sub-Saharan Africa over the period 1984-
2000 to examine the impact of political risk, institutional framework and government policy on
FDI flows. Measures of institutional quality considered in his study are corruption and the extent
to which the rule of law is enforced. Political risk factors considered in the study are coups,
assassinations, revolutions and riots. Coups are the number of forced changes in the top
government, while assassinations include any politically motivated murder or attempted murder
of a senior government official. Revolutions include any illegal or forced change in the ruling
government, and riots are the number of violent demonstrations or clashes of more than 100
citizens involving the use of force.
Asiedu’s study reveals that an efficient legal system, a good investment regulatory framework, an
educated labor force, natural resource endowments, good infrastructure, and large markets
promote FDI, whereas, high inflation, corruption and political instability deter FDI. An
important implication of his results was that FDI to Africa is not solely driven by natural resource
endowment, and that governments can play an important role in promoting investments to the
region.
4. SECTION IV: EMPIRICAL ANALYSIS
Based on the theoretical framework of FDI and the structure of SADC economies, we used a
cross-country panel regression for the period 1996-2011 to establish the hypothesized
relationship between FDI inflows and the relevant independent variables. The period was chosen
to coincide with data on institutional variables which are only available after the 1996 period. The
model specification derives from the common factors that influence FDI in the region. The panel
specification is as follows:
𝐹𝐷𝐼𝑡,𝑖 = 𝛼 + 𝛽4ln�𝑃𝐺𝐷𝑃𝑖,𝑡−1� + 𝛽11 ln�𝑈𝑅𝐵𝑖,𝑡−1� + 𝛽1 ln(𝐶𝑃𝑆𝑖,𝑡−1) + 𝛽2ln�𝐶𝑃𝐼𝑖,𝑡−1�+ 𝛽6 ln�𝑂𝑃𝐸𝑁𝑖,𝑡−1� + 𝛽7 ln�𝐼𝑁𝐹𝑅𝐴𝑖,𝑡−1� + 𝛽9ln�𝑃𝑆𝑖,𝑡−1� + 𝛽10ln�𝑅𝑂𝐿𝑖,𝑡−1�+ 𝛽3ln(𝐺𝑂𝐸𝐹𝑖,𝑡−1) + 𝛽5ln (𝐹𝐷𝐼𝑖,𝑡−1) + 𝜀𝑖,𝑡
(t = 1996, 1997 ... 2011; i = 1, 2... 14) 15 Countries in the sample are Cameroon, Congo Rep., Cote d’Ivoire, Ethiopia, Gabon, Gambia,
Ghana, Kenya, Madagascar, Malawi, Mali, Mozambique, Niger, Nigeria, Senegal, South Africa, Sudan, Tanzania, Togo, Uganda, Zambia and Zimbabwe
26
where subscript i represents each of the 14 SADC member countries to be used in the study t
refers to years from 1996 to 2011, 𝛼 is the intercept and 𝜀𝑖,𝑡 is the error term.
The regression equation is expressed as a log-linear in order to capture the elasticity of FDI
inflows with respect to each of the explanatory variables. Further, the variables were lagged to
facilitate the interpretation of model results as the reaction of FDI to changes in either of the
independent variables.
4.1. Model Variables We used the FDI inflow as a percentage of GDP as the dependant variable (FDI), a widely used
measure16. The FDI inflow variable is desirable to the FDI stock variable as it specifically capture
the changes in economic fundamentals and policy pronouncements. The independent variables
include measures of market size, financial depth, macroeconomic environment, governance and
institutional factors. Market size is a measure of the host country’s domestic market and is
proxied by the log of per-capita income to GDP (PGDP) and urban porpoluation share (URB).
A large market size implies greater demand for goods and services and offers economies of scale
for the investor. Financial depth is measured as the size of a country’s monetary system and is
proxied by the ratio of credit to private sector to GDP (CPS). Macroeconomic factors are proxied
by the country’s inflation rate (CPI). Infation is used as an indicator of macroeconomic instability
(Buckley et al., 2007). A stable macroeconomic environment promotes FDI by showing less
investment risk. The institutional and governance factors considered in the model include trade
openness (OPEN), infrastructure (INFRA), political instability (PS), rule of law (ROL) and
government effectiveness (GOEF).
The model also included the lagged FDI variable to test for agglomeration effects. Agglomeration
may exist under the assumption that foreign investors may be attracted to countries with more
existing foreign investment. In this case, foreign investors may view the investment decisions by
others as a good signal of favorable conditions and invest there too, so as to reduce uncertainty.
4.2. Role of Institutional Factors The commonly used institutional factors that influence FDI in an economy are trade openness and
infrastructural development. Trade openness portrays the ease with which investors can freely 16See studies by Adeisu, 2002 and Quarzi, 2005.
27
move capital in and out of an economy and is measured as a percentage of the sum of exports and
imports to GDP. The impact of openness on FDI can have a positive sign if FDI is export-
oriented and a negative one if FDI is tariff jumping. With regards to infrastructural development,
there are varying theoretical and empirical views on its impact on FDI. Ang (2008), Asiedu
(2006), and Onyeiwu and Shrestha (2004) find that the relationship between the level of
infrastructure development and FDI flows is significantly positive. However, Marr (1997) argues
that the prevalence of poor infrastructure in the areas of road, rail system, electricity and
telecommunication, can create an incentive for the flow of foreign investments.
In this paper, we used the number of telephone and mobile phone subscribers per 1000 people as
a proxy for infrastructure (INF) provision. This measure is consistent with proxy used by
UNCTAD, among other factors, to compile the inward FDI potential index. Information,
Communication and Technology (ICT) infrastructure and skills are now critical in integrating
local producers into international technological and communications networks, and in attracting
vertical FDI in services as well as manufacturing17.
4.3. Role of Government Effectiveness Indicators
We also examined the impact of governance indicators on FDI in SADC countries. This is
proxied by the control of corruption, regulatory quality and rule of law (Lederman et al., 2010;
Globerman and Shapiro, 2002). The World Bank has come up with six world wide governance
indicators namely, regulatory quality, rule of law, control of corruption, voice and accountability,
government effectiveness and political stability. The governance indicators included in this paper
are government effectivenees, political stability and rule of law. Politically stable economies
guarantee the safety of investors interest and reduce uncertainty over future possible policy
reversals.
According to the World Bank, political stability measures the likelihood that the government in
power will be destabilized through unconstitutional or violent means. The rule of law index
covers the effectiveness and the predictability of the judiciary and the enforceability of contracts
and aims at measuring the confidence that agents have in the legal system. Government
effectiveness captures perceptions of the quality of public services, the quality of the civil service
and the degree of its independence from political pressures, the quality of policy formulation and
implementation, and the credibility of the government's commitment to such policies. 17See studies by Addison and Heshmati (2003)
28
Surveys18 of investors have indicated that political stability is one of the key concerns of potential
investors, although empirical results are somewhat mixed. Wheeler and Mody (1992) find that
political risk is insignificant in determining the production location decisions of US firms. On the
other hand, Asiedu (2005) examined the impact of political risk, institutional framework and
government policy on FDI flows into sub-Saharan Africa over the period 1984-2000 and found
that political stability deters FDI.
4.4. Data Sources and Estimation Procedure
The data for the trends and regression analysis was obtained mainly from SADC member
countries as well as the International Monetary Fund (IMF), UNCTAD, World Bank, and African
Development Indicators data sources. It was, however, noted that some SADC member countries
do not have adequate records on FDI by partner countries and also by sectors. All the
independent variables were lagged by one period, on the assumption that FDI decisions may be
made based on historical data and hence all the independent variables that are supposed to have
effect on FDI inflow would materialize their effect the next period (Lederman 2010). To
strengthen the empirical results, robust pooled Ordinary Least Squares (OLS) tests were
performed. This method allows estimation in the presence of AR(1) autocorrelation, within cross-
sectional correlation and heteroskedasticity across panels.
A possible problem with the above estimation is, however, the fact that it assumes that the
independant variables in the model are exogenous to FDI inflows, even when the lagged
independent variables are used. It is, however possible that some explanatory variables may be
endogenous to FDI inflows, thus, creating the problem of reverse causality. Previous studies
have, however, ruled out the possibility of endogeneity between FDI and infratructural variables
(Catrinescu et al 2006), (Aggarwal et al 2006) and Anyanwu 2010). As such, the OLS
methodology was applied to make the estimates in this study.
18 See Jenkins and Thomas (2002) and WIR Survey conducted by the United Nations Conference on trade and development
29
5. SECTION V: RESULTS AND ANALYSIS
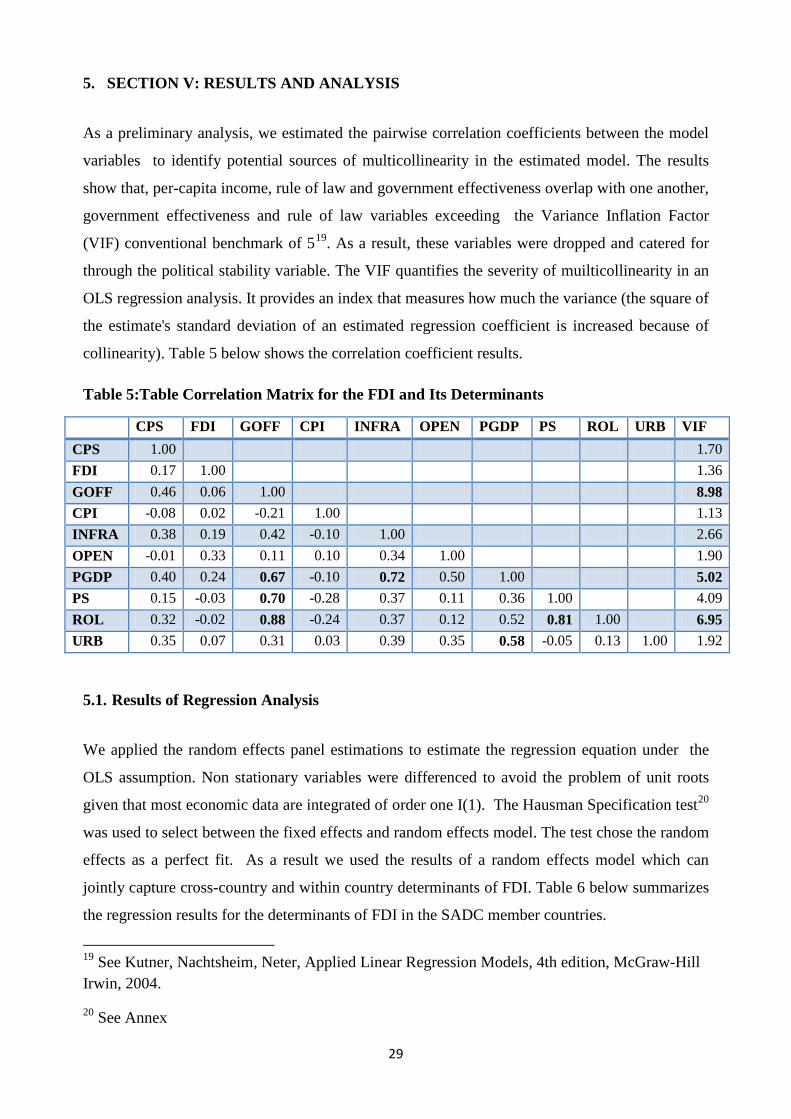
As a preliminary analysis, we estimated the pairwise correlation coefficients between the model
variables to identify potential sources of multicollinearity in the estimated model. The results
show that, per-capita income, rule of law and government effectiveness overlap with one another,
government effectiveness and rule of law variables exceeding the Variance Inflation Factor
(VIF) conventional benchmark of 519. As a result, these variables were dropped and catered for
through the political stability variable. The VIF quantifies the severity of muilticollinearity in an
OLS regression analysis. It provides an index that measures how much the variance (the square of
the estimate's standard deviation of an estimated regression coefficient is increased because of
collinearity). Table 5 below shows the correlation coefficient results.
Table 5:Table Correlation Matrix for the FDI and Its Determinants
CPS FDI GOFF CPI INFRA OPEN PGDP PS ROL URB VIF CPS 1.00 1.70 FDI 0.17 1.00 1.36 GOFF 0.46 0.06 1.00 8.98 CPI -0.08 0.02 -0.21 1.00 1.13 INFRA 0.38 0.19 0.42 -0.10 1.00 2.66 OPEN -0.01 0.33 0.11 0.10 0.34 1.00 1.90 PGDP 0.40 0.24 0.67 -0.10 0.72 0.50 1.00 5.02 PS 0.15 -0.03 0.70 -0.28 0.37 0.11 0.36 1.00 4.09 ROL 0.32 -0.02 0.88 -0.24 0.37 0.12 0.52 0.81 1.00 6.95 URB 0.35 0.07 0.31 0.03 0.39 0.35 0.58 -0.05 0.13 1.00 1.92
5.1. Results of Regression Analysis
We applied the random effects panel estimations to estimate the regression equation under the
OLS assumption. Non stationary variables were differenced to avoid the problem of unit roots
given that most economic data are integrated of order one I(1). The Hausman Specification test20
was used to select between the fixed effects and random effects model. The test chose the random
effects as a perfect fit. As a result we used the results of a random effects model which can
jointly capture cross-country and within country determinants of FDI. Table 6 below summarizes
the regression results for the determinants of FDI in the SADC member countries.
19 See Kutner, Nachtsheim, Neter, Applied Linear Regression Models, 4th edition, McGraw-Hill Irwin, 2004.
20 See Annex
30
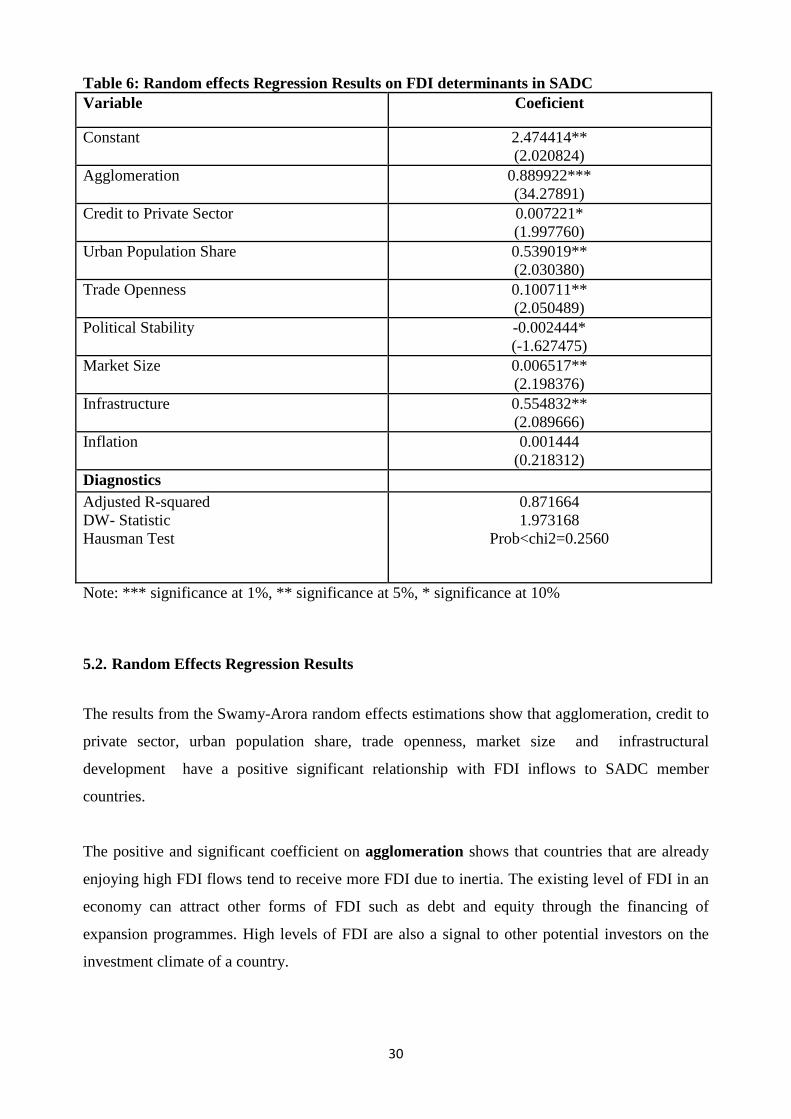
Table 6: Random effects Regression Results on FDI determinants in SADC Variable Coeficient
Constant 2.474414** (2.020824)
Agglomeration 0.889922*** (34.27891)
Credit to Private Sector 0.007221* (1.997760)
Urban Population Share 0.539019** (2.030380)
Trade Openness 0.100711** (2.050489)
Political Stability -0.002444* (-1.627475)
Market Size 0.006517** (2.198376)
Infrastructure 0.554832** (2.089666)
Inflation 0.001444 (0.218312)
Diagnostics Adjusted R-squared DW- Statistic Hausman Test
0.871664 1.973168
Prob<chi2=0.2560
Note: *** significance at 1%, ** significance at 5%, * significance at 10%
5.2. Random Effects Regression Results
The results from the Swamy-Arora random effects estimations show that agglomeration, credit to
private sector, urban population share, trade openness, market size and infrastructural
development have a positive significant relationship with FDI inflows to SADC member
countries.
The positive and significant coefficient on agglomeration shows that countries that are already
enjoying high FDI flows tend to receive more FDI due to inertia. The existing level of FDI in an
economy can attract other forms of FDI such as debt and equity through the financing of
expansion programmes. High levels of FDI are also a signal to other potential investors on the
investment climate of a country.
31
Credit to private sector was found to have a positive and significant effect on FDI, contrary to
the hypothesis that FDI will be greater where the capacity of the private sector to finance its
investment is constrained by an underdeveloped domestic financial sector. Foreign investors
prefer to invest in countries with higher levels of credit to private sector because they can access
working capital domestically after their initial investment.
The positive and significant coefficient on openness is consistent with foreign investment to most
developing countries being mainly export-oriented. It is also consistent with the FDI theory that
openness is indicative of the host countries’ ease of access to the world market for material
inputs. It also suggests that economies in which trade is important also have relatively higher
FDI. Jun and Singh (1996) found that higher levels of exports lead to higher FDI inflows.
The positive coefficients on makert size and uban population share suggest that FDI to the
region has been market seeking. A large urban population signifies a bigger market as the urban
population has generally higher income levels. According to Scaperlanda and Mauer (1969), FDI
responds positively to the market size once it reaches a threshold level that is large enough to
allow economies of scale and efficient utilization of resources. Enhanced regional integration will
therefore increase market size in SADC and help attract investors currently constrained in part by
the small size of some domestic SADC markets. This is all the more important given our finding
that large market size attracts FDI to SADC.
Political instability was found to have a negative relation with FDI, implying that perceived
political instability and government ineffectiveness in some SADC countries continues to deter
potential FDI inflows in those countries. The negative impact of political instability could be due
to weak law enforcement, red tape, and inefficient regulatory structures that characterize most
African economies (Egger and Winner, 2005). In the presence of political instability, there is
high risk of not getting the full benefits across all components of FDI, namely equity, reinvested
earnings and debt.
Infrastructural development was found to have a positive impact on FDI, implying that recent
increases in mobile telecommunication networks into SADC countries have had a significant
impact in explaining increases in FDI inflows over the past decade. This positive effect has been
confirmed by a number of previous studies, including Ang (2008), Onyeiwu and Shrestha (2004),
and Asiedu (2002).
32
SECTION VI: POLICY CONCLUSION AND RECOMMENDATIONS
5.3. Conclusion
This study was aimed at reviewing the experience of SADC countries in attracting FDI and to
explore why some member countries continue to receive more FDI than others. The study noted
that countries with higher FDI levels (agglomeration), credit to private sector, urban population
share, trade openness, market size and adequate infrastructure tend to attract more FDI,
compared to others. The study also established that countries which have made significant
progress in the privatization of public enterprises and reducing the cost of doing business in
general have also managed to attract more FDI flows compared to others.
Countries with unique specific factors such as availability of natural resources also tend to
receive more FDI flows, notwithstanding the presence of unfavourable investment regimes, such
as political instability, absence of rule of law and corruption. These countries can institute stricter
foreign equity requirements and empowerment regulations without running the risk of losing
potential investors in those sectors. However, the existence of foreign investment impediments
can affect FDI in other sectors of the economy, especially those requiring market seeking and
locational advantage FDI, which are sensitive to unfavourable investment climates.
The policy implication from the above assessment is that SADC countries should avoid
instituting stricter foreign investment regulations in sectors which they do not have unique
comparative advantage, because investors would move to other countries offering better
investment conditions. However, in sectors where a country has some unique comparative
advantages such as extractive industry, investors may not necessarily be deterred by strict
investment regulations. The regional integration initiatives by SADC, such as The Free Trade
Area and Protocol on Finance and Investment, among others have enhanced market seeking FDI
flows into the region as reflected by the recent upward trend in FDI inflows to the region.
Overall, it can be concluded that the reasons why investors choose to invest in a particular
country are wide-ranging and complex, reflecting the macroeconomic, institutional, social and
natural environment. Understanding the major factors why investors choose to invest in the
region is paramount to enhance the region’s appeal as a destination of choice.
33
5.4. Recommendations
Although substantial improvements have been made in terms of FDI policy at both regional and
country level, SADC countries should make concerted efforts to reduce the costs of doing
business and to improve international ratings on the countries’ governance and institutional
structures. This can be achieved by removing FDI impediments, particularly in areas requiring
market seeking and locational advantage FDI. This, however, require SADC countries to institute
regulations that are impartial and economically sound. In addition, the region needs to ensure
better quality infrastructure and creating a financial system that supports productive activity and
widespread access to credit. Significant progress in these areas will not only attract FDI, but can
also bring credibility on the effectiveness of governments.
SADC should promote greater regional integration by removing remaining trade obstacles,
particularly in extractive industries, which need huge capital outlay, beyond the capacity of the
domestic financial system. Enhanced trade openness will enable the SADC region to benefit as a
whole, by knocking down barriers to trade and opening the doors of mutual gain by strengthening
policies aimed at ensuring free flow of goods and services. There is also need to strengthen
governance through promoting effective contract enforcement and fighting corruption. Sound
governance, infrastructure and institutional quality, especially the rule of law, not only attracts
FDI, but also creates the conditions under which domestic TNCs emerge and invest abroad. There
is also need to set up and enforce commercial and small claims and anti-corruption courts.
SADC should also put more effort to improve openess through creating a common set of trade
and investment rules, that will help to provide a better investment environment for the entire
SADC market and potential investors. Deepening regional integration and economic cooperation
will help improve the competitiveness of SADC in attracting FDI through the halo effect and a
large market size. A regional approach can enhance these factors where an individual country by
itself has limited scope in achieving enhanced locational competitiveness associated with the
benefits of agglomeration, full capacity utilisation and in overcoming the handicap of small
markets.
However, there is need to strike a balance between fostering increased financial inflows through
openness and the need for the promotion of the growth of domestic industries, especially the
small to medium scale enterprises. Capacitation of the local companies is also of paramount
importance to enable the domestic industries to compete with TNCs.
34
The consolidation of the financial sector also plays an important role to attract FDI to the country
and the region as a whole. Countries need to deal with the high cost of financial intermediation,
interest rate differentials and credit provision procedures. There is also need to improve the
general quality of banking services and to remove remaining financial obstacles that hider foreign
inflows such as the existence of exchange controls. The quality of banking sector services should
also be improved.
There is also need to explore diversification through developing new investment niches in
dynamic sectors, beyond natural resources sector, by taping into other areas such as engineering,
software development and computing. This can be achieved by removing obstacles such as
foreign investment restrictions in market seeking investments. SADC countries with high FDI in
extractive industries such as mining should actively promote FDI in other sectors of the economy.
In essence, SADC countries need to aggressively promote FDI in sectors that provides backward,
forward and horizontal linkages with extractive industries through refining and beneficiation.
There is, therefore, need to invest more on basic infrastructures such as roads, bridges and power
plants in order to facilitate trade among member countries and lure foreign investors to the
region. In addition, there is need to ensure transformation of public sector delivery, particularly in
sectors such as provision of utility, enegy and water, among others.
Overall, the major policy areas SADC countries should focus on, to attract more FDI, is to
institute policies aimed at improving stability of the monetary system, removing foreign
investment restrictions, allocating more resources to infrastructural development, opening their
markets by entering into the right kind of bilateral and multilateral trade agreements, and
improving governance and institutional indicators such as doing business, political stability, rule
of law and the fight against corruption. Capacity building need to be enhanced so that foreign
investors are able to make use of local staff.
There is, however, need to weigh the pros and cons of FDI in the receiving economy to ensure
that the majority benefit from the multiplier effect of FDI. In some cases, countries only benefit
from employment, without any other social benefits accruing to the society in which TNCs
operate.
5.5. Areas for Further Research
Going forward, more detailed, country-level studies are required to provide comprehensive
insight into why investors choose to invest in particular countries. There is also need to assess the

35
pros and cons of fully opening up the domestic economy to foreign investors. The perception that
foreign investors exploit domestic economies need to be unpacked to establish wether its reality
or just perception. Furthermore, it is necessary to determine the role of tax incentives in attracting
Foregn Direct I Investment in the region. Although this study has provided some entry points, the
results of more country studies would allow for more grounded evaluation of good practice
mechanisms to regulate FDI in a regional context in SADC.
36
REFERENCES
1. Anyanwu J. C.(2011) “Determinants of Foreign Direct Investment Inflows to Africa,
1980-2007”, African Development Bank Working Paper Series.
2. Asiedu, E. (2006), “Foreign Direct Investment in Africa: The Role of Natural Resources,
Market Size, Government Policy, Institutions and Political Instability”. World Institute
for Development Economics Research Working Paper Number 05/24, United Nations
University.
3. Asiedu, E. (2002). “On the Determinants of Foreign Direct Investment to Developing
Countries: Is Africa Different?” World Development, 30 (1), 107-19.
4. Baum, C. F., Schaffer, M. E., and Stillman, S. (2007) “Enhanced routines for instrumental
variables /GMM estimation and testing”, Boston College Economics Working Paper. 667.
5. Bezuidenhout, H., and Naudé, W. A. (2008) “Foreign direct investment and trade in the
Southern African development community”, Working Papers RP2008/88, World Institute
for Development Economic Research (UNU-WIDER).
6. Borenstein, E., de Gregorio, J., and Lee, J.-W. (1998) “How does foreign direct investment affect economic growth?”, Journal of International Economics, 45, 115–135.
7. Campos and Kinoshida (2003), “Why Does FDI Go Where It Goes? New Evidence from
the Transition Economy”, IMF Working Paper 03/228.
8. Dunning (1981) “International Production and the Multinational Enterprise”, George
Allen and Unwin, London.
9. Greene, W. (1993), “Econometric Analysis”, Prentice Hall
10. Gujarati, D. N. (2003), “Basic Econometrics”, 4th Edition, The McGraw-Hill Companies
11. Kosack, S., & Tobin, J. (2006) “ Funding self-sustaining development: the role of aid, FDI
and government in economic success”, International Organization, 60, 205–243.
12. Lederman, D., Mengistae, T and Xu, L. C. (2010), Microeconomic Consequences and
Macroeconomic Causes of Foreign Direct Investment in Southern African Economies,
World Bank Policy Research Working Paper 5416, September.
13. Markusen, J., and A. Venables, (1998) “Multinational Firms and the New Trade
Theory,”Journal of International Economics, Vol. 46, No. 2, pp. 183–203.
14. Mauro, F. (2000), “The impact of economic integration on FDI and exports: A gravity
approach”, Centre for European Policy Studies, Working Document No. 156
37
15. Miyamoto, K. (2003) “Human capital formation and foreign direct investment in
developing countries”, Organization for Economic Co-operation and Development (OECD)
Paper No. 211.
16. Morisset, P. (2000). “Foreign Direct Investment to Africa: Policies also Matter”
Transnational Corporation, 9 (2), 107-125.
17. Naudé, W. A., & Krugell, W. F. (2003) “ Managing and developing human resources for
attracting foreign direct investment in Africa”, Management Dynamics, 12(3), 2–11.
18. Naudé, W. A., & Krugell, W. F. (2007) “Investigating geography and institutions as
determinants offoreign direct investment in Africa using panel data”, Applied
Economics, 39(10–12), 1223–1234.
19. Obwona, M. B. (2001), “Determinants of FDI and their impact on economic growth in
Uganda”, Economic Policy Research Centre, African Development Bank, Oxford, UK
20. Organization for Economic Co-operation and Development (1996), “The Detailed OECD
Benchmark Definition of Foreign Direct Investment”, third edition. OECD Publications,
Paris, France.
21. Quazi R. (2007) “Economic Freedom and Foreign Direct Investment in East Asia”,
College of Business Prairie View A&M University Prairie View, Texas 77446, USA
International Academy of Business and Public Administration Disciplines (IABPAD)
meetings
22. Shatz, H. and Venables A. J, (2000), “The Geography of International Investment”, World
Bank Policy Research Working Paper No. 2338
23. UNCTAD (2010) “ Regional Trends: Africa, World Investment Report 2010|Investing in
a Low-Carbon Economy”, United Nations Conference on Trade and Development: Geneva.
24. Van Der Lugt S. and Humbling V. (2009) “Assessing China’s role in foreign direct
investment in Southern Africa”, Center For Chinese Studies
25. Walsh, P. W. and Yu, J. (2010), “Determinants of Foreign Direct Investment: A Sectoral
and Insitutional Approach”, IMF Working Paper 10/187 (Washington: International
Monetary Fund).
26. Wilhelms, S. (1998), “Foreign Direct Investment and its determinants in emerging
economies”. African Policy Paper No.9, United States Agency for International Development
Bureau for Africa.
27. World Bank. (2002) GRICS: Governance Research Indicator Country Snapshot.
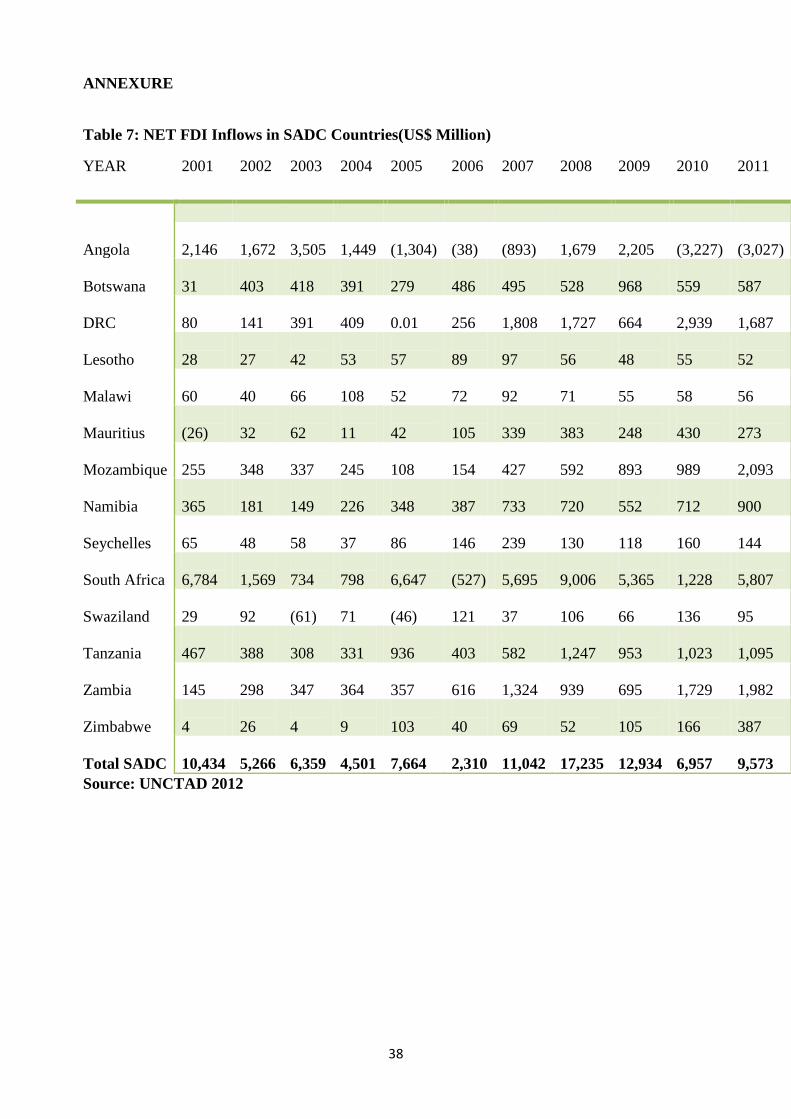
38
ANNEXURE
Table 7: NET FDI Inflows in SADC Countries(US$ Million)
YEAR 2001 2002 2003 2004 2005 2006 2007 2008 2009 2010 2011
Angola
2,146
1,672
3,505
1,449
(1,304)
(38)
(893)
1,679
2,205
(3,227)
(3,027)
Botswana
31
403
418
391
279
486
495
528
968
559
587
DRC 80
141
391
409
0.01
256
1,808
1,727
664
2,939
1,687
Lesotho
28
27
42
53
57
89
97
56
48
55
52
Malawi
60
40
66
108
52
72
92
71
55
58
56
Mauritius
(26)
32
62
11
42
105
339
383
248
430
273
Mozambique
255
348
337
245
108
154
427
592
893
989
2,093
Namibia
365
181
149
226
348
387
733
720
552
712
900
Seychelles
65
48
58
37
86
146
239
130
118
160
144
South Africa 6,784
1,569
734
798
6,647
(527)
5,695
9,006
5,365
1,228
5,807
Swaziland
29
92
(61)
71
(46)
121
37
106
66
136
95
Tanzania
467
388
308
331
936
403
582
1,247
953
1,023
1,095
Zambia
145
298
347
364
357
616
1,324
939
695
1,729
1,982
Zimbabwe
4
26
4
9
103
40
69
52
105
166
387
Total SADC 10,434
5,266
6,359
4,501
7,664
2,310
11,042
17,235
12,934
6,957
9,573
Source: UNCTAD 2012
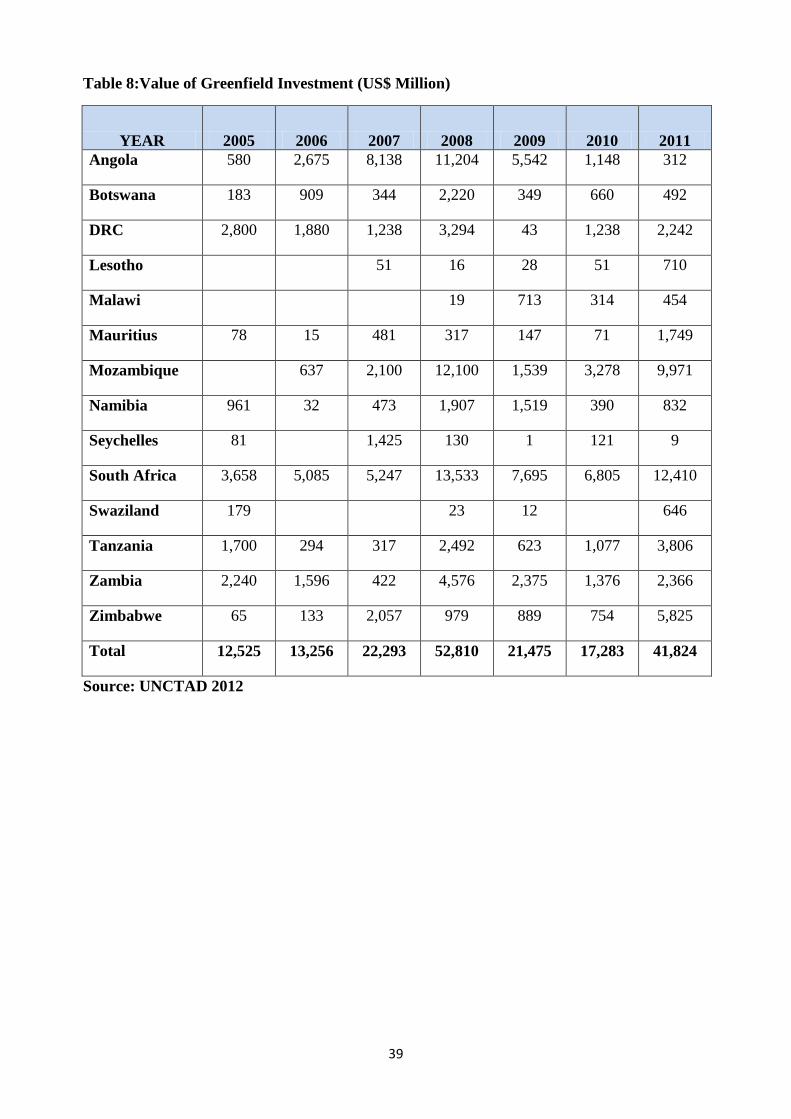
39
Table 8:Value of Greenfield Investment (US$ Million)
YEAR 2005 2006 2007 2008 2009 2010 2011 Angola 580 2,675 8,138 11,204 5,542 1,148 312
Botswana 183 909 344 2,220 349 660 492
DRC 2,800 1,880 1,238 3,294 43 1,238 2,242
Lesotho
51 16 28 51 710
Malawi
19 713 314 454
Mauritius 78 15 481 317 147 71 1,749
Mozambique
637 2,100 12,100 1,539 3,278 9,971
Namibia 961 32 473 1,907 1,519 390 832
Seychelles 81
1,425 130 1 121 9
South Africa 3,658 5,085 5,247 13,533 7,695 6,805 12,410
Swaziland 179
23 12
646
Tanzania 1,700 294 317 2,492 623 1,077 3,806
Zambia 2,240 1,596 422 4,576 2,375 1,376 2,366
Zimbabwe 65 133 2,057 979 889 754 5,825
Total 12,525 13,256 22,293 52,810 21,475 17,283 41,824
Source: UNCTAD 2012
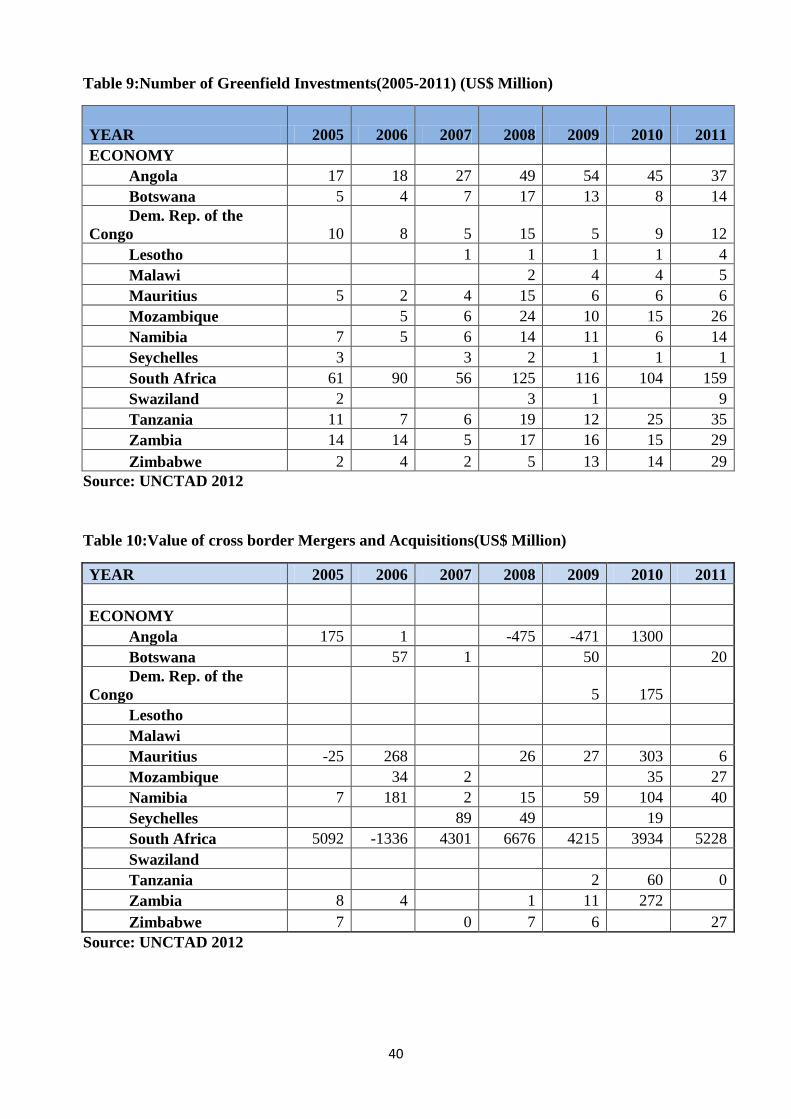
40
Table 9:Number of Greenfield Investments(2005-2011) (US$ Million)
YEAR 2005 2006 2007 2008 2009 2010 2011 ECONOMY
Angola 17 18 27 49 54 45 37 Botswana 5 4 7 17 13 8 14 Dem. Rep. of the Congo 10 8 5 15 5 9 12 Lesotho
1 1 1 1 4
Malawi
2 4 4 5 Mauritius 5 2 4 15 6 6 6 Mozambique
5 6 24 10 15 26
Namibia 7 5 6 14 11 6 14 Seychelles 3
3 2 1 1 1
South Africa 61 90 56 125 116 104 159 Swaziland 2
3 1
9
Tanzania 11 7 6 19 12 25 35 Zambia 14 14 5 17 16 15 29 Zimbabwe 2 4 2 5 13 14 29
Source: UNCTAD 2012
Table 10:Value of cross border Mergers and Acquisitions(US$ Million)
YEAR 2005 2006 2007 2008 2009 2010 2011 ECONOMY Angola 175 1 -475 -471 1300 Botswana 57 1 50 20 Dem. Rep. of the Congo 5 175 Lesotho Malawi Mauritius -25 268 26 27 303 6 Mozambique 34 2 35 27 Namibia 7 181 2 15 59 104 40 Seychelles 89 49 19 South Africa 5092 -1336 4301 6676 4215 3934 5228 Swaziland Tanzania 2 60 0 Zambia 8 4 1 11 272 Zimbabwe 7 0 7 6 27
Source: UNCTAD 2012
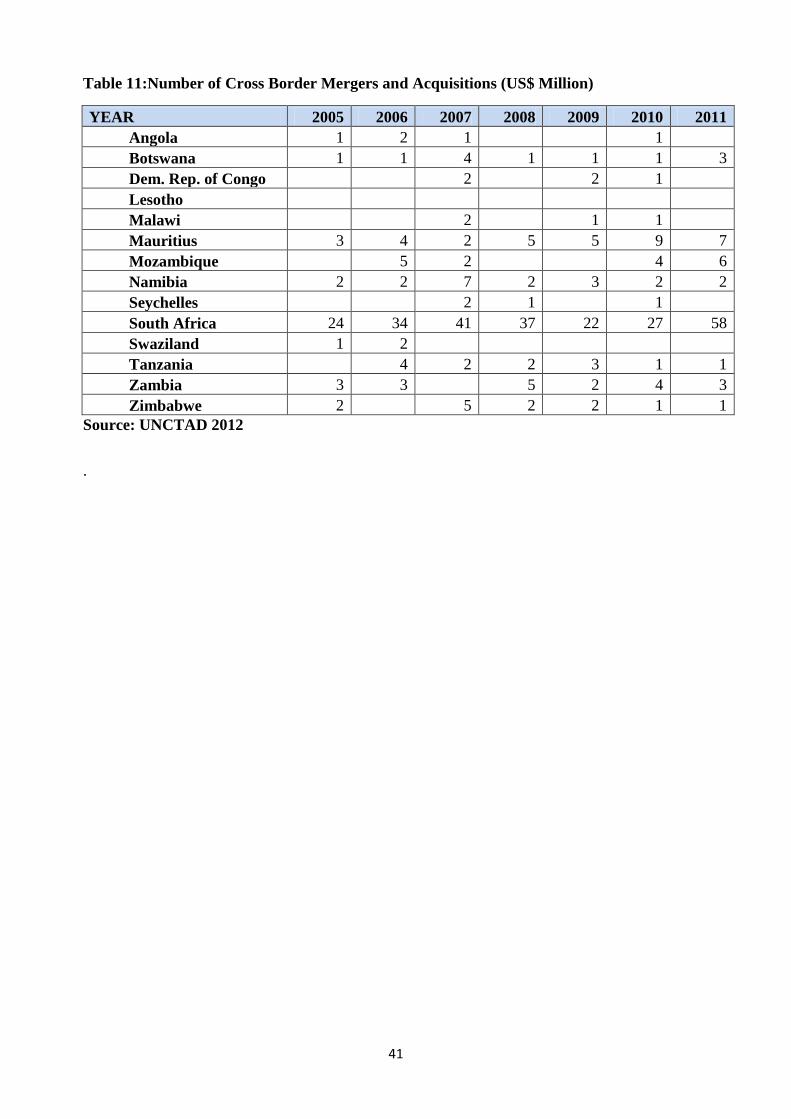
41
Table 11:Number of Cross Border Mergers and Acquisitions (US$ Million)
YEAR 2005 2006 2007 2008 2009 2010 2011 Angola 1 2 1 1 Botswana 1 1 4 1 1 1 3 Dem. Rep. of Congo 2 2 1 Lesotho Malawi 2 1 1 Mauritius 3 4 2 5 5 9 7 Mozambique 5 2 4 6 Namibia 2 2 7 2 3 2 2 Seychelles 2 1 1 South Africa 24 34 41 37 22 27 58 Swaziland 1 2 Tanzania 4 2 2 3 1 1 Zambia 3 3 5 2 4 3 Zimbabwe 2 5 2 2 1 1
Source: UNCTAD 2012
.