Embed Size (px)
Citation preview

Marcin Humanicki / Economic Analysis Department
Recent trends in the real estate market and its analysis – 2017 edition
Zalesie Górne / 23 November 2017
Foreign direct investment in commercial real estate:
Poland vs OECD countries

■ Firstly, analyze the evolution of inward FDI stock in Poland over the period
1998-2012 with the emphasis on commercial real estate.
■ Secondly, study how Poland differs in terms of sectoral structure of inward
FDI with the OECD countries (regional peers from CEE and developed
economies).
■ Thirdly, assess Poland’s FDI attractiveness relative to the OECD.
■ Finally, prepare the background for the further research on impact of FDI
in real estate on economic growth in Poland.
2
Motovation

■ Source: OECD International Direct Investment Statistics (database)
■ Classification: 3rd edition Benchmark Definition of FDI (previous one)
■ Variable of interest: inward FDI stock
■ Sector of interest: real estate, renting and business activities (broad
category) due to limited availability of data for its subsector real estate
■ Time period: annual data for the period 1998-2012
■ Reference group of countries: OECD and its members
3
Data used in the analysis

Geographical distribution of FDI flows Geographical distribution of FDI stocks
Note: data presented according to FDI Benchmark Definition 3rd edition
Source: OECD International Direct Investment Statistics (database)
Note: data presented according to FDI Benchmark Definition 3rd edition
Source: OECD International Direct Investment Statistics (database)
OECD remains the main destination for FDI, but the distribution is changing
4

Inward FDI stock by sector (% of total FDI) Inward FDI stock by sector (% of total FDI)
Note: data presented according to FDI Benchmark Definition 3rd edition
Source: OECD International Direct Investment Statistics (database)
Note: data presented according to FDI Benchmark Definition 3rd edition
Source: OECD International Direct Investment Statistics (database)
Global FDI is shifting towards services and Poland has followed this path
5
Poland OECD-21

■ Non-tradable nature of many
services causes that the only
way to serve foreign markets is
through market-seeking FDI
■ Lower entry barriers due to a
removal of many capital controls
Growing importance of the financial and real estate services in the OECD
Inward FDI stock in the services (% of GDP)
Note: data presented according to FDI Benchmark Definition 3rd edition
Source: OECD International Direct Investment Statistics (database)
6
OECD-21
0%
10%
20%
30%
40%
50%
1998 2000 2002 2004 2006 2008 2010 2012
Financial services
Real estate, renting and business activities
Services
Total FDI

Sectoral distribution of FDI in the services Inward FDI stock in the services (% of GDP)
Note: data presented according to FDI Benchmark Definition 3rd edition
Source: OECD International Direct Investment Statistics (database)
Note: data presented according to FDI Benchmark Definition 3rd edition
Source: OECD International Direct Investment Statistics (database)
Within the services in Poland, the role of real estate sector has increased
7
0%
20%
40%
60%
80%
100%
1998 2000 2002 2004 2006 2008 2010 2012
Trade Transports and communication
Financial intermediation Real estate and business activities
Other services
7%0%
10%
20%
30%
40%
50%
1995 1997 1999 2001 2003 2005 2007 2009 2011
Financial services
Real estate, renting and business activities
Services
Total FDI

0%
10%
20%
30%
40%
50%
60%
70%
80%
90%
100%
1998 1999 2000 2001 2002 2003 2004 2005 2006 2007 2008 2009 2010 2011 2012
TRADE AND REPAIRS
TRANSPORTS, STORAGE AND COMMUNICATION
FINANCIAL INTERMEDIATION
REAL ESTATE, RENTING AND BUSINESS ACTIVITIES
OTHER SERVICES
0%
10%
20%
30%
40%
50%
60%
70%
80%
90%
100%
1998 1999 2000 2001 2002 2003 2004 2005 2006 2007 2008 2009 2010 2011 2012
TRADE AND REPAIRS
TRANSPORTS, STORAGE AND COMMUNICATION
FINANCIAL INTERMEDIATION
REAL ESTATE, RENTING AND BUSINESS ACTIVITIES
OTHER SERVICES
Poland, the Czech Republic and Slovakia show a similar pattern like …
8
Czech Republic Slovakia

… developed countries (US, UK) representing anglo-saxon model
9
United States United Kingdom
0%
10%
20%
30%
40%
50%
60%
70%
80%
90%
100%
1998 1999 2000 2001 2002 2003 2004 2005 2006 2007 2008 2009 2010 2011 2012
TRADE AND REPAIRS
TRANSPORTS, STORAGE AND COMMUNICATION
FINANCIAL INTERMEDIATION
REAL ESTATE, RENTING AND BUSINESS ACTIVITIES
OTHER SERVICES
0%
10%
20%
30%
40%
50%
60%
70%
80%
90%
100%
1998 1999 2000 2001 2002 2003 2004 2005 2006 2007 2008 2009 2010 2011 2012
TRADE AND REPAIRS
TRANSPORTS, STORAGE AND COMMUNICATION
FINANCIAL INTERMEDIATION
REAL ESTATE, RENTING AND BUSINESS ACTIVITIES
OTHER SERVICES

Germany and Hungary tend to show similar pattern (continental model)
10
Germany Hungary
0%
10%
20%
30%
40%
50%
60%
70%
80%
90%
100%
1998 1999 2000 2001 2002 2003 2004 2005 2006 2007 2008 2009 2010 2011 2012
TRADE AND REPAIRS
TRANSPORTS, STORAGE AND COMMUNICATION
FINANCIAL INTERMEDIATION
REAL ESTATE, RENTING AND BUSINESS ACTIVITIES
OTHER SERVICES
0%
10%
20%
30%
40%
50%
60%
70%
80%
90%
100%
1998 1999 2000 2001 2002 2003 2004 2005 2006 2007 2008 2009 2010 2011 2012
TRADE AND REPAIRS
TRANSPORTS, STORAGE AND COMMUNICATION
FINANCIAL INTERMEDIATION
REAL ESTATE, RENTING AND BUSINESS ACTIVITIES
OTHER SERVICES

■ We use UNCTAD’s benchmarking
tool called Inward FDI Performance
Index
■ FDI performance index is defined as:
■ Countries with a value higher than
one attract more FDI than could be
expected on the basis of their
relative GDP size
Poland’s FDI performance in real estate is strengthening, but remains weak
relative to the OECD
Inward FDI Performance index
Source: own calculations based on UNCTAD’s methodology
11
OECDi
OECDi
GDPGDP
FDIFDI
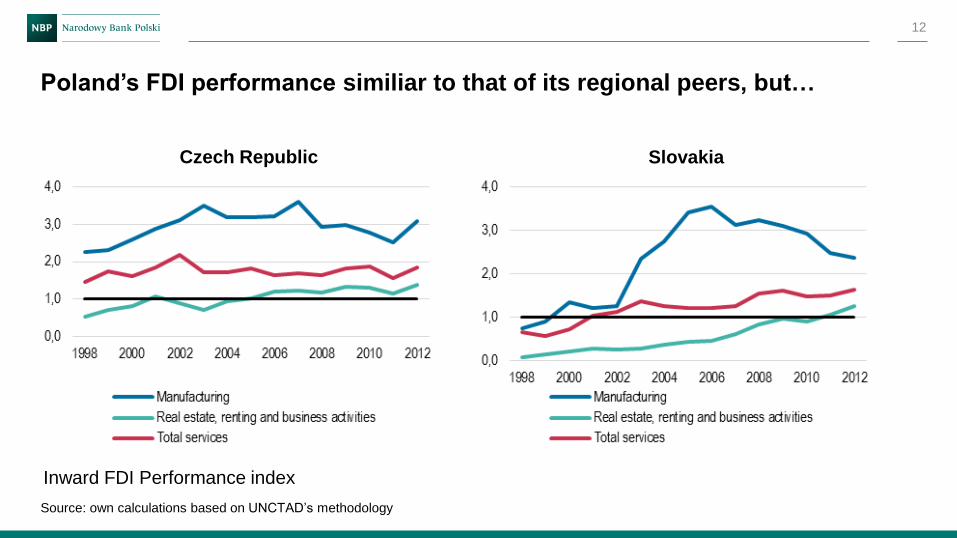
Poland’s FDI performance similiar to that of its regional peers, but…
12
Czech Republic Slovakia
Inward FDI Performance index
Source: own calculations based on UNCTAD’s methodology

better than that of developed countries following anglo-saxon model
13
United States United Kingdom
Inward FDI Performance index
Source: own calculations based on UNCTAD’s methodology

0,0
1,0
2,0
3,0
4,0
5,0
1998 2000 2002 2004 2006 2008 2010 2012
Manufacturing
Real estate, renting and business activities
Total services
0,0
1,0
2,0
3,0
4,0
5,0
1998 2000 2002 2004 2006 2008 2010 2012
Manufacturing
Real estate, renting and business activities
Total services
Germany and Hungary have a higher FDI performance in real estate sector
14
German Hungary
Inward FDI Performance index
Source: own calculations based on UNCTAD’s methodology

■ In terms of FDI’s decomposition in the services and FDI’s performance
Poland tends to follow a similar pattern to that of its regional peers (the
Czech Republic and Slovakia) and, to some degree, of the developed
countries representing the anglo-saxon model (US, UK).
■ Hungary tends to show a similar pattern as the core EU countries
(Germany).
■ The reason for such pattern should be studied further in the next paper.
15
Main conclusions

■ merge data on sectoral decomposition of FDI from 3rd and 4th OECD
classifications
■ extend the current analysis by examining the growth effects of FDI in real
estate sector.
16
Next step will be to…

17
Any comments, suggestions or questions
are welcome!