Embed Size (px)
Citation preview
Foreign Direct Investment in Latin America during the Emergence of China and
India: Stylized Facts
Javier Cravino, Daniel Lederman and Marcelo Olarreaga∗
This version: May 24, 2006
Abstract
In spite of the growing concerns about Foreign Direct Investment (FDI) being diverted from Latin America to China and India, the best available data show that Latin America has performed relatively well since 1997. Foreign Capital Stocks (FCS) from OECD countries and the U.S. in particular in China and India are still far from those in the largest Latin American economies. The evidence shows that FCS in China increased more than in Latin America during 1990-1997, but not so much since 1997. In fact, Latin America actually performed better than China since 1997 given its lack of relative growth. The growth of FCS in India was more stable than in China. Nonetheless, after controlling for shocks emanating from the source countries and bilateral distance between source and host countries, we find a significant change in the FCS relative to China between 1990 and 1997, but no change relative to India.
The findings, interpretations and conclusions expressed in this paper are entirely those of
the authors. They do not necessarily represent the view of the World Bank, its Executive
Directors, or the countries they represent.
∗ We are grateful to Pravin Krishna for helpful discussions and comments Financial support from the World Bank’s Latin American and Caribbean Regional Studies Program is gratefully acknowledged.
1
Pub
lic D
iscl
osur
e A
utho
rized
Pub
lic D
iscl
osur
e A
utho
rized
Pub
lic D
iscl
osur
e A
utho
rized
Pub
lic D
iscl
osur
e A
utho
rized
Pub
lic D
iscl
osur
e A
utho
rized
Pub
lic D
iscl
osur
e A
utho
rized
Pub
lic D
iscl
osur
e A
utho
rized
Pub
lic D
iscl
osur
e A
utho
rized
1. Introduction
Foreign direct investment (FDI) has been increasing at an extraordinary speed
during the last twenty years. In the second half of the last decade, world inflows grew at
an annual rate of almost 40 percent, reaching $648 billion in 2004.1 Foreign Capital
Stocks (FCS) were multiplied by a factor of 5 between 1990 and 2004, rising from
$1,770 billion in 1990 to almost $9 trillion in 2004.2 An even larger increase was
reported in developing countries, where stocks went from $364 billion to over $2,230
billion over the same period.
In particular, foreign direct investment inflows to Latin America and the
Caribbean (LAC) continuously grew during the nineties, up to almost half of total inflows
into developing economies in 1999. In that year, FDI accounted for 25 percent of Latin
America’s gross fixed capital formation.3 Although there was a slowdown in these
inflows at the beginning of the 21st century, by 2004 aggregate stocks in Latin America
reached $600 billion dollars, about six times more than in 1990.4
There is a growing concern that the growth in China and India may present a
challenge to other developing countries. The low wages and the large populations of
these countries may entice multinational enterprises to relocate their production facilities
there. In fact, FCS in China grew at an amazing speed, from $20 billion in 1990 to $245
billion in 2004, the largest FCS in the developing world. At the same time, stocks in India
increased from $1.6 to almost $40 billion over the same period.
1 UNCTAD 2005 2 Throughout the paper we refer to stocks of foreign direct investment (FDI) as foreign capital stocks (FCS). 3 UNCTAD 2004 and UNCTAD 2005 4 These figures were taken from UNCTAD foreign direct investment database. We do not include Bermuda, Cayman Islands and Virgin Islands in the Latin American figures as part of LAC.
2
This paper examines the evolution of foreign capital in Latin American
economies by comparing them to China and India. In particular, we study total inward
stocks into each country, inward stocks from major OECD countries, inward stocks from
the U.S. and inward stocks from the U.S. in the manufacturing sector.
Although China appears as the developing economy with the largest FCS, its
stocks from OECD sources and the U.S. in particular are smaller than those of the major
Latin American countries. In fact; FCS in China are still smaller than in Latin America if
we control for county size. However, Hong-Kong and Mainland China together
accumulated larger stocks from OECD investments than any Latin American country.
FCS in India, on the other hand, are still small compared to those in the major Latin
American countries.
We then analyze the evolution of the relative stocks by looking at how they
changed between 1990, 1997, and 2003, because the data suggest that time trends of
Chinese FCS changed after 1997. We find that China accumulated larger stocks than
Latin America since 1990, but not since 1997. This was not the case for U.S. capital in
the manufacturing sectors of host countries, where stocks in China grew faster than in
most Latin American countries between 1997 and 2003. This growth, however, is far
from impressive, and it is mainly explained by faster GDP growth. In contrast, Indian
FCS grew faster than in Latin American countries during the whole period 1990-2003,
but this growth was slower than in China during the entire period according to both the
U.S. and the OECD data.
Finally, we analyze the evolution of OECD FCS in Latin America relative to
those in China and India after controlling for shocks affecting the source countries as well
3
as geographic distance between source and host countries. This evidence suggests that
OECD capital stocks in Latin American economies relative to China changed between
1990 and 1997, but not between 1997 and 2003. At the same time, we did not find any
statistically significant change in the stocks relative to China plus Hong-Kong and India
during this period, thus implying that China plus Hong Kong and India receive FDI from
different sources than Latin American economies. Nevertheless, these stylized facts do
not tell us much about whether FDI flows to China, Hong Kong plus China, or India
since 1990 have come at the expense of FDI to Latin American countries. Further
econometric analysis is required to address this question (see, for example, Eichengreen
and Tong 2005; Cravino, Lederman, and Olarreaga 2006; Garcia Herrero and
Santabárbara 2005; and Chantassasawat et al. 2004).
The rest of this paper is organized as follows. Section 2 describes the data.
Section 3 compares FCS levels in Latin America, China, China plus Hong-Kong, and
India. Sections 4 and 5 analyze the evolution of these stocks. Section 6 studies the
conditional relative stocks, and section 7 provides concluding remarks.
2. Data Description
The analyses in this paper use data on aggregate inward FCS, outward stocks
from some OECD countries, outwards stocks from the U.S., and outward stocks from the
U.S. in the manufacturing sectors of China, China plus Hong-Kong, India, and Latin
American countries. Data on aggregate stocks was collected from UNCTAD, which are
available from its website.5 UNCTAD reports aggregate FCS at book values or at
historical cost in millions of U.S. dollars. The aggregate inward data is attractive since it 5 www.unctad.org
4
draws a general picture of the relative evolution of FCS. One drawback of this dataset is
that the agencies that collected the original data vary from one host country to another.
This makes comparisons between different host countries difficult to interpret. Moreover,
these aggregate data do not provide information on FCS by source-host country pairs.
Since the major sources of FCS for China are different from those of Latin American
countries, it is prudent to focus on some attention on source countries that are important
for Latin America6.
To address these issues, we also use data on bilateral outward stocks from major
OECD countries. These data were taken from OECD statistics and UNCTAD for the
period 1990-2003.7 The OECD reports the bilateral FCS of 29 OECD countries into 235
host economies in millions of U.S. dollars from 1982 to 2003. One shortcoming of this
dataset is that observations for most Latin American countries are missing for some
source countries. We therefore expanded this dataset using data from UNCTAD for 29
source countries into 190 host countries. For those countries for which the UNCTAD data
is reported in national currency, we transformed the figures into U.S. dollars using the
end of period exchange rate, which was taken from the OECD. We then use the OECD
dataset unless the observations are missing.8 Even after including the observations from
UNCTAD, we continue to have several missing observations for some country pairs. For
this reason, in sections 3, 4 and 5 we restrict the analysis to major source countries that
have most of the observations for the Latin American countries. The selected source
countries were Canada, Germany, France, Japan, Netherlands, Spain, Switzerland, the United
6 IADB [2004] 7 The OECD data is available from www.sourceoecd.org. 8 Data for Australia for the period 1990-2000 was also taken from the UNCTAD, since OECD reports data for the fiscal year.
5
Kingdom, and the United States.9 Together they accounted for more than 68 percent of total
FCS in the major Latin American countries as of 2002.10 The complete dataset was used in
the regression analysis of section 6, where the data were also deflated by the U.S. Producer
Price Index (PPI). 11 Although the agencies that collected the OECD and UNCTAD
databases vary from one source country to another, they remain the same within the host
countries, which facilitates international comparisons, especially in econometric analyses
that control for source-country effects as in section 6 below.
Data for total outward stocks from the U.S. were taken from the Bureau of Economic
Analysis.12 These stocks are reported on a historical cost basis in millions of U.S. dollars.
These data are of particular interest for our purpose due to the visible presence of U.S.
multinational corporations in Latin American countries as well as in China, Hong Kong, and
India. An advantage of these data is that it was collected by the same agency. Finally, we
take the U.S. stocks in the manufacturing sectors of the host countries from the same
source. Again, these data are of special interest since companies in this sector seem to be
potentially more inclined to relocate production to China or India as they search for
reductions in labor costs.
To make the analysis more tractable and due to data availability on bilateral
stocks from the OECD, we focus on nine Latin American countries. We include the
major countries (Argentina, Brazil, Chile, Colombia, Mexico and Venezuela) as well as
some Central American countries that may be of particular interest (Costa Rica,
9 Stocks from Spain were calculated by accumulating the flows, which were taken from the OECD. Japan does not report stocks in 1995 for any Country. It does not report stocks in any year for Colombia, Costa Rica, Guatemala, Venezuela and in Argentina and Chile since 1996. 10 UNCTAD 2004. This figure does not include stocks into Mexico. However, FDI flows from these countries comprised more than 90 percent of Mexican FDI inflows in 2002. 11 The PPI was taken from the International Monetary Fund’s International Financial Statistics database. 12 www.bea.org
6
Guatemala and El Salvador) due to their dependence of manufacturing exports that
compete with Chinese exports in the U.S. market. Together, these countries accounted for
86 percent of Latin Americas FCS in 2003.
3. Relative stocks in 2003
In this section we analyze the FCS levels in Latin American countries relative to
those in China, China and Hong-Kong together, and India. Table 1 reports these ratios for
the world total, OECD, U.S. and U.S. manufacturing FCS.
The first column shows how important China has become as a destination for
FDI: by 2003 total FCS in China were bigger than in any Latin American country. Brazil
and Mexico, the countries with the largest FCS of the region, had only 58 and 73 percent
of China’s stock respectively. At the same time, Argentina, Chile, and Venezuela
reported less than a quarter of China’s FCS.
Nonetheless, OECD FCS in China were significantly smaller than in the major
Latin American countries. In particular, Mexico had almost twice as much capital from
the OECD than China. This disparity is more noticeable in disaggregated data from the
U.S. The third column of table 1 shows that the relative stocks from the U.S. were bigger
than both the aggregate and the OECD relative stocks. This reflects the fact that the U.S.
is a relatively more important source of FDI for Latin American countries than for China.
In 2003, U.S. stocks in China were only $11.5 billion, quite small compared to the $ 59
billion in Mexico or the $ 37 billion in Brazil. These data show that when it comes to
OECD and U.S. stocks, China is still far from being a major host of FCS.
7
The last column in the first panel of table 1 reports the relative stocks from the
U.S. in the manufacturing sector. Again China does not appear as a major host of FCS,
with one third of the capital accumulated in Mexico. However, in this sector Chinese
stocks are larger than those of Argentina, Chile, and Venezuela, suggesting that China
has been relatively more attractive to capital in the manufacturing sector.
China and Hong-Kong jointly had accumulated FCS for almost $188 billion, more
from the OECD than any Latin American country by 2003. China and Hong-Kong are
important hosts of U.S. FCS, being considerably bigger than every country from Latin
America with the exception of Mexico.
India, on the other hand, is a long way from reaching the FCS levels of the major
Latin American countries countries. By 2003, total FCS in Mexico alone were more than
5 times bigger than in India. The OECD data shows that this gap is bigger for the largest
countries, but it is smaller for Costa Rica, El Salvador and Guatemala.
The last two columns of the table reveal that India is not a major destination for
U.S. capital. Except for Argentina and Chile the difference between Latin American and
Indian stocks is larger in the manufacturing sector.
Differences in FCS in Latin American countries and China and India may only
reflect differences in country sizes. Thus, we proceed to normalize the FCS by each
country GDP and recalculate the relative stocks. The U.S. FCS in the manufacturing
sector were normalized with the Manufacturing Value added in each country13. The
resulting ratios are reported in Table 2. After controlling for country size, China appears
with less FCS than any Latin American country. This is true for the different indicators of
13 GDP and Value Added in manufacturing in current U.S. Dollars were taken from WDI. Manufacturing Value Added for China in Yuans was taken from China Statistical Yearbook, and transformed into dollars using the period average exchange rate from IFS.
8
FCS. Latin American countries also have more FCS from the OECD and the U.S. relative
to their size than China and Hong-Kong put together. The last panel shows that FCS in
India are even more irrelevant once we control for country size.
In brief, the general view of China and India as major destinations for foreign
capital can be deceptive. When looking at stocks, we observe that India is still far from
the major Latin American economies. China on the other hand, has a larger level of
capital stocks than these economies, although this is not the case when we restrict the
source countries to the OECD or the U.S. In fact, Latin American countries have large
FCS than China and India relative to their size. Finally, it is important to notice that
stocks in China are particularly large in the manufacturing sector, whereas stocks in India
are relatively smaller in the manufacturing sector. However, the snapshot of the relative
FCS position in 2003 hides important over-time trends, as discussed in the following
section.
4. Evolution of the FCS between 1990 and 2003
This section analyzes the evolution of FCS in Latin America relative to those in
China, China and Hong-Kong, and India. More specifically, we calculated these relative
stocks as:
j
i
j
i
FCSFCS
FCSFCS
90
90
03
03
,
where i stands for the Latin American countries, and j stands for China, China plus Hong-
Kong, or India. When this ratio is less than one, the relative position of host country i
9
with respect to country j was lower in 2003 than in 1990. The corresponding calculations
are reported in Table 3.
The first column of the table reports that aggregate stocks in China have grown
significantly faster than in Latin America during this period. Between 1990 and 2003
stocks in China grew two times faster than in Argentina, Chile and Colombia, three times
faster than in Brazil and Costa Rica and four times faster than in Guatemala. OECD
stocks in China also grew faster than in Latin American countries.
Column 3 shows that the fall in the relative stocks is more dramatic in the U.S.
data. For most countries, relative stocks in 2003 were less than 20 percent of its 1990
level. In Brazil, Colombia, and Costa Rica the ratios are below 0.1. This reveals that U.S.
stocks in China caught up with those in Latin American countries. The relative decline
was particularly remarkable in the manufacturing sector. Relative stocks in this sector in
the major countries declined the most: stocks in Brazil, Mexico, Argentina, and Colombia
were at 5 percent or less than its 1990 levels. Again, this reflects that China is relative
more attractive to capital in the manufacturing sector.
The second panel in the table displays the changes in the stocks relative to those
in China and Hong-Kong. Column 5 shows that aggregate relative stocks in China and
Hong-Kong grew faster than in most Latin American countries. However, this pattern is
reversed when we focus on the stocks from OECD. Most countries from Latin America
accumulated more stocks from the OECD than China and Hong-Kong during this period.
In fact, only in Brazil and Guatemala the relative stocks from the OECD turn out to be
smaller in 2003 than in 1990.
10
Column 7 shows results for the U.S. data. Again we find that stocks in China and
Hong-Kong grew faster than in most Latin American countries. In the manufacturing
sector, the ratios are significantly smaller than in China, suggesting that most of the
growth in the manufacturing stocks in China and Hong-Kong was due to FDI in mainland
china gather than Hong-Kong.
Finally, the last panel of Table 3 reports the results relative to India. Not one of
the Latin American countries accumulated more stocks than India during the period.
Indeed, Latin American total stocks relative to India fell even more than those relative to
China. Unlike those of China, however, these ratios are significantly bigger when we
repeat the exercise with the stocks from the OECD.
U.S. stocks in India also grew faster than in Latin American countries. Contrary to
what happened with China, it is interesting that this growth was less pronounced in the
manufacturing sector. The most remarkable example is that of Chile, where total stocks
relative to India in 2003 were about one third of those in 1990 but were 37 percent bigger
in the manufacturing sector.
It is interesting to estimate the share of these variations explained by GDP growth.
We do this by normalizing the FCS by the GDP and Value Added in Manufacturing
before calculating the ratios of the relative stocks between 2003 and 1990. The results are
reported in Table 4. The first panel of the table shows the results for China. FCS in China
grew more than in Latin America even after controlling for GDP growth. Although the
ratios are still less than one, they are significantly higher than those in Table 3, reflecting
that GDP growth was faster in China than in Latin American countries. FCS in India also
grew more than in Latin America, even after normalizing by the GDP growth.
11
In summary, we find that Latin American stocks were smaller relatively to those
of China and India in 2003 than in 1990, even after controlling for GDP growth. This is
less true when we consider China and Hong-Kong as one economy. Nevertheless, there
are significant differences among source and host countries: whereas in China stocks
from the U.S. and the OECD grew relatively faster, aggregate stocks grew faster in India.
Another interesting aspect when comparing the growth of the stocks in China and India is
that U.S. stocks in China grew more in the manufacturing sector, whereas U.S. stocks in
India grew more in the aggregate.
5. Evolution of relative FCS between 1997 and 2003
To get a clearer picture of the evolution of the relative stocks over time we repeat
the exercise using 1997 as a benchmark year. Table 5 reports the ratios of the relative
stocks in 2003 divided by those in 1997.
The results are quite surprising. Column 1 shows that aggregate stocks in most
Latin American countries grew faster than in China: only Argentina and Colombia
accumulated fewer stocks during this period. What is perhaps more unexpected is that the
major winners are Central American countries: between 1997 and 2003, FDI stocks grew
4 times faster in El Salvador than in China, and about two times faster in Mexico and
Costa Rica. Stocks in Brazil, Chile, Guatemala and Venezuela also increased more than
in China during this period.
Chinese stocks from the OECD did not grow faster than those in Latin American
countries. The second column shows that in general stocks in China and Latin America
12
grew at similar rates since 1997. Argentina, El Salvador and Mexico actually
accumulated more stocks than China since this year.
We then turn to the stocks from the U.S. In this case, stocks in China increased
more rapidly than those in Latin America. This however was not the case for Mexico and
El Salvador, which once again grew faster than China. This seems to be at odds with the
perception that foreign investment in Mexico and Central America are receding because
firms are increasingly moving their production facilities to China.
Column 4 reports the ratios in the manufacturing sector. Here, we do find that
stocks in China continued to outgrow those in Latin America for the period 1997-2003.
In particular it is worth highlighting that stocks in the manufacturing sector in Mexico
relative to China were only 60 percent of its 1997 level. At the same time, relative stocks
in Argentina and Brazil were less than one fourth of their 1997 levels. It is however
important to acknowledge that even in the manufacturing sector, the growth of Chinese
FCS was not spectacular: during the same period, stocks grew faster in Chile, and at
about the same rate in Costa Rica.
The second panel exhibits the evolution of FCS relative to China plus Hong-
Kong. The ratios for the total FCS are very similar to those in China, thus indicating that
FCS in Hong-Kong and in the mainland grew at similar rates during the period. Again,
the aggregate FCS in most Latin American countries grew faster than in China plus
Hong-Kong since 1997. The results using the major OECD countries and the U.S. as the
only sources of FCS are also quite similar to those in China. Differences appear in
manufacturing-sector FCS. In this case, we find that the growth in FCS in China plus
Hong-Kong was smaller than in Chile, Costa Rica, and Venezuela.
13
Regarding FCS in India, the first column on the last panel shows that for the
aggregate they grew less than in Mexico, Costa Rica, and El Salvador. However, total
stocks in India did grow faster than in the other Latin American countries, especially than
in Argentina, Chile, and Colombia. This was also the case for the OECD stocks. Here
stocks in India increased more rapidly than in every country in our sample with the
exception of Mexico and El Salvador.
Even more than the OECD stocks, U.S. stocks in India continued to grow faster
than those in Latin American between 1997 and 2003. In this period, India accumulated
about three times more FCS from the U.S. than Argentina, Brazil, Chile, or Guatemala,
and about 5 times more than Colombia or Costa Rica. Even Mexican relative FCS were
only 0.79 of the 1997 level. Only stocks in El Salvador grew at the same rate as those in
India. Finally, when we concentrate on the manufacturing sector we find that the stocks
in India have increased more than in Latin American countries during this period.
Table 6 repeats the exercise after normalizing the FCS. Again, we find that part of
the relative growth in China FCS can be attributed to faster GDP growth. The ratios here
are much lower than those in Table 5. Total and OECD FCS in Latin American countries
grew more than in China relative to their GDP. U.S. FCS in the manufacturing sector
grew more in China than in Latin America during this period, although this growth is was
less than in Chile, Costa Rica and Venezuela. On the other hand, FCS in India grew faster
than in Latin America during this period.
In short, aggregate and OECD FCS in China did not outgrow those in Latin
America between 1997 and 2003. Even for the U.S. stocks, we find that some countries
like Mexico and El Salvador accumulated more FCS than China since 1997. Only in the
14
manufacturing sectors China accumulated more capital than most Latin American
countries, although these FCS data were significantly smaller than those reported for the
entire period. Latin American countries have in general performed better than China
relative to their lack of relative growth. India, in contrast, continued to accumulate FCS
faster than our sample of Latin American economies between 1997 and 2003.
6. Conditional relative stocks
As noted above, relative FCS trends differ across source countries, thus
suggesting that bilateral characteristics may be important in determining the allocation of
FDI. Consequently, this section analyzes trends in FCS while controlling for distance and
source-country characteristics. To deal with these issues, we use the OECD and
UNCTAD data to estimate cross sectional regressions for each year with source and host
country dummies and the bilateral distance between source and host countries14. In each
regression we exclude the dummy for China as a host country, and then interpret the
dummy-variable coefficients of the other host countries as the effect of each host country
relative to China. We then repeat the exercise excluding the dummies for China plus
Hong-Kong and India. This econometric approach is consistent with existing literature on
the determinants of FDI in developed and developing countries, which suggests that host
and source country characteristics, as well as their bilateral characteristics affect the
investment decisions of investor firms (see, for example, Carr et al. 2001, and Blonigen et
al. 2003).
14 Since we are controlling for source country fixed effects, we include all source and host countries that are available in the dataset, but exclude small host countries with populations below 500,000 people. The bilateral distance is measured in miles and was taken from Rose (2004).
15
Table 7 reports the coefficients and the confidence intervals of the dummies for
the regressions in the years 1990, 1997, and 2003. The first panel shows the results when
we exclude the dummy for China. After controlling for source-country fixed effects and
distance, Mexico no longer appears as the major destination for OECD stocks. Instead,
Brazil comes out as the major recipient in Latin America. After conditioning on distance
and source countries fixed effects, we find the dummies in 1997 decreased relative to
those in 1990. However, the relative-FCS coefficients from 1997 and 2003 are not
significantly different. This finding confirms that China has not become relatively more
attractive for OECD capital than Latin American countries since 1997. In contrast, the
relative-FCS coefficients with respect to China plus Hong-Kong and India, do not vary
significantly over time. All the coefficients for 2003 are within the confidence intervals
of the 1990 coefficients.
7. Concluding remarks
In sum, India is still far from the aggregate levels of FCS found in the major Latin
American economies, while China and Hong-Kong as a whole have had higher FCS since
1990. Regarding China, when we restrict the source countries to the OECD or the U.S.
we find that FCS in China have grown significantly faster than in Latin America between
1990 and 2003, especially those originating in the U.S. and destined to the manufacturing
sectors of host countries. Nevertheless, this relative growth has been less evident since
1997. From this year on, we find that China accumulated more FCS than Latin American
countries only in the manufacturing sector. Even here, U.S. stocks in China did not grow
faster than in Chile or Costa Rica. At the same time, stocks in India increased more than
16
in Latin America in both periods. This was true both for stocks originating in the OECD
and in the U.S., but their growth were less significant than that of China between 1990
and 1997.
After controlling for shocks emanating from source countries and bilateral
distance between source and host countries, the OECD data suggest that the significant
change in Latin America’s FCS relative to China occurred between 1990 and 1997.
However, even this econometric analysis is silent with respect to any substitution effects
that might have affected Latin America’s FCS positions. That is, further econometric
analyses are needed to directly test the hypothesis that changes in Chinese and/or Indian
FCS positions were associated with changes in Latin American FCS levels, as has been
attempted by Eichengreen and Tong (2005) and Cravino, Lederman, and Olarreaga
(forthcoming), among others. In any case, the data and the findings of this paper suggest
that the threat from China and India in terms of FDI might be the dog that did not bark.
17
References
Blonigen, Bruce, Ronald B. Davies, and Keith Head. 2003. “Estimating the knowledge-
Capital Model of the Multinational enterprise: Comment.” American Economic
Review 93: 980-994.
Carr, David L., James R. Markusen, and Keith E. Maskus. 2001. “Estimating the
Knowledge-Capital Model of the Multinational Enterprise.” American Economic
Review 91: 693-708.
Chantasasawat, B, K.C. Fung, H. Lizaka, and A. Siu. 2005. “FDI flows to Latin America,
East and Southeast Asia and China: Substitutes or Complements?” Working Paper
595, Department of Economics, University of California, Santa Cruz.
Cravino, Javier, Daniel Lederman, and Marcelo Olarreaga, [2006], Forthcoming.
Eichengreen, Barry, and Hui Tong. 2005. “Is China FDI Coming at the Expense of Other
Countries?” NBER Working Paper 11335, Cambridge, Massachusetts.
Garcia-Herrero, Alicia, and Daniel Santabárbara. 2005. “Does China Have an Impact on
Foreign Direct Investment to Latin America?” Working Paper 0517, Bank of
Spain, Madrid.
IADB [Inter-American Development Bank]. 2004. The Emergence of China:
Opportunities and Challenges for Latin America and the Caribbean.
Rose, Andrew K. 2004. “Does the WTO Make Trade More Stable?” NBER Working
Paper 10207, Cambridge, Massachusetts.
UNCTAD [United Nations Conference on Trade and Development]. 2004. World
Investment Directory. Geneva and New York: United Nations.
UNCTAD. 2005. World Investment Report. Geneva and New York: United Nations.
18

19
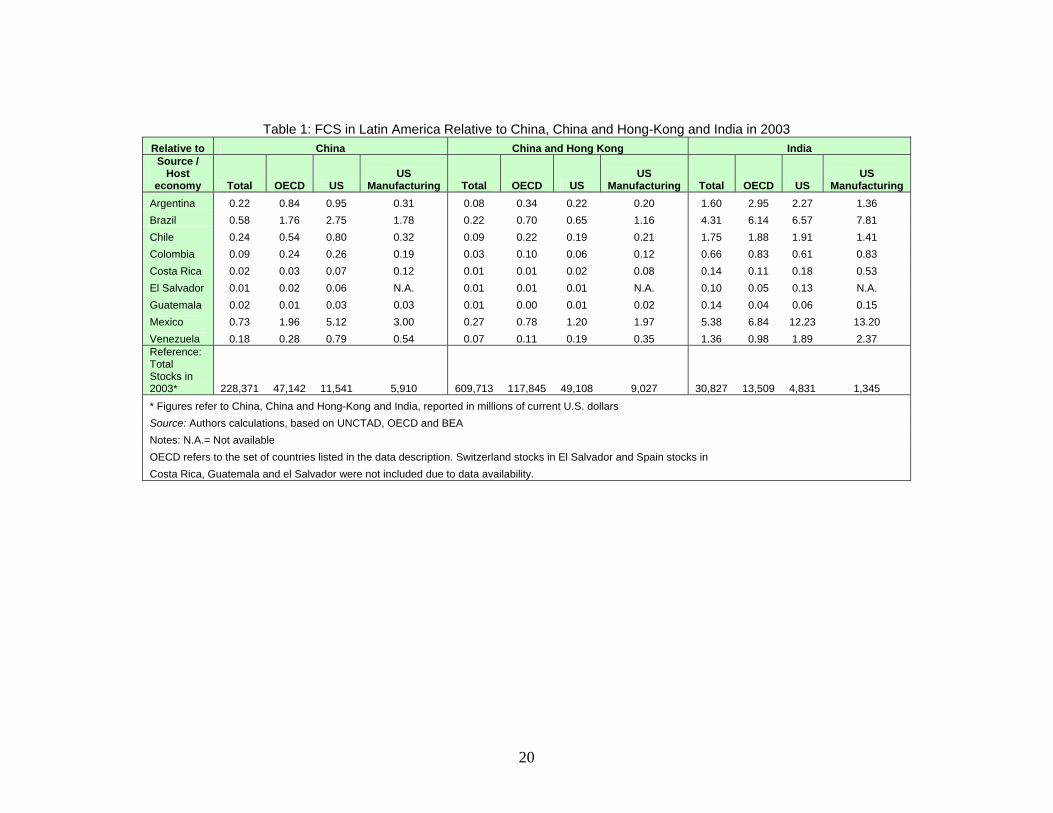
Table 1: FCS in Latin America Relative to China, China and Hong-Kong and India in 2003 Relative to China China and Hong Kong India
Source / Host
economy Total OECD US US
Manufacturing Total OECD US US
Manufacturing Total OECD US US
Manufacturing Argentina 0.22 0.84 0.95 0.31 0.08 0.34 0.22 0.20 1.60 2.95 2.27 1.36 Brazil 0.58 1.76 2.75 1.78 0.22 0.70 0.65 1.16 4.31 6.14 6.57 7.81 Chile 0.24 0.54 0.80 0.32 0.09 0.22 0.19 0.21 1.75 1.88 1.91 1.41 Colombia 0.09 0.24 0.26 0.19 0.03 0.10 0.06 0.12 0.66 0.83 0.61 0.83 Costa Rica 0.02 0.03 0.07 0.12 0.01 0.01 0.02 0.08 0.14 0.11 0.18 0.53 El Salvador 0.01 0.02 0.06 N.A. 0.01 0.01 0.01 N.A. 0.10 0.05 0.13 N.A. Guatemala 0.02 0.01 0.03 0.03 0.01 0.00 0.01 0.02 0.14 0.04 0.06 0.15 Mexico 0.73 1.96 5.12 3.00 0.27 0.78 1.20 1.97 5.38 6.84 12.23 13.20 Venezuela 0.18 0.28 0.79 0.54 0.07 0.11 0.19 0.35 1.36 0.98 1.89 2.37 Reference: Total Stocks in 2003* 228,371 47,142 11,541 5,910 609,713 117,845 49,108 9,027 30,827 13,509 4,831 1,345
* Figures refer to China, China and Hong-Kong and India, reported in millions of current U.S. dollars Source: Authors calculations, based on UNCTAD, OECD and BEA Notes: N.A.= Not available OECD refers to the set of countries listed in the data description. Switzerland stocks in El Salvador and Spain stocks in Costa Rica, Guatemala and el Salvador were not included due to data availability.
20
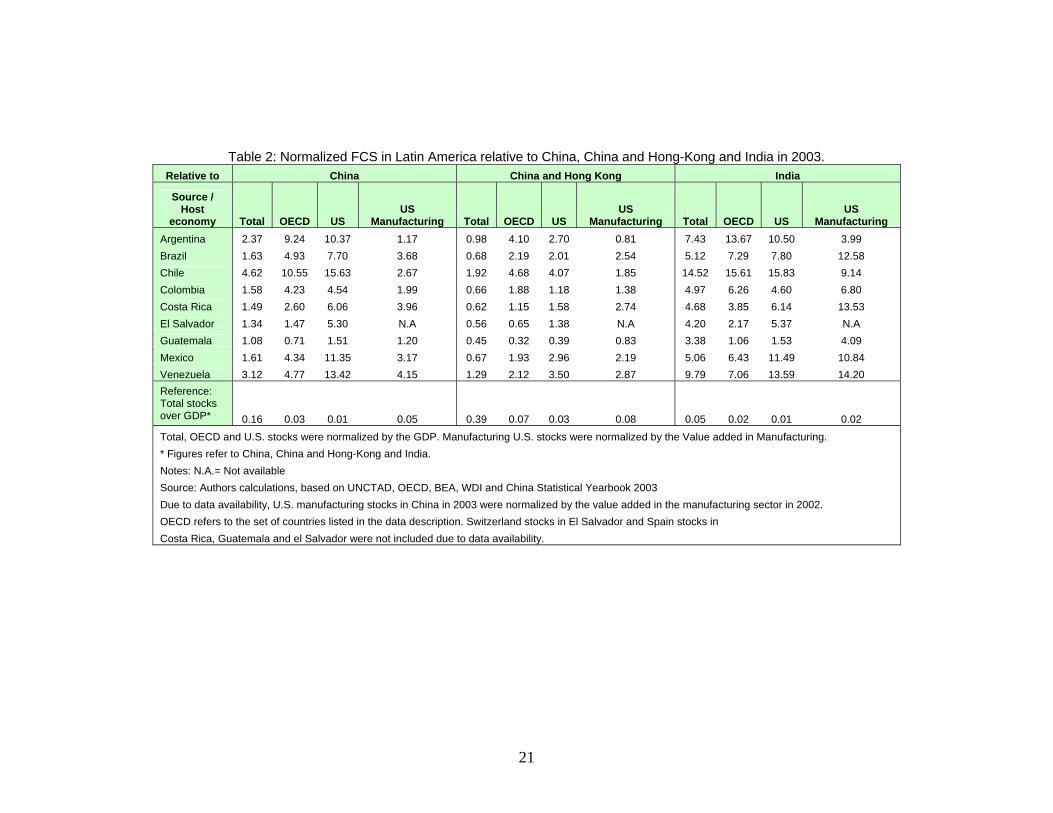
Table 2: Normalized FCS in Latin America relative to China, China and Hong-Kong and India in 2003. Relative to China China and Hong Kong India
Source / Host
economy Total OECD US US
Manufacturing Total OECD US US
Manufacturing Total OECD US US
Manufacturing Argentina 2.37 9.24 10.37 1.17 0.98 4.10 2.70 0.81 7.43 13.67 10.50 3.99 Brazil 1.63 4.93 7.70 3.68 0.68 2.19 2.01 2.54 5.12 7.29 7.80 12.58 Chile 4.62 10.55 15.63 2.67 1.92 4.68 4.07 1.85 14.52 15.61 15.83 9.14 Colombia 1.58 4.23 4.54 1.99 0.66 1.88 1.18 1.38 4.97 6.26 4.60 6.80 Costa Rica 1.49 2.60 6.06 3.96 0.62 1.15 1.58 2.74 4.68 3.85 6.14 13.53 El Salvador 1.34 1.47 5.30 N.A 0.56 0.65 1.38 N.A 4.20 2.17 5.37 N.A Guatemala 1.08 0.71 1.51 1.20 0.45 0.32 0.39 0.83 3.38 1.06 1.53 4.09 Mexico 1.61 4.34 11.35 3.17 0.67 1.93 2.96 2.19 5.06 6.43 11.49 10.84 Venezuela 3.12 4.77 13.42 4.15 1.29 2.12 3.50 2.87 9.79 7.06 13.59 14.20 Reference: Total stocks over GDP* 0.16 0.03 0.01 0.05 0.39 0.07 0.03 0.08 0.05 0.02 0.01 0.02 Total, OECD and U.S. stocks were normalized by the GDP. Manufacturing U.S. stocks were normalized by the Value added in Manufacturing. * Figures refer to China, China and Hong-Kong and India. Notes: N.A.= Not available Source: Authors calculations, based on UNCTAD, OECD, BEA, WDI and China Statistical Yearbook 2003 Due to data availability, U.S. manufacturing stocks in China in 2003 were normalized by the value added in the manufacturing sector in 2002. OECD refers to the set of countries listed in the data description. Switzerland stocks in El Salvador and Spain stocks in Costa Rica, Guatemala and el Salvador were not included due to data availability.
21
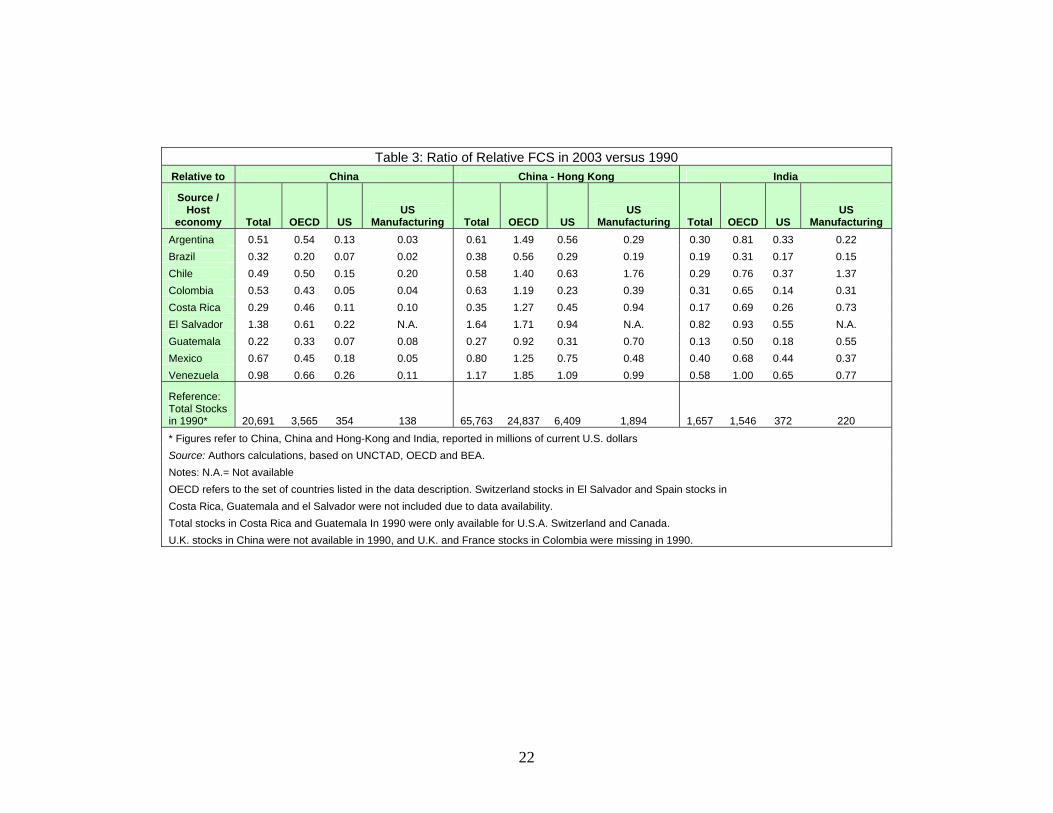
Table 3: Ratio of Relative FCS in 2003 versus 1990 Relative to China China - Hong Kong India
Source / Host
economy Total OECD US US
Manufacturing Total OECD US US
Manufacturing Total OECD US US
Manufacturing Argentina 0.51 0.54 0.13 0.03 0.61 1.49 0.56 0.29 0.30 0.81 0.33 0.22 Brazil 0.32 0.20 0.07 0.02 0.38 0.56 0.29 0.19 0.19 0.31 0.17 0.15 Chile 0.49 0.50 0.15 0.20 0.58 1.40 0.63 1.76 0.29 0.76 0.37 1.37 Colombia 0.53 0.43 0.05 0.04 0.63 1.19 0.23 0.39 0.31 0.65 0.14 0.31 Costa Rica 0.29 0.46 0.11 0.10 0.35 1.27 0.45 0.94 0.17 0.69 0.26 0.73 El Salvador 1.38 0.61 0.22 N.A. 1.64 1.71 0.94 N.A. 0.82 0.93 0.55 N.A. Guatemala 0.22 0.33 0.07 0.08 0.27 0.92 0.31 0.70 0.13 0.50 0.18 0.55 Mexico 0.67 0.45 0.18 0.05 0.80 1.25 0.75 0.48 0.40 0.68 0.44 0.37 Venezuela 0.98 0.66 0.26 0.11 1.17 1.85 1.09 0.99 0.58 1.00 0.65 0.77
Reference: Total Stocks in 1990* 20,691 3,565 354 138 65,763 24,837 6,409 1,894 1,657 1,546 372 220 * Figures refer to China, China and Hong-Kong and India, reported in millions of current U.S. dollars Source: Authors calculations, based on UNCTAD, OECD and BEA. Notes: N.A.= Not available OECD refers to the set of countries listed in the data description. Switzerland stocks in El Salvador and Spain stocks in Costa Rica, Guatemala and el Salvador were not included due to data availability. Total stocks in Costa Rica and Guatemala In 1990 were only available for U.S.A. Switzerland and Canada. U.K. stocks in China were not available in 1990, and U.K. and France stocks in Colombia were missing in 1990.
22
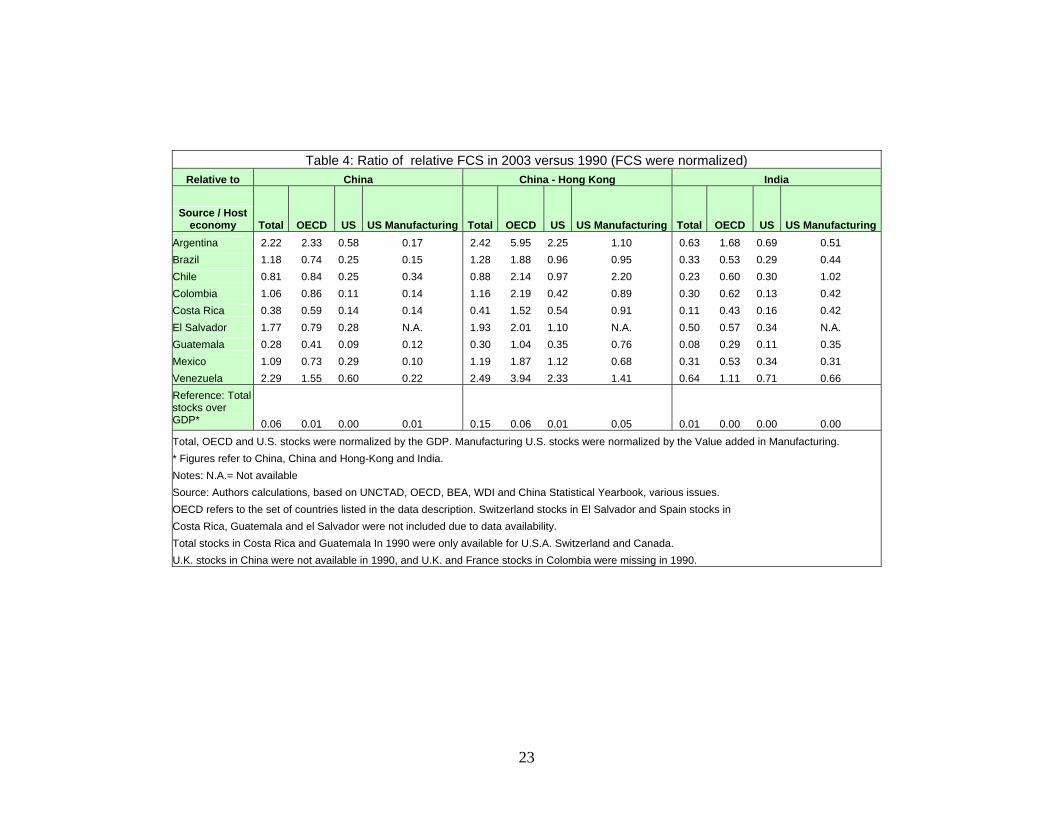
Table 4: Ratio of relative FCS in 2003 versus 1990 (FCS were normalized) Relative to China China - Hong Kong India
Source / Host economy Total OECD US US Manufacturing Total OECD US US Manufacturing Total OECD US US Manufacturing
Argentina 2.22 2.33 0.58 0.17 2.42 5.95 2.25 1.10 0.63 1.68 0.69 0.51 Brazil 1.18 0.74 0.25 0.15 1.28 1.88 0.96 0.95 0.33 0.53 0.29 0.44 Chile 0.81 0.84 0.25 0.34 0.88 2.14 0.97 2.20 0.23 0.60 0.30 1.02 Colombia 1.06 0.86 0.11 0.14 1.16 2.19 0.42 0.89 0.30 0.62 0.13 0.42 Costa Rica 0.38 0.59 0.14 0.14 0.41 1.52 0.54 0.91 0.11 0.43 0.16 0.42 El Salvador 1.77 0.79 0.28 N.A. 1.93 2.01 1.10 N.A. 0.50 0.57 0.34 N.A. Guatemala 0.28 0.41 0.09 0.12 0.30 1.04 0.35 0.76 0.08 0.29 0.11 0.35 Mexico 1.09 0.73 0.29 0.10 1.19 1.87 1.12 0.68 0.31 0.53 0.34 0.31 Venezuela 2.29 1.55 0.60 0.22 2.49 3.94 2.33 1.41 0.64 1.11 0.71 0.66 Reference: Total stocks over GDP* 0.06 0.01 0.00 0.01 0.15 0.06 0.01 0.05 0.01 0.00 0.00 0.00 Total, OECD and U.S. stocks were normalized by the GDP. Manufacturing U.S. stocks were normalized by the Value added in Manufacturing. * Figures refer to China, China and Hong-Kong and India. Notes: N.A.= Not available Source: Authors calculations, based on UNCTAD, OECD, BEA, WDI and China Statistical Yearbook, various issues. OECD refers to the set of countries listed in the data description. Switzerland stocks in El Salvador and Spain stocks in Costa Rica, Guatemala and el Salvador were not included due to data availability. Total stocks in Costa Rica and Guatemala In 1990 were only available for U.S.A. Switzerland and Canada. U.K. stocks in China were not available in 1990, and U.K. and France stocks in Colombia were missing in 1990.
23
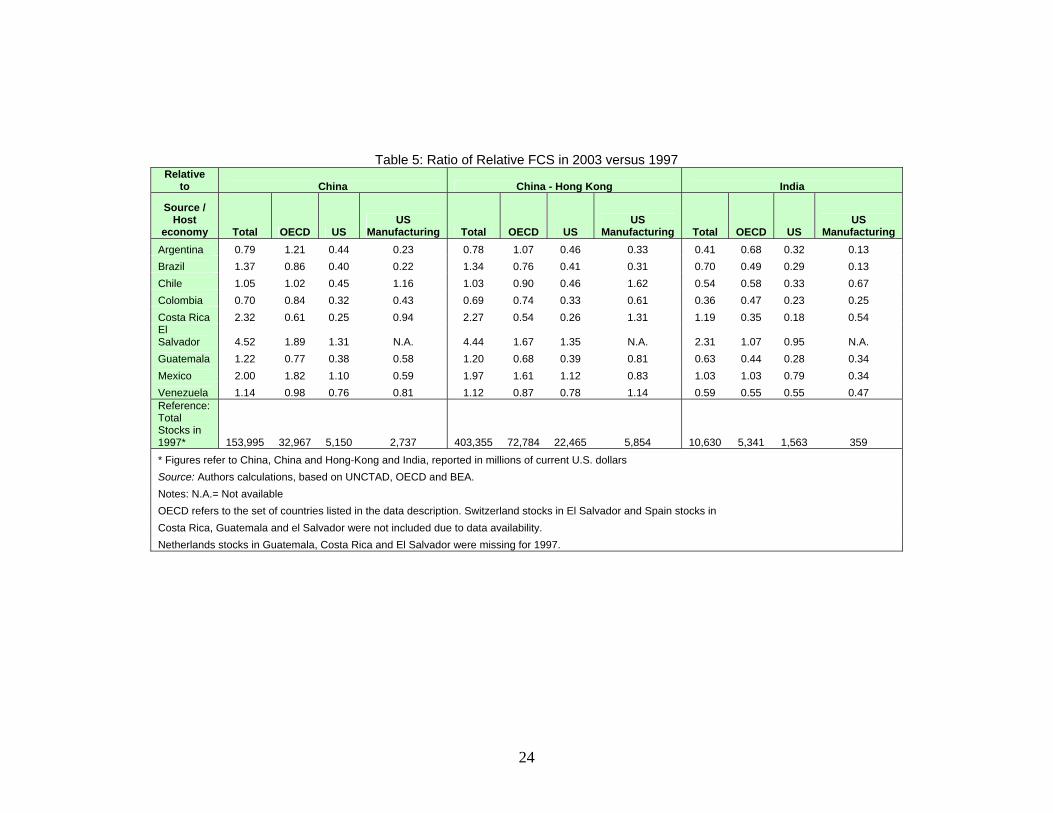
Table 5: Ratio of Relative FCS in 2003 versus 1997 Relative
to China China - Hong Kong India
Source / Host
economy Total OECD US US
Manufacturing Total OECD US US
Manufacturing Total OECD US US
Manufacturing Argentina 0.79 1.21 0.44 0.23 0.78 1.07 0.46 0.33 0.41 0.68 0.32 0.13 Brazil 1.37 0.86 0.40 0.22 1.34 0.76 0.41 0.31 0.70 0.49 0.29 0.13 Chile 1.05 1.02 0.45 1.16 1.03 0.90 0.46 1.62 0.54 0.58 0.33 0.67 Colombia 0.70 0.84 0.32 0.43 0.69 0.74 0.33 0.61 0.36 0.47 0.23 0.25 Costa Rica 2.32 0.61 0.25 0.94 2.27 0.54 0.26 1.31 1.19 0.35 0.18 0.54 El Salvador 4.52 1.89 1.31 N.A. 4.44 1.67 1.35 N.A. 2.31 1.07 0.95 N.A. Guatemala 1.22 0.77 0.38 0.58 1.20 0.68 0.39 0.81 0.63 0.44 0.28 0.34 Mexico 2.00 1.82 1.10 0.59 1.97 1.61 1.12 0.83 1.03 1.03 0.79 0.34 Venezuela 1.14 0.98 0.76 0.81 1.12 0.87 0.78 1.14 0.59 0.55 0.55 0.47 Reference: Total Stocks in 1997* 153,995 32,967 5,150 2,737 403,355 72,784 22,465 5,854 10,630 5,341 1,563 359 * Figures refer to China, China and Hong-Kong and India, reported in millions of current U.S. dollars Source: Authors calculations, based on UNCTAD, OECD and BEA. Notes: N.A.= Not available OECD refers to the set of countries listed in the data description. Switzerland stocks in El Salvador and Spain stocks in Costa Rica, Guatemala and el Salvador were not included due to data availability. Netherlands stocks in Guatemala, Costa Rica and El Salvador were missing for 1997.
24
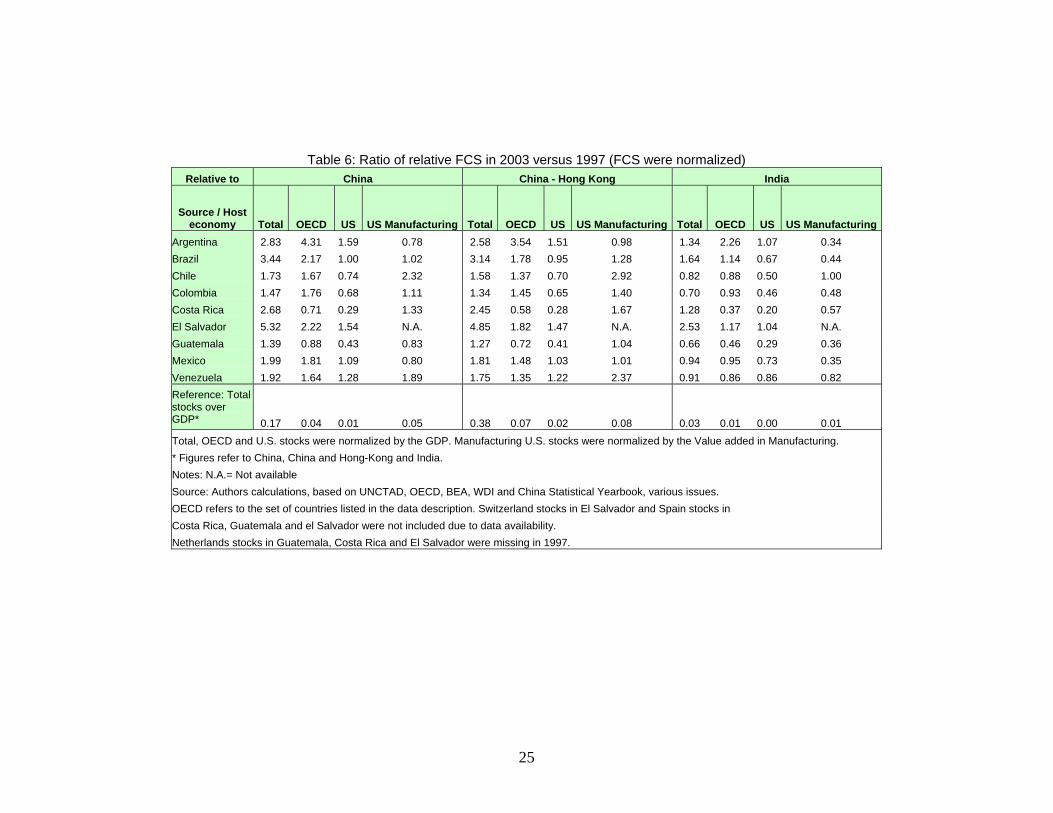
Table 6: Ratio of relative FCS in 2003 versus 1997 (FCS were normalized) Relative to China China - Hong Kong India
Source / Host economy Total OECD US US Manufacturing Total OECD US US Manufacturing Total OECD US US Manufacturing
Argentina 2.83 4.31 1.59 0.78 2.58 3.54 1.51 0.98 1.34 2.26 1.07 0.34 Brazil 3.44 2.17 1.00 1.02 3.14 1.78 0.95 1.28 1.64 1.14 0.67 0.44 Chile 1.73 1.67 0.74 2.32 1.58 1.37 0.70 2.92 0.82 0.88 0.50 1.00 Colombia 1.47 1.76 0.68 1.11 1.34 1.45 0.65 1.40 0.70 0.93 0.46 0.48 Costa Rica 2.68 0.71 0.29 1.33 2.45 0.58 0.28 1.67 1.28 0.37 0.20 0.57 El Salvador 5.32 2.22 1.54 N.A. 4.85 1.82 1.47 N.A. 2.53 1.17 1.04 N.A. Guatemala 1.39 0.88 0.43 0.83 1.27 0.72 0.41 1.04 0.66 0.46 0.29 0.36 Mexico 1.99 1.81 1.09 0.80 1.81 1.48 1.03 1.01 0.94 0.95 0.73 0.35 Venezuela 1.92 1.64 1.28 1.89 1.75 1.35 1.22 2.37 0.91 0.86 0.86 0.82 Reference: Total stocks over GDP* 0.17 0.04 0.01 0.05 0.38 0.07 0.02 0.08 0.03 0.01 0.00 0.01 Total, OECD and U.S. stocks were normalized by the GDP. Manufacturing U.S. stocks were normalized by the Value added in Manufacturing. * Figures refer to China, China and Hong-Kong and India. Notes: N.A.= Not available Source: Authors calculations, based on UNCTAD, OECD, BEA, WDI and China Statistical Yearbook, various issues. OECD refers to the set of countries listed in the data description. Switzerland stocks in El Salvador and Spain stocks in Costa Rica, Guatemala and el Salvador were not included due to data availability. Netherlands stocks in Guatemala, Costa Rica and El Salvador were missing in 1997.
25
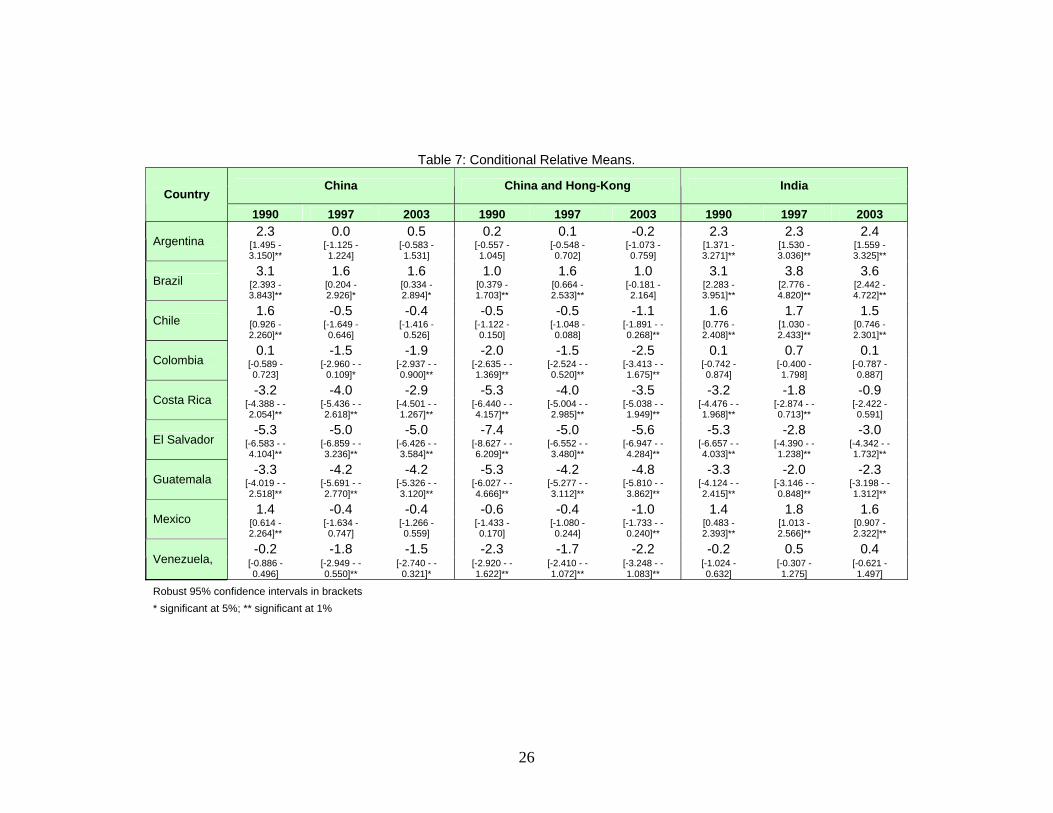
Table 7: Conditional Relative Means.
China China and Hong-Kong India Country
1990 1997 2003 1990 1997 2003 1990 1997 2003 2.3 0.0 0.5 0.2 0.1 -0.2 2.3 2.3 2.4
Argentina [1.495 - 3.150]**
[-1.125 - 1.224]
[-0.583 - 1.531]
[-0.557 - 1.045]
[-0.548 - 0.702]
[-1.073 - 0.759]
[1.371 - 3.271]**
[1.530 - 3.036]**
[1.559 - 3.325]**
3.1 1.6 1.6 1.0 1.6 1.0 3.1 3.8 3.6 Brazil [2.393 -
3.843]** [0.204 - 2.926]*
[0.334 - 2.894]*
[0.379 - 1.703]**
[0.664 - 2.533]**
[-0.181 - 2.164]
[2.283 - 3.951]**
[2.776 - 4.820]**
[2.442 - 4.722]**
1.6 -0.5 -0.4 -0.5 -0.5 -1.1 1.6 1.7 1.5 Chile [0.926 -
2.260]** [-1.649 - 0.646]
[-1.416 - 0.526]
[-1.122 - 0.150]
[-1.048 - 0.088]
[-1.891 - -0.268]**
[0.776 - 2.408]**
[1.030 - 2.433]**
[0.746 - 2.301]**
0.1 -1.5 -1.9 -2.0 -1.5 -2.5 0.1 0.7 0.1 Colombia [-0.589 -
0.723] [-2.960 - -
0.109]* [-2.937 - -0.900]**
[-2.635 - -1.369]**
[-2.524 - -0.520]**
[-3.413 - -1.675]**
[-0.742 - 0.874]
[-0.400 - 1.798]
[-0.787 - 0.887]
-3.2 -4.0 -2.9 -5.3 -4.0 -3.5 -3.2 -1.8 -0.9 Costa Rica [-4.388 - -
2.054]** [-5.436 - -2.618]**
[-4.501 - -1.267]**
[-6.440 - -4.157]**
[-5.004 - -2.985]**
[-5.038 - -1.949]**
[-4.476 - -1.968]**
[-2.874 - -0.713]**
[-2.422 - 0.591]
-5.3 -5.0 -5.0 -7.4 -5.0 -5.6 -5.3 -2.8 -3.0 El Salvador [-6.583 - -
4.104]** [-6.859 - -3.236]**
[-6.426 - -3.584]**
[-8.627 - -6.209]**
[-6.552 - -3.480]**
[-6.947 - -4.284]**
[-6.657 - -4.033]**
[-4.390 - -1.238]**
[-4.342 - -1.732]**
-3.3 -4.2 -4.2 -5.3 -4.2 -4.8 -3.3 -2.0 -2.3 Guatemala [-4.019 - -
2.518]** [-5.691 - -2.770]**
[-5.326 - -3.120]**
[-6.027 - -4.666]**
[-5.277 - -3.112]**
[-5.810 - -3.862]**
[-4.124 - -2.415]**
[-3.146 - -0.848]**
[-3.198 - -1.312]**
1.4 -0.4 -0.4 -0.6 -0.4 -1.0 1.4 1.8 1.6 Mexico [0.614 -
2.264]** [-1.634 - 0.747]
[-1.266 - 0.559]
[-1.433 - 0.170]
[-1.080 - 0.244]
[-1.733 - -0.240]**
[0.483 - 2.393]**
[1.013 - 2.566]**
[0.907 - 2.322]**
-0.2 -1.8 -1.5 -2.3 -1.7 -2.2 -0.2 0.5 0.4 Venezuela, [-0.886 -
0.496] [-2.949 - -0.550]**
[-2.740 - -0.321]*
[-2.920 - -1.622]**
[-2.410 - -1.072]**
[-3.248 - -1.083]**
[-1.024 - 0.632]
[-0.307 - 1.275]
[-0.621 - 1.497]
Robust 95% confidence intervals in brackets * significant at 5%; ** significant at 1%
26