Embed Size (px)
Citation preview
Foreign Ownership in the Canadian Oil Sands: A
General Equilibrium approach
Derrick Persson
Department of Economics
University of Victoria, 2013
An Extended Essay Submitted in Partial Fulfillment of the Requirements for the Degree of
Bachelor of Science, Honours
in the Department of Economics
Dr. Elisabeth Gugl, Supervisor (Department of Economics)
Dr. Pascal Courty, Honours Co-Supervisor (Department of Economics)
Dr. Herbert Schuetze, Honours Co-Supervisor (Department of Economics)
©Derrick Persson, 2013.
All rights reserved. This extended essay may not be reproduced in whole or in part, by photocopy
or other means, without the permission of the author.
1
Abstract:
In this paper a general equilibrium model approach is used to provide an economic framework to
the debate of foreign ownership in the Canadian oil sands. The concern has been raised that
inadequate benefit is distributed to domestic consumers. Generally, consumers benefit from oil
resources through the collection of royalty revenues as well as company profits. In Canada these
companies are privately owned. By examining changes in firm composition we establish that
domestic consumers benefit from increased foreign operations and are adequately compensated
through increased royalty rates.
Acknowledgements:
I would like to thank my supervisor Dr. Elisabeth Gugl for all her advice and support
throughout this entire project. She has supplied generous amounts of her time and I greatly
appreciate all the help she has given me. It has been an honour to work with her. I would also
like to thank Dr. Pascal Courty and Dr. Herbert Schuetze for providing a stimulating
environment and their helpful feedback throughout the year. Finally, I would like to congratulate
my fellow honours students and thank them for a great year.
2
Contents
1. Introduction: ......................................................................................................................................... 3
2. Previous Literature: ............................................................................................................................... 5
3. Public concerns: .................................................................................................................................... 7
4. Economic Model: .................................................................................................................................. 9
4.1 Overview: ...................................................................................................................................... 9
5. Results: ................................................................................................................................................ 16
5.1 Benchmark results: ..................................................................................................................... 16
5.2 No foreign firm case results: ....................................................................................................... 19
5.3 Comparing the two scenarios: .................................................................................................... 20
5.4 Global Price of Oil: ...................................................................................................................... 24
5.5 Adaptations: ................................................................................................................................ 27
5.5.1 Inclusion of externalities: .................................................................................................... 27
5.5.2 Consumer discrimination: ................................................................................................... 29
6. Discussion: .......................................................................................................................................... 31
7. Conclusion: .......................................................................................................................................... 32
8. Appendix: ............................................................................................................................................ 34
3
1. Introduction:
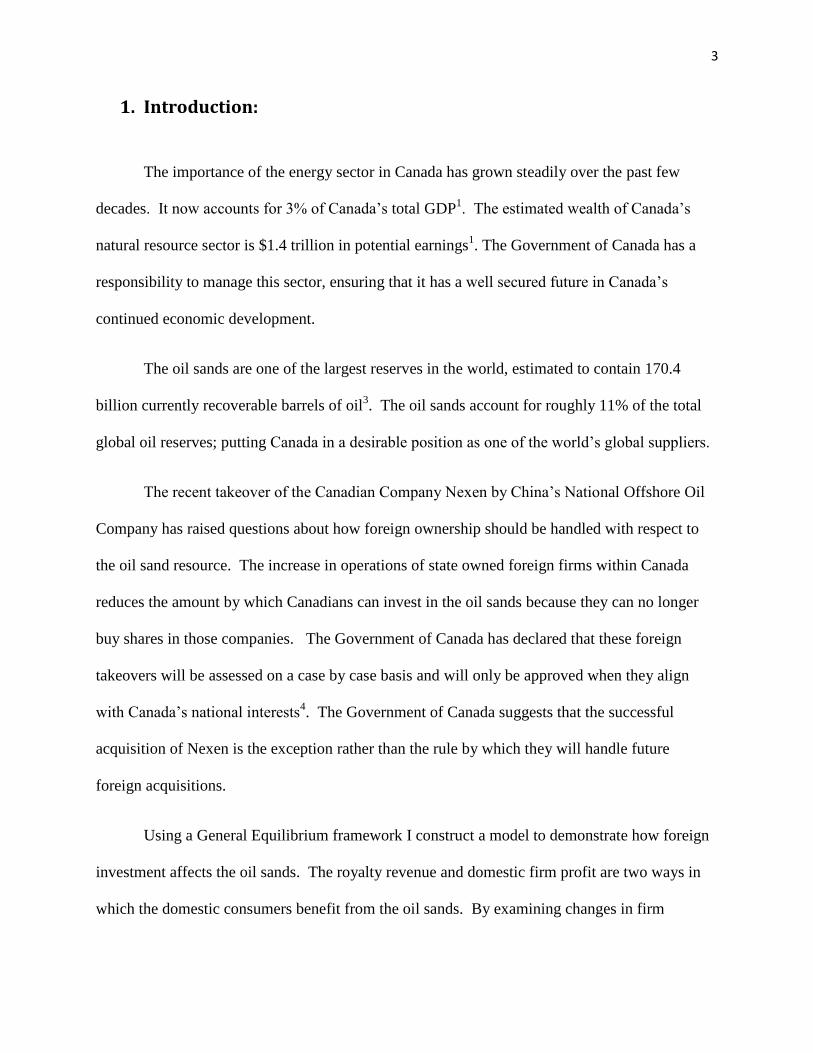
The importance of the energy sector in Canada has grown steadily over the past few
decades. It now accounts for 3% of Canada’s total GDP1. The estimated wealth of Canada’s
natural resource sector is $1.4 trillion in potential earnings1. The Government of Canada has a
responsibility to manage this sector, ensuring that it has a well secured future in Canada’s
continued economic development.
The oil sands are one of the largest reserves in the world, estimated to contain 170.4
billion currently recoverable barrels of oil3. The oil sands account for roughly 11% of the total
global oil reserves; putting Canada in a desirable position as one of the world’s global suppliers.
The recent takeover of the Canadian Company Nexen by China’s National Offshore Oil
Company has raised questions about how foreign ownership should be handled with respect to
the oil sand resource. The increase in operations of state owned foreign firms within Canada
reduces the amount by which Canadians can invest in the oil sands because they can no longer
buy shares in those companies. The Government of Canada has declared that these foreign
takeovers will be assessed on a case by case basis and will only be approved when they align
with Canada’s national interests4. The Government of Canada suggests that the successful
acquisition of Nexen is the exception rather than the rule by which they will handle future
foreign acquisitions.
Using a General Equilibrium framework I construct a model to demonstrate how foreign
investment affects the oil sands. The royalty revenue and domestic firm profit are two ways in
which the domestic consumers benefit from the oil sands. By examining changes in firm
4
composition and the resulting changes in these two factors we can determine if the domestic
consumer is better or worse off from the operation of foreign owned firms.
The model assumes open capital markets, competitive markets, and firms are profit
maximizing. Capital markets refer to the lack of restrictions on global trade and investment.
Competitive markets allow for Pareto optimal outcomes in the absence of externalities, public
goods, or asymmetric information. Profit maximizing firms are also reasonable to assume in this
model and are assumed for all scenarios.
The first case compares two scenarios. In the first scenario both domestic and foreign
private firms produce oil. In the second scenario a single domestic firm produces oil. The two
cases are compared examining the resulting impacts on the domestic consumer. The model
shows that domestic consumers are better off without the foreign firm operating within Canada
when the price of oil is endogenously determined.
The second case involved setting the price of oil fixed and comparing the same two
scenarios. This is a better representation of the world because the price of oil is set on a global
market. The model shows that the domestic consumers are worse off when foreign firms are
barred from entry.
The third case examines extensions to the model, including the addition of an external
cost associated with the production of the oil sands as well as an adaptation of Becker’s theory of
consumer discrimination.
The conclusions gathered from the model suggest that the operation of foreign owned
enterprises within Canada should not have any negative impacts upon the Canadian economy
given that the price of oil is determined globally. By reducing the amount of firms operating in
5
Canada there is a corresponding decrease in output. The decline in output leads to declining
royalty revenue because the sector is less productive. Accordingly, a lower royalty rate is
charged. The model shows that by increasing the number of firms, the royalty rate paid to
domestic consumers can adequately compensate Canadian consumers for the use of their
resource. The result being that all consumers are better off when foreign firms operate within
Canada.
2. Previous Literature:
The related literature falls into a number of categories. The first paper I examine focuses on
the fiscal resource revenue distribution within Canada. The second provides a general
background of the primary political economic concerns associated with the oil industry. The
third covers the policy framework associated with successful hydrocarbon development.
With respect to Canada in particular the first paper, “Evaluating the efficiency and equity of
Federal Fiscal Equalization,” by David Albouy (2012) evaluates the resource revenue
distribution policies active in Canada. The problem in Canada’s fiscal equalization scheme is
that the redistribution has a disproportionate focus to lower paid areas. Albouy argues that
redistribution should instead target location independent characteristics. The current
redistribution only takes into account the value of the local wage and is not adjusted to the
relative price levels of the area. The relevant insight Albouy provides is that a further problem
exists, Canada’s fiscal equalization fails to redistribute income from source based revenues, such
as oil sand royalties. This failure creates an imbalanced and inefficient outcome, resulting in an
overpopulation of the Prairie Provinces by 30%. While it is implied in my model that royalty
6
revenues will not have any adverse effects to Canadian consumers, the reality is that distribution
problems exist and can lead to inefficient outcomes.
To provide a general overview of some of the problems associated with National Oil
Companies (NOC’s) the paper, “The Rentier State and National Oil Companies: An economic
and political perspective,” by Donald Losman (2010) was examined. The rentier state is
characterised by the excessive dependence on oil revenues such that it makes up the majority of
government income. The Government primarily governs through the use of subsidies leaving
citizens untaxed. This results in an almost free reign structure, where citizens are unconcerned
about Government actions as long as the substantial benefits are still being offered. The primary
focus of NOCs in rentier states are to justify their regime, in that they try to perpetuate their
existence. Losman outlines how NOCs suffer from non-profit maximizing behaviour by
highlighting that they are political instruments. Objectives of NOC’s are often subjected to
political agenda’s which may not be in the best interest of cost minimization. The overall effect
of NOCs lead countries to pursue short-term resource rent activities over investments in
technological advances. The argument is made that more focus is put on the distribution of
resource rents than the production. This leads to insufficient economic development. The
implication for Canada is that the operation of NOCs in the oil sands may have negative
consequences for Canadians. Namely, they may pursue political objectives rather than profit
maximization ones.
A different approach using NOCs is known as the Norwegian Model. The model is
reviewed in the article, “Exporting the ‘Norwegian Model’: The effect of administrative design
on oil sector performance” by, Mark Thurber et al. (2011). The Norwegian Model is
characterized by the separation of the oil sector into 3 distinct entities. The first entity is the
7
NOC itself and carries out commercial operations. The second entity is the government ministry
responsible for the pursuit of sector goals. The third entity is an overseeing body which provides
regulation and technical advice. This segmentation allows for efficient commercial operations,
pursuit of sector goals and prevention of conflicts of interest. The creation of autonomous policy
and regulatory bodies improves the ability of Governments to monitor and benchmark the NOC
and other players in the sector thereby improving performance. The paper tests the performance
of the hydrocarbon industries in ten different countries to see if the segmentation design found in
Norway was a pre-requisite to success. Thurber finds that it is not necessary but mostly has
beneficial effects. Furthermore, the strength of the segmentation depends upon the institutional
structure within each country. Countries without structured and well developed institutions do
not benefit and in some cases actually falter from the segmentation of NOCs from policy bodies.
The conclusion is that while the Norwegian Model may be the ‘best practice’, it is not a perfect
mandate for all countries.
3. Public concerns:
In recent years there has been considerable concern raised about the development of the
oil sand resource. In addition to the environmental opposition faced there has been further
concern raised about the distribution of wealth of the oil sand resource.
The Canadian Government accounts for roughly 8% of total domestic investment in the
oil sand resource1. By contrast, in most countries with reserves a National Oil Company is
present and holds direct operations within their respective oil sectors. National Oil companies
control roughly 85% of the world’s reserves, and account for 55% of global production5.
8
National Oil Companies are generally in place to assure the country’s presence in the
development of their resource.
Usually, consumers benefit in two ways from owning oil resources. Firstly, they receive
a royalty rate from the use of the resource. Secondly, if a state owned company is operating in
the oil sector the consumers receive an increase in government funding because the profits
generated by the state owned companies are redirected to public funds. In Canada however,
there is no state owned company operating in the oil sands. The private composition of
enterprises in Canada means Canadians benefit only from the collection of royalty revenues.
Shareholders of the private companies also benefit from the profits of the companies. In Canada,
royalty rates are calculated based upon production quantities and oil prices. They are essentially
a special kind of tax in place for resources. The current framework places a maximum royalty
rate at 40%6. An independent review was done in 2007 assessing Alberta’s royalty revenue
framework and concludes that the rate should be increased to roughly 60%7. Canadians are not
receiving an equitable royalty return on the oil sands. This concern is not addressed in this paper
as it is assumed that royalty rates are set at the optimal level. Instead the focus is to establish the
effects on domestic consumers from barring the operation of foreign firms.
The foreign owned share of assets in the Canadian oil sector is roughly 27%1. This raises
concerns for Canadians about the distribution of profits from the oil sand sector. As noted
previously, Canadian citizens have become increasingly worried about the presence of foreign
owned companies operating within the oil sand resource. The operation of any company in the
natural resource sector causes a depletion of reserves. This inherently causes a depletion of a
country’s asset. This then becomes of public concern because each citizen should be entitled to
reap the benefits that result from this extraction process.
9
Domestic consumers are assumed to hold shares in the domestic private firm, while
foreign consumers are assumed to hold shares in the foreign private firm. From this division of
profit shares, we can examine if domestic consumers are better or worse off when foreign firms
are allowed to operate. The main concern of domestic consumers is that by allowing foreign
firms to operate the benefits go solely to the foreign consumers.
The model results show that these concerns are not justified. The oil sand resource
benefits from an increase in the number of firms operating within it. The royalty revenue can be
expected to increase as the number of firms increase. This is due to the increase in demand for
the resource. Domestic consumers are made better off from the operation of foreign firms if the
increase in royalty revenue offsets the decrease in domestic profits.
4. Economic Model:
4.1 Overview:
The General equilibrium model is chosen to establish the effects foreign investment has
on the overall welfare of consumers. General Equilibrium modelling uses micro foundations and
as such is appropriate to investigate changes in firm composition at the firm level.
The General Equilibrium model which I construct is a 2 good model. The good of
interest is oil represented by good X in this model. All other goods are represented by good Y.
The inputs are capital denoted K and land denoted L. The land parameter can be thought of as
the oil sand resource. Therefore the price paid to that input can be described as the royalty
revenue received from the use of the oil sands. Domestic consumers own both capital and land,
10
as the oil sand resource resides within their borders. The foreign consumers however, only have
inputs of capital. The X good requires both capital and land, whereas the Y good requires only
capital. The usual labour input is left out because it unnecessarily complicates the model.
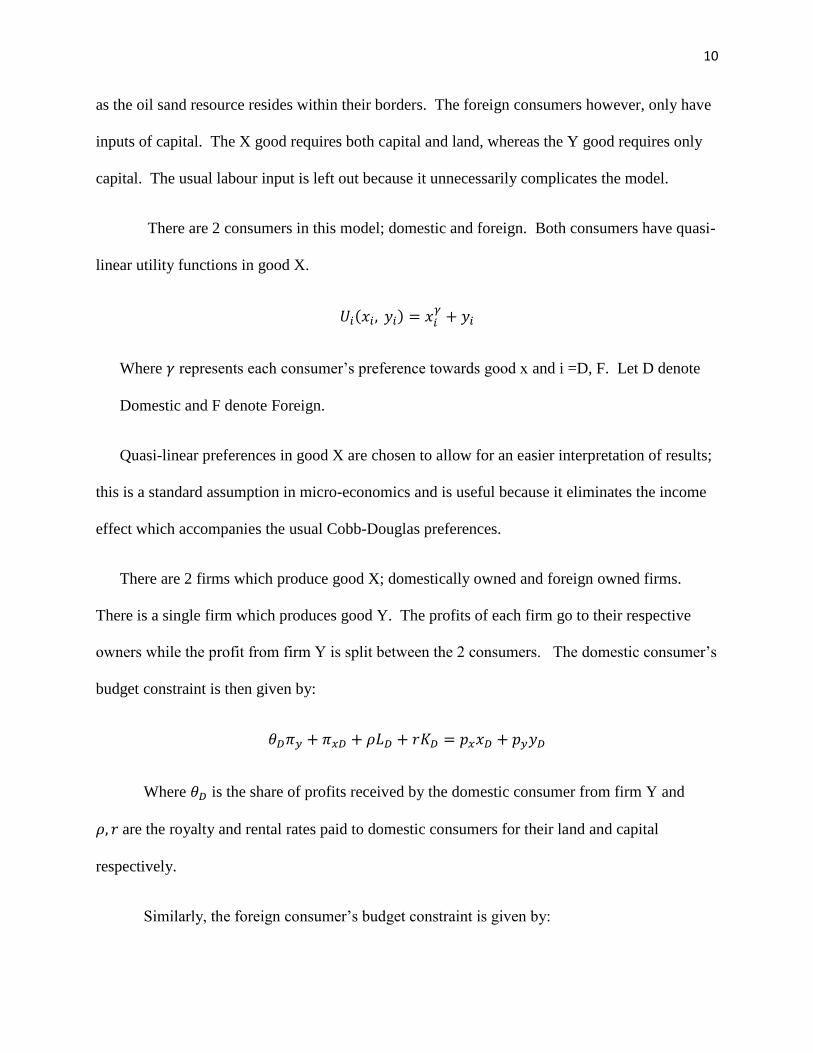
There are 2 consumers in this model; domestic and foreign. Both consumers have quasi-
linear utility functions in good X.
( )
Where represents each consumer’s preference towards good x and i =D, F. Let D denote
Domestic and F denote Foreign.
Quasi-linear preferences in good X are chosen to allow for an easier interpretation of results;
this is a standard assumption in micro-economics and is useful because it eliminates the income
effect which accompanies the usual Cobb-Douglas preferences.
There are 2 firms which produce good X; domestically owned and foreign owned firms.
There is a single firm which produces good Y. The profits of each firm go to their respective
owners while the profit from firm Y is split between the 2 consumers. The domestic consumer’s
budget constraint is then given by:
Where is the share of profits received by the domestic consumer from firm Y and
are the royalty and rental rates paid to domestic consumers for their land and capital
respectively.
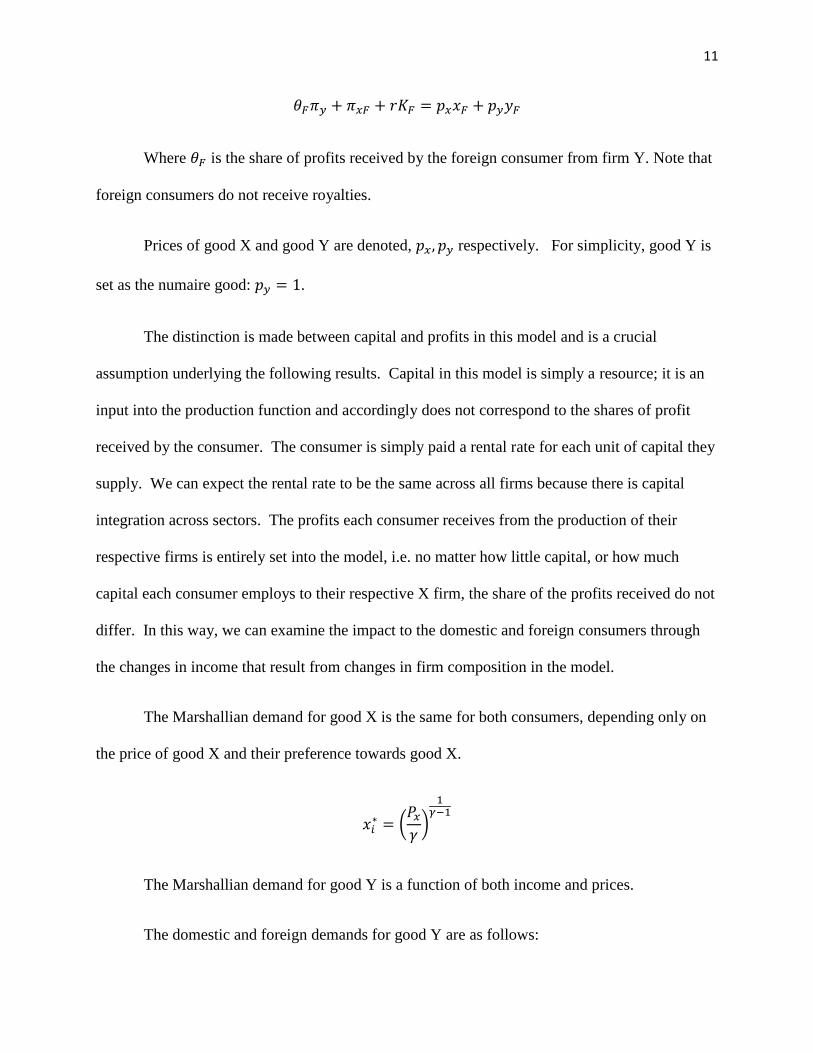
Similarly, the foreign consumer’s budget constraint is given by:
11
Where is the share of profits received by the foreign consumer from firm Y. Note that
foreign consumers do not receive royalties.
Prices of good X and good Y are denoted, respectively. For simplicity, good Y is
set as the numaire good: .
The distinction is made between capital and profits in this model and is a crucial
assumption underlying the following results. Capital in this model is simply a resource; it is an
input into the production function and accordingly does not correspond to the shares of profit
received by the consumer. The consumer is simply paid a rental rate for each unit of capital they
supply. We can expect the rental rate to be the same across all firms because there is capital
integration across sectors. The profits each consumer receives from the production of their
respective firms is entirely set into the model, i.e. no matter how little capital, or how much
capital each consumer employs to their respective X firm, the share of the profits received do not
differ. In this way, we can examine the impact to the domestic and foreign consumers through
the changes in income that result from changes in firm composition in the model.
The Marshallian demand for good X is the same for both consumers, depending only on
the price of good X and their preference towards good X.
(
)
The Marshallian demand for good Y is a function of both income and prices.
The domestic and foreign demands for good Y are as follows:
12
( )
(
)
( )
(
)
There will be different amounts of good Y demanded by each consumer because of the
different incomes they receive.
The domestic and foreign firms use Cobb-Douglas production functions with decreasing
returns to scale.
( )
Where i is indexed as before. And let . For the first case scenario
and . Firms with decreasing returns to scale in production have increasing cost
functions, accordingly a sector will produce less when there are less firms operating in that
sector. The cost function can be shown from first order conditions as:
( ) (
)
(
)
( )
Maximizing the profit function of:
( )
allows us to find the optimal level of good X supplied by each firm which is:
)(1)(1
1**
rpXX xFD
13
Each firm will produce exactly half of the production of Good X in the original
specification. Their profit can be determined by:
)(1)(1
)(1
1
1
rpxFD
Using Hotelling’s lemma the optimal amount of capital supplied to each firm is:
1
1
1
)(1
1
rpKK xFD
Likewise, the optimal amount of labour supplied to each firm is:
11
1
)(1
1
rpLL xFD
The production function of firm Y is a simple Cobb-Douglas production function,
requiring just a single input, and therefore only a single cost. With the restriction of the
exponent, .
( )
The optimal amount of capital allocated to Good Y is:
(
)
The profit of firm Y is:
(
)
14
A diagramatical specification of the different markets and how the actors within each
interact can be shown as follows:
Figure 1: Good X market structure.
15
Figure 2: Good Y market structure.
Figure 3: Land market structure.
16
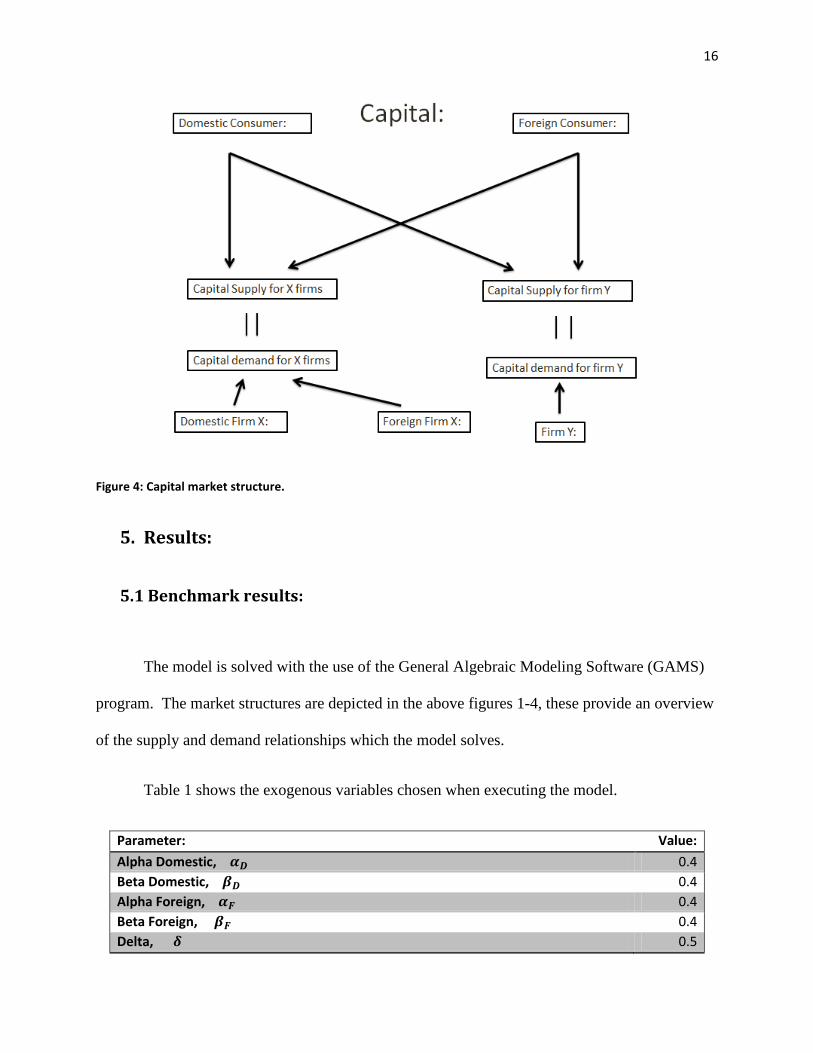
Figure 4: Capital market structure.
5. Results:
5.1 Benchmark results:
The model is solved with the use of the General Algebraic Modeling Software (GAMS)
program. The market structures are depicted in the above figures 1-4, these provide an overview
of the supply and demand relationships which the model solves.
Table 1 shows the exogenous variables chosen when executing the model.
Parameter: Value:
Alpha Domestic, 0.4
Beta Domestic, 0.4
Alpha Foreign, 0.4
Beta Foreign, 0.4
Delta, 0.5
17
Gamma Domestic, 0.5
Gamma Foreign, 0.5
Total Land supplied, ̅ 2
Capital endowment Domestic, 2
Capital endowment Foreign, 2
Share of profits from Firm Y to Domestic Consumer, 0.5
Share of profits from Firm Y to Foreign Consumers, 0.5
Table 1: Exogenous variable values specified in the model.
The results are sensitive to the parameter values chosen for the exogenous variables. The
biggest impact to the model results from exogenous changes in the parameter values of alphas,
betas, and delta. A change in these values simulates a change in technologies, or improvements
in efficiency. As such, to simulate the proposed benefits of foreign investment, the alpha and
beta foreign parameters could be increased to simulate improved technologies foreign companies
possess. They have been assumed to be the same for all examples in this model because Canada
is a developed country, and the technologies present in Canada can be expected to be similar
across firms. This specification however might be useful if this model were to be extended to
investigate a developing country.
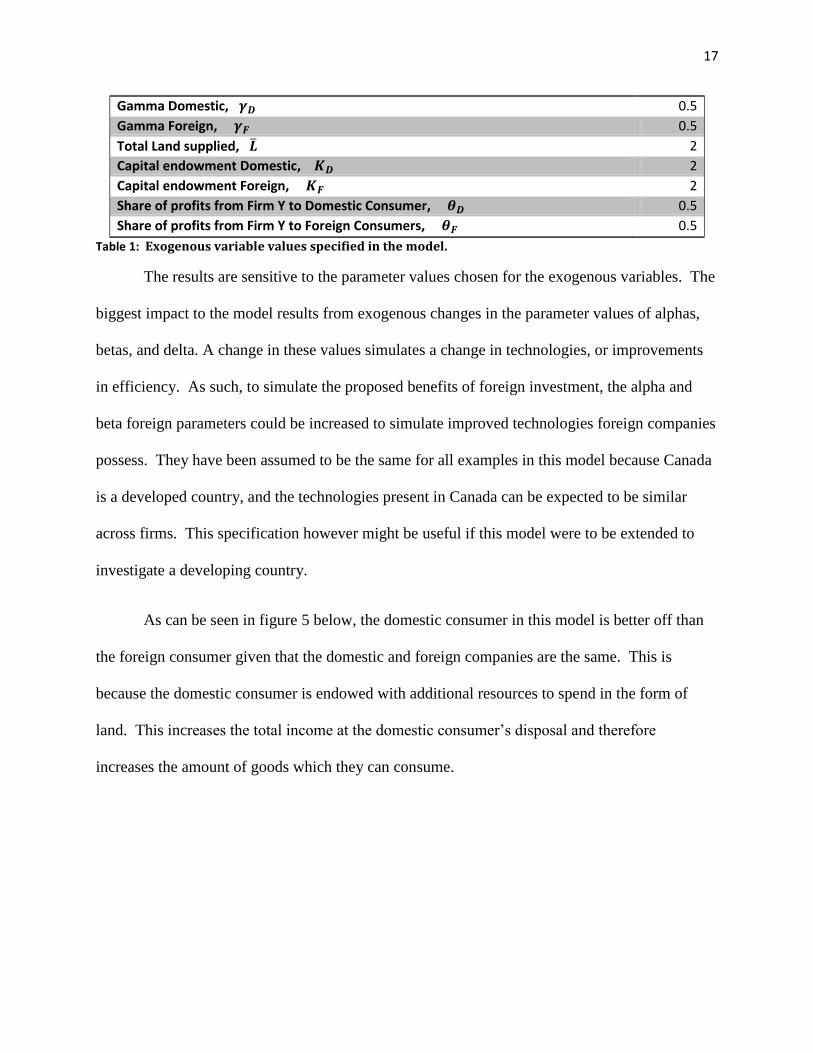
As can be seen in figure 5 below, the domestic consumer in this model is better off than
the foreign consumer given that the domestic and foreign companies are the same. This is
because the domestic consumer is endowed with additional resources to spend in the form of
land. This increases the total income at the domestic consumer’s disposal and therefore
increases the amount of goods which they can consume.
18
Figure 5: Benchmark utilities of consumers.
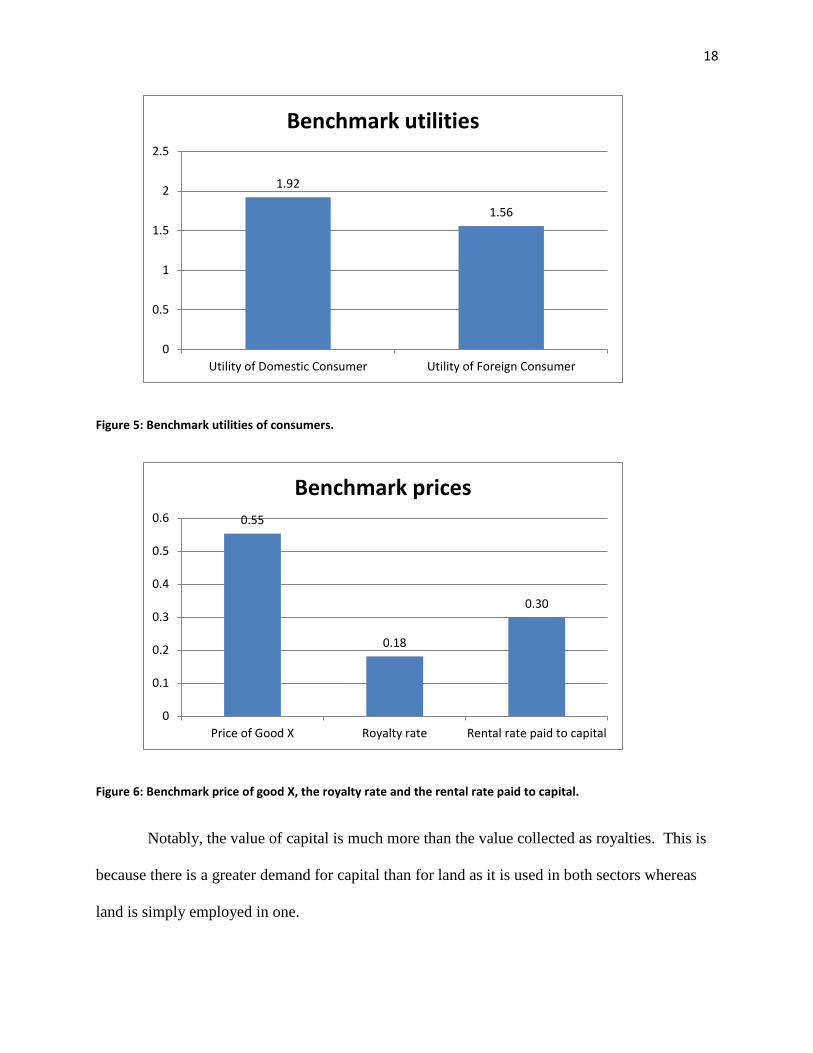
Figure 6: Benchmark price of good X, the royalty rate and the rental rate paid to capital.
Notably, the value of capital is much more than the value collected as royalties. This is
because there is a greater demand for capital than for land as it is used in both sectors whereas
land is simply employed in one.
1.92
1.56
0
0.5
1
1.5
2
2.5
Utility of Domestic Consumer Utility of Foreign Consumer
Benchmark utilities
0.55
0.18
0.30
0
0.1
0.2
0.3
0.4
0.5
0.6
Price of Good X Royalty rate Rental rate paid to capital
Benchmark prices
19
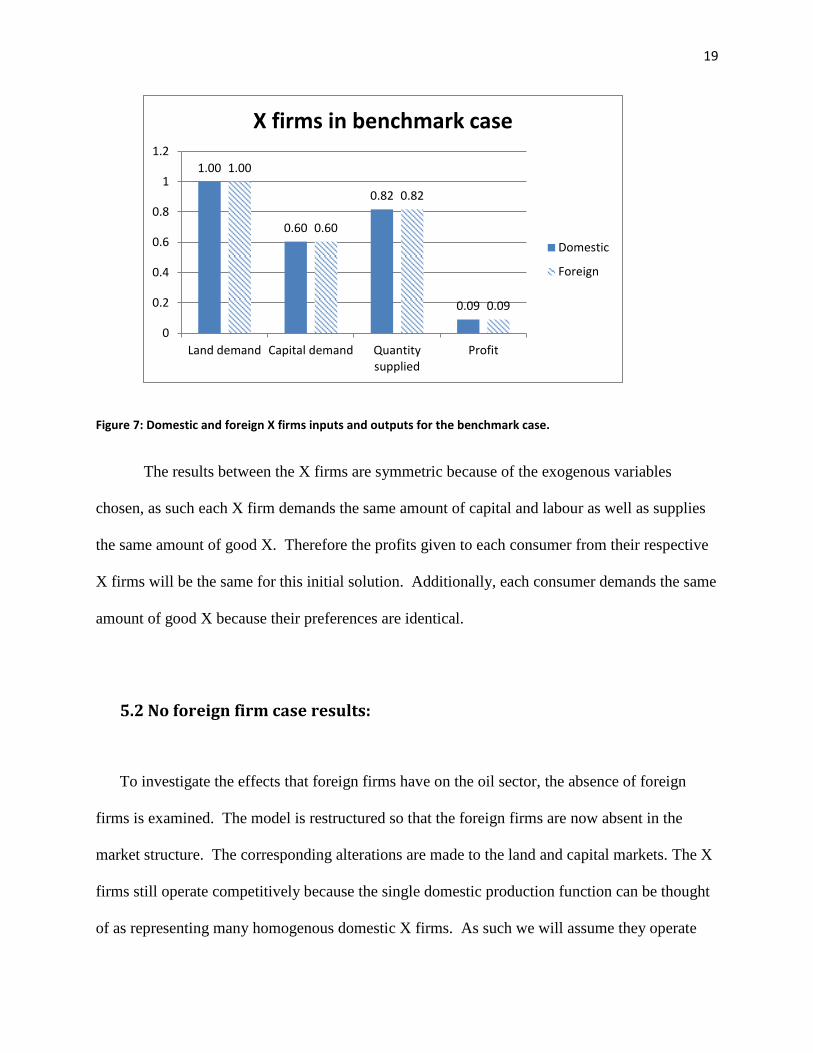
Figure 7: Domestic and foreign X firms inputs and outputs for the benchmark case.
The results between the X firms are symmetric because of the exogenous variables
chosen, as such each X firm demands the same amount of capital and labour as well as supplies
the same amount of good X. Therefore the profits given to each consumer from their respective
X firms will be the same for this initial solution. Additionally, each consumer demands the same
amount of good X because their preferences are identical.
5.2 No foreign firm case results:
To investigate the effects that foreign firms have on the oil sector, the absence of foreign
firms is examined. The model is restructured so that the foreign firms are now absent in the
market structure. The corresponding alterations are made to the land and capital markets. The X
firms still operate competitively because the single domestic production function can be thought
of as representing many homogenous domestic X firms. As such we will assume they operate
1.00
0.60
0.82
0.09
1.00
0.60
0.82
0.09
0
0.2
0.4
0.6
0.8
1
1.2
Land demand Capital demand Quantitysupplied
Profit
X firms in benchmark case
Domestic
Foreign
20
competitively without the presence of the foreign firms. This ensures an efficient use of
resources.
If it were impossible to add a foreign firm into the model, this model specification would
be Pareto efficient. All market resources are reallocated to meet the change in demand that
results from the absence of the foreign firm. The X firm still operates competitively and therefore
all resources are used efficiently. The solution meets all of the standard requirements of
efficiency, and importantly no one can be made better off by a reallocation of resources given
that it is impossible to add a foreign firm.
5.3 Comparing the two scenarios:
In order to establish the effects of changing firm composition, the two scenarios need to be
compared. The important results will be highlighted here while table 4 in the appendix will
report all value changes.
The domestic X firm now produces all of good X, but produces less than if there were two
firms as is shown in figure 8. This is a result of the model specification. Specifically the
decreasing returns to scale property in the production functions.

21
Figure 8: Quantity of X supplied across scenarios.
This is one of the driving forces behind the conclusion. The implication of this result is that
when prices are endogenously solved for the price will increase. This leads to an increase in
profits for the domestic firm through two ways. Firstly, the domestic firm captures the entire X
market. Secondly, the domestic firm charges a higher price. This greatly benefits domestic
consumers because they receive all profits from the domestic X firm.
0.82
1.38
0.82
0
0.2
0.4
0.6
0.8
1
1.2
1.4
1.6
1.8
Benchmark No foreign firm
Quantity of X supplied across scenarios
Quantity of X supplied byForeign firm X
Quantity of X supplied byDomestic firm X
22
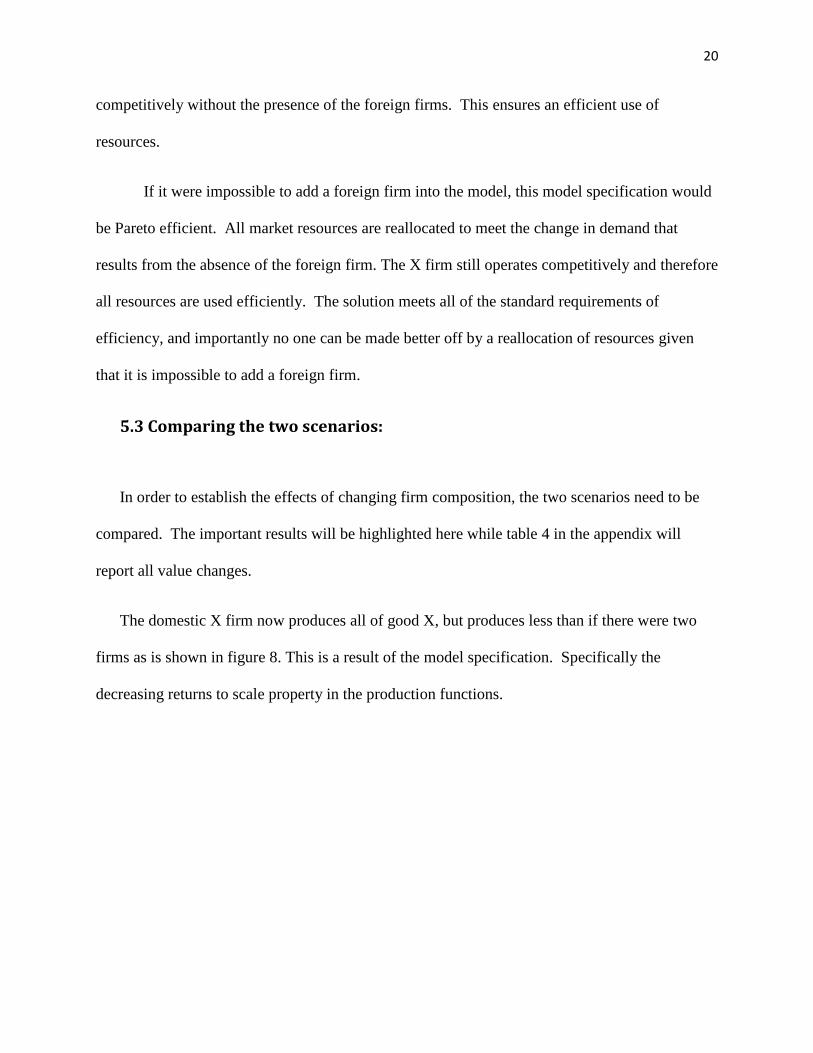
Figure 9: X firm profits across scenarios.
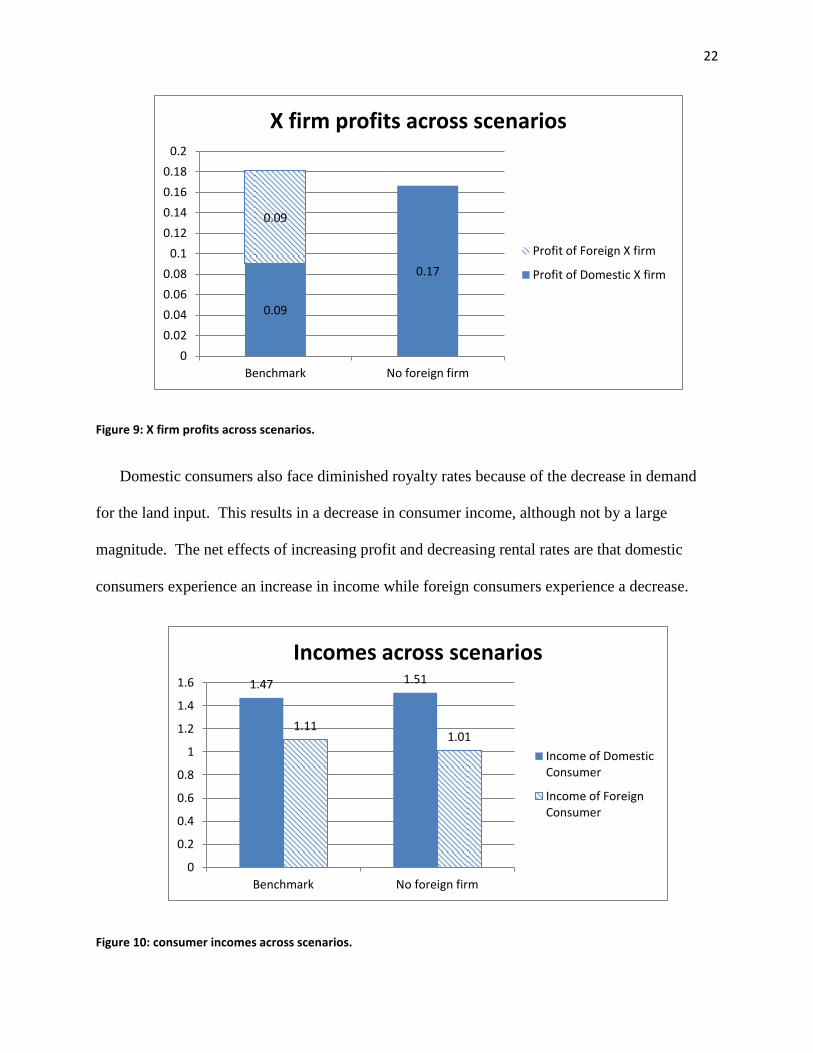
Domestic consumers also face diminished royalty rates because of the decrease in demand
for the land input. This results in a decrease in consumer income, although not by a large
magnitude. The net effects of increasing profit and decreasing rental rates are that domestic
consumers experience an increase in income while foreign consumers experience a decrease.
Figure 10: consumer incomes across scenarios.
0.09
0.17
0.09
0
0.02
0.04
0.06
0.08
0.1
0.12
0.14
0.16
0.18
0.2
Benchmark No foreign firm
X firm profits across scenarios
Profit of Foreign X firm
Profit of Domestic X firm
1.47 1.51
1.11 1.01
0
0.2
0.4
0.6
0.8
1
1.2
1.4
1.6
Benchmark No foreign firm
Incomes across scenarios
Income of DomesticConsumer
Income of ForeignConsumer
23
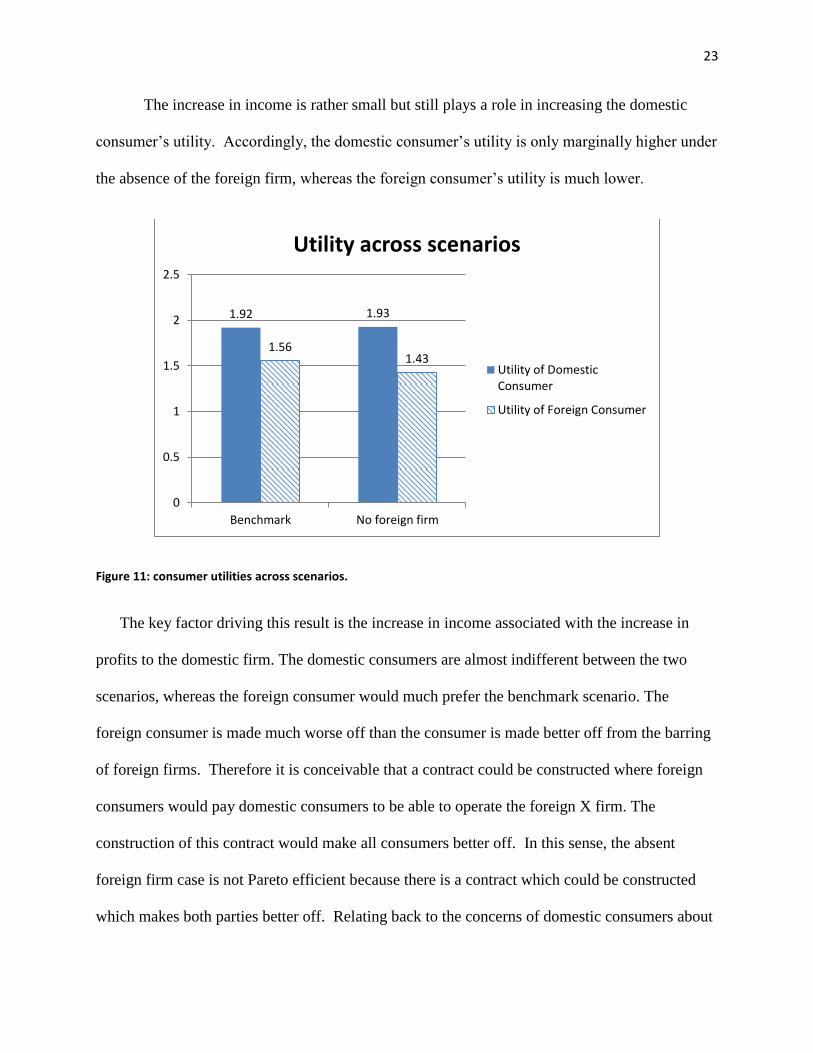
The increase in income is rather small but still plays a role in increasing the domestic
consumer’s utility. Accordingly, the domestic consumer’s utility is only marginally higher under
the absence of the foreign firm, whereas the foreign consumer’s utility is much lower.
Figure 11: consumer utilities across scenarios.
The key factor driving this result is the increase in income associated with the increase in
profits to the domestic firm. The domestic consumers are almost indifferent between the two
scenarios, whereas the foreign consumer would much prefer the benchmark scenario. The
foreign consumer is made much worse off than the consumer is made better off from the barring
of foreign firms. Therefore it is conceivable that a contract could be constructed where foreign
consumers would pay domestic consumers to be able to operate the foreign X firm. The
construction of this contract would make all consumers better off. In this sense, the absent
foreign firm case is not Pareto efficient because there is a contract which could be constructed
which makes both parties better off. Relating back to the concerns of domestic consumers about
1.92 1.93
1.56 1.43
0
0.5
1
1.5
2
2.5
Benchmark No foreign firm
Utility across scenarios
Utility of DomesticConsumer
Utility of Foreign Consumer
24
the distribution of profits received by foreign consumers, if the contracted lump sum paid to
domestic consumers is too low then domestic consumers will be better off in the absence of
foreign firms. In this sense, domestic consumers should not only be compensated for the
extraction of their resource through royal rates, but also should be paid a lump sum when foreign
firms enter into the market.
These results however, have one implicit assumption which weakens the strength of the
overall conclusion. The price of X here is endogenously solved. This means that domestic firms
benefit from the lack of X production because they receive a higher price for every unit of X
which they produce. This increase in price ultimately drives the results, increasing the profits
received by the X firm. Using the model we next examine the effects a fixed price has on
domestic consumers.
5.4 Global Price of Oil:
In the previous scenarios, the price of oil was solved endogenously. This implies that Canada
has a large enough market share to influence the price of oil. While Canada does contain a large
portion of oil reserves it is not the only country capable of supplying oil and is probably unable
to determine the price through supply decisions. A more realistic assumption is made that the
price of oil is set on a global level.
The scenarios are the same as before except the price of good X is now exogenously given.
We can assume Canada is a price taker in the supply of oil and that the price of X is determined
by the global market, i.e. Canada’s production will have no bearing on the world production
levels. As such, the decrease in firm output now will not result in an increase in price.
25
Setting the equilibrium price of good X has consequences for the solution of the model. The
good X market will no longer clear. The additional assumption is made that demand and supply
will clear on the global market, but not necessarily clear for the domestic market.
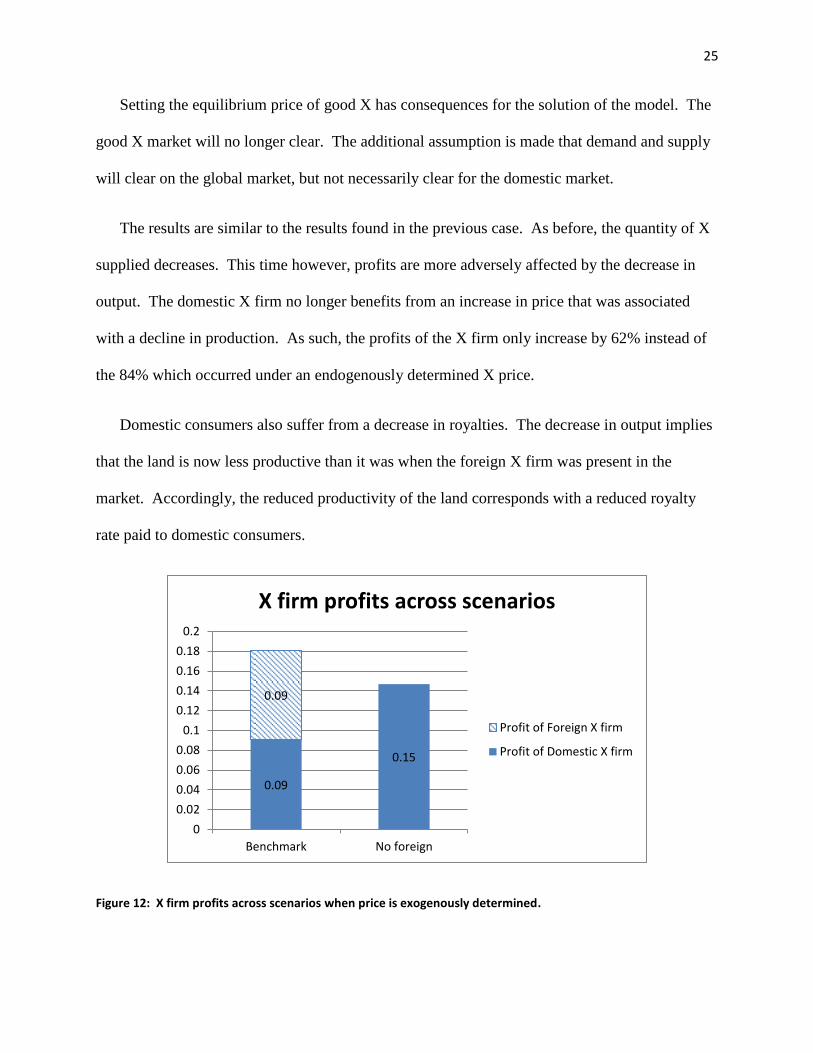
The results are similar to the results found in the previous case. As before, the quantity of X
supplied decreases. This time however, profits are more adversely affected by the decrease in
output. The domestic X firm no longer benefits from an increase in price that was associated
with a decline in production. As such, the profits of the X firm only increase by 62% instead of
the 84% which occurred under an endogenously determined X price.
Domestic consumers also suffer from a decrease in royalties. The decrease in output implies
that the land is now less productive than it was when the foreign X firm was present in the
market. Accordingly, the reduced productivity of the land corresponds with a reduced royalty
rate paid to domestic consumers.
Figure 12: X firm profits across scenarios when price is exogenously determined.
0.09
0.15
0.09
0
0.02
0.04
0.06
0.08
0.1
0.12
0.14
0.16
0.18
0.2
Benchmark No foreign
X firm profits across scenarios
Profit of Foreign X firm
Profit of Domestic X firm
26
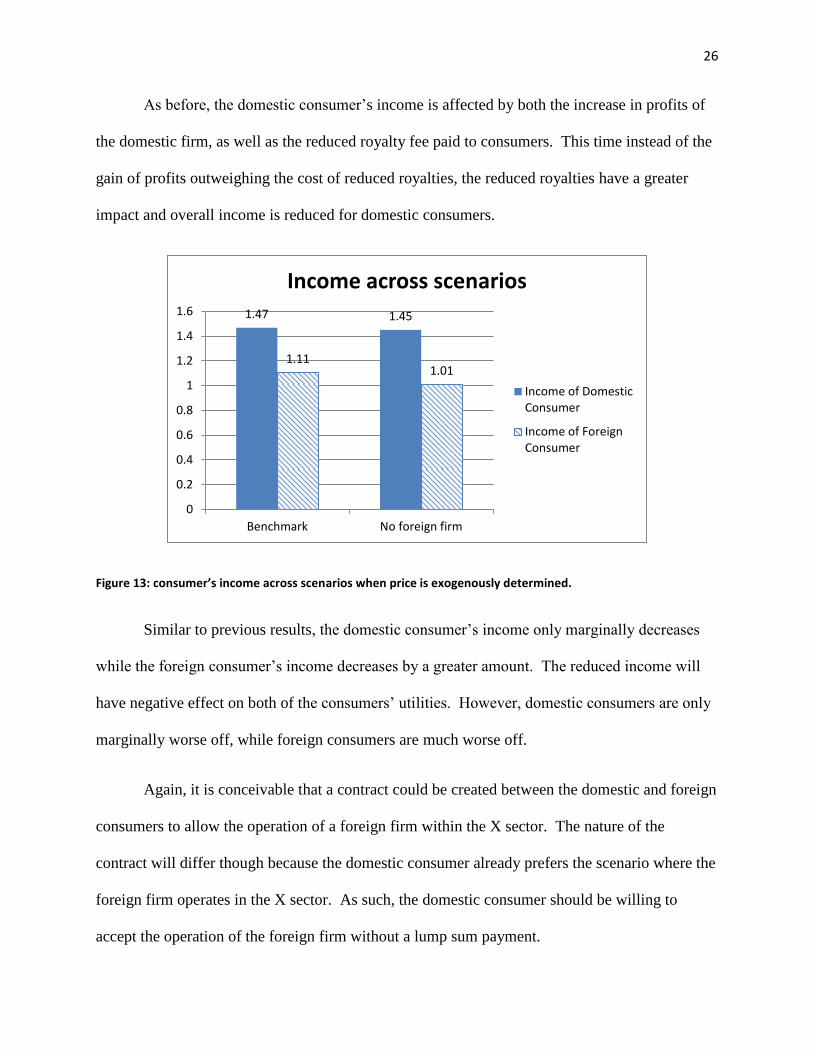
As before, the domestic consumer’s income is affected by both the increase in profits of
the domestic firm, as well as the reduced royalty fee paid to consumers. This time instead of the
gain of profits outweighing the cost of reduced royalties, the reduced royalties have a greater
impact and overall income is reduced for domestic consumers.
Figure 13: consumer’s income across scenarios when price is exogenously determined.
Similar to previous results, the domestic consumer’s income only marginally decreases
while the foreign consumer’s income decreases by a greater amount. The reduced income will
have negative effect on both of the consumers’ utilities. However, domestic consumers are only
marginally worse off, while foreign consumers are much worse off.
Again, it is conceivable that a contract could be created between the domestic and foreign
consumers to allow the operation of a foreign firm within the X sector. The nature of the
contract will differ though because the domestic consumer already prefers the scenario where the
foreign firm operates in the X sector. As such, the domestic consumer should be willing to
accept the operation of the foreign firm without a lump sum payment.
1.47 1.45
1.11 1.01
0
0.2
0.4
0.6
0.8
1
1.2
1.4
1.6
Benchmark No foreign firm
Income across scenarios
Income of DomesticConsumer
Income of ForeignConsumer
27
5.5 Adaptations:
5.5.1 Inclusion of externalities:
Several adaptations are made to this model in order to simulate different scenarios. The
first adaptation allows for the inclusion of external costs. One criticism of the oil sand industry
has been that there are large external environmental costs associated with the production of the
resource. The oil which is locked within the oil sands is incredibly energy, water and capital
intensive to extract. This leads to some undesirable consequences. The oil sands currently
produce 7% of Canada’s CO2 emissions and are expected to increase to 14% by the year 202011
.
The use of water in the extraction process creates tailing ponds which are filled with toxic
pollutants with potential to leech into the surrounding environment contaminating local rivers
and lakes. The populations of the local communities also expand at dramatic rates leading to
problems of inadequate public facilities. This generally results in increasing crime rates and
rising social problems such as an increase in drug use and domestic violence.
These are some of the external problem associated with the production. For the purposes
of this model only the local externalities will be taken into consideration, as such they will only
affect the domestic consumer.
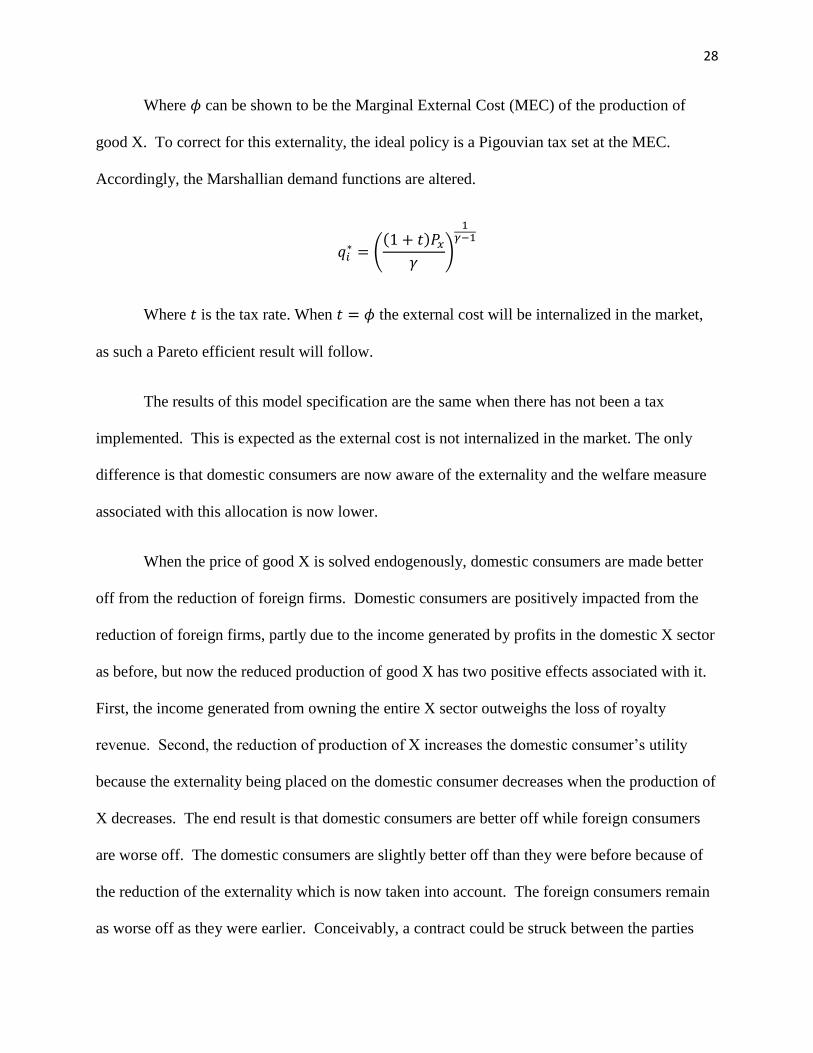
The domestic consumer’s utility function will now be given by:
( ) ∑
28
Where can be shown to be the Marginal External Cost (MEC) of the production of
good X. To correct for this externality, the ideal policy is a Pigouvian tax set at the MEC.
Accordingly, the Marshallian demand functions are altered.
(
( )
)
Where is the tax rate. When the external cost will be internalized in the market,
as such a Pareto efficient result will follow.
The results of this model specification are the same when there has not been a tax
implemented. This is expected as the external cost is not internalized in the market. The only
difference is that domestic consumers are now aware of the externality and the welfare measure
associated with this allocation is now lower.
When the price of good X is solved endogenously, domestic consumers are made better
off from the reduction of foreign firms. Domestic consumers are positively impacted from the
reduction of foreign firms, partly due to the income generated by profits in the domestic X sector
as before, but now the reduced production of good X has two positive effects associated with it.
First, the income generated from owning the entire X sector outweighs the loss of royalty
revenue. Second, the reduction of production of X increases the domestic consumer’s utility
because the externality being placed on the domestic consumer decreases when the production of
X decreases. The end result is that domestic consumers are better off while foreign consumers
are worse off. The domestic consumers are slightly better off than they were before because of
the reduction of the externality which is now taken into account. The foreign consumers remain
as worse off as they were earlier. Conceivably, a contract could be struck between the parties
29
which would make both parties better off as before. The foreign consumers would now have to
compensate the domestic consumers more than in the previous scenarios.
When the price of good X is given exogenously, domestic consumers are made worse off
from the reduction of foreign firms. Again the same factors are at work here. The loss in
productivity of the land resource leads to a decrease in royalty revenue collected. The decrease
in royalty revenue collected outweighs the increase in profits from the domestic X firm. This
results in a loss of income, and a subsequent decrease in utility. The decrease in utility from the
decrease in income however is slightly offset by the lower X production. The overall impact is
the same as in the original model, with both domestic consumers and foreign consumers
becoming worse off when the foreign firm is absent. The foreign consumers are again worse off
than the domestic consumers.
5.5.2 Consumer discrimination:
An additional adaptation which was done involved altering Gary Becker’s model of
consumer discrimination. The model is structured by assuming that domestic consumers have
distaste for oil produced by foreign companies. As such, domestic consumers’ willingness to
pay is lower for oil produced by foreign companies. It can be described as:
( )
Where is the price of good x, is a variable with set values of 0 or 1, and is the
coefficient of consumer discrimination. The variable is denoted 1 when the foreign company
produces good X and 0 otherwise. The variable then captures the consumer’s distaste for
30
foreign produced oil. When approaches the domestic consumer will pay an infinite amount
to avoid foreign produced oil. When is equal to 0, the domestic consumer is indifferent
between domestically produced oil and foreign produced oil.
The case which I investigate is when the variable approaches infinity. Essentially, this
segments the market so that domestic consumers only purchase domestically produced oil and
foreign consumers are forced to purchase foreign produced oil. This is a result which relies on
the symmetry of the model. The demand for good X is symmetric across consumers, as is the
supply. Therefore, each firm can produce exactly enough to meet the needs of their respective
consumers. The result being that domestic consumers consume all of the domestic supply, while
the foreign consumers consume all of the foreign supply.
The results of the non-symmetric case become extremely messy, extremely quickly. The
results are driven almost entirely from assumptions. If the assumption is made that domestic
consumers represent the majority of market demand, then the product is effectively discriminated
against, such that the domestic consumers view the products as two separate products and two
different prices can be applied to each. The foreign produced oil is sold at a lower price. This
affects the foreign firm forcing it to reduce output or alternatively shut down altogether. In
either case, we can expect a reduction in demand for the land resource because of the decrease in
productivity; as such domestic consumer’s income will be negatively impacted.
Correspondingly, the profits from the domestic X firm increase from the increase in supply by
the X firm. The end results are extremely sensitive to the specific assumptions made as well as
exogenous parameters.
31
6. Discussion:
If the price of oil is endogenously determined, domestic consumers face a trade-off between
collecting higher royalty rates or higher profits. From this model specification the domestic
consumer is almost indifferent between either maximization. However, this preference could
change if the exogenous parameters for the model were altered. Conceivably there is a case
where domestic consumers would much prefer to collect higher royalty revenue over increasing
domestic firm profits. For example, if the alpha parameters were increased, the demand for land
would increase and the subsequent royalty rates would rise to account for this.
The assumption of endogenously determined prices assumes Canada’s production capacity is
large enough to influence prices. This is unlikely because Canada only holds a small portion of
total reserves. This may however be a reasonable assumption if there was some form of
collusion, or a cartel formation across various oil producing countries such that they would have
the capacity to determine the price of oil through the control of the majority of supply.
In the more likely case where prices are exogenously determined by global markets, domestic
consumers now face a similar trade-off. They can either allow the foreign firms to operate
within Canada and receive higher royalty rates, or they can bar foreign firms from operating
within Canada and receive higher domestic firm profits. The difference now though, is that the
profits received by the operation of the domestic firm do not outweigh the loss of royalty income
incurred from barring foreign firms. This is because domestic firms can no longer receive
higher prices from a reduced production, and therefore will generate less profit than when prices
were endogenously determined.
32
This is a more realistic assumption because as stated above, Canada is only a small supplier
in the oil industry and as such, cannot influence the price of oil through supply decisions. As
such, domestic consumers should prefer to allow the operation of foreign owned firms within
Canada because they will receive higher royalty rates which outweigh the benefits of having a
single domestic oil firm operating within Canada.
One political constraint which is not focused on in this model is the feasibility of choosing
the optimal royalty rate. The assumption was made at the beginning of the paper that the royalty
rate in place would always be the ideal amount. Empirically, the royalty rate has been shown
that Alberta could benefit from increasing the current royalty rate. The political barriers to doing
so are high and the likelihood of an increase is slim. In fact, recent reforms have even decreased
the royalty rates pushing them further below the optimum level6.
If domestic consumers are unable to be adequately compensated for the use of the oil sands
through the royalty rate mechanism, then it could be conceivable that domestic consumers could
be better off without the operation of foreign firms. Therefore, the results depend upon the
royalty rate being able to capture the increase in demand for the resource. If the royalty rate does
not increase sufficiently because of political barriers then domestic consumers may indeed be
cheated out of the gains made from increasing the amount of firms operating within Canada.
7. Conclusion:
The model in this paper shows that the concerns domestic consumers raise over the
distribution of profits is not justified. Given that the price of oil is set in the global market and
33
that Canada is a relatively small supplier unable to affect the price of oil, domestic consumers
can be adequately compensated for the use of their resource through royalties. Domestic
consumers receive more benefits when foreign firms operate in Canada because of higher royalty
rates. Therefore, domestic consumers should encourage foreign firms to operate in Canada.
Additional research can be explored by adapting this model. One factor which could be
explored is the operation of state owned firms. All firms are assumed to be private entities and
as such they can be expected to operate in a similar manner, regardless of ownership. State
owned enterprises however are not necessarily bounded to the same profit maximization
operation. While it is likely they undergo cost minimization it may not be to the same degree as
under a private firm because of the different structure of the firm. State owned enterprises may
instead focus on government objectives such as securing fuel and energy for development
purposes rather than on optimizing the returns to shareholders that private companies pursue.
34
8. Appendix:
8.1 Reference list:
1. Statistics Canada, n.d., CANSIM tables 378-0005 ,379-0027 and 179-0004..
2. Islam, K. (2008) Canada’s natural resource wealth at a glance, Statistics Canada.
3. Alberta Government. About the Oil
Sands.http://www.oilsands.alberta.ca/resource.html.
4. Statement Regarding Investment by Foreign State-owned Enterprises. (2012).
http://www.ic.gc.ca/eic/site/ica-lic.nsf/eng/lk81147.html
5. Who are the major players supplying the world oil market?. Energy In brief. Energy
information Administration (EIA). March 15th, 2012.
http://www.eia.gov/energy_in_brief/article/world_oil_market.cfm
6. Government of Alberta. Energy economics understanding royalties. December 2010.
http://www.energy.gov.ab.ca/Org/pdfs/EnergyEconomics.pdf
7. Hunter et al. Alberta Royalty Review Panel. Our fair share: Report of the Alberta
Royalty review panel. September 18th, 2007.
http://www.albertaroyaltyreview.ca/panel/final_report.pdf
8. Albouy, D. Evaluating the efficiency and equity of federal fiscal equalization.
Journal of Public Economics, Volume 96, Issues 9–10, October 2012, Pages 824–839.
http://dx.doi.org/10.1016/j.jpubeco.2012.05.015
9. Losman, D. The rentier state and National Oil Companies: An economic and Political
Perspective. The middle East Journal, volume 64, Number 3, Summer 2010.
http://muse.jhu.edu.ezproxy.library.uvic.ca/journals/the_middle_east_journal/v064
/64.3.losman.html
10. Thurber et al. Exporting the “Norwegian Model”: The effect of administrative design
on oil sector performance. Energy Policy, Volume 39, Issue 9, September 2011,
Pages 5366–5378.
http://dx.doi.org.ezproxy.library.uvic.ca/10.1016/j.enpol.2011.05.027
35
11. Environment Canada. Canada’s Emissions Trends 2012.
http://www.ec.gc.ca/Publications/253AE6E6-5E73-4AFC-81B7-
9CF440D5D2C5%5C793-Canada's-Emissions-Trends-2012_e_01.pdf
12. Laing, D. Labor Economics, chapter 11 Discrimination 1: theory. First edition 2011.
Norton & Company Inc. New York.
8.2 Resource sector magnitude:
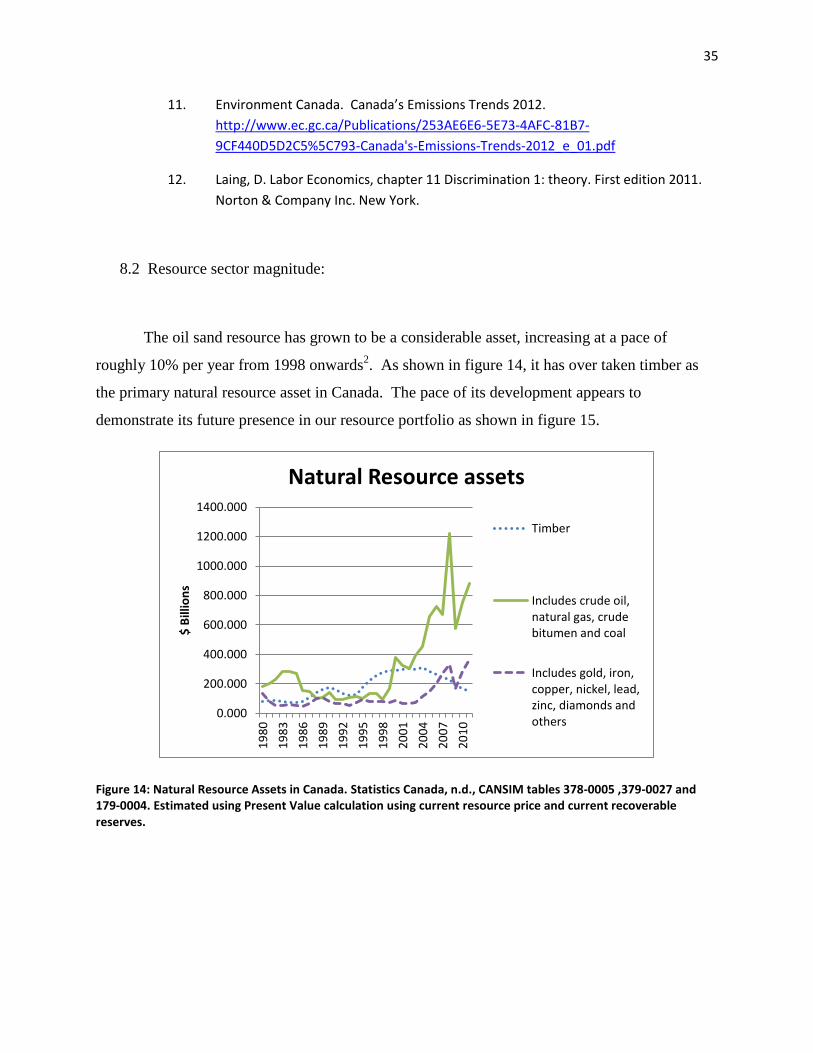
The oil sand resource has grown to be a considerable asset, increasing at a pace of
roughly 10% per year from 1998 onwards2. As shown in figure 14, it has over taken timber as
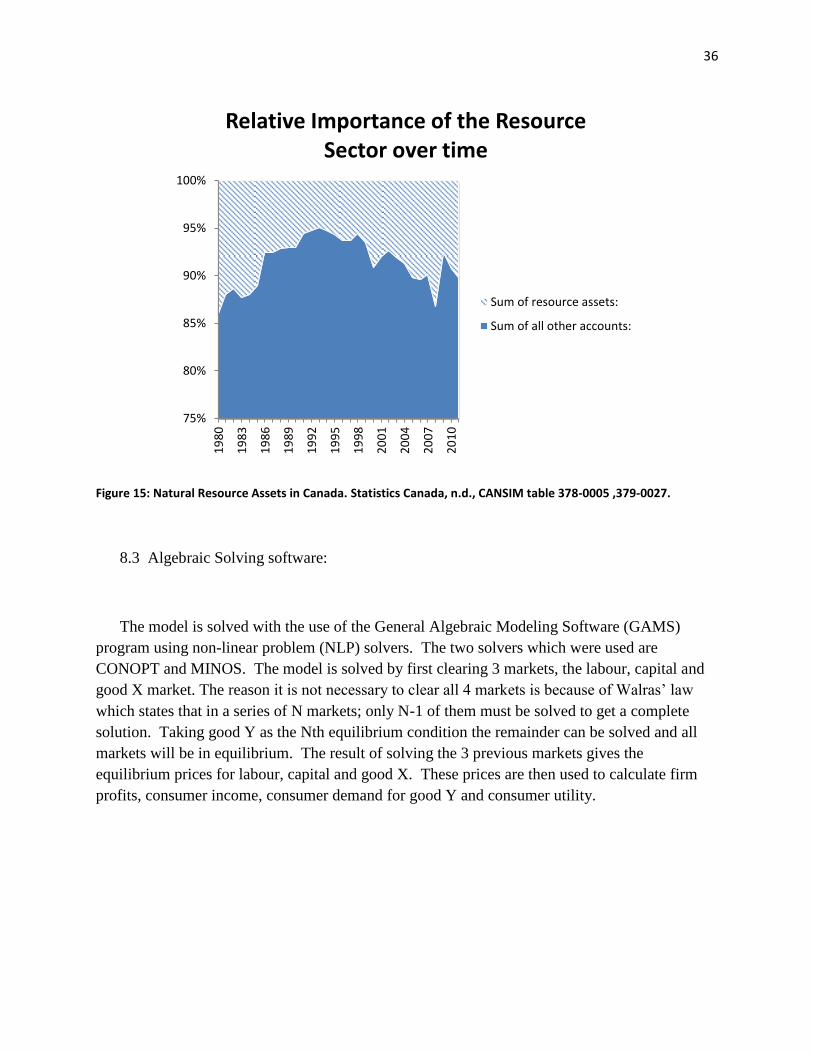
the primary natural resource asset in Canada. The pace of its development appears to
demonstrate its future presence in our resource portfolio as shown in figure 15.
Figure 14: Natural Resource Assets in Canada. Statistics Canada, n.d., CANSIM tables 378-0005 ,379-0027 and 179-0004. Estimated using Present Value calculation using current resource price and current recoverable reserves.
0.000
200.000
400.000
600.000
800.000
1000.000
1200.000
1400.000
19
80
19
83
19
86
19
89
19
92
19
95
19
98
20
01
20
04
20
07
20
10
$ B
illio
ns
Natural Resource assets
Timber
Includes crude oil,natural gas, crudebitumen and coal
Includes gold, iron,copper, nickel, lead,zinc, diamonds andothers
36
Figure 15: Natural Resource Assets in Canada. Statistics Canada, n.d., CANSIM table 378-0005 ,379-0027.
8.3 Algebraic Solving software:
The model is solved with the use of the General Algebraic Modeling Software (GAMS)
program using non-linear problem (NLP) solvers. The two solvers which were used are
CONOPT and MINOS. The model is solved by first clearing 3 markets, the labour, capital and
good X market. The reason it is not necessary to clear all 4 markets is because of Walras’ law
which states that in a series of N markets; only N-1 of them must be solved to get a complete
solution. Taking good Y as the Nth equilibrium condition the remainder can be solved and all
markets will be in equilibrium. The result of solving the 3 previous markets gives the
equilibrium prices for labour, capital and good X. These prices are then used to calculate firm
profits, consumer income, consumer demand for good Y and consumer utility.
75%
80%
85%
90%
95%
100%
19
80
19
83
19
86
19
89
19
92
19
95
19
98
20
01
20
04
20
07
20
10
Relative Importance of the Resource Sector over time
Sum of resource assets:
Sum of all other accounts:
37
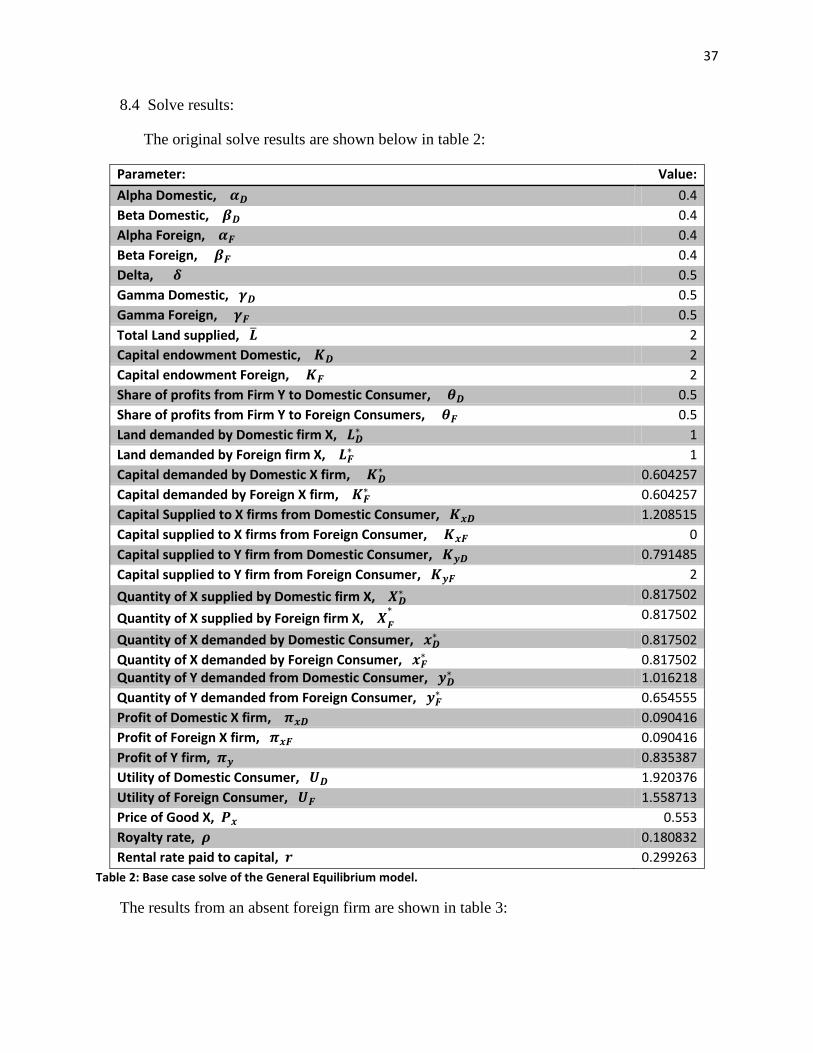
8.4 Solve results:
The original solve results are shown below in table 2:
Parameter: Value:
Alpha Domestic, 0.4
Beta Domestic, 0.4
Alpha Foreign, 0.4
Beta Foreign, 0.4
Delta, 0.5
Gamma Domestic, 0.5
Gamma Foreign, 0.5
Total Land supplied, ̅ 2
Capital endowment Domestic, 2
Capital endowment Foreign, 2
Share of profits from Firm Y to Domestic Consumer, 0.5
Share of profits from Firm Y to Foreign Consumers, 0.5
Land demanded by Domestic firm X, 1
Land demanded by Foreign firm X, 1
Capital demanded by Domestic X firm, 0.604257
Capital demanded by Foreign X firm, 0.604257
Capital Supplied to X firms from Domestic Consumer, 1.208515
Capital supplied to X firms from Foreign Consumer, 0
Capital supplied to Y firm from Domestic Consumer, 0.791485
Capital supplied to Y firm from Foreign Consumer, 2
Quantity of X supplied by Domestic firm X, 0.817502
Quantity of X supplied by Foreign firm X,
0.817502
Quantity of X demanded by Domestic Consumer, 0.817502
Quantity of X demanded by Foreign Consumer, 0.817502
Quantity of Y demanded from Domestic Consumer, 1.016218
Quantity of Y demanded from Foreign Consumer, 0.654555
Profit of Domestic X firm, 0.090416
Profit of Foreign X firm, 0.090416
Profit of Y firm, 0.835387
Utility of Domestic Consumer, 1.920376
Utility of Foreign Consumer, 1.558713
Price of Good X, 0.553
Royalty rate, 0.180832
Rental rate paid to capital, 0.299263
Table 2: Base case solve of the General Equilibrium model.
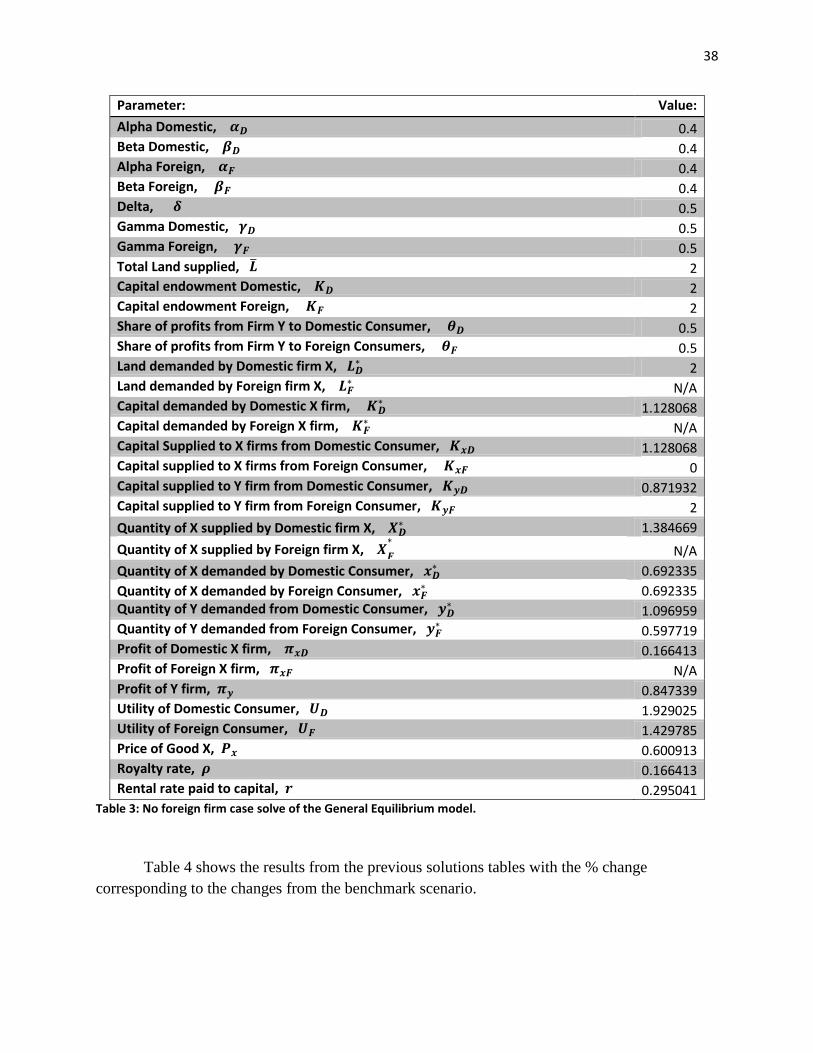
The results from an absent foreign firm are shown in table 3:
38
Parameter: Value:
Alpha Domestic, 0.4 Beta Domestic, 0.4 Alpha Foreign, 0.4 Beta Foreign, 0.4 Delta, 0.5 Gamma Domestic, 0.5 Gamma Foreign, 0.5 Total Land supplied, ̅ 2 Capital endowment Domestic, 2 Capital endowment Foreign, 2 Share of profits from Firm Y to Domestic Consumer, 0.5 Share of profits from Firm Y to Foreign Consumers, 0.5 Land demanded by Domestic firm X,
2 Land demanded by Foreign firm X,
N/A Capital demanded by Domestic X firm,
1.128068 Capital demanded by Foreign X firm,
N/A Capital Supplied to X firms from Domestic Consumer, 1.128068 Capital supplied to X firms from Foreign Consumer, 0 Capital supplied to Y firm from Domestic Consumer, 0.871932 Capital supplied to Y firm from Foreign Consumer, 2
Quantity of X supplied by Domestic firm X, 1.384669
Quantity of X supplied by Foreign firm X,
N/A
Quantity of X demanded by Domestic Consumer, 0.692335
Quantity of X demanded by Foreign Consumer, 0.692335
Quantity of Y demanded from Domestic Consumer, 1.096959
Quantity of Y demanded from Foreign Consumer, 0.597719
Profit of Domestic X firm, 0.166413 Profit of Foreign X firm, N/A Profit of Y firm, 0.847339 Utility of Domestic Consumer, 1.929025 Utility of Foreign Consumer, 1.429785 Price of Good X, 0.600913 Royalty rate, 0.166413 Rental rate paid to capital, 0.295041
Table 3: No foreign firm case solve of the General Equilibrium model.
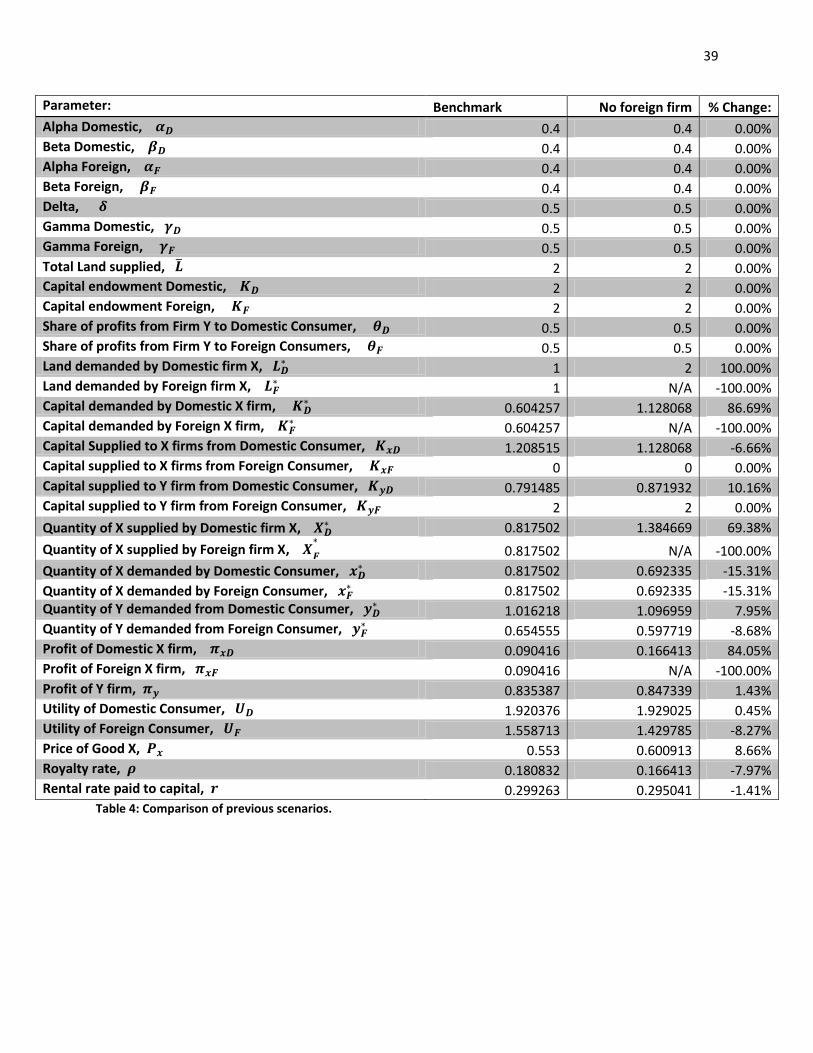
Table 4 shows the results from the previous solutions tables with the % change
corresponding to the changes from the benchmark scenario.
39
Parameter: Benchmark No foreign firm % Change:
Alpha Domestic, 0.4 0.4 0.00% Beta Domestic, 0.4 0.4 0.00% Alpha Foreign, 0.4 0.4 0.00% Beta Foreign, 0.4 0.4 0.00% Delta, 0.5 0.5 0.00% Gamma Domestic, 0.5 0.5 0.00% Gamma Foreign, 0.5 0.5 0.00% Total Land supplied, ̅ 2 2 0.00% Capital endowment Domestic, 2 2 0.00% Capital endowment Foreign, 2 2 0.00% Share of profits from Firm Y to Domestic Consumer, 0.5 0.5 0.00% Share of profits from Firm Y to Foreign Consumers, 0.5 0.5 0.00% Land demanded by Domestic firm X,
1 2 100.00% Land demanded by Foreign firm X,
1 N/A -100.00% Capital demanded by Domestic X firm,
0.604257 1.128068 86.69% Capital demanded by Foreign X firm,
0.604257 N/A -100.00% Capital Supplied to X firms from Domestic Consumer, 1.208515 1.128068 -6.66% Capital supplied to X firms from Foreign Consumer, 0 0 0.00% Capital supplied to Y firm from Domestic Consumer, 0.791485 0.871932 10.16% Capital supplied to Y firm from Foreign Consumer, 2 2 0.00%
Quantity of X supplied by Domestic firm X, 0.817502 1.384669 69.38%
Quantity of X supplied by Foreign firm X,
0.817502 N/A -100.00%
Quantity of X demanded by Domestic Consumer, 0.817502 0.692335 -15.31%
Quantity of X demanded by Foreign Consumer, 0.817502 0.692335 -15.31%
Quantity of Y demanded from Domestic Consumer, 1.016218 1.096959 7.95%
Quantity of Y demanded from Foreign Consumer, 0.654555 0.597719 -8.68%
Profit of Domestic X firm, 0.090416 0.166413 84.05% Profit of Foreign X firm, 0.090416 N/A -100.00% Profit of Y firm, 0.835387 0.847339 1.43% Utility of Domestic Consumer, 1.920376 1.929025 0.45% Utility of Foreign Consumer, 1.558713 1.429785 -8.27% Price of Good X, 0.553 0.600913 8.66% Royalty rate, 0.180832 0.166413 -7.97% Rental rate paid to capital, 0.299263 0.295041 -1.41%
Table 4: Comparison of previous scenarios.
40
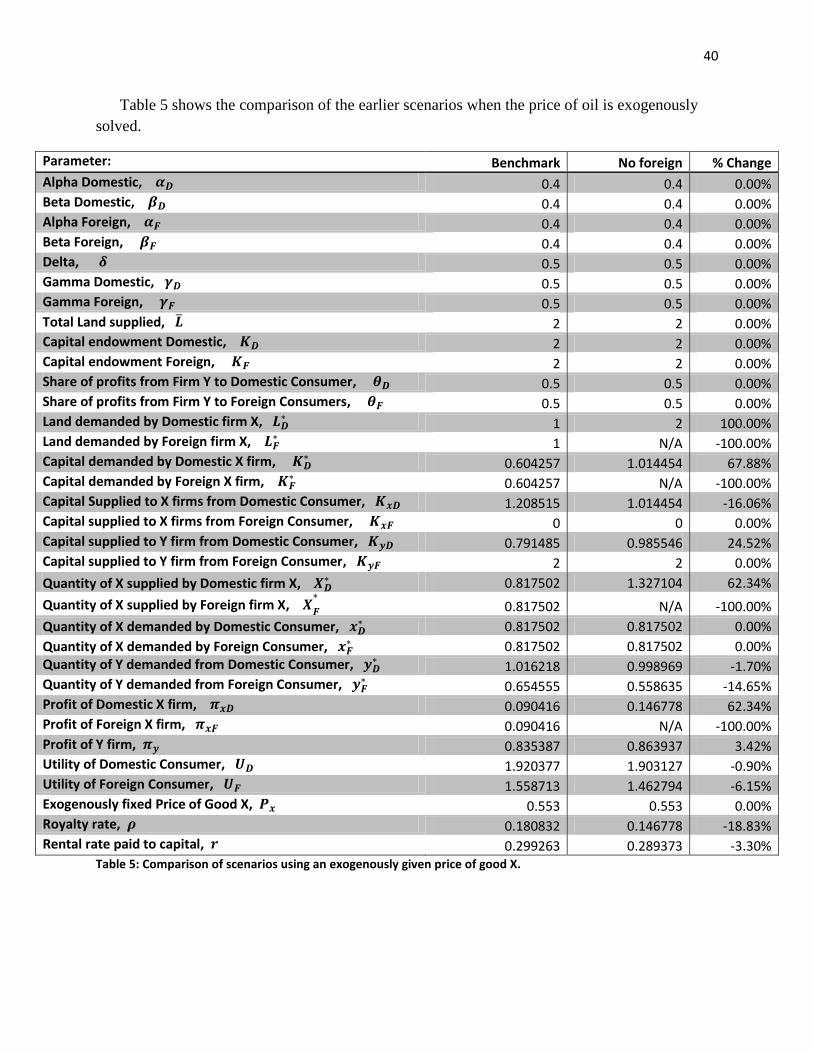
Table 5 shows the comparison of the earlier scenarios when the price of oil is exogenously
solved.
Parameter: Benchmark No foreign % Change
Alpha Domestic, 0.4 0.4 0.00% Beta Domestic, 0.4 0.4 0.00% Alpha Foreign, 0.4 0.4 0.00% Beta Foreign, 0.4 0.4 0.00% Delta, 0.5 0.5 0.00% Gamma Domestic, 0.5 0.5 0.00% Gamma Foreign, 0.5 0.5 0.00% Total Land supplied, ̅ 2 2 0.00% Capital endowment Domestic, 2 2 0.00% Capital endowment Foreign, 2 2 0.00% Share of profits from Firm Y to Domestic Consumer, 0.5 0.5 0.00% Share of profits from Firm Y to Foreign Consumers, 0.5 0.5 0.00% Land demanded by Domestic firm X,
1 2 100.00% Land demanded by Foreign firm X,
1 N/A -100.00% Capital demanded by Domestic X firm,
0.604257 1.014454 67.88% Capital demanded by Foreign X firm,
0.604257 N/A -100.00% Capital Supplied to X firms from Domestic Consumer, 1.208515 1.014454 -16.06% Capital supplied to X firms from Foreign Consumer, 0 0 0.00% Capital supplied to Y firm from Domestic Consumer, 0.791485 0.985546 24.52% Capital supplied to Y firm from Foreign Consumer, 2 2 0.00%
Quantity of X supplied by Domestic firm X, 0.817502 1.327104 62.34%
Quantity of X supplied by Foreign firm X,
0.817502 N/A -100.00%
Quantity of X demanded by Domestic Consumer, 0.817502 0.817502 0.00%
Quantity of X demanded by Foreign Consumer, 0.817502 0.817502 0.00%
Quantity of Y demanded from Domestic Consumer, 1.016218 0.998969 -1.70%
Quantity of Y demanded from Foreign Consumer, 0.654555 0.558635 -14.65%
Profit of Domestic X firm, 0.090416 0.146778 62.34% Profit of Foreign X firm, 0.090416 N/A -100.00% Profit of Y firm, 0.835387 0.863937 3.42% Utility of Domestic Consumer, 1.920377 1.903127 -0.90% Utility of Foreign Consumer, 1.558713 1.462794 -6.15% Exogenously fixed Price of Good X, 0.553 0.553 0.00% Royalty rate, 0.180832 0.146778 -18.83% Rental rate paid to capital, 0.299263 0.289373 -3.30%
Table 5: Comparison of scenarios using an exogenously given price of good X.
41
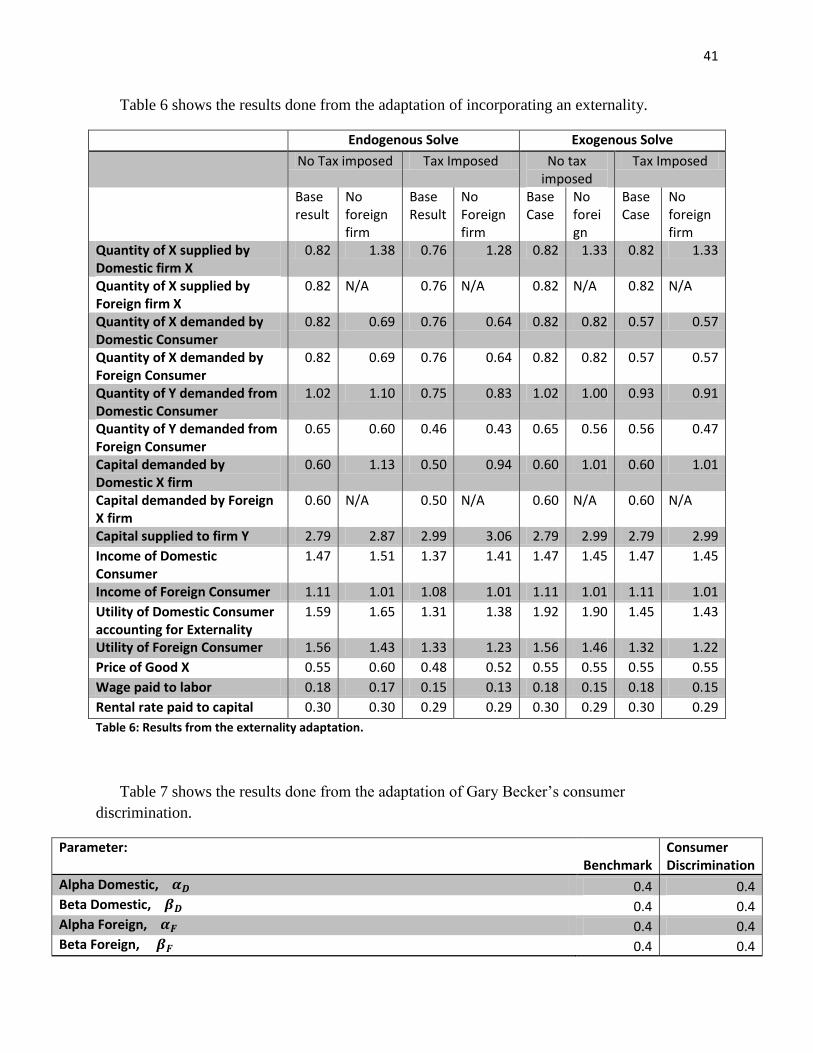
Table 6 shows the results done from the adaptation of incorporating an externality.
Endogenous Solve Exogenous Solve
No Tax imposed Tax Imposed No tax imposed
Tax Imposed
Base result
No foreign firm
Base Result
No Foreign firm
Base Case
No foreign
Base Case
No foreign firm
Quantity of X supplied by Domestic firm X
0.82 1.38 0.76 1.28 0.82 1.33 0.82 1.33
Quantity of X supplied by Foreign firm X
0.82 N/A 0.76 N/A 0.82 N/A 0.82 N/A
Quantity of X demanded by Domestic Consumer
0.82 0.69 0.76 0.64 0.82 0.82 0.57 0.57
Quantity of X demanded by Foreign Consumer
0.82 0.69 0.76 0.64 0.82 0.82 0.57 0.57
Quantity of Y demanded from Domestic Consumer
1.02 1.10 0.75 0.83 1.02 1.00 0.93 0.91
Quantity of Y demanded from Foreign Consumer
0.65 0.60 0.46 0.43 0.65 0.56 0.56 0.47
Capital demanded by Domestic X firm
0.60 1.13 0.50 0.94 0.60 1.01 0.60 1.01
Capital demanded by Foreign X firm
0.60 N/A 0.50 N/A 0.60 N/A 0.60 N/A
Capital supplied to firm Y 2.79 2.87 2.99 3.06 2.79 2.99 2.79 2.99
Income of Domestic Consumer
1.47 1.51 1.37 1.41 1.47 1.45 1.47 1.45
Income of Foreign Consumer 1.11 1.01 1.08 1.01 1.11 1.01 1.11 1.01
Utility of Domestic Consumer accounting for Externality
1.59 1.65 1.31 1.38 1.92 1.90 1.45 1.43
Utility of Foreign Consumer 1.56 1.43 1.33 1.23 1.56 1.46 1.32 1.22
Price of Good X 0.55 0.60 0.48 0.52 0.55 0.55 0.55 0.55
Wage paid to labor 0.18 0.17 0.15 0.13 0.18 0.15 0.18 0.15
Rental rate paid to capital 0.30 0.30 0.29 0.29 0.30 0.29 0.30 0.29
Table 6: Results from the externality adaptation.
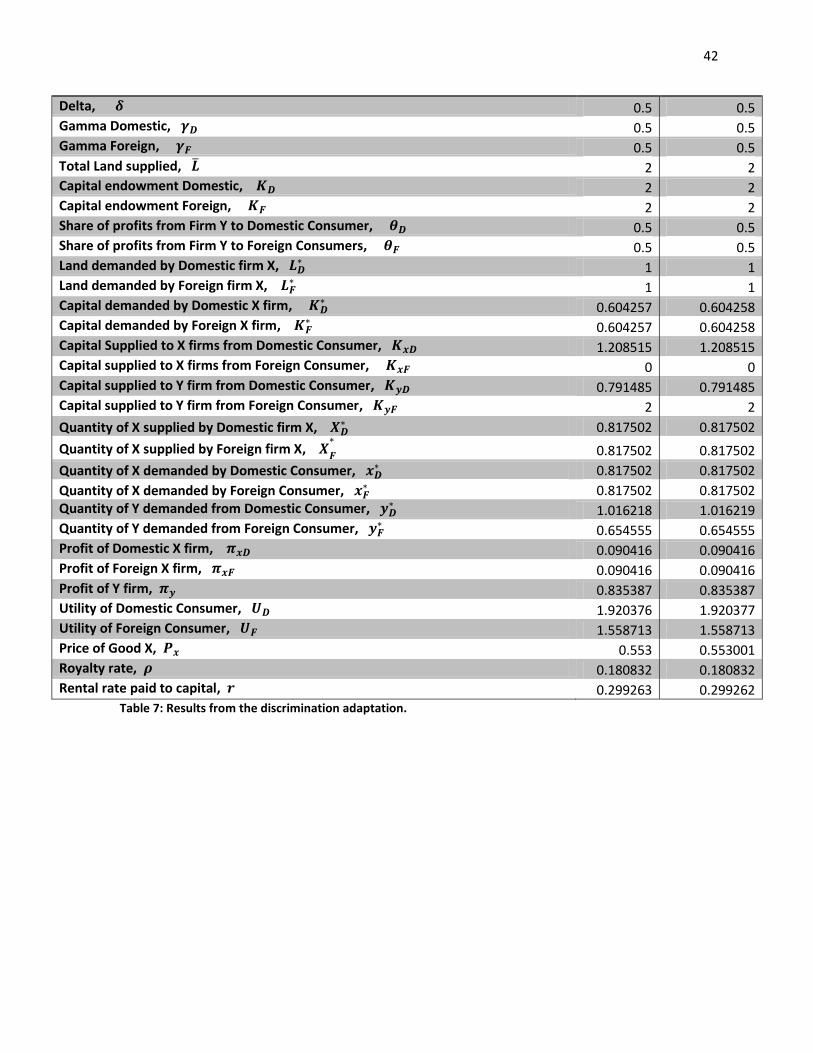
Table 7 shows the results done from the adaptation of Gary Becker’s consumer
discrimination.
Parameter: Benchmark
Consumer Discrimination
Alpha Domestic, 0.4 0.4 Beta Domestic, 0.4 0.4 Alpha Foreign, 0.4 0.4 Beta Foreign, 0.4 0.4
42
Delta, 0.5 0.5 Gamma Domestic, 0.5 0.5 Gamma Foreign, 0.5 0.5 Total Land supplied, ̅ 2 2 Capital endowment Domestic, 2 2 Capital endowment Foreign, 2 2 Share of profits from Firm Y to Domestic Consumer, 0.5 0.5 Share of profits from Firm Y to Foreign Consumers, 0.5 0.5 Land demanded by Domestic firm X,
1 1 Land demanded by Foreign firm X,
1 1 Capital demanded by Domestic X firm,
0.604257 0.604258 Capital demanded by Foreign X firm,
0.604257 0.604258 Capital Supplied to X firms from Domestic Consumer, 1.208515 1.208515 Capital supplied to X firms from Foreign Consumer, 0 0 Capital supplied to Y firm from Domestic Consumer, 0.791485 0.791485 Capital supplied to Y firm from Foreign Consumer, 2 2
Quantity of X supplied by Domestic firm X, 0.817502 0.817502
Quantity of X supplied by Foreign firm X,
0.817502 0.817502
Quantity of X demanded by Domestic Consumer, 0.817502 0.817502
Quantity of X demanded by Foreign Consumer, 0.817502 0.817502
Quantity of Y demanded from Domestic Consumer, 1.016218 1.016219
Quantity of Y demanded from Foreign Consumer, 0.654555 0.654555
Profit of Domestic X firm, 0.090416 0.090416 Profit of Foreign X firm, 0.090416 0.090416 Profit of Y firm, 0.835387 0.835387 Utility of Domestic Consumer, 1.920376 1.920377 Utility of Foreign Consumer, 1.558713 1.558713 Price of Good X, 0.553 0.553001 Royalty rate, 0.180832 0.180832 Rental rate paid to capital, 0.299263 0.299262
Table 7: Results from the discrimination adaptation.