Embed Size (px)
Citation preview
Foreign resident opinion survey
FY2013-Minato City
Mina to C i ty


Declaration as a City of Peace
Minato City
August 15, 1985
All people are one in wishing to preserve the beauty of the
Earth and the permanence of world peace. These sentiments
will never change.
We are working to develop a community filled with
motivation in life, while striving for true peace and the
preservation of our cultural traditions.
Our duty is to pass down this homeland that enjoys
closeness and a beautiful land to the generation to be born and
raised.
We request our government to abide firmly by the “three
non-nuclear principles” (of not producing, not possessing, and
not allowing the entry of nuclear weapons into the country) and
appealing to seek the abolition of nuclear weapons.
As it is our earnest wish for world peace, we hereby declare
Minato City to be a City of Peace.

Table of Contents
Section 1 Survey Outline ......................................................................................................................... 1
1. Survey Purpose ............................................................................................................................................. 1
2. Survey Design .............................................................................................................................................. 1
3. Survey Details ............................................................................................................................................... 1
4. Collection Status ........................................................................................................................................... 1
5. How to View the Report ................................................................................................................................ 1
6. Sampling Error.............................................................................................................................................. 2
Section 2 Respondents ............................................................................................................................ 3
Section 3 Analysis of Survey Results ........................................................................................................ 9
1. Language...................................................................................................................................................... 9
(1) Level of Japanese Abilities ....................................................................................................................................... 9
(2) English Abilities .................................................................................................................................................... 32
(3) Mother Tongue ...................................................................................................................................................... 50
(4) Plans to Study Japanese ......................................................................................................................................... 53
(4-2) Japanese Study Method ...................................................................................................................................... 57
(4-3) Features of a Japanese School/Class .................................................................................................................... 61
2. Problems with Daily Life and Community Activities ...................................................................................... 64
(1) Things considered inconvenient in daily life ........................................................................................................... 64
(2) Problems experienced with Japanese neighbors ...................................................................................................... 71
(3) People you can consult with when things are considered inconvenient..................................................................... 75
(4) Community activities and groups ......................................................................................................................... 79
(4-2) Community activities you participate in and things you address through group activities ..................................... 83
(5) Intention to participate in community and city activities .......................................................................................... 90
(5-2) Community activities you would like to start ....................................................................................................... 95
(5-3) Support you hope for in conducting activities of a town association/neighborhood association ............................ 102
(6) Daily exchange with your country’s embassy ....................................................................................................... 104
(7) Means of collecting daily information .................................................................................................................. 108
3. Disaster resilient community development ....................................................................................................114
(1) Experience with a dangerous earthquake .............................................................................................................. 114
(2) Awareness of city designated evacuation centers ................................................................................................... 116
(3) First action if you had difficulties returning home in a natural disaster .................................................................... 118
(4) Who to rely on during a natural disaster ................................................................................................................ 121
(5) Ppreparation measures regarding natural disasters ................................................................................................. 125
(6) Uneasy feelings about natural disasters ................................................................................................................. 128
(7) Natural disaster response measures you want for Minato City ............................................................................... 132
(8) Where to obtain information concerning disasters ................................................................................................. 135
(9) Methods Minato City should enhance to obtain disaster information ..................................................................... 139
4. Education ................................................................................................................................................. 142
(1) Problems at schools your children attend .............................................................................................................. 142
(2) Requests for the school your children attend ......................................................................................................... 144
(3) Type of elementary or junior high school your children attend ............................................................................... 147
(4) Reasons for choosing a public school ................................................................................................................... 149
(5) Reasons for choosing a private school .................................................................................................................. 150
5. Healthcare ................................................................................................................................................ 151
6. Minato City .............................................................................................................................................. 153
(1) Ease of living in Minato City ............................................................................................................................... 153
(2) Satisfaction with Minato City administrative services ........................................................................................... 153
(3) Minato City ......................................................................................................................................................... 154
(3-2) Ease of living in Minato City (Free description response) ................................................................................... 158
(4) Administrative services received from Minato City............................................................................................... 159
(5) Fulfillment of administrative services of Minato City ............................................................................................ 159
(5-2) Fulfillment of administrative services of Minato City (Free description response) ............................................... 166
(6) Information you would like to know regarding the administration of Minato City and your life in the city .............. 167
(7) Means to obtain information when you want to know of the city’s administrative services and procedures .............. 168
(8) Public information you read on a daily basis in Minato City .................................................................................. 169
(8-2) Fulfillment of information provided by Minato City .......................................................................................... 169
(8-3) Specific information you feel lacking adequate provision ................................................................................... 170
(9) Administrative information distributed in four different languages (Japanese, English, Chinese, and Hangul) ......... 171
(9-2) Languages that should be added other than the four languages listed .................................................................. 171
7. Internationalization Master Plan .................................................................................................................. 172
(1) Awareness of the Minato Internationalization Master Plan ..................................................................................... 172
(1-2) Interest in the Minato Internationalization Master Plan ....................................................................................... 172
(2) Necessary measures for promoting internationalization in Minato City .................................................................. 173
(3) Intent to participate in international exchange meetings and foreign resident discussions ........................................ 173
(3-2) Reasons for wanting to participate in international exchange meetings and foreign resident discussions ............... 174
(3-3) Reasons for not wanting to participate in international exchange meetings and foreign resident discussions ......... 174
(4) Awareness of the Minato International Association ............................................................................................... 175
(4-2) Participation experience in a Minato International Association lecture, project, or event ...................................... 175
(4-3) Current projects Minato International Association addresses you would like to see further fulfilled ...................... 176
(5) Activities you could do to promote the internationalization of Minato City ............................................................ 177
8. City administration in general (Please state your opinion freely) ..................................................................... 177

Section 1 Survey Outline

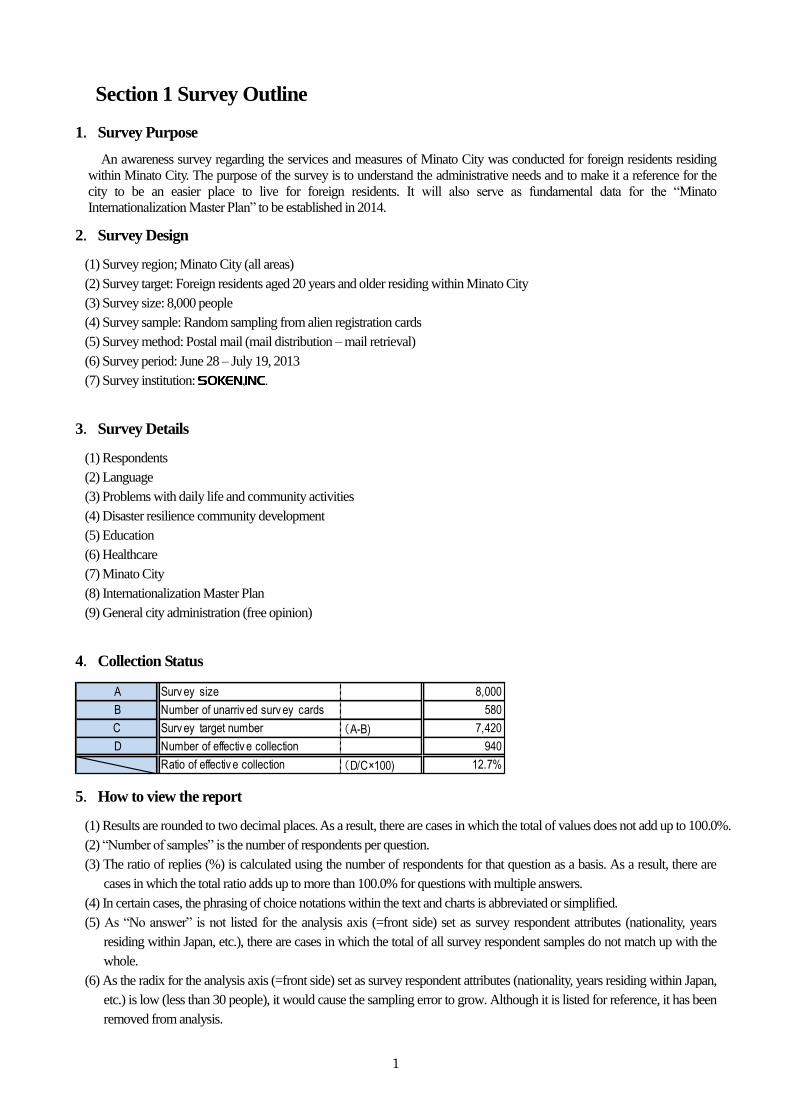
1
Section 1 Survey Outline
1.Survey Purpose
An awareness survey regarding the services and measures of Minato City was conducted for foreign residents residing
within Minato City. The purpose of the survey is to understand the administrative needs and to make it a reference for the
city to be an easier place to live for foreign residents. It will also serve as fundamental data for the “Minato
Internationalization Master Plan” to be established in 2014.
2.Survey Design
(1) Survey region; Minato City (all areas)
(2) Survey target: Foreign residents aged 20 years and older residing within Minato City
(3) Survey size: 8,000 people
(4) Survey sample: Random sampling from alien registration cards
(5) Survey method: Postal mail (mail distribution – mail retrieval)
(6) Survey period: June 28 – July 19, 2013
(7) Survey institution:
3.Survey Details
(1) Respondents
(2) Language
(3) Problems with daily life and community activities
(4) Disaster resilience community development
(5) Education
(6) Healthcare
(7) Minato City
(8) Internationalization Master Plan
(9) General city administration (free opinion)
4.Collection Status
A Surv ey size 8,000
B Number of unarriv ed surv ey cards 580
C Surv ey target number (A-B) 7,420
D Number of effectiv e collection 940
Ratio of effectiv e collection (D/C×100) 12.7%
5.How to view the report
(1) Results are rounded to two decimal places. As a result, there are cases in which the total of values does not add up to 100.0%.
(2) “Number of samples” is the number of respondents per question.
(3) The ratio of replies (%) is calculated using the number of respondents for that question as a basis. As a result, there are
cases in which the total ratio adds up to more than 100.0% for questions with multiple answers.
(4) In certain cases, the phrasing of choice notations within the text and charts is abbreviated or simplified.
(5) As “No answer” is not listed for the analysis axis (=front side) set as survey respondent attributes (nationality, years
residing within Japan, etc.), there are cases in which the total of all survey respondent samples do not match up with the
whole.
(6) As the radix for the analysis axis (=front side) set as survey respondent attributes (nationality, years residing within Japan,
etc.) is low (less than 30 people), it would cause the sampling error to grow. Although it is listed for reference, it has been
removed from analysis.
2
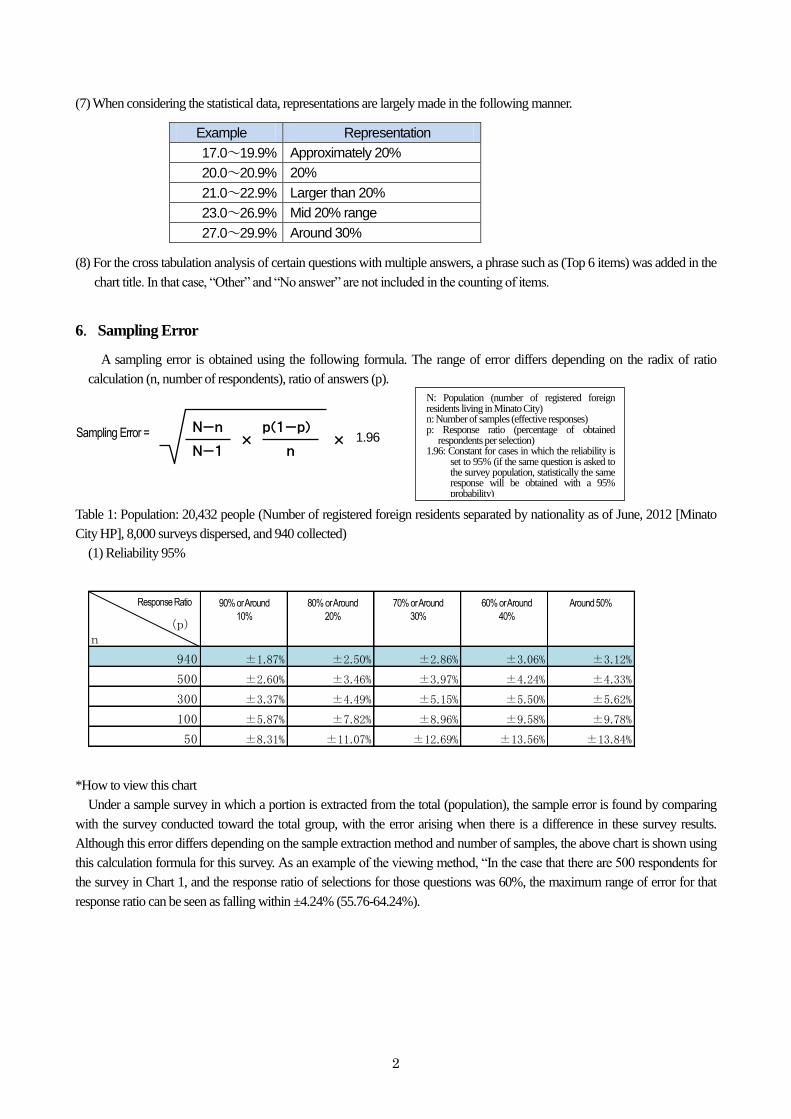
(7) When considering the statistical data, representations are largely made in the following manner.
Example Representation
17.0~19.9% Approximately 20%
20.0~20.9% 20%
21.0~22.9% Larger than 20%
23.0~26.9% Mid 20% range
27.0~29.9% Around 30%
(8) For the cross tabulation analysis of certain questions with multiple answers, a phrase such as (Top 6 items) was added in the
chart title. In that case, “Other” and “No answer” are not included in the counting of items.
6.Sampling Error
A sampling error is obtained using the following formula. The range of error differs depending on the radix of ratio
calculation (n, number of respondents), ratio of answers (p).
Table 1: Population: 20,432 people (Number of registered foreign residents separated by nationality as of June, 2012 [Minato
City HP], 8,000 surveys dispersed, and 940 collected)
(1) Reliability 95%
回答比率
(p)
n
90%または10%程度
80%または20%程度
70%または30%程度
60%または40%程度
50%程度
940 ±1.87% ±2.50% ±2.86% ±3.06% ±3.12%
500 ±2.60% ±3.46% ±3.97% ±4.24% ±4.33%
300 ±3.37% ±4.49% ±5.15% ±5.50% ±5.62%
100 ±5.87% ±7.82% ±8.96% ±9.58% ±9.78%
50 ±8.31% ±11.07% ±12.69% ±13.56% ±13.84%
*How to view this chart
Under a sample survey in which a portion is extracted from the total (population), the sample error is found by comparing
with the survey conducted toward the total group, with the error arising when there is a difference in these survey results.
Although this error differs depending on the sample extraction method and number of samples, the above chart is shown using
this calculation formula for this survey. As an example of the viewing method, “In the case that there are 500 respondents for
the survey in Chart 1, and the response ratio of selections for those questions was 60%, the maximum range of error for that
response ratio can be seen as falling within ±4.24% (55.76-64.24%).
Sampling Error = N-n
N-1
p(1-p)
n × × 1.96
N: Population (number of registered foreign residents living in Minato City) n: Number of samples (effective responses) p: Response ratio (percentage of obtained
respondents per selection) 1.96: Constant for cases in which the reliability is
set to 95% (if the same question is asked to the survey population, statistically the same response will be obtained with a 95% probability)
Around 50% 60% or Around
40% 70% or Around
30% 80% or Around
20% 90% or Around
10% Response Ratio

Section 2 Respondents

3
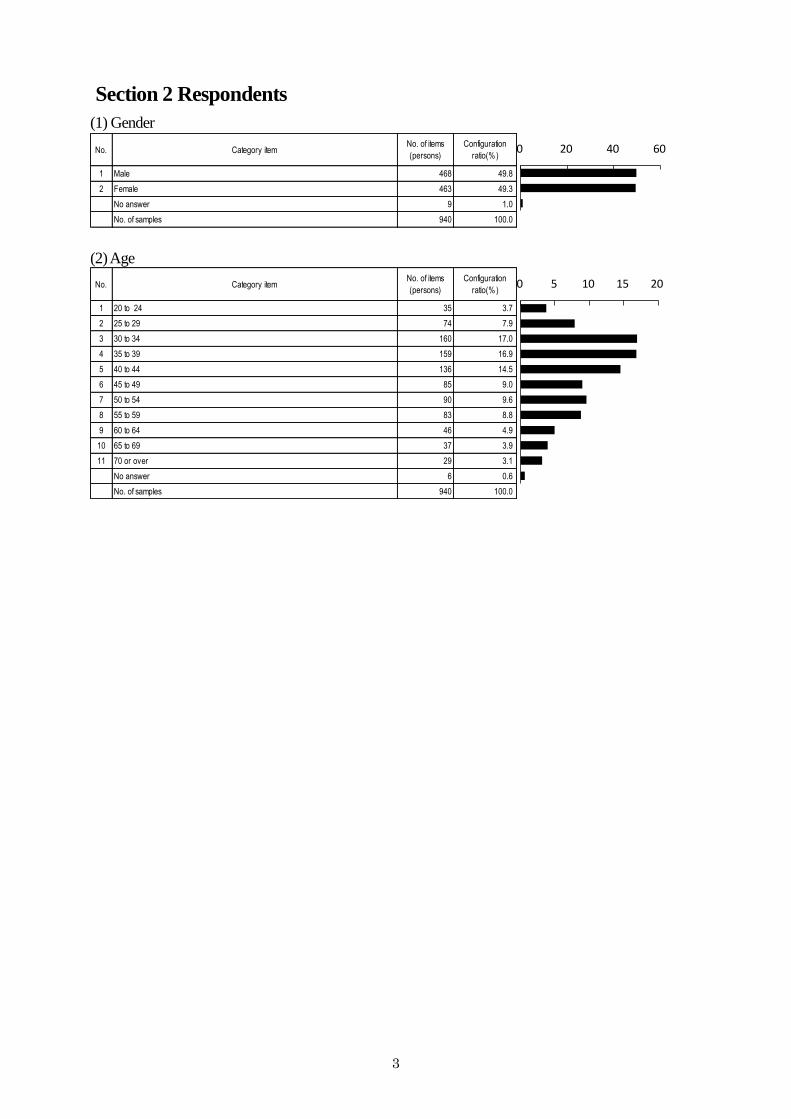
Section 2 Respondents
(1) Gender
No. Category itemNo. of items
(persons)
Configuration
ratio(%)
1 Male 468 49.8
2 Female 463 49.3
No answer 9 1.0
No. of samples 940 100.0
0 20 40 60
(2) Age
No. Category itemNo. of items
(persons)
Configuration
ratio(%)
1 20 to 24 35 3.7
2 25 to 29 74 7.9
3 30 to 34 160 17.0
4 35 to 39 159 16.9
5 40 to 44 136 14.5
6 45 to 49 85 9.0
7 50 to 54 90 9.6
8 55 to 59 83 8.8
9 60 to 64 46 4.9
10 65 to 69 37 3.9
11 70 or over 29 3.1
No answer 6 0.6
No. of samples 940 100.0
0 5 10 15 20
4
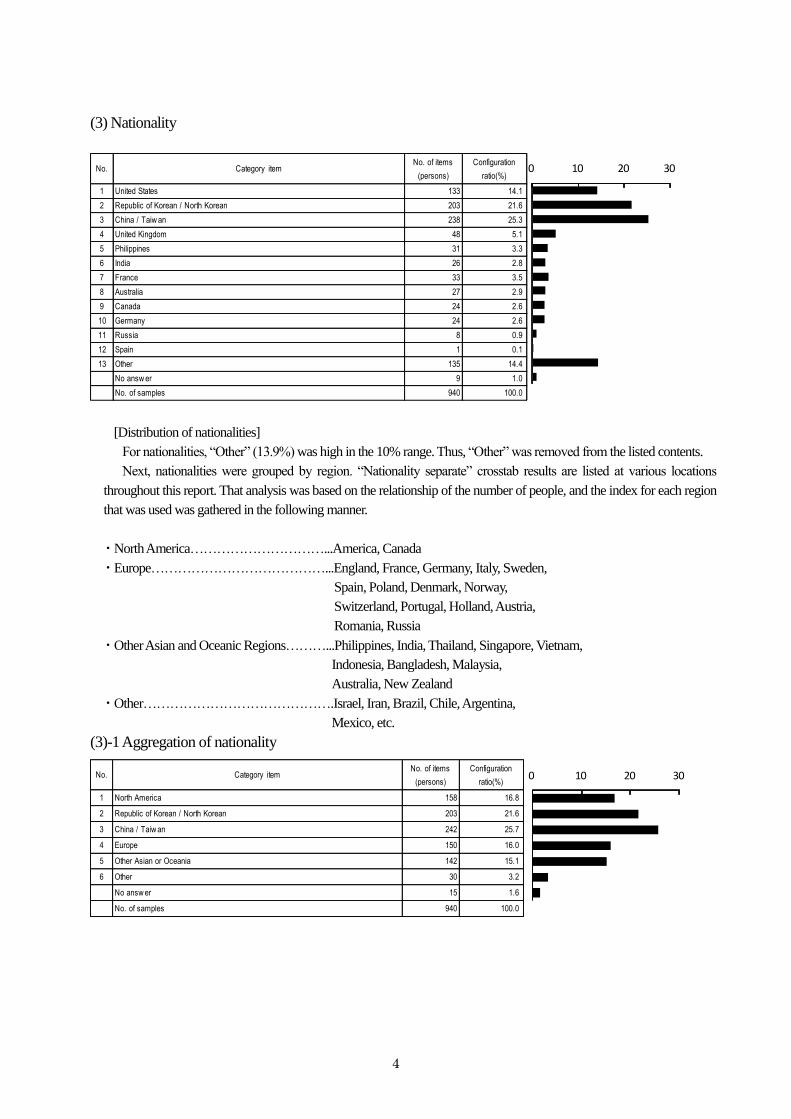
(3) Nationality
No. Category itemNo. of items
(persons)
Configuration
ratio(%)
1 United States 133 14.1
2 Republic of Korean / North Korean 203 21.6
3 China / Taiw an 238 25.3
4 United Kingdom 48 5.1
5 Philippines 31 3.3
6 India 26 2.8
7 France 33 3.5
8 Australia 27 2.9
9 Canada 24 2.6
10 Germany 24 2.6
11 Russia 8 0.9
12 Spain 1 0.1
13 Other 135 14.4
No answ er 9 1.0
No. of samples 940 100.0
0 10 20 30
[Distribution of nationalities]
For nationalities, “Other” (13.9%) was high in the 10% range. Thus, “Other” was removed from the listed contents.
Next, nationalities were grouped by region. “Nationality separate” crosstab results are listed at various locations
throughout this report. That analysis was based on the relationship of the number of people, and the index for each region
that was used was gathered in the following manner.
・North America…………………………...America, Canada
・Europe…………………………………...England, France, Germany, Italy, Sweden,
Spain, Poland, Denmark, Norway,
Switzerland, Portugal, Holland, Austria,
Romania, Russia
・Other Asian and Oceanic Regions………...Philippines, India, Thailand, Singapore, Vietnam,
Indonesia, Bangladesh, Malaysia,
Australia, New Zealand
・Other…………………………………….Israel, Iran, Brazil, Chile, Argentina,
Mexico, etc.
(3)-1 Aggregation of nationality
No. Category itemNo. of items
(persons)
Configuration
ratio(%)
1 North America 158 16.8
2 Republic of Korean / North Korean 203 21.6
3 China / Taiw an 242 25.7
4 Europe 150 16.0
5 Other Asian or Oceania 142 15.1
6 Other 30 3.2
No answ er 15 1.6
No. of samples 940 100.0
0 10 20 30
5
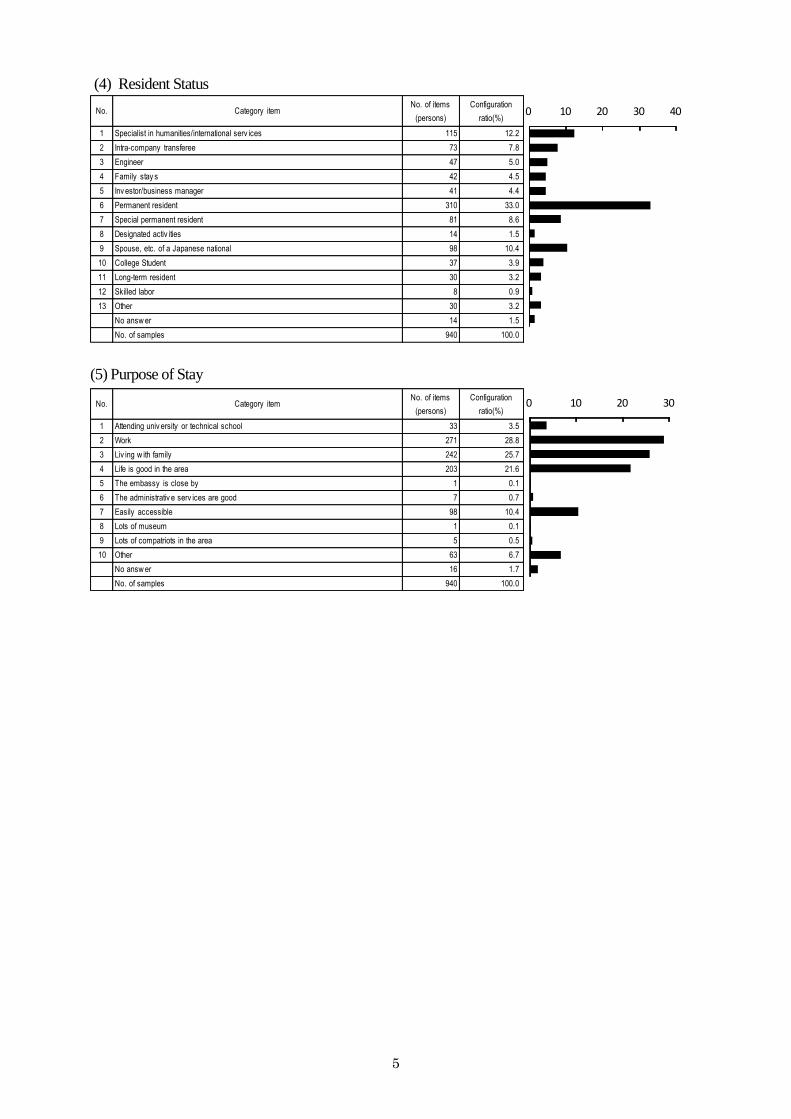
(4) Resident Status
No. Category itemNo. of items
(persons)
Configuration
ratio(%)
1 Specialist in humanities/international serv ices 115 12.2
2 Intra-company transferee 73 7.8
3 Engineer 47 5.0
4 Family stay s 42 4.5
5 Inv estor/business manager 41 4.4
6 Permanent resident 310 33.0
7 Special permanent resident 81 8.6
8 Designated activ ities 14 1.5
9 Spouse, etc. of a Japanese national 98 10.4
10 College Student 37 3.9
11 Long-term resident 30 3.2
12 Skilled labor 8 0.9
13 Other 30 3.2
No answ er 14 1.5
No. of samples 940 100.0
0 10 20 30 40
(5) Purpose of Stay
No. Category itemNo. of items
(persons)
Configuration
ratio(%)
1 Attending univ ersity or technical school 33 3.5
2 Work 271 28.8
3 Liv ing w ith family 242 25.7
4 Life is good in the area 203 21.6
5 The embassy is close by 1 0.1
6 The administrativ e serv ices are good 7 0.7
7 Easily accessible 98 10.4
8 Lots of museum 1 0.1
9 Lots of compatriots in the area 5 0.5
10 Other 63 6.7
No answ er 16 1.7
No. of samples 940 100.0
0 10 20 30
6
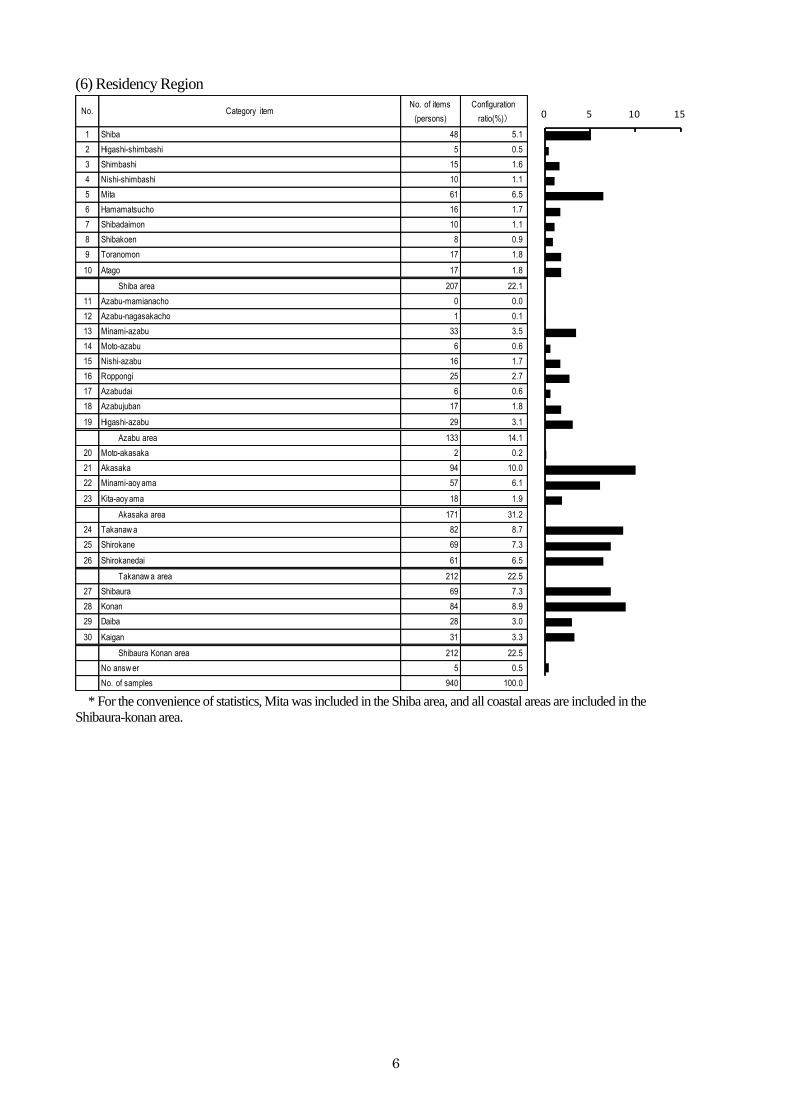
(6) Residency Region
No. Category itemNo. of items
(persons)
Configuration
ratio(%))
1 Shiba 48 5.1
2 Higashi-shimbashi 5 0.5
3 Shimbashi 15 1.6
4 Nishi-shimbashi 10 1.1
5 Mita 61 6.5
6 Hamamatsucho 16 1.7
7 Shibadaimon 10 1.1
8 Shibakoen 8 0.9
9 Toranomon 17 1.8
10 Atago 17 1.8
Shiba area 207 22.1
11 Azabu-mamianacho 0 0.0
12 Azabu-nagasakacho 1 0.1
13 Minami-azabu 33 3.5
14 Moto-azabu 6 0.6
15 Nishi-azabu 16 1.7
16 Roppongi 25 2.7
17 Azabudai 6 0.6
18 Azabujuban 17 1.8
19 Higashi-azabu 29 3.1
Azabu area 133 14.1
20 Moto-akasaka 2 0.2
21 Akasaka 94 10.0
22 Minami-aoy ama 57 6.1
23 Kita-aoy ama 18 1.9
Akasaka area 171 31.2
24 Takanaw a 82 8.7
25 Shirokane 69 7.3
26 Shirokanedai 61 6.5
Takanaw a area 212 22.5
27 Shibaura 69 7.3
28 Konan 84 8.9
29 Daiba 28 3.0
30 Kaigan 31 3.3
Shibaura Konan area 212 22.5
No answ er 5 0.5
No. of samples 940 100.0
0 5 10 15
* For the convenience of statistics, Mita was included in the Shiba area, and all coastal areas are included in the
Shibaura-konan area.
7
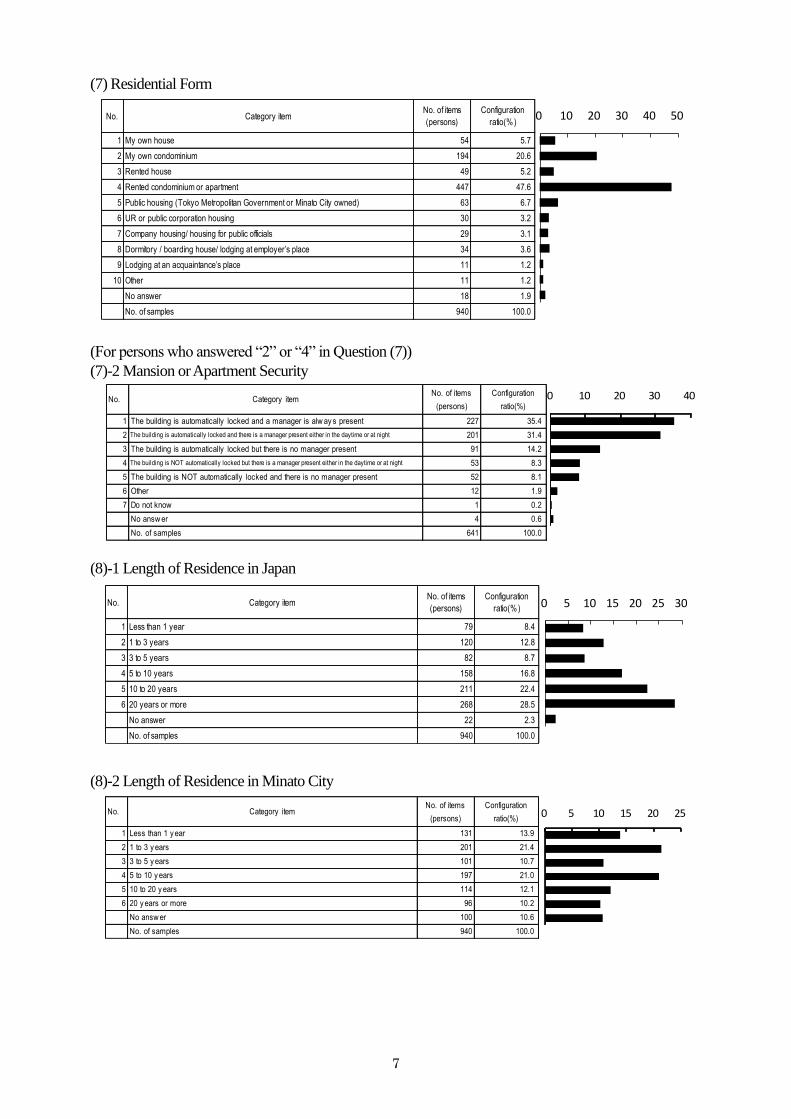
(7) Residential Form
No. Category itemNo. of items
(persons)
Configuration
ratio(%)
1 My own house 54 5.7
2 My own condominium 194 20.6
3 Rented house 49 5.2
4 Rented condominium or apartment 447 47.6
5 Public housing (Tokyo Metropolitan Government or Minato City owned) 63 6.7
6 UR or public corporation housing 30 3.2
7 Company housing/ housing for public officials 29 3.1
8 Dormitory / boarding house/ lodging at employer’s place 34 3.6
9 Lodging at an acquaintance’s place 11 1.2
10 Other 11 1.2
No answer 18 1.9
No. of samples 940 100.0
0 10 20 30 40 50
(For persons who answered “2” or “4” in Question (7)) (7)-2 Mansion or Apartment Security
(8)-1 Length of Residence in Japan
No. Category itemNo. of items
(persons)
Configuration
ratio(%)
1 Less than 1 year 79 8.4
2 1 to 3 years 120 12.8
3 3 to 5 years 82 8.7
4 5 to 10 years 158 16.8
5 10 to 20 years 211 22.4
6 20 years or more 268 28.5
No answer 22 2.3
No. of samples 940 100.0
0 5 10 15 20 25 30
(8)-2 Length of Residence in Minato City
No. Category itemNo. of items
(persons)
Configuration
ratio(%)
1 Less than 1 y ear 131 13.9
2 1 to 3 y ears 201 21.4
3 3 to 5 y ears 101 10.7
4 5 to 10 y ears 197 21.0
5 10 to 20 y ears 114 12.1
6 20 y ears or more 96 10.2
No answ er 100 10.6
No. of samples 940 100.0
0 5 10 15 20 25
No. Category itemNo. of items
(persons)
Configuration
ratio(%)
1 The building is automatically locked and a manager is alw ay s present 227 35.4
2 The building is automatically locked and there is a manager present either in the daytime or at night 201 31.4
3 The building is automatically locked but there is no manager present 91 14.2
4 The building is NOT automatically locked but there is a manager present either in the daytime or at night 53 8.3
5 The building is NOT automatically locked and there is no manager present 52 8.1
6 Other 12 1.9
7 Do not know 1 0.2
No answ er 4 0.6
No. of samples 641 100.0
0 10 20 30 40
8
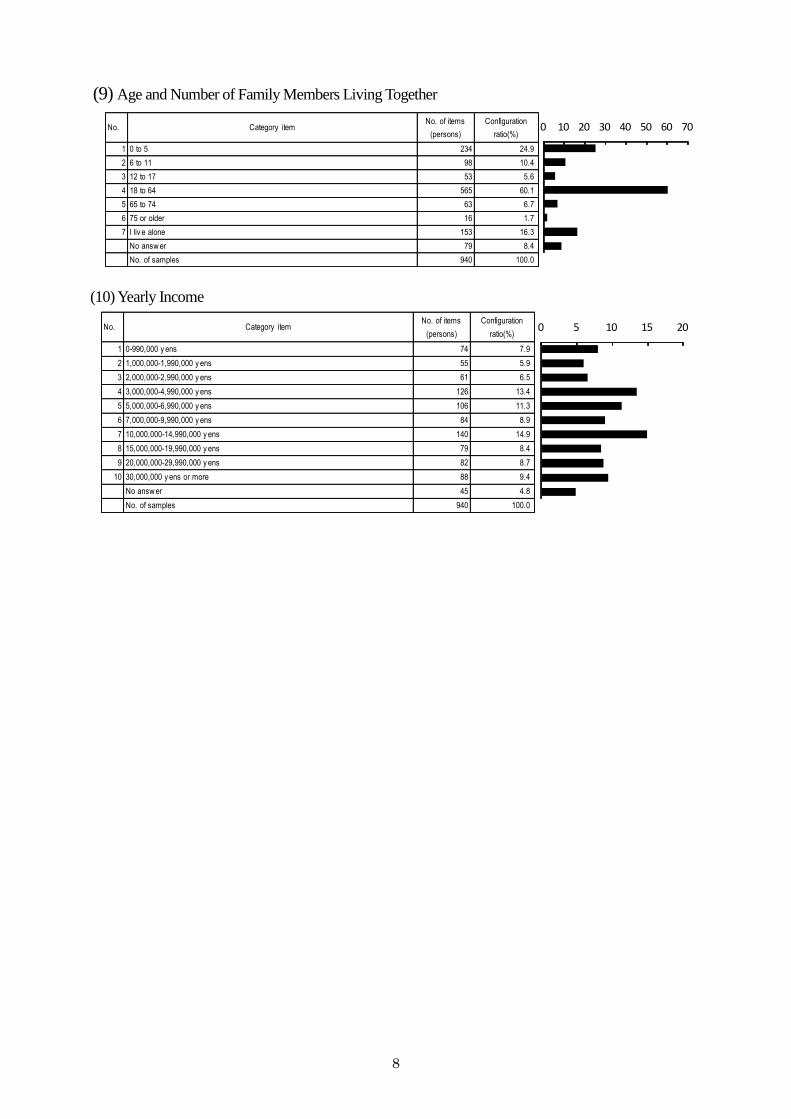
(9) Age and Number of Family Members Living Together
No. Category itemNo. of items
(persons)
Configuration
ratio(%)
1 0 to 5 234 24.9
2 6 to 11 98 10.4
3 12 to 17 53 5.6
4 18 to 64 565 60.1
5 65 to 74 63 6.7
6 75 or older 16 1.7
7 I liv e alone 153 16.3
No answ er 79 8.4
No. of samples 940 100.0
0 10 20 30 40 50 60 70
(10) Yearly Income
No. Category itemNo. of items
(persons)
Configuration
ratio(%)
1 0-990,000 y ens 74 7.9
2 1,000,000-1,990,000 y ens 55 5.9
3 2,000,000-2,990,000 y ens 61 6.5
4 3,000,000-4,990,000 y ens 126 13.4
5 5,000,000-6,990,000 y ens 106 11.3
6 7,000,000-9,990,000 y ens 84 8.9
7 10,000,000-14,990,000 y ens 140 14.9
8 15,000,000-19,990,000 y ens 79 8.4
9 20,000,000-29,990,000 y ens 82 8.7
10 30,000,000 y ens or more 88 9.4
No answ er 45 4.8
No. of samples 940 100.0
0 5 10 15 20
Section 3 Analysis of Survey Results

9
Section 3 Analysis of Survey Results
1.Language
(1) Level of Japanese Abilities
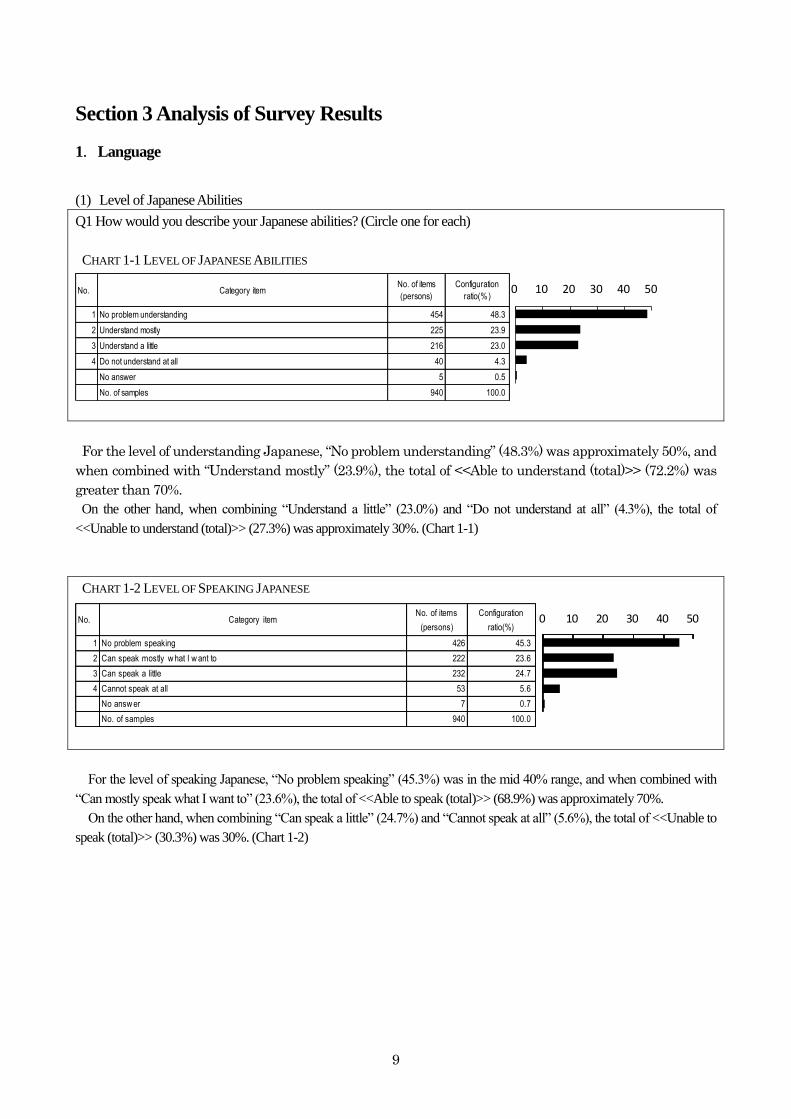
Q1 How would you describe your Japanese abilities? (Circle one for each)
CHART 1-1 LEVEL OF JAPANESE ABILITIES
No. Category itemNo. of items
(persons)
Configuration
ratio(%)
1 No problem understanding 454 48.3
2 Understand mostly 225 23.9
3 Understand a little 216 23.0
4 Do not understand at all 40 4.3
No answer 5 0.5
No. of samples 940 100.0
0 10 20 30 40 50
For the level of understanding Japanese, “No problem understanding” (48.3%) was approximately 50%, and
when combined with “Understand mostly” (23.9%), the total of <<Able to understand (total)>> (72.2%) was
greater than 70%.
On the other hand, when combining “Understand a little” (23.0%) and “Do not understand at all” (4.3%), the total of
<<Unable to understand (total)>> (27.3%) was approximately 30%. (Chart 1-1)
CHART 1-2 LEVEL OF SPEAKING JAPANESE
No. Category itemNo. of items
(persons)
Configuration
ratio(%)
1 No problem speaking 426 45.3
2 Can speak mostly w hat I w ant to 222 23.6
3 Can speak a little 232 24.7
4 Cannot speak at all 53 5.6
No answ er 7 0.7
No. of samples 940 100.0
0 10 20 30 40 50
For the level of speaking Japanese, “No problem speaking” (45.3%) was in the mid 40% range, and when combined with
“Can mostly speak what I want to” (23.6%), the total of <<Able to speak (total)>> (68.9%) was approximately 70%.
On the other hand, when combining “Can speak a little” (24.7%) and “Cannot speak at all” (5.6%), the total of <<Unable to
speak (total)>> (30.3%) was 30%. (Chart 1-2)
10
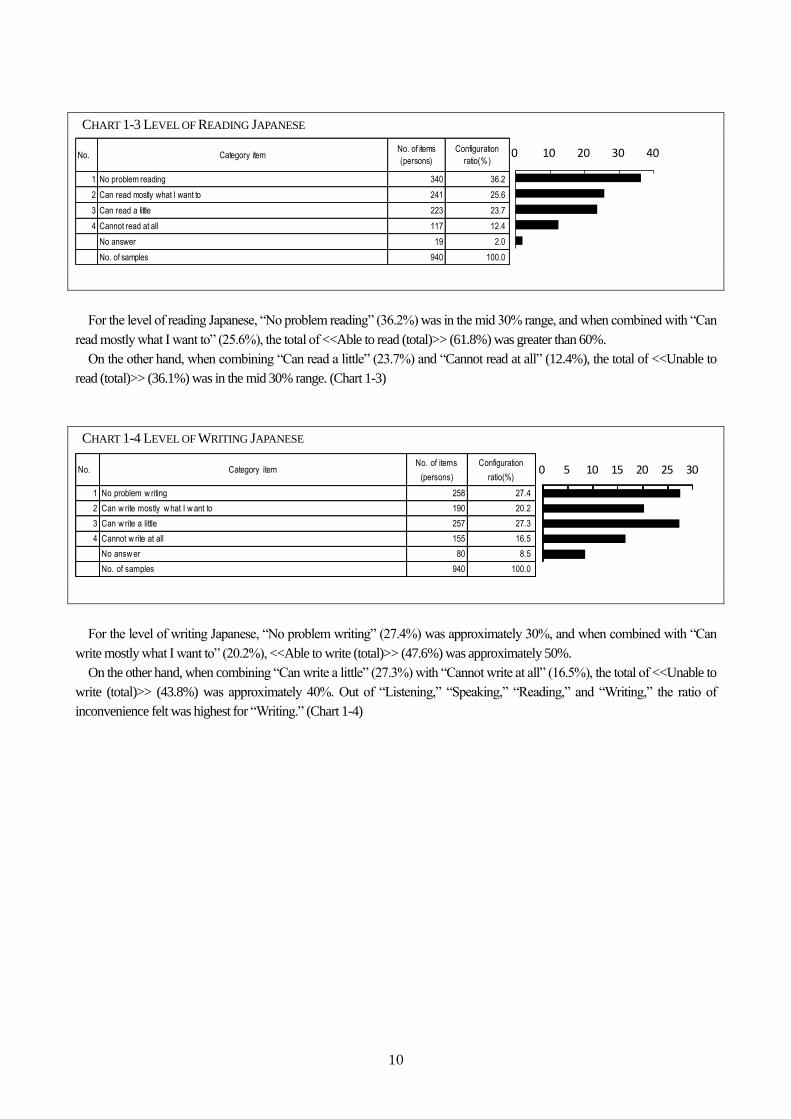
CHART 1-3 LEVEL OF READING JAPANESE
No. Category itemNo. of items
(persons)
Configuration
ratio(%)
1 No problem reading 340 36.2
2 Can read mostly what I want to 241 25.6
3 Can read a little 223 23.7
4 Cannot read at all 117 12.4
No answer 19 2.0
No. of samples 940 100.0
0 10 20 30 40
For the level of reading Japanese, “No problem reading” (36.2%) was in the mid 30% range, and when combined with “Can
read mostly what I want to” (25.6%), the total of <<Able to read (total)>> (61.8%) was greater than 60%.
On the other hand, when combining “Can read a little” (23.7%) and “Cannot read at all” (12.4%), the total of <<Unable to
read (total)>> (36.1%) was in the mid 30% range. (Chart 1-3)
CHART 1-4 LEVEL OF WRITING JAPANESE
No. Category itemNo. of items
(persons)
Configuration
ratio(%)
1 No problem w riting 258 27.4
2 Can w rite mostly w hat I w ant to 190 20.2
3 Can w rite a little 257 27.3
4 Cannot w rite at all 155 16.5
No answ er 80 8.5
No. of samples 940 100.0
0 5 10 15 20 25 30
For the level of writing Japanese, “No problem writing” (27.4%) was approximately 30%, and when combined with “Can
write mostly what I want to” (20.2%), <<Able to write (total)>> (47.6%) was approximately 50%.
On the other hand, when combining “Can write a little” (27.3%) with “Cannot write at all” (16.5%), the total of <<Unable to
write (total)>> (43.8%) was approximately 40%. Out of “Listening,” “Speaking,” “Reading,” and “Writing,” the ratio of
inconvenience felt was highest for “Writing.” (Chart 1-4)
11
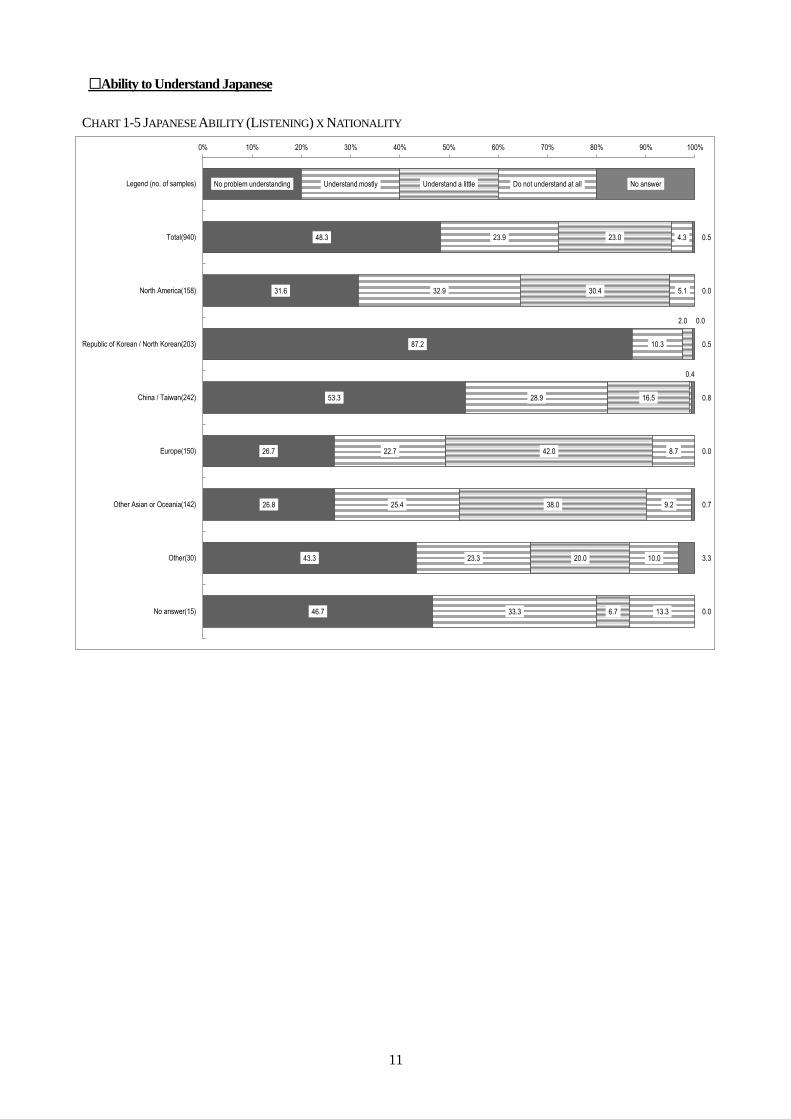
□Ability to Understand Japanese
CHART 1-5 JAPANESE ABILITY (LISTENING) X NATIONALITY
No problem understanding
48.3
31.6
87.2
53.3
26.7
26.8
43.3
46.7
Understand mostly
23.9
32.9
10.3
28.9
22.7
25.4
23.3
33.3
Understand a little
23.0
30.4
2.0
16.5
42.0
38.0
20.0
6.7
Do not understand at all
4.3
5.1
0.0
0.4
8.7
9.2
10.0
13.3
No answer
0.5
0.0
0.5
0.8
0.0
0.7
3.3
0.0
0% 10% 20% 30% 40% 50% 60% 70% 80% 90% 100%
Legend (no. of samples)
Total(940)
North America(158)
Republic of Korean / North Korean(203)
China / Taiwan(242)
Europe(150)
Other Asian or Oceania(142)
Other(30)
No answer(15)
12
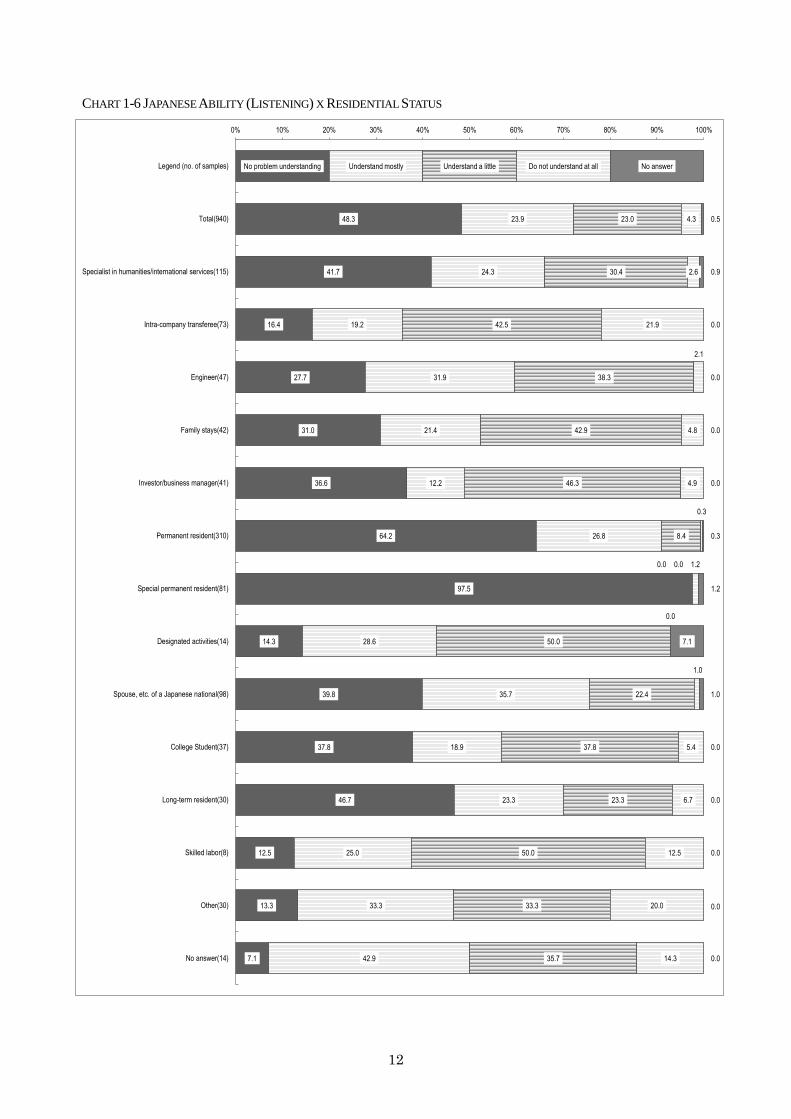
CHART 1-6 JAPANESE ABILITY (LISTENING) X RESIDENTIAL STATUS
No problem understanding
48.3
41.7
16.4
27.7
31.0
36.6
64.2
97.5
14.3
39.8
37.8
46.7
12.5
13.3
7.1
Understand mostly
23.9
24.3
19.2
31.9
21.4
12.2
26.8
0.0
28.6
35.7
18.9
23.3
25.0
33.3
42.9
Understand a little
23.0
30.4
42.5
38.3
42.9
46.3
8.4
0.0
50.0
22.4
37.8
23.3
50.0
33.3
35.7
Do not understand at all
4.3
2.6
21.9
2.1
4.8
4.9
0.3
1.2
0.0
1.0
5.4
6.7
12.5
20.0
14.3
No answer
0.5
0.9
0.0
0.0
0.0
0.0
0.3
1.2
7.1
1.0
0.0
0.0
0.0
0.0
0.0
0% 10% 20% 30% 40% 50% 60% 70% 80% 90% 100%
Legend (no. of samples)
Total(940)
Specialist in humanities/international services(115)
Intra-company transferee(73)
Engineer(47)
Family stays(42)
Investor/business manager(41)
Permanent resident(310)
Special permanent resident(81)
Designated activities(14)
Spouse, etc. of a Japanese national(98)
College Student(37)
Long-term resident(30)
Skilled labor(8)
Other(30)
No answer(14)
13
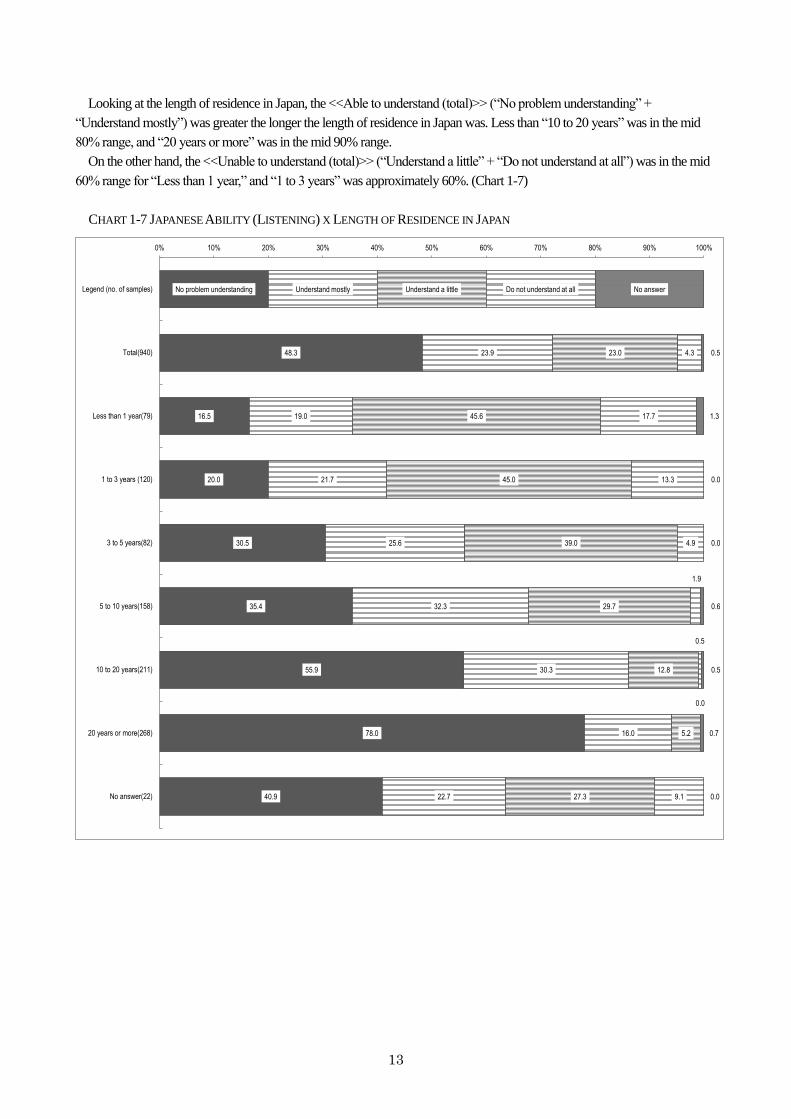
Looking at the length of residence in Japan, the <<Able to understand (total)>> (“No problem understanding” +
“Understand mostly”) was greater the longer the length of residence in Japan was. Less than “10 to 20 years” was in the mid
80% range, and “20 years or more” was in the mid 90% range.
On the other hand, the <<Unable to understand (total)>> (“Understand a little” + “Do not understand at all”) was in the mid
60% range for “Less than 1 year,” and “1 to 3 years” was approximately 60%. (Chart 1-7)
CHART 1-7 JAPANESE ABILITY (LISTENING) X LENGTH OF RESIDENCE IN JAPAN
No problem understanding
48.3
16.5
20.0
30.5
35.4
55.9
78.0
40.9
Understand mostly
23.9
19.0
21.7
25.6
32.3
30.3
16.0
22.7
Understand a little
23.0
45.6
45.0
39.0
29.7
12.8
5.2
27.3
Do not understand at all
4.3
17.7
13.3
4.9
1.9
0.5
0.0
9.1
No answer
0.5
1.3
0.0
0.0
0.6
0.5
0.7
0.0
0% 10% 20% 30% 40% 50% 60% 70% 80% 90% 100%
Legend (no. of samples)
Total(940)
Less than 1 year(79)
1 to 3 years (120)
3 to 5 years(82)
5 to 10 years(158)
10 to 20 years(211)
20 years or more(268)
No answer(22)
14
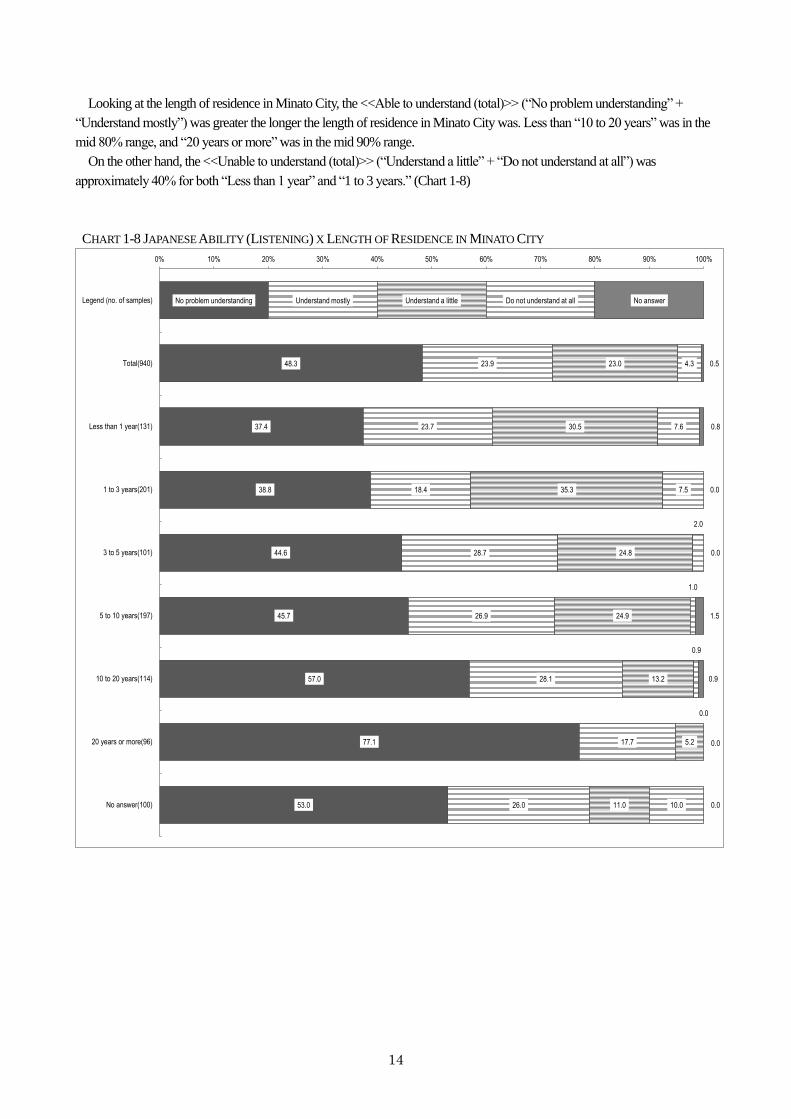
Looking at the length of residence in Minato City, the <<Able to understand (total)>> (“No problem understanding” +
“Understand mostly”) was greater the longer the length of residence in Minato City was. Less than “10 to 20 years” was in the
mid 80% range, and “20 years or more” was in the mid 90% range.
On the other hand, the <<Unable to understand (total)>> (“Understand a little” + “Do not understand at all”) was
approximately 40% for both “Less than 1 year” and “1 to 3 years.” (Chart 1-8)
CHART 1-8 JAPANESE ABILITY (LISTENING) X LENGTH OF RESIDENCE IN MINATO CITY
No problem understanding
48.3
37.4
38.8
44.6
45.7
57.0
77.1
53.0
Understand mostly
23.9
23.7
18.4
28.7
26.9
28.1
17.7
26.0
Understand a little
23.0
30.5
35.3
24.8
24.9
13.2
5.2
11.0
Do not understand at all
4.3
7.6
7.5
2.0
1.0
0.9
0.0
10.0
No answer
0.5
0.8
0.0
0.0
1.5
0.9
0.0
0.0
0% 10% 20% 30% 40% 50% 60% 70% 80% 90% 100%
Legend (no. of samples)
Total(940)
Less than 1 year(131)
1 to 3 years(201)
3 to 5 years(101)
5 to 10 years(197)
10 to 20 years(114)
20 years or more(96)
No answer(100)
15
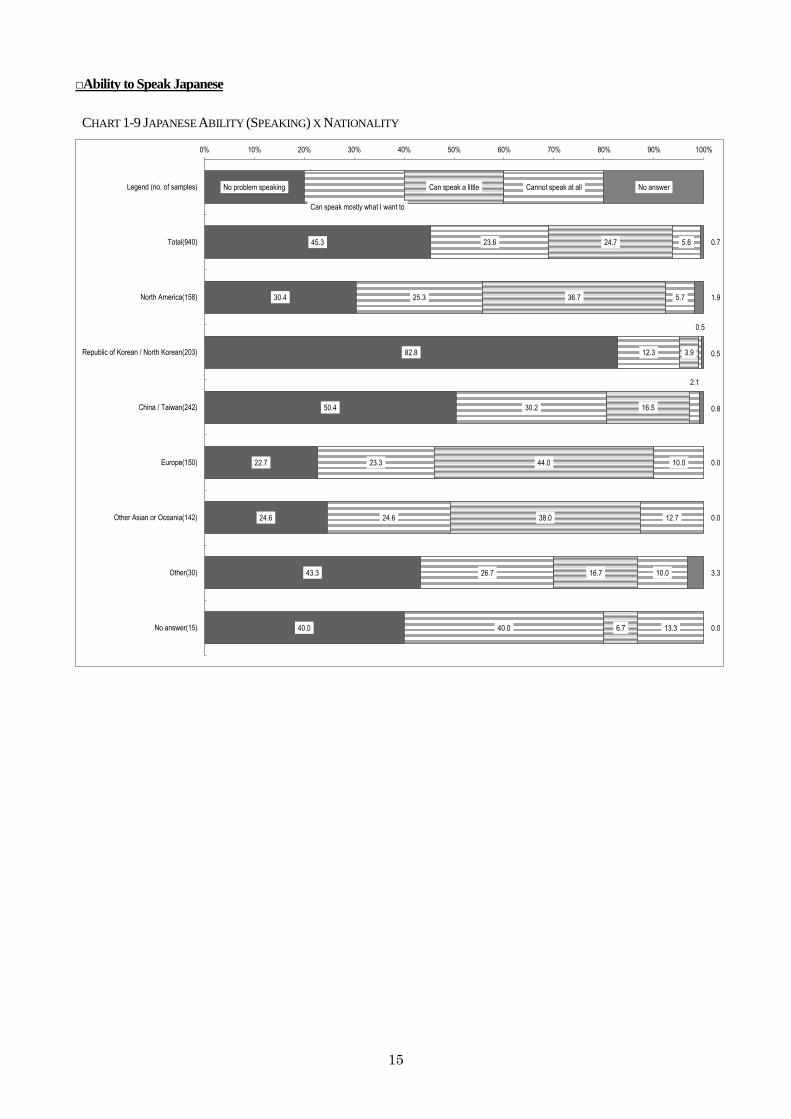
□Ability to Speak Japanese
CHART 1-9 JAPANESE ABILITY (SPEAKING) X NATIONALITY
No problem speaking
45.3
30.4
82.8
50.4
22.7
24.6
43.3
40.0
Can speak mostly what I want to
23.6
25.3
12.3
30.2
23.3
24.6
26.7
40.0
Can speak a little
24.7
36.7
3.9
16.5
44.0
38.0
16.7
6.7
Cannot speak at all
5.6
5.7
0.5
2.1
10.0
12.7
10.0
13.3
No answer
0.7
1.9
0.5
0.8
0.0
0.0
3.3
0.0
0% 10% 20% 30% 40% 50% 60% 70% 80% 90% 100%
Legend (no. of samples)
Total(940)
North America(158)
Republic of Korean / North Korean(203)
China / Taiwan(242)
Europe(150)
Other Asian or Oceania(142)
Other(30)
No answer(15)
16
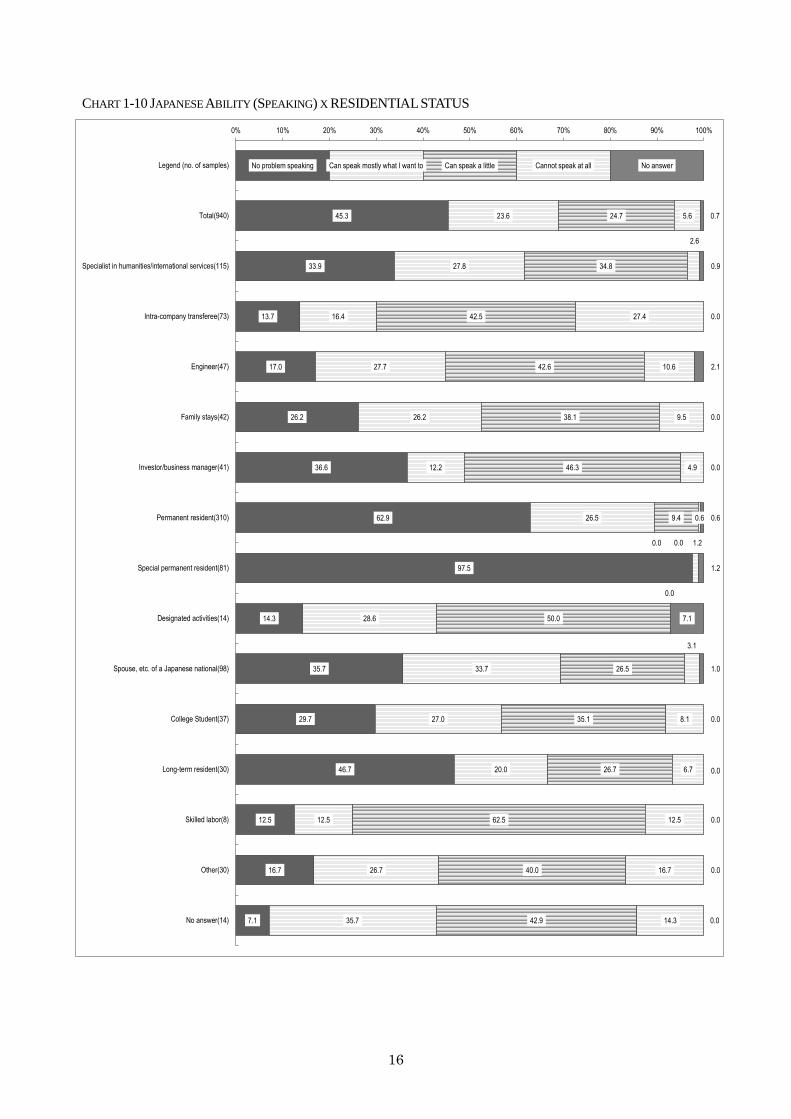
CHART 1-10 JAPANESE ABILITY (SPEAKING) X RESIDENTIAL STATUS
No problem speaking
45.3
33.9
13.7
17.0
26.2
36.6
62.9
97.5
14.3
35.7
29.7
46.7
12.5
16.7
7.1
Can speak mostly what I want to
23.6
27.8
16.4
27.7
26.2
12.2
26.5
0.0
28.6
33.7
27.0
20.0
12.5
26.7
35.7
Can speak a little
24.7
34.8
42.5
42.6
38.1
46.3
9.4
0.0
50.0
26.5
35.1
26.7
62.5
40.0
42.9
Cannot speak at all
5.6
2.6
27.4
10.6
9.5
4.9
0.6
1.2
0.0
3.1
8.1
6.7
12.5
16.7
14.3
No answer
0.7
0.9
0.0
2.1
0.0
0.0
0.6
1.2
7.1
1.0
0.0
0.0
0.0
0.0
0.0
0% 10% 20% 30% 40% 50% 60% 70% 80% 90% 100%
Legend (no. of samples)
Total(940)
Specialist in humanities/international services(115)
Intra-company transferee(73)
Engineer(47)
Family stays(42)
Investor/business manager(41)
Permanent resident(310)
Special permanent resident(81)
Designated activities(14)
Spouse, etc. of a Japanese national(98)
College Student(37)
Long-term resident(30)
Skilled labor(8)
Other(30)
No answer(14)
17
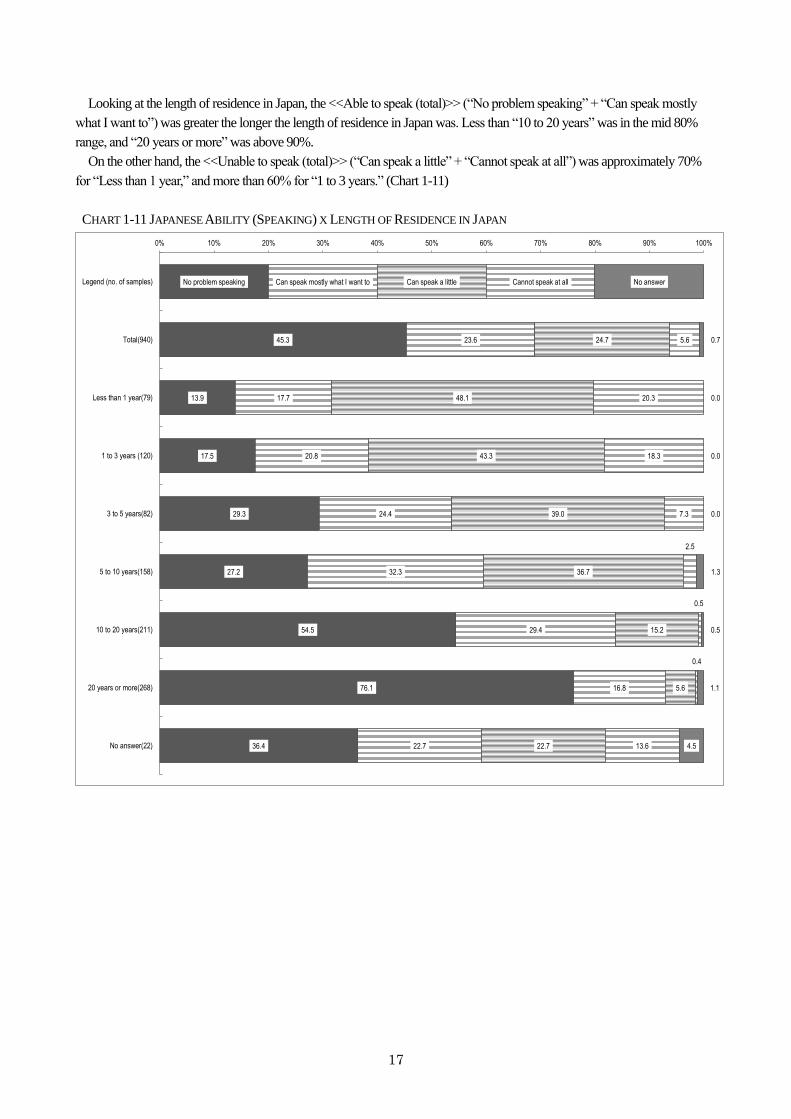
Looking at the length of residence in Japan, the <<Able to speak (total)>> (“No problem speaking” + “Can speak mostly
what I want to”) was greater the longer the length of residence in Japan was. Less than “10 to 20 years” was in the mid 80%
range, and “20 years or more” was above 90%.
On the other hand, the <<Unable to speak (total)>> (“Can speak a little” + “Cannot speak at all”) was approximately 70%
for “Less than 1 year,” and more than 60% for “1 to 3 years.” (Chart 1-11)
CHART 1-11 JAPANESE ABILITY (SPEAKING) X LENGTH OF RESIDENCE IN JAPAN
No problem speaking
45.3
13.9
17.5
29.3
27.2
54.5
76.1
36.4
Can speak mostly what I want to
23.6
17.7
20.8
24.4
32.3
29.4
16.8
22.7
Can speak a little
24.7
48.1
43.3
39.0
36.7
15.2
5.6
22.7
Cannot speak at all
5.6
20.3
18.3
7.3
2.5
0.5
0.4
13.6
No answer
0.7
0.0
0.0
0.0
1.3
0.5
1.1
4.5
0% 10% 20% 30% 40% 50% 60% 70% 80% 90% 100%
Legend (no. of samples)
Total(940)
Less than 1 year(79)
1 to 3 years (120)
3 to 5 years(82)
5 to 10 years(158)
10 to 20 years(211)
20 years or more(268)
No answer(22)
18
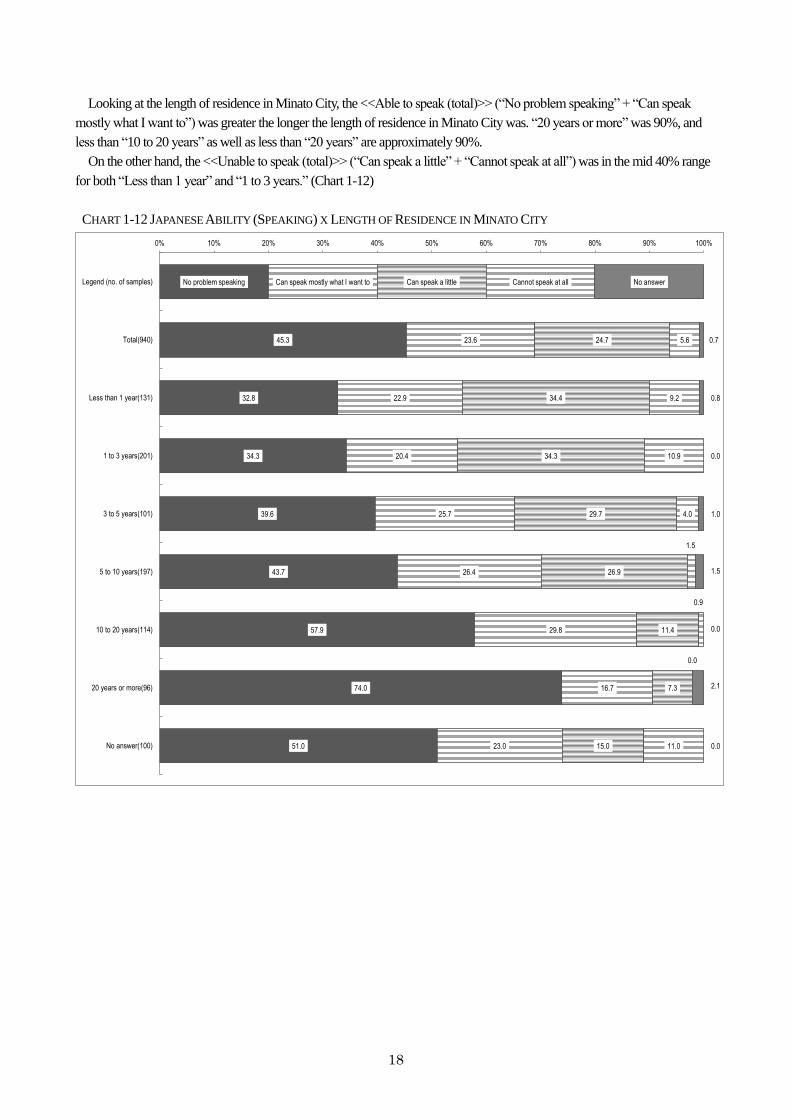
Looking at the length of residence in Minato City, the <<Able to speak (total)>> (“No problem speaking” + “Can speak
mostly what I want to”) was greater the longer the length of residence in Minato City was. “20 years or more” was 90%, and
less than “10 to 20 years” as well as less than “20 years” are approximately 90%.
On the other hand, the <<Unable to speak (total)>> (“Can speak a little” + “Cannot speak at all”) was in the mid 40% range
for both “Less than 1 year” and “1 to 3 years.” (Chart 1-12)
CHART 1-12 JAPANESE ABILITY (SPEAKING) X LENGTH OF RESIDENCE IN MINATO CITY
No problem speaking
45.3
32.8
34.3
39.6
43.7
57.9
74.0
51.0
Can speak mostly what I want to
23.6
22.9
20.4
25.7
26.4
29.8
16.7
23.0
Can speak a little
24.7
34.4
34.3
29.7
26.9
11.4
7.3
15.0
Cannot speak at all
5.6
9.2
10.9
4.0
1.5
0.9
0.0
11.0
No answer
0.7
0.8
0.0
1.0
1.5
0.0
2.1
0.0
0% 10% 20% 30% 40% 50% 60% 70% 80% 90% 100%
Legend (no. of samples)
Total(940)
Less than 1 year(131)
1 to 3 years(201)
3 to 5 years(101)
5 to 10 years(197)
10 to 20 years(114)
20 years or more(96)
No answer(100)
19
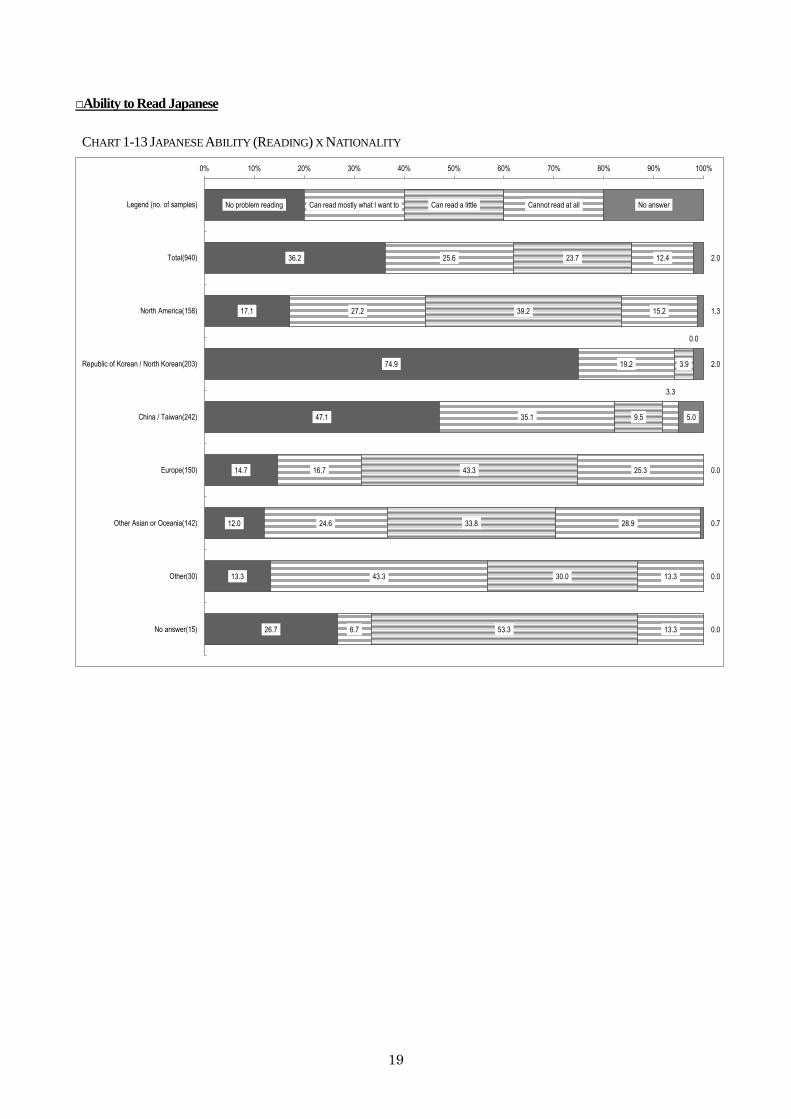
□Ability to Read Japanese
CHART 1-13 JAPANESE ABILITY (READING) X NATIONALITY
No problem reading
36.2
17.1
74.9
47.1
14.7
12.0
13.3
26.7
Can read mostly what I want to
25.6
27.2
19.2
35.1
16.7
24.6
43.3
6.7
Can read a little
23.7
39.2
3.9
9.5
43.3
33.8
30.0
53.3
Cannot read at all
12.4
15.2
0.0
3.3
25.3
28.9
13.3
13.3
No answer
2.0
1.3
2.0
5.0
0.0
0.7
0.0
0.0
0% 10% 20% 30% 40% 50% 60% 70% 80% 90% 100%
Legend (no. of samples)
Total(940)
North America(158)
Republic of Korean / North Korean(203)
China / Taiwan(242)
Europe(150)
Other Asian or Oceania(142)
Other(30)
No answer(15)
20
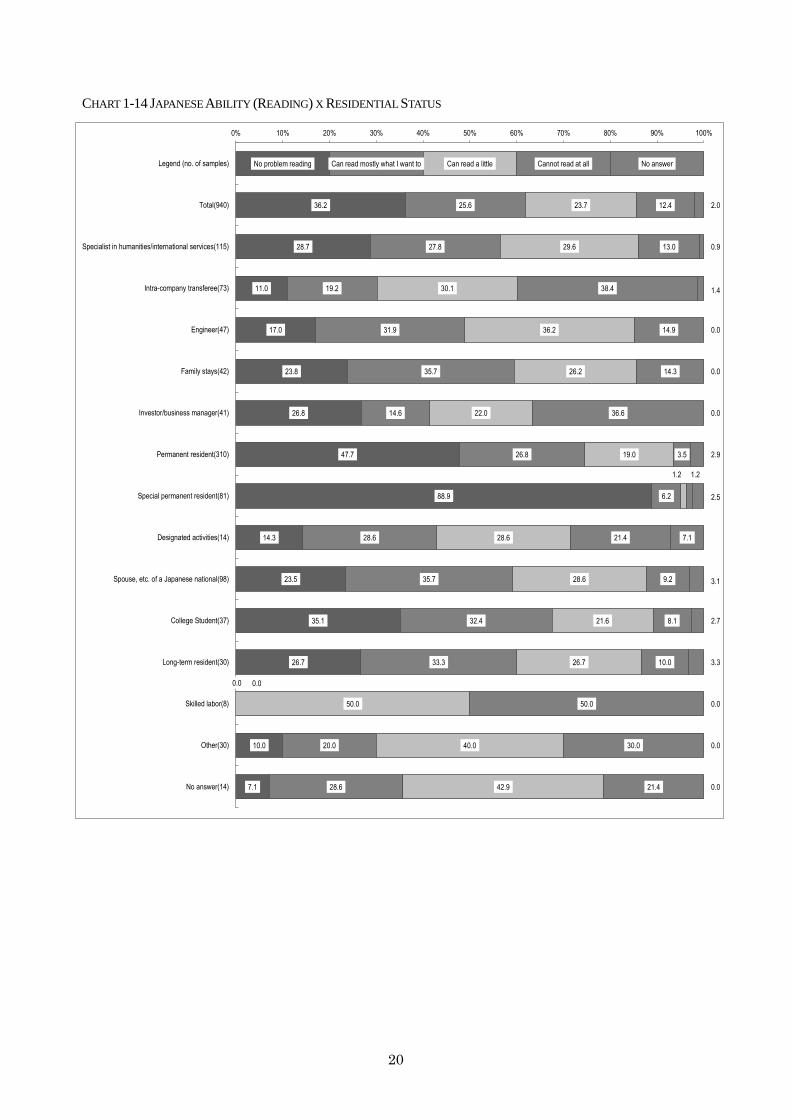
CHART 1-14 JAPANESE ABILITY (READING) X RESIDENTIAL STATUS
No problem reading
36.2
28.7
11.0
17.0
23.8
26.8
47.7
88.9
14.3
23.5
35.1
26.7
0.0
10.0
7.1
Can read mostly what I want to
25.6
27.8
19.2
31.9
35.7
14.6
26.8
6.2
28.6
35.7
32.4
33.3
0.0
20.0
28.6
Can read a little
23.7
29.6
30.1
36.2
26.2
22.0
19.0
1.2
28.6
28.6
21.6
26.7
50.0
40.0
42.9
Cannot read at all
12.4
13.0
38.4
14.9
14.3
36.6
3.5
1.2
21.4
9.2
8.1
10.0
50.0
30.0
21.4
No answer
2.0
0.9
1.4
0.0
0.0
0.0
2.9
2.5
7.1
3.1
2.7
3.3
0.0
0.0
0.0
0% 10% 20% 30% 40% 50% 60% 70% 80% 90% 100%
Legend (no. of samples)
Total(940)
Specialist in humanities/international services(115)
Intra-company transferee(73)
Engineer(47)
Family stays(42)
Investor/business manager(41)
Permanent resident(310)
Special permanent resident(81)
Designated activities(14)
Spouse, etc. of a Japanese national(98)
College Student(37)
Long-term resident(30)
Skilled labor(8)
Other(30)
No answer(14)
21
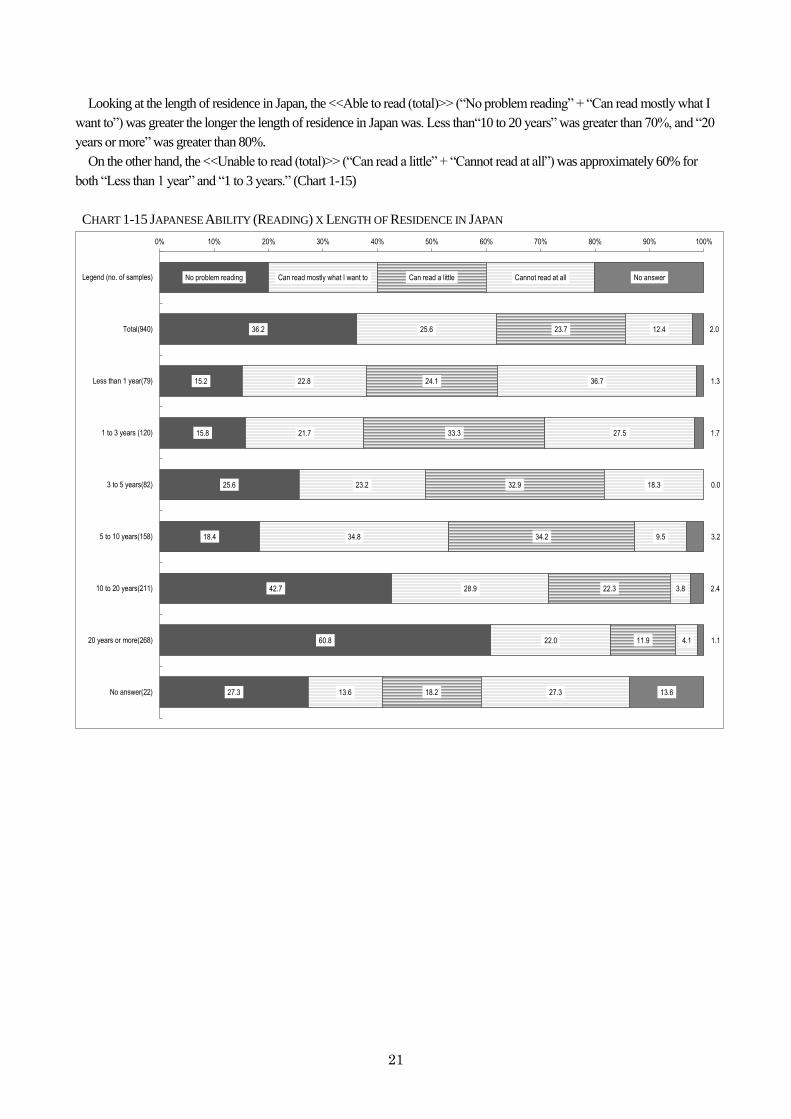
Looking at the length of residence in Japan, the <<Able to read (total)>> (“No problem reading” + “Can read mostly what I
want to”) was greater the longer the length of residence in Japan was. Less than“10 to 20 years” was greater than 70%, and “20
years or more” was greater than 80%.
On the other hand, the <<Unable to read (total)>> (“Can read a little” + “Cannot read at all”) was approximately 60% for
both “Less than 1 year” and “1 to 3 years.” (Chart 1-15)
CHART 1-15 JAPANESE ABILITY (READING) X LENGTH OF RESIDENCE IN JAPAN
No problem reading
36.2
15.2
15.8
25.6
18.4
42.7
60.8
27.3
Can read mostly what I want to
25.6
22.8
21.7
23.2
34.8
28.9
22.0
13.6
Can read a little
23.7
24.1
33.3
32.9
34.2
22.3
11.9
18.2
Cannot read at all
12.4
36.7
27.5
18.3
9.5
3.8
4.1
27.3
No answer
2.0
1.3
1.7
0.0
3.2
2.4
1.1
13.6
0% 10% 20% 30% 40% 50% 60% 70% 80% 90% 100%
Legend (no. of samples)
Total(940)
Less than 1 year(79)
1 to 3 years (120)
3 to 5 years(82)
5 to 10 years(158)
10 to 20 years(211)
20 years or more(268)
No answer(22)
22
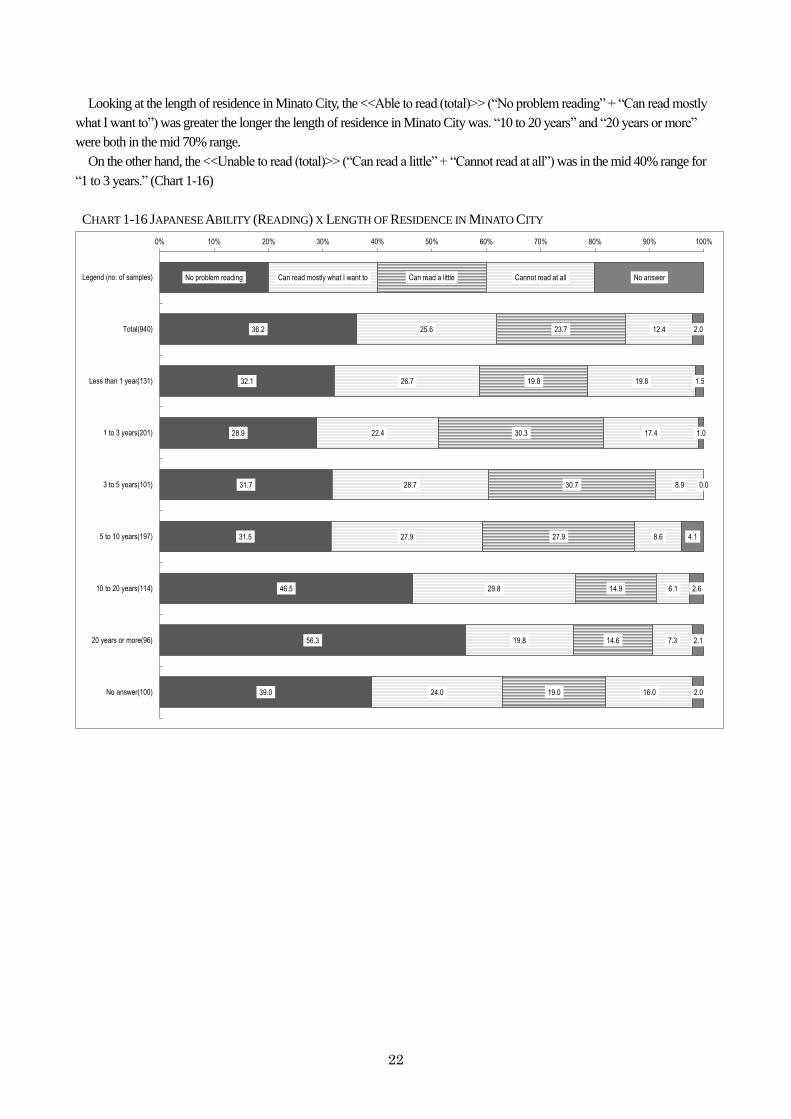
Looking at the length of residence in Minato City, the <<Able to read (total)>> (“No problem reading” + “Can read mostly
what I want to”) was greater the longer the length of residence in Minato City was. “10 to 20 years” and “20 years or more”
were both in the mid 70% range.
On the other hand, the <<Unable to read (total)>> (“Can read a little” + “Cannot read at all”) was in the mid 40% range for
“1 to 3 years.” (Chart 1-16)
CHART 1-16 JAPANESE ABILITY (READING) X LENGTH OF RESIDENCE IN MINATO CITY
No problem reading
36.2
32.1
28.9
31.7
31.5
46.5
56.3
39.0
Can read mostly what I want to
25.6
26.7
22.4
28.7
27.9
29.8
19.8
24.0
Can read a little
23.7
19.8
30.3
30.7
27.9
14.9
14.6
19.0
Cannot read at all
12.4
19.8
17.4
8.9
8.6
6.1
7.3
16.0
No answer
2.0
1.5
1.0
0.0
4.1
2.6
2.1
2.0
0% 10% 20% 30% 40% 50% 60% 70% 80% 90% 100%
Legend (no. of samples)
Total(940)
Less than 1 year(131)
1 to 3 years(201)
3 to 5 years(101)
5 to 10 years(197)
10 to 20 years(114)
20 years or more(96)
No answer(100)
23
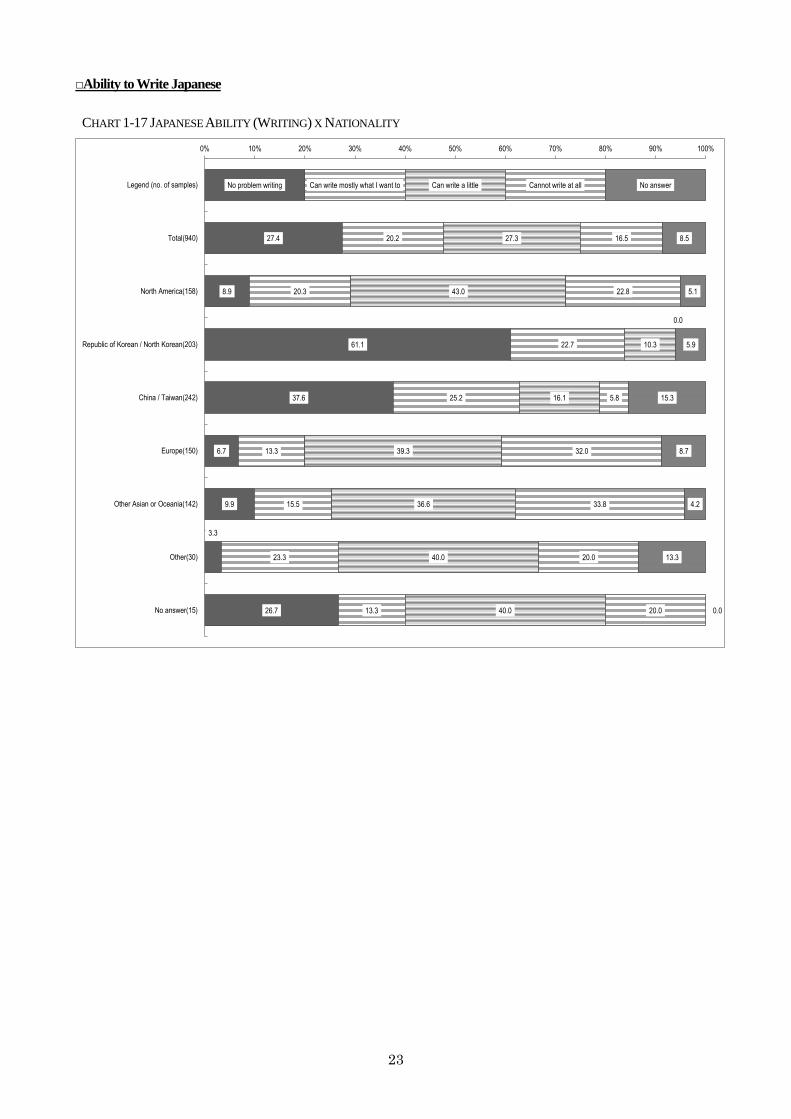
□Ability to Write Japanese
CHART 1-17 JAPANESE ABILITY (WRITING) X NATIONALITY
No problem writing
27.4
8.9
61.1
37.6
6.7
9.9
3.3
26.7
Can write mostly what I want to
20.2
20.3
22.7
25.2
13.3
15.5
23.3
13.3
Can write a little
27.3
43.0
10.3
16.1
39.3
36.6
40.0
40.0
Cannot write at all
16.5
22.8
0.0
5.8
32.0
33.8
20.0
20.0
No answer
8.5
5.1
5.9
15.3
8.7
4.2
13.3
0.0
0% 10% 20% 30% 40% 50% 60% 70% 80% 90% 100%
Legend (no. of samples)
Total(940)
North America(158)
Republic of Korean / North Korean(203)
China / Taiwan(242)
Europe(150)
Other Asian or Oceania(142)
Other(30)
No answer(15)
24
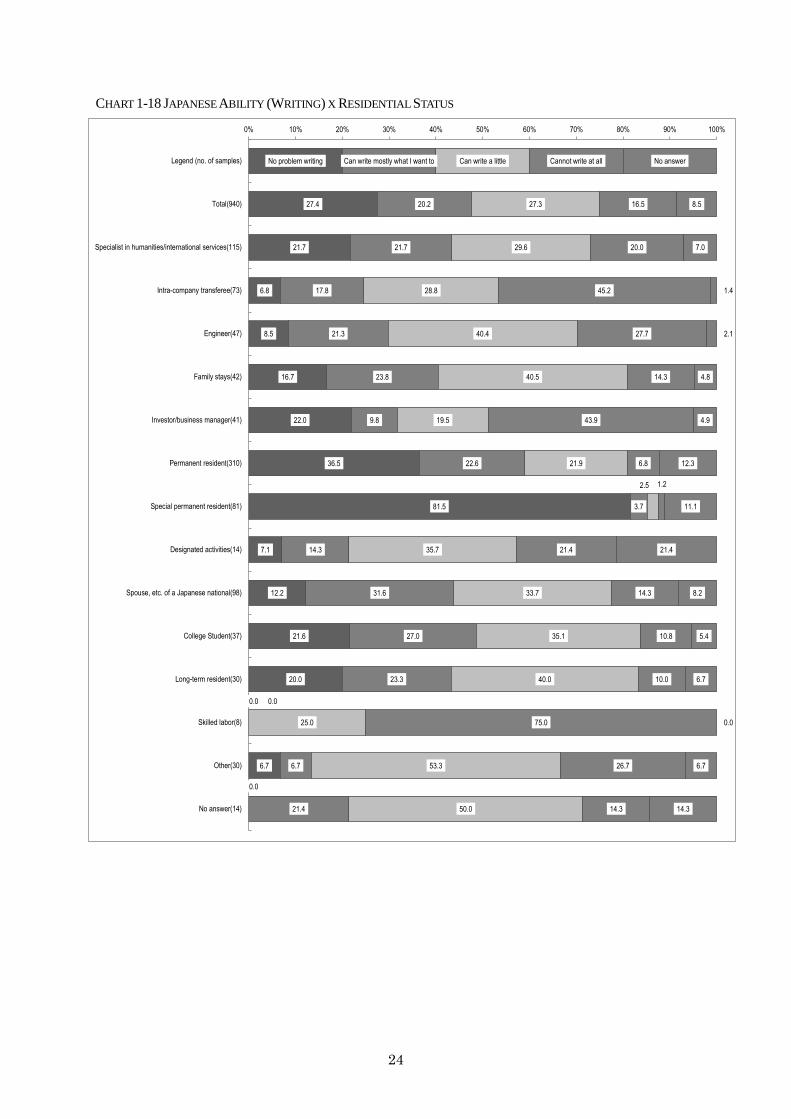
CHART 1-18 JAPANESE ABILITY (WRITING) X RESIDENTIAL STATUS
No problem writing
27.4
21.7
6.8
8.5
16.7
22.0
36.5
81.5
7.1
12.2
21.6
20.0
0.0
6.7
0.0
Can write mostly what I want to
20.2
21.7
17.8
21.3
23.8
9.8
22.6
3.7
14.3
31.6
27.0
23.3
0.0
6.7
21.4
Can write a little
27.3
29.6
28.8
40.4
40.5
19.5
21.9
2.5
35.7
33.7
35.1
40.0
25.0
53.3
50.0
Cannot write at all
16.5
20.0
45.2
27.7
14.3
43.9
6.8
1.2
21.4
14.3
10.8
10.0
75.0
26.7
14.3
No answer
8.5
7.0
1.4
2.1
4.8
4.9
12.3
11.1
21.4
8.2
5.4
6.7
0.0
6.7
14.3
0% 10% 20% 30% 40% 50% 60% 70% 80% 90% 100%
Legend (no. of samples)
Total(940)
Specialist in humanities/international services(115)
Intra-company transferee(73)
Engineer(47)
Family stays(42)
Investor/business manager(41)
Permanent resident(310)
Special permanent resident(81)
Designated activities(14)
Spouse, etc. of a Japanese national(98)
College Student(37)
Long-term resident(30)
Skilled labor(8)
Other(30)
No answer(14)
25
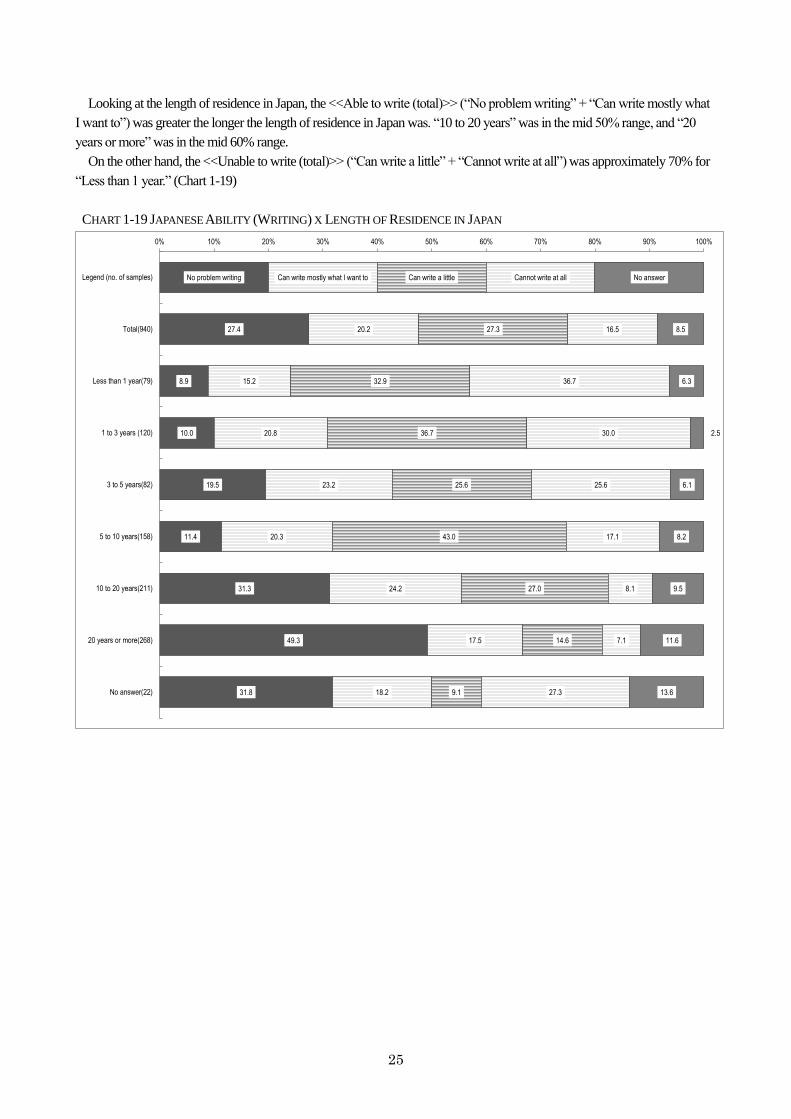
Looking at the length of residence in Japan, the <<Able to write (total)>> (“No problem writing” + “Can write mostly what
I want to”) was greater the longer the length of residence in Japan was. “10 to 20 years” was in the mid 50% range, and “20
years or more” was in the mid 60% range.
On the other hand, the <<Unable to write (total)>> (“Can write a little” + “Cannot write at all”) was approximately 70% for
“Less than 1 year.” (Chart 1-19)
CHART 1-19 JAPANESE ABILITY (WRITING) X LENGTH OF RESIDENCE IN JAPAN
No problem writing
27.4
8.9
10.0
19.5
11.4
31.3
49.3
31.8
Can write mostly what I want to
20.2
15.2
20.8
23.2
20.3
24.2
17.5
18.2
Can write a little
27.3
32.9
36.7
25.6
43.0
27.0
14.6
9.1
Cannot write at all
16.5
36.7
30.0
25.6
17.1
8.1
7.1
27.3
No answer
8.5
6.3
2.5
6.1
8.2
9.5
11.6
13.6
0% 10% 20% 30% 40% 50% 60% 70% 80% 90% 100%
Legend (no. of samples)
Total(940)
Less than 1 year(79)
1 to 3 years (120)
3 to 5 years(82)
5 to 10 years(158)
10 to 20 years(211)
20 years or more(268)
No answer(22)
26
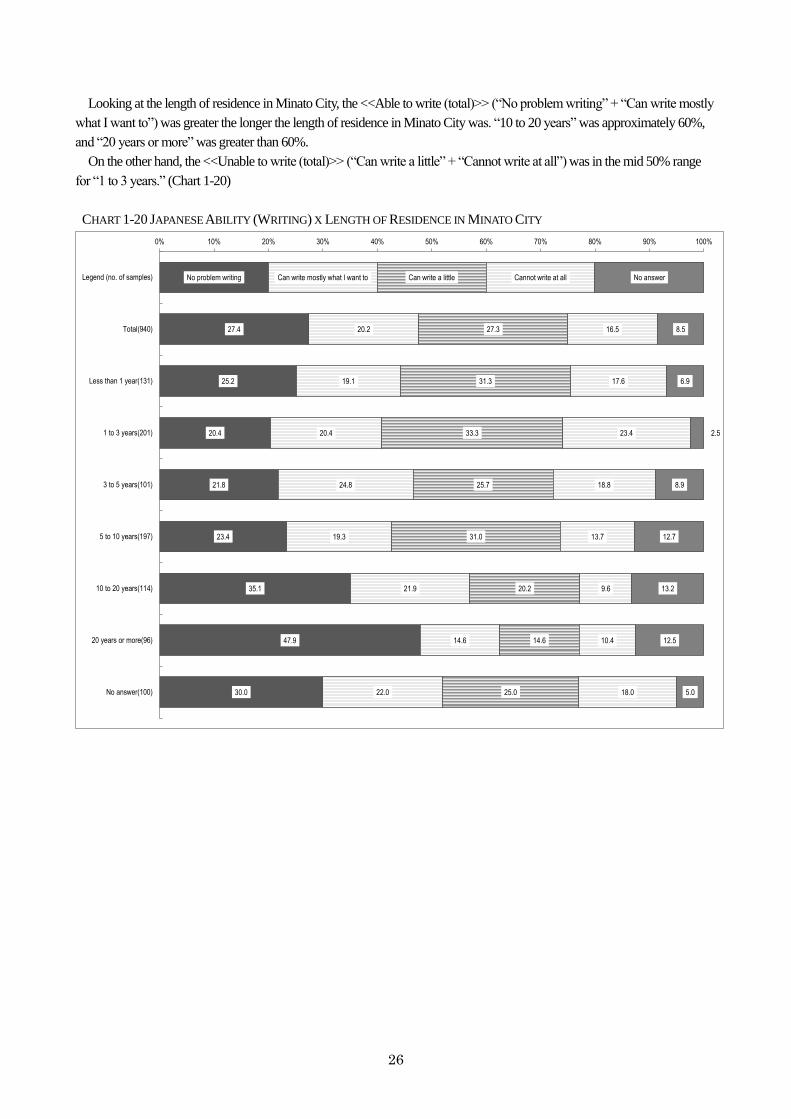
Looking at the length of residence in Minato City, the <<Able to write (total)>> (“No problem writing” + “Can write mostly
what I want to”) was greater the longer the length of residence in Minato City was. “10 to 20 years” was approximately 60%,
and “20 years or more” was greater than 60%.
On the other hand, the <<Unable to write (total)>> (“Can write a little” + “Cannot write at all”) was in the mid 50% range
for “1 to 3 years.” (Chart 1-20)
CHART 1-20 JAPANESE ABILITY (WRITING) X LENGTH OF RESIDENCE IN MINATO CITY
No problem writing
27.4
25.2
20.4
21.8
23.4
35.1
47.9
30.0
Can write mostly what I want to
20.2
19.1
20.4
24.8
19.3
21.9
14.6
22.0
Can write a little
27.3
31.3
33.3
25.7
31.0
20.2
14.6
25.0
Cannot write at all
16.5
17.6
23.4
18.8
13.7
9.6
10.4
18.0
No answer
8.5
6.9
2.5
8.9
12.7
13.2
12.5
5.0
0% 10% 20% 30% 40% 50% 60% 70% 80% 90% 100%
Legend (no. of samples)
Total(940)
Less than 1 year(131)
1 to 3 years(201)
3 to 5 years(101)
5 to 10 years(197)
10 to 20 years(114)
20 years or more(96)
No answer(100)
27
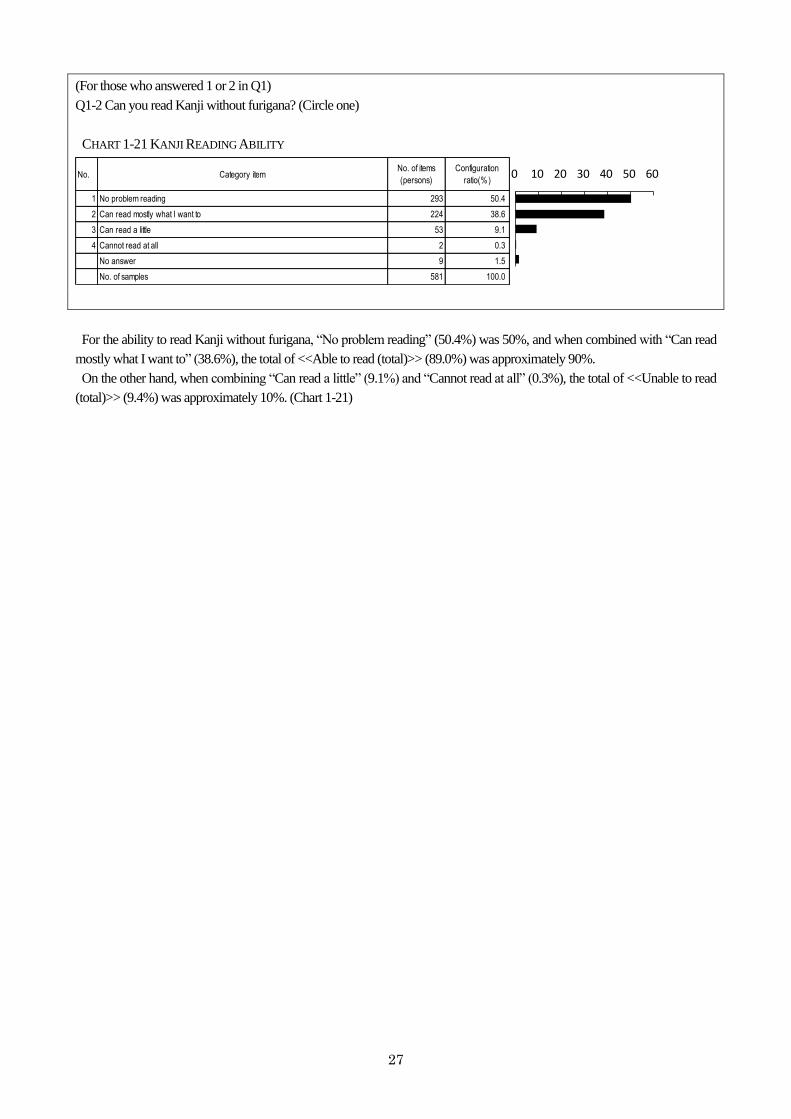
(For those who answered 1 or 2 in Q1)
Q1-2 Can you read Kanji without furigana? (Circle one)
CHART 1-21 KANJI READING ABILITY
No. Category itemNo. of items
(persons)
Configuration
ratio(%)
1 No problem reading 293 50.4
2 Can read mostly what I want to 224 38.6
3 Can read a little 53 9.1
4 Cannot read at all 2 0.3
No answer 9 1.5
No. of samples 581 100.0
0 10 20 30 40 50 60
For the ability to read Kanji without furigana, “No problem reading” (50.4%) was 50%, and when combined with “Can read
mostly what I want to” (38.6%), the total of <<Able to read (total)>> (89.0%) was approximately 90%.
On the other hand, when combining “Can read a little” (9.1%) and “Cannot read at all” (0.3%), the total of <<Unable to read
(total)>> (9.4%) was approximately 10%. (Chart 1-21)
28
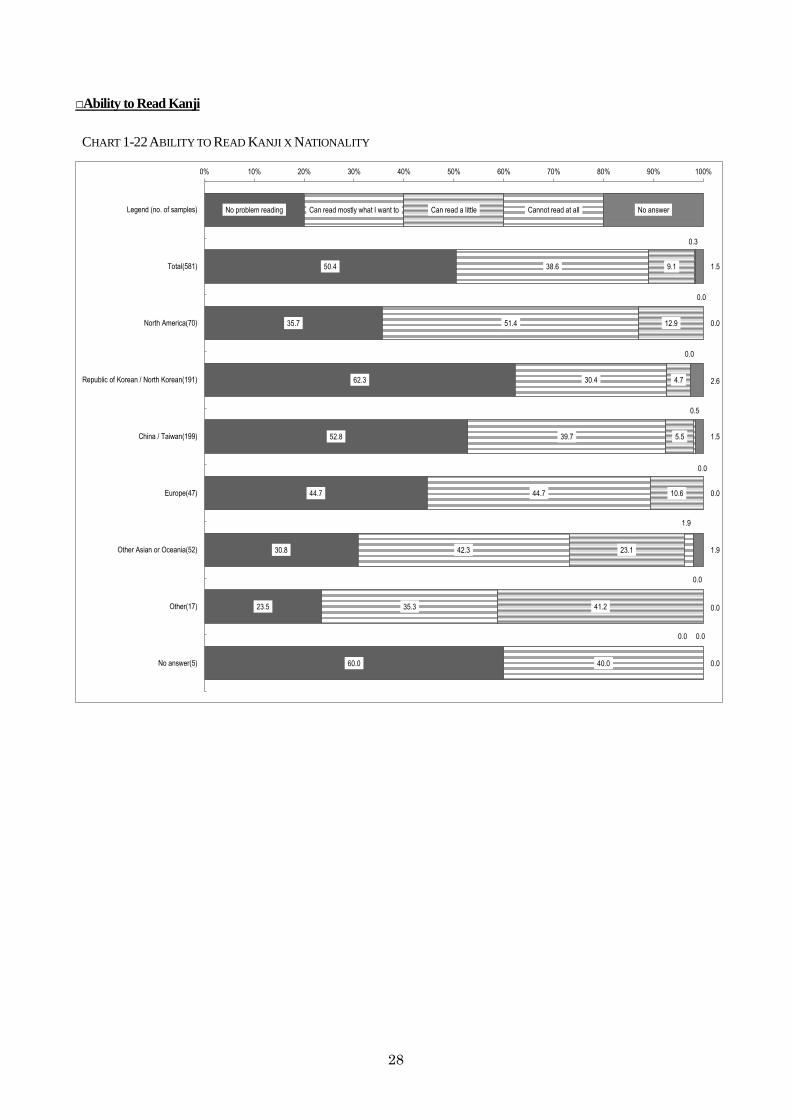
□Ability to Read Kanji
CHART 1-22 ABILITY TO READ KANJI X NATIONALITY
No problem reading
50.4
35.7
62.3
52.8
44.7
30.8
23.5
60.0
Can read mostly what I want to
38.6
51.4
30.4
39.7
44.7
42.3
35.3
40.0
Can read a little
9.1
12.9
4.7
5.5
10.6
23.1
41.2
0.0
Cannot read at all
0.3
0.0
0.0
0.5
0.0
1.9
0.0
0.0
No answer
1.5
0.0
2.6
1.5
0.0
1.9
0.0
0.0
0% 10% 20% 30% 40% 50% 60% 70% 80% 90% 100%
Legend (no. of samples)
Total(581)
North America(70)
Republic of Korean / North Korean(191)
China / Taiwan(199)
Europe(47)
Other Asian or Oceania(52)
Other(17)
No answer(5)
29
CHART 1-23 ABILITY TO READ KANJI X RESIDENTIAL STATUS
No problem reading
50.4
40.0
13.6
34.8
28.0
47.1
58.4
87.0
16.7
27.6
48.0
33.3
0.0
33.3
20.0
Can read mostly what I want to
38.6
52.3
63.6
43.5
44.0
41.2
33.8
6.5
33.3
62.1
40.0
61.1
0.0
44.4
40.0
Can read a little
9.1
6.2
18.2
21.7
24.0
11.8
5.2
3.9
50.0
10.3
12.0
5.6
0.0
22.2
40.0
Cannot read at all
0.3
0.0
0.0
0.0
4.0
0.0
0.4
0.0
0.0
0.0
0.0
0.0
0.0
0.0
0.0
No answer
1.5
1.5
4.5
0.0
0.0
0.0
2.2
2.6
0.0
0.0
0.0
0.0
0.0
0.0
0.0
0% 10% 20% 30% 40% 50% 60% 70% 80% 90% 100%
Legend (no. of samples)
Total(581)
Specialist in humanities/international services(65)
Intra-company transferee(22)
Engineer(23)
Family stays(25)
Investor/business manager(17)
Permanent resident(231)
Special permanent resident(77)
Designated activities(6)
Spouse, etc. of a Japanese national(58)
College Student(25)
Long-term resident(18)
Skilled labor(-)
Other(9)
No answer(5)
30
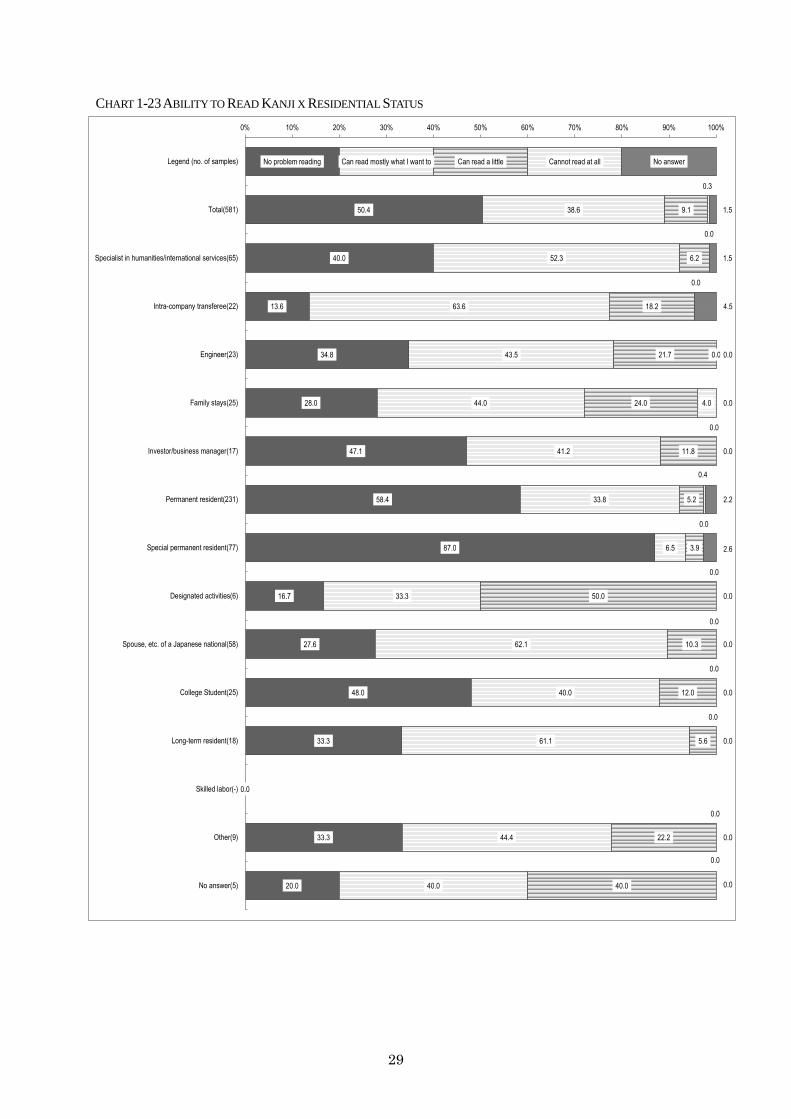
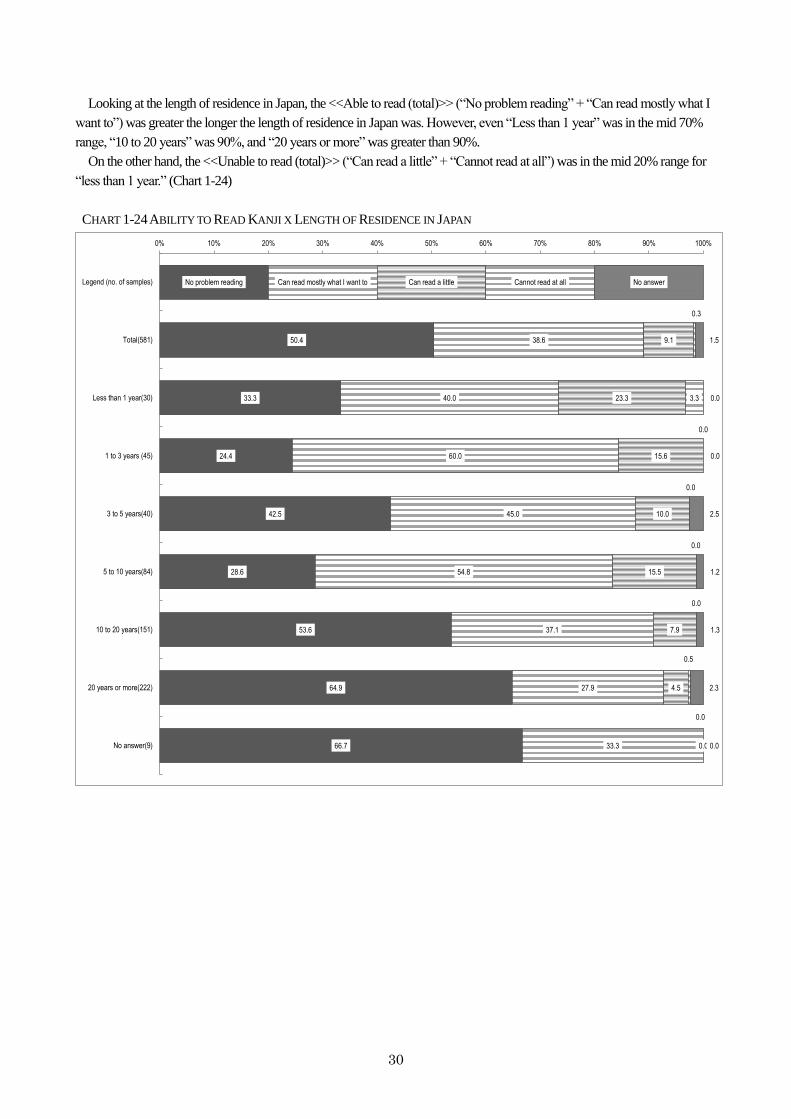
Looking at the length of residence in Japan, the <<Able to read (total)>> (“No problem reading” + “Can read mostly what I
want to”) was greater the longer the length of residence in Japan was. However, even “Less than 1 year” was in the mid 70%
range, “10 to 20 years” was 90%, and “20 years or more” was greater than 90%.
On the other hand, the <<Unable to read (total)>> (“Can read a little” + “Cannot read at all”) was in the mid 20% range for
“less than 1 year.” (Chart 1-24)
CHART 1-24 ABILITY TO READ KANJI X LENGTH OF RESIDENCE IN JAPAN
No problem reading
50.4
33.3
24.4
42.5
28.6
53.6
64.9
66.7
Can read mostly what I want to
38.6
40.0
60.0
45.0
54.8
37.1
27.9
33.3
Can read a little
9.1
23.3
15.6
10.0
15.5
7.9
4.5
0.0
Cannot read at all
0.3
3.3
0.0
0.0
0.0
0.0
0.5
0.0
No answer
1.5
0.0
0.0
2.5
1.2
1.3
2.3
0.0
0% 10% 20% 30% 40% 50% 60% 70% 80% 90% 100%
Legend (no. of samples)
Total(581)
Less than 1 year(30)
1 to 3 years (45)
3 to 5 years(40)
5 to 10 years(84)
10 to 20 years(151)
20 years or more(222)
No answer(9)
31
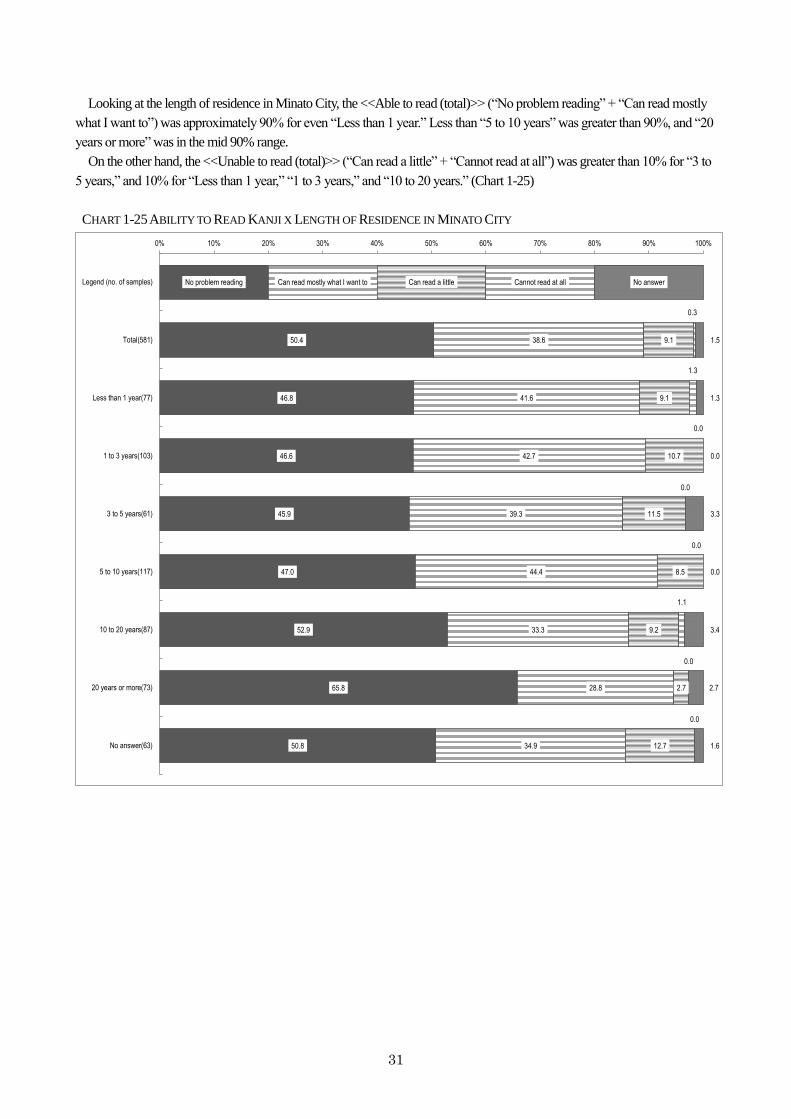
Looking at the length of residence in Minato City, the <<Able to read (total)>> (“No problem reading” + “Can read mostly
what I want to”) was approximately 90% for even “Less than 1 year.” Less than “5 to 10 years” was greater than 90%, and “20
years or more” was in the mid 90% range.
On the other hand, the <<Unable to read (total)>> (“Can read a little” + “Cannot read at all”) was greater than 10% for “3 to
5 years,” and 10% for “Less than 1 year,” “1 to 3 years,” and “10 to 20 years.” (Chart 1-25)
CHART 1-25 ABILITY TO READ KANJI X LENGTH OF RESIDENCE IN MINATO CITY
No problem reading
50.4
46.8
46.6
45.9
47.0
52.9
65.8
50.8
Can read mostly what I want to
38.6
41.6
42.7
39.3
44.4
33.3
28.8
34.9
Can read a little
9.1
9.1
10.7
11.5
8.5
9.2
2.7
12.7
Cannot read at all
0.3
1.3
0.0
0.0
0.0
1.1
0.0
0.0
No answer
1.5
1.3
0.0
3.3
0.0
3.4
2.7
1.6
0% 10% 20% 30% 40% 50% 60% 70% 80% 90% 100%
Legend (no. of samples)
Total(581)
Less than 1 year(77)
1 to 3 years(103)
3 to 5 years(61)
5 to 10 years(117)
10 to 20 years(87)
20 years or more(73)
No answer(63)
32
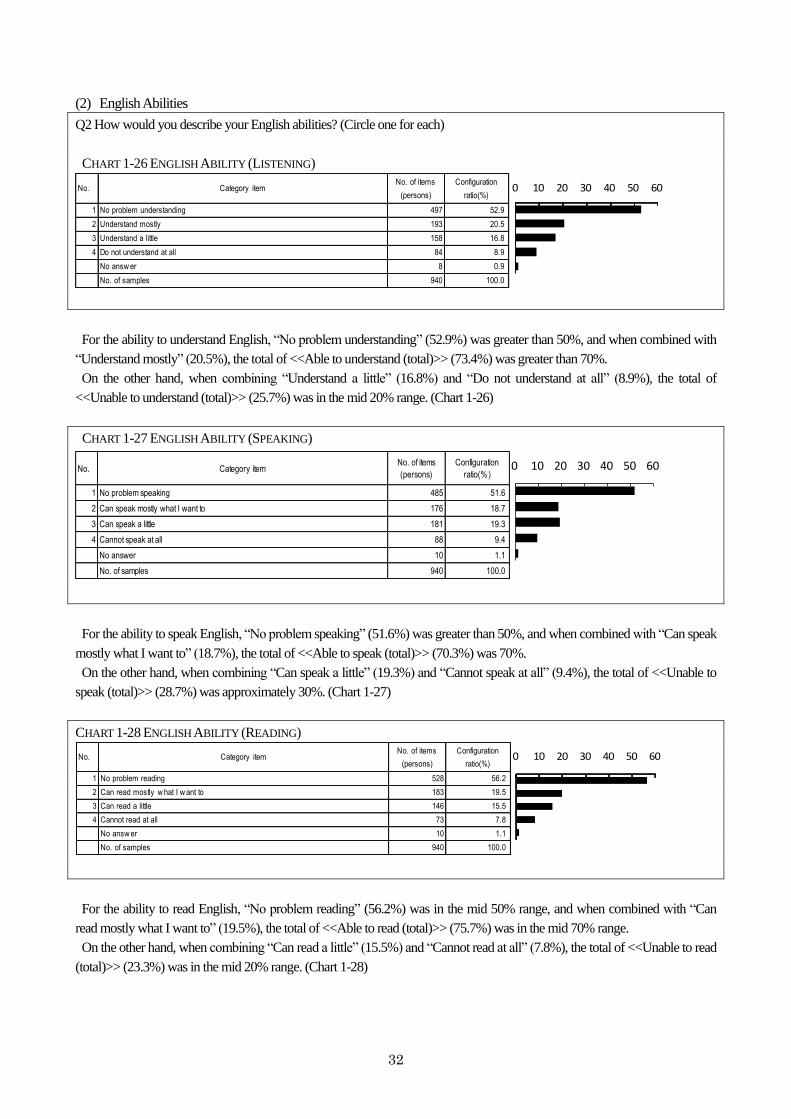
(2) English Abilities
Q2 How would you describe your English abilities? (Circle one for each)
CHART 1-26 ENGLISH ABILITY (LISTENING)
No. Category itemNo. of items
(persons)
Configuration
ratio(%)
1 No problem understanding 497 52.9
2 Understand mostly 193 20.5
3 Understand a little 158 16.8
4 Do not understand at all 84 8.9
No answ er 8 0.9
No. of samples 940 100.0
0 10 20 30 40 50 60
For the ability to understand English, “No problem understanding” (52.9%) was greater than 50%, and when combined with
“Understand mostly” (20.5%), the total of <<Able to understand (total)>> (73.4%) was greater than 70%.
On the other hand, when combining “Understand a little” (16.8%) and “Do not understand at all” (8.9%), the total of
<<Unable to understand (total)>> (25.7%) was in the mid 20% range. (Chart 1-26)
CHART 1-27 ENGLISH ABILITY (SPEAKING)
No. Category itemNo. of items
(persons)
Configuration
ratio(%)
1 No problem speaking 485 51.6
2 Can speak mostly what I want to 176 18.7
3 Can speak a little 181 19.3
4 Cannot speak at all 88 9.4
No answer 10 1.1
No. of samples 940 100.0
0 10 20 30 40 50 60
For the ability to speak English, “No problem speaking” (51.6%) was greater than 50%, and when combined with “Can speak
mostly what I want to” (18.7%), the total of <<Able to speak (total)>> (70.3%) was 70%.
On the other hand, when combining “Can speak a little” (19.3%) and “Cannot speak at all” (9.4%), the total of <<Unable to
speak (total)>> (28.7%) was approximately 30%. (Chart 1-27)
CHART 1-28 ENGLISH ABILITY (READING)
For the ability to read English, “No problem reading” (56.2%) was in the mid 50% range, and when combined with “Can
read mostly what I want to” (19.5%), the total of <<Able to read (total)>> (75.7%) was in the mid 70% range.
On the other hand, when combining “Can read a little” (15.5%) and “Cannot read at all” (7.8%), the total of <<Unable to read
(total)>> (23.3%) was in the mid 20% range. (Chart 1-28)
No. Category itemNo. of items
(persons)
Configuration
ratio(%)
1 No problem reading 528 56.2
2 Can read mostly w hat I w ant to 183 19.5
3 Can read a little 146 15.5
4 Cannot read at all 73 7.8
No answ er 10 1.1
No. of samples 940 100.0
0 10 20 30 40 50 60
33
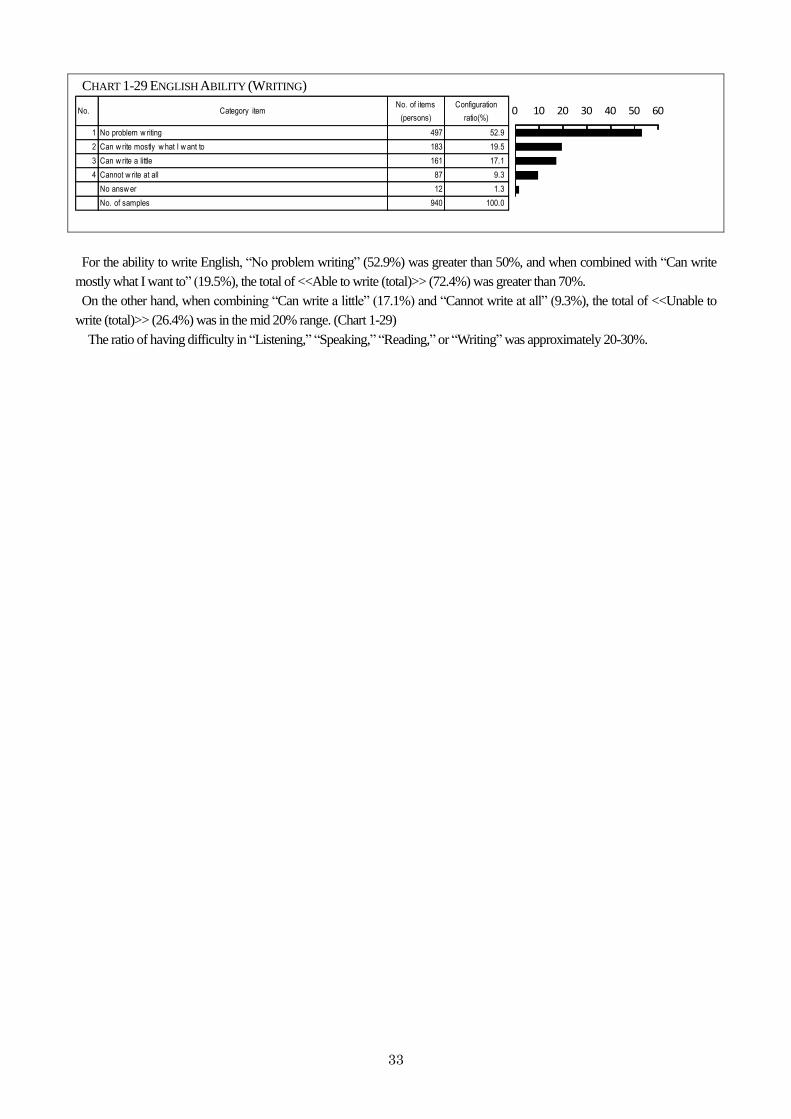
CHART 1-29 ENGLISH ABILITY (WRITING)
No. Category itemNo. of items
(persons)
Configuration
ratio(%)
1 No problem w riting 497 52.9
2 Can w rite mostly w hat I w ant to 183 19.5
3 Can w rite a little 161 17.1
4 Cannot w rite at all 87 9.3
No answ er 12 1.3
No. of samples 940 100.0
0 10 20 30 40 50 60
For the ability to write English, “No problem writing” (52.9%) was greater than 50%, and when combined with “Can write
mostly what I want to” (19.5%), the total of <<Able to write (total)>> (72.4%) was greater than 70%.
On the other hand, when combining “Can write a little” (17.1%) and “Cannot write at all” (9.3%), the total of <<Unable to
write (total)>> (26.4%) was in the mid 20% range. (Chart 1-29)
The ratio of having difficulty in “Listening,” “Speaking,” “Reading,” or “Writing” was approximately 20-30%.
34
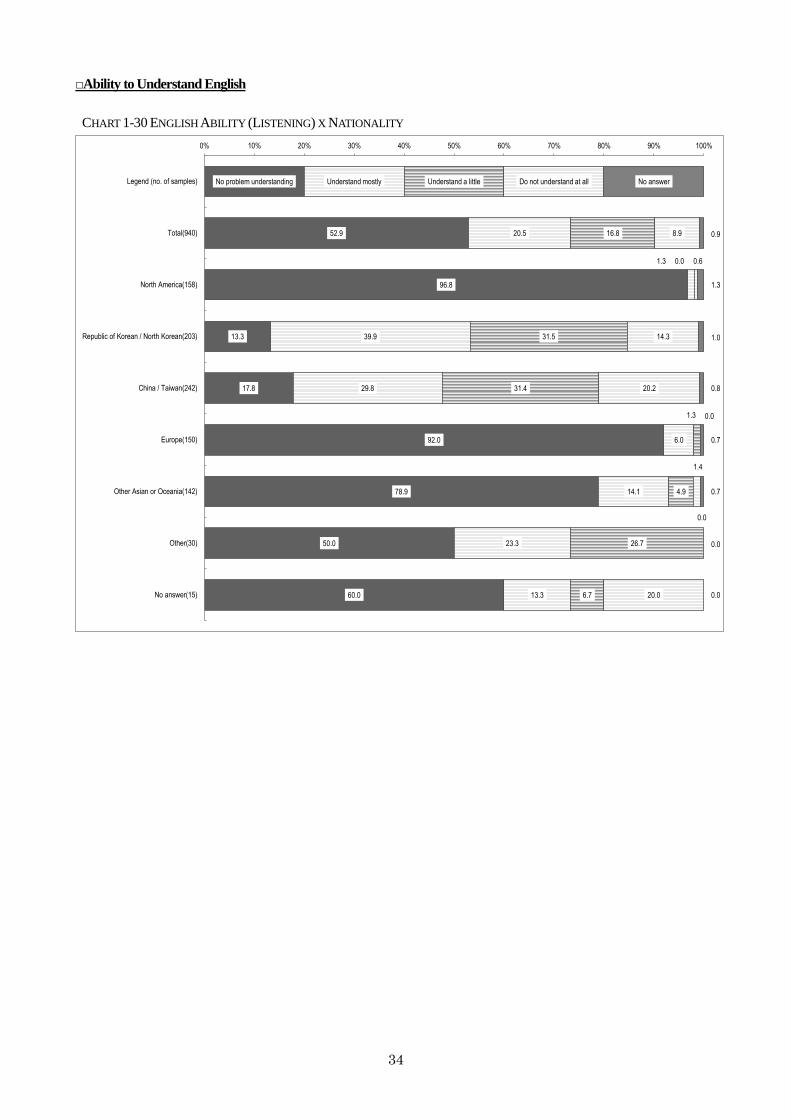
□Ability to Understand English
CHART 1-30 ENGLISH ABILITY (LISTENING) X NATIONALITY
No problem understanding
52.9
96.8
13.3
17.8
92.0
78.9
50.0
60.0
Understand mostly
20.5
1.3
39.9
29.8
6.0
14.1
23.3
13.3
Understand a little
16.8
0.0
31.5
31.4
1.3
4.9
26.7
6.7
Do not understand at all
8.9
0.6
14.3
20.2
0.0
1.4
0.0
20.0
No answer
0.9
1.3
1.0
0.8
0.7
0.7
0.0
0.0
0% 10% 20% 30% 40% 50% 60% 70% 80% 90% 100%
Legend (no. of samples)
Total(940)
North America(158)
Republic of Korean / North Korean(203)
China / Taiwan(242)
Europe(150)
Other Asian or Oceania(142)
Other(30)
No answer(15)
35
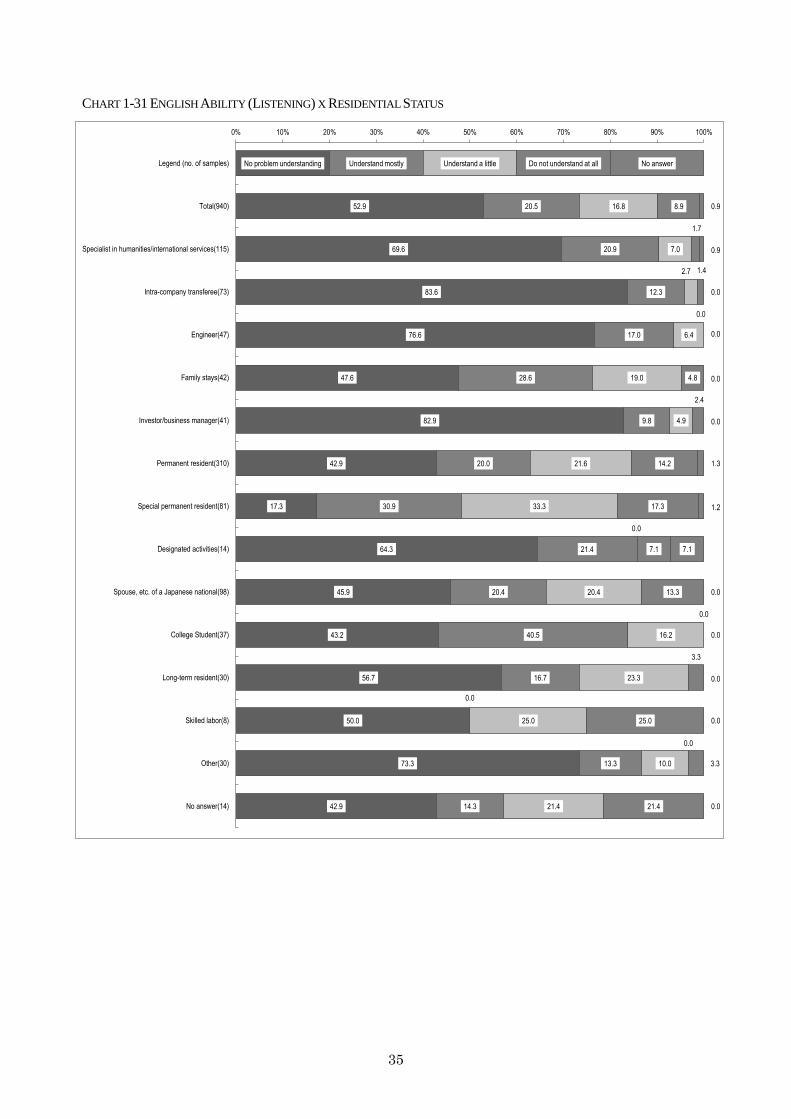
CHART 1-31 ENGLISH ABILITY (LISTENING) X RESIDENTIAL STATUS
No problem understanding
52.9
69.6
83.6
76.6
47.6
82.9
42.9
17.3
64.3
45.9
43.2
56.7
50.0
73.3
42.9
Understand mostly
20.5
20.9
12.3
17.0
28.6
9.8
20.0
30.9
21.4
20.4
40.5
16.7
0.0
13.3
14.3
Understand a little
16.8
7.0
2.7
6.4
19.0
4.9
21.6
33.3
0.0
20.4
16.2
23.3
25.0
10.0
21.4
Do not understand at all
8.9
1.7
1.4
0.0
4.8
2.4
14.2
17.3
7.1
13.3
0.0
3.3
25.0
0.0
21.4
No answer
0.9
0.9
0.0
0.0
0.0
0.0
1.3
1.2
7.1
0.0
0.0
0.0
0.0
3.3
0.0
0% 10% 20% 30% 40% 50% 60% 70% 80% 90% 100%
Legend (no. of samples)
Total(940)
Specialist in humanities/international services(115)
Intra-company transferee(73)
Engineer(47)
Family stays(42)
Investor/business manager(41)
Permanent resident(310)
Special permanent resident(81)
Designated activities(14)
Spouse, etc. of a Japanese national(98)
College Student(37)
Long-term resident(30)
Skilled labor(8)
Other(30)
No answer(14)
36
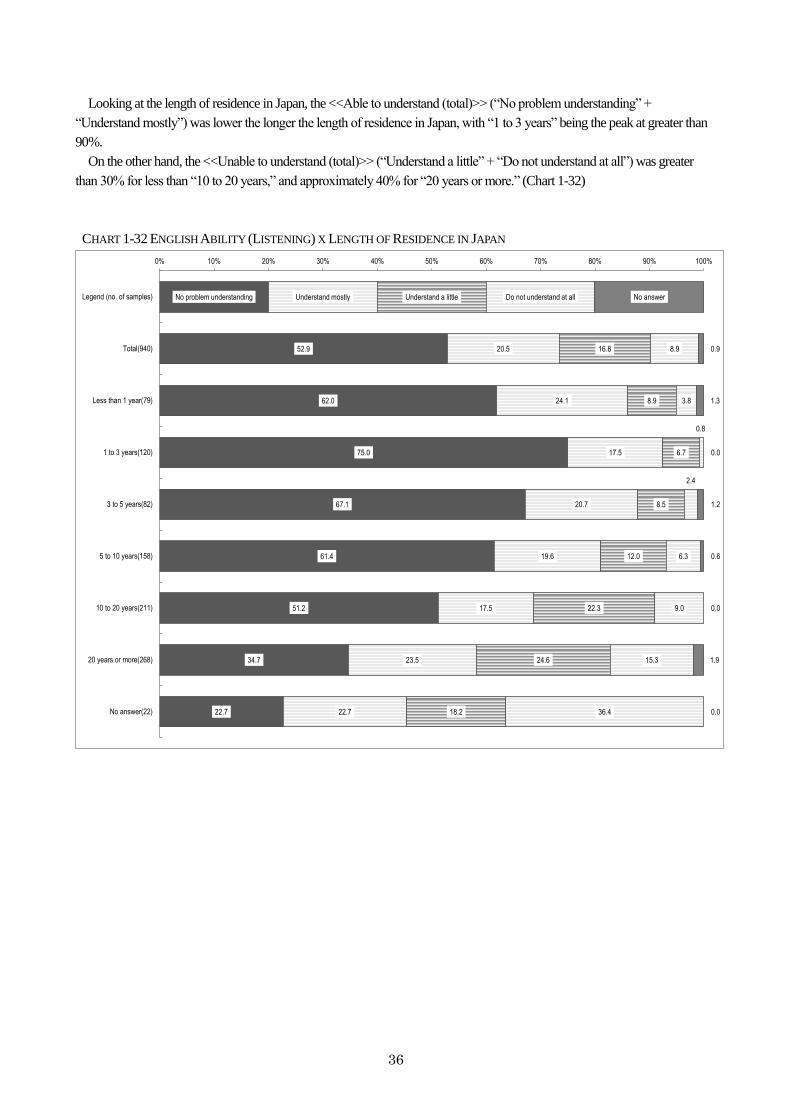
Looking at the length of residence in Japan, the <<Able to understand (total)>> (“No problem understanding” +
“Understand mostly”) was lower the longer the length of residence in Japan, with “1 to 3 years” being the peak at greater than
90%.
On the other hand, the <<Unable to understand (total)>> (“Understand a little” + “Do not understand at all”) was greater
than 30% for less than “10 to 20 years,” and approximately 40% for “20 years or more.” (Chart 1-32)
CHART 1-32 ENGLISH ABILITY (LISTENING) X LENGTH OF RESIDENCE IN JAPAN
No problem understanding
52.9
62.0
75.0
67.1
61.4
51.2
34.7
22.7
Understand mostly
20.5
24.1
17.5
20.7
19.6
17.5
23.5
22.7
Understand a little
16.8
8.9
6.7
8.5
12.0
22.3
24.6
18.2
Do not understand at all
8.9
3.8
0.8
2.4
6.3
9.0
15.3
36.4
No answer
0.9
1.3
0.0
1.2
0.6
0.0
1.9
0.0
0% 10% 20% 30% 40% 50% 60% 70% 80% 90% 100%
Legend (no. of samples)
Total(940)
Less than 1 year(79)
1 to 3 years(120)
3 to 5 years(82)
5 to 10 years(158)
10 to 20 years(211)
20 years or more(268)
No answer(22)
37
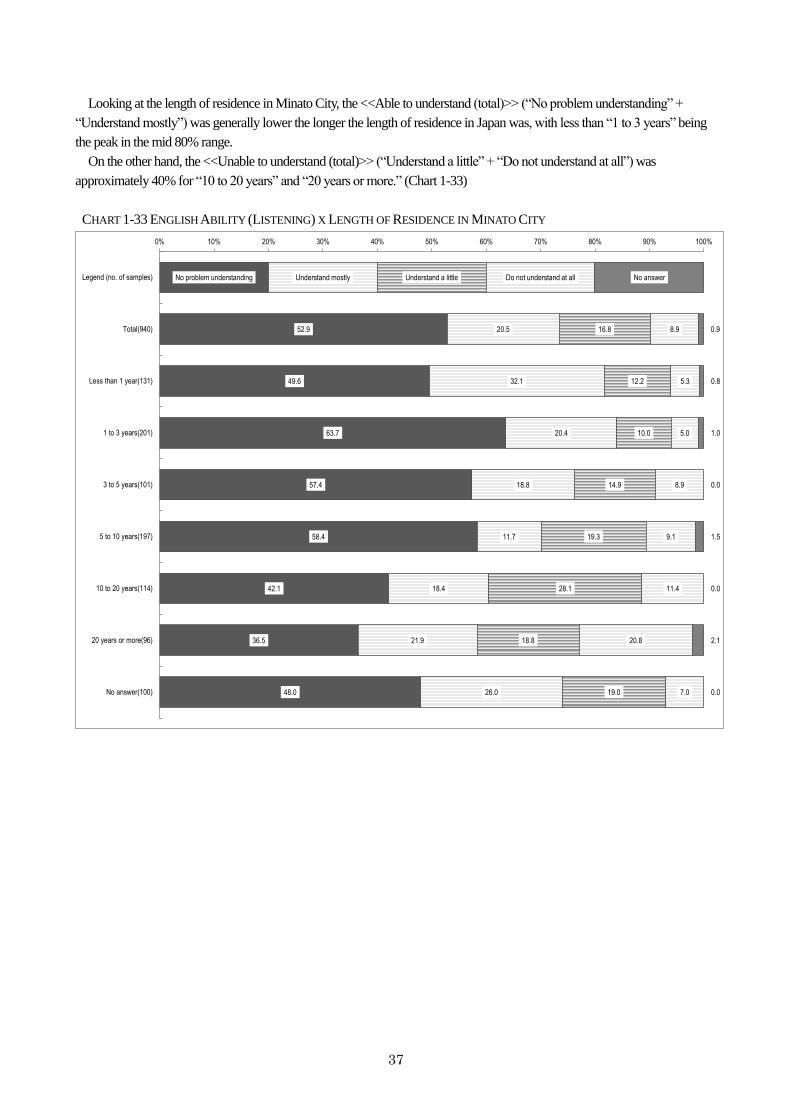
Looking at the length of residence in Minato City, the <<Able to understand (total)>> (“No problem understanding” +
“Understand mostly”) was generally lower the longer the length of residence in Japan was, with less than “1 to 3 years” being
the peak in the mid 80% range.
On the other hand, the <<Unable to understand (total)>> (“Understand a little” + “Do not understand at all”) was
approximately 40% for “10 to 20 years” and “20 years or more.” (Chart 1-33)
CHART 1-33 ENGLISH ABILITY (LISTENING) X LENGTH OF RESIDENCE IN MINATO CITY
No problem understanding
52.9
49.6
63.7
57.4
58.4
42.1
36.5
48.0
Understand mostly
20.5
32.1
20.4
18.8
11.7
18.4
21.9
26.0
Understand a little
16.8
12.2
10.0
14.9
19.3
28.1
18.8
19.0
Do not understand at all
8.9
5.3
5.0
8.9
9.1
11.4
20.8
7.0
No answer
0.9
0.8
1.0
0.0
1.5
0.0
2.1
0.0
0% 10% 20% 30% 40% 50% 60% 70% 80% 90% 100%
Legend (no. of samples)
Total(940)
Less than 1 year(131)
1 to 3 years(201)
3 to 5 years(101)
5 to 10 years(197)
10 to 20 years(114)
20 years or more(96)
No answer(100)
38
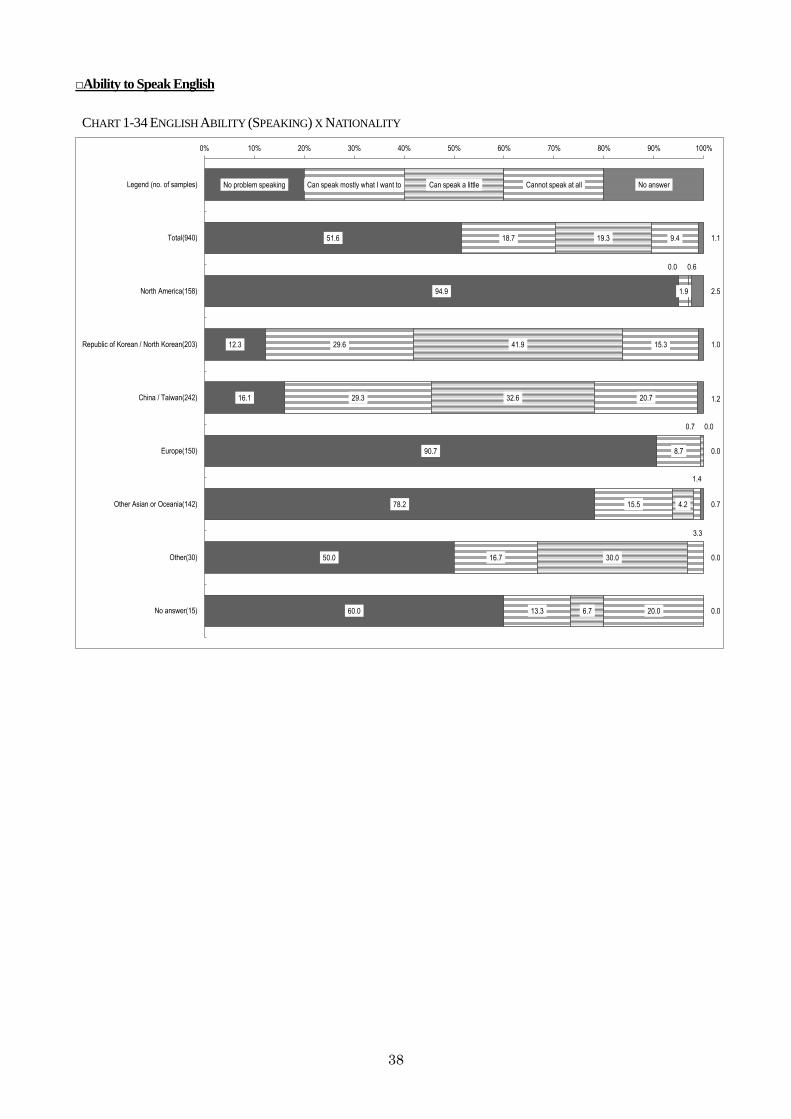
□Ability to Speak English
CHART 1-34 ENGLISH ABILITY (SPEAKING) X NATIONALITY
No problem speaking
51.6
94.9
12.3
16.1
90.7
78.2
50.0
60.0
Can speak mostly what I want to
18.7
1.9
29.6
29.3
8.7
15.5
16.7
13.3
Can speak a little
19.3
0.0
41.9
32.6
0.7
4.2
30.0
6.7
Cannot speak at all
9.4
0.6
15.3
20.7
0.0
1.4
3.3
20.0
No answer
1.1
2.5
1.0
1.2
0.0
0.7
0.0
0.0
0% 10% 20% 30% 40% 50% 60% 70% 80% 90% 100%
Legend (no. of samples)
Total(940)
North America(158)
Republic of Korean / North Korean(203)
China / Taiwan(242)
Europe(150)
Other Asian or Oceania(142)
Other(30)
No answer(15)
39
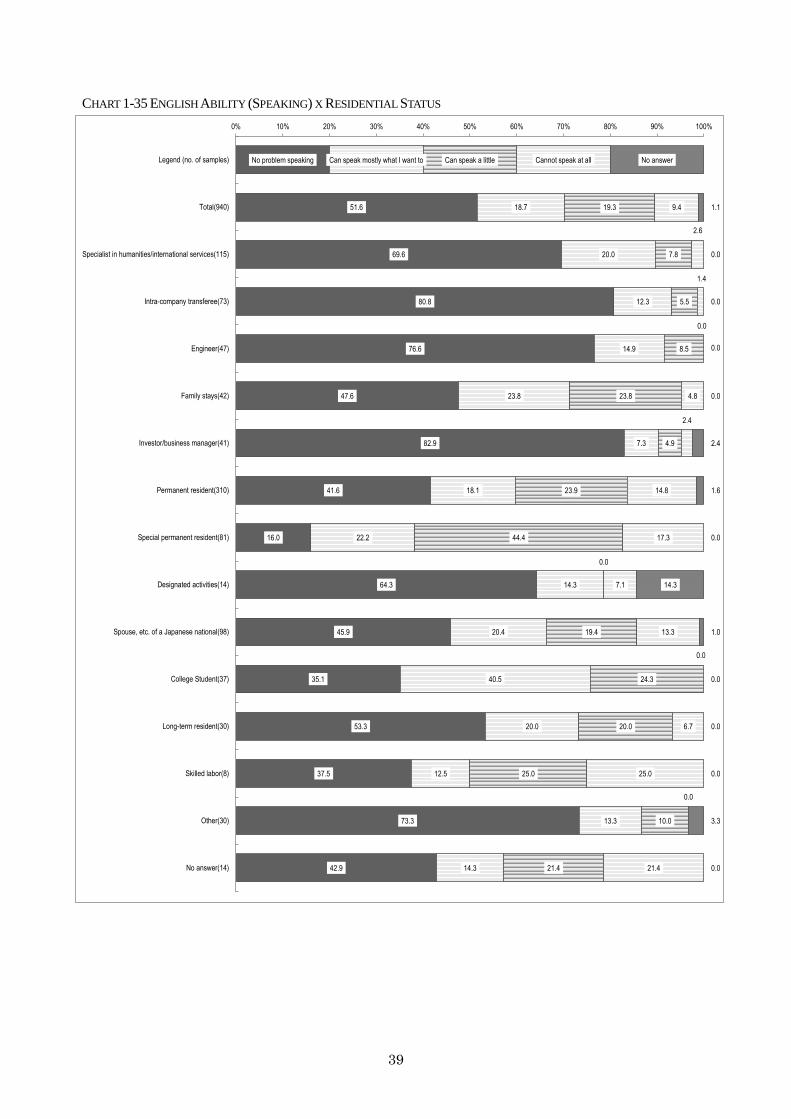
CHART 1-35 ENGLISH ABILITY (SPEAKING) X RESIDENTIAL STATUS
No problem speaking
51.6
69.6
80.8
76.6
47.6
82.9
41.6
16.0
64.3
45.9
35.1
53.3
37.5
73.3
42.9
Can speak mostly what I want to
18.7
20.0
12.3
14.9
23.8
7.3
18.1
22.2
14.3
20.4
40.5
20.0
12.5
13.3
14.3
Can speak a little
19.3
7.8
5.5
8.5
23.8
4.9
23.9
44.4
0.0
19.4
24.3
20.0
25.0
10.0
21.4
Cannot speak at all
9.4
2.6
1.4
0.0
4.8
2.4
14.8
17.3
7.1
13.3
0.0
6.7
25.0
0.0
21.4
No answer
1.1
0.0
0.0
0.0
0.0
2.4
1.6
0.0
14.3
1.0
0.0
0.0
0.0
3.3
0.0
0% 10% 20% 30% 40% 50% 60% 70% 80% 90% 100%
Legend (no. of samples)
Total(940)
Specialist in humanities/international services(115)
Intra-company transferee(73)
Engineer(47)
Family stays(42)
Investor/business manager(41)
Permanent resident(310)
Special permanent resident(81)
Designated activities(14)
Spouse, etc. of a Japanese national(98)
College Student(37)
Long-term resident(30)
Skilled labor(8)
Other(30)
No answer(14)
40
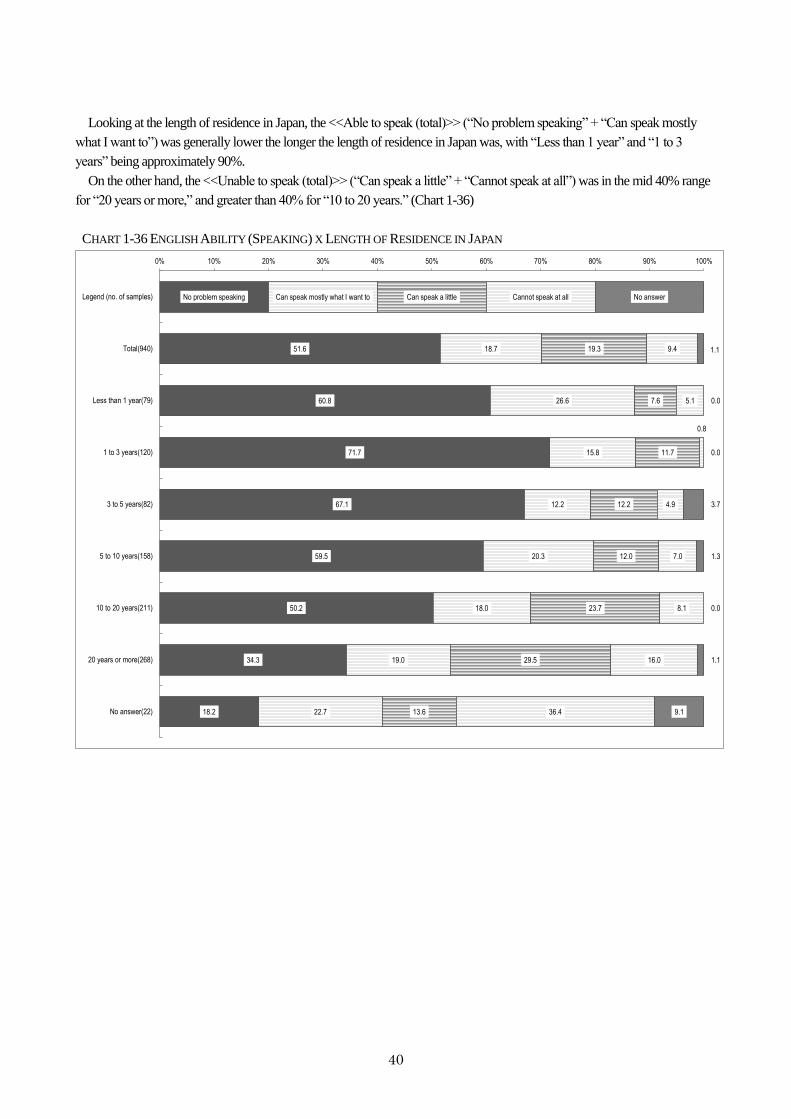
Looking at the length of residence in Japan, the <<Able to speak (total)>> (“No problem speaking” + “Can speak mostly
what I want to”) was generally lower the longer the length of residence in Japan was, with “Less than 1 year” and “1 to 3
years” being approximately 90%.
On the other hand, the <<Unable to speak (total)>> (“Can speak a little” + “Cannot speak at all”) was in the mid 40% range
for “20 years or more,” and greater than 40% for “10 to 20 years.” (Chart 1-36)
CHART 1-36 ENGLISH ABILITY (SPEAKING) X LENGTH OF RESIDENCE IN JAPAN
No problem speaking
51.6
60.8
71.7
67.1
59.5
50.2
34.3
18.2
Can speak mostly what I want to
18.7
26.6
15.8
12.2
20.3
18.0
19.0
22.7
Can speak a little
19.3
7.6
11.7
12.2
12.0
23.7
29.5
13.6
Cannot speak at all
9.4
5.1
0.8
4.9
7.0
8.1
16.0
36.4
No answer
1.1
0.0
0.0
3.7
1.3
0.0
1.1
9.1
0% 10% 20% 30% 40% 50% 60% 70% 80% 90% 100%
Legend (no. of samples)
Total(940)
Less than 1 year(79)
1 to 3 years(120)
3 to 5 years(82)
5 to 10 years(158)
10 to 20 years(211)
20 years or more(268)
No answer(22)
41
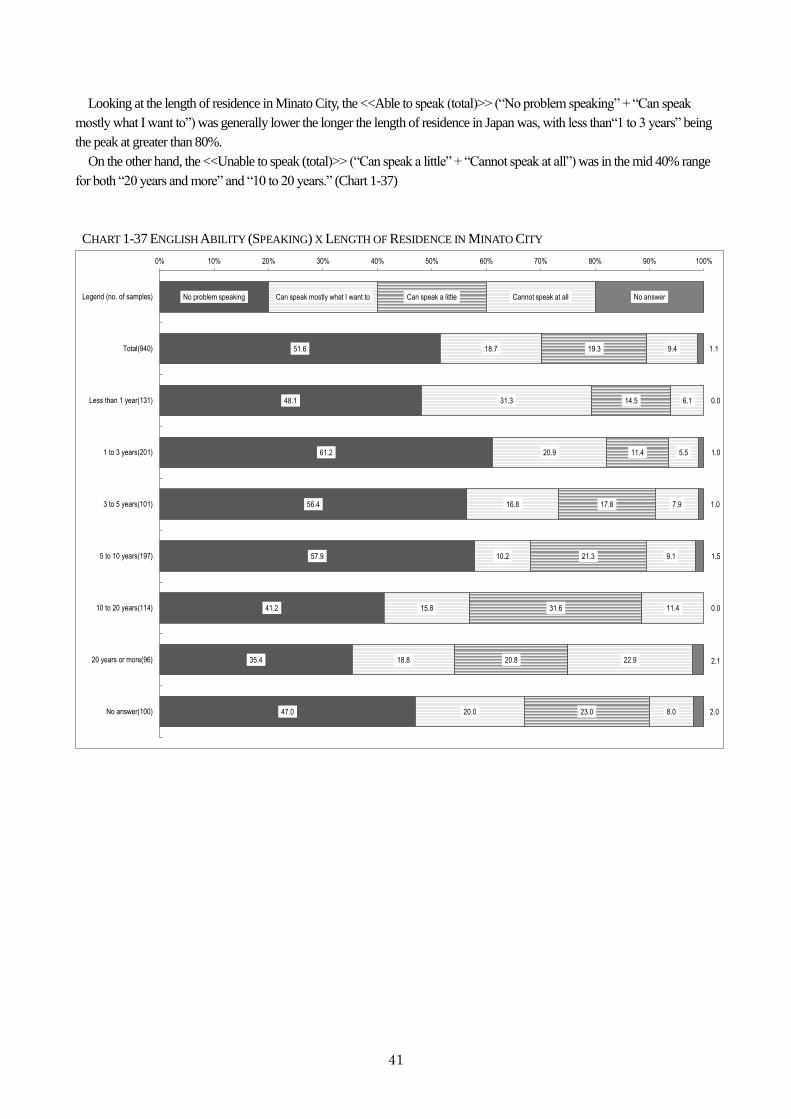
Looking at the length of residence in Minato City, the <<Able to speak (total)>> (“No problem speaking” + “Can speak
mostly what I want to”) was generally lower the longer the length of residence in Japan was, with less than“1 to 3 years” being
the peak at greater than 80%.
On the other hand, the <<Unable to speak (total)>> (“Can speak a little” + “Cannot speak at all”) was in the mid 40% range
for both “20 years and more” and “10 to 20 years.” (Chart 1-37)
CHART 1-37 ENGLISH ABILITY (SPEAKING) X LENGTH OF RESIDENCE IN MINATO CITY
No problem speaking
51.6
48.1
61.2
56.4
57.9
41.2
35.4
47.0
Can speak mostly what I want to
18.7
31.3
20.9
16.8
10.2
15.8
18.8
20.0
Can speak a little
19.3
14.5
11.4
17.8
21.3
31.6
20.8
23.0
Cannot speak at all
9.4
6.1
5.5
7.9
9.1
11.4
22.9
8.0
No answer
1.1
0.0
1.0
1.0
1.5
0.0
2.1
2.0
0% 10% 20% 30% 40% 50% 60% 70% 80% 90% 100%
Legend (no. of samples)
Total(940)
Less than 1 year(131)
1 to 3 years(201)
3 to 5 years(101)
5 to 10 years(197)
10 to 20 years(114)
20 years or more(96)
No answer(100)
42
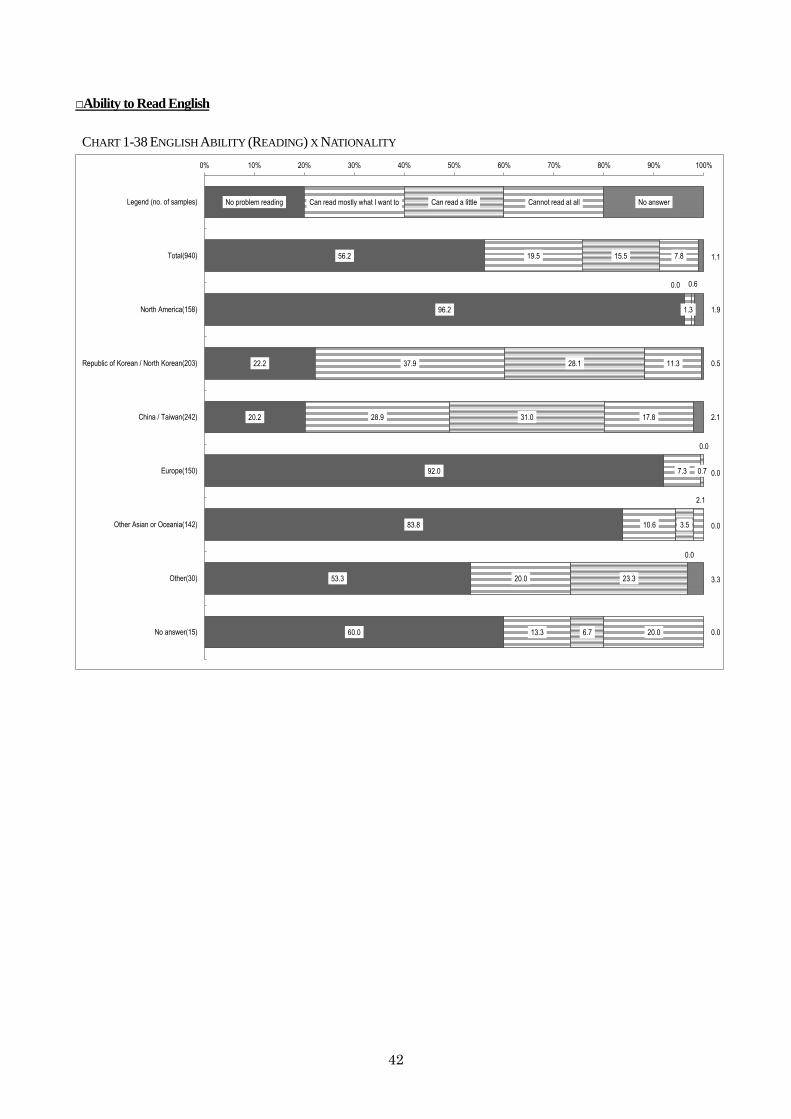
□Ability to Read English
CHART 1-38 ENGLISH ABILITY (READING) X NATIONALITY
No problem reading
56.2
96.2
22.2
20.2
92.0
83.8
53.3
60.0
Can read mostly what I want to
19.5
1.3
37.9
28.9
7.3
10.6
20.0
13.3
Can read a little
15.5
0.0
28.1
31.0
0.7
3.5
23.3
6.7
Cannot read at all
7.8
0.6
11.3
17.8
0.0
2.1
0.0
20.0
No answer
1.1
1.9
0.5
2.1
0.0
0.0
3.3
0.0
0% 10% 20% 30% 40% 50% 60% 70% 80% 90% 100%
Legend (no. of samples)
Total(940)
North America(158)
Republic of Korean / North Korean(203)
China / Taiwan(242)
Europe(150)
Other Asian or Oceania(142)
Other(30)
No answer(15)
43
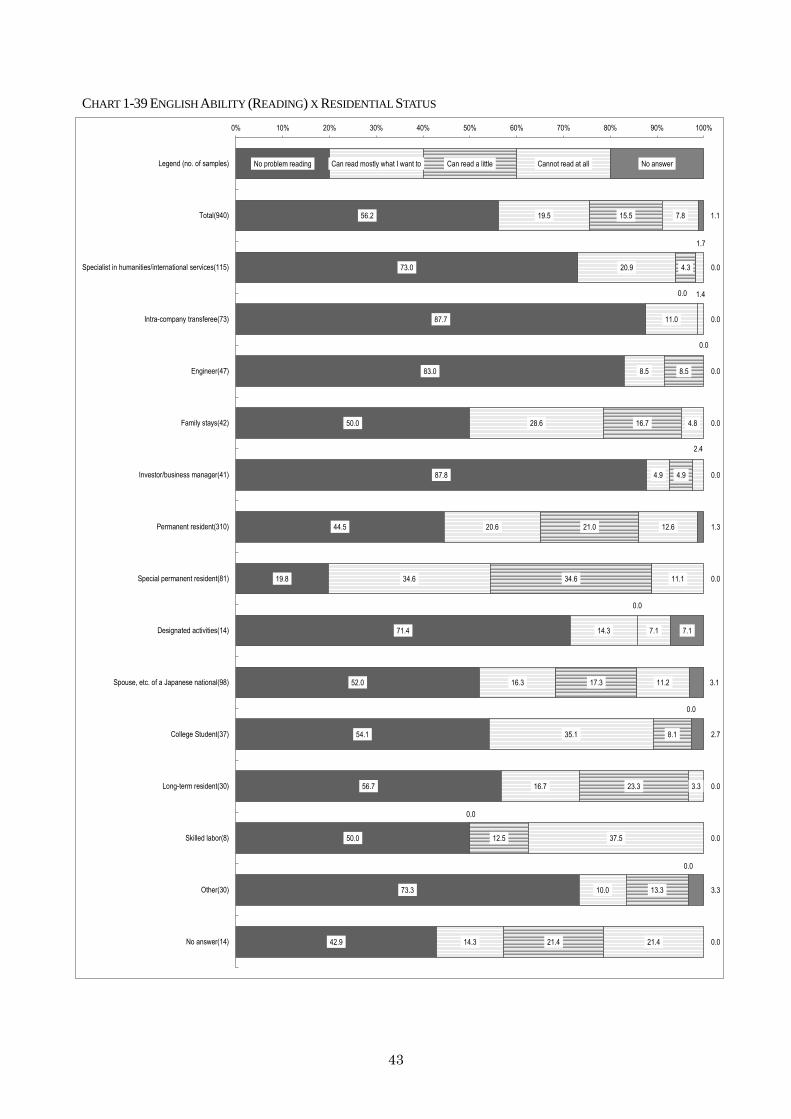
CHART 1-39 ENGLISH ABILITY (READING) X RESIDENTIAL STATUS
No problem reading
56.2
73.0
87.7
83.0
50.0
87.8
44.5
19.8
71.4
52.0
54.1
56.7
50.0
73.3
42.9
Can read mostly what I want to
19.5
20.9
11.0
8.5
28.6
4.9
20.6
34.6
14.3
16.3
35.1
16.7
0.0
10.0
14.3
Can read a little
15.5
4.3
0.0
8.5
16.7
4.9
21.0
34.6
0.0
17.3
8.1
23.3
12.5
13.3
21.4
Cannot read at all
7.8
1.7
1.4
0.0
4.8
2.4
12.6
11.1
7.1
11.2
0.0
3.3
37.5
0.0
21.4
No answer
1.1
0.0
0.0
0.0
0.0
0.0
1.3
0.0
7.1
3.1
2.7
0.0
0.0
3.3
0.0
0% 10% 20% 30% 40% 50% 60% 70% 80% 90% 100%
Legend (no. of samples)
Total(940)
Specialist in humanities/international services(115)
Intra-company transferee(73)
Engineer(47)
Family stays(42)
Investor/business manager(41)
Permanent resident(310)
Special permanent resident(81)
Designated activities(14)
Spouse, etc. of a Japanese national(98)
College Student(37)
Long-term resident(30)
Skilled labor(8)
Other(30)
No answer(14)
44
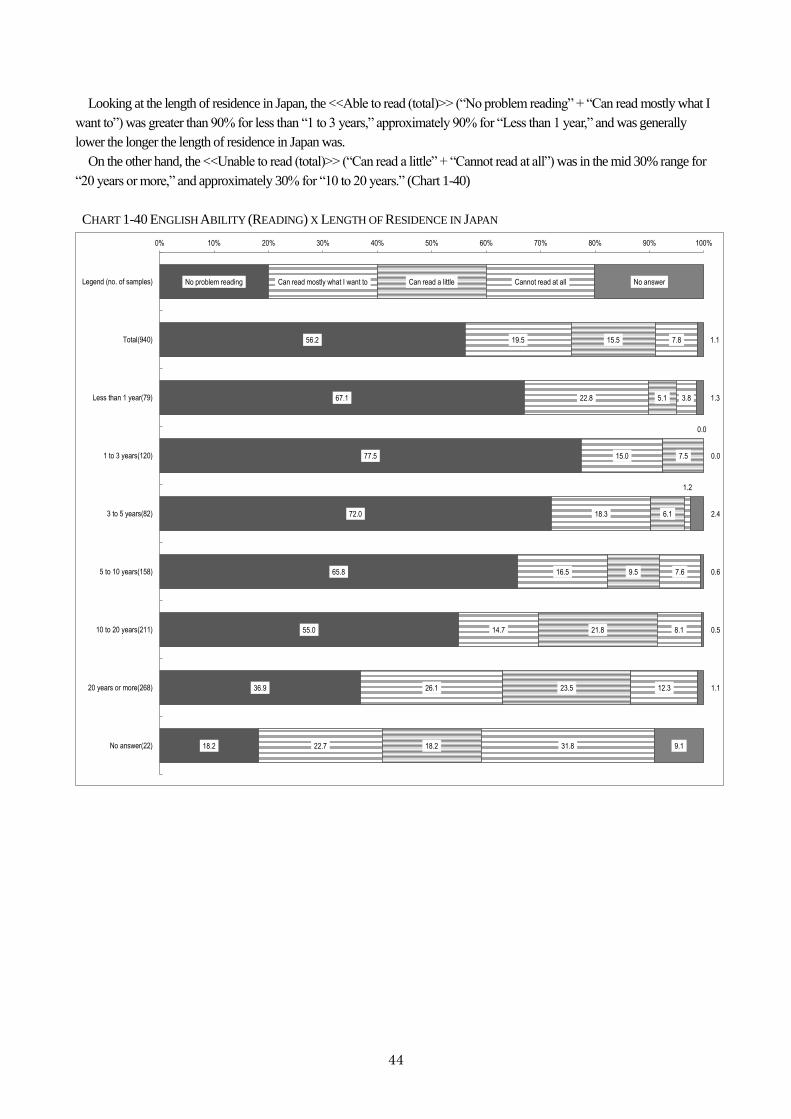
Looking at the length of residence in Japan, the <<Able to read (total)>> (“No problem reading” + “Can read mostly what I
want to”) was greater than 90% for less than “1 to 3 years,” approximately 90% for “Less than 1 year,” and was generally
lower the longer the length of residence in Japan was.
On the other hand, the <<Unable to read (total)>> (“Can read a little” + “Cannot read at all”) was in the mid 30% range for
“20 years or more,” and approximately 30% for “10 to 20 years.” (Chart 1-40)
CHART 1-40 ENGLISH ABILITY (READING) X LENGTH OF RESIDENCE IN JAPAN
No problem reading
56.2
67.1
77.5
72.0
65.8
55.0
36.9
18.2
Can read mostly what I want to
19.5
22.8
15.0
18.3
16.5
14.7
26.1
22.7
Can read a little
15.5
5.1
7.5
6.1
9.5
21.8
23.5
18.2
Cannot read at all
7.8
3.8
0.0
1.2
7.6
8.1
12.3
31.8
No answer
1.1
1.3
0.0
2.4
0.6
0.5
1.1
9.1
0% 10% 20% 30% 40% 50% 60% 70% 80% 90% 100%
Legend (no. of samples)
Total(940)
Less than 1 year(79)
1 to 3 years(120)
3 to 5 years(82)
5 to 10 years(158)
10 to 20 years(211)
20 years or more(268)
No answer(22)
45
Looking at the length of residence in Minato City, the <<Able to read (total)>> (“No problem reading” + “Can read mostly
what I want to”) was in the mid 80% range for “Less than 1 year” and “1 to 3 years,” and was generally lower the longer the
length of residence in Japan was.
On the other hand, the <<Unable to read (total)>> (“Can read a little” + “Cannot read at all”) was in the mid 30% range for
“20 years or more,” and 40% for “10 to 20 years.” (Chart 1-41)
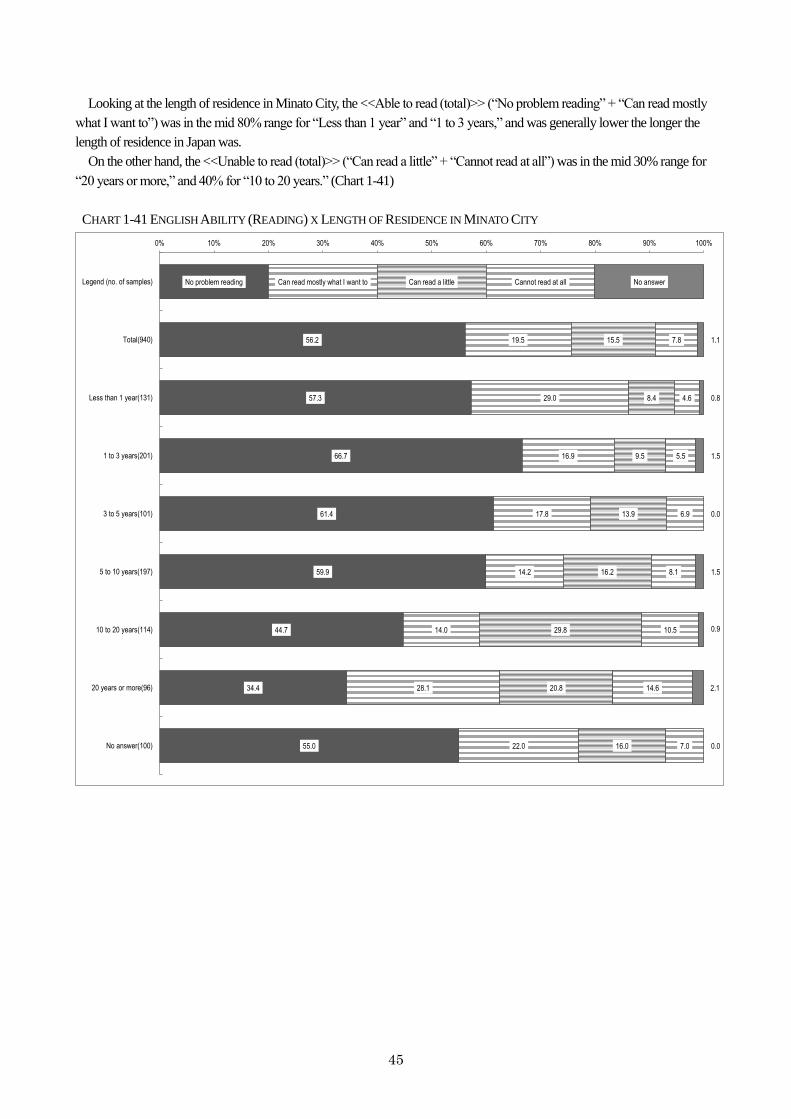
CHART 1-41 ENGLISH ABILITY (READING) X LENGTH OF RESIDENCE IN MINATO CITY
No problem reading
56.2
57.3
66.7
61.4
59.9
44.7
34.4
55.0
Can read mostly what I want to
19.5
29.0
16.9
17.8
14.2
14.0
28.1
22.0
Can read a little
15.5
8.4
9.5
13.9
16.2
29.8
20.8
16.0
Cannot read at all
7.8
4.6
5.5
6.9
8.1
10.5
14.6
7.0
No answer
1.1
0.8
1.5
0.0
1.5
0.9
2.1
0.0
0% 10% 20% 30% 40% 50% 60% 70% 80% 90% 100%
Legend (no. of samples)
Total(940)
Less than 1 year(131)
1 to 3 years(201)
3 to 5 years(101)
5 to 10 years(197)
10 to 20 years(114)
20 years or more(96)
No answer(100)
46
□Ability to Write English
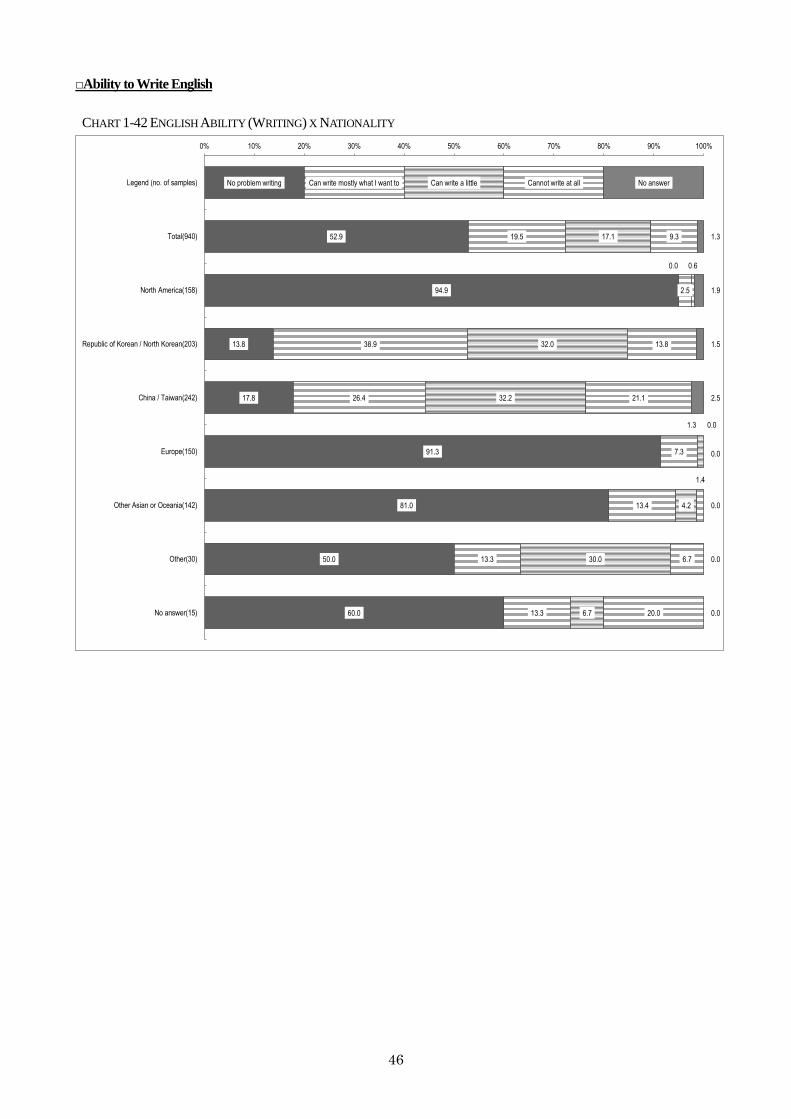
CHART 1-42 ENGLISH ABILITY (WRITING) X NATIONALITY
No problem writing
52.9
94.9
13.8
17.8
91.3
81.0
50.0
60.0
Can write mostly what I want to
19.5
2.5
38.9
26.4
7.3
13.4
13.3
13.3
Can write a little
17.1
0.0
32.0
32.2
1.3
4.2
30.0
6.7
Cannot write at all
9.3
0.6
13.8
21.1
0.0
1.4
6.7
20.0
No answer
1.3
1.9
1.5
2.5
0.0
0.0
0.0
0.0
0% 10% 20% 30% 40% 50% 60% 70% 80% 90% 100%
Legend (no. of samples)
Total(940)
North America(158)
Republic of Korean / North Korean(203)
China / Taiwan(242)
Europe(150)
Other Asian or Oceania(142)
Other(30)
No answer(15)
47
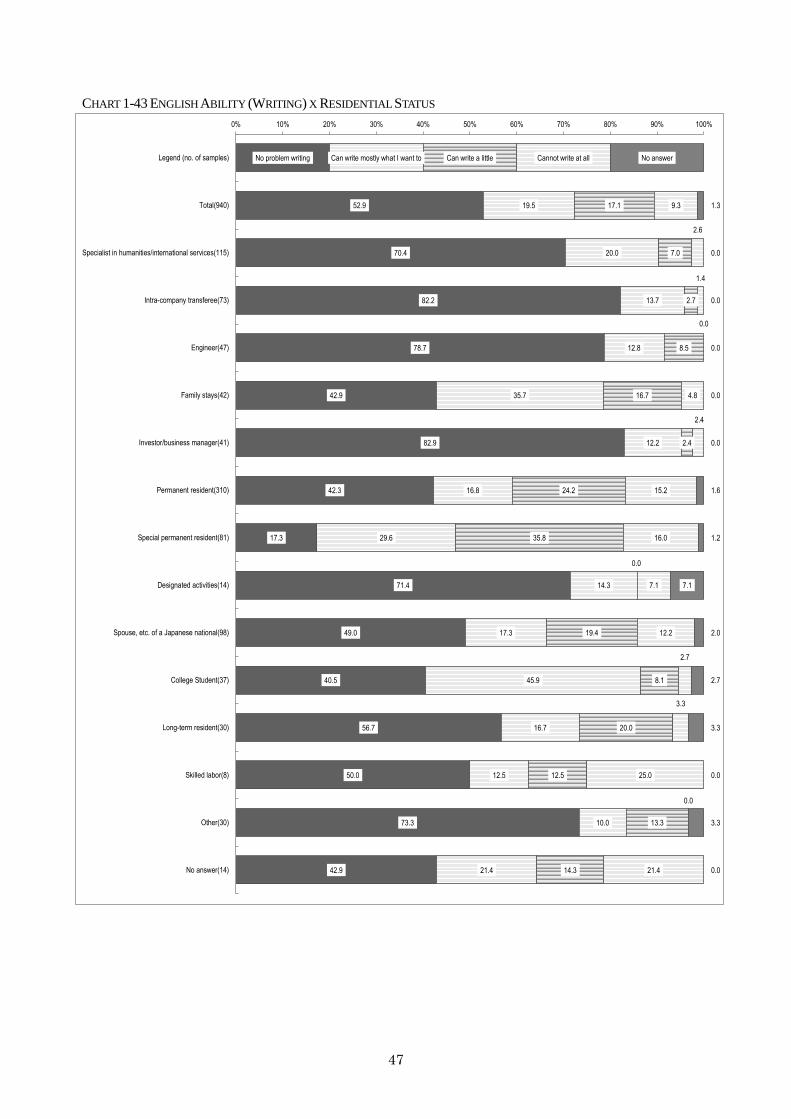
CHART 1-43 ENGLISH ABILITY (WRITING) X RESIDENTIAL STATUS
No problem writing
52.9
70.4
82.2
78.7
42.9
82.9
42.3
17.3
71.4
49.0
40.5
56.7
50.0
73.3
42.9
Can write mostly what I want to
19.5
20.0
13.7
12.8
35.7
12.2
16.8
29.6
14.3
17.3
45.9
16.7
12.5
10.0
21.4
Can write a little
17.1
7.0
2.7
8.5
16.7
2.4
24.2
35.8
0.0
19.4
8.1
20.0
12.5
13.3
14.3
Cannot write at all
9.3
2.6
1.4
0.0
4.8
2.4
15.2
16.0
7.1
12.2
2.7
3.3
25.0
0.0
21.4
No answer
1.3
0.0
0.0
0.0
0.0
0.0
1.6
1.2
7.1
2.0
2.7
3.3
0.0
3.3
0.0
0% 10% 20% 30% 40% 50% 60% 70% 80% 90% 100%
Legend (no. of samples)
Total(940)
Specialist in humanities/international services(115)
Intra-company transferee(73)
Engineer(47)
Family stays(42)
Investor/business manager(41)
Permanent resident(310)
Special permanent resident(81)
Designated activities(14)
Spouse, etc. of a Japanese national(98)
College Student(37)
Long-term resident(30)
Skilled labor(8)
Other(30)
No answer(14)
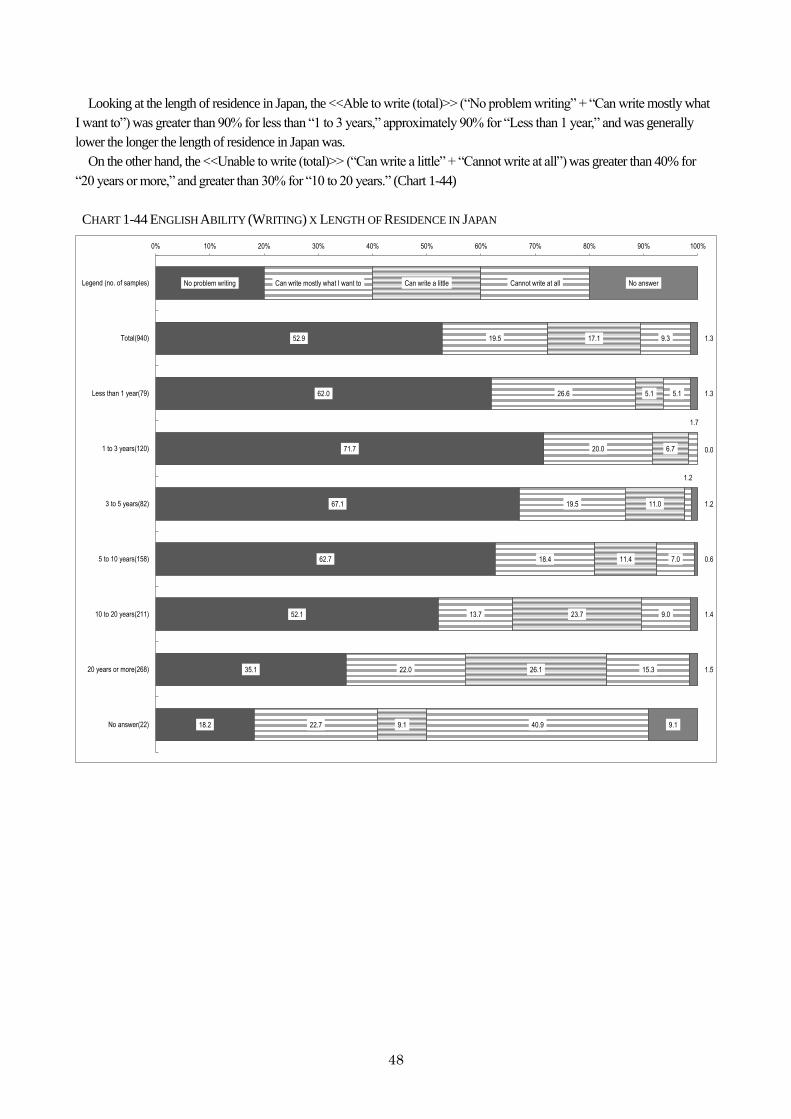
48
Looking at the length of residence in Japan, the <<Able to write (total)>> (“No problem writing” + “Can write mostly what
I want to”) was greater than 90% for less than “1 to 3 years,” approximately 90% for “Less than 1 year,” and was generally
lower the longer the length of residence in Japan was.
On the other hand, the <<Unable to write (total)>> (“Can write a little” + “Cannot write at all”) was greater than 40% for
“20 years or more,” and greater than 30% for “10 to 20 years.” (Chart 1-44)
CHART 1-44 ENGLISH ABILITY (WRITING) X LENGTH OF RESIDENCE IN JAPAN
No problem writing
52.9
62.0
71.7
67.1
62.7
52.1
35.1
18.2
Can write mostly what I want to
19.5
26.6
20.0
19.5
18.4
13.7
22.0
22.7
Can write a little
17.1
5.1
6.7
11.0
11.4
23.7
26.1
9.1
Cannot write at all
9.3
5.1
1.7
1.2
7.0
9.0
15.3
40.9
No answer
1.3
1.3
0.0
1.2
0.6
1.4
1.5
9.1
0% 10% 20% 30% 40% 50% 60% 70% 80% 90% 100%
Legend (no. of samples)
Total(940)
Less than 1 year(79)
1 to 3 years(120)
3 to 5 years(82)
5 to 10 years(158)
10 to 20 years(211)
20 years or more(268)
No answer(22)
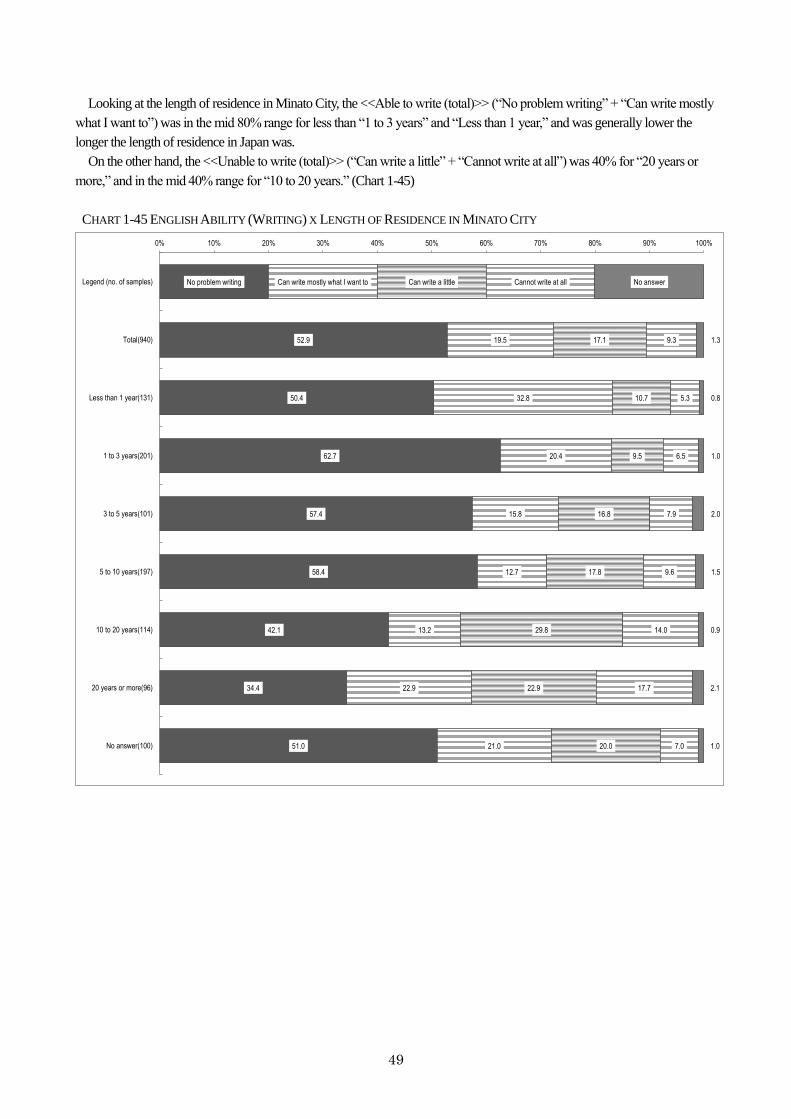
49
Looking at the length of residence in Minato City, the <<Able to write (total)>> (“No problem writing” + “Can write mostly
what I want to”) was in the mid 80% range for less than “1 to 3 years” and “Less than 1 year,” and was generally lower the
longer the length of residence in Japan was.
On the other hand, the <<Unable to write (total)>> (“Can write a little” + “Cannot write at all”) was 40% for “20 years or
more,” and in the mid 40% range for “10 to 20 years.” (Chart 1-45)
CHART 1-45 ENGLISH ABILITY (WRITING) X LENGTH OF RESIDENCE IN MINATO CITY
No problem writing
52.9
50.4
62.7
57.4
58.4
42.1
34.4
51.0
Can write mostly what I want to
19.5
32.8
20.4
15.8
12.7
13.2
22.9
21.0
Can write a little
17.1
10.7
9.5
16.8
17.8
29.8
22.9
20.0
Cannot write at all
9.3
5.3
6.5
7.9
9.6
14.0
17.7
7.0
No answer
1.3
0.8
1.0
2.0
1.5
0.9
2.1
1.0
0% 10% 20% 30% 40% 50% 60% 70% 80% 90% 100%
Legend (no. of samples)
Total(940)
Less than 1 year(131)
1 to 3 years(201)
3 to 5 years(101)
5 to 10 years(197)
10 to 20 years(114)
20 years or more(96)
No answer(100)
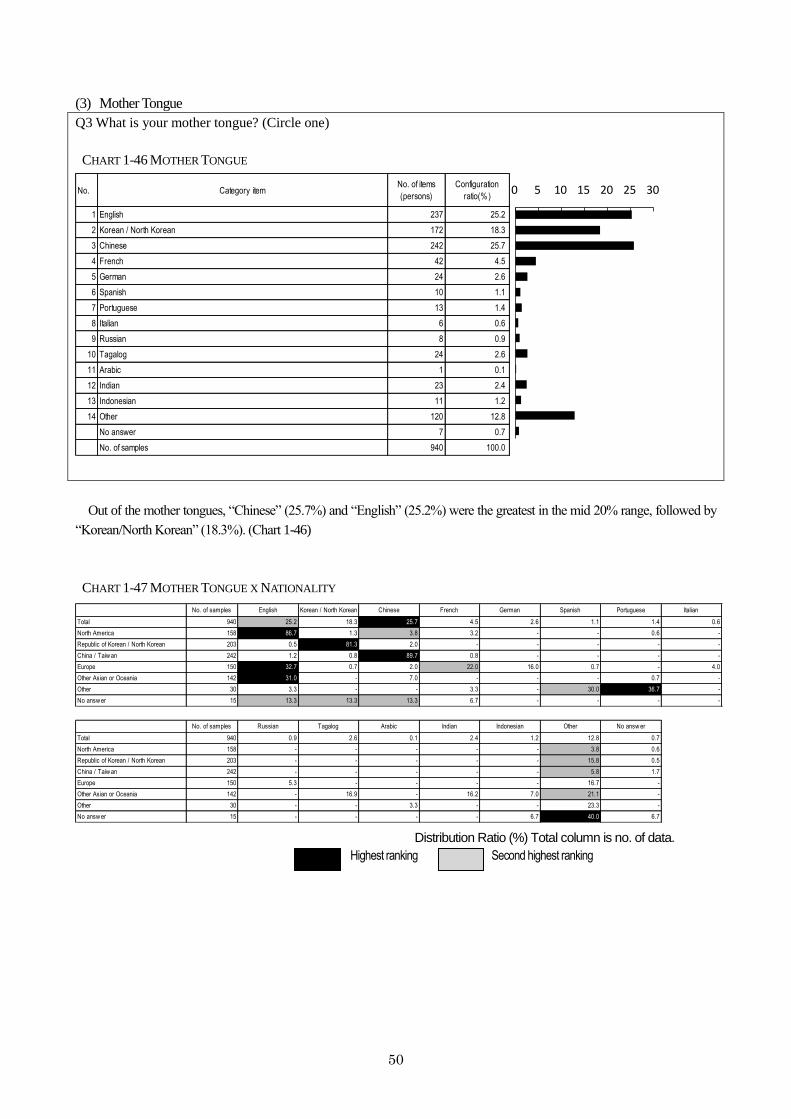
50
(3) Mother Tongue
Q3 What is your mother tongue? (Circle one)
CHART 1-46 MOTHER TONGUE
No. Category itemNo. of items
(persons)
Configuration
ratio(%)
1 English 237 25.2
2 Korean / North Korean 172 18.3
3 Chinese 242 25.7
4 French 42 4.5
5 German 24 2.6
6 Spanish 10 1.1
7 Portuguese 13 1.4
8 Italian 6 0.6
9 Russian 8 0.9
10 Tagalog 24 2.6
11 Arabic 1 0.1
12 Indian 23 2.4
13 Indonesian 11 1.2
14 Other 120 12.8
No answer 7 0.7
No. of samples 940 100.0
0 5 10 15 20 25 30
Out of the mother tongues, “Chinese” (25.7%) and “English” (25.2%) were the greatest in the mid 20% range, followed by
“Korean/North Korean” (18.3%). (Chart 1-46)
CHART 1-47 MOTHER TONGUE X NATIONALITY
No. of samples English Korean / North Korean Chinese French German Spanish Portuguese Italian
Total 940 25.2 18.3 25.7 4.5 2.6 1.1 1.4 0.6
North America 158 86.7 1.3 3.8 3.2 - - 0.6 -
Republic of Korean / North Korean 203 0.5 81.3 2.0 - - - - -
China / Taiw an 242 1.2 0.8 89.7 0.8 - - - -
Europe 150 32.7 0.7 2.0 22.0 16.0 0.7 - 4.0
Other Asian or Oceania 142 31.0 - 7.0 - - - 0.7 -
Other 30 3.3 - - 3.3 - 30.0 36.7 -
No answ er 15 13.3 13.3 13.3 6.7 - - - -
No. of samples Russian Tagalog Arabic Indian Indonesian Other No answ er
Total 940 0.9 2.6 0.1 2.4 1.2 12.8 0.7
North America 158 - - - - - 3.8 0.6
Republic of Korean / North Korean 203 - - - - - 15.8 0.5
China / Taiw an 242 - - - - - 5.8 1.7
Europe 150 5.3 - - - - 16.7 -
Other Asian or Oceania 142 - 16.9 - 16.2 7.0 21.1 -
Other 30 - - 3.3 - - 23.3 -
No answ er 15 - - - - 6.7 40.0 6.7
Distribution Ratio (%) Total column is no. of data.
Second highest ranking Highest ranking
51
CHART 1-48 MOTHER TONGUE X RESIDENTIAL STATUS
No. of samples English Korean / North Korean Chinese French German Spanish Portuguese Italian
Total 940 25.2 18.3 25.7 4.5 2.6 1.1 1.4 0.6
Specialist in humanities/
international serv ices115 39.1 16.5 18.3 3.5 3.5 0.9 0.9 2.6
Intra-company transferee 73 34.2 9.6 9.6 12.3 8.2 1.4 2.7 -
Engineer 47 25.5 8.5 21.3 14.9 4.3 2.1 - -
Family stay s 42 11.9 33.3 33.3 - 4.8 - - -
Inv estor/business manager 41 39.0 19.5 14.6 4.9 7.3 - - -
Permanent resident 310 22.6 15.5 36.5 3.5 1.0 1.3 2.3 0.6
Special permanent resident 81 1.2 51.9 4.9 - - - - -
Designated activ ities 14 35.7 7.1 14.3 14.3 - - - -
Spouse, etc. of a Japanese national 98 29.6 15.3 28.6 2.0 1.0 1.0 2.0 1.0
College Student 37 2.7 18.9 48.6 2.7 - - - -
Long-term resident 30 30.0 16.7 16.7 6.7 6.7 3.3 3.3 -
Skilled labor 8 25.0 - 37.5 - - - - -
Other 30 46.7 3.3 16.7 6.7 - 3.3 - -
No answ er 14 21.4 7.1 42.9 - 7.1 - - -
No. of samples Russian Tagalog Arabic Indian Indonesian Other No answ er
Total 940 0.9 2.6 0.1 2.4 1.2 12.8 0.7
Specialist in humanities/
international serv ices115 0.9 2.6 - 1.7 0.9 7.0 1.7
Intra-company transferee 73 - 1.4 - 6.8 1.4 12.3 -
Engineer 47 4.3 - - 6.4 2.1 10.6 -
Family stay s 42 - - - 4.8 - 11.9 -
Inv estor/business manager 41 - - - 4.9 - 9.8 -
Permanent resident 310 1.3 2.3 - 1.6 0.3 10.3 1.0
Special permanent resident 81 - 1.2 - - - 39.5 1.2
Designated activ ities 14 - 21.4 - 7.1 - - -
Spouse, etc. of a Japanese national 98 1.0 4.1 - - 1.0 12.2 1.0
College Student 37 - 5.4 2.7 - 5.4 13.5 -
Long-term resident 30 - 3.3 - 3.3 - 10.0 -
Skilled labor 8 - - - 12.5 12.5 12.5 -
Other 30 - 3.3 - 3.3 10.0 6.7 -
No answ er 14 - 7.1 - - - 14.3 -
Distribution Ratio (%) Total column is no. of data.
Second highest ranking Highest ranking
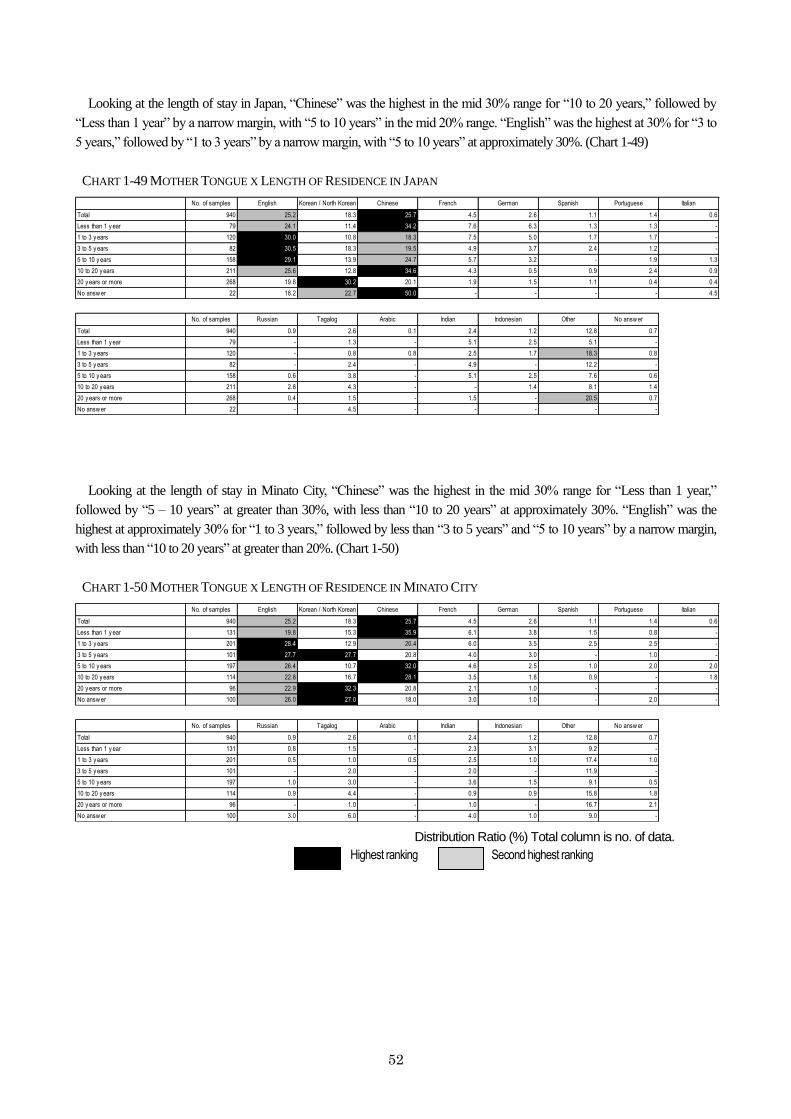
52
Looking at the length of stay in Japan, “Chinese” was the highest in the mid 30% range for “10 to 20 years,” followed by
“Less than 1 year” by a narrow margin, with “5 to 10 years” in the mid 20% range. “English” was the highest at 30% for “3 to
5 years,” followed by “1 to 3 years” by a narrow margin, with “5 to 10 years” at approximately 30%. (Chart 1-49)
CHART 1-49 MOTHER TONGUE X LENGTH OF RESIDENCE IN JAPAN
No. of samples English Korean / North Korean Chinese French German Spanish Portuguese Italian
Total 940 25.2 18.3 25.7 4.5 2.6 1.1 1.4 0.6
Less than 1 y ear 79 24.1 11.4 34.2 7.6 6.3 1.3 1.3 -
1 to 3 y ears 120 30.0 10.8 18.3 7.5 5.0 1.7 1.7 -
3 to 5 y ears 82 30.5 18.3 19.5 4.9 3.7 2.4 1.2 -
5 to 10 y ears 158 29.1 13.9 24.7 5.7 3.2 - 1.9 1.3
10 to 20 y ears 211 25.6 12.8 34.6 4.3 0.5 0.9 2.4 0.9
20 y ears or more 268 19.8 30.2 20.1 1.9 1.5 1.1 0.4 0.4
No answ er 22 18.2 22.7 50.0 - - - - 4.5
No. of samples Russian Tagalog Arabic Indian Indonesian Other No answ er
Total 940 0.9 2.6 0.1 2.4 1.2 12.8 0.7
Less than 1 y ear 79 - 1.3 - 5.1 2.5 5.1 -
1 to 3 y ears 120 - 0.8 0.8 2.5 1.7 18.3 0.8
3 to 5 y ears 82 - 2.4 - 4.9 - 12.2 -
5 to 10 y ears 158 0.6 3.8 - 5.1 2.5 7.6 0.6
10 to 20 y ears 211 2.8 4.3 - - 1.4 8.1 1.4
20 y ears or more 268 0.4 1.5 - 1.5 - 20.5 0.7
No answ er 22 - 4.5 - - - - -
Looking at the length of stay in Minato City, “Chinese” was the highest in the mid 30% range for “Less than 1 year,”
followed by “5 – 10 years” at greater than 30%, with less than “10 to 20 years” at approximately 30%. “English” was the
highest at approximately 30% for “1 to 3 years,” followed by less than “3 to 5 years” and “5 to 10 years” by a narrow margin,
with less than “10 to 20 years” at greater than 20%. (Chart 1-50)
CHART 1-50 MOTHER TONGUE X LENGTH OF RESIDENCE IN MINATO CITY
No. of samples English Korean / North Korean Chinese French German Spanish Portuguese Italian
Total 940 25.2 18.3 25.7 4.5 2.6 1.1 1.4 0.6
Less than 1 y ear 131 19.8 15.3 35.9 6.1 3.8 1.5 0.8 -
1 to 3 y ears 201 28.4 12.9 20.4 6.0 3.5 2.5 2.5 -
3 to 5 y ears 101 27.7 27.7 20.8 4.0 3.0 - 1.0 -
5 to 10 y ears 197 26.4 10.7 32.0 4.6 2.5 1.0 2.0 2.0
10 to 20 y ears 114 22.8 16.7 28.1 3.5 1.8 0.9 - 1.8
20 y ears or more 96 22.9 32.3 20.8 2.1 1.0 - - -
No answ er 100 26.0 27.0 18.0 3.0 1.0 - 2.0 -
No. of samples Russian Tagalog Arabic Indian Indonesian Other No answ er
Total 940 0.9 2.6 0.1 2.4 1.2 12.8 0.7
Less than 1 y ear 131 0.8 1.5 - 2.3 3.1 9.2 -
1 to 3 y ears 201 0.5 1.0 0.5 2.5 1.0 17.4 1.0
3 to 5 y ears 101 - 2.0 - 2.0 - 11.9 -
5 to 10 y ears 197 1.0 3.0 - 3.6 1.5 9.1 0.5
10 to 20 y ears 114 0.9 4.4 - 0.9 0.9 15.8 1.8
20 y ears or more 96 - 1.0 - 1.0 - 16.7 2.1
No answ er 100 3.0 6.0 - 4.0 1.0 9.0 -
Distribution Ratio (%) Total column is no. of data.
Second highest ranking Highest ranking
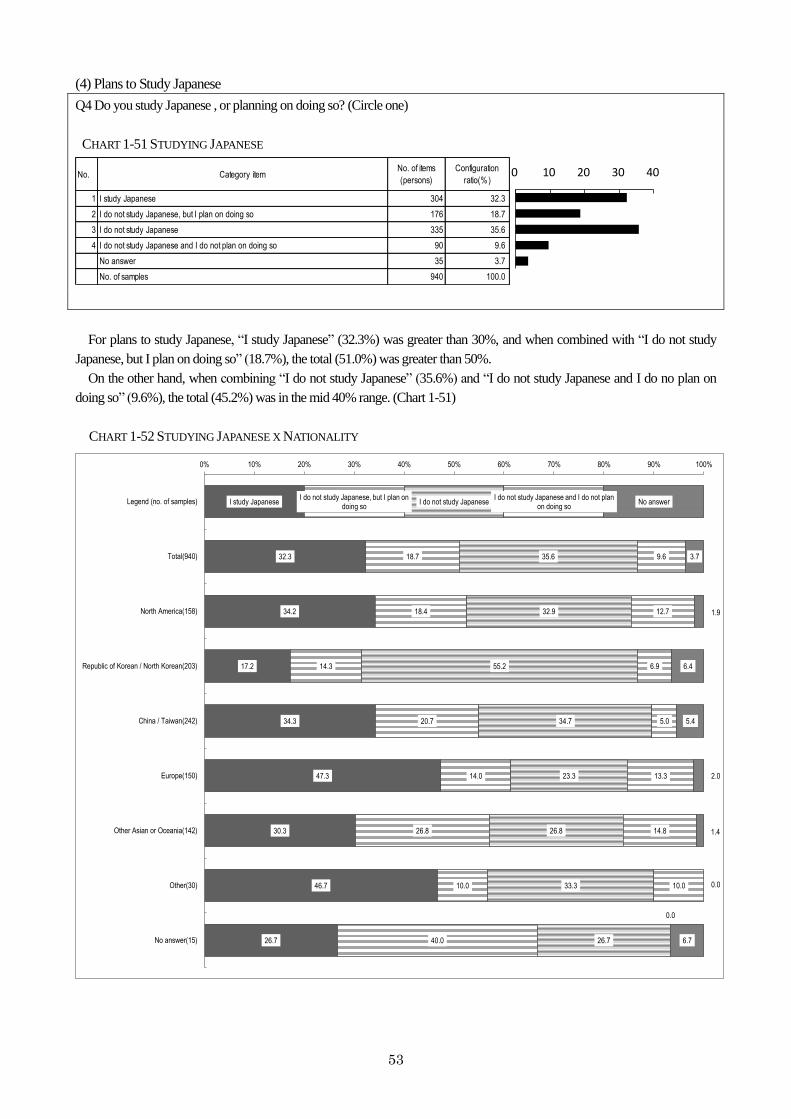
53
(4) Plans to Study Japanese
Q4 Do you study Japanese , or planning on doing so? (Circle one)
CHART 1-51 STUDYING JAPANESE
No. Category itemNo. of items
(persons)
Configuration
ratio(%)
1 I study Japanese 304 32.3
2 I do not study Japanese, but I plan on doing so 176 18.7
3 I do not study Japanese 335 35.6
4 I do not study Japanese and I do not plan on doing so 90 9.6
No answer 35 3.7
No. of samples 940 100.0
0 10 20 30 40
For plans to study Japanese, “I study Japanese” (32.3%) was greater than 30%, and when combined with “I do not study
Japanese, but I plan on doing so” (18.7%), the total (51.0%) was greater than 50%.
On the other hand, when combining “I do not study Japanese” (35.6%) and “I do not study Japanese and I do no plan on
doing so” (9.6%), the total (45.2%) was in the mid 40% range. (Chart 1-51)
CHART 1-52 STUDYING JAPANESE X NATIONALITY
I study Japanese
32.3
34.2
17.2
34.3
47.3
30.3
46.7
26.7
I do not study Japanese, but I plan on doing so
18.7
18.4
14.3
20.7
14.0
26.8
10.0
40.0
I do not study Japanese
35.6
32.9
55.2
34.7
23.3
26.8
33.3
26.7
I do not study Japanese and I do not plan on doing so
9.6
12.7
6.9
5.0
13.3
14.8
10.0
0.0
No answer
3.7
1.9
6.4
5.4
2.0
1.4
0.0
6.7
0% 10% 20% 30% 40% 50% 60% 70% 80% 90% 100%
Legend (no. of samples)
Total(940)
North America(158)
Republic of Korean / North Korean(203)
China / Taiwan(242)
Europe(150)
Other Asian or Oceania(142)
Other(30)
No answer(15)
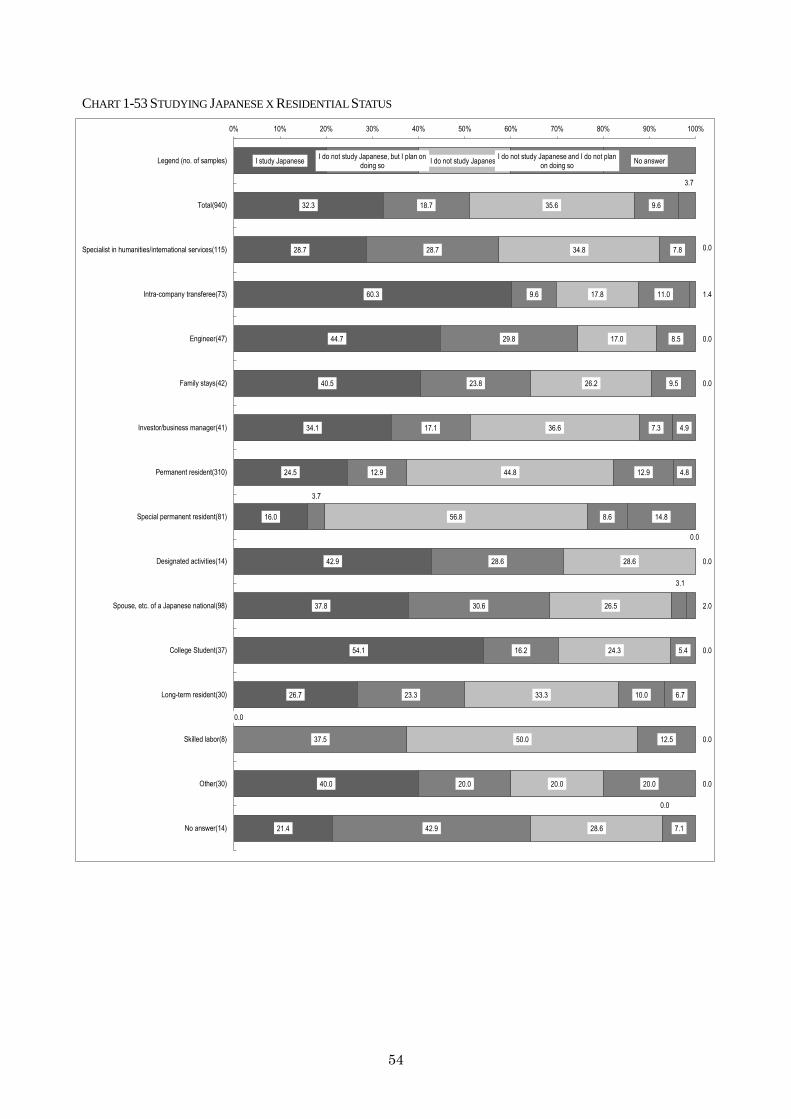
54
CHART 1-53 STUDYING JAPANESE X RESIDENTIAL STATUS
I study Japanese
32.3
28.7
60.3
44.7
40.5
34.1
24.5
16.0
42.9
37.8
54.1
26.7
0.0
40.0
21.4
I do not study Japanese, but I plan on doing so
18.7
28.7
9.6
29.8
23.8
17.1
12.9
3.7
28.6
30.6
16.2
23.3
37.5
20.0
42.9
I do not study Japanese
35.6
34.8
17.8
17.0
26.2
36.6
44.8
56.8
28.6
26.5
24.3
33.3
50.0
20.0
28.6
I do not study Japanese and I do not plan on doing so
9.6
7.8
11.0
8.5
9.5
7.3
12.9
8.6
0.0
3.1
5.4
10.0
12.5
20.0
0.0
No answer
3.7
0.0
1.4
0.0
0.0
4.9
4.8
14.8
0.0
2.0
0.0
6.7
0.0
0.0
7.1
0% 10% 20% 30% 40% 50% 60% 70% 80% 90% 100%
Legend (no. of samples)
Total(940)
Specialist in humanities/international services(115)
Intra-company transferee(73)
Engineer(47)
Family stays(42)
Investor/business manager(41)
Permanent resident(310)
Special permanent resident(81)
Designated activities(14)
Spouse, etc. of a Japanese national(98)
College Student(37)
Long-term resident(30)
Skilled labor(8)
Other(30)
No answer(14)
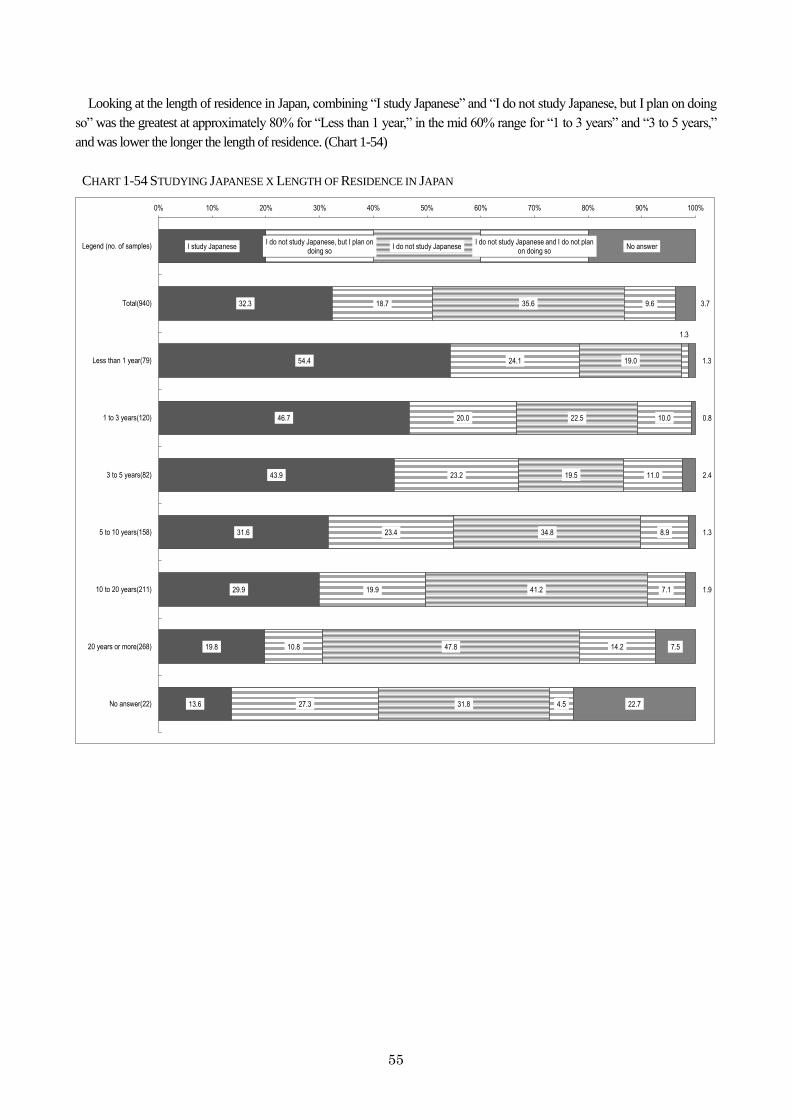
55
Looking at the length of residence in Japan, combining “I study Japanese” and “I do not study Japanese, but I plan on doing
so” was the greatest at approximately 80% for “Less than 1 year,” in the mid 60% range for “1 to 3 years” and “3 to 5 years,”
and was lower the longer the length of residence. (Chart 1-54)
CHART 1-54 STUDYING JAPANESE X LENGTH OF RESIDENCE IN JAPAN
I study Japanese
32.3
54.4
46.7
43.9
31.6
29.9
19.8
13.6
I do not study Japanese, but I plan on doing so
18.7
24.1
20.0
23.2
23.4
19.9
10.8
27.3
I do not study Japanese
35.6
19.0
22.5
19.5
34.8
41.2
47.8
31.8
I do not study Japanese and I do not plan on doing so
9.6
1.3
10.0
11.0
8.9
7.1
14.2
4.5
No answer
3.7
1.3
0.8
2.4
1.3
1.9
7.5
22.7
0% 10% 20% 30% 40% 50% 60% 70% 80% 90% 100%
Legend (no. of samples)
Total(940)
Less than 1 year(79)
1 to 3 years(120)
3 to 5 years(82)
5 to 10 years(158)
10 to 20 years(211)
20 years or more(268)
No answer(22)
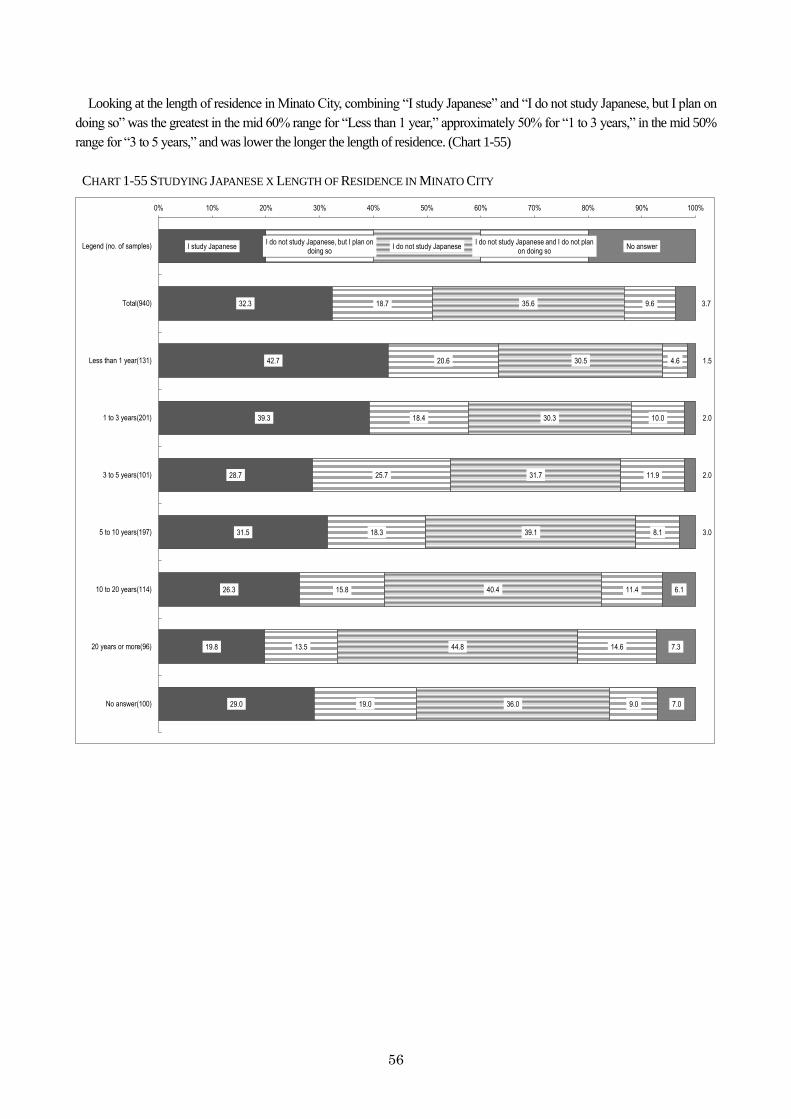
56
Looking at the length of residence in Minato City, combining “I study Japanese” and “I do not study Japanese, but I plan on
doing so” was the greatest in the mid 60% range for “Less than 1 year,” approximately 50% for “1 to 3 years,” in the mid 50%
range for “3 to 5 years,” and was lower the longer the length of residence. (Chart 1-55)
CHART 1-55 STUDYING JAPANESE X LENGTH OF RESIDENCE IN MINATO CITY
I study Japanese
32.3
42.7
39.3
28.7
31.5
26.3
19.8
29.0
I do not study Japanese, but I plan on doing so
18.7
20.6
18.4
25.7
18.3
15.8
13.5
19.0
I do not study Japanese
35.6
30.5
30.3
31.7
39.1
40.4
44.8
36.0
I do not study Japanese and I do not plan on doing so
9.6
4.6
10.0
11.9
8.1
11.4
14.6
9.0
No answer
3.7
1.5
2.0
2.0
3.0
6.1
7.3
7.0
0% 10% 20% 30% 40% 50% 60% 70% 80% 90% 100%
Legend (no. of samples)
Total(940)
Less than 1 year(131)
1 to 3 years(201)
3 to 5 years(101)
5 to 10 years(197)
10 to 20 years(114)
20 years or more(96)
No answer(100)
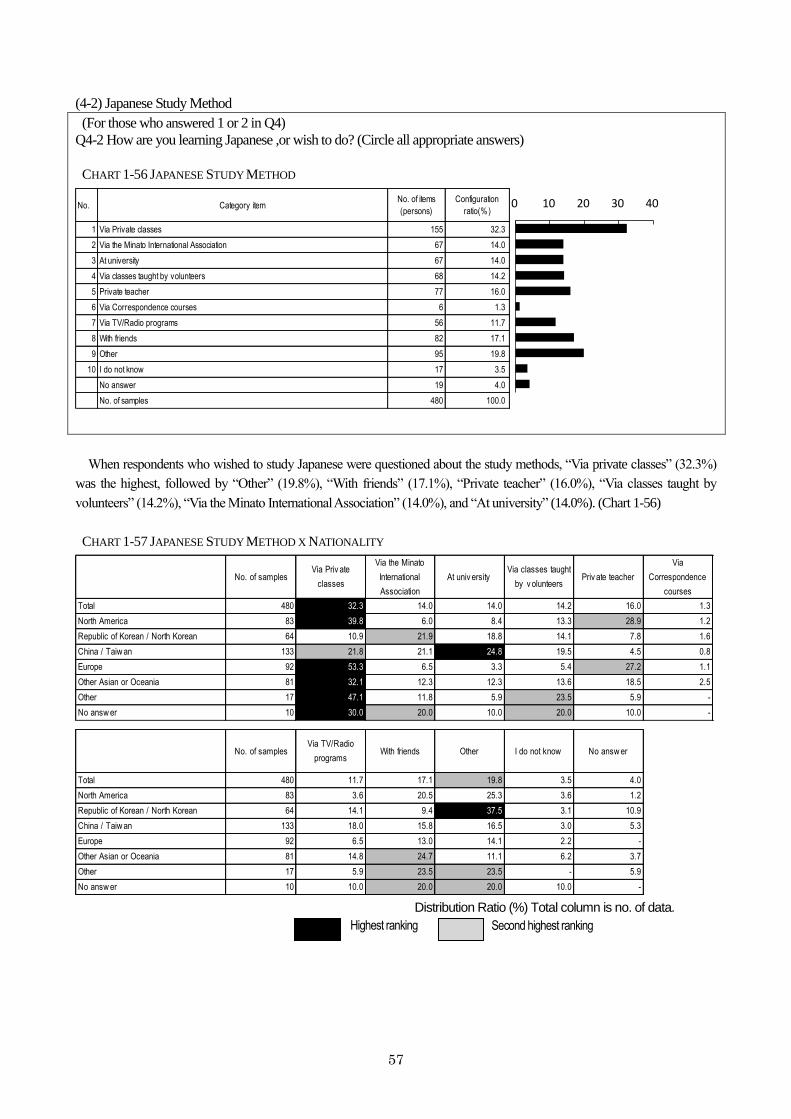
57
(4-2) Japanese Study Method
(For those who answered 1 or 2 in Q4) Q4-2 How are you learning Japanese ,or wish to do? (Circle all appropriate answers)
CHART 1-56 JAPANESE STUDY METHOD
No. Category itemNo. of items
(persons)
Configuration
ratio(%)
1 Via Private classes 155 32.3
2 Via the Minato International Association 67 14.0
3 At university 67 14.0
4 Via classes taught by volunteers 68 14.2
5 Private teacher 77 16.0
6 Via Correspondence courses 6 1.3
7 Via TV/Radio programs 56 11.7
8 With friends 82 17.1
9 Other 95 19.8
10 I do not know 17 3.5
No answer 19 4.0
No. of samples 480 100.0
0 10 20 30 40
When respondents who wished to study Japanese were questioned about the study methods, “Via private classes” (32.3%)
was the highest, followed by “Other” (19.8%), “With friends” (17.1%), “Private teacher” (16.0%), “Via classes taught by
volunteers” (14.2%), “Via the Minato International Association” (14.0%), and “At university” (14.0%). (Chart 1-56)
CHART 1-57 JAPANESE STUDY METHOD X NATIONALITY
No. of samplesVia Priv ate
classes
Via the Minato
International
Association
At univ ersityVia classes taught
by v olunteersPriv ate teacher
Via
Correspondence
courses
Total 480 32.3 14.0 14.0 14.2 16.0 1.3
North America 83 39.8 6.0 8.4 13.3 28.9 1.2
Republic of Korean / North Korean 64 10.9 21.9 18.8 14.1 7.8 1.6
China / Taiw an 133 21.8 21.1 24.8 19.5 4.5 0.8
Europe 92 53.3 6.5 3.3 5.4 27.2 1.1
Other Asian or Oceania 81 32.1 12.3 12.3 13.6 18.5 2.5
Other 17 47.1 11.8 5.9 23.5 5.9 -
No answ er 10 30.0 20.0 10.0 20.0 10.0 -
No. of samplesVia TV/Radio
programsWith friends Other I do not know No answ er
Total 480 11.7 17.1 19.8 3.5 4.0
North America 83 3.6 20.5 25.3 3.6 1.2
Republic of Korean / North Korean 64 14.1 9.4 37.5 3.1 10.9
China / Taiw an 133 18.0 15.8 16.5 3.0 5.3
Europe 92 6.5 13.0 14.1 2.2 -
Other Asian or Oceania 81 14.8 24.7 11.1 6.2 3.7
Other 17 5.9 23.5 23.5 - 5.9
No answ er 10 10.0 20.0 20.0 10.0 - Distribution Ratio (%) Total column is no. of data.
Second highest ranking Highest ranking
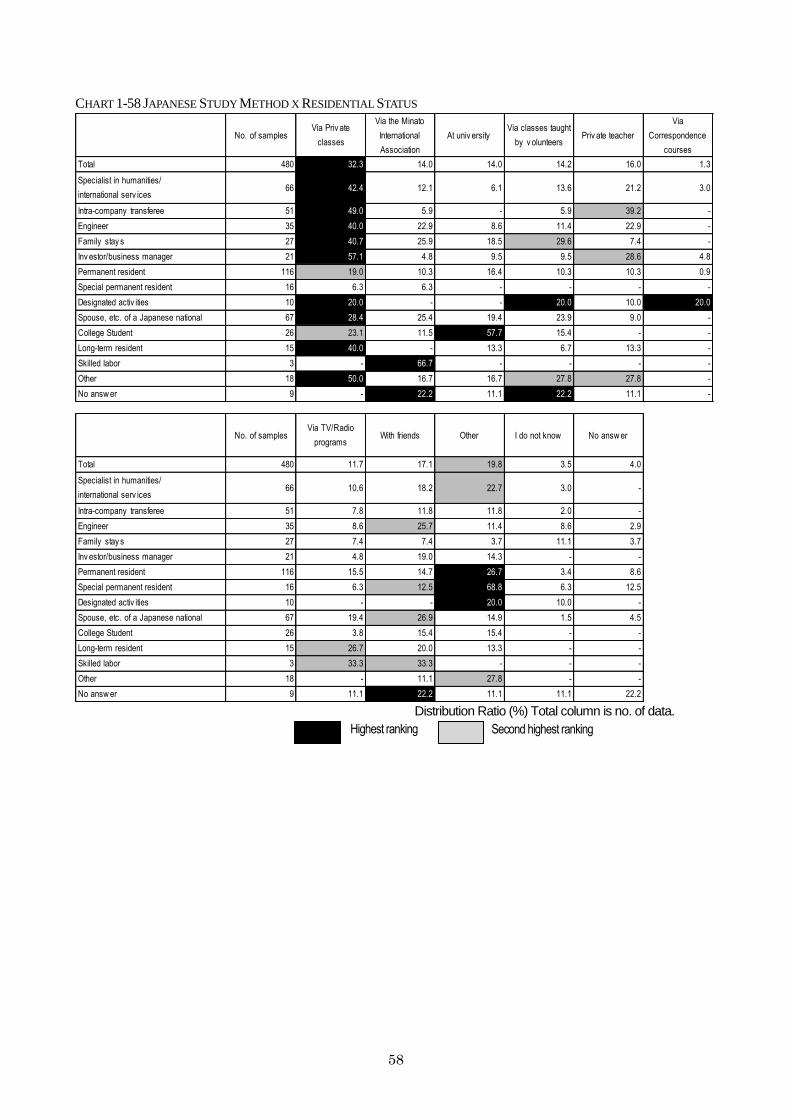
58
CHART 1-58 JAPANESE STUDY METHOD X RESIDENTIAL STATUS
No. of samplesVia Priv ate
classes
Via the Minato
International
Association
At univ ersityVia classes taught
by v olunteersPriv ate teacher
Via
Correspondence
courses
Total 480 32.3 14.0 14.0 14.2 16.0 1.3
Specialist in humanities/
international serv ices66 42.4 12.1 6.1 13.6 21.2 3.0
Intra-company transferee 51 49.0 5.9 - 5.9 39.2 -
Engineer 35 40.0 22.9 8.6 11.4 22.9 -
Family stay s 27 40.7 25.9 18.5 29.6 7.4 -
Inv estor/business manager 21 57.1 4.8 9.5 9.5 28.6 4.8
Permanent resident 116 19.0 10.3 16.4 10.3 10.3 0.9
Special permanent resident 16 6.3 6.3 - - - -
Designated activ ities 10 20.0 - - 20.0 10.0 20.0
Spouse, etc. of a Japanese national 67 28.4 25.4 19.4 23.9 9.0 -
College Student 26 23.1 11.5 57.7 15.4 - -
Long-term resident 15 40.0 - 13.3 6.7 13.3 -
Skilled labor 3 - 66.7 - - - -
Other 18 50.0 16.7 16.7 27.8 27.8 -
No answ er 9 - 22.2 11.1 22.2 11.1 -
No. of samplesVia TV/Radio
programsWith friends Other I do not know No answ er
Total 480 11.7 17.1 19.8 3.5 4.0
Specialist in humanities/
international serv ices66 10.6 18.2 22.7 3.0 -
Intra-company transferee 51 7.8 11.8 11.8 2.0 -
Engineer 35 8.6 25.7 11.4 8.6 2.9
Family stay s 27 7.4 7.4 3.7 11.1 3.7
Inv estor/business manager 21 4.8 19.0 14.3 - -
Permanent resident 116 15.5 14.7 26.7 3.4 8.6
Special permanent resident 16 6.3 12.5 68.8 6.3 12.5
Designated activ ities 10 - - 20.0 10.0 -
Spouse, etc. of a Japanese national 67 19.4 26.9 14.9 1.5 4.5
College Student 26 3.8 15.4 15.4 - -
Long-term resident 15 26.7 20.0 13.3 - -
Skilled labor 3 33.3 33.3 - - -
Other 18 - 11.1 27.8 - -
No answ er 9 11.1 22.2 11.1 11.1 22.2 Distribution Ratio (%) Total column is no. of data.
Second highest ranking Highest ranking
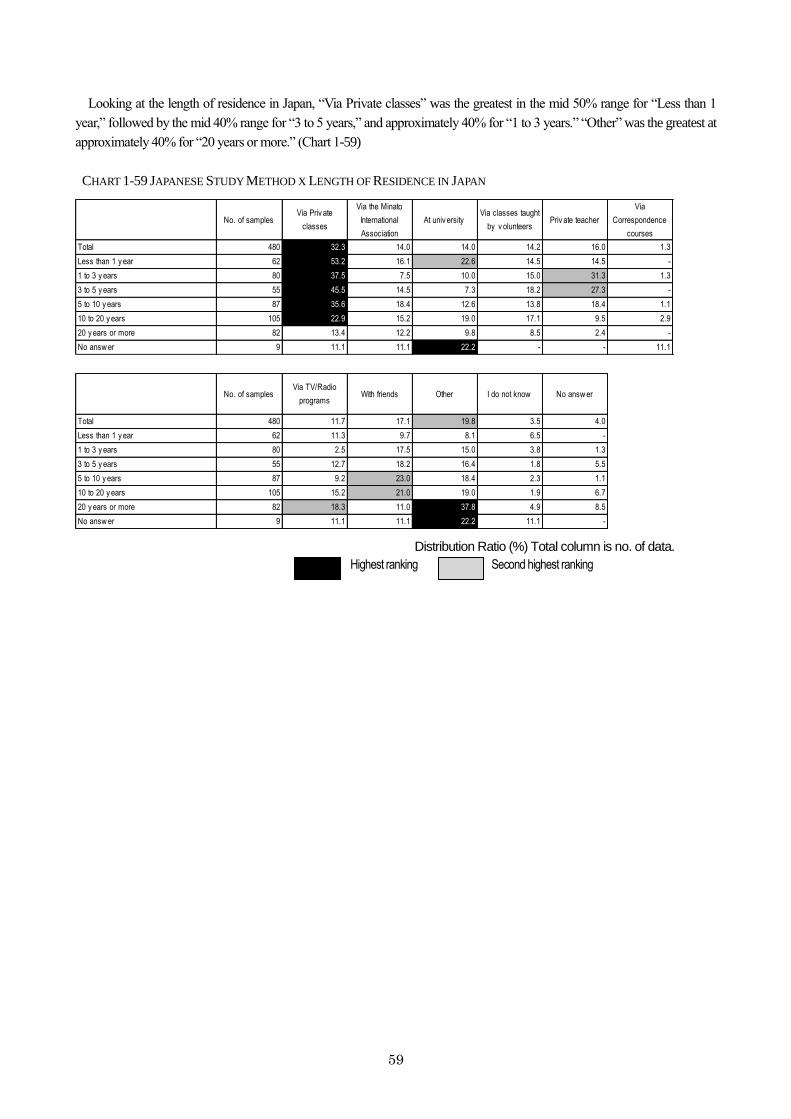
59
Looking at the length of residence in Japan, “Via Private classes” was the greatest in the mid 50% range for “Less than 1
year,” followed by the mid 40% range for “3 to 5 years,” and approximately 40% for “1 to 3 years.” “Other” was the greatest at
approximately 40% for “20 years or more.” (Chart 1-59)
CHART 1-59 JAPANESE STUDY METHOD X LENGTH OF RESIDENCE IN JAPAN
No. of samplesVia Priv ate
classes
Via the Minato
International
Association
At univ ersityVia classes taught
by v olunteersPriv ate teacher
Via
Correspondence
courses
Total 480 32.3 14.0 14.0 14.2 16.0 1.3
Less than 1 y ear 62 53.2 16.1 22.6 14.5 14.5 -
1 to 3 y ears 80 37.5 7.5 10.0 15.0 31.3 1.3
3 to 5 y ears 55 45.5 14.5 7.3 18.2 27.3 -
5 to 10 y ears 87 35.6 18.4 12.6 13.8 18.4 1.1
10 to 20 y ears 105 22.9 15.2 19.0 17.1 9.5 2.9
20 y ears or more 82 13.4 12.2 9.8 8.5 2.4 -
No answ er 9 11.1 11.1 22.2 - - 11.1
No. of samplesVia TV/Radio
programsWith friends Other I do not know No answ er
Total 480 11.7 17.1 19.8 3.5 4.0
Less than 1 y ear 62 11.3 9.7 8.1 6.5 -
1 to 3 y ears 80 2.5 17.5 15.0 3.8 1.3
3 to 5 y ears 55 12.7 18.2 16.4 1.8 5.5
5 to 10 y ears 87 9.2 23.0 18.4 2.3 1.1
10 to 20 y ears 105 15.2 21.0 19.0 1.9 6.7
20 y ears or more 82 18.3 11.0 37.8 4.9 8.5
No answ er 9 11.1 11.1 22.2 11.1 -
Distribution Ratio (%) Total column is no. of data.
Second highest ranking Highest ranking
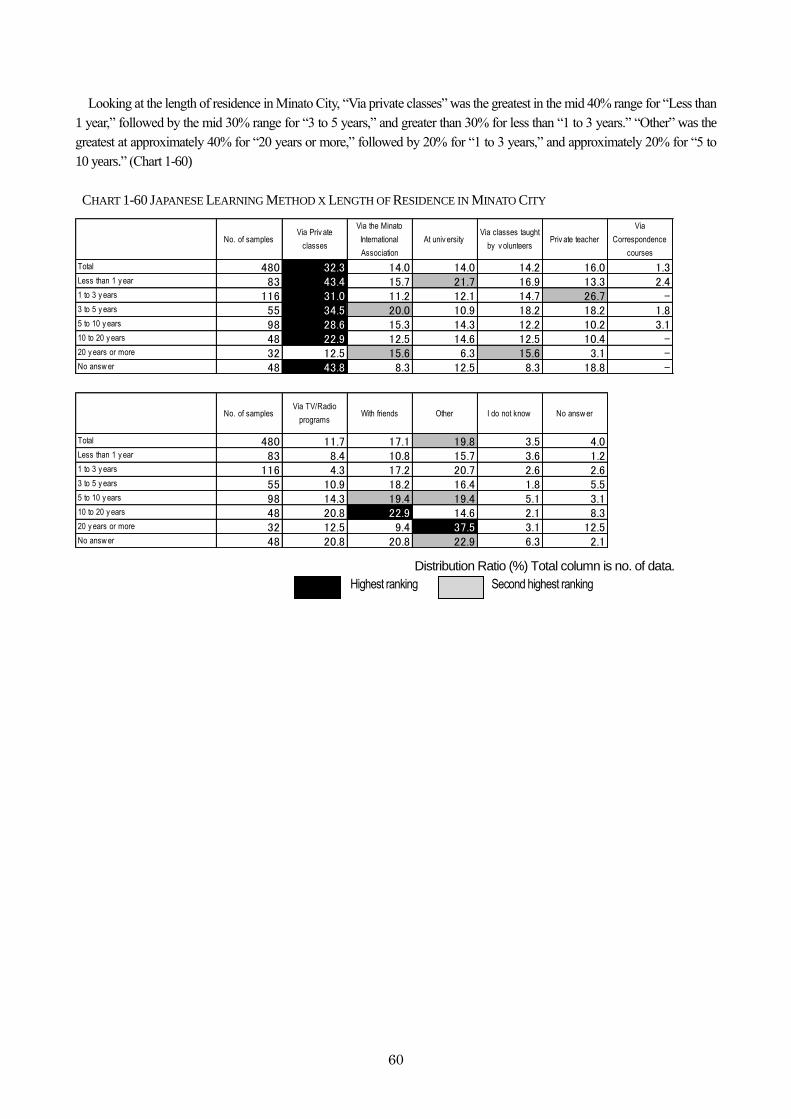
60
Looking at the length of residence in Minato City, “Via private classes” was the greatest in the mid 40% range for “Less than
1 year,” followed by the mid 30% range for “3 to 5 years,” and greater than 30% for less than “1 to 3 years.” “Other” was the
greatest at approximately 40% for “20 years or more,” followed by 20% for “1 to 3 years,” and approximately 20% for “5 to
10 years.” (Chart 1-60)
CHART 1-60 JAPANESE LEARNING METHOD X LENGTH OF RESIDENCE IN MINATO CITY
No. of samplesVia Priv ate
classes
Via the Minato
International
Association
At univ ersityVia classes taught
by v olunteersPriv ate teacher
Via
Correspondence
courses
Total 480 32.3 14.0 14.0 14.2 16.0 1.3Less than 1 y ear 83 43.4 15.7 21.7 16.9 13.3 2.41 to 3 y ears 116 31.0 11.2 12.1 14.7 26.7 -3 to 5 y ears 55 34.5 20.0 10.9 18.2 18.2 1.85 to 10 y ears 98 28.6 15.3 14.3 12.2 10.2 3.110 to 20 y ears 48 22.9 12.5 14.6 12.5 10.4 -20 y ears or more 32 12.5 15.6 6.3 15.6 3.1 -No answ er 48 43.8 8.3 12.5 8.3 18.8 -
No. of samplesVia TV/Radio
programsWith friends Other I do not know No answ er
Total 480 11.7 17.1 19.8 3.5 4.0Less than 1 y ear 83 8.4 10.8 15.7 3.6 1.21 to 3 y ears 116 4.3 17.2 20.7 2.6 2.63 to 5 y ears 55 10.9 18.2 16.4 1.8 5.55 to 10 y ears 98 14.3 19.4 19.4 5.1 3.110 to 20 y ears 48 20.8 22.9 14.6 2.1 8.320 y ears or more 32 12.5 9.4 37.5 3.1 12.5No answ er 48 20.8 20.8 22.9 6.3 2.1
Distribution Ratio (%) Total column is no. of data.
Second highest ranking Highest ranking
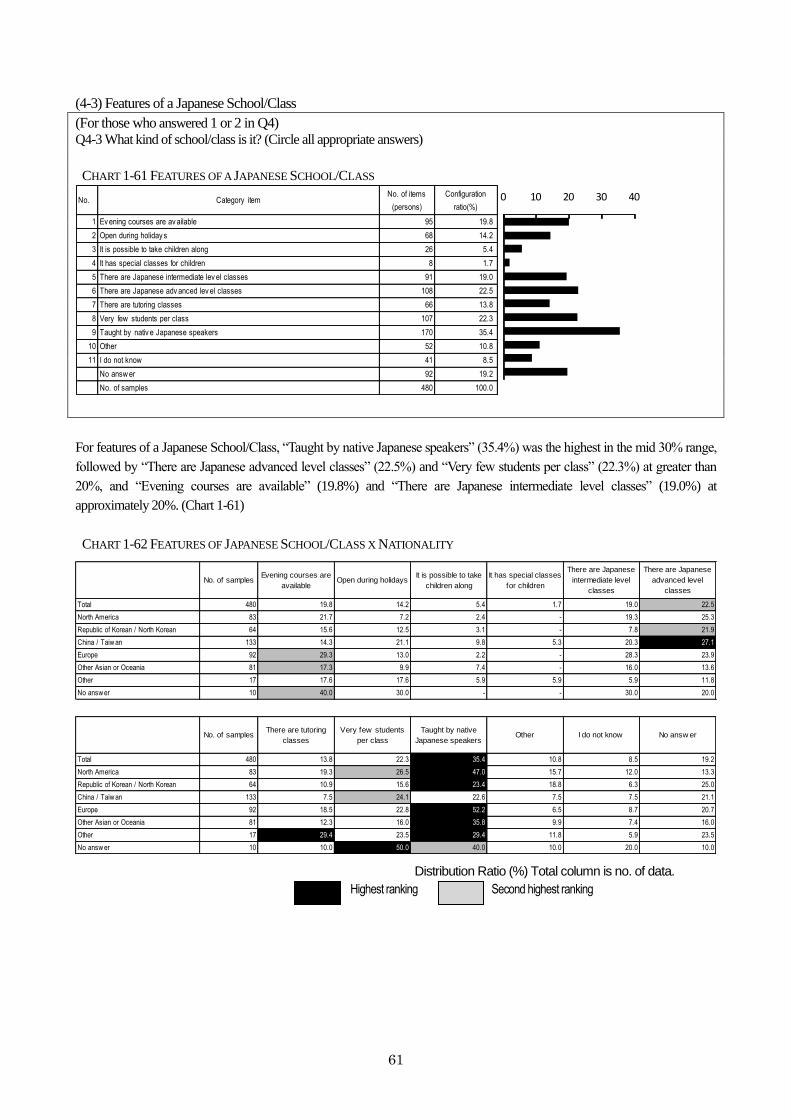
61
(4-3) Features of a Japanese School/Class
(For those who answered 1 or 2 in Q4) Q4-3 What kind of school/class is it? (Circle all appropriate answers)
CHART 1-61 FEATURES OF A JAPANESE SCHOOL/CLASS
For features of a Japanese School/Class, “Taught by native Japanese speakers” (35.4%) was the highest in the mid 30% range,
followed by “There are Japanese advanced level classes” (22.5%) and “Very few students per class” (22.3%) at greater than
20%, and “Evening courses are available” (19.8%) and “There are Japanese intermediate level classes” (19.0%) at
approximately 20%. (Chart 1-61)
CHART 1-62 FEATURES OF JAPANESE SCHOOL/CLASS X NATIONALITY
No. of samplesEvening courses are
availableOpen during holidays
It is possible to take
children along
It has special classes
for children
There are Japanese
intermediate level
classes
There are Japanese
advanced level
classes
Total 480 19.8 14.2 5.4 1.7 19.0 22.5
North America 83 21.7 7.2 2.4 - 19.3 25.3
Republic of Korean / North Korean 64 15.6 12.5 3.1 - 7.8 21.9
China / Taiw an 133 14.3 21.1 9.8 5.3 20.3 27.1
Europe 92 29.3 13.0 2.2 - 28.3 23.9
Other Asian or Oceania 81 17.3 9.9 7.4 - 16.0 13.6
Other 17 17.6 17.6 5.9 5.9 5.9 11.8
No answ er 10 40.0 30.0 - - 30.0 20.0
No. of samplesThere are tutoring
classes
Very few students
per class
Taught by native
Japanese speakersOther I do not know No answ er
Total 480 13.8 22.3 35.4 10.8 8.5 19.2
North America 83 19.3 26.5 47.0 15.7 12.0 13.3
Republic of Korean / North Korean 64 10.9 15.6 23.4 18.8 6.3 25.0
China / Taiw an 133 7.5 24.1 22.6 7.5 7.5 21.1
Europe 92 18.5 22.8 52.2 6.5 8.7 20.7
Other Asian or Oceania 81 12.3 16.0 35.8 9.9 7.4 16.0
Other 17 29.4 23.5 29.4 11.8 5.9 23.5
No answ er 10 10.0 50.0 40.0 10.0 20.0 10.0
Distribution Ratio (%) Total column is no. of data.
Second highest ranking Highest ranking
No. Category itemNo. of items
(persons)
Configuration
ratio(%)
1 Ev ening courses are av ailable 95 19.8
2 Open during holiday s 68 14.2
3 It is possible to take children along 26 5.4
4 It has special classes for children 8 1.7
5 There are Japanese intermediate lev el classes 91 19.0
6 There are Japanese adv anced lev el classes 108 22.5
7 There are tutoring classes 66 13.8
8 Very few students per class 107 22.3
9 Taught by nativ e Japanese speakers 170 35.4
10 Other 52 10.8
11 I do not know 41 8.5
No answ er 92 19.2
No. of samples 480 100.0
0 10 20 30 40
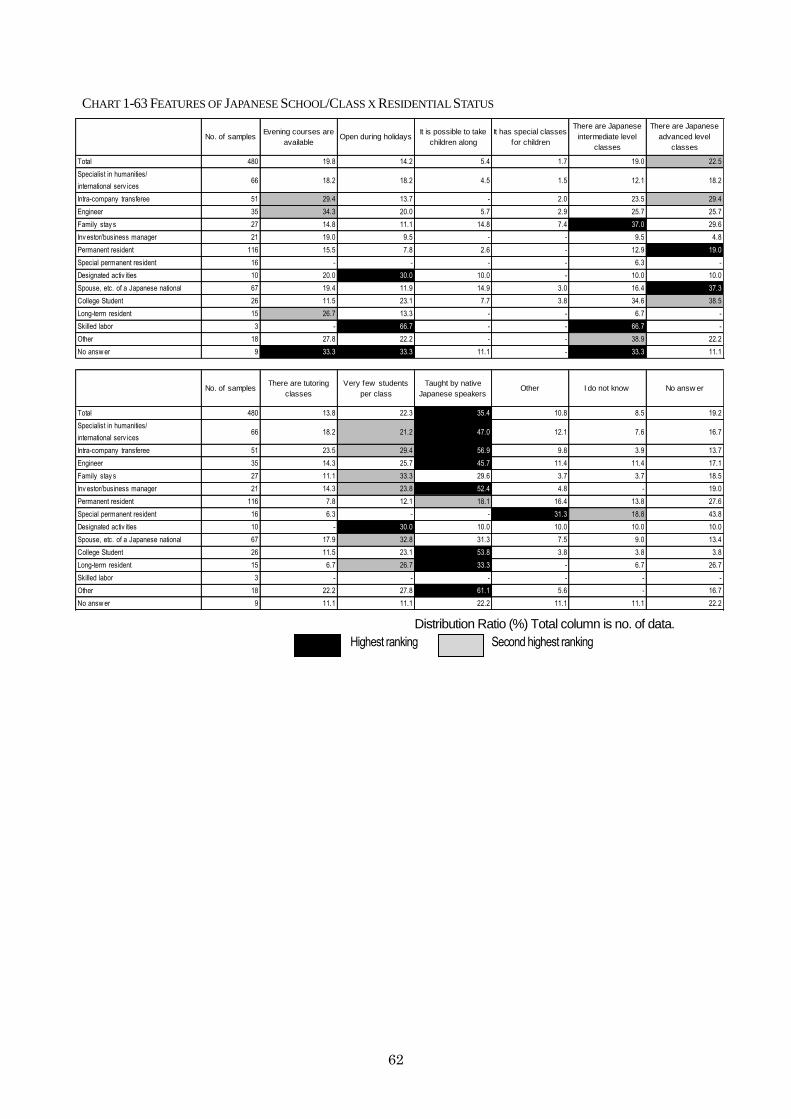
62
CHART 1-63 FEATURES OF JAPANESE SCHOOL/CLASS X RESIDENTIAL STATUS
No. of samplesEvening courses are
availableOpen during holidays
It is possible to take
children along
It has special classes
for children
There are Japanese
intermediate level
classes
There are Japanese
advanced level
classes
Total 480 19.8 14.2 5.4 1.7 19.0 22.5
Specialist in humanities/
international serv ices66 18.2 18.2 4.5 1.5 12.1 18.2
Intra-company transferee 51 29.4 13.7 - 2.0 23.5 29.4
Engineer 35 34.3 20.0 5.7 2.9 25.7 25.7
Family stay s 27 14.8 11.1 14.8 7.4 37.0 29.6
Inv estor/business manager 21 19.0 9.5 - - 9.5 4.8
Permanent resident 116 15.5 7.8 2.6 - 12.9 19.0
Special permanent resident 16 - - - - 6.3 -
Designated activ ities 10 20.0 30.0 10.0 - 10.0 10.0
Spouse, etc. of a Japanese national 67 19.4 11.9 14.9 3.0 16.4 37.3
College Student 26 11.5 23.1 7.7 3.8 34.6 38.5
Long-term resident 15 26.7 13.3 - - 6.7 -
Skilled labor 3 - 66.7 - - 66.7 -
Other 18 27.8 22.2 - - 38.9 22.2
No answ er 9 33.3 33.3 11.1 - 33.3 11.1
No. of samplesThere are tutoring
classes
Very few students
per class
Taught by native
Japanese speakersOther I do not know No answ er
Total 480 13.8 22.3 35.4 10.8 8.5 19.2
Specialist in humanities/
international serv ices66 18.2 21.2 47.0 12.1 7.6 16.7
Intra-company transferee 51 23.5 29.4 56.9 9.8 3.9 13.7
Engineer 35 14.3 25.7 45.7 11.4 11.4 17.1
Family stay s 27 11.1 33.3 29.6 3.7 3.7 18.5
Inv estor/business manager 21 14.3 23.8 52.4 4.8 - 19.0
Permanent resident 116 7.8 12.1 18.1 16.4 13.8 27.6
Special permanent resident 16 6.3 - - 31.3 18.8 43.8
Designated activ ities 10 - 30.0 10.0 10.0 10.0 10.0
Spouse, etc. of a Japanese national 67 17.9 32.8 31.3 7.5 9.0 13.4
College Student 26 11.5 23.1 53.8 3.8 3.8 3.8
Long-term resident 15 6.7 26.7 33.3 - 6.7 26.7
Skilled labor 3 - - - - - -
Other 18 22.2 27.8 61.1 5.6 - 16.7
No answ er 9 11.1 11.1 22.2 11.1 11.1 22.2
Distribution Ratio (%) Total column is no. of data.
Second highest ranking Highest ranking
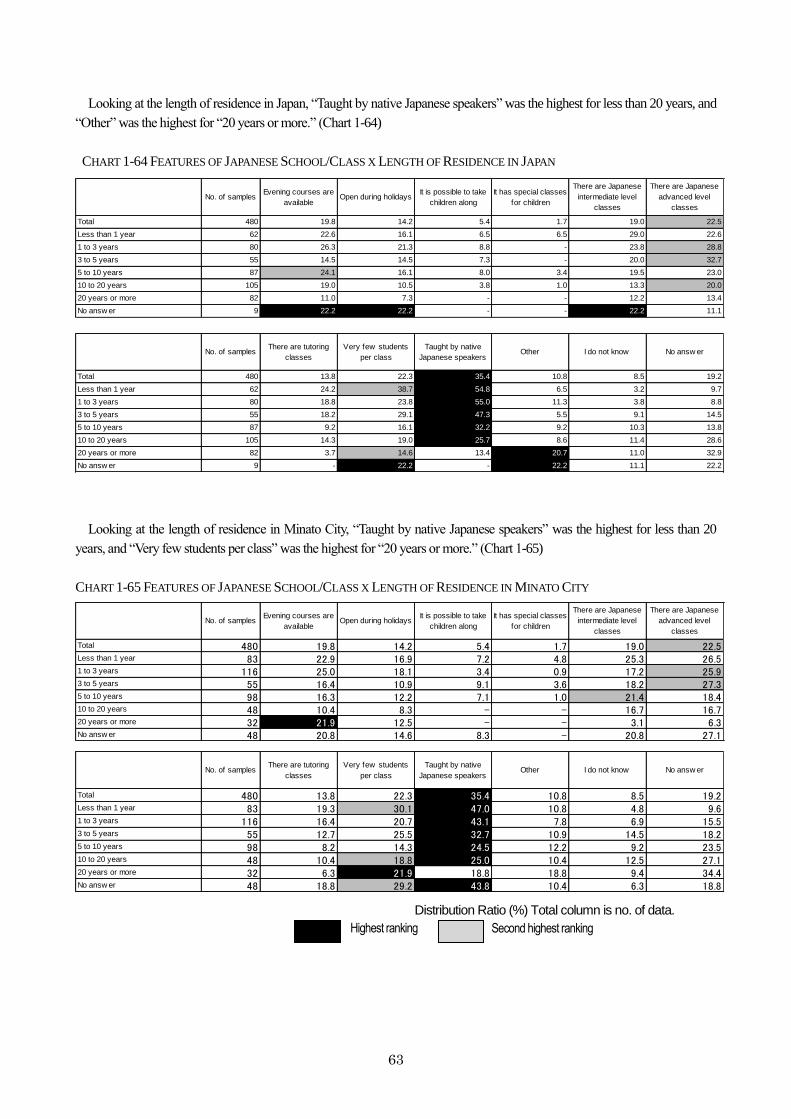
63
Looking at the length of residence in Japan, “Taught by native Japanese speakers” was the highest for less than 20 years, and
“Other” was the highest for “20 years or more.” (Chart 1-64)
CHART 1-64 FEATURES OF JAPANESE SCHOOL/CLASS X LENGTH OF RESIDENCE IN JAPAN
No. of samplesEvening courses are
availableOpen during holidays
It is possible to take
children along
It has special classes
for children
There are Japanese
intermediate level
classes
There are Japanese
advanced level
classes
Total 480 19.8 14.2 5.4 1.7 19.0 22.5
Less than 1 year 62 22.6 16.1 6.5 6.5 29.0 22.6
1 to 3 years 80 26.3 21.3 8.8 - 23.8 28.8
3 to 5 years 55 14.5 14.5 7.3 - 20.0 32.7
5 to 10 years 87 24.1 16.1 8.0 3.4 19.5 23.0
10 to 20 years 105 19.0 10.5 3.8 1.0 13.3 20.0
20 years or more 82 11.0 7.3 - - 12.2 13.4
No answ er 9 22.2 22.2 - - 22.2 11.1
No. of samplesThere are tutoring
classes
Very few students
per class
Taught by native
Japanese speakersOther I do not know No answ er
Total 480 13.8 22.3 35.4 10.8 8.5 19.2
Less than 1 year 62 24.2 38.7 54.8 6.5 3.2 9.7
1 to 3 years 80 18.8 23.8 55.0 11.3 3.8 8.8
3 to 5 years 55 18.2 29.1 47.3 5.5 9.1 14.5
5 to 10 years 87 9.2 16.1 32.2 9.2 10.3 13.8
10 to 20 years 105 14.3 19.0 25.7 8.6 11.4 28.6
20 years or more 82 3.7 14.6 13.4 20.7 11.0 32.9
No answ er 9 - 22.2 - 22.2 11.1 22.2
Looking at the length of residence in Minato City, “Taught by native Japanese speakers” was the highest for less than 20
years, and “Very few students per class” was the highest for “20 years or more.” (Chart 1-65)
CHART 1-65 FEATURES OF JAPANESE SCHOOL/CLASS X LENGTH OF RESIDENCE IN MINATO CITY
No. of samplesEvening courses are
availableOpen during holidays
It is possible to take
children along
It has special classes
for children
There are Japanese
intermediate level
classes
There are Japanese
advanced level
classes
Total 480 19.8 14.2 5.4 1.7 19.0 22.5Less than 1 year 83 22.9 16.9 7.2 4.8 25.3 26.51 to 3 years 116 25.0 18.1 3.4 0.9 17.2 25.93 to 5 years 55 16.4 10.9 9.1 3.6 18.2 27.35 to 10 years 98 16.3 12.2 7.1 1.0 21.4 18.410 to 20 years 48 10.4 8.3 - - 16.7 16.720 years or more 32 21.9 12.5 - - 3.1 6.3No answ er 48 20.8 14.6 8.3 - 20.8 27.1
No. of samplesThere are tutoring
classes
Very few students
per class
Taught by native
Japanese speakersOther I do not know No answ er
Total 480 13.8 22.3 35.4 10.8 8.5 19.2Less than 1 year 83 19.3 30.1 47.0 10.8 4.8 9.61 to 3 years 116 16.4 20.7 43.1 7.8 6.9 15.53 to 5 years 55 12.7 25.5 32.7 10.9 14.5 18.25 to 10 years 98 8.2 14.3 24.5 12.2 9.2 23.510 to 20 years 48 10.4 18.8 25.0 10.4 12.5 27.120 years or more 32 6.3 21.9 18.8 18.8 9.4 34.4No answ er 48 18.8 29.2 43.8 10.4 6.3 18.8
Distribution Ratio (%) Total column is no. of data.
Second highest ranking Highest ranking
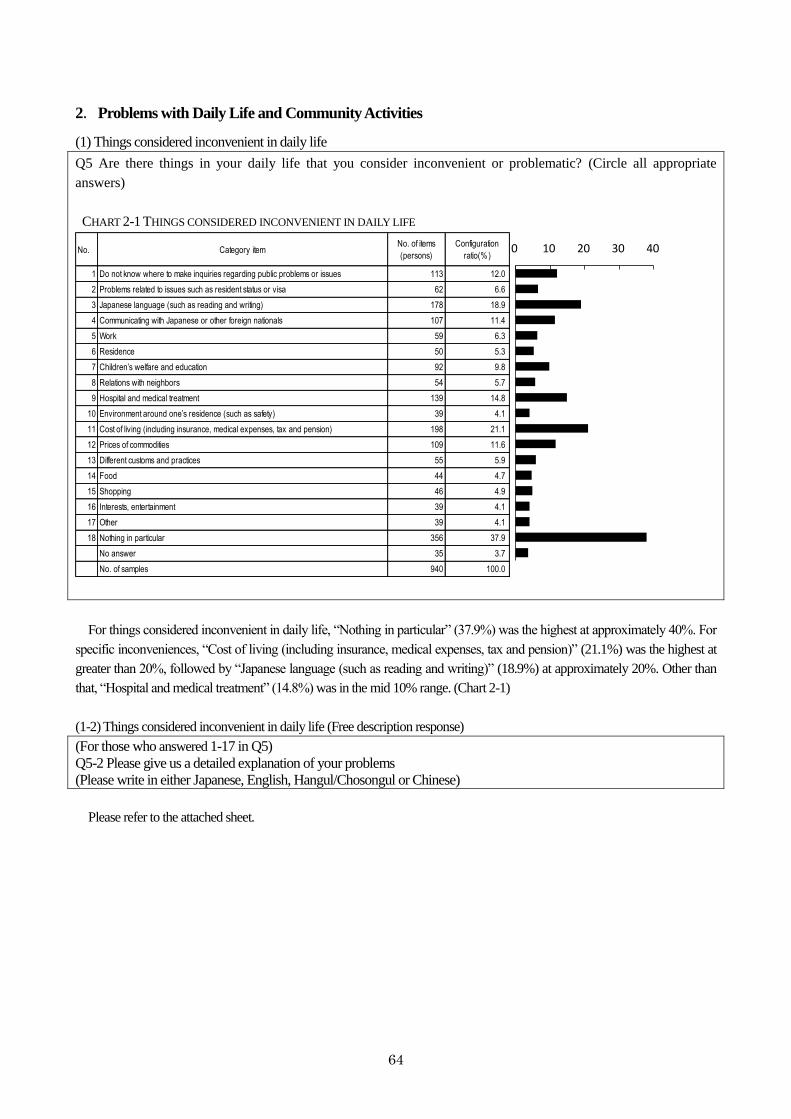
64
2.Problems with Daily Life and Community Activities
(1) Things considered inconvenient in daily life
Q5 Are there things in your daily life that you consider inconvenient or problematic? (Circle all appropriate
answers)
CHART 2-1 THINGS CONSIDERED INCONVENIENT IN DAILY LIFE
No. Category itemNo. of items
(persons)
Configuration
ratio(%)
1 Do not know where to make inquiries regarding public problems or issues 113 12.0
2 Problems related to issues such as resident status or visa 62 6.6
3 Japanese language (such as reading and writing) 178 18.9
4 Communicating with Japanese or other foreign nationals 107 11.4
5 Work 59 6.3
6 Residence 50 5.3
7 Children’s welfare and education 92 9.8
8 Relations with neighbors 54 5.7
9 Hospital and medical treatment 139 14.8
10 Environment around one’s residence (such as safety) 39 4.1
11 Cost of living (including insurance, medical expenses, tax and pension) 198 21.1
12 Prices of commodities 109 11.6
13 Different customs and practices 55 5.9
14 Food 44 4.7
15 Shopping 46 4.9
16 Interests, entertainment 39 4.1
17 Other 39 4.1
18 Nothing in particular 356 37.9
No answer 35 3.7
No. of samples 940 100.0
0 10 20 30 40
For things considered inconvenient in daily life, “Nothing in particular” (37.9%) was the highest at approximately 40%. For
specific inconveniences, “Cost of living (including insurance, medical expenses, tax and pension)” (21.1%) was the highest at
greater than 20%, followed by “Japanese language (such as reading and writing)” (18.9%) at approximately 20%. Other than
that, “Hospital and medical treatment” (14.8%) was in the mid 10% range. (Chart 2-1)
(1-2) Things considered inconvenient in daily life (Free description response)
(For those who answered 1-17 in Q5) Q5-2 Please give us a detailed explanation of your problems (Please write in either Japanese, English, Hangul/Chosongul or Chinese)
Please refer to the attached sheet.
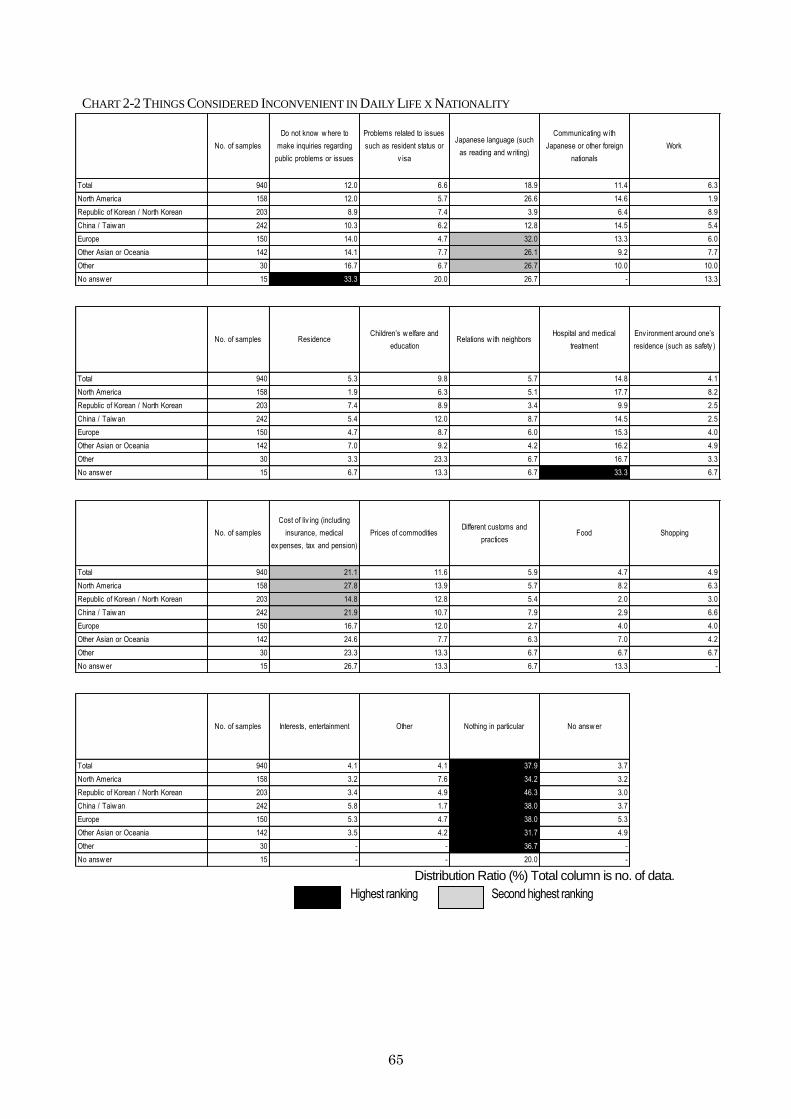
65
CHART 2-2 THINGS CONSIDERED INCONVENIENT IN DAILY LIFE X NATIONALITY
No. of samples
Do not know w here to
make inquiries regarding
public problems or issues
Problems related to issues
such as resident status or
v isa
Japanese language (such
as reading and w riting)
Communicating w ith
Japanese or other foreign
nationals
Work
Total 940 12.0 6.6 18.9 11.4 6.3
North America 158 12.0 5.7 26.6 14.6 1.9
Republic of Korean / North Korean 203 8.9 7.4 3.9 6.4 8.9
China / Taiw an 242 10.3 6.2 12.8 14.5 5.4
Europe 150 14.0 4.7 32.0 13.3 6.0
Other Asian or Oceania 142 14.1 7.7 26.1 9.2 7.7
Other 30 16.7 6.7 26.7 10.0 10.0
No answ er 15 33.3 20.0 26.7 - 13.3
No. of samples ResidenceChildren’s w elfare and
educationRelations w ith neighbors
Hospital and medical
treatment
Env ironment around one’s
residence (such as safety )
Total 940 5.3 9.8 5.7 14.8 4.1
North America 158 1.9 6.3 5.1 17.7 8.2
Republic of Korean / North Korean 203 7.4 8.9 3.4 9.9 2.5
China / Taiw an 242 5.4 12.0 8.7 14.5 2.5
Europe 150 4.7 8.7 6.0 15.3 4.0
Other Asian or Oceania 142 7.0 9.2 4.2 16.2 4.9
Other 30 3.3 23.3 6.7 16.7 3.3
No answ er 15 6.7 13.3 6.7 33.3 6.7
No. of samples
Cost of liv ing (including
insurance, medical
ex penses, tax and pension)
Prices of commoditiesDifferent customs and
practicesFood Shopping
Total 940 21.1 11.6 5.9 4.7 4.9
North America 158 27.8 13.9 5.7 8.2 6.3
Republic of Korean / North Korean 203 14.8 12.8 5.4 2.0 3.0
China / Taiw an 242 21.9 10.7 7.9 2.9 6.6
Europe 150 16.7 12.0 2.7 4.0 4.0
Other Asian or Oceania 142 24.6 7.7 6.3 7.0 4.2
Other 30 23.3 13.3 6.7 6.7 6.7
No answ er 15 26.7 13.3 6.7 13.3 -
No. of samples Interests, entertainment Other Nothing in particular No answ er
Total 940 4.1 4.1 37.9 3.7
North America 158 3.2 7.6 34.2 3.2
Republic of Korean / North Korean 203 3.4 4.9 46.3 3.0
China / Taiw an 242 5.8 1.7 38.0 3.7
Europe 150 5.3 4.7 38.0 5.3
Other Asian or Oceania 142 3.5 4.2 31.7 4.9
Other 30 - - 36.7 -
No answ er 15 - - 20.0 - Distribution Ratio (%) Total column is no. of data.
Second highest ranking Highest ranking
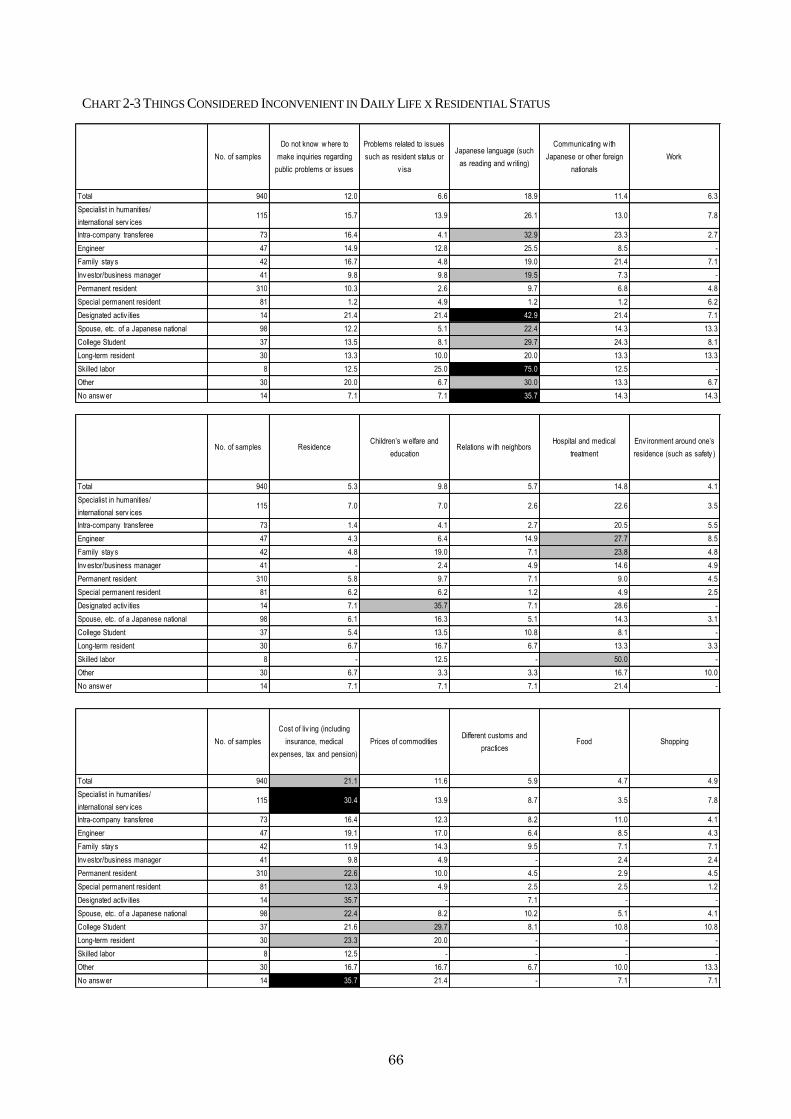
66
CHART 2-3 THINGS CONSIDERED INCONVENIENT IN DAILY LIFE X RESIDENTIAL STATUS
No. of samples
Do not know w here to
make inquiries regarding
public problems or issues
Problems related to issues
such as resident status or
v isa
Japanese language (such
as reading and w riting)
Communicating w ith
Japanese or other foreign
nationals
Work
Total 940 12.0 6.6 18.9 11.4 6.3
Specialist in humanities/
international serv ices115 15.7 13.9 26.1 13.0 7.8
Intra-company transferee 73 16.4 4.1 32.9 23.3 2.7
Engineer 47 14.9 12.8 25.5 8.5 -
Family stay s 42 16.7 4.8 19.0 21.4 7.1
Inv estor/business manager 41 9.8 9.8 19.5 7.3 -
Permanent resident 310 10.3 2.6 9.7 6.8 4.8
Special permanent resident 81 1.2 4.9 1.2 1.2 6.2
Designated activ ities 14 21.4 21.4 42.9 21.4 7.1
Spouse, etc. of a Japanese national 98 12.2 5.1 22.4 14.3 13.3
College Student 37 13.5 8.1 29.7 24.3 8.1
Long-term resident 30 13.3 10.0 20.0 13.3 13.3
Skilled labor 8 12.5 25.0 75.0 12.5 -
Other 30 20.0 6.7 30.0 13.3 6.7
No answ er 14 7.1 7.1 35.7 14.3 14.3
No. of samples ResidenceChildren’s w elfare and
educationRelations w ith neighbors
Hospital and medical
treatment
Env ironment around one’s
residence (such as safety )
Total 940 5.3 9.8 5.7 14.8 4.1
Specialist in humanities/
international serv ices115 7.0 7.0 2.6 22.6 3.5
Intra-company transferee 73 1.4 4.1 2.7 20.5 5.5
Engineer 47 4.3 6.4 14.9 27.7 8.5
Family stay s 42 4.8 19.0 7.1 23.8 4.8
Inv estor/business manager 41 - 2.4 4.9 14.6 4.9
Permanent resident 310 5.8 9.7 7.1 9.0 4.5
Special permanent resident 81 6.2 6.2 1.2 4.9 2.5
Designated activ ities 14 7.1 35.7 7.1 28.6 -
Spouse, etc. of a Japanese national 98 6.1 16.3 5.1 14.3 3.1
College Student 37 5.4 13.5 10.8 8.1 -
Long-term resident 30 6.7 16.7 6.7 13.3 3.3
Skilled labor 8 - 12.5 - 50.0 -
Other 30 6.7 3.3 3.3 16.7 10.0
No answ er 14 7.1 7.1 7.1 21.4 -
No. of samples
Cost of liv ing (including
insurance, medical
ex penses, tax and pension)
Prices of commoditiesDifferent customs and
practicesFood Shopping
Total 940 21.1 11.6 5.9 4.7 4.9
Specialist in humanities/
international serv ices115 30.4 13.9 8.7 3.5 7.8
Intra-company transferee 73 16.4 12.3 8.2 11.0 4.1
Engineer 47 19.1 17.0 6.4 8.5 4.3
Family stay s 42 11.9 14.3 9.5 7.1 7.1
Inv estor/business manager 41 9.8 4.9 - 2.4 2.4
Permanent resident 310 22.6 10.0 4.5 2.9 4.5
Special permanent resident 81 12.3 4.9 2.5 2.5 1.2
Designated activ ities 14 35.7 - 7.1 - -
Spouse, etc. of a Japanese national 98 22.4 8.2 10.2 5.1 4.1
College Student 37 21.6 29.7 8.1 10.8 10.8
Long-term resident 30 23.3 20.0 - - -
Skilled labor 8 12.5 - - - -
Other 30 16.7 16.7 6.7 10.0 13.3
No answ er 14 35.7 21.4 - 7.1 7.1
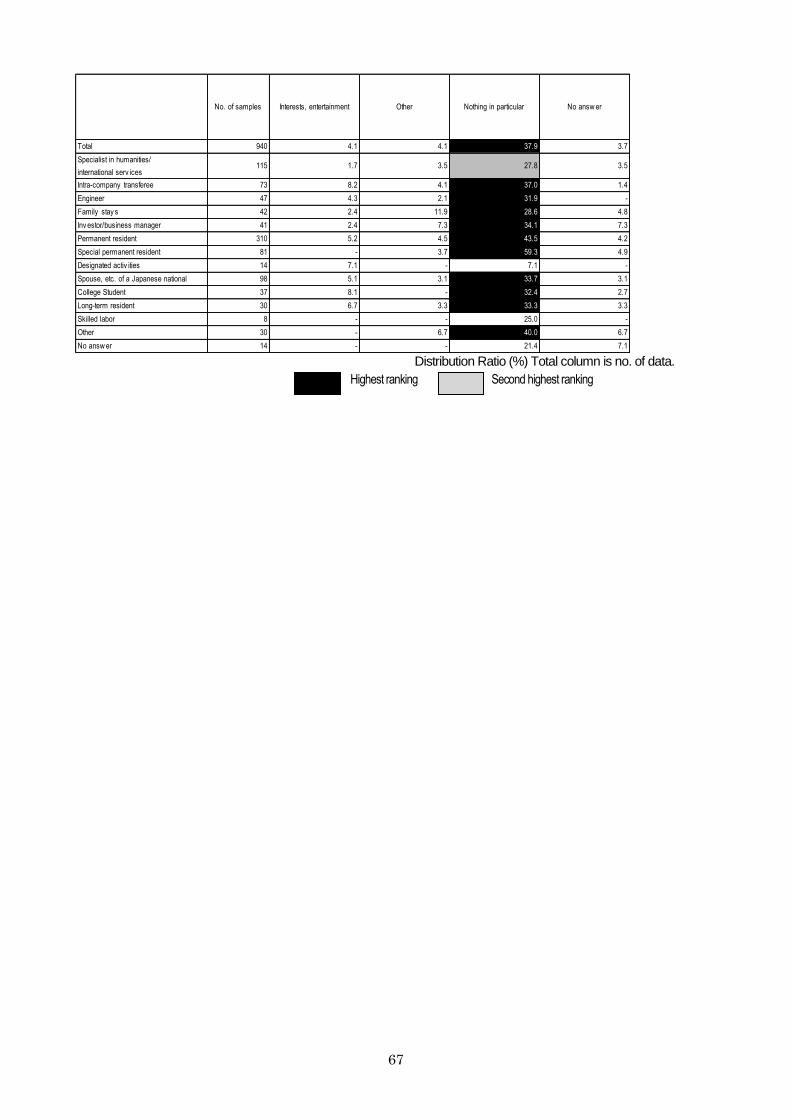
67
No. of samples Interests, entertainment Other Nothing in particular No answ er
Total 940 4.1 4.1 37.9 3.7
Specialist in humanities/
international serv ices115 1.7 3.5 27.8 3.5
Intra-company transferee 73 8.2 4.1 37.0 1.4
Engineer 47 4.3 2.1 31.9 -
Family stay s 42 2.4 11.9 28.6 4.8
Inv estor/business manager 41 2.4 7.3 34.1 7.3
Permanent resident 310 5.2 4.5 43.5 4.2
Special permanent resident 81 - 3.7 59.3 4.9
Designated activ ities 14 7.1 - 7.1 -
Spouse, etc. of a Japanese national 98 5.1 3.1 33.7 3.1
College Student 37 8.1 - 32.4 2.7
Long-term resident 30 6.7 3.3 33.3 3.3
Skilled labor 8 - - 25.0 -
Other 30 - 6.7 40.0 6.7
No answ er 14 - - 21.4 7.1 Distribution Ratio (%) Total column is no. of data.
Second highest ranking Highest ranking
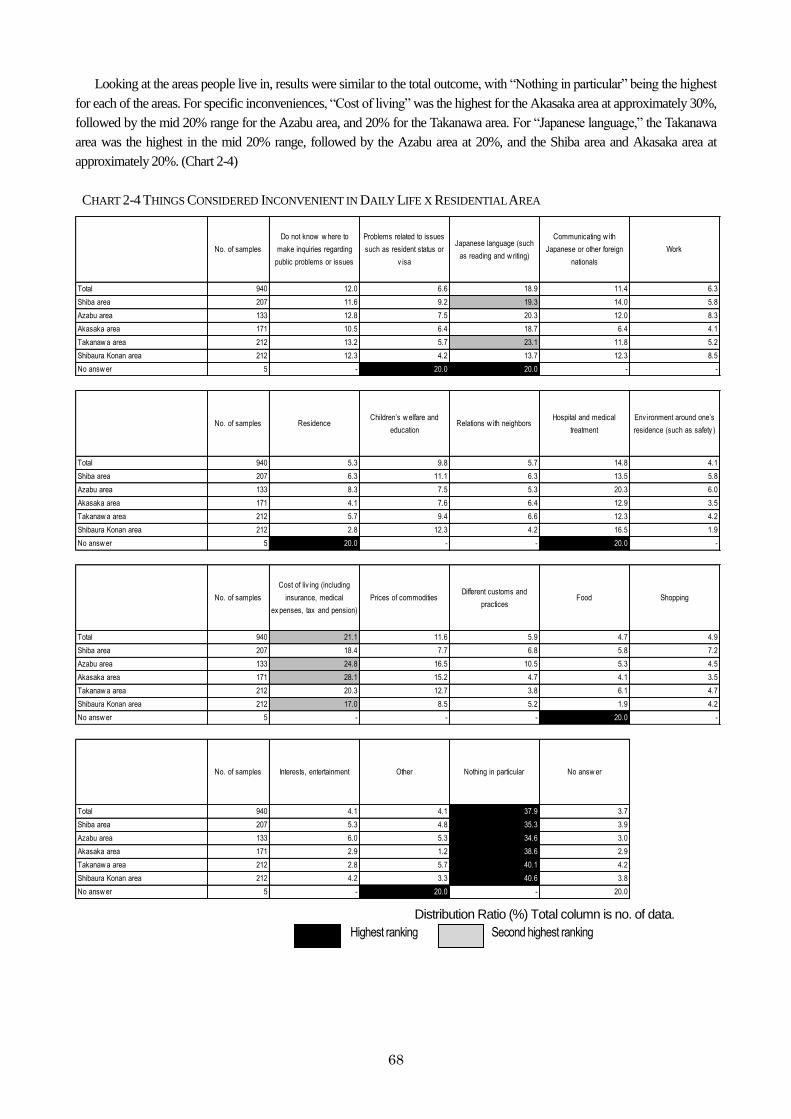
68
Looking at the areas people live in, results were similar to the total outcome, with “Nothing in particular” being the highest
for each of the areas. For specific inconveniences, “Cost of living” was the highest for the Akasaka area at approximately 30%,
followed by the mid 20% range for the Azabu area, and 20% for the Takanawa area. For “Japanese language,” the Takanawa
area was the highest in the mid 20% range, followed by the Azabu area at 20%, and the Shiba area and Akasaka area at
approximately 20%. (Chart 2-4)
CHART 2-4 THINGS CONSIDERED INCONVENIENT IN DAILY LIFE X RESIDENTIAL AREA
No. of samples
Do not know w here to
make inquiries regarding
public problems or issues
Problems related to issues
such as resident status or
v isa
Japanese language (such
as reading and w riting)
Communicating w ith
Japanese or other foreign
nationals
Work
Total 940 12.0 6.6 18.9 11.4 6.3
Shiba area 207 11.6 9.2 19.3 14.0 5.8
Azabu area 133 12.8 7.5 20.3 12.0 8.3
Akasaka area 171 10.5 6.4 18.7 6.4 4.1
Takanaw a area 212 13.2 5.7 23.1 11.8 5.2
Shibaura Konan area 212 12.3 4.2 13.7 12.3 8.5
No answ er 5 - 20.0 20.0 - -
No. of samples ResidenceChildren’s w elfare and
educationRelations w ith neighbors
Hospital and medical
treatment
Env ironment around one’s
residence (such as safety )
Total 940 5.3 9.8 5.7 14.8 4.1
Shiba area 207 6.3 11.1 6.3 13.5 5.8
Azabu area 133 8.3 7.5 5.3 20.3 6.0
Akasaka area 171 4.1 7.6 6.4 12.9 3.5
Takanaw a area 212 5.7 9.4 6.6 12.3 4.2
Shibaura Konan area 212 2.8 12.3 4.2 16.5 1.9
No answ er 5 20.0 - - 20.0 -
No. of samples
Cost of liv ing (including
insurance, medical
ex penses, tax and pension)
Prices of commoditiesDifferent customs and
practicesFood Shopping
Total 940 21.1 11.6 5.9 4.7 4.9
Shiba area 207 18.4 7.7 6.8 5.8 7.2
Azabu area 133 24.8 16.5 10.5 5.3 4.5
Akasaka area 171 28.1 15.2 4.7 4.1 3.5
Takanaw a area 212 20.3 12.7 3.8 6.1 4.7
Shibaura Konan area 212 17.0 8.5 5.2 1.9 4.2
No answ er 5 - - - 20.0 -
No. of samples Interests, entertainment Other Nothing in particular No answ er
Total 940 4.1 4.1 37.9 3.7
Shiba area 207 5.3 4.8 35.3 3.9
Azabu area 133 6.0 5.3 34.6 3.0
Akasaka area 171 2.9 1.2 38.6 2.9
Takanaw a area 212 2.8 5.7 40.1 4.2
Shibaura Konan area 212 4.2 3.3 40.6 3.8
No answ er 5 - 20.0 - 20.0
Distribution Ratio (%) Total column is no. of data.
Second highest ranking Highest ranking
69
Looking at the length of residence in Japan, “Japanese language” was the highest for “Less than 1 year” at greater than 40%,
followed by approximately 40% for “1 to 3 years,” and was lower the longer the length of residence in Japan. “Communicating
with Japanese or other foreign nationals” was comparatively high at the mid 30% range for “Less than 1 year.” (Chart 2-5)
CHART 2-5 THINGS CONSIDERED INCONVENIENT IN DAILY LIFE X LENGTH OF RESIDENCE IN JAPAN
No. of samples
Do not know w here to
make inquiries regarding
public problems or issues
Problems related to issues
such as resident status or
v isa
Japanese language (such
as reading and w riting)
Communicating w ith
Japanese or other foreign
nationals
Work
Total 940 12.0 6.6 18.9 11.4 6.3
Less than 1 y ear 79 19.0 6.3 41.8 34.2 8.9
1 to 3 y ears 120 16.7 5.8 38.3 22.5 10.0
3 to 5 y ears 82 11.0 11.0 26.8 13.4 7.3
5 to 10 y ears 158 12.0 10.8 21.5 11.4 4.4
10 to 20 y ears 211 13.7 4.3 10.9 7.1 5.2
20 y ears or more 268 7.1 4.9 6.0 2.6 6.0
No answ er 22 9.1 9.1 18.2 9.1 -
No. of samples ResidenceChildren’s w elfare and
educationRelations w ith neighbors
Hospital and medical
treatment
Env ironment around one’s
residence (such as safety )
Total 940 5.3 9.8 5.7 14.8 4.1
Less than 1 y ear 79 2.5 7.6 6.3 25.3 6.3
1 to 3 y ears 120 4.2 11.7 7.5 21.7 3.3
3 to 5 y ears 82 12.2 11.0 4.9 17.1 4.9
5 to 10 y ears 158 2.5 10.8 3.8 19.0 4.4
10 to 20 y ears 211 5.7 16.1 10.0 13.3 3.3
20 y ears or more 268 5.6 4.5 3.4 6.7 4.5
No answ er 22 9.1 - - 13.6 -
No. of samples
Cost of liv ing (including
insurance, medical
ex penses, tax and pension)
Prices of commoditiesDifferent customs and
practicesFood Shopping
Total 940 21.1 11.6 5.9 4.7 4.9
Less than 1 y ear 79 19.0 21.5 15.2 15.2 6.3
1 to 3 y ears 120 21.7 15.0 7.5 8.3 9.2
3 to 5 y ears 82 20.7 15.9 4.9 3.7 4.9
5 to 10 y ears 158 23.4 10.8 6.3 3.2 5.1
10 to 20 y ears 211 18.5 10.4 4.7 1.9 2.8
20 y ears or more 268 23.1 7.8 3.7 3.4 4.5
No answ er 22 9.1 4.5 - 4.5 -
No. of samples Interests, entertainment Other Nothing in particular No answ er
Total 940 4.1 4.1 37.9 3.7
Less than 1 y ear 79 3.8 6.3 21.5 1.3
1 to 3 y ears 120 8.3 3.3 29.2 1.7
3 to 5 y ears 82 4.9 3.7 34.1 3.7
5 to 10 y ears 158 1.3 4.4 35.4 2.5
10 to 20 y ears 211 3.8 3.8 35.5 4.7
20 y ears or more 268 4.1 4.1 50.7 4.9
No answ er 22 4.5 4.5 40.9 9.1
Distribution Ratio (%) Total column is no. of data.
Second highest ranking Highest ranking
70
Looking at the length of residence in Minato City, results were similar to the total outcome, with “Nothing in particular”
being the highest for each of the lengths of residence. For specific inconveniences, “Japanese language” was the highest for “1
to 3 years” at approximately 30%, followed by the mid 20% range for “Less than 1 year. “Cost of living” was the highest in the
mid 20% range for “3 to 5 years,” followed by “5 to 10 years” by a narrow margin. (Chart 2-6)
CHART 2-6 THINGS CONSIDERED INCONVENIENT IN DAILY LIFE X LENGTH OF RESIDENCE IN MINATO CITY
No. of samples
Do not know w here to
make inquiries regarding
public problems or issues
Problems related to issues
such as resident status or
v isa
Japanese language (such
as reading and w riting)
Communicating w ith
Japanese or other foreign
nationals
Work
Total 940 12.0 6.6 18.9 11.4 6.3
Less than 1 y ear 131 12.2 6.9 25.2 20.6 3.1
1 to 3 y ears 201 10.4 7.5 27.4 13.9 7.0
3 to 5 y ears 101 12.9 11.9 18.8 10.9 8.9
5 to 10 y ears 197 14.7 5.1 19.8 8.6 3.6
10 to 20 y ears 114 8.8 2.6 6.1 6.1 6.1
20 y ears or more 96 10.4 5.2 5.2 2.1 6.3
No answ er 100 14.0 8.0 20.0 15.0 12.0
No. of samples ResidenceChildren’s w elfare and
educationRelations w ith neighbors
Hospital and medical
treatment
Env ironment around one’s
residence (such as safety )
Total 940 5.3 9.8 5.7 14.8 4.1
Less than 1 y ear 131 3.8 8.4 6.1 16.8 3.1
1 to 3 y ears 201 6.5 10.4 6.5 17.9 3.0
3 to 5 y ears 101 3.0 7.9 5.0 15.8 5.9
5 to 10 y ears 197 2.5 12.2 6.6 14.7 4.6
10 to 20 y ears 114 6.1 7.9 2.6 12.3 3.5
20 y ears or more 96 7.3 4.2 5.2 6.3 3.1
No answ er 100 10.0 15.0 7.0 16.0 7.0
No. of samples
Cost of liv ing (including
insurance, medical
ex penses, tax and pension)
Prices of commoditiesDifferent customs and
practicesFood Shopping
Total 940 21.1 11.6 5.9 4.7 4.9
Less than 1 y ear 131 16.0 16.8 9.2 9.2 8.4
1 to 3 y ears 201 19.4 13.9 6.0 7.0 8.0
3 to 5 y ears 101 24.8 10.9 7.9 4.0 4.0
5 to 10 y ears 197 23.4 9.6 5.1 2.0 3.6
10 to 20 y ears 114 22.8 11.4 2.6 0.9 1.8
20 y ears or more 96 20.8 7.3 5.2 4.2 4.2
No answ er 100 21.0 9.0 5.0 5.0 2.0
No. of samples Interests, entertainment Other Nothing in particular No answ er
Total 940 4.1 4.1 37.9 3.7
Less than 1 y ear 131 3.1 6.1 33.6 3.1
1 to 3 y ears 201 5.5 3.5 33.3 2.0
3 to 5 y ears 101 3.0 3.0 33.7 4.0
5 to 10 y ears 197 3.6 4.1 38.6 3.6
10 to 20 y ears 114 5.3 6.1 44.7 4.4
20 y ears or more 96 2.1 3.1 54.2 6.3
No answ er 100 6.0 3.0 32.0 5.0
Distribution Ratio (%) Total column is no. of data.
Second highest ranking Highest ranking
71
(2) Problems experienced with Japanese neighbors
Q6 Have you ever had any problems with Japanese neighbors? (Circle all appropriate answers)
CHART 2-7 PROBLEMS EXPERIENCED WITH JAPANESE NEIGHBORS
No. Category itemNo. of items
(persons)
Configuration
ratio(%)
1 Language misunderstanding 44 4.7
2 Noises from houses/rooms 65 6.9
3 Pet related issues 25 2.7
4 Parking (car or bicy cle) 32 3.4
5 Rules regarding putting out w astes 30 3.2
6 Behav ior of children or relationship w ith other children 31 3.3
7 Use of shared public places in facilities such as apartment complex es 15 1.6
8 Operation of a store on lodging 11 1.2
9 Held responsible for a problem I didn’t cause 14 1.5
10 Ex pansion, renov ation of building 12 1.3
11 Other 32 3.4
12 Nothing in particular 657 69.9
No answ er 69 7.3
No. of samples 940 100.0
0 50 100
For problems experienced with Japanese neighbors, “Nothing in particular” (69.9%) was approximately 70%. For specific
problems experienced, “Noises from houses/rooms” (6.9%) was the highest at approximately 10%, followed by “Language
misunderstanding” (4.7%), and “Parking (Car or bicycle)” (3.4%). (Chart 2-7)
(2-2) PROBLEMS EXPERIENCED WITH JAPANESE NEIGHBORS (FREE DESCRIPTION RESPONSE)
(For those who answered 1-11 in Q6)
Q6-2 Please give us a detailed explanation of the problem. (Please write in either Japanese, English, Hangul/Chosongul
or Chinese)
Please refer to the attached sheet.
72
CHART 2-8 PROBLEMS EXPERIENCED WITH JAPANESE NEIGHBORS X NATIONALITY
No. of samplesLanguage
misunderstanding
Noises from
houses/roomsPet related issues Parking (car or bicy cle)
Rules regarding putting
out w astes
Behav ior of children or
relationship w ith other
children
Use of shared public
places in facilities such
as apartment complex es
Total 940 4.7 6.9 2.7 3.4 3.2 3.3 1.6
North America 158 4.4 7.0 4.4 7.6 5.7 3.2 1.3
Republic of Korean / North Korean 203 2.0 4.4 3.9 1.0 3.0 4.4 2.5
China / Taiw an 242 7.0 8.7 0.8 2.1 0.8 4.1 1.2
Europe 150 3.3 8.7 3.3 5.3 5.3 2.0 2.7
Other Asian or Oceania 142 7.0 6.3 1.4 2.8 2.8 2.1 -
Other 30 - 3.3 3.3 - - 3.3 3.3
No answ er 15 6.7 6.7 - 6.7 6.7 - -
No. of samplesOperation of a store on
lodging
Held responsible for a
problem I didn’t cause
Ex pansion, renov ation of
buildingOther Nothing in particular No answ er
Total 940 1.2 1.5 1.3 3.4 69.9 7.3
North America 158 1.9 2.5 3.8 6.3 60.8 7.0
Republic of Korean / North Korean 203 - 2.0 1.5 5.4 68.5 8.4
China / Taiw an 242 2.5 1.2 - 1.7 68.2 10.7
Europe 150 0.7 1.3 2.0 2.0 77.3 3.3
Other Asian or Oceania 142 0.7 0.7 - 2.1 73.9 6.3
Other 30 - - - 3.3 80.0 3.3
No answ er 15 - - - - 80.0 -
CHART 2-9 PROBLEMS EXPERIENCED WITH JAPANESE NEIGHBORS X RESIDENTIAL STATUS
No. of samplesLanguage
misunderstanding
Noises from
houses/roomsPet related issues Parking (car or bicy cle)
Rules regarding putting
out w astes
Behav ior of children or
relationship w ith other
children
Use of shared public
places in facilities such
as apartment complex es
Total 940 4.7 6.9 2.7 3.4 3.2 3.3 1.6
Specialist in humanities/
international serv ices115 5.2 3.5 1.7 2.6 7.0 0.9 1.7
Intra-company transferee 73 4.1 - 2.7 1.4 1.4 - -
Engineer 47 6.4 10.6 - 4.3 - - -
Family stay s 42 11.9 2.4 4.8 2.4 - - 4.8
Inv estor/business manager 41 - 7.3 2.4 2.4 2.4 - -
Permanent resident 310 3.9 10.3 3.9 3.5 2.9 4.8 1.6
Special permanent resident 81 - - - - 1.2 1.2 3.7
Designated activ ities 14 14.3 7.1 - 14.3 - - 7.1
Spouse, etc. of a Japanese national 98 7.1 11.2 3.1 8.2 6.1 9.2 2.0
College Student 37 - 8.1 - 2.7 - - -
Long-term resident 30 6.7 3.3 3.3 - 6.7 6.7 -
Skilled labor 8 25.0 - - 12.5 - - -
Other 30 6.7 10.0 3.3 - 3.3 6.7 -
No answ er 14 - 7.1 7.1 7.1 7.1 7.1 -
No. of samplesOperation of a store on
lodging
Held responsible for a
problem I didn’t cause
Ex pansion, renov ation of
buildingOther Nothing in particular No answ er
Total 940 1.2 1.5 1.3 3.4 69.9 7.3
Specialist in humanities/
international serv ices115 0.9 1.7 0.9 3.5 67.8 7.8
Intra-company transferee 73 - - - 2.7 80.8 6.8
Engineer 47 - 2.1 - 4.3 70.2 4.3
Family stay s 42 - - - 2.4 71.4 2.4
Inv estor/business manager 41 - 2.4 2.4 2.4 75.6 7.3
Permanent resident 310 1.9 2.3 2.6 3.9 67.7 8.1
Special permanent resident 81 - 1.2 1.2 4.9 76.5 12.3
Designated activ ities 14 - - - 7.1 50.0 7.1
Spouse, etc. of a Japanese national 98 3.1 1.0 1.0 3.1 59.2 5.1
College Student 37 - - - - 83.8 5.4
Long-term resident 30 3.3 - - - 66.7 10.0
Skilled labor 8 - - - - 62.5 12.5
Other 30 - 3.3 - 6.7 80.0 -
No answ er 14 - - - - 64.3 14.3
Distribution Ratio (%) Total column is no. of data.
Second highest ranking Highest ranking
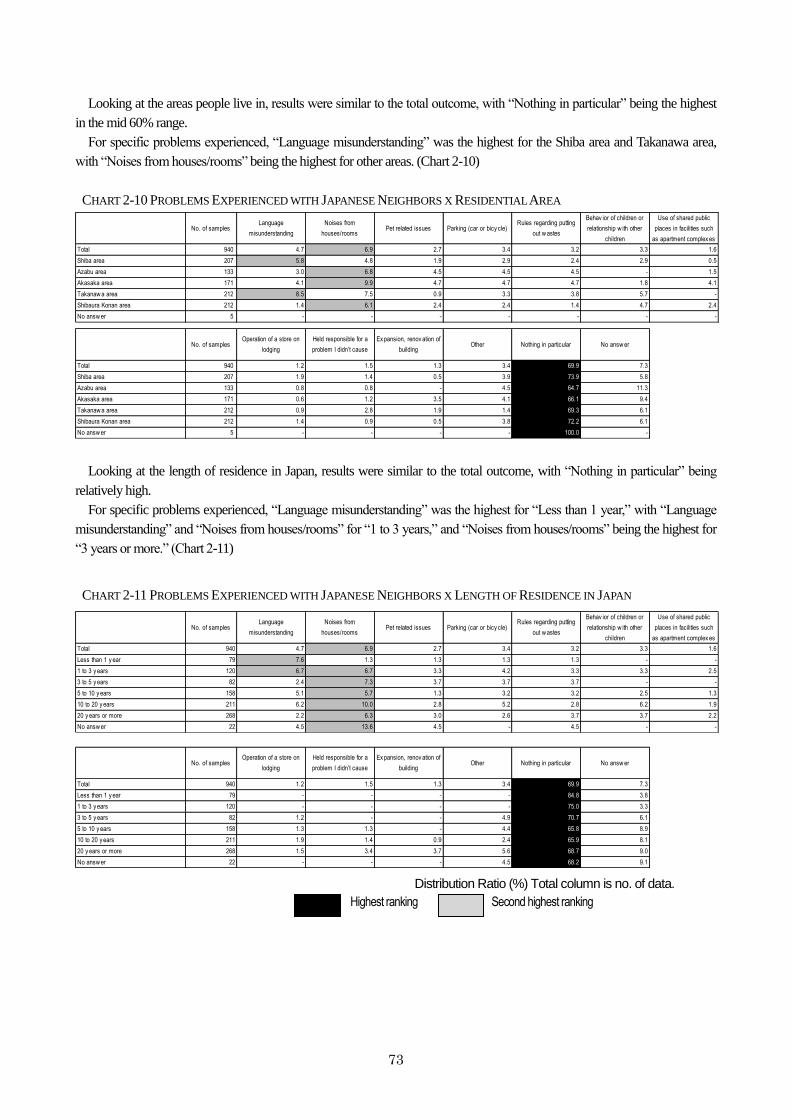
73
Looking at the areas people live in, results were similar to the total outcome, with “Nothing in particular” being the highest
in the mid 60% range.
For specific problems experienced, “Language misunderstanding” was the highest for the Shiba area and Takanawa area,
with “Noises from houses/rooms” being the highest for other areas. (Chart 2-10)
CHART 2-10 PROBLEMS EXPERIENCED WITH JAPANESE NEIGHBORS X RESIDENTIAL AREA
No. of samplesLanguage
misunderstanding
Noises from
houses/roomsPet related issues Parking (car or bicy cle)
Rules regarding putting
out w astes
Behav ior of children or
relationship w ith other
children
Use of shared public
places in facilities such
as apartment complex es
Total 940 4.7 6.9 2.7 3.4 3.2 3.3 1.6
Shiba area 207 5.8 4.8 1.9 2.9 2.4 2.9 0.5
Azabu area 133 3.0 6.8 4.5 4.5 4.5 - 1.5
Akasaka area 171 4.1 9.9 4.7 4.7 4.7 1.8 4.1
Takanaw a area 212 8.5 7.5 0.9 3.3 3.8 5.7 -
Shibaura Konan area 212 1.4 6.1 2.4 2.4 1.4 4.7 2.4
No answ er 5 - - - - - - -
No. of samplesOperation of a store on
lodging
Held responsible for a
problem I didn’t cause
Ex pansion, renov ation of
buildingOther Nothing in particular No answ er
Total 940 1.2 1.5 1.3 3.4 69.9 7.3
Shiba area 207 1.9 1.4 0.5 3.9 73.9 5.8
Azabu area 133 0.8 0.8 - 4.5 64.7 11.3
Akasaka area 171 0.6 1.2 3.5 4.1 66.1 9.4
Takanaw a area 212 0.9 2.8 1.9 1.4 69.3 6.1
Shibaura Konan area 212 1.4 0.9 0.5 3.8 72.2 6.1
No answ er 5 - - - - 100.0 -
Looking at the length of residence in Japan, results were similar to the total outcome, with “Nothing in particular” being
relatively high.
For specific problems experienced, “Language misunderstanding” was the highest for “Less than 1 year,” with “Language
misunderstanding” and “Noises from houses/rooms” for “1 to 3 years,” and “Noises from houses/rooms” being the highest for
“3 years or more.” (Chart 2-11)
CHART 2-11 PROBLEMS EXPERIENCED WITH JAPANESE NEIGHBORS X LENGTH OF RESIDENCE IN JAPAN
No. of samplesLanguage
misunderstanding
Noises from
houses/roomsPet related issues Parking (car or bicy cle)
Rules regarding putting
out w astes
Behav ior of children or
relationship w ith other
children
Use of shared public
places in facilities such
as apartment complex es
Total 940 4.7 6.9 2.7 3.4 3.2 3.3 1.6
Less than 1 y ear 79 7.6 1.3 1.3 1.3 1.3 - -
1 to 3 y ears 120 6.7 6.7 3.3 4.2 3.3 3.3 2.5
3 to 5 y ears 82 2.4 7.3 3.7 3.7 3.7 - -
5 to 10 y ears 158 5.1 5.7 1.3 3.2 3.2 2.5 1.3
10 to 20 y ears 211 6.2 10.0 2.8 5.2 2.8 6.2 1.9
20 y ears or more 268 2.2 6.3 3.0 2.6 3.7 3.7 2.2
No answ er 22 4.5 13.6 4.5 - 4.5 - -
No. of samplesOperation of a store on
lodging
Held responsible for a
problem I didn’t cause
Ex pansion, renov ation of
buildingOther Nothing in particular No answ er
Total 940 1.2 1.5 1.3 3.4 69.9 7.3
Less than 1 y ear 79 - - - - 84.8 3.8
1 to 3 y ears 120 - - - - 75.0 3.3
3 to 5 y ears 82 1.2 - - 4.9 70.7 6.1
5 to 10 y ears 158 1.3 1.3 - 4.4 65.8 8.9
10 to 20 y ears 211 1.9 1.4 0.9 2.4 65.9 8.1
20 y ears or more 268 1.5 3.4 3.7 5.6 68.7 9.0
No answ er 22 - - - 4.5 68.2 9.1
Distribution Ratio (%) Total column is no. of data.
Second highest ranking Highest ranking
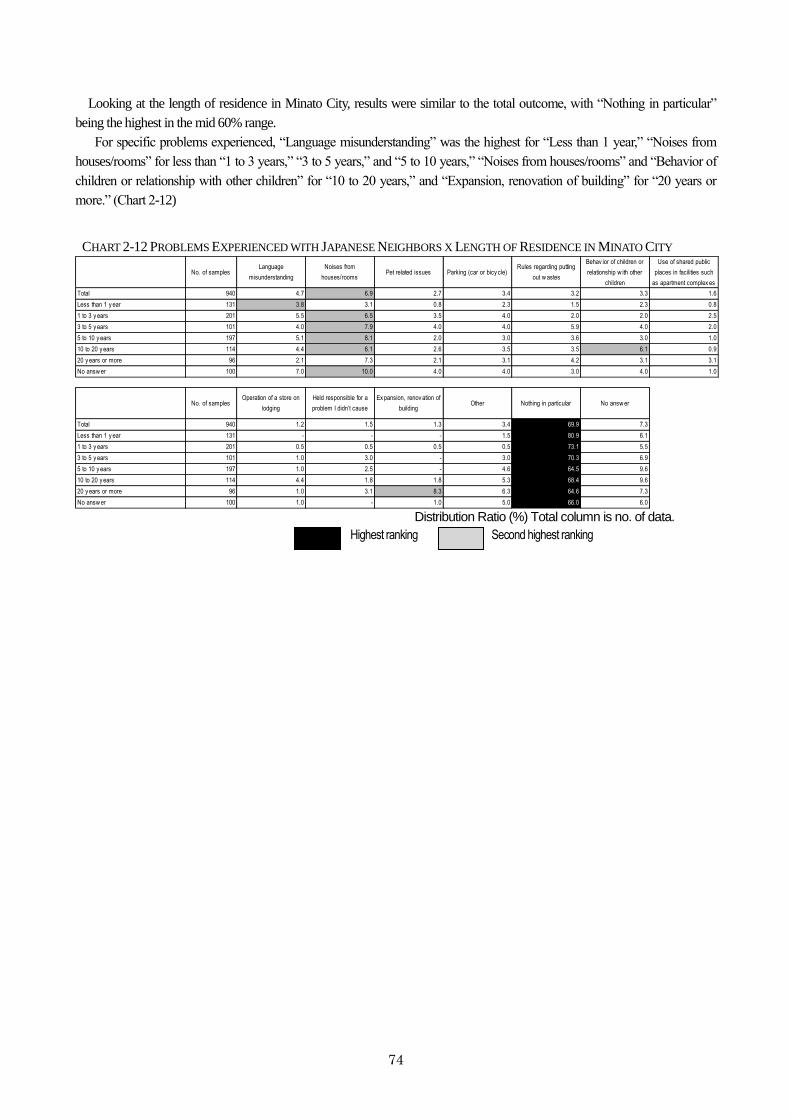
74
Looking at the length of residence in Minato City, results were similar to the total outcome, with “Nothing in particular”
being the highest in the mid 60% range.
For specific problems experienced, “Language misunderstanding” was the highest for “Less than 1 year,” “Noises from
houses/rooms” for less than “1 to 3 years,” “3 to 5 years,” and “5 to 10 years,” “Noises from houses/rooms” and “Behavior of
children or relationship with other children” for “10 to 20 years,” and “Expansion, renovation of building” for “20 years or
more.” (Chart 2-12)
CHART 2-12 PROBLEMS EXPERIENCED WITH JAPANESE NEIGHBORS X LENGTH OF RESIDENCE IN MINATO CITY
No. of samplesLanguage
misunderstanding
Noises from
houses/roomsPet related issues Parking (car or bicy cle)
Rules regarding putting
out w astes
Behav ior of children or
relationship w ith other
children
Use of shared public
places in facilities such
as apartment complex es
Total 940 4.7 6.9 2.7 3.4 3.2 3.3 1.6
Less than 1 y ear 131 3.8 3.1 0.8 2.3 1.5 2.3 0.8
1 to 3 y ears 201 5.5 6.5 3.5 4.0 2.0 2.0 2.5
3 to 5 y ears 101 4.0 7.9 4.0 4.0 5.9 4.0 2.0
5 to 10 y ears 197 5.1 8.1 2.0 3.0 3.6 3.0 1.0
10 to 20 y ears 114 4.4 6.1 2.6 3.5 3.5 6.1 0.9
20 y ears or more 96 2.1 7.3 2.1 3.1 4.2 3.1 3.1
No answ er 100 7.0 10.0 4.0 4.0 3.0 4.0 1.0
No. of samplesOperation of a store on
lodging
Held responsible for a
problem I didn’t cause
Ex pansion, renov ation of
buildingOther Nothing in particular No answ er
Total 940 1.2 1.5 1.3 3.4 69.9 7.3
Less than 1 y ear 131 - - - 1.5 80.9 6.1
1 to 3 y ears 201 0.5 0.5 0.5 0.5 73.1 5.5
3 to 5 y ears 101 1.0 3.0 - 3.0 70.3 6.9
5 to 10 y ears 197 1.0 2.5 - 4.6 64.5 9.6
10 to 20 y ears 114 4.4 1.8 1.8 5.3 68.4 9.6
20 y ears or more 96 1.0 3.1 8.3 6.3 64.6 7.3
No answ er 100 1.0 - 1.0 5.0 66.0 6.0 Distribution Ratio (%) Total column is no. of data.
Second highest ranking Highest ranking
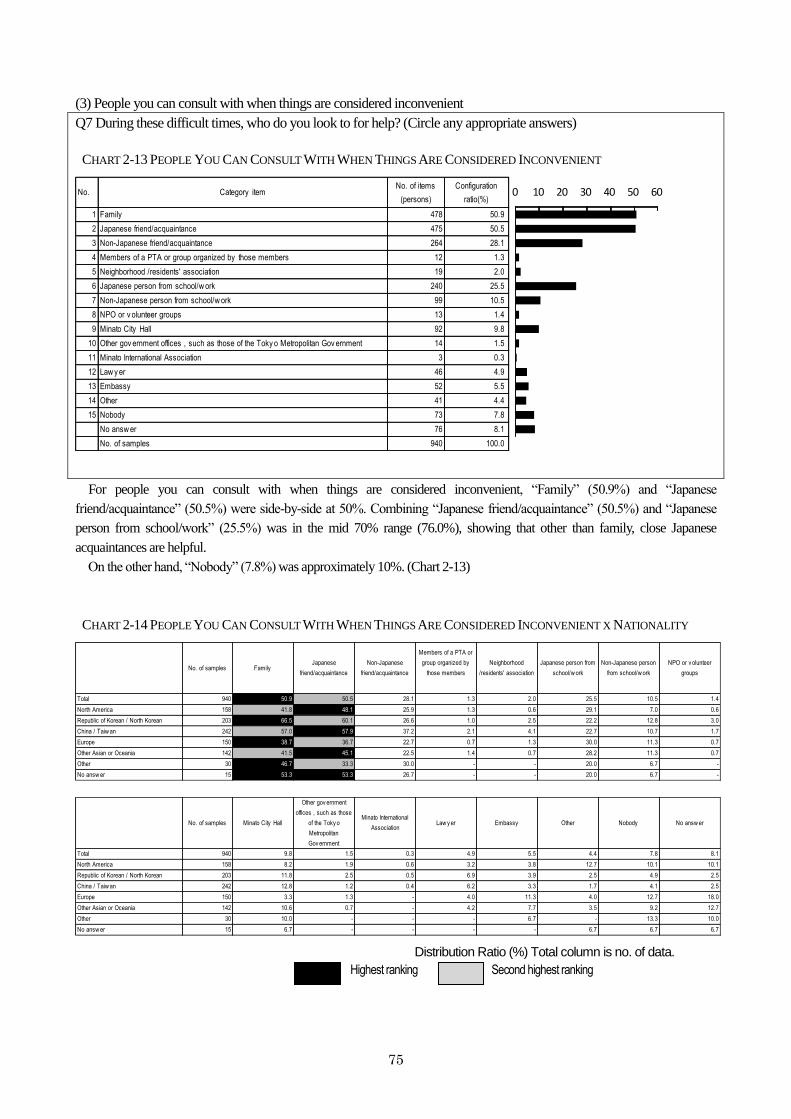
75
(3) People you can consult with when things are considered inconvenient
Q7 During these difficult times, who do you look to for help? (Circle any appropriate answers)
CHART 2-13 PEOPLE YOU CAN CONSULT WITH WHEN THINGS ARE CONSIDERED INCONVENIENT
No. Category itemNo. of items
(persons)
Configuration
ratio(%)
1 Family 478 50.9
2 Japanese friend/acquaintance 475 50.5
3 Non-Japanese friend/acquaintance 264 28.1
4 Members of a PTA or group organized by those members 12 1.3
5 Neighborhood /residents' association 19 2.0
6 Japanese person from school/w ork 240 25.5
7 Non-Japanese person from school/w ork 99 10.5
8 NPO or v olunteer groups 13 1.4
9 Minato City Hall 92 9.8
10 Other gov ernment offices , such as those of the Toky o Metropolitan Gov ernment 14 1.5
11 Minato International Association 3 0.3
12 Law y er 46 4.9
13 Embassy 52 5.5
14 Other 41 4.4
15 Nobody 73 7.8
No answ er 76 8.1
No. of samples 940 100.0
0 10 20 30 40 50 60
For people you can consult with when things are considered inconvenient, “Family” (50.9%) and “Japanese
friend/acquaintance” (50.5%) were side-by-side at 50%. Combining “Japanese friend/acquaintance” (50.5%) and “Japanese
person from school/work” (25.5%) was in the mid 70% range (76.0%), showing that other than family, close Japanese
acquaintances are helpful.
On the other hand, “Nobody” (7.8%) was approximately 10%. (Chart 2-13)
CHART 2-14 PEOPLE YOU CAN CONSULT WITH WHEN THINGS ARE CONSIDERED INCONVENIENT X NATIONALITY
No. of samples FamilyJapanese
friend/acquaintance
Non-Japanese
friend/acquaintance
Members of a PTA or
group organized by
those members
Neighborhood
/residents' association
Japanese person from
school/w ork
Non-Japanese person
from school/w ork
NPO or v olunteer
groups
Total 940 50.9 50.5 28.1 1.3 2.0 25.5 10.5 1.4
North America 158 41.8 48.1 25.9 1.3 0.6 29.1 7.0 0.6
Republic of Korean / North Korean 203 66.5 60.1 26.6 1.0 2.5 22.2 12.8 3.0
China / Taiw an 242 57.0 57.9 37.2 2.1 4.1 22.7 10.7 1.7
Europe 150 38.7 36.7 22.7 0.7 1.3 30.0 11.3 0.7
Other Asian or Oceania 142 41.5 45.1 22.5 1.4 0.7 28.2 11.3 0.7
Other 30 46.7 33.3 30.0 - - 20.0 6.7 -
No answ er 15 53.3 53.3 26.7 - - 20.0 6.7 -
No. of samples Minato City Hall
Other gov ernment
offices , such as those
of the Toky o
Metropolitan
Gov ernment
Minato International
AssociationLaw y er Embassy Other Nobody No answ er
Total 940 9.8 1.5 0.3 4.9 5.5 4.4 7.8 8.1
North America 158 8.2 1.9 0.6 3.2 3.8 12.7 10.1 10.1
Republic of Korean / North Korean 203 11.8 2.5 0.5 6.9 3.9 2.5 4.9 2.5
China / Taiw an 242 12.8 1.2 0.4 6.2 3.3 1.7 4.1 2.5
Europe 150 3.3 1.3 - 4.0 11.3 4.0 12.7 18.0
Other Asian or Oceania 142 10.6 0.7 - 4.2 7.7 3.5 9.2 12.7
Other 30 10.0 - - - 6.7 - 13.3 10.0
No answ er 15 6.7 - - - - 6.7 6.7 6.7
Distribution Ratio (%) Total column is no. of data.
Second highest ranking Highest ranking
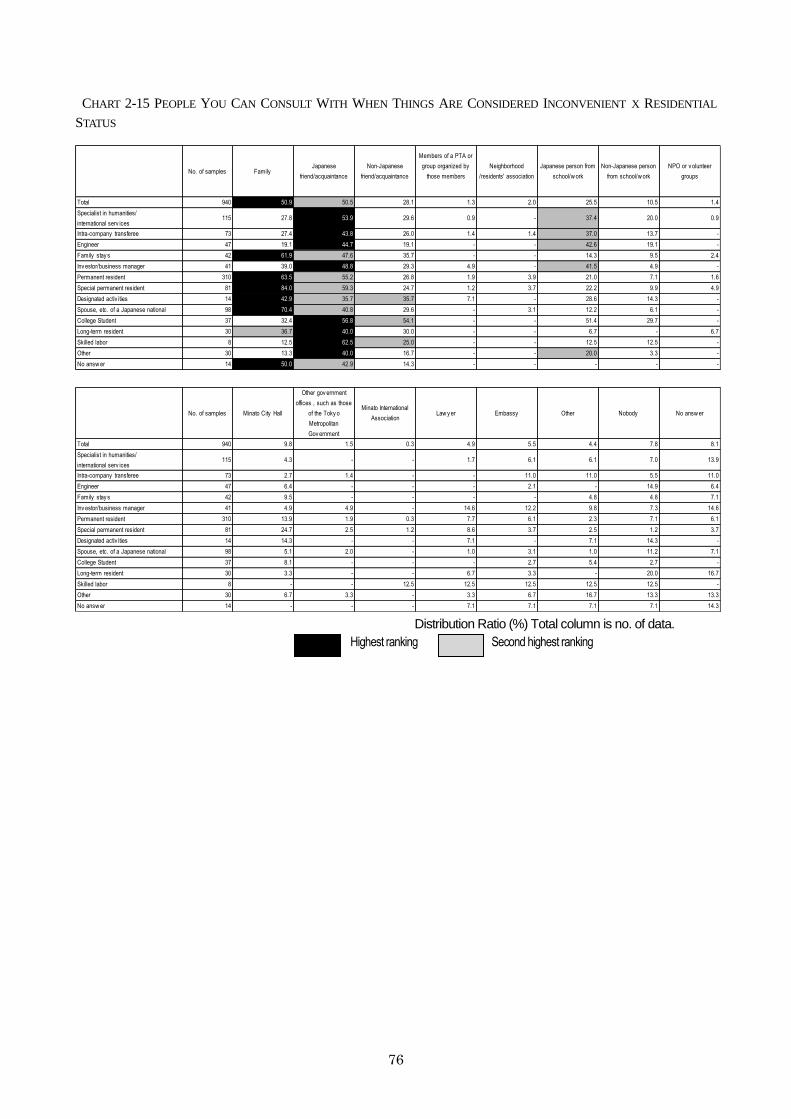
76
CHART 2-15 PEOPLE YOU CAN CONSULT WITH WHEN THINGS ARE CONSIDERED INCONVENIENT X RESIDENTIAL
STATUS
No. of samples FamilyJapanese
friend/acquaintance
Non-Japanese
friend/acquaintance
Members of a PTA or
group organized by
those members
Neighborhood
/residents' association
Japanese person from
school/w ork
Non-Japanese person
from school/w ork
NPO or v olunteer
groups
Total 940 50.9 50.5 28.1 1.3 2.0 25.5 10.5 1.4
Specialist in humanities/
international serv ices115 27.8 53.9 29.6 0.9 - 37.4 20.0 0.9
Intra-company transferee 73 27.4 43.8 26.0 1.4 1.4 37.0 13.7 -
Engineer 47 19.1 44.7 19.1 - - 42.6 19.1 -
Family stay s 42 61.9 47.6 35.7 - - 14.3 9.5 2.4
Inv estor/business manager 41 39.0 48.8 29.3 4.9 - 41.5 4.9 -
Permanent resident 310 63.5 55.2 26.8 1.9 3.9 21.0 7.1 1.6
Special permanent resident 81 84.0 59.3 24.7 1.2 3.7 22.2 9.9 4.9
Designated activ ities 14 42.9 35.7 35.7 7.1 - 28.6 14.3 -
Spouse, etc. of a Japanese national 98 70.4 40.8 29.6 - 3.1 12.2 6.1 -
College Student 37 32.4 56.8 54.1 - - 51.4 29.7 -
Long-term resident 30 36.7 40.0 30.0 - - 6.7 - 6.7
Skilled labor 8 12.5 62.5 25.0 - - 12.5 12.5 -
Other 30 13.3 40.0 16.7 - - 20.0 3.3 -
No answ er 14 50.0 42.9 14.3 - - - - -
No. of samples Minato City Hall
Other gov ernment
offices , such as those
of the Toky o
Metropolitan
Gov ernment
Minato International
AssociationLaw y er Embassy Other Nobody No answ er
Total 940 9.8 1.5 0.3 4.9 5.5 4.4 7.8 8.1
Specialist in humanities/
international serv ices115 4.3 - - 1.7 6.1 6.1 7.0 13.9
Intra-company transferee 73 2.7 1.4 - - 11.0 11.0 5.5 11.0
Engineer 47 6.4 - - - 2.1 - 14.9 6.4
Family stay s 42 9.5 - - - - 4.8 4.8 7.1
Inv estor/business manager 41 4.9 4.9 - 14.6 12.2 9.8 7.3 14.6
Permanent resident 310 13.9 1.9 0.3 7.7 6.1 2.3 7.1 6.1
Special permanent resident 81 24.7 2.5 1.2 8.6 3.7 2.5 1.2 3.7
Designated activ ities 14 14.3 - - 7.1 - 7.1 14.3 -
Spouse, etc. of a Japanese national 98 5.1 2.0 - 1.0 3.1 1.0 11.2 7.1
College Student 37 8.1 - - - 2.7 5.4 2.7 -
Long-term resident 30 3.3 - - 6.7 3.3 - 20.0 16.7
Skilled labor 8 - - 12.5 12.5 12.5 12.5 12.5 -
Other 30 6.7 3.3 - 3.3 6.7 16.7 13.3 13.3
No answ er 14 - - - 7.1 7.1 7.1 7.1 14.3 Distribution Ratio (%) Total column is no. of data.
Second highest ranking Highest ranking
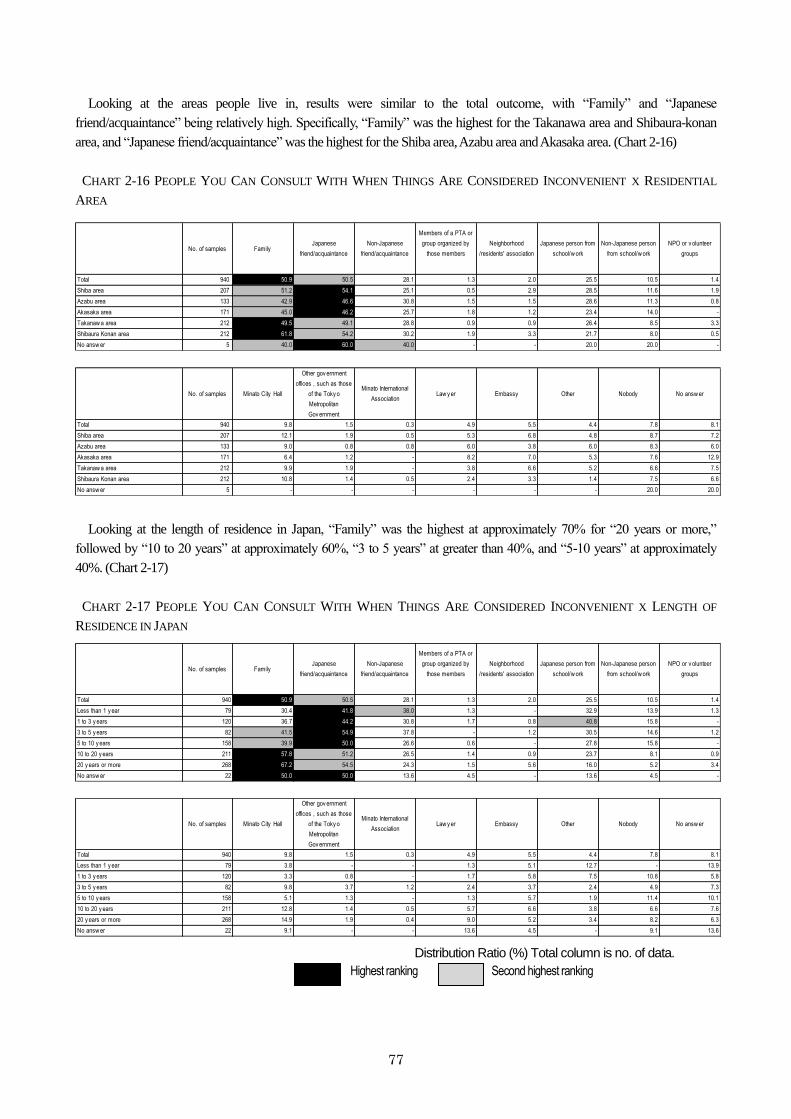
77
Looking at the areas people live in, results were similar to the total outcome, with “Family” and “Japanese
friend/acquaintance” being relatively high. Specifically, “Family” was the highest for the Takanawa area and Shibaura-konan
area, and “Japanese friend/acquaintance” was the highest for the Shiba area, Azabu area and Akasaka area. (Chart 2-16)
CHART 2-16 PEOPLE YOU CAN CONSULT WITH WHEN THINGS ARE CONSIDERED INCONVENIENT X RESIDENTIAL
AREA
No. of samples FamilyJapanese
friend/acquaintance
Non-Japanese
friend/acquaintance
Members of a PTA or
group organized by
those members
Neighborhood
/residents' association
Japanese person from
school/w ork
Non-Japanese person
from school/w ork
NPO or v olunteer
groups
Total 940 50.9 50.5 28.1 1.3 2.0 25.5 10.5 1.4
Shiba area 207 51.2 54.1 25.1 0.5 2.9 28.5 11.6 1.9
Azabu area 133 42.9 46.6 30.8 1.5 1.5 28.6 11.3 0.8
Akasaka area 171 45.0 46.2 25.7 1.8 1.2 23.4 14.0 -
Takanaw a area 212 49.5 49.1 28.8 0.9 0.9 26.4 8.5 3.3
Shibaura Konan area 212 61.8 54.2 30.2 1.9 3.3 21.7 8.0 0.5
No answ er 5 40.0 60.0 40.0 - - 20.0 20.0 -
No. of samples Minato City Hall
Other gov ernment
offices , such as those
of the Toky o
Metropolitan
Gov ernment
Minato International
AssociationLaw y er Embassy Other Nobody No answ er
Total 940 9.8 1.5 0.3 4.9 5.5 4.4 7.8 8.1
Shiba area 207 12.1 1.9 0.5 5.3 6.8 4.8 8.7 7.2
Azabu area 133 9.0 0.8 0.8 6.0 3.8 6.0 8.3 6.0
Akasaka area 171 6.4 1.2 - 8.2 7.0 5.3 7.6 12.9
Takanaw a area 212 9.9 1.9 - 3.8 6.6 5.2 6.6 7.5
Shibaura Konan area 212 10.8 1.4 0.5 2.4 3.3 1.4 7.5 6.6
No answ er 5 - - - - - - 20.0 20.0
Looking at the length of residence in Japan, “Family” was the highest at approximately 70% for “20 years or more,”
followed by “10 to 20 years” at approximately 60%, “3 to 5 years” at greater than 40%, and “5-10 years” at approximately
40%. (Chart 2-17)
CHART 2-17 PEOPLE YOU CAN CONSULT WITH WHEN THINGS ARE CONSIDERED INCONVENIENT X LENGTH OF
RESIDENCE IN JAPAN
No. of samples FamilyJapanese
friend/acquaintance
Non-Japanese
friend/acquaintance
Members of a PTA or
group organized by
those members
Neighborhood
/residents' association
Japanese person from
school/w ork
Non-Japanese person
from school/w ork
NPO or v olunteer
groups
Total 940 50.9 50.5 28.1 1.3 2.0 25.5 10.5 1.4
Less than 1 y ear 79 30.4 41.8 38.0 1.3 - 32.9 13.9 1.3
1 to 3 y ears 120 36.7 44.2 30.8 1.7 0.8 40.8 15.8 -
3 to 5 y ears 82 41.5 54.9 37.8 - 1.2 30.5 14.6 1.2
5 to 10 y ears 158 39.9 50.0 26.6 0.6 - 27.8 15.8 -
10 to 20 y ears 211 57.8 51.2 26.5 1.4 0.9 23.7 8.1 0.9
20 y ears or more 268 67.2 54.5 24.3 1.5 5.6 16.0 5.2 3.4
No answ er 22 50.0 50.0 13.6 4.5 - 13.6 4.5 -
No. of samples Minato City Hall
Other gov ernment
offices , such as those
of the Toky o
Metropolitan
Gov ernment
Minato International
AssociationLaw y er Embassy Other Nobody No answ er
Total 940 9.8 1.5 0.3 4.9 5.5 4.4 7.8 8.1
Less than 1 y ear 79 3.8 - - 1.3 5.1 12.7 - 13.9
1 to 3 y ears 120 3.3 0.8 - 1.7 5.8 7.5 10.8 5.8
3 to 5 y ears 82 9.8 3.7 1.2 2.4 3.7 2.4 4.9 7.3
5 to 10 y ears 158 5.1 1.3 - 1.3 5.7 1.9 11.4 10.1
10 to 20 y ears 211 12.8 1.4 0.5 5.7 6.6 3.8 6.6 7.6
20 y ears or more 268 14.9 1.9 0.4 9.0 5.2 3.4 8.2 6.3
No answ er 22 9.1 - - 13.6 4.5 - 9.1 13.6
Distribution Ratio (%) Total column is no. of data.
Second highest ranking Highest ranking
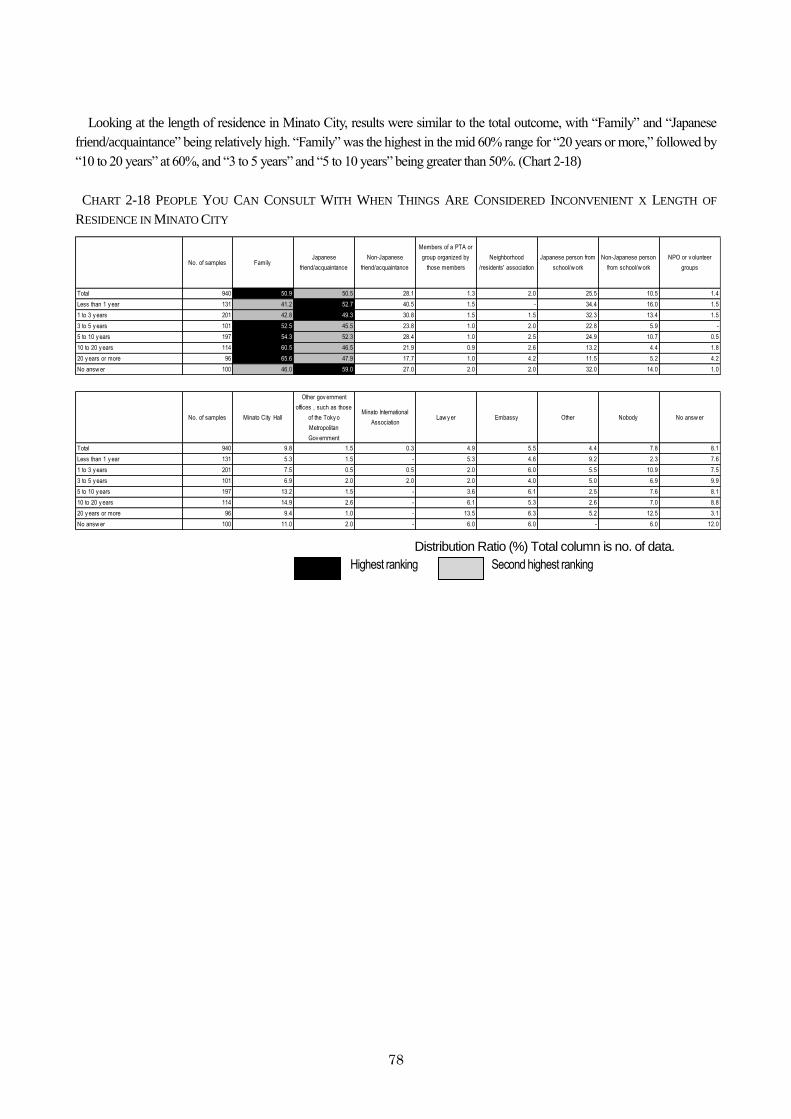
78
Looking at the length of residence in Minato City, results were similar to the total outcome, with “Family” and “Japanese
friend/acquaintance” being relatively high. “Family” was the highest in the mid 60% range for “20 years or more,” followed by
“10 to 20 years” at 60%, and “3 to 5 years” and “5 to 10 years” being greater than 50%. (Chart 2-18)
CHART 2-18 PEOPLE YOU CAN CONSULT WITH WHEN THINGS ARE CONSIDERED INCONVENIENT X LENGTH OF
RESIDENCE IN MINATO CITY
No. of samples FamilyJapanese
friend/acquaintance
Non-Japanese
friend/acquaintance
Members of a PTA or
group organized by
those members
Neighborhood
/residents' association
Japanese person from
school/w ork
Non-Japanese person
from school/w ork
NPO or v olunteer
groups
Total 940 50.9 50.5 28.1 1.3 2.0 25.5 10.5 1.4
Less than 1 y ear 131 41.2 52.7 40.5 1.5 - 34.4 16.0 1.5
1 to 3 y ears 201 42.8 49.3 30.8 1.5 1.5 32.3 13.4 1.5
3 to 5 y ears 101 52.5 45.5 23.8 1.0 2.0 22.8 5.9 -
5 to 10 y ears 197 54.3 52.3 28.4 1.0 2.5 24.9 10.7 0.5
10 to 20 y ears 114 60.5 46.5 21.9 0.9 2.6 13.2 4.4 1.8
20 y ears or more 96 65.6 47.9 17.7 1.0 4.2 11.5 5.2 4.2
No answ er 100 46.0 59.0 27.0 2.0 2.0 32.0 14.0 1.0
No. of samples Minato City Hall
Other gov ernment
offices , such as those
of the Toky o
Metropolitan
Gov ernment
Minato International
AssociationLaw y er Embassy Other Nobody No answ er
Total 940 9.8 1.5 0.3 4.9 5.5 4.4 7.8 8.1
Less than 1 y ear 131 5.3 1.5 - 5.3 4.6 9.2 2.3 7.6
1 to 3 y ears 201 7.5 0.5 0.5 2.0 6.0 5.5 10.9 7.5
3 to 5 y ears 101 6.9 2.0 2.0 2.0 4.0 5.0 6.9 9.9
5 to 10 y ears 197 13.2 1.5 - 3.6 6.1 2.5 7.6 8.1
10 to 20 y ears 114 14.9 2.6 - 6.1 5.3 2.6 7.0 8.8
20 y ears or more 96 9.4 1.0 - 13.5 6.3 5.2 12.5 3.1
No answ er 100 11.0 2.0 - 6.0 6.0 - 6.0 12.0
Distribution Ratio (%) Total column is no. of data.
Second highest ranking Highest ranking
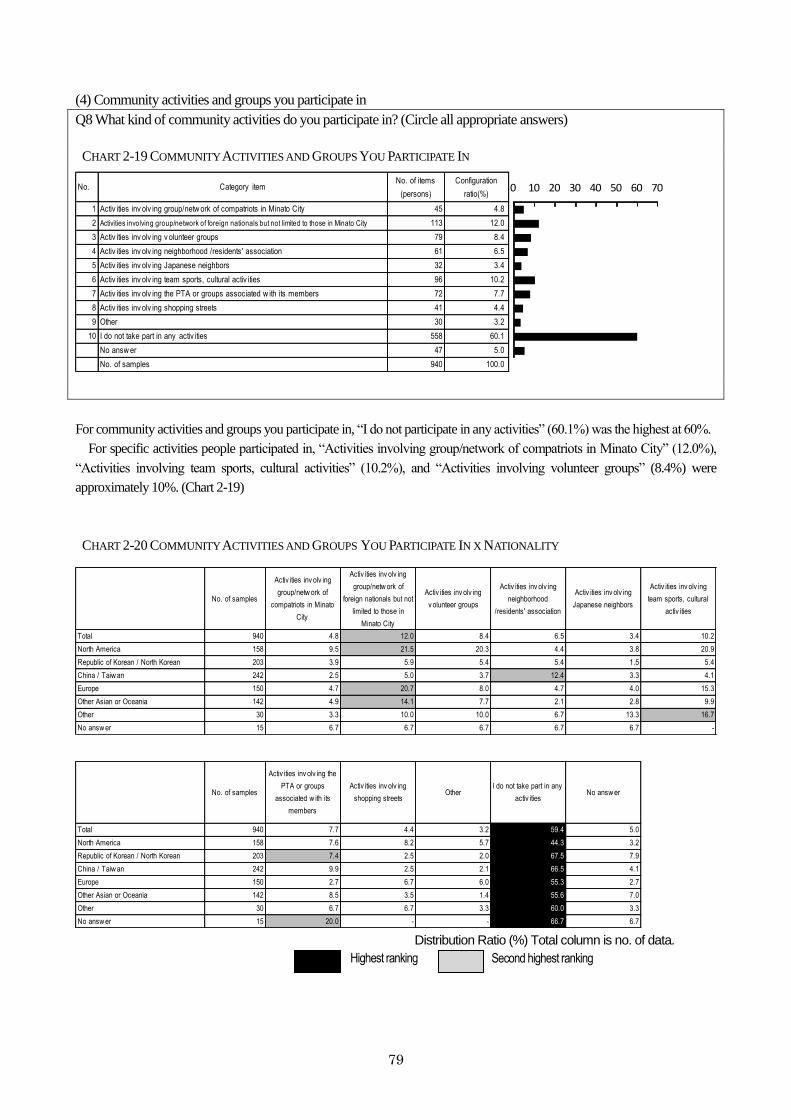
79
(4) Community activities and groups you participate in
Q8 What kind of community activities do you participate in? (Circle all appropriate answers)
CHART 2-19 COMMUNITY ACTIVITIES AND GROUPS YOU PARTICIPATE IN
No. Category itemNo. of items
(persons)
Configuration
ratio(%)
1 Activ ities inv olv ing group/netw ork of compatriots in Minato City 45 4.8
2 Activities involving group/network of foreign nationals but not limited to those in Minato City 113 12.0
3 Activ ities inv olv ing v olunteer groups 79 8.4
4 Activ ities inv olv ing neighborhood /residents' association 61 6.5
5 Activ ities inv olv ing Japanese neighbors 32 3.4
6 Activ ities inv olv ing team sports, cultural activ ities 96 10.2
7 Activ ities inv olv ing the PTA or groups associated w ith its members 72 7.7
8 Activ ities inv olv ing shopping streets 41 4.4
9 Other 30 3.2
10 I do not take part in any activ ities 558 60.1
No answ er 47 5.0
No. of samples 940 100.0
0 10 20 30 40 50 60 70
For community activities and groups you participate in, “I do not participate in any activities” (60.1%) was the highest at 60%.
For specific activities people participated in, “Activities involving group/network of compatriots in Minato City” (12.0%),
“Activities involving team sports, cultural activities” (10.2%), and “Activities involving volunteer groups” (8.4%) were
approximately 10%. (Chart 2-19)
CHART 2-20 COMMUNITY ACTIVITIES AND GROUPS YOU PARTICIPATE IN X NATIONALITY
No. of samples
Activ ities inv olv ing
group/netw ork of
compatriots in Minato
City
Activ ities inv olv ing
group/netw ork of
foreign nationals but not
limited to those in
Minato City
Activ ities inv olv ing
v olunteer groups
Activ ities inv olv ing
neighborhood
/residents' association
Activ ities inv olv ing
Japanese neighbors
Activ ities inv olv ing
team sports, cultural
activ ities
Total 940 4.8 12.0 8.4 6.5 3.4 10.2
North America 158 9.5 21.5 20.3 4.4 3.8 20.9
Republic of Korean / North Korean 203 3.9 5.9 5.4 5.4 1.5 5.4
China / Taiw an 242 2.5 5.0 3.7 12.4 3.3 4.1
Europe 150 4.7 20.7 8.0 4.7 4.0 15.3
Other Asian or Oceania 142 4.9 14.1 7.7 2.1 2.8 9.9
Other 30 3.3 10.0 10.0 6.7 13.3 16.7
No answ er 15 6.7 6.7 6.7 6.7 6.7 -
No. of samples
Activ ities inv olv ing the
PTA or groups
associated w ith its
members
Activ ities inv olv ing
shopping streetsOther
I do not take part in any
activ itiesNo answ er
Total 940 7.7 4.4 3.2 59.4 5.0
North America 158 7.6 8.2 5.7 44.3 3.2
Republic of Korean / North Korean 203 7.4 2.5 2.0 67.5 7.9
China / Taiw an 242 9.9 2.5 2.1 66.5 4.1
Europe 150 2.7 6.7 6.0 55.3 2.7
Other Asian or Oceania 142 8.5 3.5 1.4 55.6 7.0
Other 30 6.7 6.7 3.3 60.0 3.3
No answ er 15 20.0 - - 66.7 6.7 Distribution Ratio (%) Total column is no. of data.
Second highest ranking Highest ranking
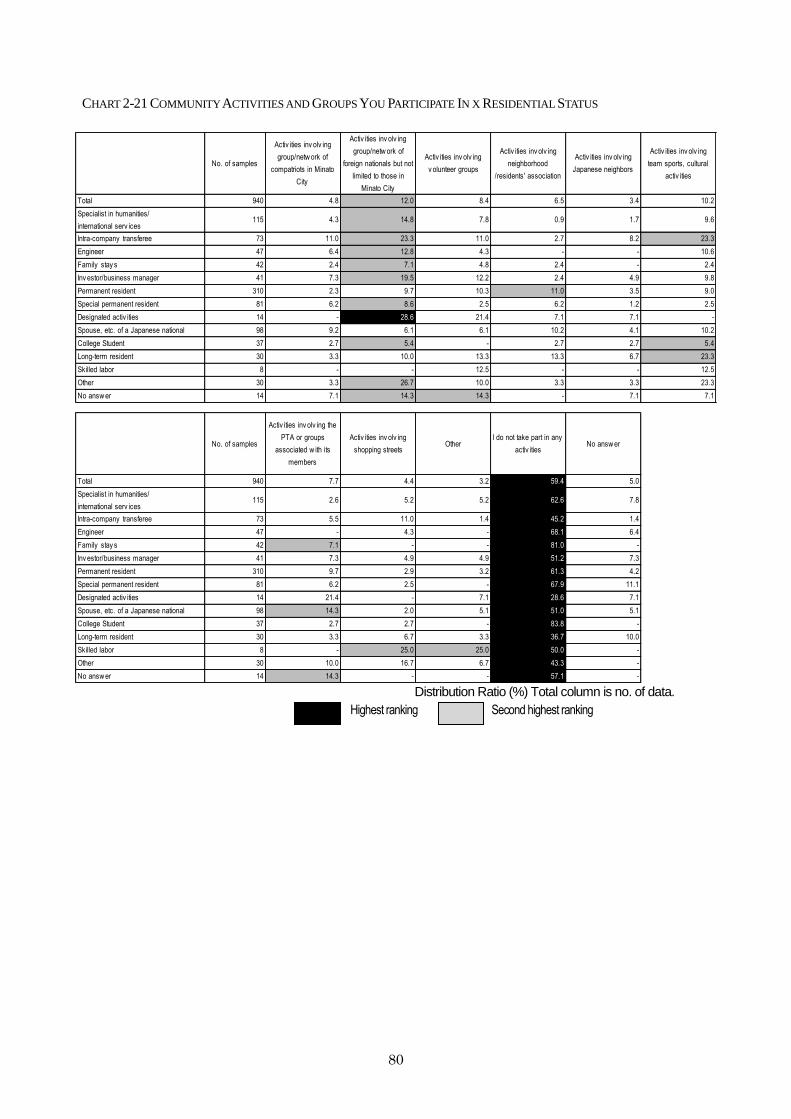
80
CHART 2-21 COMMUNITY ACTIVITIES AND GROUPS YOU PARTICIPATE IN X RESIDENTIAL STATUS
No. of samples
Activ ities inv olv ing
group/netw ork of
compatriots in Minato
City
Activ ities inv olv ing
group/netw ork of
foreign nationals but not
limited to those in
Minato City
Activ ities inv olv ing
v olunteer groups
Activ ities inv olv ing
neighborhood
/residents' association
Activ ities inv olv ing
Japanese neighbors
Activ ities inv olv ing
team sports, cultural
activ ities
Total 940 4.8 12.0 8.4 6.5 3.4 10.2
Specialist in humanities/
international serv ices115 4.3 14.8 7.8 0.9 1.7 9.6
Intra-company transferee 73 11.0 23.3 11.0 2.7 8.2 23.3
Engineer 47 6.4 12.8 4.3 - - 10.6
Family stay s 42 2.4 7.1 4.8 2.4 - 2.4
Inv estor/business manager 41 7.3 19.5 12.2 2.4 4.9 9.8
Permanent resident 310 2.3 9.7 10.3 11.0 3.5 9.0
Special permanent resident 81 6.2 8.6 2.5 6.2 1.2 2.5
Designated activ ities 14 - 28.6 21.4 7.1 7.1 -
Spouse, etc. of a Japanese national 98 9.2 6.1 6.1 10.2 4.1 10.2
College Student 37 2.7 5.4 - 2.7 2.7 5.4
Long-term resident 30 3.3 10.0 13.3 13.3 6.7 23.3
Skilled labor 8 - - 12.5 - - 12.5
Other 30 3.3 26.7 10.0 3.3 3.3 23.3
No answ er 14 7.1 14.3 14.3 - 7.1 7.1
No. of samples
Activ ities inv olv ing the
PTA or groups
associated w ith its
members
Activ ities inv olv ing
shopping streetsOther
I do not take part in any
activ itiesNo answ er
Total 940 7.7 4.4 3.2 59.4 5.0
Specialist in humanities/
international serv ices115 2.6 5.2 5.2 62.6 7.8
Intra-company transferee 73 5.5 11.0 1.4 45.2 1.4
Engineer 47 - 4.3 - 68.1 6.4
Family stay s 42 7.1 - - 81.0 -
Inv estor/business manager 41 7.3 4.9 4.9 51.2 7.3
Permanent resident 310 9.7 2.9 3.2 61.3 4.2
Special permanent resident 81 6.2 2.5 - 67.9 11.1
Designated activ ities 14 21.4 - 7.1 28.6 7.1
Spouse, etc. of a Japanese national 98 14.3 2.0 5.1 51.0 5.1
College Student 37 2.7 2.7 - 83.8 -
Long-term resident 30 3.3 6.7 3.3 36.7 10.0
Skilled labor 8 - 25.0 25.0 50.0 -
Other 30 10.0 16.7 6.7 43.3 -
No answ er 14 14.3 - - 57.1 - Distribution Ratio (%) Total column is no. of data.
Second highest ranking Highest ranking
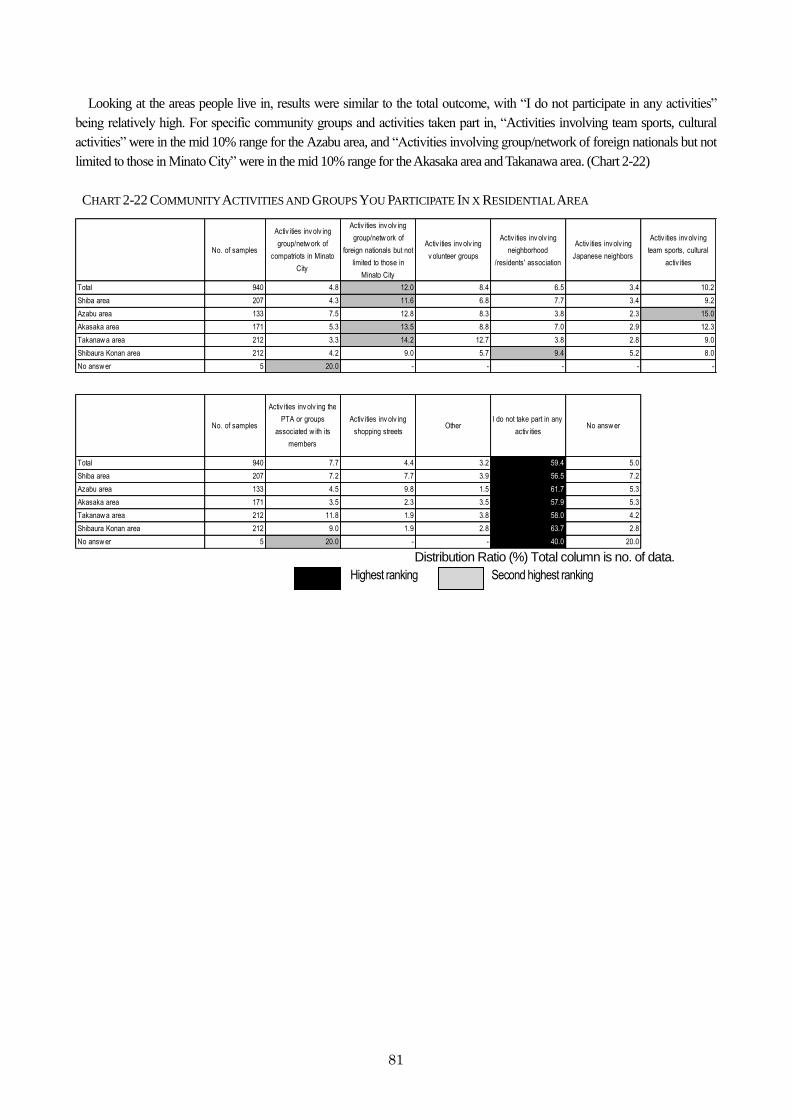
81
Looking at the areas people live in, results were similar to the total outcome, with “I do not participate in any activities”
being relatively high. For specific community groups and activities taken part in, “Activities involving team sports, cultural
activities” were in the mid 10% range for the Azabu area, and “Activities involving group/network of foreign nationals but not
limited to those in Minato City” were in the mid 10% range for the Akasaka area and Takanawa area. (Chart 2-22)
CHART 2-22 COMMUNITY ACTIVITIES AND GROUPS YOU PARTICIPATE IN X RESIDENTIAL AREA
No. of samples
Activ ities inv olv ing
group/netw ork of
compatriots in Minato
City
Activ ities inv olv ing
group/netw ork of
foreign nationals but not
limited to those in
Minato City
Activ ities inv olv ing
v olunteer groups
Activ ities inv olv ing
neighborhood
/residents' association
Activ ities inv olv ing
Japanese neighbors
Activ ities inv olv ing
team sports, cultural
activ ities
Total 940 4.8 12.0 8.4 6.5 3.4 10.2
Shiba area 207 4.3 11.6 6.8 7.7 3.4 9.2
Azabu area 133 7.5 12.8 8.3 3.8 2.3 15.0
Akasaka area 171 5.3 13.5 8.8 7.0 2.9 12.3
Takanaw a area 212 3.3 14.2 12.7 3.8 2.8 9.0
Shibaura Konan area 212 4.2 9.0 5.7 9.4 5.2 8.0
No answ er 5 20.0 - - - - -
No. of samples
Activ ities inv olv ing the
PTA or groups
associated w ith its
members
Activ ities inv olv ing
shopping streetsOther
I do not take part in any
activ itiesNo answ er
Total 940 7.7 4.4 3.2 59.4 5.0
Shiba area 207 7.2 7.7 3.9 56.5 7.2
Azabu area 133 4.5 9.8 1.5 61.7 5.3
Akasaka area 171 3.5 2.3 3.5 57.9 5.3
Takanaw a area 212 11.8 1.9 3.8 58.0 4.2
Shibaura Konan area 212 9.0 1.9 2.8 63.7 2.8
No answ er 5 20.0 - - 40.0 20.0 Distribution Ratio (%) Total column is no. of data.
Second highest ranking Highest ranking
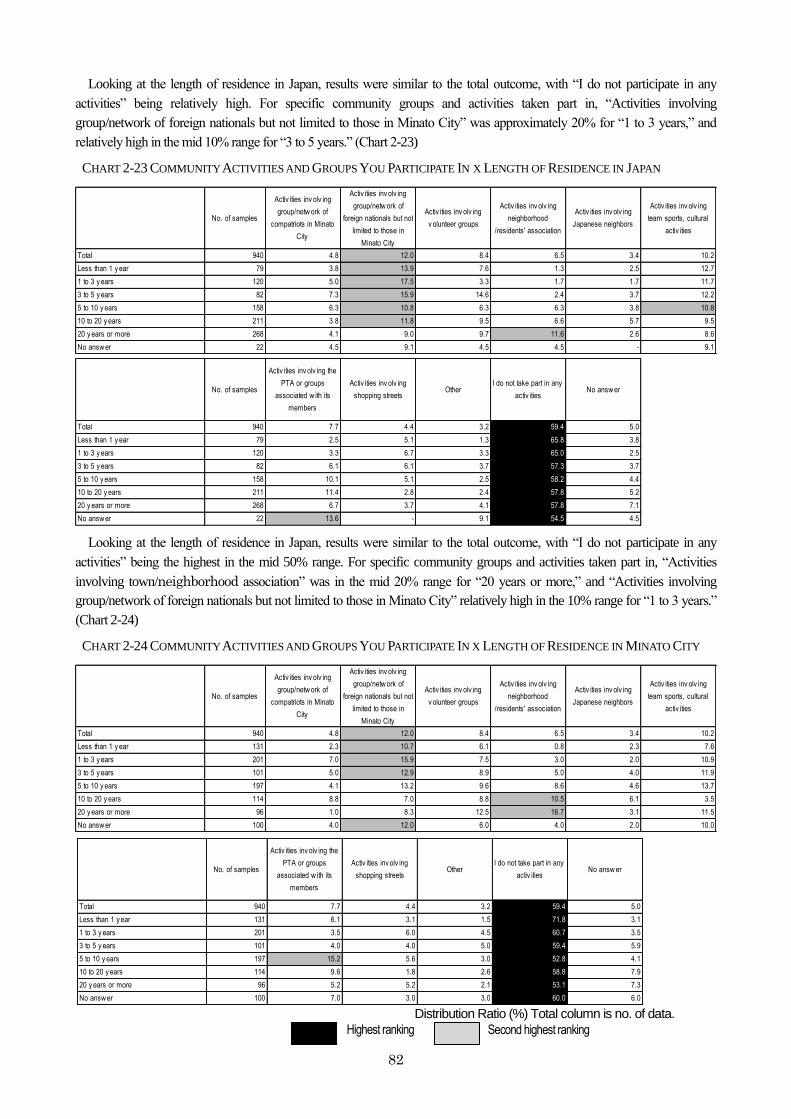
82
Looking at the length of residence in Japan, results were similar to the total outcome, with “I do not participate in any
activities” being relatively high. For specific community groups and activities taken part in, “Activities involving
group/network of foreign nationals but not limited to those in Minato City” was approximately 20% for “1 to 3 years,” and
relatively high in the mid 10% range for “3 to 5 years.” (Chart 2-23) CHART 2-23 COMMUNITY ACTIVITIES AND GROUPS YOU PARTICIPATE IN X LENGTH OF RESIDENCE IN JAPAN
No. of samples
Activ ities inv olv ing
group/netw ork of
compatriots in Minato
City
Activ ities inv olv ing
group/netw ork of
foreign nationals but not
limited to those in
Minato City
Activ ities inv olv ing
v olunteer groups
Activ ities inv olv ing
neighborhood
/residents' association
Activ ities inv olv ing
Japanese neighbors
Activ ities inv olv ing
team sports, cultural
activ ities
Total 940 4.8 12.0 8.4 6.5 3.4 10.2
Less than 1 y ear 79 3.8 13.9 7.6 1.3 2.5 12.7
1 to 3 y ears 120 5.0 17.5 3.3 1.7 1.7 11.7
3 to 5 y ears 82 7.3 15.9 14.6 2.4 3.7 12.2
5 to 10 y ears 158 6.3 10.8 6.3 6.3 3.8 10.8
10 to 20 y ears 211 3.8 11.8 9.5 6.6 5.7 9.5
20 y ears or more 268 4.1 9.0 9.7 11.6 2.6 8.6
No answ er 22 4.5 9.1 4.5 4.5 - 9.1
No. of samples
Activ ities inv olv ing the
PTA or groups
associated w ith its
members
Activ ities inv olv ing
shopping streetsOther
I do not take part in any
activ itiesNo answ er
Total 940 7.7 4.4 3.2 59.4 5.0
Less than 1 y ear 79 2.5 5.1 1.3 65.8 3.8
1 to 3 y ears 120 3.3 6.7 3.3 65.0 2.5
3 to 5 y ears 82 6.1 6.1 3.7 57.3 3.7
5 to 10 y ears 158 10.1 5.1 2.5 58.2 4.4
10 to 20 y ears 211 11.4 2.8 2.4 57.8 5.2
20 y ears or more 268 6.7 3.7 4.1 57.8 7.1
No answ er 22 13.6 - 9.1 54.5 4.5 Looking at the length of residence in Japan, results were similar to the total outcome, with “I do not participate in any
activities” being the highest in the mid 50% range. For specific community groups and activities taken part in, “Activities
involving town/neighborhood association” was in the mid 20% range for “20 years or more,” and “Activities involving
group/network of foreign nationals but not limited to those in Minato City” relatively high in the 10% range for “1 to 3 years.”
(Chart 2-24)
CHART 2-24 COMMUNITY ACTIVITIES AND GROUPS YOU PARTICIPATE IN X LENGTH OF RESIDENCE IN MINATO CITY
No. of samples
Activ ities inv olv ing
group/netw ork of
compatriots in Minato
City
Activ ities inv olv ing
group/netw ork of
foreign nationals but not
limited to those in
Minato City
Activ ities inv olv ing
v olunteer groups
Activ ities inv olv ing
neighborhood
/residents' association
Activ ities inv olv ing
Japanese neighbors
Activ ities inv olv ing
team sports, cultural
activ ities
Total 940 4.8 12.0 8.4 6.5 3.4 10.2
Less than 1 y ear 131 2.3 10.7 6.1 0.8 2.3 7.6
1 to 3 y ears 201 7.0 15.9 7.5 3.0 2.0 10.9
3 to 5 y ears 101 5.0 12.9 8.9 5.0 4.0 11.9
5 to 10 y ears 197 4.1 13.2 9.6 8.6 4.6 13.7
10 to 20 y ears 114 8.8 7.0 8.8 10.5 6.1 3.5
20 y ears or more 96 1.0 8.3 12.5 16.7 3.1 11.5
No answ er 100 4.0 12.0 6.0 4.0 2.0 10.0
Distribution Ratio (%) Total column is no. of data.
Second highest ranking Highest ranking
No. of samples
Activ ities inv olv ing the
PTA or groups
associated w ith its
members
Activ ities inv olv ing
shopping streetsOther
I do not take part in any
activ itiesNo answ er
Total 940 7.7 4.4 3.2 59.4 5.0
Less than 1 y ear 131 6.1 3.1 1.5 71.8 3.1
1 to 3 y ears 201 3.5 6.0 4.5 60.7 3.5
3 to 5 y ears 101 4.0 4.0 5.0 59.4 5.9
5 to 10 y ears 197 15.2 5.6 3.0 52.8 4.1
10 to 20 y ears 114 9.6 1.8 2.6 58.8 7.9
20 y ears or more 96 5.2 5.2 2.1 53.1 7.3
No answ er 100 7.0 3.0 3.0 60.0 6.0
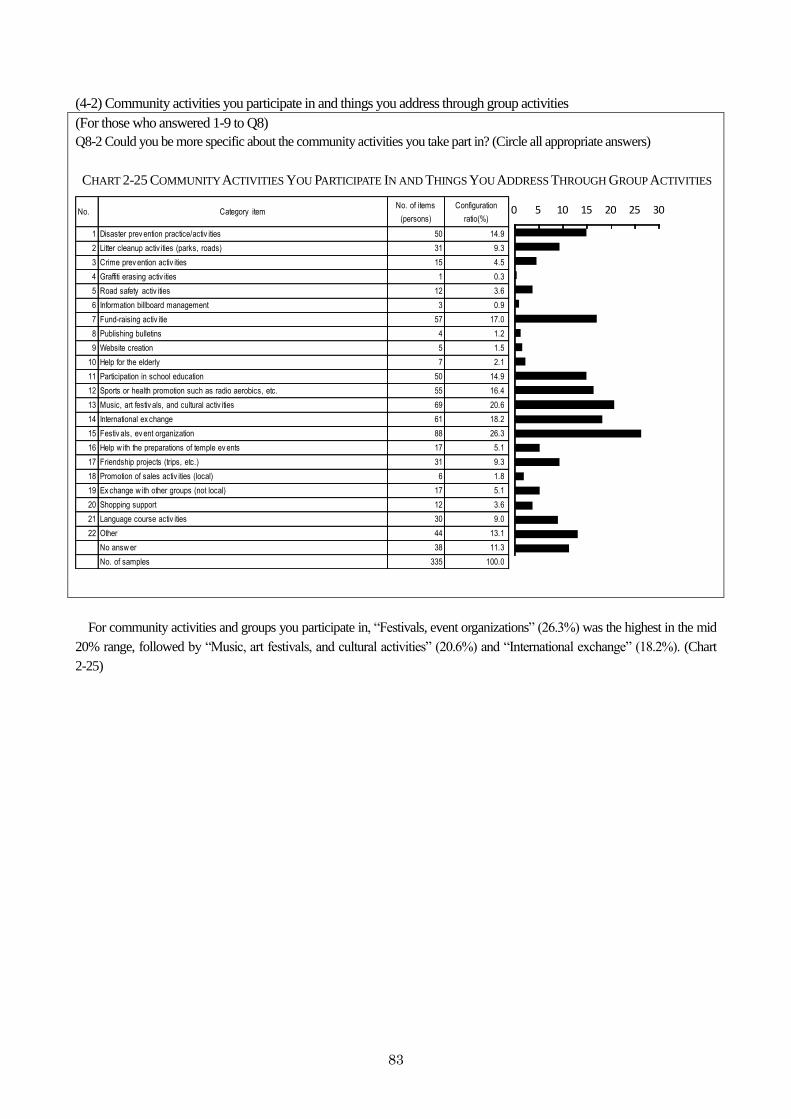
83
(4-2) Community activities you participate in and things you address through group activities
(For those who answered 1-9 to Q8)
Q8-2 Could you be more specific about the community activities you take part in? (Circle all appropriate answers)
CHART 2-25 COMMUNITY ACTIVITIES YOU PARTICIPATE IN AND THINGS YOU ADDRESS THROUGH GROUP ACTIVITIES
No. Category itemNo. of items
(persons)
Configuration
ratio(%)
1 Disaster prev ention practice/activ ities 50 14.9
2 Litter cleanup activ ities (parks, roads) 31 9.3
3 Crime prev ention activ ities 15 4.5
4 Graffiti erasing activ ities 1 0.3
5 Road safety activ ities 12 3.6
6 Information billboard management 3 0.9
7 Fund-raising activ itie 57 17.0
8 Publishing bulletins 4 1.2
9 Website creation 5 1.5
10 Help for the elderly 7 2.1
11 Participation in school education 50 14.9
12 Sports or health promotion such as radio aerobics, etc. 55 16.4
13 Music, art festiv als, and cultural activ ities 69 20.6
14 International ex change 61 18.2
15 Festiv als, ev ent organization 88 26.3
16 Help w ith the preparations of temple ev ents 17 5.1
17 Friendship projects (trips, etc.) 31 9.3
18 Promotion of sales activ ities (local) 6 1.8
19 Ex change w ith other groups (not local) 17 5.1
20 Shopping support 12 3.6
21 Language course activ ities 30 9.0
22 Other 44 13.1
No answ er 38 11.3
No. of samples 335 100.0
0 5 10 15 20 25 30
For community activities and groups you participate in, “Festivals, event organizations” (26.3%) was the highest in the mid
20% range, followed by “Music, art festivals, and cultural activities” (20.6%) and “International exchange” (18.2%). (Chart
2-25)
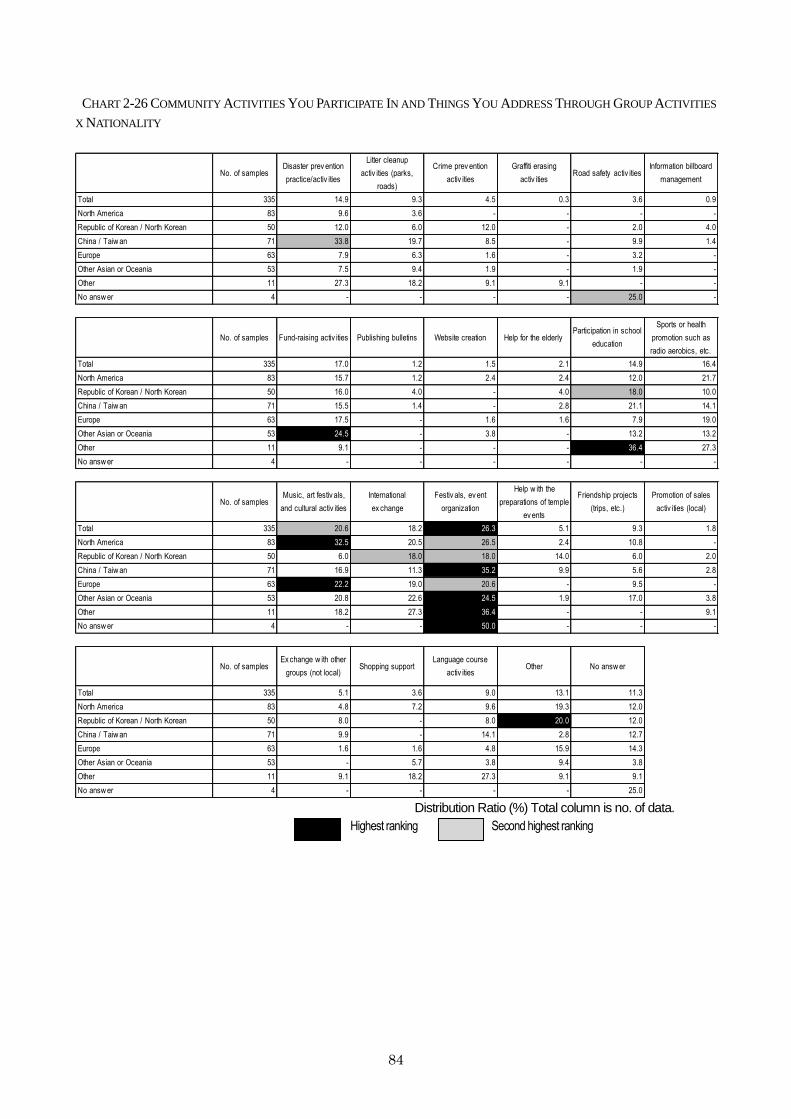
84
CHART 2-26 COMMUNITY ACTIVITIES YOU PARTICIPATE IN AND THINGS YOU ADDRESS THROUGH GROUP ACTIVITIES
X NATIONALITY
No. of samplesDisaster prev ention
practice/activ ities
Litter cleanup
activ ities (parks,
roads)
Crime prev ention
activ ities
Graffiti erasing
activ itiesRoad safety activ ities
Information billboard
management
Total 335 14.9 9.3 4.5 0.3 3.6 0.9
North America 83 9.6 3.6 - - - -
Republic of Korean / North Korean 50 12.0 6.0 12.0 - 2.0 4.0
China / Taiw an 71 33.8 19.7 8.5 - 9.9 1.4
Europe 63 7.9 6.3 1.6 - 3.2 -
Other Asian or Oceania 53 7.5 9.4 1.9 - 1.9 -
Other 11 27.3 18.2 9.1 9.1 - -
No answ er 4 - - - - 25.0 -
No. of samples Fund-raising activ ities Publishing bulletins Website creation Help for the elderlyParticipation in school
education
Sports or health
promotion such as
radio aerobics, etc.
Total 335 17.0 1.2 1.5 2.1 14.9 16.4
North America 83 15.7 1.2 2.4 2.4 12.0 21.7
Republic of Korean / North Korean 50 16.0 4.0 - 4.0 18.0 10.0
China / Taiw an 71 15.5 1.4 - 2.8 21.1 14.1
Europe 63 17.5 - 1.6 1.6 7.9 19.0
Other Asian or Oceania 53 24.5 - 3.8 - 13.2 13.2
Other 11 9.1 - - - 36.4 27.3
No answ er 4 - - - - - -
No. of samplesMusic, art festiv als,
and cultural activ ities
International
ex change
Festiv als, ev ent
organization
Help w ith the
preparations of temple
ev ents
Friendship projects
(trips, etc.)
Promotion of sales
activ ities (local)
Total 335 20.6 18.2 26.3 5.1 9.3 1.8
North America 83 32.5 20.5 26.5 2.4 10.8 -
Republic of Korean / North Korean 50 6.0 18.0 18.0 14.0 6.0 2.0
China / Taiw an 71 16.9 11.3 35.2 9.9 5.6 2.8
Europe 63 22.2 19.0 20.6 - 9.5 -
Other Asian or Oceania 53 20.8 22.6 24.5 1.9 17.0 3.8
Other 11 18.2 27.3 36.4 - - 9.1
No answ er 4 - - 50.0 - - -
No. of samplesEx change w ith other
groups (not local)Shopping support
Language course
activ itiesOther No answ er
Total 335 5.1 3.6 9.0 13.1 11.3
North America 83 4.8 7.2 9.6 19.3 12.0
Republic of Korean / North Korean 50 8.0 - 8.0 20.0 12.0
China / Taiw an 71 9.9 - 14.1 2.8 12.7
Europe 63 1.6 1.6 4.8 15.9 14.3
Other Asian or Oceania 53 - 5.7 3.8 9.4 3.8
Other 11 9.1 18.2 27.3 9.1 9.1
No answ er 4 - - - - 25.0 Distribution Ratio (%) Total column is no. of data.
Second highest ranking Highest ranking
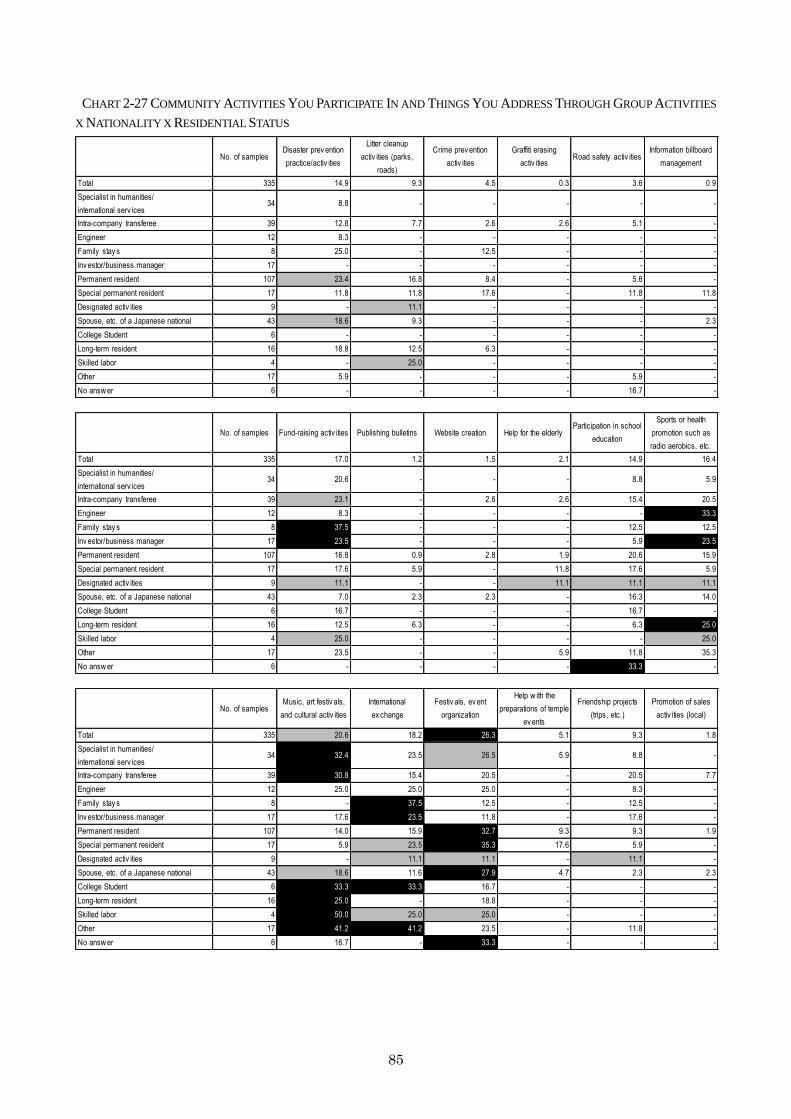
85
CHART 2-27 COMMUNITY ACTIVITIES YOU PARTICIPATE IN AND THINGS YOU ADDRESS THROUGH GROUP ACTIVITIES
X NATIONALITY X RESIDENTIAL STATUS
No. of samplesDisaster prev ention
practice/activ ities
Litter cleanup
activ ities (parks,
roads)
Crime prev ention
activ ities
Graffiti erasing
activ itiesRoad safety activ ities
Information billboard
management
Total 335 14.9 9.3 4.5 0.3 3.6 0.9
Specialist in humanities/
international serv ices34 8.8 - - - - -
Intra-company transferee 39 12.8 7.7 2.6 2.6 5.1 -
Engineer 12 8.3 - - - - -
Family stay s 8 25.0 - 12.5 - - -
Inv estor/business manager 17 - - - - - -
Permanent resident 107 23.4 16.8 8.4 - 5.6 -
Special permanent resident 17 11.8 11.8 17.6 - 11.8 11.8
Designated activ ities 9 - 11.1 - - - -
Spouse, etc. of a Japanese national 43 18.6 9.3 - - - 2.3
College Student 6 - - - - - -
Long-term resident 16 18.8 12.5 6.3 - - -
Skilled labor 4 - 25.0 - - - -
Other 17 5.9 - - - 5.9 -
No answ er 6 - - - - 16.7 -
No. of samples Fund-raising activ ities Publishing bulletins Website creation Help for the elderlyParticipation in school
education
Sports or health
promotion such as
radio aerobics, etc.
Total 335 17.0 1.2 1.5 2.1 14.9 16.4
Specialist in humanities/
international serv ices34 20.6 - - - 8.8 5.9
Intra-company transferee 39 23.1 - 2.6 2.6 15.4 20.5
Engineer 12 8.3 - - - - 33.3
Family stay s 8 37.5 - - - 12.5 12.5
Inv estor/business manager 17 23.5 - - - 5.9 23.5
Permanent resident 107 16.8 0.9 2.8 1.9 20.6 15.9
Special permanent resident 17 17.6 5.9 - 11.8 17.6 5.9
Designated activ ities 9 11.1 - - 11.1 11.1 11.1
Spouse, etc. of a Japanese national 43 7.0 2.3 2.3 - 16.3 14.0
College Student 6 16.7 - - - 16.7 -
Long-term resident 16 12.5 6.3 - - 6.3 25.0
Skilled labor 4 25.0 - - - - 25.0
Other 17 23.5 - - 5.9 11.8 35.3
No answ er 6 - - - - 33.3 -
No. of samplesMusic, art festiv als,
and cultural activ ities
International
ex change
Festiv als, ev ent
organization
Help w ith the
preparations of temple
ev ents
Friendship projects
(trips, etc.)
Promotion of sales
activ ities (local)
Total 335 20.6 18.2 26.3 5.1 9.3 1.8
Specialist in humanities/
international serv ices34 32.4 23.5 26.5 5.9 8.8 -
Intra-company transferee 39 30.8 15.4 20.5 - 20.5 7.7
Engineer 12 25.0 25.0 25.0 - 8.3 -
Family stay s 8 - 37.5 12.5 - 12.5 -
Inv estor/business manager 17 17.6 23.5 11.8 - 17.6 -
Permanent resident 107 14.0 15.9 32.7 9.3 9.3 1.9
Special permanent resident 17 5.9 23.5 35.3 17.6 5.9 -
Designated activ ities 9 - 11.1 11.1 - 11.1 -
Spouse, etc. of a Japanese national 43 18.6 11.6 27.9 4.7 2.3 2.3
College Student 6 33.3 33.3 16.7 - - -
Long-term resident 16 25.0 - 18.8 - - -
Skilled labor 4 50.0 25.0 25.0 - - -
Other 17 41.2 41.2 23.5 - 11.8 -
No answ er 6 16.7 - 33.3 - - -
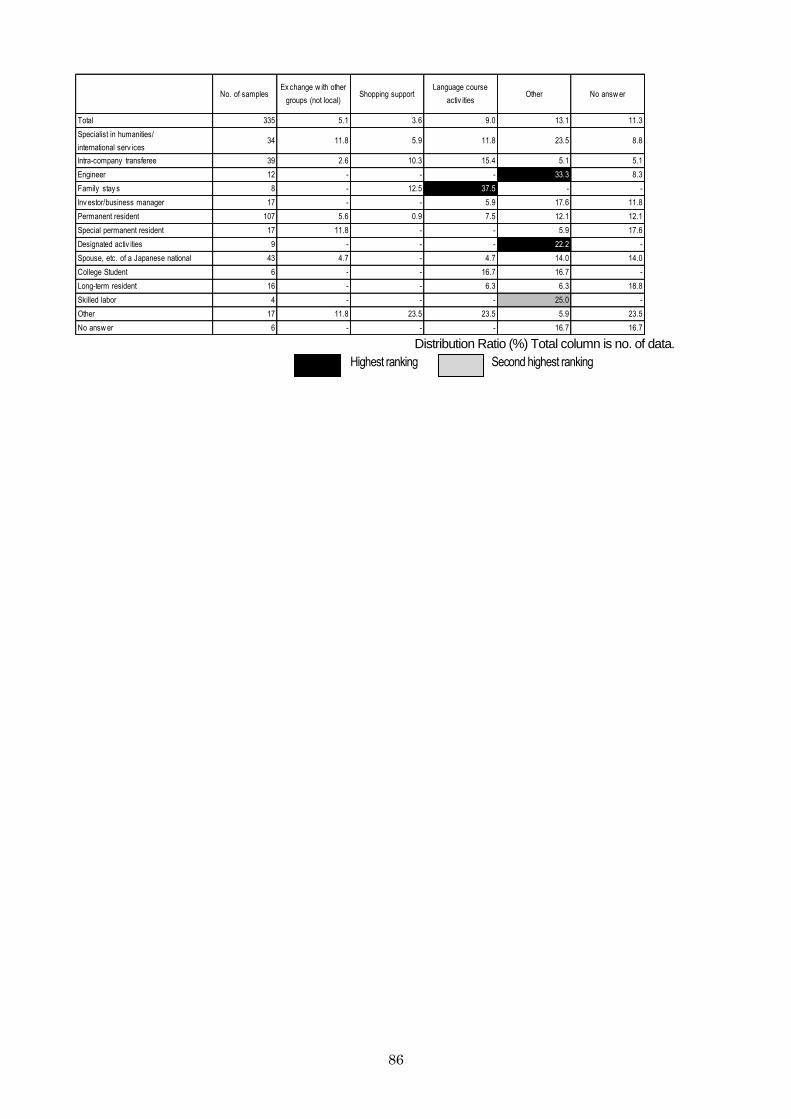
86
No. of samplesEx change w ith other
groups (not local)Shopping support
Language course
activ itiesOther No answ er
Total 335 5.1 3.6 9.0 13.1 11.3
Specialist in humanities/
international serv ices34 11.8 5.9 11.8 23.5 8.8
Intra-company transferee 39 2.6 10.3 15.4 5.1 5.1
Engineer 12 - - - 33.3 8.3
Family stay s 8 - 12.5 37.5 - -
Inv estor/business manager 17 - - 5.9 17.6 11.8
Permanent resident 107 5.6 0.9 7.5 12.1 12.1
Special permanent resident 17 11.8 - - 5.9 17.6
Designated activ ities 9 - - - 22.2 -
Spouse, etc. of a Japanese national 43 4.7 - 4.7 14.0 14.0
College Student 6 - - 16.7 16.7 -
Long-term resident 16 - - 6.3 6.3 18.8
Skilled labor 4 - - - 25.0 -
Other 17 11.8 23.5 23.5 5.9 23.5
No answ er 6 - - - 16.7 16.7 Distribution Ratio (%) Total column is no. of data.
Second highest ranking Highest ranking
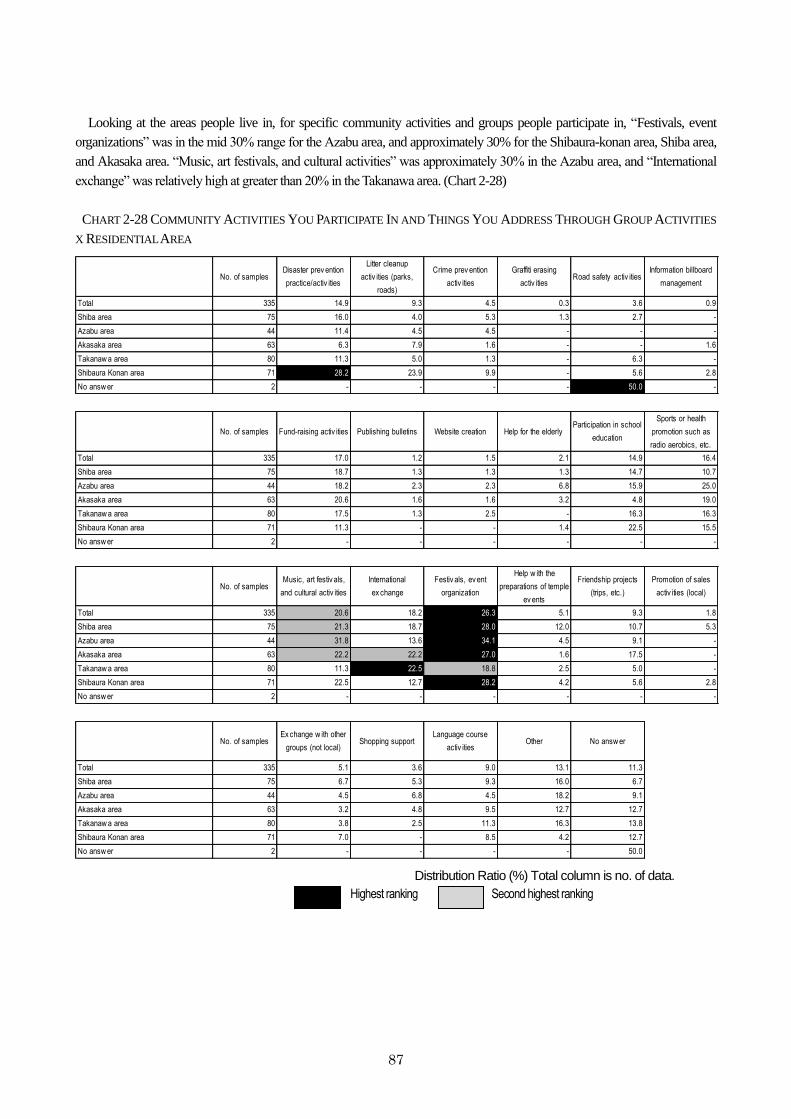
87
Looking at the areas people live in, for specific community activities and groups people participate in, “Festivals, event
organizations” was in the mid 30% range for the Azabu area, and approximately 30% for the Shibaura-konan area, Shiba area,
and Akasaka area. “Music, art festivals, and cultural activities” was approximately 30% in the Azabu area, and “International
exchange” was relatively high at greater than 20% in the Takanawa area. (Chart 2-28)
CHART 2-28 COMMUNITY ACTIVITIES YOU PARTICIPATE IN AND THINGS YOU ADDRESS THROUGH GROUP ACTIVITIES
X RESIDENTIAL AREA
No. of samplesDisaster prev ention
practice/activ ities
Litter cleanup
activ ities (parks,
roads)
Crime prev ention
activ ities
Graffiti erasing
activ itiesRoad safety activ ities
Information billboard
management
Total 335 14.9 9.3 4.5 0.3 3.6 0.9
Shiba area 75 16.0 4.0 5.3 1.3 2.7 -
Azabu area 44 11.4 4.5 4.5 - - -
Akasaka area 63 6.3 7.9 1.6 - - 1.6
Takanaw a area 80 11.3 5.0 1.3 - 6.3 -
Shibaura Konan area 71 28.2 23.9 9.9 - 5.6 2.8
No answ er 2 - - - - 50.0 -
No. of samples Fund-raising activ ities Publishing bulletins Website creation Help for the elderlyParticipation in school
education
Sports or health
promotion such as
radio aerobics, etc.
Total 335 17.0 1.2 1.5 2.1 14.9 16.4
Shiba area 75 18.7 1.3 1.3 1.3 14.7 10.7
Azabu area 44 18.2 2.3 2.3 6.8 15.9 25.0
Akasaka area 63 20.6 1.6 1.6 3.2 4.8 19.0
Takanaw a area 80 17.5 1.3 2.5 - 16.3 16.3
Shibaura Konan area 71 11.3 - - 1.4 22.5 15.5
No answ er 2 - - - - - -
No. of samplesMusic, art festiv als,
and cultural activ ities
International
ex change
Festiv als, ev ent
organization
Help w ith the
preparations of temple
ev ents
Friendship projects
(trips, etc.)
Promotion of sales
activ ities (local)
Total 335 20.6 18.2 26.3 5.1 9.3 1.8
Shiba area 75 21.3 18.7 28.0 12.0 10.7 5.3
Azabu area 44 31.8 13.6 34.1 4.5 9.1 -
Akasaka area 63 22.2 22.2 27.0 1.6 17.5 -
Takanaw a area 80 11.3 22.5 18.8 2.5 5.0 -
Shibaura Konan area 71 22.5 12.7 28.2 4.2 5.6 2.8
No answ er 2 - - - - - -
No. of samplesEx change w ith other
groups (not local)Shopping support
Language course
activ itiesOther No answ er
Total 335 5.1 3.6 9.0 13.1 11.3
Shiba area 75 6.7 5.3 9.3 16.0 6.7
Azabu area 44 4.5 6.8 4.5 18.2 9.1
Akasaka area 63 3.2 4.8 9.5 12.7 12.7
Takanaw a area 80 3.8 2.5 11.3 16.3 13.8
Shibaura Konan area 71 7.0 - 8.5 4.2 12.7
No answ er 2 - - - - 50.0
Distribution Ratio (%) Total column is no. of data.
Second highest ranking Highest ranking
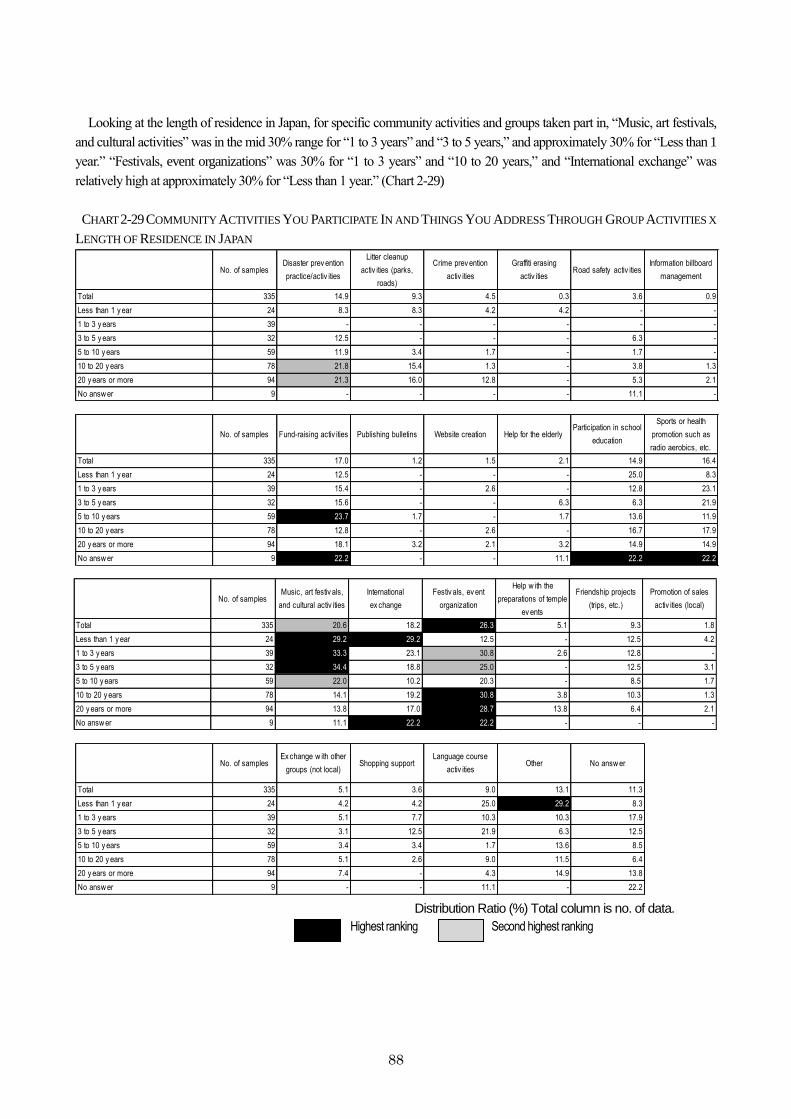
88
Looking at the length of residence in Japan, for specific community activities and groups taken part in, “Music, art festivals,
and cultural activities” was in the mid 30% range for “1 to 3 years” and “3 to 5 years,” and approximately 30% for “Less than 1
year.” “Festivals, event organizations” was 30% for “1 to 3 years” and “10 to 20 years,” and “International exchange” was
relatively high at approximately 30% for “Less than 1 year.” (Chart 2-29)
CHART 2-29 COMMUNITY ACTIVITIES YOU PARTICIPATE IN AND THINGS YOU ADDRESS THROUGH GROUP ACTIVITIES X
LENGTH OF RESIDENCE IN JAPAN
No. of samplesDisaster prev ention
practice/activ ities
Litter cleanup
activ ities (parks,
roads)
Crime prev ention
activ ities
Graffiti erasing
activ itiesRoad safety activ ities
Information billboard
management
Total 335 14.9 9.3 4.5 0.3 3.6 0.9
Less than 1 y ear 24 8.3 8.3 4.2 4.2 - -
1 to 3 y ears 39 - - - - - -
3 to 5 y ears 32 12.5 - - - 6.3 -
5 to 10 y ears 59 11.9 3.4 1.7 - 1.7 -
10 to 20 y ears 78 21.8 15.4 1.3 - 3.8 1.3
20 y ears or more 94 21.3 16.0 12.8 - 5.3 2.1
No answ er 9 - - - - 11.1 -
No. of samples Fund-raising activ ities Publishing bulletins Website creation Help for the elderlyParticipation in school
education
Sports or health
promotion such as
radio aerobics, etc.
Total 335 17.0 1.2 1.5 2.1 14.9 16.4
Less than 1 y ear 24 12.5 - - - 25.0 8.3
1 to 3 y ears 39 15.4 - 2.6 - 12.8 23.1
3 to 5 y ears 32 15.6 - - 6.3 6.3 21.9
5 to 10 y ears 59 23.7 1.7 - 1.7 13.6 11.9
10 to 20 y ears 78 12.8 - 2.6 - 16.7 17.9
20 y ears or more 94 18.1 3.2 2.1 3.2 14.9 14.9
No answ er 9 22.2 - - 11.1 22.2 22.2
No. of samplesMusic, art festiv als,
and cultural activ ities
International
ex change
Festiv als, ev ent
organization
Help w ith the
preparations of temple
ev ents
Friendship projects
(trips, etc.)
Promotion of sales
activ ities (local)
Total 335 20.6 18.2 26.3 5.1 9.3 1.8
Less than 1 y ear 24 29.2 29.2 12.5 - 12.5 4.2
1 to 3 y ears 39 33.3 23.1 30.8 2.6 12.8 -
3 to 5 y ears 32 34.4 18.8 25.0 - 12.5 3.1
5 to 10 y ears 59 22.0 10.2 20.3 - 8.5 1.7
10 to 20 y ears 78 14.1 19.2 30.8 3.8 10.3 1.3
20 y ears or more 94 13.8 17.0 28.7 13.8 6.4 2.1
No answ er 9 11.1 22.2 22.2 - - -
No. of samplesEx change w ith other
groups (not local)Shopping support
Language course
activ itiesOther No answ er
Total 335 5.1 3.6 9.0 13.1 11.3
Less than 1 y ear 24 4.2 4.2 25.0 29.2 8.3
1 to 3 y ears 39 5.1 7.7 10.3 10.3 17.9
3 to 5 y ears 32 3.1 12.5 21.9 6.3 12.5
5 to 10 y ears 59 3.4 3.4 1.7 13.6 8.5
10 to 20 y ears 78 5.1 2.6 9.0 11.5 6.4
20 y ears or more 94 7.4 - 4.3 14.9 13.8
No answ er 9 - - 11.1 - 22.2
Distribution Ratio (%) Total column is no. of data.
Second highest ranking Highest ranking
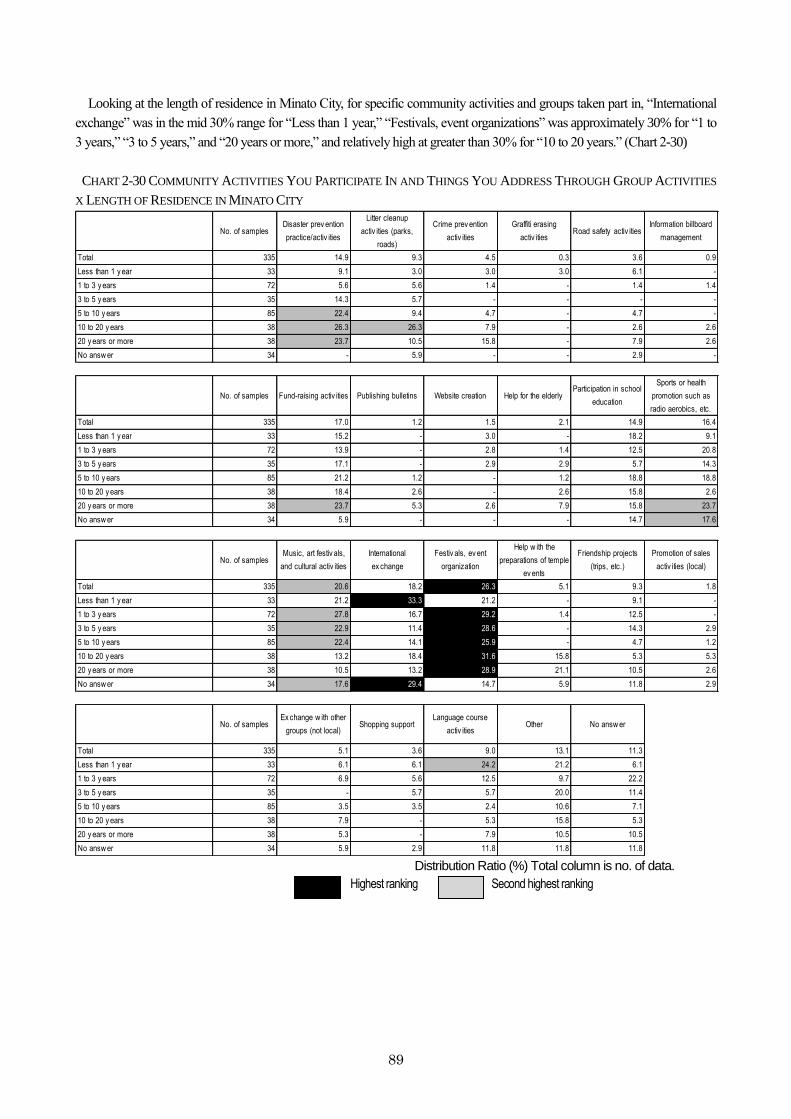
89
Looking at the length of residence in Minato City, for specific community activities and groups taken part in, “International
exchange” was in the mid 30% range for “Less than 1 year,” “Festivals, event organizations” was approximately 30% for “1 to
3 years,” “3 to 5 years,” and “20 years or more,” and relatively high at greater than 30% for “10 to 20 years.” (Chart 2-30)
CHART 2-30 COMMUNITY ACTIVITIES YOU PARTICIPATE IN AND THINGS YOU ADDRESS THROUGH GROUP ACTIVITIES
X LENGTH OF RESIDENCE IN MINATO CITY
No. of samplesDisaster prev ention
practice/activ ities
Litter cleanup
activ ities (parks,
roads)
Crime prev ention
activ ities
Graffiti erasing
activ itiesRoad safety activ ities
Information billboard
management
Total 335 14.9 9.3 4.5 0.3 3.6 0.9
Less than 1 y ear 33 9.1 3.0 3.0 3.0 6.1 -
1 to 3 y ears 72 5.6 5.6 1.4 - 1.4 1.4
3 to 5 y ears 35 14.3 5.7 - - - -
5 to 10 y ears 85 22.4 9.4 4.7 - 4.7 -
10 to 20 y ears 38 26.3 26.3 7.9 - 2.6 2.6
20 y ears or more 38 23.7 10.5 15.8 - 7.9 2.6
No answ er 34 - 5.9 - - 2.9 -
No. of samples Fund-raising activ ities Publishing bulletins Website creation Help for the elderlyParticipation in school
education
Sports or health
promotion such as
radio aerobics, etc.
Total 335 17.0 1.2 1.5 2.1 14.9 16.4
Less than 1 y ear 33 15.2 - 3.0 - 18.2 9.1
1 to 3 y ears 72 13.9 - 2.8 1.4 12.5 20.8
3 to 5 y ears 35 17.1 - 2.9 2.9 5.7 14.3
5 to 10 y ears 85 21.2 1.2 - 1.2 18.8 18.8
10 to 20 y ears 38 18.4 2.6 - 2.6 15.8 2.6
20 y ears or more 38 23.7 5.3 2.6 7.9 15.8 23.7
No answ er 34 5.9 - - - 14.7 17.6
No. of samplesMusic, art festiv als,
and cultural activ ities
International
ex change
Festiv als, ev ent
organization
Help w ith the
preparations of temple
ev ents
Friendship projects
(trips, etc.)
Promotion of sales
activ ities (local)
Total 335 20.6 18.2 26.3 5.1 9.3 1.8
Less than 1 y ear 33 21.2 33.3 21.2 - 9.1 -
1 to 3 y ears 72 27.8 16.7 29.2 1.4 12.5 -
3 to 5 y ears 35 22.9 11.4 28.6 - 14.3 2.9
5 to 10 y ears 85 22.4 14.1 25.9 - 4.7 1.2
10 to 20 y ears 38 13.2 18.4 31.6 15.8 5.3 5.3
20 y ears or more 38 10.5 13.2 28.9 21.1 10.5 2.6
No answ er 34 17.6 29.4 14.7 5.9 11.8 2.9
No. of samplesEx change w ith other
groups (not local)Shopping support
Language course
activ itiesOther No answ er
Total 335 5.1 3.6 9.0 13.1 11.3
Less than 1 y ear 33 6.1 6.1 24.2 21.2 6.1
1 to 3 y ears 72 6.9 5.6 12.5 9.7 22.2
3 to 5 y ears 35 - 5.7 5.7 20.0 11.4
5 to 10 y ears 85 3.5 3.5 2.4 10.6 7.1
10 to 20 y ears 38 7.9 - 5.3 15.8 5.3
20 y ears or more 38 5.3 - 7.9 10.5 10.5
No answ er 34 5.9 2.9 11.8 11.8 11.8 Distribution Ratio (%) Total column is no. of data.
Second highest ranking Highest ranking
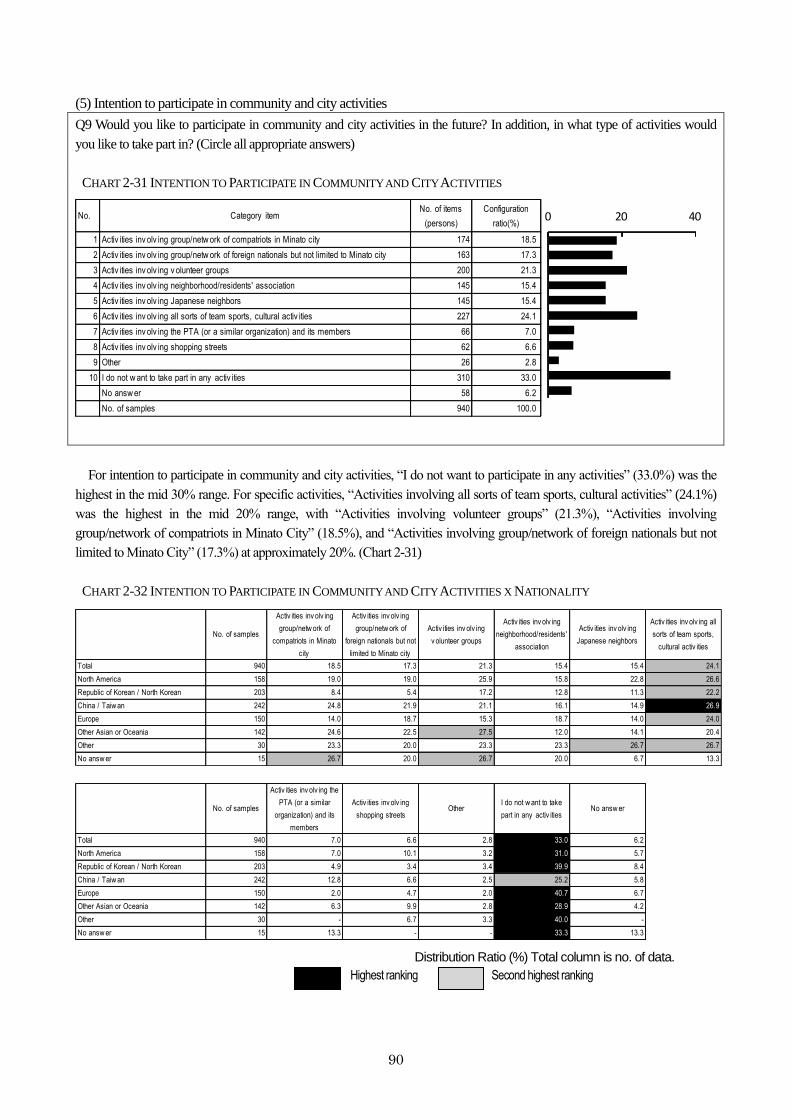
90
(5) Intention to participate in community and city activities
Q9 Would you like to participate in community and city activities in the future? In addition, in what type of activities would
you like to take part in? (Circle all appropriate answers)
CHART 2-31 INTENTION TO PARTICIPATE IN COMMUNITY AND CITY ACTIVITIES
No. Category itemNo. of items
(persons)
Configuration
ratio(%)
1 Activ ities inv olv ing group/netw ork of compatriots in Minato city 174 18.5
2 Activ ities inv olv ing group/netw ork of foreign nationals but not limited to Minato city 163 17.3
3 Activ ities inv olv ing v olunteer groups 200 21.3
4 Activ ities inv olv ing neighborhood/residents' association 145 15.4
5 Activ ities inv olv ing Japanese neighbors 145 15.4
6 Activ ities inv olv ing all sorts of team sports, cultural activ ities 227 24.1
7 Activ ities inv olv ing the PTA (or a similar organization) and its members 66 7.0
8 Activ ities inv olv ing shopping streets 62 6.6
9 Other 26 2.8
10 I do not w ant to take part in any activ ities 310 33.0
No answ er 58 6.2
No. of samples 940 100.0
0 20 40
For intention to participate in community and city activities, “I do not want to participate in any activities” (33.0%) was the
highest in the mid 30% range. For specific activities, “Activities involving all sorts of team sports, cultural activities” (24.1%)
was the highest in the mid 20% range, with “Activities involving volunteer groups” (21.3%), “Activities involving
group/network of compatriots in Minato City” (18.5%), and “Activities involving group/network of foreign nationals but not
limited to Minato City” (17.3%) at approximately 20%. (Chart 2-31)
CHART 2-32 INTENTION TO PARTICIPATE IN COMMUNITY AND CITY ACTIVITIES X NATIONALITY
No. of samples
Activ ities inv olv ing
group/netw ork of
compatriots in Minato
city
Activ ities inv olv ing
group/netw ork of
foreign nationals but not
limited to Minato city
Activ ities inv olv ing
v olunteer groups
Activ ities inv olv ing
neighborhood/residents'
association
Activ ities inv olv ing
Japanese neighbors
Activ ities inv olv ing all
sorts of team sports,
cultural activ ities
Total 940 18.5 17.3 21.3 15.4 15.4 24.1
North America 158 19.0 19.0 25.9 15.8 22.8 26.6
Republic of Korean / North Korean 203 8.4 5.4 17.2 12.8 11.3 22.2
China / Taiw an 242 24.8 21.9 21.1 16.1 14.9 26.9
Europe 150 14.0 18.7 15.3 18.7 14.0 24.0
Other Asian or Oceania 142 24.6 22.5 27.5 12.0 14.1 20.4
Other 30 23.3 20.0 23.3 23.3 26.7 26.7
No answ er 15 26.7 20.0 26.7 20.0 6.7 13.3
No. of samples
Activ ities inv olv ing the
PTA (or a similar
organization) and its
members
Activ ities inv olv ing
shopping streetsOther
I do not w ant to take
part in any activ itiesNo answ er
Total 940 7.0 6.6 2.8 33.0 6.2
North America 158 7.0 10.1 3.2 31.0 5.7
Republic of Korean / North Korean 203 4.9 3.4 3.4 39.9 8.4
China / Taiw an 242 12.8 6.6 2.5 25.2 5.8
Europe 150 2.0 4.7 2.0 40.7 6.7
Other Asian or Oceania 142 6.3 9.9 2.8 28.9 4.2
Other 30 - 6.7 3.3 40.0 -
No answ er 15 13.3 - - 33.3 13.3
Distribution Ratio (%) Total column is no. of data.
Second highest ranking Highest ranking
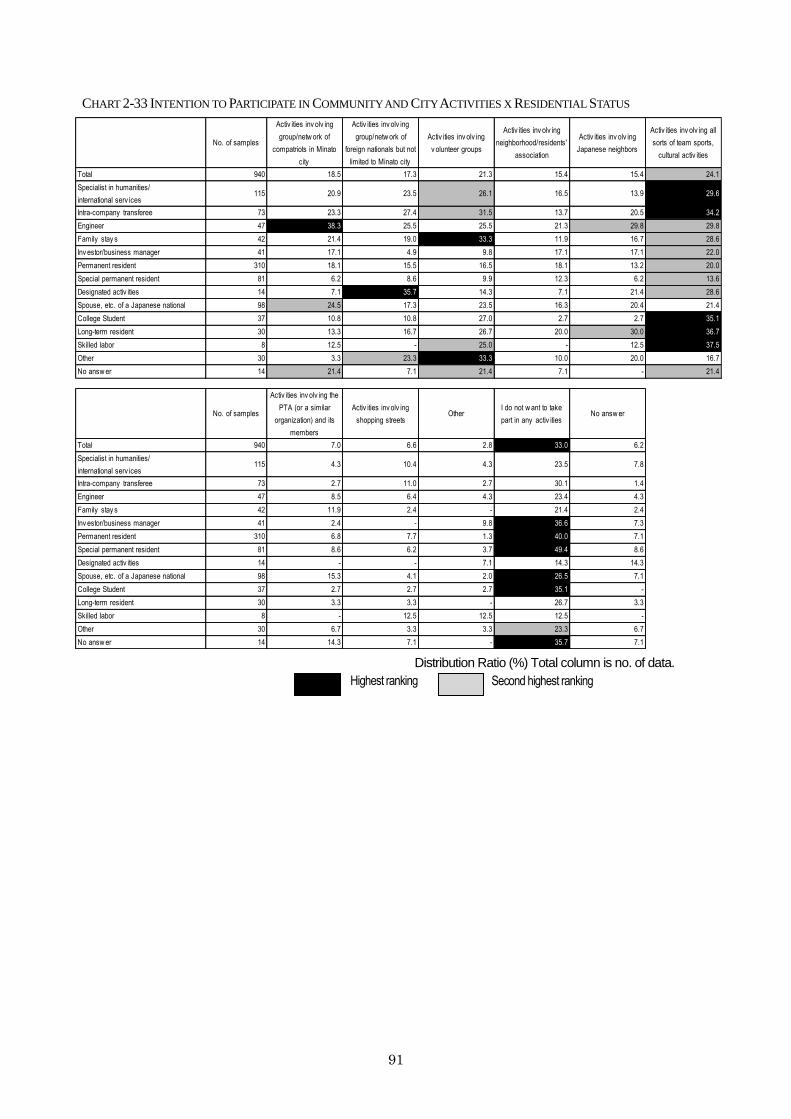
91
CHART 2-33 INTENTION TO PARTICIPATE IN COMMUNITY AND CITY ACTIVITIES X RESIDENTIAL STATUS
No. of samples
Activ ities inv olv ing
group/netw ork of
compatriots in Minato
city
Activ ities inv olv ing
group/netw ork of
foreign nationals but not
limited to Minato city
Activ ities inv olv ing
v olunteer groups
Activ ities inv olv ing
neighborhood/residents'
association
Activ ities inv olv ing
Japanese neighbors
Activ ities inv olv ing all
sorts of team sports,
cultural activ ities
Total 940 18.5 17.3 21.3 15.4 15.4 24.1
Specialist in humanities/
international serv ices115 20.9 23.5 26.1 16.5 13.9 29.6
Intra-company transferee 73 23.3 27.4 31.5 13.7 20.5 34.2
Engineer 47 38.3 25.5 25.5 21.3 29.8 29.8
Family stay s 42 21.4 19.0 33.3 11.9 16.7 28.6
Inv estor/business manager 41 17.1 4.9 9.8 17.1 17.1 22.0
Permanent resident 310 18.1 15.5 16.5 18.1 13.2 20.0
Special permanent resident 81 6.2 8.6 9.9 12.3 6.2 13.6
Designated activ ities 14 7.1 35.7 14.3 7.1 21.4 28.6
Spouse, etc. of a Japanese national 98 24.5 17.3 23.5 16.3 20.4 21.4
College Student 37 10.8 10.8 27.0 2.7 2.7 35.1
Long-term resident 30 13.3 16.7 26.7 20.0 30.0 36.7
Skilled labor 8 12.5 - 25.0 - 12.5 37.5
Other 30 3.3 23.3 33.3 10.0 20.0 16.7
No answ er 14 21.4 7.1 21.4 7.1 - 21.4
No. of samples
Activ ities inv olv ing the
PTA (or a similar
organization) and its
members
Activ ities inv olv ing
shopping streetsOther
I do not w ant to take
part in any activ itiesNo answ er
Total 940 7.0 6.6 2.8 33.0 6.2
Specialist in humanities/
international serv ices115 4.3 10.4 4.3 23.5 7.8
Intra-company transferee 73 2.7 11.0 2.7 30.1 1.4
Engineer 47 8.5 6.4 4.3 23.4 4.3
Family stay s 42 11.9 2.4 - 21.4 2.4
Inv estor/business manager 41 2.4 - 9.8 36.6 7.3
Permanent resident 310 6.8 7.7 1.3 40.0 7.1
Special permanent resident 81 8.6 6.2 3.7 49.4 8.6
Designated activ ities 14 - - 7.1 14.3 14.3
Spouse, etc. of a Japanese national 98 15.3 4.1 2.0 26.5 7.1
College Student 37 2.7 2.7 2.7 35.1 -
Long-term resident 30 3.3 3.3 - 26.7 3.3
Skilled labor 8 - 12.5 12.5 12.5 -
Other 30 6.7 3.3 3.3 23.3 6.7
No answ er 14 14.3 7.1 - 35.7 7.1
Distribution Ratio (%) Total column is no. of data.
Second highest ranking Highest ranking
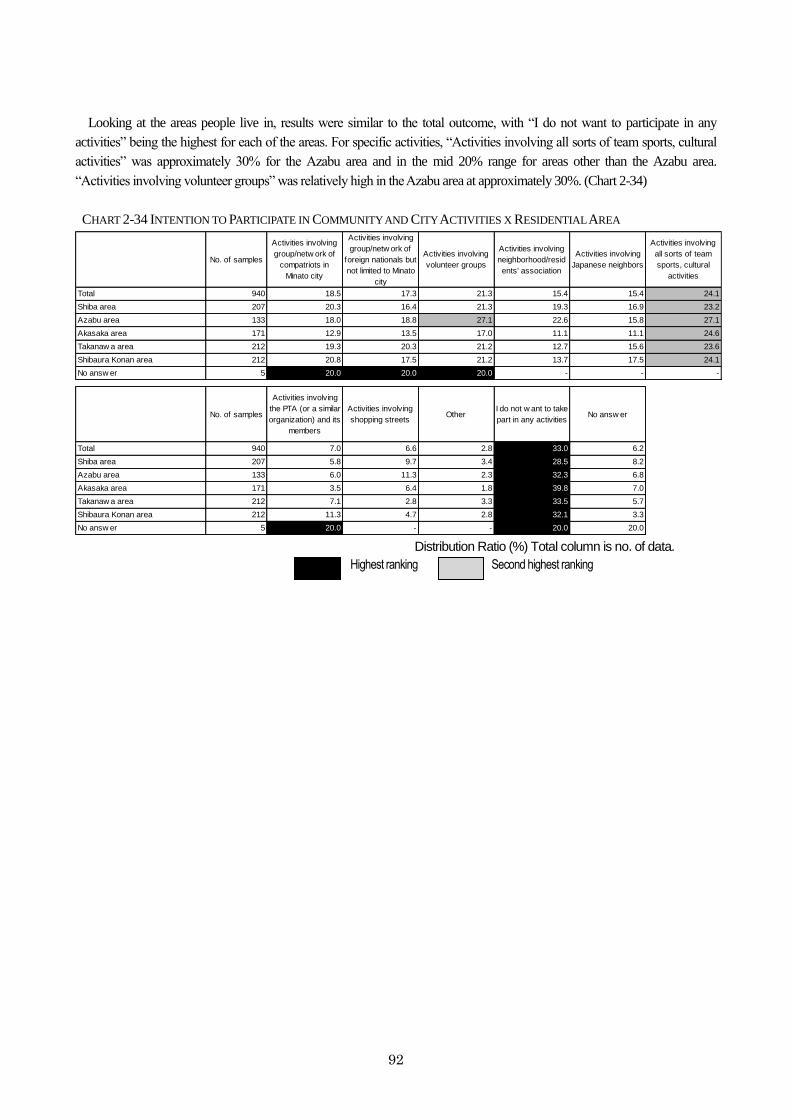
92
Looking at the areas people live in, results were similar to the total outcome, with “I do not want to participate in any
activities” being the highest for each of the areas. For specific activities, “Activities involving all sorts of team sports, cultural
activities” was approximately 30% for the Azabu area and in the mid 20% range for areas other than the Azabu area.
“Activities involving volunteer groups” was relatively high in the Azabu area at approximately 30%. (Chart 2-34)
CHART 2-34 INTENTION TO PARTICIPATE IN COMMUNITY AND CITY ACTIVITIES X RESIDENTIAL AREA
No. of samples
Activities involving
group/netw ork of
compatriots in
Minato city
Activities involving
group/netw ork of
foreign nationals but
not limited to Minato
city
Activities involving
volunteer groups
Activities involving
neighborhood/resid
ents' association
Activities involving
Japanese neighbors
Activities involving
all sorts of team
sports, cultural
activities
Total 940 18.5 17.3 21.3 15.4 15.4 24.1
Shiba area 207 20.3 16.4 21.3 19.3 16.9 23.2
Azabu area 133 18.0 18.8 27.1 22.6 15.8 27.1
Akasaka area 171 12.9 13.5 17.0 11.1 11.1 24.6
Takanaw a area 212 19.3 20.3 21.2 12.7 15.6 23.6
Shibaura Konan area 212 20.8 17.5 21.2 13.7 17.5 24.1
No answ er 5 20.0 20.0 20.0 - - -
No. of samples
Activities involving
the PTA (or a similar
organization) and its
members
Activities involving
shopping streetsOther
I do not w ant to take
part in any activitiesNo answ er
Total 940 7.0 6.6 2.8 33.0 6.2
Shiba area 207 5.8 9.7 3.4 28.5 8.2
Azabu area 133 6.0 11.3 2.3 32.3 6.8
Akasaka area 171 3.5 6.4 1.8 39.8 7.0
Takanaw a area 212 7.1 2.8 3.3 33.5 5.7
Shibaura Konan area 212 11.3 4.7 2.8 32.1 3.3
No answ er 5 20.0 - - 20.0 20.0 Distribution Ratio (%) Total column is no. of data.
Second highest ranking Highest ranking
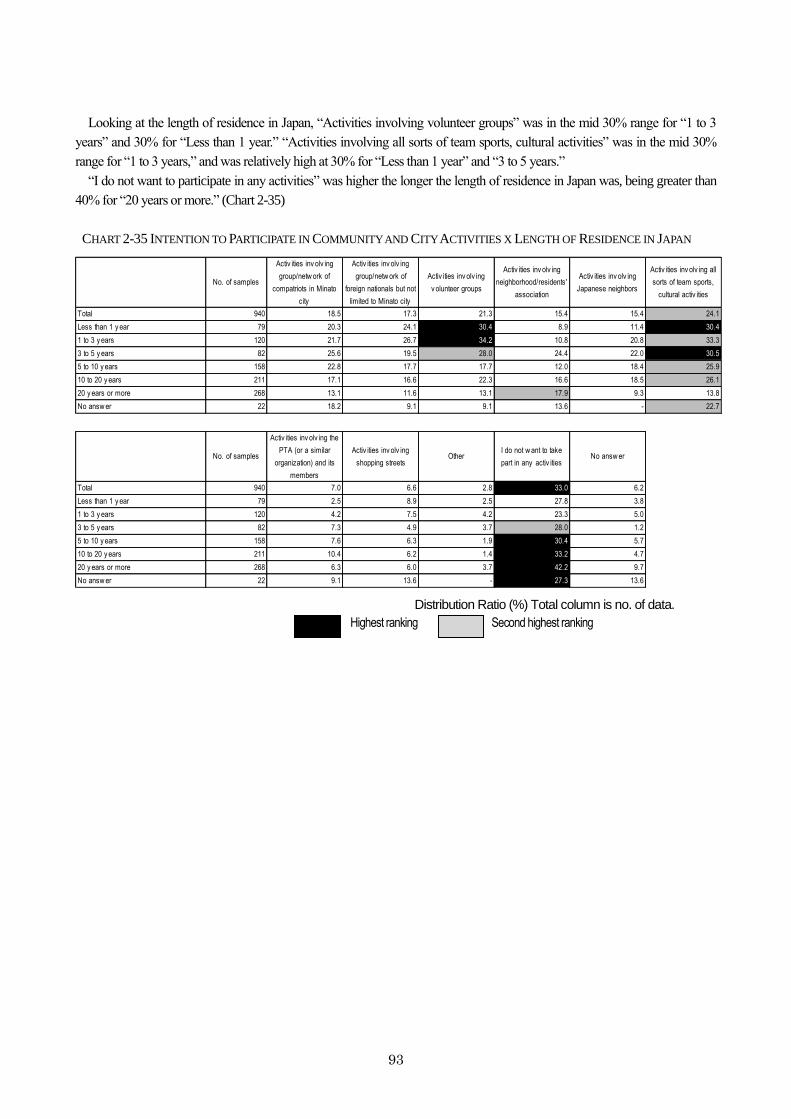
93
Looking at the length of residence in Japan, “Activities involving volunteer groups” was in the mid 30% range for “1 to 3
years” and 30% for “Less than 1 year.” “Activities involving all sorts of team sports, cultural activities” was in the mid 30%
range for “1 to 3 years,” and was relatively high at 30% for “Less than 1 year” and “3 to 5 years.”
“I do not want to participate in any activities” was higher the longer the length of residence in Japan was, being greater than
40% for “20 years or more.” (Chart 2-35)
CHART 2-35 INTENTION TO PARTICIPATE IN COMMUNITY AND CITY ACTIVITIES X LENGTH OF RESIDENCE IN JAPAN
No. of samples
Activ ities inv olv ing
group/netw ork of
compatriots in Minato
city
Activ ities inv olv ing
group/netw ork of
foreign nationals but not
limited to Minato city
Activ ities inv olv ing
v olunteer groups
Activ ities inv olv ing
neighborhood/residents'
association
Activ ities inv olv ing
Japanese neighbors
Activ ities inv olv ing all
sorts of team sports,
cultural activ ities
Total 940 18.5 17.3 21.3 15.4 15.4 24.1
Less than 1 y ear 79 20.3 24.1 30.4 8.9 11.4 30.4
1 to 3 y ears 120 21.7 26.7 34.2 10.8 20.8 33.3
3 to 5 y ears 82 25.6 19.5 28.0 24.4 22.0 30.5
5 to 10 y ears 158 22.8 17.7 17.7 12.0 18.4 25.9
10 to 20 y ears 211 17.1 16.6 22.3 16.6 18.5 26.1
20 y ears or more 268 13.1 11.6 13.1 17.9 9.3 13.8
No answ er 22 18.2 9.1 9.1 13.6 - 22.7
No. of samples
Activ ities inv olv ing the
PTA (or a similar
organization) and its
members
Activ ities inv olv ing
shopping streetsOther
I do not w ant to take
part in any activ itiesNo answ er
Total 940 7.0 6.6 2.8 33.0 6.2
Less than 1 y ear 79 2.5 8.9 2.5 27.8 3.8
1 to 3 y ears 120 4.2 7.5 4.2 23.3 5.0
3 to 5 y ears 82 7.3 4.9 3.7 28.0 1.2
5 to 10 y ears 158 7.6 6.3 1.9 30.4 5.7
10 to 20 y ears 211 10.4 6.2 1.4 33.2 4.7
20 y ears or more 268 6.3 6.0 3.7 42.2 9.7
No answ er 22 9.1 13.6 - 27.3 13.6
Distribution Ratio (%) Total column is no. of data.
Second highest ranking Highest ranking
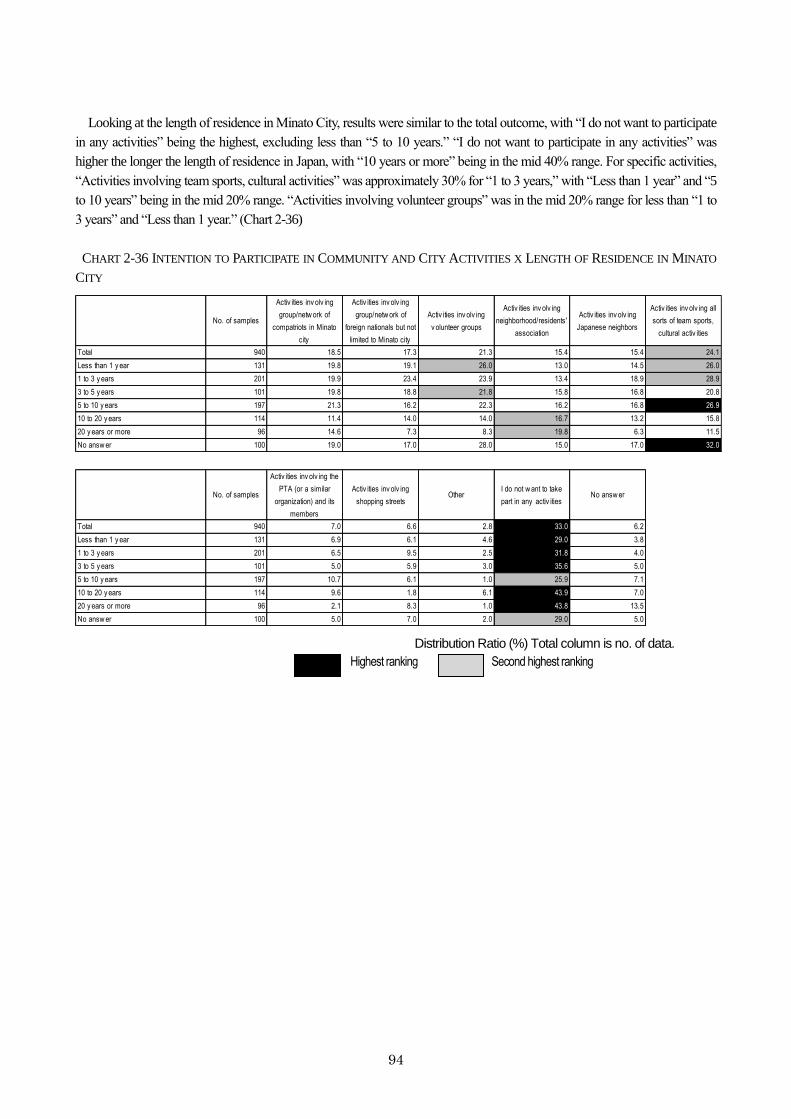
94
Looking at the length of residence in Minato City, results were similar to the total outcome, with “I do not want to participate
in any activities” being the highest, excluding less than “5 to 10 years.” “I do not want to participate in any activities” was
higher the longer the length of residence in Japan, with “10 years or more” being in the mid 40% range. For specific activities,
“Activities involving team sports, cultural activities” was approximately 30% for “1 to 3 years,” with “Less than 1 year” and “5
to 10 years” being in the mid 20% range. “Activities involving volunteer groups” was in the mid 20% range for less than “1 to
3 years” and “Less than 1 year.” (Chart 2-36)
CHART 2-36 INTENTION TO PARTICIPATE IN COMMUNITY AND CITY ACTIVITIES X LENGTH OF RESIDENCE IN MINATO
CITY
No. of samples
Activ ities inv olv ing
group/netw ork of
compatriots in Minato
city
Activ ities inv olv ing
group/netw ork of
foreign nationals but not
limited to Minato city
Activ ities inv olv ing
v olunteer groups
Activ ities inv olv ing
neighborhood/residents'
association
Activ ities inv olv ing
Japanese neighbors
Activ ities inv olv ing all
sorts of team sports,
cultural activ ities
Total 940 18.5 17.3 21.3 15.4 15.4 24.1
Less than 1 y ear 131 19.8 19.1 26.0 13.0 14.5 26.0
1 to 3 y ears 201 19.9 23.4 23.9 13.4 18.9 28.9
3 to 5 y ears 101 19.8 18.8 21.8 15.8 16.8 20.8
5 to 10 y ears 197 21.3 16.2 22.3 16.2 16.8 26.9
10 to 20 y ears 114 11.4 14.0 14.0 16.7 13.2 15.8
20 y ears or more 96 14.6 7.3 8.3 19.8 6.3 11.5
No answ er 100 19.0 17.0 28.0 15.0 17.0 32.0
No. of samples
Activ ities inv olv ing the
PTA (or a similar
organization) and its
members
Activ ities inv olv ing
shopping streetsOther
I do not w ant to take
part in any activ itiesNo answ er
Total 940 7.0 6.6 2.8 33.0 6.2
Less than 1 y ear 131 6.9 6.1 4.6 29.0 3.8
1 to 3 y ears 201 6.5 9.5 2.5 31.8 4.0
3 to 5 y ears 101 5.0 5.9 3.0 35.6 5.0
5 to 10 y ears 197 10.7 6.1 1.0 25.9 7.1
10 to 20 y ears 114 9.6 1.8 6.1 43.9 7.0
20 y ears or more 96 2.1 8.3 1.0 43.8 13.5
No answ er 100 5.0 7.0 2.0 29.0 5.0
Distribution Ratio (%) Total column is no. of data.
Second highest ranking Highest ranking
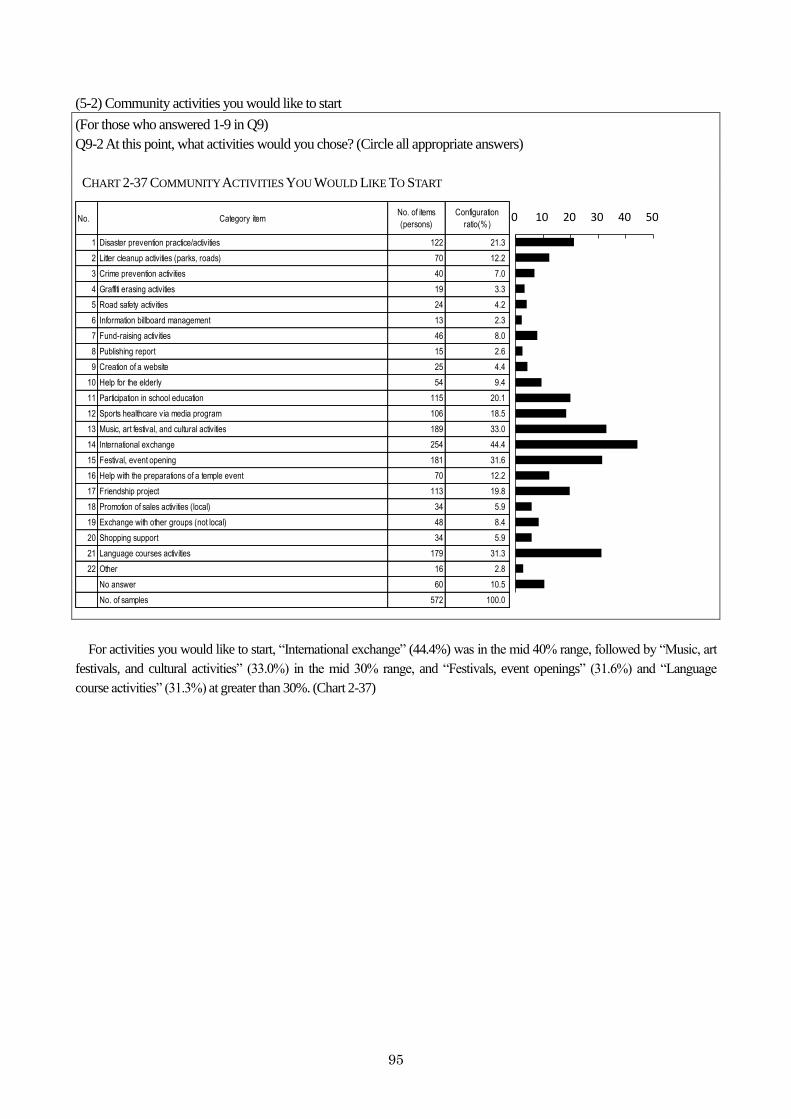
95
(5-2) Community activities you would like to start
(For those who answered 1-9 in Q9)
Q9-2 At this point, what activities would you chose? (Circle all appropriate answers)
CHART 2-37 COMMUNITY ACTIVITIES YOU WOULD LIKE TO START
No. Category itemNo. of items
(persons)
Configuration
ratio(%)
1 Disaster prevention practice/activities 122 21.3
2 Litter cleanup activities (parks, roads) 70 12.2
3 Crime prevention activities 40 7.0
4 Graffiti erasing activities 19 3.3
5 Road safety activities 24 4.2
6 Information billboard management 13 2.3
7 Fund-raising activities 46 8.0
8 Publishing report 15 2.6
9 Creation of a website 25 4.4
10 Help for the elderly 54 9.4
11 Participation in school education 115 20.1
12 Sports healthcare via media program 106 18.5
13 Music, art festival, and cultural activities 189 33.0
14 International exchange 254 44.4
15 Festival, event opening 181 31.6
16 Help with the preparations of a temple event 70 12.2
17 Friendship project 113 19.8
18 Promotion of sales activities (local) 34 5.9
19 Exchange with other groups (not local) 48 8.4
20 Shopping support 34 5.9
21 Language courses activities 179 31.3
22 Other 16 2.8
No answer 60 10.5
No. of samples 572 100.0
0 10 20 30 40 50
For activities you would like to start, “International exchange” (44.4%) was in the mid 40% range, followed by “Music, art
festivals, and cultural activities” (33.0%) in the mid 30% range, and “Festivals, event openings” (31.6%) and “Language
course activities” (31.3%) at greater than 30%. (Chart 2-37)
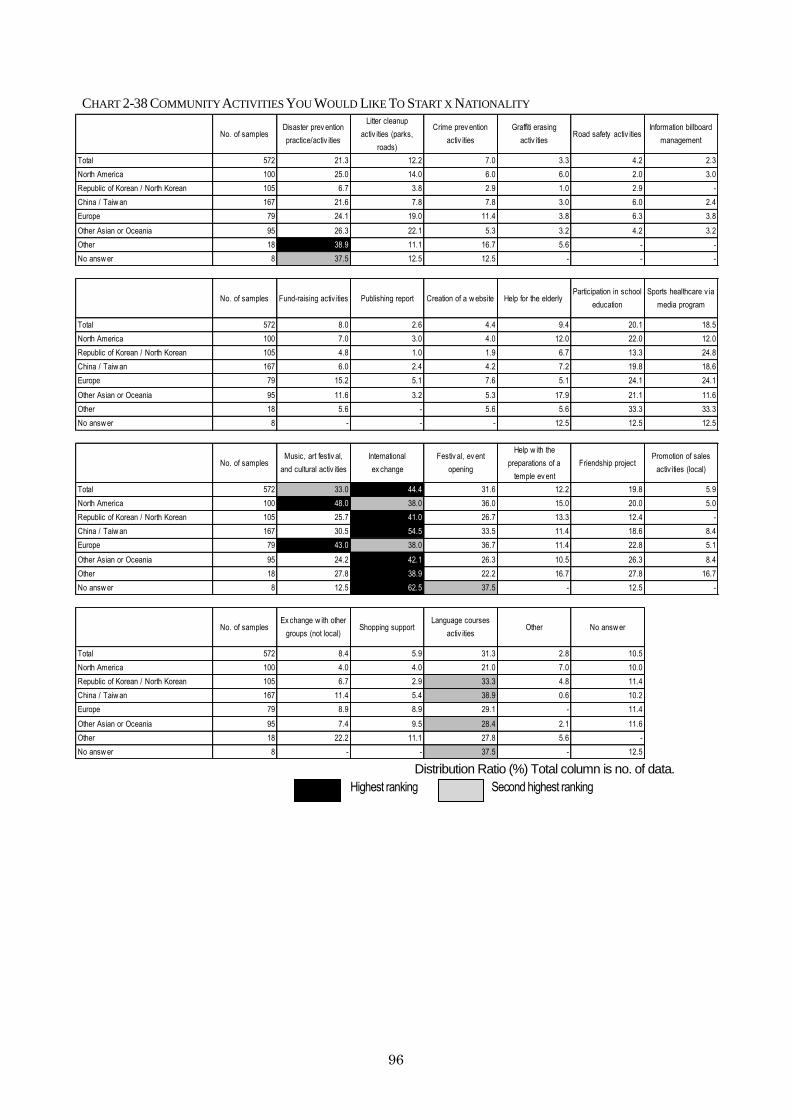
96
CHART 2-38 COMMUNITY ACTIVITIES YOU WOULD LIKE TO START X NATIONALITY
No. of samplesDisaster prev ention
practice/activ ities
Litter cleanup
activ ities (parks,
roads)
Crime prev ention
activ ities
Graffiti erasing
activ itiesRoad safety activ ities
Information billboard
management
Total 572 21.3 12.2 7.0 3.3 4.2 2.3
North America 100 25.0 14.0 6.0 6.0 2.0 3.0
Republic of Korean / North Korean 105 6.7 3.8 2.9 1.0 2.9 -
China / Taiw an 167 21.6 7.8 7.8 3.0 6.0 2.4
Europe 79 24.1 19.0 11.4 3.8 6.3 3.8
Other Asian or Oceania 95 26.3 22.1 5.3 3.2 4.2 3.2
Other 18 38.9 11.1 16.7 5.6 - -
No answ er 8 37.5 12.5 12.5 - - -
No. of samples Fund-raising activ ities Publishing report Creation of a w ebsite Help for the elderlyParticipation in school
education
Sports healthcare v ia
media program
Total 572 8.0 2.6 4.4 9.4 20.1 18.5
North America 100 7.0 3.0 4.0 12.0 22.0 12.0
Republic of Korean / North Korean 105 4.8 1.0 1.9 6.7 13.3 24.8
China / Taiw an 167 6.0 2.4 4.2 7.2 19.8 18.6
Europe 79 15.2 5.1 7.6 5.1 24.1 24.1
Other Asian or Oceania 95 11.6 3.2 5.3 17.9 21.1 11.6
Other 18 5.6 - 5.6 5.6 33.3 33.3
No answ er 8 - - - 12.5 12.5 12.5
No. of samplesMusic, art festiv al,
and cultural activ ities
International
ex change
Festiv al, ev ent
opening
Help w ith the
preparations of a
temple ev ent
Friendship projectPromotion of sales
activ ities (local)
Total 572 33.0 44.4 31.6 12.2 19.8 5.9
North America 100 48.0 38.0 36.0 15.0 20.0 5.0
Republic of Korean / North Korean 105 25.7 41.0 26.7 13.3 12.4 -
China / Taiw an 167 30.5 54.5 33.5 11.4 18.6 8.4
Europe 79 43.0 38.0 36.7 11.4 22.8 5.1
Other Asian or Oceania 95 24.2 42.1 26.3 10.5 26.3 8.4
Other 18 27.8 38.9 22.2 16.7 27.8 16.7
No answ er 8 12.5 62.5 37.5 - 12.5 -
No. of samplesEx change w ith other
groups (not local)Shopping support
Language courses
activ itiesOther No answ er
Total 572 8.4 5.9 31.3 2.8 10.5
North America 100 4.0 4.0 21.0 7.0 10.0
Republic of Korean / North Korean 105 6.7 2.9 33.3 4.8 11.4
China / Taiw an 167 11.4 5.4 38.9 0.6 10.2
Europe 79 8.9 8.9 29.1 - 11.4
Other Asian or Oceania 95 7.4 9.5 28.4 2.1 11.6
Other 18 22.2 11.1 27.8 5.6 -
No answ er 8 - - 37.5 - 12.5 Distribution Ratio (%) Total column is no. of data.
Second highest ranking Highest ranking
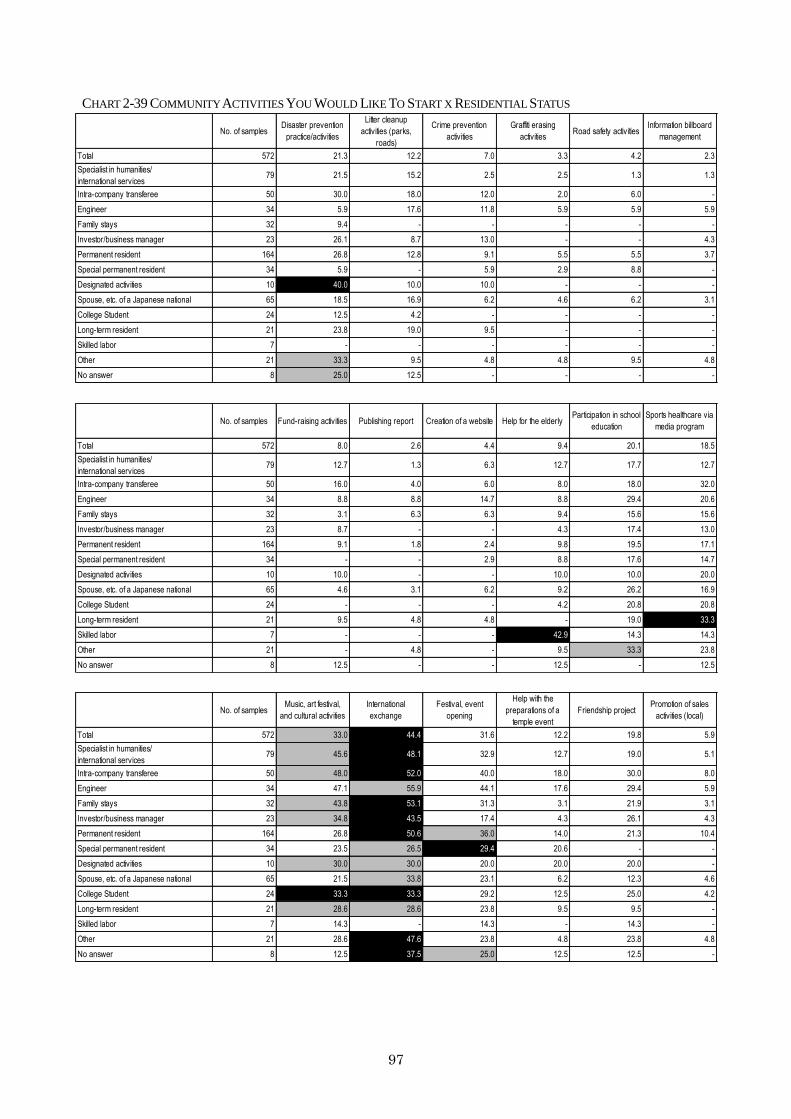
97
CHART 2-39 COMMUNITY ACTIVITIES YOU WOULD LIKE TO START X RESIDENTIAL STATUS
No. of samplesDisaster prevention
practice/activities
Litter cleanup
activities (parks,
roads)
Crime prevention
activities
Graffiti erasing
activitiesRoad safety activities
Information billboard
management
Total 572 21.3 12.2 7.0 3.3 4.2 2.3
Specialist in humanities/
international services79 21.5 15.2 2.5 2.5 1.3 1.3
Intra-company transferee 50 30.0 18.0 12.0 2.0 6.0 -
Engineer 34 5.9 17.6 11.8 5.9 5.9 5.9
Family stays 32 9.4 - - - - -
Investor/business manager 23 26.1 8.7 13.0 - - 4.3
Permanent resident 164 26.8 12.8 9.1 5.5 5.5 3.7
Special permanent resident 34 5.9 - 5.9 2.9 8.8 -
Designated activities 10 40.0 10.0 10.0 - - -
Spouse, etc. of a Japanese national 65 18.5 16.9 6.2 4.6 6.2 3.1
College Student 24 12.5 4.2 - - - -
Long-term resident 21 23.8 19.0 9.5 - - -
Skilled labor 7 - - - - - -
Other 21 33.3 9.5 4.8 4.8 9.5 4.8
No answer 8 25.0 12.5 - - - -
No. of samples Fund-raising activities Publishing report Creation of a website Help for the elderlyParticipation in school
education
Sports healthcare via
media program
Total 572 8.0 2.6 4.4 9.4 20.1 18.5
Specialist in humanities/
international services79 12.7 1.3 6.3 12.7 17.7 12.7
Intra-company transferee 50 16.0 4.0 6.0 8.0 18.0 32.0
Engineer 34 8.8 8.8 14.7 8.8 29.4 20.6
Family stays 32 3.1 6.3 6.3 9.4 15.6 15.6
Investor/business manager 23 8.7 - - 4.3 17.4 13.0
Permanent resident 164 9.1 1.8 2.4 9.8 19.5 17.1
Special permanent resident 34 - - 2.9 8.8 17.6 14.7
Designated activities 10 10.0 - - 10.0 10.0 20.0
Spouse, etc. of a Japanese national 65 4.6 3.1 6.2 9.2 26.2 16.9
College Student 24 - - - 4.2 20.8 20.8
Long-term resident 21 9.5 4.8 4.8 - 19.0 33.3
Skilled labor 7 - - - 42.9 14.3 14.3
Other 21 - 4.8 - 9.5 33.3 23.8
No answer 8 12.5 - - 12.5 - 12.5
No. of samplesMusic, art festival,
and cultural activities
International
exchange
Festival, event
opening
Help with the
preparations of a
temple event
Friendship projectPromotion of sales
activities (local)
Total 572 33.0 44.4 31.6 12.2 19.8 5.9
Specialist in humanities/
international services79 45.6 48.1 32.9 12.7 19.0 5.1
Intra-company transferee 50 48.0 52.0 40.0 18.0 30.0 8.0
Engineer 34 47.1 55.9 44.1 17.6 29.4 5.9
Family stays 32 43.8 53.1 31.3 3.1 21.9 3.1
Investor/business manager 23 34.8 43.5 17.4 4.3 26.1 4.3
Permanent resident 164 26.8 50.6 36.0 14.0 21.3 10.4
Special permanent resident 34 23.5 26.5 29.4 20.6 - -
Designated activities 10 30.0 30.0 20.0 20.0 20.0 -
Spouse, etc. of a Japanese national 65 21.5 33.8 23.1 6.2 12.3 4.6
College Student 24 33.3 33.3 29.2 12.5 25.0 4.2
Long-term resident 21 28.6 28.6 23.8 9.5 9.5 -
Skilled labor 7 14.3 - 14.3 - 14.3 -
Other 21 28.6 47.6 23.8 4.8 23.8 4.8
No answer 8 12.5 37.5 25.0 12.5 12.5 -
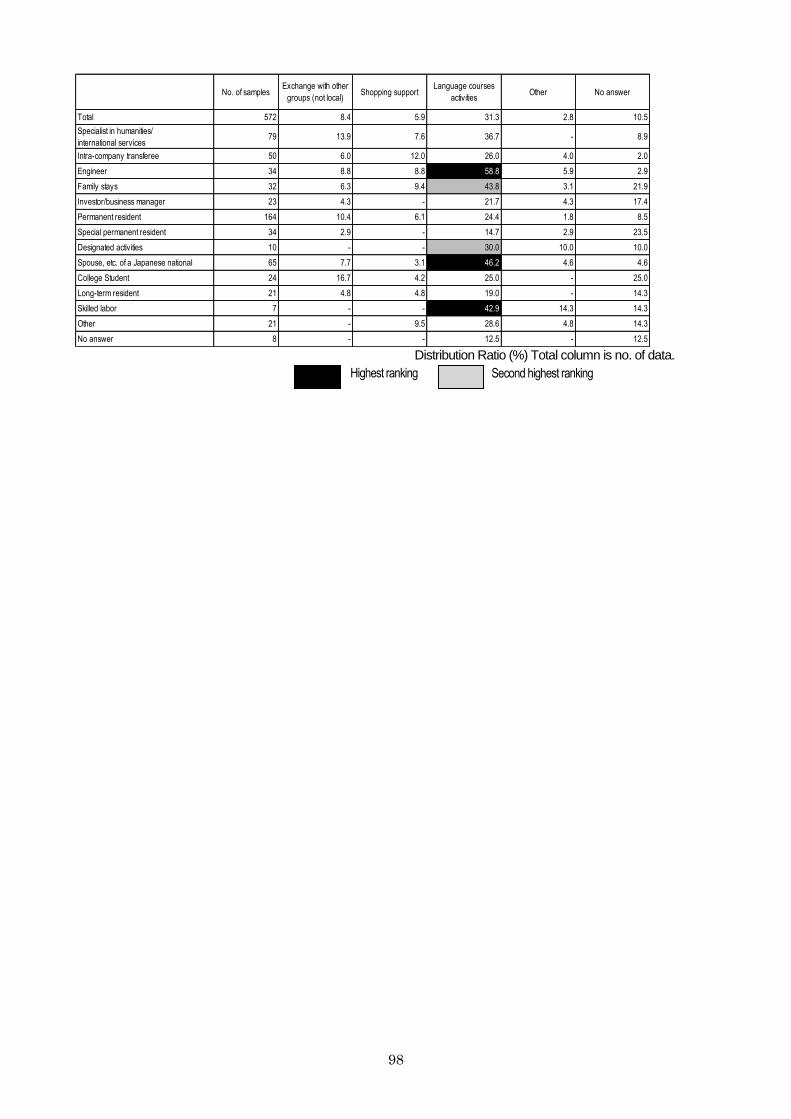
98
No. of samplesExchange with other
groups (not local)Shopping support
Language courses
activitiesOther No answer
Total 572 8.4 5.9 31.3 2.8 10.5
Specialist in humanities/
international services79 13.9 7.6 36.7 - 8.9
Intra-company transferee 50 6.0 12.0 26.0 4.0 2.0
Engineer 34 8.8 8.8 58.8 5.9 2.9
Family stays 32 6.3 9.4 43.8 3.1 21.9
Investor/business manager 23 4.3 - 21.7 4.3 17.4
Permanent resident 164 10.4 6.1 24.4 1.8 8.5
Special permanent resident 34 2.9 - 14.7 2.9 23.5
Designated activities 10 - - 30.0 10.0 10.0
Spouse, etc. of a Japanese national 65 7.7 3.1 46.2 4.6 4.6
College Student 24 16.7 4.2 25.0 - 25.0
Long-term resident 21 4.8 4.8 19.0 - 14.3
Skilled labor 7 - - 42.9 14.3 14.3
Other 21 - 9.5 28.6 4.8 14.3
No answer 8 - - 12.5 - 12.5 Distribution Ratio (%) Total column is no. of data.
Second highest ranking Highest ranking
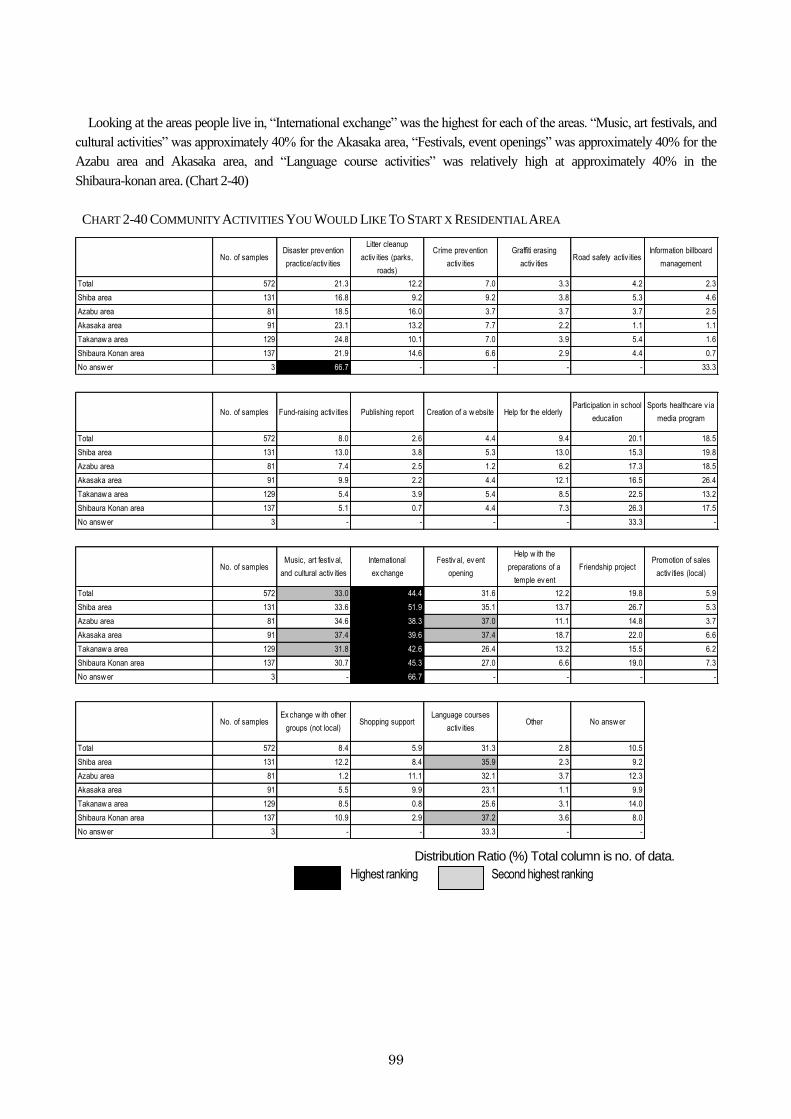
99
Looking at the areas people live in, “International exchange” was the highest for each of the areas. “Music, art festivals, and
cultural activities” was approximately 40% for the Akasaka area, “Festivals, event openings” was approximately 40% for the
Azabu area and Akasaka area, and “Language course activities” was relatively high at approximately 40% in the
Shibaura-konan area. (Chart 2-40)
CHART 2-40 COMMUNITY ACTIVITIES YOU WOULD LIKE TO START X RESIDENTIAL AREA
No. of samplesDisaster prev ention
practice/activ ities
Litter cleanup
activ ities (parks,
roads)
Crime prev ention
activ ities
Graffiti erasing
activ itiesRoad safety activ ities
Information billboard
management
Total 572 21.3 12.2 7.0 3.3 4.2 2.3
Shiba area 131 16.8 9.2 9.2 3.8 5.3 4.6
Azabu area 81 18.5 16.0 3.7 3.7 3.7 2.5
Akasaka area 91 23.1 13.2 7.7 2.2 1.1 1.1
Takanaw a area 129 24.8 10.1 7.0 3.9 5.4 1.6
Shibaura Konan area 137 21.9 14.6 6.6 2.9 4.4 0.7
No answ er 3 66.7 - - - - 33.3
No. of samples Fund-raising activ ities Publishing report Creation of a w ebsite Help for the elderlyParticipation in school
education
Sports healthcare v ia
media program
Total 572 8.0 2.6 4.4 9.4 20.1 18.5
Shiba area 131 13.0 3.8 5.3 13.0 15.3 19.8
Azabu area 81 7.4 2.5 1.2 6.2 17.3 18.5
Akasaka area 91 9.9 2.2 4.4 12.1 16.5 26.4
Takanaw a area 129 5.4 3.9 5.4 8.5 22.5 13.2
Shibaura Konan area 137 5.1 0.7 4.4 7.3 26.3 17.5
No answ er 3 - - - - 33.3 -
No. of samplesMusic, art festiv al,
and cultural activ ities
International
ex change
Festiv al, ev ent
opening
Help w ith the
preparations of a
temple ev ent
Friendship projectPromotion of sales
activ ities (local)
Total 572 33.0 44.4 31.6 12.2 19.8 5.9
Shiba area 131 33.6 51.9 35.1 13.7 26.7 5.3
Azabu area 81 34.6 38.3 37.0 11.1 14.8 3.7
Akasaka area 91 37.4 39.6 37.4 18.7 22.0 6.6
Takanaw a area 129 31.8 42.6 26.4 13.2 15.5 6.2
Shibaura Konan area 137 30.7 45.3 27.0 6.6 19.0 7.3
No answ er 3 - 66.7 - - - -
No. of samplesEx change w ith other
groups (not local)Shopping support
Language courses
activ itiesOther No answ er
Total 572 8.4 5.9 31.3 2.8 10.5
Shiba area 131 12.2 8.4 35.9 2.3 9.2
Azabu area 81 1.2 11.1 32.1 3.7 12.3
Akasaka area 91 5.5 9.9 23.1 1.1 9.9
Takanaw a area 129 8.5 0.8 25.6 3.1 14.0
Shibaura Konan area 137 10.9 2.9 37.2 3.6 8.0
No answ er 3 - - 33.3 - -
Distribution Ratio (%) Total column is no. of data.
Second highest ranking Highest ranking
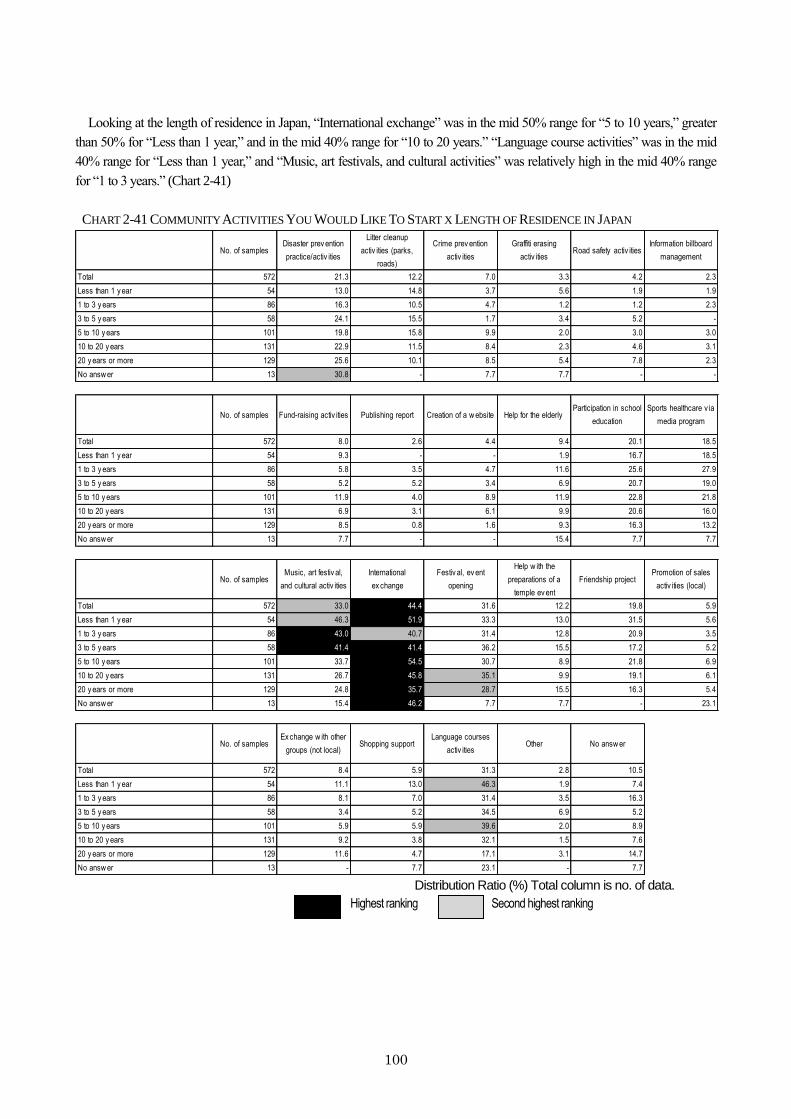
100
Looking at the length of residence in Japan, “International exchange” was in the mid 50% range for “5 to 10 years,” greater
than 50% for “Less than 1 year,” and in the mid 40% range for “10 to 20 years.” “Language course activities” was in the mid
40% range for “Less than 1 year,” and “Music, art festivals, and cultural activities” was relatively high in the mid 40% range
for “1 to 3 years.” (Chart 2-41)
CHART 2-41 COMMUNITY ACTIVITIES YOU WOULD LIKE TO START X LENGTH OF RESIDENCE IN JAPAN
No. of samplesDisaster prev ention
practice/activ ities
Litter cleanup
activ ities (parks,
roads)
Crime prev ention
activ ities
Graffiti erasing
activ itiesRoad safety activ ities
Information billboard
management
Total 572 21.3 12.2 7.0 3.3 4.2 2.3
Less than 1 y ear 54 13.0 14.8 3.7 5.6 1.9 1.9
1 to 3 y ears 86 16.3 10.5 4.7 1.2 1.2 2.3
3 to 5 y ears 58 24.1 15.5 1.7 3.4 5.2 -
5 to 10 y ears 101 19.8 15.8 9.9 2.0 3.0 3.0
10 to 20 y ears 131 22.9 11.5 8.4 2.3 4.6 3.1
20 y ears or more 129 25.6 10.1 8.5 5.4 7.8 2.3
No answ er 13 30.8 - 7.7 7.7 - -
No. of samples Fund-raising activ ities Publishing report Creation of a w ebsite Help for the elderlyParticipation in school
education
Sports healthcare v ia
media program
Total 572 8.0 2.6 4.4 9.4 20.1 18.5
Less than 1 y ear 54 9.3 - - 1.9 16.7 18.5
1 to 3 y ears 86 5.8 3.5 4.7 11.6 25.6 27.9
3 to 5 y ears 58 5.2 5.2 3.4 6.9 20.7 19.0
5 to 10 y ears 101 11.9 4.0 8.9 11.9 22.8 21.8
10 to 20 y ears 131 6.9 3.1 6.1 9.9 20.6 16.0
20 y ears or more 129 8.5 0.8 1.6 9.3 16.3 13.2
No answ er 13 7.7 - - 15.4 7.7 7.7
No. of samplesMusic, art festiv al,
and cultural activ ities
International
ex change
Festiv al, ev ent
opening
Help w ith the
preparations of a
temple ev ent
Friendship projectPromotion of sales
activ ities (local)
Total 572 33.0 44.4 31.6 12.2 19.8 5.9
Less than 1 y ear 54 46.3 51.9 33.3 13.0 31.5 5.6
1 to 3 y ears 86 43.0 40.7 31.4 12.8 20.9 3.5
3 to 5 y ears 58 41.4 41.4 36.2 15.5 17.2 5.2
5 to 10 y ears 101 33.7 54.5 30.7 8.9 21.8 6.9
10 to 20 y ears 131 26.7 45.8 35.1 9.9 19.1 6.1
20 y ears or more 129 24.8 35.7 28.7 15.5 16.3 5.4
No answ er 13 15.4 46.2 7.7 7.7 - 23.1
No. of samplesEx change w ith other
groups (not local)Shopping support
Language courses
activ itiesOther No answ er
Total 572 8.4 5.9 31.3 2.8 10.5
Less than 1 y ear 54 11.1 13.0 46.3 1.9 7.4
1 to 3 y ears 86 8.1 7.0 31.4 3.5 16.3
3 to 5 y ears 58 3.4 5.2 34.5 6.9 5.2
5 to 10 y ears 101 5.9 5.9 39.6 2.0 8.9
10 to 20 y ears 131 9.2 3.8 32.1 1.5 7.6
20 y ears or more 129 11.6 4.7 17.1 3.1 14.7
No answ er 13 - 7.7 23.1 - 7.7 Distribution Ratio (%) Total column is no. of data.
Second highest ranking Highest ranking
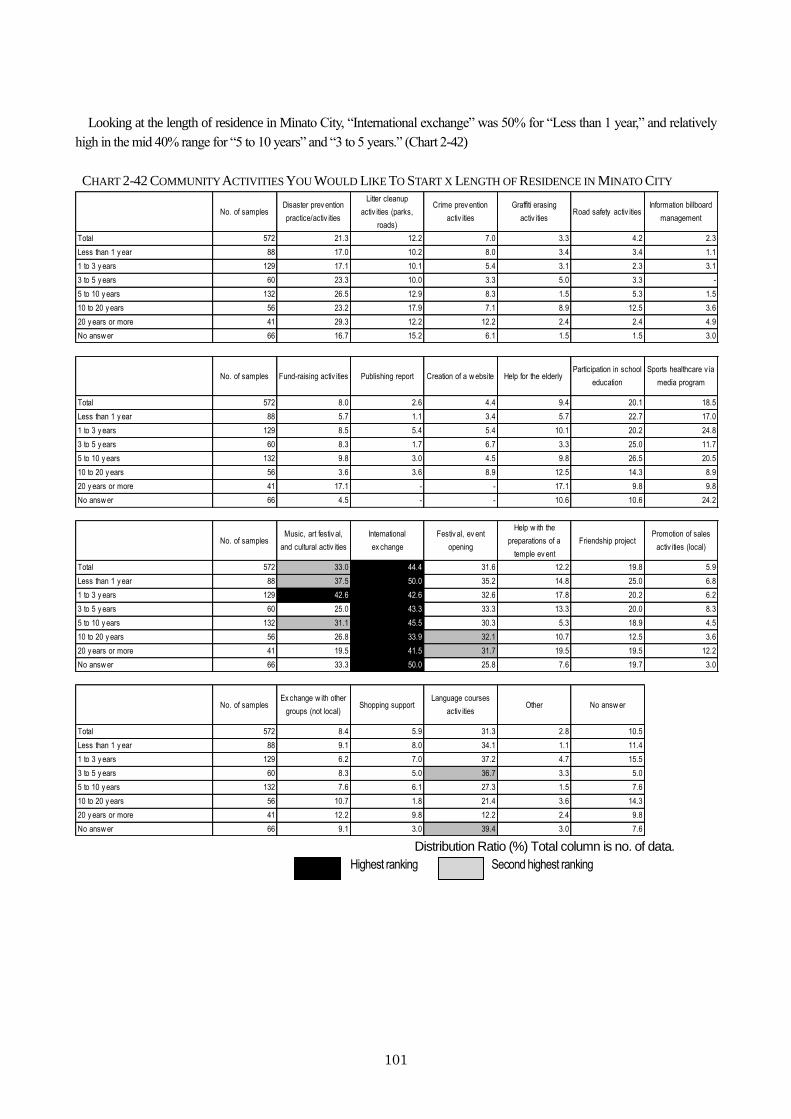
101
Looking at the length of residence in Minato City, “International exchange” was 50% for “Less than 1 year,” and relatively
high in the mid 40% range for “5 to 10 years” and “3 to 5 years.” (Chart 2-42)
CHART 2-42 COMMUNITY ACTIVITIES YOU WOULD LIKE TO START X LENGTH OF RESIDENCE IN MINATO CITY
No. of samplesDisaster prev ention
practice/activ ities
Litter cleanup
activ ities (parks,
roads)
Crime prev ention
activ ities
Graffiti erasing
activ itiesRoad safety activ ities
Information billboard
management
Total 572 21.3 12.2 7.0 3.3 4.2 2.3
Less than 1 y ear 88 17.0 10.2 8.0 3.4 3.4 1.1
1 to 3 y ears 129 17.1 10.1 5.4 3.1 2.3 3.1
3 to 5 y ears 60 23.3 10.0 3.3 5.0 3.3 -
5 to 10 y ears 132 26.5 12.9 8.3 1.5 5.3 1.5
10 to 20 y ears 56 23.2 17.9 7.1 8.9 12.5 3.6
20 y ears or more 41 29.3 12.2 12.2 2.4 2.4 4.9
No answ er 66 16.7 15.2 6.1 1.5 1.5 3.0
No. of samples Fund-raising activ ities Publishing report Creation of a w ebsite Help for the elderlyParticipation in school
education
Sports healthcare v ia
media program
Total 572 8.0 2.6 4.4 9.4 20.1 18.5
Less than 1 y ear 88 5.7 1.1 3.4 5.7 22.7 17.0
1 to 3 y ears 129 8.5 5.4 5.4 10.1 20.2 24.8
3 to 5 y ears 60 8.3 1.7 6.7 3.3 25.0 11.7
5 to 10 y ears 132 9.8 3.0 4.5 9.8 26.5 20.5
10 to 20 y ears 56 3.6 3.6 8.9 12.5 14.3 8.9
20 y ears or more 41 17.1 - - 17.1 9.8 9.8
No answ er 66 4.5 - - 10.6 10.6 24.2
No. of samplesMusic, art festiv al,
and cultural activ ities
International
ex change
Festiv al, ev ent
opening
Help w ith the
preparations of a
temple ev ent
Friendship projectPromotion of sales
activ ities (local)
Total 572 33.0 44.4 31.6 12.2 19.8 5.9
Less than 1 y ear 88 37.5 50.0 35.2 14.8 25.0 6.8
1 to 3 y ears 129 42.6 42.6 32.6 17.8 20.2 6.2
3 to 5 y ears 60 25.0 43.3 33.3 13.3 20.0 8.3
5 to 10 y ears 132 31.1 45.5 30.3 5.3 18.9 4.5
10 to 20 y ears 56 26.8 33.9 32.1 10.7 12.5 3.6
20 y ears or more 41 19.5 41.5 31.7 19.5 19.5 12.2
No answ er 66 33.3 50.0 25.8 7.6 19.7 3.0
No. of samplesEx change w ith other
groups (not local)Shopping support
Language courses
activ itiesOther No answ er
Total 572 8.4 5.9 31.3 2.8 10.5
Less than 1 y ear 88 9.1 8.0 34.1 1.1 11.4
1 to 3 y ears 129 6.2 7.0 37.2 4.7 15.5
3 to 5 y ears 60 8.3 5.0 36.7 3.3 5.0
5 to 10 y ears 132 7.6 6.1 27.3 1.5 7.6
10 to 20 y ears 56 10.7 1.8 21.4 3.6 14.3
20 y ears or more 41 12.2 9.8 12.2 2.4 9.8
No answ er 66 9.1 3.0 39.4 3.0 7.6 Distribution Ratio (%) Total column is no. of data.
Second highest ranking Highest ranking
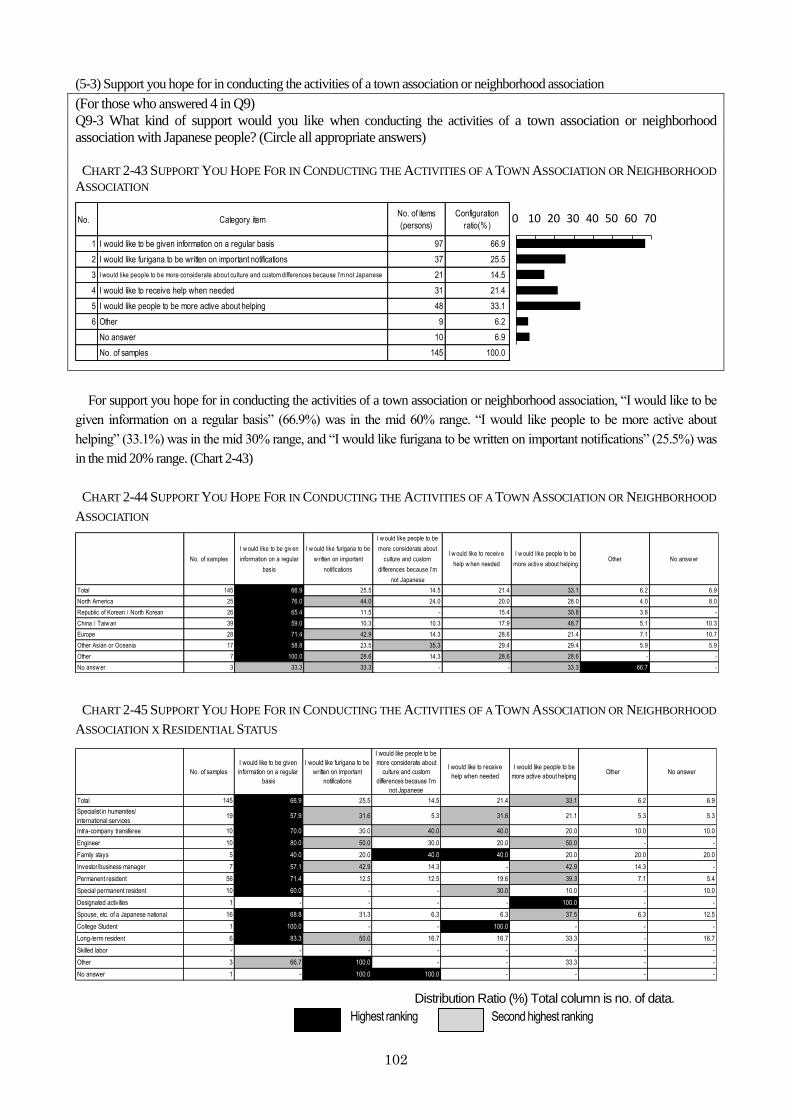
102
(5-3) Support you hope for in conducting the activities of a town association or neighborhood association
(For those who answered 4 in Q9)
Q9-3 What kind of support would you like when conducting the activities of a town association or neighborhood
association with Japanese people? (Circle all appropriate answers)
CHART 2-43 SUPPORT YOU HOPE FOR IN CONDUCTING THE ACTIVITIES OF A TOWN ASSOCIATION OR NEIGHBORHOOD
ASSOCIATION
No. Category itemNo. of items
(persons)
Configuration
ratio(%)
1 I would like to be given information on a regular basis 97 66.9
2 I would like furigana to be written on important notifications 37 25.5
3 I would like people to be more considerate about culture and custom differences because I’m not Japanese 21 14.5
4 I would like to receive help when needed 31 21.4
5 I would like people to be more active about helping 48 33.1
6 Other 9 6.2
No answer 10 6.9
No. of samples 145 100.0
0 10 20 30 40 50 60 70
For support you hope for in conducting the activities of a town association or neighborhood association, “I would like to be
given information on a regular basis” (66.9%) was in the mid 60% range. “I would like people to be more active about
helping” (33.1%) was in the mid 30% range, and “I would like furigana to be written on important notifications” (25.5%) was
in the mid 20% range. (Chart 2-43)
CHART 2-44 SUPPORT YOU HOPE FOR IN CONDUCTING THE ACTIVITIES OF A TOWN ASSOCIATION OR NEIGHBORHOOD
ASSOCIATION
No. of samples
I w ould like to be giv en
information on a regular
basis
I w ould like furigana to be
w ritten on important
notifications
I w ould like people to be
more considerate about
culture and custom
differences because I’m
not Japanese
I w ould like to receiv e
help w hen needed
I w ould like people to be
more activ e about helpingOther No answ er
Total 145 66.9 25.5 14.5 21.4 33.1 6.2 6.9
North America 25 76.0 44.0 24.0 20.0 28.0 4.0 8.0
Republic of Korean / North Korean 26 65.4 11.5 - 15.4 30.8 3.8 -
China / Taiw an 39 59.0 10.3 10.3 17.9 48.7 5.1 10.3
Europe 28 71.4 42.9 14.3 28.6 21.4 7.1 10.7
Other Asian or Oceania 17 58.8 23.5 35.3 29.4 29.4 5.9 5.9
Other 7 100.0 28.6 14.3 28.6 28.6 - -
No answ er 3 33.3 33.3 - - 33.3 66.7 -
CHART 2-45 SUPPORT YOU HOPE FOR IN CONDUCTING THE ACTIVITIES OF A TOWN ASSOCIATION OR NEIGHBORHOOD
ASSOCIATION X RESIDENTIAL STATUS
No. of samples
I would like to be given
information on a regular
basis
I would like furigana to be
written on important
notifications
I would like people to be
more considerate about
culture and custom
differences because I’m
not Japanese
I would like to receive
help when needed
I would like people to be
more active about helpingOther No answer
Total 145 66.9 25.5 14.5 21.4 33.1 6.2 6.9
Specialist in humanities/
international services19 57.9 31.6 5.3 31.6 21.1 5.3 5.3
Intra-company transferee 10 70.0 30.0 40.0 40.0 20.0 10.0 10.0
Engineer 10 80.0 50.0 30.0 20.0 50.0 - -
Family stays 5 40.0 20.0 40.0 40.0 20.0 20.0 20.0
Investor/business manager 7 57.1 42.9 14.3 - 42.9 14.3 -
Permanent resident 56 71.4 12.5 12.5 19.6 39.3 7.1 5.4
Special permanent resident 10 60.0 - - 30.0 10.0 - 10.0
Designated activities 1 - - - - 100.0 - -
Spouse, etc. of a Japanese national 16 68.8 31.3 6.3 6.3 37.5 6.3 12.5
College Student 1 100.0 - - 100.0 - - -
Long-term resident 6 83.3 50.0 16.7 16.7 33.3 - 16.7
Skilled labor - - - - - - - -
Other 3 66.7 100.0 - - 33.3 - -
No answer 1 - 100.0 100.0 - - - -
Distribution Ratio (%) Total column is no. of data.
Second highest ranking Highest ranking
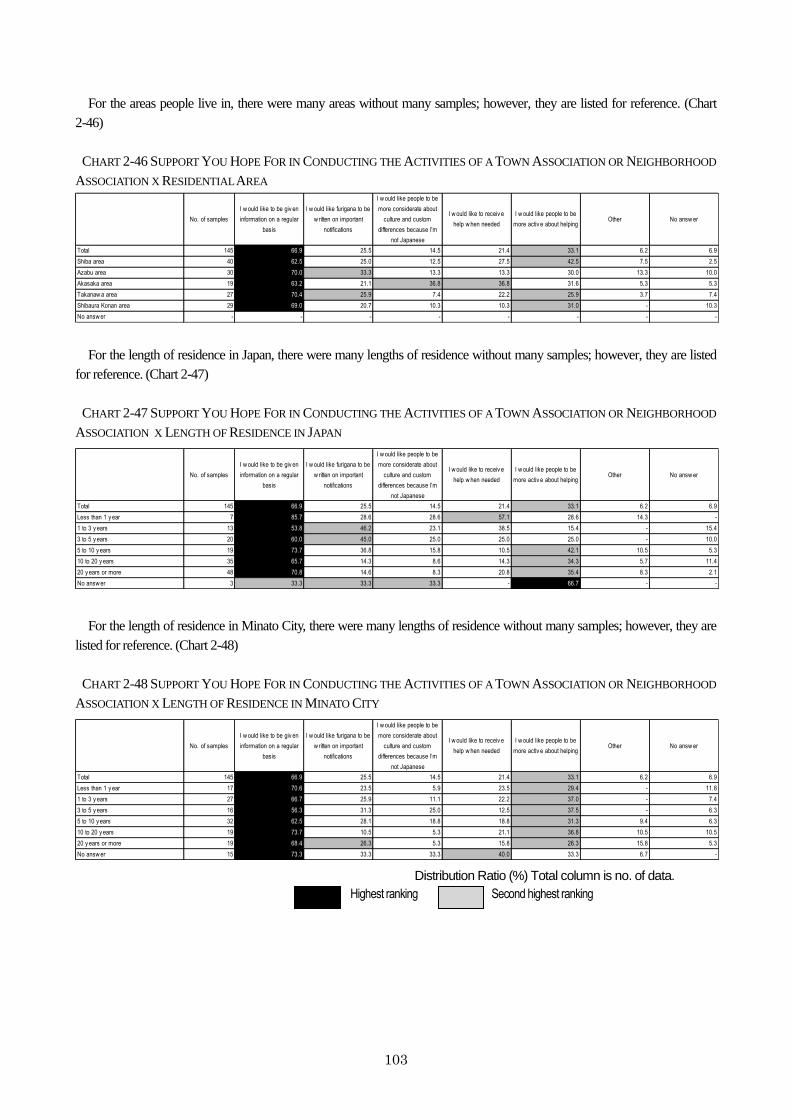
103
For the areas people live in, there were many areas without many samples; however, they are listed for reference. (Chart
2-46)
CHART 2-46 SUPPORT YOU HOPE FOR IN CONDUCTING THE ACTIVITIES OF A TOWN ASSOCIATION OR NEIGHBORHOOD
ASSOCIATION X RESIDENTIAL AREA
No. of samples
I w ould like to be giv en
information on a regular
basis
I w ould like furigana to be
w ritten on important
notifications
I w ould like people to be
more considerate about
culture and custom
differences because I’m
not Japanese
I w ould like to receiv e
help w hen needed
I w ould like people to be
more activ e about helpingOther No answ er
Total 145 66.9 25.5 14.5 21.4 33.1 6.2 6.9
Shiba area 40 62.5 25.0 12.5 27.5 42.5 7.5 2.5
Azabu area 30 70.0 33.3 13.3 13.3 30.0 13.3 10.0
Akasaka area 19 63.2 21.1 36.8 36.8 31.6 5.3 5.3
Takanaw a area 27 70.4 25.9 7.4 22.2 25.9 3.7 7.4
Shibaura Konan area 29 69.0 20.7 10.3 10.3 31.0 - 10.3
No answ er - - - - - - - -
For the length of residence in Japan, there were many lengths of residence without many samples; however, they are listed
for reference. (Chart 2-47)
CHART 2-47 SUPPORT YOU HOPE FOR IN CONDUCTING THE ACTIVITIES OF A TOWN ASSOCIATION OR NEIGHBORHOOD
ASSOCIATION X LENGTH OF RESIDENCE IN JAPAN
No. of samples
I w ould like to be giv en
information on a regular
basis
I w ould like furigana to be
w ritten on important
notifications
I w ould like people to be
more considerate about
culture and custom
differences because I’m
not Japanese
I w ould like to receiv e
help w hen needed
I w ould like people to be
more activ e about helpingOther No answ er
Total 145 66.9 25.5 14.5 21.4 33.1 6.2 6.9
Less than 1 y ear 7 85.7 28.6 28.6 57.1 28.6 14.3 -
1 to 3 y ears 13 53.8 46.2 23.1 38.5 15.4 - 15.4
3 to 5 y ears 20 60.0 45.0 25.0 25.0 25.0 - 10.0
5 to 10 y ears 19 73.7 36.8 15.8 10.5 42.1 10.5 5.3
10 to 20 y ears 35 65.7 14.3 8.6 14.3 34.3 5.7 11.4
20 y ears or more 48 70.8 14.6 8.3 20.8 35.4 8.3 2.1
No answ er 3 33.3 33.3 33.3 - 66.7 - -
For the length of residence in Minato City, there were many lengths of residence without many samples; however, they are
listed for reference. (Chart 2-48)
CHART 2-48 SUPPORT YOU HOPE FOR IN CONDUCTING THE ACTIVITIES OF A TOWN ASSOCIATION OR NEIGHBORHOOD
ASSOCIATION X LENGTH OF RESIDENCE IN MINATO CITY
No. of samples
I w ould like to be giv en
information on a regular
basis
I w ould like furigana to be
w ritten on important
notifications
I w ould like people to be
more considerate about
culture and custom
differences because I’m
not Japanese
I w ould like to receiv e
help w hen needed
I w ould like people to be
more activ e about helpingOther No answ er
Total 145 66.9 25.5 14.5 21.4 33.1 6.2 6.9
Less than 1 y ear 17 70.6 23.5 5.9 23.5 29.4 - 11.8
1 to 3 y ears 27 66.7 25.9 11.1 22.2 37.0 - 7.4
3 to 5 y ears 16 56.3 31.3 25.0 12.5 37.5 - 6.3
5 to 10 y ears 32 62.5 28.1 18.8 18.8 31.3 9.4 6.3
10 to 20 y ears 19 73.7 10.5 5.3 21.1 36.8 10.5 10.5
20 y ears or more 19 68.4 26.3 5.3 15.8 26.3 15.8 5.3
No answ er 15 73.3 33.3 33.3 40.0 33.3 6.7 -
Distribution Ratio (%) Total column is no. of data.
Second highest ranking Highest ranking
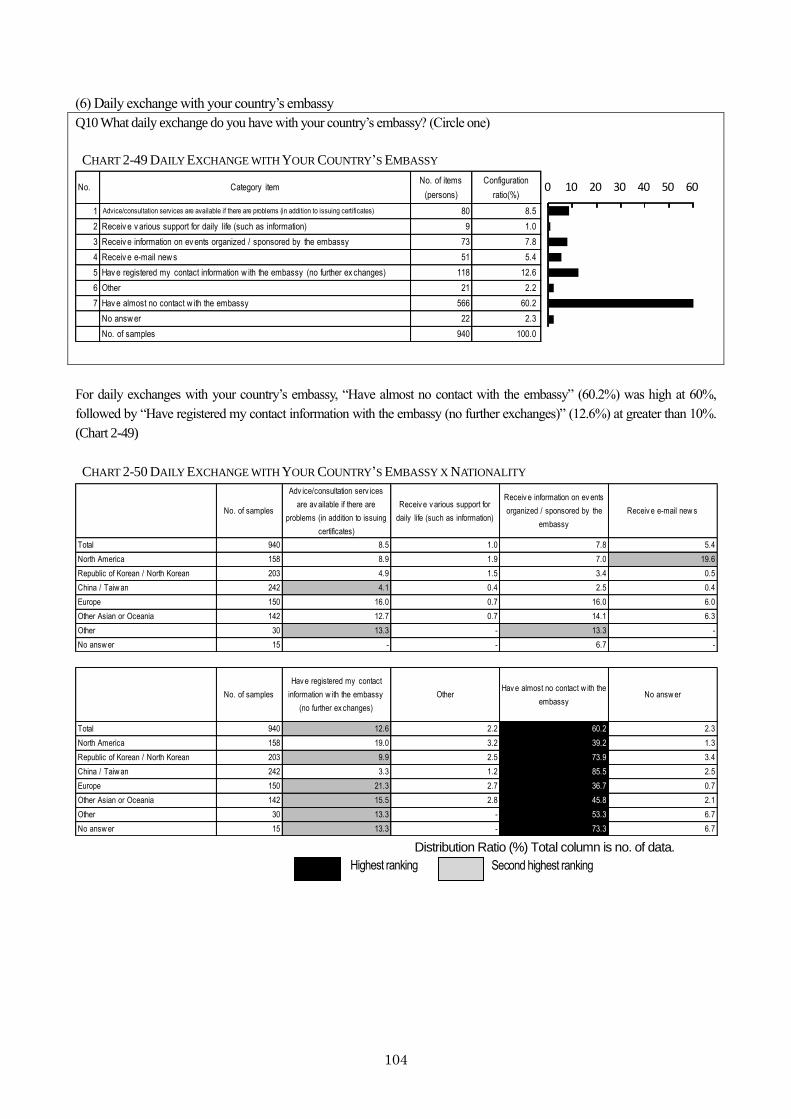
104
(6) Daily exchange with your country’s embassy
Q10 What daily exchange do you have with your country’s embassy? (Circle one)
CHART 2-49 DAILY EXCHANGE WITH YOUR COUNTRY’S EMBASSY
No. Category itemNo. of items
(persons)
Configuration
ratio(%)
1 Advice/consultation services are available if there are problems (in addition to issuing certificates) 80 8.5
2 Receiv e v arious support for daily life (such as information) 9 1.0
3 Receiv e information on ev ents organized / sponsored by the embassy 73 7.8
4 Receiv e e-mail new s 51 5.4
5 Hav e registered my contact information w ith the embassy (no further ex changes) 118 12.6
6 Other 21 2.2
7 Hav e almost no contact w ith the embassy 566 60.2
No answ er 22 2.3
No. of samples 940 100.0
0 10 20 30 40 50 60
For daily exchanges with your country’s embassy, “Have almost no contact with the embassy” (60.2%) was high at 60%,
followed by “Have registered my contact information with the embassy (no further exchanges)” (12.6%) at greater than 10%.
(Chart 2-49)
CHART 2-50 DAILY EXCHANGE WITH YOUR COUNTRY’S EMBASSY X NATIONALITY
No. of samples
Adv ice/consultation serv ices
are av ailable if there are
problems (in addition to issuing
certificates)
Receiv e v arious support for
daily life (such as information)
Receiv e information on ev ents
organized / sponsored by the
embassy
Receiv e e-mail new s
Total 940 8.5 1.0 7.8 5.4
North America 158 8.9 1.9 7.0 19.6
Republic of Korean / North Korean 203 4.9 1.5 3.4 0.5
China / Taiw an 242 4.1 0.4 2.5 0.4
Europe 150 16.0 0.7 16.0 6.0
Other Asian or Oceania 142 12.7 0.7 14.1 6.3
Other 30 13.3 - 13.3 -
No answ er 15 - - 6.7 -
No. of samples
Hav e registered my contact
information w ith the embassy
(no further ex changes)
OtherHav e almost no contact w ith the
embassyNo answ er
Total 940 12.6 2.2 60.2 2.3
North America 158 19.0 3.2 39.2 1.3
Republic of Korean / North Korean 203 9.9 2.5 73.9 3.4
China / Taiw an 242 3.3 1.2 85.5 2.5
Europe 150 21.3 2.7 36.7 0.7
Other Asian or Oceania 142 15.5 2.8 45.8 2.1
Other 30 13.3 - 53.3 6.7
No answ er 15 13.3 - 73.3 6.7 Distribution Ratio (%) Total column is no. of data.
Second highest ranking Highest ranking
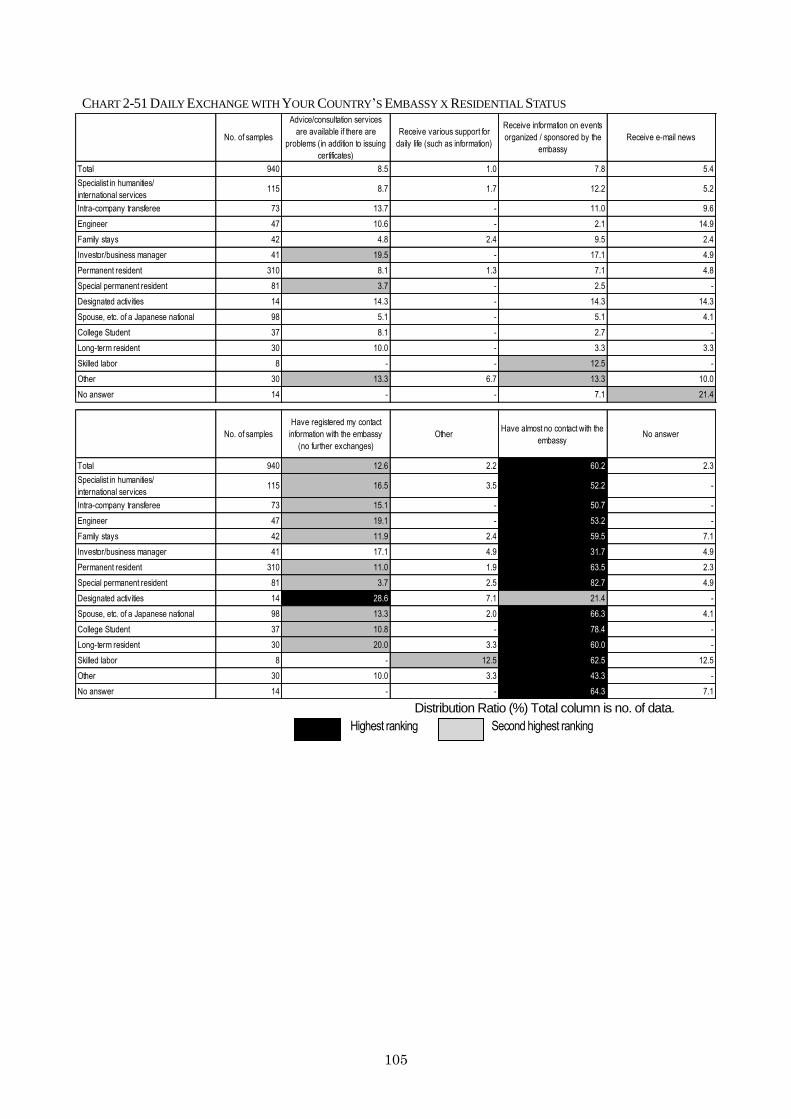
105
CHART 2-51 DAILY EXCHANGE WITH YOUR COUNTRY’S EMBASSY X RESIDENTIAL STATUS
No. of samples
Advice/consultation services
are available if there are
problems (in addition to issuing
certificates)
Receive various support for
daily life (such as information)
Receive information on events
organized / sponsored by the
embassy
Receive e-mail news
Total 940 8.5 1.0 7.8 5.4
Specialist in humanities/
international services115 8.7 1.7 12.2 5.2
Intra-company transferee 73 13.7 - 11.0 9.6
Engineer 47 10.6 - 2.1 14.9
Family stays 42 4.8 2.4 9.5 2.4
Investor/business manager 41 19.5 - 17.1 4.9
Permanent resident 310 8.1 1.3 7.1 4.8
Special permanent resident 81 3.7 - 2.5 -
Designated activities 14 14.3 - 14.3 14.3
Spouse, etc. of a Japanese national 98 5.1 - 5.1 4.1
College Student 37 8.1 - 2.7 -
Long-term resident 30 10.0 - 3.3 3.3
Skilled labor 8 - - 12.5 -
Other 30 13.3 6.7 13.3 10.0
No answer 14 - - 7.1 21.4
No. of samples
Have registered my contact
information with the embassy
(no further exchanges)
OtherHave almost no contact with the
embassyNo answer
Total 940 12.6 2.2 60.2 2.3
Specialist in humanities/
international services115 16.5 3.5 52.2 -
Intra-company transferee 73 15.1 - 50.7 -
Engineer 47 19.1 - 53.2 -
Family stays 42 11.9 2.4 59.5 7.1
Investor/business manager 41 17.1 4.9 31.7 4.9
Permanent resident 310 11.0 1.9 63.5 2.3
Special permanent resident 81 3.7 2.5 82.7 4.9
Designated activities 14 28.6 7.1 21.4 -
Spouse, etc. of a Japanese national 98 13.3 2.0 66.3 4.1
College Student 37 10.8 - 78.4 -
Long-term resident 30 20.0 3.3 60.0 -
Skilled labor 8 - 12.5 62.5 12.5
Other 30 10.0 3.3 43.3 -
No answer 14 - - 64.3 7.1 Distribution Ratio (%) Total column is no. of data.
Second highest ranking Highest ranking
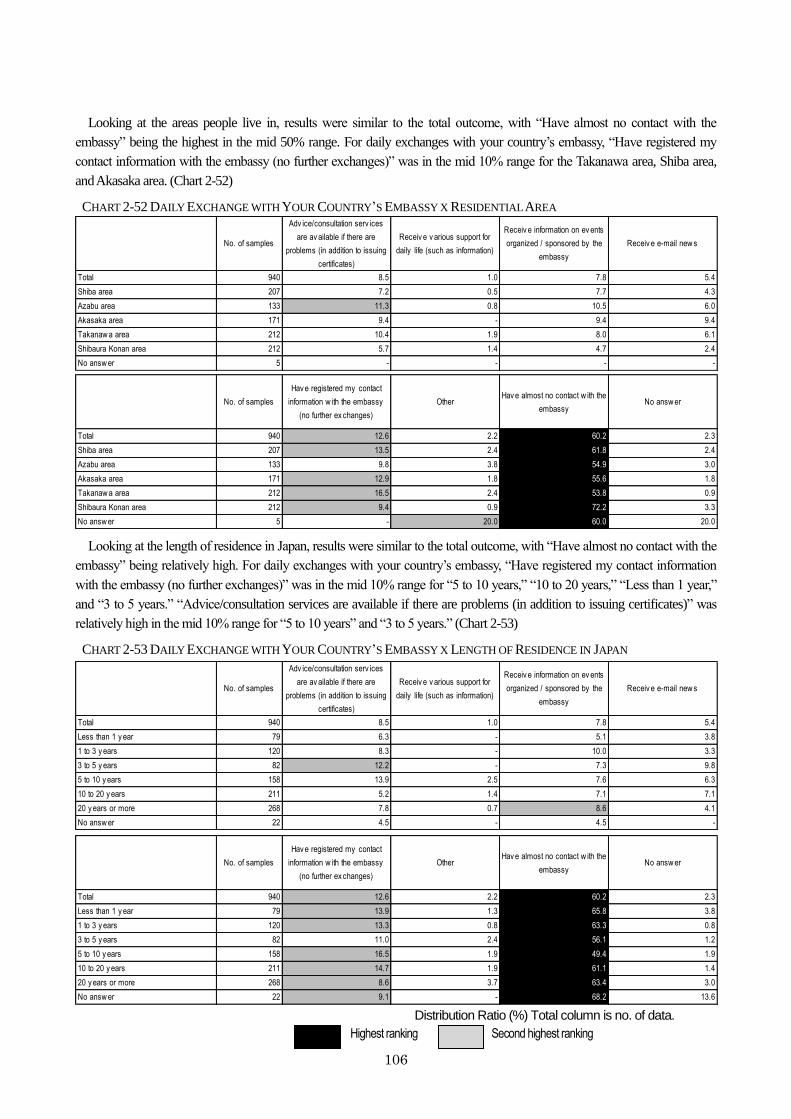
106
Looking at the areas people live in, results were similar to the total outcome, with “Have almost no contact with the
embassy” being the highest in the mid 50% range. For daily exchanges with your country’s embassy, “Have registered my
contact information with the embassy (no further exchanges)” was in the mid 10% range for the Takanawa area, Shiba area,
and Akasaka area. (Chart 2-52)
CHART 2-52 DAILY EXCHANGE WITH YOUR COUNTRY’S EMBASSY X RESIDENTIAL AREA
No. of samples
Adv ice/consultation serv ices
are av ailable if there are
problems (in addition to issuing
certificates)
Receiv e v arious support for
daily life (such as information)
Receiv e information on ev ents
organized / sponsored by the
embassy
Receiv e e-mail new s
Total 940 8.5 1.0 7.8 5.4
Shiba area 207 7.2 0.5 7.7 4.3
Azabu area 133 11.3 0.8 10.5 6.0
Akasaka area 171 9.4 - 9.4 9.4
Takanaw a area 212 10.4 1.9 8.0 6.1
Shibaura Konan area 212 5.7 1.4 4.7 2.4
No answ er 5 - - - -
No. of samples
Hav e registered my contact
information w ith the embassy
(no further ex changes)
OtherHav e almost no contact w ith the
embassyNo answ er
Total 940 12.6 2.2 60.2 2.3
Shiba area 207 13.5 2.4 61.8 2.4
Azabu area 133 9.8 3.8 54.9 3.0
Akasaka area 171 12.9 1.8 55.6 1.8
Takanaw a area 212 16.5 2.4 53.8 0.9
Shibaura Konan area 212 9.4 0.9 72.2 3.3
No answ er 5 - 20.0 60.0 20.0 Looking at the length of residence in Japan, results were similar to the total outcome, with “Have almost no contact with the
embassy” being relatively high. For daily exchanges with your country’s embassy, “Have registered my contact information
with the embassy (no further exchanges)” was in the mid 10% range for “5 to 10 years,” “10 to 20 years,” “Less than 1 year,”
and “3 to 5 years.” “Advice/consultation services are available if there are problems (in addition to issuing certificates)” was
relatively high in the mid 10% range for “5 to 10 years” and “3 to 5 years.” (Chart 2-53)
CHART 2-53 DAILY EXCHANGE WITH YOUR COUNTRY’S EMBASSY X LENGTH OF RESIDENCE IN JAPAN
No. of samples
Adv ice/consultation serv ices
are av ailable if there are
problems (in addition to issuing
certificates)
Receiv e v arious support for
daily life (such as information)
Receiv e information on ev ents
organized / sponsored by the
embassy
Receiv e e-mail new s
Total 940 8.5 1.0 7.8 5.4
Less than 1 y ear 79 6.3 - 5.1 3.8
1 to 3 y ears 120 8.3 - 10.0 3.3
3 to 5 y ears 82 12.2 - 7.3 9.8
5 to 10 y ears 158 13.9 2.5 7.6 6.3
10 to 20 y ears 211 5.2 1.4 7.1 7.1
20 y ears or more 268 7.8 0.7 8.6 4.1
No answ er 22 4.5 - 4.5 -
No. of samples
Hav e registered my contact
information w ith the embassy
(no further ex changes)
OtherHav e almost no contact w ith the
embassyNo answ er
Total 940 12.6 2.2 60.2 2.3
Less than 1 y ear 79 13.9 1.3 65.8 3.8
1 to 3 y ears 120 13.3 0.8 63.3 0.8
3 to 5 y ears 82 11.0 2.4 56.1 1.2
5 to 10 y ears 158 16.5 1.9 49.4 1.9
10 to 20 y ears 211 14.7 1.9 61.1 1.4
20 y ears or more 268 8.6 3.7 63.4 3.0
No answ er 22 9.1 - 68.2 13.6 Distribution Ratio (%) Total column is no. of data.
Second highest ranking Highest ranking
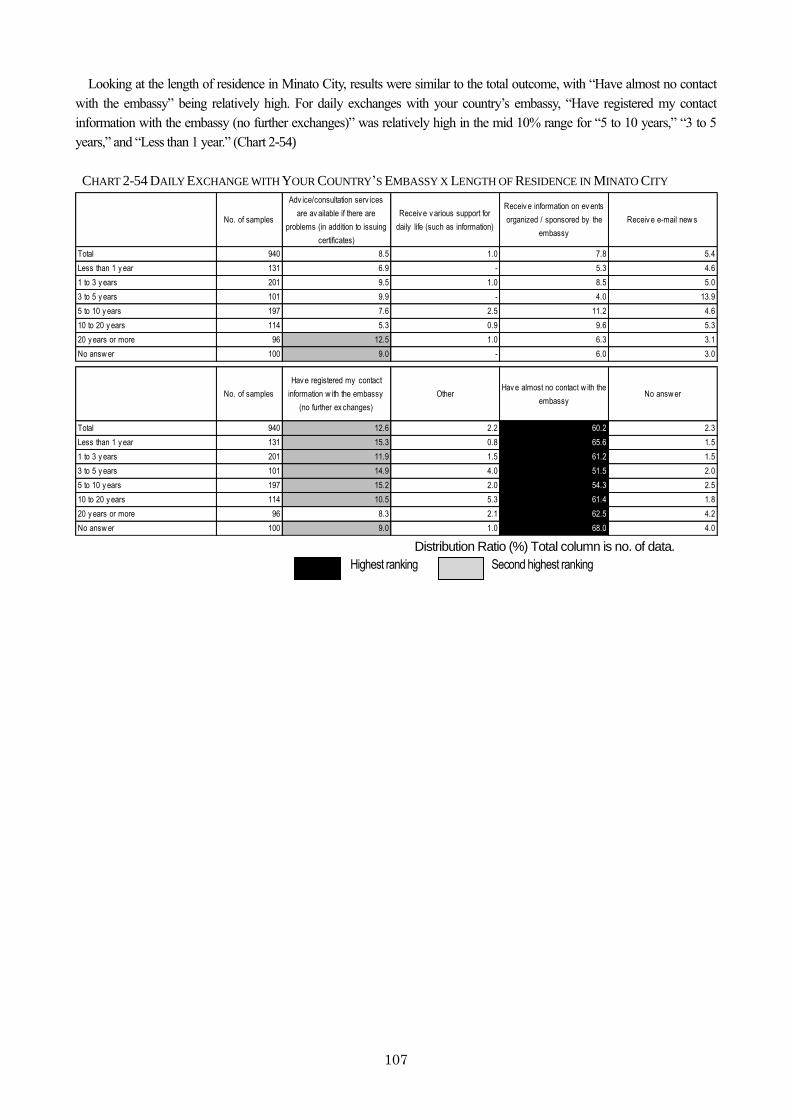
107
Looking at the length of residence in Minato City, results were similar to the total outcome, with “Have almost no contact
with the embassy” being relatively high. For daily exchanges with your country’s embassy, “Have registered my contact
information with the embassy (no further exchanges)” was relatively high in the mid 10% range for “5 to 10 years,” “3 to 5
years,” and “Less than 1 year.” (Chart 2-54)
CHART 2-54 DAILY EXCHANGE WITH YOUR COUNTRY’S EMBASSY X LENGTH OF RESIDENCE IN MINATO CITY
No. of samples
Adv ice/consultation serv ices
are av ailable if there are
problems (in addition to issuing
certificates)
Receiv e v arious support for
daily life (such as information)
Receiv e information on ev ents
organized / sponsored by the
embassy
Receiv e e-mail new s
Total 940 8.5 1.0 7.8 5.4
Less than 1 y ear 131 6.9 - 5.3 4.6
1 to 3 y ears 201 9.5 1.0 8.5 5.0
3 to 5 y ears 101 9.9 - 4.0 13.9
5 to 10 y ears 197 7.6 2.5 11.2 4.6
10 to 20 y ears 114 5.3 0.9 9.6 5.3
20 y ears or more 96 12.5 1.0 6.3 3.1
No answ er 100 9.0 - 6.0 3.0
No. of samples
Hav e registered my contact
information w ith the embassy
(no further ex changes)
OtherHav e almost no contact w ith the
embassyNo answ er
Total 940 12.6 2.2 60.2 2.3
Less than 1 y ear 131 15.3 0.8 65.6 1.5
1 to 3 y ears 201 11.9 1.5 61.2 1.5
3 to 5 y ears 101 14.9 4.0 51.5 2.0
5 to 10 y ears 197 15.2 2.0 54.3 2.5
10 to 20 y ears 114 10.5 5.3 61.4 1.8
20 y ears or more 96 8.3 2.1 62.5 4.2
No answ er 100 9.0 1.0 68.0 4.0 Distribution Ratio (%) Total column is no. of data.
Second highest ranking Highest ranking
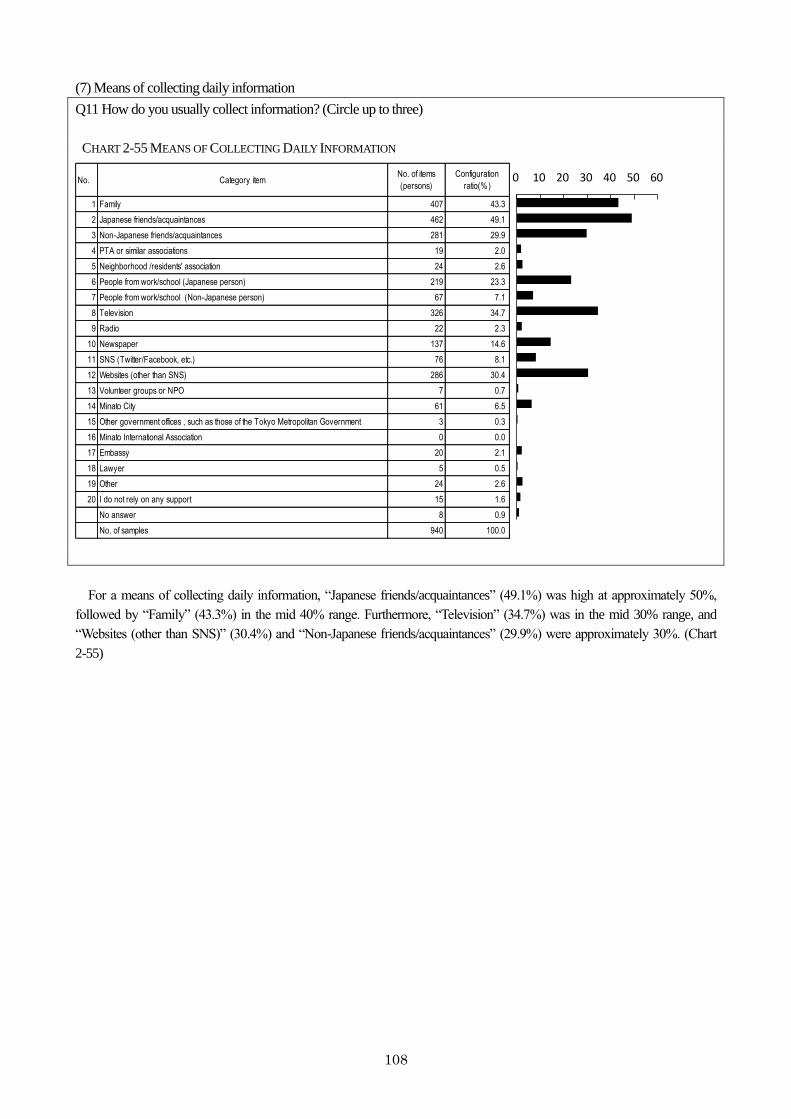
108
(7) Means of collecting daily information
Q11 How do you usually collect information? (Circle up to three)
CHART 2-55 MEANS OF COLLECTING DAILY INFORMATION
No. Category itemNo. of items
(persons)
Configuration
ratio(%)
1 Family 407 43.3
2 Japanese friends/acquaintances 462 49.1
3 Non-Japanese friends/acquaintances 281 29.9
4 PTA or similar associations 19 2.0
5 Neighborhood /residents' association 24 2.6
6 People from work/school (Japanese person) 219 23.3
7 People from work/school (Non-Japanese person) 67 7.1
8 Television 326 34.7
9 Radio 22 2.3
10 Newspaper 137 14.6
11 SNS (Twitter/Facebook, etc.) 76 8.1
12 Websites (other than SNS) 286 30.4
13 Volunteer groups or NPO 7 0.7
14 Minato City 61 6.5
15 Other government offices , such as those of the Tokyo Metropolitan Government 3 0.3
16 Minato International Association 0 0.0
17 Embassy 20 2.1
18 Lawyer 5 0.5
19 Other 24 2.6
20 I do not rely on any support 15 1.6
No answer 8 0.9
No. of samples 940 100.0
0 10 20 30 40 50 60
For a means of collecting daily information, “Japanese friends/acquaintances” (49.1%) was high at approximately 50%,
followed by “Family” (43.3%) in the mid 40% range. Furthermore, “Television” (34.7%) was in the mid 30% range, and
“Websites (other than SNS)” (30.4%) and “Non-Japanese friends/acquaintances” (29.9%) were approximately 30%. (Chart
2-55)
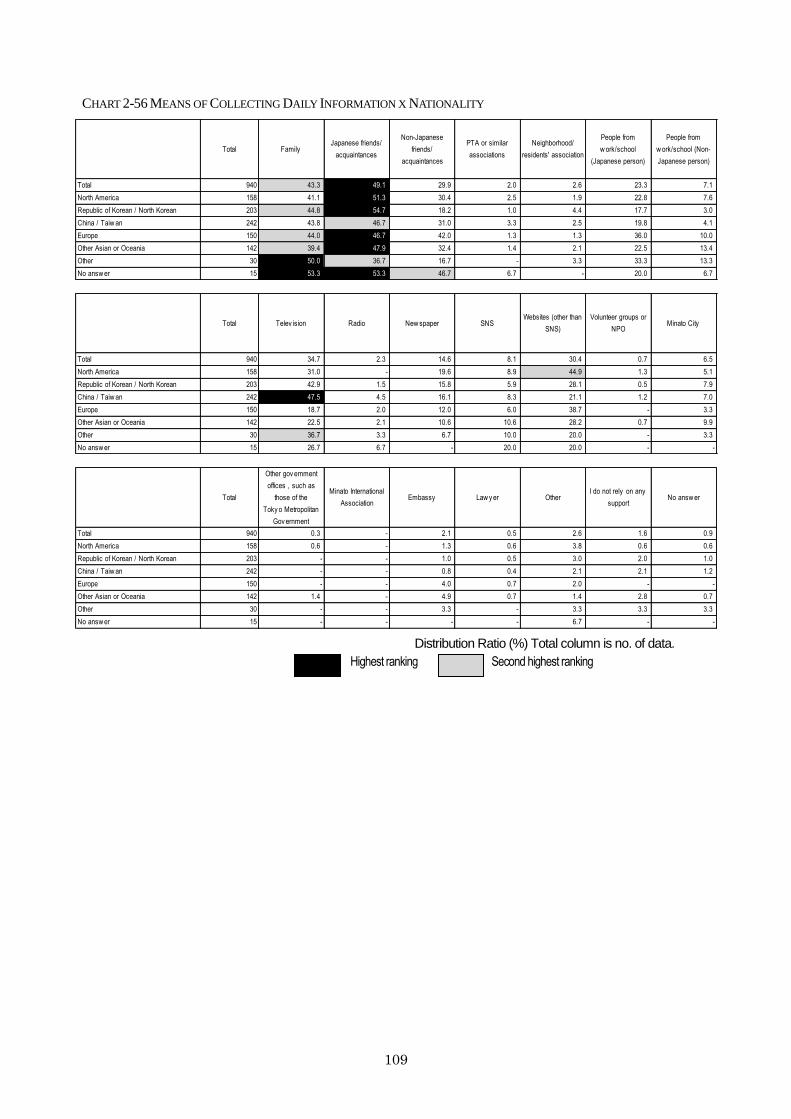
109
CHART 2-56 MEANS OF COLLECTING DAILY INFORMATION X NATIONALITY
Total FamilyJapanese friends/
acquaintances
Non-Japanese
friends/
acquaintances
PTA or similar
associations
Neighborhood/
residents' association
People from
w ork/school
(Japanese person)
People from
w ork/school (Non-
Japanese person)
Total 940 43.3 49.1 29.9 2.0 2.6 23.3 7.1
North America 158 41.1 51.3 30.4 2.5 1.9 22.8 7.6
Republic of Korean / North Korean 203 44.8 54.7 18.2 1.0 4.4 17.7 3.0
China / Taiw an 242 43.8 46.7 31.0 3.3 2.5 19.8 4.1
Europe 150 44.0 46.7 42.0 1.3 1.3 36.0 10.0
Other Asian or Oceania 142 39.4 47.9 32.4 1.4 2.1 22.5 13.4
Other 30 50.0 36.7 16.7 - 3.3 33.3 13.3
No answ er 15 53.3 53.3 46.7 6.7 - 20.0 6.7
Total Telev ision Radio New spaper SNSWebsites (other than
SNS)
Volunteer groups or
NPOMinato City
Total 940 34.7 2.3 14.6 8.1 30.4 0.7 6.5
North America 158 31.0 - 19.6 8.9 44.9 1.3 5.1
Republic of Korean / North Korean 203 42.9 1.5 15.8 5.9 28.1 0.5 7.9
China / Taiw an 242 47.5 4.5 16.1 8.3 21.1 1.2 7.0
Europe 150 18.7 2.0 12.0 6.0 38.7 - 3.3
Other Asian or Oceania 142 22.5 2.1 10.6 10.6 28.2 0.7 9.9
Other 30 36.7 3.3 6.7 10.0 20.0 - 3.3
No answ er 15 26.7 6.7 - 20.0 20.0 - -
Total
Other gov ernment
offices , such as
those of the
Toky o Metropolitan
Gov ernment
Minato International
AssociationEmbassy Law y er Other
I do not rely on any
supportNo answ er
Total 940 0.3 - 2.1 0.5 2.6 1.6 0.9
North America 158 0.6 - 1.3 0.6 3.8 0.6 0.6
Republic of Korean / North Korean 203 - - 1.0 0.5 3.0 2.0 1.0
China / Taiw an 242 - - 0.8 0.4 2.1 2.1 1.2
Europe 150 - - 4.0 0.7 2.0 - -
Other Asian or Oceania 142 1.4 - 4.9 0.7 1.4 2.8 0.7
Other 30 - - 3.3 - 3.3 3.3 3.3
No answ er 15 - - - - 6.7 - -
Distribution Ratio (%) Total column is no. of data.
Second highest ranking Highest ranking
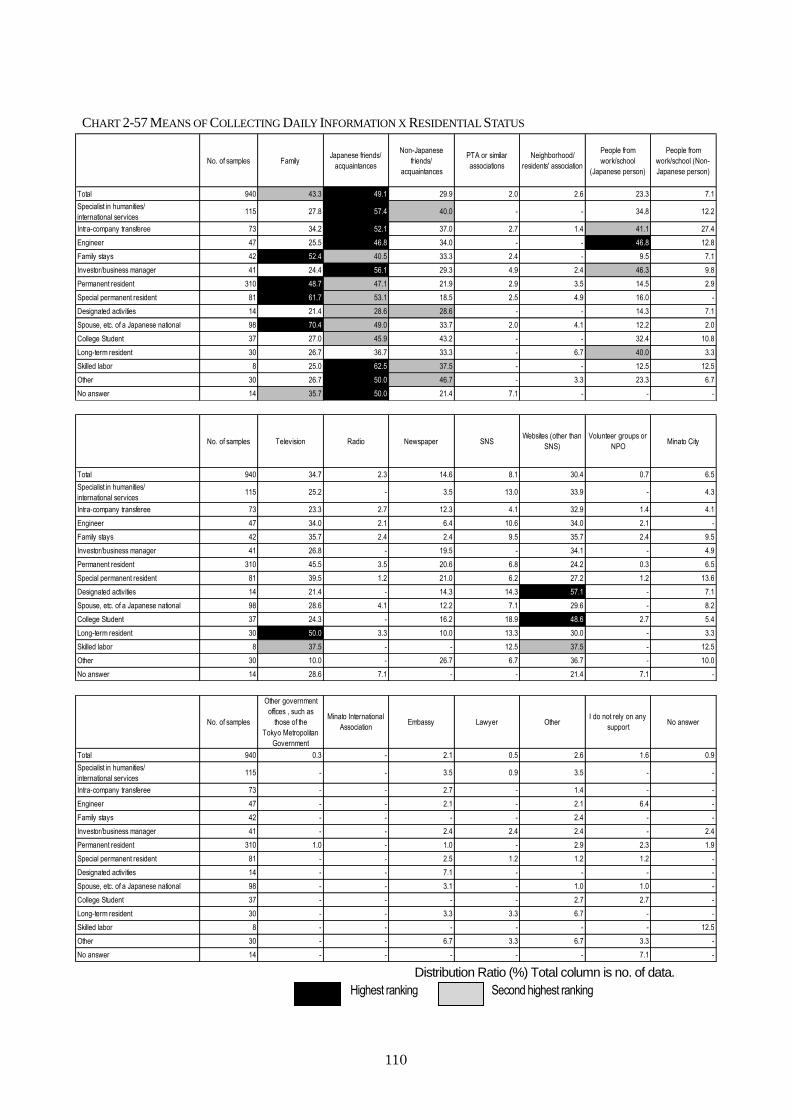
110
CHART 2-57 MEANS OF COLLECTING DAILY INFORMATION X RESIDENTIAL STATUS
No. of samples FamilyJapanese friends/
acquaintances
Non-Japanese
friends/
acquaintances
PTA or similar
associations
Neighborhood/
residents' association
People from
work/school
(Japanese person)
People from
work/school (Non-
Japanese person)
Total 940 43.3 49.1 29.9 2.0 2.6 23.3 7.1
Specialist in humanities/
international services115 27.8 57.4 40.0 - - 34.8 12.2
Intra-company transferee 73 34.2 52.1 37.0 2.7 1.4 41.1 27.4
Engineer 47 25.5 46.8 34.0 - - 46.8 12.8
Family stays 42 52.4 40.5 33.3 2.4 - 9.5 7.1
Investor/business manager 41 24.4 56.1 29.3 4.9 2.4 46.3 9.8
Permanent resident 310 48.7 47.1 21.9 2.9 3.5 14.5 2.9
Special permanent resident 81 61.7 53.1 18.5 2.5 4.9 16.0 -
Designated activities 14 21.4 28.6 28.6 - - 14.3 7.1
Spouse, etc. of a Japanese national 98 70.4 49.0 33.7 2.0 4.1 12.2 2.0
College Student 37 27.0 45.9 43.2 - - 32.4 10.8
Long-term resident 30 26.7 36.7 33.3 - 6.7 40.0 3.3
Skilled labor 8 25.0 62.5 37.5 - - 12.5 12.5
Other 30 26.7 50.0 46.7 - 3.3 23.3 6.7
No answer 14 35.7 50.0 21.4 7.1 - - -
No. of samples Television Radio Newspaper SNSWebsites (other than
SNS)
Volunteer groups or
NPOMinato City
Total 940 34.7 2.3 14.6 8.1 30.4 0.7 6.5
Specialist in humanities/
international services115 25.2 - 3.5 13.0 33.9 - 4.3
Intra-company transferee 73 23.3 2.7 12.3 4.1 32.9 1.4 4.1
Engineer 47 34.0 2.1 6.4 10.6 34.0 2.1 -
Family stays 42 35.7 2.4 2.4 9.5 35.7 2.4 9.5
Investor/business manager 41 26.8 - 19.5 - 34.1 - 4.9
Permanent resident 310 45.5 3.5 20.6 6.8 24.2 0.3 6.5
Special permanent resident 81 39.5 1.2 21.0 6.2 27.2 1.2 13.6
Designated activities 14 21.4 - 14.3 14.3 57.1 - 7.1
Spouse, etc. of a Japanese national 98 28.6 4.1 12.2 7.1 29.6 - 8.2
College Student 37 24.3 - 16.2 18.9 48.6 2.7 5.4
Long-term resident 30 50.0 3.3 10.0 13.3 30.0 - 3.3
Skilled labor 8 37.5 - - 12.5 37.5 - 12.5
Other 30 10.0 - 26.7 6.7 36.7 - 10.0
No answer 14 28.6 7.1 - - 21.4 7.1 -
No. of samples
Other government
offices , such as
those of the
Tokyo Metropolitan
Government
Minato International
AssociationEmbassy Lawyer Other
I do not rely on any
supportNo answer
Total 940 0.3 - 2.1 0.5 2.6 1.6 0.9
Specialist in humanities/
international services115 - - 3.5 0.9 3.5 - -
Intra-company transferee 73 - - 2.7 - 1.4 - -
Engineer 47 - - 2.1 - 2.1 6.4 -
Family stays 42 - - - - 2.4 - -
Investor/business manager 41 - - 2.4 2.4 2.4 - 2.4
Permanent resident 310 1.0 - 1.0 - 2.9 2.3 1.9
Special permanent resident 81 - - 2.5 1.2 1.2 1.2 -
Designated activities 14 - - 7.1 - - - -
Spouse, etc. of a Japanese national 98 - - 3.1 - 1.0 1.0 -
College Student 37 - - - - 2.7 2.7 -
Long-term resident 30 - - 3.3 3.3 6.7 - -
Skilled labor 8 - - - - - - 12.5
Other 30 - - 6.7 3.3 6.7 3.3 -
No answer 14 - - - - - 7.1 - Distribution Ratio (%) Total column is no. of data.
Second highest ranking Highest ranking
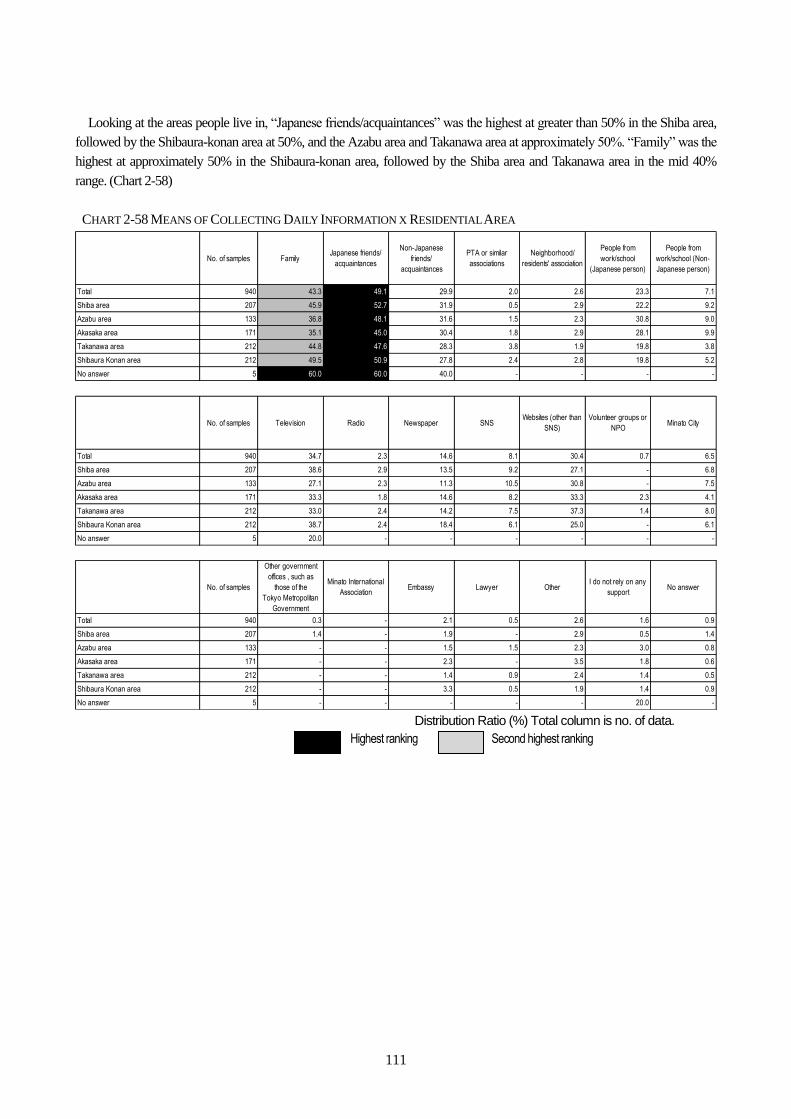
111
Looking at the areas people live in, “Japanese friends/acquaintances” was the highest at greater than 50% in the Shiba area,
followed by the Shibaura-konan area at 50%, and the Azabu area and Takanawa area at approximately 50%. “Family” was the
highest at approximately 50% in the Shibaura-konan area, followed by the Shiba area and Takanawa area in the mid 40%
range. (Chart 2-58)
CHART 2-58 MEANS OF COLLECTING DAILY INFORMATION X RESIDENTIAL AREA
No. of samples FamilyJapanese friends/
acquaintances
Non-Japanese
friends/
acquaintances
PTA or similar
associations
Neighborhood/
residents' association
People from
work/school
(Japanese person)
People from
work/school (Non-
Japanese person)
Total 940 43.3 49.1 29.9 2.0 2.6 23.3 7.1
Shiba area 207 45.9 52.7 31.9 0.5 2.9 22.2 9.2
Azabu area 133 36.8 48.1 31.6 1.5 2.3 30.8 9.0
Akasaka area 171 35.1 45.0 30.4 1.8 2.9 28.1 9.9
Takanawa area 212 44.8 47.6 28.3 3.8 1.9 19.8 3.8
Shibaura Konan area 212 49.5 50.9 27.8 2.4 2.8 19.8 5.2
No answer 5 60.0 60.0 40.0 - - - -
No. of samples Television Radio Newspaper SNSWebsites (other than
SNS)
Volunteer groups or
NPOMinato City
Total 940 34.7 2.3 14.6 8.1 30.4 0.7 6.5
Shiba area 207 38.6 2.9 13.5 9.2 27.1 - 6.8
Azabu area 133 27.1 2.3 11.3 10.5 30.8 - 7.5
Akasaka area 171 33.3 1.8 14.6 8.2 33.3 2.3 4.1
Takanawa area 212 33.0 2.4 14.2 7.5 37.3 1.4 8.0
Shibaura Konan area 212 38.7 2.4 18.4 6.1 25.0 - 6.1
No answer 5 20.0 - - - - - -
No. of samples
Other government
offices , such as
those of the
Tokyo Metropolitan
Government
Minato International
AssociationEmbassy Lawyer Other
I do not rely on any
supportNo answer
Total 940 0.3 - 2.1 0.5 2.6 1.6 0.9
Shiba area 207 1.4 - 1.9 - 2.9 0.5 1.4
Azabu area 133 - - 1.5 1.5 2.3 3.0 0.8
Akasaka area 171 - - 2.3 - 3.5 1.8 0.6
Takanawa area 212 - - 1.4 0.9 2.4 1.4 0.5
Shibaura Konan area 212 - - 3.3 0.5 1.9 1.4 0.9
No answer 5 - - - - - 20.0 - Distribution Ratio (%) Total column is no. of data.
Second highest ranking Highest ranking
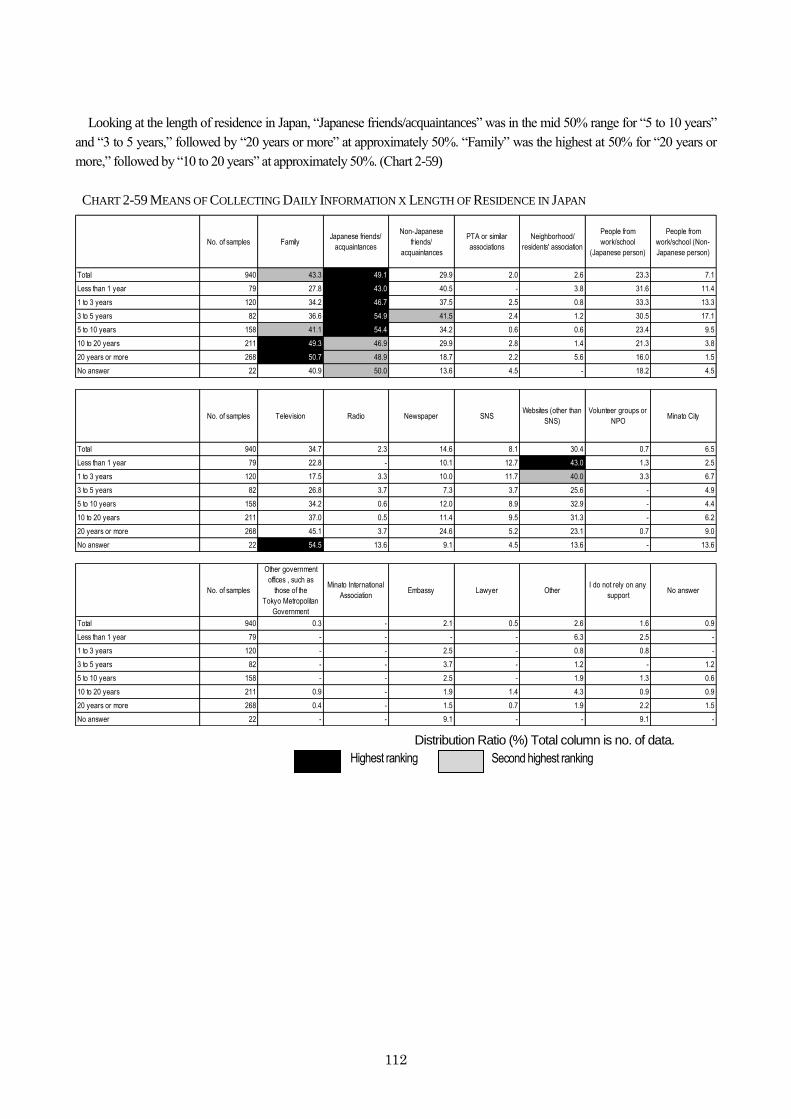
112
Looking at the length of residence in Japan, “Japanese friends/acquaintances” was in the mid 50% range for “5 to 10 years”
and “3 to 5 years,” followed by “20 years or more” at approximately 50%. “Family” was the highest at 50% for “20 years or
more,” followed by “10 to 20 years” at approximately 50%. (Chart 2-59)
CHART 2-59 MEANS OF COLLECTING DAILY INFORMATION X LENGTH OF RESIDENCE IN JAPAN
No. of samples FamilyJapanese friends/
acquaintances
Non-Japanese
friends/
acquaintances
PTA or similar
associations
Neighborhood/
residents' association
People from
work/school
(Japanese person)
People from
work/school (Non-
Japanese person)
Total 940 43.3 49.1 29.9 2.0 2.6 23.3 7.1
Less than 1 year 79 27.8 43.0 40.5 - 3.8 31.6 11.4
1 to 3 years 120 34.2 46.7 37.5 2.5 0.8 33.3 13.3
3 to 5 years 82 36.6 54.9 41.5 2.4 1.2 30.5 17.1
5 to 10 years 158 41.1 54.4 34.2 0.6 0.6 23.4 9.5
10 to 20 years 211 49.3 46.9 29.9 2.8 1.4 21.3 3.8
20 years or more 268 50.7 48.9 18.7 2.2 5.6 16.0 1.5
No answer 22 40.9 50.0 13.6 4.5 - 18.2 4.5
No. of samples Television Radio Newspaper SNSWebsites (other than
SNS)
Volunteer groups or
NPOMinato City
Total 940 34.7 2.3 14.6 8.1 30.4 0.7 6.5
Less than 1 year 79 22.8 - 10.1 12.7 43.0 1.3 2.5
1 to 3 years 120 17.5 3.3 10.0 11.7 40.0 3.3 6.7
3 to 5 years 82 26.8 3.7 7.3 3.7 25.6 - 4.9
5 to 10 years 158 34.2 0.6 12.0 8.9 32.9 - 4.4
10 to 20 years 211 37.0 0.5 11.4 9.5 31.3 - 6.2
20 years or more 268 45.1 3.7 24.6 5.2 23.1 0.7 9.0
No answer 22 54.5 13.6 9.1 4.5 13.6 - 13.6
No. of samples
Other government
offices , such as
those of the
Tokyo Metropolitan
Government
Minato International
AssociationEmbassy Lawyer Other
I do not rely on any
supportNo answer
Total 940 0.3 - 2.1 0.5 2.6 1.6 0.9
Less than 1 year 79 - - - - 6.3 2.5 -
1 to 3 years 120 - - 2.5 - 0.8 0.8 -
3 to 5 years 82 - - 3.7 - 1.2 - 1.2
5 to 10 years 158 - - 2.5 - 1.9 1.3 0.6
10 to 20 years 211 0.9 - 1.9 1.4 4.3 0.9 0.9
20 years or more 268 0.4 - 1.5 0.7 1.9 2.2 1.5
No answer 22 - - 9.1 - - 9.1 -
Distribution Ratio (%) Total column is no. of data.
Second highest ranking Highest ranking
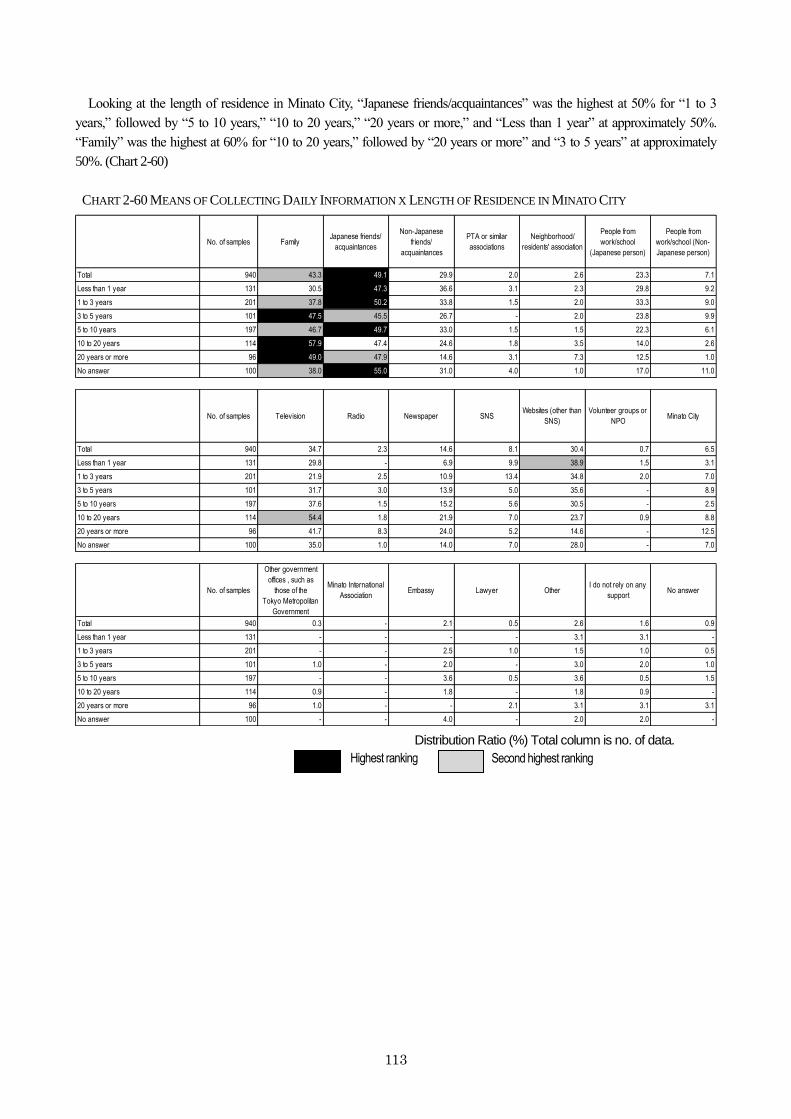
113
Looking at the length of residence in Minato City, “Japanese friends/acquaintances” was the highest at 50% for “1 to 3
years,” followed by “5 to 10 years,” “10 to 20 years,” “20 years or more,” and “Less than 1 year” at approximately 50%.
“Family” was the highest at 60% for “10 to 20 years,” followed by “20 years or more” and “3 to 5 years” at approximately
50%. (Chart 2-60)
CHART 2-60 MEANS OF COLLECTING DAILY INFORMATION X LENGTH OF RESIDENCE IN MINATO CITY
No. of samples FamilyJapanese friends/
acquaintances
Non-Japanese
friends/
acquaintances
PTA or similar
associations
Neighborhood/
residents' association
People from
work/school
(Japanese person)
People from
work/school (Non-
Japanese person)
Total 940 43.3 49.1 29.9 2.0 2.6 23.3 7.1
Less than 1 year 131 30.5 47.3 36.6 3.1 2.3 29.8 9.2
1 to 3 years 201 37.8 50.2 33.8 1.5 2.0 33.3 9.0
3 to 5 years 101 47.5 45.5 26.7 - 2.0 23.8 9.9
5 to 10 years 197 46.7 49.7 33.0 1.5 1.5 22.3 6.1
10 to 20 years 114 57.9 47.4 24.6 1.8 3.5 14.0 2.6
20 years or more 96 49.0 47.9 14.6 3.1 7.3 12.5 1.0
No answer 100 38.0 55.0 31.0 4.0 1.0 17.0 11.0
No. of samples Television Radio Newspaper SNSWebsites (other than
SNS)
Volunteer groups or
NPOMinato City
Total 940 34.7 2.3 14.6 8.1 30.4 0.7 6.5
Less than 1 year 131 29.8 - 6.9 9.9 38.9 1.5 3.1
1 to 3 years 201 21.9 2.5 10.9 13.4 34.8 2.0 7.0
3 to 5 years 101 31.7 3.0 13.9 5.0 35.6 - 8.9
5 to 10 years 197 37.6 1.5 15.2 5.6 30.5 - 2.5
10 to 20 years 114 54.4 1.8 21.9 7.0 23.7 0.9 8.8
20 years or more 96 41.7 8.3 24.0 5.2 14.6 - 12.5
No answer 100 35.0 1.0 14.0 7.0 28.0 - 7.0
No. of samples
Other government
offices , such as
those of the
Tokyo Metropolitan
Government
Minato International
AssociationEmbassy Lawyer Other
I do not rely on any
supportNo answer
Total 940 0.3 - 2.1 0.5 2.6 1.6 0.9
Less than 1 year 131 - - - - 3.1 3.1 -
1 to 3 years 201 - - 2.5 1.0 1.5 1.0 0.5
3 to 5 years 101 1.0 - 2.0 - 3.0 2.0 1.0
5 to 10 years 197 - - 3.6 0.5 3.6 0.5 1.5
10 to 20 years 114 0.9 - 1.8 - 1.8 0.9 -
20 years or more 96 1.0 - - 2.1 3.1 3.1 3.1
No answer 100 - - 4.0 - 2.0 2.0 -
Distribution Ratio (%) Total column is no. of data.
Second highest ranking Highest ranking
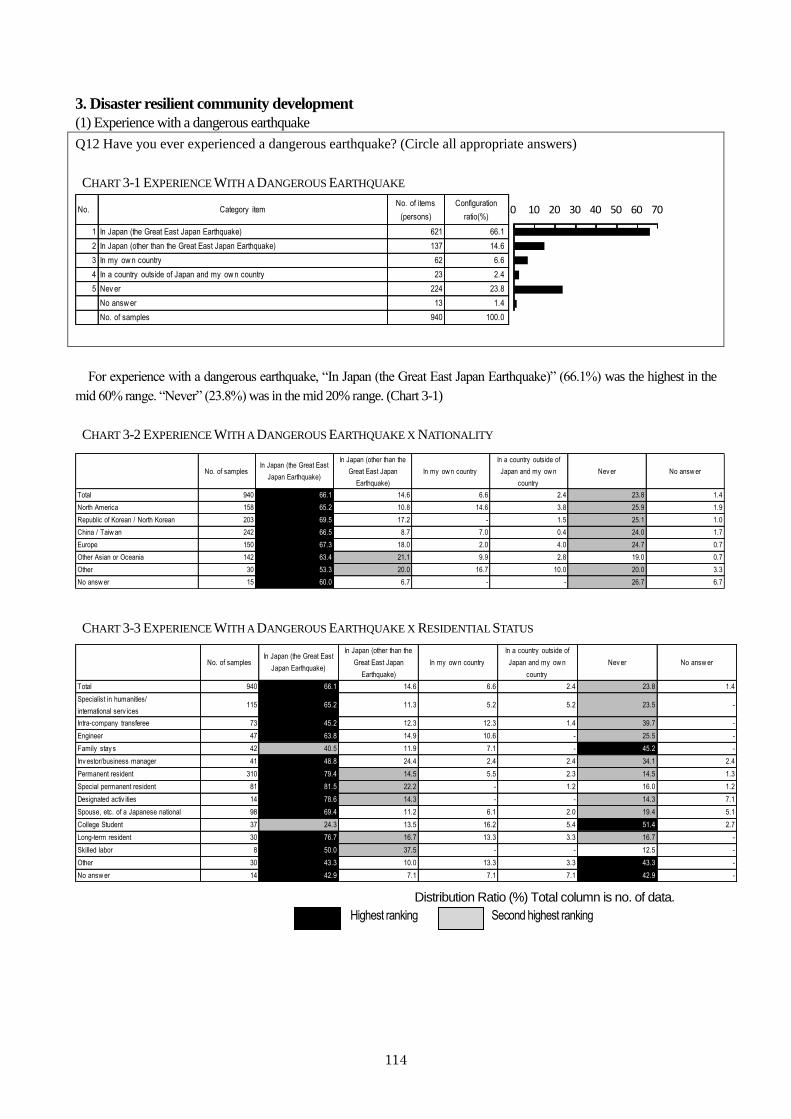
114
3. Disaster resilient community development
(1) Experience with a dangerous earthquake
Q12 Have you ever experienced a dangerous earthquake? (Circle all appropriate answers)
CHART 3-1 EXPERIENCE WITH A DANGEROUS EARTHQUAKE
No. Category itemNo. of items
(persons)
Configuration
ratio(%)
1 In Japan (the Great East Japan Earthquake) 621 66.1
2 In Japan (other than the Great East Japan Earthquake) 137 14.6
3 In my ow n country 62 6.6
4 In a country outside of Japan and my ow n country 23 2.4
5 Nev er 224 23.8
No answ er 13 1.4
No. of samples 940 100.0
0 10 20 30 40 50 60 70
For experience with a dangerous earthquake, “In Japan (the Great East Japan Earthquake)” (66.1%) was the highest in the
mid 60% range. “Never” (23.8%) was in the mid 20% range. (Chart 3-1)
CHART 3-2 EXPERIENCE WITH A DANGEROUS EARTHQUAKE X NATIONALITY
No. of samplesIn Japan (the Great East
Japan Earthquake)
In Japan (other than the
Great East Japan
Earthquake)
In my ow n country
In a country outside of
Japan and my ow n
country
Nev er No answ er
Total 940 66.1 14.6 6.6 2.4 23.8 1.4
North America 158 65.2 10.8 14.6 3.8 25.9 1.9
Republic of Korean / North Korean 203 69.5 17.2 - 1.5 25.1 1.0
China / Taiw an 242 66.5 8.7 7.0 0.4 24.0 1.7
Europe 150 67.3 18.0 2.0 4.0 24.7 0.7
Other Asian or Oceania 142 63.4 21.1 9.9 2.8 19.0 0.7
Other 30 53.3 20.0 16.7 10.0 20.0 3.3
No answ er 15 60.0 6.7 - - 26.7 6.7
CHART 3-3 EXPERIENCE WITH A DANGEROUS EARTHQUAKE X RESIDENTIAL STATUS
No. of samplesIn Japan (the Great East
Japan Earthquake)
In Japan (other than the
Great East Japan
Earthquake)
In my ow n country
In a country outside of
Japan and my ow n
country
Nev er No answ er
Total 940 66.1 14.6 6.6 2.4 23.8 1.4
Specialist in humanities/
international serv ices115 65.2 11.3 5.2 5.2 23.5 -
Intra-company transferee 73 45.2 12.3 12.3 1.4 39.7 -
Engineer 47 63.8 14.9 10.6 - 25.5 -
Family stay s 42 40.5 11.9 7.1 - 45.2 -
Inv estor/business manager 41 48.8 24.4 2.4 2.4 34.1 2.4
Permanent resident 310 79.4 14.5 5.5 2.3 14.5 1.3
Special permanent resident 81 81.5 22.2 - 1.2 16.0 1.2
Designated activ ities 14 78.6 14.3 - - 14.3 7.1
Spouse, etc. of a Japanese national 98 69.4 11.2 6.1 2.0 19.4 5.1
College Student 37 24.3 13.5 16.2 5.4 51.4 2.7
Long-term resident 30 76.7 16.7 13.3 3.3 16.7 -
Skilled labor 8 50.0 37.5 - - 12.5 -
Other 30 43.3 10.0 13.3 3.3 43.3 -
No answ er 14 42.9 7.1 7.1 7.1 42.9 -
Distribution Ratio (%) Total column is no. of data.
Second highest ranking Highest ranking
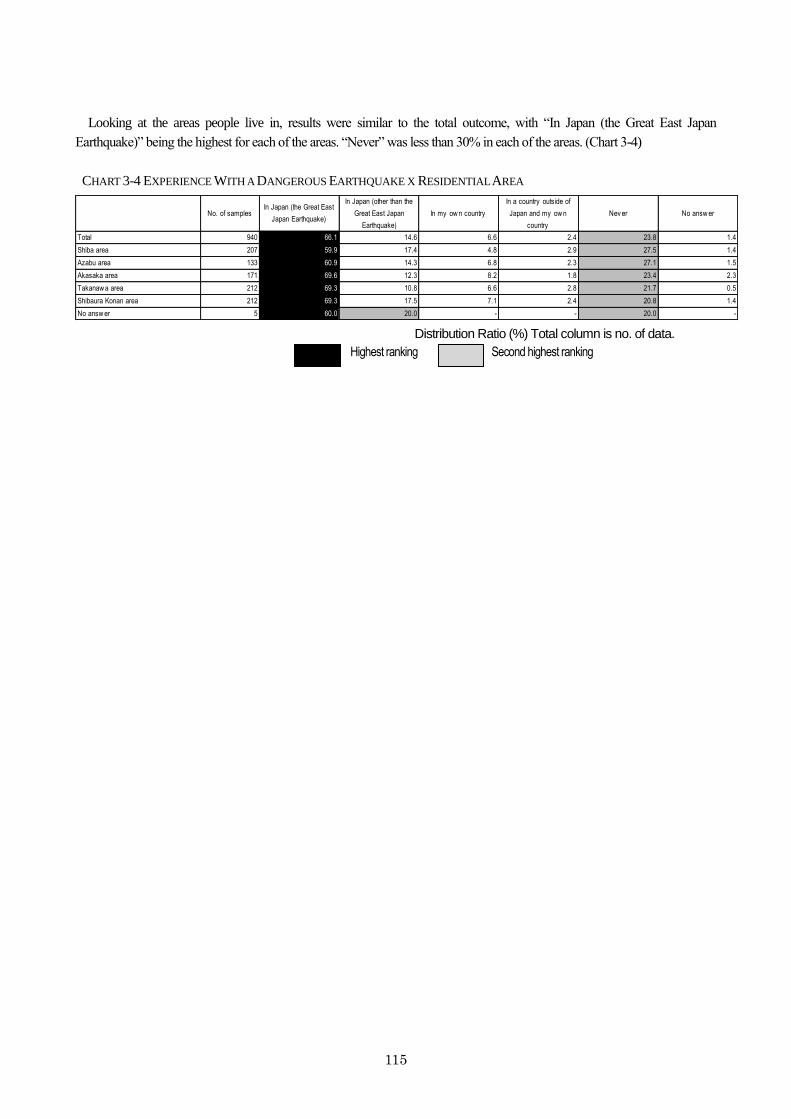
115
Looking at the areas people live in, results were similar to the total outcome, with “In Japan (the Great East Japan
Earthquake)” being the highest for each of the areas. “Never” was less than 30% in each of the areas. (Chart 3-4)
CHART 3-4 EXPERIENCE WITH A DANGEROUS EARTHQUAKE X RESIDENTIAL AREA
No. of samplesIn Japan (the Great East
Japan Earthquake)
In Japan (other than the
Great East Japan
Earthquake)
In my ow n country
In a country outside of
Japan and my ow n
country
Nev er No answ er
Total 940 66.1 14.6 6.6 2.4 23.8 1.4
Shiba area 207 59.9 17.4 4.8 2.9 27.5 1.4
Azabu area 133 60.9 14.3 6.8 2.3 27.1 1.5
Akasaka area 171 69.6 12.3 8.2 1.8 23.4 2.3
Takanaw a area 212 69.3 10.8 6.6 2.8 21.7 0.5
Shibaura Konan area 212 69.3 17.5 7.1 2.4 20.8 1.4
No answ er 5 60.0 20.0 - - 20.0 -
Distribution Ratio (%) Total column is no. of data.
Second highest ranking Highest ranking
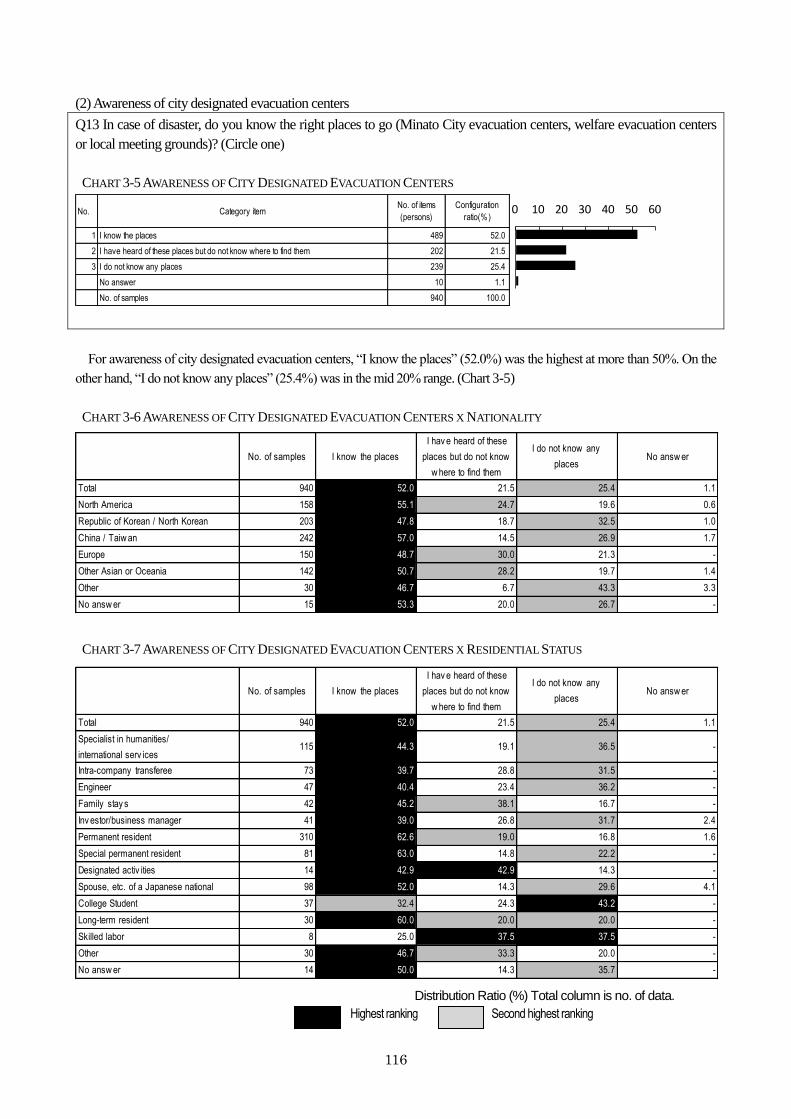
116
(2) Awareness of city designated evacuation centers
Q13 In case of disaster, do you know the right places to go (Minato City evacuation centers, welfare evacuation centers
or local meeting grounds)? (Circle one)
CHART 3-5 AWARENESS OF CITY DESIGNATED EVACUATION CENTERS
No. Category itemNo. of items
(persons)
Configuration
ratio(%)
1 I know the places 489 52.0
2 I have heard of these places but do not know where to find them 202 21.5
3 I do not know any places 239 25.4
No answer 10 1.1
No. of samples 940 100.0
0 10 20 30 40 50 60
For awareness of city designated evacuation centers, “I know the places” (52.0%) was the highest at more than 50%. On the
other hand, “I do not know any places” (25.4%) was in the mid 20% range. (Chart 3-5)
CHART 3-6 AWARENESS OF CITY DESIGNATED EVACUATION CENTERS X NATIONALITY
No. of samples I know the places
I hav e heard of these
places but do not know
w here to find them
I do not know any
placesNo answ er
Total 940 52.0 21.5 25.4 1.1
North America 158 55.1 24.7 19.6 0.6
Republic of Korean / North Korean 203 47.8 18.7 32.5 1.0
China / Taiw an 242 57.0 14.5 26.9 1.7
Europe 150 48.7 30.0 21.3 -
Other Asian or Oceania 142 50.7 28.2 19.7 1.4
Other 30 46.7 6.7 43.3 3.3
No answ er 15 53.3 20.0 26.7 -
CHART 3-7 AWARENESS OF CITY DESIGNATED EVACUATION CENTERS X RESIDENTIAL STATUS
No. of samples I know the places
I hav e heard of these
places but do not know
w here to find them
I do not know any
placesNo answ er
Total 940 52.0 21.5 25.4 1.1
Specialist in humanities/
international serv ices115 44.3 19.1 36.5 -
Intra-company transferee 73 39.7 28.8 31.5 -
Engineer 47 40.4 23.4 36.2 -
Family stay s 42 45.2 38.1 16.7 -
Inv estor/business manager 41 39.0 26.8 31.7 2.4
Permanent resident 310 62.6 19.0 16.8 1.6
Special permanent resident 81 63.0 14.8 22.2 -
Designated activ ities 14 42.9 42.9 14.3 -
Spouse, etc. of a Japanese national 98 52.0 14.3 29.6 4.1
College Student 37 32.4 24.3 43.2 -
Long-term resident 30 60.0 20.0 20.0 -
Skilled labor 8 25.0 37.5 37.5 -
Other 30 46.7 33.3 20.0 -
No answ er 14 50.0 14.3 35.7 -
Distribution Ratio (%) Total column is no. of data.
Second highest ranking Highest ranking
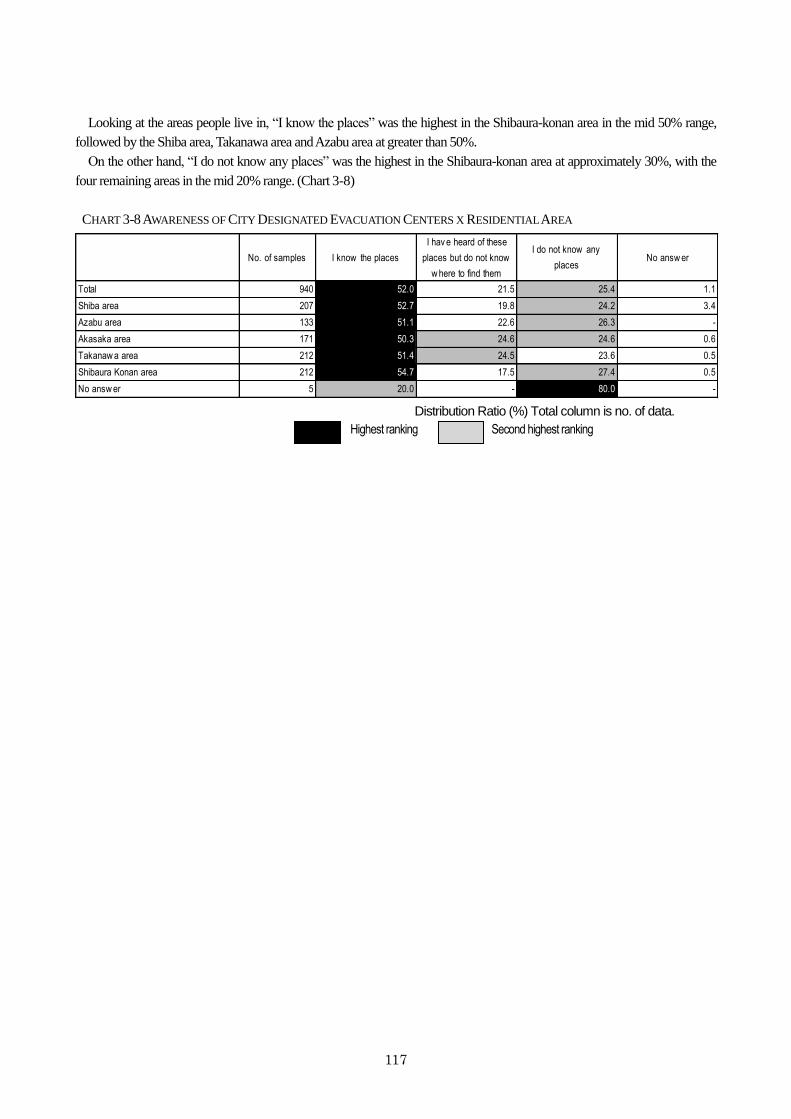
117
Looking at the areas people live in, “I know the places” was the highest in the Shibaura-konan area in the mid 50% range,
followed by the Shiba area, Takanawa area and Azabu area at greater than 50%.
On the other hand, “I do not know any places” was the highest in the Shibaura-konan area at approximately 30%, with the
four remaining areas in the mid 20% range. (Chart 3-8)
CHART 3-8 AWARENESS OF CITY DESIGNATED EVACUATION CENTERS X RESIDENTIAL AREA
No. of samples I know the places
I hav e heard of these
places but do not know
w here to find them
I do not know any
placesNo answ er
Total 940 52.0 21.5 25.4 1.1
Shiba area 207 52.7 19.8 24.2 3.4
Azabu area 133 51.1 22.6 26.3 -
Akasaka area 171 50.3 24.6 24.6 0.6
Takanaw a area 212 51.4 24.5 23.6 0.5
Shibaura Konan area 212 54.7 17.5 27.4 0.5
No answ er 5 20.0 - 80.0 -
Distribution Ratio (%) Total column is no. of data.
Second highest ranking Highest ranking
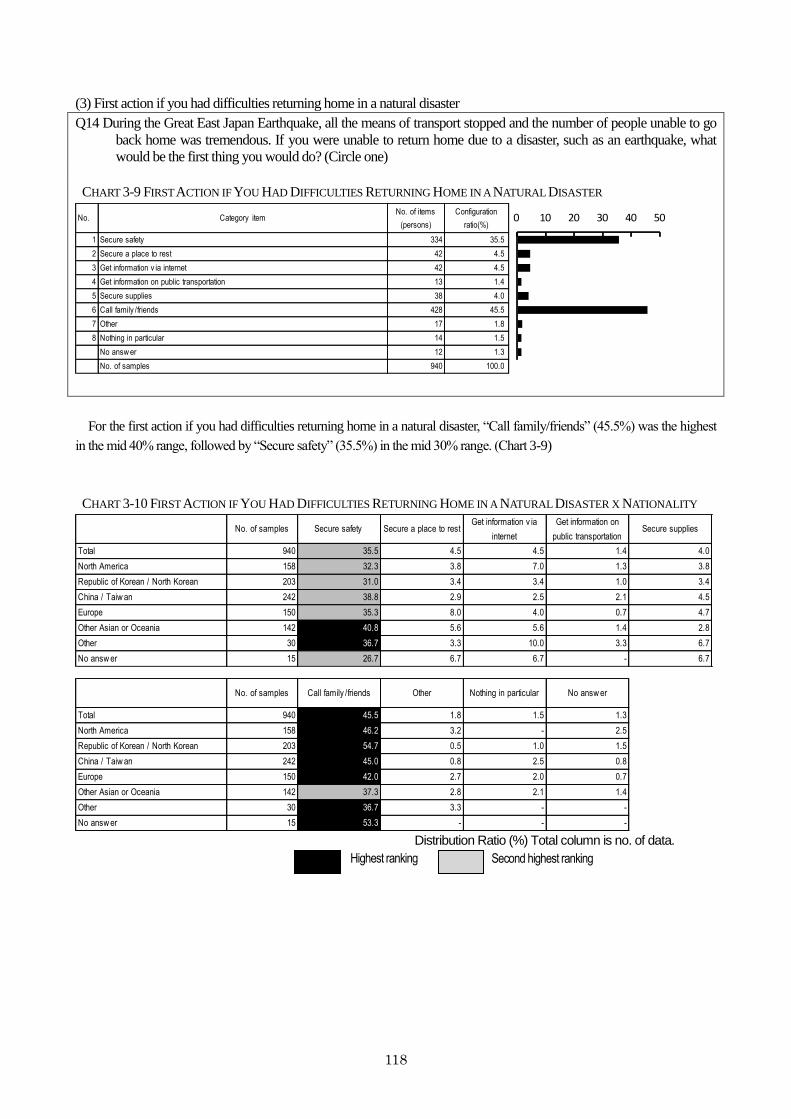
118
(3) First action if you had difficulties returning home in a natural disaster
Q14 During the Great East Japan Earthquake, all the means of transport stopped and the number of people unable to go
back home was tremendous. If you were unable to return home due to a disaster, such as an earthquake, what
would be the first thing you would do? (Circle one)
CHART 3-9 FIRST ACTION IF YOU HAD DIFFICULTIES RETURNING HOME IN A NATURAL DISASTER
No. Category itemNo. of items
(persons)
Configuration
ratio(%)
1 Secure safety 334 35.5
2 Secure a place to rest 42 4.5
3 Get information v ia internet 42 4.5
4 Get information on public transportation 13 1.4
5 Secure supplies 38 4.0
6 Call family /friends 428 45.5
7 Other 17 1.8
8 Nothing in particular 14 1.5
No answ er 12 1.3
No. of samples 940 100.0
0 10 20 30 40 50
For the first action if you had difficulties returning home in a natural disaster, “Call family/friends” (45.5%) was the highest
in the mid 40% range, followed by “Secure safety” (35.5%) in the mid 30% range. (Chart 3-9)
CHART 3-10 FIRST ACTION IF YOU HAD DIFFICULTIES RETURNING HOME IN A NATURAL DISASTER X NATIONALITY
No. of samples Secure safety Secure a place to restGet information v ia
internet
Get information on
public transportationSecure supplies
Total 940 35.5 4.5 4.5 1.4 4.0
North America 158 32.3 3.8 7.0 1.3 3.8
Republic of Korean / North Korean 203 31.0 3.4 3.4 1.0 3.4
China / Taiw an 242 38.8 2.9 2.5 2.1 4.5
Europe 150 35.3 8.0 4.0 0.7 4.7
Other Asian or Oceania 142 40.8 5.6 5.6 1.4 2.8
Other 30 36.7 3.3 10.0 3.3 6.7
No answ er 15 26.7 6.7 6.7 - 6.7
No. of samples Call family /friends Other Nothing in particular No answ er
Total 940 45.5 1.8 1.5 1.3
North America 158 46.2 3.2 - 2.5
Republic of Korean / North Korean 203 54.7 0.5 1.0 1.5
China / Taiw an 242 45.0 0.8 2.5 0.8
Europe 150 42.0 2.7 2.0 0.7
Other Asian or Oceania 142 37.3 2.8 2.1 1.4
Other 30 36.7 3.3 - -
No answ er 15 53.3 - - - Distribution Ratio (%) Total column is no. of data.
Second highest ranking Highest ranking
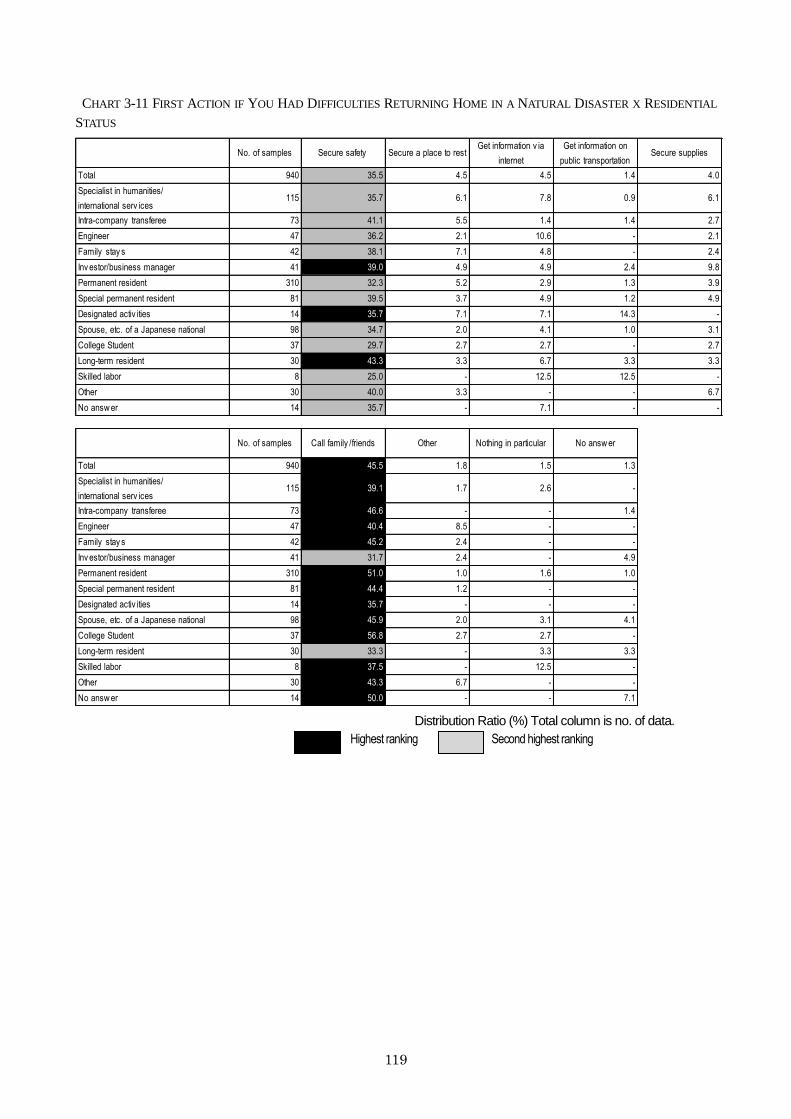
119
CHART 3-11 FIRST ACTION IF YOU HAD DIFFICULTIES RETURNING HOME IN A NATURAL DISASTER X RESIDENTIAL
STATUS
No. of samples Secure safety Secure a place to restGet information v ia
internet
Get information on
public transportationSecure supplies
Total 940 35.5 4.5 4.5 1.4 4.0
Specialist in humanities/
international serv ices115 35.7 6.1 7.8 0.9 6.1
Intra-company transferee 73 41.1 5.5 1.4 1.4 2.7
Engineer 47 36.2 2.1 10.6 - 2.1
Family stay s 42 38.1 7.1 4.8 - 2.4
Inv estor/business manager 41 39.0 4.9 4.9 2.4 9.8
Permanent resident 310 32.3 5.2 2.9 1.3 3.9
Special permanent resident 81 39.5 3.7 4.9 1.2 4.9
Designated activ ities 14 35.7 7.1 7.1 14.3 -
Spouse, etc. of a Japanese national 98 34.7 2.0 4.1 1.0 3.1
College Student 37 29.7 2.7 2.7 - 2.7
Long-term resident 30 43.3 3.3 6.7 3.3 3.3
Skilled labor 8 25.0 - 12.5 12.5 -
Other 30 40.0 3.3 - - 6.7
No answ er 14 35.7 - 7.1 - -
No. of samples Call family /friends Other Nothing in particular No answ er
Total 940 45.5 1.8 1.5 1.3
Specialist in humanities/
international serv ices115 39.1 1.7 2.6 -
Intra-company transferee 73 46.6 - - 1.4
Engineer 47 40.4 8.5 - -
Family stay s 42 45.2 2.4 - -
Inv estor/business manager 41 31.7 2.4 - 4.9
Permanent resident 310 51.0 1.0 1.6 1.0
Special permanent resident 81 44.4 1.2 - -
Designated activ ities 14 35.7 - - -
Spouse, etc. of a Japanese national 98 45.9 2.0 3.1 4.1
College Student 37 56.8 2.7 2.7 -
Long-term resident 30 33.3 - 3.3 3.3
Skilled labor 8 37.5 - 12.5 -
Other 30 43.3 6.7 - -
No answ er 14 50.0 - - 7.1
Distribution Ratio (%) Total column is no. of data.
Second highest ranking Highest ranking
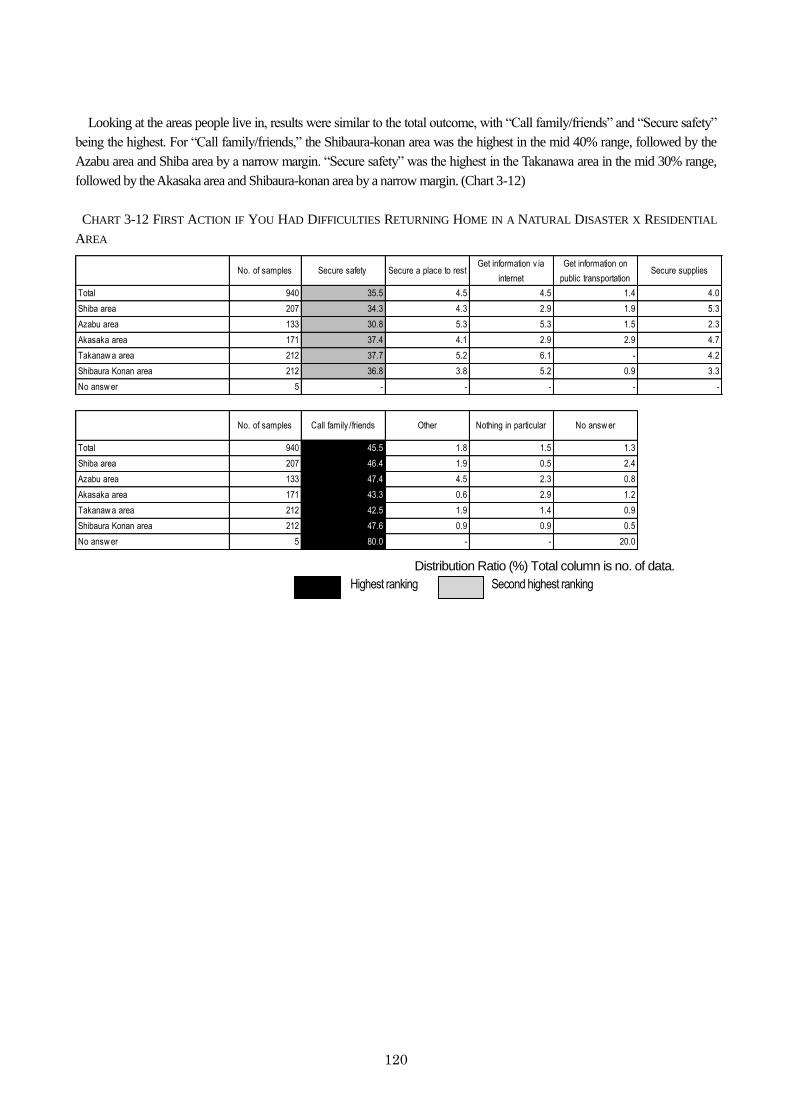
120
Looking at the areas people live in, results were similar to the total outcome, with “Call family/friends” and “Secure safety”
being the highest. For “Call family/friends,” the Shibaura-konan area was the highest in the mid 40% range, followed by the
Azabu area and Shiba area by a narrow margin. “Secure safety” was the highest in the Takanawa area in the mid 30% range,
followed by the Akasaka area and Shibaura-konan area by a narrow margin. (Chart 3-12)
CHART 3-12 FIRST ACTION IF YOU HAD DIFFICULTIES RETURNING HOME IN A NATURAL DISASTER X RESIDENTIAL
AREA
No. of samples Secure safety Secure a place to restGet information v ia
internet
Get information on
public transportationSecure supplies
Total 940 35.5 4.5 4.5 1.4 4.0
Shiba area 207 34.3 4.3 2.9 1.9 5.3
Azabu area 133 30.8 5.3 5.3 1.5 2.3
Akasaka area 171 37.4 4.1 2.9 2.9 4.7
Takanaw a area 212 37.7 5.2 6.1 - 4.2
Shibaura Konan area 212 36.8 3.8 5.2 0.9 3.3
No answ er 5 - - - - -
No. of samples Call family /friends Other Nothing in particular No answ er
Total 940 45.5 1.8 1.5 1.3
Shiba area 207 46.4 1.9 0.5 2.4
Azabu area 133 47.4 4.5 2.3 0.8
Akasaka area 171 43.3 0.6 2.9 1.2
Takanaw a area 212 42.5 1.9 1.4 0.9
Shibaura Konan area 212 47.6 0.9 0.9 0.5
No answ er 5 80.0 - - 20.0
Distribution Ratio (%) Total column is no. of data.
Second highest ranking Highest ranking
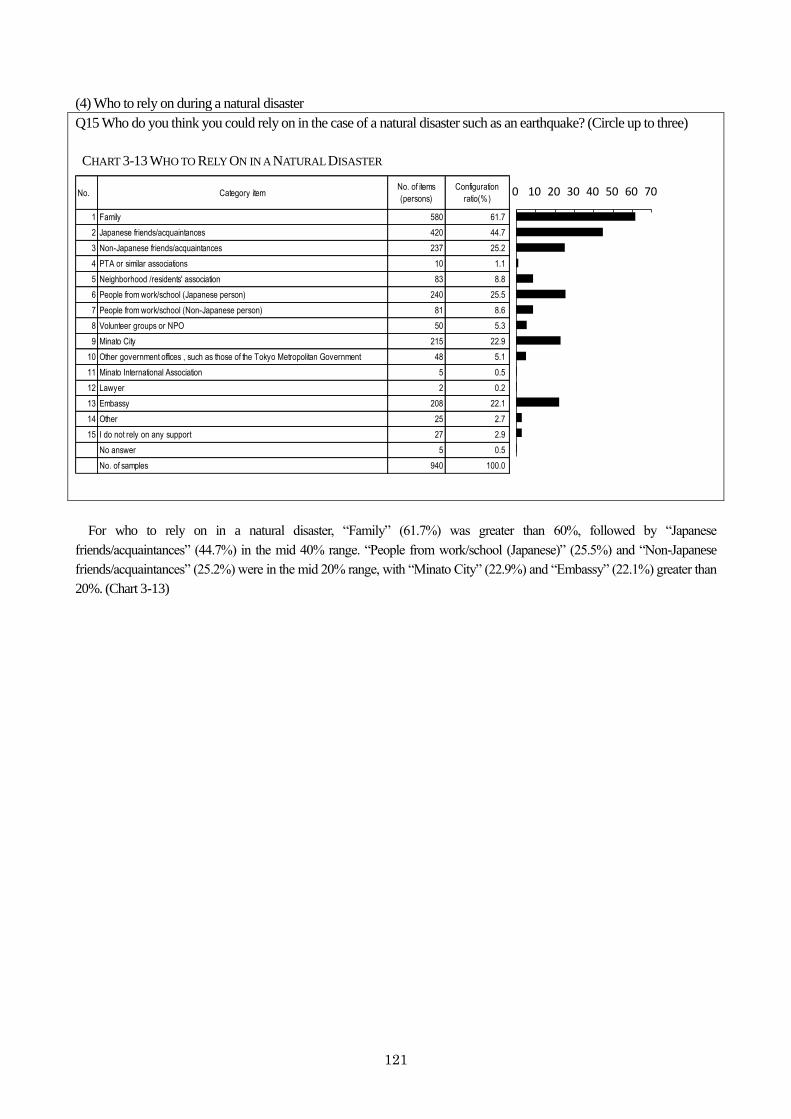
121
(4) Who to rely on during a natural disaster
Q15 Who do you think you could rely on in the case of a natural disaster such as an earthquake? (Circle up to three)
CHART 3-13 WHO TO RELY ON IN A NATURAL DISASTER
No. Category itemNo. of items
(persons)
Configuration
ratio(%)
1 Family 580 61.7
2 Japanese friends/acquaintances 420 44.7
3 Non-Japanese friends/acquaintances 237 25.2
4 PTA or similar associations 10 1.1
5 Neighborhood /residents' association 83 8.8
6 People from work/school (Japanese person) 240 25.5
7 People from work/school (Non-Japanese person) 81 8.6
8 Volunteer groups or NPO 50 5.3
9 Minato City 215 22.9
10 Other government offices , such as those of the Tokyo Metropolitan Government 48 5.1
11 Minato International Association 5 0.5
12 Lawyer 2 0.2
13 Embassy 208 22.1
14 Other 25 2.7
15 I do not rely on any support 27 2.9
No answer 5 0.5
No. of samples 940 100.0
0 10 20 30 40 50 60 70
For who to rely on in a natural disaster, “Family” (61.7%) was greater than 60%, followed by “Japanese
friends/acquaintances” (44.7%) in the mid 40% range. “People from work/school (Japanese)” (25.5%) and “Non-Japanese
friends/acquaintances” (25.2%) were in the mid 20% range, with “Minato City” (22.9%) and “Embassy” (22.1%) greater than
20%. (Chart 3-13)
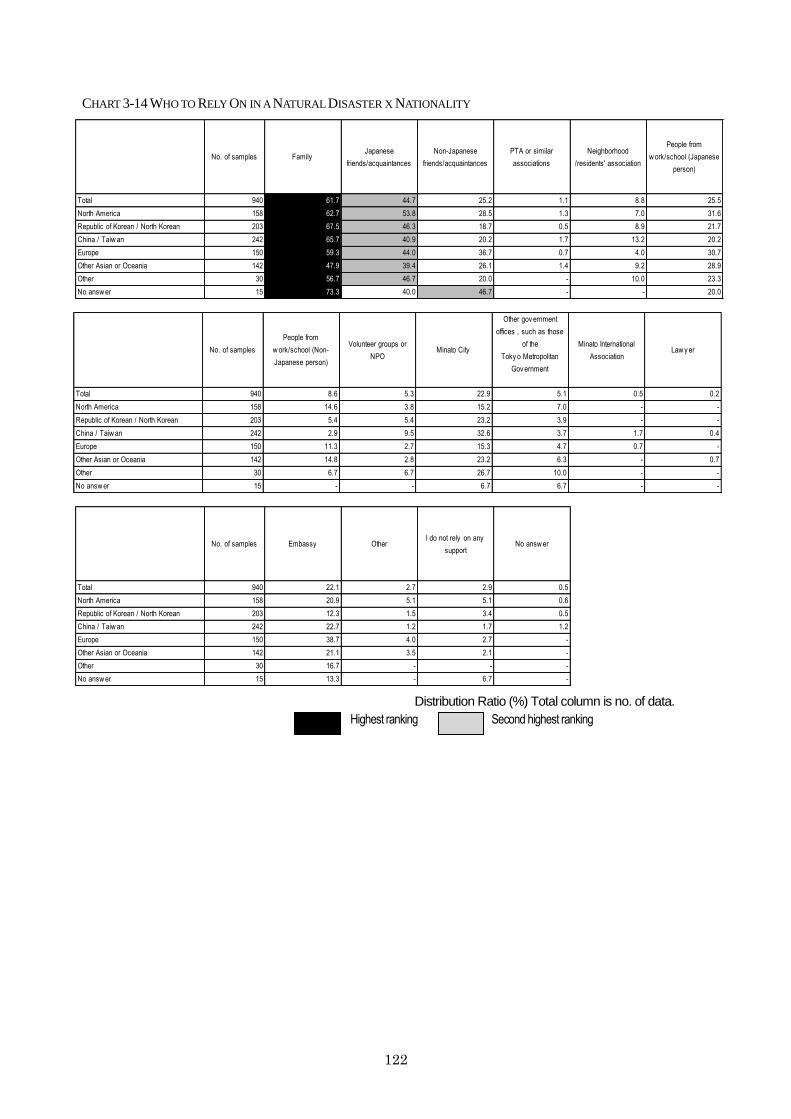
122
CHART 3-14 WHO TO RELY ON IN A NATURAL DISASTER X NATIONALITY
No. of samples FamilyJapanese
friends/acquaintances
Non-Japanese
friends/acquaintances
PTA or similar
associations
Neighborhood
/residents' association
People from
w ork/school (Japanese
person)
Total 940 61.7 44.7 25.2 1.1 8.8 25.5
North America 158 62.7 53.8 28.5 1.3 7.0 31.6
Republic of Korean / North Korean 203 67.5 46.3 18.7 0.5 8.9 21.7
China / Taiw an 242 65.7 40.9 20.2 1.7 13.2 20.2
Europe 150 59.3 44.0 36.7 0.7 4.0 30.7
Other Asian or Oceania 142 47.9 39.4 26.1 1.4 9.2 28.9
Other 30 56.7 46.7 20.0 - 10.0 23.3
No answ er 15 73.3 40.0 46.7 - - 20.0
No. of samples
People from
w ork/school (Non-
Japanese person)
Volunteer groups or
NPOMinato City
Other gov ernment
offices , such as those
of the
Toky o Metropolitan
Gov ernment
Minato International
AssociationLaw y er
Total 940 8.6 5.3 22.9 5.1 0.5 0.2
North America 158 14.6 3.8 15.2 7.0 - -
Republic of Korean / North Korean 203 5.4 5.4 23.2 3.9 - -
China / Taiw an 242 2.9 9.5 32.6 3.7 1.7 0.4
Europe 150 11.3 2.7 15.3 4.7 0.7 -
Other Asian or Oceania 142 14.8 2.8 23.2 6.3 - 0.7
Other 30 6.7 6.7 26.7 10.0 - -
No answ er 15 - - 6.7 6.7 - -
No. of samples Embassy OtherI do not rely on any
supportNo answ er
Total 940 22.1 2.7 2.9 0.5
North America 158 20.9 5.1 5.1 0.6
Republic of Korean / North Korean 203 12.3 1.5 3.4 0.5
China / Taiw an 242 22.7 1.2 1.7 1.2
Europe 150 38.7 4.0 2.7 -
Other Asian or Oceania 142 21.1 3.5 2.1 -
Other 30 16.7 - - -
No answ er 15 13.3 - 6.7 -
Distribution Ratio (%) Total column is no. of data.
Second highest ranking Highest ranking
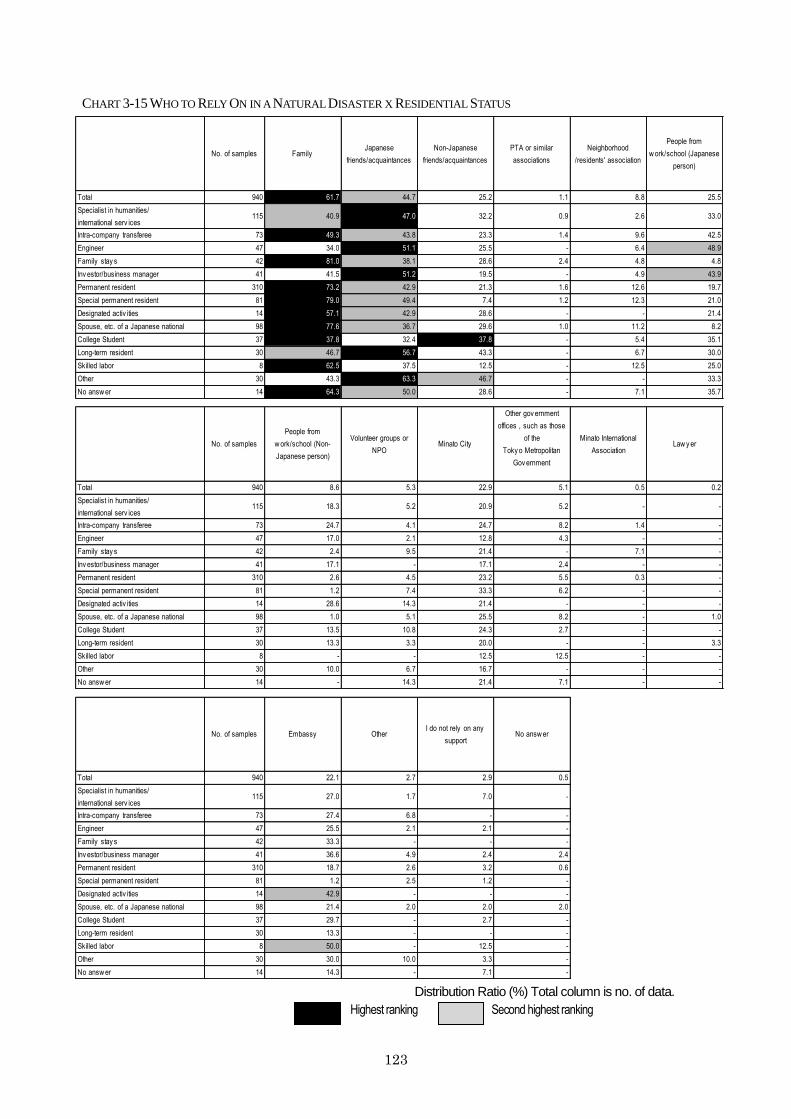
123
CHART 3-15 WHO TO RELY ON IN A NATURAL DISASTER X RESIDENTIAL STATUS
No. of samples FamilyJapanese
friends/acquaintances
Non-Japanese
friends/acquaintances
PTA or similar
associations
Neighborhood
/residents' association
People from
w ork/school (Japanese
person)
Total 940 61.7 44.7 25.2 1.1 8.8 25.5
Specialist in humanities/
international serv ices115 40.9 47.0 32.2 0.9 2.6 33.0
Intra-company transferee 73 49.3 43.8 23.3 1.4 9.6 42.5
Engineer 47 34.0 51.1 25.5 - 6.4 48.9
Family stay s 42 81.0 38.1 28.6 2.4 4.8 4.8
Inv estor/business manager 41 41.5 51.2 19.5 - 4.9 43.9
Permanent resident 310 73.2 42.9 21.3 1.6 12.6 19.7
Special permanent resident 81 79.0 49.4 7.4 1.2 12.3 21.0
Designated activ ities 14 57.1 42.9 28.6 - - 21.4
Spouse, etc. of a Japanese national 98 77.6 36.7 29.6 1.0 11.2 8.2
College Student 37 37.8 32.4 37.8 - 5.4 35.1
Long-term resident 30 46.7 56.7 43.3 - 6.7 30.0
Skilled labor 8 62.5 37.5 12.5 - 12.5 25.0
Other 30 43.3 63.3 46.7 - - 33.3
No answ er 14 64.3 50.0 28.6 - 7.1 35.7
No. of samples
People from
w ork/school (Non-
Japanese person)
Volunteer groups or
NPOMinato City
Other gov ernment
offices , such as those
of the
Toky o Metropolitan
Gov ernment
Minato International
AssociationLaw y er
Total 940 8.6 5.3 22.9 5.1 0.5 0.2
Specialist in humanities/
international serv ices115 18.3 5.2 20.9 5.2 - -
Intra-company transferee 73 24.7 4.1 24.7 8.2 1.4 -
Engineer 47 17.0 2.1 12.8 4.3 - -
Family stay s 42 2.4 9.5 21.4 - 7.1 -
Inv estor/business manager 41 17.1 - 17.1 2.4 - -
Permanent resident 310 2.6 4.5 23.2 5.5 0.3 -
Special permanent resident 81 1.2 7.4 33.3 6.2 - -
Designated activ ities 14 28.6 14.3 21.4 - - -
Spouse, etc. of a Japanese national 98 1.0 5.1 25.5 8.2 - 1.0
College Student 37 13.5 10.8 24.3 2.7 - -
Long-term resident 30 13.3 3.3 20.0 - - 3.3
Skilled labor 8 - - 12.5 12.5 - -
Other 30 10.0 6.7 16.7 - - -
No answ er 14 - 14.3 21.4 7.1 - -
No. of samples Embassy OtherI do not rely on any
supportNo answ er
Total 940 22.1 2.7 2.9 0.5
Specialist in humanities/
international serv ices115 27.0 1.7 7.0 -
Intra-company transferee 73 27.4 6.8 - -
Engineer 47 25.5 2.1 2.1 -
Family stay s 42 33.3 - - -
Inv estor/business manager 41 36.6 4.9 2.4 2.4
Permanent resident 310 18.7 2.6 3.2 0.6
Special permanent resident 81 1.2 2.5 1.2 -
Designated activ ities 14 42.9 - - -
Spouse, etc. of a Japanese national 98 21.4 2.0 2.0 2.0
College Student 37 29.7 - 2.7 -
Long-term resident 30 13.3 - - -
Skilled labor 8 50.0 - 12.5 -
Other 30 30.0 10.0 3.3 -
No answ er 14 14.3 - 7.1 -
Distribution Ratio (%) Total column is no. of data.
Second highest ranking Highest ranking
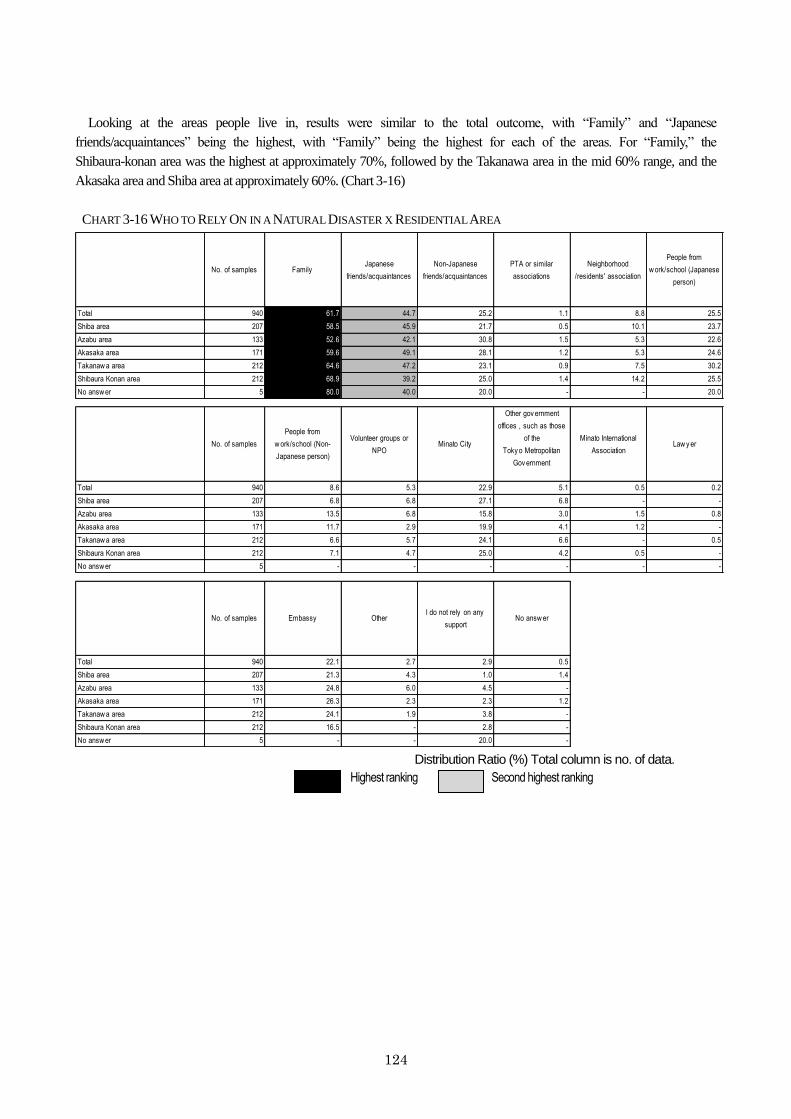
124
Looking at the areas people live in, results were similar to the total outcome, with “Family” and “Japanese
friends/acquaintances” being the highest, with “Family” being the highest for each of the areas. For “Family,” the
Shibaura-konan area was the highest at approximately 70%, followed by the Takanawa area in the mid 60% range, and the
Akasaka area and Shiba area at approximately 60%. (Chart 3-16)
CHART 3-16 WHO TO RELY ON IN A NATURAL DISASTER X RESIDENTIAL AREA
No. of samples FamilyJapanese
friends/acquaintances
Non-Japanese
friends/acquaintances
PTA or similar
associations
Neighborhood
/residents' association
People from
w ork/school (Japanese
person)
Total 940 61.7 44.7 25.2 1.1 8.8 25.5
Shiba area 207 58.5 45.9 21.7 0.5 10.1 23.7
Azabu area 133 52.6 42.1 30.8 1.5 5.3 22.6
Akasaka area 171 59.6 49.1 28.1 1.2 5.3 24.6
Takanaw a area 212 64.6 47.2 23.1 0.9 7.5 30.2
Shibaura Konan area 212 68.9 39.2 25.0 1.4 14.2 25.5
No answ er 5 80.0 40.0 20.0 - - 20.0
No. of samples
People from
w ork/school (Non-
Japanese person)
Volunteer groups or
NPOMinato City
Other gov ernment
offices , such as those
of the
Toky o Metropolitan
Gov ernment
Minato International
AssociationLaw y er
Total 940 8.6 5.3 22.9 5.1 0.5 0.2
Shiba area 207 6.8 6.8 27.1 6.8 - -
Azabu area 133 13.5 6.8 15.8 3.0 1.5 0.8
Akasaka area 171 11.7 2.9 19.9 4.1 1.2 -
Takanaw a area 212 6.6 5.7 24.1 6.6 - 0.5
Shibaura Konan area 212 7.1 4.7 25.0 4.2 0.5 -
No answ er 5 - - - - - -
No. of samples Embassy OtherI do not rely on any
supportNo answ er
Total 940 22.1 2.7 2.9 0.5
Shiba area 207 21.3 4.3 1.0 1.4
Azabu area 133 24.8 6.0 4.5 -
Akasaka area 171 26.3 2.3 2.3 1.2
Takanaw a area 212 24.1 1.9 3.8 -
Shibaura Konan area 212 16.5 - 2.8 -
No answ er 5 - - 20.0 - Distribution Ratio (%) Total column is no. of data.
Second highest ranking Highest ranking
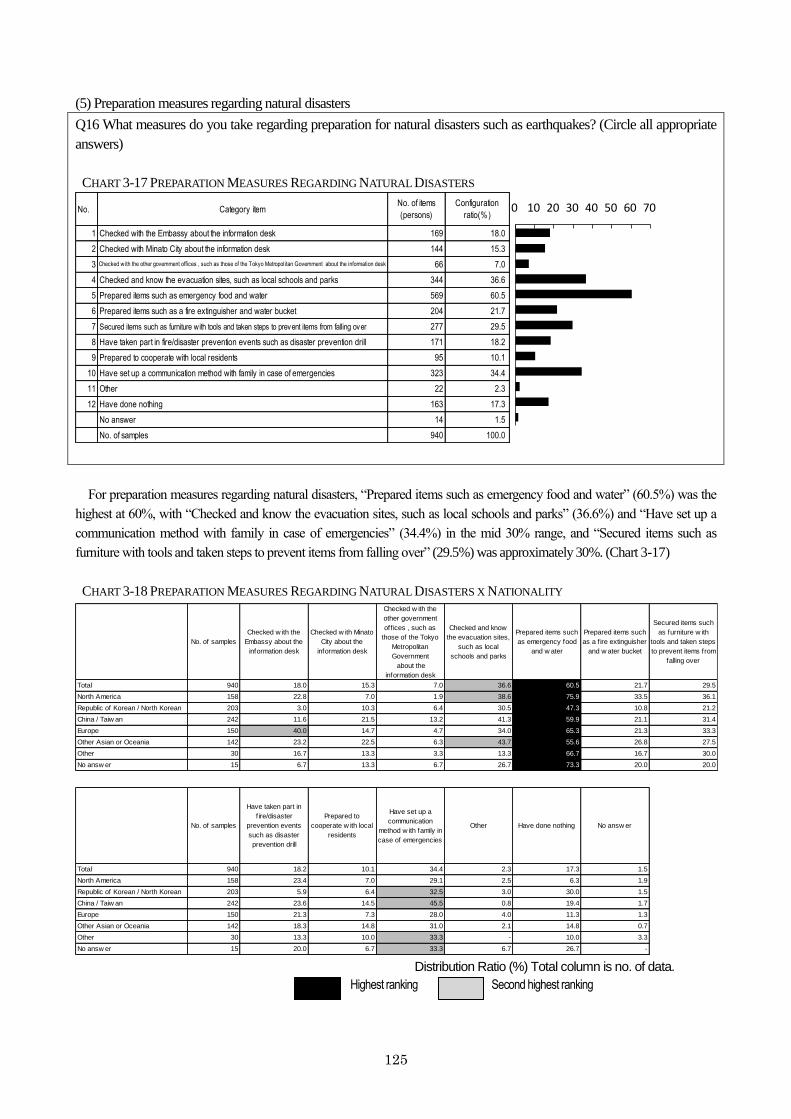
125
(5) Preparation measures regarding natural disasters
Q16 What measures do you take regarding preparation for natural disasters such as earthquakes? (Circle all appropriate
answers)
CHART 3-17 PREPARATION MEASURES REGARDING NATURAL DISASTERS
No. Category itemNo. of items
(persons)
Configuration
ratio(%)
1 Checked with the Embassy about the information desk 169 18.0
2 Checked with Minato City about the information desk 144 15.3
3 Checked with the other government offices , such as those of the Tokyo Metropolitan Government about the information desk 66 7.0
4 Checked and know the evacuation sites, such as local schools and parks 344 36.6
5 Prepared items such as emergency food and water 569 60.5
6 Prepared items such as a fire extinguisher and water bucket 204 21.7
7 Secured items such as furniture with tools and taken steps to prevent items from falling over 277 29.5
8 Have taken part in fire/disaster prevention events such as disaster prevention drill 171 18.2
9 Prepared to cooperate with local residents 95 10.1
10 Have set up a communication method with family in case of emergencies 323 34.4
11 Other 22 2.3
12 Have done nothing 163 17.3
No answer 14 1.5
No. of samples 940 100.0
0 10 20 30 40 50 60 70
For preparation measures regarding natural disasters, “Prepared items such as emergency food and water” (60.5%) was the
highest at 60%, with “Checked and know the evacuation sites, such as local schools and parks” (36.6%) and “Have set up a
communication method with family in case of emergencies” (34.4%) in the mid 30% range, and “Secured items such as
furniture with tools and taken steps to prevent items from falling over” (29.5%) was approximately 30%. (Chart 3-17)
CHART 3-18 PREPARATION MEASURES REGARDING NATURAL DISASTERS X NATIONALITY
No. of samples
Checked w ith the
Embassy about the
information desk
Checked w ith Minato
City about the
information desk
Checked w ith the
other government
off ices , such as
those of the Tokyo
Metropolitan
Government
about the
information desk
Checked and know
the evacuation sites,
such as local
schools and parks
Prepared items such
as emergency food
and w ater
Prepared items such
as a f ire extinguisher
and w ater bucket
Secured items such
as furniture w ith
tools and taken steps
to prevent items from
falling over
Total 940 18.0 15.3 7.0 36.6 60.5 21.7 29.5
North America 158 22.8 7.0 1.9 38.6 75.9 33.5 36.1
Republic of Korean / North Korean 203 3.0 10.3 6.4 30.5 47.3 10.8 21.2
China / Taiw an 242 11.6 21.5 13.2 41.3 59.9 21.1 31.4
Europe 150 40.0 14.7 4.7 34.0 65.3 21.3 33.3
Other Asian or Oceania 142 23.2 22.5 6.3 43.7 55.6 26.8 27.5
Other 30 16.7 13.3 3.3 13.3 66.7 16.7 30.0
No answ er 15 6.7 13.3 6.7 26.7 73.3 20.0 20.0
No. of samples
Have taken part in
fire/disaster
prevention events
such as disaster
prevention drill
Prepared to
cooperate w ith local
residents
Have set up a
communication
method w ith family in
case of emergencies
Other Have done nothing No answ er
Total 940 18.2 10.1 34.4 2.3 17.3 1.5
North America 158 23.4 7.0 29.1 2.5 6.3 1.9
Republic of Korean / North Korean 203 5.9 6.4 32.5 3.0 30.0 1.5
China / Taiw an 242 23.6 14.5 45.5 0.8 19.4 1.7
Europe 150 21.3 7.3 28.0 4.0 11.3 1.3
Other Asian or Oceania 142 18.3 14.8 31.0 2.1 14.8 0.7
Other 30 13.3 10.0 33.3 - 10.0 3.3
No answ er 15 20.0 6.7 33.3 6.7 26.7 - Distribution Ratio (%) Total column is no. of data.
Second highest ranking Highest ranking
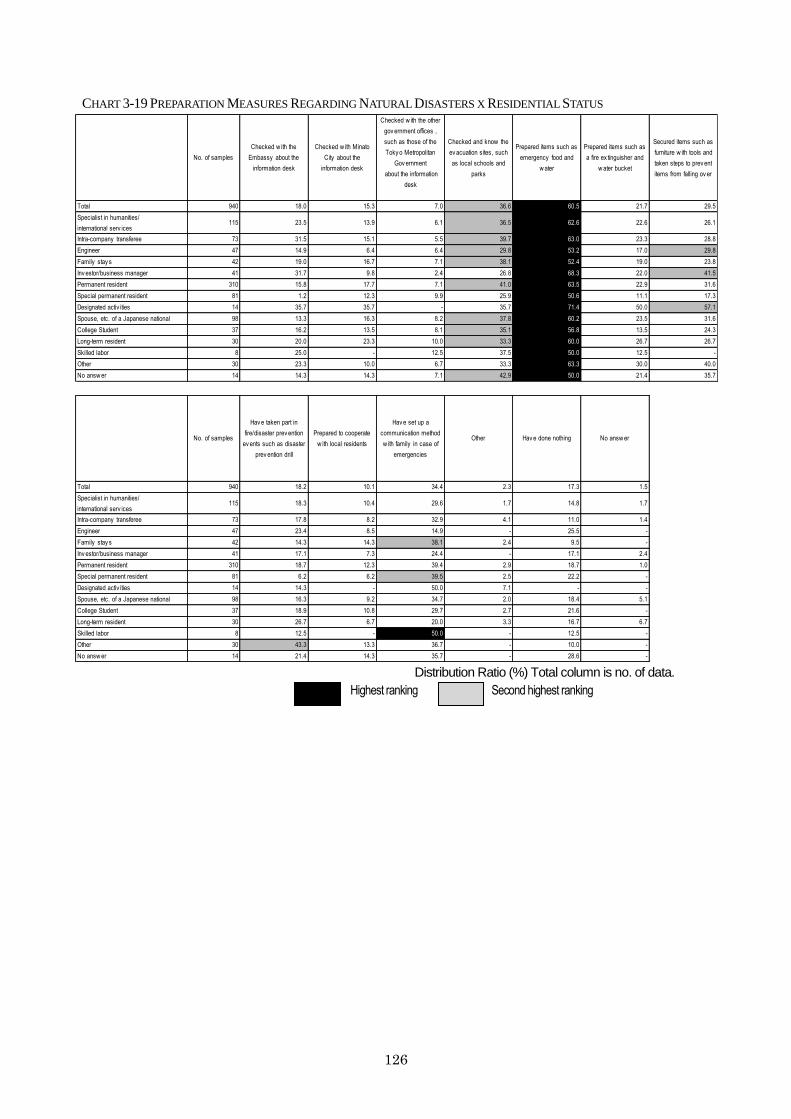
126
CHART 3-19 PREPARATION MEASURES REGARDING NATURAL DISASTERS X RESIDENTIAL STATUS
No. of samples
Checked w ith the
Embassy about the
information desk
Checked w ith Minato
City about the
information desk
Checked w ith the other
gov ernment offices ,
such as those of the
Toky o Metropolitan
Gov ernment
about the information
desk
Checked and know the
ev acuation sites, such
as local schools and
parks
Prepared items such as
emergency food and
w ater
Prepared items such as
a fire ex tinguisher and
w ater bucket
Secured items such as
furniture w ith tools and
taken steps to prev ent
items from falling ov er
Total 940 18.0 15.3 7.0 36.6 60.5 21.7 29.5
Specialist in humanities/
international serv ices115 23.5 13.9 6.1 36.5 62.6 22.6 26.1
Intra-company transferee 73 31.5 15.1 5.5 39.7 63.0 23.3 28.8
Engineer 47 14.9 6.4 6.4 29.8 53.2 17.0 29.8
Family stay s 42 19.0 16.7 7.1 38.1 52.4 19.0 23.8
Inv estor/business manager 41 31.7 9.8 2.4 26.8 68.3 22.0 41.5
Permanent resident 310 15.8 17.7 7.1 41.0 63.5 22.9 31.6
Special permanent resident 81 1.2 12.3 9.9 25.9 50.6 11.1 17.3
Designated activ ities 14 35.7 35.7 - 35.7 71.4 50.0 57.1
Spouse, etc. of a Japanese national 98 13.3 16.3 8.2 37.8 60.2 23.5 31.6
College Student 37 16.2 13.5 8.1 35.1 56.8 13.5 24.3
Long-term resident 30 20.0 23.3 10.0 33.3 60.0 26.7 26.7
Skilled labor 8 25.0 - 12.5 37.5 50.0 12.5 -
Other 30 23.3 10.0 6.7 33.3 63.3 30.0 40.0
No answ er 14 14.3 14.3 7.1 42.9 50.0 21.4 35.7
No. of samples
Hav e taken part in
fire/disaster prev ention
ev ents such as disaster
prev ention drill
Prepared to cooperate
w ith local residents
Hav e set up a
communication method
w ith family in case of
emergencies
Other Hav e done nothing No answ er
Total 940 18.2 10.1 34.4 2.3 17.3 1.5
Specialist in humanities/
international serv ices115 18.3 10.4 29.6 1.7 14.8 1.7
Intra-company transferee 73 17.8 8.2 32.9 4.1 11.0 1.4
Engineer 47 23.4 8.5 14.9 - 25.5 -
Family stay s 42 14.3 14.3 38.1 2.4 9.5 -
Inv estor/business manager 41 17.1 7.3 24.4 - 17.1 2.4
Permanent resident 310 18.7 12.3 39.4 2.9 18.7 1.0
Special permanent resident 81 6.2 6.2 39.5 2.5 22.2 -
Designated activ ities 14 14.3 - 50.0 7.1 - -
Spouse, etc. of a Japanese national 98 16.3 9.2 34.7 2.0 18.4 5.1
College Student 37 18.9 10.8 29.7 2.7 21.6 -
Long-term resident 30 26.7 6.7 20.0 3.3 16.7 6.7
Skilled labor 8 12.5 - 50.0 - 12.5 -
Other 30 43.3 13.3 36.7 - 10.0 -
No answ er 14 21.4 14.3 35.7 - 28.6 - Distribution Ratio (%) Total column is no. of data.
Second highest ranking Highest ranking
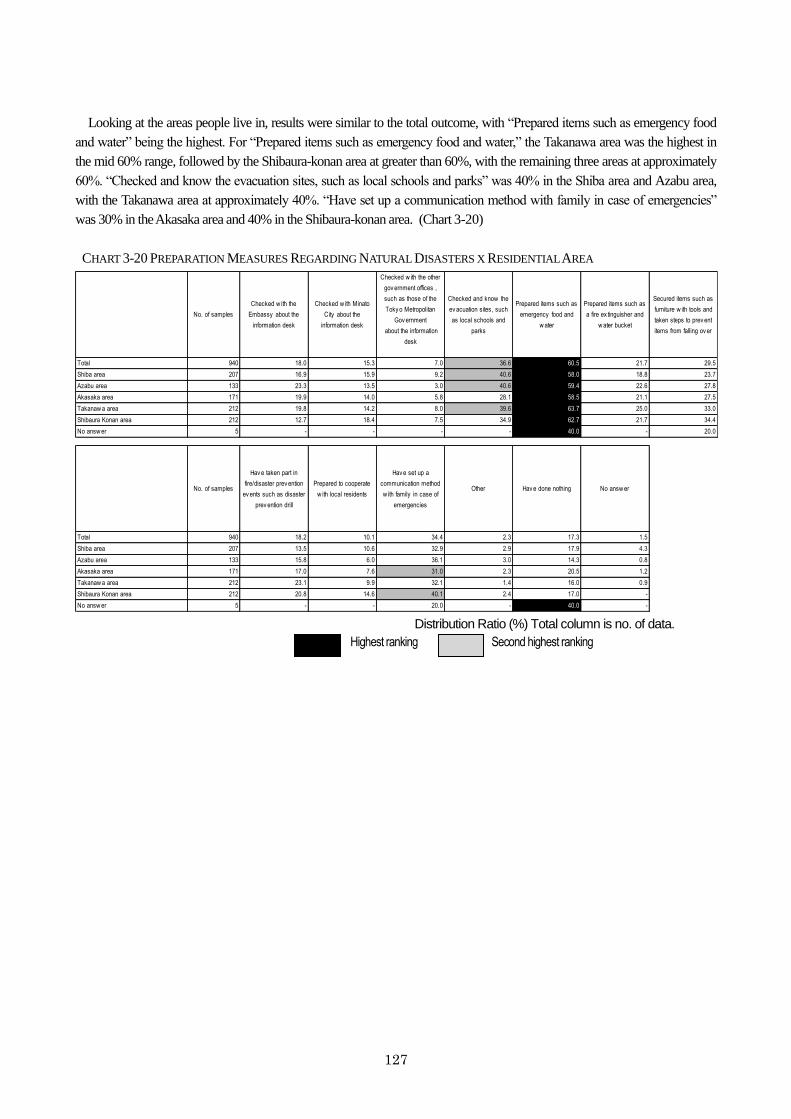
127
Looking at the areas people live in, results were similar to the total outcome, with “Prepared items such as emergency food
and water” being the highest. For “Prepared items such as emergency food and water,” the Takanawa area was the highest in
the mid 60% range, followed by the Shibaura-konan area at greater than 60%, with the remaining three areas at approximately
60%. “Checked and know the evacuation sites, such as local schools and parks” was 40% in the Shiba area and Azabu area,
with the Takanawa area at approximately 40%. “Have set up a communication method with family in case of emergencies”
was 30% in the Akasaka area and 40% in the Shibaura-konan area. (Chart 3-20)
CHART 3-20 PREPARATION MEASURES REGARDING NATURAL DISASTERS X RESIDENTIAL AREA
No. of samples
Checked w ith the
Embassy about the
information desk
Checked w ith Minato
City about the
information desk
Checked w ith the other
gov ernment offices ,
such as those of the
Toky o Metropolitan
Gov ernment
about the information
desk
Checked and know the
ev acuation sites, such
as local schools and
parks
Prepared items such as
emergency food and
w ater
Prepared items such as
a fire ex tinguisher and
w ater bucket
Secured items such as
furniture w ith tools and
taken steps to prev ent
items from falling ov er
Total 940 18.0 15.3 7.0 36.6 60.5 21.7 29.5
Shiba area 207 16.9 15.9 9.2 40.6 58.0 18.8 23.7
Azabu area 133 23.3 13.5 3.0 40.6 59.4 22.6 27.8
Akasaka area 171 19.9 14.0 5.8 28.1 58.5 21.1 27.5
Takanaw a area 212 19.8 14.2 8.0 39.6 63.7 25.0 33.0
Shibaura Konan area 212 12.7 18.4 7.5 34.9 62.7 21.7 34.4
No answ er 5 - - - - 40.0 - 20.0
No. of samples
Hav e taken part in
fire/disaster prev ention
ev ents such as disaster
prev ention drill
Prepared to cooperate
w ith local residents
Hav e set up a
communication method
w ith family in case of
emergencies
Other Hav e done nothing No answ er
Total 940 18.2 10.1 34.4 2.3 17.3 1.5
Shiba area 207 13.5 10.6 32.9 2.9 17.9 4.3
Azabu area 133 15.8 6.0 36.1 3.0 14.3 0.8
Akasaka area 171 17.0 7.6 31.0 2.3 20.5 1.2
Takanaw a area 212 23.1 9.9 32.1 1.4 16.0 0.9
Shibaura Konan area 212 20.8 14.6 40.1 2.4 17.0 -
No answ er 5 - - 20.0 - 40.0 - Distribution Ratio (%) Total column is no. of data.
Second highest ranking Highest ranking
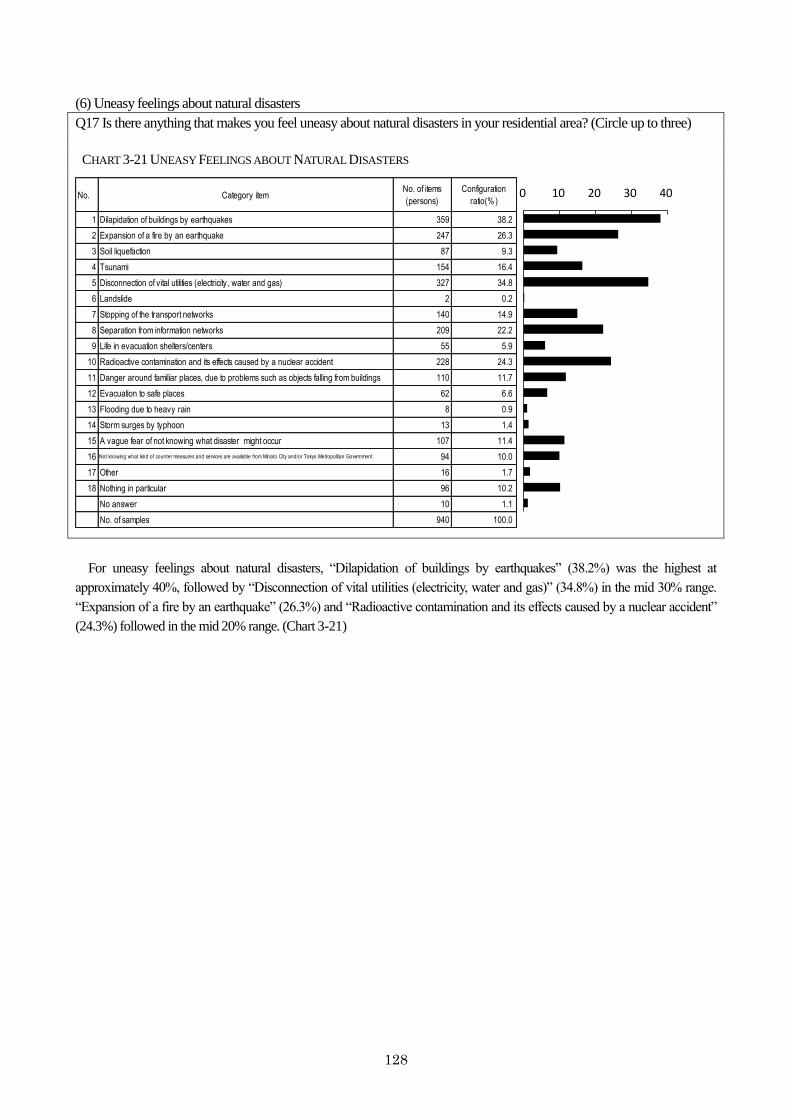
128
(6) Uneasy feelings about natural disasters
Q17 Is there anything that makes you feel uneasy about natural disasters in your residential area? (Circle up to three)
CHART 3-21 UNEASY FEELINGS ABOUT NATURAL DISASTERS
No. Category itemNo. of items
(persons)
Configuration
ratio(%)
1 Dilapidation of buildings by earthquakes 359 38.2
2 Expansion of a fire by an earthquake 247 26.3
3 Soil liquefaction 87 9.3
4 Tsunami 154 16.4
5 Disconnection of vital utilities (electricity, water and gas) 327 34.8
6 Landslide 2 0.2
7 Stopping of the transport networks 140 14.9
8 Separation from information networks 209 22.2
9 Life in evacuation shelters/centers 55 5.9
10 Radioactive contamination and its effects caused by a nuclear accident 228 24.3
11 Danger around familiar places, due to problems such as objects falling from buildings 110 11.7
12 Evacuation to safe places 62 6.6
13 Flooding due to heavy rain 8 0.9
14 Storm surges by typhoon 13 1.4
15 A vague fear of not knowing what disaster might occur 107 11.4
16 Not knowing what kind of counter measures and services are available from Minato City and/or Tokyo Metropolitan Government 94 10.0
17 Other 16 1.7
18 Nothing in particular 96 10.2
No answer 10 1.1
No. of samples 940 100.0
0 10 20 30 40
For uneasy feelings about natural disasters, “Dilapidation of buildings by earthquakes” (38.2%) was the highest at
approximately 40%, followed by “Disconnection of vital utilities (electricity, water and gas)” (34.8%) in the mid 30% range.
“Expansion of a fire by an earthquake” (26.3%) and “Radioactive contamination and its effects caused by a nuclear accident”
(24.3%) followed in the mid 20% range. (Chart 3-21)
129
CHART 3-22 UNEASY FEELINGS ABOUT NATURAL DISASTERS X NATIONALITY
No. of samples
Dilapidation of
buildings by
earthquakes
Ex pansion of a fire
by an earthquakeSoil liquefaction Tsunami
Disconnection of
v ital utilities
(electricity , w ater
and gas)
LandslideStopping of the
transport netw orks
Total 940 38.2 26.3 9.3 16.4 34.8 0.2 14.9
North America 158 27.8 20.9 7.6 12.0 41.8 - 14.6
Republic of Korean / North Korean 203 49.8 28.6 13.8 16.3 39.9 - 17.7
China / Taiw an 242 46.3 24.8 9.5 18.6 33.5 - 14.0
Europe 150 32.7 34.7 8.0 16.0 31.3 - 12.7
Other Asian or Oceania 142 28.9 22.5 4.9 14.8 25.4 0.7 15.5
Other 30 20.0 23.3 10.0 23.3 33.3 - 16.7
No answ er 15 40.0 33.3 13.3 33.3 40.0 6.7 6.7
No. of samplesSeparation from
information netw orks
Life in ev acuation
shelters/centers
Radioactiv e
contamination and its
effects caused by a
nuclear accident
Danger around
familiar places, due
to problems such as
objects falling from
buildings
Ev acuation to safe
places
Flooding due to
heav y rain
Storm surges by
ty phoon
Total 940 22.2 5.9 24.3 11.7 6.6 0.9 1.4
North America 158 29.7 4.4 27.8 11.4 6.3 0.6 -
Republic of Korean / North Korean 203 18.7 6.4 17.7 13.8 10.8 0.5 0.5
China / Taiw an 242 21.5 5.8 23.1 13.6 2.9 2.1 2.5
Europe 150 21.3 5.3 34.0 8.0 5.3 0.7 2.0
Other Asian or Oceania 142 22.5 6.3 19.0 11.3 7.7 - 2.1
Other 30 16.7 3.3 30.0 6.7 13.3 - -
No answ er 15 20.0 20.0 33.3 6.7 - - -
No. of samples
A v ague fear of not
know ing w hat
disaster might occur
Not know ing w hat
kind of counter
measures and
serv ices are
av ailable from
Minato city and/or
Toky o Metropolitan
Gov ernment
Other Nothing in particular No answ er
Total 940 11.4 10.0 1.7 10.2 1.1
North America 158 12.0 10.1 3.2 10.1 0.6
Republic of Korean / North Korean 203 13.3 8.9 1.0 5.4 0.5
China / Taiw an 242 13.2 10.3 0.8 9.1 1.7
Europe 150 7.3 9.3 3.3 12.7 2.0
Other Asian or Oceania 142 7.7 12.7 1.4 18.3 -
Other 30 16.7 3.3 - 6.7 3.3
No answ er 15 13.3 13.3 - - -
Distribution Ratio (%) Total column is no. of data.
Second highest ranking Highest ranking
130
CHART 3-23 UNEASY FEELINGS ABOUT NATURAL DISASTERS X RESIDENTIAL STATUS
No. of samples
Dilapidation of
buildings by
earthquakes
Ex pansion of a fire
by an earthquakeSoil liquefaction Tsunami
Disconnection of
v ital utilities
(electricity , w ater
and gas)
LandslideStopping of the
transport netw orks
Total 940 38.2 26.3 9.3 16.4 34.8 0.2 14.9
Specialist in humanities/
international serv ices115 35.7 25.2 7.8 13.9 27.8 - 11.3
Intra-company transferee 73 20.5 31.5 6.8 26.0 24.7 - 13.7
Engineer 47 36.2 17.0 12.8 10.6 29.8 2.1 19.1
Family stay s 42 28.6 21.4 9.5 28.6 21.4 - 14.3
Inv estor/business manager 41 34.1 24.4 4.9 17.1 29.3 - 12.2
Permanent resident 310 43.5 29.7 11.9 13.9 39.7 0.3 14.8
Special permanent resident 81 50.6 32.1 8.6 11.1 49.4 - 18.5
Designated activ ities 14 35.7 21.4 - 28.6 21.4 - 28.6
Spouse, etc. of a Japanese national 98 40.8 29.6 12.2 24.5 35.7 - 15.3
College Student 37 32.4 18.9 5.4 10.8 37.8 - 16.2
Long-term resident 30 53.3 6.7 6.7 16.7 40.0 - 13.3
Skilled labor 8 12.5 12.5 - 12.5 25.0 - 37.5
Other 30 26.7 23.3 3.3 10.0 33.3 - 6.7
No answ er 14 14.3 7.1 - 14.3 21.4 - 14.3
No. of samplesSeparation from
information netw orks
Life in ev acuation
shelters/centers
Radioactiv e
contamination and its
effects caused by a
nuclear accident
Danger around
familiar places, due
to problems such as
objects falling from
buildings
Ev acuation to safe
places
Flooding due to
heav y rain
Storm surges by
ty phoon
Total 940 22.2 5.9 24.3 11.7 6.6 0.9 1.4
Specialist in humanities/
international serv ices115 22.6 6.1 24.3 10.4 6.1 - 2.6
Intra-company transferee 73 26.0 2.7 27.4 9.6 11.0 - -
Engineer 47 21.3 12.8 36.2 6.4 12.8 - 2.1
Family stay s 42 14.3 7.1 38.1 9.5 4.8 - 2.4
Inv estor/business manager 41 31.7 2.4 34.1 4.9 7.3 - 2.4
Permanent resident 310 20.6 8.1 20.3 14.8 5.8 0.6 0.3
Special permanent resident 81 16.0 7.4 13.6 11.1 8.6 1.2 1.2
Designated activ ities 14 14.3 - 35.7 - - - -
Spouse, etc. of a Japanese national 98 22.4 1.0 21.4 15.3 3.1 3.1 -
College Student 37 29.7 8.1 27.0 13.5 2.7 2.7 10.8
Long-term resident 30 23.3 - 30.0 6.7 3.3 3.3 -
Skilled labor 8 25.0 - 12.5 - - - 12.5
Other 30 30.0 - 23.3 10.0 16.7 - -
No answ er 14 35.7 7.1 42.9 14.3 7.1 - -
No. of samples
A v ague fear of not
know ing w hat
disaster might occur
Not know ing w hat
kind of counter
measures and
serv ices are
av ailable from
Minato city and/or
Toky o Metropolitan
Gov ernment
Other Nothing in particular No answ er
Total 940 11.4 10.0 1.7 10.2 1.1
Specialist in humanities/
international serv ices115 15.7 14.8 1.7 11.3 0.9
Intra-company transferee 73 11.0 13.7 - 12.3 1.4
Engineer 47 8.5 8.5 4.3 10.6 -
Family stay s 42 21.4 16.7 - 11.9 -
Inv estor/business manager 41 4.9 12.2 7.3 7.3 2.4
Permanent resident 310 8.1 7.4 1.9 9.7 0.3
Special permanent resident 81 8.6 6.2 - 9.9 -
Designated activ ities 14 28.6 7.1 - 7.1 7.1
Spouse, etc. of a Japanese national 98 16.3 6.1 1.0 7.1 4.1
College Student 37 13.5 16.2 - 8.1 -
Long-term resident 30 10.0 3.3 - 13.3 3.3
Skilled labor 8 - - - 25.0 -
Other 30 6.7 26.7 6.7 10.0 -
No answ er 14 28.6 7.1 - 21.4 - Distribution Ratio (%) Total column is no. of data.
Second highest ranking Highest ranking
131
Looking at the areas people live in, results were similar to the total outcome, with “Dilapidation of buildings by earthquakes”
and “Disconnection of vital utilities (electricity, water, and gas)” being the highest. For “Dilapidation of buildings by
earthquakes,” the Azabu area was greater than 40% and the Akasaka area and Shibaura-konan area were approximately 40%.
“Disconnection of vital utilities (electricity, water, and gas) was relatively high at approximately 40% in the Takanawa area.
(Chart 3-24)
CHART 3-24 UNEASY FEELINGS ABOUT NATURAL DISASTERS X RESIDENTIAL AREA
No. of samples
Dilapidation of
buildings by
earthquakes
Ex pansion of a fire
by an earthquakeSoil liquefaction Tsunami
Disconnection of
v ital utilities
(electricity , w ater
and gas)
LandslideStopping of the
transport netw orks
Total 940 38.2 26.3 9.3 16.4 34.8 0.2 14.9
Shiba area 207 35.3 33.8 4.3 14.5 34.3 - 14.0
Azabu area 133 42.9 23.3 5.3 11.3 28.6 - 16.5
Akasaka area 171 39.8 22.2 2.3 8.8 35.7 0.6 14.6
Takanaw a area 212 36.8 29.7 3.8 11.3 38.2 - 12.3
Shibaura Konan area 212 39.2 21.2 27.8 32.5 35.8 0.5 17.5
No answ er 5 - - - 20.0 - - 20.0
No. of samplesSeparation from
information netw orks
Life in ev acuation
shelters/centers
Radioactiv e
contamination and its
effects caused by a
nuclear accident
Danger around
familiar places, due
to problems such as
objects falling from
buildings
Ev acuation to safe
places
Flooding due to
heav y rain
Storm surges by
ty phoon
Total 940 22.2 5.9 24.3 11.7 6.6 0.9 1.4
Shiba area 207 24.2 5.8 26.6 16.9 5.3 1.0 1.9
Azabu area 133 23.3 3.0 18.8 11.3 9.8 0.8 -
Akasaka area 171 20.5 5.8 33.3 12.9 5.8 - 0.6
Takanaw a area 212 23.1 10.4 27.8 8.5 5.7 0.9 0.5
Shibaura Konan area 212 20.3 2.8 14.6 9.0 7.5 1.4 3.3
No answ er 5 20.0 20.0 20.0 20.0 - - -
No. of samples
A v ague fear of not
know ing w hat
disaster might occur
Not know ing w hat
kind of counter
measures and
serv ices are
av ailable from
Minato city and/or
Toky o Metropolitan
Gov ernment
Other Nothing in particular No answ er
Total 940 11.4 10.0 1.7 10.2 1.1
Shiba area 207 8.2 5.8 1.0 12.1 2.4
Azabu area 133 15.0 10.5 2.3 9.8 -
Akasaka area 171 13.5 11.1 - 13.5 1.8
Takanaw a area 212 13.2 12.3 3.3 10.8 -
Shibaura Konan area 212 8.5 10.4 1.9 5.2 0.9
No answ er 5 20.0 20.0 - 20.0 - Distribution Ratio (%) Total column is no. of data.
Second highest ranking Highest ranking
132
(7) Natural disaster response measures you want for Minato City
Q18 In the case of a natural disaster such as an earthquake, it is necessary that all residents, including foreign residents,
work together to respond to the disaster. What type of measures would you like to see in Minato City? (Circle all
appropriate answers)
CHART 3-25 NATURAL DISASTER RESPONSE MEASURES YOU WANT FOR MINATO CITY
No. Category itemNo. of items
(persons)
Configuration
ratio(%)
1 Signs and information boards for ev acuation sites in multiple languages 518 55.1
2 Distribution of emergency response leaflets in multiple languages 363 38.6
3 Emergency broadcasts and directions in multiple languages 464 49.4
4 Consultation serv ices in multiple languages in emergencies 287 30.5
5Local disaster prev ention drills in w hich Japanese and foreign nationals can take part
together298 31.7
6 Disaster prev ention drills in different languages (such as at foreign and ethnic schools) 118 12.6
7Promotion of the creation of a liaison/cooperative network within the local community (neighborhood/residents'
association) that includes both Japanese and foreign nationals246 26.2
8 Promotion of the creation of a liaison/cooperativ e netw ork among foreign nationals 113 12.0
9Hold meetings in multiple languages to ex plain about the ev acuation site/centers and
disaster countermeasures and serv ices w hich can be prov ided by the City246 26.2
10Hold site tours to v isit v arious facilities related to disaster prev ention and
countermeasures, such as ev acuation sites/centers, stockpile storages, etc.233 24.8
11Establishment of v olunteer registration of interpreters in case of disasters and prov iding
seminars/trainings for the v olunteers192 20.4
12 Other 20 2.1
13 Nothing in particular 98 10.4
No answ er 16 1.7
No. of samples 940 100.0
0 10 20 30 40 50 60
For natural disaster response measures you want for Minato City, “Signs and information boards for evacuation sites in
multiple languages” (55.1%) was the highest in the mid 50% range, with “Emergency broadcasts and directions in multiple
languages” (49.4%) at approximately 50%.
“Distribution of emergency response leaflets in multiple languages” (38.6%) was approximately 40%, “Local disaster
prevention drills in which Japanese and foreign nationals can take part together” (31.7%) and “Consultation services in
multiple languages in emergencies” (30.5%) were greater than 30%. “Promotion of the creation of a liaison/cooperative
network within the local community (town/neighborhood association) that includes both Japanese and foreign nationals”
(26.2%) and “Hold meetings in multiple languages to explain about the evacuation site/centers and disaster countermeasures
and services which can be provided by the city” (24.8%) were in the mid 20% range. (Chart 3-25)
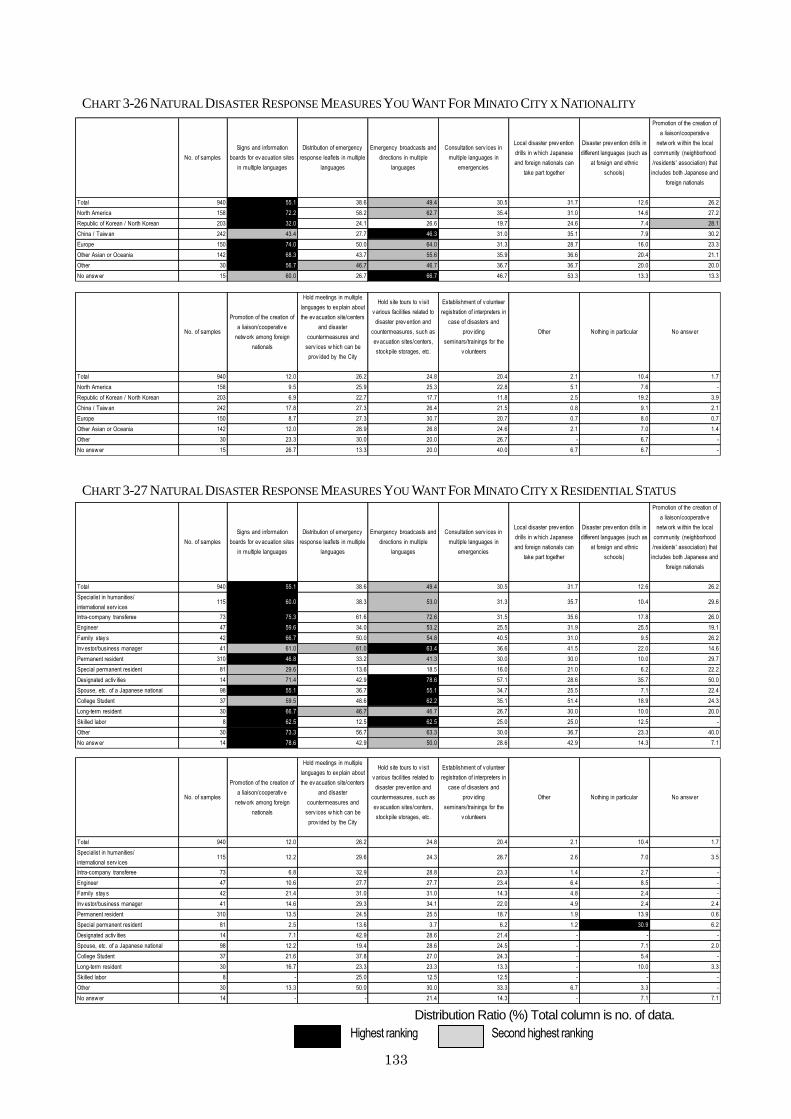
133
CHART 3-26 NATURAL DISASTER RESPONSE MEASURES YOU WANT FOR MINATO CITY X NATIONALITY
No. of samples
Signs and information
boards for ev acuation sites
in multiple languages
Distribution of emergency
response leaflets in multiple
languages
Emergency broadcasts and
directions in multiple
languages
Consultation serv ices in
multiple languages in
emergencies
Local disaster prev ention
drills in w hich Japanese
and foreign nationals can
take part together
Disaster prev ention drills in
different languages (such as
at foreign and ethnic
schools)
Promotion of the creation of
a liaison/cooperativ e
netw ork w ithin the local
community (neighborhood
/residents' association) that
includes both Japanese and
foreign nationals
Total 940 55.1 38.6 49.4 30.5 31.7 12.6 26.2
North America 158 72.2 58.2 62.7 35.4 31.0 14.6 27.2
Republic of Korean / North Korean 203 32.0 24.1 26.6 19.7 24.6 7.4 28.1
China / Taiw an 242 43.4 27.7 46.3 31.0 35.1 7.9 30.2
Europe 150 74.0 50.0 64.0 31.3 28.7 16.0 23.3
Other Asian or Oceania 142 68.3 43.7 55.6 35.9 36.6 20.4 21.1
Other 30 56.7 46.7 46.7 36.7 36.7 20.0 20.0
No answ er 15 60.0 26.7 66.7 46.7 53.3 13.3 13.3
No. of samples
Promotion of the creation of
a liaison/cooperativ e
netw ork among foreign
nationals
Hold meetings in multiple
languages to ex plain about
the ev acuation site/centers
and disaster
countermeasures and
serv ices w hich can be
prov ided by the City
Hold site tours to v isit
v arious facilities related to
disaster prev ention and
countermeasures, such as
ev acuation sites/centers,
stockpile storages, etc.
Establishment of v olunteer
registration of interpreters in
case of disasters and
prov iding
seminars/trainings for the
v olunteers
Other Nothing in particular No answ er
Total 940 12.0 26.2 24.8 20.4 2.1 10.4 1.7
North America 158 9.5 25.9 25.3 22.8 5.1 7.6 -
Republic of Korean / North Korean 203 6.9 22.7 17.7 11.8 2.5 19.2 3.9
China / Taiw an 242 17.8 27.3 26.4 21.5 0.8 9.1 2.1
Europe 150 8.7 27.3 30.7 20.7 0.7 8.0 0.7
Other Asian or Oceania 142 12.0 28.9 26.8 24.6 2.1 7.0 1.4
Other 30 23.3 30.0 20.0 26.7 - 6.7 -
No answ er 15 26.7 13.3 20.0 40.0 6.7 6.7 -
CHART 3-27 NATURAL DISASTER RESPONSE MEASURES YOU WANT FOR MINATO CITY X RESIDENTIAL STATUS
No. of samples
Signs and information
boards for ev acuation sites
in multiple languages
Distribution of emergency
response leaflets in multiple
languages
Emergency broadcasts and
directions in multiple
languages
Consultation serv ices in
multiple languages in
emergencies
Local disaster prev ention
drills in w hich Japanese
and foreign nationals can
take part together
Disaster prev ention drills in
different languages (such as
at foreign and ethnic
schools)
Promotion of the creation of
a liaison/cooperativ e
netw ork w ithin the local
community (neighborhood
/residents' association) that
includes both Japanese and
foreign nationals
Total 940 55.1 38.6 49.4 30.5 31.7 12.6 26.2
Specialist in humanities/
international serv ices115 60.0 38.3 53.0 31.3 35.7 10.4 29.6
Intra-company transferee 73 75.3 61.6 72.6 31.5 35.6 17.8 26.0
Engineer 47 59.6 34.0 53.2 25.5 31.9 25.5 19.1
Family stay s 42 66.7 50.0 54.8 40.5 31.0 9.5 26.2
Inv estor/business manager 41 61.0 61.0 63.4 36.6 41.5 22.0 14.6
Permanent resident 310 46.8 33.2 41.3 30.0 30.0 10.0 29.7
Special permanent resident 81 29.6 13.6 18.5 16.0 21.0 6.2 22.2
Designated activ ities 14 71.4 42.9 78.6 57.1 28.6 35.7 50.0
Spouse, etc. of a Japanese national 98 55.1 36.7 55.1 34.7 25.5 7.1 22.4
College Student 37 59.5 48.6 62.2 35.1 51.4 18.9 24.3
Long-term resident 30 66.7 46.7 46.7 26.7 30.0 10.0 20.0
Skilled labor 8 62.5 12.5 62.5 25.0 25.0 12.5 -
Other 30 73.3 56.7 63.3 30.0 36.7 23.3 40.0
No answ er 14 78.6 42.9 50.0 28.6 42.9 14.3 7.1
No. of samples
Promotion of the creation of
a liaison/cooperativ e
netw ork among foreign
nationals
Hold meetings in multiple
languages to ex plain about
the ev acuation site/centers
and disaster
countermeasures and
serv ices w hich can be
prov ided by the City
Hold site tours to v isit
v arious facilities related to
disaster prev ention and
countermeasures, such as
ev acuation sites/centers,
stockpile storages, etc.
Establishment of v olunteer
registration of interpreters in
case of disasters and
prov iding
seminars/trainings for the
v olunteers
Other Nothing in particular No answ er
Total 940 12.0 26.2 24.8 20.4 2.1 10.4 1.7
Specialist in humanities/
international serv ices115 12.2 29.6 24.3 28.7 2.6 7.0 3.5
Intra-company transferee 73 6.8 32.9 28.8 23.3 1.4 2.7 -
Engineer 47 10.6 27.7 27.7 23.4 6.4 8.5 -
Family stay s 42 21.4 31.0 31.0 14.3 4.8 2.4 -
Inv estor/business manager 41 14.6 29.3 34.1 22.0 4.9 2.4 2.4
Permanent resident 310 13.5 24.5 25.5 18.7 1.9 13.9 0.6
Special permanent resident 81 2.5 13.6 3.7 6.2 1.2 30.9 6.2
Designated activ ities 14 7.1 42.9 28.6 21.4 - - -
Spouse, etc. of a Japanese national 98 12.2 19.4 28.6 24.5 - 7.1 2.0
College Student 37 21.6 37.8 27.0 24.3 - 5.4 -
Long-term resident 30 16.7 23.3 23.3 13.3 - 10.0 3.3
Skilled labor 8 - 25.0 12.5 12.5 - - -
Other 30 13.3 50.0 30.0 33.3 6.7 3.3 -
No answ er 14 - - 21.4 14.3 - 7.1 7.1 Distribution Ratio (%) Total column is no. of data.
Second highest ranking Highest ranking
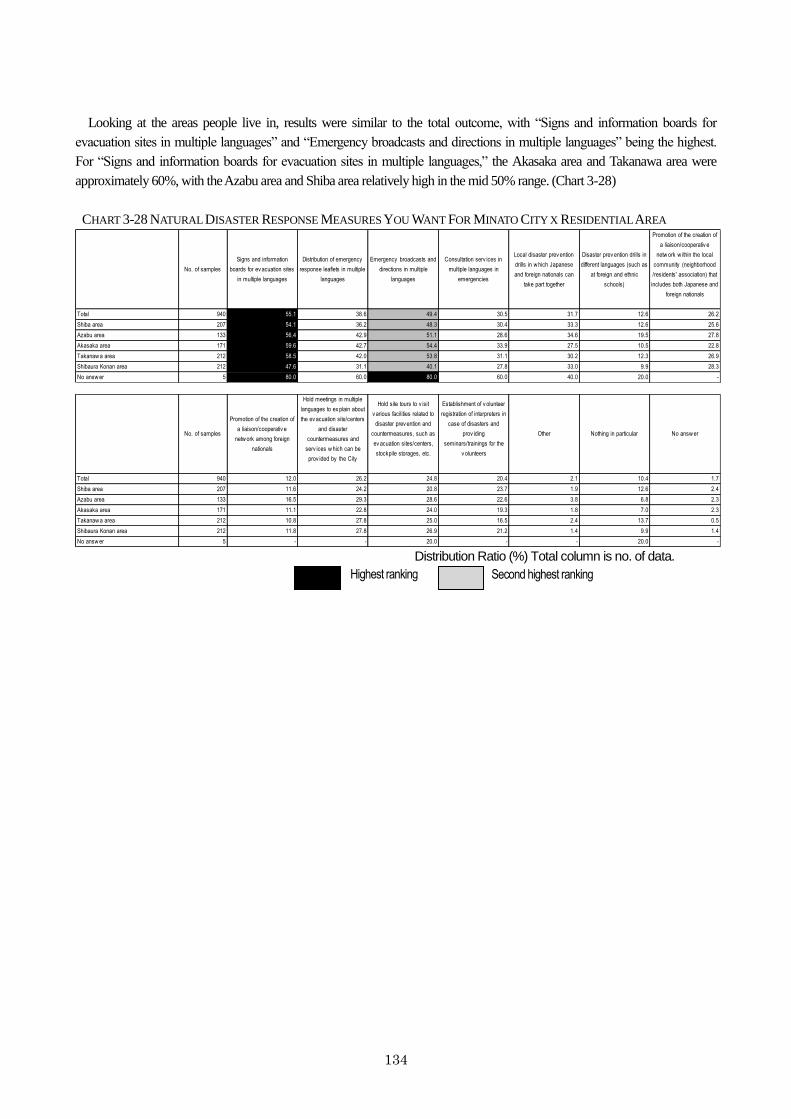
134
Looking at the areas people live in, results were similar to the total outcome, with “Signs and information boards for
evacuation sites in multiple languages” and “Emergency broadcasts and directions in multiple languages” being the highest.
For “Signs and information boards for evacuation sites in multiple languages,” the Akasaka area and Takanawa area were
approximately 60%, with the Azabu area and Shiba area relatively high in the mid 50% range. (Chart 3-28)
CHART 3-28 NATURAL DISASTER RESPONSE MEASURES YOU WANT FOR MINATO CITY X RESIDENTIAL AREA
No. of samples
Signs and information
boards for ev acuation sites
in multiple languages
Distribution of emergency
response leaflets in multiple
languages
Emergency broadcasts and
directions in multiple
languages
Consultation serv ices in
multiple languages in
emergencies
Local disaster prev ention
drills in w hich Japanese
and foreign nationals can
take part together
Disaster prev ention drills in
different languages (such as
at foreign and ethnic
schools)
Promotion of the creation of
a liaison/cooperativ e
netw ork w ithin the local
community (neighborhood
/residents' association) that
includes both Japanese and
foreign nationals
Total 940 55.1 38.6 49.4 30.5 31.7 12.6 26.2
Shiba area 207 54.1 36.2 48.3 30.4 33.3 12.6 25.6
Azabu area 133 56.4 42.9 51.1 28.6 34.6 19.5 27.8
Akasaka area 171 59.6 42.7 54.4 33.9 27.5 10.5 22.8
Takanaw a area 212 58.5 42.0 53.8 31.1 30.2 12.3 26.9
Shibaura Konan area 212 47.6 31.1 40.1 27.8 33.0 9.9 28.3
No answ er 5 80.0 60.0 80.0 60.0 40.0 20.0 -
No. of samples
Promotion of the creation of
a liaison/cooperativ e
netw ork among foreign
nationals
Hold meetings in multiple
languages to ex plain about
the ev acuation site/centers
and disaster
countermeasures and
serv ices w hich can be
prov ided by the City
Hold site tours to v isit
v arious facilities related to
disaster prev ention and
countermeasures, such as
ev acuation sites/centers,
stockpile storages, etc.
Establishment of v olunteer
registration of interpreters in
case of disasters and
prov iding
seminars/trainings for the
v olunteers
Other Nothing in particular No answ er
Total 940 12.0 26.2 24.8 20.4 2.1 10.4 1.7
Shiba area 207 11.6 24.2 20.8 23.7 1.9 12.6 2.4
Azabu area 133 16.5 29.3 28.6 22.6 3.8 6.8 2.3
Akasaka area 171 11.1 22.8 24.0 19.3 1.8 7.0 2.3
Takanaw a area 212 10.8 27.8 25.0 16.5 2.4 13.7 0.5
Shibaura Konan area 212 11.8 27.8 26.9 21.2 1.4 9.9 1.4
No answ er 5 - - 20.0 - - 20.0 - Distribution Ratio (%) Total column is no. of data.
Second highest ranking Highest ranking
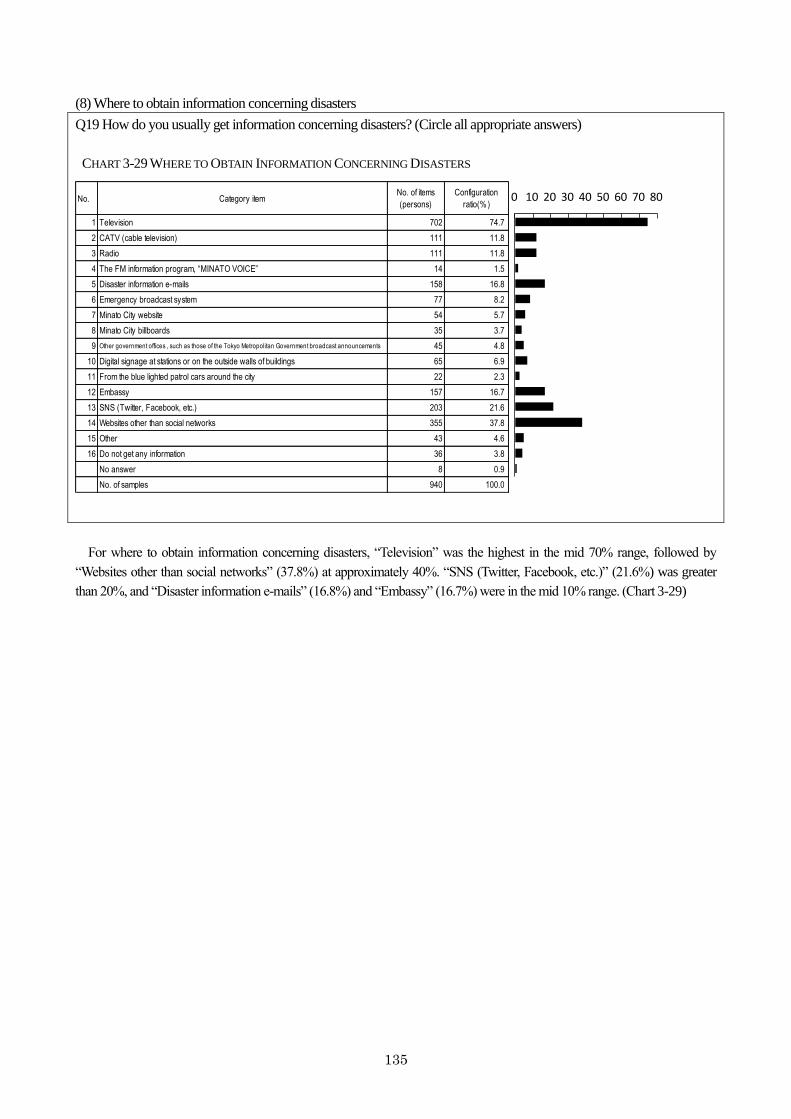
135
(8) Where to obtain information concerning disasters
Q19 How do you usually get information concerning disasters? (Circle all appropriate answers)
CHART 3-29 WHERE TO OBTAIN INFORMATION CONCERNING DISASTERS
No. Category itemNo. of items
(persons)
Configuration
ratio(%)
1 Television 702 74.7
2 CATV (cable television) 111 11.8
3 Radio 111 11.8
4 The FM information program, “MINATO VOICE” 14 1.5
5 Disaster information e-mails 158 16.8
6 Emergency broadcast system 77 8.2
7 Minato City website 54 5.7
8 Minato City billboards 35 3.7
9 Other government offices , such as those of the Tokyo Metropolitan Government broadcast announcements 45 4.8
10 Digital signage at stations or on the outside walls of buildings 65 6.9
11 From the blue lighted patrol cars around the city 22 2.3
12 Embassy 157 16.7
13 SNS (Twitter, Facebook, etc.) 203 21.6
14 Websites other than social networks 355 37.8
15 Other 43 4.6
16 Do not get any information 36 3.8
No answer 8 0.9
No. of samples 940 100.0
0 10 20 30 40 50 60 70 80
For where to obtain information concerning disasters, “Television” was the highest in the mid 70% range, followed by
“Websites other than social networks” (37.8%) at approximately 40%. “SNS (Twitter, Facebook, etc.)” (21.6%) was greater
than 20%, and “Disaster information e-mails” (16.8%) and “Embassy” (16.7%) were in the mid 10% range. (Chart 3-29)
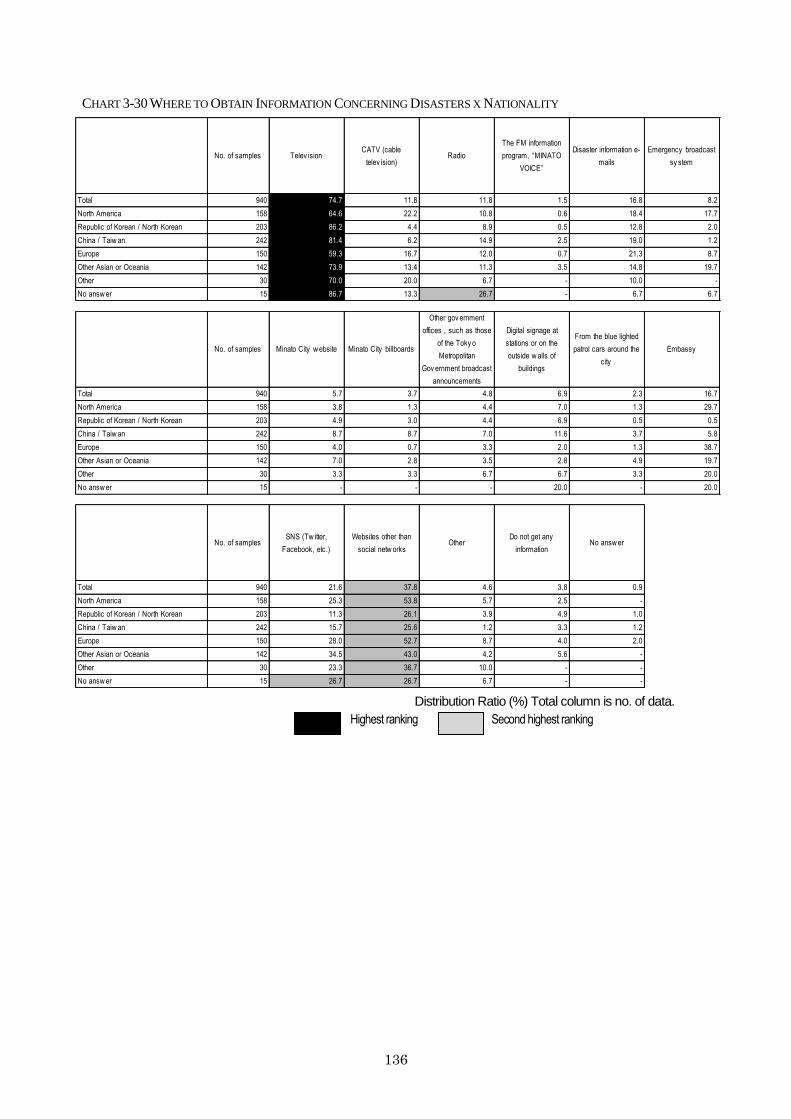
136
CHART 3-30 WHERE TO OBTAIN INFORMATION CONCERNING DISASTERS X NATIONALITY
No. of samples Telev isionCATV (cable
telev ision)Radio
The FM information
program, “MINATO
VOICE”
Disaster information e-
mails
Emergency broadcast
sy stem
Total 940 74.7 11.8 11.8 1.5 16.8 8.2
North America 158 64.6 22.2 10.8 0.6 18.4 17.7
Republic of Korean / North Korean 203 86.2 4.4 8.9 0.5 12.8 2.0
China / Taiw an 242 81.4 6.2 14.9 2.5 19.0 1.2
Europe 150 59.3 16.7 12.0 0.7 21.3 8.7
Other Asian or Oceania 142 73.9 13.4 11.3 3.5 14.8 19.7
Other 30 70.0 20.0 6.7 - 10.0 -
No answ er 15 86.7 13.3 26.7 - 6.7 6.7
No. of samples Minato City w ebsite Minato City billboards
Other gov ernment
offices , such as those
of the Toky o
Metropolitan
Gov ernment broadcast
announcements
Digital signage at
stations or on the
outside w alls of
buildings
From the blue lighted
patrol cars around the
city
Embassy
Total 940 5.7 3.7 4.8 6.9 2.3 16.7
North America 158 3.8 1.3 4.4 7.0 1.3 29.7
Republic of Korean / North Korean 203 4.9 3.0 4.4 6.9 0.5 0.5
China / Taiw an 242 8.7 8.7 7.0 11.6 3.7 5.8
Europe 150 4.0 0.7 3.3 2.0 1.3 38.7
Other Asian or Oceania 142 7.0 2.8 3.5 2.8 4.9 19.7
Other 30 3.3 3.3 6.7 6.7 3.3 20.0
No answ er 15 - - - 20.0 - 20.0
No. of samplesSNS (Tw itter,
Facebook, etc.)
Websites other than
social netw orksOther
Do not get any
informationNo answ er
Total 940 21.6 37.8 4.6 3.8 0.9
North America 158 25.3 53.8 5.7 2.5 -
Republic of Korean / North Korean 203 11.3 26.1 3.9 4.9 1.0
China / Taiw an 242 15.7 25.6 1.2 3.3 1.2
Europe 150 28.0 52.7 8.7 4.0 2.0
Other Asian or Oceania 142 34.5 43.0 4.2 5.6 -
Other 30 23.3 36.7 10.0 - -
No answ er 15 26.7 26.7 6.7 - -
Distribution Ratio (%) Total column is no. of data.
Second highest ranking Highest ranking
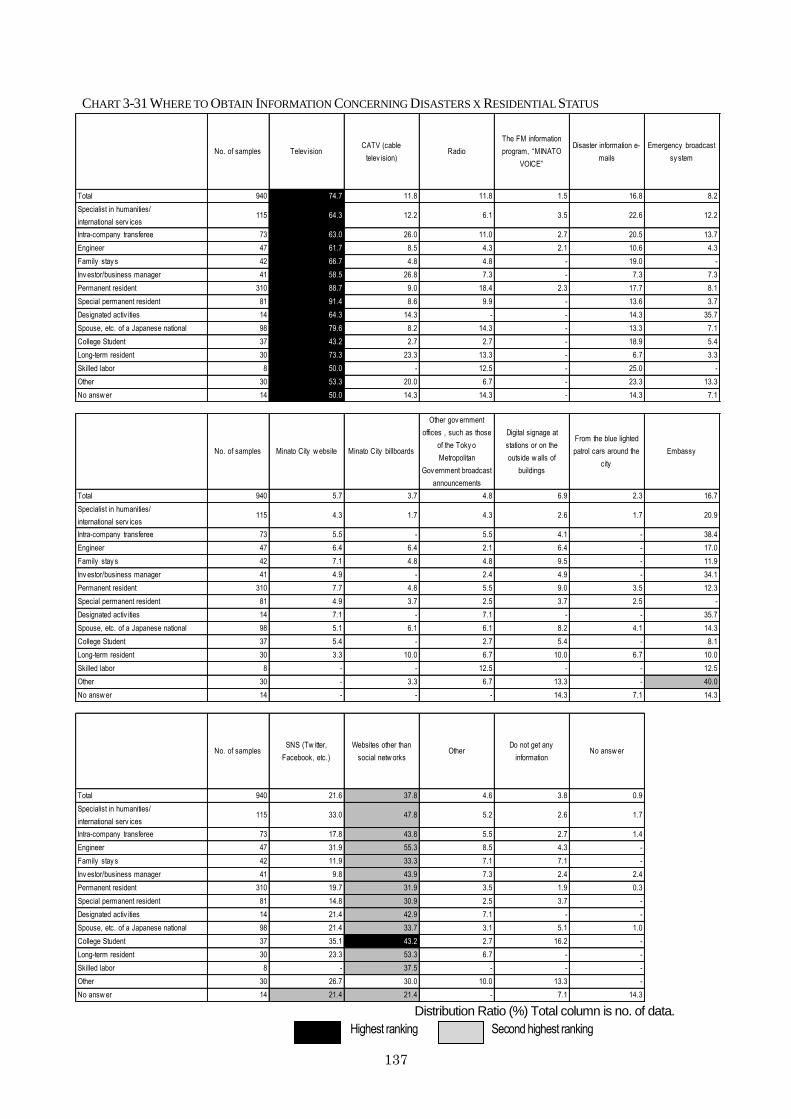
137
CHART 3-31 WHERE TO OBTAIN INFORMATION CONCERNING DISASTERS X RESIDENTIAL STATUS
No. of samples Telev isionCATV (cable
telev ision)Radio
The FM information
program, “MINATO
VOICE”
Disaster information e-
mails
Emergency broadcast
sy stem
Total 940 74.7 11.8 11.8 1.5 16.8 8.2
Specialist in humanities/
international serv ices115 64.3 12.2 6.1 3.5 22.6 12.2
Intra-company transferee 73 63.0 26.0 11.0 2.7 20.5 13.7
Engineer 47 61.7 8.5 4.3 2.1 10.6 4.3
Family stay s 42 66.7 4.8 4.8 - 19.0 -
Inv estor/business manager 41 58.5 26.8 7.3 - 7.3 7.3
Permanent resident 310 88.7 9.0 18.4 2.3 17.7 8.1
Special permanent resident 81 91.4 8.6 9.9 - 13.6 3.7
Designated activ ities 14 64.3 14.3 - - 14.3 35.7
Spouse, etc. of a Japanese national 98 79.6 8.2 14.3 - 13.3 7.1
College Student 37 43.2 2.7 2.7 - 18.9 5.4
Long-term resident 30 73.3 23.3 13.3 - 6.7 3.3
Skilled labor 8 50.0 - 12.5 - 25.0 -
Other 30 53.3 20.0 6.7 - 23.3 13.3
No answ er 14 50.0 14.3 14.3 - 14.3 7.1
No. of samples Minato City w ebsite Minato City billboards
Other gov ernment
offices , such as those
of the Toky o
Metropolitan
Gov ernment broadcast
announcements
Digital signage at
stations or on the
outside w alls of
buildings
From the blue lighted
patrol cars around the
city
Embassy
Total 940 5.7 3.7 4.8 6.9 2.3 16.7
Specialist in humanities/
international serv ices115 4.3 1.7 4.3 2.6 1.7 20.9
Intra-company transferee 73 5.5 - 5.5 4.1 - 38.4
Engineer 47 6.4 6.4 2.1 6.4 - 17.0
Family stay s 42 7.1 4.8 4.8 9.5 - 11.9
Inv estor/business manager 41 4.9 - 2.4 4.9 - 34.1
Permanent resident 310 7.7 4.8 5.5 9.0 3.5 12.3
Special permanent resident 81 4.9 3.7 2.5 3.7 2.5 -
Designated activ ities 14 7.1 - 7.1 - - 35.7
Spouse, etc. of a Japanese national 98 5.1 6.1 6.1 8.2 4.1 14.3
College Student 37 5.4 - 2.7 5.4 - 8.1
Long-term resident 30 3.3 10.0 6.7 10.0 6.7 10.0
Skilled labor 8 - - 12.5 - - 12.5
Other 30 - 3.3 6.7 13.3 - 40.0
No answ er 14 - - - 14.3 7.1 14.3
No. of samplesSNS (Tw itter,
Facebook, etc.)
Websites other than
social netw orksOther
Do not get any
informationNo answ er
Total 940 21.6 37.8 4.6 3.8 0.9
Specialist in humanities/
international serv ices115 33.0 47.8 5.2 2.6 1.7
Intra-company transferee 73 17.8 43.8 5.5 2.7 1.4
Engineer 47 31.9 55.3 8.5 4.3 -
Family stay s 42 11.9 33.3 7.1 7.1 -
Inv estor/business manager 41 9.8 43.9 7.3 2.4 2.4
Permanent resident 310 19.7 31.9 3.5 1.9 0.3
Special permanent resident 81 14.8 30.9 2.5 3.7 -
Designated activ ities 14 21.4 42.9 7.1 - -
Spouse, etc. of a Japanese national 98 21.4 33.7 3.1 5.1 1.0
College Student 37 35.1 43.2 2.7 16.2 -
Long-term resident 30 23.3 53.3 6.7 - -
Skilled labor 8 - 37.5 - - -
Other 30 26.7 30.0 10.0 13.3 -
No answ er 14 21.4 21.4 - 7.1 14.3 Distribution Ratio (%) Total column is no. of data.
Second highest ranking Highest ranking
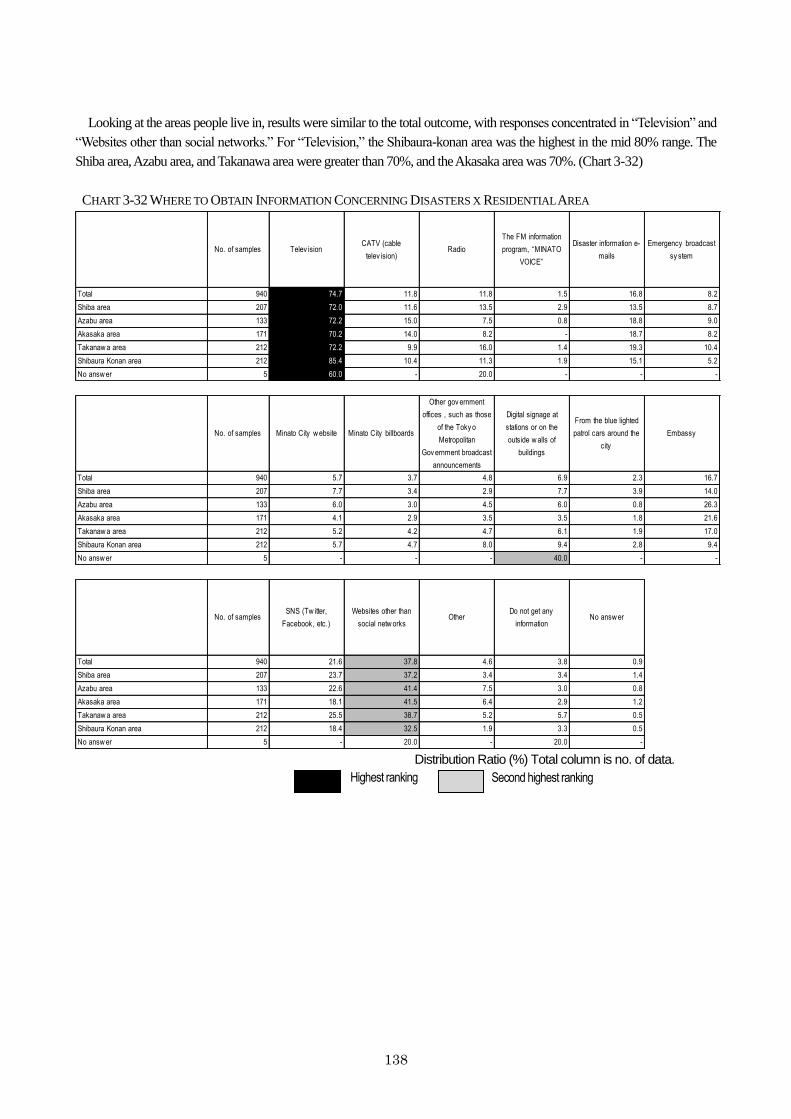
138
Looking at the areas people live in, results were similar to the total outcome, with responses concentrated in “Television” and
“Websites other than social networks.” For “Television,” the Shibaura-konan area was the highest in the mid 80% range. The
Shiba area, Azabu area, and Takanawa area were greater than 70%, and the Akasaka area was 70%. (Chart 3-32)
CHART 3-32 WHERE TO OBTAIN INFORMATION CONCERNING DISASTERS X RESIDENTIAL AREA
No. of samples Telev isionCATV (cable
telev ision)Radio
The FM information
program, “MINATO
VOICE”
Disaster information e-
mails
Emergency broadcast
sy stem
Total 940 74.7 11.8 11.8 1.5 16.8 8.2
Shiba area 207 72.0 11.6 13.5 2.9 13.5 8.7
Azabu area 133 72.2 15.0 7.5 0.8 18.8 9.0
Akasaka area 171 70.2 14.0 8.2 - 18.7 8.2
Takanaw a area 212 72.2 9.9 16.0 1.4 19.3 10.4
Shibaura Konan area 212 85.4 10.4 11.3 1.9 15.1 5.2
No answ er 5 60.0 - 20.0 - - -
No. of samples Minato City w ebsite Minato City billboards
Other gov ernment
offices , such as those
of the Toky o
Metropolitan
Gov ernment broadcast
announcements
Digital signage at
stations or on the
outside w alls of
buildings
From the blue lighted
patrol cars around the
city
Embassy
Total 940 5.7 3.7 4.8 6.9 2.3 16.7
Shiba area 207 7.7 3.4 2.9 7.7 3.9 14.0
Azabu area 133 6.0 3.0 4.5 6.0 0.8 26.3
Akasaka area 171 4.1 2.9 3.5 3.5 1.8 21.6
Takanaw a area 212 5.2 4.2 4.7 6.1 1.9 17.0
Shibaura Konan area 212 5.7 4.7 8.0 9.4 2.8 9.4
No answ er 5 - - - 40.0 - -
No. of samplesSNS (Tw itter,
Facebook, etc.)
Websites other than
social netw orksOther
Do not get any
informationNo answ er
Total 940 21.6 37.8 4.6 3.8 0.9
Shiba area 207 23.7 37.2 3.4 3.4 1.4
Azabu area 133 22.6 41.4 7.5 3.0 0.8
Akasaka area 171 18.1 41.5 6.4 2.9 1.2
Takanaw a area 212 25.5 38.7 5.2 5.7 0.5
Shibaura Konan area 212 18.4 32.5 1.9 3.3 0.5
No answ er 5 - 20.0 - 20.0 - Distribution Ratio (%) Total column is no. of data.
Second highest ranking Highest ranking
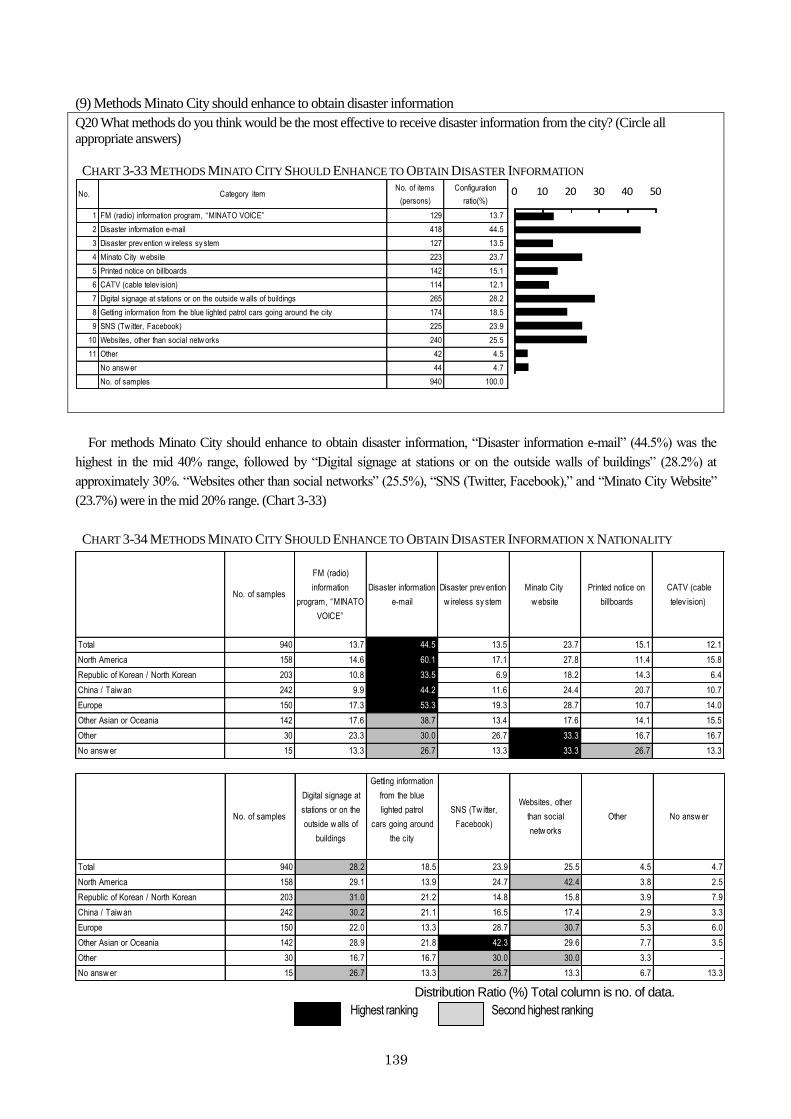
139
(9) Methods Minato City should enhance to obtain disaster information
Q20 What methods do you think would be the most effective to receive disaster information from the city? (Circle all
appropriate answers)
CHART 3-33 METHODS MINATO CITY SHOULD ENHANCE TO OBTAIN DISASTER INFORMATION
For methods Minato City should enhance to obtain disaster information, “Disaster information e-mail” (44.5%) was the
highest in the mid 40% range, followed by “Digital signage at stations or on the outside walls of buildings” (28.2%) at
approximately 30%. “Websites other than social networks” (25.5%), “SNS (Twitter, Facebook),” and “Minato City Website”
(23.7%) were in the mid 20% range. (Chart 3-33)
CHART 3-34 METHODS MINATO CITY SHOULD ENHANCE TO OBTAIN DISASTER INFORMATION X NATIONALITY
No. of samples
FM (radio)
information
program, “MINATO
VOICE”
Disaster information
Disaster prev ention
w ireless sy stem
Minato City
w ebsite
Printed notice on
billboards
CATV (cable
telev ision)
Total 940 13.7 44.5 13.5 23.7 15.1 12.1
North America 158 14.6 60.1 17.1 27.8 11.4 15.8
Republic of Korean / North Korean 203 10.8 33.5 6.9 18.2 14.3 6.4
China / Taiw an 242 9.9 44.2 11.6 24.4 20.7 10.7
Europe 150 17.3 53.3 19.3 28.7 10.7 14.0
Other Asian or Oceania 142 17.6 38.7 13.4 17.6 14.1 15.5
Other 30 23.3 30.0 26.7 33.3 16.7 16.7
No answ er 15 13.3 26.7 13.3 33.3 26.7 13.3
No. of samples
Digital signage at
stations or on the
outside w alls of
buildings
Getting information
from the blue
lighted patrol
cars going around
the city
SNS (Tw itter,
Facebook)
Websites, other
than social
netw orks
Other No answ er
Total 940 28.2 18.5 23.9 25.5 4.5 4.7
North America 158 29.1 13.9 24.7 42.4 3.8 2.5
Republic of Korean / North Korean 203 31.0 21.2 14.8 15.8 3.9 7.9
China / Taiw an 242 30.2 21.1 16.5 17.4 2.9 3.3
Europe 150 22.0 13.3 28.7 30.7 5.3 6.0
Other Asian or Oceania 142 28.9 21.8 42.3 29.6 7.7 3.5
Other 30 16.7 16.7 30.0 30.0 3.3 -
No answ er 15 26.7 13.3 26.7 13.3 6.7 13.3 Distribution Ratio (%) Total column is no. of data.
Second highest ranking Highest ranking
No. Category itemNo. of items
(persons)
Configuration
ratio(%)
1 FM (radio) information program, “MINATO VOICE” 129 13.7
2 Disaster information e-mail 418 44.5
3 Disaster prev ention w ireless sy stem 127 13.5
4 Minato City w ebsite 223 23.7
5 Printed notice on billboards 142 15.1
6 CATV (cable telev ision) 114 12.1
7 Digital signage at stations or on the outside w alls of buildings 265 28.2
8 Getting information from the blue lighted patrol cars going around the city 174 18.5
9 SNS (Tw itter, Facebook) 225 23.9
10 Websites, other than social netw orks 240 25.5
11 Other 42 4.5
No answ er 44 4.7
No. of samples 940 100.0
0 10 20 30 40 50
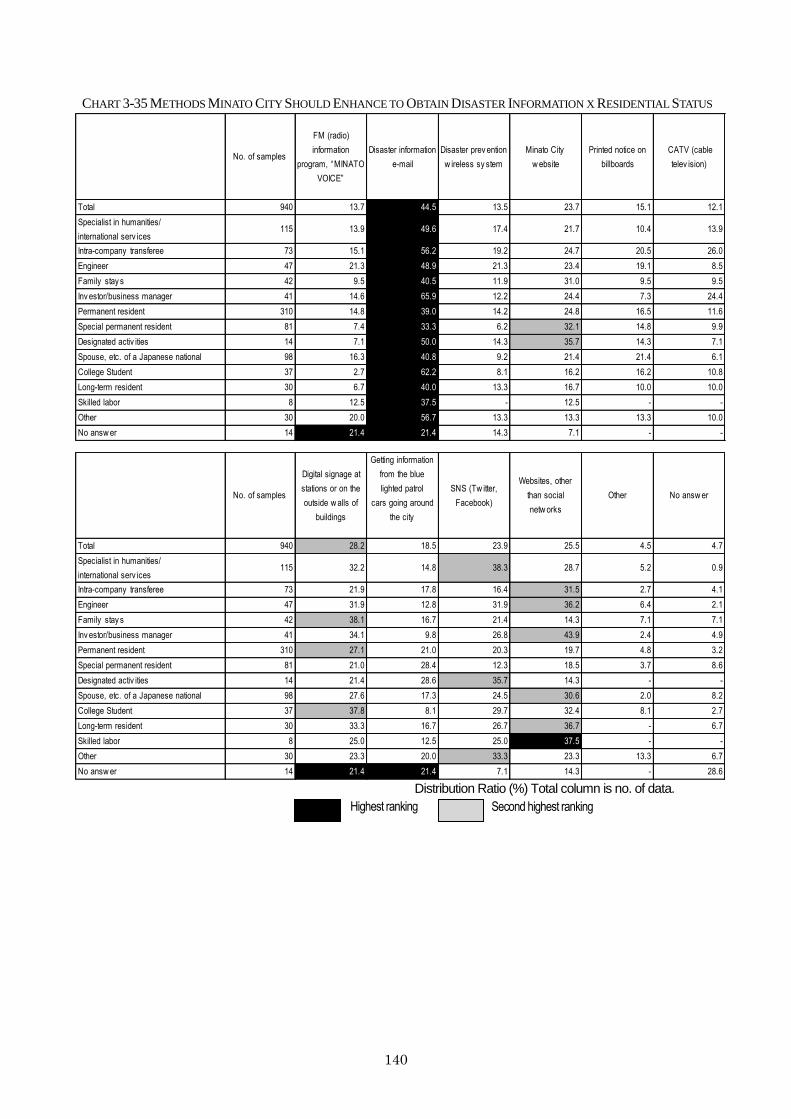
140
CHART 3-35 METHODS MINATO CITY SHOULD ENHANCE TO OBTAIN DISASTER INFORMATION X RESIDENTIAL STATUS
No. of samples
FM (radio)
information
program, “MINATO
VOICE”
Disaster information
Disaster prev ention
w ireless sy stem
Minato City
w ebsite
Printed notice on
billboards
CATV (cable
telev ision)
Total 940 13.7 44.5 13.5 23.7 15.1 12.1
Specialist in humanities/
international serv ices115 13.9 49.6 17.4 21.7 10.4 13.9
Intra-company transferee 73 15.1 56.2 19.2 24.7 20.5 26.0
Engineer 47 21.3 48.9 21.3 23.4 19.1 8.5
Family stay s 42 9.5 40.5 11.9 31.0 9.5 9.5
Inv estor/business manager 41 14.6 65.9 12.2 24.4 7.3 24.4
Permanent resident 310 14.8 39.0 14.2 24.8 16.5 11.6
Special permanent resident 81 7.4 33.3 6.2 32.1 14.8 9.9
Designated activ ities 14 7.1 50.0 14.3 35.7 14.3 7.1
Spouse, etc. of a Japanese national 98 16.3 40.8 9.2 21.4 21.4 6.1
College Student 37 2.7 62.2 8.1 16.2 16.2 10.8
Long-term resident 30 6.7 40.0 13.3 16.7 10.0 10.0
Skilled labor 8 12.5 37.5 - 12.5 - -
Other 30 20.0 56.7 13.3 13.3 13.3 10.0
No answ er 14 21.4 21.4 14.3 7.1 - -
No. of samples
Digital signage at
stations or on the
outside w alls of
buildings
Getting information
from the blue
lighted patrol
cars going around
the city
SNS (Tw itter,
Facebook)
Websites, other
than social
netw orks
Other No answ er
Total 940 28.2 18.5 23.9 25.5 4.5 4.7
Specialist in humanities/
international serv ices115 32.2 14.8 38.3 28.7 5.2 0.9
Intra-company transferee 73 21.9 17.8 16.4 31.5 2.7 4.1
Engineer 47 31.9 12.8 31.9 36.2 6.4 2.1
Family stay s 42 38.1 16.7 21.4 14.3 7.1 7.1
Inv estor/business manager 41 34.1 9.8 26.8 43.9 2.4 4.9
Permanent resident 310 27.1 21.0 20.3 19.7 4.8 3.2
Special permanent resident 81 21.0 28.4 12.3 18.5 3.7 8.6
Designated activ ities 14 21.4 28.6 35.7 14.3 - -
Spouse, etc. of a Japanese national 98 27.6 17.3 24.5 30.6 2.0 8.2
College Student 37 37.8 8.1 29.7 32.4 8.1 2.7
Long-term resident 30 33.3 16.7 26.7 36.7 - 6.7
Skilled labor 8 25.0 12.5 25.0 37.5 - -
Other 30 23.3 20.0 33.3 23.3 13.3 6.7
No answ er 14 21.4 21.4 7.1 14.3 - 28.6 Distribution Ratio (%) Total column is no. of data.
Second highest ranking Highest ranking
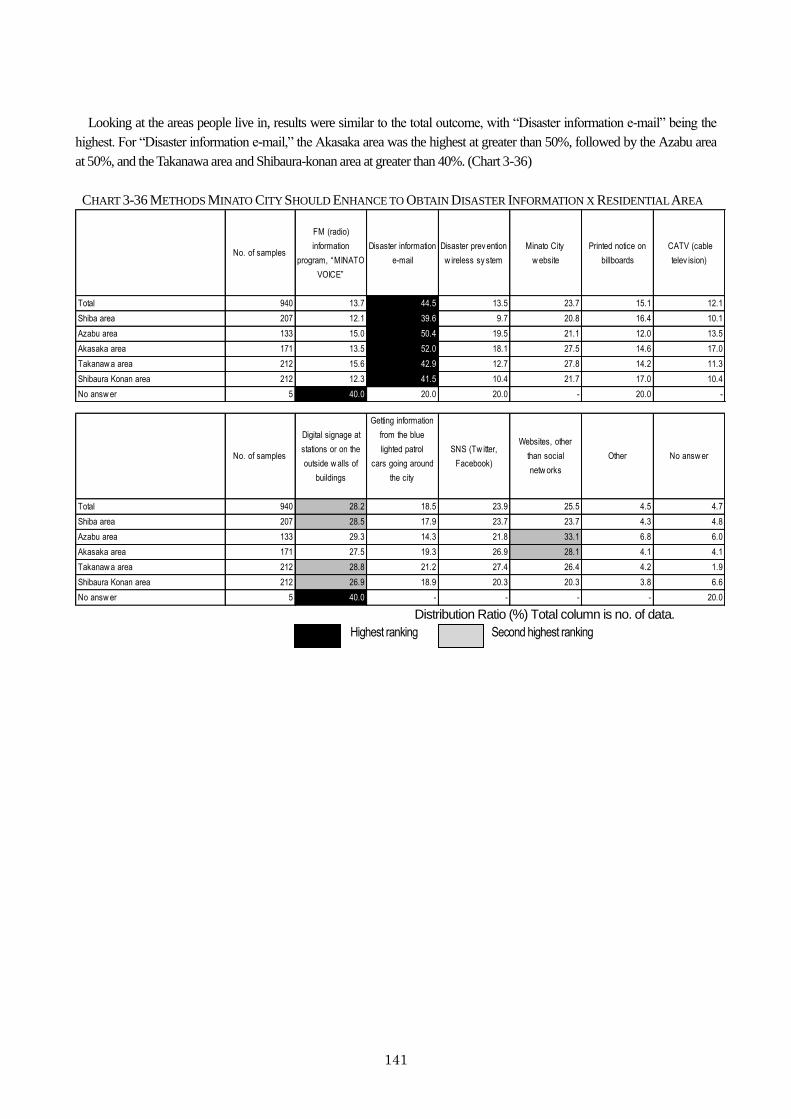
141
Looking at the areas people live in, results were similar to the total outcome, with “Disaster information e-mail” being the
highest. For “Disaster information e-mail,” the Akasaka area was the highest at greater than 50%, followed by the Azabu area
at 50%, and the Takanawa area and Shibaura-konan area at greater than 40%. (Chart 3-36)
CHART 3-36 METHODS MINATO CITY SHOULD ENHANCE TO OBTAIN DISASTER INFORMATION X RESIDENTIAL AREA
No. of samples
FM (radio)
information
program, “MINATO
VOICE”
Disaster information
Disaster prev ention
w ireless sy stem
Minato City
w ebsite
Printed notice on
billboards
CATV (cable
telev ision)
Total 940 13.7 44.5 13.5 23.7 15.1 12.1
Shiba area 207 12.1 39.6 9.7 20.8 16.4 10.1
Azabu area 133 15.0 50.4 19.5 21.1 12.0 13.5
Akasaka area 171 13.5 52.0 18.1 27.5 14.6 17.0
Takanaw a area 212 15.6 42.9 12.7 27.8 14.2 11.3
Shibaura Konan area 212 12.3 41.5 10.4 21.7 17.0 10.4
No answ er 5 40.0 20.0 20.0 - 20.0 -
No. of samples
Digital signage at
stations or on the
outside w alls of
buildings
Getting information
from the blue
lighted patrol
cars going around
the city
SNS (Tw itter,
Facebook)
Websites, other
than social
netw orks
Other No answ er
Total 940 28.2 18.5 23.9 25.5 4.5 4.7
Shiba area 207 28.5 17.9 23.7 23.7 4.3 4.8
Azabu area 133 29.3 14.3 21.8 33.1 6.8 6.0
Akasaka area 171 27.5 19.3 26.9 28.1 4.1 4.1
Takanaw a area 212 28.8 21.2 27.4 26.4 4.2 1.9
Shibaura Konan area 212 26.9 18.9 20.3 20.3 3.8 6.6
No answ er 5 40.0 - - - - 20.0 Distribution Ratio (%) Total column is no. of data.
Second highest ranking Highest ranking
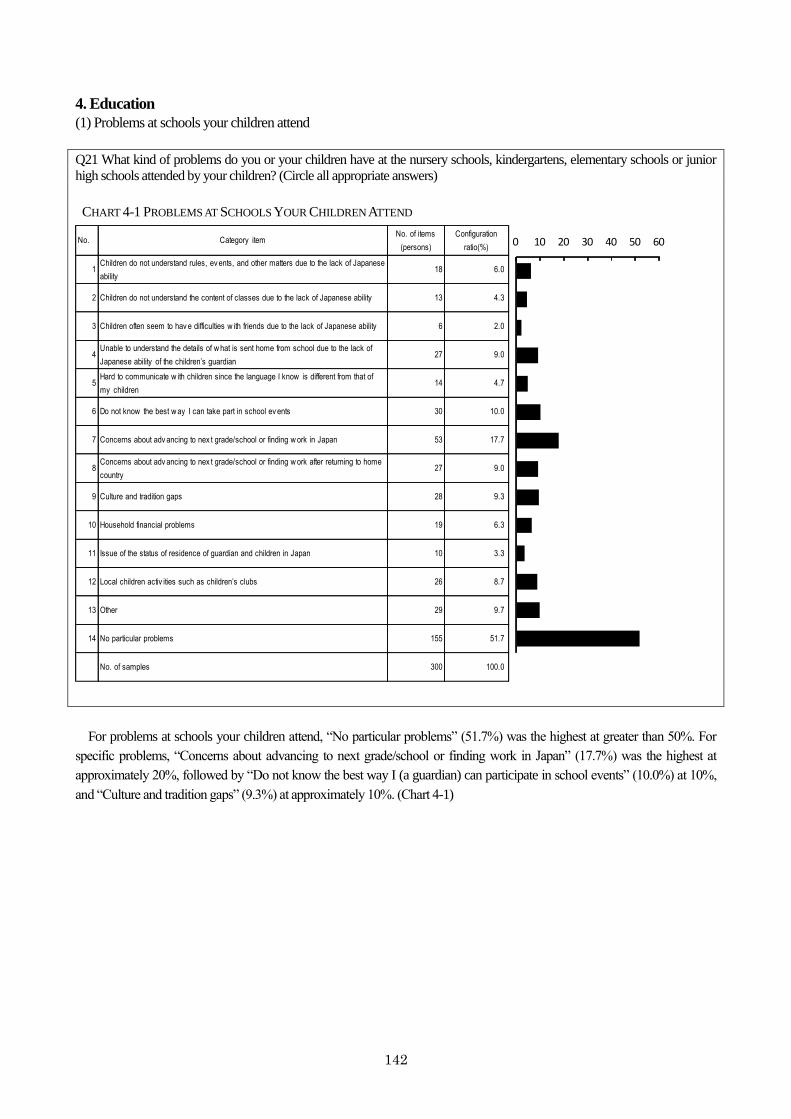
142
4. Education
(1) Problems at schools your children attend
Q21 What kind of problems do you or your children have at the nursery schools, kindergartens, elementary schools or junior
high schools attended by your children? (Circle all appropriate answers)
CHART 4-1 PROBLEMS AT SCHOOLS YOUR CHILDREN ATTEND
No. Category itemNo. of items
(persons)
Configuration
ratio(%)
1Children do not understand rules, ev ents, and other matters due to the lack of Japanese
ability18 6.0
2 Children do not understand the content of classes due to the lack of Japanese ability 13 4.3
3 Children often seem to hav e difficulties w ith friends due to the lack of Japanese ability 6 2.0
4Unable to understand the details of w hat is sent home from school due to the lack of
Japanese ability of the children’s guardian27 9.0
5Hard to communicate w ith children since the language I know is different from that of
my children14 4.7
6 Do not know the best w ay I can take part in school ev ents 30 10.0
7 Concerns about adv ancing to nex t grade/school or finding w ork in Japan 53 17.7
8Concerns about adv ancing to nex t grade/school or finding w ork after returning to home
country27 9.0
9 Culture and tradition gaps 28 9.3
10 Household financial problems 19 6.3
11 Issue of the status of residence of guardian and children in Japan 10 3.3
12 Local children activ ities such as children’s clubs 26 8.7
13 Other 29 9.7
14 No particular problems 155 51.7
No. of samples 300 100.0
0 10 20 30 40 50 60
For problems at schools your children attend, “No particular problems” (51.7%) was the highest at greater than 50%. For
specific problems, “Concerns about advancing to next grade/school or finding work in Japan” (17.7%) was the highest at
approximately 20%, followed by “Do not know the best way I (a guardian) can participate in school events” (10.0%) at 10%,
and “Culture and tradition gaps” (9.3%) at approximately 10%. (Chart 4-1)
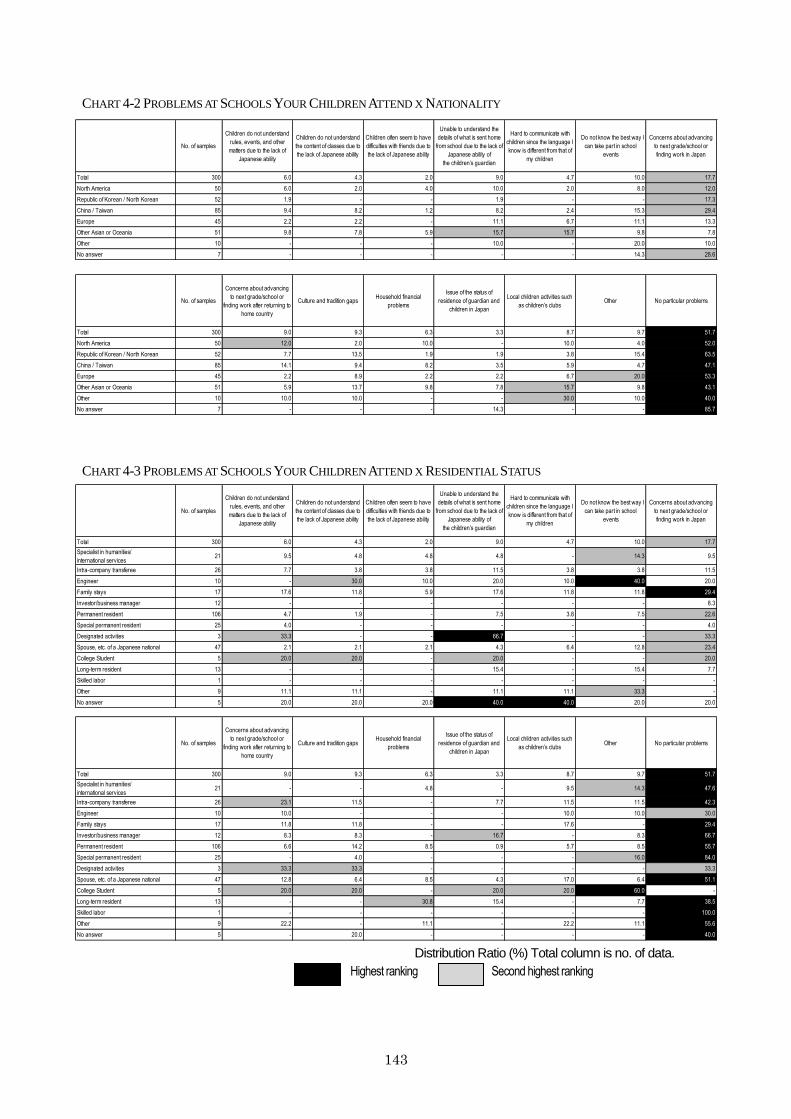
143
CHART 4-2 PROBLEMS AT SCHOOLS YOUR CHILDREN ATTEND X NATIONALITY
No. of samples
Children do not understand
rules, events, and other
matters due to the lack of
Japanese ability
Children do not understand
the content of classes due to
the lack of Japanese ability
Children often seem to have
difficulties with friends due to
the lack of Japanese ability
Unable to understand the
details of what is sent home
from school due to the lack of
Japanese ability of
the children’s guardian
Hard to communicate with
children since the language I
know is different from that of
my children
Do not know the best way I
can take part in school
events
Concerns about advancing
to next grade/school or
finding work in Japan
Total 300 6.0 4.3 2.0 9.0 4.7 10.0 17.7
North America 50 6.0 2.0 4.0 10.0 2.0 8.0 12.0
Republic of Korean / North Korean 52 1.9 - - 1.9 - - 17.3
China / Taiwan 85 9.4 8.2 1.2 8.2 2.4 15.3 29.4
Europe 45 2.2 2.2 - 11.1 6.7 11.1 13.3
Other Asian or Oceania 51 9.8 7.8 5.9 15.7 15.7 9.8 7.8
Other 10 - - - 10.0 - 20.0 10.0
No answer 7 - - - - - 14.3 28.6
No. of samples
Concerns about advancing
to next grade/school or
finding work after returning to
home country
Culture and tradition gapsHousehold financial
problems
Issue of the status of
residence of guardian and
children in Japan
Local children activities such
as children’s clubsOther No particular problems
Total 300 9.0 9.3 6.3 3.3 8.7 9.7 51.7
North America 50 12.0 2.0 10.0 - 10.0 4.0 52.0
Republic of Korean / North Korean 52 7.7 13.5 1.9 1.9 3.8 15.4 63.5
China / Taiwan 85 14.1 9.4 8.2 3.5 5.9 4.7 47.1
Europe 45 2.2 8.9 2.2 2.2 6.7 20.0 53.3
Other Asian or Oceania 51 5.9 13.7 9.8 7.8 15.7 9.8 43.1
Other 10 10.0 10.0 - - 30.0 10.0 40.0
No answer 7 - - - 14.3 - - 85.7
CHART 4-3 PROBLEMS AT SCHOOLS YOUR CHILDREN ATTEND X RESIDENTIAL STATUS
No. of samples
Children do not understand
rules, events, and other
matters due to the lack of
Japanese ability
Children do not understand
the content of classes due to
the lack of Japanese ability
Children often seem to have
difficulties with friends due to
the lack of Japanese ability
Unable to understand the
details of what is sent home
from school due to the lack of
Japanese ability of
the children’s guardian
Hard to communicate with
children since the language I
know is different from that of
my children
Do not know the best way I
can take part in school
events
Concerns about advancing
to next grade/school or
finding work in Japan
Total 300 6.0 4.3 2.0 9.0 4.7 10.0 17.7
Specialist in humanities/
international services21 9.5 4.8 4.8 4.8 - 14.3 9.5
Intra-company transferee 26 7.7 3.8 3.8 11.5 3.8 3.8 11.5
Engineer 10 - 30.0 10.0 20.0 10.0 40.0 20.0
Family stays 17 17.6 11.8 5.9 17.6 11.8 11.8 29.4
Investor/business manager 12 - - - - - - 8.3
Permanent resident 106 4.7 1.9 - 7.5 3.8 7.5 22.6
Special permanent resident 25 4.0 - - - - - 4.0
Designated activities 3 33.3 - - 66.7 - - 33.3
Spouse, etc. of a Japanese national 47 2.1 2.1 2.1 4.3 6.4 12.8 23.4
College Student 5 20.0 20.0 - 20.0 - - 20.0
Long-term resident 13 - - - 15.4 - 15.4 7.7
Skilled labor 1 - - - - - - -
Other 9 11.1 11.1 - 11.1 11.1 33.3 -
No answer 5 20.0 20.0 20.0 40.0 40.0 20.0 20.0
No. of samples
Concerns about advancing
to next grade/school or
finding work after returning to
home country
Culture and tradition gapsHousehold financial
problems
Issue of the status of
residence of guardian and
children in Japan
Local children activities such
as children’s clubsOther No particular problems
Total 300 9.0 9.3 6.3 3.3 8.7 9.7 51.7
Specialist in humanities/
international services21 - - 4.8 - 9.5 14.3 47.6
Intra-company transferee 26 23.1 11.5 - 7.7 11.5 11.5 42.3
Engineer 10 10.0 - - - 10.0 10.0 30.0
Family stays 17 11.8 11.8 - - 17.6 - 29.4
Investor/business manager 12 8.3 8.3 - 16.7 - 8.3 66.7
Permanent resident 106 6.6 14.2 8.5 0.9 5.7 8.5 55.7
Special permanent resident 25 - 4.0 - - - 16.0 84.0
Designated activities 3 33.3 33.3 - - - - 33.3
Spouse, etc. of a Japanese national 47 12.8 6.4 8.5 4.3 17.0 6.4 51.1
College Student 5 20.0 20.0 - 20.0 20.0 60.0 -
Long-term resident 13 - - 30.8 15.4 - 7.7 38.5
Skilled labor 1 - - - - - - 100.0
Other 9 22.2 - 11.1 - 22.2 11.1 55.6
No answer 5 - 20.0 - - - - 40.0 Distribution Ratio (%) Total column is no. of data.
Second highest ranking Highest ranking
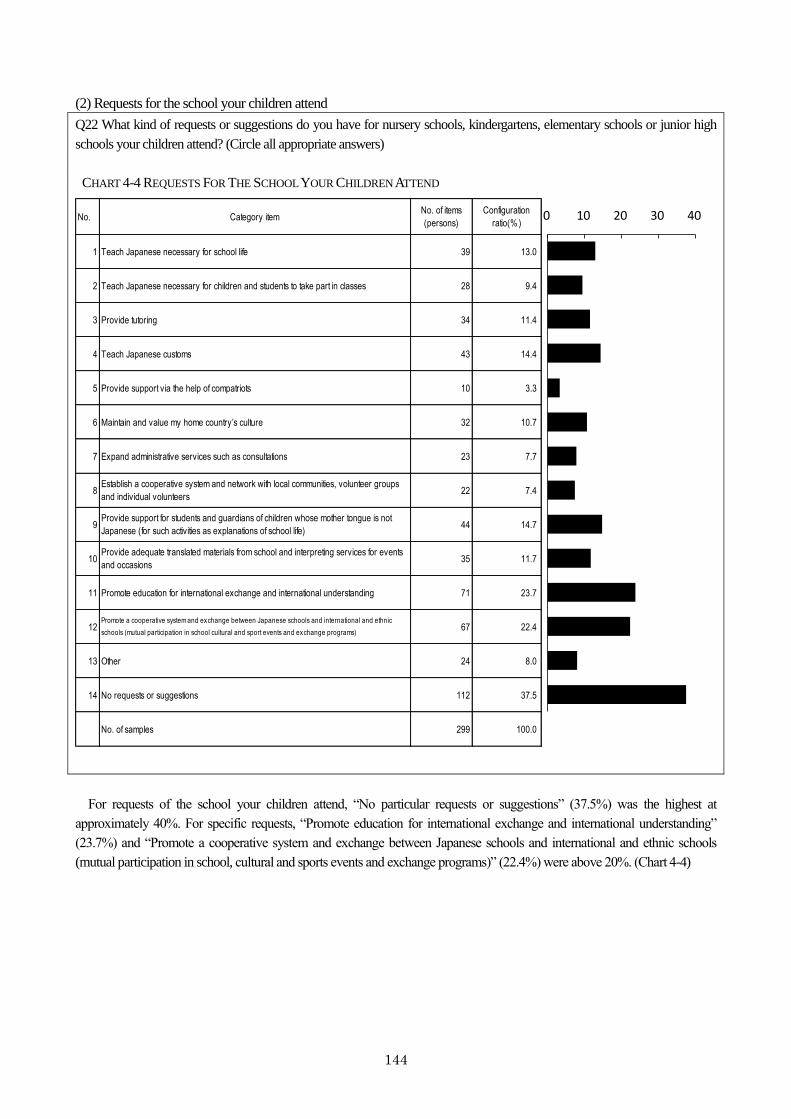
144
(2) Requests for the school your children attend
Q22 What kind of requests or suggestions do you have for nursery schools, kindergartens, elementary schools or junior high
schools your children attend? (Circle all appropriate answers)
CHART 4-4 REQUESTS FOR THE SCHOOL YOUR CHILDREN ATTEND
No. Category itemNo. of items
(persons)
Configuration
ratio(% )
1 Teach Japanese necessary for school life 39 13.0
2 Teach Japanese necessary for children and students to take part in classes 28 9.4
3 Provide tutoring 34 11.4
4 Teach Japanese customs 43 14.4
5 Provide support via the help of compatriots 10 3.3
6 Maintain and value my home country’s culture 32 10.7
7 Expand administrative services such as consultations 23 7.7
8Establish a cooperative system and network with local communities, volunteer groups
and individual volunteers22 7.4
9Provide support for students and guardians of children whose mother tongue is not
Japanese (for such activities as explanations of school life)44 14.7
10Provide adequate translated materials from school and interpreting services for events
and occasions35 11.7
11 Promote education for international exchange and international understanding 71 23.7
12Promote a cooperative system and exchange between Japanese schools and international and ethnic
schools (mutual participation in school cultural and sport events and exchange programs)67 22.4
13 Other 24 8.0
14 No requests or suggestions 112 37.5
No. of samples 299 100.0
0 10 20 30 40
For requests of the school your children attend, “No particular requests or suggestions” (37.5%) was the highest at
approximately 40%. For specific requests, “Promote education for international exchange and international understanding”
(23.7%) and “Promote a cooperative system and exchange between Japanese schools and international and ethnic schools
(mutual participation in school, cultural and sports events and exchange programs)” (22.4%) were above 20%. (Chart 4-4)
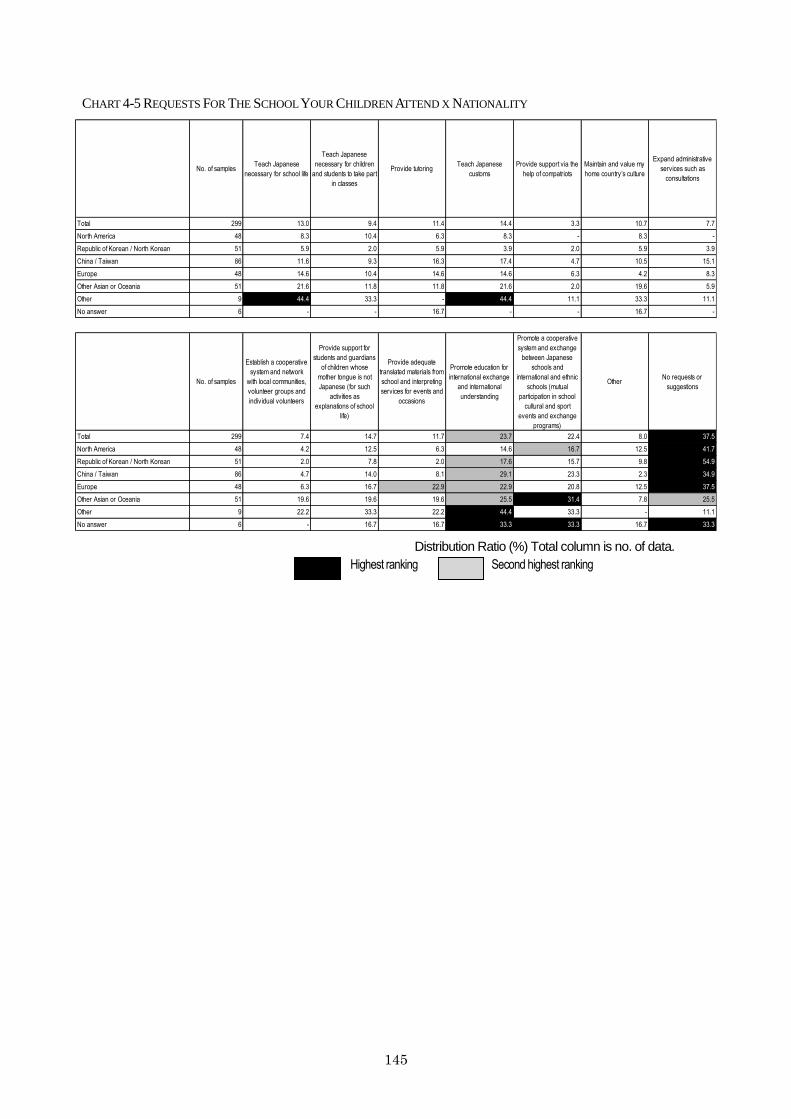
145
CHART 4-5 REQUESTS FOR THE SCHOOL YOUR CHILDREN ATTEND X NATIONALITY
No. of samplesTeach Japanese
necessary for school life
Teach Japanese
necessary for children
and students to take part
in classes
Provide tutoringTeach Japanese
customs
Provide support via the
help of compatriots
Maintain and value my
home country’s culture
Expand administrative
services such as
consultations
Total 299 13.0 9.4 11.4 14.4 3.3 10.7 7.7
North America 48 8.3 10.4 6.3 8.3 - 8.3 -
Republic of Korean / North Korean 51 5.9 2.0 5.9 3.9 2.0 5.9 3.9
China / Taiwan 86 11.6 9.3 16.3 17.4 4.7 10.5 15.1
Europe 48 14.6 10.4 14.6 14.6 6.3 4.2 8.3
Other Asian or Oceania 51 21.6 11.8 11.8 21.6 2.0 19.6 5.9
Other 9 44.4 33.3 - 44.4 11.1 33.3 11.1
No answer 6 - - 16.7 - - 16.7 -
No. of samples
Establish a cooperative
system and network
with local communities,
volunteer groups and
individual volunteers
Provide support for
students and guardians
of children whose
mother tongue is not
Japanese (for such
activities as
explanations of school
life)
Provide adequate
translated materials from
school and interpreting
services for events and
occasions
Promote education for
international exchange
and international
understanding
Promote a cooperative
system and exchange
between Japanese
schools and
international and ethnic
schools (mutual
participation in school
cultural and sport
events and exchange
programs)
OtherNo requests or
suggestions
Total 299 7.4 14.7 11.7 23.7 22.4 8.0 37.5
North America 48 4.2 12.5 6.3 14.6 16.7 12.5 41.7
Republic of Korean / North Korean 51 2.0 7.8 2.0 17.6 15.7 9.8 54.9
China / Taiwan 86 4.7 14.0 8.1 29.1 23.3 2.3 34.9
Europe 48 6.3 16.7 22.9 22.9 20.8 12.5 37.5
Other Asian or Oceania 51 19.6 19.6 19.6 25.5 31.4 7.8 25.5
Other 9 22.2 33.3 22.2 44.4 33.3 - 11.1
No answer 6 - 16.7 16.7 33.3 33.3 16.7 33.3
Distribution Ratio (%) Total column is no. of data.
Second highest ranking Highest ranking
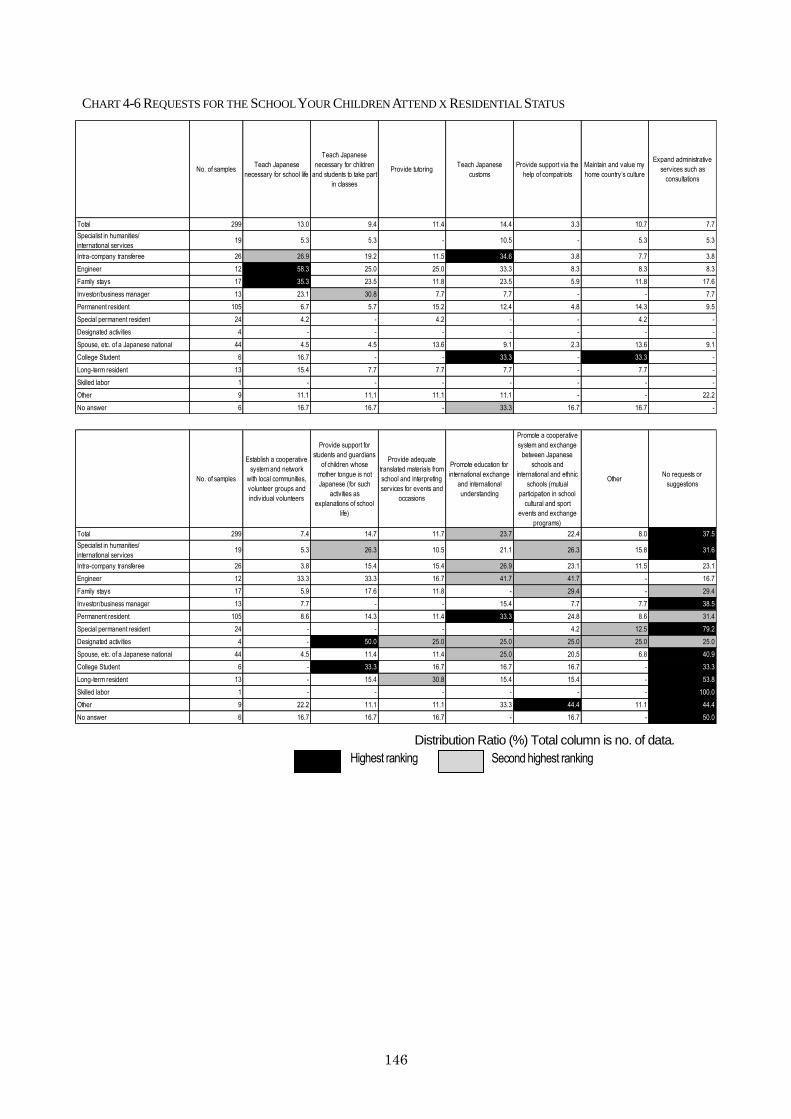
146
CHART 4-6 REQUESTS FOR THE SCHOOL YOUR CHILDREN ATTEND X RESIDENTIAL STATUS
No. of samplesTeach Japanese
necessary for school life
Teach Japanese
necessary for children
and students to take part
in classes
Provide tutoringTeach Japanese
customs
Provide support via the
help of compatriots
Maintain and value my
home country’s culture
Expand administrative
services such as
consultations
Total 299 13.0 9.4 11.4 14.4 3.3 10.7 7.7
Specialist in humanities/
international services19 5.3 5.3 - 10.5 - 5.3 5.3
Intra-company transferee 26 26.9 19.2 11.5 34.6 3.8 7.7 3.8
Engineer 12 58.3 25.0 25.0 33.3 8.3 8.3 8.3
Family stays 17 35.3 23.5 11.8 23.5 5.9 11.8 17.6
Investor/business manager 13 23.1 30.8 7.7 7.7 - - 7.7
Permanent resident 105 6.7 5.7 15.2 12.4 4.8 14.3 9.5
Special permanent resident 24 4.2 - 4.2 - - 4.2 -
Designated activities 4 - - - - - - -
Spouse, etc. of a Japanese national 44 4.5 4.5 13.6 9.1 2.3 13.6 9.1
College Student 6 16.7 - - 33.3 - 33.3 -
Long-term resident 13 15.4 7.7 7.7 7.7 - 7.7 -
Skilled labor 1 - - - - - - -
Other 9 11.1 11.1 11.1 11.1 - - 22.2
No answer 6 16.7 16.7 - 33.3 16.7 16.7 -
No. of samples
Establish a cooperative
system and network
with local communities,
volunteer groups and
individual volunteers
Provide support for
students and guardians
of children whose
mother tongue is not
Japanese (for such
activities as
explanations of school
life)
Provide adequate
translated materials from
school and interpreting
services for events and
occasions
Promote education for
international exchange
and international
understanding
Promote a cooperative
system and exchange
between Japanese
schools and
international and ethnic
schools (mutual
participation in school
cultural and sport
events and exchange
programs)
OtherNo requests or
suggestions
Total 299 7.4 14.7 11.7 23.7 22.4 8.0 37.5
Specialist in humanities/
international services19 5.3 26.3 10.5 21.1 26.3 15.8 31.6
Intra-company transferee 26 3.8 15.4 15.4 26.9 23.1 11.5 23.1
Engineer 12 33.3 33.3 16.7 41.7 41.7 - 16.7
Family stays 17 5.9 17.6 11.8 - 29.4 - 29.4
Investor/business manager 13 7.7 - - 15.4 7.7 7.7 38.5
Permanent resident 105 8.6 14.3 11.4 33.3 24.8 8.6 31.4
Special permanent resident 24 - - - - 4.2 12.5 79.2
Designated activities 4 - 50.0 25.0 25.0 25.0 25.0 25.0
Spouse, etc. of a Japanese national 44 4.5 11.4 11.4 25.0 20.5 6.8 40.9
College Student 6 - 33.3 16.7 16.7 16.7 - 33.3
Long-term resident 13 - 15.4 30.8 15.4 15.4 - 53.8
Skilled labor 1 - - - - - - 100.0
Other 9 22.2 11.1 11.1 33.3 44.4 11.1 44.4
No answer 6 16.7 16.7 16.7 - 16.7 - 50.0
Distribution Ratio (%) Total column is no. of data.
Second highest ranking Highest ranking
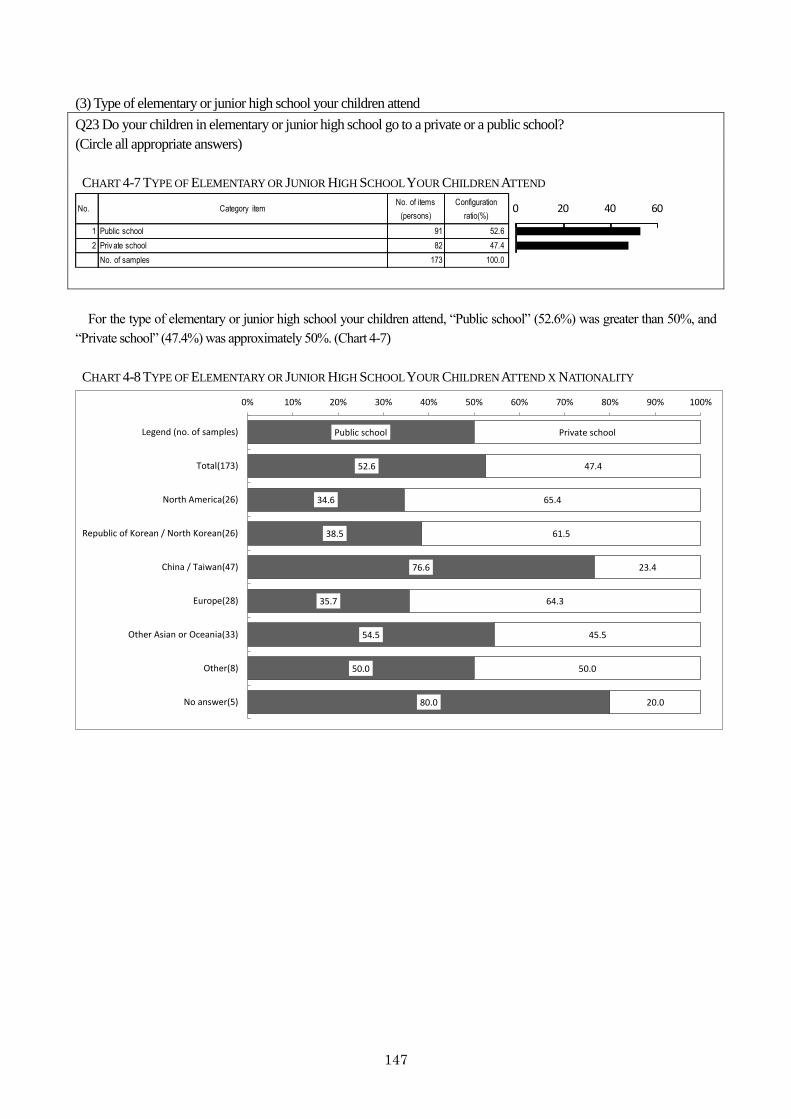
147
(3) Type of elementary or junior high school your children attend
Q23 Do your children in elementary or junior high school go to a private or a public school?
(Circle all appropriate answers)
CHART 4-7 TYPE OF ELEMENTARY OR JUNIOR HIGH SCHOOL YOUR CHILDREN ATTEND
No. Category itemNo. of items
(persons)
Configuration
ratio(%)
1 Public school 91 52.6
2 Priv ate school 82 47.4
No. of samples 173 100.0
0 20 40 60
For the type of elementary or junior high school your children attend, “Public school” (52.6%) was greater than 50%, and
“Private school” (47.4%) was approximately 50%. (Chart 4-7)
CHART 4-8 TYPE OF ELEMENTARY OR JUNIOR HIGH SCHOOL YOUR CHILDREN ATTEND X NATIONALITY
Public school
52.6
34.6
38.5
76.6
35.7
54.5
50.0
80.0
Private school
47.4
65.4
61.5
23.4
64.3
45.5
50.0
20.0
0% 10% 20% 30% 40% 50% 60% 70% 80% 90% 100%
Legend (no. of samples)
Total(173)
North America(26)
Republic of Korean / North Korean(26)
China / Taiwan(47)
Europe(28)
Other Asian or Oceania(33)
Other(8)
No answer(5)
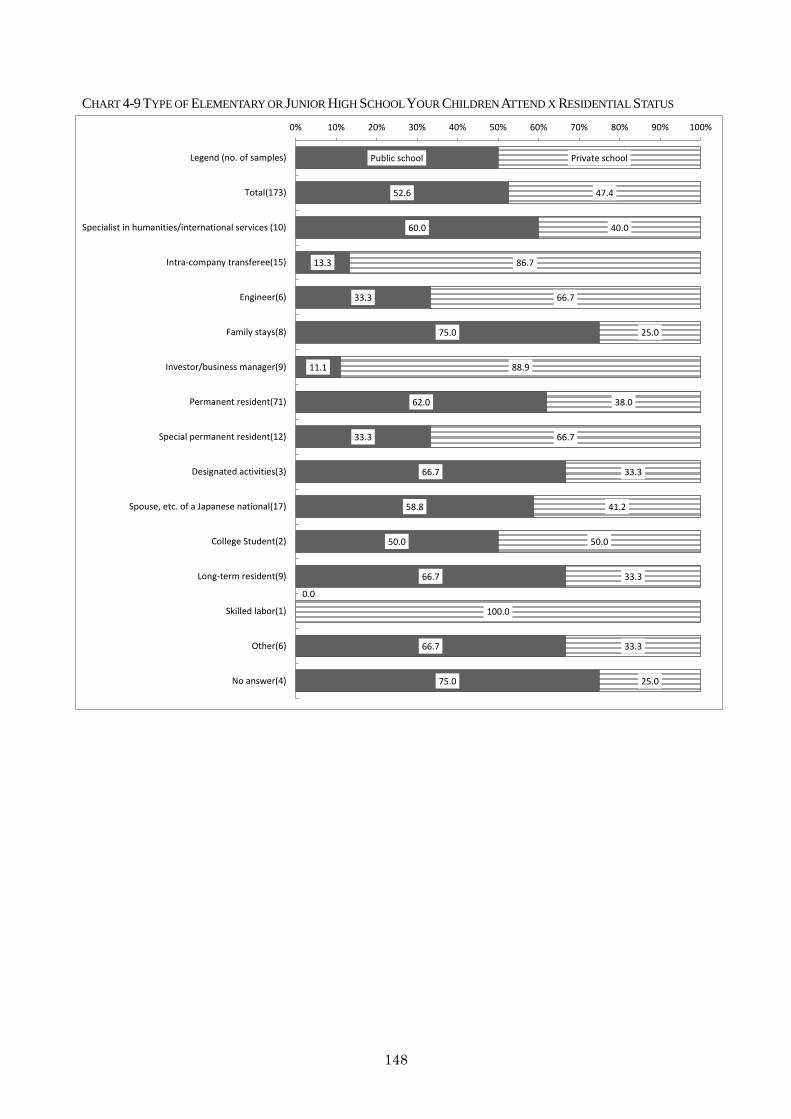
148
CHART 4-9 TYPE OF ELEMENTARY OR JUNIOR HIGH SCHOOL YOUR CHILDREN ATTEND X RESIDENTIAL STATUS
Public school
52.6
60.0
13.3
33.3
75.0
11.1
62.0
33.3
66.7
58.8
50.0
66.7
0.0
66.7
75.0
Private school
47.4
40.0
86.7
66.7
25.0
88.9
38.0
66.7
33.3
41.2
50.0
33.3
100.0
33.3
25.0
0% 10% 20% 30% 40% 50% 60% 70% 80% 90% 100%
Legend (no. of samples)
Total(173)
Specialist in humanities/international services (10)
Intra-company transferee(15)
Engineer(6)
Family stays(8)
Investor/business manager(9)
Permanent resident(71)
Special permanent resident(12)
Designated activities(3)
Spouse, etc. of a Japanese national(17)
College Student(2)
Long-term resident(9)
Skilled labor(1)
Other(6)
No answer(4)
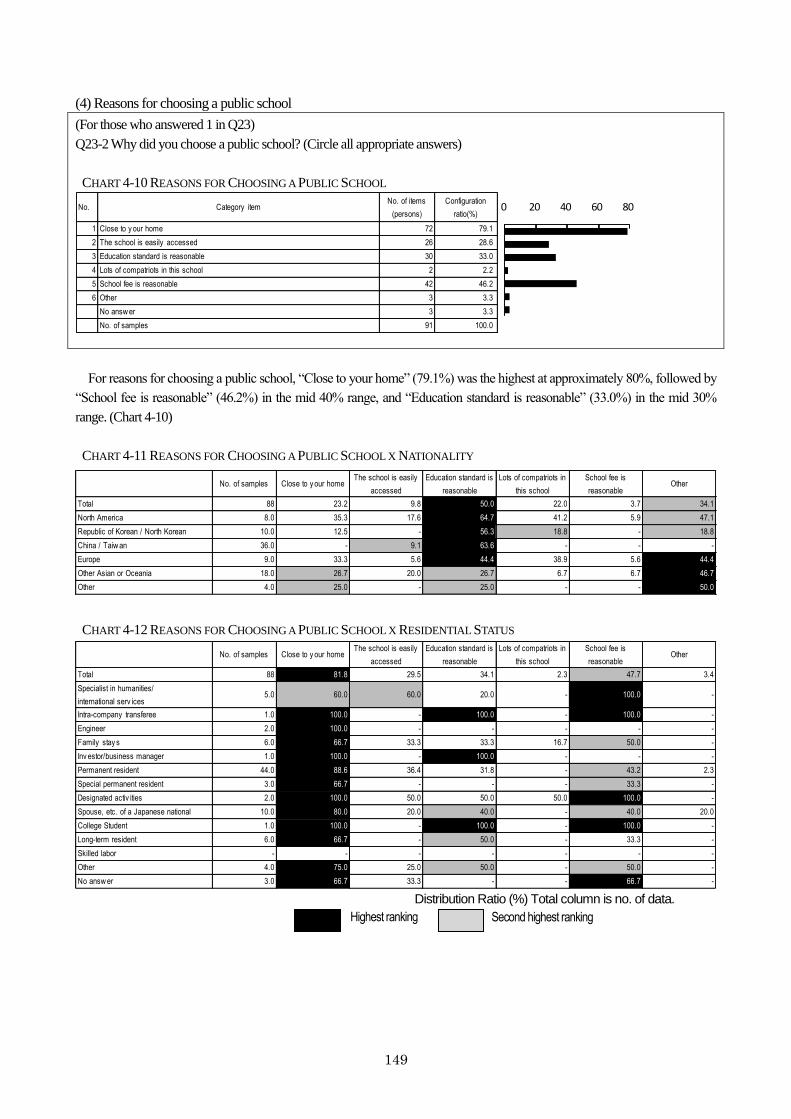
149
(4) Reasons for choosing a public school
(For those who answered 1 in Q23)
Q23-2 Why did you choose a public school? (Circle all appropriate answers)
CHART 4-10 REASONS FOR CHOOSING A PUBLIC SCHOOL
For reasons for choosing a public school, “Close to your home” (79.1%) was the highest at approximately 80%, followed by
“School fee is reasonable” (46.2%) in the mid 40% range, and “Education standard is reasonable” (33.0%) in the mid 30%
range. (Chart 4-10)
CHART 4-11 REASONS FOR CHOOSING A PUBLIC SCHOOL X NATIONALITY
No. of samples Close to y our homeThe school is easily
accessed
Education standard is
reasonable
Lots of compatriots in
this school
School fee is
reasonableOther
Total 88 23.2 9.8 50.0 22.0 3.7 34.1
North America 8.0 35.3 17.6 64.7 41.2 5.9 47.1
Republic of Korean / North Korean 10.0 12.5 - 56.3 18.8 - 18.8
China / Taiw an 36.0 - 9.1 63.6 - - -
Europe 9.0 33.3 5.6 44.4 38.9 5.6 44.4
Other Asian or Oceania 18.0 26.7 20.0 26.7 6.7 6.7 46.7
Other 4.0 25.0 - 25.0 - - 50.0
CHART 4-12 REASONS FOR CHOOSING A PUBLIC SCHOOL X RESIDENTIAL STATUS
No. of samples Close to y our homeThe school is easily
accessed
Education standard is
reasonable
Lots of compatriots in
this school
School fee is
reasonableOther
Total 88 81.8 29.5 34.1 2.3 47.7 3.4
Specialist in humanities/
international serv ices5.0 60.0 60.0 20.0 - 100.0 -
Intra-company transferee 1.0 100.0 - 100.0 - 100.0 -
Engineer 2.0 100.0 - - - - -
Family stay s 6.0 66.7 33.3 33.3 16.7 50.0 -
Inv estor/business manager 1.0 100.0 - 100.0 - - -
Permanent resident 44.0 88.6 36.4 31.8 - 43.2 2.3
Special permanent resident 3.0 66.7 - - - 33.3 -
Designated activ ities 2.0 100.0 50.0 50.0 50.0 100.0 -
Spouse, etc. of a Japanese national 10.0 80.0 20.0 40.0 - 40.0 20.0
College Student 1.0 100.0 - 100.0 - 100.0 -
Long-term resident 6.0 66.7 - 50.0 - 33.3 -
Skilled labor - - - - - - -
Other 4.0 75.0 25.0 50.0 - 50.0 -
No answ er 3.0 66.7 33.3 - - 66.7 - Distribution Ratio (%) Total column is no. of data.
Second highest ranking Highest ranking
No. Category itemNo. of items
(persons)
Configuration
ratio(%)
1 Close to y our home 72 79.1
2 The school is easily accessed 26 28.6
3 Education standard is reasonable 30 33.0
4 Lots of compatriots in this school 2 2.2
5 School fee is reasonable 42 46.2
6 Other 3 3.3
No answ er 3 3.3
No. of samples 91 100.0
0 20 40 60 80
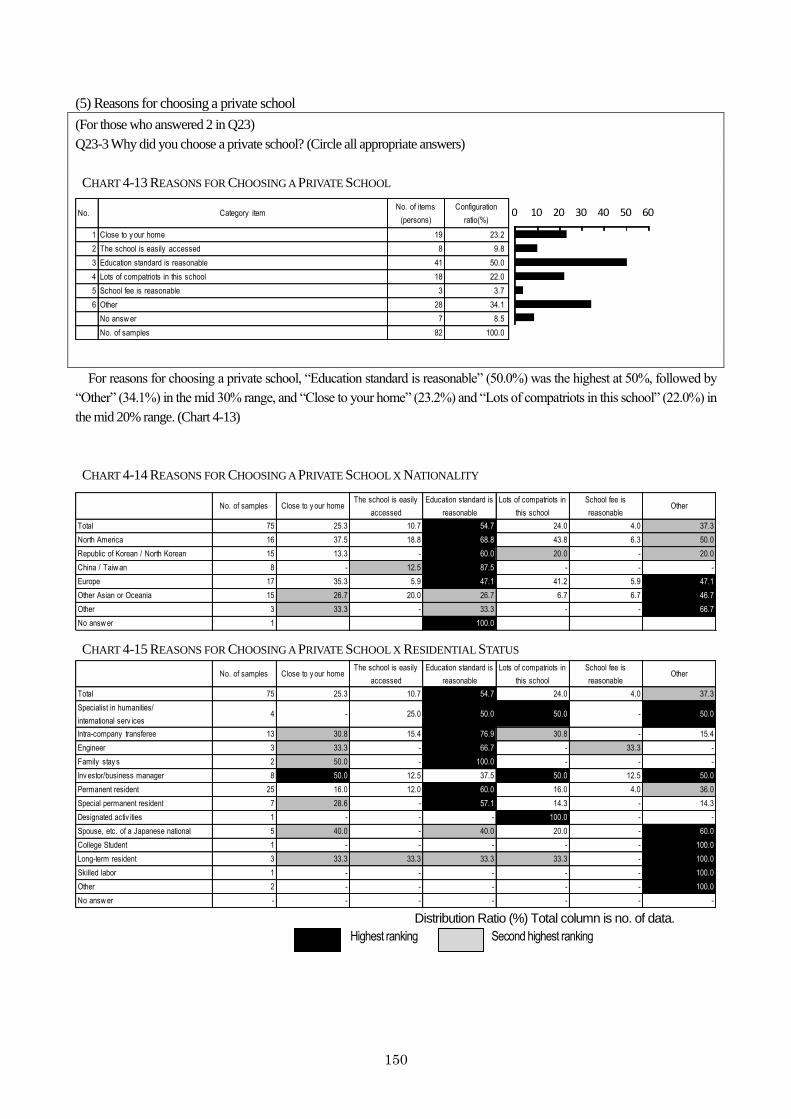
150
(5) Reasons for choosing a private school
(For those who answered 2 in Q23)
Q23-3 Why did you choose a private school? (Circle all appropriate answers)
CHART 4-13 REASONS FOR CHOOSING A PRIVATE SCHOOL
No. Category itemNo. of items
(persons)
Configuration
ratio(%)
1 Close to y our home 19 23.2
2 The school is easily accessed 8 9.8
3 Education standard is reasonable 41 50.0
4 Lots of compatriots in this school 18 22.0
5 School fee is reasonable 3 3.7
6 Other 28 34.1
No answ er 7 8.5
No. of samples 82 100.0
0 10 20 30 40 50 60
For reasons for choosing a private school, “Education standard is reasonable” (50.0%) was the highest at 50%, followed by
“Other” (34.1%) in the mid 30% range, and “Close to your home” (23.2%) and “Lots of compatriots in this school” (22.0%) in
the mid 20% range. (Chart 4-13)
CHART 4-14 REASONS FOR CHOOSING A PRIVATE SCHOOL X NATIONALITY
No. of samples Close to y our homeThe school is easily
accessed
Education standard is
reasonable
Lots of compatriots in
this school
School fee is
reasonableOther
Total 75 25.3 10.7 54.7 24.0 4.0 37.3
North America 16 37.5 18.8 68.8 43.8 6.3 50.0
Republic of Korean / North Korean 15 13.3 - 60.0 20.0 - 20.0
China / Taiw an 8 - 12.5 87.5 - - -
Europe 17 35.3 5.9 47.1 41.2 5.9 47.1
Other Asian or Oceania 15 26.7 20.0 26.7 6.7 6.7 46.7
Other 3 33.3 - 33.3 - - 66.7
No answ er 1 100.0
CHART 4-15 REASONS FOR CHOOSING A PRIVATE SCHOOL X RESIDENTIAL STATUS
No. of samples Close to y our homeThe school is easily
accessed
Education standard is
reasonable
Lots of compatriots in
this school
School fee is
reasonableOther
Total 75 25.3 10.7 54.7 24.0 4.0 37.3
Specialist in humanities/
international serv ices4 - 25.0 50.0 50.0 - 50.0
Intra-company transferee 13 30.8 15.4 76.9 30.8 - 15.4
Engineer 3 33.3 - 66.7 - 33.3 -
Family stay s 2 50.0 - 100.0 - - -
Inv estor/business manager 8 50.0 12.5 37.5 50.0 12.5 50.0
Permanent resident 25 16.0 12.0 60.0 16.0 4.0 36.0
Special permanent resident 7 28.6 - 57.1 14.3 - 14.3
Designated activ ities 1 - - - 100.0 - -
Spouse, etc. of a Japanese national 5 40.0 - 40.0 20.0 - 60.0
College Student 1 - - - - - 100.0
Long-term resident 3 33.3 33.3 33.3 33.3 - 100.0
Skilled labor 1 - - - - - 100.0
Other 2 - - - - - 100.0
No answ er - - - - - - - Distribution Ratio (%) Total column is no. of data.
Second highest ranking Highest ranking
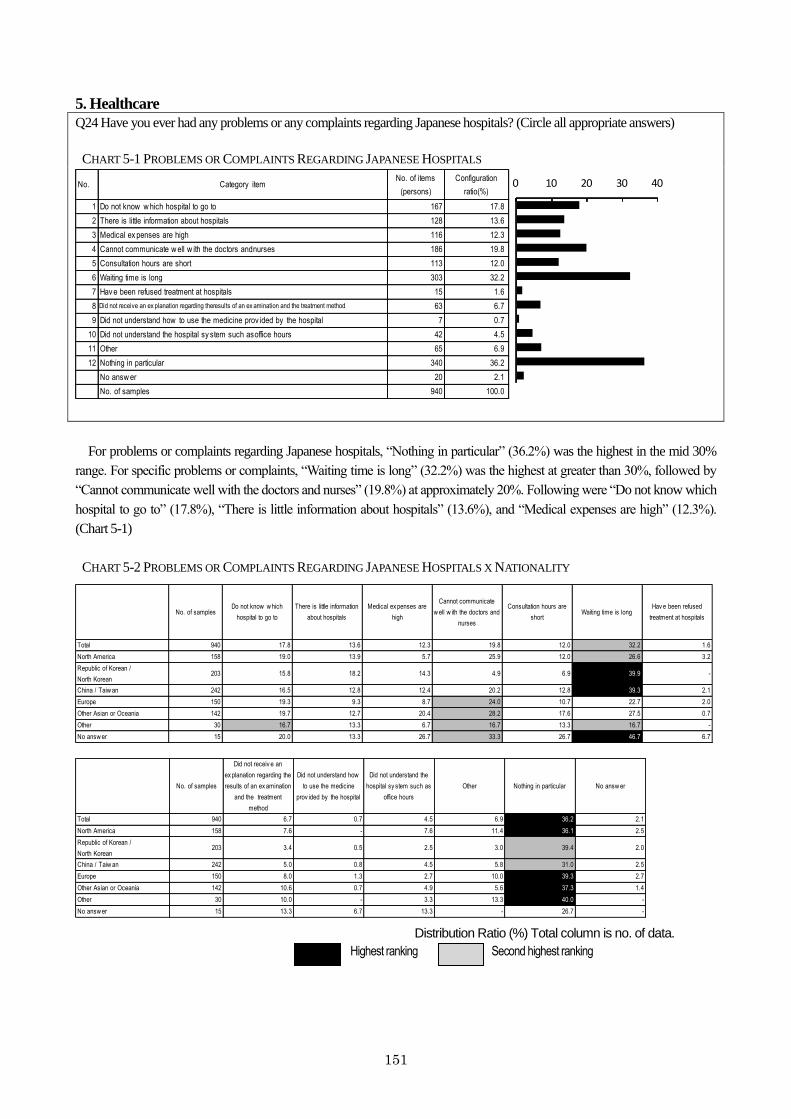
151
5. Healthcare
Q24 Have you ever had any problems or any complaints regarding Japanese hospitals? (Circle all appropriate answers)
CHART 5-1 PROBLEMS OR COMPLAINTS REGARDING JAPANESE HOSPITALS
No. Category itemNo. of items
(persons)
Configuration
ratio(%)
1 Do not know w hich hospital to go to 167 17.8
2 There is little information about hospitals 128 13.6
3 Medical ex penses are high 116 12.3
4 Cannot communicate w ell w ith the doctors and nurses 186 19.8
5 Consultation hours are short 113 12.0
6 Waiting time is long 303 32.2
7 Hav e been refused treatment at hospitals 15 1.6
8 Did not receive an ex planation regarding the results of an ex amination and the treatment method 63 6.7
9 Did not understand how to use the medicine prov ided by the hospital 7 0.7
10 Did not understand the hospital sy stem such as office hours 42 4.5
11 Other 65 6.9
12 Nothing in particular 340 36.2
No answ er 20 2.1
No. of samples 940 100.0
0 10 20 30 40
For problems or complaints regarding Japanese hospitals, “Nothing in particular” (36.2%) was the highest in the mid 30%
range. For specific problems or complaints, “Waiting time is long” (32.2%) was the highest at greater than 30%, followed by
“Cannot communicate well with the doctors and nurses” (19.8%) at approximately 20%. Following were “Do not know which
hospital to go to” (17.8%), “There is little information about hospitals” (13.6%), and “Medical expenses are high” (12.3%).
(Chart 5-1)
CHART 5-2 PROBLEMS OR COMPLAINTS REGARDING JAPANESE HOSPITALS X NATIONALITY
No. of samplesDo not know w hich
hospital to go to
There is little information
about hospitals
Medical ex penses are
high
Cannot communicate
w ell w ith the doctors and
nurses
Consultation hours are
shortWaiting time is long
Hav e been refused
treatment at hospitals
Total 940 17.8 13.6 12.3 19.8 12.0 32.2 1.6
North America 158 19.0 13.9 5.7 25.9 12.0 26.6 3.2
Republic of Korean /
North Korean203 15.8 18.2 14.3 4.9 6.9 39.9 -
China / Taiw an 242 16.5 12.8 12.4 20.2 12.8 39.3 2.1
Europe 150 19.3 9.3 8.7 24.0 10.7 22.7 2.0
Other Asian or Oceania 142 19.7 12.7 20.4 28.2 17.6 27.5 0.7
Other 30 16.7 13.3 6.7 16.7 13.3 16.7 -
No answ er 15 20.0 13.3 26.7 33.3 26.7 46.7 6.7
No. of samples
Did not receiv e an
ex planation regarding the
results of an ex amination
and the treatment
method
Did not understand how
to use the medicine
prov ided by the hospital
Did not understand the
hospital sy stem such as
office hours
Other Nothing in particular No answ er
Total 940 6.7 0.7 4.5 6.9 36.2 2.1
North America 158 7.6 - 7.6 11.4 36.1 2.5
Republic of Korean /
North Korean203 3.4 0.5 2.5 3.0 39.4 2.0
China / Taiw an 242 5.0 0.8 4.5 5.8 31.0 2.5
Europe 150 8.0 1.3 2.7 10.0 39.3 2.7
Other Asian or Oceania 142 10.6 0.7 4.9 5.6 37.3 1.4
Other 30 10.0 - 3.3 13.3 40.0 -
No answ er 15 13.3 6.7 13.3 - 26.7 -
Distribution Ratio (%) Total column is no. of data.
Second highest ranking Highest ranking
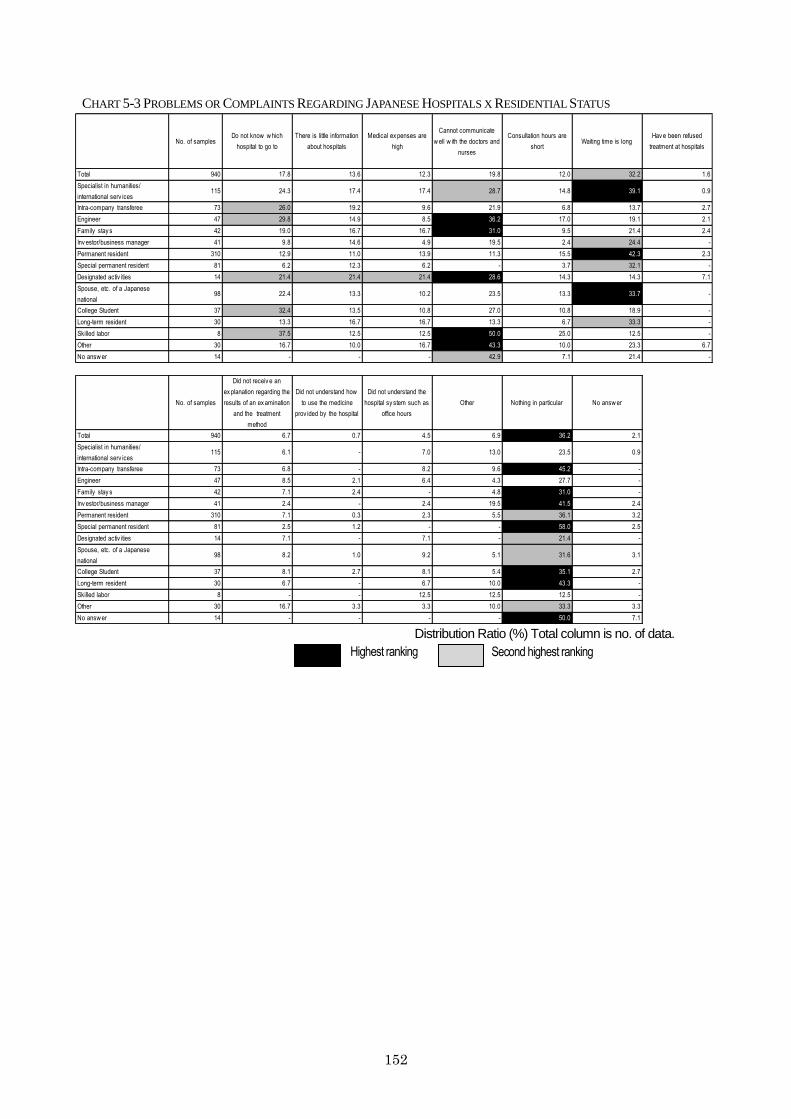
152
CHART 5-3 PROBLEMS OR COMPLAINTS REGARDING JAPANESE HOSPITALS X RESIDENTIAL STATUS
No. of samplesDo not know w hich
hospital to go to
There is little information
about hospitals
Medical ex penses are
high
Cannot communicate
w ell w ith the doctors and
nurses
Consultation hours are
shortWaiting time is long
Hav e been refused
treatment at hospitals
Total 940 17.8 13.6 12.3 19.8 12.0 32.2 1.6
Specialist in humanities/
international serv ices115 24.3 17.4 17.4 28.7 14.8 39.1 0.9
Intra-company transferee 73 26.0 19.2 9.6 21.9 6.8 13.7 2.7
Engineer 47 29.8 14.9 8.5 36.2 17.0 19.1 2.1
Family stay s 42 19.0 16.7 16.7 31.0 9.5 21.4 2.4
Inv estor/business manager 41 9.8 14.6 4.9 19.5 2.4 24.4 -
Permanent resident 310 12.9 11.0 13.9 11.3 15.5 42.3 2.3
Special permanent resident 81 6.2 12.3 6.2 - 3.7 32.1 -
Designated activ ities 14 21.4 21.4 21.4 28.6 14.3 14.3 7.1
Spouse, etc. of a Japanese
national98 22.4 13.3 10.2 23.5 13.3 33.7 -
College Student 37 32.4 13.5 10.8 27.0 10.8 18.9 -
Long-term resident 30 13.3 16.7 16.7 13.3 6.7 33.3 -
Skilled labor 8 37.5 12.5 12.5 50.0 25.0 12.5 -
Other 30 16.7 10.0 16.7 43.3 10.0 23.3 6.7
No answ er 14 - - - 42.9 7.1 21.4 -
No. of samples
Did not receiv e an
ex planation regarding the
results of an ex amination
and the treatment
method
Did not understand how
to use the medicine
prov ided by the hospital
Did not understand the
hospital sy stem such as
office hours
Other Nothing in particular No answ er
Total 940 6.7 0.7 4.5 6.9 36.2 2.1
Specialist in humanities/
international serv ices115 6.1 - 7.0 13.0 23.5 0.9
Intra-company transferee 73 6.8 - 8.2 9.6 45.2 -
Engineer 47 8.5 2.1 6.4 4.3 27.7 -
Family stay s 42 7.1 2.4 - 4.8 31.0 -
Inv estor/business manager 41 2.4 - 2.4 19.5 41.5 2.4
Permanent resident 310 7.1 0.3 2.3 5.5 36.1 3.2
Special permanent resident 81 2.5 1.2 - - 58.0 2.5
Designated activ ities 14 7.1 - 7.1 - 21.4 -
Spouse, etc. of a Japanese
national98 8.2 1.0 9.2 5.1 31.6 3.1
College Student 37 8.1 2.7 8.1 5.4 35.1 2.7
Long-term resident 30 6.7 - 6.7 10.0 43.3 -
Skilled labor 8 - - 12.5 12.5 12.5 -
Other 30 16.7 3.3 3.3 10.0 33.3 3.3
No answ er 14 - - - - 50.0 7.1 Distribution Ratio (%) Total column is no. of data.
Second highest ranking Highest ranking
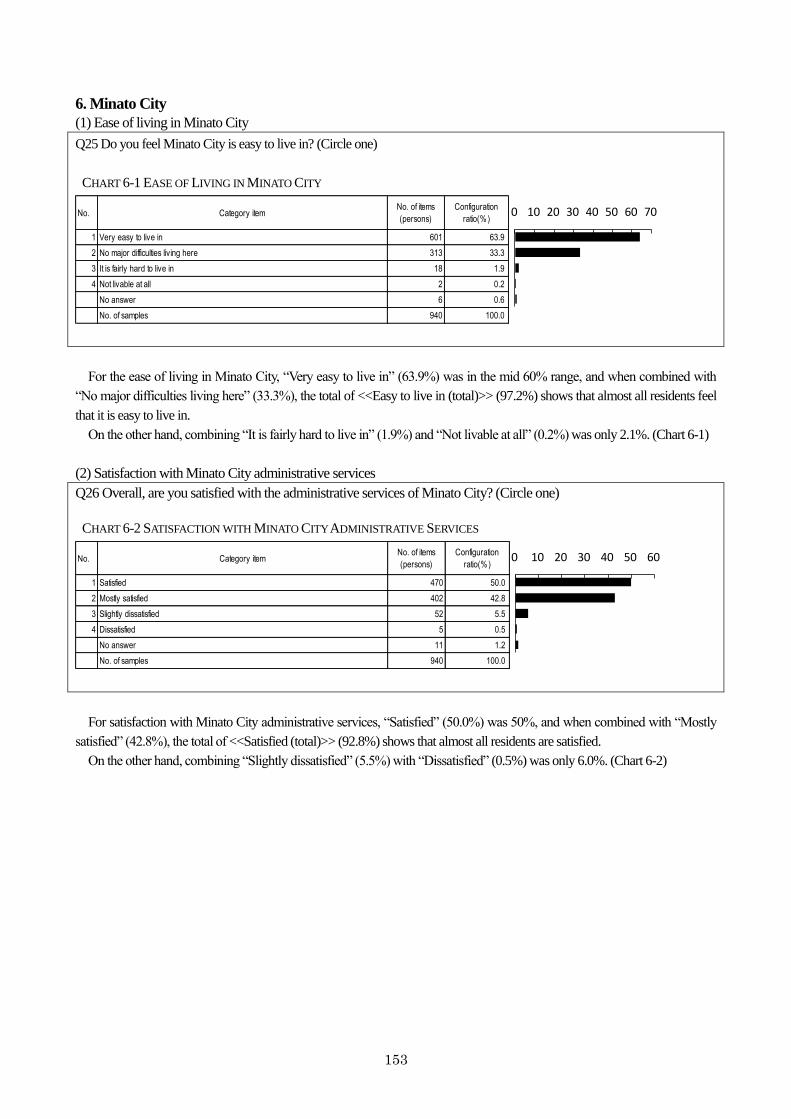
153
6. Minato City
(1) Ease of living in Minato City
Q25 Do you feel Minato City is easy to live in? (Circle one)
CHART 6-1 EASE OF LIVING IN MINATO CITY
No. Category itemNo. of items
(persons)
Configuration
ratio(%)
1 Very easy to live in 601 63.9
2 No major difficulties living here 313 33.3
3 It is fairly hard to live in 18 1.9
4 Not livable at all 2 0.2
No answer 6 0.6
No. of samples 940 100.0
0 10 20 30 40 50 60 70
For the ease of living in Minato City, “Very easy to live in” (63.9%) was in the mid 60% range, and when combined with
“No major difficulties living here” (33.3%), the total of <<Easy to live in (total)>> (97.2%) shows that almost all residents feel
that it is easy to live in.
On the other hand, combining “It is fairly hard to live in” (1.9%) and “Not livable at all” (0.2%) was only 2.1%. (Chart 6-1)
(2) Satisfaction with Minato City administrative services
Q26 Overall, are you satisfied with the administrative services of Minato City? (Circle one)
CHART 6-2 SATISFACTION WITH MINATO CITY ADMINISTRATIVE SERVICES
No. Category itemNo. of items
(persons)
Configuration
ratio(%)
1 Satisfied 470 50.0
2 Mostly satisfied 402 42.8
3 Slightly dissatisfied 52 5.5
4 Dissatisfied 5 0.5
No answer 11 1.2
No. of samples 940 100.0
0 10 20 30 40 50 60
For satisfaction with Minato City administrative services, “Satisfied” (50.0%) was 50%, and when combined with “Mostly
satisfied” (42.8%), the total of <<Satisfied (total)>> (92.8%) shows that almost all residents are satisfied.
On the other hand, combining “Slightly dissatisfied” (5.5%) with “Dissatisfied” (0.5%) was only 6.0%. (Chart 6-2)
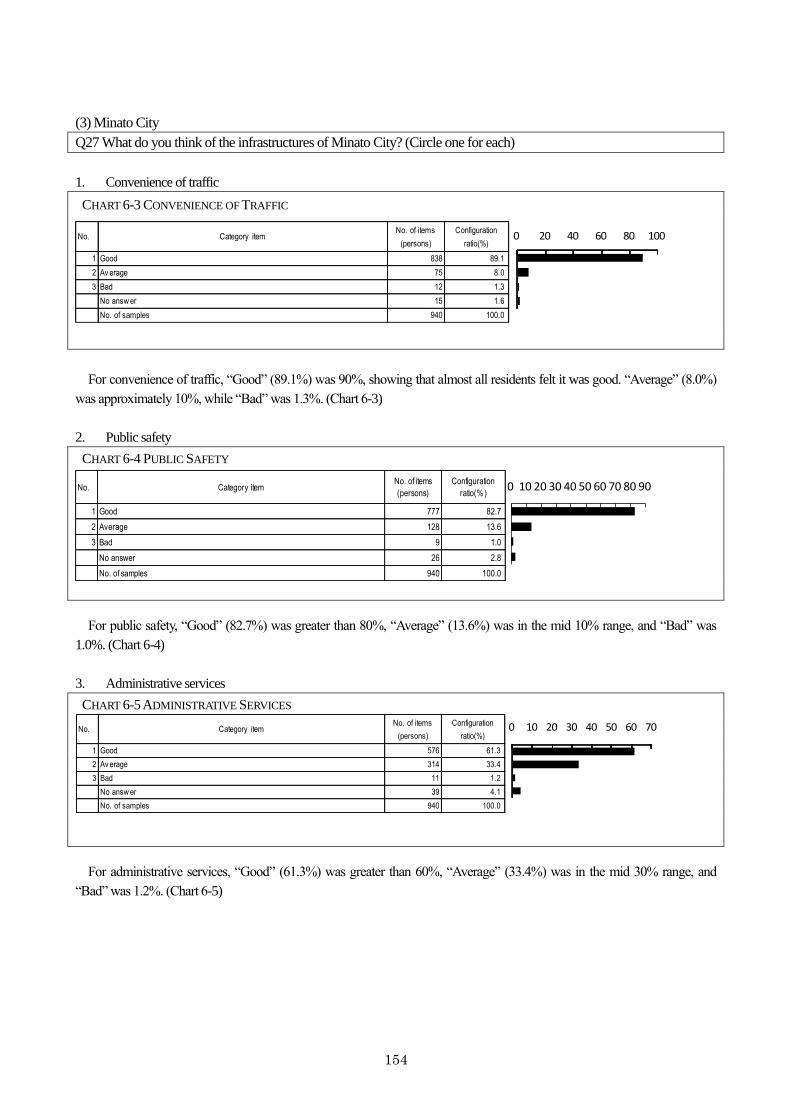
154
(3) Minato City
Q27 What do you think of the infrastructures of Minato City? (Circle one for each)
1. Convenience of traffic
CHART 6-3 CONVENIENCE OF TRAFFIC
No. Category itemNo. of items
(persons)
Configuration
ratio(%)
1 Good 838 89.1
2 Av erage 75 8.0
3 Bad 12 1.3
No answ er 15 1.6
No. of samples 940 100.0
0 20 40 60 80 100
For convenience of traffic, “Good” (89.1%) was 90%, showing that almost all residents felt it was good. “Average” (8.0%)
was approximately 10%, while “Bad” was 1.3%. (Chart 6-3)
2. Public safety
CHART 6-4 PUBLIC SAFETY
No. Category itemNo. of items
(persons)
Configuration
ratio(%)
1 Good 777 82.7
2 Average 128 13.6
3 Bad 9 1.0
No answer 26 2.8
No. of samples 940 100.0
0 10 20 30 40 50 60 70 80 90
For public safety, “Good” (82.7%) was greater than 80%, “Average” (13.6%) was in the mid 10% range, and “Bad” was
1.0%. (Chart 6-4)
3. Administrative services
CHART 6-5 ADMINISTRATIVE SERVICES
For administrative services, “Good” (61.3%) was greater than 60%, “Average” (33.4%) was in the mid 30% range, and
“Bad” was 1.2%. (Chart 6-5)
No. Category itemNo. of items
(persons)
Configuration
ratio(%)
1 Good 576 61.3
2 Av erage 314 33.4
3 Bad 11 1.2
No answ er 39 4.1
No. of samples 940 100.0
0 10 20 30 40 50 60 70
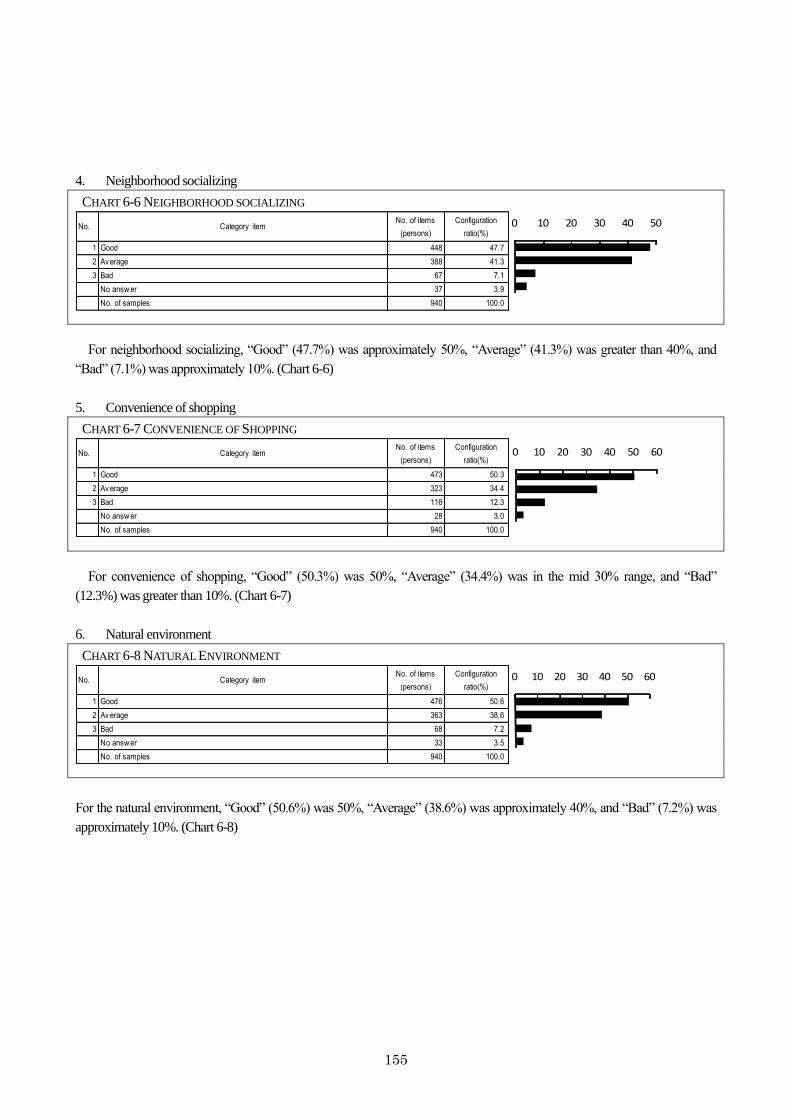
155
4. Neighborhood socializing
CHART 6-6 NEIGHBORHOOD SOCIALIZING
For neighborhood socializing, “Good” (47.7%) was approximately 50%, “Average” (41.3%) was greater than 40%, and
“Bad” (7.1%) was approximately 10%. (Chart 6-6)
5. Convenience of shopping
CHART 6-7 CONVENIENCE OF SHOPPING
For convenience of shopping, “Good” (50.3%) was 50%, “Average” (34.4%) was in the mid 30% range, and “Bad”
(12.3%) was greater than 10%. (Chart 6-7)
6. Natural environment
CHART 6-8 NATURAL ENVIRONMENT
For the natural environment, “Good” (50.6%) was 50%, “Average” (38.6%) was approximately 40%, and “Bad” (7.2%) was
approximately 10%. (Chart 6-8)
No. Category itemNo. of items
(persons)
Configuration
ratio(%)
1 Good 448 47.7
2 Av erage 388 41.3
3 Bad 67 7.1
No answ er 37 3.9
No. of samples 940 100.0
0 10 20 30 40 50
No. Category itemNo. of items
(persons)
Configuration
ratio(%)
1 Good 473 50.3
2 Av erage 323 34.4
3 Bad 116 12.3
No answ er 28 3.0
No. of samples 940 100.0
0 10 20 30 40 50 60
No. Category itemNo. of items
(persons)
Configuration
ratio(%)
1 Good 476 50.6
2 Av erage 363 38.6
3 Bad 68 7.2
No answ er 33 3.5
No. of samples 940 100.0
0 10 20 30 40 50 60
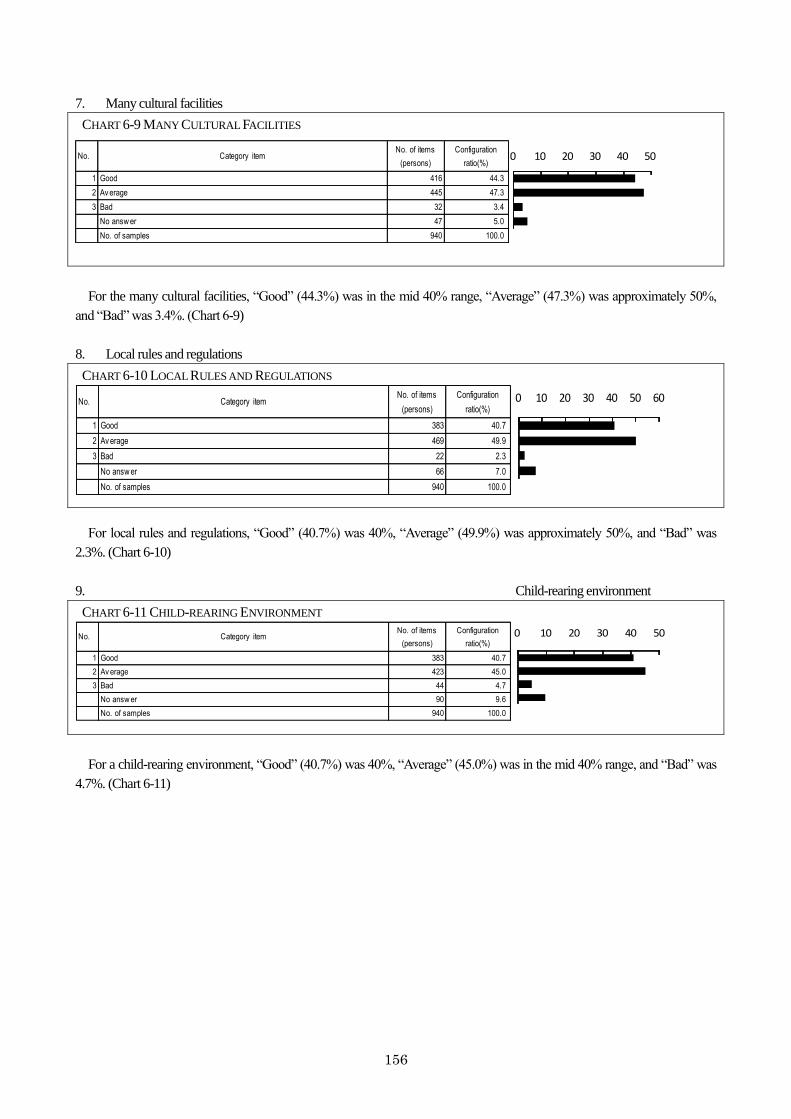
156
7. Many cultural facilities
CHART 6-9 MANY CULTURAL FACILITIES
No. Category itemNo. of items
(persons)
Configuration
ratio(%)
1 Good 416 44.3
2 Av erage 445 47.3
3 Bad 32 3.4
No answ er 47 5.0
No. of samples 940 100.0
0 10 20 30 40 50
For the many cultural facilities, “Good” (44.3%) was in the mid 40% range, “Average” (47.3%) was approximately 50%,
and “Bad” was 3.4%. (Chart 6-9)
8. Local rules and regulations
CHART 6-10 LOCAL RULES AND REGULATIONS
For local rules and regulations, “Good” (40.7%) was 40%, “Average” (49.9%) was approximately 50%, and “Bad” was
2.3%. (Chart 6-10)
9. Child-rearing environment
CHART 6-11 CHILD-REARING ENVIRONMENT
For a child-rearing environment, “Good” (40.7%) was 40%, “Average” (45.0%) was in the mid 40% range, and “Bad” was
4.7%. (Chart 6-11)
No. Category itemNo. of items
(persons)
Configuration
ratio(%)
1 Good 383 40.7
2 Av erage 469 49.9
3 Bad 22 2.3
No answ er 66 7.0
No. of samples 940 100.0
0 10 20 30 40 50 60
No. Category itemNo. of items
(persons)
Configuration
ratio(%)
1 Good 383 40.7
2 Av erage 423 45.0
3 Bad 44 4.7
No answ er 90 9.6
No. of samples 940 100.0
0 10 20 30 40 50
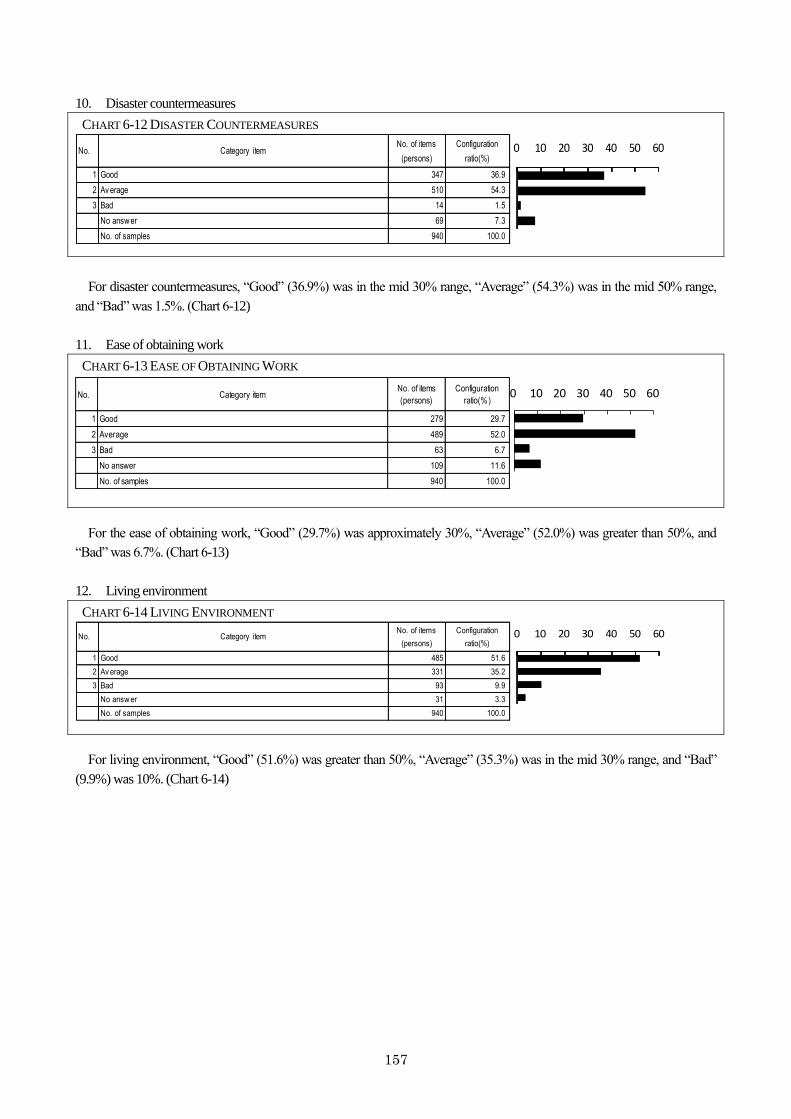
157
10. Disaster countermeasures
CHART 6-12 DISASTER COUNTERMEASURES
For disaster countermeasures, “Good” (36.9%) was in the mid 30% range, “Average” (54.3%) was in the mid 50% range,
and “Bad” was 1.5%. (Chart 6-12)
11. Ease of obtaining work
CHART 6-13 EASE OF OBTAINING WORK
No. Category itemNo. of items
(persons)
Configuration
ratio(%)
1 Good 279 29.7
2 Average 489 52.0
3 Bad 63 6.7
No answer 109 11.6
No. of samples 940 100.0
0 10 20 30 40 50 60
For the ease of obtaining work, “Good” (29.7%) was approximately 30%, “Average” (52.0%) was greater than 50%, and
“Bad” was 6.7%. (Chart 6-13)
12. Living environment
CHART 6-14 LIVING ENVIRONMENT
For living environment, “Good” (51.6%) was greater than 50%, “Average” (35.3%) was in the mid 30% range, and “Bad”
(9.9%) was 10%. (Chart 6-14)
No. Category itemNo. of items
(persons)
Configuration
ratio(%)
1 Good 347 36.9
2 Av erage 510 54.3
3 Bad 14 1.5
No answ er 69 7.3
No. of samples 940 100.0
0 10 20 30 40 50 60
No. Category itemNo. of items
(persons)
Configuration
ratio(%)
1 Good 485 51.6
2 Av erage 331 35.2
3 Bad 93 9.9
No answ er 31 3.3
No. of samples 940 100.0
0 10 20 30 40 50 60
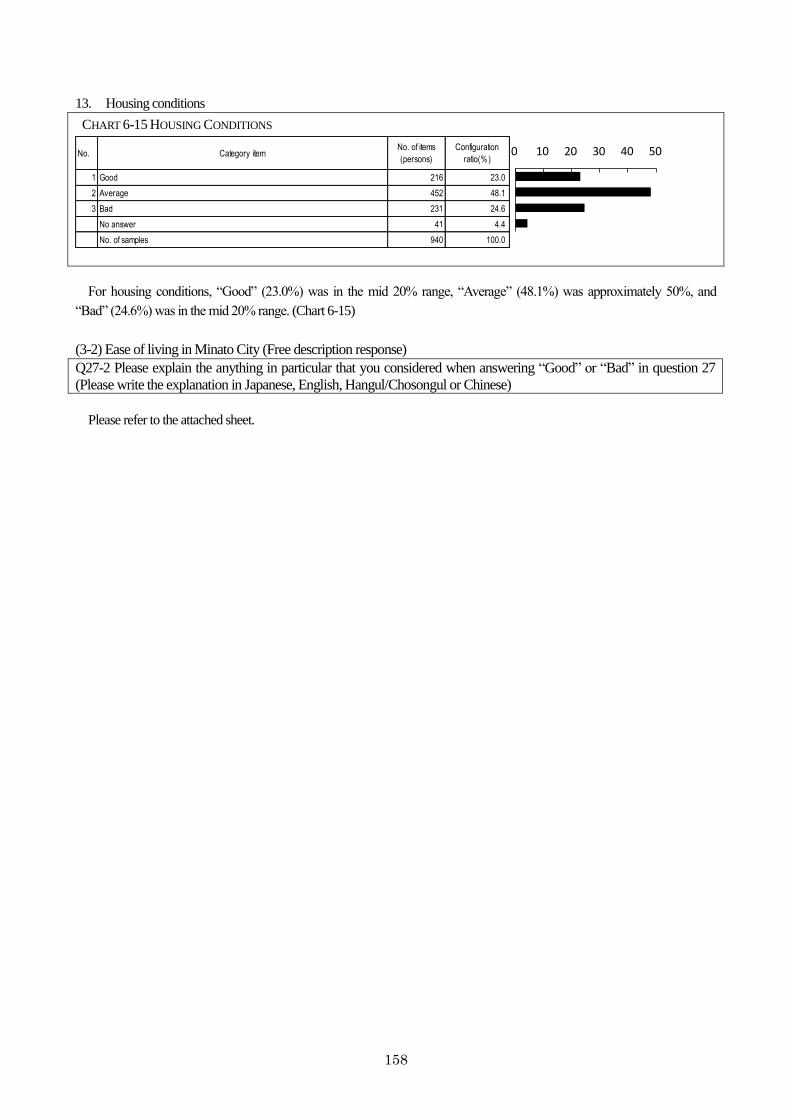
158
13. Housing conditions
CHART 6-15 HOUSING CONDITIONS
No. Category itemNo. of items
(persons)
Configuration
ratio(%)
1 Good 216 23.0
2 Average 452 48.1
3 Bad 231 24.6
No answer 41 4.4
No. of samples 940 100.0
0 10 20 30 40 50
For housing conditions, “Good” (23.0%) was in the mid 20% range, “Average” (48.1%) was approximately 50%, and
“Bad” (24.6%) was in the mid 20% range. (Chart 6-15)
(3-2) Ease of living in Minato City (Free description response)
Q27-2 Please explain the anything in particular that you considered when answering “Good” or “Bad” in question 27
(Please write the explanation in Japanese, English, Hangul/Chosongul or Chinese)
Please refer to the attached sheet.
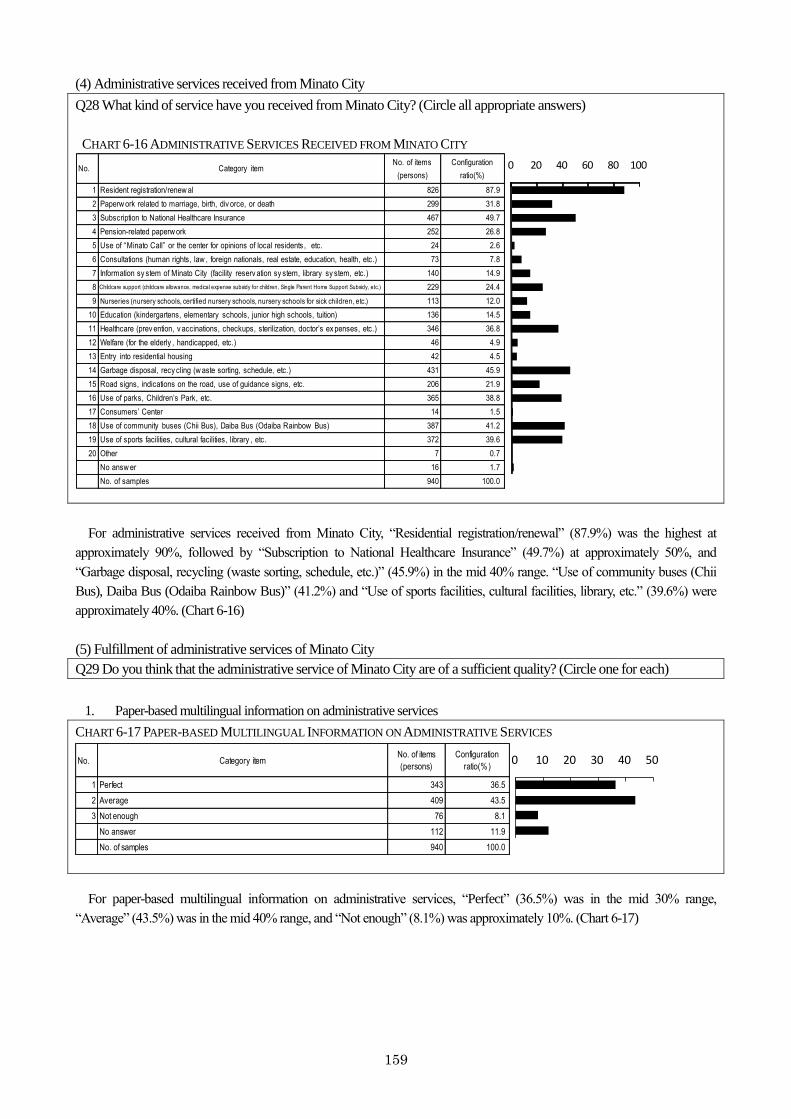
159
(4) Administrative services received from Minato City
Q28 What kind of service have you received from Minato City? (Circle all appropriate answers)
CHART 6-16 ADMINISTRATIVE SERVICES RECEIVED FROM MINATO CITY
For administrative services received from Minato City, “Residential registration/renewal” (87.9%) was the highest at
approximately 90%, followed by “Subscription to National Healthcare Insurance” (49.7%) at approximately 50%, and
“Garbage disposal, recycling (waste sorting, schedule, etc.)” (45.9%) in the mid 40% range. “Use of community buses (Chii
Bus), Daiba Bus (Odaiba Rainbow Bus)” (41.2%) and “Use of sports facilities, cultural facilities, library, etc.” (39.6%) were
approximately 40%. (Chart 6-16)
(5) Fulfillment of administrative services of Minato City
Q29 Do you think that the administrative service of Minato City are of a sufficient quality? (Circle one for each)
1. Paper-based multilingual information on administrative services
CHART 6-17 PAPER-BASED MULTILINGUAL INFORMATION ON ADMINISTRATIVE SERVICES
No. Category itemNo. of items
(persons)
Configuration
ratio(%)
1 Perfect 343 36.5
2 Average 409 43.5
3 Not enough 76 8.1
No answer 112 11.9
No. of samples 940 100.0
0 10 20 30 40 50
For paper-based multilingual information on administrative services, “Perfect” (36.5%) was in the mid 30% range,
“Average” (43.5%) was in the mid 40% range, and “Not enough” (8.1%) was approximately 10%. (Chart 6-17)
No. Category itemNo. of items
(persons)
Configuration
ratio(%)
1 Resident registration/renew al 826 87.9
2 Paperw ork related to marriage, birth, div orce, or death 299 31.8
3 Subscription to National Healthcare Insurance 467 49.7
4 Pension-related paperw ork 252 26.8
5 Use of “Minato Call” or the center for opinions of local residents , etc. 24 2.6
6 Consultations (human rights, law , foreign nationals, real estate, education, health, etc.) 73 7.8
7 Information sy stem of Minato City (facility reserv ation sy stem, library sy stem, etc.) 140 14.9
8 Childcare support (childcare allowance, medical expense subsidy for children, Single Parent Home Support Subsidy, etc.) 229 24.4
9 Nurseries (nursery schools, certified nursery schools, nursery schools for sick children, etc.) 113 12.0
10 Education (kindergartens, elementary schools, junior high schools, tuition) 136 14.5
11 Healthcare (prev ention, v accinations, checkups, sterilization, doctor’s ex penses, etc.) 346 36.8
12 Welfare (for the elderly , handicapped, etc.) 46 4.9
13 Entry into residential housing 42 4.5
14 Garbage disposal, recy cling (w aste sorting, schedule, etc.) 431 45.9
15 Road signs, indications on the road, use of guidance signs, etc. 206 21.9
16 Use of parks, Children’s Park, etc. 365 38.8
17 Consumers’ Center 14 1.5
18 Use of community buses (Chii Bus), Daiba Bus (Odaiba Rainbow Bus) 387 41.2
19 Use of sports facilities, cultural facilities, library , etc. 372 39.6
20 Other 7 0.7
No answ er 16 1.7
No. of samples 940 100.0
0 20 40 60 80 100
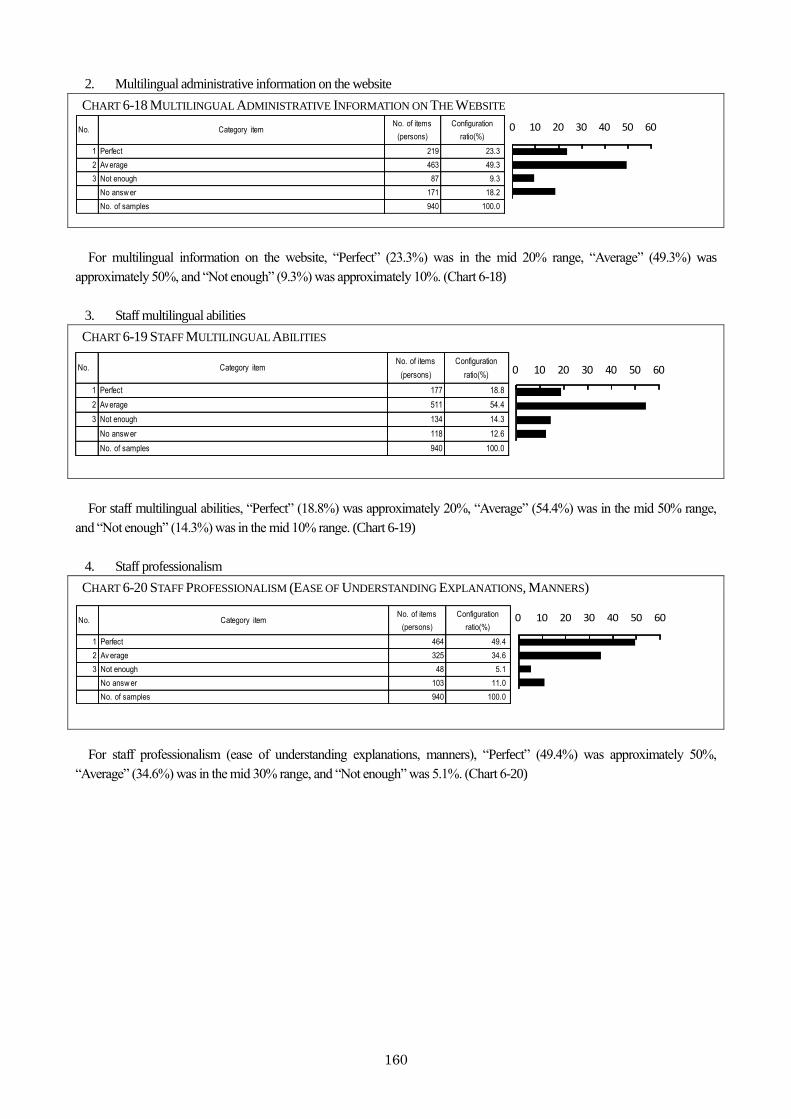
160
2. Multilingual administrative information on the website
CHART 6-18 MULTILINGUAL ADMINISTRATIVE INFORMATION ON THE WEBSITE
For multilingual information on the website, “Perfect” (23.3%) was in the mid 20% range, “Average” (49.3%) was
approximately 50%, and “Not enough” (9.3%) was approximately 10%. (Chart 6-18)
3. Staff multilingual abilities
CHART 6-19 STAFF MULTILINGUAL ABILITIES
No. Category itemNo. of items
(persons)
Configuration
ratio(%)
1 Perfect 177 18.8
2 Av erage 511 54.4
3 Not enough 134 14.3
No answ er 118 12.6
No. of samples 940 100.0
0 10 20 30 40 50 60
For staff multilingual abilities, “Perfect” (18.8%) was approximately 20%, “Average” (54.4%) was in the mid 50% range,
and “Not enough” (14.3%) was in the mid 10% range. (Chart 6-19)
4. Staff professionalism
CHART 6-20 STAFF PROFESSIONALISM (EASE OF UNDERSTANDING EXPLANATIONS, MANNERS)
For staff professionalism (ease of understanding explanations, manners), “Perfect” (49.4%) was approximately 50%,
“Average” (34.6%) was in the mid 30% range, and “Not enough” was 5.1%. (Chart 6-20)
No. Category itemNo. of items
(persons)
Configuration
ratio(%)
1 Perfect 219 23.3
2 Av erage 463 49.3
3 Not enough 87 9.3
No answ er 171 18.2
No. of samples 940 100.0
0 10 20 30 40 50 60
No. Category itemNo. of items
(persons)
Configuration
ratio(%)
1 Perfect 464 49.4
2 Av erage 325 34.6
3 Not enough 48 5.1
No answ er 103 11.0
No. of samples 940 100.0
0 10 20 30 40 50 60
161
5. Ability of Minato Call, center for local residents to respond with opinions in multiple languages
CHART 6-21 ABILITY OF MINATO CALL, CENTER FOR LOCAL RESIDENTS TO RESPOND WITH OPINIONS IN MULTIPLE
LANGUAGES
For the ability of Minato Call, center for local residents to respond with opinions in multiple languages, “Perfect” (14.0%)
was in the mid 10% range, “Average” (52.6%) was in the mid 50% range, and “Not enough” was 5.9%. (Chart 6-21)
6. Response of Minato Call, center for opinions of local residents
CHART 6-22 RESPONSE OF MINATO CALL, CENTER FOR OPINIONS OF LOCAL RESIDENTS (EASE OF UNDERSTANDING
EXPLANATIONS, MANNERS)
No. Category itemNo. of items
(persons)
Configuration
ratio(%)
1 Perfect 170 18.1
2 Av erage 463 49.3
3 Not enough 34 3.6
No answ er 273 29.0
No. of samples 940 100.0
0 10 20 30 40 50 60
For the response of Minato Call, center for opinions of local residents (ease of understanding explanations, manners),
“Perfect” (18.1%) was approximately 20%, “Average” (49.3%) was approximately 50%, and “Not enough” was 3.6%. (Chart
6-22)
7. Consultations
CHART 6-23 CONSULTATIONS
For consultations, “Perfect” (17.8%) was approximately 20%, “Average” (48.6%) was approximately 50%, and “Not
enough” was 5.2%. (Chart 6-23)
No. Category itemNo. of items
(persons)
Configuration
ratio(%)
1 Perfect 132 14.0
2 Av erage 494 52.6
3 Not enough 55 5.9
No answ er 259 27.6
No. of samples 940 100.0
0 10 20 30 40 50 60
No. Category itemNo. of items
(persons)
Configuration
ratio(%)
1 Perfect 167 17.8
2 Av erage 457 48.6
3 Not enough 49 5.2
No answ er 267 28.4
No. of samples 940 100.0
0 10 20 30 40 50 60
162
8. Provision of e-government services
CHART 6-24 PROVISION OF E-GOVERNMENT SERVICES
For the provision of e-government services, “Perfect” (21.4%) was greater than 20%, “Average” (44.3%) was in the mid
40% range, and “Not enough” was 5.9%. (Chart 6-24)
9. Child-rearing support
CHART 6-25 CHILD-REARING SUPPORT
For child-rearing support, “Perfect” (26.1%) was in the mid 20% range, “Average” (40.6%) was around 40%, and “Not
enough” was 3.6%. (Chart 6-25)
10. Childcare
CHART 6-26 CHILDCARE
No. Category itemNo. of items
(persons)
Configuration
ratio(%)
1 Perfect 154 16.4
2 Average 400 42.6
3 Not enough 75 8.0
No answer 311 33.1
No. of samples 940 100.0
0 10 20 30 40 50
For childcare, “Perfect” (16.4%) was in the mid 10% range, “Average” (42.6%) was greater than 40%, and “Not enough”
(8.0%) was approximately 10%. (Chart 6-26)
No. Category itemNo. of items
(persons)
Configuration
ratio(%)
1 Perfect 201 21.4
2 Av erage 416 44.3
3 Not enough 55 5.9
No answ er 268 28.5
No. of samples 940 100.0
0 10 20 30 40 50
No. Category itemNo. of items
(persons)
Configuration
ratio(%)
1 Perfect 245 26.1
2 Av erage 382 40.6
3 Not enough 34 3.6
No answ er 279 29.7
No. of samples 940 100.0
0 10 20 30 40 50
163
11. Education
CHART 6-27 EDUCATION
For education, “Perfect” (20.6%) was 20%, “Average” (43.5%) was in the mid 40% range, and “Not enough” was 4.3%.
(Chart 6-27)
12. Healthcare
CHART 6-28 HEALTHCARE
For healthcare, “Perfect” (37.6%) was approximately 40%, “Average” (39.0%) was also approximately 40%, and “Not
enough” was 2.9%. (Chart 6-28)
13. Welfare
CHART 6-29 WELFARE
No. Category itemNo. of items
(persons)
Configuration
ratio(%)
1 Perfect 173 18.4
2 Average 430 45.7
3 Not enough 21 2.2
No answer 316 33.6
No. of samples 940 100.0
0 10 20 30 40 50
For welfare, “Perfect” (18.4%) was approximately 20%, “Average” (45.7%) was in the mid 40% range, and “Not enough”
was 2.2%. (Chart 6-29)
No. Category itemNo. of items
(persons)
Configuration
ratio(%)
1 Perfect 194 20.6
2 Av erage 409 43.5
3 Not enough 40 4.3
No answ er 297 31.6
No. of samples 940 100.0
0 10 20 30 40 50
No. Category itemNo. of items
(persons)
Configuration
ratio(%)
1 Perfect 353 37.6
2 Av erage 367 39.0
3 Not enough 27 2.9
No answ er 193 20.5
No. of samples 940 100.0
0 10 20 30 40
164
14. Development of housing for residents
CHART 6-30 DEVELOPMENT OF HOUSING FOR RESIDENTS
For development of housing for residents, “Perfect” (15.3%) was in the mid 10% range, “Average” (48.3%) was
approximately 50%, and “Not enough” was 6.0%. (Chart 6-30)
15. Garbage collection, recycling
CHART 6-31 GARBAGE COLLECTION, RECYCLING
For garbage collection, recycling, “Perfect” (49.3%) was approximately 50%, “Average” (32.8%) was greater than 30%,
and “Not enough” was 3.0%. (Chart 6-31)
16. Maintenance of roads, street signs, and direction boards
CHART 6-32 MAINTENANCE OF ROADS, STREET SIGNS, AND DIRECTION BOARDS
No. Category itemNo. of items
(persons)
Configuration
ratio(%)
1 Perfect 386 41.1
2 Average 340 36.2
3 Not enough 33 3.5
No answer 181 19.3
No. of samples 940 100.0
0 10 20 30 40 50
For the maintenance of roads, street signs, and direction boards, “Perfect” (41.1%) was greater than 40%, “Average”
(36.2%) was in the mid 30% range, and “Not enough” was 3.5%. (Chart 6-32)
No. Category itemNo. of items
(persons)
Configuration
ratio(%)
1 Perfect 144 15.3
2 Av erage 454 48.3
3 Not enough 56 6.0
No answ er 286 30.4
No. of samples 940 100.0
0 10 20 30 40 50 60
No. Category itemNo. of items
(persons)
Configuration
ratio(%)
1 Perfect 463 49.3
2 Av erage 308 32.8
3 Not enough 28 3.0
No answ er 141 15.0
No. of samples 940 100.0
0 10 20 30 40 50 60
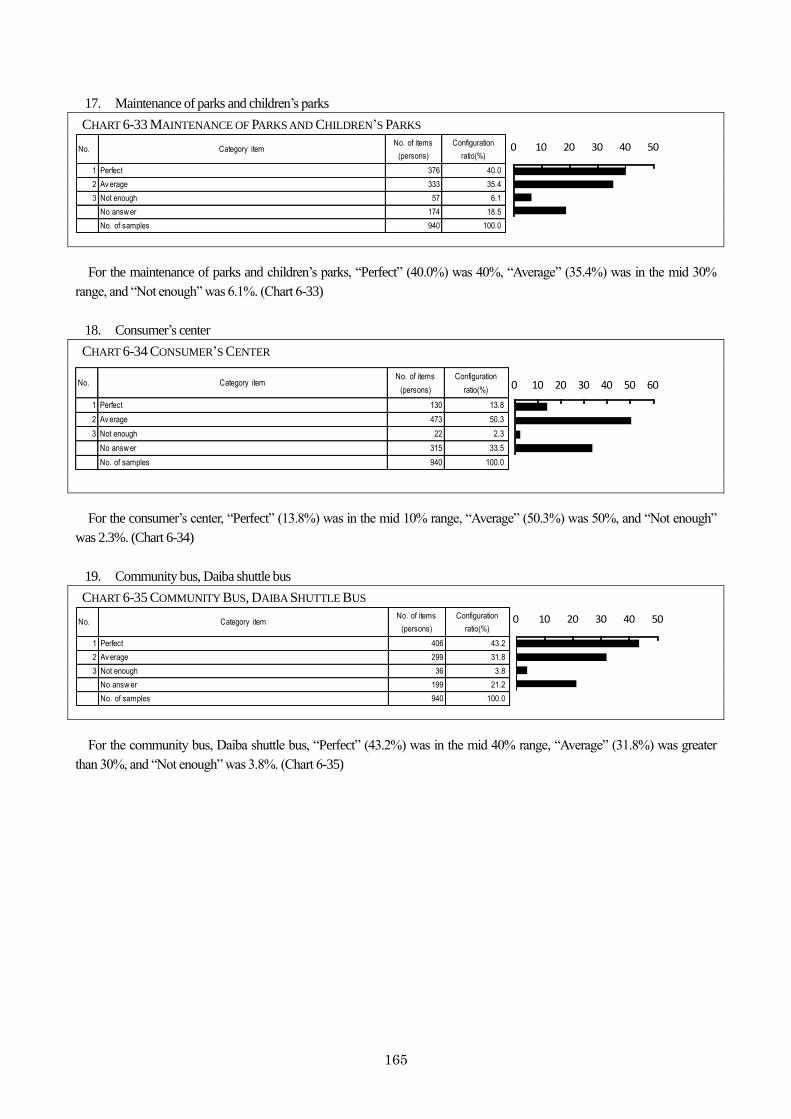
165
17. Maintenance of parks and children’s parks
CHART 6-33 MAINTENANCE OF PARKS AND CHILDREN’S PARKS
For the maintenance of parks and children’s parks, “Perfect” (40.0%) was 40%, “Average” (35.4%) was in the mid 30%
range, and “Not enough” was 6.1%. (Chart 6-33)
18. Consumer’s center
CHART 6-34 CONSUMER’S CENTER
No. Category itemNo. of items
(persons)
Configuration
ratio(%)
1 Perfect 130 13.8
2 Av erage 473 50.3
3 Not enough 22 2.3
No answ er 315 33.5
No. of samples 940 100.0
0 10 20 30 40 50 60
For the consumer’s center, “Perfect” (13.8%) was in the mid 10% range, “Average” (50.3%) was 50%, and “Not enough”
was 2.3%. (Chart 6-34)
19. Community bus, Daiba shuttle bus
CHART 6-35 COMMUNITY BUS, DAIBA SHUTTLE BUS
For the community bus, Daiba shuttle bus, “Perfect” (43.2%) was in the mid 40% range, “Average” (31.8%) was greater
than 30%, and “Not enough” was 3.8%. (Chart 6-35)
No. Category itemNo. of items
(persons)
Configuration
ratio(%)
1 Perfect 376 40.0
2 Av erage 333 35.4
3 Not enough 57 6.1
No answ er 174 18.5
No. of samples 940 100.0
0 10 20 30 40 50
No. Category itemNo. of items
(persons)
Configuration
ratio(%)
1 Perfect 406 43.2
2 Av erage 299 31.8
3 Not enough 36 3.8
No answ er 199 21.2
No. of samples 940 100.0
0 10 20 30 40 50
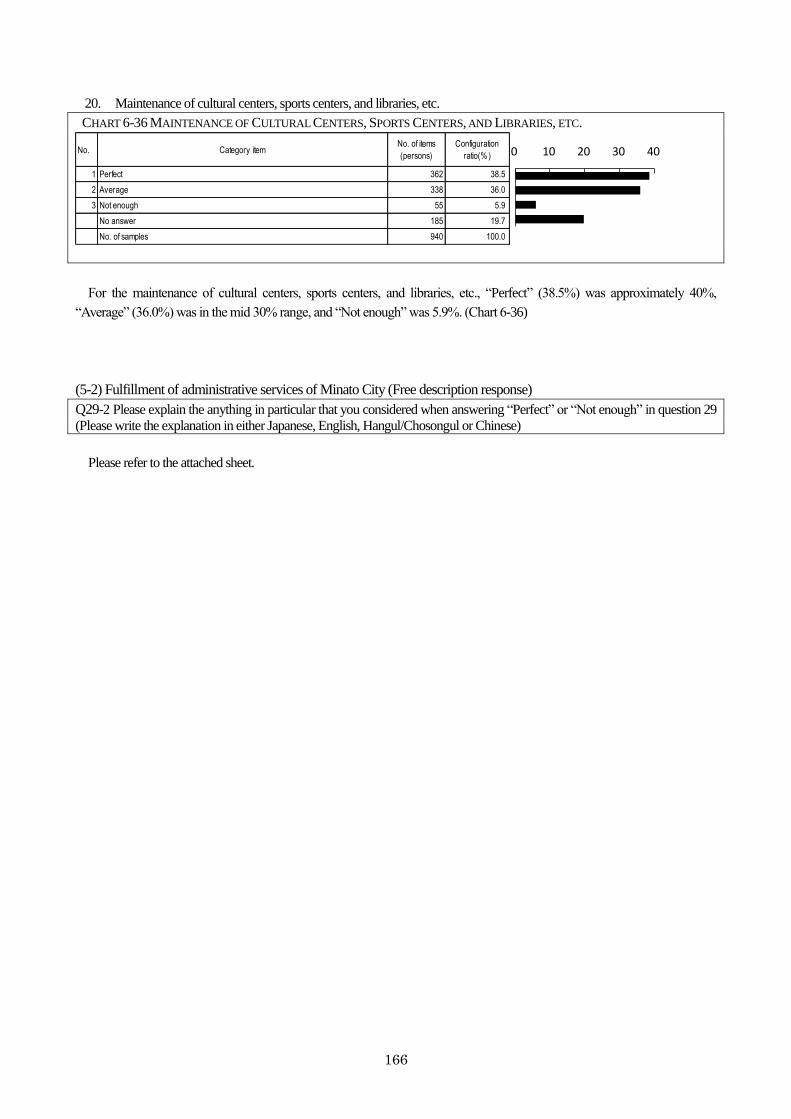
166
20. Maintenance of cultural centers, sports centers, and libraries, etc.
CHART 6-36 MAINTENANCE OF CULTURAL CENTERS, SPORTS CENTERS, AND LIBRARIES, ETC.
No. Category itemNo. of items
(persons)
Configuration
ratio(%)
1 Perfect 362 38.5
2 Average 338 36.0
3 Not enough 55 5.9
No answer 185 19.7
No. of samples 940 100.0
0 10 20 30 40
For the maintenance of cultural centers, sports centers, and libraries, etc., “Perfect” (38.5%) was approximately 40%,
“Average” (36.0%) was in the mid 30% range, and “Not enough” was 5.9%. (Chart 6-36)
(5-2) Fulfillment of administrative services of Minato City (Free description response)
Q29-2 Please explain the anything in particular that you considered when answering “Perfect” or “Not enough” in question 29
(Please write the explanation in either Japanese, English, Hangul/Chosongul or Chinese)
Please refer to the attached sheet.
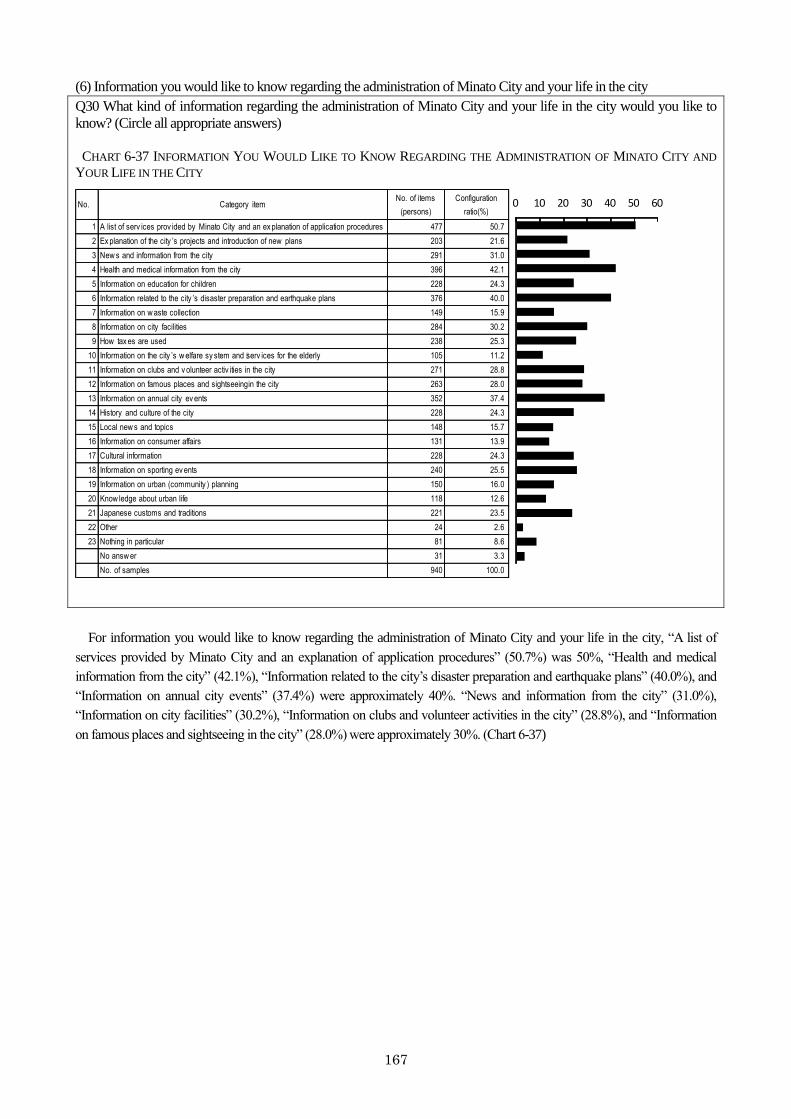
167
(6) Information you would like to know regarding the administration of Minato City and your life in the city
Q30 What kind of information regarding the administration of Minato City and your life in the city would you like to
know? (Circle all appropriate answers)
CHART 6-37 INFORMATION YOU WOULD LIKE TO KNOW REGARDING THE ADMINISTRATION OF MINATO CITY AND
YOUR LIFE IN THE CITY
No. Category itemNo. of items
(persons)
Configuration
ratio(%)
1 A list of serv ices prov ided by Minato City and an ex planation of application procedures 477 50.7
2 Ex planation of the city ’s projects and introduction of new plans 203 21.6
3 New s and information from the city 291 31.0
4 Health and medical information from the city 396 42.1
5 Information on education for children 228 24.3
6 Information related to the city ’s disaster preparation and earthquake plans 376 40.0
7 Information on w aste collection 149 15.9
8 Information on city facilities 284 30.2
9 How tax es are used 238 25.3
10 Information on the city ’s w elfare sy stem and serv ices for the elderly 105 11.2
11 Information on clubs and v olunteer activ ities in the city 271 28.8
12 Information on famous places and sightseeing in the city 263 28.0
13 Information on annual city ev ents 352 37.4
14 History and culture of the city 228 24.3
15 Local new s and topics 148 15.7
16 Information on consumer affairs 131 13.9
17 Cultural information 228 24.3
18 Information on sporting ev ents 240 25.5
19 Information on urban (community ) planning 150 16.0
20 Know ledge about urban life 118 12.6
21 Japanese customs and traditions 221 23.5
22 Other 24 2.6
23 Nothing in particular 81 8.6
No answ er 31 3.3
No. of samples 940 100.0
0 10 20 30 40 50 60
For information you would like to know regarding the administration of Minato City and your life in the city, “A list of
services provided by Minato City and an explanation of application procedures” (50.7%) was 50%, “Health and medical
information from the city” (42.1%), “Information related to the city’s disaster preparation and earthquake plans” (40.0%), and
“Information on annual city events” (37.4%) were approximately 40%. “News and information from the city” (31.0%),
“Information on city facilities” (30.2%), “Information on clubs and volunteer activities in the city” (28.8%), and “Information
on famous places and sightseeing in the city” (28.0%) were approximately 30%. (Chart 6-37)
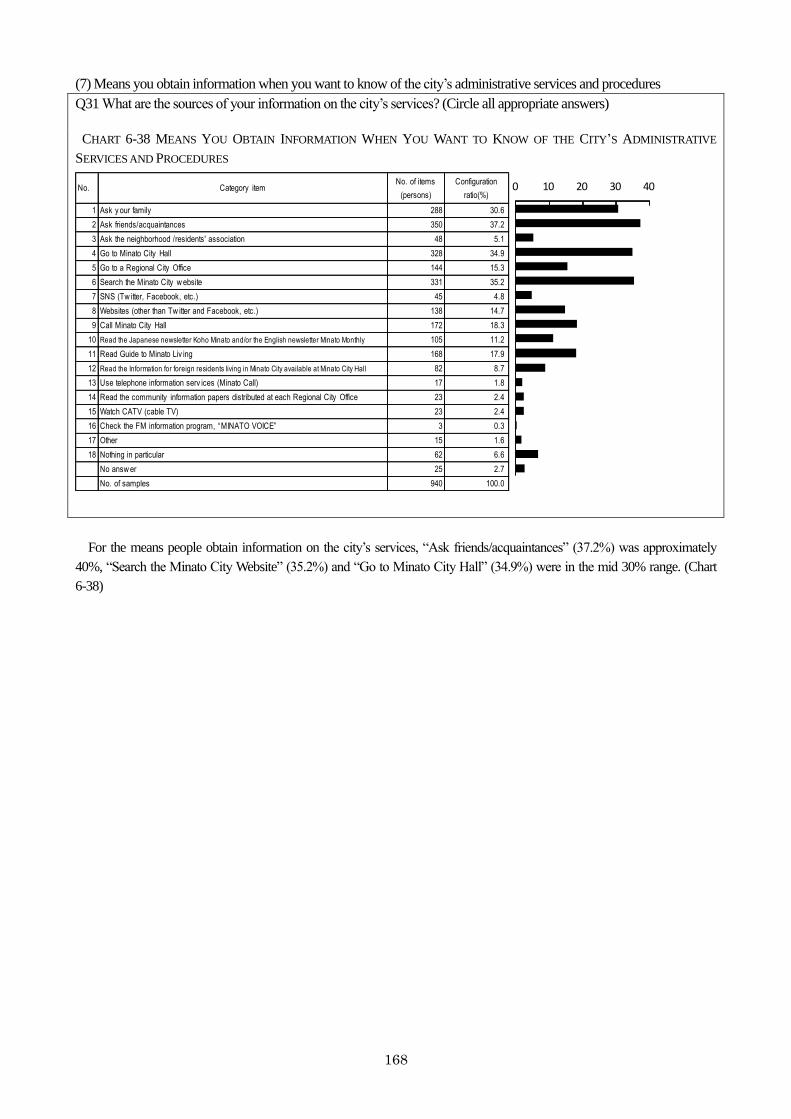
168
(7) Means you obtain information when you want to know of the city’s administrative services and procedures
Q31 What are the sources of your information on the city’s services? (Circle all appropriate answers)
CHART 6-38 MEANS YOU OBTAIN INFORMATION WHEN YOU WANT TO KNOW OF THE CITY’S ADMINISTRATIVE
SERVICES AND PROCEDURES
No. Category itemNo. of items
(persons)
Configuration
ratio(%)
1 Ask y our family 288 30.6
2 Ask friends/acquaintances 350 37.2
3 Ask the neighborhood /residents' association 48 5.1
4 Go to Minato City Hall 328 34.9
5 Go to a Regional City Office 144 15.3
6 Search the Minato City w ebsite 331 35.2
7 SNS (Tw itter, Facebook, etc.) 45 4.8
8 Websites (other than Tw itter and Facebook, etc.) 138 14.7
9 Call Minato City Hall 172 18.3
10 Read the Japanese newsletter Koho Minato and/or the English newsletter Minato Monthly 105 11.2
11 Read Guide to Minato Liv ing 168 17.9
12 Read the Information for foreign residents living in Minato City available at Minato City Hall 82 8.7
13 Use telephone information serv ices (Minato Call) 17 1.8
14 Read the community information papers distributed at each Regional City Office 23 2.4
15 Watch CATV (cable TV) 23 2.4
16 Check the FM information program, “MINATO VOICE” 3 0.3
17 Other 15 1.6
18 Nothing in particular 62 6.6
No answ er 25 2.7
No. of samples 940 100.0
0 10 20 30 40
For the means people obtain information on the city’s services, “Ask friends/acquaintances” (37.2%) was approximately
40%, “Search the Minato City Website” (35.2%) and “Go to Minato City Hall” (34.9%) were in the mid 30% range. (Chart
6-38)
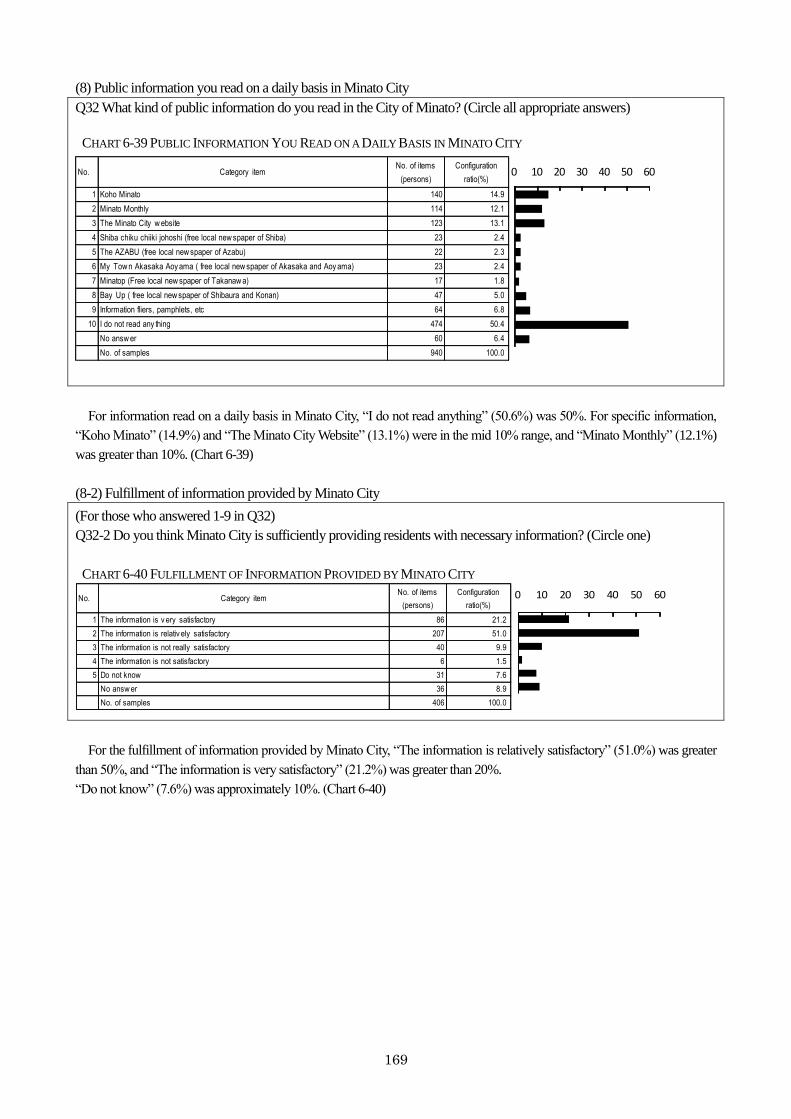
169
(8) Public information you read on a daily basis in Minato City
Q32 What kind of public information do you read in the City of Minato? (Circle all appropriate answers)
CHART 6-39 PUBLIC INFORMATION YOU READ ON A DAILY BASIS IN MINATO CITY
No. Category itemNo. of items
(persons)
Configuration
ratio(%)
1 Koho Minato 140 14.9
2 Minato Monthly 114 12.1
3 The Minato City w ebsite 123 13.1
4 Shiba chiku chiiki johoshi (free local new spaper of Shiba) 23 2.4
5 The AZABU (free local new spaper of Azabu) 22 2.3
6 My Tow n Akasaka Aoy ama ( free local new spaper of Akasaka and Aoy ama) 23 2.4
7 Minatop (Free local new spaper of Takanaw a) 17 1.8
8 Bay Up ( free local new spaper of Shibaura and Konan) 47 5.0
9 Information fliers, pamphlets, etc 64 6.8
10 I do not read any thing 474 50.4
No answ er 60 6.4
No. of samples 940 100.0
0 10 20 30 40 50 60
For information read on a daily basis in Minato City, “I do not read anything” (50.6%) was 50%. For specific information,
“Koho Minato” (14.9%) and “The Minato City Website” (13.1%) were in the mid 10% range, and “Minato Monthly” (12.1%)
was greater than 10%. (Chart 6-39)
(8-2) Fulfillment of information provided by Minato City
(For those who answered 1-9 in Q32)
Q32-2 Do you think Minato City is sufficiently providing residents with necessary information? (Circle one)
CHART 6-40 FULFILLMENT OF INFORMATION PROVIDED BY MINATO CITY
For the fulfillment of information provided by Minato City, “The information is relatively satisfactory” (51.0%) was greater
than 50%, and “The information is very satisfactory” (21.2%) was greater than 20%.
“Do not know” (7.6%) was approximately 10%. (Chart 6-40)
No. Category itemNo. of items
(persons)
Configuration
ratio(%)
1 The information is v ery satisfactory 86 21.2
2 The information is relativ ely satisfactory 207 51.0
3 The information is not really satisfactory 40 9.9
4 The information is not satisfactory 6 1.5
5 Do not know 31 7.6
No answ er 36 8.9
No. of samples 406 100.0
0 10 20 30 40 50 60
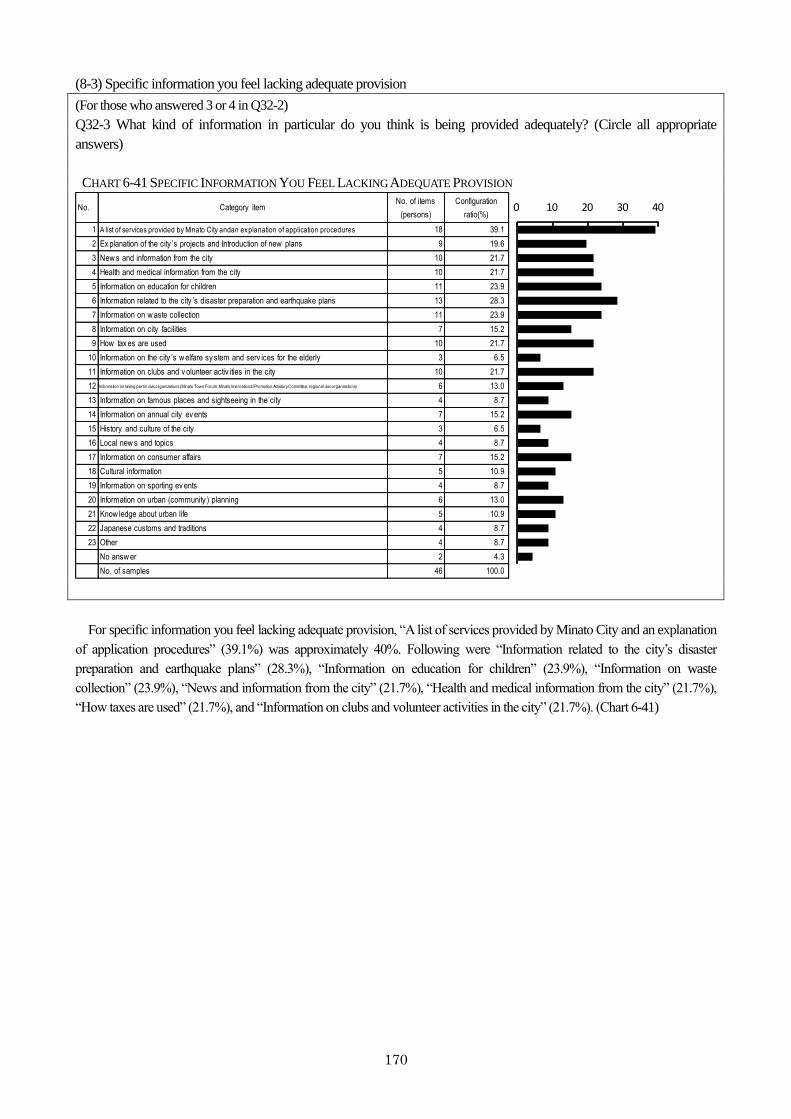
170
(8-3) Specific information you feel lacking adequate provision
(For those who answered 3 or 4 in Q32-2)
Q32-3 What kind of information in particular do you think is being provided adequately? (Circle all appropriate
answers)
CHART 6-41 SPECIFIC INFORMATION YOU FEEL LACKING ADEQUATE PROVISION
No. Category itemNo. of items
(persons)
Configuration
ratio(%)
1 A list of services provided by Minato City and an explanation of application procedures 18 39.1
2 Ex planation of the city ’s projects and introduction of new plans 9 19.6
3 New s and information from the city 10 21.7
4 Health and medical information from the city 10 21.7
5 Information on education for children 11 23.9
6 Information related to the city ’s disaster preparation and earthquake plans 13 28.3
7 Information on w aste collection 11 23.9
8 Information on city facilities 7 15.2
9 How tax es are used 10 21.7
10 Information on the city ’s w elfare sy stem and serv ices for the elderly 3 6.5
11 Information on clubs and v olunteer activ ities in the city 10 21.7
12 Information on taking part in civic organizations (Minato Town Forum, Minato International Promotion Advisory Committee, regional civic organizations) 6 13.0
13 Information on famous places and sightseeing in the city 4 8.7
14 Information on annual city ev ents 7 15.2
15 History and culture of the city 3 6.5
16 Local new s and topics 4 8.7
17 Information on consumer affairs 7 15.2
18 Cultural information 5 10.9
19 Information on sporting ev ents 4 8.7
20 Information on urban (community ) planning 6 13.0
21 Know ledge about urban life 5 10.9
22 Japanese customs and traditions 4 8.7
23 Other 4 8.7
No answ er 2 4.3
No. of samples 46 100.0
0 10 20 30 40
For specific information you feel lacking adequate provision, “A list of services provided by Minato City and an explanation
of application procedures” (39.1%) was approximately 40%. Following were “Information related to the city’s disaster
preparation and earthquake plans” (28.3%), “Information on education for children” (23.9%), “Information on waste
collection” (23.9%), “News and information from the city” (21.7%), “Health and medical information from the city” (21.7%),
“How taxes are used” (21.7%), and “Information on clubs and volunteer activities in the city” (21.7%). (Chart 6-41)
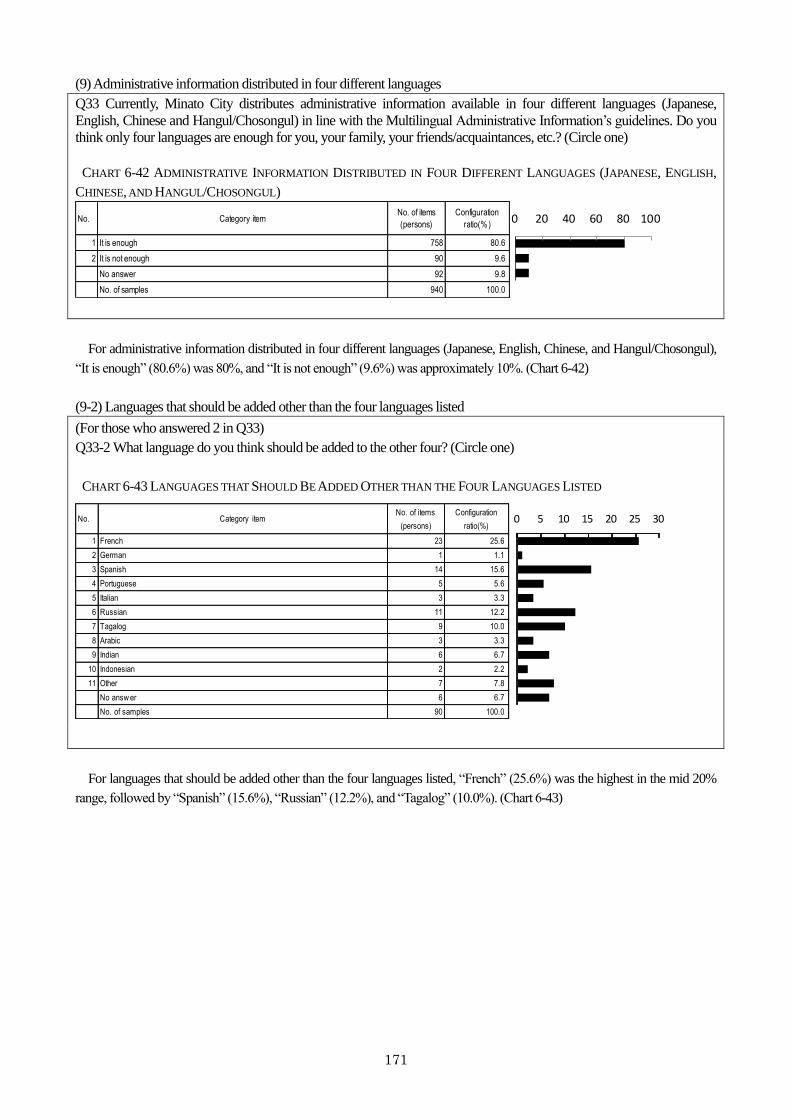
171
(9) Administrative information distributed in four different languages
Q33 Currently, Minato City distributes administrative information available in four different languages (Japanese,
English, Chinese and Hangul/Chosongul) in line with the Multilingual Administrative Information’s guidelines. Do you
think only four languages are enough for you, your family, your friends/acquaintances, etc.? (Circle one)
CHART 6-42 ADMINISTRATIVE INFORMATION DISTRIBUTED IN FOUR DIFFERENT LANGUAGES (JAPANESE, ENGLISH,
CHINESE, AND HANGUL/CHOSONGUL)
No. Category itemNo. of items
(persons)
Configuration
ratio(%)
1 It is enough 758 80.6
2 It is not enough 90 9.6
No answer 92 9.8
No. of samples 940 100.0
0 20 40 60 80 100
For administrative information distributed in four different languages (Japanese, English, Chinese, and Hangul/Chosongul),
“It is enough” (80.6%) was 80%, and “It is not enough” (9.6%) was approximately 10%. (Chart 6-42)
(9-2) Languages that should be added other than the four languages listed
(For those who answered 2 in Q33)
Q33-2 What language do you think should be added to the other four? (Circle one)
CHART 6-43 LANGUAGES THAT SHOULD BE ADDED OTHER THAN THE FOUR LANGUAGES LISTED
No. Category itemNo. of items
(persons)
Configuration
ratio(%)
1 French 23 25.6
2 German 1 1.1
3 Spanish 14 15.6
4 Portuguese 5 5.6
5 Italian 3 3.3
6 Russian 11 12.2
7 Tagalog 9 10.0
8 Arabic 3 3.3
9 Indian 6 6.7
10 Indonesian 2 2.2
11 Other 7 7.8
No answ er 6 6.7
No. of samples 90 100.0
0 5 10 15 20 25 30
For languages that should be added other than the four languages listed, “French” (25.6%) was the highest in the mid 20%
range, followed by “Spanish” (15.6%), “Russian” (12.2%), and “Tagalog” (10.0%). (Chart 6-43)
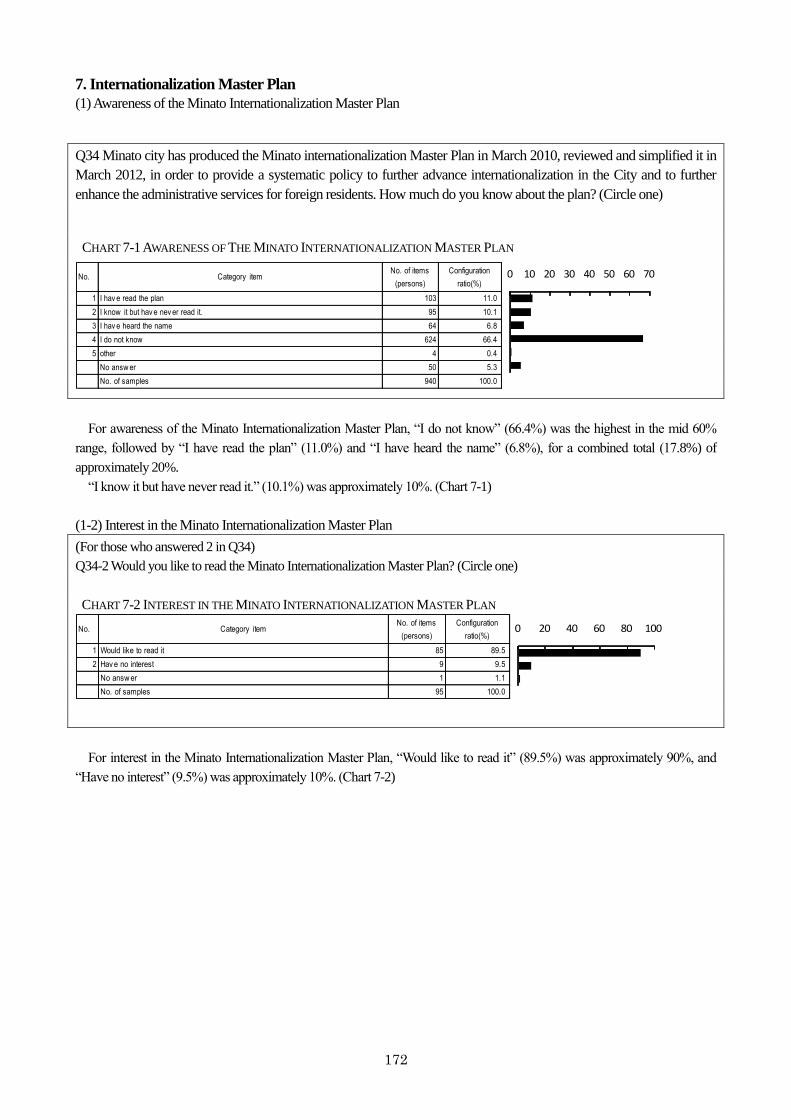
172
7. Internationalization Master Plan
(1) Awareness of the Minato Internationalization Master Plan
Q34 Minato city has produced the Minato internationalization Master Plan in March 2010, reviewed and simplified it in
March 2012, in order to provide a systematic policy to further advance internationalization in the City and to further
enhance the administrative services for foreign residents. How much do you know about the plan? (Circle one)
CHART 7-1 AWARENESS OF THE MINATO INTERNATIONALIZATION MASTER PLAN
For awareness of the Minato Internationalization Master Plan, “I do not know” (66.4%) was the highest in the mid 60%
range, followed by “I have read the plan” (11.0%) and “I have heard the name” (6.8%), for a combined total (17.8%) of
approximately 20%.
“I know it but have never read it.” (10.1%) was approximately 10%. (Chart 7-1)
(1-2) Interest in the Minato Internationalization Master Plan
(For those who answered 2 in Q34)
Q34-2 Would you like to read the Minato Internationalization Master Plan? (Circle one)
CHART 7-2 INTEREST IN THE MINATO INTERNATIONALIZATION MASTER PLAN
For interest in the Minato Internationalization Master Plan, “Would like to read it” (89.5%) was approximately 90%, and
“Have no interest” (9.5%) was approximately 10%. (Chart 7-2)
No. Category itemNo. of items
(persons)
Configuration
ratio(%)
1 I hav e read the plan 103 11.0
2 I know it but hav e nev er read it. 95 10.1
3 I hav e heard the name 64 6.8
4 I do not know 624 66.4
5 other 4 0.4
No answ er 50 5.3
No. of samples 940 100.0
0 10 20 30 40 50 60 70
No. Category itemNo. of items
(persons)
Configuration
ratio(%)
1 Would like to read it 85 89.5
2 Hav e no interest 9 9.5
No answ er 1 1.1
No. of samples 95 100.0
0 20 40 60 80 100
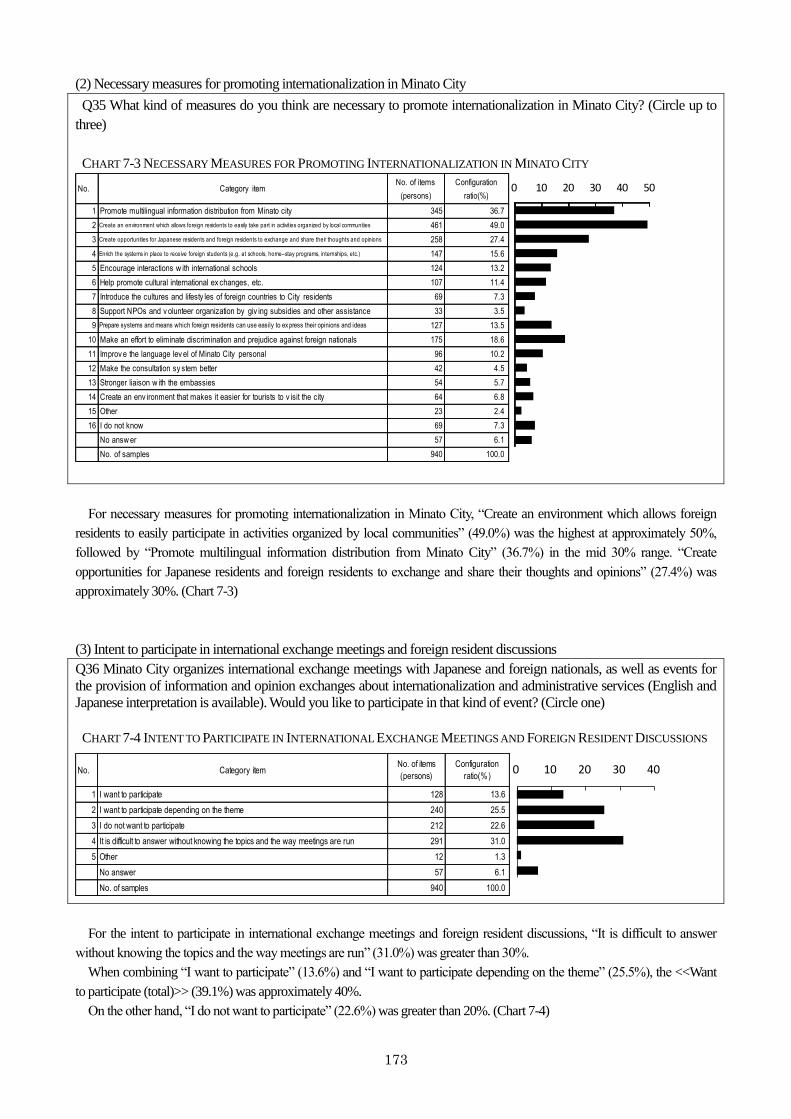
173
(2) Necessary measures for promoting internationalization in Minato City
Q35 What kind of measures do you think are necessary to promote internationalization in Minato City? (Circle up to
three)
CHART 7-3 NECESSARY MEASURES FOR PROMOTING INTERNATIONALIZATION IN MINATO CITY
No. Category itemNo. of items
(persons)
Configuration
ratio(%)
1 Promote multilingual information distribution from Minato city 345 36.7
2 Create an environment which allows foreign residents to easily take part in activities organized by local communities 461 49.0
3 Create opportunities for Japanese residents and foreign residents to exchange and share their thoughts and opinions 258 27.4
4 Enrich the systems in place to receive foreign students (e.g. at schools, home–stay programs, internships, etc.) 147 15.6
5 Encourage interactions w ith international schools 124 13.2
6 Help promote cultural international ex changes, etc. 107 11.4
7 Introduce the cultures and lifesty les of foreign countries to City residents 69 7.3
8 Support NPOs and v olunteer organization by giv ing subsidies and other assistance 33 3.5
9 Prepare systems and means which foreign residents can use easily to ex press their opinions and ideas 127 13.5
10 Make an effort to eliminate discrimination and prejudice against foreign nationals 175 18.6
11 Improv e the language lev el of Minato City personal 96 10.2
12 Make the consultation sy stem better 42 4.5
13 Stronger liaison w ith the embassies 54 5.7
14 Create an env ironment that makes it easier for tourists to v isit the city 64 6.8
15 Other 23 2.4
16 I do not know 69 7.3
No answ er 57 6.1
No. of samples 940 100.0
0 10 20 30 40 50
For necessary measures for promoting internationalization in Minato City, “Create an environment which allows foreign
residents to easily participate in activities organized by local communities” (49.0%) was the highest at approximately 50%,
followed by “Promote multilingual information distribution from Minato City” (36.7%) in the mid 30% range. “Create
opportunities for Japanese residents and foreign residents to exchange and share their thoughts and opinions” (27.4%) was
approximately 30%. (Chart 7-3)
(3) Intent to participate in international exchange meetings and foreign resident discussions
Q36 Minato City organizes international exchange meetings with Japanese and foreign nationals, as well as events for
the provision of information and opinion exchanges about internationalization and administrative services (English and
Japanese interpretation is available). Would you like to participate in that kind of event? (Circle one)
CHART 7-4 INTENT TO PARTICIPATE IN INTERNATIONAL EXCHANGE MEETINGS AND FOREIGN RESIDENT DISCUSSIONS
No. Category itemNo. of items
(persons)
Configuration
ratio(%)
1 I want to participate 128 13.6
2 I want to participate depending on the theme 240 25.5
3 I do not want to participate 212 22.6
4 It is difficult to answer without knowing the topics and the way meetings are run 291 31.0
5 Other 12 1.3
No answer 57 6.1
No. of samples 940 100.0
0 10 20 30 40
For the intent to participate in international exchange meetings and foreign resident discussions, “It is difficult to answer
without knowing the topics and the way meetings are run” (31.0%) was greater than 30%.
When combining “I want to participate” (13.6%) and “I want to participate depending on the theme” (25.5%), the <<Want
to participate (total)>> (39.1%) was approximately 40%.
On the other hand, “I do not want to participate” (22.6%) was greater than 20%. (Chart 7-4)
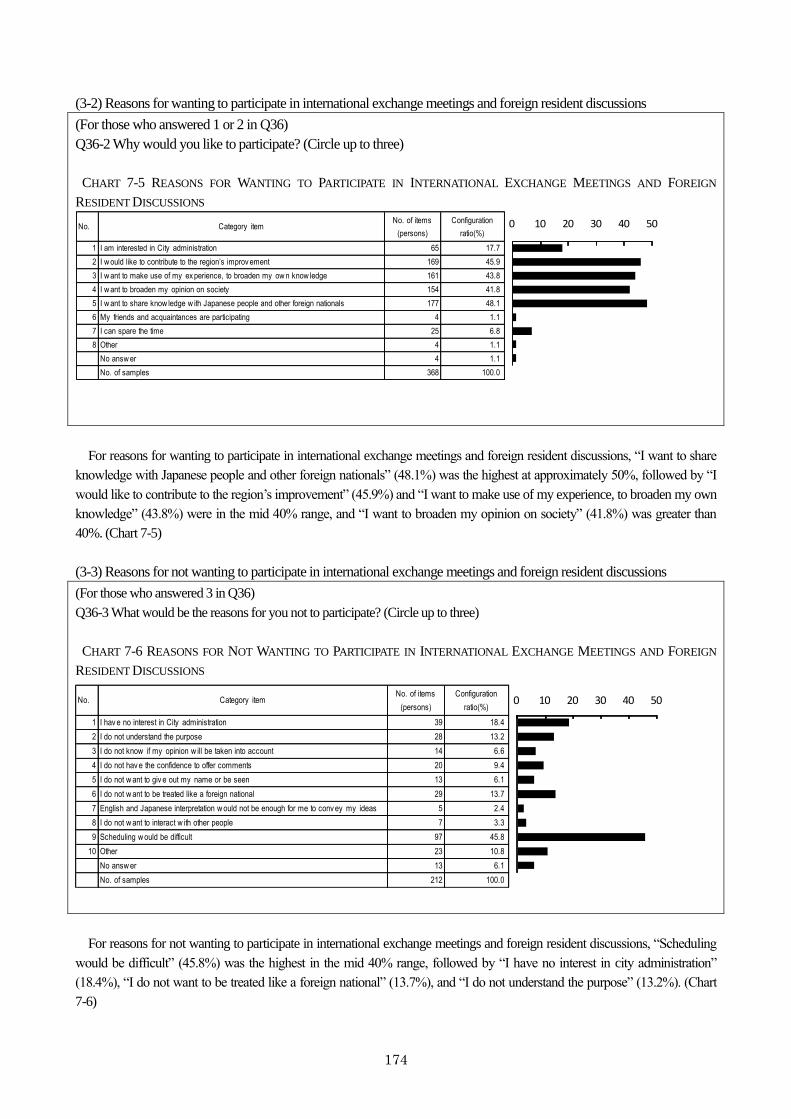
174
(3-2) Reasons for wanting to participate in international exchange meetings and foreign resident discussions
(For those who answered 1 or 2 in Q36)
Q36-2 Why would you like to participate? (Circle up to three)
CHART 7-5 REASONS FOR WANTING TO PARTICIPATE IN INTERNATIONAL EXCHANGE MEETINGS AND FOREIGN
RESIDENT DISCUSSIONS
For reasons for wanting to participate in international exchange meetings and foreign resident discussions, “I want to share
knowledge with Japanese people and other foreign nationals” (48.1%) was the highest at approximately 50%, followed by “I
would like to contribute to the region’s improvement” (45.9%) and “I want to make use of my experience, to broaden my own
knowledge” (43.8%) were in the mid 40% range, and “I want to broaden my opinion on society” (41.8%) was greater than
40%. (Chart 7-5)
(3-3) Reasons for not wanting to participate in international exchange meetings and foreign resident discussions
(For those who answered 3 in Q36)
Q36-3 What would be the reasons for you not to participate? (Circle up to three)
CHART 7-6 REASONS FOR NOT WANTING TO PARTICIPATE IN INTERNATIONAL EXCHANGE MEETINGS AND FOREIGN
RESIDENT DISCUSSIONS
No. Category itemNo. of items
(persons)
Configuration
ratio(%)
1 I hav e no interest in City administration 39 18.4
2 I do not understand the purpose 28 13.2
3 I do not know if my opinion w ill be taken into account 14 6.6
4 I do not hav e the confidence to offer comments 20 9.4
5 I do not w ant to giv e out my name or be seen 13 6.1
6 I do not w ant to be treated like a foreign national 29 13.7
7 English and Japanese interpretation w ould not be enough for me to conv ey my ideas 5 2.4
8 I do not w ant to interact w ith other people 7 3.3
9 Scheduling w ould be difficult 97 45.8
10 Other 23 10.8
No answ er 13 6.1
No. of samples 212 100.0
0 10 20 30 40 50
For reasons for not wanting to participate in international exchange meetings and foreign resident discussions, “Scheduling
would be difficult” (45.8%) was the highest in the mid 40% range, followed by “I have no interest in city administration”
(18.4%), “I do not want to be treated like a foreign national” (13.7%), and “I do not understand the purpose” (13.2%). (Chart
7-6)
No. Category itemNo. of items
(persons)
Configuration
ratio(%)
1 I am interested in City administration 65 17.7
2 I w ould like to contribute to the region’s improv ement 169 45.9
3 I w ant to make use of my ex perience, to broaden my ow n know ledge 161 43.8
4 I w ant to broaden my opinion on society 154 41.8
5 I w ant to share know ledge w ith Japanese people and other foreign nationals 177 48.1
6 My friends and acquaintances are participating 4 1.1
7 I can spare the time 25 6.8
8 Other 4 1.1
No answ er 4 1.1
No. of samples 368 100.0
0 10 20 30 40 50
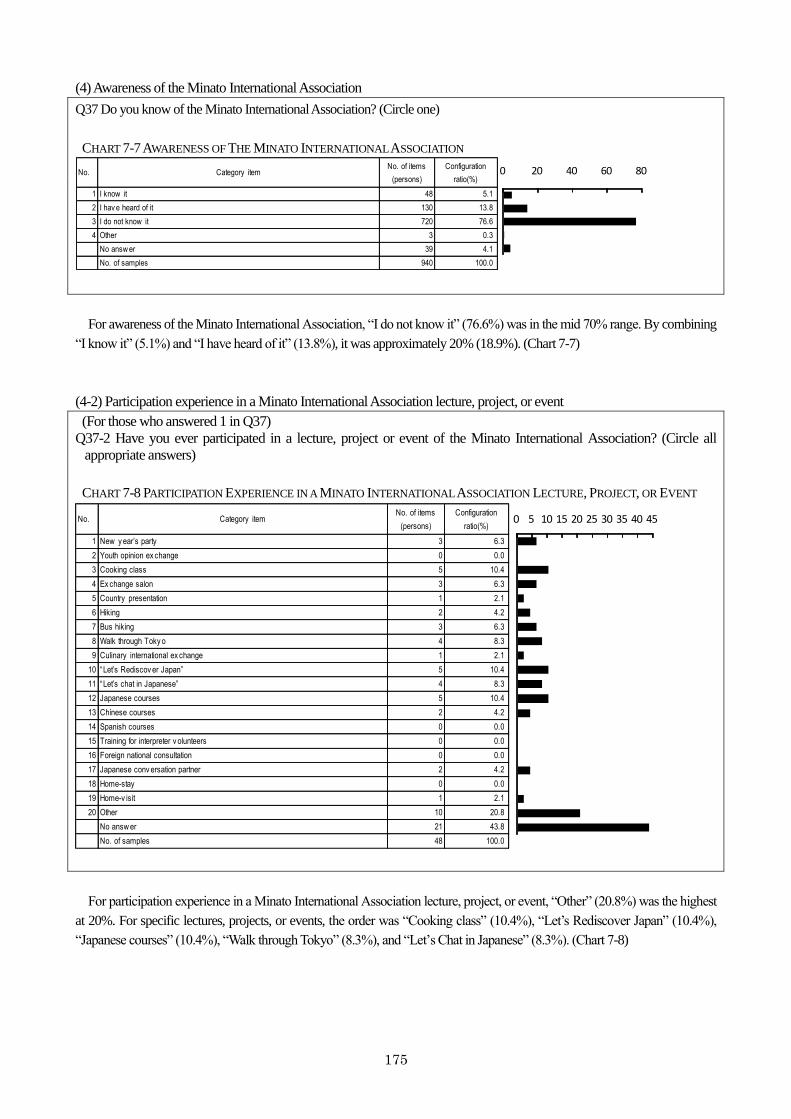
175
(4) Awareness of the Minato International Association
Q37 Do you know of the Minato International Association? (Circle one)
CHART 7-7 AWARENESS OF THE MINATO INTERNATIONAL ASSOCIATION
For awareness of the Minato International Association, “I do not know it” (76.6%) was in the mid 70% range. By combining
“I know it” (5.1%) and “I have heard of it” (13.8%), it was approximately 20% (18.9%). (Chart 7-7)
(4-2) Participation experience in a Minato International Association lecture, project, or event
(For those who answered 1 in Q37)
Q37-2 Have you ever participated in a lecture, project or event of the Minato International Association? (Circle all
appropriate answers)
CHART 7-8 PARTICIPATION EXPERIENCE IN A MINATO INTERNATIONAL ASSOCIATION LECTURE, PROJECT, OR EVENT
No. Category itemNo. of items
(persons)
Configuration
ratio(%)
1 New y ear’s party 3 6.3
2 Youth opinion ex change 0 0.0
3 Cooking class 5 10.4
4 Ex change salon 3 6.3
5 Country presentation 1 2.1
6 Hiking 2 4.2
7 Bus hiking 3 6.3
8 Walk through Toky o 4 8.3
9 Culinary international ex change 1 2.1
10 “Let’s Rediscov er Japan” 5 10.4
11 “Let’s chat in Japanese” 4 8.3
12 Japanese courses 5 10.4
13 Chinese courses 2 4.2
14 Spanish courses 0 0.0
15 Training for interpreter v olunteers 0 0.0
16 Foreign national consultation 0 0.0
17 Japanese conv ersation partner 2 4.2
18 Home-stay 0 0.0
19 Home-v isit 1 2.1
20 Other 10 20.8
No answ er 21 43.8
No. of samples 48 100.0
0 5 10 15 20 25 30 35 40 45
For participation experience in a Minato International Association lecture, project, or event, “Other” (20.8%) was the highest
at 20%. For specific lectures, projects, or events, the order was “Cooking class” (10.4%), “Let’s Rediscover Japan” (10.4%),
“Japanese courses” (10.4%), “Walk through Tokyo” (8.3%), and “Let’s Chat in Japanese” (8.3%). (Chart 7-8)
No. Category itemNo. of items
(persons)
Configuration
ratio(%)
1 I know it 48 5.1
2 I hav e heard of it 130 13.8
3 I do not know it 720 76.6
4 Other 3 0.3
No answ er 39 4.1
No. of samples 940 100.0
0 20 40 60 80
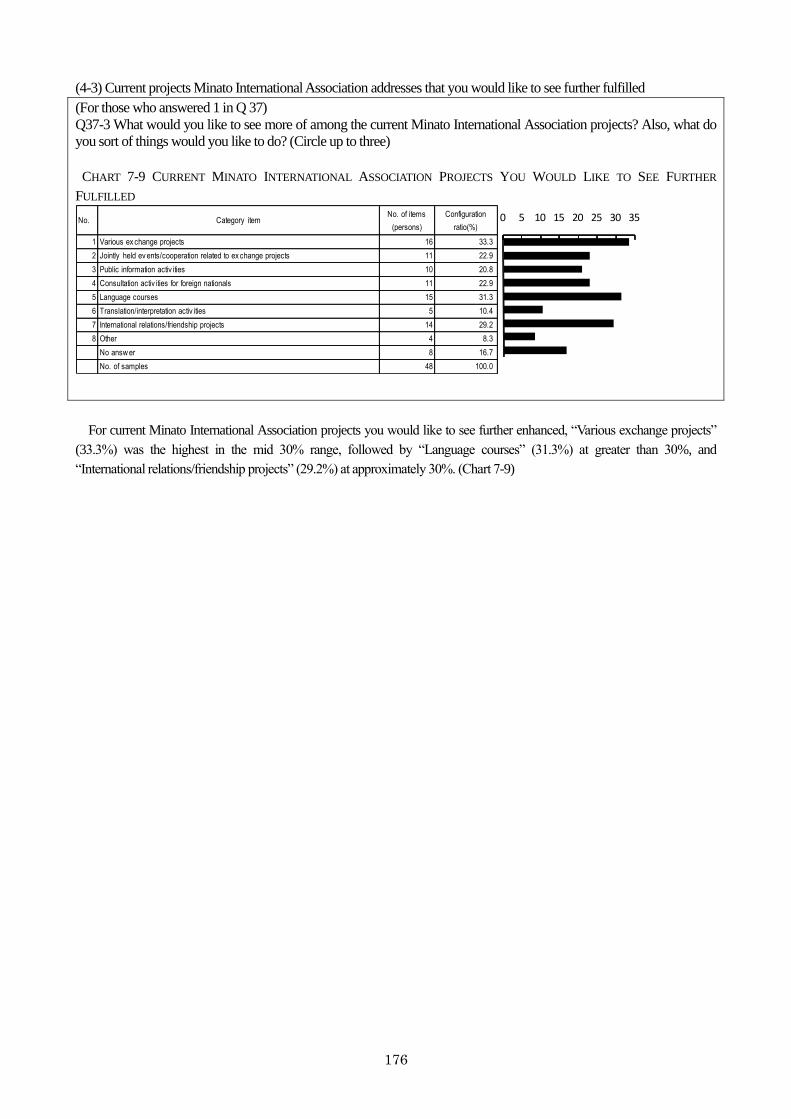
176
(4-3) Current projects Minato International Association addresses that you would like to see further fulfilled
(For those who answered 1 in Q 37) Q37-3 What would you like to see more of among the current Minato International Association projects? Also, what do
you sort of things would you like to do? (Circle up to three)
CHART 7-9 CURRENT MINATO INTERNATIONAL ASSOCIATION PROJECTS YOU WOULD LIKE TO SEE FURTHER
FULFILLED
For current Minato International Association projects you would like to see further enhanced, “Various exchange projects”
(33.3%) was the highest in the mid 30% range, followed by “Language courses” (31.3%) at greater than 30%, and
“International relations/friendship projects” (29.2%) at approximately 30%. (Chart 7-9)
No. Category itemNo. of items
(persons)
Configuration
ratio(%)
1 Various ex change projects 16 33.3
2 Jointly held ev ents/cooperation related to ex change projects 11 22.9
3 Public information activ ities 10 20.8
4 Consultation activ ities for foreign nationals 11 22.9
5 Language courses 15 31.3
6 Translation/interpretation activ ities 5 10.4
7 International relations/friendship projects 14 29.2
8 Other 4 8.3
No answ er 8 16.7
No. of samples 48 100.0
0 5 10 15 20 25 30 35
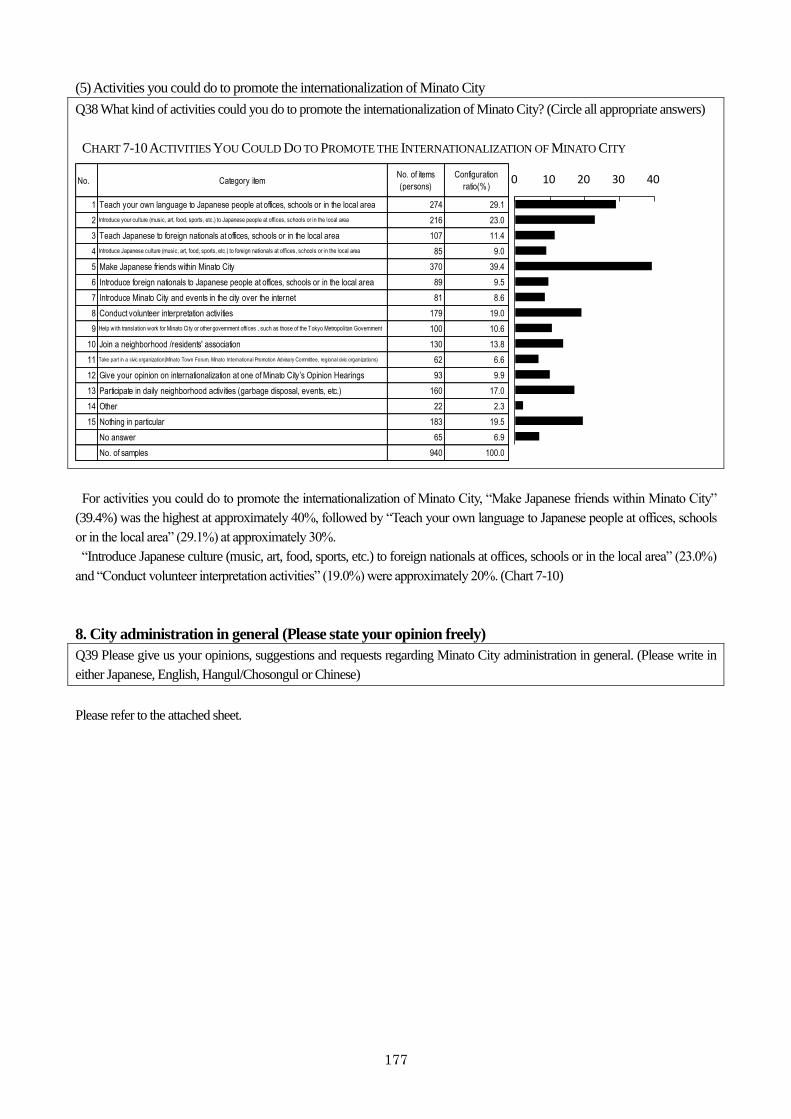
177
(5) Activities you could do to promote the internationalization of Minato City
Q38 What kind of activities could you do to promote the internationalization of Minato City? (Circle all appropriate answers)
CHART 7-10 ACTIVITIES YOU COULD DO TO PROMOTE THE INTERNATIONALIZATION OF MINATO CITY
No. Category itemNo. of items
(persons)
Configuration
ratio(%)
1 Teach your own language to Japanese people at offices, schools or in the local area 274 29.1
2 Introduce your culture (music, art, food, sports, etc.) to Japanese people at offices, schools or in the local area 216 23.0
3 Teach Japanese to foreign nationals at offices, schools or in the local area 107 11.4
4 Introduce Japanese culture (music, art, food, sports, etc.) to foreign nationals at offices, schools or in the local area 85 9.0
5 Make Japanese friends within Minato City 370 39.4
6 Introduce foreign nationals to Japanese people at offices, schools or in the local area 89 9.5
7 Introduce Minato City and events in the city over the internet 81 8.6
8 Conduct volunteer interpretation activities 179 19.0
9 Help with translation work for Minato City or other government offices , such as those of the Tokyo Metropolitan Government 100 10.6
10 Join a neighborhood /residents' association 130 13.8
11 Take part in a civic organization(Minato Town Forum, Minato International Promotion Advisory Committee, regional civic organizations) 62 6.6
12 Give your opinion on internationalization at one of Minato City’s Opinion Hearings 93 9.9
13 Participate in daily neighborhood activities (garbage disposal, events, etc.) 160 17.0
14 Other 22 2.3
15 Nothing in particular 183 19.5
No answer 65 6.9
No. of samples 940 100.0
0 10 20 30 40
For activities you could do to promote the internationalization of Minato City, “Make Japanese friends within Minato City”
(39.4%) was the highest at approximately 40%, followed by “Teach your own language to Japanese people at offices, schools
or in the local area” (29.1%) at approximately 30%.
“Introduce Japanese culture (music, art, food, sports, etc.) to foreign nationals at offices, schools or in the local area” (23.0%)
and “Conduct volunteer interpretation activities” (19.0%) were approximately 20%. (Chart 7-10)
8. City administration in general (Please state your opinion freely)
Q39 Please give us your opinions, suggestions and requests regarding Minato City administration in general. (Please write in
either Japanese, English, Hangul/Chosongul or Chinese)
Please refer to the attached sheet.

Foreign resident opinion survey
FY2013-Minato City
[Issued by] Internationalization and Cultural Art Charge, Industry and
Community Promotion Support Department, Minato City
〒105-8511 1-5-25 Shibakoen, Minato-ku
☎ 03(3578)2111
Publication Issue No. 25136-3215
Minato City strives for the reduction of garbage and protection of
the environment. This stamp indicates that recycled paper is used.