Embed Size (px)
Citation preview

®
ForeRunner ATM Switch ModulesManagement Module Guide
ForeRunner ATM Switch ModulesManagement Module Guide
Summary of Changes
Version Date Reason/Rational Nature of Changes
9031342 E5i
Notice
Cabletron Systems reserves the right to make changes in specifications and other information contained in this document without prior notice. The reader should in all cases consult Cabletron Systems to determine whether any such changes have been made.
The hardware, firmware, or software described in this manual is subject to change without notice.
IN NO EVENT SHALL CABLETRON SYSTEMS BE LIABLE FOR ANY INCIDENTAL, INDIRECT, SPECIAL, OR CONSEQUENTIAL DAMAGES WHATSOEVER (INCLUDING BUT NOT LIMITED TO LOST PROFITS) ARISING OUT OF OR RELATED TO THIS MANUAL OR THE INFORMATION CONTAINED IN IT, EVEN IF CABLETRON SYSTEMS HAS BEEN ADVISED OF, KNOWN, OR SHOULD HAVE KNOWN, THE POSSIBILITY OF SUCH DAMAGES.
Cabletron Systems makes no representations or warranties to the effect that the Licensed Software is virus-free.
Copyright © February 1998, by Cabletron Systems, Inc. All rights reserved.
Printed in the United States of America.
Order Number: 9031342 E5
Cabletron Systems, Inc.P.O. Box 5005Rochester, NH 03866-5005
SPECTRUM
, the
SPECTRUM
IMT/VNM
logo,
DCM
,
IMT
, and
VNM
are registered trademarks, and
SpectroGRAPH
,
SpectroSERVER
,
Inductive Modeling Technology
,
Device Communications Manager
, and
Virtual Network Machine
are trademarks of Cabletron Systems, Inc.
ForeRunner
and
ForeView
are trademarks of FORE Systems, Inc.
C++
is a trademark of American Telephone and Telegraph, Inc.
UNIX
is a trademark of The Open Group.
OSF/Motif
and
Motif
are trademarks of the Open Software Foundation, Inc.
X Window System
is a trademark of The Open Group.
Ethernet
is a trademark of Xerox Corporation.

ForeRunner ATM Switch Modulesii Management Module Guide
Virus Disclaimer
Cabletron has tested its software with current virus checking technologies. However, because no anti-virus system is 100% reliable, we strongly caution you to write protect and then verify that the Licensed Software, prior to installing it, is virus-free with an anti-virus system in which you have confidence.
Restricted Rights Notice
(Applicable to licenses to the United States Government only.)
1. Use, duplication, or disclosure by the Government is subject to restrictions as set forth in subparagraph (c) (1) (ii) of the Rights in Technical Data and Computer Software clause at DFARS 252.227-7013.
Cabletron Systems, Inc., 35 Industrial Way, Rochester, New Hampshire 03866-5005.
2. (a) This computer software is submitted with restricted rights. It may not be used, reproduced, or disclosed by the Government except as provided in paragraph (b) of this Notice or as otherwise expressly stated in the contract.
(b) This computer software may be:
(1) Used or copied for use in or with the computer or computers for which it was acquired, including use at any Government installation to which such computer or computers may be transferred;
(2) Used or copied for use in a backup computer if any computer for which it was acquired is inoperative;
(3) Reproduced for safekeeping (archives) or backup purposes;
(4) Modified, adapted, or combined with other computer software, provided that the modified, combined, or adapted portions of the derivative software incorporating restricted computer software are made subject to the same restricted rights;
(5) Disclosed to and reproduced for use by support service contractors in accordance with subparagraphs (b) (1) through (4) of this clause, provided the Government makes such disclosure or reproduction subject to these restricted rights; and
(6) Used or copied for use in or transferred to a replacement computer.
(c) Notwithstanding the foregoing, if this computer software is published copyrighted computer software, it is licensed to the Government, without disclosure prohibitions, with the minimum rights set forth in paragraph (b) of this clause.
(d) Any other rights or limitations regarding the use, duplication, or disclosure of this computer software are to be expressly stated in, or incorporated in, the contract.
(e) This Notice shall be marked on any reproduction of this computer software, in whole or in part.
9031342 E5iii
Contents
Preface
What Is in This Guide .......................................................................................................... xiConventions ......................................................................................................................... xiiTerminology ......................................................................................................................... xiiRelated SPECTRUM Documentation................................................................................ xiiiOther Related Documentation ........................................................................................... xiii
Chapter 1 Introduction
What Is in This Chapter..................................................................................................... 1-1The Devices ......................................................................................................................... 1-1ATM/ForeRunner Overview ............................................................................................... 1-2SPECTRUM Model Types and Icons ................................................................................. 1-4
ForeRunner................................................................................................................... 1-4ForeSwitchApp ............................................................................................................. 1-5ATM_Network .............................................................................................................. 1-5ForeUserApp................................................................................................................. 1-6SW_Link ....................................................................................................................... 1-6Workstation .................................................................................................................. 1-7
SPECTRUM Support.......................................................................................................... 1-7Accessing SPECTRUM Views ..................................................................................... 1-7
SPECTRUM Views Roadmap ............................................................................................ 1-9
Chapter 2 Device Views
What Is in This Chapter..................................................................................................... 2-1ForeRunner Interface Device View.................................................................................... 2-2
ForeRunner Interface Icons......................................................................................... 2-3ForeRunner Interface Icon Labels............................................................................... 2-4
Interface Label....................................................................................................... 2-4Administrative Status Label................................................................................. 2-4Interface Type Label.............................................................................................. 2-4MAC Address Label ............................................................................................... 2-4Address Label ........................................................................................................ 2-4Gauge Label ........................................................................................................... 2-5
ForeRunner Interface Icon Subviews.......................................................................... 2-5Interface Detail View............................................................................................. 2-5Interface Status View ............................................................................................ 2-6Fore Switch Interface Configuration View ........................................................... 2-7Interface Address Translation Table View ........................................................... 2-7Secondary Address View ....................................................................................... 2-8
ForeRunner ATM Switch Modulesiv Management Module Guide
Chapter 2 Device Views (continued)
Interface Threshold View.......................................................................................2-8Performance View ..................................................................................................2-8
ForeRunner Interface Options Panel.........................................................................2-10ForeRunner Gauge Control Panel .......................................................................2-10
ForeSwitchApp Interface Device View.............................................................................2-14ForeSwitchApp Interface Icons..................................................................................2-15ForeSwitchApp Interface Icon Labels........................................................................2-16
Interface Label .....................................................................................................2-16Administrative Status Label ...............................................................................2-16Interface Type Label ............................................................................................2-16Inbound Gauge Label...........................................................................................2-16Outbound Gauge Label ........................................................................................2-16
ForeSwitchApp Interface Icon Subviews...................................................................2-17Port Performance View ........................................................................................2-17Port Detail View ...................................................................................................2-18
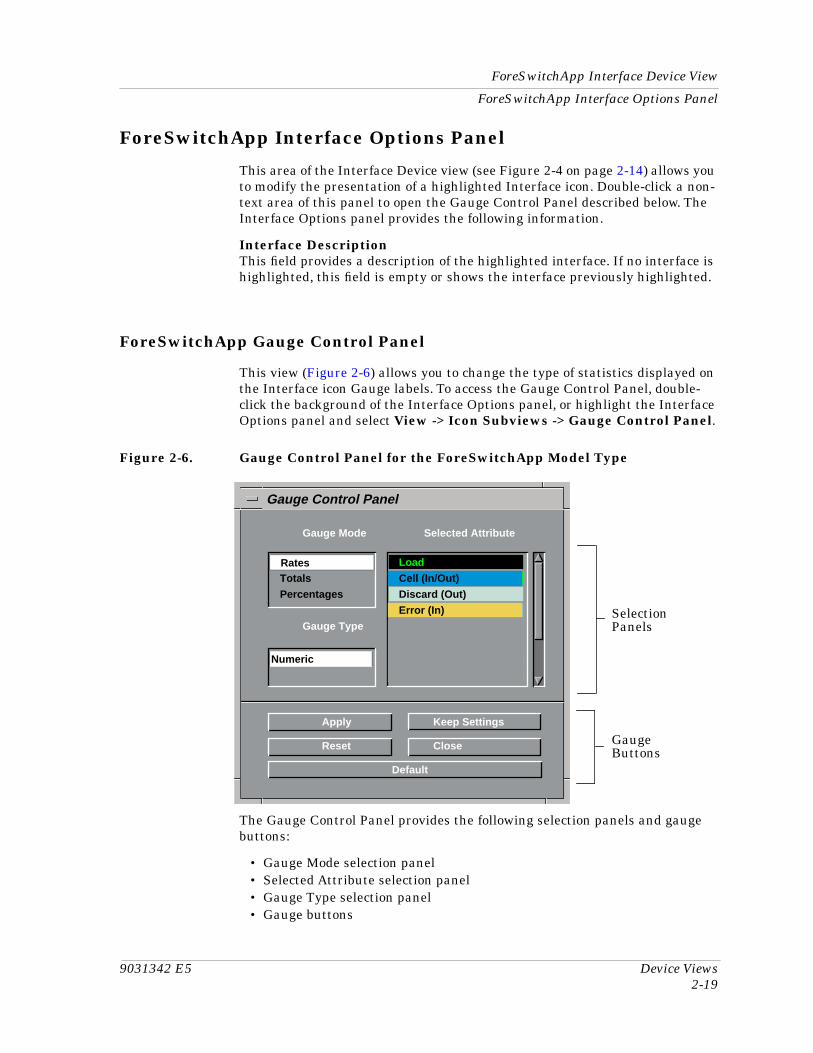
ForeSwitchApp Interface Options Panel ...................................................................2-19ForeSwitchApp Gauge Control Panel..................................................................2-19
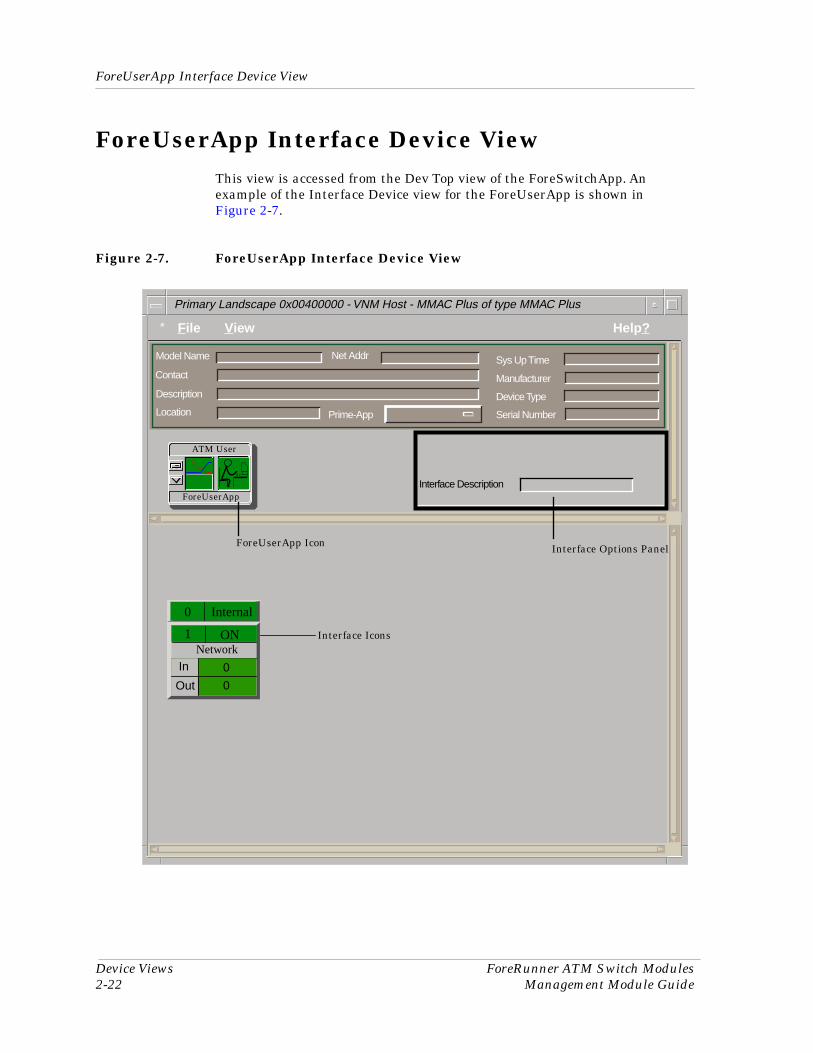
ForeUserApp Interface Device View ................................................................................2-22ForeUserApp Interface Icons .....................................................................................2-23ForeUserApp Interface Icon Labels ...........................................................................2-24
Ethernet Interface Label .....................................................................................2-24Ethernet Network Information Label .................................................................2-24ATM Interface Label ............................................................................................2-24ATM Administrative Status Label ......................................................................2-24ATM Interface Type Label ...................................................................................2-24Inbound Gauge Label...........................................................................................2-24Outbound Gauge Label ........................................................................................2-25
ForeUserApp Interface Icons Subviews ....................................................................2-25Port Performance View ........................................................................................2-25
Port Detail View.............................................................................................2-26ForeUserApp Interface Options Panel.......................................................................2-28
ForeUserApp Gauge Control Panel .....................................................................2-28SW_Link Interface Device View.......................................................................................2-29
Chapter 3 Configuration Views
What Is in This Chapter .....................................................................................................3-1Fore ATM Switch Configuration View ...............................................................................3-2
Buffer Table...................................................................................................................3-3Board Table ...................................................................................................................3-4Module Table.................................................................................................................3-4Interface Table ..............................................................................................................3-4
Fore ATM Switch Application Configuration View ...........................................................3-5Port Table ......................................................................................................................3-6
Fore User Application Configuration View ........................................................................3-7ForeSwitchApp Port Configuration View...........................................................................3-8ForeUserApp Configuration View ......................................................................................3-9Fore ATM SONET Application Configuration View........................................................3-10
9031342 E5v
Chapter 4 Event and Alarm Messages
What Is in This Chapter..................................................................................................... 4-1Device Events and Alarms ................................................................................................. 4-1
Chapter 5 Application Views
What Is in This Chapter..................................................................................................... 5-1Common Applications Not Covered Here.......................................................................... 5-2The Application Views ........................................................................................................ 5-2Routing (GenRtrApp) Application ..................................................................................... 5-5
Protocol Comparison View........................................................................................... 5-5IP Routing (IP2RtrApp) Application ................................................................................. 5-6
Detail View ................................................................................................................... 5-6IP Configuration View.................................................................................................. 5-7IP Routing View ........................................................................................................... 5-8IP Address Table View ................................................................................................. 5-9IP Fragmentation View................................................................................................ 5-9IP Reassembly View................................................................................................... 5-10
Switching (ForeSwitchApp) Application.......................................................................... 5-11Path Tables ................................................................................................................. 5-12
Originating Path Table........................................................................................ 5-12Terminating Path Table....................................................................................... 5-13Through Path Table ............................................................................................. 5-14
Channels Tables ......................................................................................................... 5-15Input Channels Table .......................................................................................... 5-15Output Channels Table ....................................................................................... 5-16
Topology Tables .......................................................................................................... 5-16Links Table........................................................................................................... 5-17Switch Cluster Table ........................................................................................... 5-17Switch Board Links/Topology Table.................................................................... 5-18NSAP Network Prefix Table................................................................................ 5-18NSAP Admin Table .............................................................................................. 5-18NSAP Topology Table .......................................................................................... 5-19
Signaling Tables ......................................................................................................... 5-20SPANS Path Table ............................................................................................... 5-20SPANS Status Table ............................................................................................ 5-21SPANS Smart PVCs Source Table ...................................................................... 5-22SPANS Smart PVCs Destination Table.............................................................. 5-23Q2931 Admin Table ............................................................................................. 5-23Q2931 Statistics Table......................................................................................... 5-25
SONET (Fore_SONET_App) Application ........................................................................ 5-26ForeUserAgent (ForeUserAgent) Application ................................................................. 5-26ATM User (ForeUserApp) Application ............................................................................ 5-26
Connection Table ........................................................................................................ 5-27
ForeRunner ATM Switch Modulesvi Management Module Guide
Chapter 6 ForeView
What Is in This Chapter .....................................................................................................6-1Physical View ......................................................................................................................6-2Network Map View..............................................................................................................6-4Virtual Path/Channel Tool View.........................................................................................6-5Channel/Path Tracer View..................................................................................................6-6
Appendix A Overview of Signaling Concepts
Appendix B Discovering Your ATM Network
What Is in This Appendix .................................................................................................. B-1Checking the Firmware Version........................................................................................ B-2
Checking Firmware of 9A000 and SFCS Devices ...................................................... B-2Checking Firmware of ASX Devices ........................................................................... B-2
Modeling a Seed Switch..................................................................................................... B-3Running AutoDiscovery ..................................................................................................... B-4
Appendix C Manual Modeling
What Is in This Appendix .................................................................................................. C-1Read Me First..................................................................................................................... C-1Modeling a Single Device and Workstation ...................................................................... C-2Modeling Multiple Devices and Workstations ................................................................ C-10
Index
9031342 E5vii
Figures
Chapter 1 Introduction
Figure 1-1. Functional Block Diagram of a Device and its Network Connections ............... 1-3Figure 1-2. ForeRunner Icons ................................................................................................. 1-4Figure 1-3. ForeSwitchApp Icons ............................................................................................ 1-5Figure 1-4. ATM_Network Icon ............................................................................................... 1-5Figure 1-5. ForeUserApp Icons ............................................................................................... 1-6Figure 1-6. SW_Link Icon ........................................................................................................ 1-6Figure 1-7. Workstation Icons ................................................................................................. 1-7Figure 1-8. Using Double-Click Zones to Access SPECTRUM Views ................................... 1-8Figure 1-9. Accessing Icon Subviews Menus from the Device Icon ....................................... 1-9Figure 1-10. Accessing Icon Subviews menus from Labels ..................................................... 1-9Figure 1-11. SPECTRUM Views Roadmap ............................................................................ 1-10
Chapter 2 Device Views
Figure 2-1. ForeRunner Interface Device View ...................................................................... 2-2Figure 2-2. Interface Icon in the ForeRunner Interface Device View ................................... 2-3Figure 2-3. Gauge Control Panel for the ForeRunner Model Type ..................................... 2-11Figure 2-4. ForeSwitchApp Interface Device View .............................................................. 2-14Figure 2-5. Interface Icon in the ForeSwitchApp Interface Device View ............................ 2-15Figure 2-6. Gauge Control Panel for the ForeSwitchApp Model Type ................................ 2-19Figure 2-7. ForeUserApp Interface Device View .................................................................. 2-22Figure 2-8. Interface Icon in the ForeUserApp Interface Device View ............................... 2-23Figure 2-9. SW_Link View ..................................................................................................... 2-30
Chapter 5 Application Views
Figure 5-1. ForeRunner Application View in the Icon Mode ................................................. 5-3Figure 5-2. Workstation Application View in the List Mode ................................................. 5-4
Chapter 6 ForeView
Figure 6-1. Physical View ........................................................................................................ 6-2Figure 6-2. Examples of Foreview Hotspots ........................................................................... 6-3Figure 6-3. Network Map View ............................................................................................... 6-4Figure 6-4. Virtual Path/Channel Tool ................................................................................... 6-5Figure 6-5. Channel/Path Tracer View ................................................................................... 6-6
ForeRunner ATM Switch Modulesviii Management Module Guide
Appendix A Overview of Signaling Concepts
Figure A-1. Virtual Channels .................................................................................................. A-2Figure A-2. Virtual Path and Virtual Channel Relationship ................................................ A-2
Appendix B Discovering Your ATM Network
Figure B-1. Firmware Version ................................................................................................. B-2Figure B-2. AutoDiscovery Dialog Box ................................................................................... B-4
Appendix C Manual Modeling
Figure C-1. Modeling a Single Device and Workstation Conceptual Overview .................... C-2Figure C-2. Creating the Universe Level Models ................................................................... C-2Figure C-3. Creating the Workstation Model ......................................................................... C-3Figure C-4. Pasting the ForeUserApp Model into the ATM_Network Model ....................... C-4Figure C-5. Pasting the ForeSwitchApp Model into the ATM_Network Model ................... C-5Figure C-6. The ForeRunner Off-Page Reference .................................................................. C-6Figure C-7. Automatically Placed Universe Level Logical Pipe Connection ........................ C-6Figure C-8. Creating the SW_Link Model .............................................................................. C-7Figure C-9. Creating, Pasting, and Resolving the Fanout Model .......................................... C-8Figure C-10. The Fanout Cablewalk View ................................................................................ C-9Figure C-11. Logical Pipe Connections in the ATM_Network Model ..................................... C-9Figure C-12. Modeling Multiple Devices and Workstations Conceptual Overview ............. C-10Figure C-13. Completed ATM_Network Model ...................................................................... C-11Figure C-14. Automatically Placed Universe Level Logical Pipe Connections .................... C-12
9031342 E5ix
Tables
Chapter 2 Device Views
Table 2-1. ForeRunner Interface Icon Subviews Menu ........................................................ 2-5Table 2-2. Packet Breakdown................................................................................................. 2-6Table 2-3. Error Breakdown ................................................................................................... 2-6Table 2-4. Discard Breakdown ............................................................................................... 2-6Table 2-5. Performance Statistic Color Definitions............................................................... 2-9Table 2-6. Totals Mode: Attributes and Corresponding Color............................................ 2-12Table 2-7. Rates Mode: Attributes and Corresponding Color............................................. 2-12Table 2-8. ForeSwitchApp Interface Icon Subviews Menu................................................. 2-17Table 2-9. Performance Statistic Color Definitions............................................................. 2-17Table 2-10. Cell Breakdown.................................................................................................... 2-18Table 2-11. Totals Mode: Attributes and Corresponding Color............................................ 2-20Table 2-12. Rates Mode: Attributes and Corresponding Color............................................. 2-20Table 2-13. ForeUserApp Interface Icon Subviews Menu .................................................... 2-25Table 2-14. Performance Statistic Color Definitions............................................................. 2-26Table 2-15. Cell Breakdown.................................................................................................... 2-26Table 2-16. ATM Layer ........................................................................................................... 2-26Table 2-17. AAL0 Cell Breakdown......................................................................................... 2-27Table 2-18. AAL4 Cell Breakdown......................................................................................... 2-27Table 2-19. AAL5 Cell Breakdown......................................................................................... 2-28
Chapter 4 Event and Alarm Messages
Table 4-1. Device Events and Alarms .................................................................................... 4-1
Chapter 5 Application Views
Table 5-1. Routing Application Icon Subviews Menu Selections.......................................... 5-5Table 5-2. IP Routing Application Icon Subviews Menu Selections.................................... 5-6Table 5-3. IP Routing Detail Packet Breakdown .................................................................. 5-6Table 5-4. IP Routing Detail Error Breakdown..................................................................... 5-7Table 5-5. IP Routing Detail Discard Breakdown................................................................. 5-7Table 5-6. IP Fragmentation Breakdown .............................................................................. 5-9Table 5-7. IP Reassembly Breakdown.................................................................................. 5-10Table 5-8. Switching Application Icon Subviews Menu Selections .................................... 5-11Table 5-9. SONET Application Icon Subviews Menu.......................................................... 5-26Table 5-10. ATM User Application Icon Subviews Menu Selections ................................... 5-26

ForeRunner ATM Switch Modulesx Management Module Guide
9031342 E5xi
Preface
Use this guide as a reference for the SPECTRUM management module referred to as “ForeRunner,” which is used to manage the Cabletron Systems, Inc., and FORE Systems, Inc., ATM switches described in Chapter 1,
Introduction
.
Before reading this guide, you should be familiar with the SPECTRUM functions described in the
Operator’s Reference
and the
Administrator’s Reference
.
What Is in This Guide
Chapter Description
Chapter 1
Introduction
Describes the devices managed by this management module, the model types created by SPECTRUM, and how to access views.
Chapter 2
Device Views
Describes the views representing the devices.
Chapter 3
Configuration Views
Describes the Configuration views and the network management information provided by them.
Chapter 4
Event and Alarm Messages
Lists and explains the common event and alarm messages generated in the Event Log or Alarm Manager for the device model types.
Chapter 5
Application Views
Describes the Application views and the application-specific information for the devices.
Chapter 6
ForeView
Summarizes a separately purchasable management module that is used to set virtual paths, virtual channels, and smart permanent virtual channels.
Appendix A
Overview of Signaling Concepts
Provides a discussion of the concepts for setting up signaling between devices and workstations.
Conventions
Preface ForeRunner ATM Switch Modulesxii Management Module Guide
Conventions
This guide uses the following conventions:
• Menu selections and buttons referenced in text appear in
bold
; for example,
Configuration
or
Detail
.
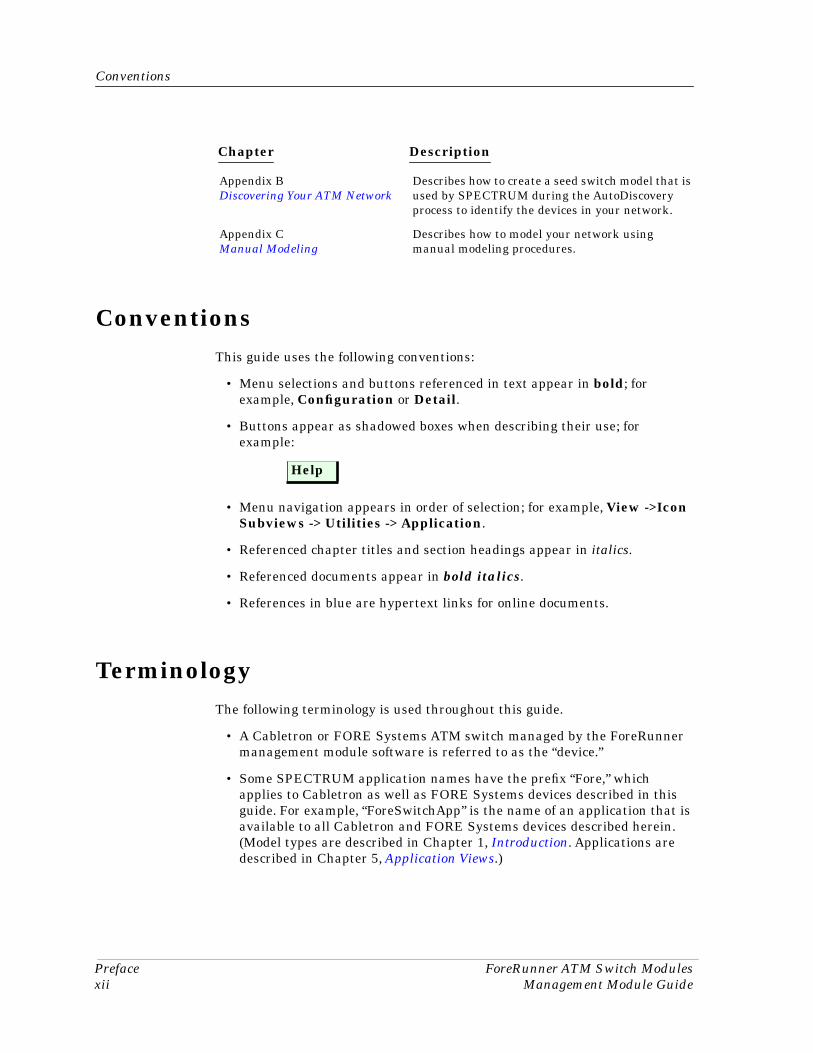
• Buttons appear as shadowed boxes when describing their use; for example:
• Menu navigation appears in order of selection; for example,
View ->Icon Subviews -> Utilities -> Application
.
• Referenced chapter titles and section headings appear in
italics
.
• Referenced documents appear in
bold italics
.
• References in blue are hypertext links for online documents.
Terminology
The following terminology is used throughout this guide.
• A Cabletron or FORE Systems ATM switch managed by the ForeRunner management module software is referred to as the “device.”
• Some SPECTRUM application names have the prefix “Fore,” which applies to Cabletron as well as FORE Systems devices described in this guide. For example, “ForeSwitchApp” is the name of an application that is available to all Cabletron and FORE Systems devices described herein. (Model types are described in Chapter 1,
Introduction
. Applications are described in Chapter 5,
Application Views
.)
Appendix B
Discovering Your ATM Network
Describes how to create a seed switch model that is used by SPECTRUM during the AutoDiscovery process to identify the devices in your network.
Appendix C
Manual Modeling
Describes how to model your network using manual modeling procedures.
Chapter Description
Help
9031342 E5 Prefacexiii
Related SPECTRUM Documentation
Related SPECTRUM Documentation
It is important when using this guide that you have a clear understanding of SPECTRUM functionality and navigation techniques as described in the following recommended documentation:
Operator’s Reference
Administrator’s Reference
Report Generator User’s Guide
Application View Reference
Getting Started with SPECTRUM 4.0 for Operators
Getting Started with SPECTRUM 4.0 for Administrators
How to Manage Your Network with SPECTRUM
SPECTRUM System AutoDiscovery User’s Guide
This guide also references the following documents:
SPECTRUM Portable Management Application Tools Guide
SPECTRUM Routing Services Management Module Guide
SPECTRUM Enterprise Alarm Manager User’s Guide
SPECTRUM ATM Switch Discovery Process
Other Related Documentation
Refer to the following documentation for more information on managing TCP/IP-based networks:
Martin, James, Kathleen Kavanagh Chapman, Joe Leben.
Local Area Networks, Architectures and Implementations
, 2nd ed. Englewood Cliffs, NJ: Prentice Hall, 1994.
Rose, Marshall T.
The Simple Book — An Introduction to Management of TCP/IP-based Internets
. Performance Systems International, Inc.
Stallings, William.
Data and Computer Communications
, 4th ed. New York: Macmillan Publishing Company, 1994.
Tanenbaum, Andrew S. Computer Networks, 3rd ed. Englewood Cliffs, NJ: Prentice Hall, 1996.

Other Related Documentation
Preface ForeRunner ATM Switch Modulesxiv Management Module Guide

9031342 E51-1
Chapter 1
Introduction
What Is in This ChapterThis chapter introduces the SPECTRUM ForeRunner management module, which supports the Cabletron Systems, Inc., and FORE Systems, Inc., ATM devices described below. This chapter also describes the SPECTRUM models and icons used to manage the devices.
This chapter covers the following topics:
• The Devices• ATM/ForeRunner Overview on page 1-2• SPECTRUM Model Types and Icons on page 1-4• SPECTRUM Support on page 1-7• SPECTRUM Views Roadmap on page 1-9
The DevicesThis management module supports the following devices:
• Cabletron’s 9A000 ATM Switch Module for the MMAC-Plus.• Cabletron’s SFCS-200BX and SFCS-1000 SecureFast Cell Switches.• FORE Systems’ ASX-100, ASX-200 series, and ASX-1000 ATM Switches.
NOTE
Modeling instructions are provided in Appendix B, Discovering Your ATM Network, and Appendix C, Manual Modeling.
ATM/ForeRunner Overview
Introduction ForeRunner ATM Switch Modules1-2 Management Module Guide
The 9A000 is a dual-slot MMAC-Plus module that provides an aggregate 2.5 Gbps of ATM switching capacity for up to 24 workstations or ATM devices. Its four network module slots can provide a range of LAN and WAN interfaces from 1.5 to 622 Mbps to accommodate ATM.
The SFCS-200BX and SFCS-1000 meet the needs of LAN backbone networks and offer a variety of connectivity options including LAN to ATM access, interswitch links, and WAN access. The SFCS-200BX is a 2.5 Gbps modular ATM switch for the wiring closet with four network module slots. The SFCS-1000 is a modular, 10 Gbps backbone ATM switch that includes two 2.5 Gbps switch modules, each containing four network module slots. It provides connectivity for up to 96 ATM servers or LAN access devices.
The ASX100, ASX200 series, and ASX1000 are stand-alone switches that provide workgroup, LAN, LAN backbone, and WAN access support. They are configurable from 2 to 96 ports, offer a switching capacity ranging from 2.5 to 10 Gbps, and support LAN and WAN interface speeds of 34 to 155 Mbps.
ATM/ForeRunner OverviewAsynchronous Transfer Mode (ATM) is based on the transmission of fixed-length (53-byte) cells of data. Contrast this with an Ethernet LAN, which transmits variable-length packets ranging in size from 64 to over 1500 bytes of data. ATM’s use of small, fixed-length data cells allows for improved traffic management and traffic shaping.
ATM is a connection-oriented network communication architecture, which generally means that it transmits data through pre-established virtual channels (circuits), similar to telephone calls. Virtual channels may be established automatically by Switched Virtual Circuit (SVC) signaling or they may be set up manually by the network administrator to form Permanent Virtual Circuits (PVCs).
Each ATM cell contains a five-byte header and 48 bytes of payload. The header includes a Virtual Path Identifier (VPI) and a Virtual Channel Identifier (VCI). These identifiers are used by ATM switches to determine the correct channels to transmit particular cells. Transmission is controlled by statistical multiplexing, which awards bandwidth (channels) to devices ready to send data on a first come, first served basis. (For more information on virtual paths and virtual channels, see Appendix A, Overview of Signaling Concepts.)
The combination of small, fixed-length data cells and the efficient use of bandwidth (among other things) allow ATM switches to communicate time-critical video and audio data along with other computer data across the ATM network. In an end-to-end transmission across a mixed LAN/ATM/LAN network, packets transmitted by a LAN workstation to an ATM switch are segmented into cells for high speed transmission through ATM channels. At the receiving end, cells are reassembled into packets for use by another LAN workstation.
9031342 E5 Introduction1-3
ATM/ForeRunner Overview
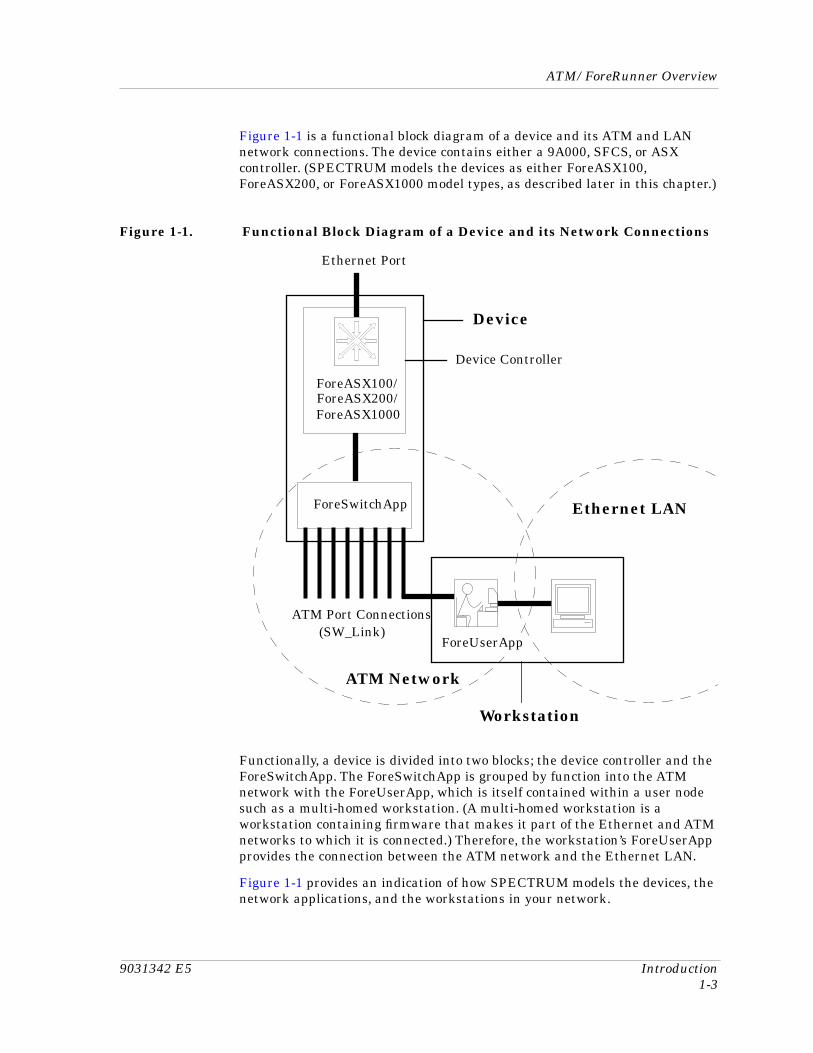
Figure 1-1 is a functional block diagram of a device and its ATM and LAN network connections. The device contains either a 9A000, SFCS, or ASX controller. (SPECTRUM models the devices as either ForeASX100, ForeASX200, or ForeASX1000 model types, as described later in this chapter.)
Figure 1-1. Functional Block Diagram of a Device and its Network Connections
Functionally, a device is divided into two blocks; the device controller and the ForeSwitchApp. The ForeSwitchApp is grouped by function into the ATM network with the ForeUserApp, which is itself contained within a user node such as a multi-homed workstation. (A multi-homed workstation is a workstation containing firmware that makes it part of the Ethernet and ATM networks to which it is connected.) Therefore, the workstation’s ForeUserApp provides the connection between the ATM network and the Ethernet LAN.
Figure 1-1 provides an indication of how SPECTRUM models the devices, the network applications, and the workstations in your network.
Ethernet Port
ForeASX200/
ATM Network
ForeSwitchApp
Workstation
Ethernet LAN
Device
ATM Port Connections(SW_Link)
ForeUserApp
ForeASX1000
ForeASX100/
Device Controller
SPECTRUM Model Types and Icons
Introduction ForeRunner ATM Switch Modules1-4 Management Module Guide
SPECTRUM Model Types and IconsSPECTRUM uses the model types and icons described in this section to represent a device and its components. The model types are as follows:
• ForeRunner (uses 9A000, ForeASX200, etc., as described below)• ForeSwitchApp• ATM_Network• ForeUserApp• SW_Link
The workstation is modeled as a generic SNMP device (GnSNMPDev). ForeSwitchApp and ForeUserApp are located in the ATM_Network’s Device Topology view. (Refer to the Operator’s Reference for a description of the Device Topology view.)
ForeRunner
The model types representing the devices use names that approximate the device names. For example, ForeASX1000 is the model type name for the FORE Systems ASX1000 ATM switch; 9A000 is the model type name for the Cabletron 9A000 ATM Switch Module for the MMAC-Plus.
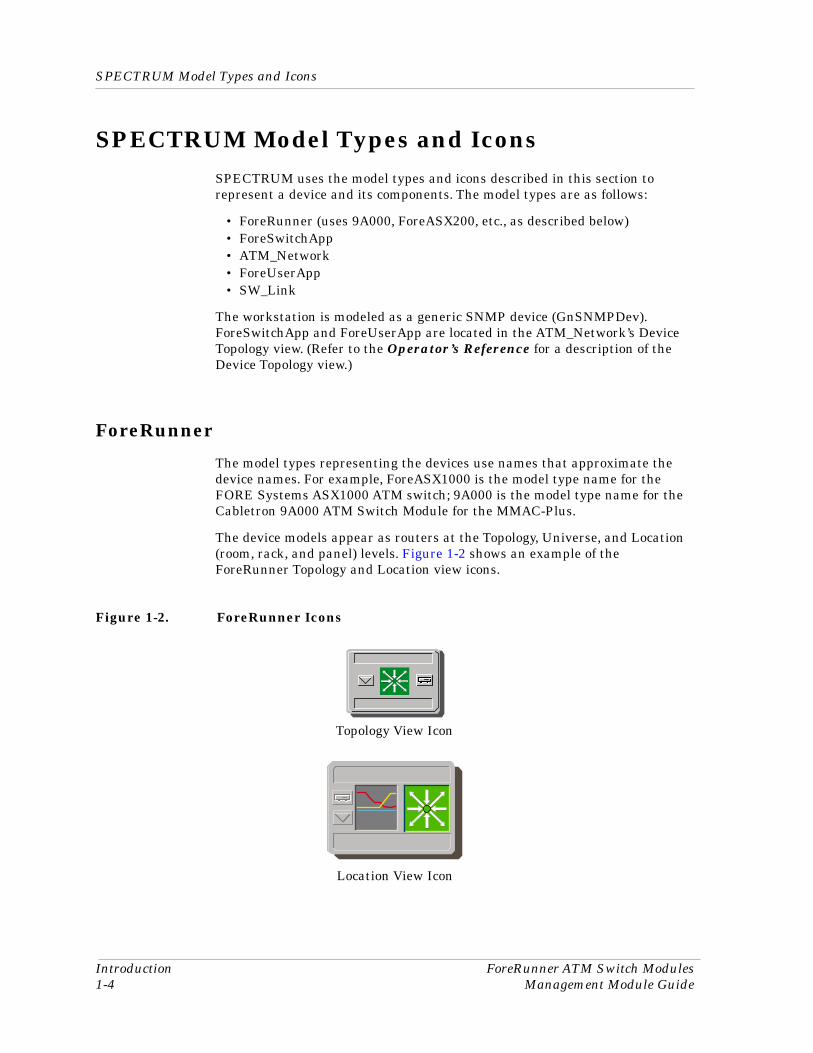
The device models appear as routers at the Topology, Universe, and Location (room, rack, and panel) levels. Figure 1-2 shows an example of the ForeRunner Topology and Location view icons.
Figure 1-2. ForeRunner Icons
Topology View Icon
Location View Icon
9031342 E5 Introduction1-5
SPECTRUM Model Types and Icons
ForeSwitchApp
ForeSwitchApp
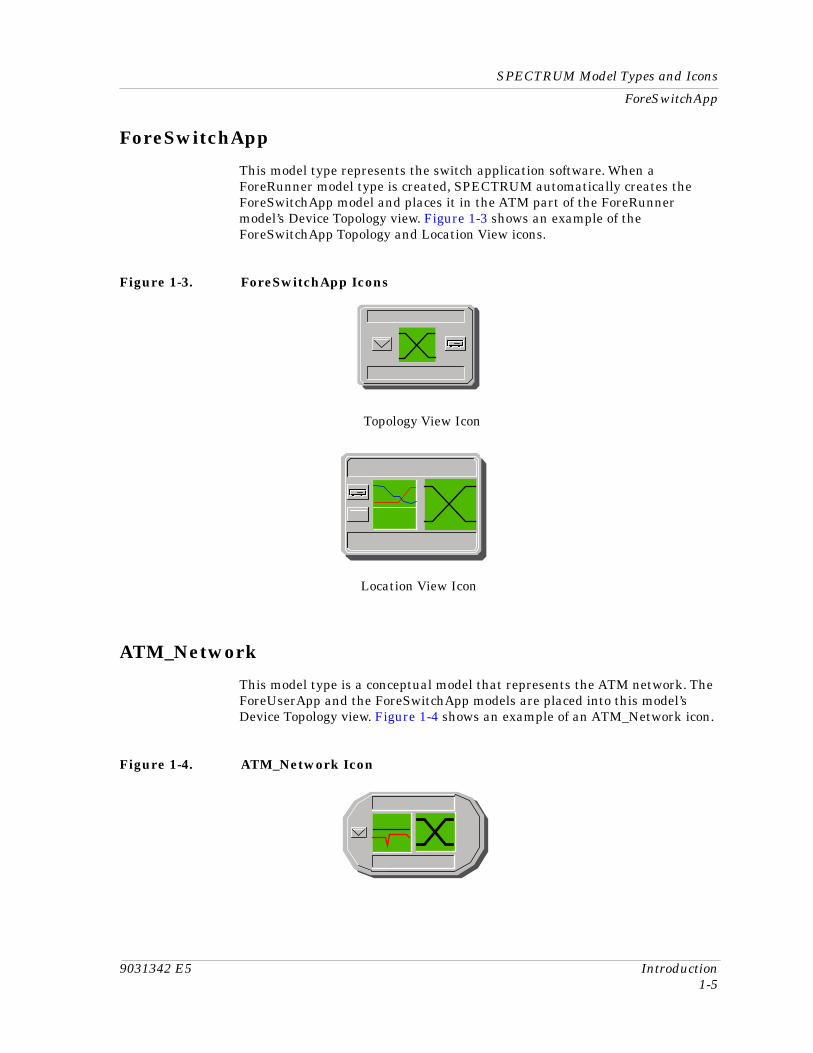
This model type represents the switch application software. When a ForeRunner model type is created, SPECTRUM automatically creates the ForeSwitchApp model and places it in the ATM part of the ForeRunner model’s Device Topology view. Figure 1-3 shows an example of the ForeSwitchApp Topology and Location View icons.
Figure 1-3. ForeSwitchApp Icons
ATM_Network
This model type is a conceptual model that represents the ATM network. The ForeUserApp and the ForeSwitchApp models are placed into this model’s Device Topology view. Figure 1-4 shows an example of an ATM_Network icon.
Figure 1-4. ATM_Network Icon
Topology View Icon
Location View Icon
SPECTRUM Model Types and IconsForeUserApp
Introduction ForeRunner ATM Switch Modules1-6 Management Module Guide
ForeUserApp
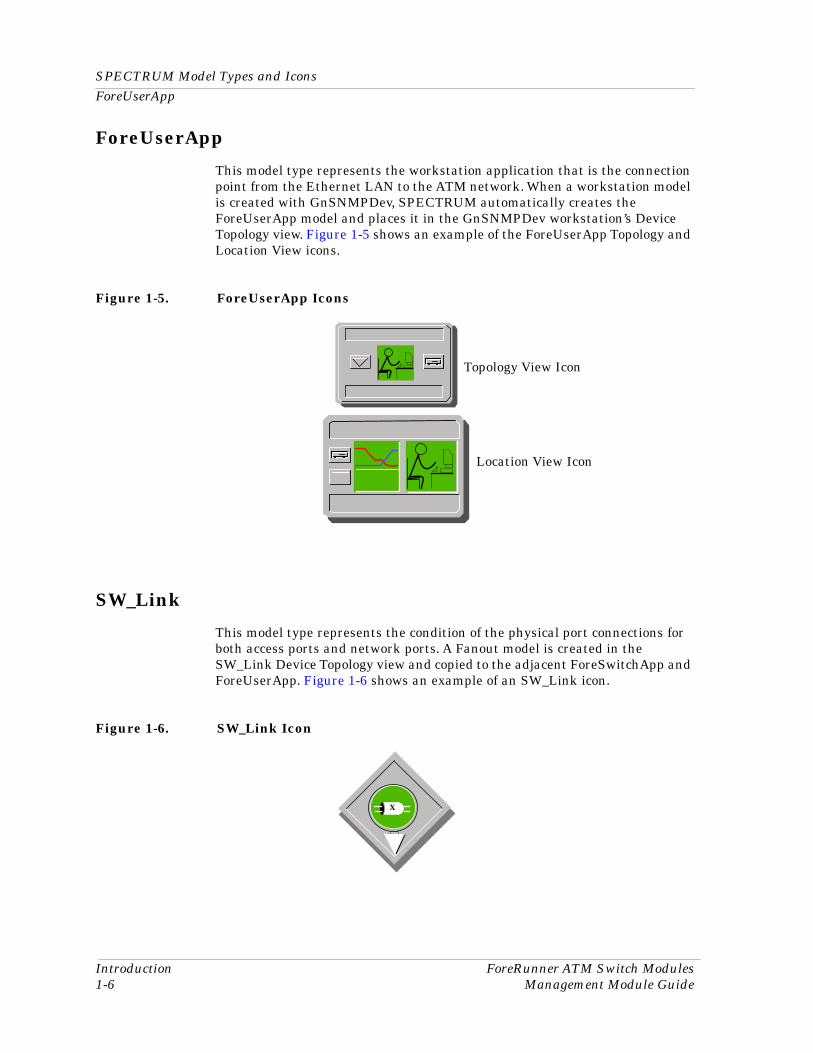
This model type represents the workstation application that is the connection point from the Ethernet LAN to the ATM network. When a workstation model is created with GnSNMPDev, SPECTRUM automatically creates the ForeUserApp model and places it in the GnSNMPDev workstation’s Device Topology view. Figure 1-5 shows an example of the ForeUserApp Topology and Location View icons.
Figure 1-5. ForeUserApp Icons
SW_Link
This model type represents the condition of the physical port connections for both access ports and network ports. A Fanout model is created in the SW_Link Device Topology view and copied to the adjacent ForeSwitchApp and ForeUserApp. Figure 1-6 shows an example of an SW_Link icon.
Figure 1-6. SW_Link Icon
Topology View Icon
Location View Icon
X
9031342 E5 Introduction1-7
SPECTRUM Support
Workstation
Workstation
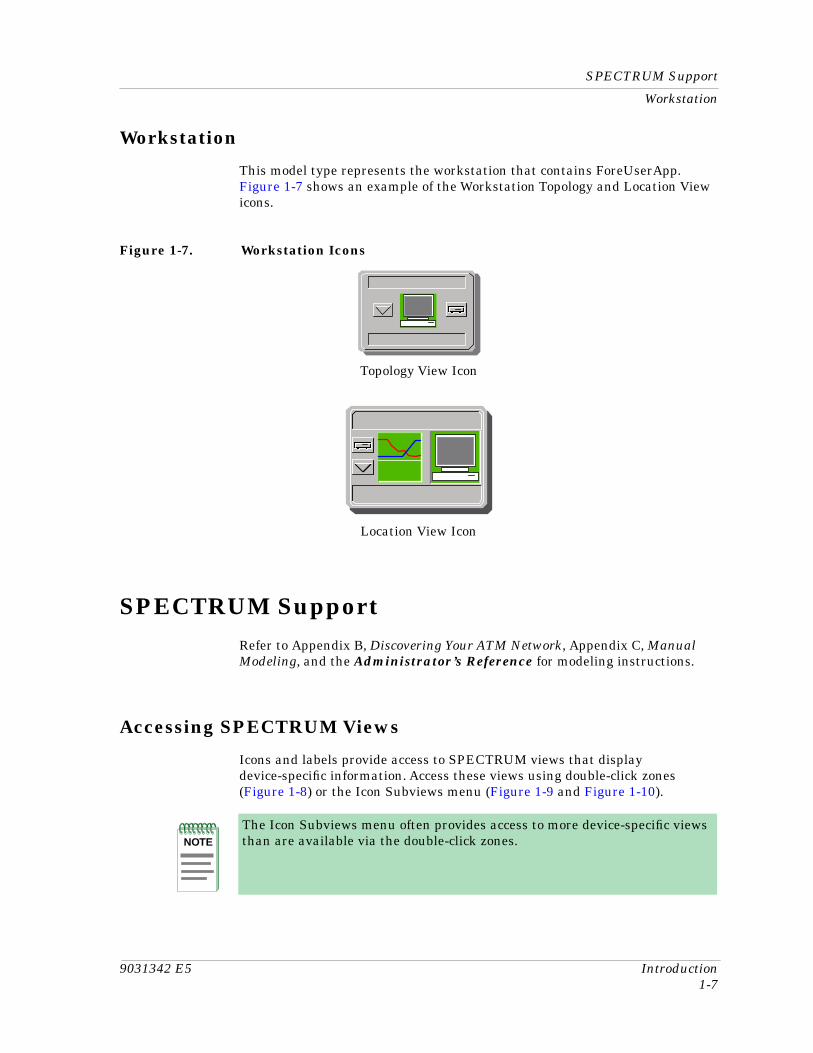
This model type represents the workstation that contains ForeUserApp. Figure 1-7 shows an example of the Workstation Topology and Location View icons.
Figure 1-7. Workstation Icons
SPECTRUM SupportRefer to Appendix B, Discovering Your ATM Network, Appendix C, Manual Modeling, and the Administrator’s Reference for modeling instructions.
Accessing SPECTRUM Views
Icons and labels provide access to SPECTRUM views that display device-specific information. Access these views using double-click zones (Figure 1-8) or the Icon Subviews menu (Figure 1-9 and Figure 1-10).
Topology View Icon
Location View Icon
NOTE
The Icon Subviews menu often provides access to more device-specific views than are available via the double-click zones.
SPECTRUM SupportAccessing SPECTRUM Views
Introduction ForeRunner ATM Switch Modules1-8 Management Module Guide
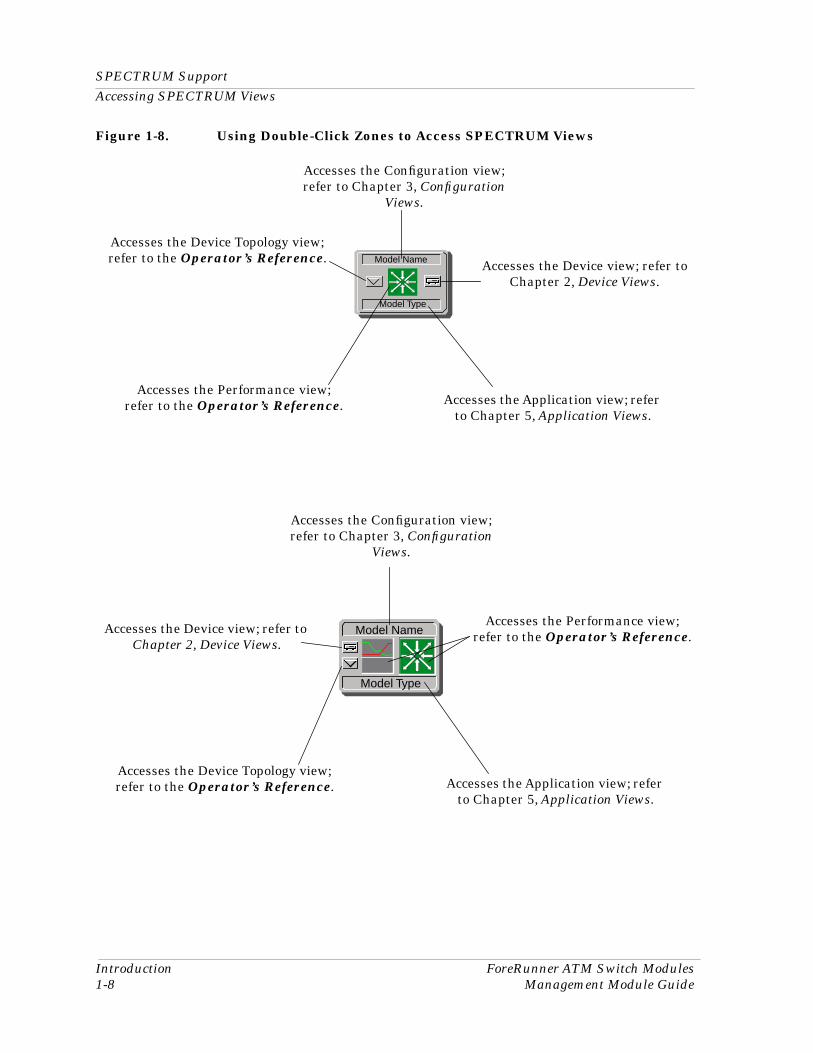
Figure 1-8. Using Double-Click Zones to Access SPECTRUM Views
Accesses the Device Topology view; refer to the Operator’s Reference.
Accesses the Device view; refer to Chapter 2, Device Views.
Accesses the Device Topology view; refer to the Operator’s Reference.
Accesses the Configuration view; refer to Chapter 3, Configuration
Views.
Accesses the Performance view; refer to the Operator’s Reference.
Accesses the Application view; refer to Chapter 5, Application Views.
Accesses the Configuration view; refer to Chapter 3, Configuration
Views.
Accesses the Device view; refer to Chapter 2, Device Views.
Accesses the Application view; refer to Chapter 5, Application Views.
Accesses the Performance view; refer to the Operator’s Reference.
Model Type
Model Name
Model Name
Model Type
9031342 E5 Introduction1-9
SPECTRUM Views Roadmap
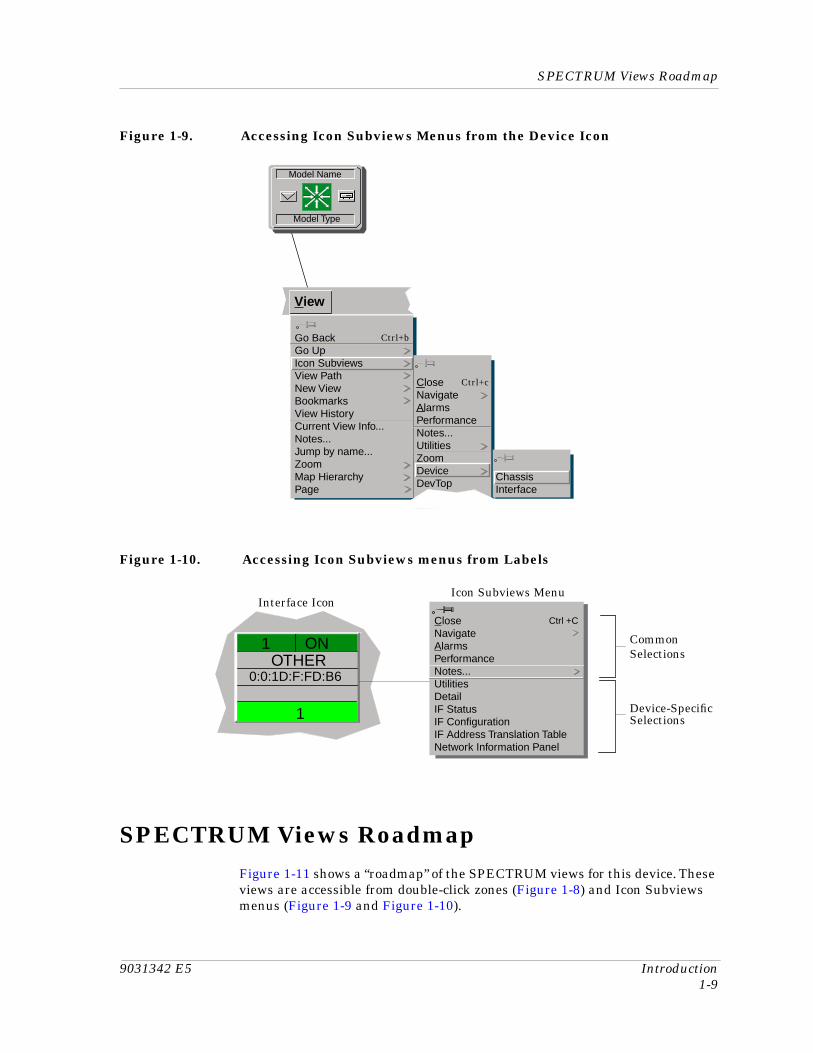
Figure 1-9. Accessing Icon Subviews Menus from the Device Icon
Figure 1-10. Accessing Icon Subviews menus from Labels
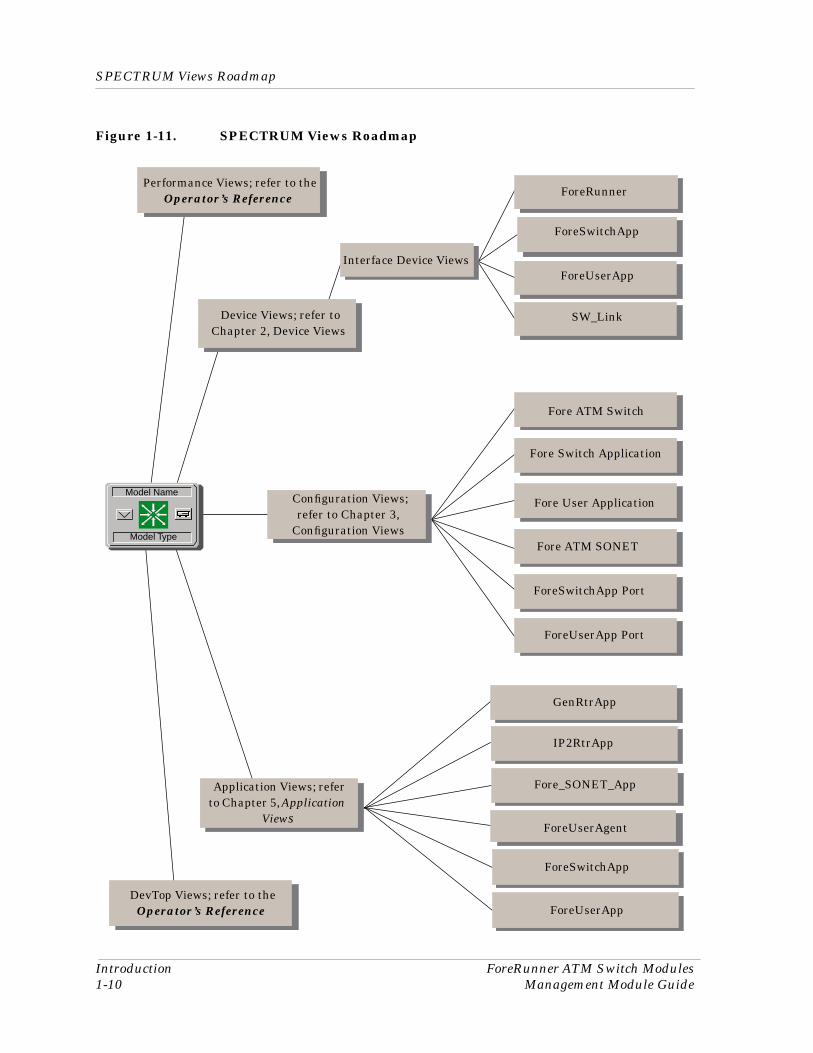
SPECTRUM Views RoadmapFigure 1-11 shows a “roadmap” of the SPECTRUM views for this device. These views are accessible from double-click zones (Figure 1-8) and Icon Subviews menus (Figure 1-9 and Figure 1-10).
Go BackGo UpIcon SubviewsView PathNew ViewBookmarksView HistoryCurrent View Info...Notes...Jump by name...ZoomMap HierarchyPage
CloseNavigateAlarmsPerformanceNotes...UtilitiesZoomDeviceDevTop
ChassisInterface
View
Ctrl+b
Ctrl+c
Model Name
Model Type
Close NavigateAlarmsPerformanceNotes...UtilitiesDetailIF StatusIF ConfigurationIF Address Translation TableNetwork Information Panel
Device-Specific
Common Selections
Ctrl +C
1 ONOTHER
0:0:1D:F:FD:B6
1 Selections
Interface IconIcon Subviews Menu
SPECTRUM Views Roadmap
Introduction ForeRunner ATM Switch Modules1-10 Management Module Guide
Figure 1-11. SPECTRUM Views Roadmap
Performance Views; refer to the Operator’s Reference
DevTop Views; refer to the Operator’s Reference
Device Views; refer to Chapter 2, Device Views
ForeRunner
Fore Switch Application
Fore User Application
ForeSwitchApp
ForeUserAgent
Fore_SONET_App
Configuration Views; refer to Chapter 3,
Configuration Views
Application Views; refer to Chapter 5, Application
Views
Interface Device ViewsForeUserApp
ForeSwitchApp
GenRtrApp
Fore ATM Switch
Fore ATM SONET
SW_Link
IP2RtrApp
ForeUserApp
ForeSwitchApp Port
ForeUserApp Port
Model Name
Model Type
9031342 E52-1
Chapter 2
Device Views
What Is in This ChapterThis chapter describes the Interface Device views and subviews available for the devices. SPECTRUM provides an Interface Device view for each of the following model types:
• ForeRunner (9A000, ForeASX200, etc.) on page 2-2• ForeSwitchApp on page 2-14• ForeUserApp on page 2-22• SW_Link on page 2-29
This chapter describes the Interface icons and Interface Options panel contained in the Interface Device view of each model type.
The procedures for accessing the Interface Device views are the same for all model types. Use one of the following procedures:
• Double-click the Device view access button on the model type icon.
• Highlight the model type icon and select View -> Icon Subviews -> Device.
• Click and hold the model type icon using the appropriate mouse button (right or middle) to bring up the Pop-up Navigator menu and then select Device.
In general, the Interface Device view provides dynamic configuration and performance information for each interface. The view represents both physical and conceptual devices. If the configuration changes, SPECTRUM modifies the Interface Device view after the next polling cycle to reflect the new configuration. The Interface Device view also provides a model type icon that allows you to monitor the device operation and to access other device-specific views.
ForeRunner Interface Device View
Device Views ForeRunner ATM Switch Modules2-2 Management Module Guide
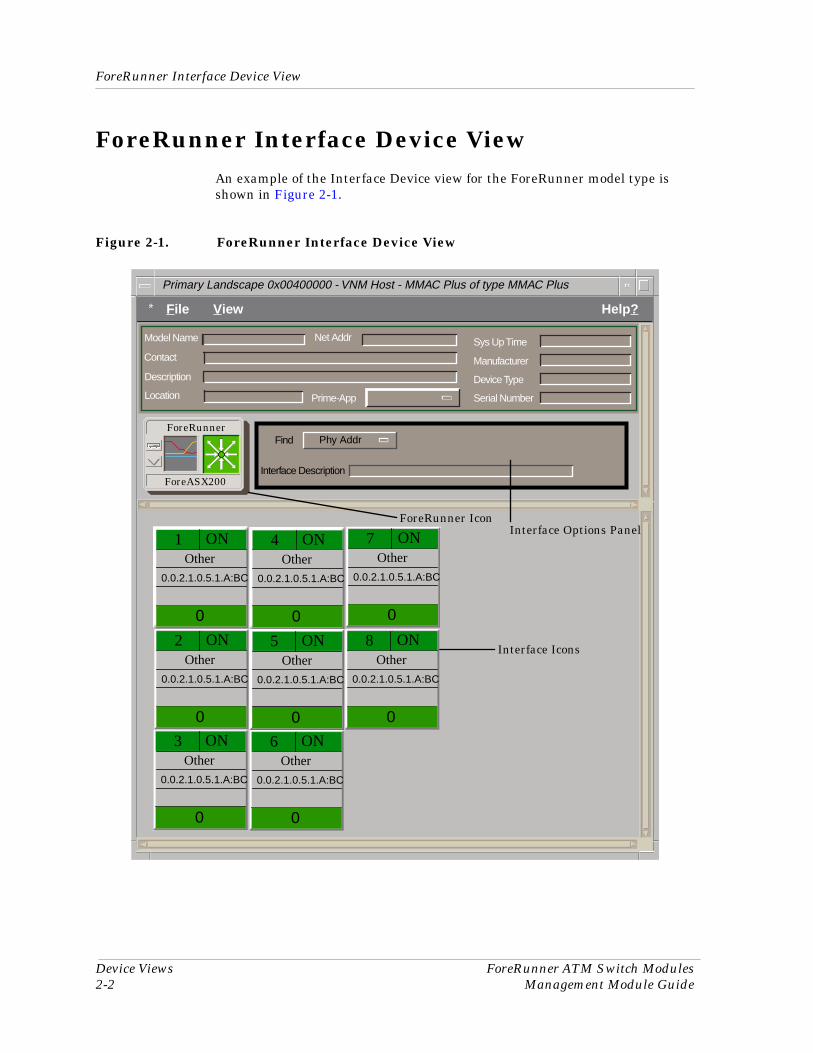
ForeRunner Interface Device ViewAn example of the Interface Device view for the ForeRunner model type is shown in Figure 2-1.
Figure 2-1. ForeRunner Interface Device View
* File View Help?
Primary Landscape 0x00400000 - VNM Host - MMAC Plus of type MMAC Plus
Model Name
Contact
Description
Location
Net Addr
Prime-App
Sys Up Time
Manufacturer
Device Type
Serial Number
Find
Interface Description
Phy Addr
1 ONOther
0.0.2.1.0.5.1.A:BC
0
4 ONOther
0.0.2.1.0.5.1.A:BC
0
2 ONOther
0.0.2.1.0.5.1.A:BC
0
5 ONOther
0.0.2.1.0.5.1.A:BC
0
3 ONOther
0.0.2.1.0.5.1.A:BC
0
Interface Options Panel
Interface Icons
ForeRunner Icon
ForeRunner
ForeASX200
6 ONOther
0.0.2.1.0.5.1.A:BC
0
7 ONOther
0.0.2.1.0.5.1.A:BC
0
8 ONOther
0.0.2.1.0.5.1.A:BC
0
9031342 E5 Device Views2-3
ForeRunner Interface Device View
ForeRunner Interface Icons
ForeRunner Interface Icons
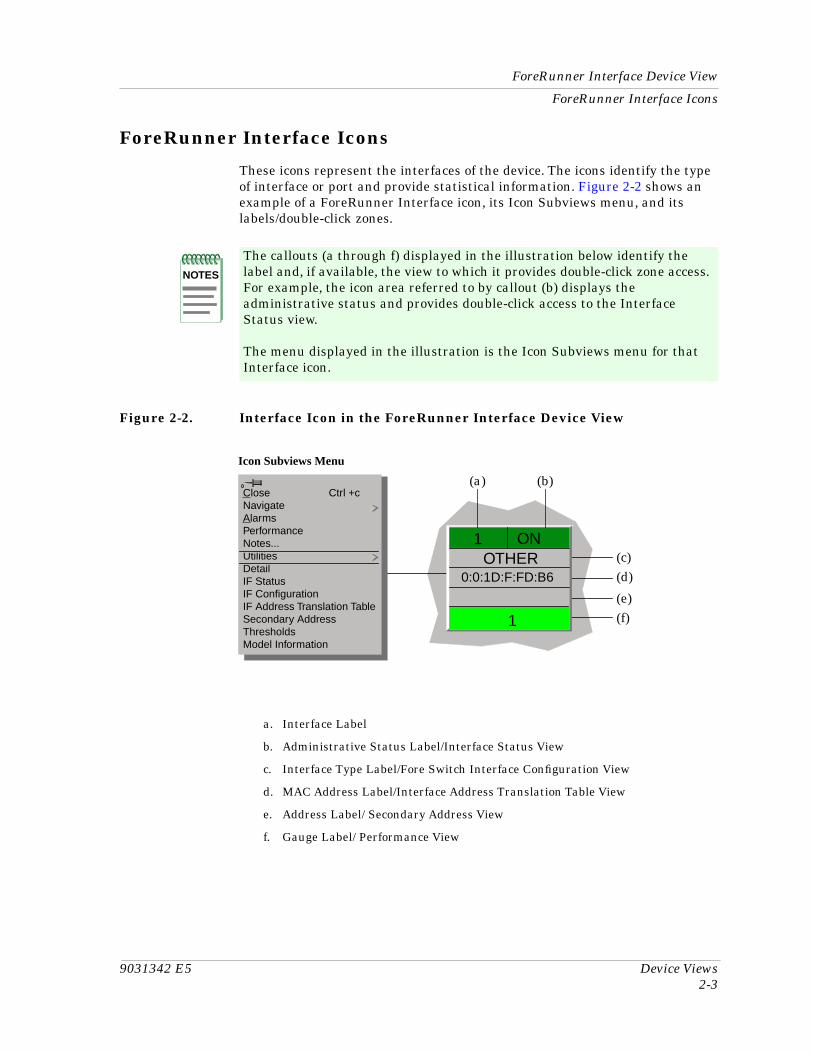
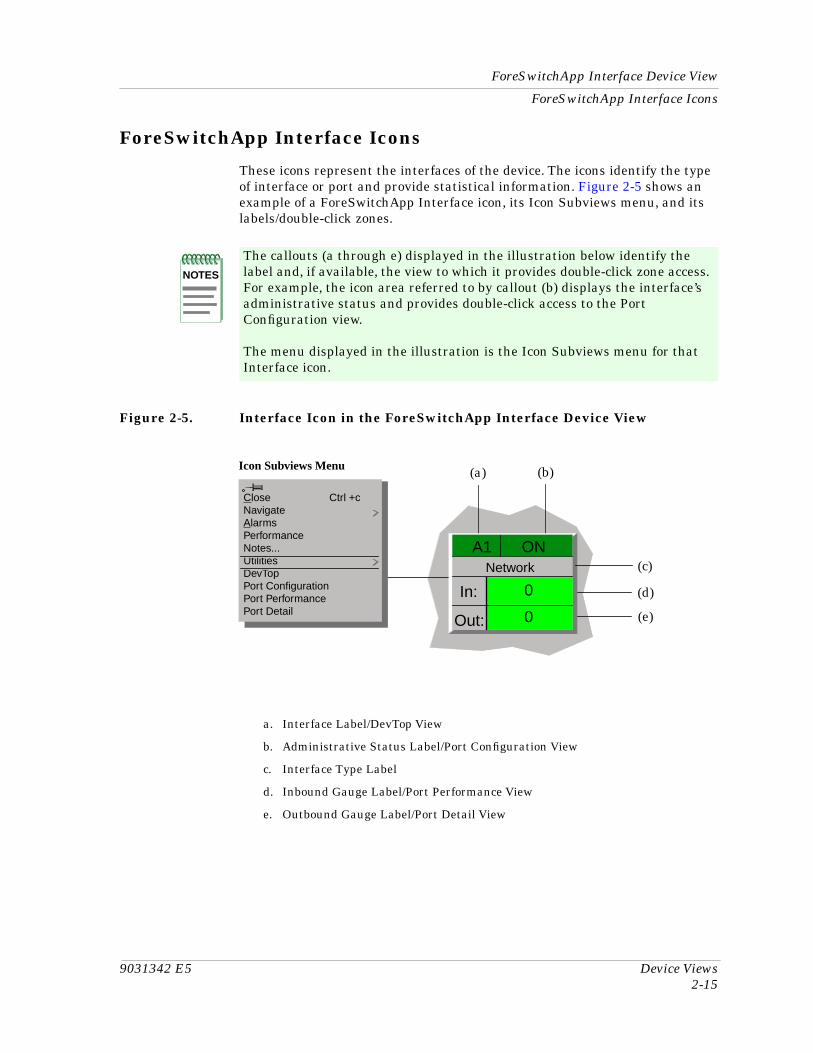
These icons represent the interfaces of the device. The icons identify the type of interface or port and provide statistical information. Figure 2-2 shows an example of a ForeRunner Interface icon, its Icon Subviews menu, and its labels/double-click zones.
Figure 2-2. Interface Icon in the ForeRunner Interface Device View
a. Interface Label
b. Administrative Status Label/Interface Status View
c. Interface Type Label/Fore Switch Interface Configuration View
d. MAC Address Label/Interface Address Translation Table View
e. Address Label/ Secondary Address View
f. Gauge Label/ Performance View
NOTES
The callouts (a through f) displayed in the illustration below identify the label and, if available, the view to which it provides double-click zone access. For example, the icon area referred to by callout (b) displays the administrative status and provides double-click access to the Interface Status view.
The menu displayed in the illustration is the Icon Subviews menu for that Interface icon.
(c)(d)
(e)(f)
(b)
Icon Subviews Menu
Close Ctrl +cNavigateAlarmsPerformanceNotes...UtilitiesDetailIF StatusIF ConfigurationIF Address Translation TableSecondary AddressThresholdsModel Information
1 ONOTHER
0:0:1D:F:FD:B6
1
(a)
ForeRunner Interface Device ViewForeRunner Interface Icon Labels
Device Views ForeRunner ATM Switch Modules2-4 Management Module Guide
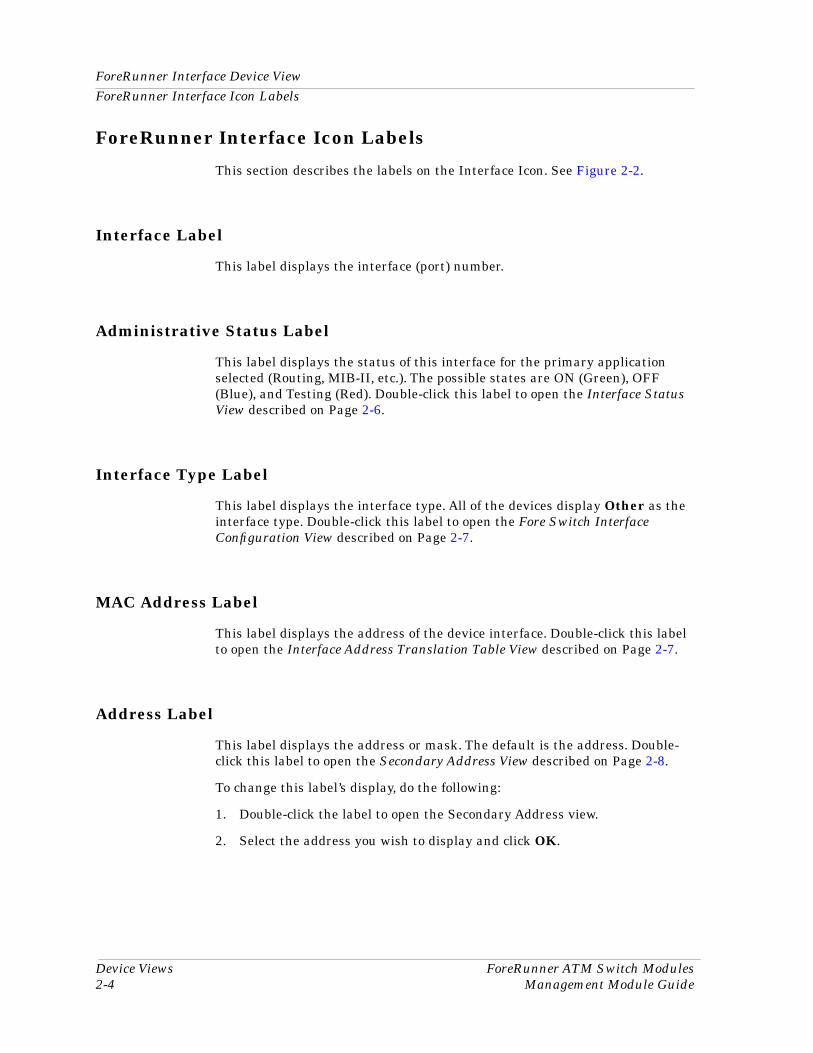
ForeRunner Interface Icon Labels
This section describes the labels on the Interface Icon. See Figure 2-2.
Interface Label
This label displays the interface (port) number.
Administrative Status Label
This label displays the status of this interface for the primary application selected (Routing, MIB-II, etc.). The possible states are ON (Green), OFF (Blue), and Testing (Red). Double-click this label to open the Interface Status View described on Page 2-6.
Interface Type Label
This label displays the interface type. All of the devices display Other as the interface type. Double-click this label to open the Fore Switch Interface Configuration View described on Page 2-7.
MAC Address Label
This label displays the address of the device interface. Double-click this label to open the Interface Address Translation Table View described on Page 2-7.
Address Label
This label displays the address or mask. The default is the address. Double-click this label to open the Secondary Address View described on Page 2-8.
To change this label’s display, do the following:
1. Double-click the label to open the Secondary Address view.
2. Select the address you wish to display and click OK.
9031342 E5 Device Views2-5
ForeRunner Interface Device View
ForeRunner Interface Icon Subviews
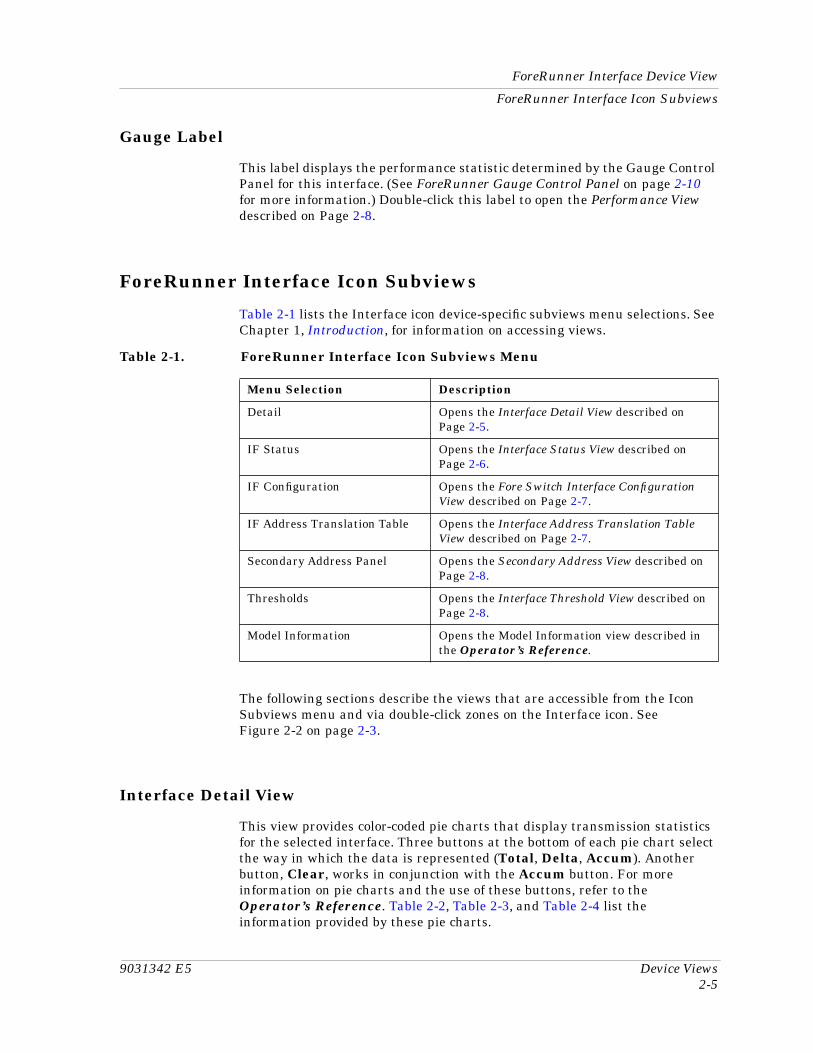
Gauge Label
This label displays the performance statistic determined by the Gauge Control Panel for this interface. (See ForeRunner Gauge Control Panel on page 2-10 for more information.) Double-click this label to open the Performance View described on Page 2-8.
ForeRunner Interface Icon Subviews
Table 2-1 lists the Interface icon device-specific subviews menu selections. See Chapter 1, Introduction, for information on accessing views.
The following sections describe the views that are accessible from the Icon Subviews menu and via double-click zones on the Interface icon. See Figure 2-2 on page 2-3.
Interface Detail View
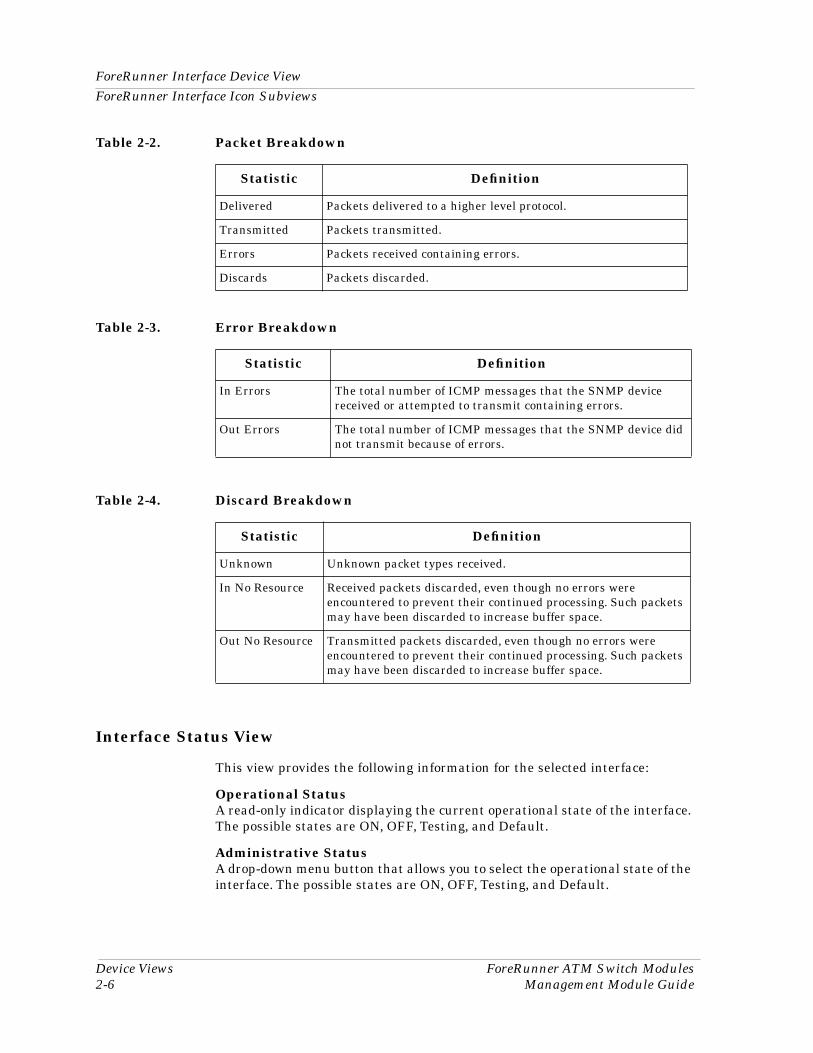
This view provides color-coded pie charts that display transmission statistics for the selected interface. Three buttons at the bottom of each pie chart select the way in which the data is represented (Total, Delta, Accum). Another button, Clear, works in conjunction with the Accum button. For more information on pie charts and the use of these buttons, refer to the Operator’s Reference. Table 2-2, Table 2-3, and Table 2-4 list the information provided by these pie charts.
Table 2-1. ForeRunner Interface Icon Subviews Menu
Menu Selection Description
Detail Opens the Interface Detail View described on Page 2-5.
IF Status Opens the Interface Status View described on Page 2-6.
IF Configuration Opens the Fore Switch Interface Configuration View described on Page 2-7.
IF Address Translation Table Opens the Interface Address Translation Table View described on Page 2-7.
Secondary Address Panel Opens the Secondary Address View described on Page 2-8.
Thresholds Opens the Interface Threshold View described on Page 2-8.
Model Information Opens the Model Information view described in the Operator’s Reference.
ForeRunner Interface Device ViewForeRunner Interface Icon Subviews
Device Views ForeRunner ATM Switch Modules2-6 Management Module Guide
Interface Status View
This view provides the following information for the selected interface:
Operational StatusA read-only indicator displaying the current operational state of the interface. The possible states are ON, OFF, Testing, and Default.
Administrative StatusA drop-down menu button that allows you to select the operational state of the interface. The possible states are ON, OFF, Testing, and Default.
Table 2-2. Packet Breakdown
Statistic Definition
Delivered Packets delivered to a higher level protocol.
Transmitted Packets transmitted.
Errors Packets received containing errors.
Discards Packets discarded.
Table 2-3. Error Breakdown
Statistic Definition
In Errors The total number of ICMP messages that the SNMP device received or attempted to transmit containing errors.
Out Errors The total number of ICMP messages that the SNMP device did not transmit because of errors.
Table 2-4. Discard Breakdown
Statistic Definition
Unknown Unknown packet types received.
In No Resource Received packets discarded, even though no errors were encountered to prevent their continued processing. Such packets may have been discarded to increase buffer space.
Out No Resource Transmitted packets discarded, even though no errors were encountered to prevent their continued processing. Such packets may have been discarded to increase buffer space.
9031342 E5 Device Views2-7
ForeRunner Interface Device View
ForeRunner Interface Icon Subviews
Fore Switch Interface Configuration View
This view displays the following information for the selected interface:
Operation StatusA read-only indicator that shows the current operational state of the port (ON, OFF, Testing, or Default).
Admin. StatusA drop-down menu button that allows you to select the operational state of the port (ON, OFF, or Testing). This can be seen on the Administrative Status Label.
DescriptionThe description of the interface.
Network Name/AddressThe network name and IP address of the interface.
Physical AddressThe physical (MAC) address of the port.
BandwidthThe estimated bandwidth of the interface measured in bits per second. For interfaces that do not vary in bandwidth or for which no accurate estimate can be made, a nominal bandwidth is provided.
Packet SizeThe size of the packets being transmitted or received.
Interface Address Translation Table View
This view displays the following information for the selected interface:
Interface IndexThe value identifying the port.
Physical AddressThe physical (MAC) address of the port.
Sorts the table columns.
Searches for a particular entry in the table.
Updates the table with the latest configuration information.
Sort
Find
Update
ForeRunner Interface Device ViewForeRunner Interface Icon Subviews
Device Views ForeRunner ATM Switch Modules2-8 Management Module Guide
Secondary Address View
This view displays the following information for the selected interface:
AddressThe IP address of the interface.
MaskThe mask address of the interface.
Interface Threshold View
This view displays the following information for the selected interface:
Load ThresholdThe ON and OFF values set to determine the point at which a load alarm will be turned on or off.
Packet Rate ThresholdThe ON and OFF values set to determine the point at which a packet transmission alarm will be turned on or off.
Error Rate ThresholdThe ON and OFF values set to determine the point at which an error alarm will be turned on or off.
% Discarded ThresholdThe ON and OFF values set to determine the point at which an alarm will be turned on or off.
Performance View
This view displays a breakdown of statistics for the selected interface. A multi-attribute line graph shows the port activity. You can change the graph properties via the Graph Properties drop-down menu and Lin/Log toggle described below.
This view also contains tables displaying transmission statistics. Current, average, and peak values are shown. The attributes displayed are pre-selected and the colors used represent different statistics.
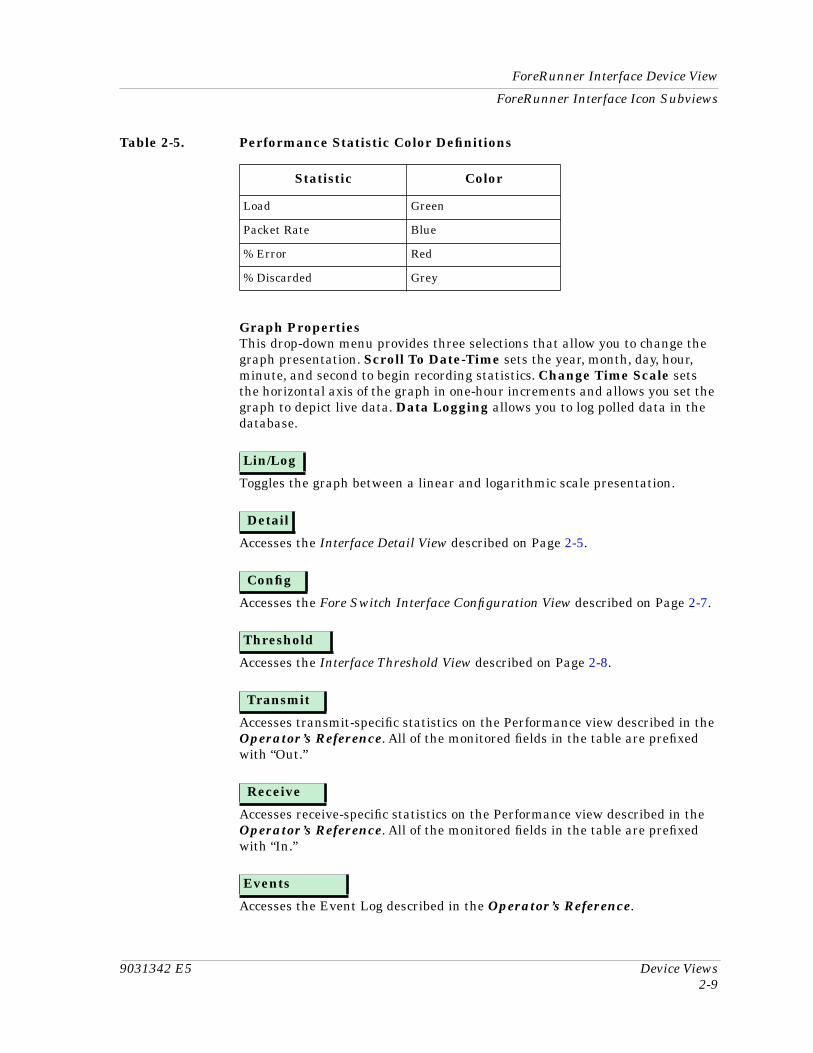
Table 2-5 lists the color definitions for the application. Refer to the Operator’s Reference for more information on the multi-attribute line graph.
9031342 E5 Device Views2-9
ForeRunner Interface Device View
ForeRunner Interface Icon Subviews
Graph PropertiesThis drop-down menu provides three selections that allow you to change the graph presentation. Scroll To Date-Time sets the year, month, day, hour, minute, and second to begin recording statistics. Change Time Scale sets the horizontal axis of the graph in one-hour increments and allows you set the graph to depict live data. Data Logging allows you to log polled data in the database.
Toggles the graph between a linear and logarithmic scale presentation.
Accesses the Interface Detail View described on Page 2-5.
Accesses the Fore Switch Interface Configuration View described on Page 2-7.
Accesses the Interface Threshold View described on Page 2-8.
Accesses transmit-specific statistics on the Performance view described in the Operator’s Reference. All of the monitored fields in the table are prefixed with “Out.”
Accesses receive-specific statistics on the Performance view described in the Operator’s Reference. All of the monitored fields in the table are prefixed with “In.”
Accesses the Event Log described in the Operator’s Reference.
Table 2-5. Performance Statistic Color Definitions
Statistic Color
Load Green
Packet Rate Blue
% Error Red
% Discarded Grey
Lin/Log
Detail
Config
Threshold
Transmit
Receive
Events
ForeRunner Interface Device ViewForeRunner Interface Options Panel
Device Views ForeRunner ATM Switch Modules2-10 Management Module Guide
Accesses the Alarm Manager application described in the SPECTRUM Enterprise Manager User’s Guide.
ForeRunner Interface Options Panel
This panel (see Figure 2-1 on page 2-2) allows you to modify the presentation of a highlighted Interface icon. Double-click a non-text area of this panel to open the ForeRunner Gauge Control Panel described below.
The Interface Options panel provides the following information.
FindThis drop-down menu allows you to search for a model or group of models based on the physical address, IP address, model type, or network name. Refer to the Operator’s Reference for more information.
Interface DescriptionThis field describes the interface of the highlighted Interface icon. If no Interface icon is highlighted, the field is empty or shows the interface previously highlighted.
ForeRunner Gauge Control Panel
This view (see Figure 2-3) allows you to change the type of statistical information displayed on the Gauge label of the Interface icon.
To access the Gauge Control Panel, double-click the background of the Interface Options panel, or do the following:
1. Highlight the Interface Options panel.
2. Select View -> Icon Subviews -> Gauge Control Panel.
Alarms
9031342 E5 Device Views2-11
ForeRunner Interface Device View
ForeRunner Interface Options Panel
Figure 2-3. Gauge Control Panel for the ForeRunner Model Type
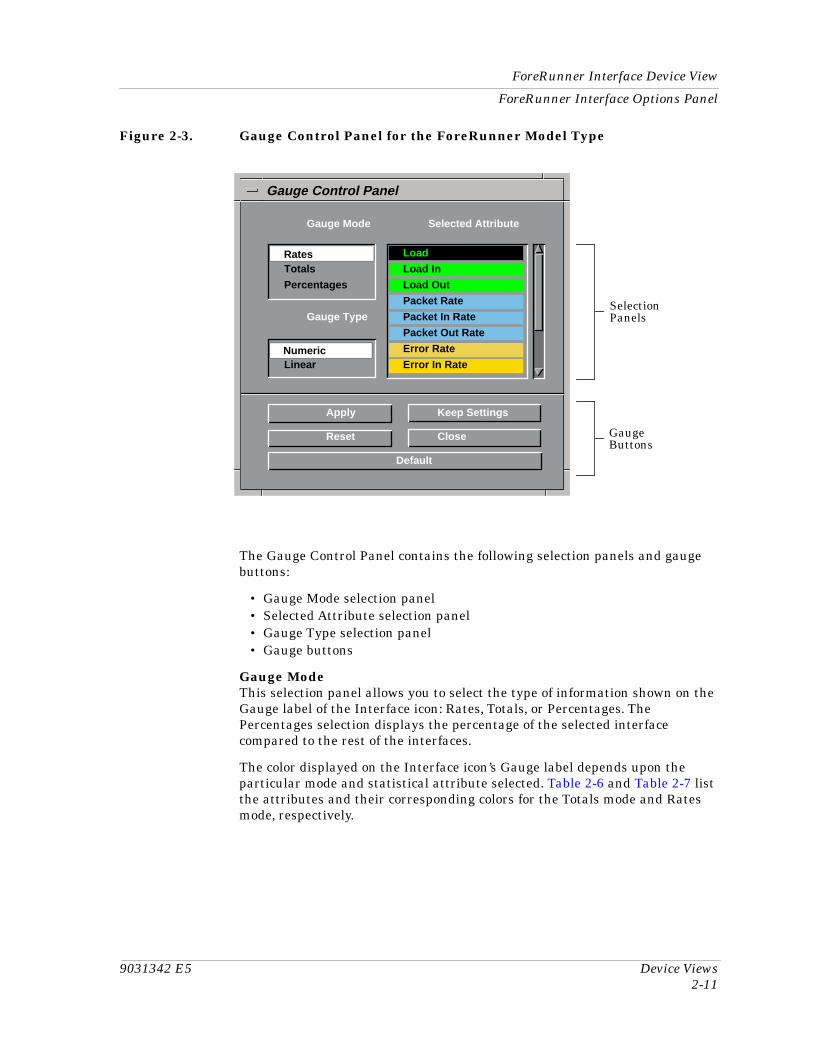
The Gauge Control Panel contains the following selection panels and gauge buttons:
• Gauge Mode selection panel• Selected Attribute selection panel• Gauge Type selection panel• Gauge buttons
Gauge ModeThis selection panel allows you to select the type of information shown on the Gauge label of the Interface icon: Rates, Totals, or Percentages. The Percentages selection displays the percentage of the selected interface compared to the rest of the interfaces.
The color displayed on the Interface icon’s Gauge label depends upon the particular mode and statistical attribute selected. Table 2-6 and Table 2-7 list the attributes and their corresponding colors for the Totals mode and Rates mode, respectively.
Gauge Mode Selected Attribute
Rates Load
Totals Load In
Percentages Load Out
Packet Rate
Gauge Type Packet In Rate
Packet Out Rate
Numeric Error Rate
Linear Error In Rate
Apply Keep Settings
Reset Close
Default
Gauge Control Panel
Rates
Numeric
SelectionPanels
GaugeButtons
ForeRunner Interface Device ViewForeRunner Interface Options Panel
Device Views ForeRunner ATM Switch Modules2-12 Management Module Guide
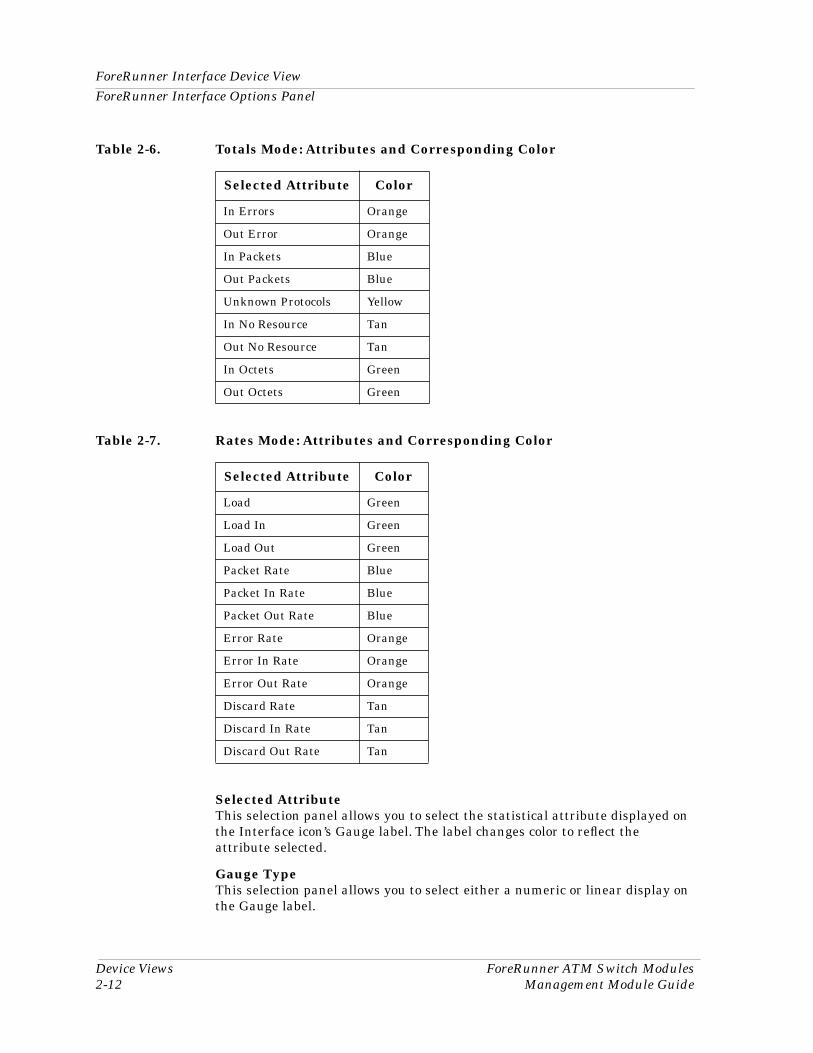
Selected AttributeThis selection panel allows you to select the statistical attribute displayed on the Interface icon’s Gauge label. The label changes color to reflect the attribute selected.
Gauge TypeThis selection panel allows you to select either a numeric or linear display on the Gauge label.
Table 2-6. Totals Mode: Attributes and Corresponding Color
Selected Attribute Color
In Errors Orange
Out Error Orange
In Packets Blue
Out Packets Blue
Unknown Protocols Yellow
In No Resource Tan
Out No Resource Tan
In Octets Green
Out Octets Green
Table 2-7. Rates Mode: Attributes and Corresponding Color
Selected Attribute Color
Load Green
Load In Green
Load Out Green
Packet Rate Blue
Packet In Rate Blue
Packet Out Rate Blue
Error Rate Orange
Error In Rate Orange
Error Out Rate Orange
Discard Rate Tan
Discard In Rate Tan
Discard Out Rate Tan
9031342 E5 Device Views2-13
ForeRunner Interface Device View
ForeRunner Interface Options Panel
Applies the current settings to the Gauge label for as long as the view is open.
Saves the current settings while SpectroGRAPH is running. The settings return to their default values when you restart SpectroGRAPH.
Returns the settings to the previously saved values.
Closes the Gauge Control Panel.
Returns the settings to the SPECTRUM default.
Apply
Keep Settings
Reset
Close
Default
ForeSwitchApp Interface Device View
Device Views ForeRunner ATM Switch Modules2-14 Management Module Guide
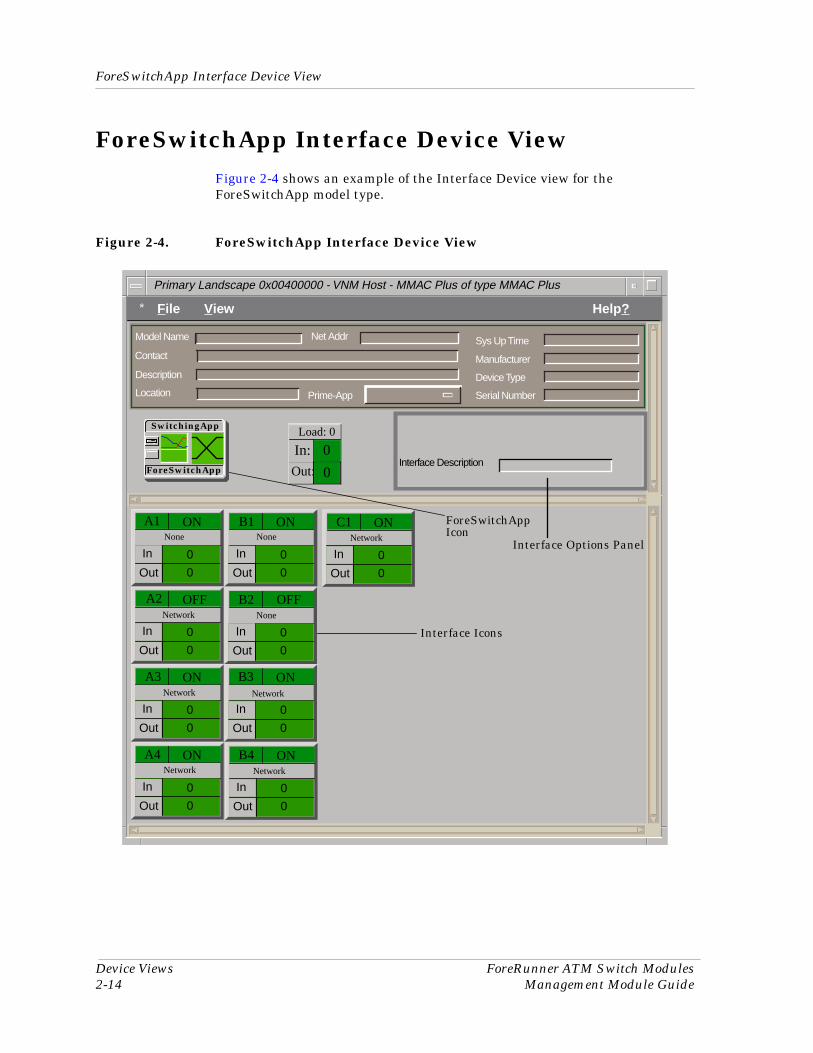
ForeSwitchApp Interface Device ViewFigure 2-4 shows an example of the Interface Device view for the ForeSwitchApp model type.
Figure 2-4. ForeSwitchApp Interface Device View
* File View Help?
Primary Landscape 0x00400000 - VNM Host - MMAC Plus of type MMAC Plus
Model Name
Contact
Description
Location
Net Addr
Prime-App
Sys Up Time
Manufacturer
Device Type
Serial Number
ForeSwitchApp
Interface Description
Load: 0
0In:
0Out:
Interface Options Panel
A3 ON
0In
Out 0
B3 ON
0In
Out 0
A4 ON
0In
Out 0
A2 OFF
0In
Out 0
B2None
0In
Out 0
B4 ON
0In
Out 0
C1 ONNetwork
0In
Out 0
A1 ON
0In
Out 0
B1 ONNone
0In
Out 0
Interface Icons
None
Network
OFF
NetworkNetwork
NetworkNetwork
Icon
SwitchingApp
ForeSwitchApp
9031342 E5 Device Views2-15
ForeSwitchApp Interface Device View
ForeSwitchApp Interface Icons
ForeSwitchApp Interface Icons
These icons represent the interfaces of the device. The icons identify the type of interface or port and provide statistical information. Figure 2-5 shows an example of a ForeSwitchApp Interface icon, its Icon Subviews menu, and its labels/double-click zones.
Figure 2-5. Interface Icon in the ForeSwitchApp Interface Device View
a. Interface Label/DevTop View
b. Administrative Status Label/Port Configuration View
c. Interface Type Label
d. Inbound Gauge Label/Port Performance View
e. Outbound Gauge Label/Port Detail View
NOTES
The callouts (a through e) displayed in the illustration below identify the label and, if available, the view to which it provides double-click zone access. For example, the icon area referred to by callout (b) displays the interface’s administrative status and provides double-click access to the Port Configuration view.
The menu displayed in the illustration is the Icon Subviews menu for that Interface icon.
(d)
(e)
(b)Icon Subviews Menu
Close Ctrl +cNavigateAlarmsPerformanceNotes...UtilitiesDevTopPort ConfigurationPort PerformancePort Detail
(a)
A1 ONNetwork
0
0
In:
Out:
(c)
ForeSwitchApp Interface Device ViewForeSwitchApp Interface Icon Labels
Device Views ForeRunner ATM Switch Modules2-16 Management Module Guide
ForeSwitchApp Interface Icon Labels
This section describes the labels on the ForeSwitchApp Interface icon. See Figure 2-5.
Interface Label
This label displays the interface (port) number. Double-click this label to open the Device Topology view described in the Operator’s Reference.
Administrative Status Label
This label displays the status of this interface for the primary application selected (Routing, MIB-II, etc.). The possible states are ON (Green), OFF (Blue), and Testing (Red). Double-click this label to open the ForeSwitchApp Port Configuration View described in Chapter 3, Configuration Views.
Interface Type Label
This label displays the type of interface.
Inbound Gauge Label
This label displays the performance statistic determined by the Gauge Control Panel for this interface. The ForeSwitchApp Gauge Control Panel is described on Page 2-19. Double-click this label to open the Port Performance View described on Page 2-17.
Outbound Gauge Label
This label displays the performance statistic determined by the Gauge Control Panel for this interface. The ForeSwitchApp Gauge Control Panel is described on Page 2-19. Double-click this label to open the Port Detail View described on Page 2-18.
9031342 E5 Device Views2-17
ForeSwitchApp Interface Device View
ForeSwitchApp Interface Icon Subviews
ForeSwitchApp Interface Icon Subviews
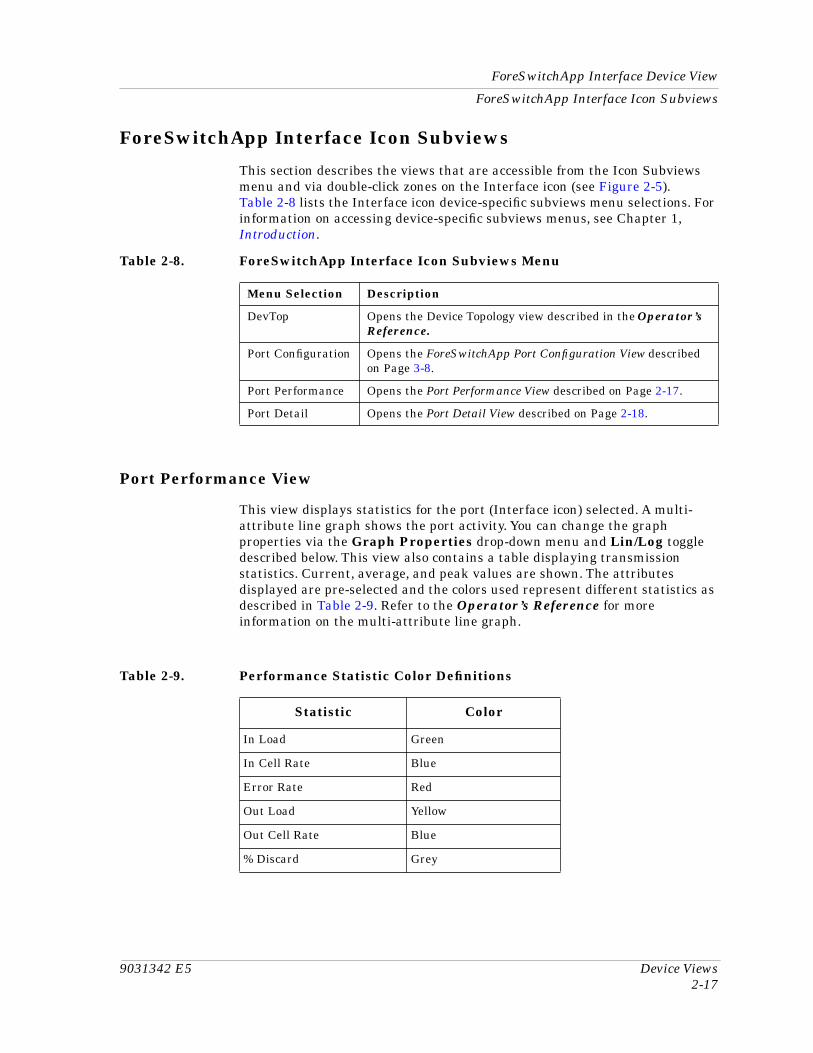
This section describes the views that are accessible from the Icon Subviews menu and via double-click zones on the Interface icon (see Figure 2-5). Table 2-8 lists the Interface icon device-specific subviews menu selections. For information on accessing device-specific subviews menus, see Chapter 1, Introduction.
Port Performance View
This view displays statistics for the port (Interface icon) selected. A multi-attribute line graph shows the port activity. You can change the graph properties via the Graph Properties drop-down menu and Lin/Log toggle described below. This view also contains a table displaying transmission statistics. Current, average, and peak values are shown. The attributes displayed are pre-selected and the colors used represent different statistics as described in Table 2-9. Refer to the Operator’s Reference for more information on the multi-attribute line graph.
Table 2-8. ForeSwitchApp Interface Icon Subviews Menu
Menu Selection Description
DevTop Opens the Device Topology view described in the Operator’s Reference.
Port Configuration Opens the ForeSwitchApp Port Configuration View described on Page 3-8.
Port Performance Opens the Port Performance View described on Page 2-17.
Port Detail Opens the Port Detail View described on Page 2-18.
Table 2-9. Performance Statistic Color Definitions
Statistic Color
In Load Green
In Cell Rate Blue
Error Rate Red
Out Load Yellow
Out Cell Rate Blue
% Discard Grey
ForeSwitchApp Interface Device ViewForeSwitchApp Interface Icon Subviews
Device Views ForeRunner ATM Switch Modules2-18 Management Module Guide
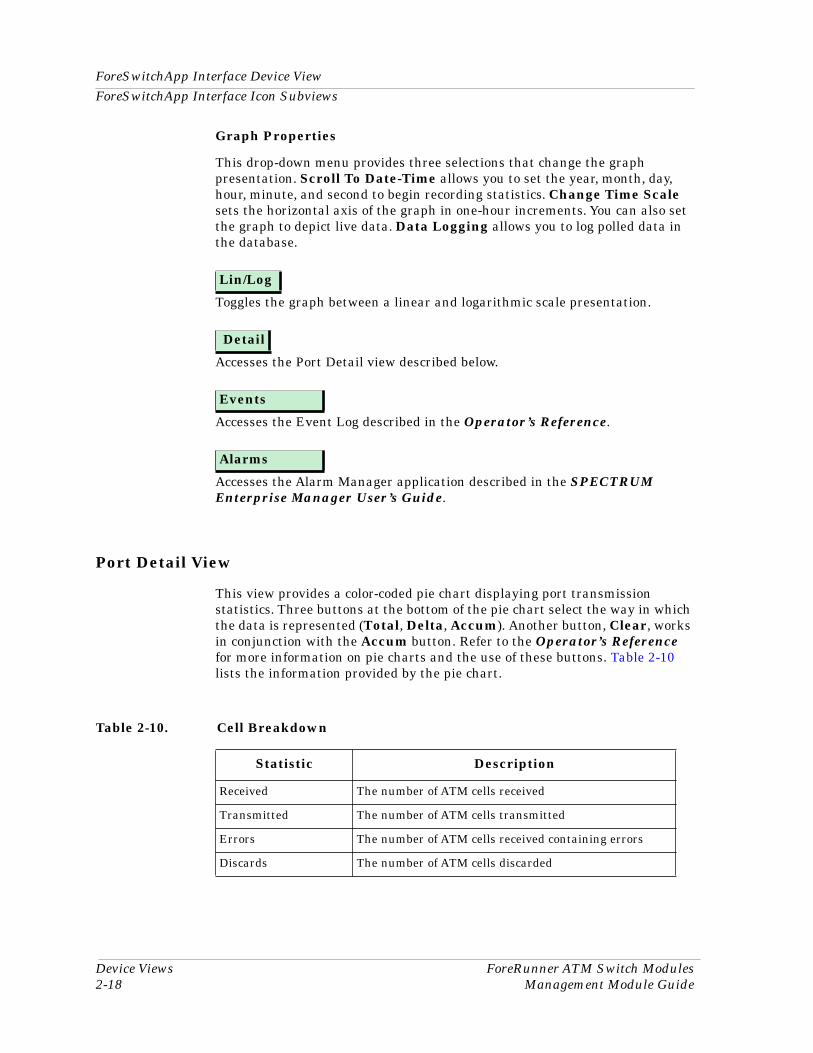
Graph Properties
This drop-down menu provides three selections that change the graph presentation. Scroll To Date-Time allows you to set the year, month, day, hour, minute, and second to begin recording statistics. Change Time Scale sets the horizontal axis of the graph in one-hour increments. You can also set the graph to depict live data. Data Logging allows you to log polled data in the database.
Toggles the graph between a linear and logarithmic scale presentation.
Accesses the Port Detail view described below.
Accesses the Event Log described in the Operator’s Reference.
Accesses the Alarm Manager application described in the SPECTRUM Enterprise Manager User’s Guide.
Port Detail View
This view provides a color-coded pie chart displaying port transmission statistics. Three buttons at the bottom of the pie chart select the way in which the data is represented (Total, Delta, Accum). Another button, Clear, works in conjunction with the Accum button. Refer to the Operator’s Reference for more information on pie charts and the use of these buttons. Table 2-10 lists the information provided by the pie chart.
Lin/Log
Detail
Events
Alarms
Table 2-10. Cell Breakdown
Statistic Description
Received The number of ATM cells received
Transmitted The number of ATM cells transmitted
Errors The number of ATM cells received containing errors
Discards The number of ATM cells discarded
9031342 E5 Device Views2-19
ForeSwitchApp Interface Device View
ForeSwitchApp Interface Options Panel
ForeSwitchApp Interface Options Panel
This area of the Interface Device view (see Figure 2-4 on page 2-14) allows you to modify the presentation of a highlighted Interface icon. Double-click a non-text area of this panel to open the Gauge Control Panel described below. The Interface Options panel provides the following information.
Interface DescriptionThis field provides a description of the highlighted interface. If no interface is highlighted, this field is empty or shows the interface previously highlighted.
ForeSwitchApp Gauge Control Panel
This view (Figure 2-6) allows you to change the type of statistics displayed on the Interface icon Gauge labels. To access the Gauge Control Panel, double-click the background of the Interface Options panel, or highlight the Interface Options panel and select View -> Icon Subviews -> Gauge Control Panel.
Figure 2-6. Gauge Control Panel for the ForeSwitchApp Model Type
The Gauge Control Panel provides the following selection panels and gauge buttons:
• Gauge Mode selection panel• Selected Attribute selection panel• Gauge Type selection panel• Gauge buttons
Gauge Control Panel
Numeric
Gauge Mode Selected Attribute
Rates Load
Totals Cell (In/Out)
Percentages Discard (Out)
Error (In)
Gauge Type
Apply Keep Settings
Reset Close
Default
Rates
SelectionPanels
GaugeButtons
ForeSwitchApp Interface Device ViewForeSwitchApp Interface Options Panel
Device Views ForeRunner ATM Switch Modules2-20 Management Module Guide
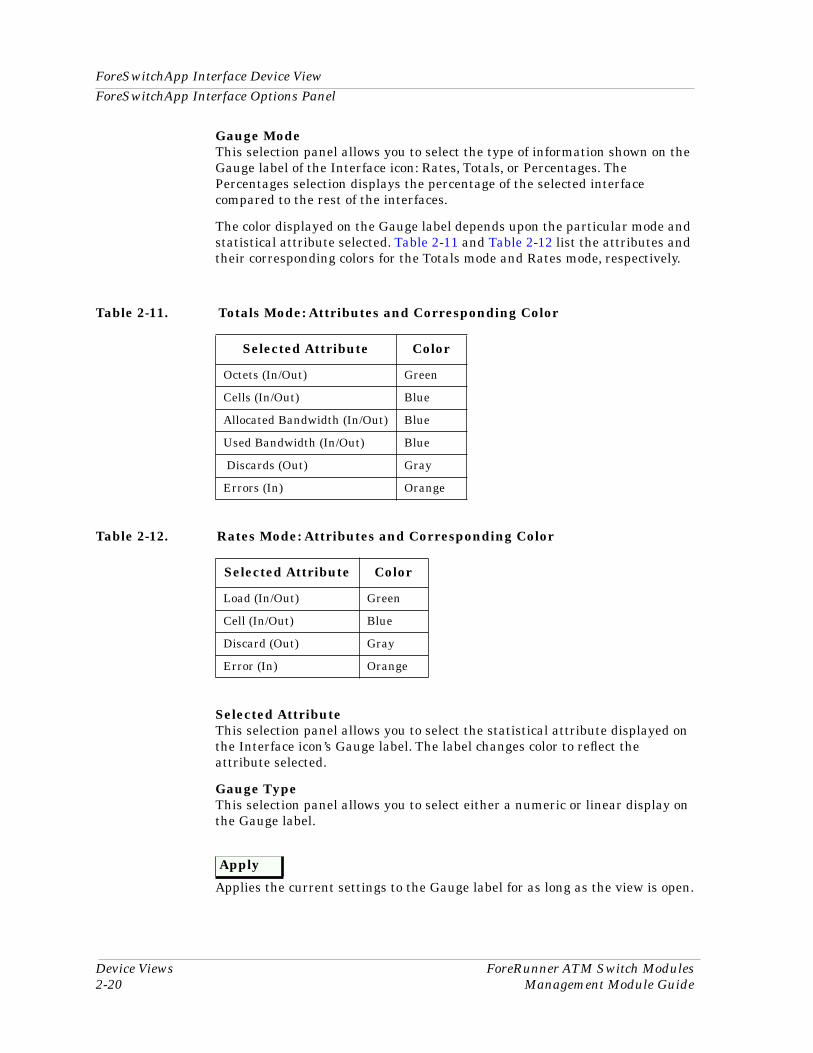
Gauge ModeThis selection panel allows you to select the type of information shown on the Gauge label of the Interface icon: Rates, Totals, or Percentages. The Percentages selection displays the percentage of the selected interface compared to the rest of the interfaces.
The color displayed on the Gauge label depends upon the particular mode and statistical attribute selected. Table 2-11 and Table 2-12 list the attributes and their corresponding colors for the Totals mode and Rates mode, respectively.
Selected AttributeThis selection panel allows you to select the statistical attribute displayed on the Interface icon’s Gauge label. The label changes color to reflect the attribute selected.
Gauge TypeThis selection panel allows you to select either a numeric or linear display on the Gauge label.
Applies the current settings to the Gauge label for as long as the view is open.
Table 2-11. Totals Mode: Attributes and Corresponding Color
Selected Attribute Color
Octets (In/Out) Green
Cells (In/Out) Blue
Allocated Bandwidth (In/Out) Blue
Used Bandwidth (In/Out) Blue
Discards (Out) Gray
Errors (In) Orange
Table 2-12. Rates Mode: Attributes and Corresponding Color
Selected Attribute Color
Load (In/Out) Green
Cell (In/Out) Blue
Discard (Out) Gray
Error (In) Orange
Apply
9031342 E5 Device Views2-21
ForeSwitchApp Interface Device View
ForeSwitchApp Interface Options Panel
Saves the current settings while SpectroGRAPH is running. Settings return to default when you restart SpectroGRAPH.
Returns the settings to the previously saved values.
Closes the Gauge Control Panel.
Returns the settings to the SPECTRUM default.
Keep Settings
Reset
Close
Default
ForeUserApp Interface Device View
Device Views ForeRunner ATM Switch Modules2-22 Management Module Guide
ForeUserApp Interface Device ViewThis view is accessed from the Dev Top view of the ForeSwitchApp. An example of the Interface Device view for the ForeUserApp is shown in Figure 2-7.
Figure 2-7. ForeUserApp Interface Device View
* File View Help?
Primary Landscape 0x00400000 - VNM Host - MMAC Plus of type MMAC Plus
Model Name
Contact
Description
Location
Net Addr
Prime-App
Sys Up Time
Manufacturer
Device Type
Serial Number
ForeUserApp Icon
Interface Description
Interface Options Panel
1 ON
0In
Out 0
0
Interface IconsNetwork
Internal
ATM User
ForeUserApp
9031342 E5 Device Views2-23
ForeUserApp Interface Device View
ForeUserApp Interface Icons
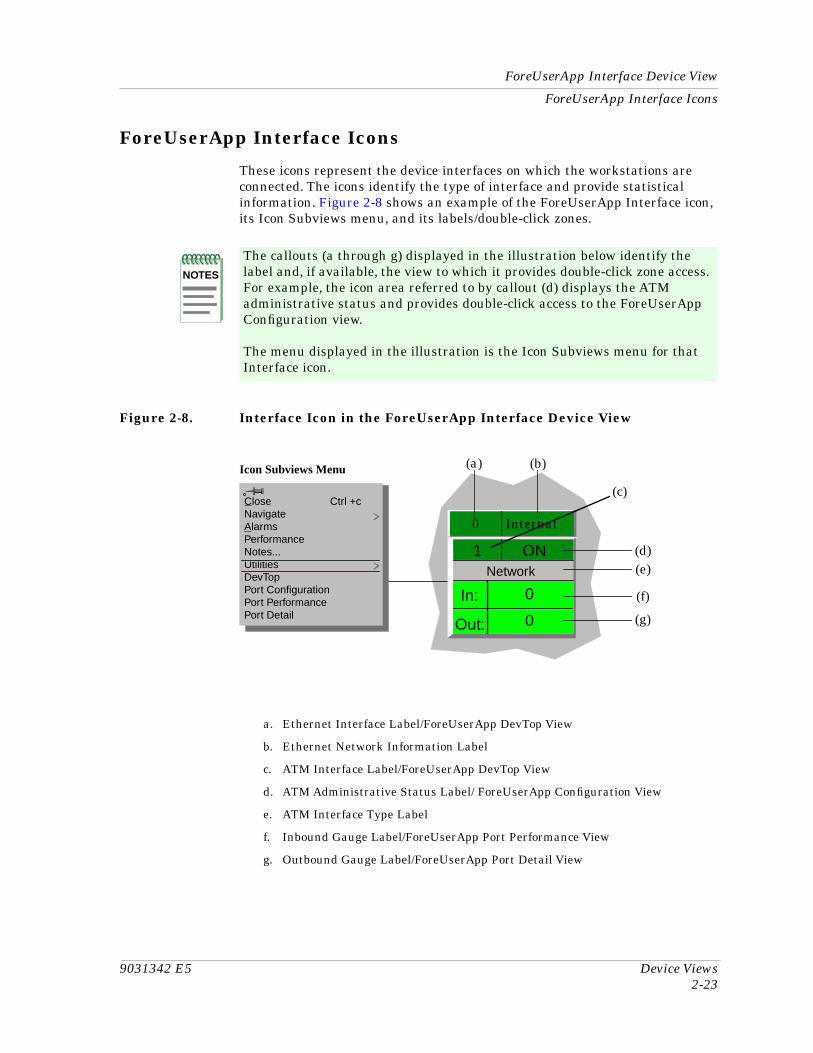
ForeUserApp Interface Icons
These icons represent the device interfaces on which the workstations are connected. The icons identify the type of interface and provide statistical information. Figure 2-8 shows an example of the ForeUserApp Interface icon, its Icon Subviews menu, and its labels/double-click zones.
Figure 2-8. Interface Icon in the ForeUserApp Interface Device View
a. Ethernet Interface Label/ForeUserApp DevTop View
b. Ethernet Network Information Label
c. ATM Interface Label/ForeUserApp DevTop View
d. ATM Administrative Status Label/ ForeUserApp Configuration View
e. ATM Interface Type Label
f. Inbound Gauge Label/ForeUserApp Port Performance View
g. Outbound Gauge Label/ForeUserApp Port Detail View
NOTES
The callouts (a through g) displayed in the illustration below identify the label and, if available, the view to which it provides double-click zone access. For example, the icon area referred to by callout (d) displays the ATM administrative status and provides double-click access to the ForeUserApp Configuration view.
The menu displayed in the illustration is the Icon Subviews menu for that Interface icon.
(f)
(g)
Icon Subviews Menu
Close Ctrl +cNavigateAlarmsPerformanceNotes...UtilitiesDevTopPort ConfigurationPort PerformancePort Detail
1 ONNetwork
0
0
In:
Out:
(e)
0 Internal
(d)
(a) (b)
(c)
ForeUserApp Interface Device ViewForeUserApp Interface Icon Labels
Device Views ForeRunner ATM Switch Modules2-24 Management Module Guide
ForeUserApp Interface Icon Labels
This section describes the labels on the Interface Icons contained in the ForeUserApp Device view (see Figure 2-8).
Ethernet Interface Label
This label displays the Ethernet interface (port) number. Double-click this label to open the ForeUserApp DevTop view described in the Operator’s Reference.
Ethernet Network Information Label
This label displays user-selectable network information. To change this label’s display, use the ForeUserApp Interface Options Panel described on Page 2-28.
ATM Interface Label
This label displays the ATM interface (port) number. Double-click this label to open the ForeUserApp DevTop view described in the Operator’s Reference.
ATM Administrative Status Label
This label displays the status of this interface for the primary application selected (Routing, MIB-II, etc.). The possible states are ON (Green), OFF (Blue), and Testing (Red). Double-click this label to open the Fore User Application Configuration View described on Page 3-9.
ATM Interface Type Label
This label displays the type of ATM interface.
Inbound Gauge Label
This label displays the performance statistic determined by the Gauge Control Panel for this interface. The Gauge Control Panel is described on Page 2-28. Double-click this label to open the ForeUserApp Port Performance View described on Page 2-25.
9031342 E5 Device Views2-25
ForeUserApp Interface Device View
ForeUserApp Interface Icons Subviews
Outbound Gauge Label
This label displays the performance statistic determined by the Gauge Control Panel for this interface. The Gauge Control Panel is described on Page 2-28. Double-click this label to open the ForeUserApp Port Detail view described below.
ForeUserApp Interface Icons Subviews
This section describes the views that are accessible from the Icon Subviews menu and from the double-click zones on the Interface icon (see Figure 2-8 on page 2-23). Table 2-13 lists the Interface icon device-specific subviews menu selections. For information on accessing device-specific subviews menus, see Chapter 1, Introduction.
Port Performance View
This view includes two subviews: Detail and AAL Detail. Access the ForeUserApp Port Performance view and its subviews as follows:
• Select View -> Icon Subviews -> Port Performance.
• Select Detail from the Performance view.
• Select AAL Detail from the Detail view.
The Port Performance view displays a breakdown of statistics for the port. A mult-attribute line graph provides a general indication of device activity. The attributes displayed are pre-selected and the colors used represent different statistics. Buttons allow you to modify the statistical presentation of the mult-attribute line graph. Table 2-14 lists the color definitions for the port. Refer to the Operator’s Reference for more information on the mult-attribute line graph.
Table 2-13. ForeUserApp Interface Icon Subviews Menu
Menu Selection Description
DevTop Opens the Device Topology view described in the Operator’s Reference.
Port Configuration Opens the ForeUserApp Configuration view described in Chapter 3, Configuration Views.
Port Performance Opens the ForeUserApp Port Performance View described below.
Port Detail Opens the ForeUserApp Port Detail View described on Page 2-26.
ForeUserApp Interface Device ViewForeUserApp Interface Icons Subviews
Device Views ForeRunner ATM Switch Modules2-26 Management Module Guide
Port Detail View
This view provides color-coded pie charts displaying statistical information. Three buttons at the bottom of each pie chart select the way in which the data is represented (Total, Delta, Accum). Another button, Clear, works in conjunction with the Accum button. Statistics are provided on cells and ATM layer data, broken down as listed in Table 2-15 and Table 2-16. Refer to the Operator’s Reference for more information on pie charts.
Table 2-14. Performance Statistic Color Definitions
Statistic Color
In Load Green
In Cell Rate Light Blue
Error Rate Red
Out Load Yellow
Out Cell Rate Blue
Discarded Grey
Table 2-15. Cell Breakdown
Statistics Description
Received The number of ATM cells received.
Transmitted The number of ATM cells transmitted.
Errors The number of ATM cells received containing errors.
Discards The number of ATM cells discarded.
Table 2-16. ATM Layer
Statistics Description
Received The number of ATM cells received.
Transmitted The number of ATM cells transmitted.
Out of Range VPIs The number of ATM cells received with VPI values that were out of range.
Unconnected VPIs The number of ATM cells received with VPI values that were in range but did not correspond to active connections.
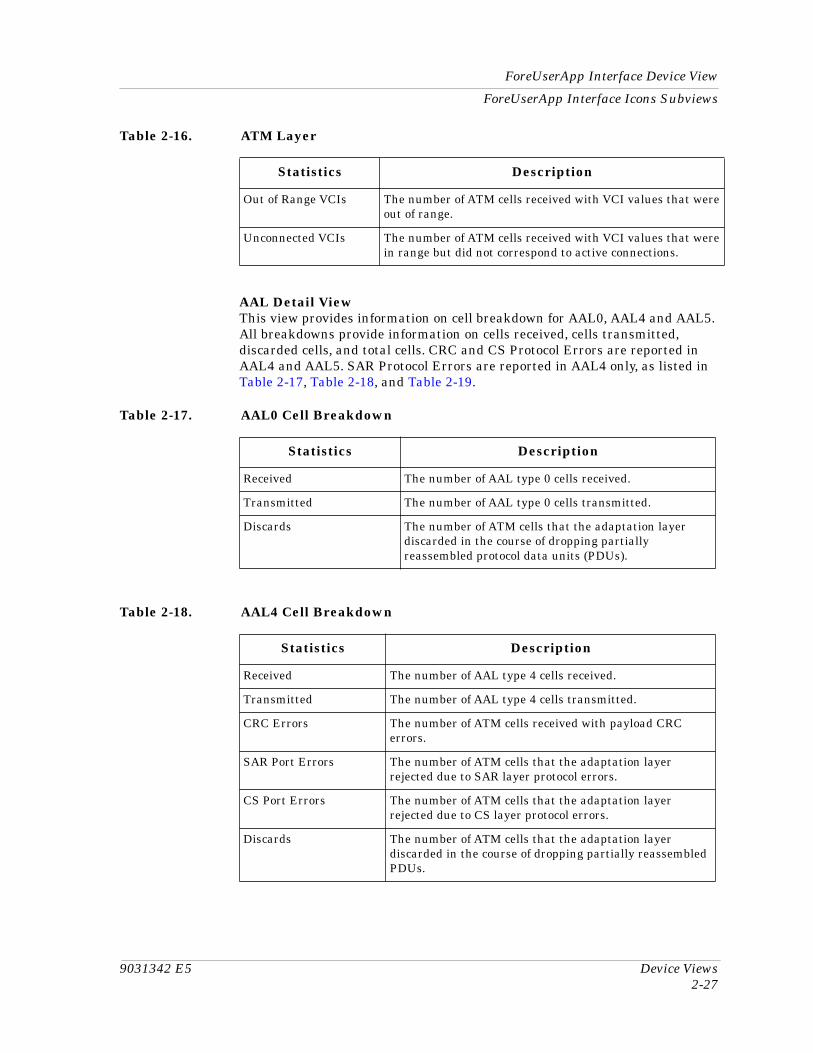
9031342 E5 Device Views2-27
ForeUserApp Interface Device View
ForeUserApp Interface Icons Subviews
AAL Detail ViewThis view provides information on cell breakdown for AAL0, AAL4 and AAL5. All breakdowns provide information on cells received, cells transmitted, discarded cells, and total cells. CRC and CS Protocol Errors are reported in AAL4 and AAL5. SAR Protocol Errors are reported in AAL4 only, as listed in Table 2-17, Table 2-18, and Table 2-19.
Out of Range VCIs The number of ATM cells received with VCI values that were out of range.
Unconnected VCIs The number of ATM cells received with VCI values that were in range but did not correspond to active connections.
Table 2-16. ATM Layer
Statistics Description
Table 2-17. AAL0 Cell Breakdown
Statistics Description
Received The number of AAL type 0 cells received.
Transmitted The number of AAL type 0 cells transmitted.
Discards The number of ATM cells that the adaptation layer discarded in the course of dropping partially reassembled protocol data units (PDUs).
Table 2-18. AAL4 Cell Breakdown
Statistics Description
Received The number of AAL type 4 cells received.
Transmitted The number of AAL type 4 cells transmitted.
CRC Errors The number of ATM cells received with payload CRC errors.
SAR Port Errors The number of ATM cells that the adaptation layer rejected due to SAR layer protocol errors.
CS Port Errors The number of ATM cells that the adaptation layer rejected due to CS layer protocol errors.
Discards The number of ATM cells that the adaptation layer discarded in the course of dropping partially reassembled PDUs.
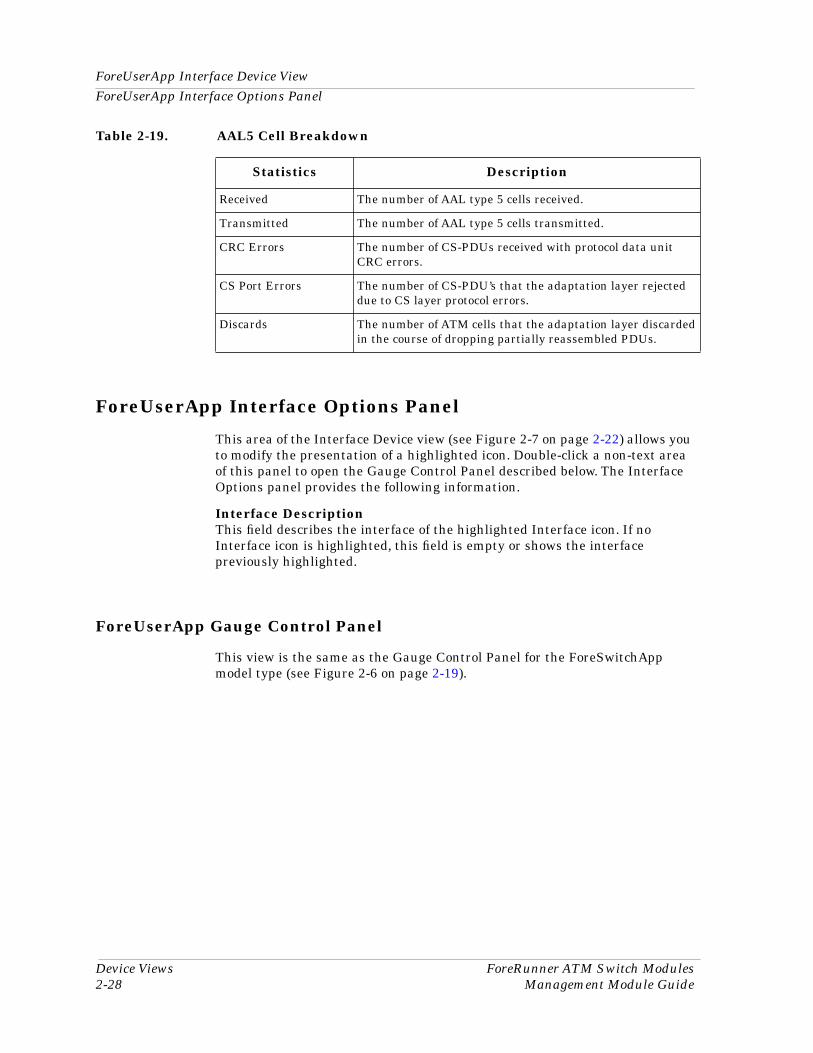
ForeUserApp Interface Device ViewForeUserApp Interface Options Panel
Device Views ForeRunner ATM Switch Modules2-28 Management Module Guide
ForeUserApp Interface Options Panel
This area of the Interface Device view (see Figure 2-7 on page 2-22) allows you to modify the presentation of a highlighted icon. Double-click a non-text area of this panel to open the Gauge Control Panel described below. The Interface Options panel provides the following information.
Interface DescriptionThis field describes the interface of the highlighted Interface icon. If no Interface icon is highlighted, this field is empty or shows the interface previously highlighted.
ForeUserApp Gauge Control Panel
This view is the same as the Gauge Control Panel for the ForeSwitchApp model type (see Figure 2-6 on page 2-19).
Table 2-19. AAL5 Cell Breakdown
Statistics Description
Received The number of AAL type 5 cells received.
Transmitted The number of AAL type 5 cells transmitted.
CRC Errors The number of CS-PDUs received with protocol data unit CRC errors.
CS Port Errors The number of CS-PDU’s that the adaptation layer rejected due to CS layer protocol errors.
Discards The number of ATM cells that the adaptation layer discarded in the course of dropping partially reassembled PDUs.
9031342 E5 Device Views2-29
SW_Link Interface Device View
SW_Link Interface Device ViewThe SW_Link Interface Device view (Figure 2-9) provides a logical representation of the physical connections between ForeSwitchApp model types.
Access the Link view in one of the following ways:
1. Double-click the Link view access arrow on the SW_Link icon.
2. Highlight the SW_Link icon and select View -> Icon Subviews -> Link View.
The information available from the Interface icons and Interface Options panel is the same as what is described in this chapter for the ForeSwitchApp model type.
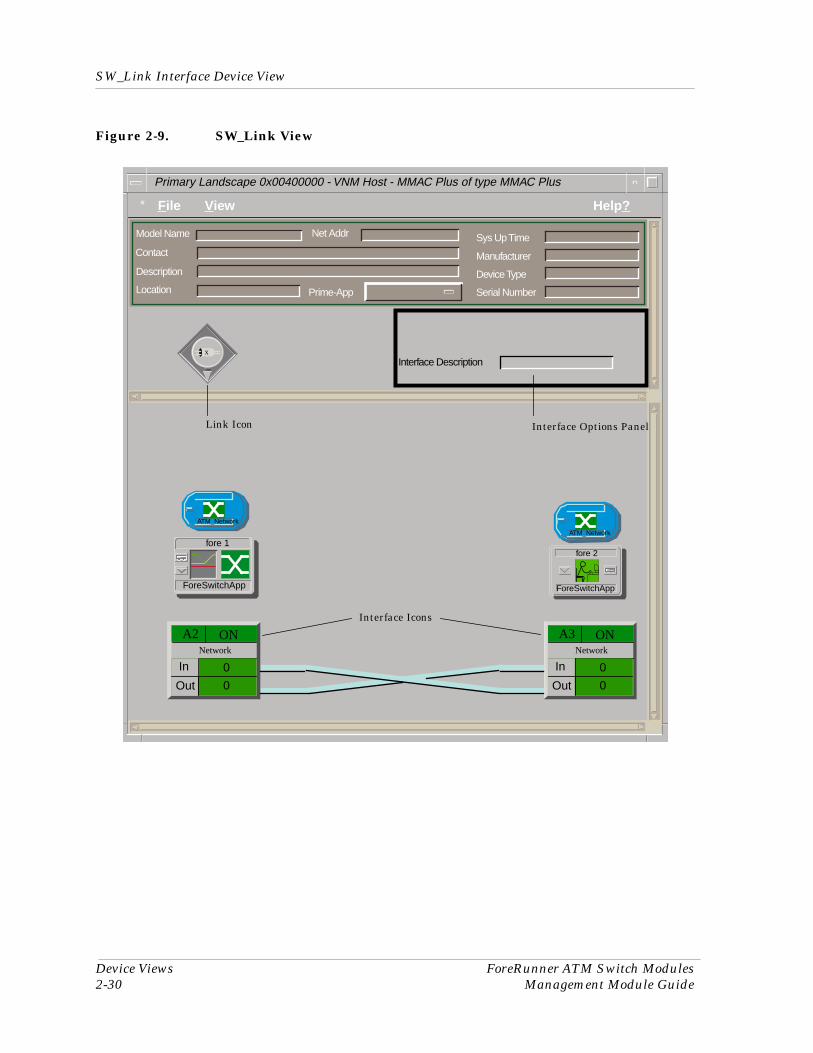
SW_Link Interface Device View
Device Views ForeRunner ATM Switch Modules2-30 Management Module Guide
Figure 2-9. SW_Link View
* File View Help?
Primary Landscape 0x00400000 - VNM Host - MMAC Plus of type MMAC Plus
Model Name
Contact
Description
Location
Net Addr
Prime-App
Sys Up Time
Manufacturer
Device Type
Serial Number
Interface Description
Interface Options Panel
A2 ON
0In
Out 0
Network
A3 ON
0In
Out 0
Network
ATM_Network
ForeSwitchApp
fore 2
ForeSwitchApp
fore 1
ATM_Network
Xx
Interface Icons
Link Icon
9031342 E53-1
Chapter 3
Configuration Views
What Is in This ChapterThis chapter describes the following configuration views available for the devices:
• Fore ATM Switch Configuration View, described on Page 3-2, provides board, module, and port level administrative details and operational information.
• Fore ATM Switch Application Configuration View, described on Page 3-5, provides port configuration information and allows you to change some IP configuration parameters.
• Fore User Application Configuration View, described on Page 3-7, describes the workstation ATM configuration.
• ForeSwitchApp Port Configuration View, described on Page 3-8, provides port-specific administration, bandwidth, and path information.
• ForeUserApp Configuration View, described on Page 3-9, provides workstation hardware and software configuration information.
• Fore ATM SONET Application Configuration View, described on Page 3-10, provides ATM transmission status information.
NOTE
The Fore ATM SONET Application Configuration view is provided as an example of a typical application configuration view. Your system may not have this application (i.e., SONET OC-3) or it may have other applications (such as DS-1, DS-2, etc.) depending on the network modules installed in your devices. All of these configuration views provide similar information.
Fore ATM Switch Configuration View
Configuration Views ForeRunner ATM Switch Modules3-2 Management Module Guide
In general, you access the device configuration views from the model type icons (ForeSwitchApp, ForeUserApp, etc.) For these views, highlight the model type icon and select View -> Icon Subviews -> Configuration.
You access port-specific configuration views from the Interface icons within the Device Interface view. For these views, highlight the Interface icon for the desired interface and select View -> Icon Subviews -> Configuration.
Fore ATM Switch Configuration ViewThis configuration view displays the information listed below.
1. The Banner (within the green border area) provides descriptive information about the model as described in the Operator’s Reference.
2. The four fields below the Banner display the software and hardware version numbers, the signaling control software identification, and the ATM address of the device.
3. The buttons are as follows:
Opens the Fore ATM Switch Application Trap Destination Table view, which displays instructions for setting destinations. For more information on setting traps, refer to the SPECTRUM Portable Management Application Tools Guide.
Opens the Fore ATM Switch Alarm Table view, which lists alarm, log, and trap action information. For more information, refer to the SPECTRUM Portable Management Application Tools Guide.
Opens the Buffer Table described below.
4. The configuration view tables (Board, Module, and Interface) are the main focus of the Fore ATM Switch Configuration view. These tables provide board-level, module-level, and port-level administrative details (such as names and addresses) and operational information (such as signaling type, port on/off status, port speed, and datagram size). The configuration view tables also provide double-click access zones and buttons that are
NOTE
You can use the mouse button (right or middle) to access the Configuration views. Click the icon to access the Pop-up Navigator menu and select Configuration.
Traps
Alarms
Buffers
9031342 E5 Configuration Views3-3
Fore ATM Switch Configuration View
Buffer Table
common to all of the tables, including the Buffer Table. These common items are described below, followed by descriptions of each table.
Double Click Access ZonesEach row of data in the configuration tables provides double-click access to a detail view, which provides information specific to the row. Click on any field within a row to access the detail view for the row. The detail view accessed from the Interface Table permits you to change the administrative status of the selected port.
Configuration Table ButtonsEach configuration table contains the buttons described below.
Sorts the items listed in the columns. Click the column heading of the column you want to sort (which makes Sort available) and click Sort.
A search feature that is not yet implemented.
Returns the table to its default sort order and updates the display.
Buffer Table
This table provides information concerning the type and size of the ATM switch output buffer. Click Buffers in the Fore ATM Switch Configuration view to access this table.
Board The index of this output buffer’s switch board.
Num. Buffers The number of this output buffer.
TypeThe type of this output buffer.
Oper. Status The operational status of this output buffer.
Buffer SizeThe logical size of this output buffer, in cells.
Queue LengthThe number of cells in this output buffer.
OverflowsThe number of cells dropped because the output buffer was full.
Sort
Find
Update
Fore ATM Switch Configuration ViewBoard Table
Configuration Views ForeRunner ATM Switch Modules3-4 Management Module Guide
Board Table
This table provides the following identification information for the ATM switch output buffer:
VersionThe ATM switch board version number.
ModelThe ATM switch board model number.
Serial NumberThe ATM switch board serial number.
Number Of ModulesThe number of network modules on this ATM switch board.
Module Table
This table provides the following configuration information concerning the ATM switch network module:
BoardThe index of this board within the ATM switch.
NumberThe number of this network module within the ATM switch.
NameThe type name of this network module within the ATM switch.
SpeedThe speed of this network module within the ATM switch.
Number Of PortsThe number of ports on this network module.
UpTimeThe time since this network module was created, in hundredths of a second.
Interface Table
This table provides the following port status information for the ATM switch:
IndexThe value identifying the port.
DescriptionThe textural description of the interface.
9031342 E5 Configuration Views3-5
Fore ATM Switch Application Configuration View
Admin StatusThe desired state of this port (ON, OFF, or TEST).
Oper StatusThe current operational state of this port (ON, OFF, or TEST).
MAC AddressThe MAC address of the port.
SpeedThe speed of this port within the ATM switch.
TypeThe type of this port.
Mtu (Message Transfer Unit)The size of the largest datagram that can be sent or received on the interface, specified in octets. For interfaces that are red transmitting network datagrams, this is the size of the largest network datagram that can be sent on the interface.
Fore ATM Switch Application Configuration View
This view provides board-specific configuration information and allows you to change some of the IP configuration parameters. Each row of data in the view provides double-click access to a Port view that provides information specific to the row and permits you to change the loopback and administrative status of the selected module. Click on any field contained within a row to access the Port view.
The Fore ATM Switch Application Configuration view provides three fields and a Port Table as follows:
Num. of PortsThe number of ports available on the device.
Policing ActionThe action the device will take in case of a bandwidth violation on this channel.
CDV (Cell Delay Variation)The time window in which a cell may be received on a channel and be accepted.
Fore ATM Switch Application Configuration ViewPort Table
Configuration Views ForeRunner ATM Switch Modules3-6 Management Module Guide
Port Table
This table provides the following port information for the devices:
BoardThe index of this port’s switch board.
ModuleThe network module of this port.
PortThe number of this port within its network module.
VersionThe version number of this port’s network module.
ModelThe model number of this port’s network module.
Oper. StatusThe operational status of this port.
Buffer SizeThe logical size of this port’s output buffer, in cells.
Queue LengthThe number of cells in this port’s output buffer.
OverflowsThe number of cells dropped because the output buffer was full.
ErrorsThe number of cells containing errors.
CarrierThe presence or absence of a carrier at this port.
Global IndexThe global index of this port within the ATM switch as a whole.
NameThe name of the port indicating the board network module and port identifiers.
Admin StatusThe administrative state of the physical layer of this port. When a port is configured “Up”, the physical layer is configured to process all physical layer events including the transmission and reception of data (cells). When a port is configured “Down”, the physical layer is shut down and ignores all physical layer events.
9031342 E5 Configuration Views3-7
Fore User Application Configuration View
Fore User Application Configuration ViewThis view includes the following fields that describe the workstation ATM configuration:
Hardware VersionThe version of the ATM adaptor hardware. The number is encoded into six hexadecimal digits.
Hardware SpeedThe speed of the ATM adaptor hardware.
Firmware VersionThe version of the ATM adaptor firmware. The number is encoded into six hexadecimal digits.
Software VersionThe version of the ATM adaptor software. The number is encoded into six hexadecimal digits.
UptimeThe length of time since the workstation connection was created, in hundredths of a second.
Serial NumberThe serial number of the ATM adaptor hardware.
Adapter TypeThe workstation adapter type number
Rec CarrierThe presence or absence of a carrier on the link.
Port NumberThe number of the port selected.
Oper StatusThe current operational state of the adaptor.
ATM AddressThe address of this ATM adaptor.
Physical LayerThe physical layer of the adaptor.
ForeSwitchApp Port Configuration View
Configuration Views ForeRunner ATM Switch Modules3-8 Management Module Guide
ForeSwitchApp Port Configuration ViewThis view provides the following port specific information:
Port NumberIdentifies the port.
Port UptimeThe length of time this port has been in its current state.
Port Hw BoardThe hardware board number of this port.
Port Hw ModuleThe hardware module number of this port.
Port Hw NumberThe hardware port number of this port.
Remote ATM AddressThe ATM address of the entity connected to this port.
Remote IP AddressThe IP address of the entity connected to this port.
ILMI Remote AddressThe Integrated Layer Management Interface (ILMI) address of the entity connected to this port. Default is 255.255.255.255.
Administrative StatusThe desired state of this port. The dynamic state indicates that a link monitoring protocol is used to determine the operational status of the port.
Operational StatusThe current operational state of this port
Bandwidth In Max/Out MaxThe maximum incoming/outgoing bandwidth of this port, in cells per second.
Bandwidth In Allocated/Out AllocatedThe allocated incoming/outgoing bandwidth of this port, in cells per second.
Bandwidth In Used/Out UsedThe incoming/outgoing bandwidth being used on this port, in cells per second.
Paths In Max/Out MaxThe maximum number of incoming/outgoing virtual paths supported by this port.
Paths In Number/Out NumberThe number of incoming/outgoing virtual paths being used on this port.
The Port Configuration view also contains five buttons that access the Path Table views described for ForeSwitchApp in Chapter 5, Application Views.
9031342 E5 Configuration Views3-9
ForeUserApp Configuration View
ForeUserApp Configuration ViewThis view provides the following port specific information:
Hardware VersionThe version of the ATM adaptor hardware. The number is encoded into six hexadecimal digits.
Hardware SpeedThe speed of the ATM adaptor hardware.
Firmware VersionThe version of the ATM adaptor firmware. The number is encoded into six hexadecimal digits.
Software VersionThe version of the ATM adaptor software. The number is encoded into six hexadecimal digits.
UptimeThe length of time that the port has been in its current state.
Serial NumberThe serial number of the ATM adaptor hardware.
Adaptor TypeThe hardware type of the adaptor.
Rec CarrierThe presence or absence of a carrier on the link.
Port NumberThe number of the port selected.
Oper StatusThe current operational state of the adaptor.
ATM AddressThe address of this ATM adaptor.
Physical LayerThe physical layer of the adaptor.
Fore ATM SONET Application Configuration View
Configuration Views ForeRunner ATM Switch Modules3-10 Management Module Guide
Fore ATM SONET Application Configuration View
The Fore ATM SONET Application Configuration view is provided as an example of a typical application configuration view. Your system may not have this application (i.e., SONET OC-3) or it may have other applications (such as DS-1, DS-2, etc.) depending on the network modules installed in your devices. All of these configuration views provide similar information.
In general, the application configuration view provides port-specific configuration information and allows you to change some of the transmission parameters. Each row of data in the view provides double-click access to a detail view that provides information specific to the row. Click on any field contained within a row to access the detail view for the row.
The detail view accessed from the Fore ATM SONET Application Configuration view permits you to control transmit and receive descrambling and change the framing operator and loopback configuration of the selected port.
The Fore ATM SONET Application Configuration view provides the following fields:
BoardThe index of this port’s switch board.
ModuleThe network module of this port.
PortThe number of the port within the network module.
Line TypeThe line type for the interface. The possible values are Other, Single mode short range, Single mode medium range, Multimode, UTP, or Coax. The default is Multimode.
Line CodingThe line coding for the interface. The possible values are Other, B3ZS, CMI, or NRZ. The default is NRZ.
Framing DefaultThe default value of the framing standard used by the port. The possible values are SONET or SDH.
Framing OperThe operational value of the framing standard used by the port. The possible values are 1 (atm SONET) or 2 (atm SDH).
Path WidthThe type of the SONET path. The possible values are sts1, sts3c, sts9c, sts12c, sts24c, or sts48c. The default is sts3c.
9031342 E5 Configuration Views3-11
Fore ATM SONET Application Configuration View
LoopbackThe current loopback status of the SONET interface. The possible status entries are as follows:
None - the interface is not in a loopback state (default value)
Line - the receive data and clock are connected to the transmit data and clock
Diag - the transmit data stream and clock are looped back to the receiver
Other - the interface is in a loopback that is not defined.
Tx Clock SourceThe source of the transmit clock. The possible values are Local or Rx. The default is Local.
Rx ScramblingIndicates whether the information is being descrambled on receiving. The possible values are Descrambling or No Descrambling. The default is Descrambling.
Tx ScramblingIndicates whether the information is being descrambled before transmitting. The possible values are Scrambling or No Scrambling. The default is Scrambling.
Section StatThe section status of the interface. The possible values are 1 (no defect), 2 (loss of signal detected), or 4 (loss of frame detected). The default is 1.
Line StatusThe line status of the interface. The possible values are 1 (no defect), 2 (line alarm indication signal detected), or 4 (line far end receive failure detected). The default is 1.
Path StatusThe path status of the interface. The possible values are 1 (no defect), 2 (path loss of pointer detected), 4 (path alarm indication signal detected), or 8 (path yellow alarm detected). The default is 1.

Fore ATM SONET Application Configuration View
Configuration Views ForeRunner ATM Switch Modules3-12 Management Module Guide
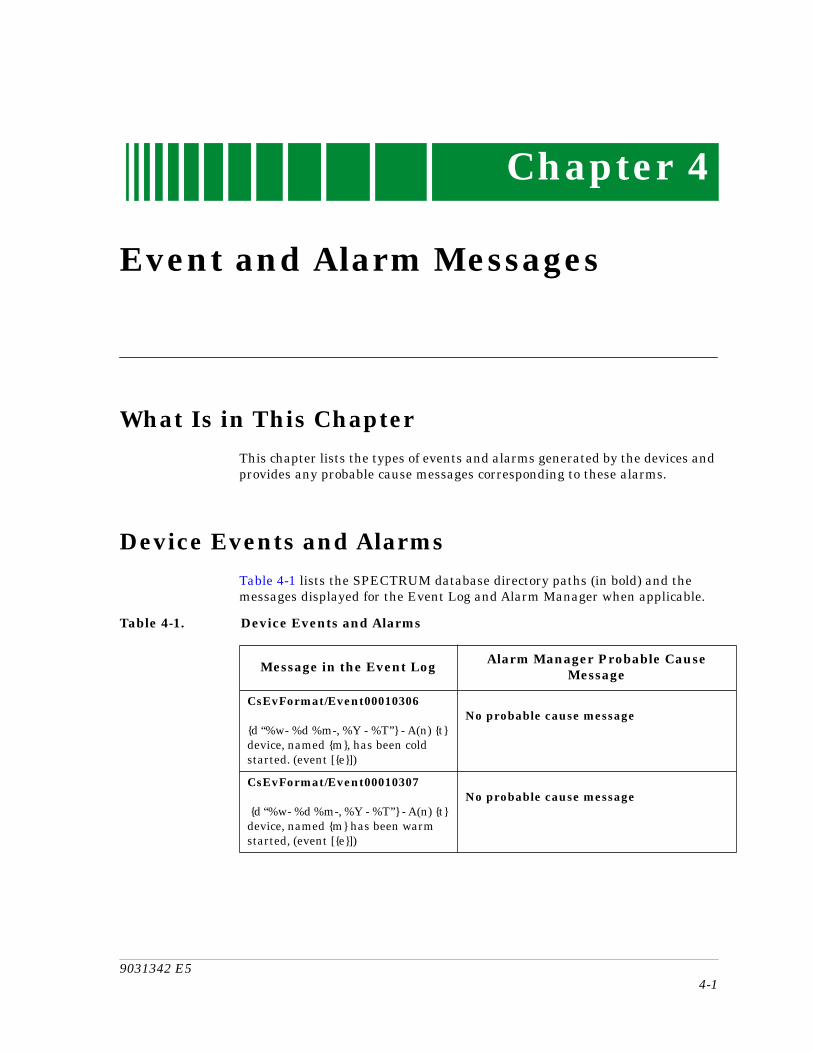
9031342 E54-1
Chapter 4
Event and Alarm Messages
What Is in This ChapterThis chapter lists the types of events and alarms generated by the devices and provides any probable cause messages corresponding to these alarms.
Device Events and AlarmsTable 4-1 lists the SPECTRUM database directory paths (in bold) and the messages displayed for the Event Log and Alarm Manager when applicable.
Table 4-1. Device Events and Alarms
Message in the Event Log Alarm Manager Probable Cause Message
CsEvFormat/Event00010306
{d “%w- %d %m-, %Y - %T”} - A(n) {t} device, named {m}, has been cold started. (event [{e}])
No probable cause message
CsEvFormat/Event00010307
{d “%w- %d %m-, %Y - %T”} - A(n) {t} device, named {m} has been warm started, (event [{e}])
No probable cause message
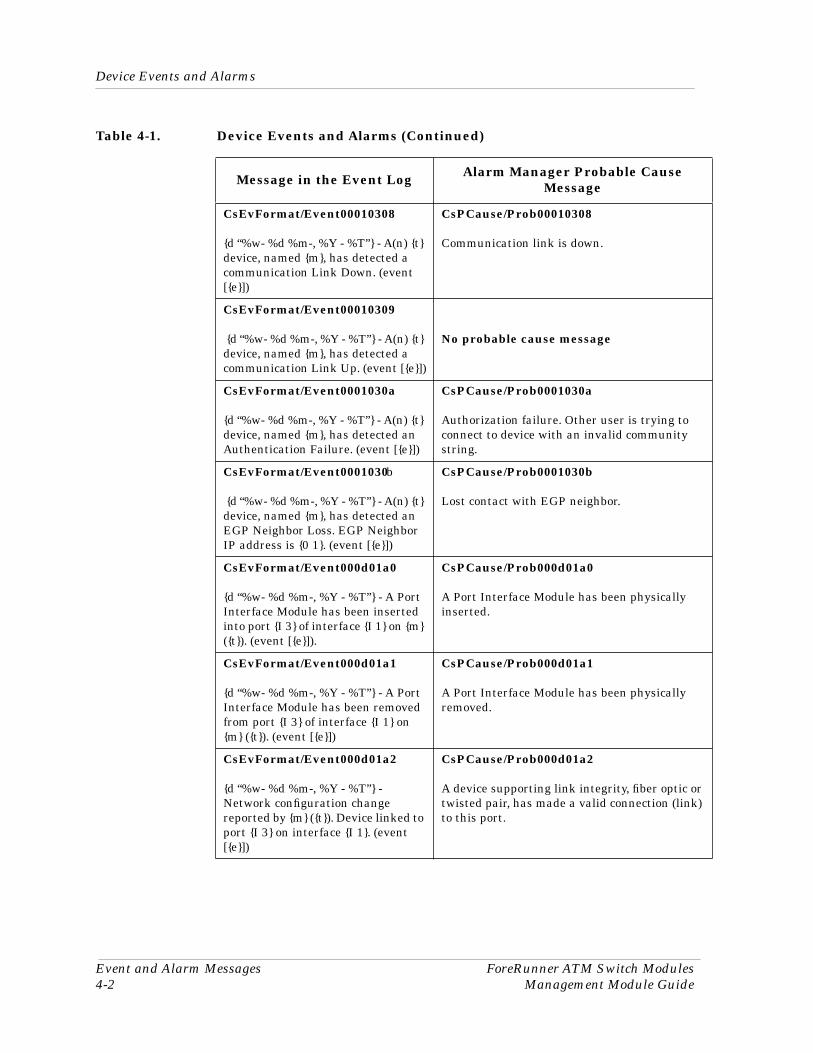
Device Events and Alarms
Event and Alarm Messages ForeRunner ATM Switch Modules4-2 Management Module Guide
CsEvFormat/Event00010308
{d “%w- %d %m-, %Y - %T”} - A(n) {t} device, named {m}, has detected a communication Link Down. (event [{e}])
CsPCause/Prob00010308
Communication link is down.
CsEvFormat/Event00010309
{d “%w- %d %m-, %Y - %T”} - A(n) {t} device, named {m}, has detected a communication Link Up. (event [{e}])
No probable cause message
CsEvFormat/Event0001030a
{d “%w- %d %m-, %Y - %T”} - A(n) {t} device, named {m}, has detected an Authentication Failure. (event [{e}])
CsPCause/Prob0001030a
Authorization failure. Other user is trying to connect to device with an invalid community string.
CsEvFormat/Event0001030b
{d “%w- %d %m-, %Y - %T”} - A(n) {t} device, named {m}, has detected an EGP Neighbor Loss. EGP Neighbor IP address is {0 1}. (event [{e}])
CsPCause/Prob0001030b
Lost contact with EGP neighbor.
CsEvFormat/Event000d01a0
{d “%w- %d %m-, %Y - %T”} - A Port Interface Module has been inserted into port {I 3} of interface {I 1} on {m} ({t}). (event [{e}]).
CsPCause/Prob000d01a0
A Port Interface Module has been physically inserted.
CsEvFormat/Event000d01a1
{d “%w- %d %m-, %Y - %T”} - A Port Interface Module has been removed from port {I 3} of interface {I 1} on {m} ({t}). (event [{e}])
CsPCause/Prob000d01a1
A Port Interface Module has been physically removed.
CsEvFormat/Event000d01a2
{d “%w- %d %m-, %Y - %T”} - Network configuration change reported by {m} ({t}). Device linked to port {I 3} on interface {I 1}. (event [{e}])
CsPCause/Prob000d01a2
A device supporting link integrity, fiber optic or twisted pair, has made a valid connection (link) to this port.
Table 4-1. Device Events and Alarms (Continued)
Message in the Event Log Alarm Manager Probable Cause Message
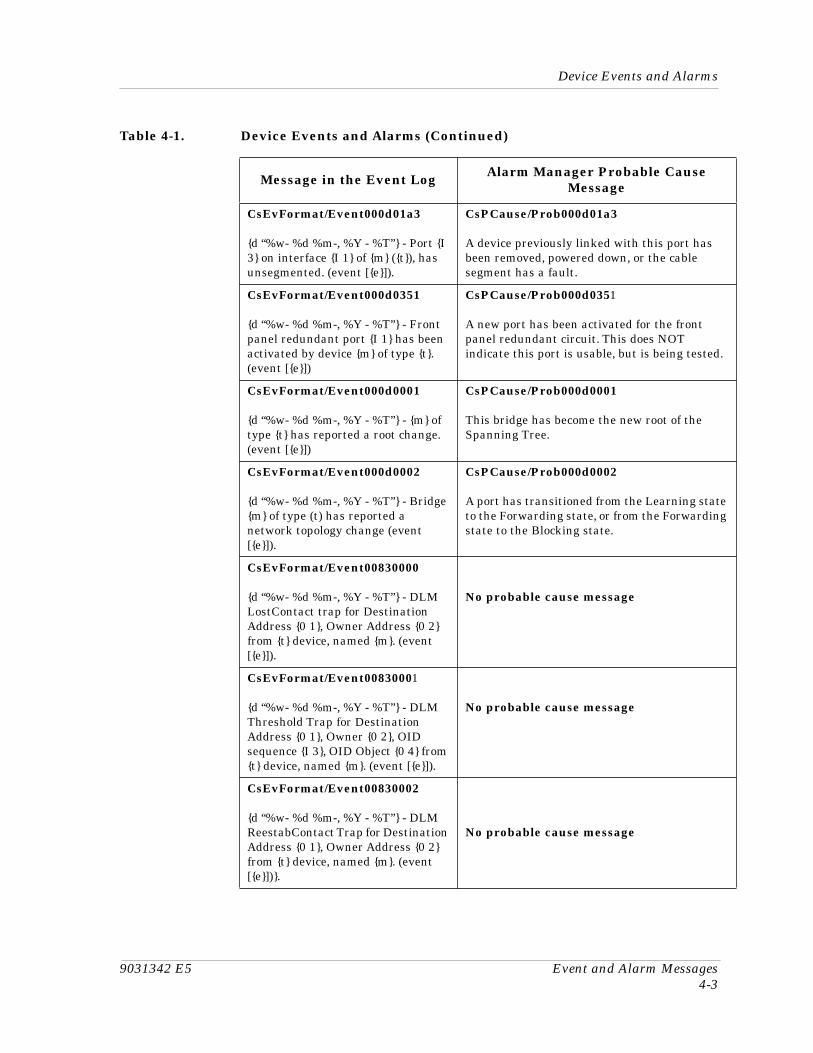
9031342 E5 Event and Alarm Messages4-3
Device Events and Alarms
CsEvFormat/Event000d01a3
{d “%w- %d %m-, %Y - %T”} - Port {I 3} on interface {I 1} of {m} ({t}), has unsegmented. (event [{e}]).
CsPCause/Prob000d01a3
A device previously linked with this port has been removed, powered down, or the cable segment has a fault.
CsEvFormat/Event000d0351
{d “%w- %d %m-, %Y - %T”} - Front panel redundant port {I 1} has been activated by device {m} of type {t}. (event [{e}])
CsPCause/Prob000d0351
A new port has been activated for the front panel redundant circuit. This does NOT indicate this port is usable, but is being tested.
CsEvFormat/Event000d0001
{d “%w- %d %m-, %Y - %T”} - {m} of type {t} has reported a root change. (event [{e}])
CsPCause/Prob000d0001
This bridge has become the new root of the Spanning Tree.
CsEvFormat/Event000d0002
{d “%w- %d %m-, %Y - %T”} - Bridge {m} of type (t) has reported a network topology change (event [{e}]).
CsPCause/Prob000d0002
A port has transitioned from the Learning state to the Forwarding state, or from the Forwarding state to the Blocking state.
CsEvFormat/Event00830000
{d “%w- %d %m-, %Y - %T”} - DLM LostContact trap for Destination Address {0 1}, Owner Address {0 2} from {t} device, named {m}. (event [{e}]).
No probable cause message
CsEvFormat/Event00830001
{d “%w- %d %m-, %Y - %T”} - DLM Threshold Trap for Destination Address {0 1}, Owner {0 2}, OID sequence {I 3}, OID Object {0 4} from {t} device, named {m}. (event [{e}]).
No probable cause message
CsEvFormat/Event00830002
{d “%w- %d %m-, %Y - %T”} - DLM ReestabContact Trap for Destination Address {0 1}, Owner Address {0 2} from {t} device, named {m}. (event [{e}])}.
No probable cause message
Table 4-1. Device Events and Alarms (Continued)
Message in the Event Log Alarm Manager Probable Cause Message

Device Events and Alarms
Event and Alarm Messages ForeRunner ATM Switch Modules4-4 Management Module Guide
9031342 E55-1
Chapter 5
Application Views
What Is in This ChapterThis chapter describes the Application views and the device-specific applications to which they provide access. The applications display detailed configuration and operational status information.
This chapter describes the following Application views, applications, and application model types (in parentheses):
• ForeRunner Application View- Routing (GenRtrApp)- IP Routing (IP2RtrApp)- Switching (ForeSwitchApp)- SONET (Fore_SONET_App)
• Workstation Application View- Routing (GenRtrApp)- IP Routing (IP2RtrApp)- Fore User Agent (ForeUserAgent)- ATM User (ForeUserApp)
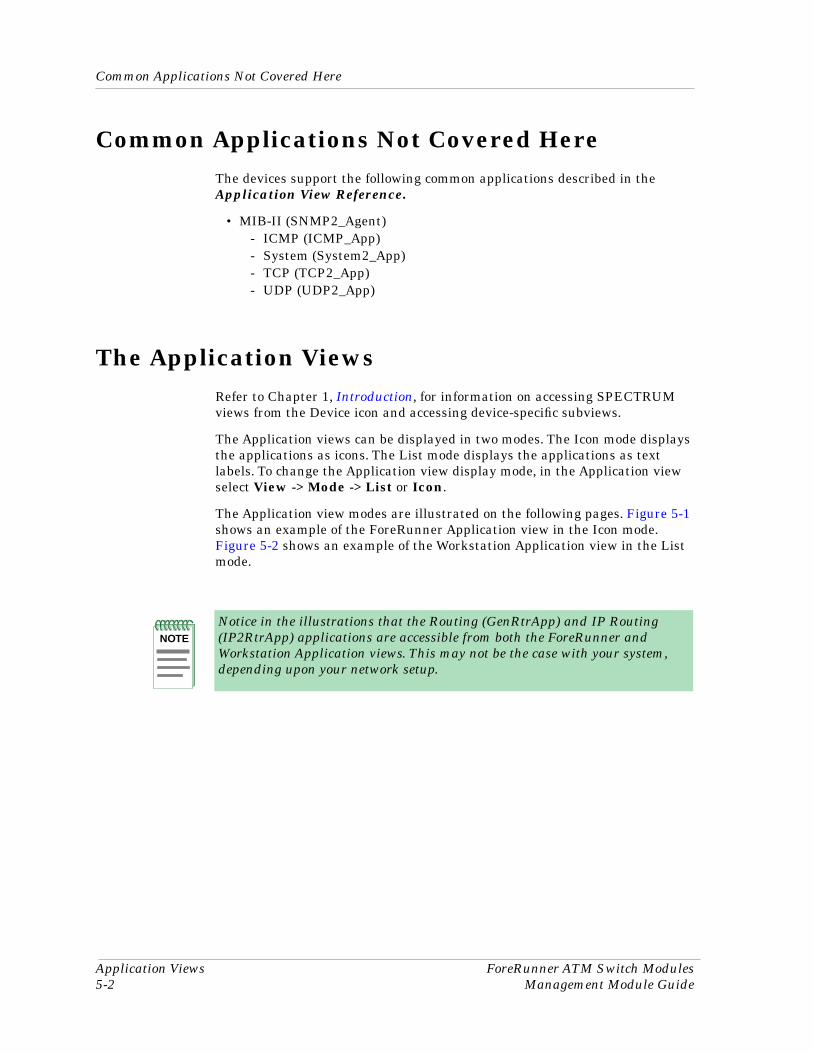
Common Applications Not Covered Here
Application Views ForeRunner ATM Switch Modules5-2 Management Module Guide
Common Applications Not Covered HereThe devices support the following common applications described in the Application View Reference.
• MIB-II (SNMP2_Agent)- ICMP (ICMP_App)- System (System2_App)- TCP (TCP2_App)- UDP (UDP2_App)
The Application ViewsRefer to Chapter 1, Introduction, for information on accessing SPECTRUM views from the Device icon and accessing device-specific subviews.
The Application views can be displayed in two modes. The Icon mode displays the applications as icons. The List mode displays the applications as text labels. To change the Application view display mode, in the Application view select View -> Mode -> List or Icon.
The Application view modes are illustrated on the following pages. Figure 5-1 shows an example of the ForeRunner Application view in the Icon mode. Figure 5-2 shows an example of the Workstation Application view in the List mode.
NOTE
Notice in the illustrations that the Routing (GenRtrApp) and IP Routing (IP2RtrApp) applications are accessible from both the ForeRunner and Workstation Application views. This may not be the case with your system, depending upon your network setup.
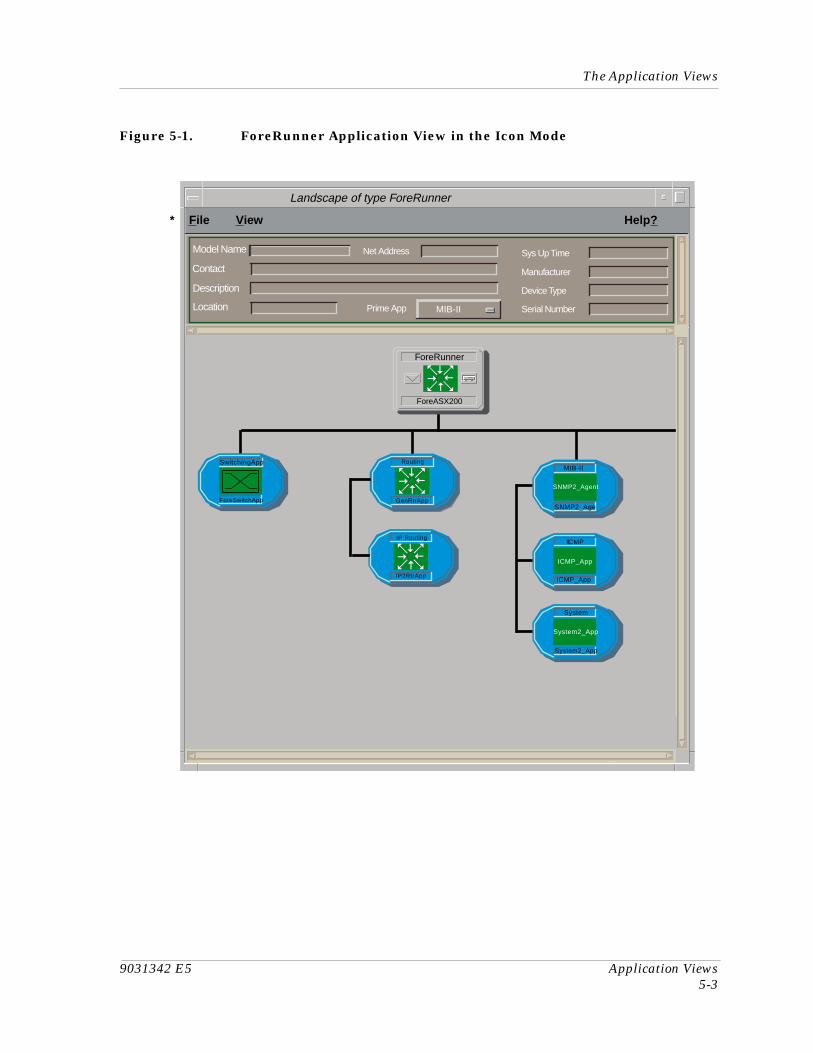
9031342 E5 Application Views5-3
The Application Views
Figure 5-1. ForeRunner Application View in the Icon Mode
* File View Help?
Landscape of type ForeRunner
Model Name
Contact
Description
Location
Net Address
Prime App
Sys Up Time
Manufacturer
Device Type
Serial Number
SwitchingApp
ForeSwitchApp
IICMP
ICMP_App
ICMP_App
MIB-II
SNMP2_Age
SNMP2_Agent
System
System2_App
System2_App
ForeASX200
ForeRunner
MIB-II
Routing
GenRtrApp
IP Routing
IP2RtrApp
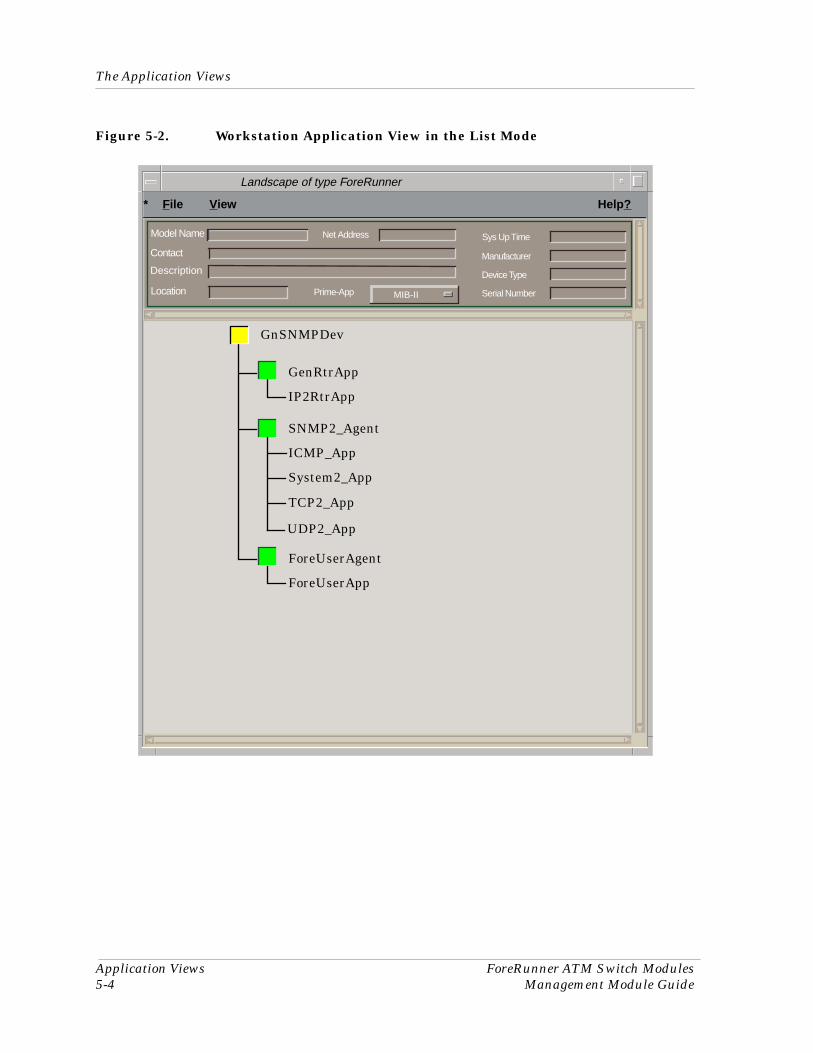
The Application Views
Application Views ForeRunner ATM Switch Modules5-4 Management Module Guide
Figure 5-2. Workstation Application View in the List Mode
* File View Help?
Model Name
Contact
Location
Net Address
Prime-App
Sys Up Time
Manufacturer
Device Type
Serial Number
GnSNMPDev
SNMP2_Agent
ICMP_App
System2_App
GenRtrApp
IP2RtrApp
Landscape of type ForeRunner
Description
MIB-II
ForeUserAgent
ForeUserApp
TCP2_App
UDP2_App
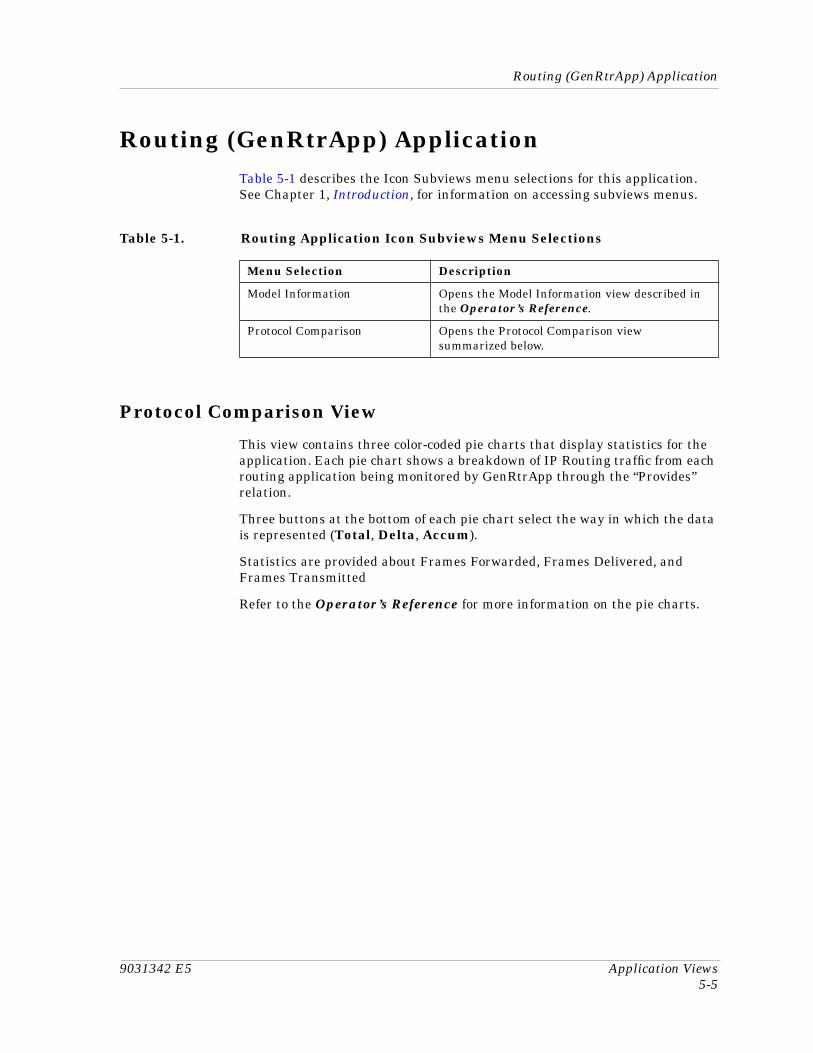
9031342 E5 Application Views5-5
Routing (GenRtrApp) Application
Routing (GenRtrApp) ApplicationTable 5-1 describes the Icon Subviews menu selections for this application. See Chapter 1, Introduction, for information on accessing subviews menus.
Protocol Comparison View
This view contains three color-coded pie charts that display statistics for the application. Each pie chart shows a breakdown of IP Routing traffic from each routing application being monitored by GenRtrApp through the “Provides” relation.
Three buttons at the bottom of each pie chart select the way in which the data is represented (Total, Delta, Accum).
Statistics are provided about Frames Forwarded, Frames Delivered, and Frames Transmitted
Refer to the Operator’s Reference for more information on the pie charts.
Table 5-1. Routing Application Icon Subviews Menu Selections
Menu Selection Description
Model Information Opens the Model Information view described in the Operator’s Reference.
Protocol Comparison Opens the Protocol Comparison view summarized below.
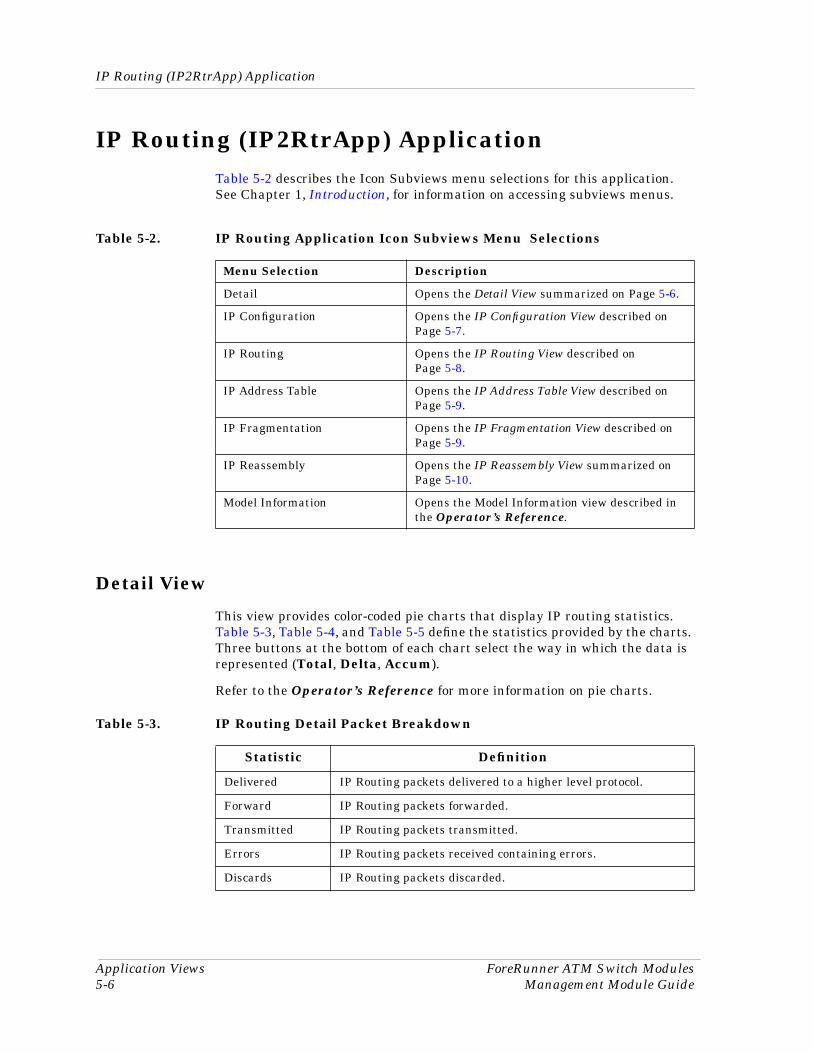
IP Routing (IP2RtrApp) Application
Application Views ForeRunner ATM Switch Modules5-6 Management Module Guide
IP Routing (IP2RtrApp) ApplicationTable 5-2 describes the Icon Subviews menu selections for this application. See Chapter 1, Introduction, for information on accessing subviews menus.
Detail View
This view provides color-coded pie charts that display IP routing statistics. Table 5-3, Table 5-4, and Table 5-5 define the statistics provided by the charts. Three buttons at the bottom of each chart select the way in which the data is represented (Total, Delta, Accum).
Refer to the Operator’s Reference for more information on pie charts.
Table 5-2. IP Routing Application Icon Subviews Menu Selections
Menu Selection Description
Detail Opens the Detail View summarized on Page 5-6.
IP Configuration Opens the IP Configuration View described on Page 5-7.
IP Routing Opens the IP Routing View described on Page 5-8.
IP Address Table Opens the IP Address Table View described on Page 5-9.
IP Fragmentation Opens the IP Fragmentation View described on Page 5-9.
IP Reassembly Opens the IP Reassembly View summarized on Page 5-10.
Model Information Opens the Model Information view described in the Operator’s Reference.
Table 5-3. IP Routing Detail Packet Breakdown
Statistic Definition
Delivered IP Routing packets delivered to a higher level protocol.
Forward IP Routing packets forwarded.
Transmitted IP Routing packets transmitted.
Errors IP Routing packets received containing errors.
Discards IP Routing packets discarded.
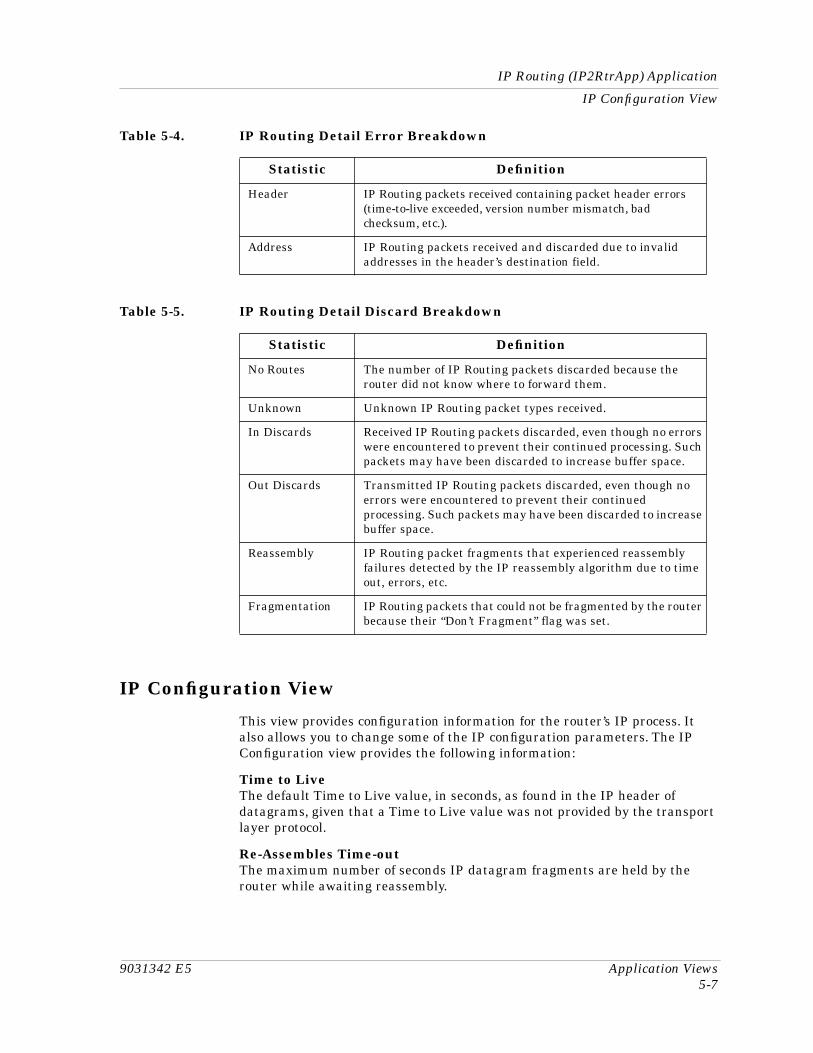
9031342 E5 Application Views5-7
IP Routing (IP2RtrApp) Application
IP Configuration View
IP Configuration View
This view provides configuration information for the router’s IP process. It also allows you to change some of the IP configuration parameters. The IP Configuration view provides the following information:
Time to LiveThe default Time to Live value, in seconds, as found in the IP header of datagrams, given that a Time to Live value was not provided by the transport layer protocol.
Re-Assembles Time-outThe maximum number of seconds IP datagram fragments are held by the router while awaiting reassembly.
Table 5-4. IP Routing Detail Error Breakdown
Statistic Definition
Header IP Routing packets received containing packet header errors (time-to-live exceeded, version number mismatch, bad checksum, etc.).
Address IP Routing packets received and discarded due to invalid addresses in the header’s destination field.
Table 5-5. IP Routing Detail Discard Breakdown
Statistic Definition
No Routes The number of IP Routing packets discarded because the router did not know where to forward them.
Unknown Unknown IP Routing packet types received.
In Discards Received IP Routing packets discarded, even though no errors were encountered to prevent their continued processing. Such packets may have been discarded to increase buffer space.
Out Discards Transmitted IP Routing packets discarded, even though no errors were encountered to prevent their continued processing. Such packets may have been discarded to increase buffer space.
Reassembly IP Routing packet fragments that experienced reassembly failures detected by the IP reassembly algorithm due to time out, errors, etc.
Fragmentation IP Routing packets that could not be fragmented by the router because their “Don’t Fragment” flag was set.
IP Routing (IP2RtrApp) ApplicationIP Routing View
Application Views ForeRunner ATM Switch Modules5-8 Management Module Guide
IP ForwardingA read-only indicator displaying whether the router is operating as a gateway or a host.
IP Routing View
This view provides a table that describes each transmission route known by the router. Double-clicking any table entry opens a route-specific IP Routing table. The IP Routing view and the corresponding entry-specific tables provide the following information:
Destination AddrThe destination IP address of the route. An address 0.0.0.0 is a default route.
Next Hop AddrThe IP address of the next hop on the route.
InterfaceThe local interface through which the next hop on the route should be reached.
Route AgeThe number of seconds since the route was last updated or determined to be correct.
Primary MetricThe primary routing metric for the route. A metric is the value resulting from algorithmic computations of a variable such as path length, bandwidth, or load. If the primary metric is not used, set the value to -1.
Alt MetricThe alternative (secondary) routing metric for the route. If this metric is not used, set the value to -1. This field is only available from the route-specific IP Routing table.
Route MaskThe network mask (either a Class A, B, or C network).
Metric 5An alternate routing metric for a router, which is set to a value of -1 if not used.
Route InfoInformation regarding the routing protocol applicable to the route.
Routing TypeThe type of routing used by the device. Possible types are Direct, Indirect, Invalid, and Other. Direct routing follows a point-to-point hierarchical path, or tree structure, in searching for the destination host. Indirect routing transports packets through other networks (also termed group-to-group).
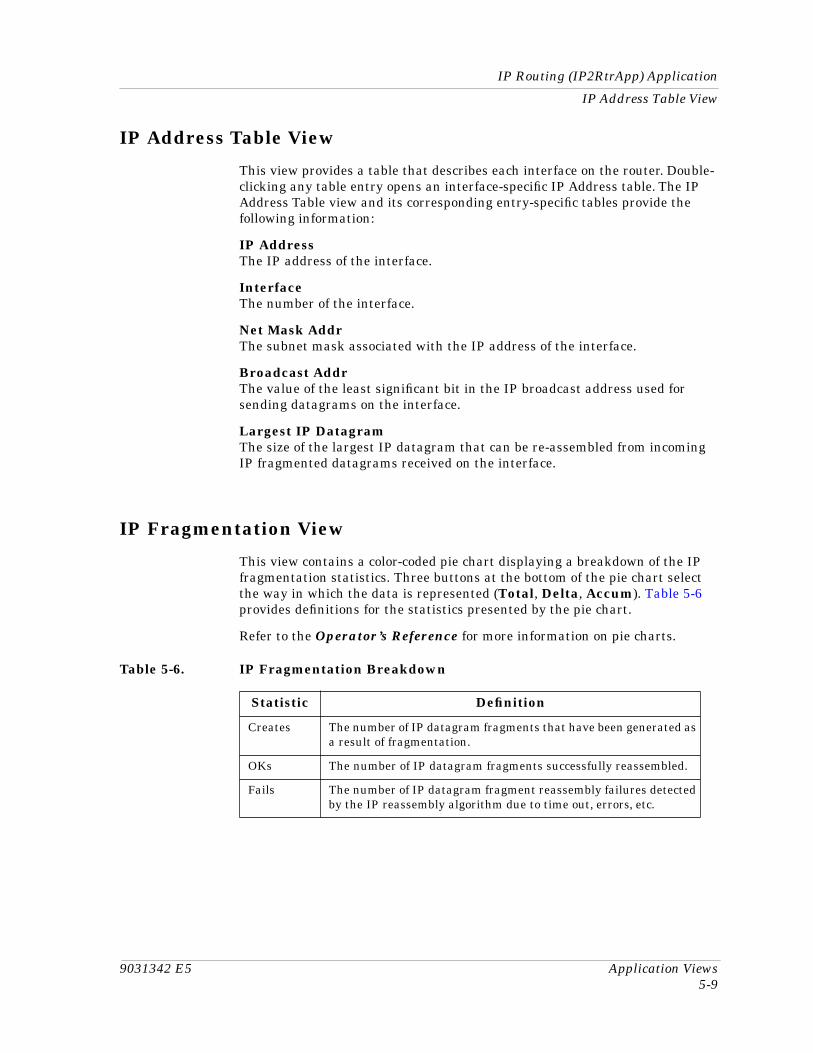
9031342 E5 Application Views5-9
IP Routing (IP2RtrApp) Application
IP Address Table View
IP Address Table View
This view provides a table that describes each interface on the router. Double-clicking any table entry opens an interface-specific IP Address table. The IP Address Table view and its corresponding entry-specific tables provide the following information:
IP AddressThe IP address of the interface.
InterfaceThe number of the interface.
Net Mask AddrThe subnet mask associated with the IP address of the interface.
Broadcast AddrThe value of the least significant bit in the IP broadcast address used for sending datagrams on the interface.
Largest IP DatagramThe size of the largest IP datagram that can be re-assembled from incoming IP fragmented datagrams received on the interface.
IP Fragmentation View
This view contains a color-coded pie chart displaying a breakdown of the IP fragmentation statistics. Three buttons at the bottom of the pie chart select the way in which the data is represented (Total, Delta, Accum). Table 5-6 provides definitions for the statistics presented by the pie chart.
Refer to the Operator’s Reference for more information on pie charts.
Table 5-6. IP Fragmentation Breakdown
Statistic Definition
Creates The number of IP datagram fragments that have been generated as a result of fragmentation.
OKs The number of IP datagram fragments successfully reassembled.
Fails The number of IP datagram fragment reassembly failures detected by the IP reassembly algorithm due to time out, errors, etc.
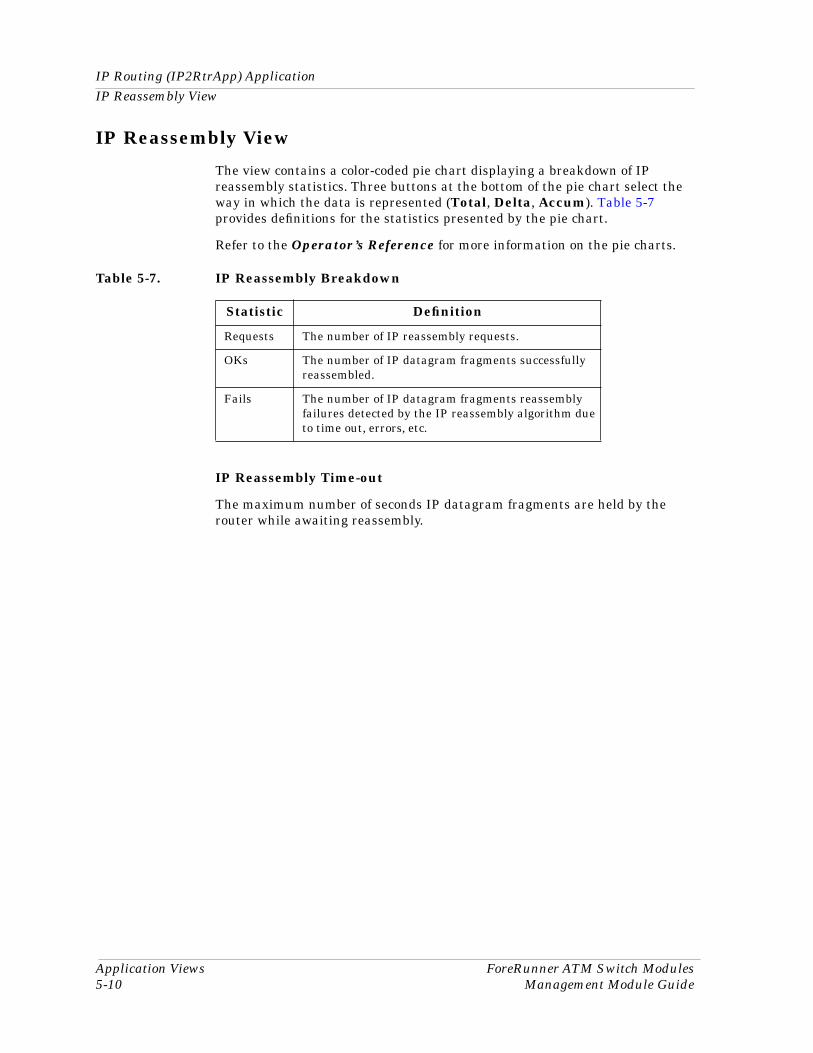
IP Routing (IP2RtrApp) ApplicationIP Reassembly View
Application Views ForeRunner ATM Switch Modules5-10 Management Module Guide
IP Reassembly View
The view contains a color-coded pie chart displaying a breakdown of IP reassembly statistics. Three buttons at the bottom of the pie chart select the way in which the data is represented (Total, Delta, Accum). Table 5-7 provides definitions for the statistics presented by the pie chart.
Refer to the Operator’s Reference for more information on the pie charts.
IP Reassembly Time-out
The maximum number of seconds IP datagram fragments are held by the router while awaiting reassembly.
Table 5-7. IP Reassembly Breakdown
Statistic Definition
Requests The number of IP reassembly requests.
OKs The number of IP datagram fragments successfully reassembled.
Fails The number of IP datagram fragments reassembly failures detected by the IP reassembly algorithm due to time out, errors, etc.
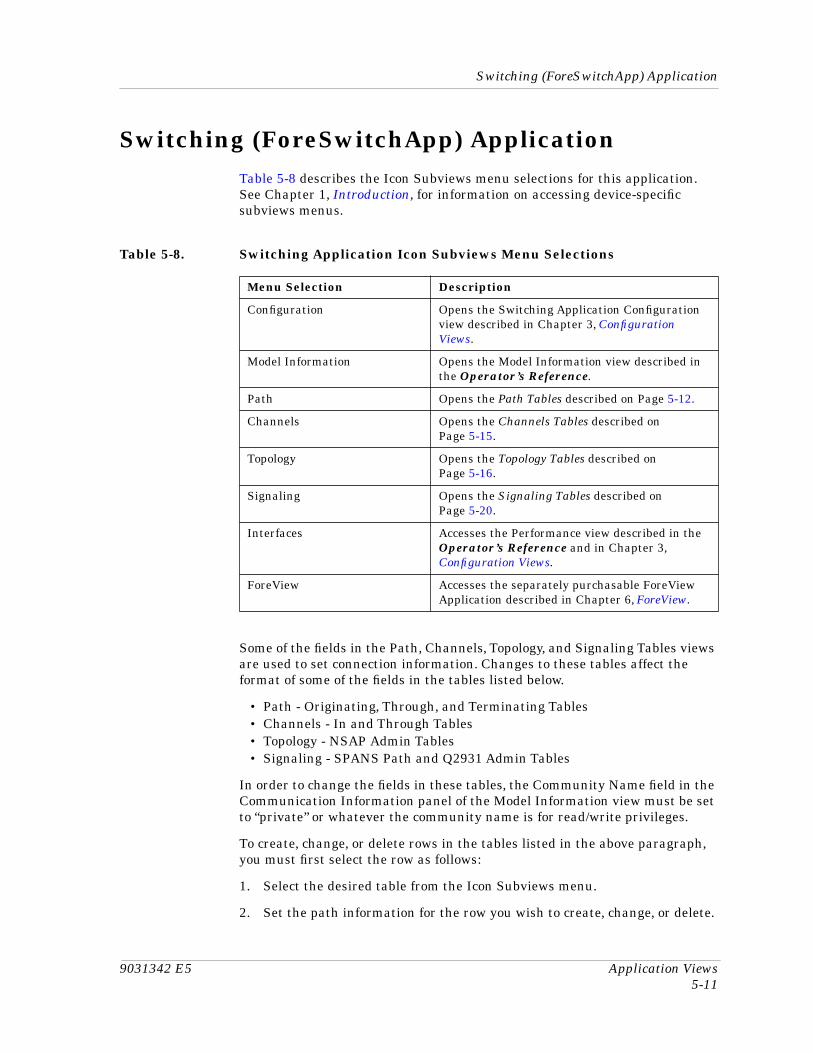
9031342 E5 Application Views5-11
Switching (ForeSwitchApp) Application
Switching (ForeSwitchApp) ApplicationTable 5-8 describes the Icon Subviews menu selections for this application. See Chapter 1, Introduction, for information on accessing device-specific subviews menus.
Some of the fields in the Path, Channels, Topology, and Signaling Tables views are used to set connection information. Changes to these tables affect the format of some of the fields in the tables listed below.
• Path - Originating, Through, and Terminating Tables• Channels - In and Through Tables• Topology - NSAP Admin Tables• Signaling - SPANS Path and Q2931 Admin Tables
In order to change the fields in these tables, the Community Name field in the Communication Information panel of the Model Information view must be set to “private” or whatever the community name is for read/write privileges.
To create, change, or delete rows in the tables listed in the above paragraph, you must first select the row as follows:
1. Select the desired table from the Icon Subviews menu.
2. Set the path information for the row you wish to create, change, or delete.
Table 5-8. Switching Application Icon Subviews Menu Selections
Menu Selection Description
Configuration Opens the Switching Application Configuration view described in Chapter 3, Configuration Views.
Model Information Opens the Model Information view described in the Operator’s Reference.
Path Opens the Path Tables described on Page 5-12.
Channels Opens the Channels Tables described on Page 5-15.
Topology Opens the Topology Tables described on Page 5-16.
Signaling Opens the Signaling Tables described on Page 5-20.
Interfaces Accesses the Performance view described in the Operator’s Reference and in Chapter 3, Configuration Views.
ForeView Accesses the separately purchasable ForeView Application described in Chapter 6, ForeView.
Switching (ForeSwitchApp) ApplicationPath Tables
Application Views ForeRunner ATM Switch Modules5-12 Management Module Guide
3. Click Enter and then OK.
To create or change the row after selecting it, do the following:
1. Click Create.
2. Change the applicable fields in the change view.
3. Click the right mouse button and select OK.
4. Click Validate Row and click the right mouse button to return to the table view and see the change.
To remove the row after selecting it, do the following:
1. Click Remove.
2. Click Update. The row will be removed from the table view.
Path Tables
These tables contain Path information about the virtual paths originating from, terminating at, or passing through the device. The following tables are available:
• Originating Path Table
• Terminating Path Table
• Through Path Table
Originating Path Table
This table shows originating path status information and allows you to create and remove paths. Follow the procedure shown at the bottom of the table to create and remove paths. This table contains the following fields:
PortThe input port of this path.
VPI (Virtual Path Identifier)The input VPI of this path.
StatusThe status of this path entry.
Chan. Max The maximum number of virtual channels that can be allocated on this path.
Chan. Alloc.The number of virtual channels currently allocated on this path.
9031342 E5 Application Views5-13
Switching (ForeSwitchApp) Application
Path Tables
Band. MaxThe maximum bandwidth of this path, in cells per second.
Band. Alloc.The allocated bandwidth of this path, in cells per second.
Band. UsedThe bandwidth used on this path, in cells per second.
UptimeThe time since this path was created.
CellsThe number of cells transferred over this path.
ProtocolThe signaling protocol that created this path.
Terminating Path Table
This table shows terminating path status information and allows you to create and remove paths. Follow the procedure shown at the bottom of the table to create and remove paths. This table contains the following fields:
PortThe output port of this path.
VPIThe output VPI of this path.
StatusThe status of this path entry.
VCs (Virtual Channels)The VCs of this path.
Chan. Max The maximum number of virtual channels that can be allocated on this path.
Chan. Alloc.The number of channels currently allocated on this path.
Band. MaxThe maximum bandwidth of this path, in cells per second.
Band. Alloc.The allocated bandwidth of this path, in cells per second.
Band. UsedThe bandwidth used on this path, in cells per second.
UptimeThe time since this path was created, in hundredths of a second.
Switching (ForeSwitchApp) ApplicationPath Tables
Application Views ForeRunner ATM Switch Modules5-14 Management Module Guide
CellsThe number of cells transferred over this path.
ProtocolThe signaling protocol that created this path.
Through Path Table
This table shows through path status information and allows you to create and remove paths. Follow the procedure shown at the bottom of the table to create and remove paths.This table contains the following fields:
In PortThe input port of this path.
In VPIThe input VPI of this path.
Out PortThe output port of this path.
Out VPIThe output VPI of this path.
StatusThe status of this path entry.
Band. MaxThe maximum bandwidth of this path, in cells per second.
Band. Alloc.The allocated bandwidth of this path, in cells per second.
CellsThe number of cells transferred over this path.
UptimeThe time since this path was created, in hundredths of a second.
ProtocolThe signaling protocol that created this path.
9031342 E5 Application Views5-15
Switching (ForeSwitchApp) Application
Channels Tables
Channels Tables
These tables contain channel information about the virtual paths coming in or passing through the device. The following tables are available:
• In Channels Table• Through Channels Table
Input Channels Table
This table shows input path status information and allows you to create and remove paths. Follow the procedure shown at the bottom of the table to create and remove paths.This table contains the following fields:
PortThe input of this channel.
VPIThe input VPI of this channel.
VCI (Virtual Channel Identifier)The input VCI of this channel.
StatusThe status of this channel entry.
Ports RoutedThe number of output ports to which this channel is routed.
Band. Alloc.The allocated bandwidth on this channel, in cells per second.
Band. UsedThe bandwidth used on this channel, in cells per second.
UptimeThe time since this channel was created, in hundredths of a second.
ProtocolThe signaling protocol that created this path.
CellsThe number of cells transferred over this channel.
Rejected CellsThe number of cells discarded on this channel.
CDVThe Cell Delay Variation Tolerance specified in microseconds.
Switching (ForeSwitchApp) ApplicationTopology Tables
Application Views ForeRunner ATM Switch Modules5-16 Management Module Guide
Policing ActionThe action the device will take when there is a bandwidth violation on this channel.
Output Channels Table
This table shows output path status information and allows you to create and remove paths. Follow the procedure shown at the bottom of the table to create and remove paths.This table contains the following fields:
In PortThe input port of this path.
In VPIThe input VPI of this path.
In VCIThe input VCI of this channel.
Out PortThe output port of this path.
Out VPIThe output VPI of this path.
Out VCIThe output VCI of this channel.
StatusThe status of this path entry.
ProtocolThe signaling protocol that created this path.
Topology Tables
These tables contain information about the links, switch cluster, switch board links/topology, NSAP prefix, NSAP administration, and NSAP topology for the devices. The following tables are available:
• Links Table• Switch Cluster Table• Switch Board Links/Topology Table• NSAP Network Prefix Table• NSAP Admin Table• NSAP Topology Table
9031342 E5 Application Views5-17
Switching (ForeSwitchApp) Application
Topology Tables
Links Table
This table contains the following fields:
Number of LinksThe current number of Links known by this ATM switch.
SourceThe ATM address of the source switch of this link.
Destination The ATM address of the destination switch of this link.
CapacityThe free capacity of this link, in kilobits per second.
AgeThe age of this link information. The actual value has meaning only for comparing different links.
Switch Cluster Table
This table contains the following fields:
IndexThe index number of the switch board within the ATM switch cluster.
Max PathsThe maximum number of input VPIs on this switch board.
Max ChannelThe maximum number of input VCIs on this switch board.
ATM AddressThe address of this ATM switch board.
UptimeThe length of time this switch board has been up, in hundredths of a second.
CDV (Cell Delay Variation)The switch board CDV, specified in microseconds. This indicates the time window in which a cell may be received on a connection and be accepted.
Policing ActThe action the switch board will take in case of a bandwidth violation.
Switching (ForeSwitchApp) ApplicationTopology Tables
Application Views ForeRunner ATM Switch Modules5-18 Management Module Guide
Switch Board Links/Topology Table
This table contains the following fields:
IndexThe index of this switch board within the ATM switch cluster.
SourceThe ATM address of the source switch of this link.
Destination The ATM address of the destination switch of this link.
CapacityThe free capacity of this link, in kilobits per second.
AgeThe age of this link information. The actual value has meaning only for comparing different links.
Inter-Switch LinksThe number of inter-switch links for this ATM switch.
NSAP Network Prefix Table
This table contains the following fields:
PortThe port of this signaling path, which is the same as the NSAP port.
VPIThe VPI of this signaling path statistics entry.
NSAP PrefixThe network prefix used for ATM addresses that is in effect on the user side of the ATM UNI (User Network Interface) port.
StatusThe status of this Network Prefix entry. Setting this field to “invalid” causes this network to disappear.
NSAP Admin Table
This table contains the following fields:
AddressIdentifies the NSAP.
MaskIdentifies the mask that is used for this NSAP.
9031342 E5 Application Views5-19
Switching (ForeSwitchApp) Application
Topology Tables
PortIdentifies the port that this NSAP can be reached on.
VPIIdentifies the path that this NSAP can be reached on.
StateIdentifies the state of this NSAP: (1) in use, (2) idle.
StatusThe status of this NSAP address. Setting this object to invalid causes this NSAP address to disappear.
NSAP Topology Table
This table contains the following fields:
BoardThe switch board within the ATM switch cluster.
SourceIdentifies the source NSAP address of this link.
Source MaskIdentifies the mask that is used for the link source NSAP address.
Source PortIdentifies the port that is used for the link source NSAP address.
Destination Identifies the destination NSAP address of this link.
Dest. MaskIdentifies the mask that is used for the link destination NSAP address.
Dest. PortIdentifies the port that is used for the link destination NSAP address.
CostThe routing metric for this link.
CBR (Constant Bit Rate) CapacityThe available capacity for additional CBR connections, in kilobits per second.
CBR FIFO (First In First Out)The size of the FIFO queue that is used for transmitting CBR traffic, in cells.
VBR (Variable Bit Rate) CapacityThe available capacity for additional VBR connections, in kilobits per second.
VBR FIFOThe size of the FIFO queue that is used for transmitting VBR traffic, in cells.
Switching (ForeSwitchApp) ApplicationSignaling Tables
Application Views ForeRunner ATM Switch Modules5-20 Management Module Guide
Link SourceThe source of this route information.
CapabilitiesThe bitmap indication of the capabilities of this link.
UBR (Unspecified Bit Rate) VCsThe number of active UBR VCs over this link.
FreshnessThe freshness (or staleness) of this NSAP link.
Signaling Tables
The following signaling information tables are provided:
• SPANS Path Table• SPANS Status Table• SPANS Smart PVCs Source Table• SPANS Smart PVCs Destination Table• Q2931 Admin Table• Q2931 Statistics Table
SPANS Path Table
This table contains the following fields:
PortThe port of this signaling path.
VPIThe VPI of this signaling path.
VCIThe VCI of the signaling channel within the signaling path.
Connectionless VCIThe VCI of the connectionless channel within the signaling path.
Admin StatusThe desired state of this signaling channel.
Operational The current operational state of this signaling channel.
StatusThe status of this signaling path entry.
9031342 E5 Application Views5-21
Switching (ForeSwitchApp) Application
Signaling Tables
AAL (ATM Adaptation Layer) TypeThe AAL type that is used by this Q2931 signaling path.
CDV (Cell Delay Variation)The switch board CDV, specified in microseconds. This indicates the time window in which a cell may be received on a connection and be accepted. A cell that is received on a connections outside the CDV window will be tagged or dropped as indicated by the board Policing Action.
Policing ActionThe Policing Action indicates the action the switch board will take in case of a bandwidth violation.
Remote ATMThe ATM address of the entity connected to this port.
Remote IPThe IP address of the entity connected to this port.
TypeThe type of the signaling path connection. UNI (User Network Interface) means that there is a workstation on the remote side. NNI (Network Network Interface) means there is another switch that communicates using SPANS on the remote side.
SPANS Status Table
This table contains the following fields:
PortThe port of this signaling path.
VPIThe VPI of this signaling path.
VCC (Virtual Channel Connections)The number of VCCs on this signaling path.
RestartsThe number of times the switch has lost and regained contact.
CompletionsThe number of completed calls for this signaling path.
FailuresThe number of call failures for this signaling path.
RejectionsThe number of rejections for this signaling path.
Transmitted MessagesThe number of transmitted messages over this signaling path.
Switching (ForeSwitchApp) ApplicationSignaling Tables
Application Views ForeRunner ATM Switch Modules5-22 Management Module Guide
Received MessagesThe number of received messages over this signaling path.
Connectionless TransmittedThe number of connectionless transmitted messages over this signaling path.
Connectionless ReceivedThe number of connectionless received messages over this signaling path.
SPANS Smart PVCs Source Table
This table contains the following fields:
IdThe identifier for the SPVC for which this switch is the source.
ATM AddressThe ATM address of this switch source.
Destination Id The identifier of the destination switch.
Destination The ATM address of the destination switch.
In PortThe input port of this SPVC.
In VPIThe input VPI of this SPVC.
In VCIThe input VCI of this SPVC.
Alloc BWThe allocated bandwidth of this SPVC.
UptimeThe time since this SPVC was created, in hundredths of a second.
StatusThe status of this SPVC.
Entry StatusThe status of this SPVC entry.
9031342 E5 Application Views5-23
Switching (ForeSwitchApp) Application
Signaling Tables
SPANS Smart PVCs Destination Table
This table contains the following fields:
IdThe SPVC identifier at the source switch.
ATM AddressThe ATM address of this switch.
Source Id The SPVC identifier at the source switch.
Source The ATM address of the source switch of this SPVC.
Out PortThe output port of this SPVC.
Out VPIThe output VPI of this SPVC.
Out VCIThe output VCI of this SPVC.
Alloc BWThe allocated bandwidth of this SPVC, in cells per second.
UptimeThe time since this SPVC was created, in hundredths of a second.
StatusThe status of this SPVC.
Entry StatusThe status of this SPVC entry.
Q2931 Admin Table
This table contains the following fields:
Port The port for this signaling path.
VPIThe VPI of this signaling path.
VCIThe VCI of this signaling channel within this signaling path.
Admin StatusThe desired state of this signaling channel.
Switching (ForeSwitchApp) ApplicationSignaling Tables
Application Views ForeRunner ATM Switch Modules5-24 Management Module Guide
Operational The current operational state of this signaling channel.
SSCOP Oper Stat The current operational state of the underlying SSCOP on this channel. SSCOP’s function is to provide a reliable data link layer for the exchange of Q2931 signaling messages.
ILMI Admin StatThe desired state of the underlying ILMI status and configuration channel.
ILMI Oper StatusThe current operational state of the underlying ILMI status and configuration channel.
AAL (ATM Adaptation Layer) TypeThe AAL type that is used by this Q2931 signaling path.
UNI SideDetermines the role this port takes in the UNI. If this port is connected to a host using the private UNI, it is on the network. If this port is connected to the public UNI, this port may be required to be the user.
Config TypeThe configuration of the UNI at initialization. Configuring the UNI to publicUNI means that this link will be used between the switch and a public switch. Configuring the UNI to auto means that the operational type will be determined dynamically. Configuring the UNI to phaseONNI indicates that this link is used for static routing.
Oper TypeThe operational configuration of the UNI. PublicUNI is used between the switch and a public switch. PrivateUNI is used between the switch and a host. PhaseONNI is used between two switches using static routing. PhaseSpansNNI is used between two switches using SPANS mapping messages for synamic routing. If the Q2931AdminConfigType is set to auto, the value of this object may be either privateUNI or phaseSpansNNI.
Remote IPThe IP address of the entity connected to this port.
Entry StatThe status of this path entry.
9031342 E5 Application Views5-25
Switching (ForeSwitchApp) Application
Signaling Tables
Q2931 Statistics Table
This table contains the following fields:
Port The port for this signaling path.
VPIThe VPI of this signaling path.
VCC (Virtual Channel Connections)The VCC of this signaling path.
RestartsThe number of times this switch has lost and regained contact with the remote signaling entity on this path.
Call CompletionsThe number of successful call completions for this signaling path.
Call FailuresThe number of call failures for this signaling path.
Call RejectionsThe number of connections on this path that were rejected by the far end.
Messages Trans.The number of transmitted messages over this signaling path.
Messages Rec.The number of received messages on this signaling path.
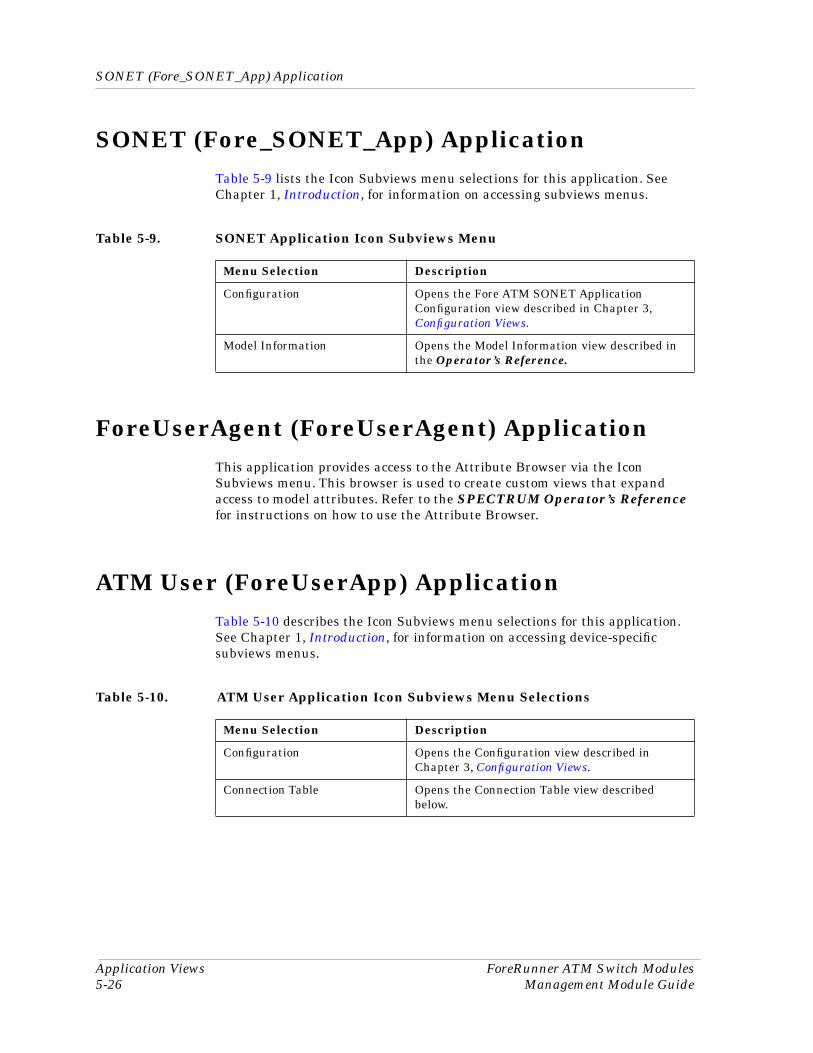
SONET (Fore_SONET_App) Application
Application Views ForeRunner ATM Switch Modules5-26 Management Module Guide
SONET (Fore_SONET_App) ApplicationTable 5-9 lists the Icon Subviews menu selections for this application. See Chapter 1, Introduction, for information on accessing subviews menus.
ForeUserAgent (ForeUserAgent) ApplicationThis application provides access to the Attribute Browser via the Icon Subviews menu. This browser is used to create custom views that expand access to model attributes. Refer to the SPECTRUM Operator’s Reference for instructions on how to use the Attribute Browser.
ATM User (ForeUserApp) ApplicationTable 5-10 describes the Icon Subviews menu selections for this application. See Chapter 1, Introduction, for information on accessing device-specific subviews menus.
Table 5-9. SONET Application Icon Subviews Menu
Menu Selection Description
Configuration Opens the Fore ATM SONET Application Configuration view described in Chapter 3, Configuration Views.
Model Information Opens the Model Information view described in the Operator’s Reference.
Table 5-10. ATM User Application Icon Subviews Menu Selections
Menu Selection Description
Configuration Opens the Configuration view described in Chapter 3, Configuration Views.
Connection Table Opens the Connection Table view described below.
9031342 E5 Application Views5-27
ATM User (ForeUserApp) Application
Connection Table
Connection Table
The Connection Table includes the following fields that describe the ATM User Applications connections.
Interface The ATM interface.
DirectionThe direction of the ATM connection.
VPIThe VPI for this connection.
VCIThe VCI for this connection.
Local SAPThe local SAP for this connection.
Remote SAPThe remote SAP for this connection.
Remote AddressThe ATM address of the remote end of this connection.
Peak BandwidthThe peak bandwidth for this connection, in kilobits per second.
Mean BandwidthThe mean bandwidth for this connection, in kilobits per second.
Mean BurstThe mean burst length for this connection, in kilobits.
UptimeThe length of time since this connection was created, in hundredths of a second.

ATM User (ForeUserApp) ApplicationConnection Table
Application Views ForeRunner ATM Switch Modules5-28 Management Module Guide
9031342 E56-1
Chapter 6
ForeView
ForeView is a separately purchasable management module that provides a graphical interface to a suite of tools that help you configure, control, monitor, and troubleshoot ATM networks. ForeView provides a physical device view that uses hot spots to retrieve device information and configure device operation. Its virtual path/channel tool sets virtual paths, virtual channels, and smart PVCs. Its circuit trace tool identifies all the devices and ports used for a specific ATM circuit. The network map tool discovers and maps the location of the devices in your ATM network.
ForeView must be installed on the SpectroGRAPH workstation. Install ForeView in the /usr/fore/foreview directory path or set the environment variable FOREVIEW_HOME to point to the appropriate path. If this has not been done, the Foreview Not Found error message will appear. Refer to the installation instructions provided with ForeView.
What Is in This ChapterThis chapter describes the views accessible from the ForeView menu within SPECTRUM and provides illustrations of those views. The illustrations are examples and may not represent your views exactly. To access the ForeView menu, highlight the Device or ForeSwitchApp icon and from the View menu select Icon Subviews -> ForeView.
This chapter is organized as follows:
• Physical View• Network Map View• Virtual Path/Channel Tool View• Channel/Path Tracer View
Click HELP in each view for information on using ForeView.
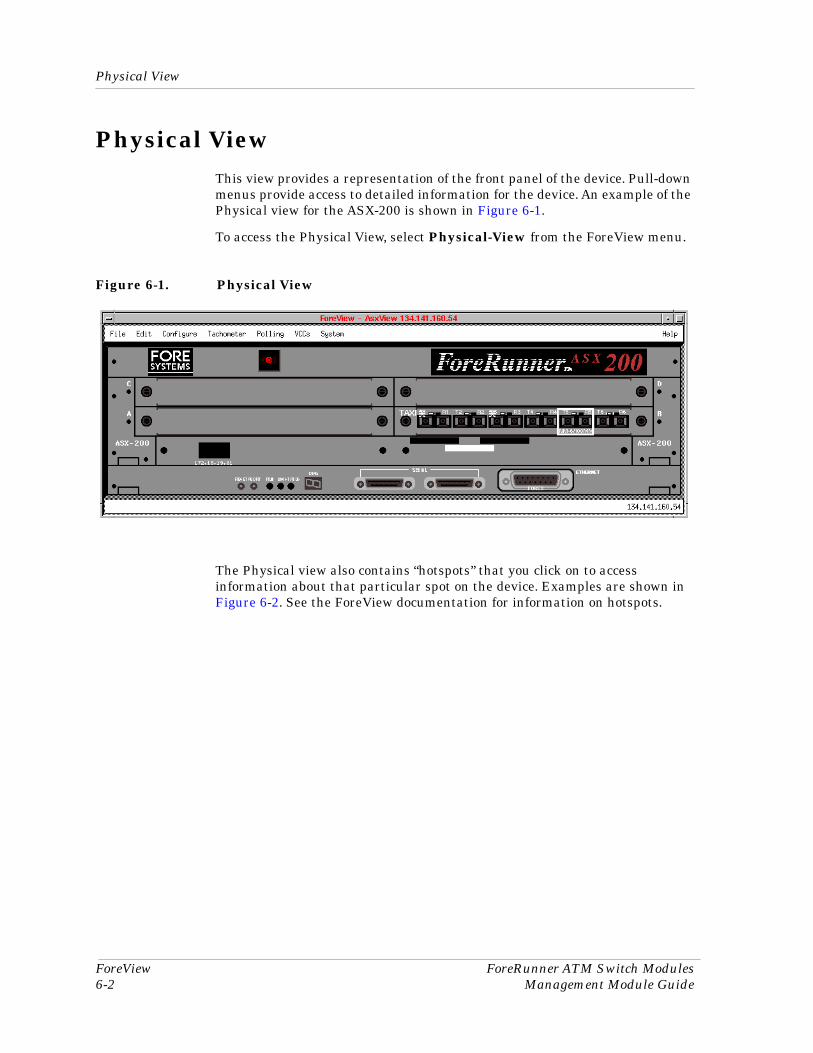
Physical View
ForeView ForeRunner ATM Switch Modules6-2 Management Module Guide
Physical ViewThis view provides a representation of the front panel of the device. Pull-down menus provide access to detailed information for the device. An example of the Physical view for the ASX-200 is shown in Figure 6-1.
To access the Physical View, select Physical-View from the ForeView menu.
Figure 6-1. Physical View
The Physical view also contains “hotspots” that you click on to access information about that particular spot on the device. Examples are shown in Figure 6-2. See the ForeView documentation for information on hotspots.
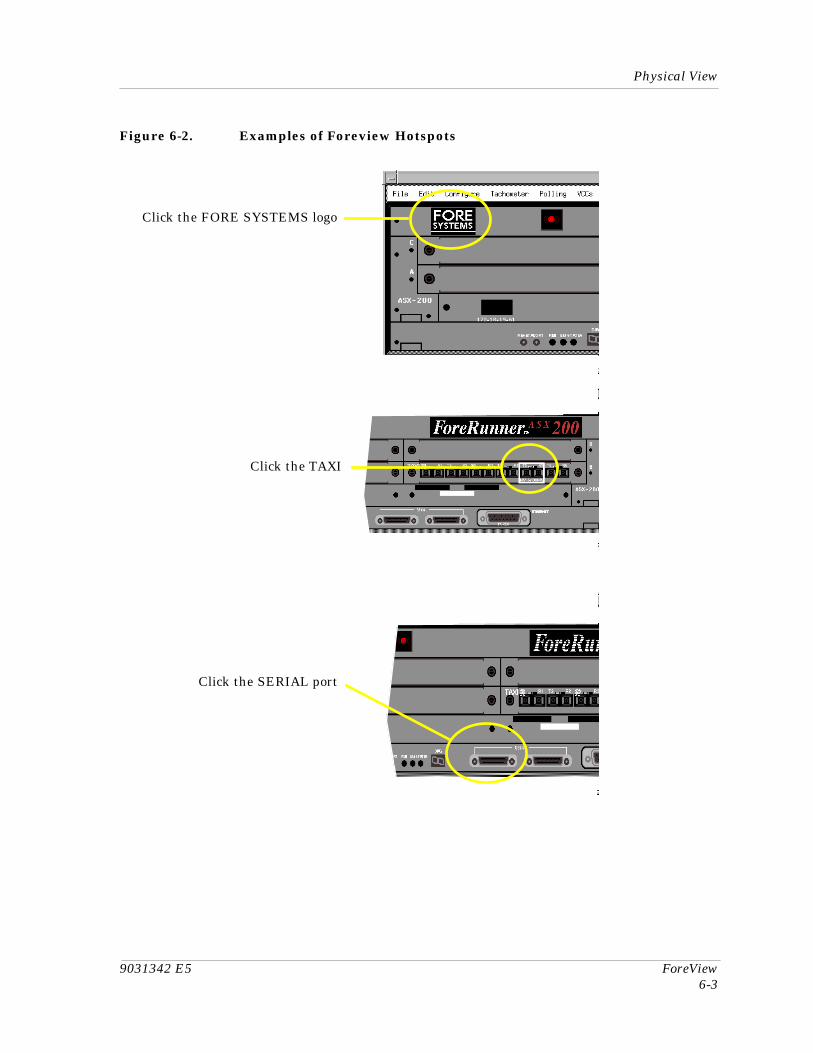
9031342 E5 ForeView6-3
Physical View
Figure 6-2. Examples of Foreview Hotspots
Click the FORE SYSTEMS logo
Click the TAXI
Click the SERIAL port
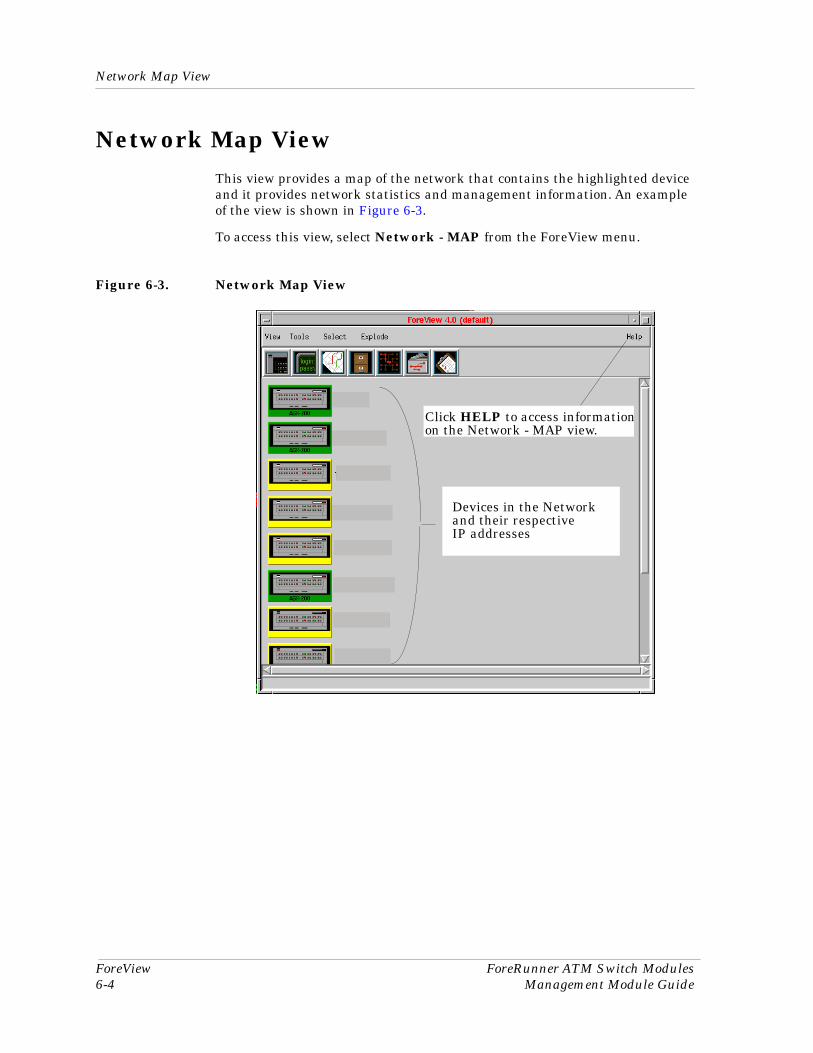
Network Map View
ForeView ForeRunner ATM Switch Modules6-4 Management Module Guide
Network Map ViewThis view provides a map of the network that contains the highlighted device and it provides network statistics and management information. An example of the view is shown in Figure 6-3.
To access this view, select Network - MAP from the ForeView menu.
Figure 6-3. Network Map View
Devices in the Network and their respectiveIP addresses
Click HELP to access information on the Network - MAP view.
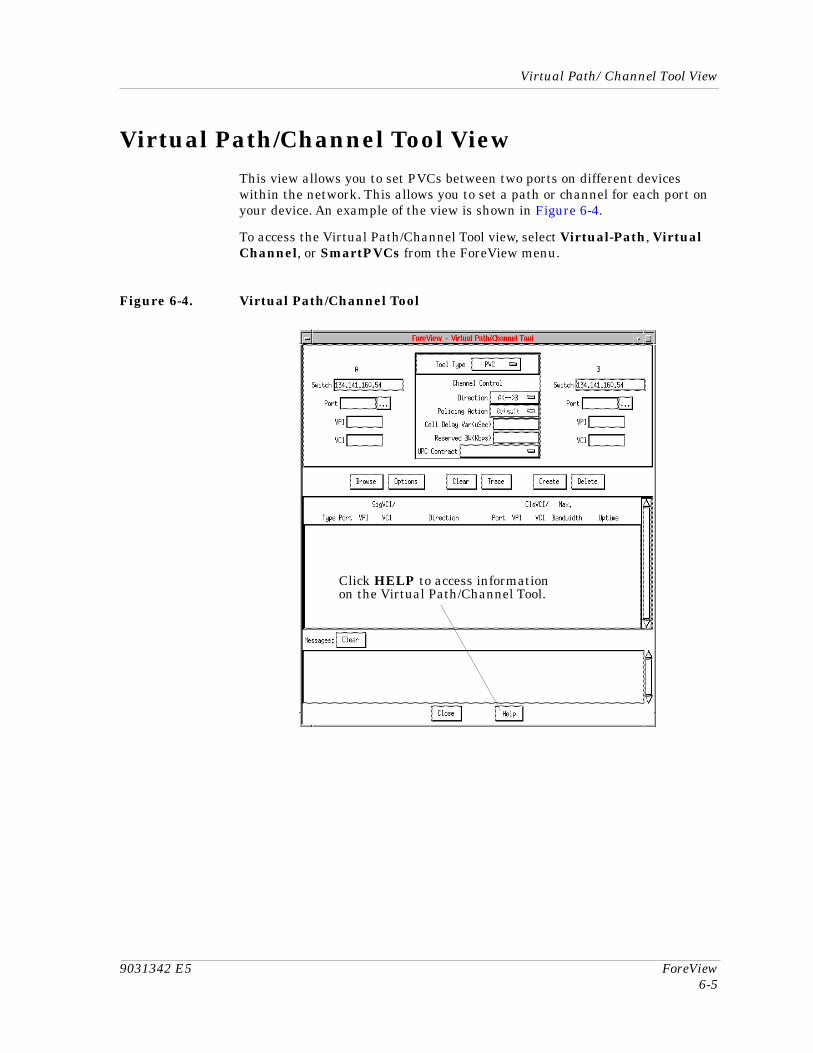
9031342 E5 ForeView6-5
Virtual Path/Channel Tool View
Virtual Path/Channel Tool ViewThis view allows you to set PVCs between two ports on different devices within the network. This allows you to set a path or channel for each port on your device. An example of the view is shown in Figure 6-4.
To access the Virtual Path/Channel Tool view, select Virtual-Path, Virtual Channel, or SmartPVCs from the ForeView menu.
Figure 6-4. Virtual Path/Channel Tool
Click HELP to access information on the Virtual Path/Channel Tool.
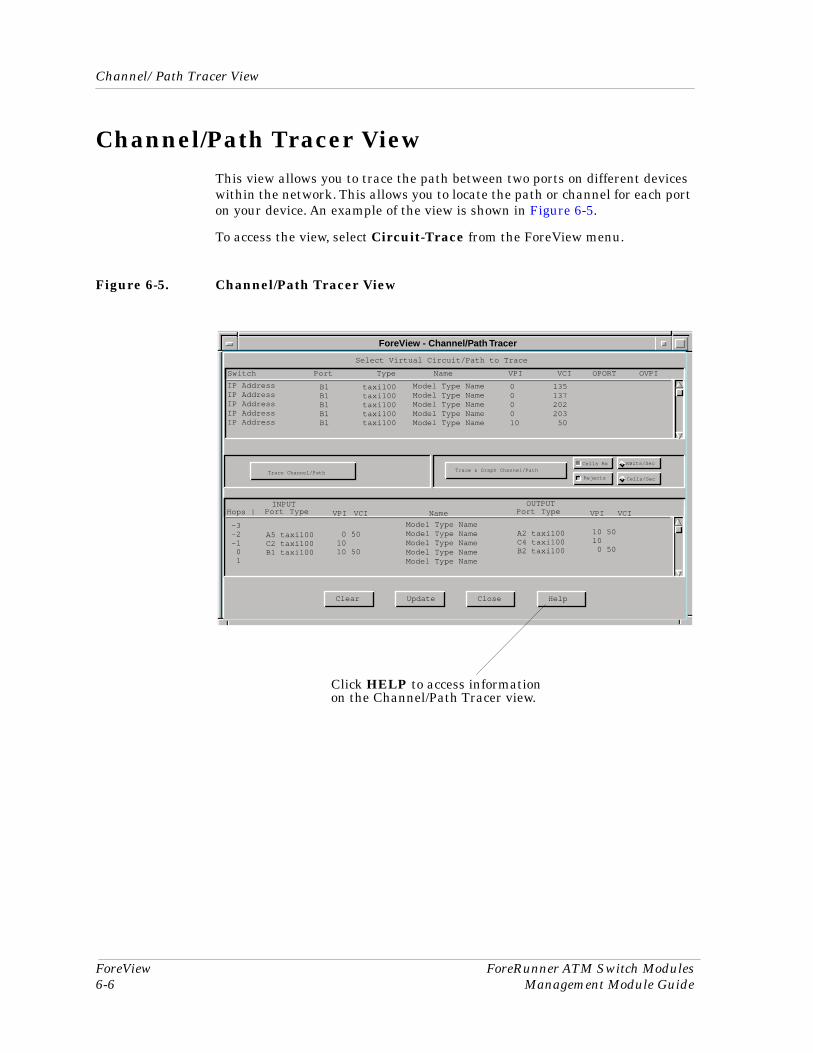
Channel/Path Tracer View
ForeView ForeRunner ATM Switch Modules6-6 Management Module Guide
Channel/Path Tracer ViewThis view allows you to trace the path between two ports on different devices within the network. This allows you to locate the path or channel for each port on your device. An example of the view is shown in Figure 6-5.
To access the view, select Circuit-Trace from the ForeView menu.
Figure 6-5. Channel/Path Tracer View
ForeView - Channel/Path Tracer
Select Virtual Circuit/Path to Trace
Switch Port Type Name VPI VCI OPORT OVPI
Hops | Port Type Name VPI VCI
Cells Rx
Rejects
KBits/Sec
Cells/Sec
Trace & Graph Channel/PathTrace Channel/Path
Clear Update Close Help
VPI VCI Port TypeOUTPUTINPUT
-3-2-1 0 1
Model Type NameModel Type NameModel Type NameModel Type NameModel Type Name
0 501010 50
10 5010 0 50
A5 taxi100C2 taxi100B1 taxi100
A2 taxi100C4 taxi100B2 taxi100
B1 taxi100B1 taxi100B1 taxi100
IP Address IP AddressIP AddressIP AddressIP Address
B1 taxi100B1 taxi100
Model Type NameModel Type NameModel Type NameModel Type NameModel Type Name
0 1350 1370 2020 20310 50
Click HELP to access information on the Channel/Path Tracer view.
9031342 E5A-1
Appendix A
Overview of Signaling Concepts
This appendix provides an overview of the concepts for setting up signaling. The specific type of signaling you establish depends on what equipment you have installed and the network communications you are using. Some of the types of signaling that can be set up are as follows:
• Classical IP• Classical IP with the workstation as the ARPSERVER• Classical IP with the switch as the ARPSERVER• Network Service Access Point (NSAP) in the Device• Permanent Virtual Circuit (PVC)• User Network Interface (UNI) Signaling• LAN Emulation with API• LAN Emulation with ForeView• IISP• SPANS
Refer to the FORE Systems, Inc., documentation delivered with your ForeRunner devices for specific procedures on setting up signaling.
You set up signaling for each workstation in your network to establish mappings that route ATM cells from a source to a destination. The routes are referred to as virtual channels and virtual paths. You can set the virtual channels and paths to create a Permanent Virtual Circuit (PVC) for dedicated long-term information transfer between two endpoints.
An ATM cell includes a five-byte header that contains a Virtual Path Identifier (VPI) and a Virtual Channel Identifier (VCI). These identifiers are used by the receiving device to determine the correct output port for the cell. The VPI and VCI may be set to a different value at the output to be received by the next device in the network (Figure A-1).
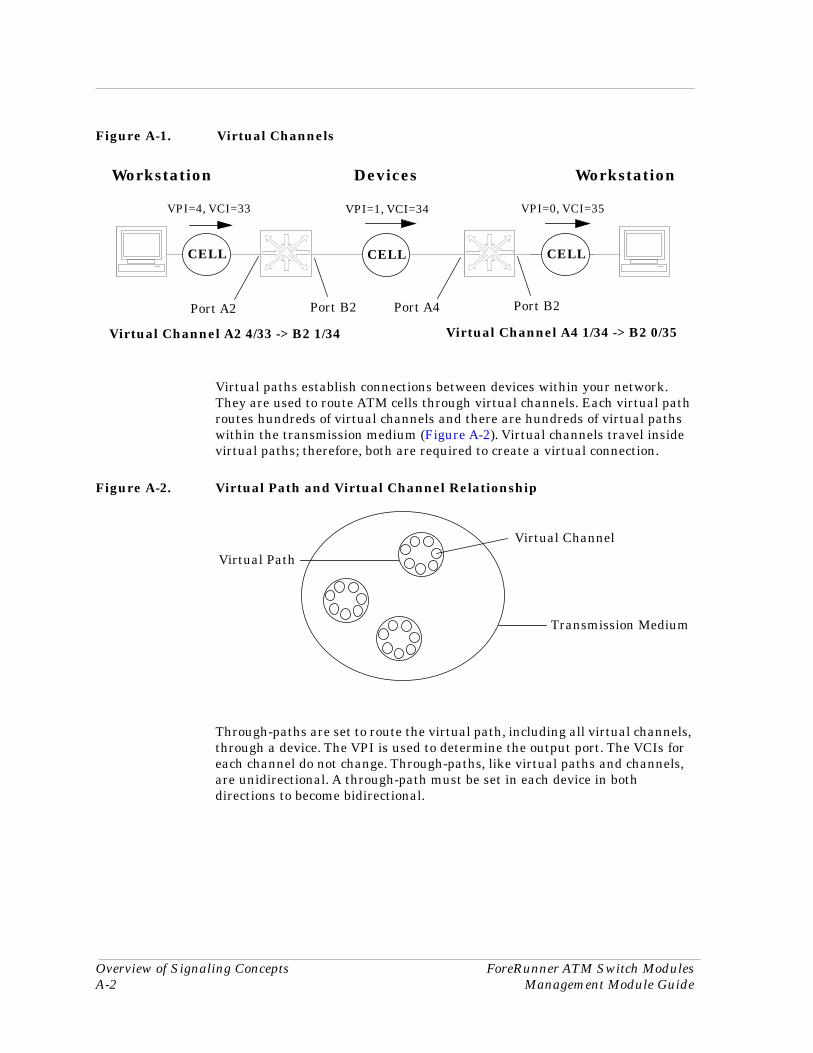
Overview of Signaling Concepts ForeRunner ATM Switch ModulesA-2 Management Module Guide
Figure A-1. Virtual Channels
Virtual paths establish connections between devices within your network. They are used to route ATM cells through virtual channels. Each virtual path routes hundreds of virtual channels and there are hundreds of virtual paths within the transmission medium (Figure A-2). Virtual channels travel inside virtual paths; therefore, both are required to create a virtual connection.
Figure A-2. Virtual Path and Virtual Channel Relationship
Through-paths are set to route the virtual path, including all virtual channels, through a device. The VPI is used to determine the output port. The VCIs for each channel do not change. Through-paths, like virtual paths and channels, are unidirectional. A through-path must be set in each device in both directions to become bidirectional.
WorkstationDevicesWorkstation
CELL
VPI=4, VCI=33
CELL
VPI=0, VCI=35
CELL
VPI=1, VCI=34
Port A2 Port B2
Virtual Channel A2 4/33 -> B2 1/34
Port A4 Port B2
Virtual Channel A4 1/34 -> B2 0/35
Virtual Channel
Virtual Path
Transmission Medium
9031342 E5B-1
Appendix B
Discovering Your ATM Network
What Is in This AppendixThis appendix describes how to discover and model a network that includes ATM switches, which involves the following steps:
1. Create a “seed switch” representing one of your ATM switches.
2. Run SPECTRUM AutoDiscovery to discover and model your network, including ATM switches.
3. Run ATM Discovery from the command line to complete the ATM switch discovery.
NOTES
1. This appendix describes how to create a seed switch and run SPECTRUM AutoDiscovery. Refer to ATM Switch Discovery Process (Cabletron part number 9032521) for instructions on running ATM Discovery.
2. It is recommended that you create device and network models automatically using SPECTRUM’s AutoDiscovery feature to ensure proper modeling of your network. (See AutoDiscovery User’s Guide for detailed instructions on modeling your network.) If you choose to model your network manually, refer to Appendix C, Manual Modeling.
3. Whether you discover your network manually or use SPECTRUM AutoDiscovery, you must begin by modeling an ATM device “seed switch” within the network. SPECTRUM uses the seed switch model as a starting point to identify the other devices within the network.
4. You should check the firmware version of each switch in your network prior to running SPECTRUM AutoDiscovery. SPECTRUM management of your ATM network is most reliable for switches with the latest firmware version.
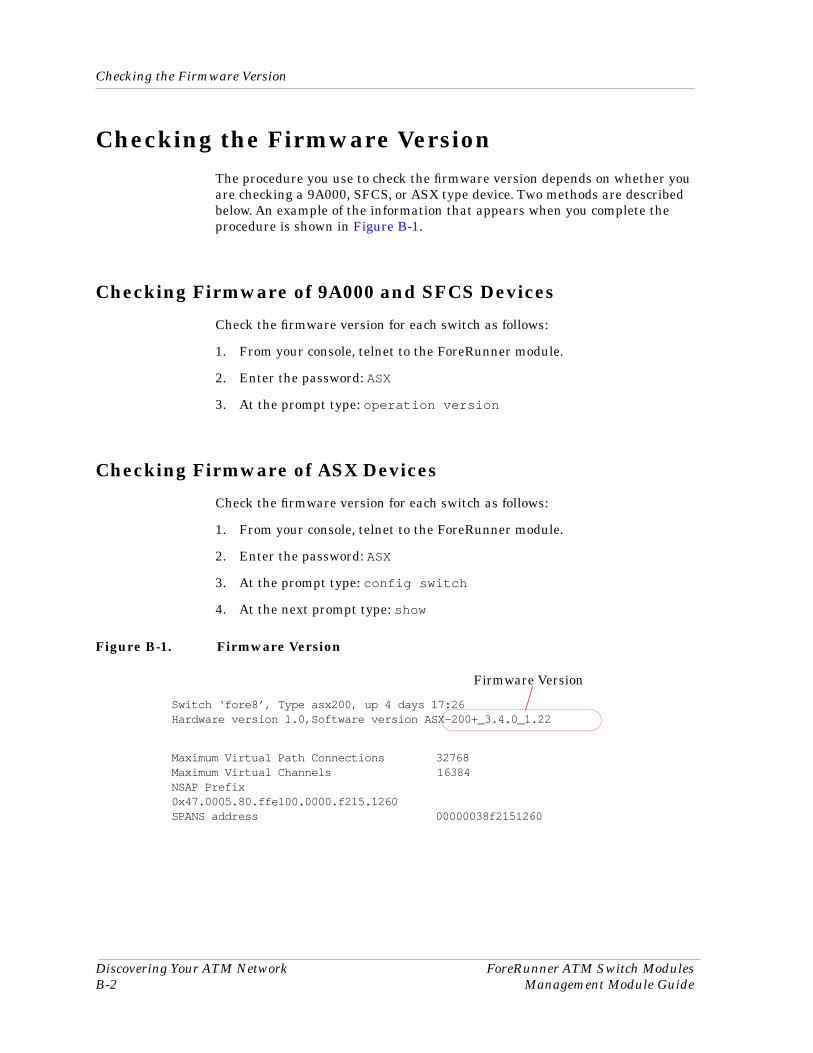
Checking the Firmware Version
Discovering Your ATM Network ForeRunner ATM Switch ModulesB-2 Management Module Guide
Checking the Firmware VersionThe procedure you use to check the firmware version depends on whether you are checking a 9A000, SFCS, or ASX type device. Two methods are described below. An example of the information that appears when you complete the procedure is shown in Figure B-1.
Checking Firmware of 9A000 and SFCS Devices
Check the firmware version for each switch as follows:
1. From your console, telnet to the ForeRunner module.
2. Enter the password: ASX
3. At the prompt type: operation version
Checking Firmware of ASX Devices
Check the firmware version for each switch as follows:
1. From your console, telnet to the ForeRunner module.
2. Enter the password: ASX
3. At the prompt type: config switch
4. At the next prompt type: show
Figure B-1. Firmware Version
Switch ‘fore8’, Type asx200, up 4 days 17:26Hardware version 1.0,Software version ASX-200+_3.4.0_1.22
Maximum Virtual Path Connections 32768Maximum Virtual Channels 16384NSAP Prefix0x47.0005.80.ffe100.0000.f215.1260SPANS address 00000038f2151260
Firmware Version
9031342 E5 Discovering Your ATM NetworkB-3
Modeling a Seed Switch
Modeling a Seed SwitchFollow these steps to create a device model to be used as a seed switch.
1. At the Universe level, select File -> Edit to enter the Edit mode.
2. Select Edit -> New Model. The Select Model Type dialog box displays.
3. Select ForeRunner from the Select Model Type dialog box and click OK. The Creation dialog box displays.
4. Fill in the Creation dialog box parameters as described below.
a. Model Name - Assign a unique name that identifies this switch.
b. Network Address - Enter the Internet Protocol (IP) address that has been assigned to the switch. The IP address may represent a LAN address or an ATM network address.
c. Security String - Assign the Security String of the device. Refer to the Administrator’s Reference for details on setting up security in SPECTRUM.
d. Polling Interval - Enter the time interval, in seconds, for polling any attributes that have been flagged as “POLLED.” The default value is 60 seconds.
e. Log Ratio - Enter the number of poll cycles that must be achieved before the SpectroSERVER writes any attributes that have been flagged as “LOGGED” to the statistical database. The default value is 10.
5. After filling in the above parameters, click OK. An icon representing the switch appears at the top of the window.
6. The icon can be moved to another area of the window by dragging it using the left mouse button while still in the Edit mode.
NOTE
For SPECTRUM to correctly discover and model an ATM network, the ForeRunner device must have two IP addresses: one for the Ethernet side of the switch and one for the ATM side. Either IP address can be used for the purpose of manually modeling the seed switch. See Appendix C, Manual Modeling, for instructions.
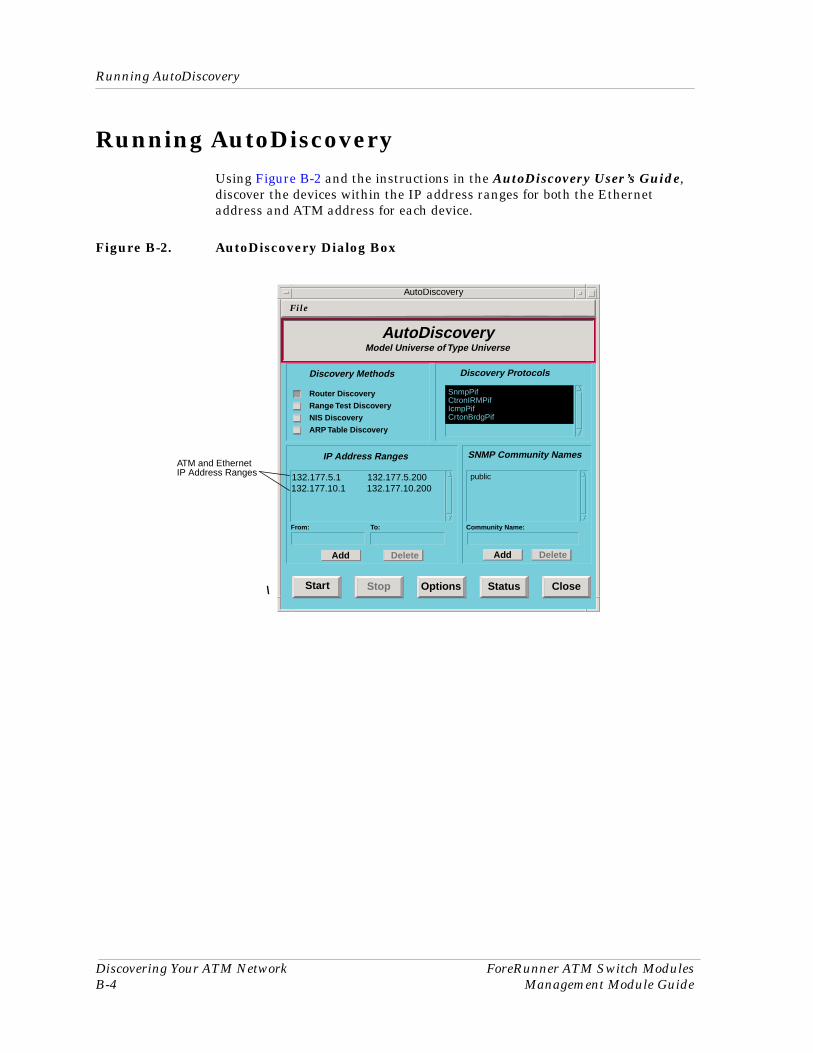
Running AutoDiscovery
Discovering Your ATM Network ForeRunner ATM Switch ModulesB-4 Management Module Guide
Running AutoDiscovery Using Figure B-2 and the instructions in the AutoDiscovery User’s Guide, discover the devices within the IP address ranges for both the Ethernet address and ATM address for each device.
Figure B-2. AutoDiscovery Dialog Box
AutoDiscovery
Add
Community Name:
File
Start
AutoDiscoveryModel Universe of Type Universe
Discovery Protocols
SNMP Community NamesIP Address Ranges
Router Discovery
Discovery Methods
Range Test Discovery
NIS Discovery
ARP Table Discovery
SnmpPifCtronIRMPifIcmpPifCrtonBrdgPif
public
From: To:
Delete Add Delete
Stop Options Status Close
AutoDiscoveryModel Universe of Type Universe
132.177.5.1 132.177.5.200132.177.10.1 132.177.10.200
ATM and EthernetIP Address Ranges
9031342 E5C-1
Appendix C
Manual Modeling
What Is in This AppendixThis appendix describes the procedures for modeling single and multiple devices and workstations. Modeling these devices involves creating a switch model at the Universe level, creating ATM and LAN or discrete LAN conceptual network models, and configuring application and link models within the conceptual network models.
This appendix includes the following topics:
• Read Me First• Modeling a Single Device and Workstation on Page C-2• Modeling Multiple Devices and Workstations on Page C-10
Read Me FirstIt is recommended that you model your network automatically using SPECTRUM’s AutoDiscovery feature to ensure the best modeling of your network. (See the AutoDiscovery User’s Guide for details on modeling your network.) Before modeling your network, you must model an ATM device “seed switch” within the network. SPECTRUM uses the seed switch as a starting point to identify the other devices within the ATM network. Refer to Appendix B, Discovering Your ATM Network, for information on creating a seed switch. Once you have discovered and modeled your network devices manually or using SPECTRUM AutoDiscovery, you must run ATM Discovery. Refer to ATM Switch Discovery Process for instructions on running ATM Discovery from the command line.
If you choose to model your network manually, use the procedures described in this appendix.
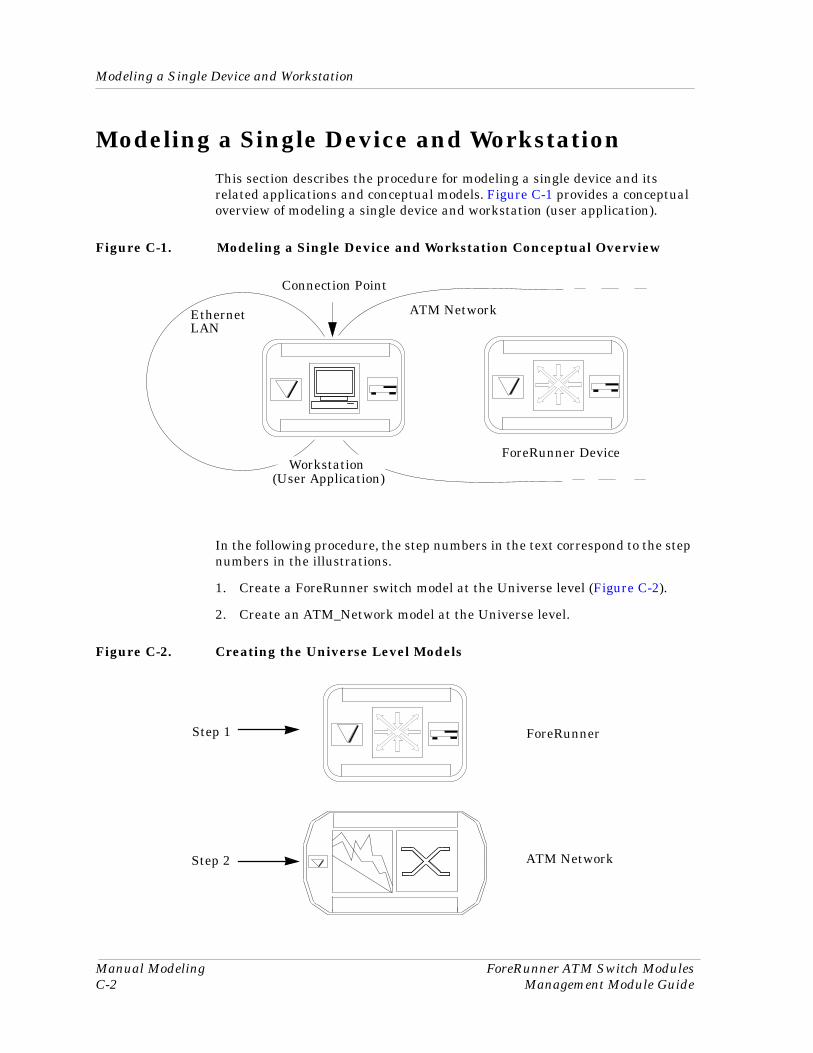
Modeling a Single Device and Workstation
Manual Modeling ForeRunner ATM Switch ModulesC-2 Management Module Guide
Modeling a Single Device and WorkstationThis section describes the procedure for modeling a single device and its related applications and conceptual models. Figure C-1 provides a conceptual overview of modeling a single device and workstation (user application).
Figure C-1. Modeling a Single Device and Workstation Conceptual Overview
In the following procedure, the step numbers in the text correspond to the step numbers in the illustrations.
1. Create a ForeRunner switch model at the Universe level (Figure C-2).
2. Create an ATM_Network model at the Universe level.
Figure C-2. Creating the Universe Level Models
ATM Network
ForeRunner Device
Ethernet
Workstation(User Application)
Connection Point
LAN
ATM Network
Step 1
Step 2
ForeRunner
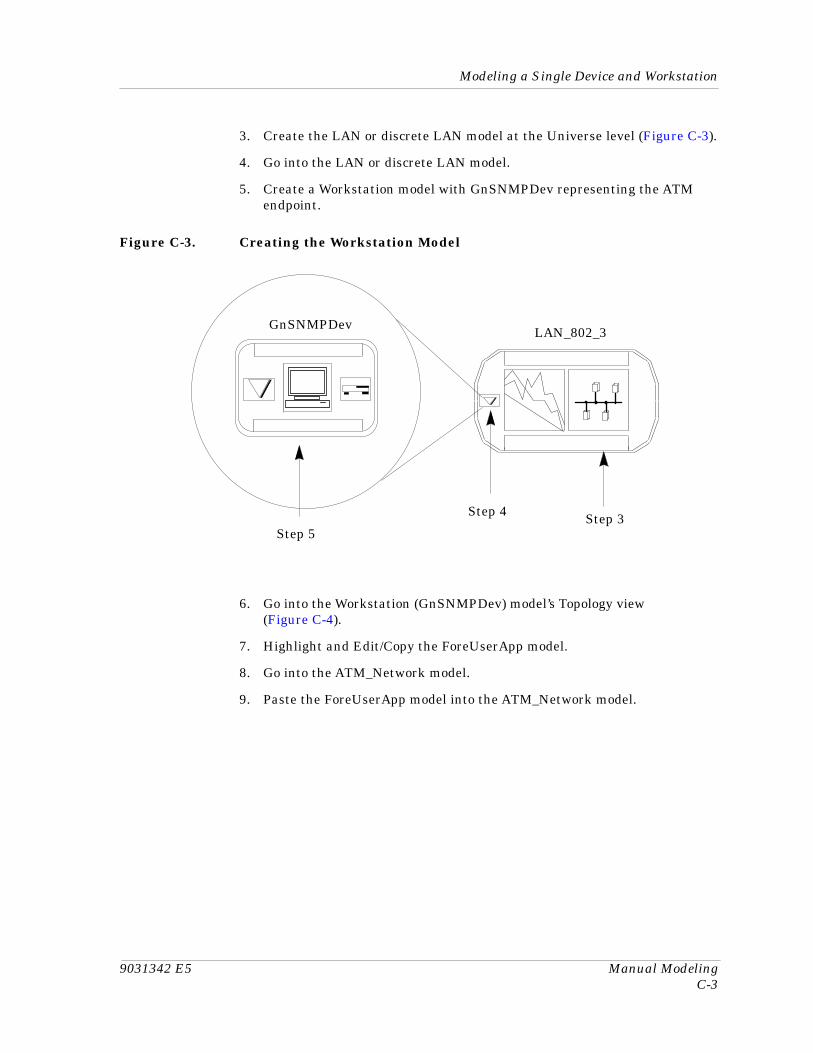
9031342 E5 Manual ModelingC-3
Modeling a Single Device and Workstation
3. Create the LAN or discrete LAN model at the Universe level (Figure C-3).
4. Go into the LAN or discrete LAN model.
5. Create a Workstation model with GnSNMPDev representing the ATM endpoint.
Figure C-3. Creating the Workstation Model
6. Go into the Workstation (GnSNMPDev) model’s Topology view (Figure C-4).
7. Highlight and Edit/Copy the ForeUserApp model.
8. Go into the ATM_Network model.
9. Paste the ForeUserApp model into the ATM_Network model.
LAN_802_3
Step 4
Step 5
GnSNMPDev
Step 3
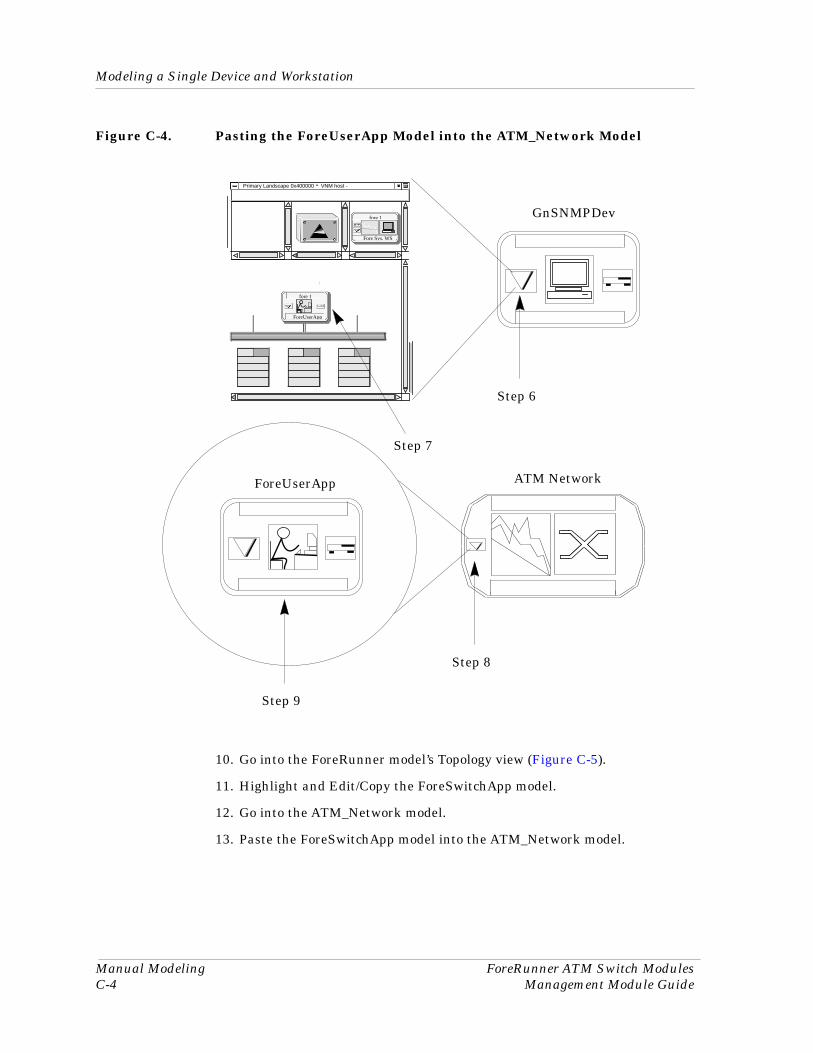
Modeling a Single Device and Workstation
Manual Modeling ForeRunner ATM Switch ModulesC-4 Management Module Guide
Figure C-4. Pasting the ForeUserApp Model into the ATM_Network Model
10. Go into the ForeRunner model’s Topology view (Figure C-5).
11. Highlight and Edit/Copy the ForeSwitchApp model.
12. Go into the ATM_Network model.
13. Paste the ForeSwitchApp model into the ATM_Network model.
Step 8
Step 9
Step 6
132.17
fore 1
Fore Sys. WS
fore 1
ForeUserApp
Primary Landscape 0x400000 - VNM host -
Step 7
GnSNMPDev
ATM NetworkForeUserApp
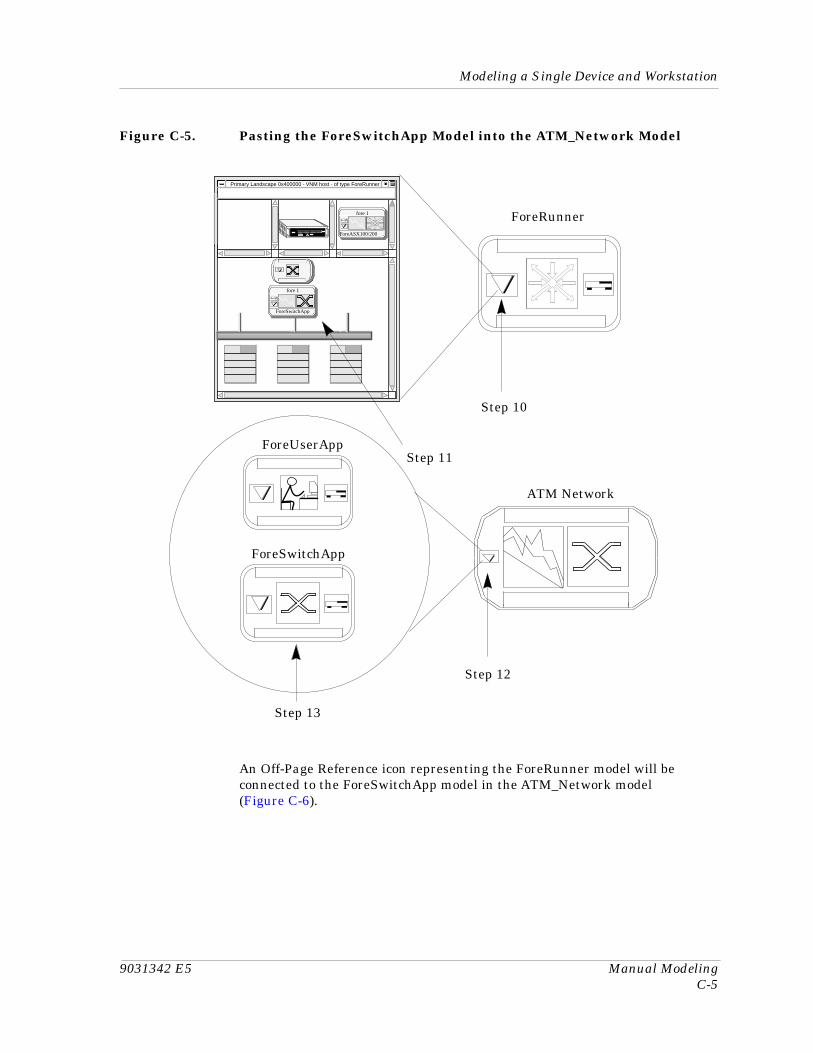
9031342 E5 Manual ModelingC-5
Modeling a Single Device and Workstation
Figure C-5. Pasting the ForeSwitchApp Model into the ATM_Network Model
An Off-Page Reference icon representing the ForeRunner model will be connected to the ForeSwitchApp model in the ATM_Network model (Figure C-6).
Step 12
Step 13
Step 11
ATM Network
ForeUserApp
132.17
Primary Landscape 0x400000 - VNM host - of type ForeRunner
fore 1
ForeSwitchApp
fore 1
ForeASX100/200
Step 10
ForeSwitchApp
ForeRunner
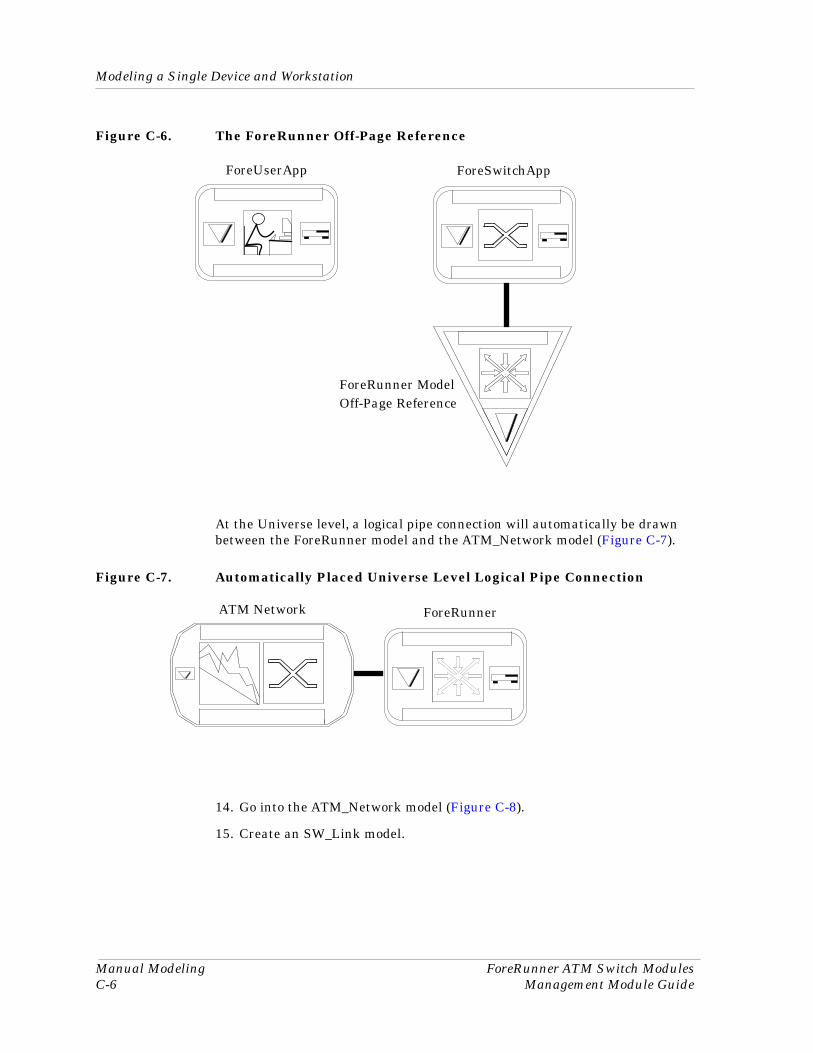
Modeling a Single Device and Workstation
Manual Modeling ForeRunner ATM Switch ModulesC-6 Management Module Guide
Figure C-6. The ForeRunner Off-Page Reference
At the Universe level, a logical pipe connection will automatically be drawn between the ForeRunner model and the ATM_Network model (Figure C-7).
Figure C-7. Automatically Placed Universe Level Logical Pipe Connection
14. Go into the ATM_Network model (Figure C-8).
15. Create an SW_Link model.
Off-Page ReferenceForeRunner Model
ForeSwitchAppForeUserApp
ATM Network ForeRunner
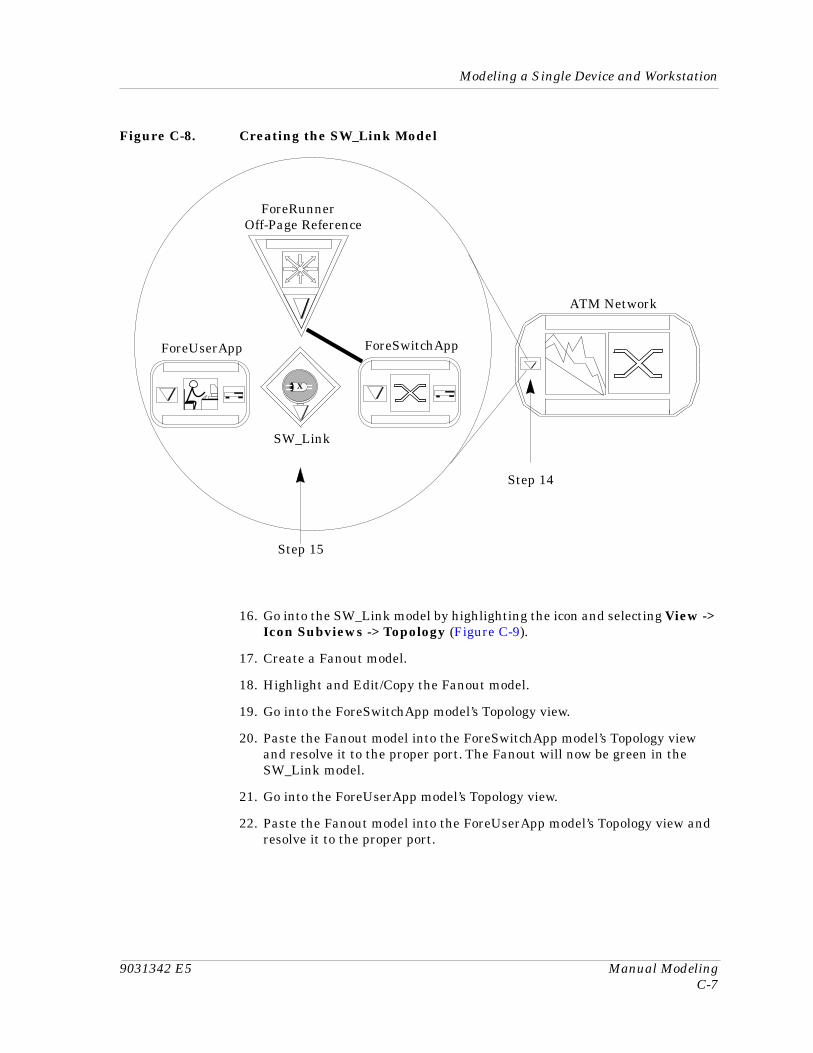
9031342 E5 Manual ModelingC-7
Modeling a Single Device and Workstation
Figure C-8. Creating the SW_Link Model
16. Go into the SW_Link model by highlighting the icon and selecting View -> Icon Subviews -> Topology (Figure C-9).
17. Create a Fanout model.
18. Highlight and Edit/Copy the Fanout model.
19. Go into the ForeSwitchApp model’s Topology view.
20. Paste the Fanout model into the ForeSwitchApp model’s Topology view and resolve it to the proper port. The Fanout will now be green in the SW_Link model.
21. Go into the ForeUserApp model’s Topology view.
22. Paste the Fanout model into the ForeUserApp model’s Topology view and resolve it to the proper port.
Step 14
Step 15
ATM Network
ForeUserApp ForeSwitchApp
X
Off-Page ReferenceForeRunner
SW_Link
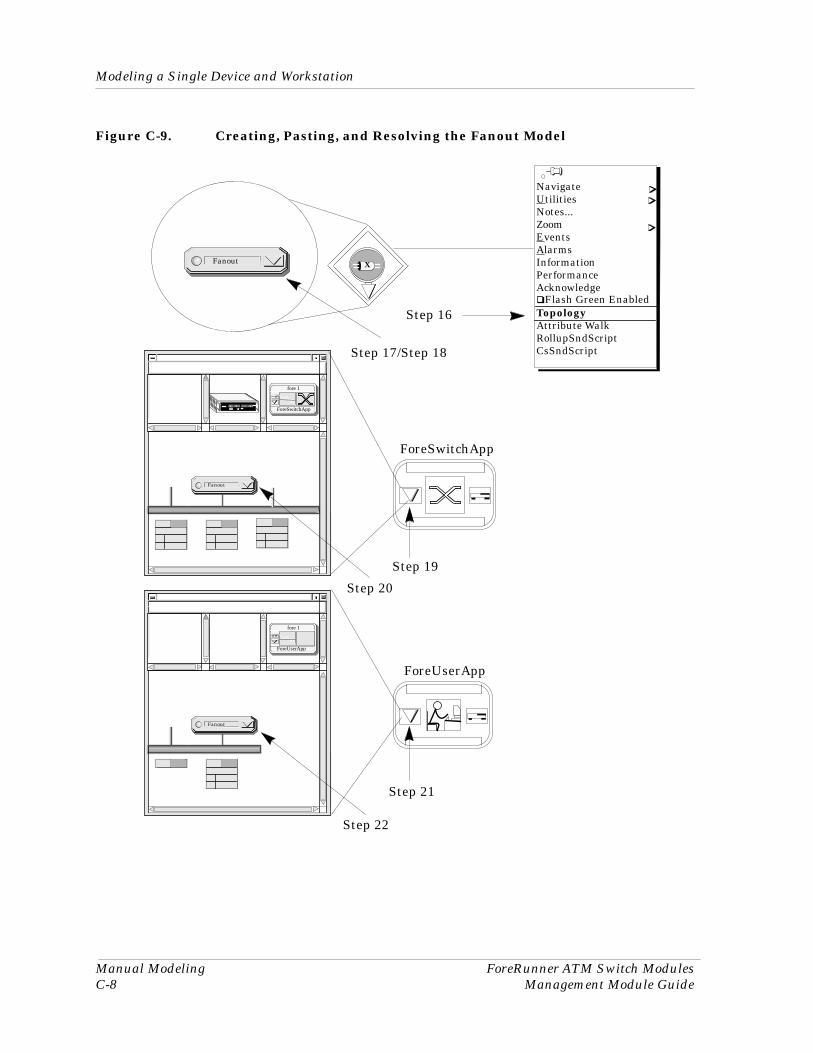
Modeling a Single Device and Workstation
Manual Modeling ForeRunner ATM Switch ModulesC-8 Management Module Guide
Figure C-9. Creating, Pasting, and Resolving the Fanout Model
132.17
Fanout
fore 1
ForeSwitchApp
132.17
Fanout
fore 1
ForeUserApp
ForeUserApp
ForeSwitchApp
Fanout X
Step 19
Step 21
Step 17/Step 18
Step 20
Step 22
NavigateUtilitiesNotes...ZoomEventsAlarmsInformationPerformanceAcknowledge
TopologyAttribute WalkRollupSndScriptCsSndScript
Flash Green EnabledStep 16
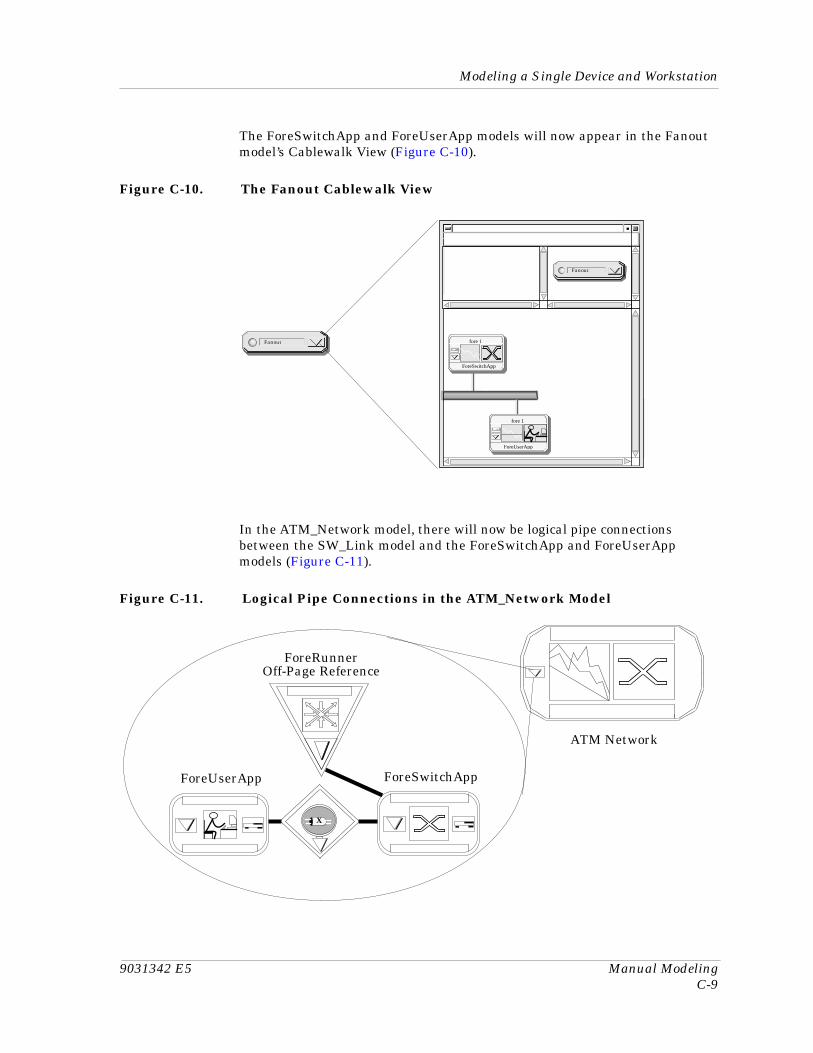
9031342 E5 Manual ModelingC-9
Modeling a Single Device and Workstation
The ForeSwitchApp and ForeUserApp models will now appear in the Fanout model’s Cablewalk View (Figure C-10).
Figure C-10. The Fanout Cablewalk View
In the ATM_Network model, there will now be logical pipe connections between the SW_Link model and the ForeSwitchApp and ForeUserApp models (Figure C-11).
Figure C-11. Logical Pipe Connections in the ATM_Network Model
132.17
Fanout
Fanout fore 1
ForeSwitchApp
fore 1
ForeUserApp
ATM Network
ForeSwitchApp
X
Off-Page ReferenceForeRunner
ForeUserApp
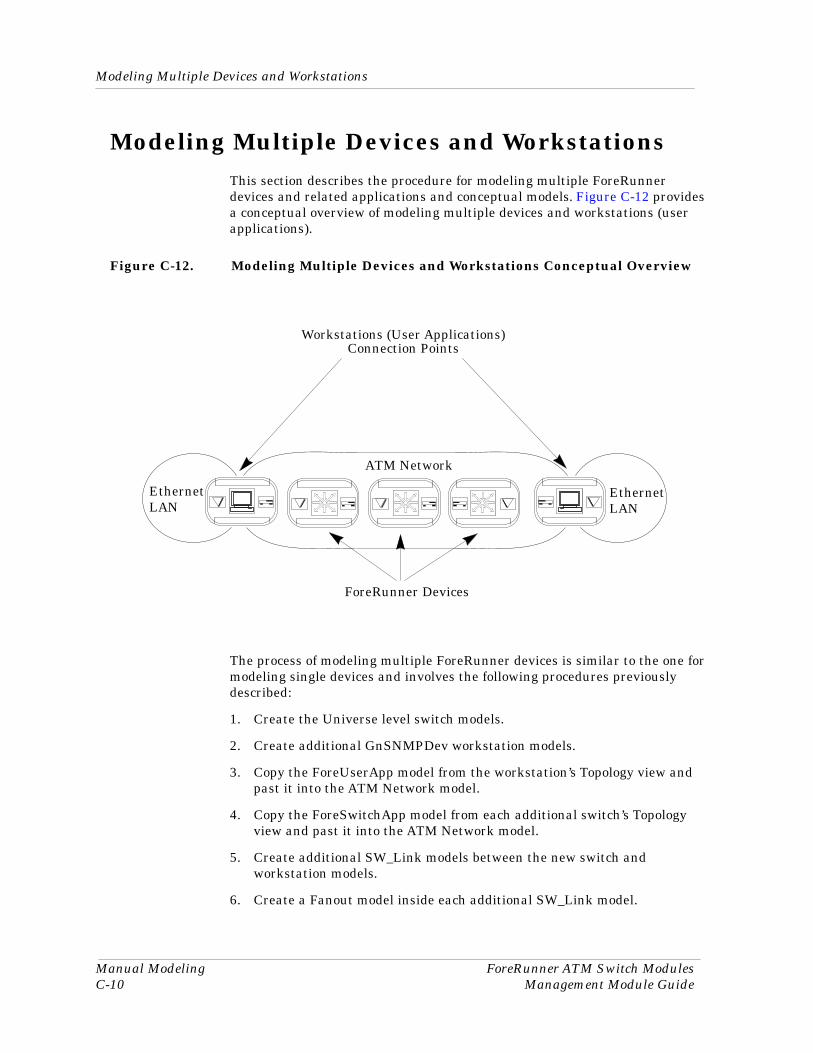
Modeling Multiple Devices and Workstations
Manual Modeling ForeRunner ATM Switch ModulesC-10 Management Module Guide
Modeling Multiple Devices and WorkstationsThis section describes the procedure for modeling multiple ForeRunner devices and related applications and conceptual models. Figure C-12 provides a conceptual overview of modeling multiple devices and workstations (user applications).
Figure C-12. Modeling Multiple Devices and Workstations Conceptual Overview
The process of modeling multiple ForeRunner devices is similar to the one for modeling single devices and involves the following procedures previously described:
1. Create the Universe level switch models.
2. Create additional GnSNMPDev workstation models.
3. Copy the ForeUserApp model from the workstation’s Topology view and past it into the ATM Network model.
4. Copy the ForeSwitchApp model from each additional switch’s Topology view and past it into the ATM Network model.
5. Create additional SW_Link models between the new switch and workstation models.
6. Create a Fanout model inside each additional SW_Link model.
ATM Network
ForeRunner Devices
Ethernet LAN
Ethernet LAN
Workstations (User Applications)Connection Points
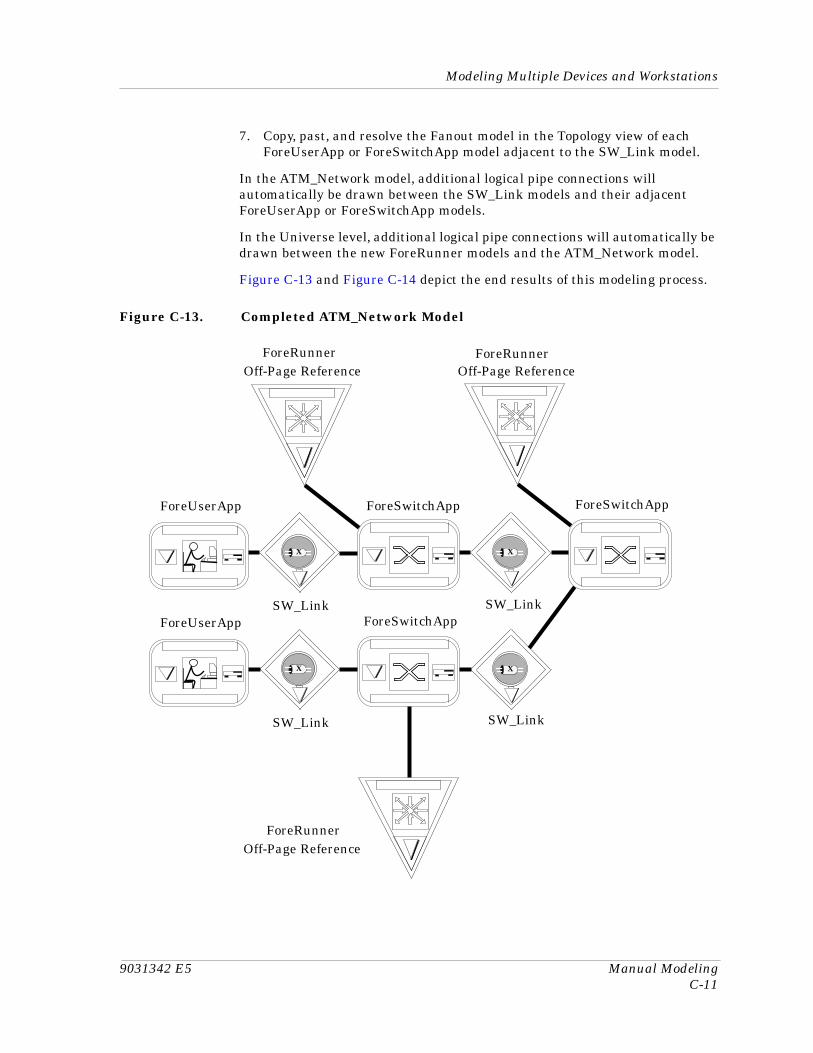
9031342 E5 Manual ModelingC-11
Modeling Multiple Devices and Workstations
7. Copy, past, and resolve the Fanout model in the Topology view of each ForeUserApp or ForeSwitchApp model adjacent to the SW_Link model.
In the ATM_Network model, additional logical pipe connections will automatically be drawn between the SW_Link models and their adjacent ForeUserApp or ForeSwitchApp models.
In the Universe level, additional logical pipe connections will automatically be drawn between the new ForeRunner models and the ATM_Network model.
Figure C-13 and Figure C-14 depict the end results of this modeling process.
Figure C-13. Completed ATM_Network Model
ForeSwitchApp
X
Off-Page ReferenceForeRunner
ForeUserApp
ForeSwitchApp
X
Off-Page ReferenceForeRunner
ForeUserApp
ForeSwitchApp
X
Off-Page Reference
X
SW_Link
SW_LinkSW_Link
SW_Link
ForeRunner
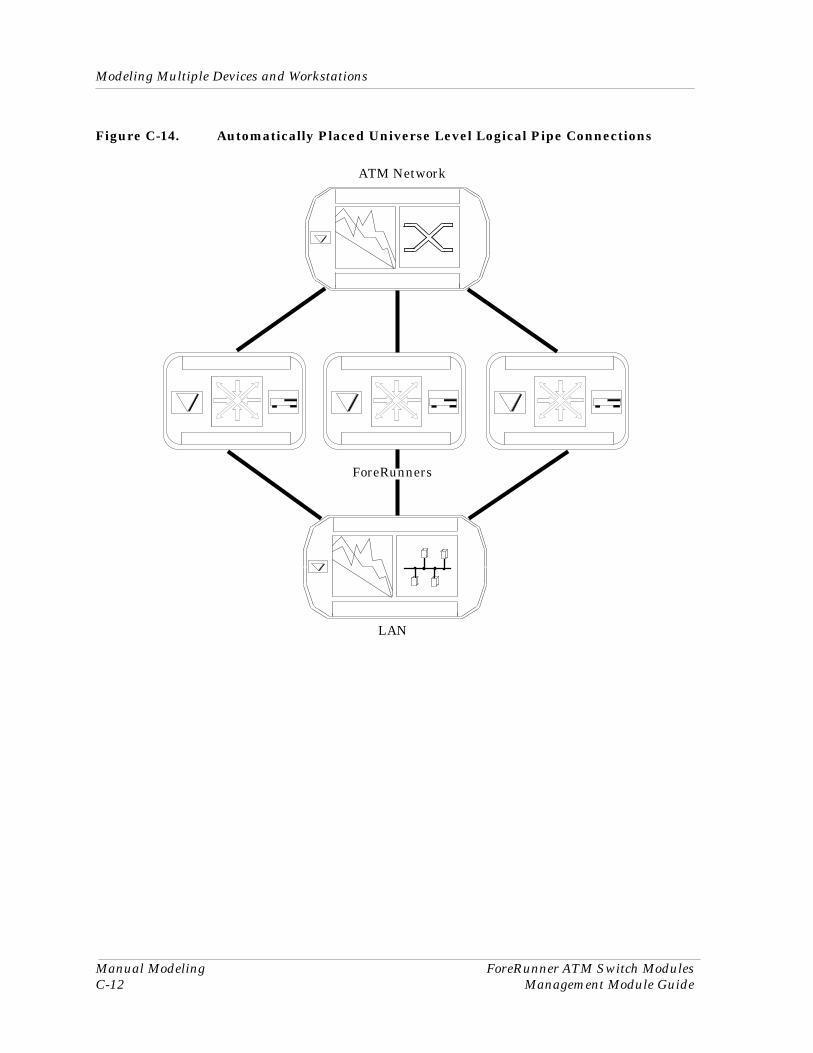
Modeling Multiple Devices and Workstations
Manual Modeling ForeRunner ATM Switch ModulesC-12 Management Module Guide
Figure C-14. Automatically Placed Universe Level Logical Pipe Connections
ATM Network
LAN
ForeRunners
9031342 E51
IndexNumerics9A000 1-2
AAAL0 2-27AAL4 2-27AAL5 2-27Accessing SPECTRUM Views 1-9Adaptor Type 3-9Address 5-7, 5-18
MAC 2-4Physical 2-7
Address Label 2-4Administrative Status 2-7, 2-16, 2-24, 3-8Age 5-17, 5-18Alarm Discard Threshold 2-8Alarm Messages 4-1Alt Metric 2 5-8Application View 5-1
Icon Mode 5-3List Mode 5-4
ASX Switches 1-2Asynchronous Transfer Mode 1-2ATM
Address 3-7, 3-9, 5-17Cells 1-2Interface Type 2-24User Configuration View 3-7
ATM_Network Model Type 1-5Attribute Selected 2-11, 2-20AutoDiscovery B-4, C-1
BBandwidth
Allocated 5-13, 5-14, 5-15In/Out Allocated 3-8In/Out Maximum 3-8In/Out Used 3-8Interface 2-7Maximum 5-13, 5-14
Used 5-13, 5-15Board 3-6, 3-10Broadcast Address 5-9Buffer Size 3-6Buffer Table View 3-3
CCablewalk View C-9Capacity 5-17, 5-18, 5-19Carrier 3-6CDV 5-17Cell Header A-1Cells 1-2, 5-13, 5-14, 5-15Channel Allocation 5-13Channels
Allocation 5-12Maximum 5-12, 5-13
Connection Table 5-27Creates 5-9
DDelivered 5-6Destination 5-17, 5-18, 5-19
Address 5-8Mask 5-19Port 5-19
Detail View 2-9Discards 5-6Discovering Your Network B-1Double-Click Zones 1-8
EError Rate Threshold 2-8Errors 3-6, 5-6Event Messages 4-1
FFails 5-9, 5-10
Index ForeRunner ATM Switch Modules2 Management Module Guide
Firmware Version 3-7, 3-9, B-2Fore ATM SONET Configuration View 3-10Fore User Application Table View 5-26ForeRunner
Configuration View 3-2Model Types 1-4Physical View 6-2
ForeSwitchApp 3-8ForeUserApp 3-9ForeUserApp Model Type 1-6ForeView 6-1ForeView Installation 6-1Forward 5-6Fragmentation 5-7Frames
Delivered 5-5Forwarded 5-5Transmitted 5-5
Framing Default 3-10Framing Operation 3-10
GGauge
Mode 2-12, 2-20Selected Attribute 2-12, 2-20Type 2-12, 2-20
Gauge Control PanelForeRunner 2-10ForeSwitchApp 2-19ForeUserApp 2-28
Gauge Label 2-16, 2-24, 2-25
HHardware Speed 3-7, 3-9Hardware Version 3-7, 3-9Header 5-7
IICMP_App 5-2Icon Modification 2-10, 2-19, 2-28Icon Types 1-4In, Discards 5-7In, Port 5-14, 5-16In, VCI (Virtual Channel Identifier) 5-16In, VPI (Virtual Path Identifier) 5-14, 5-16Index 5-17, 5-18
Interface 5-8, 5-9Description 2-7, 2-10, 2-19, 2-28Detail View 2-9Icon, Device View 2-3, 2-15Index 2-7Label 2-4, 2-16, 2-24Status of 2-4Type 2-4
Interface Icon, Device ViewAdministrative Status 2-4, 2-16, 2-24Gauge Label 2-16, 2-24, 2-25Illustration 2-3, 2-15, 2-23Interface Number label 2-4, 2-16, 2-24Interface Type Label 2-4Network Information Label 2-24
Interface Options Panel 2-12, 2-20ForeRunner 2-10ForeSwitchApp 2-19ForeUserApp 2-28
Interface Type 2-16Inter-Switch Links 5-18IP Address 5-9IP Forwarding 5-8IP Reassembly 5-10IP Routing
Address Table 5-9Application 5-6Configuration 5-7Fragmentation 5-9Packets 5-7Reassembly 5-10Statistics 5-6Table 5-8
LLabel and Double-Click Zones 2-3, 2-15, 2-23Lin Button 2-9, 2-18Line Coding 3-10Line Status 3-11Line Type 3-10Link QoS 5-20Load Alarm Threshold 2-8Log Button 2-9, 2-18Logical Pipe Connection C-6Loopback 3-11
9031342 E5 Index3
MMAC Address Label 2-4Mask 5-18Max Channels 5-17Max Paths 5-17MIB-II 5-2Model 3-6Modeling a Device 1-3, B-1, C-1Module 3-6, 3-10Module Table View 3-4
NNetwork
Information 2-24Management 6-4Mask Address 5-9
Network Statistics 6-4Next Hop Address 5-8Notice iNumber of Links 5-17Number of Ports 3-5
OOKs 5-9, 5-10Operational Status 2-7, 3-6, 3-7, 3-8, 3-9Out, Discards 5-7Out, Port 5-14, 5-16Out, VCI (Virtual Channel Identifier) 5-16Out, VPI (Virtual Path Identifier) 5-14, 5-16Overflows 3-6
PPacket Size 2-7Packet Threshold 2-8Path
Status 3-11Table Views 5-12Tracing 6-6Width 3-10
Paths-In/Out Max 3-8Paths-In/Out Number 3-8Performance Statistics 2-5, 2-16, 2-24, 2-25Physical Layer 3-7, 3-9Policing Act 5-17Port 3-6, 3-10, 5-12, 5-13, 5-15, 5-19
Port ConfigurationForeSwitchApp 3-8ForeUserApp 3-9
Port Detail View 2-18Port Number 3-7, 3-8, 3-9Port Uptime 3-8Ports Routed 5-15Primary Metric 5-8Protocol 5-13, 5-14, 5-15, 5-16Provides Relation 5-5PVCs, Setting 6-5
QQueue Length 3-6
RReassembles Timeout 5-7Reassembly 5-7Rec Carrier 3-7, 3-9Related Reading xiiiRemote ATM Address 3-8Remote IP Address 3-8Requests 5-10Restricted Rights Notice iiRoute, Age 5-8Routing Type 5-8Rx Scrambling 3-11
SSecondary Address Panel 2-8Section Statistics 3-11Seed Switch B-3Serial Number 3-7, 3-9Signaling A-1Signaling Table Views
Q2931 Admin 5-20Q2931 Statistics 5-20
Smart PVCs 6-5SNMP2_Agent 5-2Software Version 3-7, 3-9Source 5-17, 5-18, 5-19Source Mask 5-19Source Port 5-19SPANS 5-20SPECTRUM Support 1-7State 5-19
Index ForeRunner ATM Switch Modules4 Management Module Guide
Statistical Information 2-3, 2-15, 2-23Status 5-13, 5-14, 5-15, 5-16, 5-19SW_Link Model Type 1-6Switch Application Configuration View 3-5System2_App 5-2
TTCP2_App 5-2Time To Live 5-7Tracing a Path 6-6Trademarks iTransmitted 5-6Tx Clock Source 3-11Tx Scrambling 3-11
UUDP2_App 5-2Unknown IP Routing Packets 5-7Uptime 3-9, 5-13, 5-14, 5-15, 5-17
VVCI (Virtual Channel Identifier) 5-15VCI, Cell Header 1-2, A-1VCs 5-13Version 3-6Virtual Channel 6-5Virtual Channel Identifier 5-15Virtual Path 6-5Virtual Path Identifier (VPI) 5-12, 5-13, 5-15Virus Disclaimer iiVPI (Virtual Path Identifier) 5-19VPI, Cell Header 1-2, A-1
WWorkstation Model Type 1-7
ZZones, Double-Click 1-8, 2-3, 2-15, 2-23