Embed Size (px)
Citation preview

FOREST BIOMASS REMOVAL ON NATIONAL FOREST LANDS First Progress Report
November 17, 2008
Prepared For: THE SIERRA NEVADA CONSERVANCY
AUBURN, CALIFORNIA
Prepared By: PLACER COUNTY CHIEF EXECUTIVE OFFICE
AUBURN, CALIFORNIA
And TSS CONSULTANTS
RANCHO CORDOVA, CALIFORNIA
Funding for this research was provided by the Sierra Nevada Conservancy, Placer County, and the Placer County Air Pollution Control District
Forest Biomass Removal on National Forest Lands First Progress Report
1
Background This represents the first progress report for grant agreement #G0770005 between the Sierra Nevada Conservancy (SNC) and Placer County. The project grant, “Biomass Removal on National Forest Lands,” was proposed and sponsored by Placer County in a partnership with the USDA Forest Service (USFS), Placer County Air Pollution Control District (PCAPCD), and Sierra Pacific Industries (SPI). Representatives from the SNC participated in the implementation planning discussions and the drafting of the communications plan for this project. The primary objective of the Forest Biomass Removal on National Forest Lands project is the removal of woody biomass waste material from national forests located within the SNC service area. Placer County proposed that the woody biomass material be removed as a byproduct of fuels treatment/timber management activities and that this byproduct is recovered as fuel for renewable energy generation rather than its current fate which is pile and burn or leave on site. The first project sites located near Foresthill, California were chosen to ensure that proposed objectives were met as outlined in the grant proposal: Specific project sites will receive fuels treatments consistent with existing Land Management Plans for the National Forests and treatments will be implemented with the assistance of USFS and SPI foresters to ensure that projects are targeted to produce lasting effects on the landscape and are accomplished in conjunction with other relevant public and private ecosystem projects that enhance forest and watershed health. This progress report provides Phase I findings. Phase II of this project is already underway and should be completed by December 2008. Introduction Public and private forest lands in Placer County are severely overstocked with very high concentrations of hazardous forest fuels. These hazardous conditions place important natural resources and assets at significant risk, including upland watersheds, human communities and biological communities. To reduce the risk of catastrophic wildfire, forest fuels treatment (e.g., thinning, mastication, prescribed fire) is needed. In many parts of the Sierra Nevada Range, merchantable timber in the form of sawlogs are harvested and transported to local sawmills. Leftover material (slash) in the form of limbs, tops and small stems is piled at a collection point (landing) for eventual disposal through pile burning typically conducted in the late fall. Air pollutant emissions (including CO, NOx, and particulate matter) generated can be significant. Historically, it has not been economical to utilize this slash because the costs to collect, process and transport are higher than its value as either fuel or wood product (e.g., posts/poles). Slash pile burning is constrained by the limited time of year it can be conducted due to weather conditions, is expensive to conduct (in part because the piles can burn for days), produces large amount of unhealthy air emissions, and pile burn residuals (blackened logs and woody debris) are aesthetically unpleasing. In addition, by

Forest Biomass Removal on National Forest Lands First Progress Report
2
limiting the amount of burning taking place in these watersheds, potential impacts such as soil and ash runoff are reduced, thus enhancing water quality while preparing these forested sites for reforestation activities (tree planting). Slash pile burning can also impact soil chemistry, loss of soil organic matter and nitrogenous materials, and potentially, soil mineralogy. There is evidence also suggesting that slash pile burning negatively impacts the viability of seeds and native plants, opening up the possibility of allowing exotic species to invade impacted land.1 As a result of commercial harvesting and forest fuels reduction activities, there are numerous existing slash piles located throughout the central sierra National Forests, and many more will be generated from future forest fuels reduction efforts. As an alternative to slash pile burning, the Placer County Team2 is evaluating the economic costs and environmental benefits of utilizing slash generated in selected regions of Placer County as fuel in a biomass-to-power cogeneration facility. This demonstration project will take several years to implement. We anticipate evolving the projects to encompass strategies during forest thinning treatments (rather than after as is current practice) that will improve logistical, economic and watershed enhancement possibilities of future forest health operations. We plan to evaluate and monitor selected fuels treatment projects on four national forests during this project:
• Tahoe National Forest • Plumas National Forest • Lake Tahoe Basin Management Unit3 • Eldorado National Forest
Key metrics that will be analyzed in the evaluation and monitoring process include:
• Economics of woody biomass material collection, processing and transport. • Performance of the biomass-to-energy recovery boiler (located at SPI Lincoln). • Net air quality impacts from open pile burning and utilizing woody biomass in a
biomass power cogeneration facility, including criteria on? air pollutants and greenhouse gases.
• Potential benefits to watersheds (water quality, wildlife habitat, recreation). • Mitigation of wildfire behavior.
Findings will be delivered in summary report format as projects are completed.
1Elliot et al. “Vegetation Management in Sensitive Areas of the Lake Tahoe Basin: A Workshop to Evaluate Risks and Advance Existing Strategies and Practices.” March-April 2008. 2Staff from Placer County, Placer County Air Pollution Control District, and TSS Consultants. 3Not part of the Sierra Nevada Conservancy boundary.

Forest Biomass Removal on National Forest Lands First Progress Report
3
Phase I SSO/BFP Project Description The first project implemented in this research study was located on the Tahoe National Forest, American River Ranger District near Foresthill, California. This location was chosen for several reasons, including the fact that it is in the American River watershed. Woody biomass waste material generated as a result of two timber harvest projects (SSO Stewardship Project and Big Reservoir Timber Sale) was collected, processed and transported to the Sierra Pacific Industries (SPI) power cogeneration facility located at Lincoln, California. Originally these USFS stewardship contracts were awarded and implemented in 2007, at which time it was not economical to remove the byproducts (limbs, tops small stems) generated. In the course of this Phase I implementation, approximately 16 piles were removed. Figure 1 highlights the approximate locations of the projects and the SPI facility.
Figure 1. Location of SSO/BFP Projects and SPI Lincoln Facility
Forest Biomass Removal on National Forest Lands First Progress Report
4
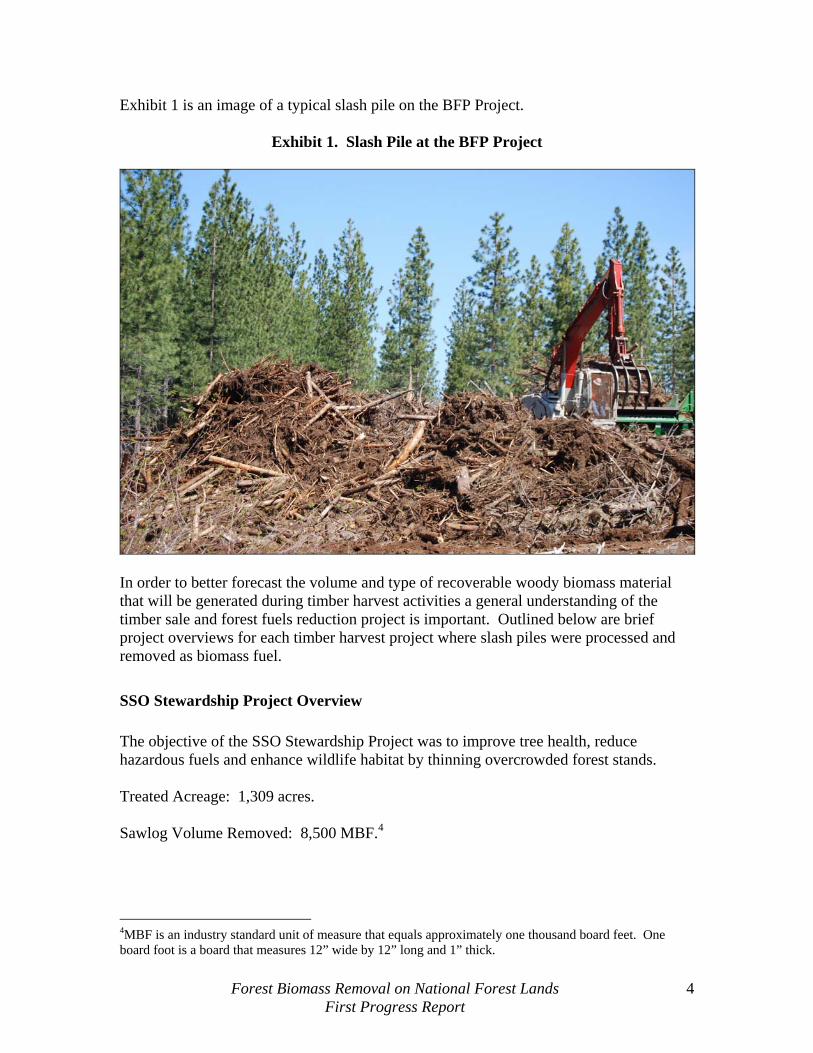
Exhibit 1 is an image of a typical slash pile on the BFP Project.
Exhibit 1. Slash Pile at the BFP Project
In order to better forecast the volume and type of recoverable woody biomass material that will be generated during timber harvest activities a general understanding of the timber sale and forest fuels reduction project is important. Outlined below are brief project overviews for each timber harvest project where slash piles were processed and removed as biomass fuel.
SSO Stewardship Project Overview The objective of the SSO Stewardship Project was to improve tree health, reduce hazardous fuels and enhance wildlife habitat by thinning overcrowded forest stands. Treated Acreage: 1,309 acres. Sawlog Volume Removed: 8,500 MBF.4
4MBF is an industry standard unit of measure that equals approximately one thousand board feet. One board foot is a board that measures 12” wide by 12” long and 1” thick.
Forest Biomass Removal on National Forest Lands First Progress Report
5
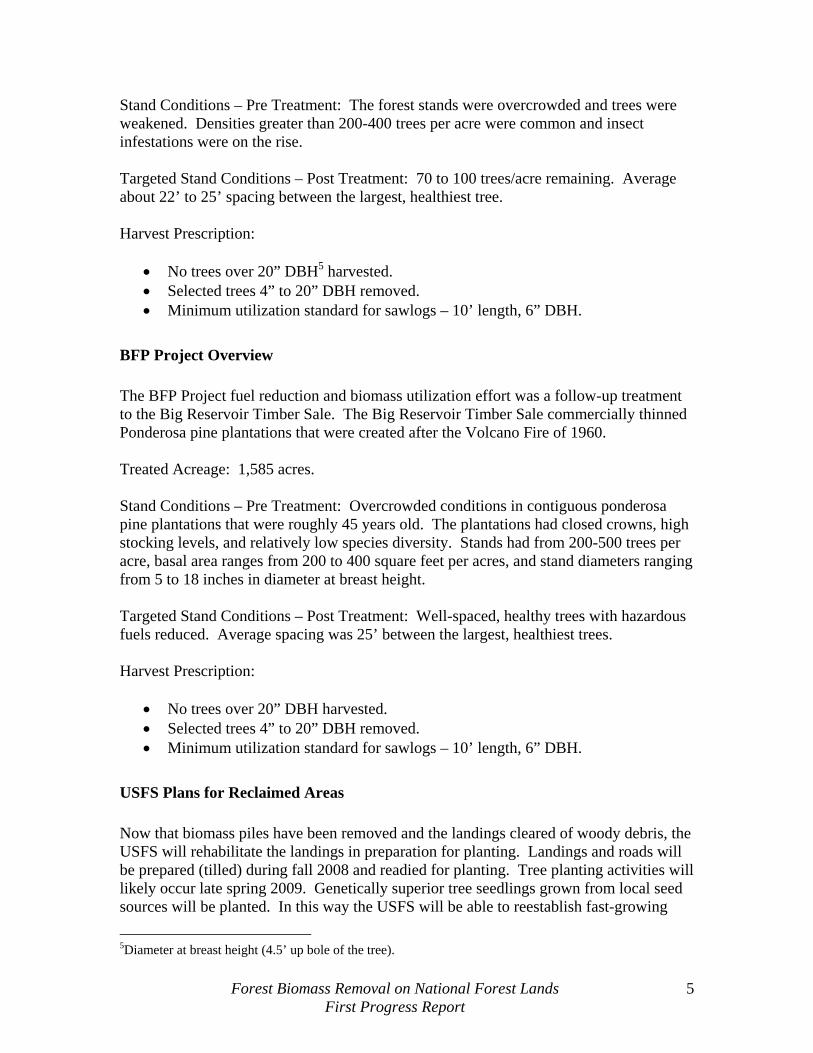
Stand Conditions – Pre Treatment: The forest stands were overcrowded and trees were weakened. Densities greater than 200-400 trees per acre were common and insect infestations were on the rise. Targeted Stand Conditions – Post Treatment: 70 to 100 trees/acre remaining. Average about 22’ to 25’ spacing between the largest, healthiest tree. Harvest Prescription:
• No trees over 20” DBH5 harvested. • Selected trees 4” to 20” DBH removed. • Minimum utilization standard for sawlogs – 10’ length, 6” DBH.
BFP Project Overview The BFP Project fuel reduction and biomass utilization effort was a follow-up treatment to the Big Reservoir Timber Sale. The Big Reservoir Timber Sale commercially thinned Ponderosa pine plantations that were created after the Volcano Fire of 1960. Treated Acreage: 1,585 acres. Stand Conditions – Pre Treatment: Overcrowded conditions in contiguous ponderosa pine plantations that were roughly 45 years old. The plantations had closed crowns, high stocking levels, and relatively low species diversity. Stands had from 200-500 trees per acre, basal area ranges from 200 to 400 square feet per acres, and stand diameters ranging from 5 to 18 inches in diameter at breast height. Targeted Stand Conditions – Post Treatment: Well-spaced, healthy trees with hazardous fuels reduced. Average spacing was 25’ between the largest, healthiest trees. Harvest Prescription:
• No trees over 20” DBH harvested. • Selected trees 4” to 20” DBH removed. • Minimum utilization standard for sawlogs – 10’ length, 6” DBH.
USFS Plans for Reclaimed Areas Now that biomass piles have been removed and the landings cleared of woody debris, the USFS will rehabilitate the landings in preparation for planting. Landings and roads will be prepared (tilled) during fall 2008 and readied for planting. Tree planting activities will likely occur late spring 2009. Genetically superior tree seedlings grown from local seed sources will be planted. In this way the USFS will be able to reestablish fast-growing
5Diameter at breast height (4.5’ up bole of the tree).
Forest Biomass Removal on National Forest Lands First Progress Report
6
and resilient trees to take advantage of high site lands and thus reestablish a robust and productive forest ecosystem. Economics of Collection, Processing and Transport Processing and Transport Methodology A primary objective of this study was to better understand the logistics and financial costs of woody biomass collection, processing and transport. Current practices include pile burning of this material following one or two years of drying. Financial costs to burn are relatively low with US Forest Service estimates at $500 per pile (can be considerably higher if smoldering piles require supervision for an extended period of time). An alternative fate for this material is to process the piles into woody biomass fuel suitable for use as fuel in a biomass power generation facility. Typically this fuel is collected using excavators or rubber-tired loaders, processed using portable grinders, and transported using large capacity trailers (i.e., chip vans). SPI retained Brushbuster, Inc., a Foresthill area contractor, to provide processing and transport services on the SSO and BFP projects. Exhibit 2 shows the Brushbuster equipment processing a slash pile on the BFP project. Slash piles were collected and processed at the landing site, and conveyed directly into chip vans (see Exhibit 2). Collection was accomplished using two Linkbelt excavators and processing was performed using a Bandit Beast horizontal grinder with a rated production of approximately 60 green tons / hr (about 2.5 loads per hour). Slash material was collected and transported from the pile to the grinder utilizing the excavator type equipment. Two excavators were required for the Phase I work due in part to the fact that slash piles were arranged for burning and not for processing. If the slash piles had been created so that slash was stacked and not pushed (into piles) then only one excavator would likely have been required.6 See Observations section of this report (below) for more information regarding methods to create piles that are more efficient to collect and process. The processed slash was conveyed directly from the grinder into chip vans and transported 60 miles (one way) to the SPI Lincoln biomass power generation facility. Chip vans have a loaded net capacity of about 25 green tons.
6Discussions with Ben Wing, Brushbuster, Inc.

Forest Biomass Removal on National Forest Lands First Progress Report
7
Exhibit 2. Brushbuster Processing Equipment and Chip Truck – BFP Project
Table 1 lists the equipment utilized to collect, process, and transport biomass fuel to the SPI Lincoln facility. Table 1. Equipment Utilized to Process and Transport Biomass Fuel to SPI Lincoln
EQUIPMENT VENDOR/MODEL/YEAR ENGINE FUEL USAGE Horizontal Grinder Bandit Beast - 2008 Caterpillar 3680 30 gallons/hour Excavator Loader Linkbelt Model 290 - 2003 Isuzu 5 gallons/hour Excavator Loader Linkbelt Model 135 - 2003 Isuzu 2.6 gallons/hourTruck/Chip Van Kenworth - 1997 Cummins N14 4.5 miles/gallon Truck/Chip Van Kenworth - 1997 Cummins N14 4.5 miles/gallon Truck/Chip Van Kenworth - 2006 Caterpillar C 13 4.5 miles/gallon Water Truck (dust control) Ford Model L9000 - 1995 Detroit Series 60 6 miles/gallon Truck/Low Bed Kenworth - 2003 Caterpillar C 15 4.5 miles/gallon Truck – Crew Transport Ford F 250 - 2003 7.3 liter Powerstroke 14 miles/gallon Service Truck Ford F 350 - 2000 7.3 liter Powerstroke 13 miles/gallon

Forest Biomass Removal on National Forest Lands First Progress Report
8
Collection, Processing and Transport Costs There are numerous opportunities throughout the Sierra Nevada Range to recover and utilize woody biomass material. However, the financial costs are generally much higher than the current market value of the wood fuel delivered to biomass power generation facilities. Findings from our Phase I analysis confirm this hypothesis. The financial costs to collect, process and transport biomass fuel from the SSO and BFP project sites to a biomass power generation facility were significantly higher than the current market value. Total costs (see Table 2) amount to approximately $58.43/bone dry ton7 (BDT). Current market value of biomass fuel sourced from timber harvest residuals in the central Sierra Nevada region is about $30/BDT. Table 2 summarizes the findings from 45 days of operational data as provided by Brushbuster, Inc. See Appendix C for the full dataset of daily production rates and operating performance.
Table 2. Financial Cost Estimate for Collection, Processing and Transport 4/14/08 to 7/24/08
EQUIPMENT
$/OPERATING
HOUR
AVERAGE OPERATING HOURS/DAY
COST $/BDT8 Grinder – Bandit Beast $400 4 $17.19 Excavator – Linkbelt 135 $125 3.7 $4.97 Excavator – Linkbelt 290 $150 3.7 $5.96 Chip Truck - Kenworth $85 9 $27.13 Water Truck – Ford L9000 $60 3 $1.93 Service Truck – Ford F 350 $25 2 $0.54 Crew Truck – Ford F 250 $20 2 $0.43 Low Bed – Kenworth $100 .279 $0.29
TOTAL $58.43
Additional Data Generated Progress on-site was measured by the amount of biomass collected, processed, transported, and utilized as fuel at the biomass power generation facility (SPI – Lincoln). Phase I operations provided the empirical evidence of the potential baseline performance of a contractor on a site with similar conditions as the site studied. During Phase I, approximately 7,080 green tons of biomass were collected, processed, and transported. Given the moisture content of the fuel (41%), it was estimated that this was the 7Bone dry ton (BDT) equals 2,000 pounds of wood fiber at zero percent moisture. BDT is a common unit of measure in the biomass power generation market sector. 8Reported cost per bone dry ton is on the basis of daily average production rate which is reported in bone dry tons per day. 9Lowbed truck was utilized for a total of 12 hours to transport grinder and both excavators.

Forest Biomass Removal on National Forest Lands First Progress Report
9
equivalent of 4,191 bone dry tons. Each truck that removed biomass from the site carried an average of 23.9 green tons, or 14.1 bone dry tons. On a daily basis, 93.1 bone dry tons of biomass were removed from the site and transported to the biomass power generation facility. The fuel that was processed and delivered to the generation facility was generally of good quality. Laboratory tests of the material collected indicated that the fuel which was processed and delivered had a higher heating value (HHV) with a range of 8,589 Btu per dry pound to 9,957 Btu10 per dry pound. Of the samples that were tested, the average HHV reported was approximately 9,000 Btu per dry pound. When considering the financial costs of collection, processing, and transport, the average cost of this fuel (delivered to SPI – Lincoln) expressed as cost per unit measure of heating value is $3.25M per million Btu.11
Future Optimization As a result of implementing Phase I, it became quite clear that there are opportunities to improve the efficiencies and drive down the associated expenses. Plans are to work with the contractors involved in Phases II + to test methods that will ultimately improve the economics of these biomass utilization operations. See Observations section for specific recommendations regarding operational efficiencies. SPI Lincoln Boiler Operating Performance The SPI – Lincoln sawmill facility includes a wood-fired boiler that produces steam for on-site use. The steam is utilized to provide process steam to support the lumber drying process (dry kilns), and in a steam turbine to produce approximately 18 MW of electricity. The boiler, a McBurney stoker grate design, was installed in 2005 and has a firing rate capacity of 300 MMBtu/hour. The boiler is fueled by biomass waste including: (1) lumber mill wood wastes generated on site; (2) agricultural wastes, including nut shells and orchard removals/prunings; and (3) woody wastes from timber operations. The boiler uses Selective Non-Catalytic Reduction for NOx control and multiclones, followed by an electrostatic precipitator (ESP), for particulate control. The cogeneration plant is shown in Exhibit 3. The net boiler heat rate is 16,145 Btu/kWhe, translating to a net efficiency of 22%.
10British Thermal Unit – the quantity of heat required to raise the temperature of one pound of water from 60 degrees to 61 degrees Fahrenheit at a constant pressure of one atmosphere. 11Million British Thermal units (MMBtu) per hour. This is a common unit of measure used to convey the relative amount of thermal energy produced.

Forest Biomass Removal on National Forest Lands First Progress Report
10
Exhibit 3. SPI – Lincoln Biomass-Fired Cogeneration Plant
The SPI Lincoln boiler produced 4,652 megawatt hours of electricity (MWhe) from the 4,191 BDT of biomass removed by the SSO/BFP projects, as shown in Table 3. This electricity is the equivalent of the annual consumption of approximately 517 single family households.
Table 3. SPI Boiler Performance
Chipped Material Moved to SPI – Lincoln Chip van loads 297 Bone dry tons 4,191 Green tons 7,089 Chip Heating Value (Btu/lb, dry pound) 8,700 Total Energy from Chipped Biomass (MMBtu) 72,923 SPI – Lincoln Boiler Firing Rate (MMBtu/hr) 300 Equivalent Boiler Operating Time on Biomass hour 243 days 10.1 SPI – Lincoln Boiler Efficiency (%) 22 Electricity Production from Biomass (MWhe) 4652.5

Forest Biomass Removal on National Forest Lands First Progress Report
11
Air Quality Impacts – Criteria Air Pollutant Emissions Open Pile Burning Under historical, “baseline as usual” operations, criteria air pollutant emissions that would have resulted from open pile burning of the forest slash are listed below and detailed in Table 4:
• CO (carbon monoxide) • NOx (nitrogen oxides) • PM10 (particulate matter, diameter less than 10 microns) • NMOC (non-methane organic hydrocarbons)
Table 4. Emissions Summary – Criteria Air Pollutants
PM10 NOx CO NMOC Baseline, Business as Usual Open Pile Burn (lb) 106,335 28,356 1,063,350 106,335 Biomass to Energy SPI – Lincoln Boiler (lb) 1,338 8,921 12,744 299 Transport (lb) 32 1,335 3,140 39 Chipping (lb) 1,632 829 874 26 TOTAL (lb) 3,002 11,084 16,759 365 Reduction (tons) 51.7 8.6 523.3 53.0 % Reduction 97.2 60.9 98.4 99.7
Emission factors (EF) used for open slash pile burning are provided in Appendix A.
Utilizing Woody Biomass in a Biomass Power Generation Facility As an alternative to open pile burning, criteria air pollutant emissions from collection, processing, transport, and use of biomass slash to energy, as conducted in this program, are also shown in Table 4. Sources of emissions include:
• Diesel engines on grinder and loaders. • Diesel engines on chip van transports. • Dust from grinding operation. • Dust from vehicle travel on dirt roads. • Biomass-to-energy plant.
Factors used for these sources of emissions are also provided in Appendix A.

Forest Biomass Removal on National Forest Lands First Progress Report
12
As highlighted in Figure 2, using forest slash for energy provides significant reductions in all criteria pollutants:
• PM10 – Reduced by 97.1% (51.7 tons). This is the equivalent of the yearly output of 3,447 residential wood burning appliances.
• NOx – Reduced by 60.1% (8.6 tons). • CO – Reduced by 98.4% (523 tons). • NMOC – Reduced by 99.7% (53 tons).
Figure 2. Criteria Air Pollutant Emissions Comparison Between Open Pile Burn and Biomass-to-Energy Operations
Air Quality Impacts – Greenhouse Gases Table 5 shows the greenhouse gas (GHG) reductions achieved by using the forest slash for biomass to energy.

Forest Biomass Removal on National Forest Lands First Progress Report
13
Table 5. Emission Summary – Greenhouse Gases
Baseline, Business as Usual Open burning CH4 (tons) 18 CO2e12 (tons) 372 Displaced grid electricity (tons) 2,003 Biomass to Energy Biomass power plant CH4 (tons) 0.4 CO2e (CH4*25) (tons) 9 Chipping Fuel (gallons) 6,623 CO2 (tons) 73 Transport Travel (miles) 35,640 Fuel (gallons) 7,920 CO2 (tons) 87 Net Reduction CO2 Cost Effectiveness ($/ton) 38 CO2e (tons) 2,205 CO2e reduction per BDT biomass (ton CO2e/ton biomass) 0.526
Reductions are determined as the difference of:
• Baseline, business as usual. GHG emissions are associated with:
- Open pile burning. Accounts for CH4 that is released from open pile burning. The CH4 EF is shown in Appendix A.
- Electricity from the existing grid (from associated fossil fuel combustion)
displaced by that produced from the waste biomass fuel. An existing electricity grid EF of 861 lb CO2 / MWhe is used (taken from that used by the California Air Resources Board AB32 Scoping Plan).
• Biomass to energy. GHG emissions associated with:
- Biomass power plant. Accounts for CH4 released from the combustion of
biomass in the power plant boiler. The CH4 EF is shown in Appendix A.
12CO2e is determined by using the global warming potential of CH4. The GWP of CH4 utilized in this model is 21 tons CO2e/ton CH4.

Forest Biomass Removal on National Forest Lands First Progress Report
14
- Collection, Processing and Transport. Accounts for CO2 produced from diesel
fuel combustion from engines on grinder, loader, and chip van transport operations.
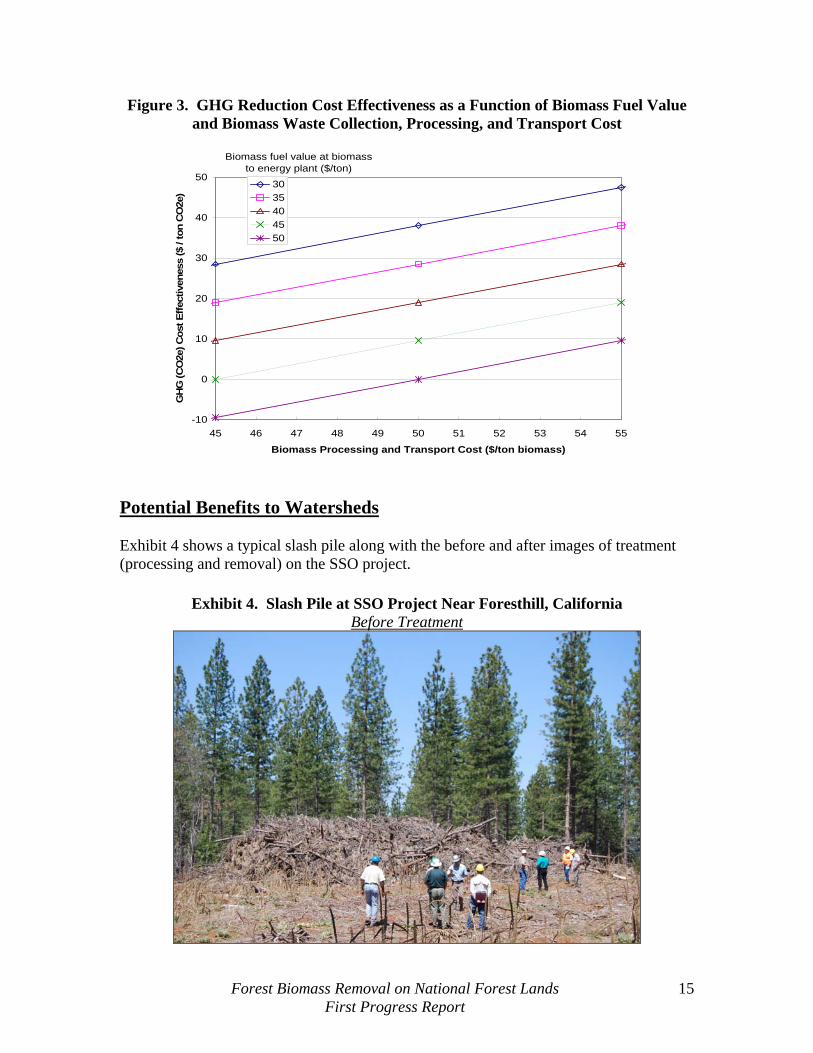
An overall reduction of 2,205 tons of GHG is achieved from the biomass-to-energy operations. Based on an assumption that an average passenger vehicle emits 5.75 tons of CO2e per vehicle per year,13 this overall reduction is equivalent to removing approximately 380 vehicles off the road. The project team is in the process of developing a formal biomass waste-to-energy GHG protocol for official issuance of GHG offset credits from these types of projects. The protocol will be based on the data gathering and calculations presented from this forest biomass waster recovery and utilization program. The cost effectiveness of CO2 reductions is shown as a function of biomass fuel value at the energy recovery plant and collection/processing/transport costs (see Figure 3). Cost effectiveness is the measure of the projected cost to remove or avoid GHG emissions as a function of the fuel value and collection/processing/transport costs. As a result of this analysis based on the data generated at the SSO project, a lower cost effectiveness would indicate that a project would have to generate fewer funds in order to make the project economical to avoid GHG emissions. If cost effectiveness is zero or negative, this indicates that the project is economical without consideration of GHG, and thus the project avoids emissions without any additional incentive.
13http://www.epa.gov/otaq/climate/420f05004.htm, accessed October 23, 2008.
Forest Biomass Removal on National Forest Lands First Progress Report
15
Figure 3. GHG Reduction Cost Effectiveness as a Function of Biomass Fuel Value and Biomass Waste Collection, Processing, and Transport Cost
-10
0
10
20
30
40
50
45 46 47 48 49 50 51 52 53 54 55
Biomass Processing and Transport Cost ($/ton biomass)
GH
G (C
O2e
) Cos
t Effe
ctiv
enes
s ($
/ to
n C
O2e
)3035404550
Biomass fuel value at biomass to energy plant ($/ton)
Potential Benefits to Watersheds Exhibit 4 shows a typical slash pile along with the before and after images of treatment (processing and removal) on the SSO project.
Exhibit 4. Slash Pile at SSO Project Near Foresthill, California Before Treatment

Forest Biomass Removal on National Forest Lands First Progress Report
16
After Treatment
Natural resource managers have found that treating hazardous forest fuels in the upland watersheds of California provides numerous societal benefits. For example, the hydrologic response following fuels treatment activities indicates that there is a net increase in water yield if the forest stand density (basal area) is reduced at least 20 percent.14 While increasing the water yield in selected watersheds is important, so too is the net improvement in overall forest health as a result of treating unnaturally high concentrations of forest fuels. Watersheds are more fire resilient following landscape level vegetation management activities, helping to mitigate the propensity for catastrophic wildfire events. History has shown that watersheds which experience high intensity wildfire events are likely to experience significant water quality degradation from the accelerated erosion and deposition of organic carbon, ash, and sediment. In some cases wildfire events will severely impact watersheds for decades. The Buffalo Creek Fire (1996) and Hayman Fire (2002) consumed almost 150,000 acres in the domestic watershed for the City of Denver. Due to the severe degradation and increased erosion, the Denver Water Board is estimating that sediment removal operations for the Strontia Springs and Cheesman Reservoirs will cost approximately 31 million dollars.15 In direct response to the issue of wildfire defensible watersheds, the Colorado State
14C.A. Troendle et al. The Herger-Feinstein Quincy Library Group Project Impacts of Vegetation Management on Water Yield, May, 2007. 15Interview with Chips Barry, Denver Water Manager. Denver Post, April 11, 2008 editorial.

Forest Biomass Removal on National Forest Lands First Progress Report
17
legislature has sponsored a bill authorizing the Colorado Water Resources and Power Development Authorities to issue bonds to initiate forest health improvement projects. While much of the information available regarding the benefits of forest fuels reduction to the health of watersheds is anecdotal, there are some recent studies underway that are structured to monitor watershed impacts in the central Sierra Nevada Range. The Sierra Nevada Adaptive Management Project (SNAMP) is currently seeking full funding and will likely be implemented. This project will include research sites in the headwaters of the North Fork of the Middle Fork of the American River. The research team anticipates that all instrumentation should be installed and operational by the end of 2008.16 Current study plan indicates that this research project will take about seven years to implement. Key factors relative to watershed health to be monitored in the SNAMP research include:
• Timing and magnitude of both peak flows and overall flow regime. • Changes in water cycle affecting water quality. • Soil disturbance (may affect terrestrial and aquatic flora/fauna and water
resources for downstream users).
Exhibit 5 provides an image of one of the tributaries to the Middle Fork of the American River.
Exhibit 5. Sugar Pine Dam and Shirttail Creek Watershed Near Foresthill, California
16Sierra Nevada Adaptive Management Plan, Field Protocol and Study Plan Water, May, 2008.

Forest Biomass Removal on National Forest Lands First Progress Report
18
Mitigation of Wildfire Behavior Proactive removal of excess biomass material generated as a result of timber management and forest fuels reduction activities have a significant impact on wildfire behavior. Communities and forest managers throughout the Inland West have employed this tactic to create defensible space to protect lives, property, habitat and forest ecosystems. Fire officials in Placer County have been very supportive of the SSO/BFP biomass removal project. Luana Dowling, Administration Manager for the Foresthill/Iowa Hill Fire Safe Council, noted:17
“First I would like to thank you for your help with fuels mitigation in our area, this is never easy and we can use all the help we can get. The removal of these large piles is essential to fire mitigation efforts in the forest. Two of the piles in the area were set fire this summer and had the potential of becoming major forest fires. These piles in our forests are a tinder box waiting to be lit. They seem to attract our young folks as party sites and are easily set ablaze. The cost to extinguish these piles after accidental ignition is substantial. The money and personnel time is quite extensive. Dozers, engine crews, water tenders, and hand crews are needed to pull apart the piles so that they can be put out without the threat of re-ignition.”
See Appendix B for full text of this correspondence. Observations As this analysis represents the first of several phases, numerous observations or “lessons learned” should be noted. Regarding the selection of timber harvest slash piles for processing:
• Best to select piles that are located on fairly flat ground. • Piles that are more than two years old typically yield low quality wood fuel (low
heating value). • At higher elevations (snow zone), moisture content of the slash will be high
following winter. Best to process these piles mid summer (July or later) to allow drying due to the impacts of snow load.
• Piles that have been stacked neatly (not “jack strawed”) are easier to manage when feeding grinder. Less equipment time is needed to break down the piles. This may eliminate need for two excavators.
17Correspondence to Placer County, 10/7/2008.

Forest Biomass Removal on National Forest Lands First Progress Report
19
• Piles that are pushed up with a dozer blade will likely have a relatively high amount of dirt which will impact fuel quality (high amount of non-combustible material).
• Develop a set of guidelines that forest managers can utilize when directing contractors to build slash piles.
• Select strategic locations for project implementation so that wildfire mitigation and watershed enhancement opportunities are maximized.
Regarding the efficient collection, processing and transport of biomass fuel:
• Large piles with a minimum amount of slash (e.g., ten truckloads minimum) will allow contractors to amortize mobilization costs over more tons produced. Small piles have fewer tons and thus a higher cost per ton for mobilization into and out of the landing.
• Maximize chipping operations productive machine hours by scheduling trucks so the grinder is continuously operating. Grinding equipment only averaged 4 operational hours per day in Phase I.
• If trucks cannot be scheduled (or are not available) to maximize productive machine hours per day, then alternative strategies should be considered, such as grinding onto the ground and loading out trucks using a rubber-tired loader.
Meetings Conducted and Funds Allocated Several meetings have been held to discuss this project with stakeholders both at the policy team level and with members of the project team to review project objectives, initial findings and discuss next steps. Field trips to the project site within the Tahoe National Forest have been offered to all stakeholders. A short documentary video has been developed regarding this project and will be made available to the SNC. In addition, meetings have been held with the Tahoe Basin Management Unit and Eldorado National Forest to determine which projects should be accomplished in those forests. To date, no specific projects have been identified, but several in each forest are being studied to determine which sites would be optimum and most strategic. Each national forest has a specific implementation schedule. Coordination and timing of project implementation is taking more time than anticipated and there have been some delays. In addition, the Plumas National Forest suffered from multiple fires this year, thus impacting where the next phase projects are implemented. Additional coordination meetings are scheduled in upcoming months. Placer County is currently on track to allocate projected budget funds and expects to expend all grant funds as provided by the SNC. To date, approximately 20% of the SNC funds have been expended.

Forest Biomass Removal on National Forest Lands First Progress Report
20
Phase II Analysis Additional woody biomass material from slash piles on the SSO project and Gorman Ranch project (also located on the American River Ranger District) is currently being collected, processed and transported to the SPI – Lincoln power plant. The Placer County Team continues to monitor financial costs, production, and emission levels. It is anticipated that Phase II findings will be available in the early spring of 2009 and will be included in the next progress report to the SNC.
Forest Biomass Removal on National Forest Lands First Progress Report
21
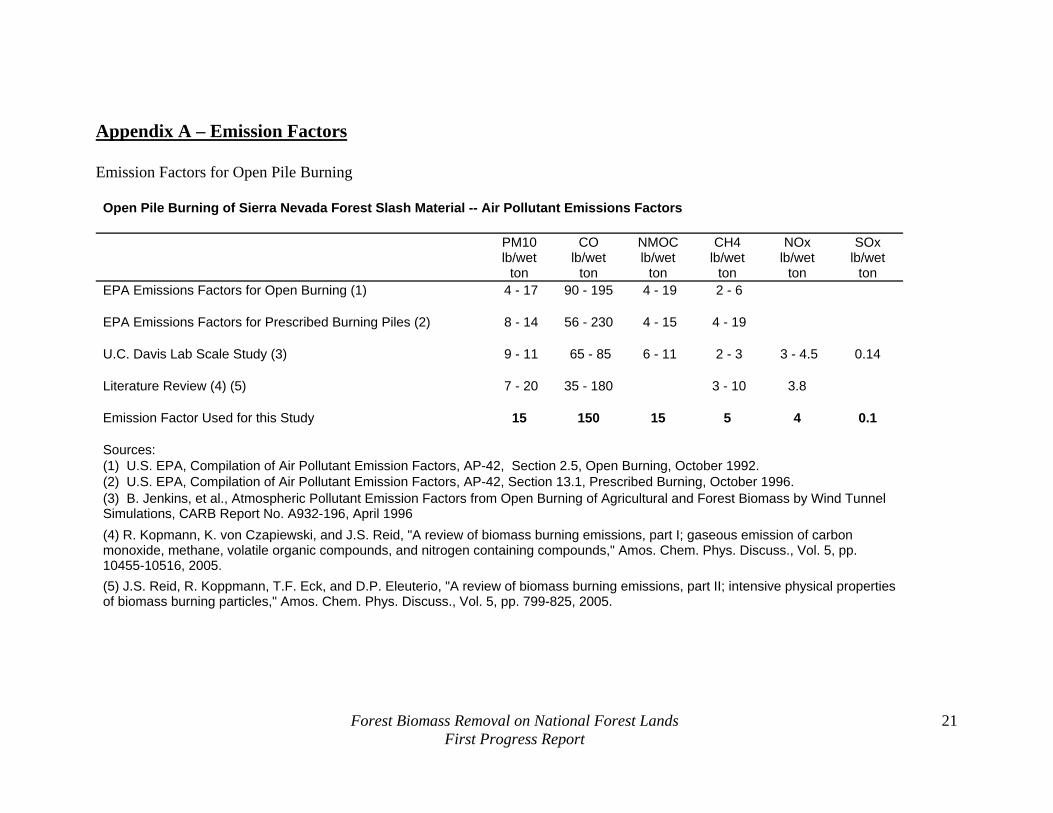
Appendix A – Emission Factors Emission Factors for Open Pile Burning Open Pile Burning of Sierra Nevada Forest Slash Material -- Air Pollutant Emissions Factors PM10 CO NMOC CH4 NOx SOx
lb/wet
ton lb/wet
ton lb/wet
ton lb/wet
ton lb/wet
ton lb/wet
ton EPA Emissions Factors for Open Burning (1) 4 - 17 90 - 195 4 - 19 2 - 6 EPA Emissions Factors for Prescribed Burning Piles (2) 8 - 14 56 - 230 4 - 15 4 - 19 U.C. Davis Lab Scale Study (3) 9 - 11 65 - 85 6 - 11 2 - 3 3 - 4.5 0.14 Literature Review (4) (5) 7 - 20 35 - 180 3 - 10 3.8 Emission Factor Used for this Study 15 150 15 5 4 0.1 Sources: (1) U.S. EPA, Compilation of Air Pollutant Emission Factors, AP-42, Section 2.5, Open Burning, October 1992. (2) U.S. EPA, Compilation of Air Pollutant Emission Factors, AP-42, Section 13.1, Prescribed Burning, October 1996. (3) B. Jenkins, et al., Atmospheric Pollutant Emission Factors from Open Burning of Agricultural and Forest Biomass by Wind Tunnel Simulations, CARB Report No. A932-196, April 1996 (4) R. Kopmann, K. von Czapiewski, and J.S. Reid, "A review of biomass burning emissions, part I; gaseous emission of carbon monoxide, methane, volatile organic compounds, and nitrogen containing compounds," Amos. Chem. Phys. Discuss., Vol. 5, pp. 10455-10516, 2005. (5) J.S. Reid, R. Koppmann, T.F. Eck, and D.P. Eleuterio, "A review of biomass burning emissions, part II; intensive physical properties of biomass burning particles," Amos. Chem. Phys. Discuss., Vol. 5, pp. 799-825, 2005.

Forest Biomass Removal on National Forest Lands First Progress Report
22
Biomass Power Plant Emission Factors PM10 SO2 CO NOx NMOC CH4
lb/dry ton
lb/dry ton
lb/dry ton
lb/dry ton
lb/dry ton
lb/dry ton
Rio Bravo Rocklin (1) 0.205 1.477 0.196 0.002 0.064 0.192 SPI Lincoln (2) 0.319 2.129 0.018 3.041 0.071 0.214 SPI Loyalton (3) (4) 0.344 2.499 0.031 9.359 0.175 0.524 Sources: (1) From June 2007 Source Test of Rio Bravo Rocklin Circulating Fluidized Bed Boiler, burning urban wood waste and agricultural biomass wastes (2) From June 2007 Source Test of Sierra Pacific Industry Lincoln McBurney Grate Fired Boiler, burning mill wood wastes and agricultural biomass wastes (3) From August 2007 Source Test of Sierra Pacific Industry Loyalton Riley Grate Fired Boiler, burning urban wood wastes, mill residues and in-forest biomass wastes (4) Loyalton PM10 is based on 16 year average due to 2007 being extremely low (0.47 pph) and not representative of normal.

Forest Biomass Removal on National Forest Lands First Progress Report
23
Transport Related Emission Factors Chip Van PM10 NOx CO NMOC CH4 g/mile g/mile g/mile g/mile g/mile Chip Van (1) 0.4 17 40 0.5 0.5 Source: (1) Carl Moyer Program Guidelines, Diesel Heavy Duty Vehicles, November 2005
Emissions from Chip Van travel over dirt road surfaces PM10 g/mile traveled Unpaved Road (1) 2.1 Source: (1) California Air Resources Board, Emission Inventory, Section 7.10, Unpaved Road Dust (Non-Farm Roads)
Chipper Equipment Emission Factors Engine Engine Emission Factor (1) NOx VOC PM10 CO g/HP-hr g/HP-hr g/HP-hr g/HP-hr Tier I, 300-750 HP 5.93 0.38 0.12 5 Tier II, 300-750 HP 3.79 0.12 0.088 4 Tier III, 300-750 HP 2.32 0.12 0.088 3 Source: (1) Carl Moyer Program Guidelines, Agricultural Engines, Off-Road Diesel, Table B-12, November 2005

Forest Biomass Removal on National Forest Lands First Progress Report
24
Engine Emission Factor (1) NOx VOC PM10 CO
lb/wet
ton lb/wet
ton lb/wet ton lb/wet ton Tier I 0.1829 0.0117 0.0037 0.1542 Tier II 0.1169 0.0037 0.0027 0.1233 Tier III 0.0715 0.0037 0.0027 0.0925 Source: (1)Carl Moyer Program Guidelines, Agricultural Engines, Off-Road Diesel, Table B-12, November 2005. Also assumes a 700 HP grinder processing 50 green tons slash per hour.
Uncontrolled (1) Controlled (2)
PM10 PM10 lb/green ton lb/green ton
0.35 0.105
Sources: (1) EPA, AP-42, Log Sawing, Chapter 12 (2) PM control efficiency of 70% with water spray (3) EPA, AP-42, Log Debarking, Chapter 12, 0.024 lb PM/ton

Forest Biomass Removal on National Forest Lands First Progress Report
25
Appendix B – Foresthill Fire Protection District

Forest Biomass Removal on National Forest Lands First Progress Report
26
Appendix C – Daily Operation Performance Data
Date Chip Van Loads
Chip Production Landing #
Equipment Operation
Fuel Usage Chipping
Grinder Loader Excavator Green Tons/operating
hour (bone dry tons) (green tons) (hours) (gal) gal gal gal
4/14/08 2 23.5 43.3 2 2.5 93.5 75 6.5 12 17.3 4/15/08 5 57.6 116.5 2 11.8 0 9.9 4/16/08 6 80.1 148.7 2 2.8 105 84 7 14 53.1 4/17/08 7 84.9 162.9 2 5.8 218 174 15 29 28.1 4/18/08 1 12.9 23.0 2 4/21/08 1 13.7 24.5 2 4/22/08 5 73.2 124.0 2 1.8 68 54 5 9 68.9 4/23/08 1 13.0 22.9 2 2.3 86 69 6 11 9.9 4/24/08 3.3 124 99 9 16 0.0 4/25/08 3 35.6 74.5 2 4/28/08 1 13.4 25.4 2 5/5/08 4 54.5 120.2 BFP 3.1 116 93 8 15 38.8 5/6/08 8 123.6 195.8 BFP 2.2 83 66 6 11 89.0 5/7/08 10 135.9 253.9 BFP 3.1 116 93 8 15 81.9 5/8/08 8 103.4 211.6 BFP 2.6 98 78 7 13 81.4 5/9/08 9 130.0 217.8 BFP 2.8 105 84 7 14 77.8
5/12/08 7 107.7 166.5 BFP 3.5 132 105 9 18 47.6 5/13/08 6 83.7 149.5 BFP 1.9 71 57 5 9 78.7 5/27/08 4 71.1 102.4 BFP 1.7 63 51 4 8 60.2 5/28/08 3 30.9 69.2 BFP 0.7 26 21 2 3 98.9 5/29/08 8 118.0 213.4 BFP 4.8 180 144 12 24 44.4 5/30/08 9 119.4 225.2 BFP 2.0 75 60 5 10 112.6 6/2/08 8 102.9 185.3 BFP 3.1 116 93 8 15 59.8 6/3/08 7 79.0 157.4 1 4.8 180 144 12 24 32.8 6/4/08 1 11.7 21.3 1 6/5/08 8 112.5 192.4 1 4.5 169 135 12 22 42.8 6/6/08 7 91.4 183.3 1 5.1 191 153 13 25 35.9 6/9/08 11 131.8 244.5 1 5.5 206 165 14 27 44.4
6/10/08 6 83.8 138.0 1, 3 4.3 161 129 11 21 32.1

Forest Biomass Removal on National Forest Lands First Progress Report
27
Date Chip Van Loads
Chip Production Landing #
Equipment Operation
Fuel Usage Chipping
Grinder Loader Excavator Green Tons/operating
hour 6/11/08 10 152.6 234.4 3 5.2 196 156 14 26 45.1 6/12/08 8 108.9 198.9 3 5.5 206 165 14 27 36.2 6/13/08 7 110.0 170.4 3 4.7 176 141 12 23 36.2 6/16/08 7 95.4 158.6 3 3.5 131 105 9 17 45.3 6/17/08 7 96.3 156.8 4, 5 5.4 203 162 14 27 29.0 6/18/08 8 109.6 178.8 4, 5 3.3 124 99 9 16 54.2 6/20/08 5 73.7 104.1 6 6.3 236 189 16 31 16.5 6/23/08 8 107.2 187.6 6 6.1 229 183 16 30 30.7 6/24/08 2 29.0 47.2 6 3.4 128 102 9 17 13.9 6/25/08 10 144.9 253.9 6 4.3 161 129 11 21 59.1 6/26/08 8 116.1 196.4 6, 7 5.6 211 168 15 28 35.1 6/27/08 9 127.8 227.8 7 3.7 139 111 10 18 61.6 7/9/08 5 62.9 91.4 8 5.0 188 150 13 25 18.3
7/10/08 8 114.8 169.6 8 4.9 184 147 13 24 34.6 7/11/08 9 124.6 208.8 8 4.9 184 147 13 24 42.6 7/16/08 7 116.0 152.0 8 5.5 206 165 14 27 27.6 7/17/08 8 133.8 180.7 8 5.8 218 174 15 29 31.2 7/18/08 5 78.0 107.2 8 4.5 169 135 12 22 23.8 7/21/08 2 29.8 45.4 8 7/22/08 4 76.9 99.6 8 2.1 78 63 5 10 47.4 7/23/08 4 84.2 106.2 8 2.5 93 75 6 12 42.5 7/24/08 8 0.1 4 3 0.5 0.5 0.0 8/1/08 3.0 63 40 8 15 0.0 8/4/08 3.2 70 46 8 16 0.0 8/5/08 4.4 165 132 11 22 0.0 8/6/08 2.1 78 63 5 10 0.0