Embed Size (px)
Citation preview
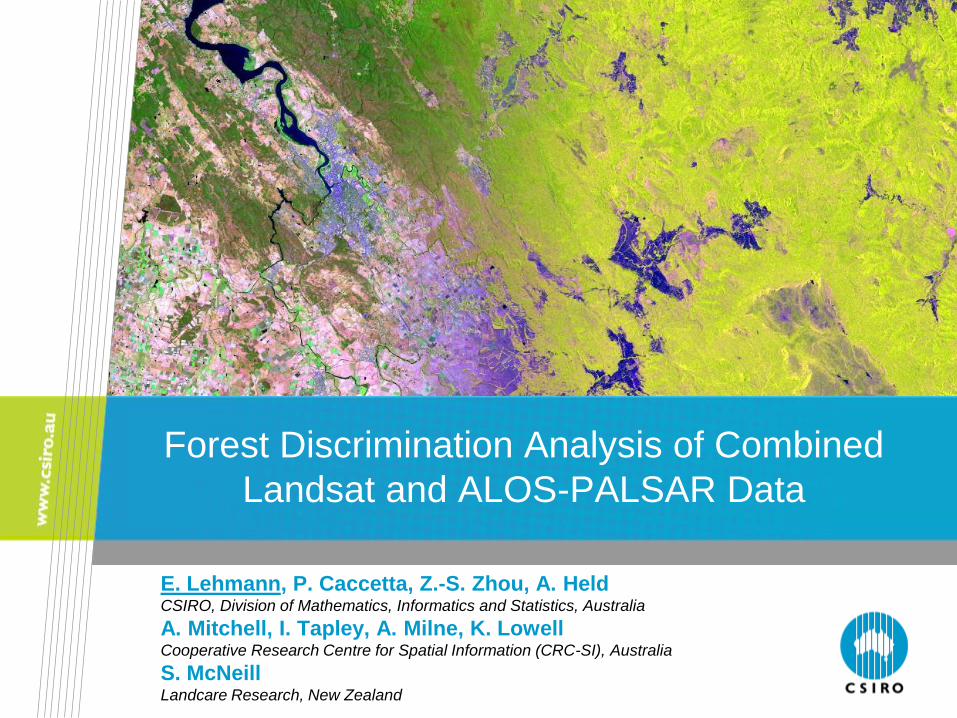
Forest Discrimination Analysis of Combined
Landsat and ALOS-PALSAR Data
E. Lehmann, P. Caccetta, Z.-S. Zhou, A. Held CSIRO, Division of Mathematics, Informatics and Statistics, Australia
A. Mitchell, I. Tapley, A. Milne, K. Lowell Cooperative Research Centre for Spatial Information (CRC-SI), Australia
S. McNeill Landcare Research, New Zealand
E. Lehmann et al.: Forest Discrimination Analysis of Combined Landsat and ALOS-PALSAR Data
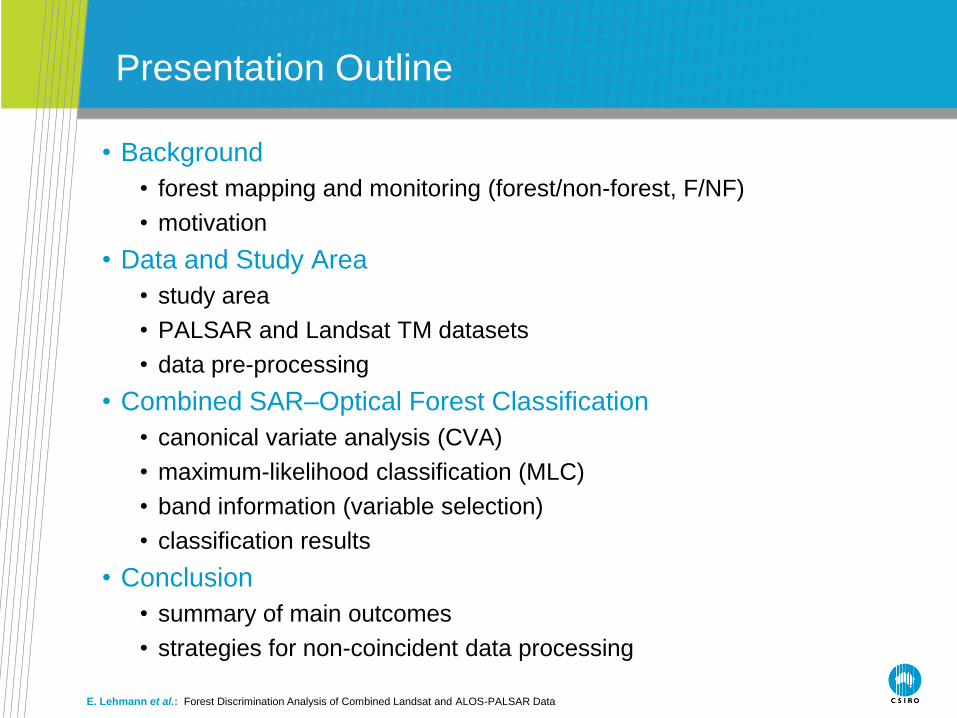
Presentation Outline
• Background
• forest mapping and monitoring (forest/non-forest, F/NF)
• motivation
• Data and Study Area
• study area
• PALSAR and Landsat TM datasets
• data pre-processing
• Combined SAR–Optical Forest Classification
• canonical variate analysis (CVA)
• maximum-likelihood classification (MLC)
• band information (variable selection)
• classification results
• Conclusion
• summary of main outcomes
• strategies for non-coincident data processing
E. Lehmann et al.: Forest Discrimination Analysis of Combined Landsat and ALOS-PALSAR Data
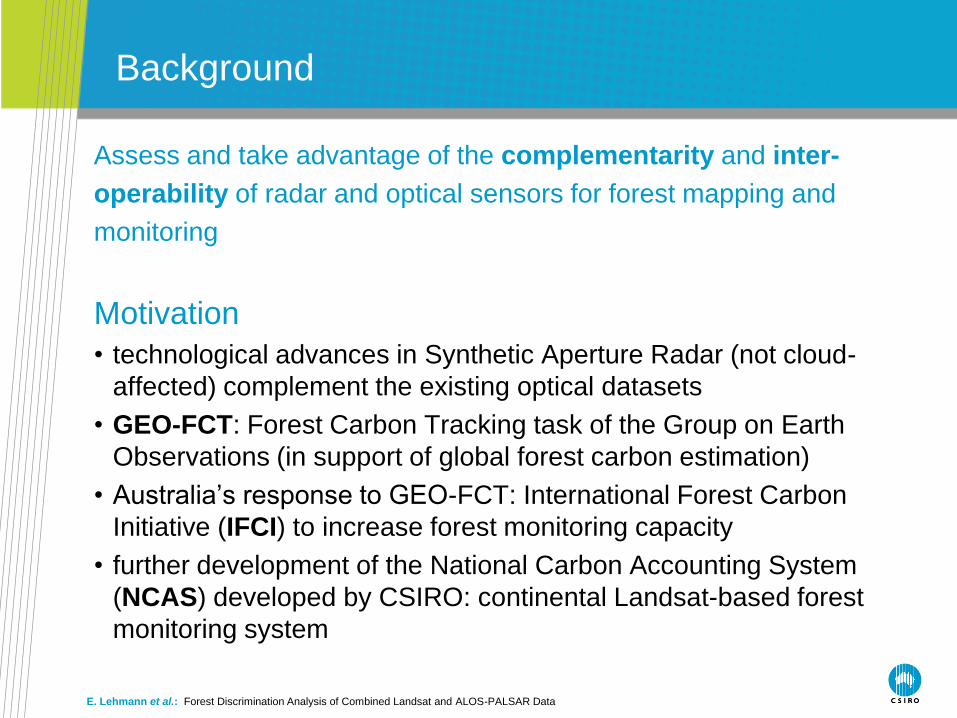
Background
Assess and take advantage of the complementarity and inter-
operability of radar and optical sensors for forest mapping and
monitoring
Motivation
• technological advances in Synthetic Aperture Radar (not cloud-
affected) complement the existing optical datasets
• GEO-FCT: Forest Carbon Tracking task of the Group on Earth
Observations (in support of global forest carbon estimation)
• Australia’s response to GEO-FCT: International Forest Carbon
Initiative (IFCI) to increase forest monitoring capacity
• further development of the National Carbon Accounting System
(NCAS) developed by CSIRO: continental Landsat-based forest
monitoring system
E. Lehmann et al.: Forest Discrimination Analysis of Combined Landsat and ALOS-PALSAR Data
Data and Study Area
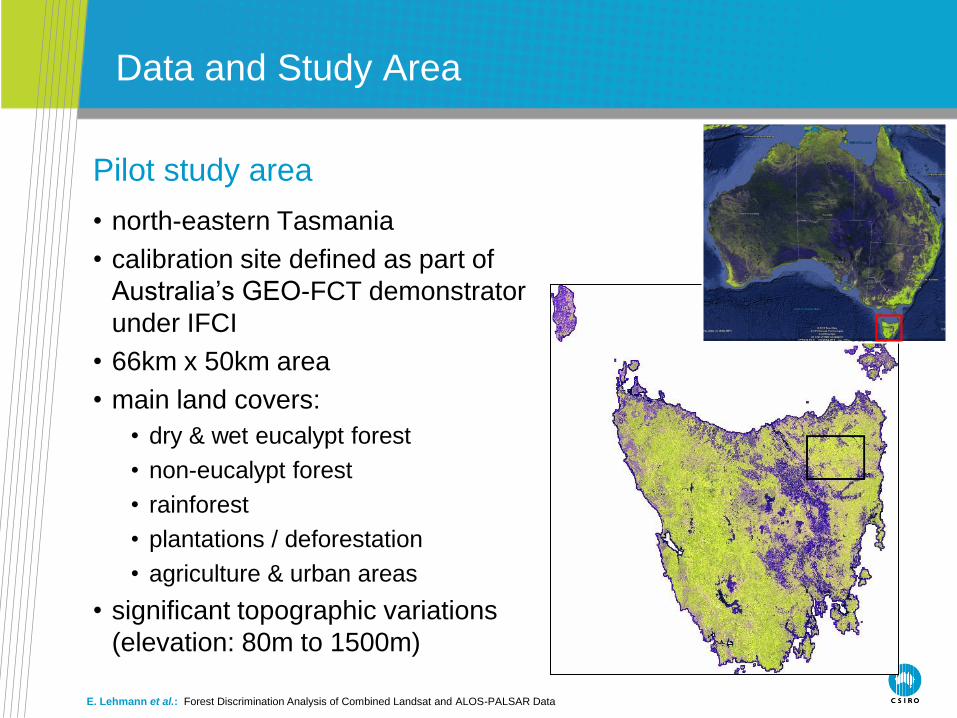
Pilot study area
• north-eastern Tasmania
• calibration site defined as part of
Australia’s GEO-FCT demonstrator
under IFCI
• 66km x 50km area
• main land covers:
• dry & wet eucalypt forest
• non-eucalypt forest
• rainforest
• plantations / deforestation
• agriculture & urban areas
• significant topographic variations
(elevation: 80m to 1500m)
E. Lehmann et al.: Forest Discrimination Analysis of Combined Landsat and ALOS-PALSAR Data
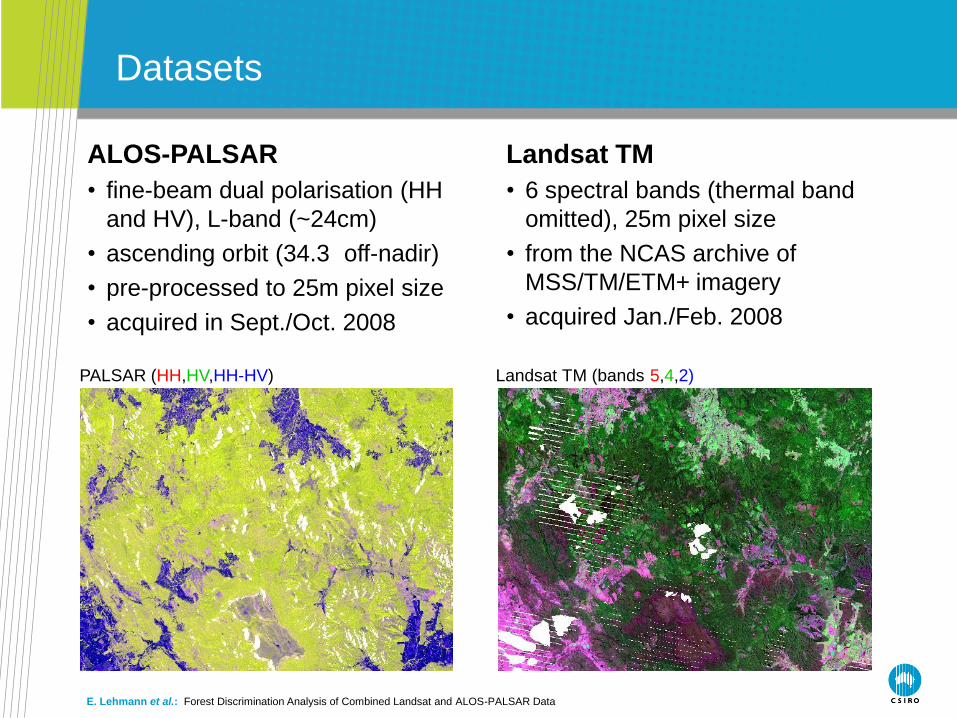
Datasets
Landsat TM
• 6 spectral bands (thermal band
omitted), 25m pixel size
• from the NCAS archive of
MSS/TM/ETM+ imagery
• acquired Jan./Feb. 2008
PALSAR (HH,HV,HH-HV) Landsat TM (bands 5,4,2)
ALOS-PALSAR
• fine-beam dual polarisation (HH
and HV), L-band (~24cm)
• ascending orbit (34.3 off-nadir)
• pre-processed to 25m pixel size
• acquired in Sept./Oct. 2008
E. Lehmann et al.: Forest Discrimination Analysis of Combined Landsat and ALOS-PALSAR Data
Data Pre-Processing
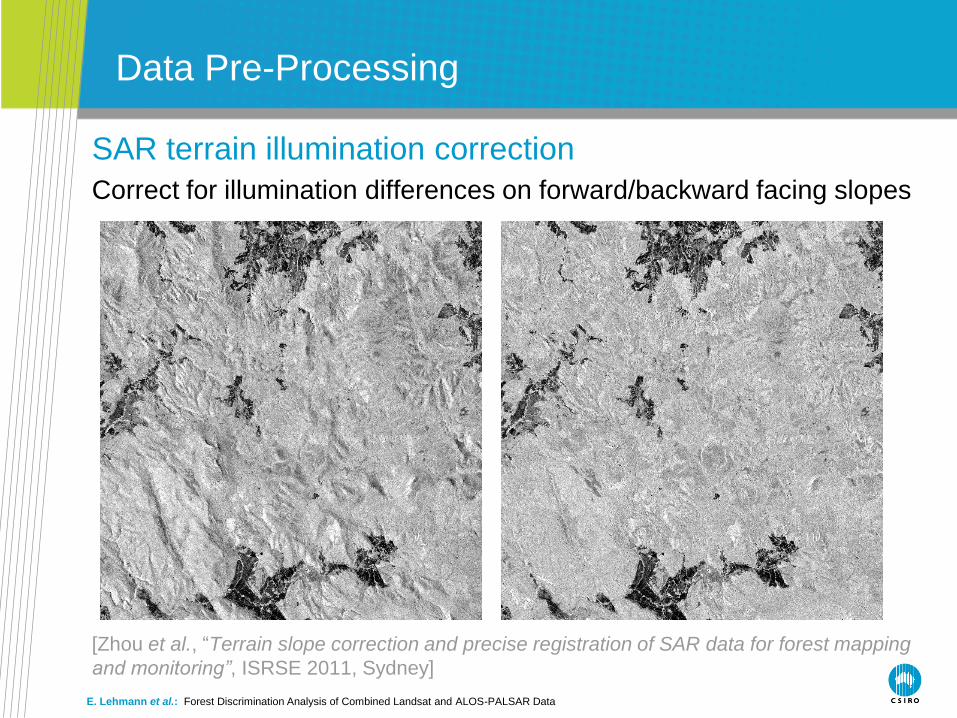
SAR terrain illumination correction
Correct for illumination differences on forward/backward facing slopes
[Zhou et al., “Terrain slope correction and precise registration of SAR data for forest mapping
and monitoring”, ISRSE 2011, Sydney]
E. Lehmann et al.: Forest Discrimination Analysis of Combined Landsat and ALOS-PALSAR Data
Data Pre-Processing
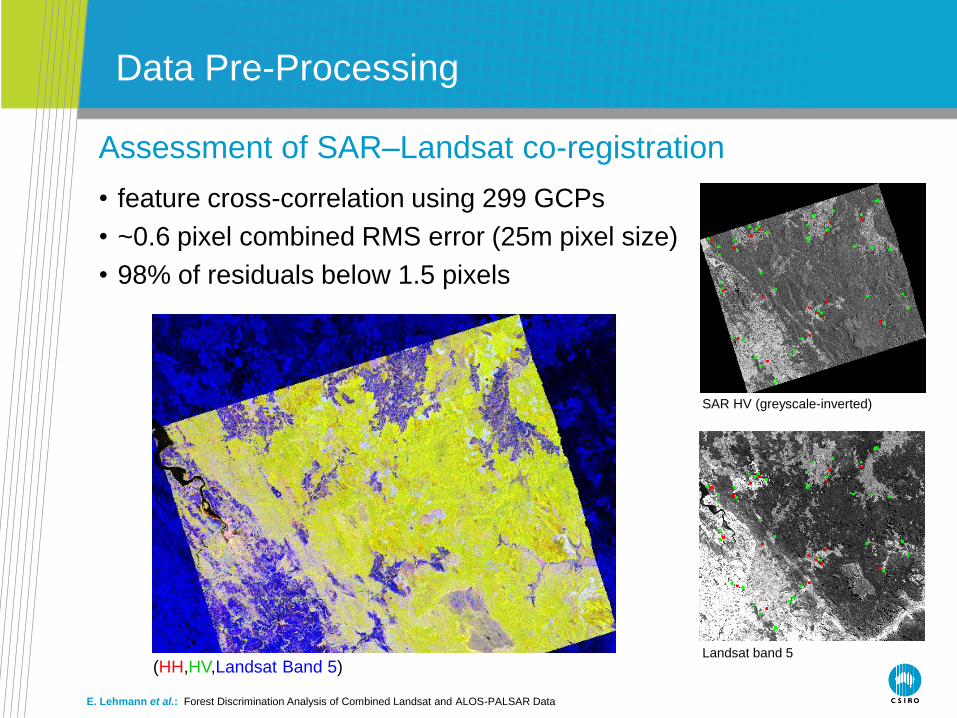
Assessment of SAR–Landsat co-registration
• feature cross-correlation using 299 GCPs
• ~0.6 pixel combined RMS error (25m pixel size)
• 98% of residuals below 1.5 pixels
SAR HV (greyscale-inverted)
Landsat band 5
(HH,HV,Landsat Band 5)
E. Lehmann et al.: Forest Discrimination Analysis of Combined Landsat and ALOS-PALSAR Data
SAR–Optical F/NF Classification
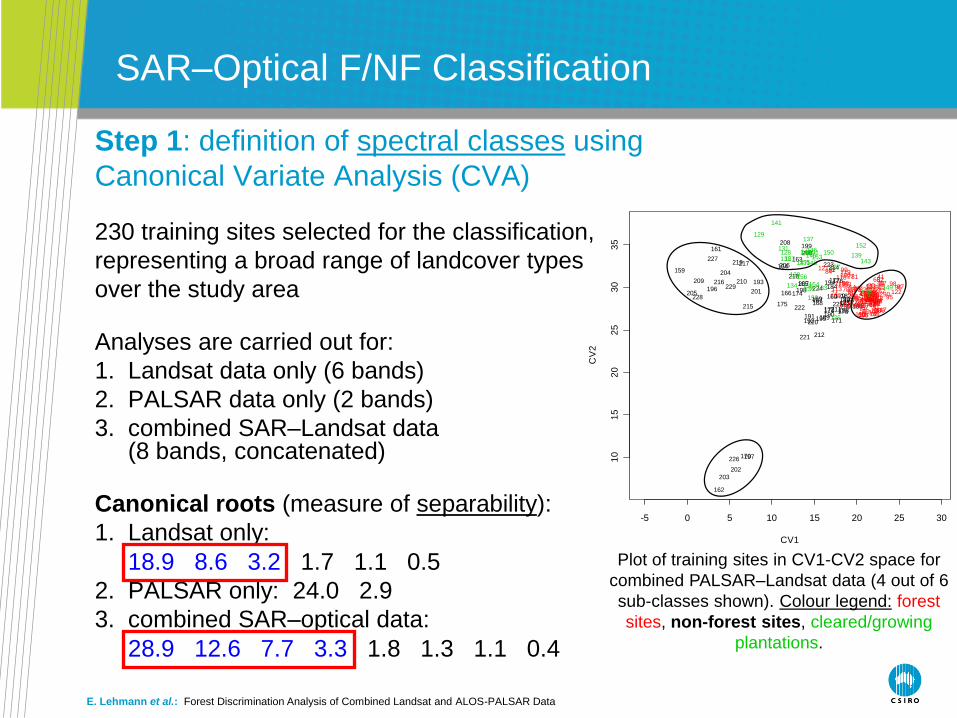
Step 1: definition of spectral classes using
Canonical Variate Analysis (CVA)
230 training sites selected for the classification,
representing a broad range of landcover types
over the study area
Analyses are carried out for:
1. Landsat data only (6 bands)
2. PALSAR data only (2 bands)
3. combined SAR–Landsat data (8 bands, concatenated)
Canonical roots (measure of separability):
1. Landsat only:
18.9 8.6 3.2 1.7 1.1 0.5
2. PALSAR only: 24.0 2.9
3. combined SAR–optical data:
28.9 12.6 7.7 3.3 1.8 1.3 1.1 0.4
-5 0 5 10 15 20 25 30
10
15
20
25
30
35
CV1
CV
2
CVA results -- 2008_ago_sk55__AOI_pwr_fil2_trsites_all3
159
160
161
162
163164
165
166167168169
170
171
172173
174
175
176177
178
179180
181
182183
184
185
188189190191
192
193 194
195
196
197
198
199200
201
202
203
204
205
206
207
208
209 210
211
212
213
214
215
216
217
218
219
220
221
222
223
224
225
226
227
228
229
230
1
2 34
567 8
910
11
12
1314
151617
1819
202122
23
24
25
26
27
2829
303132
33 3435
3637
3839
4041
4243444546
474849
50
5152
53
5455
56
57585960
616263
646566
67
68
69
70 7172
7374 75
76
77
78
79
80
8182
83
84
85
86
87
88
89
9091929394
95
969798
99100
101
102103
104105 106
107
108109
110
111112
113114
115116
117
118119
120
121
122123
124125
126
127
128
129
130
131
132
133134 135136
137
138
139140
141
142
143
144145146
147148
149
150151152
153
154
155
156
157
158
Plot of training sites in CV1-CV2 space for
combined PALSAR–Landsat data (4 out of 6
sub-classes shown). Colour legend: forest
sites, non-forest sites, cleared/growing
plantations.
E. Lehmann et al.: Forest Discrimination Analysis of Combined Landsat and ALOS-PALSAR Data
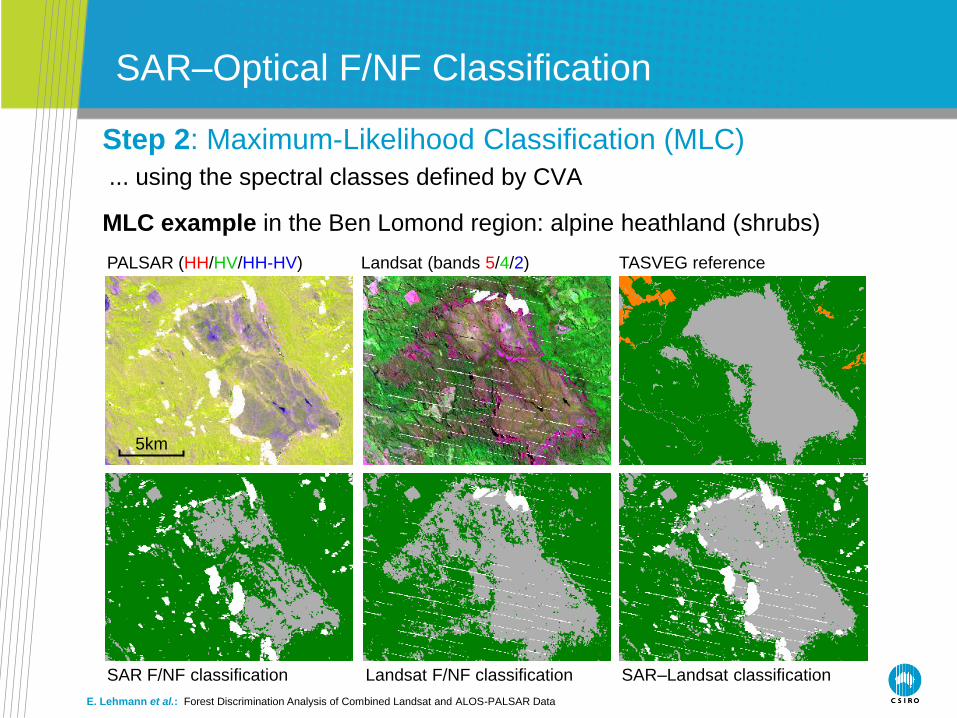
Step 2: Maximum-Likelihood Classification (MLC)
... using the spectral classes defined by CVA
MLC example in the Ben Lomond region: alpine heathland (shrubs)
SAR–Optical F/NF Classification
PALSAR (HH/HV/HH-HV) Landsat (bands 5/4/2) TASVEG reference
SAR F/NF classification Landsat F/NF classification SAR–Landsat classification
5km
E. Lehmann et al.: Forest Discrimination Analysis of Combined Landsat and ALOS-PALSAR Data
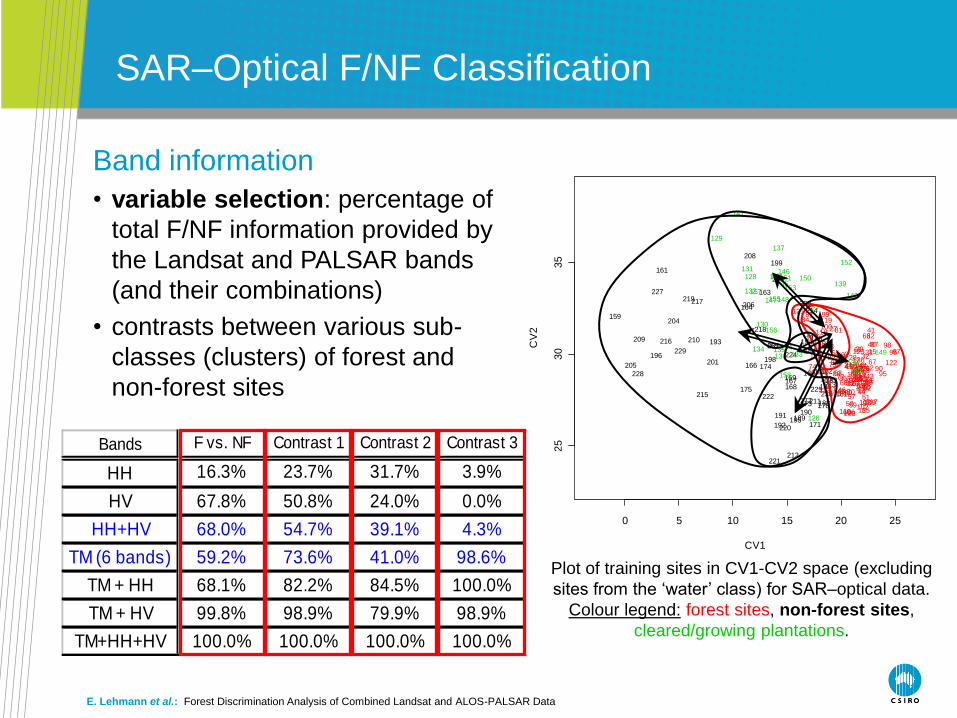
Bands F vs. NF Contrast 1 Contrast 2 Contrast 3
HH 16.3% 23.7% 31.7% 3.9%
HV 67.8% 50.8% 24.0% 0.0%
HH+HV 68.0% 54.7% 39.1% 4.3%
TM (6 bands) 59.2% 73.6% 41.0% 98.6%
TM + HH 68.1% 82.2% 84.5% 100.0%
TM + HV 99.8% 98.9% 79.9% 98.9%
TM+HH+HV 100.0% 100.0% 100.0% 100.0%
SAR–Optical F/NF Classification
0 5 10 15 20 25
25
30
35
CV1C
V2
159
160
161
163
164
165
166
167168
169
171
172173
174
175
176177
178
179180
181
182
183
184
185
188
189190191
192
193 194
195
196198
199
200
201
204
205
206
207
208
209 210
211
212
213
214
215
216
217
218
219
220
221
222
223
224
225
227
228
229
230
1
2 3
4
5
67
8
9
10
11
12
13
14
15
1617
18
19
2021
22
23
24
25
26
27
28
29
30 3132
33 3435
36
37
3839
40
41
4243
444546
4748
49
50
51
52
53
54
55
56
575859
60
61
6263
646566
67
68
69
7071
72
73
74 7576
77
78
79
80
81
82
83
84
85
86
87
88
89
9091
9293
94
95
969798
99
100
101
102103
104
105106
107
108
109
110
111112
113
114
115116
117
118
119
120
121
122
123
124
125
126
127
128
129
130
131
132
133134 135
136
137
138
139140
141
142
143
144145
146
147148
149
150151
152
153
154
155
156
157
158
Band information
• variable selection: percentage of
total F/NF information provided by
the Landsat and PALSAR bands
(and their combinations)
• contrasts between various sub-
classes (clusters) of forest and
non-forest sites
Plot of training sites in CV1-CV2 space (excluding
sites from the ‘water’ class) for SAR–optical data.
Colour legend: forest sites, non-forest sites,
cleared/growing plantations.
E. Lehmann et al.: Forest Discrimination Analysis of Combined Landsat and ALOS-PALSAR Data
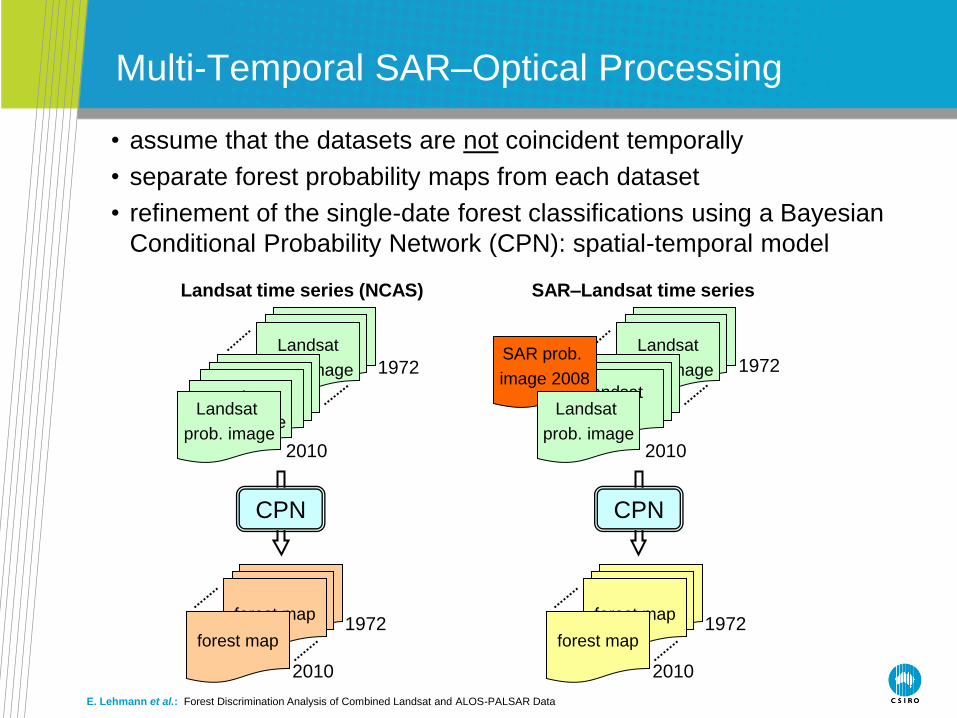
Multi-Temporal SAR–Optical Processing
• assume that the datasets are not coincident temporally
• separate forest probability maps from each dataset
• refinement of the single-date forest classifications using a Bayesian
Conditional Probability Network (CPN): spatial-temporal model
Landsat
prob. image
1972
2010
Landsat
Landsat
prob. image
CPN
forest map 1972
2010
forest map
Landsat
prob. image
2010
Landsat
SAR prob.
image 2008
CPN
forest map 1972
2010
forest map
Landsat
prob. image
Landsat
prob. image
Landsat time series (NCAS) SAR–Landsat time series
1972
E. Lehmann et al.: Forest Discrimination Analysis of Combined Landsat and ALOS-PALSAR Data
Conclusion
Summary
• SAR and optical sensors are inter-operable and provide
complementary information for forest mapping and monitoring
• jointly considering PALSAR and Landsat data improves the
forest/non-forest classification significantly:
◦ adding SAR bands (HH+HV) to the optical data provides one additional
dimension for classification
◦ in PALSAR, the HV polarisation provides most of the discrimination
information
◦ significant variation in the respective contribution of the PALSAR and
Landsat bands towards the separation of specific sub-classes of forest
and non-forest sites
• strategies for dealing with non-coincident datasets:
◦ use of a multi-temporal approach (e.g. conditional probability network)
◦ check for atypical spectral signatures in the maximum-likelihood
classification

Contact Us
Phone: 1300 363 400 or +61 3 9545 2176
Email: [email protected] Web: www.csiro.au
Thank you...
CSIRO Mathematics, Informatics & Statistics Eric A. Lehmann, Research Scientist
Phone: +61 (0)8 9333 6123
Email: [email protected]
Web: http://www.csiro.au/org/CMIS.html