Embed Size (px)
Citation preview
PS
MEa
b
a
ARRA
KGNWS
1
e(hadRscdefl
P
0d
Forest Ecology and Management 259 (2010) 1959–1970
Contents lists available at ScienceDirect
Forest Ecology and Management
journa l homepage: www.e lsev ier .com/ locate / foreco
rescribed burning effects on the hydrologic behavior of gullies in theouth Carolina Piedmont
arco A. Galanga,1, Lawrence A. Morrisa, Daniel Markewitza,∗, C. Rhett Jacksona,mily A. Carterb
The University of Georgia, Athens, GA 30602, USAUSDA Forest Service, Southern Research Station, Auburn, AL, USA
r t i c l e i n f o
rticle history:eceived 10 August 2009eceived in revised form 8 February 2010ccepted 9 February 2010
eywords:ully erosiononpoint source pollutionater perching
urface runoff
a b s t r a c t
Gullies found in the Piedmont of South Carolina are legacies of past land use and erosion. Although themajority of these gullies are now under forest vegetation and perceived as geomorphologically stable, thequestion of gully contribution to nonpoint source pollution remains undetermined, especially when thesegullies are subjected to prescribed burning or other forest disturbance. Six prescribed burned and tworeference gullies draining mature pine stands grown on former cotton fields were instrumented at theLong Cane Ranger District, Sumter National Forest, South Carolina to characterize the hydrologic behaviorof these gullies and to investigate response to prescribed burning. Flow in the gullies was observed forone year of pre-burn and one year of post-burn conditions. Hydrologic behavior of these eight gulliesvaried greatly in the pre-treatment period. During the study, 48 rainfall events exceeding 12.7 mm wererecorded, but one reference gully never produced flow and three treatment gullies flowed during three
events or less and only in the pre-burn period. Although significant storm events occurred throughout theyear, all gully flow events occurred between December and March. Double-mass and graphical analysisof relative stormflow production of the reference and treatment gullies in the pre- and post-treatmentperiods did not indicate an effect of the controlled burn on flow behavior, but the post-burn year wascharacterized by drought. The observed inter-annual variation in gully behavior was large. Observationsof local groundwater conditions with piezometers and electrical resistivity surveys indicated that gullyflows were controlled by the presence of a flow-restricting layer below the gully bed.. Introduction
The Piedmont region of South Carolina suffered severe soilrosion from 1860 to 1920 due to deforestation and cultivationTrimble, 1974; Richter and Markewitz, 2001). Evidence of thisistory is recognizable in the turbid conditions of today’s riversnd streams that are unlike those of pre-European colonizationescribed by William Bartram (Jackson et al., 2005; Harper, 1998).emnant agricultural gullies are a ubiquitous feature of land under
econdary forest vegetation growing on areas once cultivated forotton. These gullies formed when high soil surface hydraulic con-uctivities of the pre-European forest were greatly reduced by thelimination of vegetative cover and organic soil horizons (forestoor) that resulted in Hortonian overland flow. After the collapse of∗ Corresponding author. Tel.: +1 706 542 0133.E-mail address: [email protected] (D. Markewitz).
1 Current address: University of the Philippines Los Banos, College, Laguna 4030,hilippines.
378-1127/$ – see front matter © 2010 Elsevier B.V. All rights reserved.oi:10.1016/j.foreco.2010.02.007
© 2010 Elsevier B.V. All rights reserved.
the cotton farming economy, much of the Piedmont reverted to for-est, and these gullies have been healing (i.e., aggrading with soil andorganic material, growing trees within the gully banks, increasingtheir surficial infiltration rates). However, studies of remnant gullyhydrology are few, and little is known about the hydrologic activ-ity of these remnant gullies or the effects of silvicultural activities,particularly prescribed fire or timber harvest, on their hydrologicactivity (Hansen and Law, 2006).
Many remnant agricultural gullies become more active aftertimber harvest (Rivenbark and Jackson, 2004) and such gullieshave been identified as significant contributors to nonpoint sourcepollution after timber harvest (Hewlett and Doss, 1984). The con-tribution of these gullies, through continued erosion, to the overallsediment production of a watershed is typically unaccounted for inerosion models (e.g. WEPP and USLE; Poesen et al., 2003) and, yet,
could play a significant role in producing nonpoint source pollution.Nonpoint source pollution associated with sediment is a keyissue in the southern United States (Neary et al., 1989; Baker,1992). In forested watersheds, best management practices areimplemented to minimize sediment input to streams. These prac-

1960 M.A. Galang et al. / Forest Ecology and Ma
Tab
le1
Mor
ph
olog
ical
pro
per
ties
for
inst
rum
ente
dgu
llie
sw
ith
inth
eSu
mte
rN
atio
nal
Fore
stin
the
Pied
mon
tof
Sou
thC
arol
ina.
Init
ialm
easu
rem
ents
wer
eta
ken
in20
07p
rior
toa
Mar
ch13
pre
scri
bed
burn
.
Gu
lly
Trea
tmen
tC
ontr
ibu
tin
gar
ea(h
a)Sl
ope
(%)
Hea
dcu
t(m
)C
SaLe
ngt
hA
vera
gew
idth
Dep
thG
ull
ybe
dPr
e-bu
rnco
ver
(%)b
Con
trib
uti
ng
area
Post
-bu
rnco
ver
(%)c
Dep
thW
idth
(%)
(m)
(m)
(m)
FFC
CA
PM
S
AB
urn
ed0.
36
0.8
3.9
1468
5.9
1.5
100
9233
578
2B
Bu
rned
0.3
62.
912
.35
409.
52.
796
9446
4014
0C
Bu
rned
0.3
152.
15.
211
549.
23.
010
095
2650
231
DB
urn
ed0.
87
2.7
11.5
968
6.2
2.1
9693
4736
170
EB
urn
ed0.
38
0.8
2.1
1150
2.4
0.9
9692
2346
310
FB
urn
ed0.
24
1.6
2.0
652
4.3
1.2
100
8921
4928
1G
Un
burn
ed0.
77
1.3
4.8
1790
7.9
2.0
9692
nad
na
na
na
HU
nbu
rned
0.1
161.
34.
46
364.
31.
496
92n
an
an
an
a
aC
S,co
ntr
ibu
tin
gsl
ope
mea
sure
dab
ove
the
hea
dcu
t.b
FF,f
ores
tfl
oor;
CC
,can
opy
cove
r.c
A,f
ull
yco
nsu
med
litt
erla
yer;
P,p
arti
ally
con
sum
edli
tter
laye
r;M
,min
eral
soil
exp
osed
;S,
rock
orst
one.
dN
A,n
otap
pli
cabl
e.
nagement 259 (2010) 1959–1970
tices often focus on activities proximal to streams (Lynch et al.,1985) with little regard to gully networks. If gullies behave likeephemeral streams, policies pertaining to prevention of sedimentmovement might logically be extended to include these land fea-tures. This is especially true for gullies that connect directly toperennial streams and, thus, can readily facilitate direct trans-port of sediments and nutrients from upslope areas. In a surveyof recently clearcut and site prepared forest management units,Rivenbark and Jackson (2004) found that for 50% of the observationswhere “breakthrough of sediment” occurred (i.e., areas where sedi-ment passed the Streamside Management Zones (SMZ) and enteredstream channels) there was topographical convergence associatedwith swales or gullies. Currently, South Carolina Best ManagementPractices (BMP; South Carolina Forestry Commission) defines agully as “an eroded channel (generally at least 25 cm deep), whichhas deepened to the point that it cannot be removed by tillage”and recommends the maintenance of vegetation and minimal soildisturbance during forest operations.
Prescribed burning is a forest management strategy practiced inmany managed pine stands in the southeastern United States forfuel reduction and wildlife management. Prescribed burning is alsoused to restore the fire-regime associated with longleaf pine standslong suppressed by previous policies (Youngblood et al., 2005;Wade and Lunsford, 1989). Re-introducing fire to southern hard-wood forest is also under consideration (Fire and Fire SurrogatesStudy, 2008). Some studies have shown negative impacts of pre-scribed burning on sediment and nutrient movement. Wright etal. (1976) found adverse effects of prescribed burning on soil lossand water quality on moderate to steep slopes covered with Ashejuniper (Juniperus ashei). Townsend and Douglas (2000) observedhigher total suspended sediments and volatile suspended sedi-ments in catchments of Australia as a result of reduction in groundcover from burning. In contrast, other studies have shown thatprescribed fire has little effect on soil erosion and can increasesoil nutrient content. Van Lear and Danielovich (1988) recordedinsignificant soil movement in a logging slash burn in the southernAppalachians. An increase in soil nutrient content occurred after theburn, and was mostly attributed to the combustion of organic mate-rials (Carter and Foster, 2004; Certini, 2005). In the case of nitrogen(N), the influx of native herbaceous N-fixing legumes can compen-sate for the amount volatilized during the burn (Hendricks andBoring, 1999; Boring et al., 2004). Discrepancies between resultsof these studies may result partly from differences in fire intensityand severity (Neary et al., 1999).
Previous evaluations of the effect of prescribed burning on agullied landscape are limited. Douglass and Van Lear (1983) investi-gated the effect of prescribed burning on watersheds with “healed”gullies and found no significant effect on storm runoff, sedimentconcentration, and transport. However, their investigation wasconducted at a watershed level and the contribution and behav-ior of individual gullies were not measured. Cushwa et al. (1971)studied individual gullies in South Carolina and concluded therewas no significant effect of prescribed burning on soil movement.
There is a clear need for further investigation of individualgullies, especially after a prescribed burn, to determine the rolegullies play in the transport of sediment and nutrient from ups-lope to downslope areas. We instrumented eight remnant gullieson United States Forest Service land in the South Carolina Pied-mont with flumes, stage recorders, and piezometers, and wemeasured gully soil profiles as well as water table dynamics toinvestigate three hypotheses: (1) prescribed fire increases the fre-
quency and volume of stormflow within gullies, (2) prescribedfire increases the fluxes of nutrients and sediments from gullies,and (3) stormflow volumes within gullies increase with increas-ing surficial contributing area. Observations were made on tworeference gullies and six treatment gullies, all of which were
M.A. Galang et al. / Forest Ecology and Management 259 (2010) 1959–1970 1961
F e Lonb
mfi
2
2
t8iwLiTmfSokHvarDlsagdibW
2
wwl
ig. 1. Gullies instrumented with 90◦ V-notch weir and stormwater sampler at thurned March 13, 2007 while gullies G and H served as controls.
onitored one year prior to, and one year following, prescribedre.
. Materials and methods
.1. Location and description of the study site
This study was conducted in the Long Cane Ranger Dis-rict, Sumter National Forest, South Carolina (34◦7′55.36′′N,2◦18′36.17′′W). The region was subjected to deforestation and
ntensive cotton cultivation from the late 1800s to early 1900s,hich resulted in massive gully formation (Trimble, 1974). The
ong Cane District is in the Piedmont physiographic region ands dominated by the Cecil soil series (fine, kaolinitic, thermicypic Kanhapludults), characterized as “very deep, well-drainedoderately permeable soils formed in residuum weathered from
elsic, igneous and high-grade metamorphic rocks” (Soil Surveytaff, Natural Resources Conservation Service, U.S. Departmentf Agriculture, 2007). Associated soil series include Pacolet (fine,aolinitic, thermic Kanhapludults; shallower B horizon) andiwassee (fine, kaolinitic, thermic Rhodic Kanhapludults; allu-ium parent material) soils. Elevation ranges from 120 to 180 mbove sea level, slope varies from 2 to 12%, and average annualainfall is 1210 mm distributed evenly throughout the year (U.S.epartment of Agriculture, 1980). Vegetative cover consists of
oblolly pine (Pinus taeda) of about 40 years old with occa-ional similarly aged hardwood trees established in gully bedsnd side slopes. The understory vegetation is mostly sweet-um (Liquidambar styraciflua) and briars (Rubus spp.). Forest floorepth ranges from 3 to 5 cm. Previous silvicultural treatments
nclude intermediate thinning in 1997 and 1999 and prescribedurning with the last prescribed burn on February 20, 2004 (S.ilhelm, personal communication, April 3, 2008).
.2. Gully description and instrumentation
Eight gullies ranging in size from 36 to 90 m long, 2.4 to 9.5 mide, and 0.9 to 3.0 m deep were instrumented with 90◦ V-notcheirs between November and December 2005 (Table 1). Morpho-
ogical properties of the individual gullies were measured following
g Cane Ranger District, Sumter National Forest, South Carolina. Gullies A–F were
the procedure outlined in Galang et al. (2007), with the excep-tion of conducting the measurements between the headcut andweir instrumentation point instead of to the gully mouth. The con-tributing area for each gully, based on the relief and observedsource of surface runoff, was mapped using a Trimble GeoExplorer3 Global Positioning System (GPS) (Trimble Navigation Limited,Sunnyvale, California). Gully bed cover was assessed also follow-ing Galang et al. (2007), where four transects perpendicular to thegully length were established in the gully bed and surface coverat points along these transects recorded. A spherical densiome-ter was used to measure canopy cover at each transect location.Six treated gullies were adjacent to each other, within two man-agement compartments, while the two reference gullies were in aseparate location that was not scheduled for burning <5 km fromthe other six (Fig. 1).
Data-logging pressure transducers and stormwater samplers(Global Water Sampler WS750, Global Water Instrumentation, GoldRiver, California) were installed in each gully to measure stageheight and collect runoff samples for analyses (Fig. 2). In each gully,the nadir of the weir’s V-notch was set at about 15 cm above thesoil surface, resulting in a dead storage space below this height.As such, below 15 cm stage height, a volume–stage relationshipwas developed using the gully slope and width at the point of weirinstrumentation to estimate runoff volume. A positive change instage indicated an influx of runoff (i.e., a flow event) and the flowrate was determined by dividing the change in volume by the timeinterval. A negative change in stage height after a flow event wasconsidered “no flow.” Stage height above 15 cm was converted toa flow rate using the Cone Equation (Water Measurement Manual,2001). Runoff volume was calculated from the hydrograph area ofeach flow event, integrating flow rate by each time step (Volume attime i = Flow rate at time i × 2 min), then adding up all the volumesat each time step (
∑ni=1Volumei). Runoff volume for each gully was
converted to depth by dividing by the contributing area of the gully.Two HOBO® data-logging raingauges (Onset Computer Corpo-
ration, Pocasset, Massachusetts) were installed on site for localrainfall measurements. In addition, three ECH2O EC-20 soil mois-ture sensors (Decagon Devices Incorporated, Pullman, Washington)connected to HOBO® microstation data loggers (Onset ComputerCorporation, Pocasset, Massachusetts) were installed atop the side
1962 M.A. Galang et al. / Forest Ecology and Ma
Fig. 2. Instrumented gully with a 90◦ V-notch weir, pressure transducer, piezome-tDfit
st
2
2tgiaIpwiprUpt1sswCyssp(
2
gwbsfotG(
ers, and stormwater sampler shortly after a prescribed burn at the Long Cane Rangeristrict, Sumter National Forest, South Carolina. Note: The weir was protected fromre while the gully was allowed to burn as evidenced by the ashen forest floor inhe gully.
lope of three selected gullies, recording soil moisture content inhe 0–20 cm depth.
.3. Runoff collection and analysis
Sampling and gully observations were conducted from April 1,006 to March 12, 2007 for pre-burn data and from March 14, 2007o March 12, 2008 for post-burn data. Since the majority of theseullies behave ephemerally, runoff sampling was conducted dur-ng events when the gullies flowed. During these flow events, anutomatic sampler (Global Water Sampler WS750, Global Waternstrumentation, Gold River, California) collected a discrete sam-le of up to a maximum of 3 L per flow event. The discrete sampleras turned on when flow began and continued sampling at a max-
mal rate of 1 L/min under a 1.2 m head (rates are lower with lessressure head) until 3 L was collected or flow stopped. This sampleate was sufficient to collect samples over all stormflow events. TheSGS precipitation gage in Greenwood, SC was monitored and sam-le pick-up was initiated after any rain event >1.5 cm. In general,he number of days between sample collections ranged from 2 to0 days. In addition to event-based sampling, a biweekly visit to theite was performed to check the integrity of the instruments and theamplers at each gully. During sampling, containers with samplesere taken out and replaced with newly acid-washed containers.ollected unfiltered samples were preserved frozen prior to anal-ses. Samples were analyzed for pH, conductivity, total suspendedolids (TSS), and dissolved reactive phosphorus (DRP) followingtandard techniques (Clesceri et al., 1998). These same runoff sam-les were also analyzed for Ca, Mg, and K using ion chromatographyDX 500, Dionex Corporation, Sunnyvale, California).
.4. Water table investigation
The role of the water table on gully runoff events was investi-ated following two techniques. First, maximum-rise piezometersere installed at 50 (shallow) and 275 cm (deep) depth in Novem-
er 2006, about 1 m away from the weir on the downstreamide. The rise in water line, as recorded by floating cork pieces,
rom each piezometer was measured every sample collection. Sec-nd, soil resistivity-transect surveys were conducted perpendicularo gullies using a SuperSting R8 IP resistivity meter (Advancedeosciences Inc., Austin, Texas) from December to January 2006Winter) and in June 2007 (Summer). Soil electrical resistivity
nagement 259 (2010) 1959–1970
is a technique used to investigate spatial and temporal variabil-ity in subsurface properties such as in groundwater exploration(Samouëlian et al., 2005). A resistivity survey was used in thisresearch to determine the groundwater table depth in the area andto determine if it rose sufficiently during the wet winter season toinitiate gully flow.
Field saturated hydraulic conductivity (Kfs) at the 25 and 50 cmdepths were also measured at the downstream side of each weirusing a Guelph Permeameter (SoilMoisture Equipment Corp., SantaBarbara, Ca). Soil samples were taken within 0–25 cm and 25–50 cmdepth increments and analyzed for particle size using the hydrom-eter method (Day, 1965).
2.5. Prescribed burn treatment
Gullies designated for treatment were burned on March 13,2007. Burning on a compartment scale was initiated using ahelicopter drop of “ping-pong” balls filled with potassium perman-ganate and injected with glycol solution for ignition at about 10 mintervals. Drip torches were used for ignition along the compart-ment perimeters. Weather conditions during the burn were mostlyclear skies, maximum air temperature of 80oF, relative humidity of32% and wind speed of 11 km h−1 moving to the southwest. Flameheight reached 3.5 m but averaged approximately 1 m. Weirs andother instruments were protected from the burn by removal of fuelson the forest floor with a light leaf blowing. Just prior to the burn,eight HOBO® Type K thermocouples (Onset Computer Corporation,Pocasset, Massachusetts) were randomly installed on site, withinthe contributing areas of the six treated gullies and in between themineral soil and forest floor.
Two weeks after the burn, ground cover of the contributingareas of each treatment gully was estimated using a point-transectmethod. At each side of the contributing area, two transects per-pendicular to the gully were established at the 25 and 75% mark ofthe gully length. One transect following the orientation of the gullylength was also established from the headcut to the contributingarea boundary. From the gully to the boundary of the contributingarea, points at 1 m intervals were assessed as covered with fullyconsumed dark litter layer (A), covered with partially consumedlitter layer (P), exposed mineral soil (M), or exposed stone (S).
2.6. Soil core leaching
Soil core leaching was performed to investigate the potential ofprescribed burning to mobilize nutrients. Using the same transectsas for the post-burn cover estimates, which were established priorto the burn, pre-burn intact soil core samples (5 cm height × 7.5 cmdiameter) were collected on the left side, moving at a directionaway from the gully, of each of the transect midpoints. One weekafter the burn (1-week post-burn), intact soil core samples werecollected on the right side of the transect midpoint. Three monthsafter the burn (3-month post-burn), intact soil core samples wereagain collected on the right side of the transect midpoints, but25 cm upslope of the position where the one-week post-burn sam-ples were collected. Pre-burn sample cores were either mineral soilonly (MS) or forest floor + mineral soil (FF + MS). Post-burn sam-ple cores were charred organic material + mineral soil (Char + MS).Overall, 80 intact soil cores were collected in each sampling period.
Soil core leaching was performed by placing an empty coresleeve on top of the collected intact soil core sleeve to create asingle larger column. The joint was secured by Parafilm® M and
the bottom of the intact core was supported by a Whatman® 42filter paper. The vertical orientation of the column was checkedusing a level. Deionized water equivalent to 5 cm rainfall (∼1.5pore volume) was added at the core surface and allowed to leachuntil the ponded water was gone and leachate loss ceased. The col-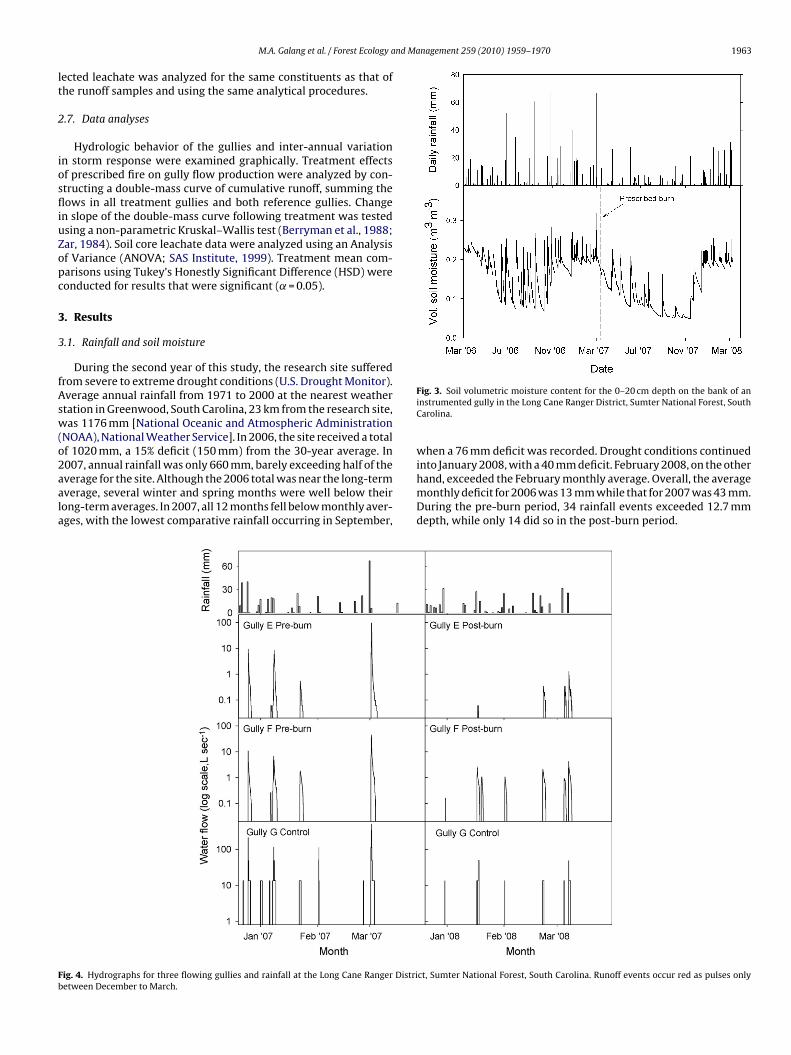
nd Management 259 (2010) 1959–1970 1963
lt
2
iosfliuZopc
3
3
fAsw(o2aala
Fb
M.A. Galang et al. / Forest Ecology a
ected leachate was analyzed for the same constituents as that ofhe runoff samples and using the same analytical procedures.
.7. Data analyses
Hydrologic behavior of the gullies and inter-annual variationn storm response were examined graphically. Treatment effectsf prescribed fire on gully flow production were analyzed by con-tructing a double-mass curve of cumulative runoff, summing theows in all treatment gullies and both reference gullies. Change
n slope of the double-mass curve following treatment was testedsing a non-parametric Kruskal–Wallis test (Berryman et al., 1988;ar, 1984). Soil core leachate data were analyzed using an Analysisf Variance (ANOVA; SAS Institute, 1999). Treatment mean com-arisons using Tukey’s Honestly Significant Difference (HSD) wereonducted for results that were significant (˛ = 0.05).
. Results
.1. Rainfall and soil moisture
During the second year of this study, the research site sufferedrom severe to extreme drought conditions (U.S. Drought Monitor).verage annual rainfall from 1971 to 2000 at the nearest weathertation in Greenwood, South Carolina, 23 km from the research site,as 1176 mm [National Oceanic and Atmospheric Administration
NOAA), National Weather Service]. In 2006, the site received a totalf 1020 mm, a 15% deficit (150 mm) from the 30-year average. In
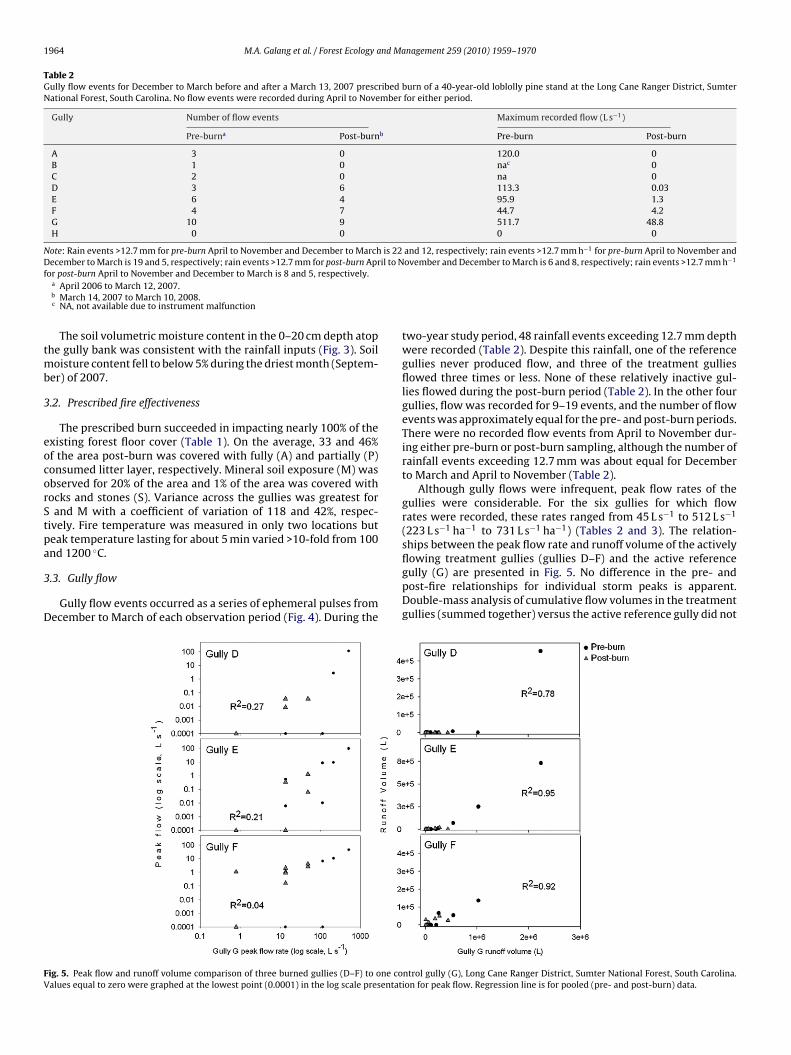
007, annual rainfall was only 660 mm, barely exceeding half of theverage for the site. Although the 2006 total was near the long-termverage, several winter and spring months were well below theirong-term averages. In 2007, all 12 months fell below monthly aver-ges, with the lowest comparative rainfall occurring in September,ig. 4. Hydrographs for three flowing gullies and rainfall at the Long Cane Ranger Distrietween December to March.
Fig. 3. Soil volumetric moisture content for the 0–20 cm depth on the bank of aninstrumented gully in the Long Cane Ranger District, Sumter National Forest, SouthCarolina.
when a 76 mm deficit was recorded. Drought conditions continuedinto January 2008, with a 40 mm deficit. February 2008, on the other
hand, exceeded the February monthly average. Overall, the averagemonthly deficit for 2006 was 13 mm while that for 2007 was 43 mm.During the pre-burn period, 34 rainfall events exceeded 12.7 mmdepth, while only 14 did so in the post-burn period.ct, Sumter National Forest, South Carolina. Runoff events occur red as pulses only
1964 M.A. Galang et al. / Forest Ecology and Management 259 (2010) 1959–1970
Table 2Gully flow events for December to March before and after a March 13, 2007 prescribed burn of a 40-year-old loblolly pine stand at the Long Cane Ranger District, SumterNational Forest, South Carolina. No flow events were recorded during April to November for either period.
Gully Number of flow events Maximum recorded flow (L s−1)
Pre-burna Post-burnb Pre-burn Post-burn
A 3 0 120.0 0B 1 0 nac 0C 2 0 na 0D 3 6 113.3 0.03E 6 4 95.9 1.3F 4 7 44.7 4.2G 10 9 511.7 48.8H 0 0 0 0
Note: Rain events >12.7 mm for pre-burn April to November and December to March is 22 and 12, respectively; rain events >12.7 mm h−1 for pre-burn April to November andDecember to March is 19 and 5, respectively; rain events >12.7 mm for post-burn April to November and December to March is 6 and 8, respectively; rain events >12.7 mm h−1
f
tmb
3
eocorStpa
3
D
FV
or post-burn April to November and December to March is 8 and 5, respectively.a April 2006 to March 12, 2007.b March 14, 2007 to March 10, 2008.c NA, not available due to instrument malfunction
The soil volumetric moisture content in the 0–20 cm depth atophe gully bank was consistent with the rainfall inputs (Fig. 3). Soil
oisture content fell to below 5% during the driest month (Septem-er) of 2007.
.2. Prescribed fire effectiveness
The prescribed burn succeeded in impacting nearly 100% of thexisting forest floor cover (Table 1). On the average, 33 and 46%f the area post-burn was covered with fully (A) and partially (P)onsumed litter layer, respectively. Mineral soil exposure (M) wasbserved for 20% of the area and 1% of the area was covered withocks and stones (S). Variance across the gullies was greatest forand M with a coefficient of variation of 118 and 42%, respec-
ively. Fire temperature was measured in only two locations buteak temperature lasting for about 5 min varied >10-fold from 100nd 1200 ◦C.
.3. Gully flow
Gully flow events occurred as a series of ephemeral pulses fromecember to March of each observation period (Fig. 4). During the
ig. 5. Peak flow and runoff volume comparison of three burned gullies (D–F) to one coalues equal to zero were graphed at the lowest point (0.0001) in the log scale presentat
two-year study period, 48 rainfall events exceeding 12.7 mm depthwere recorded (Table 2). Despite this rainfall, one of the referencegullies never produced flow, and three of the treatment gulliesflowed three times or less. None of these relatively inactive gul-lies flowed during the post-burn period (Table 2). In the other fourgullies, flow was recorded for 9–19 events, and the number of flowevents was approximately equal for the pre- and post-burn periods.There were no recorded flow events from April to November dur-ing either pre-burn or post-burn sampling, although the number ofrainfall events exceeding 12.7 mm was about equal for Decemberto March and April to November (Table 2).
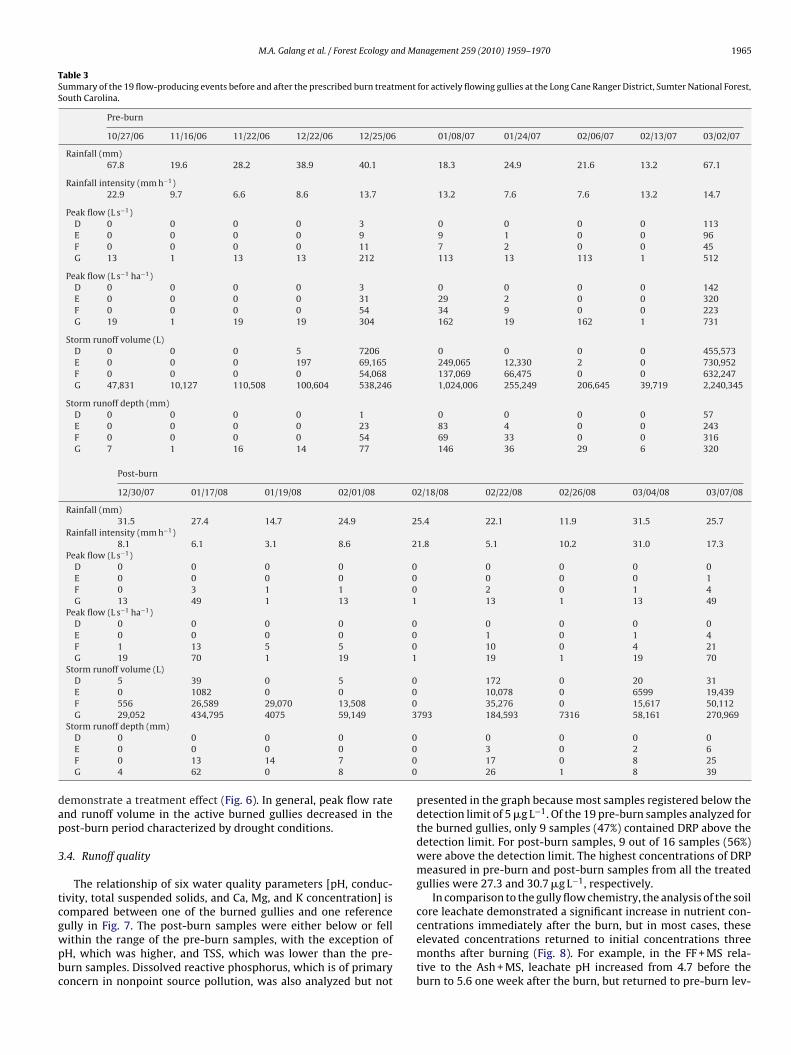
Although gully flows were infrequent, peak flow rates of thegullies were considerable. For the six gullies for which flowrates were recorded, these rates ranged from 45 L s−1 to 512 L s−1
(223 L s−1 ha−1 to 731 L s−1 ha−1) (Tables 2 and 3). The relation-ships between the peak flow rate and runoff volume of the actively
flowing treatment gullies (gullies D–F) and the active referencegully (G) are presented in Fig. 5. No difference in the pre- andpost-fire relationships for individual storm peaks is apparent.Double-mass analysis of cumulative flow volumes in the treatmentgullies (summed together) versus the active reference gully did notntrol gully (G), Long Cane Ranger District, Sumter National Forest, South Carolina.ion for peak flow. Regression line is for pooled (pre- and post-burn) data.
M.A. Galang et al. / Forest Ecology and Management 259 (2010) 1959–1970 1965
Table 3Summary of the 19 flow-producing events before and after the prescribed burn treatment for actively flowing gullies at the Long Cane Ranger District, Sumter National Forest,South Carolina.
Pre-burn
10/27/06 11/16/06 11/22/06 12/22/06 12/25/06 01/08/07 01/24/07 02/06/07 02/13/07 03/02/07
Rainfall (mm)67.8 19.6 28.2 38.9 40.1 18.3 24.9 21.6 13.2 67.1
Rainfall intensity (mm h−1)22.9 9.7 6.6 8.6 13.7 13.2 7.6 7.6 13.2 14.7
Peak flow (L s−1)D 0 0 0 0 3 0 0 0 0 113E 0 0 0 0 9 9 1 0 0 96F 0 0 0 0 11 7 2 0 0 45G 13 1 13 13 212 113 13 113 1 512
Peak flow (L s−1 ha−1)D 0 0 0 0 3 0 0 0 0 142E 0 0 0 0 31 29 2 0 0 320F 0 0 0 0 54 34 9 0 0 223G 19 1 19 19 304 162 19 162 1 731
Storm runoff volume (L)D 0 0 0 5 7206 0 0 0 0 455,573E 0 0 0 197 69,165 249,065 12,330 2 0 730,952F 0 0 0 0 54,068 137,069 66,475 0 0 632,247G 47,831 10,127 110,508 100,604 538,246 1,024,006 255,249 206,645 39,719 2,240,345
Storm runoff depth (mm)D 0 0 0 0 1 0 0 0 0 57E 0 0 0 0 23 83 4 0 0 243F 0 0 0 0 54 69 33 0 0 316G 7 1 16 14 77 146 36 29 6 320
Post-burn
12/30/07 01/17/08 01/19/08 02/01/08 02/18/08 02/22/08 02/26/08 03/04/08 03/07/08
Rainfall (mm)31.5 27.4 14.7 24.9 25.4 22.1 11.9 31.5 25.7
Rainfall intensity (mm h−1)8.1 6.1 3.1 8.6 21.8 5.1 10.2 31.0 17.3
Peak flow (L s−1)D 0 0 0 0 0 0 0 0 0E 0 0 0 0 0 0 0 0 1F 0 3 1 1 0 2 0 1 4G 13 49 1 13 1 13 1 13 49
Peak flow (L s−1 ha−1)D 0 0 0 0 0 0 0 0 0E 0 0 0 0 0 1 0 1 4F 1 13 5 5 0 10 0 4 21G 19 70 1 19 1 19 1 19 70
Storm runoff volume (L)D 5 39 0 5 0 172 0 20 31E 0 1082 0 0 0 10,078 0 6599 19,439F 556 26,589 29,070 13,508 0 35,276 0 15,617 50,112G 29,052 434,795 4075 59,149 3793 184,593 7316 58,161 270,969
Storm runoff depth (mm)0000
dap
3
tcgwpbc
D 0 0 0 0E 0 0 0 0F 0 13 14 7G 4 62 0 8
emonstrate a treatment effect (Fig. 6). In general, peak flow ratend runoff volume in the active burned gullies decreased in theost-burn period characterized by drought conditions.
.4. Runoff quality
The relationship of six water quality parameters [pH, conduc-ivity, total suspended solids, and Ca, Mg, and K concentration] isompared between one of the burned gullies and one reference
ully in Fig. 7. The post-burn samples were either below or fellithin the range of the pre-burn samples, with the exception ofH, which was higher, and TSS, which was lower than the pre-urn samples. Dissolved reactive phosphorus, which is of primaryoncern in nonpoint source pollution, was also analyzed but not0 0 0 03 0 2 617 0 8 2526 1 8 39
presented in the graph because most samples registered below thedetection limit of 5 �g L−1. Of the 19 pre-burn samples analyzed forthe burned gullies, only 9 samples (47%) contained DRP above thedetection limit. For post-burn samples, 9 out of 16 samples (56%)were above the detection limit. The highest concentrations of DRPmeasured in pre-burn and post-burn samples from all the treatedgullies were 27.3 and 30.7 �g L−1, respectively.
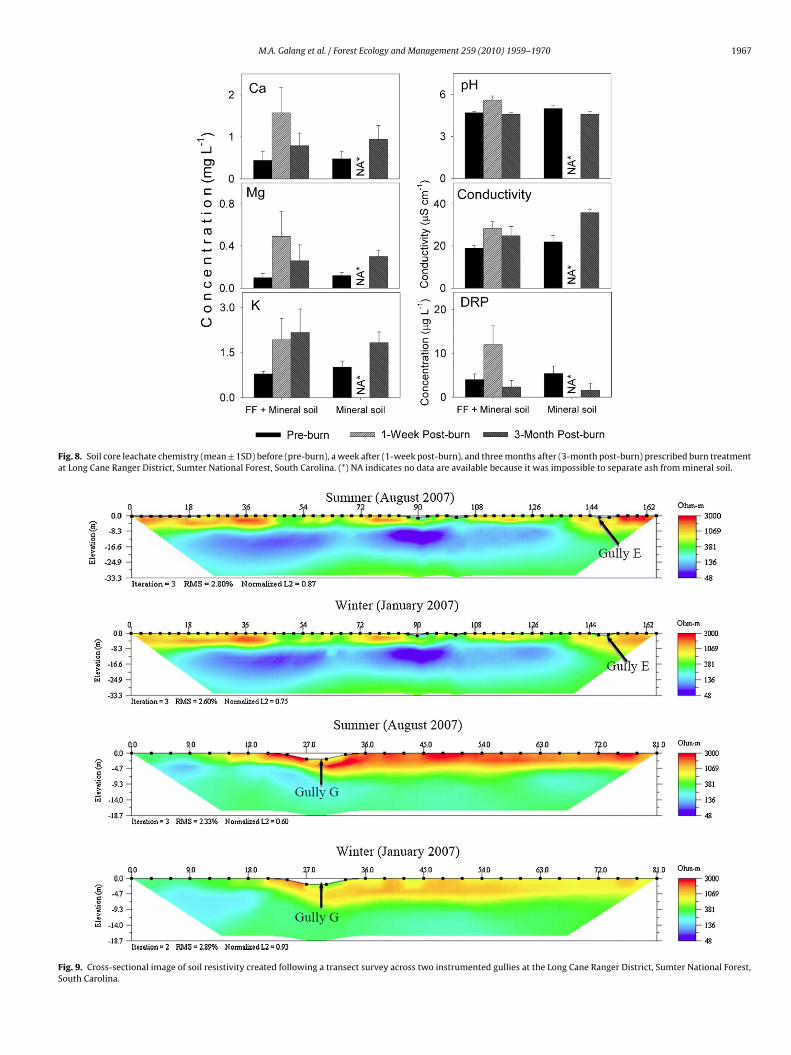
In comparison to the gully flow chemistry, the analysis of the soilcore leachate demonstrated a significant increase in nutrient con-
centrations immediately after the burn, but in most cases, theseelevated concentrations returned to initial concentrations threemonths after burning (Fig. 8). For example, in the FF + MS rela-tive to the Ash + MS, leachate pH increased from 4.7 before theburn to 5.6 one week after the burn, but returned to pre-burn lev-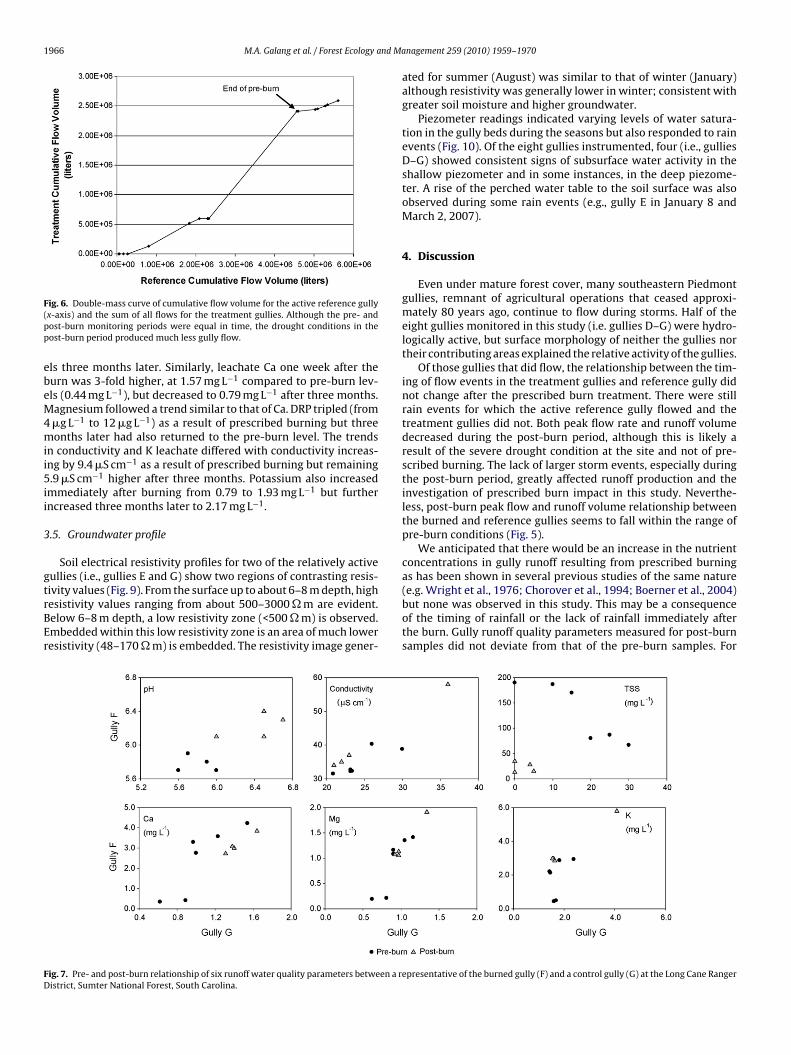
1966 M.A. Galang et al. / Forest Ecology and Ma
F(pp
ebeM4mii5ii
3
gtrBEr
FD
ig. 6. Double-mass curve of cumulative flow volume for the active reference gullyx-axis) and the sum of all flows for the treatment gullies. Although the pre- andost-burn monitoring periods were equal in time, the drought conditions in theost-burn period produced much less gully flow.
ls three months later. Similarly, leachate Ca one week after theurn was 3-fold higher, at 1.57 mg L−1 compared to pre-burn lev-ls (0.44 mg L−1), but decreased to 0.79 mg L−1 after three months.agnesium followed a trend similar to that of Ca. DRP tripled (from�g L−1 to 12 �g L−1) as a result of prescribed burning but threeonths later had also returned to the pre-burn level. The trends
n conductivity and K leachate differed with conductivity increas-ng by 9.4 �S cm−1 as a result of prescribed burning but remaining.9 �S cm−1 higher after three months. Potassium also increased
mmediately after burning from 0.79 to 1.93 mg L−1 but furtherncreased three months later to 2.17 mg L−1.
.5. Groundwater profile
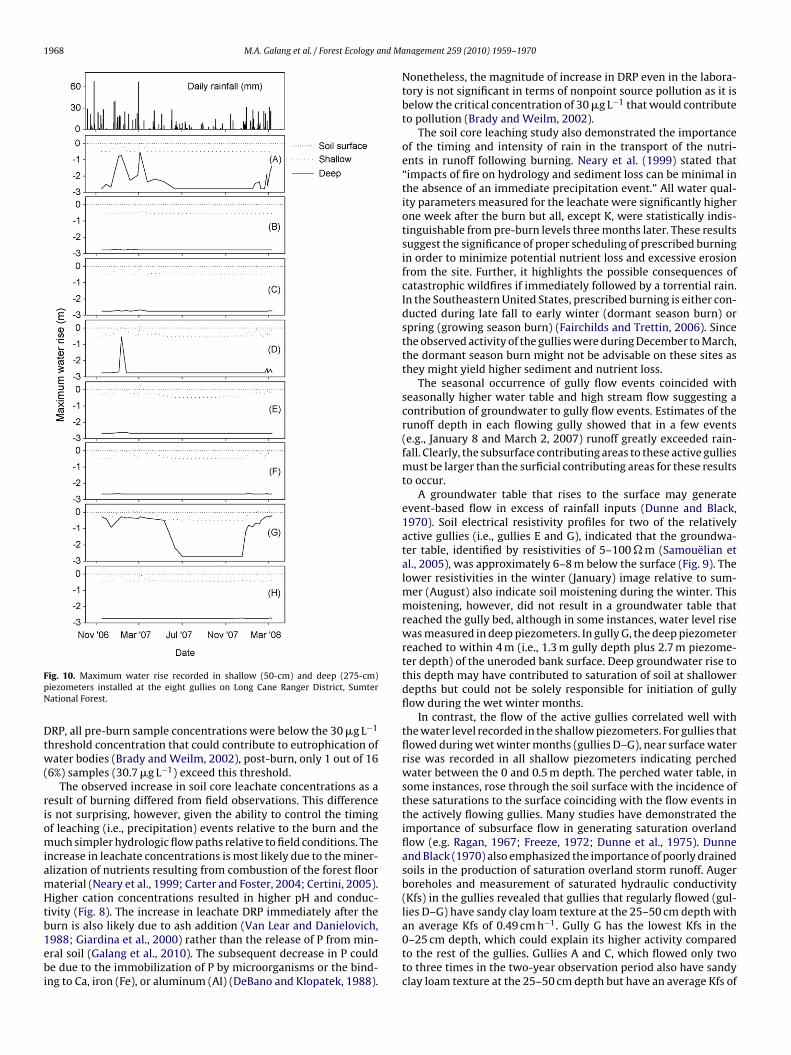
Soil electrical resistivity profiles for two of the relatively activeullies (i.e., gullies E and G) show two regions of contrasting resis-
ivity values (Fig. 9). From the surface up to about 6–8 m depth, highesistivity values ranging from about 500–3000 � m are evident.elow 6–8 m depth, a low resistivity zone (<500 � m) is observed.mbedded within this low resistivity zone is an area of much loweresistivity (48–170 � m) is embedded. The resistivity image gener-ig. 7. Pre- and post-burn relationship of six runoff water quality parameters between a ristrict, Sumter National Forest, South Carolina.
nagement 259 (2010) 1959–1970
ated for summer (August) was similar to that of winter (January)although resistivity was generally lower in winter; consistent withgreater soil moisture and higher groundwater.
Piezometer readings indicated varying levels of water satura-tion in the gully beds during the seasons but also responded to rainevents (Fig. 10). Of the eight gullies instrumented, four (i.e., gulliesD–G) showed consistent signs of subsurface water activity in theshallow piezometer and in some instances, in the deep piezome-ter. A rise of the perched water table to the soil surface was alsoobserved during some rain events (e.g., gully E in January 8 andMarch 2, 2007).
4. Discussion
Even under mature forest cover, many southeastern Piedmontgullies, remnant of agricultural operations that ceased approxi-mately 80 years ago, continue to flow during storms. Half of theeight gullies monitored in this study (i.e. gullies D–G) were hydro-logically active, but surface morphology of neither the gullies northeir contributing areas explained the relative activity of the gullies.
Of those gullies that did flow, the relationship between the tim-ing of flow events in the treatment gullies and reference gully didnot change after the prescribed burn treatment. There were stillrain events for which the active reference gully flowed and thetreatment gullies did not. Both peak flow rate and runoff volumedecreased during the post-burn period, although this is likely aresult of the severe drought condition at the site and not of pre-scribed burning. The lack of larger storm events, especially duringthe post-burn period, greatly affected runoff production and theinvestigation of prescribed burn impact in this study. Neverthe-less, post-burn peak flow and runoff volume relationship betweenthe burned and reference gullies seems to fall within the range ofpre-burn conditions (Fig. 5).
We anticipated that there would be an increase in the nutrientconcentrations in gully runoff resulting from prescribed burningas has been shown in several previous studies of the same nature
(e.g. Wright et al., 1976; Chorover et al., 1994; Boerner et al., 2004)but none was observed in this study. This may be a consequenceof the timing of rainfall or the lack of rainfall immediately afterthe burn. Gully runoff quality parameters measured for post-burnsamples did not deviate from that of the pre-burn samples. Forepresentative of the burned gully (F) and a control gully (G) at the Long Cane Ranger
M.A. Galang et al. / Forest Ecology and Management 259 (2010) 1959–1970 1967
Fig. 8. Soil core leachate chemistry (mean ± 1SD) before (pre-burn), a week after (1-week post-burn), and three months after (3-month post-burn) prescribed burn treatmentat Long Cane Ranger District, Sumter National Forest, South Carolina. (*) NA indicates no data are available because it was impossible to separate ash from mineral soil.
Fig. 9. Cross-sectional image of soil resistivity created following a transect survey across two instrumented gullies at the Long Cane Ranger District, Sumter National Forest,South Carolina.
1968 M.A. Galang et al. / Forest Ecology and Ma
FpN
Dtw(
riomiamHtb1ebi
−1
ig. 10. Maximum water rise recorded in shallow (50-cm) and deep (275-cm)iezometers installed at the eight gullies on Long Cane Ranger District, Sumterational Forest.
RP, all pre-burn sample concentrations were below the 30 �g L−1
hreshold concentration that could contribute to eutrophication ofater bodies (Brady and Weilm, 2002), post-burn, only 1 out of 16
6%) samples (30.7 �g L−1) exceed this threshold.The observed increase in soil core leachate concentrations as a
esult of burning differed from field observations. This differences not surprising, however, given the ability to control the timingf leaching (i.e., precipitation) events relative to the burn and theuch simpler hydrologic flow paths relative to field conditions. The
ncrease in leachate concentrations is most likely due to the miner-lization of nutrients resulting from combustion of the forest flooraterial (Neary et al., 1999; Carter and Foster, 2004; Certini, 2005).igher cation concentrations resulted in higher pH and conduc-
ivity (Fig. 8). The increase in leachate DRP immediately after the
urn is also likely due to ash addition (Van Lear and Danielovich,988; Giardina et al., 2000) rather than the release of P from min-ral soil (Galang et al., 2010). The subsequent decrease in P coulde due to the immobilization of P by microorganisms or the bind-ng to Ca, iron (Fe), or aluminum (Al) (DeBano and Klopatek, 1988).
nagement 259 (2010) 1959–1970
Nonetheless, the magnitude of increase in DRP even in the labora-tory is not significant in terms of nonpoint source pollution as it isbelow the critical concentration of 30 �g L−1 that would contributeto pollution (Brady and Weilm, 2002).
The soil core leaching study also demonstrated the importanceof the timing and intensity of rain in the transport of the nutri-ents in runoff following burning. Neary et al. (1999) stated that“impacts of fire on hydrology and sediment loss can be minimal inthe absence of an immediate precipitation event.” All water qual-ity parameters measured for the leachate were significantly higherone week after the burn but all, except K, were statistically indis-tinguishable from pre-burn levels three months later. These resultssuggest the significance of proper scheduling of prescribed burningin order to minimize potential nutrient loss and excessive erosionfrom the site. Further, it highlights the possible consequences ofcatastrophic wildfires if immediately followed by a torrential rain.In the Southeastern United States, prescribed burning is either con-ducted during late fall to early winter (dormant season burn) orspring (growing season burn) (Fairchilds and Trettin, 2006). Sincethe observed activity of the gullies were during December to March,the dormant season burn might not be advisable on these sites asthey might yield higher sediment and nutrient loss.
The seasonal occurrence of gully flow events coincided withseasonally higher water table and high stream flow suggesting acontribution of groundwater to gully flow events. Estimates of therunoff depth in each flowing gully showed that in a few events(e.g., January 8 and March 2, 2007) runoff greatly exceeded rain-fall. Clearly, the subsurface contributing areas to these active gulliesmust be larger than the surficial contributing areas for these resultsto occur.
A groundwater table that rises to the surface may generateevent-based flow in excess of rainfall inputs (Dunne and Black,1970). Soil electrical resistivity profiles for two of the relativelyactive gullies (i.e., gullies E and G), indicated that the groundwa-ter table, identified by resistivities of 5–100 � m (Samouëlian etal., 2005), was approximately 6–8 m below the surface (Fig. 9). Thelower resistivities in the winter (January) image relative to sum-mer (August) also indicate soil moistening during the winter. Thismoistening, however, did not result in a groundwater table thatreached the gully bed, although in some instances, water level risewas measured in deep piezometers. In gully G, the deep piezometerreached to within 4 m (i.e., 1.3 m gully depth plus 2.7 m piezome-ter depth) of the uneroded bank surface. Deep groundwater rise tothis depth may have contributed to saturation of soil at shallowerdepths but could not be solely responsible for initiation of gullyflow during the wet winter months.
In contrast, the flow of the active gullies correlated well withthe water level recorded in the shallow piezometers. For gullies thatflowed during wet winter months (gullies D–G), near surface waterrise was recorded in all shallow piezometers indicating perchedwater between the 0 and 0.5 m depth. The perched water table, insome instances, rose through the soil surface with the incidence ofthese saturations to the surface coinciding with the flow events inthe actively flowing gullies. Many studies have demonstrated theimportance of subsurface flow in generating saturation overlandflow (e.g. Ragan, 1967; Freeze, 1972; Dunne et al., 1975). Dunneand Black (1970) also emphasized the importance of poorly drainedsoils in the production of saturation overland storm runoff. Augerboreholes and measurement of saturated hydraulic conductivity(Kfs) in the gullies revealed that gullies that regularly flowed (gul-lies D–G) have sandy clay loam texture at the 25–50 cm depth with
an average Kfs of 0.49 cm h . Gully G has the lowest Kfs in the0–25 cm depth, which could explain its higher activity comparedto the rest of the gullies. Gullies A and C, which flowed only twoto three times in the two-year observation period also have sandyclay loam texture at the 25–50 cm depth but have an average Kfs of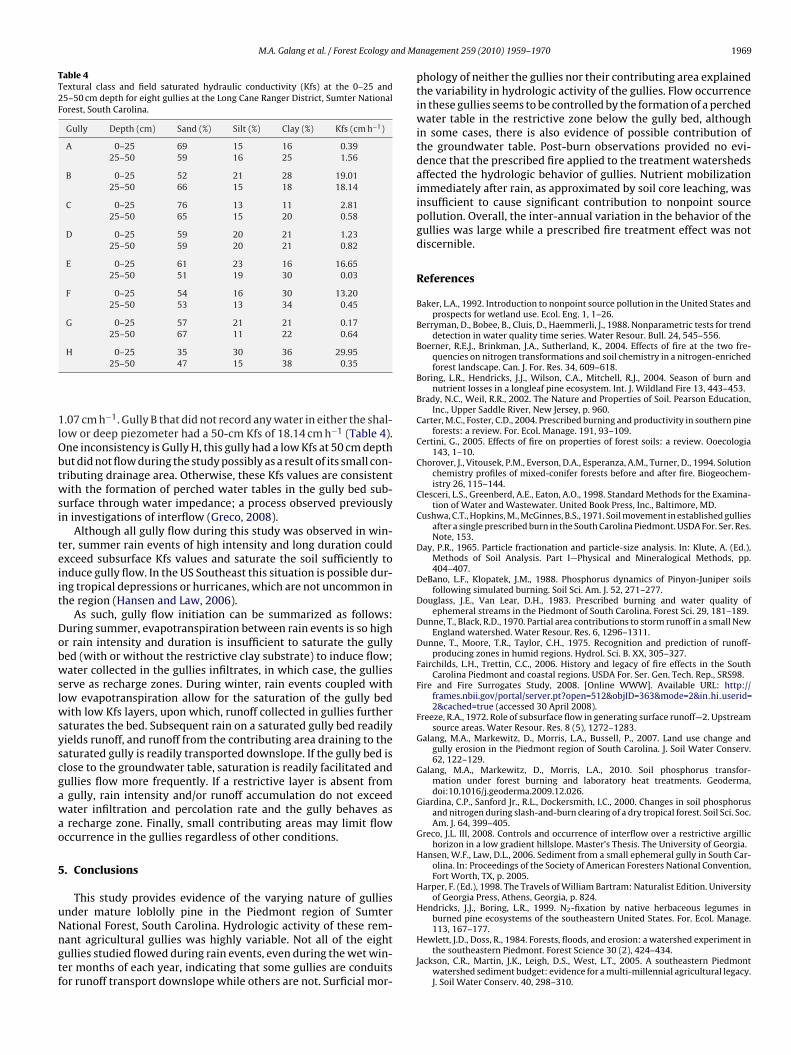
M.A. Galang et al. / Forest Ecology and Ma
Table 4Textural class and field saturated hydraulic conductivity (Kfs) at the 0–25 and25–50 cm depth for eight gullies at the Long Cane Ranger District, Sumter NationalForest, South Carolina.
Gully Depth (cm) Sand (%) Silt (%) Clay (%) Kfs (cm h−1)
A 0–25 69 15 16 0.3925–50 59 16 25 1.56
B 0–25 52 21 28 19.0125–50 66 15 18 18.14
C 0–25 76 13 11 2.8125–50 65 15 20 0.58
D 0–25 59 20 21 1.2325–50 59 20 21 0.82
E 0–25 61 23 16 16.6525–50 51 19 30 0.03
F 0–25 54 16 30 13.2025–50 53 13 34 0.45
G 0–25 57 21 21 0.1725–50 67 11 22 0.64
1lObtwsi
teiit
Dobwslwsyscgawao
5
uNngtf
H 0–25 35 30 36 29.9525–50 47 15 38 0.35
.07 cm h−1. Gully B that did not record any water in either the shal-ow or deep piezometer had a 50-cm Kfs of 18.14 cm h−1 (Table 4).ne inconsistency is Gully H, this gully had a low Kfs at 50 cm depthut did not flow during the study possibly as a result of its small con-ributing drainage area. Otherwise, these Kfs values are consistentith the formation of perched water tables in the gully bed sub-
urface through water impedance; a process observed previouslyn investigations of interflow (Greco, 2008).
Although all gully flow during this study was observed in win-er, summer rain events of high intensity and long duration couldxceed subsurface Kfs values and saturate the soil sufficiently tonduce gully flow. In the US Southeast this situation is possible dur-ng tropical depressions or hurricanes, which are not uncommon inhe region (Hansen and Law, 2006).
As such, gully flow initiation can be summarized as follows:uring summer, evapotranspiration between rain events is so highr rain intensity and duration is insufficient to saturate the gullyed (with or without the restrictive clay substrate) to induce flow;ater collected in the gullies infiltrates, in which case, the gullies
erve as recharge zones. During winter, rain events coupled withow evapotranspiration allow for the saturation of the gully bed
ith low Kfs layers, upon which, runoff collected in gullies furtheraturates the bed. Subsequent rain on a saturated gully bed readilyields runoff, and runoff from the contributing area draining to theaturated gully is readily transported downslope. If the gully bed islose to the groundwater table, saturation is readily facilitated andullies flow more frequently. If a restrictive layer is absent fromgully, rain intensity and/or runoff accumulation do not exceedater infiltration and percolation rate and the gully behaves asrecharge zone. Finally, small contributing areas may limit flow
ccurrence in the gullies regardless of other conditions.
. Conclusions
This study provides evidence of the varying nature of gulliesnder mature loblolly pine in the Piedmont region of Sumterational Forest, South Carolina. Hydrologic activity of these rem-
ant agricultural gullies was highly variable. Not all of the eightullies studied flowed during rain events, even during the wet win-er months of each year, indicating that some gullies are conduitsor runoff transport downslope while others are not. Surficial mor-nagement 259 (2010) 1959–1970 1969
phology of neither the gullies nor their contributing area explainedthe variability in hydrologic activity of the gullies. Flow occurrencein these gullies seems to be controlled by the formation of a perchedwater table in the restrictive zone below the gully bed, althoughin some cases, there is also evidence of possible contribution ofthe groundwater table. Post-burn observations provided no evi-dence that the prescribed fire applied to the treatment watershedsaffected the hydrologic behavior of gullies. Nutrient mobilizationimmediately after rain, as approximated by soil core leaching, wasinsufficient to cause significant contribution to nonpoint sourcepollution. Overall, the inter-annual variation in the behavior of thegullies was large while a prescribed fire treatment effect was notdiscernible.
References
Baker, L.A., 1992. Introduction to nonpoint source pollution in the United States andprospects for wetland use. Ecol. Eng. 1, 1–26.
Berryman, D., Bobee, B., Cluis, D., Haemmerli, J., 1988. Nonparametric tests for trenddetection in water quality time series. Water Resour. Bull. 24, 545–556.
Boerner, R.E.J., Brinkman, J.A., Sutherland, K., 2004. Effects of fire at the two fre-quencies on nitrogen transformations and soil chemistry in a nitrogen-enrichedforest landscape. Can. J. For. Res. 34, 609–618.
Boring, L.R., Hendricks, J.J., Wilson, C.A., Mitchell, R.J., 2004. Season of burn andnutrient losses in a longleaf pine ecosystem. Int. J. Wildland Fire 13, 443–453.
Brady, N.C., Weil, R.R., 2002. The Nature and Properties of Soil. Pearson Education,Inc., Upper Saddle River, New Jersey, p. 960.
Carter, M.C., Foster, C.D., 2004. Prescribed burning and productivity in southern pineforests: a review. For. Ecol. Manage. 191, 93–109.
Certini, G., 2005. Effects of fire on properties of forest soils: a review. Ooecologia143, 1–10.
Chorover, J., Vitousek, P.M., Everson, D.A., Esperanza, A.M., Turner, D., 1994. Solutionchemistry profiles of mixed-conifer forests before and after fire. Biogeochem-istry 26, 115–144.
Clesceri, L.S., Greenberd, A.E., Eaton, A.O., 1998. Standard Methods for the Examina-tion of Water and Wastewater. United Book Press, Inc., Baltimore, MD.
Cushwa, C.T., Hopkins, M., McGinnes, B.S., 1971. Soil movement in established gulliesafter a single prescribed burn in the South Carolina Piedmont. USDA For. Ser. Res.Note, 153.
Day, P.R., 1965. Particle fractionation and particle-size analysis. In: Klute, A. (Ed.),Methods of Soil Analysis. Part I—Physical and Mineralogical Methods, pp.404–407.
DeBano, L.F., Klopatek, J.M., 1988. Phosphorus dynamics of Pinyon-Juniper soilsfollowing simulated burning. Soil Sci. Am. J. 52, 271–277.
Douglass, J.E., Van Lear, D.H., 1983. Prescribed burning and water quality ofephemeral streams in the Piedmont of South Carolina. Forest Sci. 29, 181–189.
Dunne, T., Black, R.D., 1970. Partial area contributions to storm runoff in a small NewEngland watershed. Water Resour. Res. 6, 1296–1311.
Dunne, T., Moore, T.R., Taylor, C.H., 1975. Recognition and prediction of runoff-producing zones in humid regions. Hydrol. Sci. B. XX, 305–327.
Fairchilds, L.H., Trettin, C.C., 2006. History and legacy of fire effects in the SouthCarolina Piedmont and coastal regions. USDA For. Ser. Gen. Tech. Rep., SRS98.
Fire and Fire Surrogates Study, 2008. [Online WWW]. Available URL: http://frames.nbii.gov/portal/server.pt?open=512&objID=363&mode=2&in hi userid=2&cached=true (accessed 30 April 2008).
Freeze, R.A., 1972. Role of subsurface flow in generating surface runoff—2. Upstreamsource areas. Water Resour. Res. 8 (5), 1272–1283.
Galang, M.A., Markewitz, D., Morris, L.A., Bussell, P., 2007. Land use change andgully erosion in the Piedmont region of South Carolina. J. Soil Water Conserv.62, 122–129.
Galang, M.A., Markewitz, D., Morris, L.A., 2010. Soil phosphorus transfor-mation under forest burning and laboratory heat treatments. Geoderma,doi:10.1016/j.geoderma.2009.12.026.
Giardina, C.P., Sanford Jr., R.L., Dockersmith, I.C., 2000. Changes in soil phosphorusand nitrogen during slash-and-burn clearing of a dry tropical forest. Soil Sci. Soc.Am. J. 64, 399–405.
Greco, J.L. III, 2008. Controls and occurrence of interflow over a restrictive argillichorizon in a low gradient hillslope. Master’s Thesis. The University of Georgia.
Hansen, W.F., Law, D.L., 2006. Sediment from a small ephemeral gully in South Car-olina. In: Proceedings of the Society of American Foresters National Convention,Fort Worth, TX, p. 2005.
Harper, F. (Ed.), 1998. The Travels of William Bartram: Naturalist Edition. Universityof Georgia Press, Athens, Georgia, p. 824.
Hendricks, J.J., Boring, L.R., 1999. N2-fixation by native herbaceous legumes inburned pine ecosystems of the southeastern United States. For. Ecol. Manage.
113, 167–177.Hewlett, J.D., Doss, R., 1984. Forests, floods, and erosion: a watershed experiment inthe southeastern Piedmont. Forest Science 30 (2), 424–434.
Jackson, C.R., Martin, J.K., Leigh, D.S., West, L.T., 2005. A southeastern Piedmontwatershed sediment budget: evidence for a multi-millennial agricultural legacy.J. Soil Water Conserv. 40, 298–310.
1 nd Ma
L
N
N
N
P
R
R
R
S
SS
970 M.A. Galang et al. / Forest Ecology a
ynch, J.A., Corbett, E.S., Mussallem, K., 1985. Best management practices for con-trolling nonpoint source pollution in watersheds. J. Soil Water Conserv. 40,164–167.
ational Oceanic and Atmospheric Administration (NOAA), 2008. National WeatherService. Available URL: http://www.weather.gov/climate/xmacis.php?wfo=gsp(accessed 11 March 2008).
eary, D.G., Swank, W.T., Riekerk, H., 1989. An overview of nonpoint source pollutionin the southern United States, pp. 1–17. In: Hook, D.D., Lea, R. (Eds.), Proceedingsof The Forested Wetlands of the Southern United States Symposium, Orlando,FL, July 12–15. USDA For. Serv. Gen. Tech. Rep. SE-50, 168.
eary, D.G., Klopatek, C.C., DeBano, L.F., Ffolliott, P.F., 1999. Fire effects on below-ground sustainability: a review and synthesis. For. Ecol. Manage. 122, 51–71.
oesen, J., Nachtergaele, J., Verstraeten, G., Valentin, C., 2003. Gully erosionand environmental change: importance and research needs. Catena 50,91–133.
agan, R.M., 1968. An Experimental Investigation of partial Area Contributions. p.241–251 In: Hydrological Aspects of the Utilization of Water International Asso-ciation of Hydrological Sciences Proceedings of the General Assembly of Bern,September 25–October 7, 1967, IAHS Publ. No. 76.
ichter, D.D., Markewitz, D., 2001. Understanding Soil Change: Soil SustainabilityOver Time Scales of Decades and Centuries. Cambridge University Press, NewYork, NY, p. 255.
ivenbark, B.L., Jackson, C.R., 2004. Concentrated flow breakthroughs movingthrough silvicultural streamside management zones: southeastern Piedmont
USA. J. Am. Water Res. Assoc. 40, 1043–1052.amouëlian, A., Cousin, I., Tabbagh, A., Bruand, A., Richard, G., 2005. Electrical resis-tivity survey in soil science: a review. Soil Till. Res. 83, 173–193.
AS Institute, 1999. SAS/STAT User’s Guide. v. 8. SAS Inst., Cary, NC.outh Carolina Forestry Commission, 2008. Best Management Practices for Forestry.
URL: http://www.state.sc.us/forest/refbmp.htm (accessed 3 April 2008).
nagement 259 (2010) 1959–1970
Soil Survey Staff, Natural Resources Conservation Service, US Departmentof Agriculture. 2007. Soil Series Classification Database URL: http://soils.usda.gov/soils/technical/classification/scfile/index.html (accessed 5 December2007).
Townsend, S.A., Douglas, M.M., 2000. The effects of three fire regimes on streamwater quality, water yield and export coefficients in a tropical savanna (northernAustralia). J. Hydrol. 229, 118–137.
Trimble, S.W., 1974. Man-induced Soil Erosion on the Southern Piedmont1700–1970. Soil Conservation Society of America, Ankeny, Iowa, p. 188.
US Drought Monitor, 2008. URL: www.drought.unl.edu/dm/monitor.html (accessed11 March 2008).
U.S. Department of Agriculture, 1980. Soil Survey Report of Abbeville County, SouthCarolina.
Van Lear, D.H., Danielovich, S.J., 1988. Soil movement after broadcast burning in theSouthern Appalachians. South. J. Appl. For. 12, 49–53.
Water Measurement Manual. 2001. US Department of the Interior, Bureau of LandReclamation.
Wade, D.D., Lunsford, J.D., 1989. A guide for prescribed fire in southern forests. USDAFor. Serv. Tech. Pub., 56, R8-TP 11, 56p.
Wright, H.A., Churchill, F.M., Stevens, W.C., 1976. Effect of prescribed burning onsediment, water yield, and water quality from dozed juniper lands in CentralTexas. J. Range Manage. 29, 294–298.
Youngblood, A., Metlen, K.L., Knapp, E.E., Outcalt, K.W., Stephens, S.L., Waldorp, T.A.,Yaussy, D., 2005. Implementation of the fire and fire surrogate study—a national
research effort to evaluate the consequences of fuel reduction treatments. In:Proceedings of the Balancing Ecosystem Values: Innovative Experiments for Sus-tainable Forestry. USDA For. Serv. Pacific Northwest Res. Sta., Portland, OR, pp.315–321.Zar, J.H., 1984. Biostatistical Analysis, 2nd ed. Prentice-Hall, Englewood Cliffs, NJ, p.130.


![Forest Ecology and Management - fs.fed.us · Forest Ecology and Management 287 (2013) 40-52 Contents lists available at SciVerse ScienceDirect Forest Ecology and Management ~].SEVIER](https://img.pdfslide.net/doc/110x75/5cc6143d88c99384138bdcda/forest-ecology-and-management-fsfedus-forest-ecology-and-management-287.jpg)