Embed Size (px)
Citation preview
Forest Ecology and Management 278 (2012) 35–54
Contents lists available at SciVerse ScienceDirect
Forest Ecology and Management
journal homepage: www.elsevier .com/locate / foreco
Effects of organic matter removal, soil compaction and vegetation control on10th year biomass and foliar nutrition: LTSP continent-wide comparisons
Felix Ponder Jr. a,1, Robert L. Fleming b,⇑, Shannon Berch c, Matt D. Busse d, John D. Elioff e,2, Paul W. Hazlett b,Richard D. Kabzems f, J. Marty Kranabetter c, David M. Morris g, Deborah Page-Dumroese h, Brian J. Palik e,Robert F. Powers d,2, Felipe G. Sanchez i, D. Andrew Scott j, Richard H. Stagg k, Douglas M. Stone e,2,David H. Young m, Jianwei Zhang d, Kim H. Ludovici i, Daniel W. McKenney b, Debbie S. Mossa b,Paul T. Sanborn l, Richard A. Voldseth e,n
a USDA Forest Service, Northern Research Station 202 Natural Resources Building, University of Missouri, Columbia, MO 65211-7260, USAb Canadian Forest Service, Great Lakes Forestry Centre, 1219 Queen St. E., Sault Ste. Marie, ON, Canada P6A 2E5c British Columbia Ministry of Forests and Range, Research Branch Lab, 4300 North Road, Victoria, BC, Canada V8Z 5J3d USDA Forest Service, Pacific Southwest Research Station, 2400 Washington Ave., Redding, CA 96001, USAe USDA Forest Service, Northern Research Station, 1831 East Highway 169, East Grand Rapids, MN 55744, USAf British Columbia Ministry of Forests and Range, Prince George Region, 8808 72 Street, Fort St. John, BC, Canada V1J 6M2g Ontario Ministry of Natural Resources, Centre for Northern Forest Ecosystem Research, c/o Lakehead University, 955 Oliver Road, Thunder Bay, ON, Canada P7B 5E1h USDA Forest Service, Rocky Mountain Research Station, 1221 S. Main, Moscow, ID 83843, USAi USDA Forest Service, Southern Research Station, Forestry Sciences Laboratory, P.O. Box 12254, Research Triangle Park, NC 27709, USAj USDA Forest Service, Southern Research Station, 4900 Meridian St., Normal, AL 35762, USAk USDA Forest Service, Southern Research Station, 4472 Highway 133 South Crossett, AR 71635, USAl University of Northern British Columbia, 3333 University Way, Prince George, BC, Canada V2N 4Z9m USDA Forest Service, Pacific Southwest Region, 2400 Washington Ave., Redding, CA 96001, USAn Department of Soil Science, North Dakota State University, Fargo, ND, USA
a r t i c l e i n f o
Article history:Received 16 November 2011Received in revised form 6 April 2012Accepted 7 April 2012
Keywords:Stand productivityLong-Term Soil ProductivityStem-only harvestFull tree harvestForest floor removalClimatic regions
0378-1127/$ - see front matter Crown Copyright � 2http://dx.doi.org/10.1016/j.foreco.2012.04.014
⇑ Corresponding author. Tel.: +1 705 541 5632; faxE-mail address: [email protected] (R.
1 Deceased.2 Retired.
a b s t r a c t
We examined 10th year above-ground planted tree and total stand biomass, and planted tree foliar N andP concentrations across gradients in soil disturbance at 45 North American Long-Term Soil Productivity(LTSP) installations. While ranging across several climate regions, these installations all share a commonexperimental design with similar measurement protocols. Across all installations planted tree biomasswith stem-only harvest (OM0), no compaction (C0) and chemical vegetation control (VC), ranged from2 to 90 Mg ha�1. When compared with the OM0, full-tree harvest (OM1) had little consistent effect onany response variable. Full-tree harvest plus forest floor removal (OM2) also demonstrated few consistenteffects on planted tree biomass, although Boreal – Great Lakes conifers showed some positive effects,reflecting high survival, but also negative effects on foliar nutrition. Compaction (C2), regardless of OMtreatment, increased planted tree stand biomass consistently in Warm Humid climates, and compactionwith intact forest floors (OM0C2) did so across all regions. However, most installations had medium – orcoarse-textured soils and compaction did not achieve theoretical growth-limiting bulk densities. Com-bining OM2 with C2 resulted in lesser gains in planted tree biomass. Planted tree biomass gains withthe OM0C2 were attributed largely to changes in physical soil characteristics, not to vegetation controlor nutrient availability. Total stand biomass (Mg ha�1) was either unaffected or, with aspen, reducedby compaction. Vegetation control (VC) consistently enhanced planted tree biomass, regardless of cli-mate, and also enhanced foliar nutrient concentrations on Warm Humid and Mediterranean sites. VC alsoincreased total stand biomass on sites without abundant woody competitors, but decreased it on shrub-dominated Mediterranean sites. For many of the site types and species investigated, harvest-relatedorganic matter removal and soil compaction (excepting aspen vegetative reproduction) have not resultedin large losses in stand biomass 10 year after harvest. Most stands, however, have not yet reached canopyclosure, and treatment effects may continue to evolve.
Crown Copyright � 2012 Published by Elsevier B.V. All rights reserved.
012 Published by Elsevier B.V. All
: +1 705 541 5700.L. Fleming).
rights reserved.
36 F. Ponder Jr. et al. / Forest Ecology and Management 278 (2012) 35–54
1. Introduction
The North American Long-Term Soil Productivity program(LTSP) addresses short- and long-term effects of harvest-relateddisturbance on fundamental soil productivity (i.e., the capacity tocapture carbon and produce biomass). Manipulative treatments fo-cus on site organic matter and soil porosity, two key propertiesaffecting productive capacity which are influenced by harvestingand silvicultural activities (Powers, 2006). Additionally, vegetationcontrol is considered because it influences both target tree and to-tal biomass production (Wagner et al., 2006). This network of over100 core and affiliate installations provides rigorous empirical evi-dence regarding short- and long-term treatment effects and theirinteractions, features lacking in most chronosequence, retrospec-tive and modelling studies (Powers and Van Cleve, 1991; Morrisand Miller, 1994).
Harvest and related regeneration treatments often have differ-ent impacts on seedling establishment than on longer-termgrowth. In particular, treatment effects on microclimatic condi-tions and competition from lesser vegetation may have large initialimpacts, but diminishing effects following stand establishment(Mason and Milne, 1999; Proe et al., 2001). In contrast, increasedpost-harvest nutrient availability may provide adequate seedlingnutrition, regardless of treatment (cf. Smethhurst and Nambiar,1990; Vitousek et al., 1992; Sanchez et al., 2006). Subsequentreductions in nutrient availability, however, combined with in-creased nutrient demands as the newly-established stands buildleaf area (Switzer and Nelson, 1972; Miller, 1995) may impose sub-stantial productivity constraints related to organic matter removal(Proe et al., 1996; Egnell and Valinger, 2003; Mendham et al.,2003).
Impacts of harvest-related soil compaction often vary with soilconditions. For drier coarse-textured soils compaction can increasewater holding capacity, root/soil contact and resource uptakewhereas for moister, finer-textured soils compaction often restrictssoil aeration, with soil strength and possible rooting restrictionsincreasing on many soil types (Greacen and Sands, 1980; Kozlow-ski, 1999). Further, the combined effects of these soil impacts mayor may not affect stand productivity (Froehlich et al., 1986; Milleret al., 1996; Gomez et al., 2002a). Over time bulk densities and aer-ation porosities are likely to recover, but recovery rates can varygreatly, reflecting frost action, soil rock and water content, plantrooting, shrink-swell activity, and the action of soil fauna (Greacenand Sands, 1980; Corns, 1988; Powers et al., 2005; Eisenbies et al.,2007).
Effects of vegetation control on productivity are likely to varywith vegetation type, soil conditions, climate regime, and time(South et al., 2006). Further, results often depend on the productiv-ity measure used (e.g., biomass production of crop trees vs. that ofthe entire plant community). Herbaceous competition is often se-vere initially but effects can diminish markedly with canopy clo-sure and understory shading (Mason and Milne, 1999; Milleret al., 2003a,b). Larger woody competition often produces greaterdecreases in planted tree biomass as time proceeds, but effectson total stand biomass vary greatly, depending on site and timeframe (Glover and Zutter, 1993; Miller et al., 1999, 2003a,b; Roseet al., 2006).
In earlier synthetic papers we addressed treatment effects on5th year seedling establishment (Fleming et al., 2006), soil C andN (Sanchez et al., 2006) and soil physical properties (Page-Dumro-ese et al., 2006), and 10th year effects on soil C and nutrient avail-ability, soil bulk density and stand biomass at 18 installations(Powers et al., 2005). Briefly, forest floor removal improved seed-ling establishment at Mediterranean (Medit) sites but reduced itat Warm Humid (WmHd) sites (Fleming et al., 2006). Overall, Pow-ers et al. (2005) found 10th year total above-ground biomass
(without vegetation control) was not significantly affected by or-ganic matter removal. Compaction generally improved seedlingestablishment, particularly with intact forest floors (Fleminget al., 2006) whereas effects on 10th year total stand biomass (noforest floor only) varied with soil texture and were present (nega-tive) only with vegetation control (Powers et al., 2005). Vegetationcontrol benefited seedling establishment (Fleming et al., 2006), butgeneral effects on subsequent biomass production were notassessed.
Here we analyze 10th year planted tree and total standing(above-ground) biomass across 45 installations, using additionalanalytic approaches, and consider both regional and transconti-nental trends, as well as foliar N and P concentrations. In partic-ular, we consider the following questions: (1) is there aconsistent or regionally-based trend of decreased biomass pro-duction and/or foliar nutrition with increased organic matterremoval?; (2) are compaction effects on biomass production orfoliar nutrition evident at year 10, and if so, to what degree dosuch effects interact with vegetation control and forest floor re-moval?; and (3) what is the relative importance of vegetationcontrol compared to other treatments in terms of planted-treeand total stand response?
2. Methods
2.1. Site location, forest description, experimental design
This paper draws on 10th year results from a broad spectrumof locations representing a range of climates, soil conditions andspecies, and organized into 29 replicated studies for most analy-ses (Table 1 and (Fig. 1). Studies and installations were assignedto four broad climate groupings based on principal componentsanalysis of modeled climate variables (McKenney et al., 2006)(Table 1). We chose four groupings based on geographic locationand general climate (e.g., Fig. 2): Warm Humid (WmHd) encom-passing studies in the southeast U.S.; Mediterranean (Medit) forstudies in California; Western Montane (WtMt) for studies inthe higher-elevation western interior with cool temperate – bor-eal climates; and Boreal-Great Lakes for studies in northern cooltemperate and boreal climates adjacent to the Great Lakes. Thefull LTSP factorial experimental design involves three organicmatter removal levels (stem-only harvest (OM0), full-tree harvest(OM1) and full-tree harvest plus forest floor removal (OM2)), andthree soil compaction (Comp) levels (none (C0), moderate (C1),and severe (C2)) (Table 2) (Powers et al., 1990). The organic mat-ter removal levels encompass the extremes in removal levels aptto occur with clearcut harvesting and produce a step series in bio-mass and nutrient removal (see Powers et al., 2005, Table 1). Forthe C0, large mechanized equipment was usually excluded fromthe plots, but in some cases (e.g., black spruce, jack pine and cer-tain aspen installations (Stone, 2001; Stone and Kabzems, 2002))dry-weather or winter harvesting was conducted with mecha-nized equipment crossing the plots. Compaction was accom-plished with a variety of mechanical means when soils werenear field capacity with the goal of the C2 treatment to increasesoil bulk density to 80% of that proposed by Daddow and War-rington (1983) as limiting root growth. In the event, however,both C1 and C2 compaction treatments increased root zone densi-ties by similar amounts (averaging about 18% or 011 Mg m�3)(Powers et al., 2005). As a result we only consider the C0 andC2 treatments in this paper. Greater increases in bulk densitieswere associated with lower initial bulk densities, but at all instal-lations the C2 treatment never achieved P80% of Daddow andWarrington’s (1983) proposed growth-limiting values (Powerset al., 2005; Page-Dumroese et al., 2006).
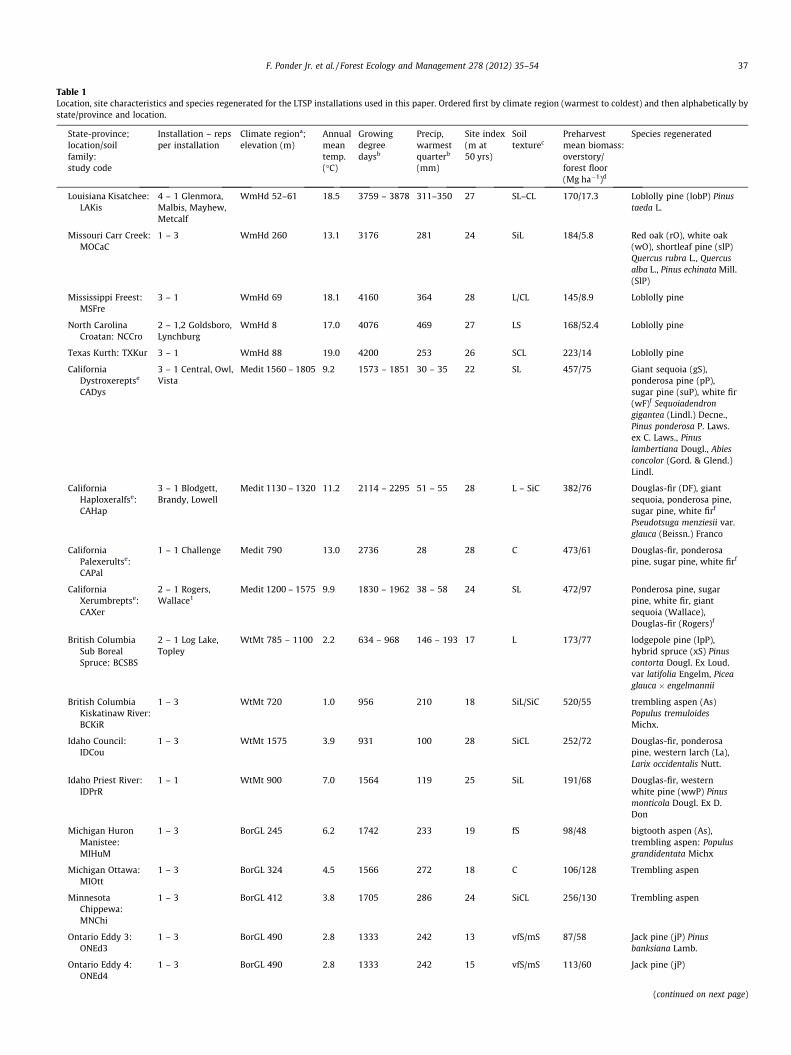
Table 1Location, site characteristics and species regenerated for the LTSP installations used in this paper. Ordered first by climate region (warmest to coldest) and then alphabetically bystate/province and location.
State-province;location/soilfamily:study code
Installation – repsper installation
Climate regiona;elevation (m)
Annualmeantemp.(�C)
Growingdegreedaysb
Precip,warmestquarterb
(mm)
Site index(m at50 yrs)
Soiltexturec
Preharvestmean biomass:overstory/forest floor(Mg ha�1)d
Species regenerated
Louisiana Kisatchee:LAKis
4 – 1 Glenmora,Malbis, Mayhew,Metcalf
WmHd 52–61 18.5 3759 – 3878 311–350 27 SL–CL 170/17.3 Loblolly pine (lobP) Pinustaeda L.
Missouri Carr Creek:MOCaC
1 – 3 WmHd 260 13.1 3176 281 24 SiL 184/5.8 Red oak (rO), white oak(wO), shortleaf pine (slP)Quercus rubra L., Quercusalba L., Pinus echinata Mill.(SlP)
Mississippi Freest:MSFre
3 – 1 WmHd 69 18.1 4160 364 28 L/CL 145/8.9 Loblolly pine
North CarolinaCroatan: NCCro
2 – 1,2 Goldsboro,Lynchburg
WmHd 8 17.0 4076 469 27 LS 168/52.4 Loblolly pine
Texas Kurth: TXKur 3 – 1 WmHd 88 19.0 4200 253 26 SCL 223/14 Loblolly pine
CaliforniaDystroxereptse
CADys
3 – 1 Central, Owl,Vista
Medit 1560 – 1805 9.2 1573 – 1851 30 – 35 22 SL 457/75 Giant sequoia (gS),ponderosa pine (pP),sugar pine (suP), white fir(wF)f Sequoiadendrongigantea (Lindl.) Decne.,Pinus ponderosa P. Laws.ex C. Laws., Pinuslambertiana Dougl., Abiesconcolor (Gord. & Glend.)Lindl.
CaliforniaHaploxeralfse:CAHap
3 – 1 Blodgett,Brandy, Lowell
Medit 1130 – 1320 11.2 2114 – 2295 51 – 55 28 L – SiC 382/76 Douglas-fir (DF), giantsequoia, ponderosa pine,sugar pine, white firf
Pseudotsuga menziesii var.glauca (Beissn.) Franco
CaliforniaPalexerultse:CAPal
1 – 1 Challenge Medit 790 13.0 2736 28 28 C 473/61 Douglas-fir, ponderosapine, sugar pine, white firf
CaliforniaXerumbreptse:CAXer
2 – 1 Rogers,Wallace1
Medit 1200 – 1575 9.9 1830 – 1962 38 – 58 24 SL 472/97 Ponderosa pine, sugarpine, white fir, giantsequoia (Wallace),Douglas-fir (Rogers)f
British ColumbiaSub BorealSpruce: BCSBS
2 – 1 Log Lake,Topley
WtMt 785 – 1100 2.2 634 – 968 146 – 193 17 L 173/77 lodgepole pine (lpP),hybrid spruce (xS) Pinuscontorta Dougl. Ex Loud.var latifolia Engelm, Piceaglauca � engelmannii
British ColumbiaKiskatinaw River:BCKiR
1 – 3 WtMt 720 1.0 956 210 18 SiL/SiC 520/55 trembling aspen (As)Populus tremuloidesMichx.
Idaho Council:IDCou
1 – 3 WtMt 1575 3.9 931 100 28 SiCL 252/72 Douglas-fir, ponderosapine, western larch (La),Larix occidentalis Nutt.
Idaho Priest River:IDPrR
1 – 1 WtMt 900 7.0 1564 119 25 SiL 191/68 Douglas-fir, westernwhite pine (wwP) Pinusmonticola Dougl. Ex D.Don
Michigan HuronManistee:MIHuM
1 – 3 BorGL 245 6.2 1742 233 19 fS 98/48 bigtooth aspen (As),trembling aspen: Populusgrandidentata Michx
Michigan Ottawa:MIOtt
1 – 3 BorGL 324 4.5 1566 272 18 C 106/128 Trembling aspen
MinnesotaChippewa:MNChi
1 – 3 BorGL 412 3.8 1705 286 24 SiCL 256/130 Trembling aspen
Ontario Eddy 3:ONEd3
1 – 3 BorGL 490 2.8 1333 242 13 vfS/mS 87/58 Jack pine (jP) Pinusbanksiana Lamb.
Ontario Eddy 4:ONEd4
1 – 3 BorGL 490 2.8 1333 242 15 vfS/mS 113/60 Jack pine (jP)
(continued on next page)
F. Ponder Jr. et al. / Forest Ecology and Management 278 (2012) 35–54 37
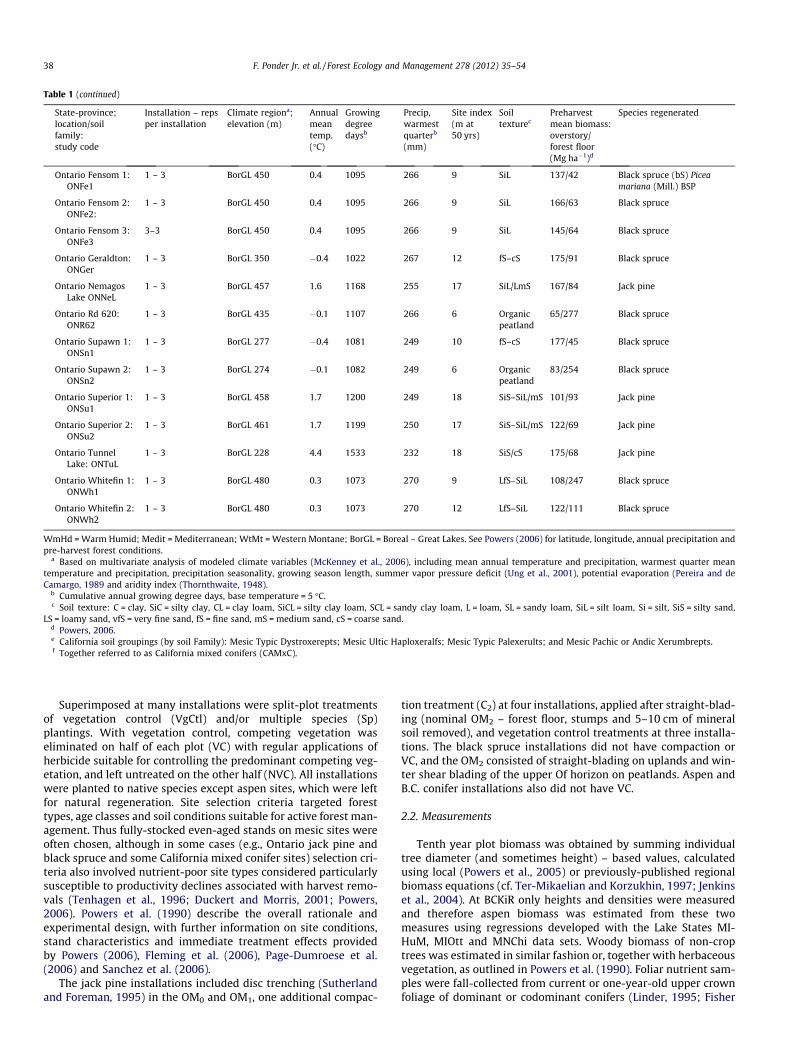
Table 1 (continued)
State-province;location/soilfamily:study code
Installation – repsper installation
Climate regiona;elevation (m)
Annualmeantemp.(�C)
Growingdegreedaysb
Precip,warmestquarterb
(mm)
Site index(m at50 yrs)
Soiltexturec
Preharvestmean biomass:overstory/forest floor(Mg ha�1)d
Species regenerated
Ontario Fensom 1:ONFe1
1 – 3 BorGL 450 0.4 1095 266 9 SiL 137/42 Black spruce (bS) Piceamariana (Mill.) BSP
Ontario Fensom 2:ONFe2:
1 – 3 BorGL 450 0.4 1095 266 9 SiL 166/63 Black spruce
Ontario Fensom 3:ONFe3
3–3 BorGL 450 0.4 1095 266 9 SiL 145/64 Black spruce
Ontario Geraldton:ONGer
1 – 3 BorGL 350 �0.4 1022 267 12 fS–cS 175/91 Black spruce
Ontario NemagosLake ONNeL
1 – 3 BorGL 457 1.6 1168 255 17 SiL/LmS 167/84 Jack pine
Ontario Rd 620:ONR62
1 – 3 BorGL 435 �0.1 1107 266 6 Organicpeatland
65/277 Black spruce
Ontario Supawn 1:ONSn1
1 – 3 BorGL 277 �0.4 1081 249 10 fS–cS 177/45 Black spruce
Ontario Supawn 2:ONSn2
1 – 3 BorGL 274 �0.1 1082 249 6 Organicpeatland
83/254 Black spruce
Ontario Superior 1:ONSu1
1 – 3 BorGL 458 1.7 1200 249 18 SiS–SiL/mS 101/93 Jack pine
Ontario Superior 2:ONSu2
1 – 3 BorGL 461 1.7 1199 250 17 SiS–SiL/mS 122/69 Jack pine
Ontario TunnelLake: ONTuL
1 – 3 BorGL 228 4.4 1533 232 18 SiS/cS 175/68 Jack pine
Ontario Whitefin 1:ONWh1
1 – 3 BorGL 480 0.3 1073 270 9 LfS–SiL 108/247 Black spruce
Ontario Whitefin 2:ONWh2
1 – 3 BorGL 480 0.3 1073 270 12 LfS–SiL 122/111 Black spruce
WmHd = Warm Humid; Medit = Mediterranean; WtMt = Western Montane; BorGL = Boreal – Great Lakes. See Powers (2006) for latitude, longitude, annual precipitation andpre-harvest forest conditions.
a Based on multivariate analysis of modeled climate variables (McKenney et al., 2006), including mean annual temperature and precipitation, warmest quarter meantemperature and precipitation, precipitation seasonality, growing season length, summer vapor pressure deficit (Ung et al., 2001), potential evaporation (Pereira and deCamargo, 1989 and aridity index (Thornthwaite, 1948).
b Cumulative annual growing degree days, base temperature = 5 �C.c Soil texture: C = clay, SiC = silty clay, CL = clay loam, SiCL = silty clay loam, SCL = sandy clay loam, L = loam, SL = sandy loam, SiL = silt loam, Si = silt, SiS = silty sand,
LS = loamy sand, vfS = very fine sand, fS = fine sand, mS = medium sand, cS = coarse sand.d Powers, 2006.e California soil groupings (by soil Family): Mesic Typic Dystroxerepts; Mesic Ultic Haploxeralfs; Mesic Typic Palexerults; and Mesic Pachic or Andic Xerumbrepts.f Together referred to as California mixed conifers (CAMxC).
38 F. Ponder Jr. et al. / Forest Ecology and Management 278 (2012) 35–54
Superimposed at many installations were split-plot treatmentsof vegetation control (VgCtl) and/or multiple species (Sp)plantings. With vegetation control, competing vegetation waseliminated on half of each plot (VC) with regular applications ofherbicide suitable for controlling the predominant competing veg-etation, and left untreated on the other half (NVC). All installationswere planted to native species except aspen sites, which were leftfor natural regeneration. Site selection criteria targeted foresttypes, age classes and soil conditions suitable for active forest man-agement. Thus fully-stocked even-aged stands on mesic sites wereoften chosen, although in some cases (e.g., Ontario jack pine andblack spruce and some California mixed conifer sites) selection cri-teria also involved nutrient-poor site types considered particularlysusceptible to productivity declines associated with harvest remo-vals (Tenhagen et al., 1996; Duckert and Morris, 2001; Powers,2006). Powers et al. (1990) describe the overall rationale andexperimental design, with further information on site conditions,stand characteristics and immediate treatment effects providedby Powers (2006), Fleming et al. (2006), Page-Dumroese et al.(2006) and Sanchez et al. (2006).
The jack pine installations included disc trenching (Sutherlandand Foreman, 1995) in the OM0 and OM1, one additional compac-
tion treatment (C2) at four installations, applied after straight-blad-ing (nominal OM2 – forest floor, stumps and 5–10 cm of mineralsoil removed), and vegetation control treatments at three installa-tions. The black spruce installations did not have compaction orVC, and the OM2 consisted of straight-blading on uplands and win-ter shear blading of the upper Of horizon on peatlands. Aspen andB.C. conifer installations also did not have VC.
2.2. Measurements
Tenth year plot biomass was obtained by summing individualtree diameter (and sometimes height) – based values, calculatedusing local (Powers et al., 2005) or previously-published regionalbiomass equations (cf. Ter-Mikaelian and Korzukhin, 1997; Jenkinset al., 2004). At BCKiR only heights and densities were measuredand therefore aspen biomass was estimated from these twomeasures using regressions developed with the Lake States MI-HuM, MIOtt and MNChi data sets. Woody biomass of non-croptrees was estimated in similar fashion or, together with herbaceousvegetation, as outlined in Powers et al. (1990). Foliar nutrient sam-ples were fall-collected from current or one-year-old upper crownfoliage of dominant or codominant conifers (Linder, 1995; Fisher
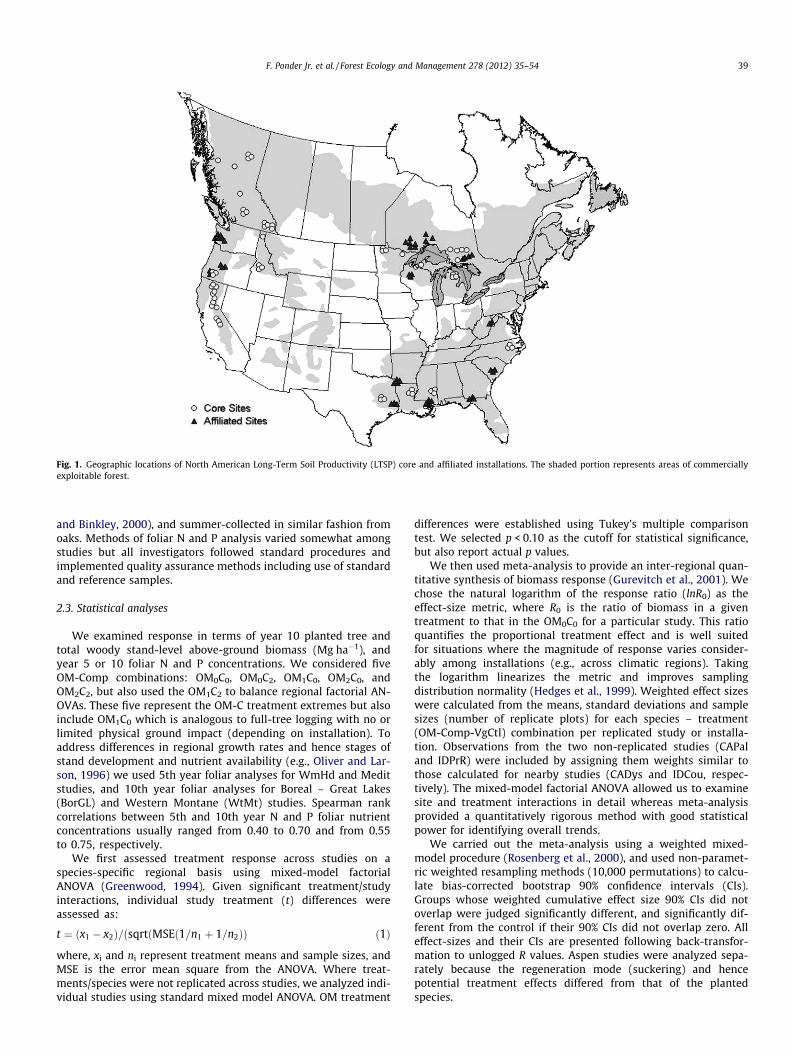
Fig. 1. Geographic locations of North American Long-Term Soil Productivity (LTSP) core and affiliated installations. The shaded portion represents areas of commerciallyexploitable forest.
F. Ponder Jr. et al. / Forest Ecology and Management 278 (2012) 35–54 39
and Binkley, 2000), and summer-collected in similar fashion fromoaks. Methods of foliar N and P analysis varied somewhat amongstudies but all investigators followed standard procedures andimplemented quality assurance methods including use of standardand reference samples.
2.3. Statistical analyses
We examined response in terms of year 10 planted tree andtotal woody stand-level above-ground biomass (Mg ha�1), andyear 5 or 10 foliar N and P concentrations. We considered fiveOM-Comp combinations: OM0C0, OM0C2, OM1C0, OM2C0, andOM2C2, but also used the OM1C2 to balance regional factorial AN-OVAs. These five represent the OM-C treatment extremes but alsoinclude OM1C0 which is analogous to full-tree logging with no orlimited physical ground impact (depending on installation). Toaddress differences in regional growth rates and hence stages ofstand development and nutrient availability (e.g., Oliver and Lar-son, 1996) we used 5th year foliar analyses for WmHd and Meditstudies, and 10th year foliar analyses for Boreal – Great Lakes(BorGL) and Western Montane (WtMt) studies. Spearman rankcorrelations between 5th and 10th year N and P foliar nutrientconcentrations usually ranged from 0.40 to 0.70 and from 0.55to 0.75, respectively.
We first assessed treatment response across studies on aspecies-specific regional basis using mixed-model factorialANOVA (Greenwood, 1994). Given significant treatment/studyinteractions, individual study treatment (t) differences wereassessed as:
t ¼ ðx1 � x2Þ=ðsqrtðMSEð1=n1 þ 1=n2ÞÞ ð1Þ
where, xi and ni represent treatment means and sample sizes, andMSE is the error mean square from the ANOVA. Where treat-ments/species were not replicated across studies, we analyzed indi-vidual studies using standard mixed model ANOVA. OM treatment
differences were established using Tukey’s multiple comparisontest. We selected p < 0.10 as the cutoff for statistical significance,but also report actual p values.
We then used meta-analysis to provide an inter-regional quan-titative synthesis of biomass response (Gurevitch et al., 2001). Wechose the natural logarithm of the response ratio (lnR0) as theeffect-size metric, where R0 is the ratio of biomass in a giventreatment to that in the OM0C0 for a particular study. This ratioquantifies the proportional treatment effect and is well suitedfor situations where the magnitude of response varies consider-ably among installations (e.g., across climatic regions). Takingthe logarithm linearizes the metric and improves samplingdistribution normality (Hedges et al., 1999). Weighted effect sizeswere calculated from the means, standard deviations and samplesizes (number of replicate plots) for each species – treatment(OM-Comp-VgCtl) combination per replicated study or installa-tion. Observations from the two non-replicated studies (CAPaland IDPrR) were included by assigning them weights similar tothose calculated for nearby studies (CADys and IDCou, respec-tively). The mixed-model factorial ANOVA allowed us to examinesite and treatment interactions in detail whereas meta-analysisprovided a quantitatively rigorous method with good statisticalpower for identifying overall trends.
We carried out the meta-analysis using a weighted mixed-model procedure (Rosenberg et al., 2000), and used non-paramet-ric weighted resampling methods (10,000 permutations) to calcu-late bias-corrected bootstrap 90% confidence intervals (CIs).Groups whose weighted cumulative effect size 90% CIs did notoverlap were judged significantly different, and significantly dif-ferent from the control if their 90% CIs did not overlap zero. Alleffect-sizes and their CIs are presented following back-transfor-mation to unlogged R values. Aspen studies were analyzed sepa-rately because the regeneration mode (suckering) and hencepotential treatment effects differed from that of the plantedspecies.
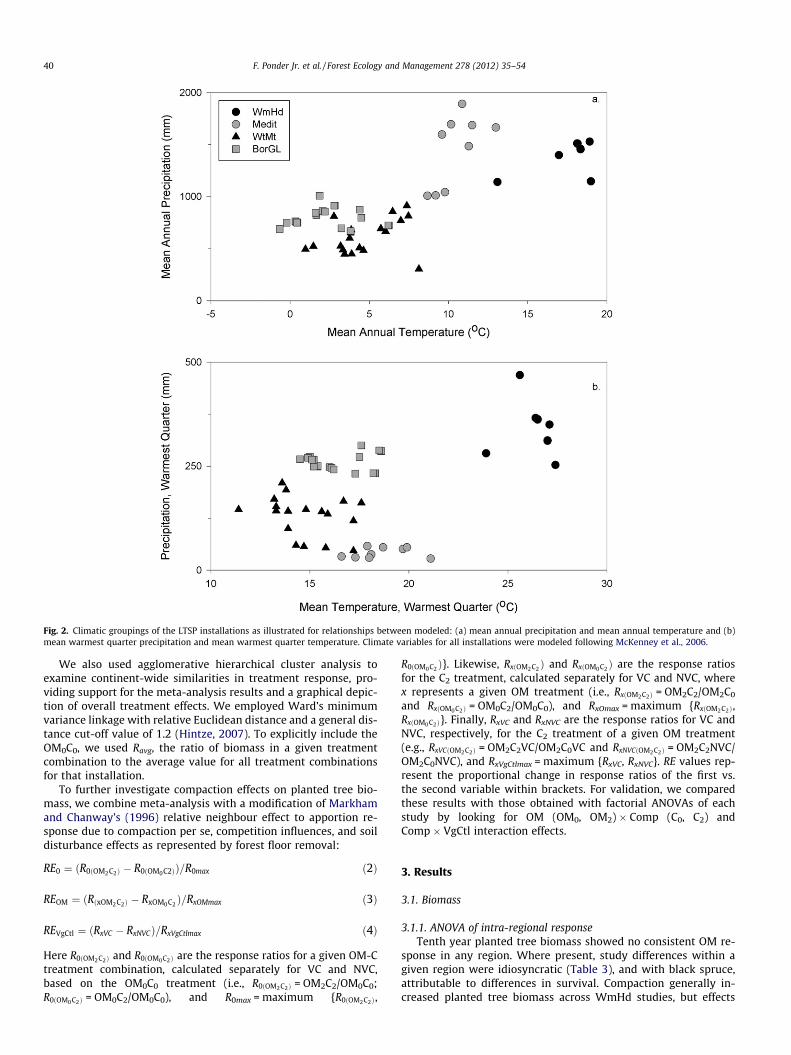
Fig. 2. Climatic groupings of the LTSP installations as illustrated for relationships between modeled: (a) mean annual precipitation and mean annual temperature and (b)mean warmest quarter precipitation and mean warmest quarter temperature. Climate variables for all installations were modeled following McKenney et al., 2006.
40 F. Ponder Jr. et al. / Forest Ecology and Management 278 (2012) 35–54
We also used agglomerative hierarchical cluster analysis toexamine continent-wide similarities in treatment response, pro-viding support for the meta-analysis results and a graphical depic-tion of overall treatment effects. We employed Ward’s minimumvariance linkage with relative Euclidean distance and a general dis-tance cut-off value of 1.2 (Hintze, 2007). To explicitly include theOM0C0, we used Ravg, the ratio of biomass in a given treatmentcombination to the average value for all treatment combinationsfor that installation.
To further investigate compaction effects on planted tree bio-mass, we combine meta-analysis with a modification of Markhamand Chanway’s (1996) relative neighbour effect to apportion re-sponse due to compaction per se, competition influences, and soildisturbance effects as represented by forest floor removal:
RE0 ¼ ðR0ðOM2C2Þ � R0ðOM0C2ÞÞ=R0max ð2Þ
REOM ¼ ðRðxOM2C2Þ � RxOM0C2 Þ=RxOMmax ð3Þ
REVgCtl ¼ ðRxVC � RxNVCÞ=RxVgCtlmax ð4Þ
Here R0ðOM2C2Þ and R0ðOM0C2Þ are the response ratios for a given OM-Ctreatment combination, calculated separately for VC and NVC,based on the OM0C0 treatment (i.e., R0ðOM2C2Þ = OM2C2/OM0C0;R0ðOM0C2Þ = OM0C2/OM0C0), and R0max = maximum {R0ðOM2C2Þ,
R0ðOM0C2 Þ}. Likewise, RxðOM2C2 Þ and RxðOM0C2 Þ are the response ratiosfor the C2 treatment, calculated separately for VC and NVC, wherex represents a given OM treatment (i.e., RxðOM2C2Þ = OM2C2/OM2C0
and RxðOM0C2Þ = OM0C2/OM0C0), and RxOmax = maximum {RxðOM2C2Þ,RxðOM0C2Þ}. Finally, RxVC and RxNVC are the response ratios for VC andNVC, respectively, for the C2 treatment of a given OM treatment(e.g., RxVCðOM2C2Þ = OM2C2VC/OM2C0VC and RxNVCðOM2C2Þ = OM2C2NVC/OM2C0NVC), and RxVgCtlmax = maximum {RxVC, RxNVC}. RE values rep-resent the proportional change in response ratios of the first vs.the second variable within brackets. For validation, we comparedthese results with those obtained with factorial ANOVAs of eachstudy by looking for OM (OM0, OM2) � Comp (C0, C2) andComp � VgCtl interaction effects.
3. Results
3.1. Biomass
3.1.1. ANOVA of intra-regional responseTenth year planted tree biomass showed no consistent OM re-
sponse in any region. Where present, study differences within agiven region were idiosyncratic (Table 3), and with black spruce,attributable to differences in survival. Compaction generally in-creased planted tree biomass across WmHd studies, but effects
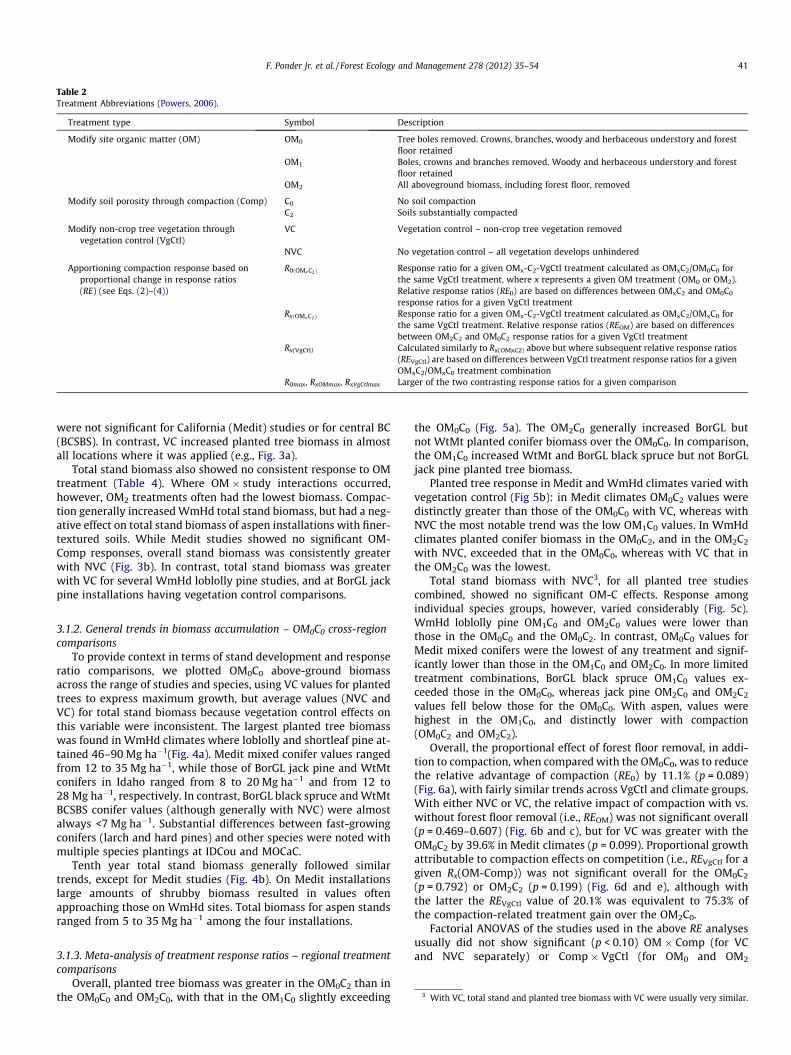
Table 2Treatment Abbreviations (Powers, 2006).
Treatment type Symbol Description
Modify site organic matter (OM) OM0 Tree boles removed. Crowns, branches, woody and herbaceous understory and forestfloor retained
OM1 Boles, crowns and branches removed. Woody and herbaceous understory and forestfloor retained
OM2 All aboveground biomass, including forest floor, removed
Modify soil porosity through compaction (Comp) C0 No soil compactionC2 Soils substantially compacted
Modify non-crop tree vegetation throughvegetation control (VgCtl)
VC Vegetation control – non-crop tree vegetation removed
NVC No vegetation control – all vegetation develops unhindered
Apportioning compaction response based onproportional change in response ratios(RE) (see Eqs. (2)–(4))
R0ðOMx C2Þ Response ratio for a given OMx-C2-VgCtl treatment calculated as OMxC2/OM0C0 forthe same VgCtl treatment, where x represents a given OM treatment (OM0 or OM2).Relative response ratios (RE0) are based on differences between OMxC2 and OM0C0
response ratios for a given VgCtl treatmentRxðOMx C2Þ Response ratio for a given OMx-C2-VgCtl treatment calculated as OMxC2/OMxC0 for
the same VgCtl treatment. Relative response ratios (REOM) are based on differencesbetween OM2C2 and OM0C2 response ratios for a given VgCtl treatment
Rx(VgCtl) Calculated similarly to Rx(OMxC2) above but where subsequent relative response ratios(REVgCtl) are based on differences between VgCtl treatment response ratios for a givenOMxC2/OMxC0 treatment combination
R0max, RxOMmax, RxVgCtlmax Larger of the two contrasting response ratios for a given comparison
F. Ponder Jr. et al. / Forest Ecology and Management 278 (2012) 35–54 41
were not significant for California (Medit) studies or for central BC(BCSBS). In contrast, VC increased planted tree biomass in almostall locations where it was applied (e.g., Fig. 3a).
Total stand biomass also showed no consistent response to OMtreatment (Table 4). Where OM � study interactions occurred,however, OM2 treatments often had the lowest biomass. Compac-tion generally increased WmHd total stand biomass, but had a neg-ative effect on total stand biomass of aspen installations with finer-textured soils. While Medit studies showed no significant OM-Comp responses, overall stand biomass was consistently greaterwith NVC (Fig. 3b). In contrast, total stand biomass was greaterwith VC for several WmHd loblolly pine studies, and at BorGL jackpine installations having vegetation control comparisons.
3.1.2. General trends in biomass accumulation – OM0C0 cross-regioncomparisons
To provide context in terms of stand development and responseratio comparisons, we plotted OM0C0 above-ground biomassacross the range of studies and species, using VC values for plantedtrees to express maximum growth, but average values (NVC andVC) for total stand biomass because vegetation control effects onthis variable were inconsistent. The largest planted tree biomasswas found in WmHd climates where loblolly and shortleaf pine at-tained 46–90 Mg ha�1(Fig. 4a). Medit mixed conifer values rangedfrom 12 to 35 Mg ha�1, while those of BorGL jack pine and WtMtconifers in Idaho ranged from 8 to 20 Mg ha�1 and from 12 to28 Mg ha�1, respectively. In contrast, BorGL black spruce and WtMtBCSBS conifer values (although generally with NVC) were almostalways <7 Mg ha�1. Substantial differences between fast-growingconifers (larch and hard pines) and other species were noted withmultiple species plantings at IDCou and MOCaC.
Tenth year total stand biomass generally followed similartrends, except for Medit studies (Fig. 4b). On Medit installationslarge amounts of shrubby biomass resulted in values oftenapproaching those on WmHd sites. Total biomass for aspen standsranged from 5 to 35 Mg ha�1 among the four installations.
3 With VC, total stand and planted tree biomass with VC were usually very similar.
3.1.3. Meta-analysis of treatment response ratios – regional treatmentcomparisons
Overall, planted tree biomass was greater in the OM0C2 than inthe OM0C0 and OM2C0, with that in the OM1C0 slightly exceeding
the OM0C0 (Fig. 5a). The OM2C0 generally increased BorGL butnot WtMt planted conifer biomass over the OM0C0. In comparison,the OM1C0 increased WtMt and BorGL black spruce but not BorGLjack pine planted tree biomass.
Planted tree response in Medit and WmHd climates varied withvegetation control (Fig 5b): in Medit climates OM0C2 values weredistinctly greater than those of the OM0C0 with VC, whereas withNVC the most notable trend was the low OM1C0 values. In WmHdclimates planted conifer biomass in the OM0C2, and in the OM2C2
with NVC, exceeded that in the OM0C0, whereas with VC that inthe OM2C0 was the lowest.
Total stand biomass with NVC3, for all planted tree studiescombined, showed no significant OM-C effects. Response amongindividual species groups, however, varied considerably (Fig. 5c).WmHd loblolly pine OM1C0 and OM2C0 values were lower thanthose in the OM0C0 and the OM0C2. In contrast, OM0C0 values forMedit mixed conifers were the lowest of any treatment and signif-icantly lower than those in the OM1C0 and OM2C0. In more limitedtreatment combinations, BorGL black spruce OM1C0 values ex-ceeded those in the OM0C0, whereas jack pine OM2C0 and OM2C2
values fell below those for the OM0C0. With aspen, values werehighest in the OM1C0, and distinctly lower with compaction(OM0C2 and OM2C2).
Overall, the proportional effect of forest floor removal, in addi-tion to compaction, when compared with the OM0C0, was to reducethe relative advantage of compaction (RE0) by 11.1% (p = 0.089)(Fig. 6a), with fairly similar trends across VgCtl and climate groups.With either NVC or VC, the relative impact of compaction with vs.without forest floor removal (i.e., REOM) was not significant overall(p = 0.469–0.607) (Fig. 6b and c), but for VC was greater with theOM0C2 by 39.6% in Medit climates (p = 0.099). Proportional growthattributable to compaction effects on competition (i.e., REVgCtl for agiven Rx(OM-Comp)) was not significant overall for the OM0C2
(p = 0.792) or OM2C2 (p = 0.199) (Fig. 6d and e), although withthe latter the REVgCtl value of 20.1% was equivalent to 75.3% ofthe compaction-related treatment gain over the OM2C0.
Factorial ANOVAS of the studies used in the above RE analysesusually did not show significant (p < 0.10) OM � Comp (for VCand NVC separately) or Comp � VgCtl (for OM0 and OM2
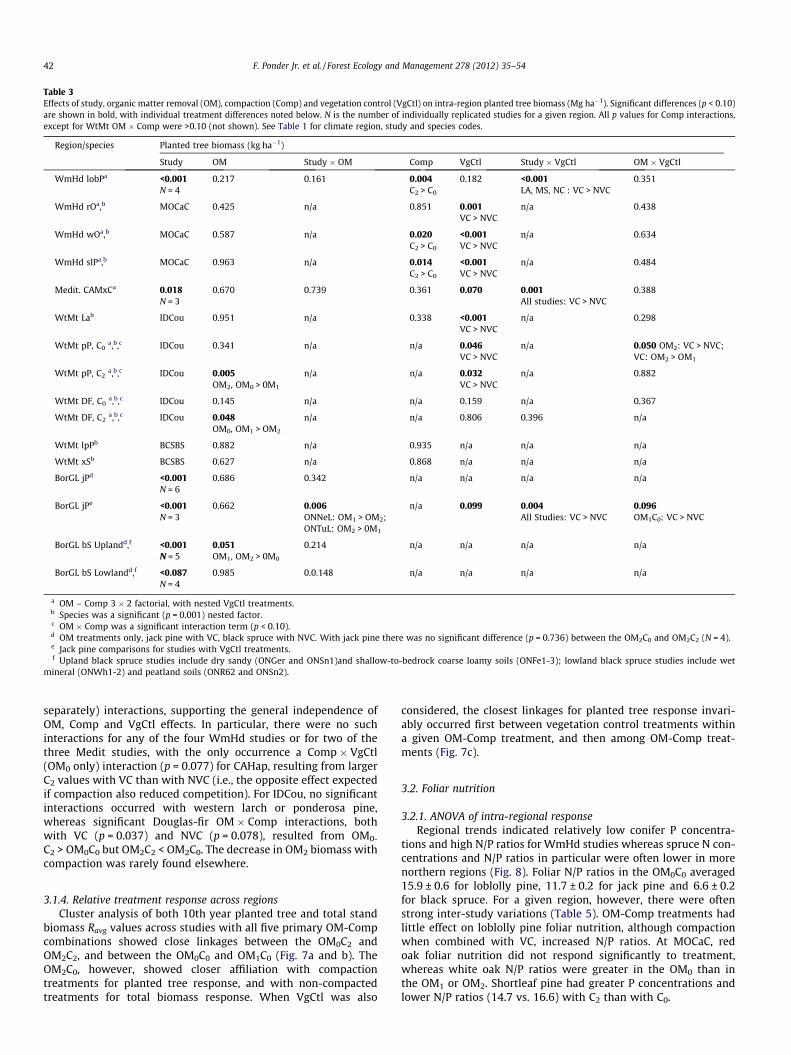
Table 3Effects of study, organic matter removal (OM), compaction (Comp) and vegetation control (VgCtl) on intra-region planted tree biomass (Mg ha�1). Significant differences (p < 0.10)are shown in bold, with individual treatment differences noted below. N is the number of individually replicated studies for a given region. All p values for Comp interactions,except for WtMt OM � Comp were >0.10 (not shown). See Table 1 for climate region, study and species codes.
Region/species Planted tree biomass (kg ha�1)
Study OM Study � OM Comp VgCtl Study � VgCtl OM � VgCtl
WmHd lobPa <0.001N = 4
0.217 0.161 0.004C2 > C0
0.182 <0.001LA, MS, NC : VC > NVC
0.351
WmHd rOa,b MOCaC 0.425 n/a 0.851 0.001VC > NVC
n/a 0.438
WmHd wOa,b MOCaC 0.587 n/a 0.020C2 > C0
<0.001VC > NVC
n/a 0.634
WmHd slPa,b MOCaC 0.963 n/a 0.014C2 > C0
<0.001VC > NVC
n/a 0.484
Medit. CAMxCa 0.018N = 3
0.670 0.739 0.361 0.070 0.001All studies: VC > NVC
0.388
WtMt Lab IDCou 0.951 n/a 0.338 <0.001VC > NVC
n/a 0.298
WtMt pP, C0a,b,c IDCou 0.341 n/a n/a 0.046
VC > NVCn/a 0.050 OM2: VC > NVC;
VC: OM2 > OM1
WtMt pP, C2a,b,c IDCou 0.005
OM2, OM0 > 0M1
n/a n/a 0.032VC > NVC
n/a 0.882
WtMt DF, C0a,b,c IDCou 0.145 n/a n/a 0.159 n/a 0.367
WtMt DF, C2a,b,c IDCou 0.048
OM0, OM1 > OM2
n/a n/a 0.806 0.396 n/a
WtMt lpPb BCSBS 0.882 n/a 0.935 n/a n/a n/a
WtMt xSb BCSBS 0.627 n/a 0.868 n/a n/a n/a
BorGL jPd <0.001N = 6
0.686 0.342 n/a n/a n/a n/a
BorGL jPe <0.001N = 3
0.662 0.006ONNeL: OM1 > OM2;ONTuL: OM2 > 0M1
n/a 0.099 0.004All Studies: VC > NVC
0.096OM1C0: VC > NVC
BorGL bS Uplandd,f <0.001N = 5
0.051OM1, OM2 > 0M0
0.214 n/a n/a n/a n/a
BorGL bS Lowlandd,f <0.087N = 4
0.985 0.0.148 n/a n/a n/a n/a
a OM – Comp 3 � 2 factorial, with nested VgCtl treatments.b Species was a significant (p = 0.001) nested factor.c OM � Comp was a significant interaction term (p < 0.10).d OM treatments only, jack pine with VC, black spruce with NVC. With jack pine there was no significant difference (p = 0.736) between the OM2C0 and OM2C2 (N = 4).e Jack pine comparisons for studies with VgCtl treatments.f Upland black spruce studies include dry sandy (ONGer and ONSn1)and shallow-to-bedrock coarse loamy soils (ONFe1-3); lowland black spruce studies include wet
mineral (ONWh1-2) and peatland soils (ONR62 and ONSn2).
42 F. Ponder Jr. et al. / Forest Ecology and Management 278 (2012) 35–54
separately) interactions, supporting the general independence ofOM, Comp and VgCtl effects. In particular, there were no suchinteractions for any of the four WmHd studies or for two of thethree Medit studies, with the only occurrence a Comp � VgCtl(OM0 only) interaction (p = 0.077) for CAHap, resulting from largerC2 values with VC than with NVC (i.e., the opposite effect expectedif compaction also reduced competition). For IDCou, no significantinteractions occurred with western larch or ponderosa pine,whereas significant Douglas-fir OM � Comp interactions, bothwith VC (p = 0.037) and NVC (p = 0.078), resulted from OM0-
C2 > OM0C0 but OM2C2 < OM2C0. The decrease in OM2 biomass withcompaction was rarely found elsewhere.
3.1.4. Relative treatment response across regionsCluster analysis of both 10th year planted tree and total stand
biomass Ravg values across studies with all five primary OM-Compcombinations showed close linkages between the OM0C2 andOM2C2, and between the OM0C0 and OM1C0 (Fig. 7a and b). TheOM2C0, however, showed closer affiliation with compactiontreatments for planted tree response, and with non-compactedtreatments for total biomass response. When VgCtl was also
considered, the closest linkages for planted tree response invari-ably occurred first between vegetation control treatments withina given OM-Comp treatment, and then among OM-Comp treat-ments (Fig. 7c).
3.2. Foliar nutrition
3.2.1. ANOVA of intra-regional responseRegional trends indicated relatively low conifer P concentra-
tions and high N/P ratios for WmHd studies whereas spruce N con-centrations and N/P ratios in particular were often lower in morenorthern regions (Fig. 8). Foliar N/P ratios in the OM0C0 averaged15.9 ± 0.6 for loblolly pine, 11.7 ± 0.2 for jack pine and 6.6 ± 0.2for black spruce. For a given region, however, there were oftenstrong inter-study variations (Table 5). OM-Comp treatments hadlittle effect on loblolly pine foliar nutrition, although compactionwhen combined with VC, increased N/P ratios. At MOCaC, redoak foliar nutrition did not respond significantly to treatment,whereas white oak N/P ratios were greater in the OM0 than inthe OM1 or OM2. Shortleaf pine had greater P concentrations andlower N/P ratios (14.7 vs. 16.6) with C2 than with C0.

Fig. 3. Mean 10th year response (±standard errors) to vegetation control (all OM-Comp treatments combined) for Mediterranean (California) studies in terms of mixedconifer: (a) planted tree biomass and (b) total stand biomass. See Table 1 for study codes.
Table 4Effects of study, organic matter removal (OM), compaction (Comp) and vegetation control (VgCtl) on intra-region total stand biomass (Mg ha�1). Significant differences (p < 0.10)are shown in bold, with individual treatment differences noted below. N is the number of individually replicated studies. All p values for VgCtl interactions, except Study � VgCtl,were >0.10 (not shown). See Table 1 for climate region, study and species codes.
Region/species Total biomass (Mg ha�1)
Study OM Study � OM Comp Study � Comp OM � Comp VgCtl Study � VgCtl
WmHd lobPa <0.001N = 4
0.294 0.099MSFre: OM0 > OM1, OM2;TXKur: OM0 > OM2
0.080C2 > C0
0.485 0.870 0.105 <0.001LA, MS,NC : VC > NVC
Medit. CAMxCa 0.048N = 3
0.887 0.857 0.772 0.388 0.345 0.035NVC > VC
0.302
BorGL/WtMt Asb <0.001N = 4
0.470 0.414 0.318 <0.001MNChi: C0 > C2
0.271 n/a n/a
BorGL jPc, <0.001N = 6
0.065 0.076ONSu1, ONSu2: OM0 > OM2
n/a n/a n/a n/a n/a
BorGL bS Uplandd <0.001N = 5
0.084OM1, OM2 > OM0
0.186 n/a n/a n/a n/a n/a
BorGL bS Lowlandd <0.001N = 4
0.048 0.037ONWh1, ONWh2:OM0,OM1 > OM2
n/a n/a n/a n/a n/a
a OM – Comp 3 � 2 factorial design with nested VgCtl treatments.b OM – Comp 3 � 2 factorial design, no vegetation control. Included in this analysis are BCKiR, MNChi, MIHuM and MIOtt.c OM treatments only, VC. There was no significant difference (p = 0.290) between OM2C0 and OM2C2 (N = 4), whereas for studies with OM – VgCtl treatments (N = 3), total
biomass was significantly greater (p < 0.061) with VC.d OM treatments only, NVC: upland sites include ONFen1-3, ONGer and ONSn1; lowland sites include ONWh1-2, ONR62 and ONSn2.
F. Ponder Jr. et al. / Forest Ecology and Management 278 (2012) 35–54 43
For BorGL but not WtMt studies, foliar nutrient concentrationswere usually lower with the OM2. Compaction had no significanteffect on western white pine or jack pine OM2 foliar nutrition,but increased Douglas-fir N concentrations at IDPrR. Limited datafrom Medit sites showed no significant response in ponderosa pineN concentration to OM-Comp treatments at two installations(Challenge and Rogers), with greater N concentrations in OM2 thanOM0 at a third (Blodgett) (Gomez et al., 2002b). At Wallace, meanmixed conifer N concentrations were somewhat greater (p = 0.050)in the OM2 than in the OM0.
In contrast, vegetation control often affected foliar nutrition(Fig. 9). With WmHd loblolly pine, VC increased N but decreasedP concentrations for all four studies, and increased N/P ratios atthree of these. In California, both Wallace (p = 0.039) and Central(p = 0.012) showed increased N concentrations with VC. However,
at more northern locations (e.g., Ontario jack pine and Idaho mixedconifers) vegetation control had no significant effects.
3.2.2. Foliar nutrition – biomass relationships: intra-regionalcomparisons
Loblolly pine foliar N and P concentrations and N/P ratiosshowed relatively strong negative correlations overall with 10thyear planted tree and total stand biomass across studies (Table 6).For individual studies, however, correlations were usually not sig-nificant (p > 0.10). At MOCaC, white oak showed no significant cor-relations but shortleaf pine foliar N (+ve) and N/P ratios (�ve) ofboth red oak and shortleaf pine with VC were significantly corre-lated with 10th year biomass. IDPrR western white pine and BCSBSlodgepole pine foliar nutrition was not correlated (p > 0.10) with10th year planted tree biomass, but there were positive correla-
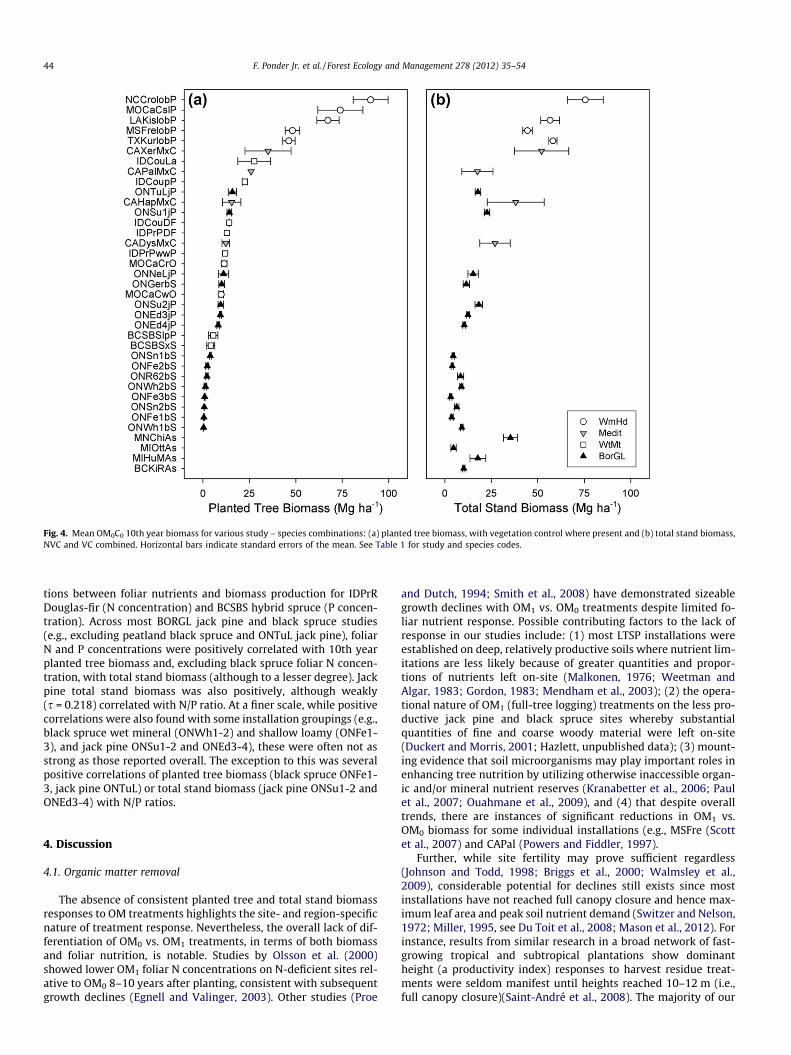
Fig. 4. Mean OM0C0 10th year biomass for various study – species combinations: (a) planted tree biomass, with vegetation control where present and (b) total stand biomass,NVC and VC combined. Horizontal bars indicate standard errors of the mean. See Table 1 for study and species codes.
44 F. Ponder Jr. et al. / Forest Ecology and Management 278 (2012) 35–54
tions between foliar nutrients and biomass production for IDPrRDouglas-fir (N concentration) and BCSBS hybrid spruce (P concen-tration). Across most BORGL jack pine and black spruce studies(e.g., excluding peatland black spruce and ONTuL jack pine), foliarN and P concentrations were positively correlated with 10th yearplanted tree biomass and, excluding black spruce foliar N concen-tration, with total stand biomass (although to a lesser degree). Jackpine total stand biomass was also positively, although weakly(s = 0.218) correlated with N/P ratio. At a finer scale, while positivecorrelations were also found with some installation groupings (e.g.,black spruce wet mineral (ONWh1-2) and shallow loamy (ONFe1-3), and jack pine ONSu1-2 and ONEd3-4), these were often not asstrong as those reported overall. The exception to this was severalpositive correlations of planted tree biomass (black spruce ONFe1-3, jack pine ONTuL) or total stand biomass (jack pine ONSu1-2 andONEd3-4) with N/P ratios.
4. Discussion
4.1. Organic matter removal
The absence of consistent planted tree and total stand biomassresponses to OM treatments highlights the site- and region-specificnature of treatment response. Nevertheless, the overall lack of dif-ferentiation of OM0 vs. OM1 treatments, in terms of both biomassand foliar nutrition, is notable. Studies by Olsson et al. (2000)showed lower OM1 foliar N concentrations on N-deficient sites rel-ative to OM0 8–10 years after planting, consistent with subsequentgrowth declines (Egnell and Valinger, 2003). Other studies (Proe
and Dutch, 1994; Smith et al., 2008) have demonstrated sizeablegrowth declines with OM1 vs. OM0 treatments despite limited fo-liar nutrient response. Possible contributing factors to the lack ofresponse in our studies include: (1) most LTSP installations wereestablished on deep, relatively productive soils where nutrient lim-itations are less likely because of greater quantities and propor-tions of nutrients left on-site (Malkonen, 1976; Weetman andAlgar, 1983; Gordon, 1983; Mendham et al., 2003); (2) the opera-tional nature of OM1 (full-tree logging) treatments on the less pro-ductive jack pine and black spruce sites whereby substantialquantities of fine and coarse woody material were left on-site(Duckert and Morris, 2001; Hazlett, unpublished data); (3) mount-ing evidence that soil microorganisms may play important roles inenhancing tree nutrition by utilizing otherwise inaccessible organ-ic and/or mineral nutrient reserves (Kranabetter et al., 2006; Paulet al., 2007; Ouahmane et al., 2009), and (4) that despite overalltrends, there are instances of significant reductions in OM1 vs.OM0 biomass for some individual installations (e.g., MSFre (Scottet al., 2007) and CAPal (Powers and Fiddler, 1997).
Further, while site fertility may prove sufficient regardless(Johnson and Todd, 1998; Briggs et al., 2000; Walmsley et al.,2009), considerable potential for declines still exists since mostinstallations have not reached full canopy closure and hence max-imum leaf area and peak soil nutrient demand (Switzer and Nelson,1972; Miller, 1995, see Du Toit et al., 2008; Mason et al., 2012). Forinstance, results from similar research in a broad network of fast-growing tropical and subtropical plantations show dominantheight (a productivity index) responses to harvest residue treat-ments were seldom manifest until heights reached 10–12 m (i.e.,full canopy closure)(Saint-André et al., 2008). The majority of our
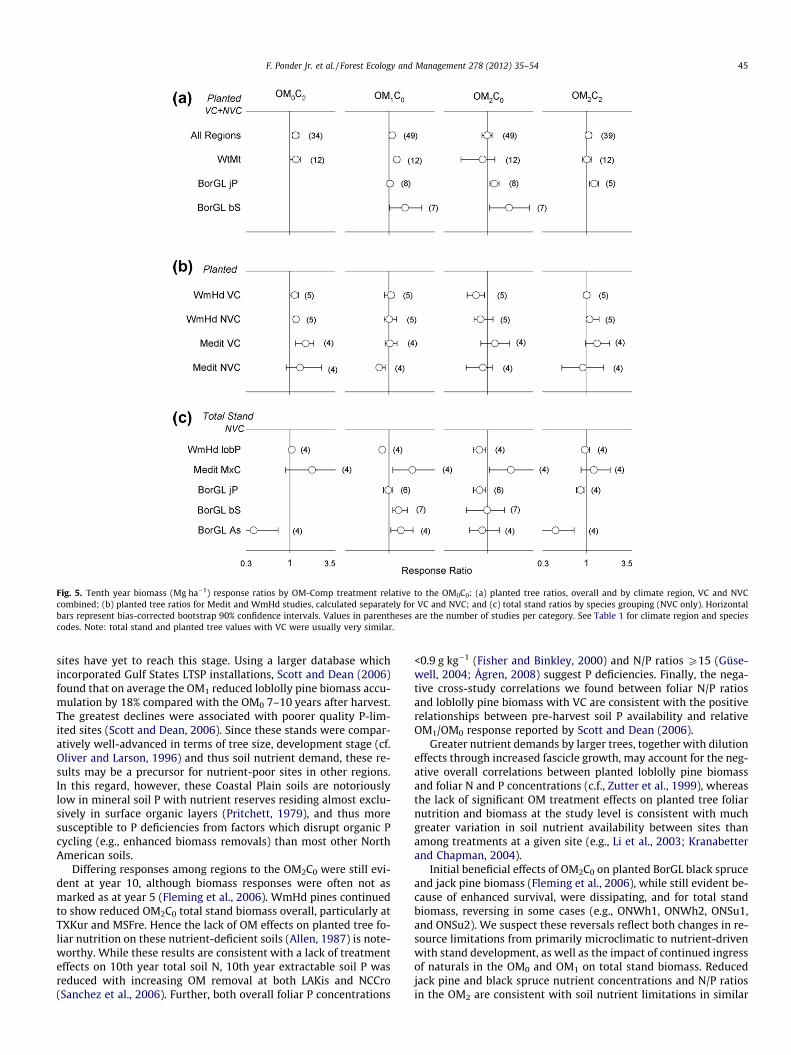
Fig. 5. Tenth year biomass (Mg ha�1) response ratios by OM-Comp treatment relative to the OM0C0: (a) planted tree ratios, overall and by climate region, VC and NVCcombined; (b) planted tree ratios for Medit and WmHd studies, calculated separately for VC and NVC; and (c) total stand ratios by species grouping (NVC only). Horizontalbars represent bias-corrected bootstrap 90% confidence intervals. Values in parentheses are the number of studies per category. See Table 1 for climate region and speciescodes. Note: total stand and planted tree values with VC were usually very similar.
F. Ponder Jr. et al. / Forest Ecology and Management 278 (2012) 35–54 45
sites have yet to reach this stage. Using a larger database whichincorporated Gulf States LTSP installations, Scott and Dean (2006)found that on average the OM1 reduced loblolly pine biomass accu-mulation by 18% compared with the OM0 7–10 years after harvest.The greatest declines were associated with poorer quality P-lim-ited sites (Scott and Dean, 2006). Since these stands were compar-atively well-advanced in terms of tree size, development stage (cf.Oliver and Larson, 1996) and thus soil nutrient demand, these re-sults may be a precursor for nutrient-poor sites in other regions.In this regard, however, these Coastal Plain soils are notoriouslylow in mineral soil P with nutrient reserves residing almost exclu-sively in surface organic layers (Pritchett, 1979), and thus moresusceptible to P deficiencies from factors which disrupt organic Pcycling (e.g., enhanced biomass removals) than most other NorthAmerican soils.
Differing responses among regions to the OM2C0 were still evi-dent at year 10, although biomass responses were often not asmarked as at year 5 (Fleming et al., 2006). WmHd pines continuedto show reduced OM2C0 total stand biomass overall, particularly atTXKur and MSFre. Hence the lack of OM effects on planted tree fo-liar nutrition on these nutrient-deficient soils (Allen, 1987) is note-worthy. While these results are consistent with a lack of treatmenteffects on 10th year total soil N, 10th year extractable soil P wasreduced with increasing OM removal at both LAKis and NCCro(Sanchez et al., 2006). Further, both overall foliar P concentrations
<0.9 g kg�1 (Fisher and Binkley, 2000) and N/P ratios P15 (Güse-well, 2004; Ågren, 2008) suggest P deficiencies. Finally, the nega-tive cross-study correlations we found between foliar N/P ratiosand loblolly pine biomass with VC are consistent with the positiverelationships between pre-harvest soil P availability and relativeOM1/OM0 response reported by Scott and Dean (2006).
Greater nutrient demands by larger trees, together with dilutioneffects through increased fascicle growth, may account for the neg-ative overall correlations between planted loblolly pine biomassand foliar N and P concentrations (c.f., Zutter et al., 1999), whereasthe lack of significant OM treatment effects on planted tree foliarnutrition and biomass at the study level is consistent with muchgreater variation in soil nutrient availability between sites thanamong treatments at a given site (e.g., Li et al., 2003; Kranabetterand Chapman, 2004).
Initial beneficial effects of OM2C0 on planted BorGL black spruceand jack pine biomass (Fleming et al., 2006), while still evident be-cause of enhanced survival, were dissipating, and for total standbiomass, reversing in some cases (e.g., ONWh1, ONWh2, ONSu1,and ONSu2). We suspect these reversals reflect both changes in re-source limitations from primarily microclimatic to nutrient-drivenwith stand development, as well as the impact of continued ingressof naturals in the OM0 and OM1 on total stand biomass. Reducedjack pine and black spruce nutrient concentrations and N/P ratiosin the OM2 are consistent with soil nutrient limitations in similar
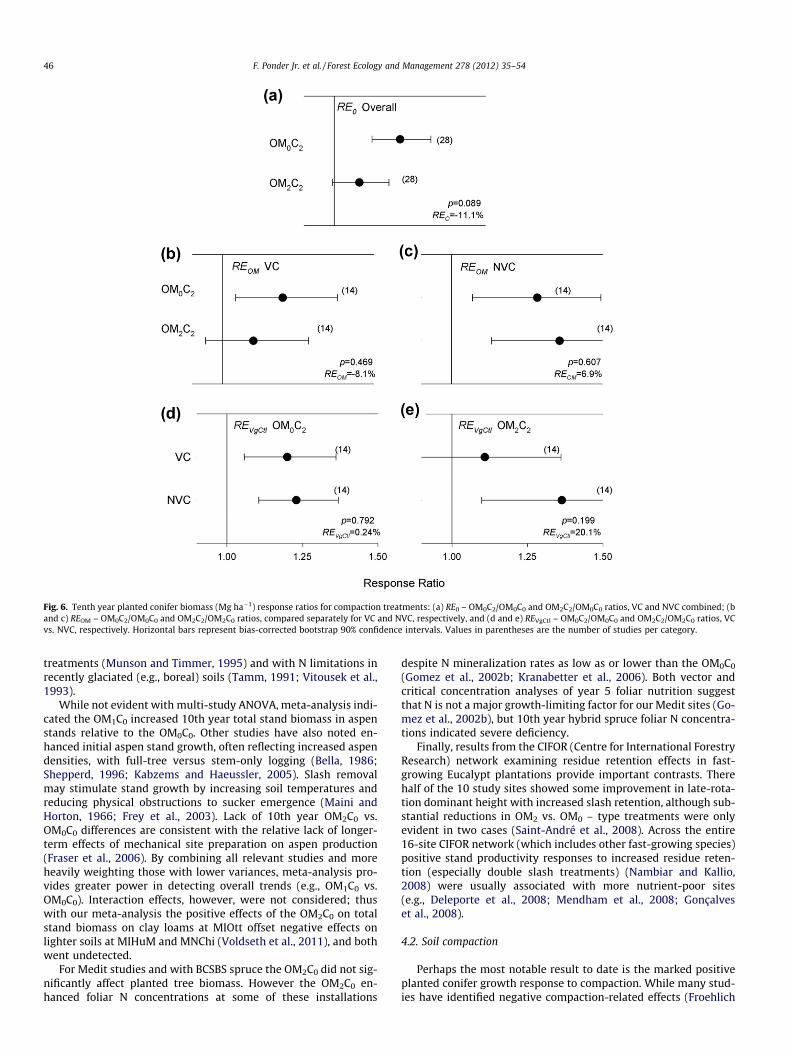
Fig. 6. Tenth year planted conifer biomass (Mg ha�1) response ratios for compaction treatments: (a) RE0 – OM0C2/OM0C0 and OM2C2/OM0C0 ratios, VC and NVC combined; (band c) REOM – OM0C2/OM0C0 and OM2C2/OM2C0 ratios, compared separately for VC and NVC, respectively, and (d and e) REVgCtl – OM0C2/OM0C0 and OM2C2/OM2C0 ratios, VCvs. NVC, respectively. Horizontal bars represent bias-corrected bootstrap 90% confidence intervals. Values in parentheses are the number of studies per category.
46 F. Ponder Jr. et al. / Forest Ecology and Management 278 (2012) 35–54
treatments (Munson and Timmer, 1995) and with N limitations inrecently glaciated (e.g., boreal) soils (Tamm, 1991; Vitousek et al.,1993).
While not evident with multi-study ANOVA, meta-analysis indi-cated the OM1C0 increased 10th year total stand biomass in aspenstands relative to the OM0C0. Other studies have also noted en-hanced initial aspen stand growth, often reflecting increased aspendensities, with full-tree versus stem-only logging (Bella, 1986;Shepperd, 1996; Kabzems and Haeussler, 2005). Slash removalmay stimulate stand growth by increasing soil temperatures andreducing physical obstructions to sucker emergence (Maini andHorton, 1966; Frey et al., 2003). Lack of 10th year OM2C0 vs.OM0C0 differences are consistent with the relative lack of longer-term effects of mechanical site preparation on aspen production(Fraser et al., 2006). By combining all relevant studies and moreheavily weighting those with lower variances, meta-analysis pro-vides greater power in detecting overall trends (e.g., OM1C0 vs.OM0C0). Interaction effects, however, were not considered; thuswith our meta-analysis the positive effects of the OM2C0 on totalstand biomass on clay loams at MIOtt offset negative effects onlighter soils at MIHuM and MNChi (Voldseth et al., 2011), and bothwent undetected.
For Medit studies and with BCSBS spruce the OM2C0 did not sig-nificantly affect planted tree biomass. However the OM2C0 en-hanced foliar N concentrations at some of these installations
despite N mineralization rates as low as or lower than the OM0C0
(Gomez et al., 2002b; Kranabetter et al., 2006). Both vector andcritical concentration analyses of year 5 foliar nutrition suggestthat N is not a major growth-limiting factor for our Medit sites (Go-mez et al., 2002b), but 10th year hybrid spruce foliar N concentra-tions indicated severe deficiency.
Finally, results from the CIFOR (Centre for International ForestryResearch) network examining residue retention effects in fast-growing Eucalypt plantations provide important contrasts. Therehalf of the 10 study sites showed some improvement in late-rota-tion dominant height with increased slash retention, although sub-stantial reductions in OM2 vs. OM0 – type treatments were onlyevident in two cases (Saint-André et al., 2008). Across the entire16-site CIFOR network (which includes other fast-growing species)positive stand productivity responses to increased residue reten-tion (especially double slash treatments) (Nambiar and Kallio,2008) were usually associated with more nutrient-poor sites(e.g., Deleporte et al., 2008; Mendham et al., 2008; Gonçalveset al., 2008).
4.2. Soil compaction
Perhaps the most notable result to date is the marked positiveplanted conifer growth response to compaction. While many stud-ies have identified negative compaction-related effects (Froehlich
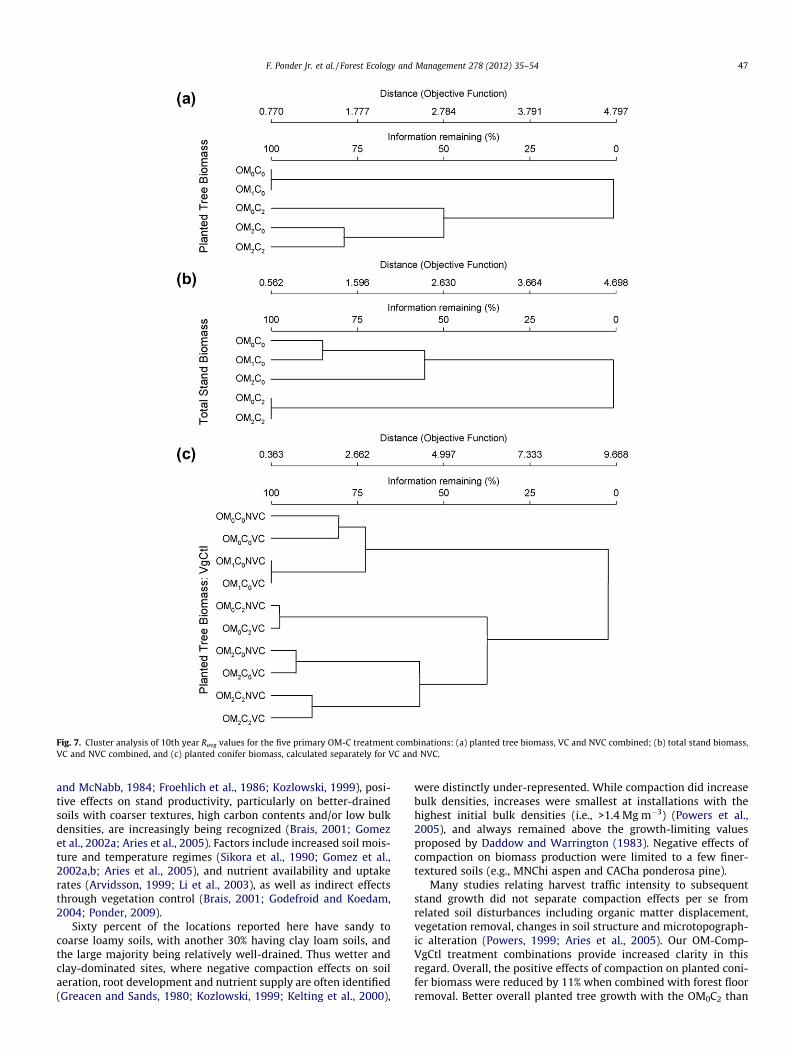
Fig. 7. Cluster analysis of 10th year Ravg values for the five primary OM-C treatment combinations: (a) planted tree biomass, VC and NVC combined; (b) total stand biomass,VC and NVC combined, and (c) planted conifer biomass, calculated separately for VC and NVC.
F. Ponder Jr. et al. / Forest Ecology and Management 278 (2012) 35–54 47
and McNabb, 1984; Froehlich et al., 1986; Kozlowski, 1999), posi-tive effects on stand productivity, particularly on better-drainedsoils with coarser textures, high carbon contents and/or low bulkdensities, are increasingly being recognized (Brais, 2001; Gomezet al., 2002a; Aries et al., 2005). Factors include increased soil mois-ture and temperature regimes (Sikora et al., 1990; Gomez et al.,2002a,b; Aries et al., 2005), and nutrient availability and uptakerates (Arvidsson, 1999; Li et al., 2003), as well as indirect effectsthrough vegetation control (Brais, 2001; Godefroid and Koedam,2004; Ponder, 2009).
Sixty percent of the locations reported here have sandy tocoarse loamy soils, with another 30% having clay loam soils, andthe large majority being relatively well-drained. Thus wetter andclay-dominated sites, where negative compaction effects on soilaeration, root development and nutrient supply are often identified(Greacen and Sands, 1980; Kozlowski, 1999; Kelting et al., 2000),
were distinctly under-represented. While compaction did increasebulk densities, increases were smallest at installations with thehighest initial bulk densities (i.e., >1.4 Mg m�3) (Powers et al.,2005), and always remained above the growth-limiting valuesproposed by Daddow and Warrington (1983). Negative effects ofcompaction on biomass production were limited to a few finer-textured soils (e.g., MNChi aspen and CACha ponderosa pine).
Many studies relating harvest traffic intensity to subsequentstand growth did not separate compaction effects per se fromrelated soil disturbances including organic matter displacement,vegetation removal, changes in soil structure and microtopograph-ic alteration (Powers, 1999; Aries et al., 2005). Our OM-Comp-VgCtl treatment combinations provide increased clarity in thisregard. Overall, the positive effects of compaction on planted coni-fer biomass were reduced by 11% when combined with forest floorremoval. Better overall planted tree growth with the OM0C2 than
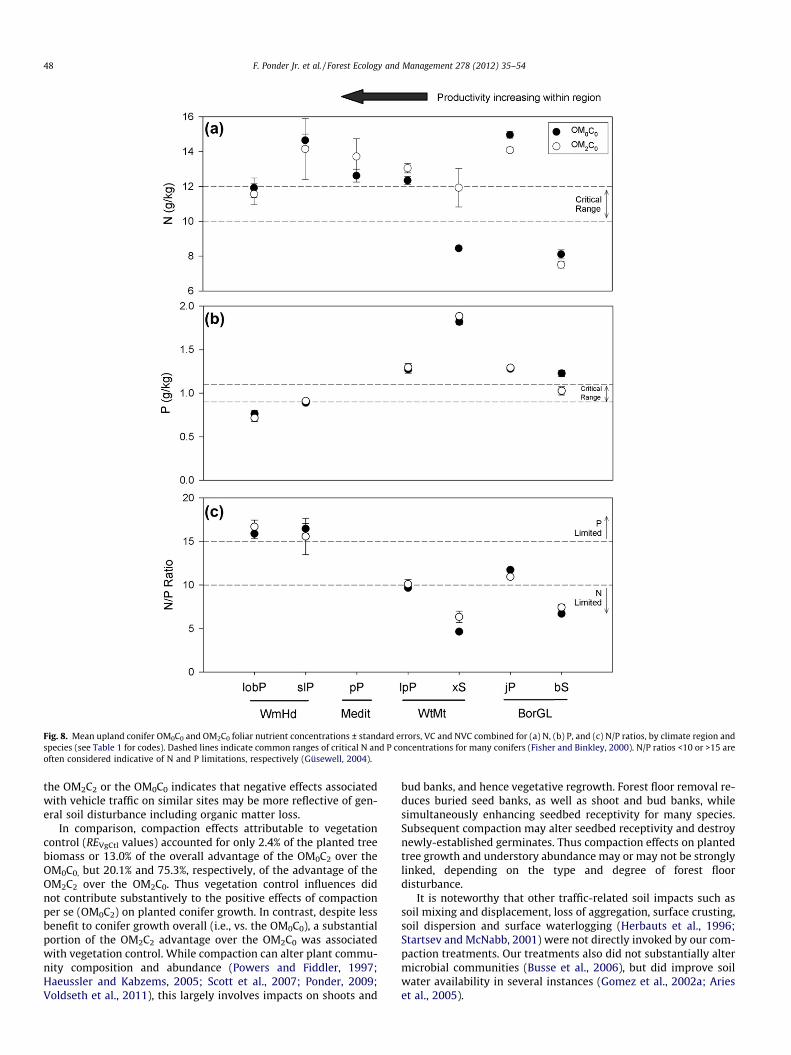
Fig. 8. Mean upland conifer OM0C0 and OM2C0 foliar nutrient concentrations ± standard errors, VC and NVC combined for (a) N, (b) P, and (c) N/P ratios, by climate region andspecies (see Table 1 for codes). Dashed lines indicate common ranges of critical N and P concentrations for many conifers (Fisher and Binkley, 2000). N/P ratios <10 or >15 areoften considered indicative of N and P limitations, respectively (Güsewell, 2004).
48 F. Ponder Jr. et al. / Forest Ecology and Management 278 (2012) 35–54
the OM2C2 or the OM0C0 indicates that negative effects associatedwith vehicle traffic on similar sites may be more reflective of gen-eral soil disturbance including organic matter loss.
In comparison, compaction effects attributable to vegetationcontrol (REVgCtl values) accounted for only 2.4% of the planted treebiomass or 13.0% of the overall advantage of the OM0C2 over theOM0C0, but 20.1% and 75.3%, respectively, of the advantage of theOM2C2 over the OM2C0. Thus vegetation control influences didnot contribute substantively to the positive effects of compactionper se (OM0C2) on planted conifer growth. In contrast, despite lessbenefit to conifer growth overall (i.e., vs. the OM0C0), a substantialportion of the OM2C2 advantage over the OM2C0 was associatedwith vegetation control. While compaction can alter plant commu-nity composition and abundance (Powers and Fiddler, 1997;Haeussler and Kabzems, 2005; Scott et al., 2007; Ponder, 2009;Voldseth et al., 2011), this largely involves impacts on shoots and
bud banks, and hence vegetative regrowth. Forest floor removal re-duces buried seed banks, as well as shoot and bud banks, whilesimultaneously enhancing seedbed receptivity for many species.Subsequent compaction may alter seedbed receptivity and destroynewly-established germinates. Thus compaction effects on plantedtree growth and understory abundance may or may not be stronglylinked, depending on the type and degree of forest floordisturbance.
It is noteworthy that other traffic-related soil impacts such assoil mixing and displacement, loss of aggregation, surface crusting,soil dispersion and surface waterlogging (Herbauts et al., 1996;Startsev and McNabb, 2001) were not directly invoked by our com-paction treatments. Our treatments also did not substantially altermicrobial communities (Busse et al., 2006), but did improve soilwater availability in several instances (Gomez et al., 2002a; Arieset al., 2005).
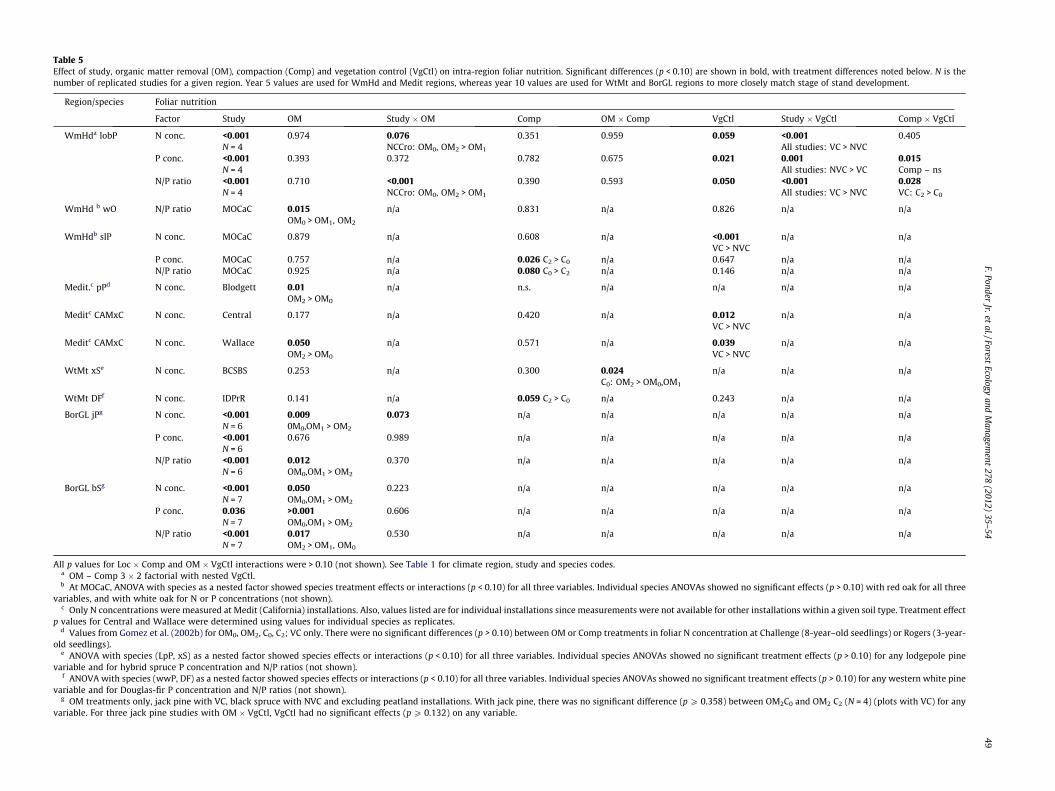
Table 5Effect of study, organic matter removal (OM), compaction (Comp) and vegetation control (VgCtl) on intra-region foliar nutrition. Significant differences (p < 0.10) are shown in bold, with treatment differences noted below. N is thenumber of replicated studies for a given region. Year 5 values are used for WmHd and Medit regions, whereas year 10 values are used for WtMt and BorGL regions to more closely match stage of stand development.
Region/species Foliar nutrition
Factor Study OM Study � OM Comp OM � Comp VgCtl Study � VgCtl Comp � VgCtl
WmHda lobP N conc. <0.001N = 4
0.974 0.076NCCro: OM0, OM2 > OM1
0.351 0.959 0.059 <0.001All studies: VC > NVC
0.405
P conc. <0.001N = 4
0.393 0.372 0.782 0.675 0.021 0.001All studies: NVC > VC
0.015Comp – ns
N/P ratio <0.001N = 4
0.710 <0.001NCCro: OM0, OM2 > OM1
0.390 0.593 0.050 <0.001All studies: VC > NVC
0.028VC: C2 > C0
WmHd b wO N/P ratio MOCaC 0.015OM0 > OM1, OM2
n/a 0.831 n/a 0.826 n/a n/a
WmHdb slP N conc. MOCaC 0.879 n/a 0.608 n/a <0.001VC > NVC
n/a n/a
P conc. MOCaC 0.757 n/a 0.026 C2 > C0 n/a 0.647 n/a n/aN/P ratio MOCaC 0.925 n/a 0.080 C0 > C2 n/a 0.146 n/a n/a
Medit.c pPd N conc. Blodgett 0.01OM2 > OM0
n/a n.s. n/a n/a n/a n/a
Meditc CAMxC N conc. Central 0.177 n/a 0.420 n/a 0.012VC > NVC
n/a n/a
Meditc CAMxC N conc. Wallace 0.050OM2 > OM0
n/a 0.571 n/a 0.039VC > NVC
n/a n/a
WtMt xSe N conc. BCSBS 0.253 n/a 0.300 0.024C0: OM2 > OM0,OM1
n/a n/a n/a
WtMt DFf N conc. IDPrR 0.141 n/a 0.059 C2 > C0 n/a 0.243 n/a n/a
BorGL jPg N conc. <0.001N = 6
0.0090M0,OM1 > OM2
0.073 n/a n/a n/a n/a n/a
P conc. <0.001N = 6
0.676 0.989 n/a n/a n/a n/a n/a
N/P ratio <0.001N = 6
0.012OM0,OM1 > OM2
0.370 n/a n/a n/a n/a n/a
BorGL bSg N conc. <0.001N = 7
0.050OM0,OM1 > OM2
0.223 n/a n/a n/a n/a n/a
P conc. 0.036N = 7
>0.001OM0,OM1 > OM2
0.606 n/a n/a n/a n/a n/a
N/P ratio <0.001N = 7
0.017OM2 > OM1, OM0
0.530 n/a n/a n/a n/a n/a
All p values for Loc � Comp and OM � VgCtl interactions were > 0.10 (not shown). See Table 1 for climate region, study and species codes.a OM – Comp 3 � 2 factorial with nested VgCtl.b At MOCaC, ANOVA with species as a nested factor showed species treatment effects or interactions (p < 0.10) for all three variables. Individual species ANOVAs showed no significant effects (p > 0.10) with red oak for all three
variables, and with white oak for N or P concentrations (not shown).c Only N concentrations were measured at Medit (California) installations. Also, values listed are for individual installations since measurements were not available for other installations within a given soil type. Treatment effect
p values for Central and Wallace were determined using values for individual species as replicates.d Values from Gomez et al. (2002b) for OM0, OM2, C0, C2; VC only. There were no significant differences (p > 0.10) between OM or Comp treatments in foliar N concentration at Challenge (8-year–old seedlings) or Rogers (3-year-
old seedlings).e ANOVA with species (LpP, xS) as a nested factor showed species effects or interactions (p < 0.10) for all three variables. Individual species ANOVAs showed no significant treatment effects (p > 0.10) for any lodgepole pine
variable and for hybrid spruce P concentration and N/P ratios (not shown).f ANOVA with species (wwP, DF) as a nested factor showed species effects or interactions (p < 0.10) for all three variables. Individual species ANOVAs showed no significant treatment effects (p > 0.10) for any western white pine
variable and for Douglas-fir P concentration and N/P ratios (not shown).g OM treatments only, jack pine with VC, black spruce with NVC and excluding peatland installations. With jack pine, there was no significant difference (p P 0.358) between OM2C0 and OM2 C2 (N = 4) (plots with VC) for any
variable. For three jack pine studies with OM � VgCtl, VgCtl had no significant effects (p P 0.132) on any variable.
F.PonderJr.et
al./ForestEcology
andM
anagement
278(2012)
35–54
49
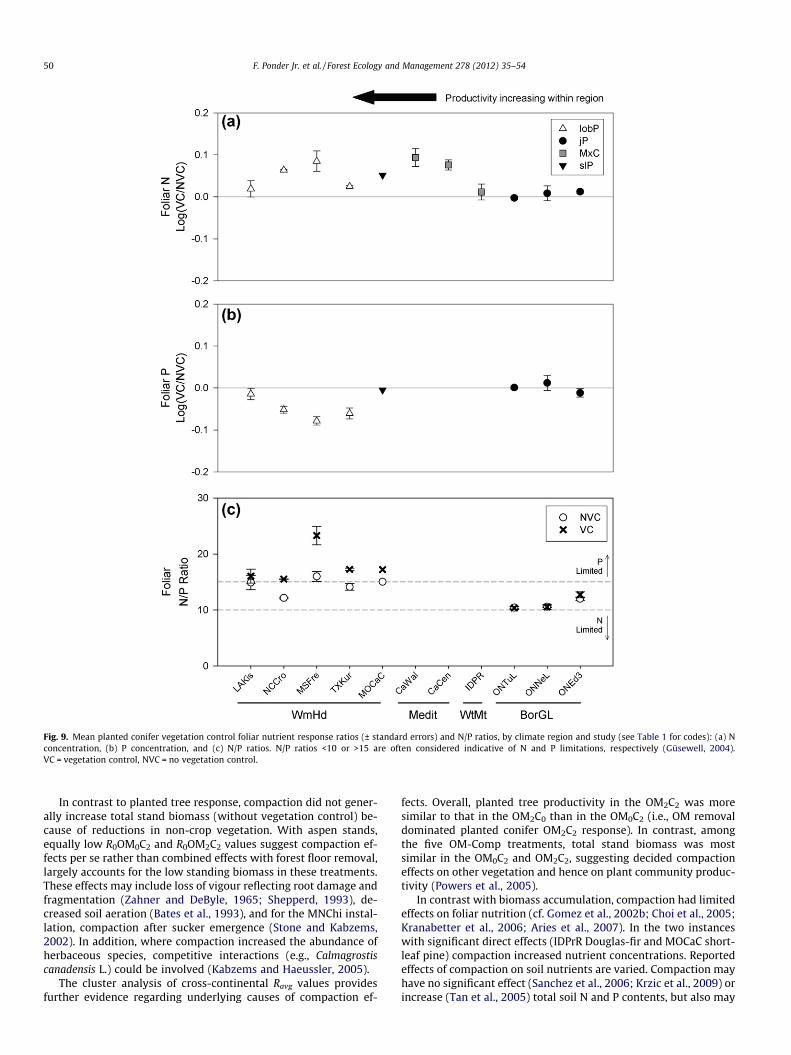
Fig. 9. Mean planted conifer vegetation control foliar nutrient response ratios (± standard errors) and N/P ratios, by climate region and study (see Table 1 for codes): (a) Nconcentration, (b) P concentration, and (c) N/P ratios. N/P ratios <10 or >15 are often considered indicative of N and P limitations, respectively (Güsewell, 2004).VC = vegetation control, NVC = no vegetation control.
50 F. Ponder Jr. et al. / Forest Ecology and Management 278 (2012) 35–54
In contrast to planted tree response, compaction did not gener-ally increase total stand biomass (without vegetation control) be-cause of reductions in non-crop vegetation. With aspen stands,equally low R0OM0C2 and R0OM2C2 values suggest compaction ef-fects per se rather than combined effects with forest floor removal,largely accounts for the low standing biomass in these treatments.These effects may include loss of vigour reflecting root damage andfragmentation (Zahner and DeByle, 1965; Shepperd, 1993), de-creased soil aeration (Bates et al., 1993), and for the MNChi instal-lation, compaction after sucker emergence (Stone and Kabzems,2002). In addition, where compaction increased the abundance ofherbaceous species, competitive interactions (e.g., Calmagrostiscanadensis L.) could be involved (Kabzems and Haeussler, 2005).
The cluster analysis of cross-continental Ravg values providesfurther evidence regarding underlying causes of compaction ef-
fects. Overall, planted tree productivity in the OM2C2 was moresimilar to that in the OM2C0 than in the OM0C2 (i.e., OM removaldominated planted conifer OM2C2 response). In contrast, amongthe five OM-Comp treatments, total stand biomass was mostsimilar in the OM0C2 and OM2C2, suggesting decided compactioneffects on other vegetation and hence on plant community produc-tivity (Powers et al., 2005).
In contrast with biomass accumulation, compaction had limitedeffects on foliar nutrition (cf. Gomez et al., 2002b; Choi et al., 2005;Kranabetter et al., 2006; Aries et al., 2007). In the two instanceswith significant direct effects (IDPrR Douglas-fir and MOCaC short-leaf pine) compaction increased nutrient concentrations. Reportedeffects of compaction on soil nutrients are varied. Compaction mayhave no significant effect (Sanchez et al., 2006; Krzic et al., 2009) orincrease (Tan et al., 2005) total soil N and P contents, but also may
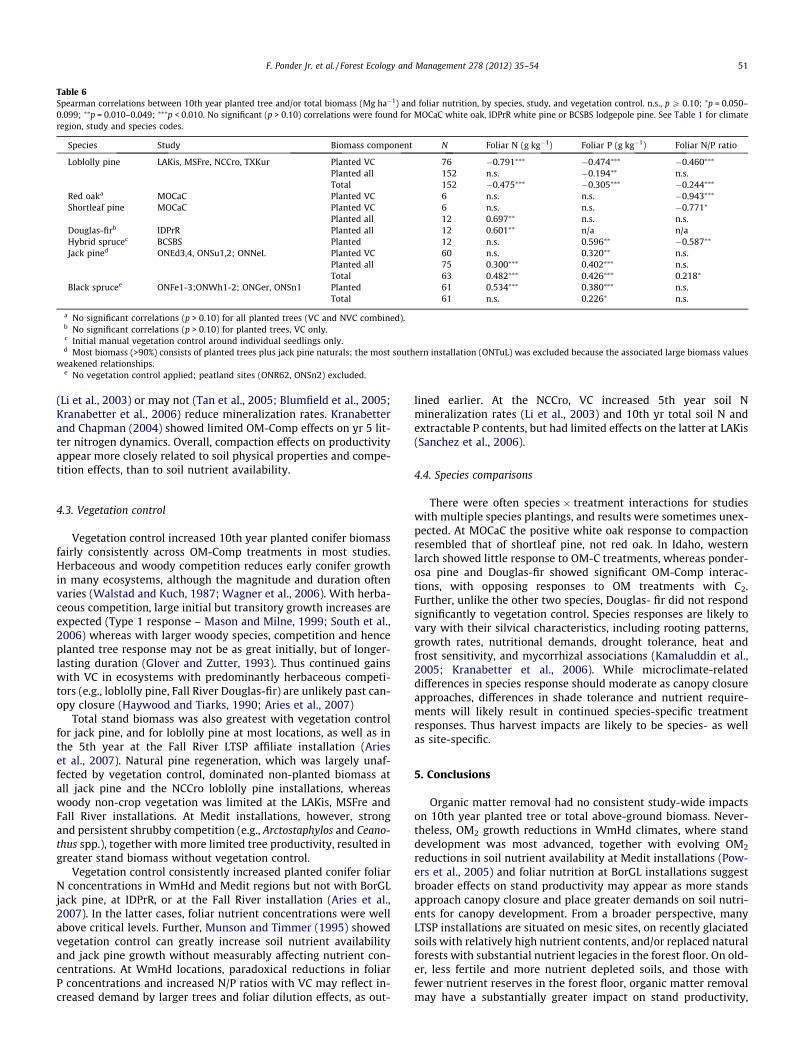
Table 6Spearman correlations between 10th year planted tree and/or total biomass (Mg ha�1) and foliar nutrition, by species, study, and vegetation control. n.s., p P 0.10; ⁄p = 0.050–0.099; ⁄⁄p = 0.010–0.049; ⁄⁄⁄p < 0.010. No significant (p > 0.10) correlations were found for MOCaC white oak, IDPrR white pine or BCSBS lodgepole pine. See Table 1 for climateregion, study and species codes.
Species Study Biomass component N Foliar N (g kg�1) Foliar P (g kg�1) Foliar N/P ratio
Loblolly pine LAKis, MSFre, NCCro, TXKur Planted VC 76 �0.791⁄⁄⁄ �0.474⁄⁄⁄ �0.460⁄⁄⁄
Planted all 152 n.s. �0.194⁄⁄ n.s.Total 152 �0.475⁄⁄⁄ �0.305⁄⁄⁄ �0.244⁄⁄⁄
Red oaka MOCaC Planted VC 6 n.s. n.s. �0.943⁄⁄⁄
Shortleaf pine MOCaC Planted VC 6 n.s. n.s. �0.771⁄
Planted all 12 0.697⁄⁄ n.s. n.s.Douglas-firb IDPrR Planted all 12 0.601⁄⁄ n/a n/aHybrid sprucec BCSBS Planted 12 n.s. 0.596⁄⁄ �0.587⁄⁄
Jack pined ONEd3,4, ONSu1,2; ONNeL Planted VC 60 n.s. 0.320⁄⁄ n.s.Planted all 75 0.300⁄⁄⁄ 0.402⁄⁄⁄ n.s.Total 63 0.482⁄⁄⁄ 0.426⁄⁄⁄ 0.218⁄
Black sprucee ONFe1-3;ONWh1-2; ONGer, ONSn1 Planted 61 0.534⁄⁄⁄ 0.380⁄⁄⁄ n.s.Total 61 n.s. 0.226⁄ n.s.
a No significant correlations (p > 0.10) for all planted trees (VC and NVC combined).b No significant correlations (p > 0.10) for planted trees, VC only.c Initial manual vegetation control around individual seedlings only.d Most biomass (>90%) consists of planted trees plus jack pine naturals; the most southern installation (ONTuL) was excluded because the associated large biomass values
weakened relationships.e No vegetation control applied; peatland sites (ONR62, ONSn2) excluded.
F. Ponder Jr. et al. / Forest Ecology and Management 278 (2012) 35–54 51
(Li et al., 2003) or may not (Tan et al., 2005; Blumfield et al., 2005;Kranabetter et al., 2006) reduce mineralization rates. Kranabetterand Chapman (2004) showed limited OM-Comp effects on yr 5 lit-ter nitrogen dynamics. Overall, compaction effects on productivityappear more closely related to soil physical properties and compe-tition effects, than to soil nutrient availability.
4.3. Vegetation control
Vegetation control increased 10th year planted conifer biomassfairly consistently across OM-Comp treatments in most studies.Herbaceous and woody competition reduces early conifer growthin many ecosystems, although the magnitude and duration oftenvaries (Walstad and Kuch, 1987; Wagner et al., 2006). With herba-ceous competition, large initial but transitory growth increases areexpected (Type 1 response – Mason and Milne, 1999; South et al.,2006) whereas with larger woody species, competition and henceplanted tree response may not be as great initially, but of longer-lasting duration (Glover and Zutter, 1993). Thus continued gainswith VC in ecosystems with predominantly herbaceous competi-tors (e.g., loblolly pine, Fall River Douglas-fir) are unlikely past can-opy closure (Haywood and Tiarks, 1990; Aries et al., 2007)
Total stand biomass was also greatest with vegetation controlfor jack pine, and for loblolly pine at most locations, as well as inthe 5th year at the Fall River LTSP affiliate installation (Arieset al., 2007). Natural pine regeneration, which was largely unaf-fected by vegetation control, dominated non-planted biomass atall jack pine and the NCCro loblolly pine installations, whereaswoody non-crop vegetation was limited at the LAKis, MSFre andFall River installations. At Medit installations, however, strongand persistent shrubby competition (e.g., Arctostaphylos and Ceano-thus spp.), together with more limited tree productivity, resulted ingreater stand biomass without vegetation control.
Vegetation control consistently increased planted conifer foliarN concentrations in WmHd and Medit regions but not with BorGLjack pine, at IDPrR, or at the Fall River installation (Aries et al.,2007). In the latter cases, foliar nutrient concentrations were wellabove critical levels. Further, Munson and Timmer (1995) showedvegetation control can greatly increase soil nutrient availabilityand jack pine growth without measurably affecting nutrient con-centrations. At WmHd locations, paradoxical reductions in foliarP concentrations and increased N/P ratios with VC may reflect in-creased demand by larger trees and foliar dilution effects, as out-
lined earlier. At the NCCro, VC increased 5th year soil Nmineralization rates (Li et al., 2003) and 10th yr total soil N andextractable P contents, but had limited effects on the latter at LAKis(Sanchez et al., 2006).
4.4. Species comparisons
There were often species � treatment interactions for studieswith multiple species plantings, and results were sometimes unex-pected. At MOCaC the positive white oak response to compactionresembled that of shortleaf pine, not red oak. In Idaho, westernlarch showed little response to OM-C treatments, whereas ponder-osa pine and Douglas-fir showed significant OM-Comp interac-tions, with opposing responses to OM treatments with C2.Further, unlike the other two species, Douglas- fir did not respondsignificantly to vegetation control. Species responses are likely tovary with their silvical characteristics, including rooting patterns,growth rates, nutritional demands, drought tolerance, heat andfrost sensitivity, and mycorrhizal associations (Kamaluddin et al.,2005; Kranabetter et al., 2006). While microclimate-relateddifferences in species response should moderate as canopy closureapproaches, differences in shade tolerance and nutrient require-ments will likely result in continued species-specific treatmentresponses. Thus harvest impacts are likely to be species- as wellas site-specific.
5. Conclusions
Organic matter removal had no consistent study-wide impactson 10th year planted tree or total above-ground biomass. Never-theless, OM2 growth reductions in WmHd climates, where standdevelopment was most advanced, together with evolving OM2
reductions in soil nutrient availability at Medit installations (Pow-ers et al., 2005) and foliar nutrition at BorGL installations suggestbroader effects on stand productivity may appear as more standsapproach canopy closure and place greater demands on soil nutri-ents for canopy development. From a broader perspective, manyLTSP installations are situated on mesic sites, on recently glaciatedsoils with relatively high nutrient contents, and/or replaced naturalforests with substantial nutrient legacies in the forest floor. On old-er, less fertile and more nutrient depleted soils, and those withfewer nutrient reserves in the forest floor, organic matter removalmay have a substantially greater impact on stand productivity,
52 F. Ponder Jr. et al. / Forest Ecology and Management 278 (2012) 35–54
particularly over multiple rotations with fast-growing species(Nambiar and Kallio, 2008).
Soil compaction per se generally increased planted tree biomasson these predominantly coarser-textured soils, particularly in theabsence of forest floor removal (i.e., OM0C2). Overall, this positiveOM0C2 response was more strongly associated with ameliorationof the physical environment rather than nutritional effects orreduced vegetative competition. Conversely, smaller benefits ofthe OM2C2 on stand productivity were more closely associatedwith reduced competition.
Vegetation control increased 10th yr planted tree biomass andin many cases, foliar N concentrations, with positive responsesusually occurring consistently across organic matter removal andcompaction treatments. Vegetation control also increased totalstand biomass at installations with abundant conifer ingress (e.g.,BorGL jack pine) which was not affected by control measures (her-bicides), and at installations with primarily herbaceous competi-tion which was being shaded out with canopy development (e.g.,WmHd loblolly pine). At installations with abundant shrubby com-petitors (e.g., Medit sites), however, total stand biomass wasreduced by vegetation control.
To date the suite of LTSP study installations have been of greatvalue in addressing the short-term consequences of harvest-re-lated site and soil disturbances to fundamental site productivityacross broad ecological gradients. However, their greatest valuewill only be realized if measurement schedules can be followedto address treatment impacts on the longer-term productivecapacity of the sites. Undoubtedly impacts will change with standage and development stage, reflecting both evolving environmen-tal constraints, plant community development and recovery fromtreatment.
Acknowledgements
The implementation and continued success of the LTSP programhas relied heavily on the support and dedication of managers,administrators and regional technical specialists in both US andCanadian government offices. These include Marilyn Buford, RandyDavis, and Deb Hayes (USFS, Washington); Brent Roath, Tom Col-lins and Mark Jensen (deceased) (USFS Regional Soil Specialists);James Barott, Joe Gates, Sarah Mase, Dave Shadis, and Robert Wag-ner (USFS, Lake States National Forests); Jeff Karau (CFS, Ottawa)and Bill Meades (CFS, Great Lakes Forestry Centre); and Ed Iawa-chewski (OMNR, Centre for Northern Forest Ecosystem Research)and Frank Kennedy (OMNR, head office).
References
Ågren, G.I., 2008. Stoichiometry and nutrition of plant growth in naturalcommunities. Annu. Rev. Ecol. Evol. Syst. 39, 153–170.
Allen, H.L., 1987. Forest fertilizers. J. For. 85 (2), 37–46.Aries, A., Terry, T.A., Miller, R.E., Anderson, H.W., Flaming, B.L., 2005. Ground-based
forest harvesting effects on soil physical properties and Douglas-fir growth. SoilSci. Soc. Am. J. 69, 1822–1832.
Aries, A., Terry, T.A., Harrington, C., Devine, W., Peter, D., Bailey, J., 2007. Biomassremoval, soil compaction, and vegetation control effects on five-year growth ofDouglas-fir in coastal Washington. For. Sci. 53, 600–610.
Arvidsson, J., 1999. Nutrient uptake and growth of barley as affected by soilcompaction. Plant Soil 208, 9–19.
Bates, P.C., Blinn, C.R., Alm, A.A., 1993. Harvesting impacts on quaking aspenregeneration in northern Minnesota. Can. J. For. Res. 23, 2403–2412.
Bella, I.E., 1986. Logging practices and subsequent development of aspen stands ineast-central Saskatchewan. For. Chron. 62, 81–83.
Blumfield, T.J., Xu, Z.H., Chen, C., 2005. Mineral nitrogen dynamics following soilcompaction and cultivation during hoop pine plantation establishment. For.Ecol. Manage. 204, 129–135.
Brais, S., 2001. Persistence of soil compaction and effects on seedling growth innorthwestern Quebec. Soil Sci. Soc. Am. J. 65, 1263–1271.
Briggs, R.D., Hornbeck, J.W., Smith, C.T., Lemin Jr., R.C., McCormack Jr., M.L., 2000.Long-term effects of forest management on nutrient cycling in spruce-firforests. For. Ecol. Manage. 138, 285–299.
Busse, M.D., Beattie, S.E., Powers, R.F., Sanchez, F.G., Tiarks, A.E., 2006. Microbialcommunity responses in forest mineral soil to compaction, organic matterremoval, and vegetation control. Can. J. For. Res. 36, 577–588.
Choi, W.-J., Chang, S.X., Curran, M.P., Ro, H.-M., Kamaluddin, M., Zwiazek, J.J., 2005.Foliar d13 C and d15 N response of lodgepole pine and Douglas-fir seedlings tosoil compaction and forest floor removal. For. Sci. 51, 546–555.
Corns, I.G.W., 1988. Compaction by forestry equipment and effects on coniferousseedling growth on four forest soils in the Alberta foothills. Can. J. For. Res. 18,75–84.
Daddow, R.L., Warrington, G.E., 1983. Growth-limiting soil bulk densities asinfluenced by soil texture. Watershed Sys. Dev. Group Rep. WSDG-TN-00005.
Deleporte, P., Laclau, J.P., Nzila, J.D., Kazotti, J.G., Marien, J.N., Bouillet, J.P., Szwarc,M., D’Annunzio, R., Ranger, J. 2008. Effects of slash and litter managementpractices on soil chemical properties and growth of second rotation Eucalypts inthe Congo. In: Nambiar, E.K.S. (Ed.), Site Management and Productivity inTropical Plantation Forests: Workshop Proceedings, 22–26 November 2004,Piracicaba, Brazil and 6–9 November, Bogor, Indonesia. Center for InternationalForestry Research, Bogor, Indonesia, pp. 5–22.
Duckert, D.R., Morris, D.M. 2001. Effects of harvest intensity on long-term siteproductivity in black spruce ecosystems: establishment report. Ont. Min. Nat.Resourc., Centre for Northern Forest Ecosystem Research, Thunder Bay, ON.CNFER TR-008. pp. 24. +append.
Du Toit, B., Dovey, S.B., Smith, C.W. 2008. Effects of slash and site managementtreatments on soil properties, nutrition and growth of a Eucalyptus grandisplantation in South Africa. In: Nambiar, E.K.S. (Ed.), Site Management andProductivity in Tropical Plantation Forests: Workshop Proceedings, 22–26November 2004, Piracicaba, Brazil and 6–9 November, Bogor, Indonesia. Centerfor International Forestry Research, Bogor, Indonesia, pp. 63–77.
Eisenbies, M.H., Burger, J.A., Aust, W.M., Patterson, S.C., 2007. Changes in siteproductivity and the recovery of soil properties following wet- and dry-weatherharvesting disturbances in the Atlantic Coastal Plain for a stand of age 10 years.Can. J. For. Res. 37, 1336–1348.
Egnell, G., Valinger, E., 2003. Survival, growth and growth allocation of planted Scotspine trees after different levels of biomass removal in clear-felling. For. Ecol.Manage. 177, 65–74.
Fisher, R.F., Binkley, D., 2000. Ecology and Management of Forest Soils, third ed.John Wiley & Sons, New York, pp. 489.
Fleming, R.L., Powers, R., Foster, N., Kranabetter, J.M., Scott, D.A., Ponder Jr., F., Berch,S., Chapman, W., Kabzems, R., Ludovici, K., Morris, D., Page-Dumroese, D.,Sanborn, P., Sanchez, F., Stone, D., Tiarks, A., 2006. Effects of organic matterremoval, soil compaction, and vegetation control on 5-year seedlingperformance: a regional comparison of Long-Term Soil Productivity sites. Can.J. For. Res. 36, 529–550.
Fraser, E.C., Landhäusser, S.M., Lieffers, V.J., 2006. Does mechanical site preparationaffect trembling aspen density and growth 9-12 years after treatment. New For.32, 299–306.
Frey, B.R., Lieffers, V.J., Landhäusser, S.M., Comeau, P.G., Greenway, K.J., 2003. Ananalysis of sucker regeneration of trembling aspen. Can. J. For. Res. 33, 1169–1179.
Froehlich, H.A., McNabb, D.H., 1984. Minimizing soil compaction in PacificNorthwest forests. In: Stone, E.L. (Ed.), Forest Soils and Treatment Impacts. In:Proc. Sixth North American Forest Soils Conference. University of Tennessee,Knoxville, pp. 159–192.
Froehlich, H.A., Miles, D.W.R., Robbins, R.W., 1986. Growth of young Pinus ponderosaand Pinus contorta on compacted soil in central Washington. For. Ecol. Manage.15, 285–291.
Glover, G.R., Zutter, B.R., 1993. Loblolly pine and mixed hardwood stand dynamicsfor 27 years following chemical, mechanical and manual site preparation. Can. J.For. Res. 23, 2126–2132.
Godefroid, S., Koedam, N., 2004. Interspecific variation in soil compaction sensitivityamong forest floor species. Biol. Cons. 119, 207–217.
Gomez, A., Powers, R.F., Singer, M.J., Horwath, W.R., 2002a. Soil compaction effectson growth of young ponderosa pine following litter removal in California’sSierra Nevada. Soil Sci. Soc. Am. J. 66, 1334–1344.
Gomez, A., Powers, R.F., Singer, M.J., Horwath, W.R., 2002b. N uptake and N status inponderosa pine as affected by soil compaction and forest floor removal. PlantSoil 242, 263–275.
Gonçalves, J.L., Wichert, M.C., Gava, J. L., Serrano, M.I. 2008. Soil fertility and growthof Eucalyptus grandis in Brazil under different residue management practices.In: Nambiar, E.K.S. (Ed.), Site Management and Productivity in TropicalPlantation Forests: Workshop Proceedings, 22–26 November 2004, Piracicaba,Brazil and 6–9 November, Bogor, Indonesia. Center for International ForestryResearch, Bogor, Indonesia, pp. 51–62.
Gordon, A.G., 1983. Nutrient cycling dynamics in differing spruce and mixedwoodecosystems in Ontario and the effects of nutrient removals through harvesting.In: Wien, R.W., MacLean, D.A. (Eds.), Resources and Dynamics of the BorealZone. Assoc. Can. Univ. North. Stud, Ottawa, pp. 97–118.
Greacen, E.L., Sands, R., 1980. Compaction of forest soils. A review. Aust. J. Soil Res.18, 163–189.
Greenwood, J.J., 1994. Statistical analysis of experiments conducted at multiplesites. Oikos 69, 334.
Gurevitch, J., Curtis, P.S., Jones, M.H., 2001. Meta-analysis in ecology. Adv. Ecol. Res.32, 199–247.
Güsewell, S., 2004. N: P ratios in terrestrial plants: variation and functionalsignificance. New Phytol. 164, 243–266.
F. Ponder Jr. et al. / Forest Ecology and Management 278 (2012) 35–54 53
Haeussler, S., Kabzems, R., 2005. Aspen plant community response to organicmatter removal and soil compaction. Can. J. For. Res. 2005, 2030–2044.
Haywood, J.D., Tiarks, A.E., 1990. Eleventh-year results of fertilization, herbaceous,and woody plant control in a loblolly pine plantation. South. J. Appl. For. 14,173–177.
Hedges, L.V., Gurevitch, J., Curtis, P.S., 1999. The meta-analysis of response ratios inexperimental ecology. Ecology 80, 1150–1156.
Herbauts, J., El Bayad, J., Gruber, W., 1996. Influence of logging traffic on thehydromorphic degradation of acid forest soils developed on loessic loam inmiddle Belgium. For. Ecol. Manage. 87, 193–207.
Hintze, J.L., 2007. NCSS 2007. Number Cruncher Statistical Systems, Kaysville, Utah.Jenkins, J.C., Chojnacky, D.C., Heath, L.S., Birdsey, R.A., 2004. Comprehensive
database of diameter-based biomass regressions for North American treespecies. USDA For. Serv. Northeastern Research Sta. Gen. Tech. Rep. NE-319. pp.45. + CD-ROM.
Johnson, D.W., Todd Jr., D.E., 1998. Harvest effects on long-term changes in nutrientpools of mixed oak forest. Soil Sci. Soc. Am. J. 62, 1725–1735.
Kabzems, R., Haeussler, S., 2005. Soil properties, aspen, and white spruce responsesfive years after organic matter removal and compaction treatments. Can. J. For.Res. 35, 2045–2055.
Kamaluddin, M., Chang, S.X., Curran, M.P., Zwiazek, J.J., 2005. Soil compaction andforest floor removal affect early growth and physiology of lodgepole pine andDouglas-fir in British Columbia. For. Sci. 51, 513–521.
Kelting, D.L., Burger, J.A., Patterson, S.C., 2000. Early loblolly pine growth responseto changes in the soil environment. N. Z. J. For. Sci. 30, 206–224.
Kozlowski, T.T., 1999. Soil compaction and growth of woody plants. Scand. J. For.Res. 14, 596–619.
Kranabetter, J.M., Chapman, B.K., 2004. An analysis of litter nitrogen dynamics usingartificial soils across a gradient of forest soil disturbances. Can. J. Soil Sci. 84,159–167.
Kranabetter, J.M., Sanborn, P., Chapman, B.K., Dube, S., 2006. The contrastingresponse to soil disturbance between lodgepole pine and hybrid white spruce insubboreal forests. Soil Sci. Soc. Am. J. 70, 1591–1599.
Krzic, M., Zabek, L., Bulmer, C.E., Chapman, B.K., Trethewey, C., 2009. Soil propertiesand lodgepole pine growth on forest landings rehabilitated by tillage andfertilizer application. Can. J. Soil Sci. 89, 25–34.
Li, Q., Allen, H.L., Wilson, C.A., 2003. Nitrogen mineralization dynamicsfollowing the establishment of a loblolly pine plantation. Can. J. For. Res.33, 364–374.
Linder, S., 1995. Foliar analysis for detecting and correcting nutrient imbalances inNorway spruce. Ecol. Bull. 44, 178–190.
Maini, J.S., Horton, K.W., 1966. Vegetative propagation of Populus spp. I. Theinfluence of temperature on formation and initial growth of aspen suckers. Can.J. Bot. 44, 1183–1189.
Malkonen, E., 1976. Effect of whole-tree harvesting on soil fertility. Silva Fennica 10,157–164.
Markham, J.H., Chanway, C.P., 1996. Measuring plant neighbour effects. Funct. Ecol.10, 548–549.
Mason, E.G., Milne, P.G., 1999. Effects of weed control, fertilization, and soilcultivation on the growth of Pinus radiata at midrotation in Canterbury, NewZealand. Can. J. For. Res. 29, 985–992.
Mason, W.L., McKay, H.M., Weatherall, A., Connolly, T., Harrison, A.J., 2012. Theeffects of whole-tree harvesting on three sites in upland Britain on the growthof Sitka spruce over ten years. Forestry 85, 111–123.
McKenney, D.W., Pedlar, J.H., Papadopol, P., Hutchinson, M.F., 2006. Thedevelopment of 1901–2000 historical monthly climate models for Canada andthe United States. Agric. For. Meteorol. 138, 69–81.
Mendham, D.S., O’Connell, A.M., Grove, T.S., Rance, S.J., 2003. Residue managementeffects on soil carbon and nutrient contents and growth of second rotationeucalypts. For. Ecol. Manage. 181, 357–372.
Mendham, D.S., Grove, T.S., O’Connell, A.M., Rance, S.J., 2008. Impacts of inter-rotation site management on soil nutrients and plantation productivity inEucalyptus globulus plantations in south-western Australia. In: Nambiar, E.K.S.(Ed.), Site Management and Productivity in Tropical Plantation Forests:Workshop Proceedings, 22–26 November 2004, Piracicaba, Brazil and 6–9November, Bogor, Indonesia. Center for International Forestry Research, Bogor,Indonesia, pp. 79–92.
Miller, H.G., 1995. The influence of stand development on nutrient demand, growthand allocation. Plant Soil, 225–232.
Miller, J.H., Boyd, R.S., Edwards, M.B., 1999. Floristic diversity, stand structure, andcomposition 11 years after herbicide site preparation. Can. J. For. Res. 29, 1073–1083.
Miller, J.H., Zutter, B.R., Newbold, R.A., Edwards, M.B., Zedaker, S.M., 2003a. Standdynamics and plant associates of loblolly pine plantations to midrotation afterearly intensive vegetation management – a southeastern United States regionalstudy. South. J. Appl. For. 27, 221–236.
Miller, J.H., Zutter, B.R., Zedaker, S.M., Edwards, M.B., Newbold, R.A., 2003b. Growthand yield relative to competition for loblolly pine plantations to midrotation – asoutheastern United States regional study. South. J. Appl. For. 27, 237–252.
Miller, R.E., Scott, W., Hazard, J.W., 1996. Soil compaction and conifer growth aftertractor yarding at three coastal Washington locations. Can. J. For. Res. 26, 225–236.
Morris, L.A., Miller, R.E., 1994. Evidence for long-term productivity change asprovided by field trials. In: Dyck, W.J., Cole, D.W., Comerford, N.B. (Eds.),Impacts of Forest Harvesting on Long-term Site Productivity. Chapman & Hall,London, pp. 41–80.
Munson, A.D., Timmer, V.R., 1995. Soil nitrogen dynamics and nutrition of pinefollowing silvicultural treatments in boreal and Great Lakes – St. Lawrenceplantations. For. Ecol. Manage. 76, 169–179.
Nambiar, E.K.S., Kallio, M.H. 2008. Increasing and sustaining productivity insubtropical and tropical plantation forests: Making a difference throughresearch partnership. In: Nambiar, E.K.S. (Ed.), Site Management andProductivity in Tropical Plantation Forests: Workshop Proceedings, 22–26November 2004, Piracicaba, Brazil and 6–9 November, Bogor, Indonesia. Centerfor International Forestry Research, Bogor, Indonesia, pp. 205–227.
Oliver, C.D., Larson, B.C., 1996. Forest Stand Dynamics. Updated edition. John Wileyand Sons, Inc., New York.
Olsson, B.A., Lundkvist, H., Staaf, H., 2000. Nutrient status in needles of Norwayspruce and Scots pine following harvesting of logging residues. Plant Soil 223,161–173.
Ouahmane, L., Revel, J.C., Hafidi, M., Thioulouse, J., Prin, Y., Galiana, A., Drefus, B.,Duponnois, R., 2009. Responses of Pinus halepensis growth, soil microbialcatabolic functions and phosphate-solubilizing bacteria after rock phosphateamendment and ectomycorrhizal inoculation. Plant Soil 320, 169–179.
Page-Dumroese, D., Jurgensen, M., Tiarks, A., Ponder Jr., F., Sanchez, F., Fleming, R.,Kranabetter, M., Powers, R., Stone, M., Elioff, J., Scott, A., 2006. Soil physicalproperty changes at the North-American Long-term Soil Productivity (LTSP)study sites: 1 and 5 years after compaction. Can. J. For. Res. 36, 550–563.
Paul, L.R., Chapman, B.K., Chanway, C.P., 2007. Nitrogen fixation associated withSuillus tomentosus tuberculate ectomycorrhizae on Pinus contorta var. latifolia.Ann. Bot. 99, 1101–1109.
Pereira, A.R., De Camargo, A.P., 1989. An analysis of the criticism of Thornthwaite’sequation for estimating potential evapotranspiration. Agric. For. Meteorol. 46,149–157.
Ponder Jr., F., 2009. Nine-year response of hardwood understory to organic matterremoval and soil compaction. North. J. Appl. For. 25 (1), 25–31.
Powers, R.F., 1999. On the sustainable productivity of planted forests. New Forests17, 263–306.
Powers, R.F., 2006. Long-term soil productivity: genesis of the concept andprinciples behind the program. Can. J. For. Res. 36, 519–528.
Powers, R.F., Fiddler, G.O., 1997. The North American long-term soil productivitystudy: progress through the first five years. In: Proceedings, Eighteenth AnnualForest Vegetation Management Conference, January 14–16, 1997, Sacramento,CA. Published by the Forest Vegetation Management Conference, Redding, CA,pp. 88–102.
Powers, R.F., Van Cleve, K., 1991. Long-term ecological research in temperate andboreal forest ecosystems. Agron. J. 83, 11–24.
Powers, R.F., Alban, D.H., Miller, R.E., Tiarks A.E., Wells, C.G., Avers, P.E., Cline, R.G.,Fitzgerald, R.O., Loftus Jr., N.S., 1990. Sustaining site productivity in NorthAmerican forests: Problems and prospects. In: Gessel, S.P., Lacate, D.S.,Weetman, G.F., Powers, R.F., (Eds.), Sustained Productivity of Forest Soils.Proc. 7th North American Forest Soils Conf. Faculty of Forestry, University ofBritish Columbia, pp. 49–79.
Powers, R.F., Scott, D.A., Sanchez, F.G., Voldseth, R.A., Page-Dumroese, D., Elioff, J.D.,Stone, D.M., 2005. The North American long-term soil productivity experiment:findings from the first decade of research. For. Ecol. Manage. 220, 31–50.
Pritchett, W.L., 1979. Properties and Management of Forest Soils. John Wiley & Sons,New York, pp. 500.
Proe, M.F., Dutch, J., 1994. Impact of whole-tree harvesting on second-rotationgrowth of Sitka spruce: the first ten years. For. Ecol. Manage. 66, 39–54.
Proe, M.F., Cameron, A.D., Dutch, J., Christodoulou, X.C., 1996. The effect of whole-tree harvesting on the growth of second rotation Sitka spruce. Forestry 69, 389–401.
Proe, M.F., Griffiths, J.H., McKay, H.M., 2001. Effect of whole-tree harvesting onmicroclimate during establishment of second rotation forestry. Agric. For.Meteorol. 110, 141–154.
Rose, R., Rosner, L.S., Ketchum, J.S., 2006. Twelfth-year response of Douglas-fir toarea of weed control and herbaceous versus woody weed control treatments.Can. J. For. Res. 36, 2464–2473.
Rosenberg, M.S., Adams, D.C., Gurevitch, J., 2000. MetaWin Version 2.14. StatisticalSoftware for Meta-analysis. Sinauer Associates, Inc., Sunderland, MA.
Saint-André, L., Laclau, J.-P., Deleporte, P., Gava, J.L., Gonçalves, J.L., Mendham, D.,Nzila, J.D., Smith, C., duToit, B., Xu, D.P., Sankaren, K.V., Marien, J.N., Nouvellon,Y., Bouillet, J.-P., Ranger, J. 2008. In: Nambiar, E.K.S. (Ed.), Site Management andProductivity in Tropical Plantation Forests: Workshop Proceedings, 22–26November 2004, Piracicaba, Brazil and 6–9 November, Bogor, Indonesia. Centerfor International Forestry Research, Bogor, Indonesia, pp. 173–189.
Sanchez, F.G., Tiarks, A.E., Kranabetter, J.M., Page-Dumroese, D.S., Powers, R.F.,Sanborn, P.T., Chapman, W.K., 2006. Effects of organic matter removal and soilcompaction on fifth year mineral soil carbon and nitrogen contents for sitesacross the United States and Canada. Can. J. For. Res. 36, 564–575.
Scott, D.A., Dean, T.J., 2006. Energy trade-offs between intensive biomass utilization,site productivity loss, and ameliorative treatments in loblolly pine plantations.Biomass Bioenergy 30, 1001–1010.
Scott, D.A., Novosad, J., Goldsmith, G., 2007. Ten-year results from the NorthAmerican Long-Term Soil Productivity Study in the Western Gulf Coastal Plain.In: Furniss, M.J., Clifton, C.F., Ronnenberg, K.L. (Eds.), Advancing theFundamental Sciences. USDA For. Serv. PNW-GTR 689.
Shepperd, W.D., 1993. The effect of harvesting activities on soil compaction, rootdamage, and suckering in Colorado aspen. West. J. Appl. For. 8, 62–66.
Shepperd, W.D., 1996. Response of aspen root suckers to regeneration methods andpost-harvest protection. USDA For. Serv. Res. Paper RM-RP-324. pp. 8.
54 F. Ponder Jr. et al. / Forest Ecology and Management 278 (2012) 35–54
Sikora, E., Gupta, S.C., Kossowski, J., 1990. Soil temperature predictions from anumerical heat-flow model using variable and constant thermal diffusivities.Soil Till. Res. 18, 27–36.
Smethhurst, P.J., Nambiar, E.K.S., 1990. Effects of slash and litter management onfluxes of nitrogen and tree growth in a young Pinus radiata plantation. Can. J.For. Res. 20, 1498–1507.
Smith, T.E., Osborne, D.O., Simpson, J.A., 2008. Inter-rotation management impactson growth and soil properties in hybrid pine plantations on sandy soils insubtropical Australia. In: Nambiar, E.K.S. (Ed.), Site management andproductivity in tropical plantation forests: Workshop Proceedings, 22–26November 2004, Piracicaba, Brazil and 6–9 November, Bogor, Indonesia.Center for International Forestry Research, Bogor, Indonesia, pp. 139–147.
South, D.B., Miller, J.H., Kimberley, M.O., Vanderschaaf, C.L., 2006. Determiningproductivity gains from herbaceous vegetation management with ‘age-shift’calculations. Forestry 79, 43–56.
Startsev, A.D., McNabb, D.H., 2001. Skidder traffic effects on water retention, poresize distribution, and van Genuchten parameters of boreal forest soils. Soil Sci.Soc. Am. J. 65, 224–231.
Stone, D.M., 2001. Sustaining aspen productivity in the Lake States. In: Shepperd,W.D., Binkley, D., Bartos, D.L., Stohlgren, T.J., Eskew, L.G. (Compilers.), SustainingAspen in Western Landscapes: Symposium Proceedings. USDA For. Proc. RMRS-P-18, pp. 47–59.
Stone, D.M., Kabzems, R., 2002. Aspen development on similar soils in Minnesotaand British Columbia after compaction and forest floor removal. For. Chron. 78,886–891.
Sutherland, B.J., Foreman, F.F., 1995. Guide to the Use of Mechanical Site PreparationEquipment in Northwestern Ontario. Can. For. Serv., Great Lakes ForestryCentre, Sault Ste. Marie, Ontario. 186 p.
Switzer, G.L., Nelson, L.E., 1972. Nutrient accumulation and cycling in loblolly pine(Pinus taeda L) plantation ecosystems. The first twenty years. Soil Sci. Soc. Am. J.60, 1654–1663.
Tamm, C.O., 1991. Nitrogen in terrestrial ecosystems – questions of productivity,vegetation changes, and ecosystem stability. Ecological Studies 81, 115 p,Springer Verlag.
Tan, X., Chang, S.X., Kabzems, R., 2005. Effects of soil compaction and forest floorremoval on soil microbial properties and N transformations in a boreal forestlong-term productivity study. For. Ecol. Manage. 217, 158–170.
Tenhagen, M.D., Jeglum, J.K., Ran, S., Foster, N.W., 1996. Effects of a range of biomassremovals on long-term productivity of jack pine ecosystems: Establishmentreport. Can. For. Serv., Sault Ste. Marie, Ont. Inf. Rep. O-X-454. pp. 13 + append.
Ter-Mikaelian, M.T., Korzukhin, M.D., 1997. Biomass equations for sixty-five NorthAmerican tree species. For. Ecol. Manage. 97, 1–24.
Thornthwaite, C.W., 1948. An approach to a rational classification of climate.Geographical Rev 38, 55–94.
Ung, C.-H., Bernier, P.Y., Rauler, F., Fornier, R.A., Lambert, M.-C., Régnière, J., 2001.Biophysical site indices for shade tolerant and intolerant boreal species. For. Sci.47, 83–95.
Vitousek, P.M., Andariese, S.W., Matson, P.A., Morris, L.A., Sanford, R.L., 1992. Effectsof harvest intensity, site preparation, and herbicide use on soil nitrogentransformations in a young loblolly pine plantation. For. Ecol. Manage. 49, 277–292.
Vitousek, P.M., Walker, L.R., Whiteaker, L.D., Matson, P.A., 1993. Nutrient limitationsto plant growth during primary succession in Hawaii Volcanoes national park.Biogeochemistry 23, 197–215.
Voldseth, R., Palik, B., Elioff, J., 2011. Ten-year results from the Long-term SoilProductivity Study in aspen ecosystems of the northern Great Lakes region.USDA For. Serv. Northern Research Station, Res. Paper. NRS-17, pp. 20.
Wagner, R.G., Little, K.M., Richardson, B., McNabb, K., 2006. The role of vegetationmanagement for enhancing productivity of the world’s forests. Forestry 79, 57–79.
Walstad, J.D., Kuch, P.J. (Eds.), 1987. Vegetation Management for Conifer Production.John Wiley, New York.
Walmsley, J.D., Jones, D.L., Reynolds, B., Price, M.H., Healey, J.R., 2009. Whole treeharvesting can reduce second rotation forest productivity. For. Ecol. Manage.257, 1104–1111.
Weetman, G.F., Algar, D., 1983. Low-site class black spruce and jack pine nutrientremovals after full-tree and tree-length logging. Can. J. For. Res. 13, 1030–1036.
Zahner, R., DeByle, N.V., 1965. Effect of pruning the parent root on growth of aspensuckers. Ecology 46, 373–375.
Zutter, B.R., Miller, J.H., Allen, H.L., Zedaker, S.M., Edwards, M.B., Newbold, R.A.,1999. Fascicle nutrient and biomass response of young loblolly pine to controlof woody and herbaceous vegetation. Can. J. For. Res. 29, 917–925.