Embed Size (px)
Citation preview
11
The Economic Impact of Gloucestershire’s Visitor Economy 2016
Forest of Dean district
Produced on behalf of the Wye Valley and Forest of Dean Tourism AssociationByThe South West Research Company Ltd
January 2018
22
Contents
Page
Introduction 3
Forest of Dean district data 4
Gloucestershire county data 18
33
Introduction
This report examines the volume and value of tourism and the impact of visitor expenditure on the local economy in Forest of Dean district and Gloucestershire county in 2016. Comparisons are also provided to other Gloucestershire districts.
The figures were derived using the Cambridge Economic Impact Model undertaken by The South West Research Company (TSWRC). The model utilises information from national tourism surveys and regionally/locally based data. It distributes regional activity as measured in those surveys to local areas using ‘drivers’ such as the accommodation stock and occupancy which influence the distribution of tourism activity at local level.
For further information on the Cambridge Model and the terms used in this report please see Appendix 1 which accompanies this report.
For an overview of 2016, including key facts about the economy, weather and key events please see Appendix 2 of this report.
44
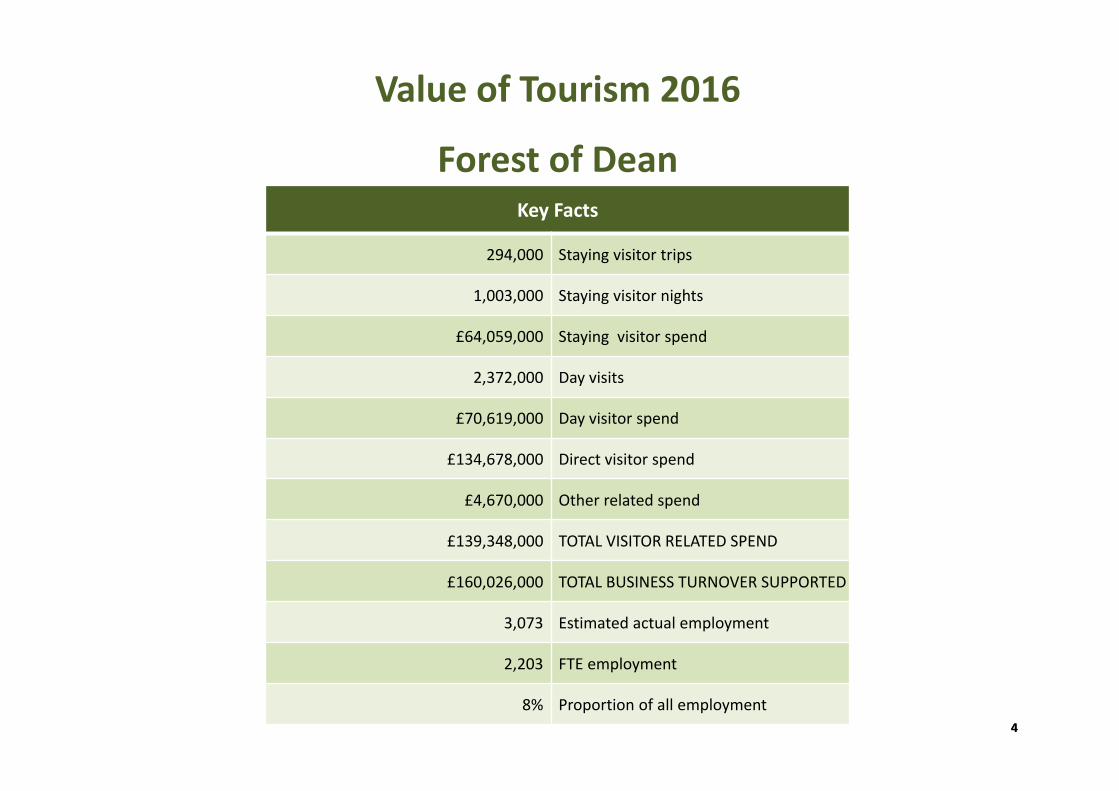
Value of Tourism 2016
Forest of DeanKey Facts
294,000 Staying visitor trips
1,003,000 Staying visitor nights
£64,059,000 Staying visitor spend
2,372,000 Day visits
£70,619,000 Day visitor spend
£134,678,000 Direct visitor spend
£4,670,000 Other related spend
£139,348,000 TOTAL VISITOR RELATED SPEND
£160,026,000 TOTAL BUSINESS TURNOVER SUPPORTED
3,073 Estimated actual employment
2,203 FTE employment
8% Proportion of all employment
55
Forest of Dean – Staying visits
6
Information on staying visits is derived from the Great Britain Tourism Survey (GBTS) for domestic visitors and from the International Passenger Survey (IPS) for Overseas visitors. The methodology of both surveys has been stable since 2006 allowing for direct comparison between years and the analysis of trend data. Data at a county level is derived from the national surveys for trips, nights and spend but adjusted to account for local data and modelled below this level.
66
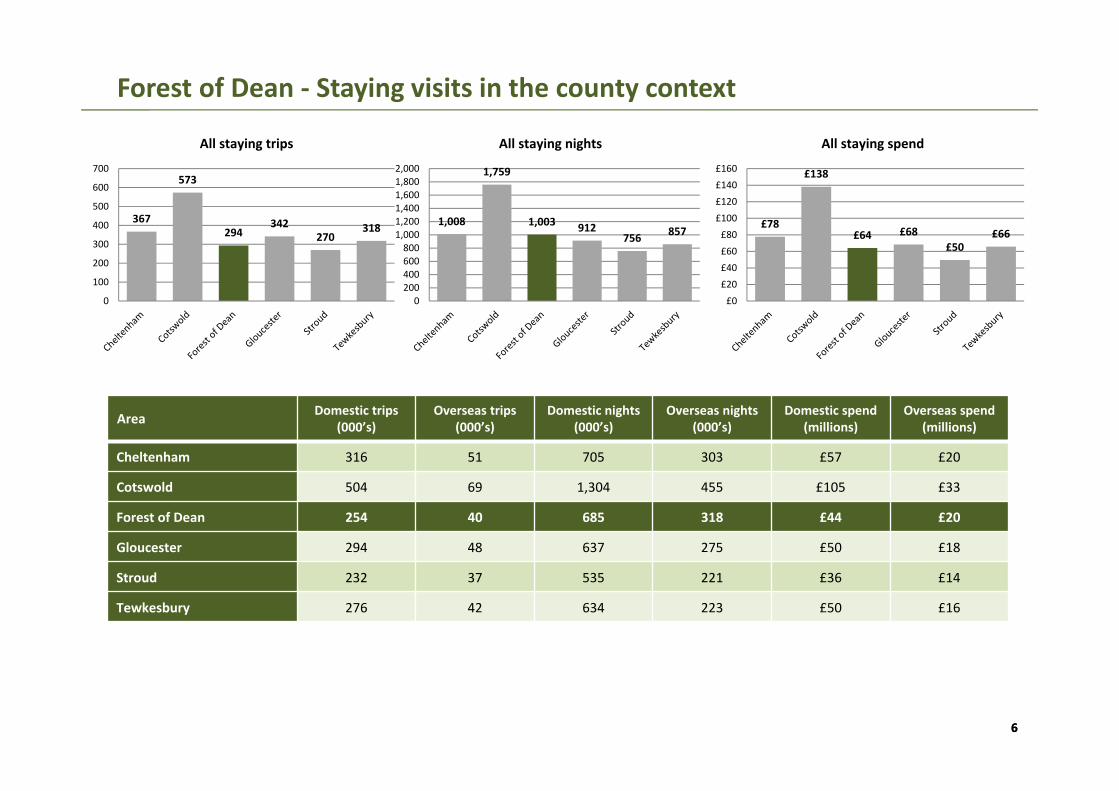
Forest of Dean ‐ Staying visits in the county context
Area Domestic trips (000’s)
Overseas trips (000’s)
Domestic nights(000’s)
Overseas nights(000’s)
Domestic spend(millions)
Overseas spend(millions)
Cheltenham 316 51 705 303 £57 £20
Cotswold 504 69 1,304 455 £105 £33
Forest of Dean 254 40 685 318 £44 £20
Gloucester 294 48 637 275 £50 £18
Stroud 232 37 535 221 £36 £14
Tewkesbury 276 42 634 223 £50 £16
367
573
294342
270318
0
100
200
300
400
500
600
700
All staying trips
1,008
1,759
1,003 912756 857
0200400600800
1,0001,2001,4001,6001,8002,000
All staying nights
£78
£138
£64 £68£50
£66
£0
£20£40£60
£80£100
£120£140£160
All staying spend
77
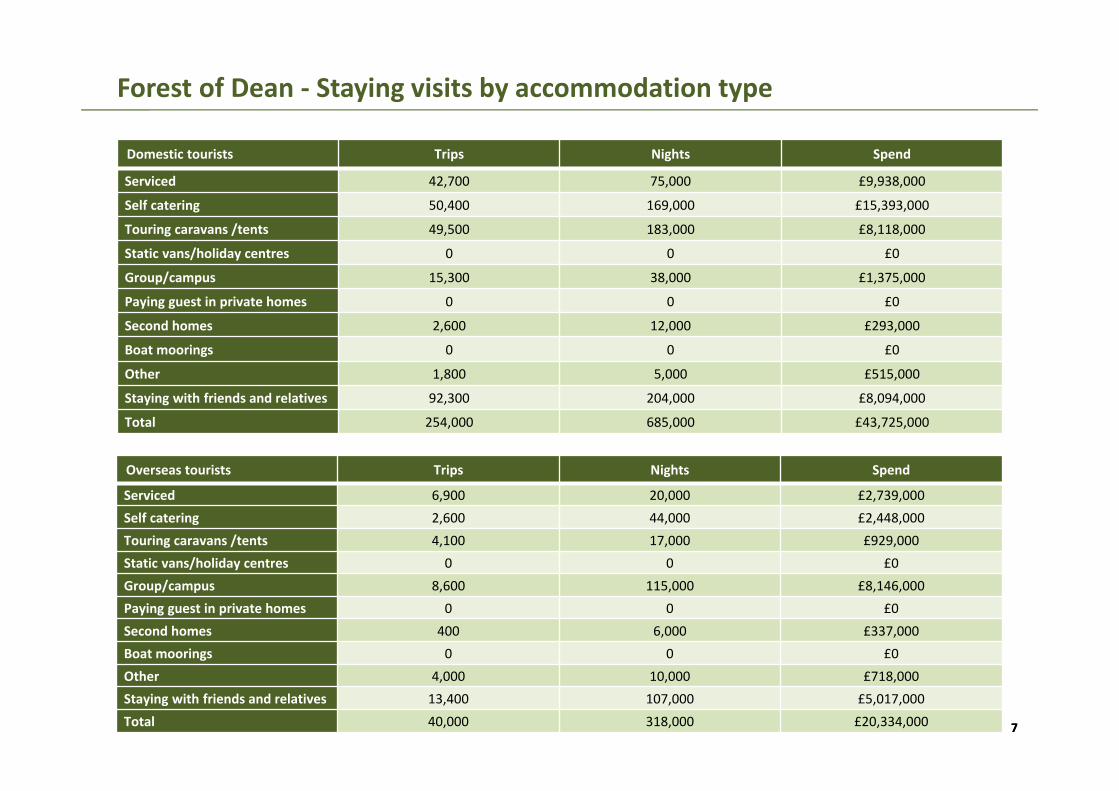
Forest of Dean ‐ Staying visits by accommodation type
Domestic tourists Trips Nights Spend
Serviced 42,700 75,000 £9,938,000
Self catering 50,400 169,000 £15,393,000
Touring caravans /tents 49,500 183,000 £8,118,000
Static vans/holiday centres 0 0 £0
Group/campus 15,300 38,000 £1,375,000
Paying guest in private homes 0 0 £0
Second homes 2,600 12,000 £293,000
Boat moorings 0 0 £0
Other 1,800 5,000 £515,000
Staying with friends and relatives 92,300 204,000 £8,094,000
Total 254,000 685,000 £43,725,000
Overseas tourists Trips Nights Spend
Serviced 6,900 20,000 £2,739,000Self catering 2,600 44,000 £2,448,000Touring caravans /tents 4,100 17,000 £929,000Static vans/holiday centres 0 0 £0Group/campus 8,600 115,000 £8,146,000Paying guest in private homes 0 0 £0Second homes 400 6,000 £337,000Boat moorings 0 0 £0Other 4,000 10,000 £718,000Staying with friends and relatives 13,400 107,000 £5,017,000Total 40,000 318,000 £20,334,000
88
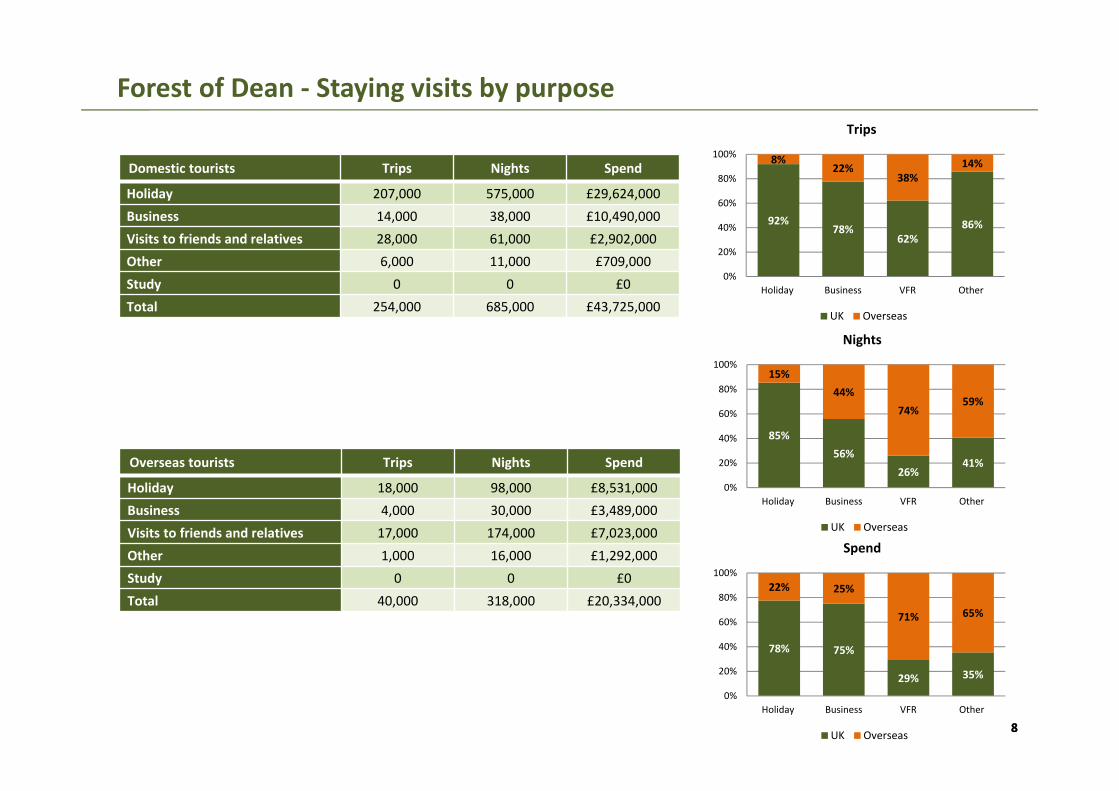
Forest of Dean ‐ Staying visits by purpose
6
Domestic tourists Trips Nights Spend
Holiday 207,000 575,000 £29,624,000Business 14,000 38,000 £10,490,000Visits to friends and relatives 28,000 61,000 £2,902,000Other 6,000 11,000 £709,000Study 0 0 £0Total 254,000 685,000 £43,725,000
Overseas tourists Trips Nights Spend
Holiday 18,000 98,000 £8,531,000Business 4,000 30,000 £3,489,000Visits to friends and relatives 17,000 174,000 £7,023,000Other 1,000 16,000 £1,292,000Study 0 0 £0Total 40,000 318,000 £20,334,000
92%78%
62%86%
8%22%
38%14%
0%
20%
40%
60%
80%
100%
Holiday Business VFR Other
Trips
UK Overseas
85%56%
26%41%
15%44%
74%59%
0%
20%
40%
60%
80%
100%
Holiday Business VFR Other
Nights
UK Overseas
78% 75%
29% 35%
22% 25%
71% 65%
0%
20%
40%
60%
80%
100%
Holiday Business VFR Other
Spend
UK Overseas
99
Forest of Dean – Day visits
6
Information on day visits within this report has been derived from the 2016 Great Britain Day Visit Survey (GBDVS). The survey, which was first undertaken in 2011, provides a much needed update on day visit activity in Great Britain and generally speaking estimated greater frequencies of trip taking than the previous day visit survey (England Leisure Visits Survey 2005). As a result of the new methodology in 2011 comparisons with previous day visit estimates are not possible.
The GBDVS distinguishes between day visits to a town or city; to the seaside and coast; and to the countryside. Different drivers are used within the model to distribute these trips. Local ‘drivers’ such as attraction footfall, quality and size of countryside and coastline are factored into the model for this purpose.
1010
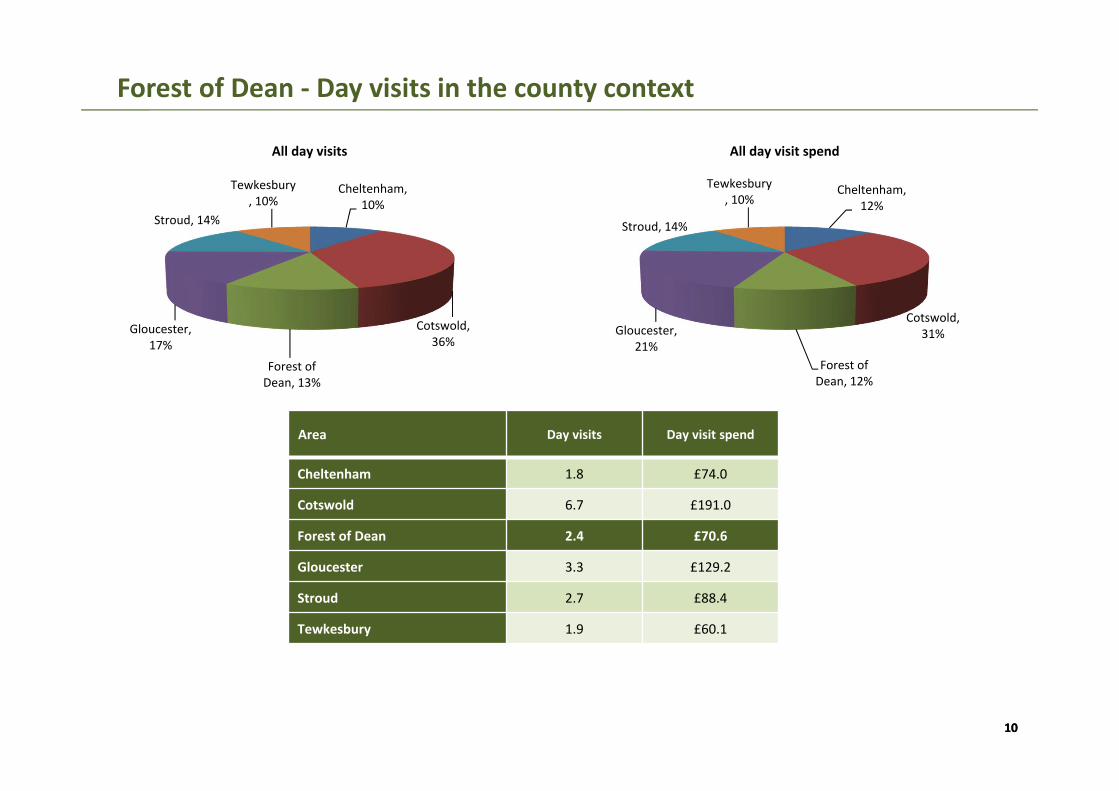
Forest of Dean ‐ Day visits in the county context
Area Day visits Day visit spend
Cheltenham 1.8 £74.0
Cotswold 6.7 £191.0
Forest of Dean 2.4 £70.6
Gloucester 3.3 £129.2
Stroud 2.7 £88.4
Tewkesbury 1.9 £60.1
Cheltenham, 10%
Cotswold, 36%
Forest of Dean, 13%
Gloucester, 17%
Stroud, 14%
Tewkesbury, 10%
All day visits
Cheltenham, 12%
Cotswold, 31%
Forest of Dean, 12%
Gloucester, 21%
Stroud, 14%
Tewkesbury, 10%
All day visit spend
1111
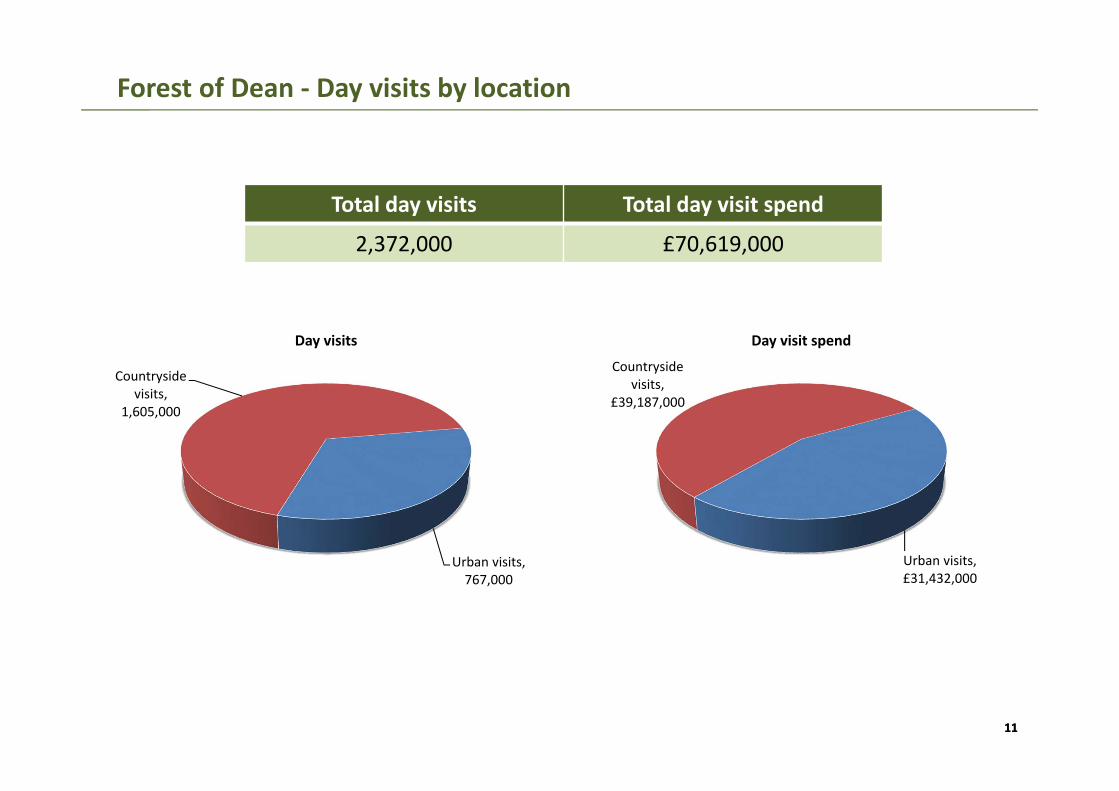
Forest of Dean ‐ Day visits by location
Urban visits, 767,000
Countryside visits,
1,605,000
Day visits
Urban visits, £31,432,000
Countryside visits,
£39,187,000
Day visit spend
Total day visits Total day visit spend
2,372,000 £70,619,000
1212
Forest of Dean ‐ Direct visitor expenditure by category
6
Information on the breakdown of visitor spending is available from the three main tourism and day visitor surveys by type of visitor. The Model divides the expenditure between five sectors:
• Accommodation
• Shopping for gifts, clothes and other goods
• Eating and drinking in restaurants, cafes and inns
• Entry to attractions, entertainment and hire of goods and services
• Transport and travel costs including public transport, purchase of fuel and parking
The following pages look at the breakdown of this expenditure and business turnover arising from this expenditure.
By applying the expenditure breakdown to the estimates of visitor spending the Model generates estimates of total spending by the five business sectors. Visitor expenditure in each sector represents additional turnover for businesses in those sectors. However, evidence from national studies suggests that some minor adjustments are required to match visitor spend to business turnover. In particular, some expenditure on food and drink actually takes place in inns and hotels that fall into the accommodation sector and at attractions. The turnover for each business sector has therefore been adjusted to take account of these marginal changes. More significantly, expenditure on travel costs associated with individual trips is as likely to take place at the origin of the trip as it is at the actual destination. It is therefore assumed that only 60% of total travel expenditure accrues to the destination area.
1313
Forest of Dean – Direct visitor expenditure by category
6
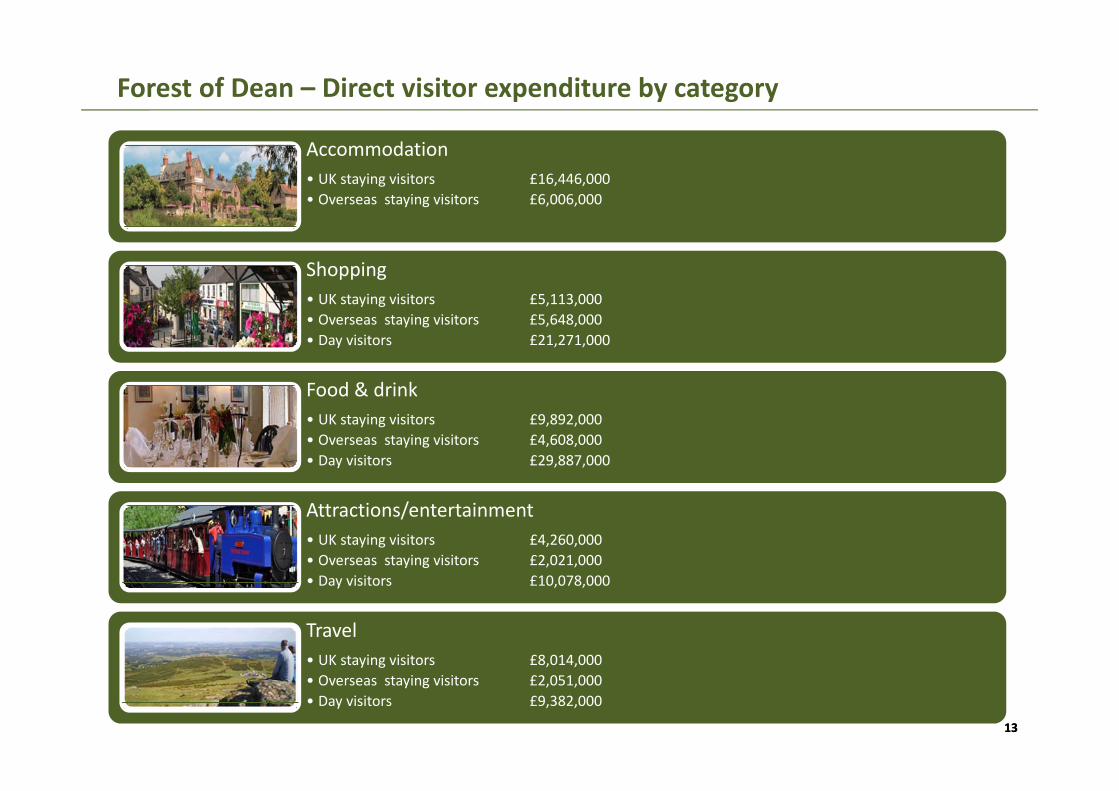
Accommodation• UK staying visitors £16,446,000• Overseas staying visitors £6,006,000
Shopping• UK staying visitors £5,113,000• Overseas staying visitors £5,648,000• Day visitors £21,271,000
Food & drink• UK staying visitors £9,892,000• Overseas staying visitors £4,608,000• Day visitors £29,887,000
Attractions/entertainment• UK staying visitors £4,260,000• Overseas staying visitors £2,021,000• Day visitors £10,078,000
Travel• UK staying visitors £8,014,000• Overseas staying visitors £2,051,000• Day visitors £9,382,000
1414
Forest of Dean – Other visitor related expenditure by category
6
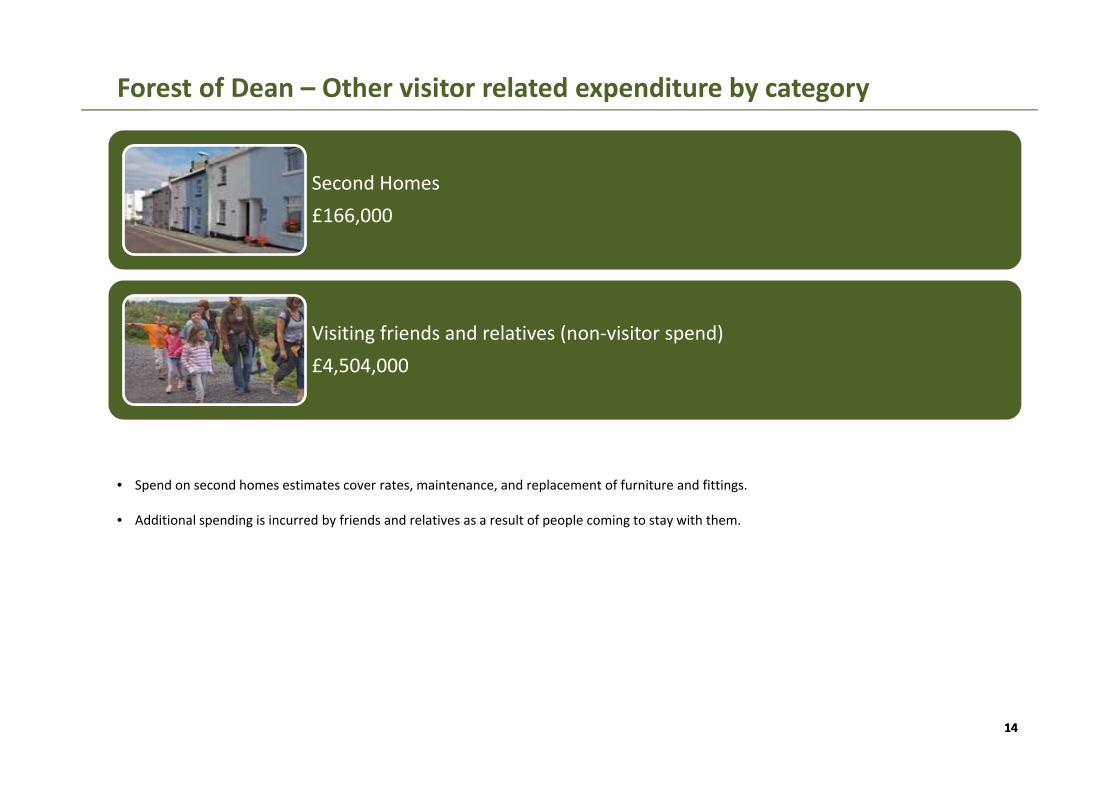
Second Homes£166,000
Visiting friends and relatives (non‐visitor spend)£4,504,000
• Spend on second homes estimates cover rates, maintenance, and replacement of furniture and fittings.
• Additional spending is incurred by friends and relatives as a result of people coming to stay with them.
1515
Forest of Dean – Business turnover
6
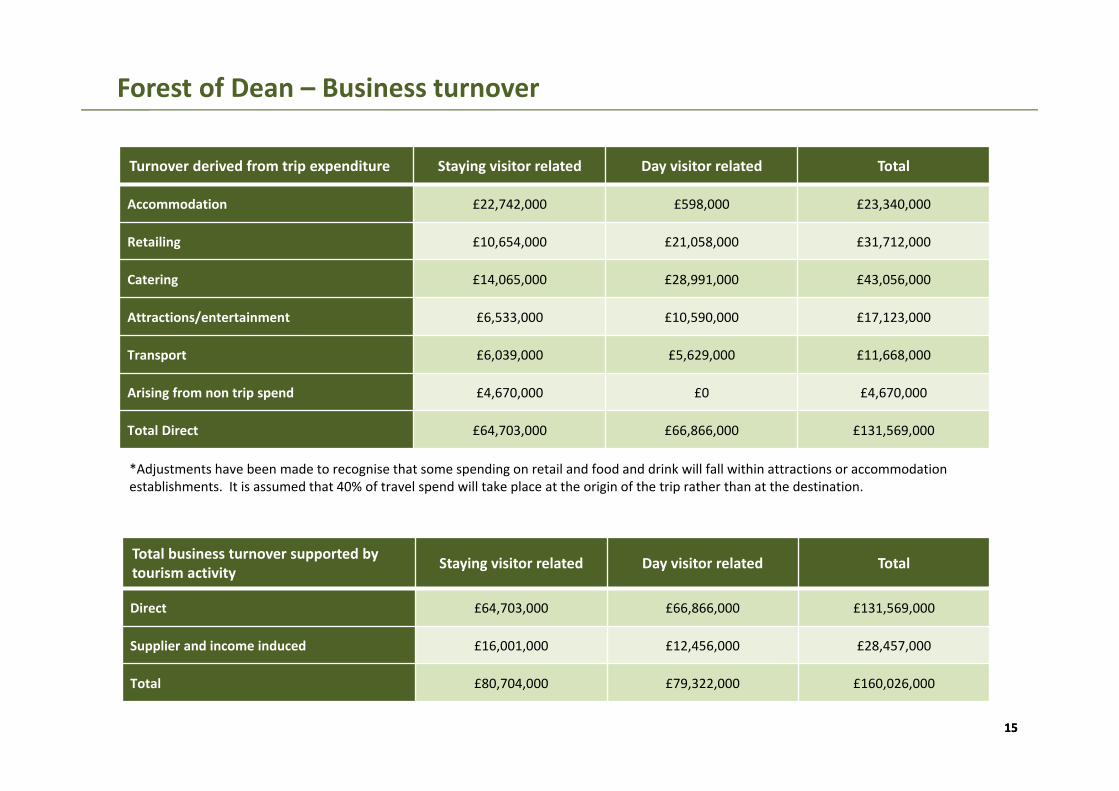
Turnover derived from trip expenditure Staying visitor related Day visitor related Total
Accommodation £22,742,000 £598,000 £23,340,000
Retailing £10,654,000 £21,058,000 £31,712,000
Catering £14,065,000 £28,991,000 £43,056,000
Attractions/entertainment £6,533,000 £10,590,000 £17,123,000
Transport £6,039,000 £5,629,000 £11,668,000
Arising from non trip spend £4,670,000 £0 £4,670,000
Total Direct £64,703,000 £66,866,000 £131,569,000
Total business turnover supported by tourism activity Staying visitor related Day visitor related Total
Direct £64,703,000 £66,866,000 £131,569,000
Supplier and income induced £16,001,000 £12,456,000 £28,457,000
Total £80,704,000 £79,322,000 £160,026,000
*Adjustments have been made to recognise that some spending on retail and food and drink will fall within attractions or accommodation establishments. It is assumed that 40% of travel spend will take place at the origin of the trip rather than at the destination.
1616
Forest of Dean – Tourism related employment
6
Having identified the value of turnover generated by visitor spending in each business sector it is possible to estimate the employment associated with that spending.
The use of visitor expenditure to generate job numbers underestimates the number of jobs arising in the attractions/entertainment sector. The underestimate arises because local authorities and voluntary bodies do not always seek to recoup the full operating costs of individual attractions of facilities from entrance charges. Therefore an additional percentage of direct employment is added to the attractions sector estimates to take account of this factor.
This section of the report looks at employment on three levels;
• Direct Jobs ‐ Direct jobs are those in businesses in receipt of visitor spending. For example, jobs supported by visitor spending at a hotel would be direct jobs.
• Indirect Jobs ‐ Indirect employment arises as a result of expenditure by businesses in direct receipt of visitor expenditure on the purchase of goods and services for their businesses. For example, some of the employment at a business supplying food and drink may be supported through the supplies that the business sells to hotels (or any other business in direct receipt of visitor expenditure).
• Induced Jobs ‐ Induced jobs are those that are supported by the spending of wages by employees in direct and indirect jobs. Such spending will be spread across a wide range of service sectors.
Estimates are shown for actual jobs and full time equivalent jobs (FTE’s).
1717
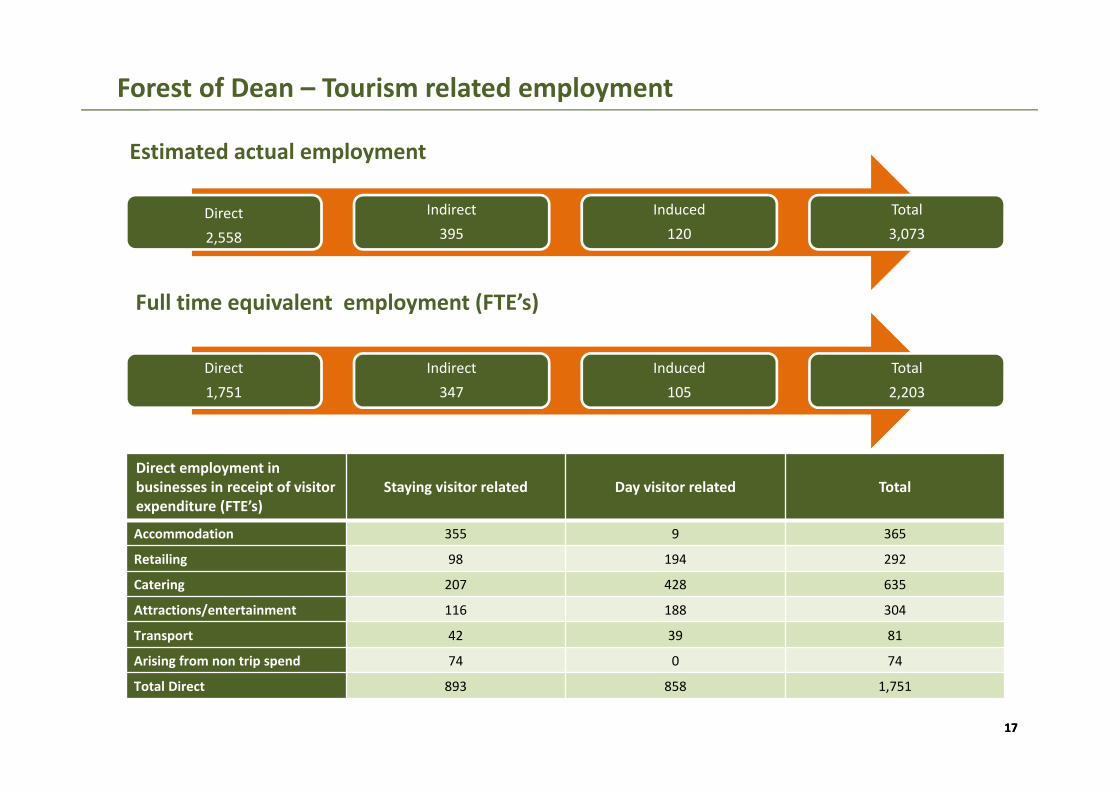
Forest of Dean – Tourism related employment
6
Direct 2,558
Indirect 395
Induced 120
Total 3,073
Direct 1,751
Indirect 347
Induced 105
Total 2,203
Estimated actual employment
Full time equivalent employment (FTE’s)
Direct employment in businesses in receipt of visitor expenditure (FTE’s)
Staying visitor related Day visitor related Total
Accommodation 355 9 365
Retailing 98 194 292
Catering 207 428 635
Attractions/entertainment 116 188 304
Transport 42 39 81
Arising from non trip spend 74 0 74
Total Direct 893 858 1,751

1818
Gloucestershire 2016
1919
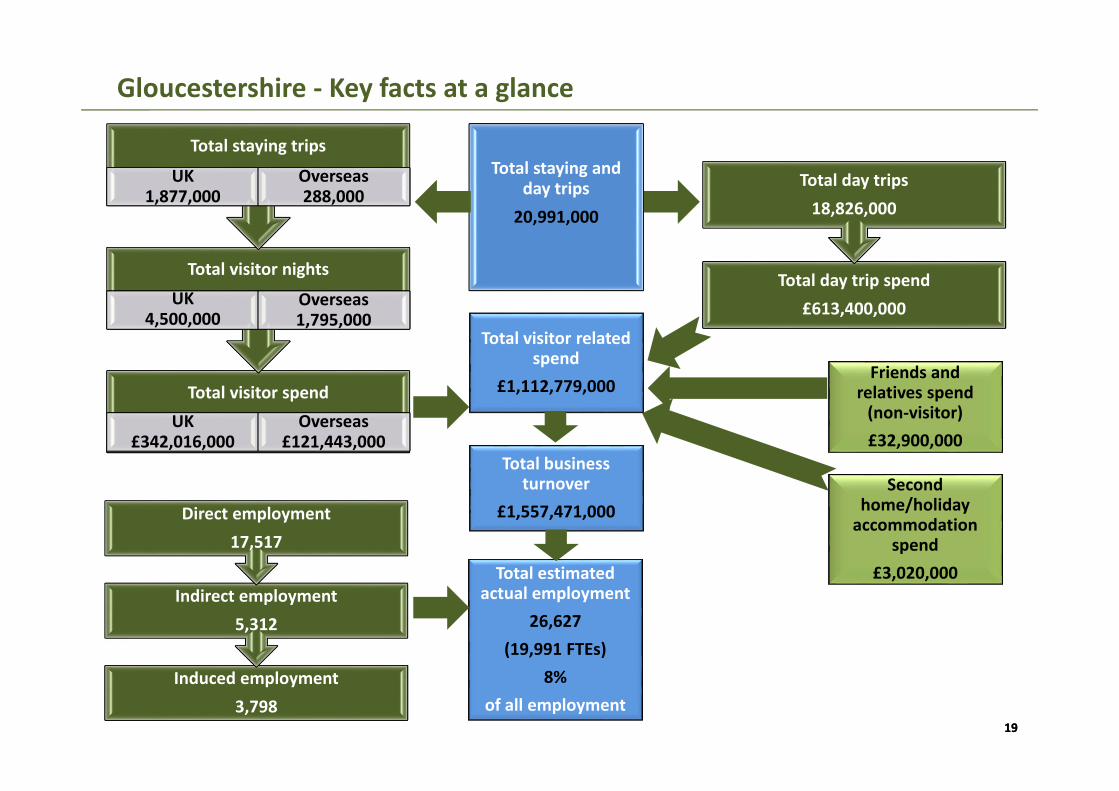
Gloucestershire ‐ Key facts at a glance
Total visitor spendUK
£342,016,000Overseas
£121,443,000
Total visitor nights
UK 4,500,000
Overseas 1,795,000
Total staying trips
UK 1,877,000
Overseas 288,000
Total day trip spend£613,400,000
Total day trips18,826,000
Total staying and day trips20,991,000
Friends and relatives spend (non‐visitor)£32,900,000
Second home/holiday accommodation
spend£3,020,000
Total visitor related spend
£1,112,779,000
Total estimated actual employment
26,627(19,991 FTEs)
8%of all employment
Induced employment3,798
Indirect employment 5,312
Direct employment17,517
Total business turnover
£1,557,471,000
2020
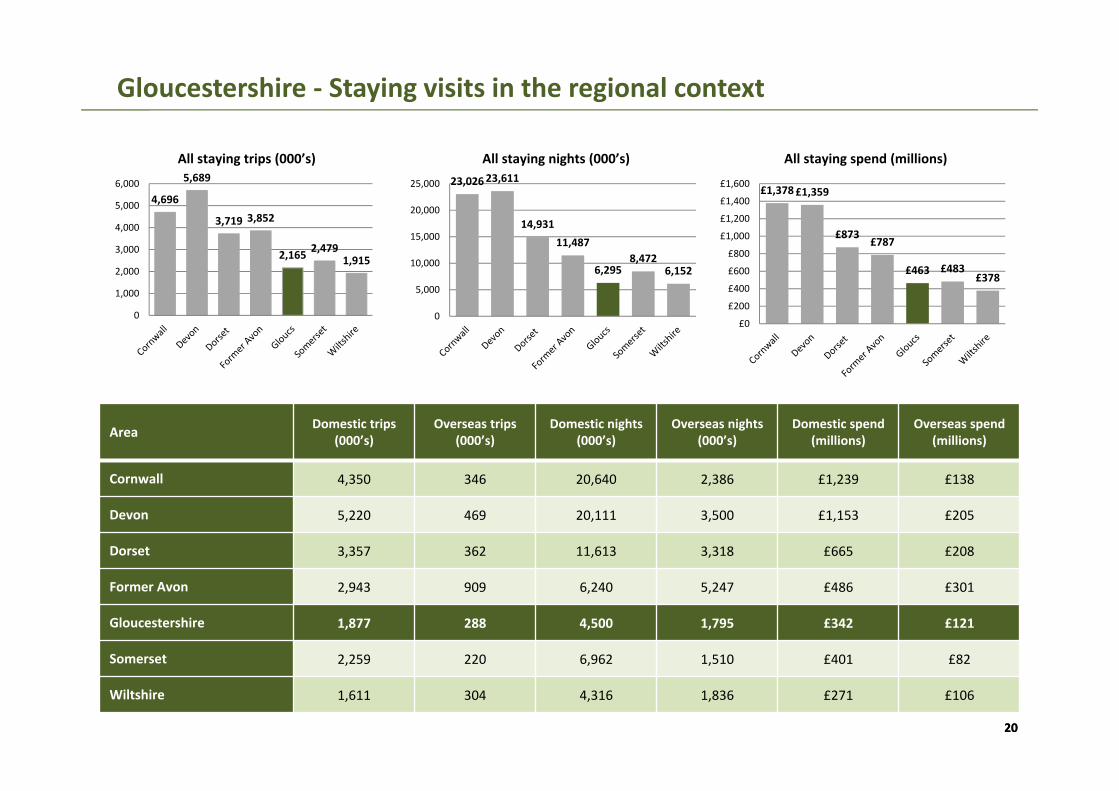
Gloucestershire ‐ Staying visits in the regional context
Area Domestic trips (000’s)
Overseas trips (000’s)
Domestic nights(000’s)
Overseas nights(000’s)
Domestic spend(millions)
Overseas spend(millions)
Cornwall 4,350 346 20,640 2,386 £1,239 £138
Devon 5,220 469 20,111 3,500 £1,153 £205
Dorset 3,357 362 11,613 3,318 £665 £208
Former Avon 2,943 909 6,240 5,247 £486 £301
Gloucestershire 1,877 288 4,500 1,795 £342 £121
Somerset 2,259 220 6,962 1,510 £401 £82
Wiltshire 1,611 304 4,316 1,836 £271 £106
4,696
5,689
3,719 3,852
2,165 2,4791,915
0
1,000
2,000
3,000
4,000
5,000
6,000
All staying trips (000’s)23,02623,611
14,93111,487
6,2958,472
6,152
0
5,000
10,000
15,000
20,000
25,000
All staying nights (000’s)
£1,378£1,359
£873£787
£463 £483£378
£0
£200
£400
£600
£800
£1,000
£1,200
£1,400
£1,600
All staying spend (millions)
2121
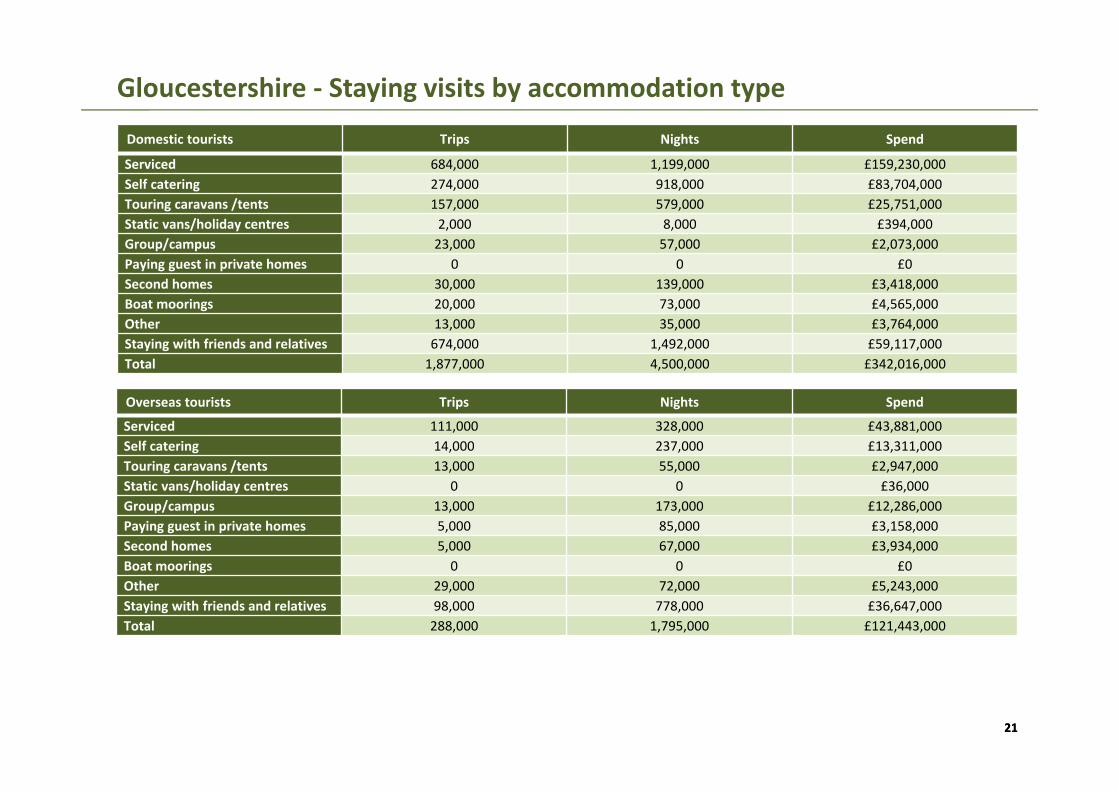
Gloucestershire ‐ Staying visits by accommodation type
Domestic tourists Trips Nights Spend
Serviced 684,000 1,199,000 £159,230,000Self catering 274,000 918,000 £83,704,000Touring caravans /tents 157,000 579,000 £25,751,000Static vans/holiday centres 2,000 8,000 £394,000Group/campus 23,000 57,000 £2,073,000Paying guest in private homes 0 0 £0Second homes 30,000 139,000 £3,418,000Boat moorings 20,000 73,000 £4,565,000Other 13,000 35,000 £3,764,000Staying with friends and relatives 674,000 1,492,000 £59,117,000Total 1,877,000 4,500,000 £342,016,000
Overseas tourists Trips Nights Spend
Serviced 111,000 328,000 £43,881,000Self catering 14,000 237,000 £13,311,000Touring caravans /tents 13,000 55,000 £2,947,000Static vans/holiday centres 0 0 £36,000Group/campus 13,000 173,000 £12,286,000Paying guest in private homes 5,000 85,000 £3,158,000Second homes 5,000 67,000 £3,934,000Boat moorings 0 0 £0Other 29,000 72,000 £5,243,000Staying with friends and relatives 98,000 778,000 £36,647,000Total 288,000 1,795,000 £121,443,000
2222
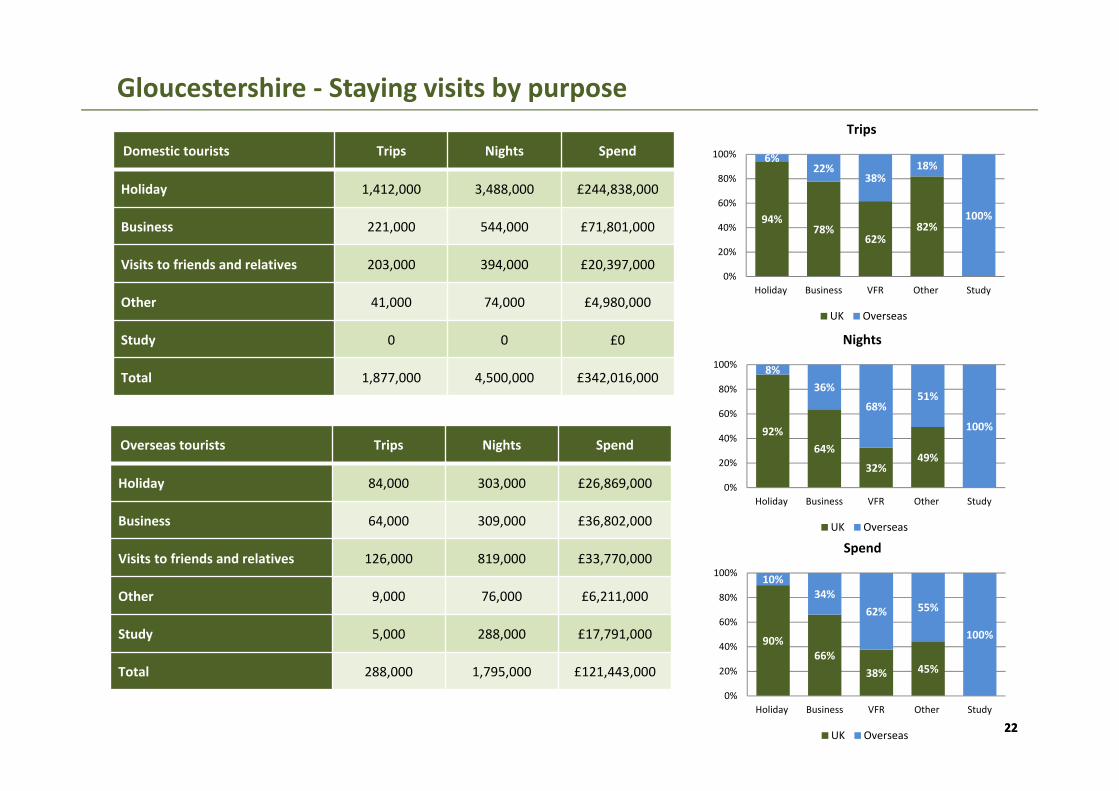
Gloucestershire ‐ Staying visits by purpose
6
Domestic tourists Trips Nights Spend
Holiday 1,412,000 3,488,000 £244,838,000
Business 221,000 544,000 £71,801,000
Visits to friends and relatives 203,000 394,000 £20,397,000
Other 41,000 74,000 £4,980,000
Study 0 0 £0
Total 1,877,000 4,500,000 £342,016,000
Overseas tourists Trips Nights Spend
Holiday 84,000 303,000 £26,869,000
Business 64,000 309,000 £36,802,000
Visits to friends and relatives 126,000 819,000 £33,770,000
Other 9,000 76,000 £6,211,000
Study 5,000 288,000 £17,791,000
Total 288,000 1,795,000 £121,443,000
94%78%
62%82%
6%22%
38%18%
100%
0%
20%
40%
60%
80%
100%
Holiday Business VFR Other Study
Trips
UK Overseas
92%64%
32%49%
8%36%
68%51%
100%
0%
20%
40%
60%
80%
100%
Holiday Business VFR Other Study
Nights
UK Overseas
90%66%
38% 45%
10%34%
62% 55%
100%
0%
20%
40%
60%
80%
100%
Holiday Business VFR Other Study
Spend
UK Overseas
2323
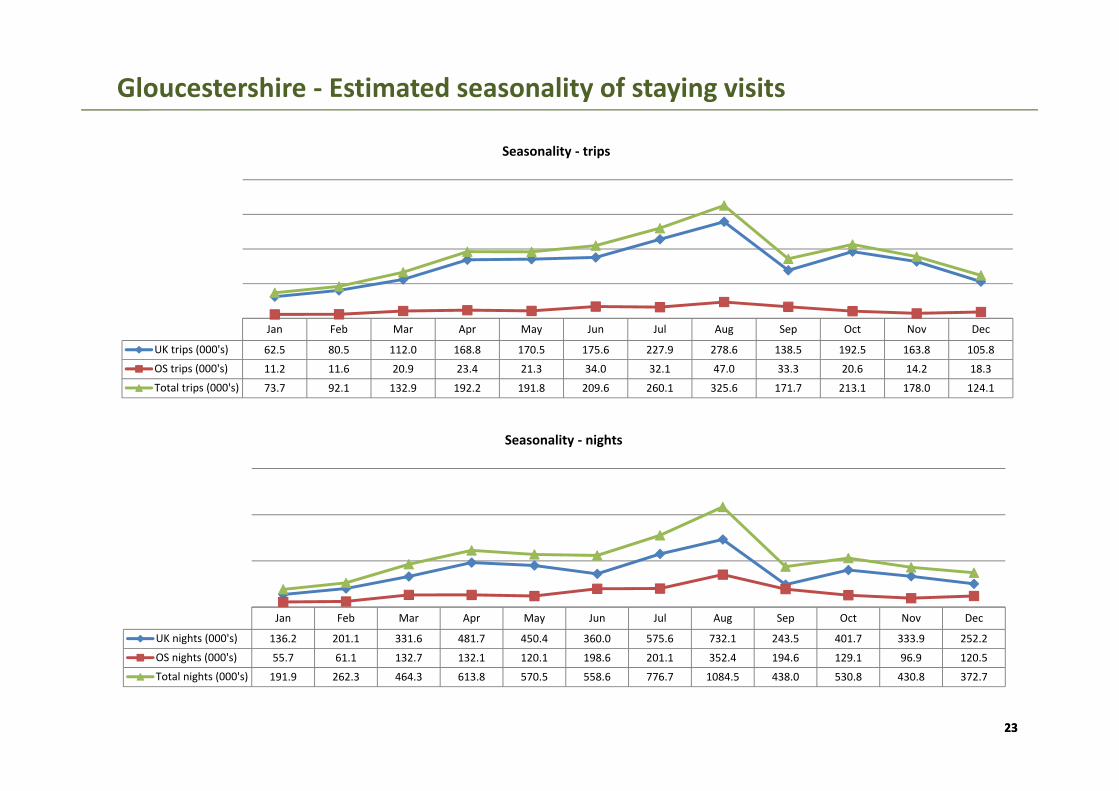
Gloucestershire ‐ Estimated seasonality of staying visits
6
Jan Feb Mar Apr May Jun Jul Aug Sep Oct Nov Dec
UK trips (000's) 62.5 80.5 112.0 168.8 170.5 175.6 227.9 278.6 138.5 192.5 163.8 105.8
OS trips (000's) 11.2 11.6 20.9 23.4 21.3 34.0 32.1 47.0 33.3 20.6 14.2 18.3
Total trips (000's) 73.7 92.1 132.9 192.2 191.8 209.6 260.1 325.6 171.7 213.1 178.0 124.1
Seasonality ‐ trips
Jan Feb Mar Apr May Jun Jul Aug Sep Oct Nov Dec
UK nights (000's) 136.2 201.1 331.6 481.7 450.4 360.0 575.6 732.1 243.5 401.7 333.9 252.2
OS nights (000's) 55.7 61.1 132.7 132.1 120.1 198.6 201.1 352.4 194.6 129.1 96.9 120.5
Total nights (000's) 191.9 262.3 464.3 613.8 570.5 558.6 776.7 1084.5 438.0 530.8 430.8 372.7
Seasonality ‐ nights
2424
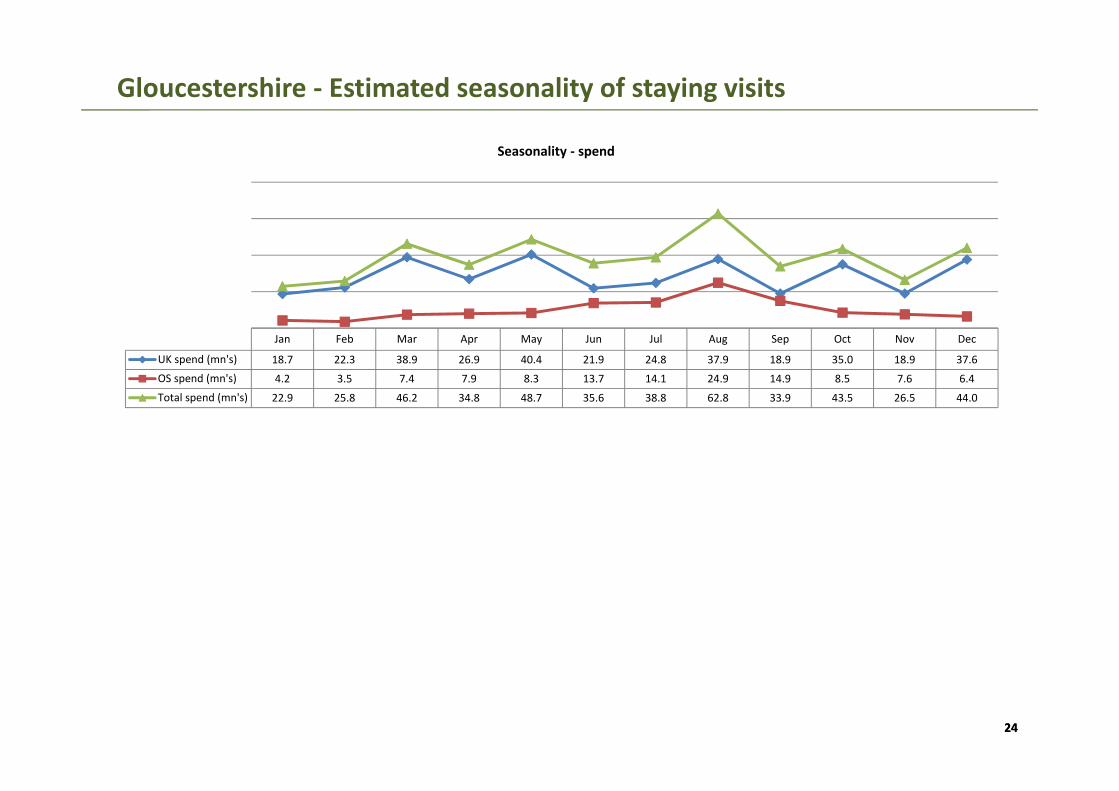
Gloucestershire ‐ Estimated seasonality of staying visits
6
Jan Feb Mar Apr May Jun Jul Aug Sep Oct Nov Dec
UK spend (mn's) 18.7 22.3 38.9 26.9 40.4 21.9 24.8 37.9 18.9 35.0 18.9 37.6
OS spend (mn's) 4.2 3.5 7.4 7.9 8.3 13.7 14.1 24.9 14.9 8.5 7.6 6.4
Total spend (mn's) 22.9 25.8 46.2 34.8 48.7 35.6 38.8 62.8 33.9 43.5 26.5 44.0
Seasonality ‐ spend
2525
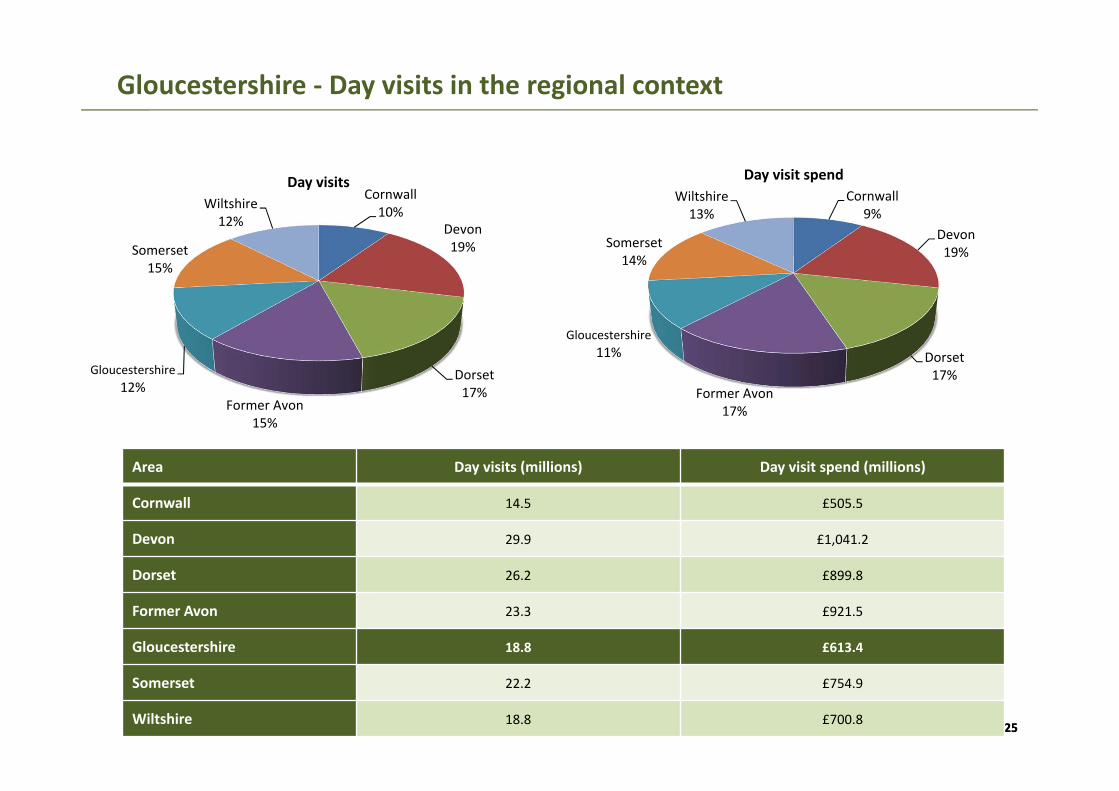
Gloucestershire ‐ Day visits in the regional context
Cornwall10%
Devon19%
Dorset17%
Former Avon15%
Gloucestershire12%
Somerset15%
Wiltshire12%
Day visitsCornwall
9%Devon19%
Dorset17%
Former Avon17%
Gloucestershire11%
Somerset14%
Wiltshire13%
Day visit spend
Area Day visits (millions) Day visit spend (millions)
Cornwall 14.5 £505.5
Devon 29.9 £1,041.2
Dorset 26.2 £899.8
Former Avon 23.3 £921.5
Gloucestershire 18.8 £613.4
Somerset 22.2 £754.9
Wiltshire 18.8 £700.8
2626
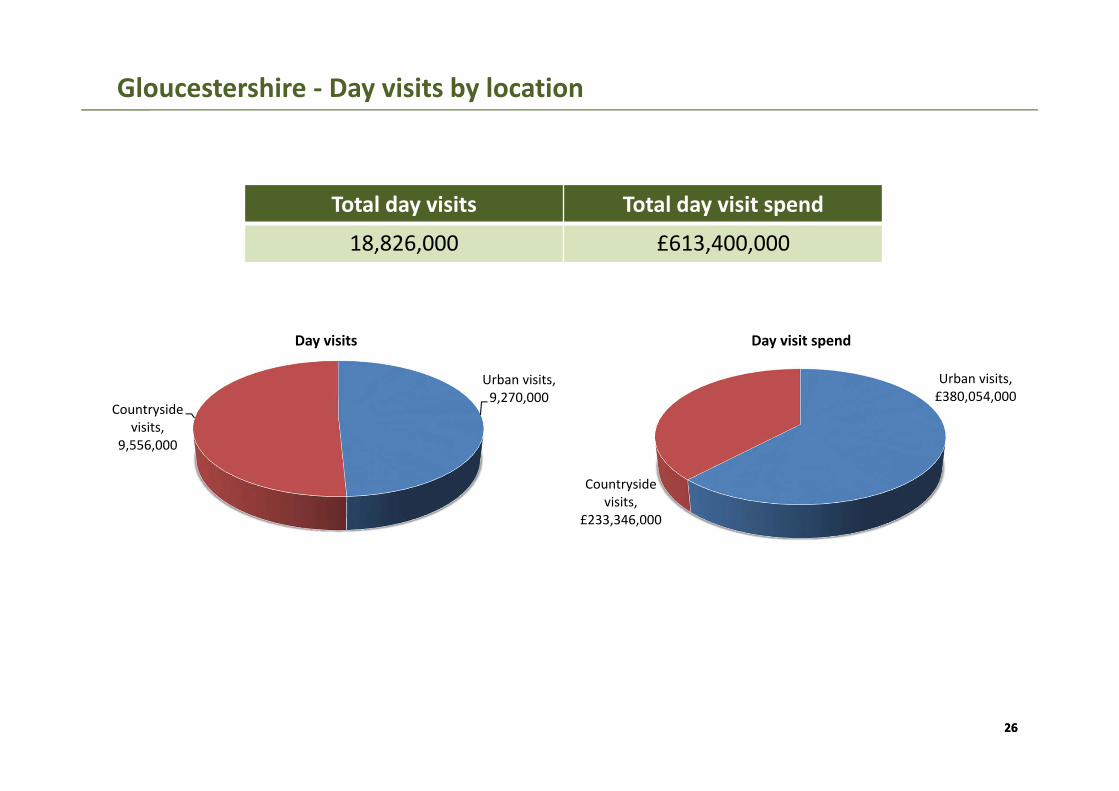
Gloucestershire ‐ Day visits by location
Urban visits, 9,270,000
Countryside visits,
9,556,000
Day visits
Urban visits, £380,054,000
Countryside visits,
£233,346,000
Day visit spend
Total day visits Total day visit spend
18,826,000 £613,400,000
2727
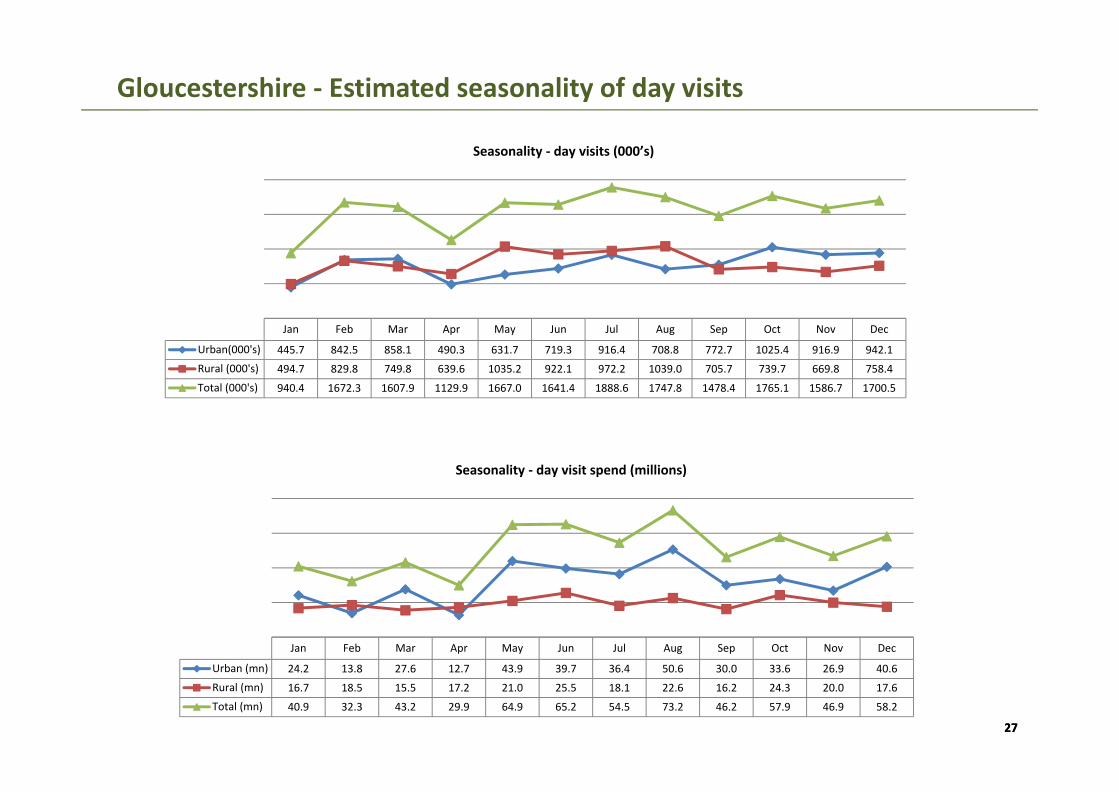
Gloucestershire ‐ Estimated seasonality of day visits
6
Jan Feb Mar Apr May Jun Jul Aug Sep Oct Nov Dec
Urban(000's) 445.7 842.5 858.1 490.3 631.7 719.3 916.4 708.8 772.7 1025.4 916.9 942.1
Rural (000's) 494.7 829.8 749.8 639.6 1035.2 922.1 972.2 1039.0 705.7 739.7 669.8 758.4
Total (000's) 940.4 1672.3 1607.9 1129.9 1667.0 1641.4 1888.6 1747.8 1478.4 1765.1 1586.7 1700.5
Seasonality ‐ day visits (000’s)
Jan Feb Mar Apr May Jun Jul Aug Sep Oct Nov Dec
Urban (mn) 24.2 13.8 27.6 12.7 43.9 39.7 36.4 50.6 30.0 33.6 26.9 40.6
Rural (mn) 16.7 18.5 15.5 17.2 21.0 25.5 18.1 22.6 16.2 24.3 20.0 17.6
Total (mn) 40.9 32.3 43.2 29.9 64.9 65.2 54.5 73.2 46.2 57.9 46.9 58.2
Seasonality ‐ day visit spend (millions)
2828
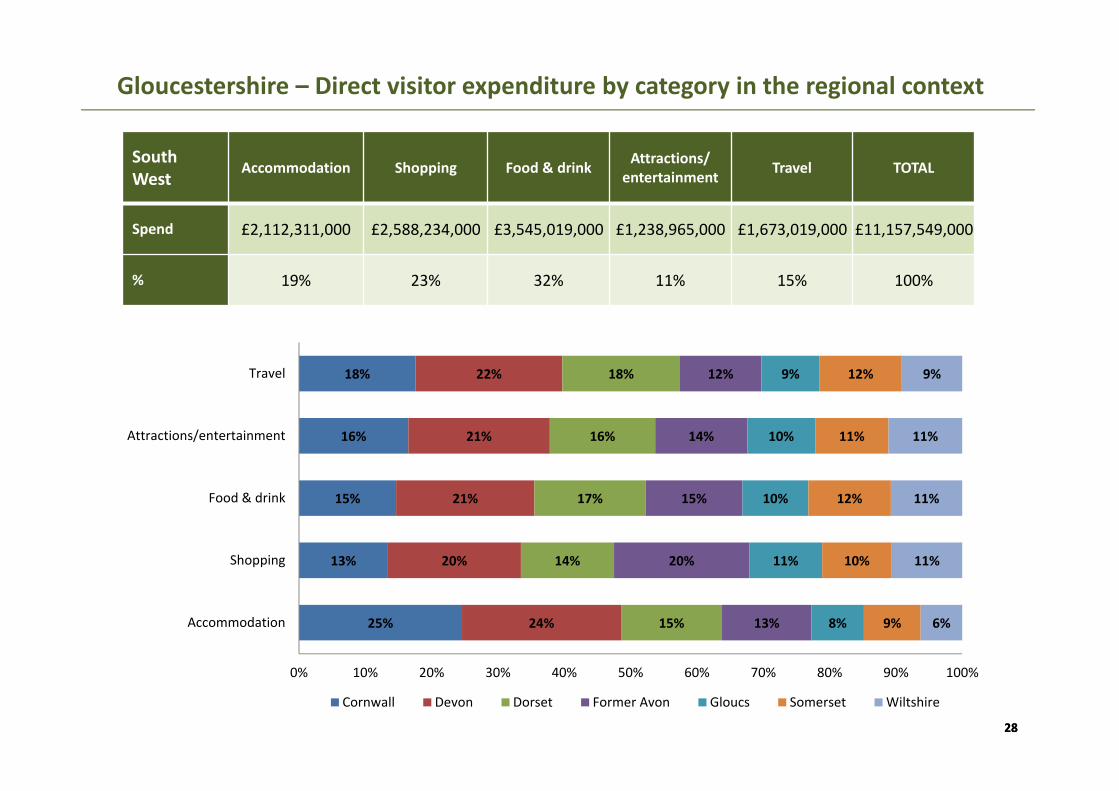
Gloucestershire – Direct visitor expenditure by category in the regional context
25%
13%
15%
16%
18%
24%
20%
21%
21%
22%
15%
14%
17%
16%
18%
13%
20%
15%
14%
12%
8%
11%
10%
10%
9%
9%
10%
12%
11%
12%
6%
11%
11%
11%
9%
0% 10% 20% 30% 40% 50% 60% 70% 80% 90% 100%
Accommodation
Shopping
Food & drink
Attractions/entertainment
Travel
Cornwall Devon Dorset Former Avon Gloucs Somerset Wiltshire
South West
Accommodation Shopping Food & drink Attractions/entertainment Travel TOTAL
Spend £2,112,311,000 £2,588,234,000 £3,545,019,000 £1,238,965,000 £1,673,019,000 £11,157,549,000
% 19% 23% 32% 11% 15% 100%
2929
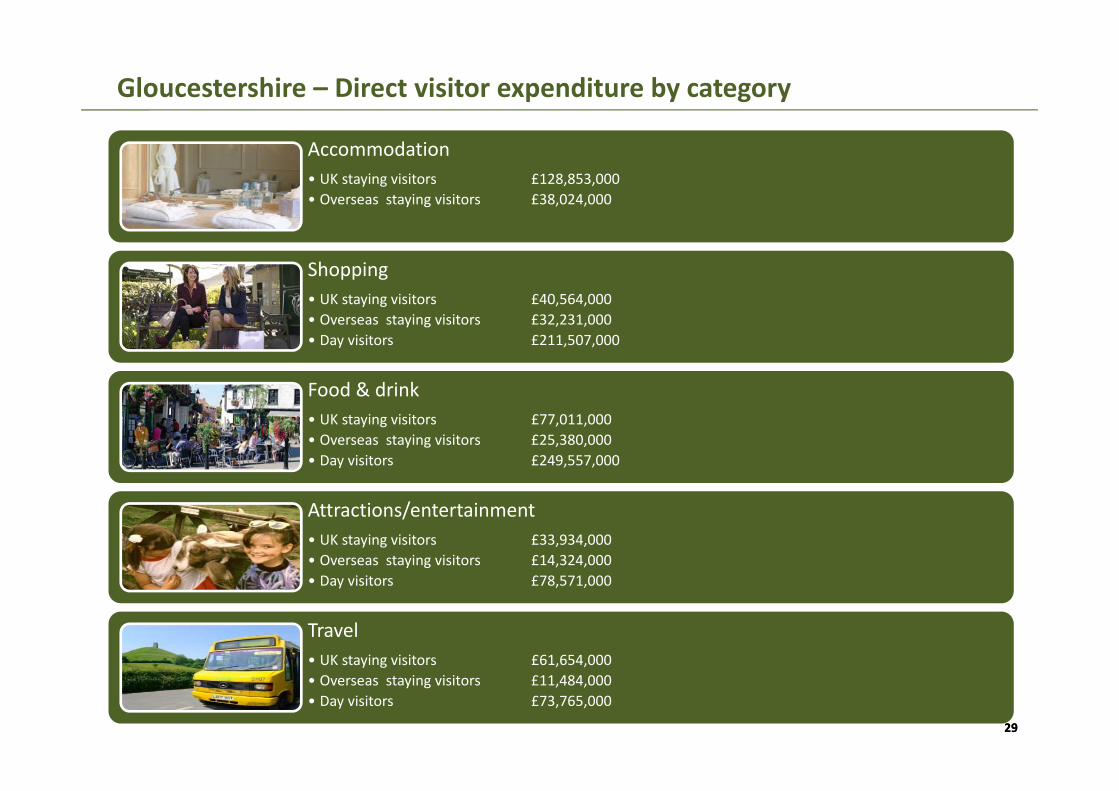
Gloucestershire – Direct visitor expenditure by category
6
Accommodation• UK staying visitors £128,853,000• Overseas staying visitors £38,024,000
Shopping• UK staying visitors £40,564,000• Overseas staying visitors £32,231,000• Day visitors £211,507,000
Food & drink• UK staying visitors £77,011,000• Overseas staying visitors £25,380,000• Day visitors £249,557,000
Attractions/entertainment• UK staying visitors £33,934,000• Overseas staying visitors £14,324,000• Day visitors £78,571,000
Travel• UK staying visitors £61,654,000• Overseas staying visitors £11,484,000• Day visitors £73,765,000
3030
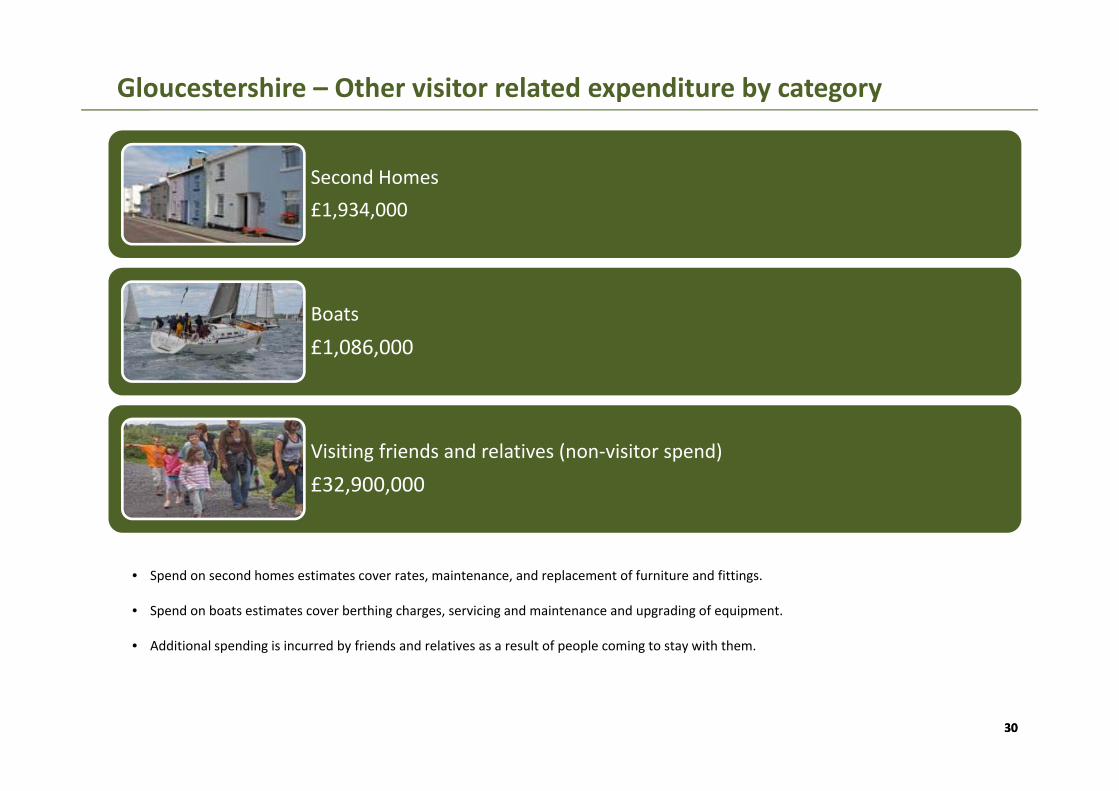
Gloucestershire – Other visitor related expenditure by category
6
Second Homes£1,934,000
Boats
£1,086,000
Visiting friends and relatives (non‐visitor spend)
£32,900,000
• Spend on second homes estimates cover rates, maintenance, and replacement of furniture and fittings.
• Spend on boats estimates cover berthing charges, servicing and maintenance and upgrading of equipment.
• Additional spending is incurred by friends and relatives as a result of people coming to stay with them.

3131
Gloucestershire – Business turnover
6
Turnover derived from trip expenditure Staying visitor related Day visitor related Total
Accommodation £168,924,000 £4,991,000 £173,915,000
Retailing £72,068,000 £209,392,000 £281,460,000
Catering £99,319,000 £242,070,000 £341,389,000
Attractions/entertainment £50,010,000 £83,182,000 £133,192,000
Transport £43,883,000 £44,259,000 £88,142,000
Arising from non trip spend £35,920,000 £0 £35,920,000
Total Direct £470,124,000 £583,894,000 £1,054,018,000
Total business turnover supported by tourism activity Staying visitor related Day visitor related Total
Direct £470,124,000 £583,894,000 £1,054,018,000
Supplier and income induced £253,913,000 £249,540,000 £503,453,000
Total £724,037,000 £833,434,000 £1,557,471,000
31
*Adjustments have been made to recognise that some spending on retail and food and drink will fall within attractions or accommodation establishments. It is assumed that 40% of travel spend will take place at the origin of the trip rather than at the destination.
3232
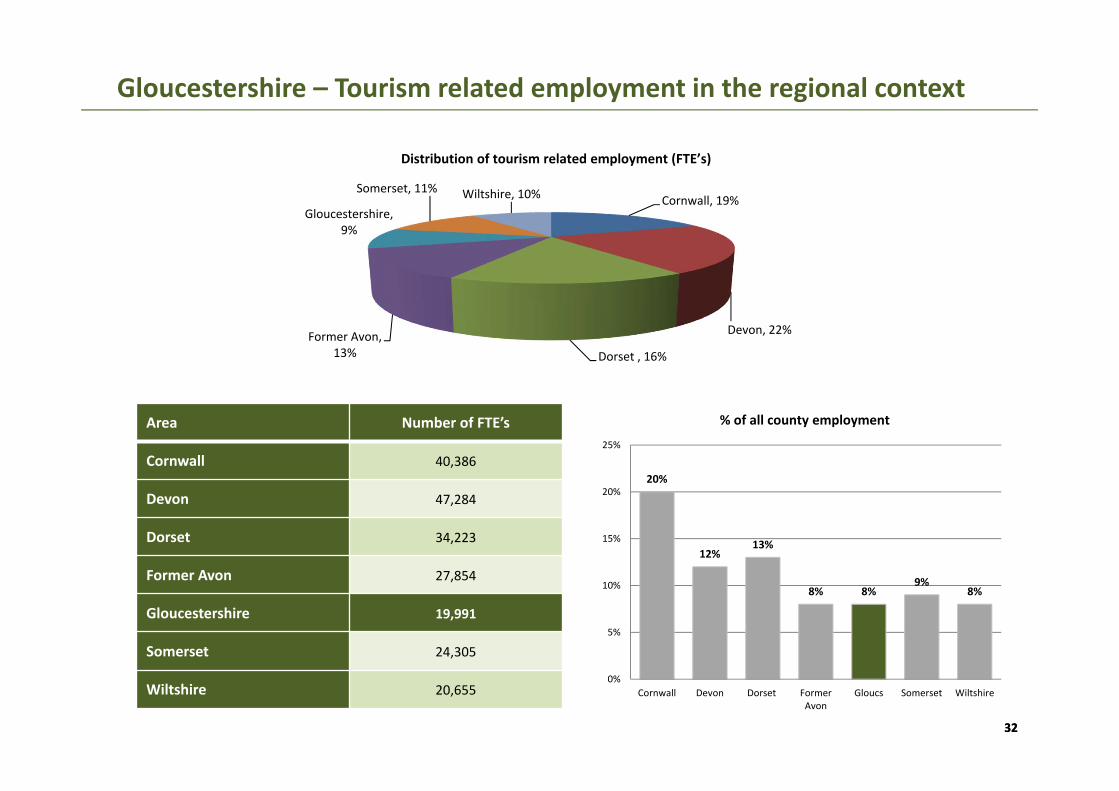
Gloucestershire – Tourism related employment in the regional context
6
Area Number of FTE’s
Cornwall 40,386
Devon 47,284
Dorset 34,223
Former Avon 27,854
Gloucestershire 19,991
Somerset 24,305
Wiltshire 20,655
20%
12%13%
8% 8%9%
8%
0%
5%
10%
15%
20%
25%
Cornwall Devon Dorset FormerAvon
Gloucs Somerset Wiltshire
% of all county employment
Cornwall, 19%
Devon, 22%
Dorset , 16%Former Avon,
13%
Gloucestershire, 9%
Somerset, 11% Wiltshire, 10%
Distribution of tourism related employment (FTE’s)
3333
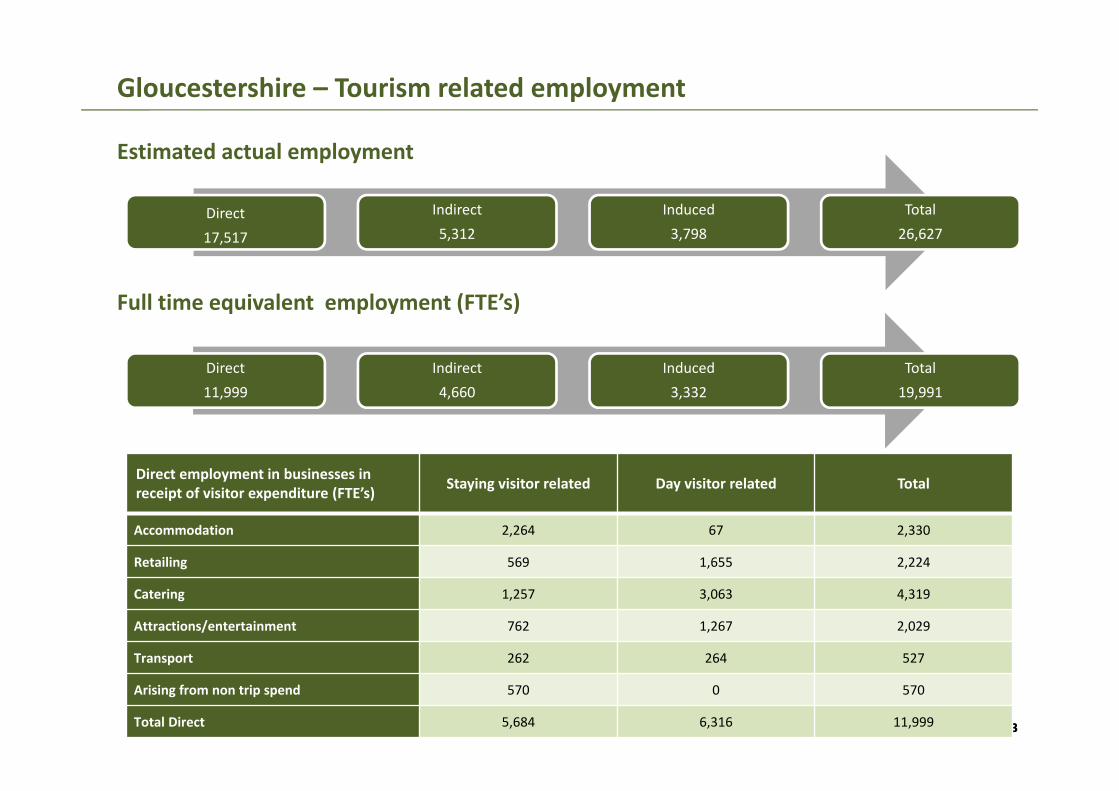
Gloucestershire – Tourism related employment
6
Direct 11,999
Indirect 4,660
Induced 3,332
Total 19,991
Estimated actual employment
Full time equivalent employment (FTE’s)
Direct employment in businesses in receipt of visitor expenditure (FTE’s) Staying visitor related Day visitor related Total
Accommodation 2,264 67 2,330
Retailing 569 1,655 2,224
Catering 1,257 3,063 4,319
Attractions/entertainment 762 1,267 2,029
Transport 262 264 527
Arising from non trip spend 570 0 570
Total Direct 5,684 6,316 11,999
Direct 17,517
Indirect 5,312
Induced 3,798
Total 26,627