Embed Size (px)
Citation preview

Portland State University Portland State University
PDXScholar PDXScholar
Institute for Sustainable Solutions Publications and Presentations Institute for Sustainable Solutions
4-2015
Forest Park Ecosystems Services Inventory: An Forest Park Ecosystems Services Inventory: An
Exploratory Study Exploratory Study
Pablo Barreyro Portland State University
Jenny Dempsey Stein Portland State University
Follow this and additional works at: https://pdxscholar.library.pdx.edu/iss_pub
Part of the Forest Management Commons, Sustainability Commons, and the Urban Studies and
Planning Commons
Let us know how access to this document benefits you.
Citation Details Citation Details Barreyro, Pablo and Stein, Jenny Dempsey, "Forest Park Ecosystems Services Inventory: An Exploratory Study" (2015). Institute for Sustainable Solutions Publications and Presentations. 94. https://pdxscholar.library.pdx.edu/iss_pub/94
This Report is brought to you for free and open access. It has been accepted for inclusion in Institute for Sustainable Solutions Publications and Presentations by an authorized administrator of PDXScholar. Please contact us if we can make this document more accessible: [email protected].

Forest Park Ecosystems Services Inventory:
An Exploratory Study
April 20, 2015
Prepared for:
The Forest Park Conservancy
http://www.forestparkconservancy.org/
http://www.pdx.edu/sustainability/iss
http://www.pdx.edu/econ/institute-for-economics-and-the-environment
For more information on this report, please contact the Institute for Economics and the Environment
Institute for Economics and the Environment

2 FOREST PARK ECOSYSTEMS SERVICES INVENTORY
2 | P a g e
Forest Park Ecosystems Services Inventory: An Exploratory Study was prepared by members of
two Portland State University classes during January – March 2015
EC # 522 Economics of Sustainability EC #427/527 Economics of Cost-Benefit Analysis
Report editors Pablo Barreyro Jenny Dempsey Stein
Student contributors Andrew Addessi Trevor Jacobson Zain Al Jumaan Antonia Machado Ryan Burchett Joe Mitchell-Nelson
Jon Castle Louis Claude Nguea-Njon
Rudina Cekani Heather Ohta Jordan Drinkhouse Aaron Scholl
Johnson Collier Tyler Stark Collin Crawford Steve Toth Amanda Davidowitz Tiffany Tram Michael Edwards James Vander Bos Jesse Horn Steve Van Eck Luke Huegle Yang Wu Alicia Imbody Szeto Yan Weng Emma Ingebretsen
Professor Randall Bluffstone, Professor of Economics
Director of the Institute for Economics and the Environment
Acknowledgements
The authors would like to thank Forest Park Conservancy and the Institute for Sustainable
Solutions at Portland State University for financial support of this project and for partnering with
the two economic classes. We especially thank Forest Park Conservancy Executive Director Renee
Meyers and Institute for Sustainable Solutions Assistant Director Fletcher Beaudoin for their
leadership and guidance on this project. We also thank Professor Randall Bluffstone and teaching
assistant Cody Kent for their creative direction and coordination of our focus group process.
Finally, we thank the neighborhood residents who gave their valuable time and input during our
focus group process.

3 FOREST PARK ECOSYSTEMS SERVICES INVENTORY
3 | P a g e
Abstract
This report presents both qualitative and quantitative survey data concerning resident
perceptions of ecosystem services in Portland’s Forest Park. Focus group best practices
and ecosystem services in urban parks literature are reviewed. Representative focus groups
were conducted to ascertain local awareness and understanding of the urban wilderness
area’s ecosystem services, identify concurrent challenges and measure interest in a
potential interpretive center. Individual surveys were also administered in order to connect
issues with demographics and recreational use information. Regression analyses were
conducted to examine related park usage, access and economic trends.
While the study is preliminary, the results reveal opportunities for future study. Such
studies should further build an understanding of the complex factors that influence park
users’ engagement, stewardship and place values associated with Forest Park, which will
in turn promote more accurate valuation of ecosystem services and better-informed
decisions about future management intensity.
JEL Classifications: Q20, Q23, Q26, R00
Keywords: Portland, Oregon, Forest, Park, Ecosystem, Wilderness

4 FOREST PARK ECOSYSTEMS SERVICES INVENTORY
4 | P a g e
I. Introduction
Within the city limits of Portland, Oregon lies an unusually large urban wilderness park
and community asset. Forest Park is a contiguous 5,200-acre natural area that is home to over 100
native bird species and more than 50 mammals. The greater Forest Park ecosystem in northwest
Portland’s Tualatin Mountains, consists of Forest Park, more than 1,100 acres of natural areas
owned by Audubon, Metro and the Forest Park Conservancy, as well as over 8,600 acres of private
land. Over 50 miles of trails traverse these woods.
Originally Forest Park was proposed in Portland’s master park plan of 1903, which was
created by the well-known Olmsted brothers. Forest Park was established in 1948, after many
decades of vulnerability to logging, exploration and development. In the 1940’s, Portland’s City
Club members organized to protect multiple tracts of forest totaling over 4,000 acres, many of
which were abandoned tax lots and/or contained second growth forests. Over the years, additional
land acquisitions have increased the park’s size.
This essential ecosystem connects to coastal mountain natural areas to the west and
provides a wildlife corridor and watershed buffer across eight miles of rolling hills and creeks.
This intact wilderness area provides many important ecosystem services within an urbanizing
metropolitan area that was home to an estimated 2.3 million people in 2013. Providing fresh water,
clean air and recreational opportunities are just a few of these precious ecosystem services.
In recent years, ecosystem services have come to be recognized as valuable, yet often
difficult to monetize or safeguard. There are four main classes of ecosystem services, and they are
all evident in Forest Park. Supporting services support basic ecological functions and sustain life.
Provisioning services provide materials and goods, including food and fiber. Regulating services
maintain stable ecological conditions over time. Cultural services include recreation, inspiration
and restorative time in nature.
We have reason to believe that little research has been done explicitly on Forest Park’s
ecosystem services. To help close this gap, Portland State University was asked by the Forest Park
Conservancy to design a focus group study and quantitative survey in order to gather data about
citizen’s awareness and understanding of the park’s ecosystem services. The project was

5 FOREST PARK ECOSYSTEMS SERVICES INVENTORY
5 | P a g e
implemented jointly by two classes, including a graduate level Economics of Sustainability (EC
522) course and a blended level Economics of Cost Benefit Analysis (EC 427/527) course.
This report contrasts and presents two distinct types of social science research. Focus
groups capture qualitative and conversational information, reflecting values, beliefs and attitudes
from group members participating in a collective and focused discussion. Quantitative survey data
reflect demographic data, opinions, values and behavior choices from self-reporting individuals.
We also conduct linear regression analyses to examine how responses to different questions relate
to one another. Alone, the survey does not render enough information to make properly informed
decisions for the future of Forest Park, but gives the reader strong supporting details to either set
a foundation or build on other findings.
Together, the report tries to create a cross-spectrum “snapshot” of perceptions and
awareness of ecosystem services and park challenges. Preliminary conclusions include a sustained
need for more research before any long-term policy is changed, particularly given that this is in a
fragile wilderness area. Many ongoing needs and opportunities are identified as well. There is a
great sense of pride in this nationally recognized park and a desire for increased stewardship and
more maintenance.
II. Ecosystem Services in Urban Parks
In recent years, increasing attention has been paid to the role ecological systems play in
creating and sustaining human well-being. Among other services, ecological systems purify air
and water, regulate temperature, provide food and raw materials, and offer unique recreational
experiences to visitors (Bateman, et al., n.d; Brown, Bergstrom & Loomis, 2007; de Groot, et al.,
2002; Dobbs, et al. 2011; Goulder & Kennedy, 1997; Hassan & Scholes, 2005; Jim & Chen, 2009;
McPherson et al., 1997; Trust for Public Lands, 2008; Tyrväinen, 2001). Although there is broad
agreement on how to categorize ecosystems services and a variety of estimating techniques
available, the process of valuing these services is still evolving.
Categories of Ecosystem Services
The Millennium Ecosystem Assessment (MA), which unites the work of more than 1,300
researchers from 95 countries, divides the human benefits derived from ecosystems into four types

6 FOREST PARK ECOSYSTEMS SERVICES INVENTORY
6 | P a g e
of “ecosystem services”: supporting, provisioning, regulating and cultural services (Hassan &
Scholes, 2005). Supporting services consist of the ecological functions that sustain all other
ecosystem services, namely “primary production, production of oxygen, and soil formation”
(Hassan and Scholes, 2005, p. 27). Provisioning services supply the material goods people receive
from ecosystems, including food, lumber, and clean water. Regulating services provide the stable
ecological conditions necessary to human well-being, such as climate regulation, clean air, erosion
prevention, and mitigation of diseases. Cultural services provide humans with intangible benefits,
such as clarity of mind, meditation, reflection, recreation, and the beauty of nature.
Valuing Ecosystem Services
To date, researchers attempting to estimate the dollar value of ecological assets have
employed four types of valuation techniques: revealed preference, stated preference, production
function, and replacement cost methods (Brown, Bergstrom & Loomis, 2007). Revealed
preference and stated preference methods estimate households’ willingness to pay for ecosystem
services that are not normally traded in markets (Brown, Bergstrom & Loomis, 2007). Willingness
to pay approximates value by measuring the dollar amount a household would give up in exchange
for access to an ecosystem or a particular ecosystem service. Revealed preference methods rely on
the behavior of households to estimate willingness to pay through realized costs. For example,
researchers may rely on time and travel cost expenses incurred in visiting a natural area as a
representation of the “price” of access. The method then uses these costs to deduce a minimum
willingness to pay for an individual.
In stated preference studies, individuals reveal their willingness to pay for continued access
to an ecosystem through surveys. This method, which includes contingent valuation and choice
experiments, is most commonly used to value environmental services (Tyrväinen, 2001). Stated
preference methods can be used to value “any good or service, real or imagined” (Brown,
Bergstrom & Loomis, 2007), but their validity is limited by individuals’ ability to accurately
estimate the utility gained from those goods and services.
Production function and replacement cost approaches are traditionally applied when
estimating the value of ecosystem goods and services that are traded in markets or possess close
substitutes that are traded in markets (Brown, Bergstrom & Loomis, 2007). Production function
methods value ecosystem goods and services by measuring their role as inputs for producers. For

7 FOREST PARK ECOSYSTEMS SERVICES INVENTORY
7 | P a g e
example, researchers may derive the value of a forest by determining its total yield of harvestable
timber. Replacement cost methods estimate the cost of restoring an ecosystem service if that
service were lost (Brown, Bergstrom & Loomis, 2007). One could value an ecosystem service
such as water purification by ascertaining the minimum cost of purifying, by other means, the
relevant water supply.
Estimates of the Values of Urban Forests and Ecosystem Services
A number of studies have found that urban forests provide valuable services to residents
and tourists (Bateman, et al., n.d.; Costanza et al., 2006; Dwyer et al., 1992; Jim & Chen, 2009;
McPherson et al., 1997; Trust for Public Lands, 2008; Tyrväinen, 2001). Using contingent
valuation to appraise two urban forests in Finland, Tyrväinen (2001) found that residents received
value equal to approximately 15,525 FIM (or $2935 US) per acre/year in the town of Johensuu,
and 7823 FIM (or $1479 US) per acre/year in Salo. Constanza et al. (2006) found similar estimates
while valuing New Jersey’s ecosystem services and natural capital. Based on studies of
comparable ecosystems services, Constanza et al. (2006) found that urban greenspace delivered
an annual value of $2,473 per acre in 2004 dollars. To give an idea of scale, this estimate, if it
could be applied to Forest Park, would value the park at $12,612,300 each year in 2004 dollars (or
$15,603,932 in 2015 dollars). Costanza et al. (2006) also observed that forests located close to a
river’s estuary zone contributed more to estuary water quality than forests further away.
Krieger (2001) emphasized the importance of forests for watersheds in terms of water
quality and quantity in his review of the economic values of forest ecosystem services for the
Wilderness Society. By his estimation, US forests as a whole contribute about
$64.16/year/household in improved water quality. All of Portland sits on five watersheds,
including the Columbia Slough, Fanno Creek, Tryon Creek, Johnson Creek and Willamette River.
Forest Park is situated within the largest Willamette River watershed that encompasses both east
and west sides of the city. Consequently, the value of water quality and quantity contributed by
Forest Park is especially relevant.
In a survey by the Trust for Public Lands (2008), city park land in Philadelphia was
estimated to reduce the cost of treating stormwater by almost $6 million per year. The survey also
estimated that the parks’ trees remove $1,534,188 in pollutants each year. These results are specific
to Philadelphia, and not enough information is given by the study to infer similar values for

8 FOREST PARK ECOSYSTEMS SERVICES INVENTORY
8 | P a g e
Portland or Forest Park, but these figures give a sense of the magnitude of these ecosystem service
values.
Investing in Forest Park
Langemeyer et al. (2014) identified a trade-off between “place value,” the sense of place
and social cohesion produced by a green space, and management intensity. In this context,
wilderness "place values" mean the sense of being in nature and of being away from modern human
developments. While place values are reduced by a higher degree of management, tourism values
increase when cultural facilities are embedded in a green space. Furthermore, Majumdar (2011)
found that in Savannah, Georgia, urban forests and green spaces provide tourists $62-$117 million
per year in consumer surplus (a critical economic measure of total value). He concludes that urban
forest resources play an “increasingly important role in attracting tourists to urban areas by
enhancing the beauty of cities and working as a complement of other urban attractions” (2011, p.
79). In the case of Forest Park, these results suggest that a visitor center that added cultural
ecosystem services to the current ones would add value in terms of attracting more tourism.
However, because a visitor center would entail more management intensity, such additional
tourism might come at the expense of deep place values, which are more difficult to quantify.
These place values can also be thought of as passive use values, such as existence, option
and bequest values. As will be discussed below, many park users gain meaning and utility just
from knowing that Forest Park exists and is protected both as a wilderness habitat and urban park
available to future generations. According to Loomis et al. (1999), such values may even exceed
the value of actual wilderness experiences.
Previous research has suggested that place values differ among park users, and that a
majority of wilderness users do not seek isolation but ‘being alone together’ with members of
one’s group. As Sharpe and Ewert (2000) stated, “it appears that people do desire social interaction
in wilderness” (p. 219). Their notion of place attachment extended this assertion, describing
visitors as ‘place-oriented,’ social or activity-oriented visitors. Sharpe & Ewert (2000) observed
that park users with higher levels of place attachment are both more likely to make personal choices
to protect their chosen environment and to respond negatively to alterations to park habitat and
aesthetics or even the presence of other visitors. This has implications for how any change in
management intensity would be perceived by residents with a wide range of viewpoints and

9 FOREST PARK ECOSYSTEMS SERVICES INVENTORY
9 | P a g e
experiences in Forest Park. The research reviewed would suggest that a well-designed interpretive
center within an urban area could become a prominent meeting place and focal point, which could
facilitate more social and cultural ecosystem services than it would take away from other
ecosystem services throughout the rest of the park.
III. Study Approach
Basis for Focus Group Approach
As part of the Forest Park Ecosystem Service Valuation Project, we conducted four focus
groups in different neighborhoods within the Portland metropolitan area. A review of the literature
indicates that focus groups are an accepted methodology for gaining insight into cultural norms
and values, with clear best practices for achieving valid results. These best practices have helped
to guide our own data collection, and are summarized in the following section.
Most best practices for creating and facilitating focus groups were established in the
academic literature in the late twentieth century and have seen little change. The first step in a
successful focus group is to determine whether it is the best approach for gathering the desired
data. Focus groups possess notable limitations when compared to detailed interviews or data rich
survey methods. Sample sizes are rarely large enough to draw inferences about larger populations,
and thus the qualitative information generated could differ drastically in content from group to
group in the same study. Despite these limitations, focus groups are generally an effective method
for exploring a topic about which little is known and not many studies have taken place. They can
be particularly useful during the early phases of a research process in order to develop hypotheses
that can then be tested or help researchers understand local opinions, beliefs, and attitudes toward
a particular issue. Focus groups can also be used by organizations as a way to develop connections
with a local community.
The process of arranging a focus group is fairly straightforward and can be distilled into
several steps (Simon, 1999). The first is to determine the stated purpose of the focus group,
ensuring that discussion prompts address the topic at hand and that the information collected will
adequately capture the subject of interest. Once these components have been determined,
organizers should establish a timeline, then identify and invite participants. Identifying desirable
attributes and key stakeholder groups in accordance with the stated purpose of the project will help

10 FOREST PARK ECOSYSTEMS SERVICES INVENTORY
10 | P a g e
ensure that the right individuals are invited to participate. The next steps are then generating a list
of questions, choosing a location or locations, creating a script for the focus group and selecting a
facilitator or facilitators.
Appointing a facilitator from outside of the organization is preferable, as it ensures greater
objectivity. It is also important to adequately train all staff assisting with the focus group. When
choosing the location and the facilitator, best practices advocate finding settings that will make the
participants feel most comfortable, though this will vary for every focus group. General consensus
deems that focus groups should last between one and two hours, allocating no longer than 20
minutes for discussion of each topic. When conducting the focus group, facilitators should
establish ground rules, stress confidentiality and continuously work to build trust. Facilitators
should use non-directive prompts, aiming for a “low-control, high-process” style, while ensuring
that discussion thoroughly covers relevant issues (McLafferty, 2004, p. 192). Facilitators should
strive for good conversation on “warm, but not hot” (i.e. private) matters, focusing on research
areas, considering alternatives, and avoiding bias (Grudens-Schuck, Allen & Larson, 2004, p. 4).
Group dynamics may encourage self-disclosure, spontaneous discussion and expression of
local perspectives. On the other hand, social norms may preclude complete honesty, dissenting
voices, or the gathering of individual content knowledge in group settings (Grudens-Schuck, Allen
& Larson, 2004). Sensitive or controversial topics may not be addressed due to the power of social
norms and etiquette. It is also useful to note that differences in status, income, power or personal
characteristics may cause individuals to censor their ideas (Grudens-Schuck, Allen & Larson,
2004).
Focus group topics related to natural resource use and stewardship may include ownership,
access, safety and risk perception, cost, wilderness ethics, management practices, political
opinions (including pro and anti-preservation or science) and equity (including gender, race and
class differences). Previous ecosystem value research has indicated that groups may generate
‘groupthink’ and more comments about general problems, cultural or aesthetic factors,
consumptive services and potential solutions (Kaplowitz & Hoehn, 2001).
Group interactions, including cross-dialogue and non-verbal behavior are as important to
gather as verbal transcripts, partly because this data may give researchers greater ‘theoretical
sensitivity’ about what is important, and the potential generalizability of group results (Duggleby,

11 FOREST PARK ECOSYSTEMS SERVICES INVENTORY
11 | P a g e
2005, p. 838). Ultimately, focus groups help to reflect social realities through direct access to
participant language, gestures and experiential concepts (McLafferty, 2004).
In order to produce the best results, focus groups should aim to achieve two main goals:
facilitating interaction among participants and maximizing the collection of high quality
information (Acocella, 2011). In fact, the virtue of the focus group as a tool is its ability to generate
data based on the synergy of the group interaction. Krueger (1994) believes rich data can only be
generated if individuals in the group are prepared to engage fully in the discussion and, for this
reason, advocates the use of a homogenous group (Rabiee, 2004).
To ensure accuracy of the information collected, all focus group interviews are recorded
on audiotape or other recording devices. It is important to note that, after recording the interviews,
each group investigates the reliability and validity of the data by conducting a team debriefing.
During this process, the successes and failures of the interview are juxtaposed in order to identify
any analysis issues.
Another benefit of focus groups is that they provide an opportunity for the sponsoring
organization to show responsiveness and accountability. Valuable positive and negative feedback
reported in the focus group process can potentially be incorporated into future best practices
(McLafferty, 2004). For example, forest ecosystem services may be better experienced, supported
and preserved as an irreplaceable ‘community forest’ which, as one British focus group participant
stated, “should be forests for the whole community” (italics added) (Burgess, 1996, p. 134). With
regard to the Forest Park project, we feel that the focus group process was enlightening and
invaluable in generating a more in-depth understanding of the uses and value of Forest Park.
Methodology
Participants were invited to attend one of four focus groups held in different neighborhoods
within the Portland Metro area. Some were offered an incentive (a $10-$25 gift card to local
markets and restaurants). Participants were told the purpose of the research and made aware that
complete anonymity could not be guaranteed due to the public nature of the focus groups, though
no one's individual comments or survey responses would be used to identify individual
perspectives, and the purpose of the focus group was to understand the perceptions of the entire
group. They were then asked to provide oral consent to participate (and anyone who chose not to

12 FOREST PARK ECOSYSTEMS SERVICES INVENTORY
12 | P a g e
participate received the incentive and was excused), followed by a series of open-ended questions
while researchers collected field notes based on the group discussions. The questions that
facilitators asked participants were semi-structured and iterative in that they were adjusted based
on participants' responses to earlier questions and the discretion of the facilitator to encourage a
robust and respectful discussion.
To supplement the qualitative data captured in focus group discussions, we also asked
participants to complete a survey. The content of the survey was developed by faculty at Portland
State University in conjunction with Forest Park Conservancy, and included a combination of
multiple choice and write-in responses. The survey was designed to be anonymous; no questions
that would provide identifying information were included. Additionally, respondents were allowed
to opt out of answering all questions. A blank survey can be found in Appendix A. The survey was
comprised of 30 questions, including questions related to:
Frequency of visits to Forest Park
Convenience of access to Forest Park
Recreational activities done while in the Park
General participation in outdoor recreational activities
Use of possible new interpretive center
Select demographic information about the respondent and their household
These surveys were administered following each of our four focus group sessions. Due to
time constraints, surveys collected at the fourth focus group are not included in this analysis, but
will be made available to Forest Park Conservancy for further study. Focus group staff gave paper
copies of the questionnaire directly to participants, who filled them out before leaving the focus
group session. Focus group facilitators provided background on the purpose of the project and
contents of the survey to each participant prior to disseminating the survey. A Spanish translator
was made available to one non-native English speaker during the focus group and survey.
Our intention in collecting this survey data was to capture a more quantifiable
representation of participants’ values and uses related to Forest Park. Survey responses were
encoded into numerical data using the key provided in Appendix B. We then compiled and entered
all of the data into Excel in order to run descriptive statistics that would allow us to see specific
patterns in values and uses across participant groups.

13 FOREST PARK ECOSYSTEMS SERVICES INVENTORY
13 | P a g e
In addition to identifying basic patterns in responses, we also sought to isolate what we
considered to be interesting associations between responses to particular questions. In order to
ascertain the direction and magnitude of these associations, we performed six regression analyses.
These are statistical tests that examine a relationship between two or more variables. A regression
plots individual points (in this case, an individual’s responses to two questions) and attempts to
characterize this relationship as a function that can then be used to predict one variable based on
knowledge of another. Additional information is also generated describing the strength of the
relationship between these variables. We were interested in five possible relationships:
1. Is there a relationship between the timing of respondents’ last visit and their annual
frequency of visits to Forest Park?
2. Is there a relationship between how often respondents participate in general outdoor
recreation activities and how often they visit Forest Park?
3. Is there a relationship between number of visits made to all parks in the city and the number
of visits made to Forest Park in the past year?
4. Is there a relationship between how long it takes respondents to get to Forest Park and how
frequently they visited in the last year?
5. Is there a relationship between how difficult it is to get to Forest Park and the frequency
they visited in the past year?
6. Is there a relationship between how long people spend in Forest Park and how long they
spend in other parks?
While many best practices described above were incorporated into the Forest Park focus
group process, there were several major differences in these groups as compared to typical studies.
None of the groups were audio or video taped in an effort to ensure confidentiality. Additionally,
though teams did not conduct post-group team debriefs due to time constraints, all contributors to
the focus group analysis were convened before the focus group data were synthesized. All focus
groups conducted were heterogeneous by design, as there was no effort to find participants with
demographic similarities, other than area of residence.
IV. Survey Data Analysis
Characterization of Survey Respondents
Out of a total of 33 complete surveys, only 26 were analyzed. We should note that this
constitutes an especially small sample size. Additionally, since survey participants were recruited
from specific neighborhoods, the sample population is only a narrow representation of the Portland

14 FOREST PARK ECOSYSTEMS SERVICES INVENTORY
14 | P a g e
population as a whole. Results are therefore best viewed as indicative of what more in-depth
analysis is likely to reveal.
The figure below depicts the extent of neighborhood representation, which varies visibly
across focus groups; most notably, the Linnton neighborhood focus group hosted twice as many
participants as did the South of Market (SoMa) focus group. This limitation should be noted when
interpreting the survey results and subsequent regression analysis.
Focus Group Location Date and Time Number of
Respondents
Linnton Linnton Community Center Feb 5th, 6:15-7:30 12
South of Market
(SoMa)
Portland State University Feb 10th, 6:00-7:30 6
Lents Bellrose Station Apartments
Community Room
Feb 12th, 6:00-7:30 8
Inner NE Matt Dishman Community
Center
Feb 25th, 7:15 - 8:45 7
Last Visit to the Park
There were 26 survey respondents and 96% had visited Forest Park prior to the study. 62% of all
respondents had visited within the last week. The second largest group of respondents (12%) had
visited Forest Park within the last 6 months. These data confirm that the majority of respondents
had some recent experience with Forest Park.

15 FOREST PARK ECOSYSTEMS SERVICES INVENTORY
15 | P a g e
Frequency of Park Visits
Our survey results indicate that
76% of respondents visited the park 1
or more times a month during the
previous year. Respondents who
reported visiting monthly constituted
36% of total respondents. These results
suggest that a majority of participants
were not only capable of drawing on
recent experience, but from fairly
regular interactions with Forest Park.

16 FOREST PARK ECOSYSTEMS SERVICES INVENTORY
16 | P a g e
Time Spent in Forest Park
The most common duration reported for an average visit to Forest Park was ‘2-3 hours’,
chosen by 38% of respondents. A majority of respondents (69%) could be characterized as
spending between 1 and 3 hours in the park. Given the size of Forest Park and its trails alone, the
relative brevity of the average visit might suggest a preference for certain modes of transportation
(e.g. biking or running as opposed to walking or hiking).
Typical Recreational Activity
Most respondents reported hiking or walking during their visits to Forest Park. Exactly half
of all respondents (13 individuals) indicated that they went bird watching, and as many individuals
also reported that they had engaged in an activity that was not specifically listed in the survey
question. Over a quarter of respondents reported running in Forest Park, with as many individuals
also noting that they bring dogs with them during their visits. When taken with the results to the
previous survey question, these results might suggest that most participants in this study likely
spend a majority of their time traversing relatively small areas of Forest Park during their average
visit. However, our limited insight into these “other” reported activities prohibits us from
confidently making such an assertion.

17 FOREST PARK ECOSYSTEMS SERVICES INVENTORY
17 | P a g e
Use of Other Parks
When asked how much time respondents spent on average during visits to other parks,
most reported between 1 and 2 hours. The main difference in time spent in other parks in
comparison to Forest Park is a larger number of respondents spend under 30 minutes in other parks.
46% of respondents spend an hour or less on average in other parks. These findings suggest that
activities in Forest Park are viewed as distinct from activities undertaken in other urban parks.

18 FOREST PARK ECOSYSTEMS SERVICES INVENTORY
18 | P a g e
Transportation
The majority of respondents (64%) reported driving a car to Forest Park. The second most
common mode of transportation reported was walking (24%). Only one participant in the entire
study used TriMet to reach the park.

19 FOREST PARK ECOSYSTEMS SERVICES INVENTORY
19 | P a g e
Participants were also asked if they owned a car and whether they believed public transit
was a convenient mode of transportation for them. Again, a majority of respondents (69%)
reported owning a car, though one individual did not typically rely on it to access Forest park. A
reported 54% of participants further indicated that using TriMet to access the park would not be
convenient for them.
These results indicate that, with exception of those respondents who live within walking
distance to Forest Park, the majority of participants in our study share a similar experience in
accessing Forest Park. Unfortunately, these results also prevent us from gaining equal insight into
the experience of users who must rely on public transportation to access the park. This could also
indicate constraints that exist with respect to capturing the views of key demographic groups.
Respondent Outdoor activities
When asked how often participants engage in outdoor recreational activities, 40% indicated they
are active outdoors on a daily basis, with 76% of respondents saying they participate in outdoor
recreational activities at least once a week.

20 FOREST PARK ECOSYSTEMS SERVICES INVENTORY
20 | P a g e
When asked a follow-up question regarding what activities they participate in, the most popular
activities were walking (96%) and hiking (84%). Both these activities are the most common
activities that occur within Forest Park.
Overall City Park Use
When asked to report their total park use in the past year, an appreciable number of
participants reported 16 visits or more. A simple majority (57%) visited city parks 10 times or
more. Based on these findings, questions of a similar nature that are posed to future samples should
group lower values together into a selection of ‘1-3’ instead of separating these choices. In
addition, more options for higher values might be considered.

21 FOREST PARK ECOSYSTEMS SERVICES INVENTORY
21 | P a g e
Questions Related to an Interpretive Center
When asked if respondents would use the proposed interpretive center, two individuals
declined to respond. Of those participants who did respond, 50% replied ‘yes’ and the other 50%
said ‘no.’

22 FOREST PARK ECOSYSTEMS SERVICES INVENTORY
22 | P a g e
When further asked whether participants thought their friends and neighbors would use
such a center, the results perfectly mirrored responses to the previous question. This could be
interpreted as individuals believing that those around them also hold their beliefs.
Of the respondents who reported that they would visit an interpretive center, 16% visited
Forest Park at least once a week, 33% reported visiting the park monthly, 25% visited twice a year,
and 17% had never visited before. Of the same respondents, 75% traveled to Forest Park by car,
with the average travel time among them being 28 minutes.
Demographics
After being asked general questions about Forest Park, participants were asked a series of
demographic identifier questions. The following figures illustrate those demographics that we
found to be most significant to our results. Some demographic divisions, such as location of
respondents’ residence, are not as prominently highlighted in this section because they are a result
of the study design itself. Other information, such as whether respondents owned a car, is already
reflected in responses to other questions. Additional summary tables are available in Appendix C.
Do you think your friends and
neighbors would use the visitors’
center?

23 FOREST PARK ECOSYSTEMS SERVICES INVENTORY
23 | P a g e
Important patterns to note in these responses relate to the relative absence of certain
demographic groups. According to our survey results, participants were mostly female (62%), not-
retired (65%) and/or employed (73%), and have resided in the Portland area for over 5 years.
Nearly 60% of respondents were 50 years of age or older, while 19% were 30 years or younger.

24 FOREST PARK ECOSYSTEMS SERVICES INVENTORY
24 | P a g e
Study participants overwhelmingly represented households of one or two individuals
(69%), though it is unclear whether respondents were single, married or had children. A majority
of respondents (73%) had earned at least a bachelor’s degree; 23% of respondents had received
some post-secondary education and only 4% had not received their high school diploma.

25 FOREST PARK ECOSYSTEMS SERVICES INVENTORY
25 | P a g e
Approximate annual incomes seemed evenly distributed across ranges provided, though
we did not distinguish between individual and household income. It is important to note the extent
to which these demographics reflect those of Portland’s population. Some statistics, such as
household size and post-secondary education, could be viewed as consistent with recent census
data; in 2010, the average household consisted of 2.31 individuals and over 90% of individuals
possessed at least a high school diploma. Nonetheless, some underrepresented groups in this study,
such as employed persons under the age of 50, could be thought of as an important demographic
in capturing a representative sample population.
Regression Analysis
Question #1: Is there a relationship between the timing of respondents’ last visit and their
annual frequency of visits to Forest Park?
In this case, we did find significance, with a truncated p-value of .000. The R value, which
indicates the strength of the relationship was .759, showing a strong positive relationship. The R
square value, which gives the amount of shared variance and provides much of the predictive value
is .576. The intercept value was 3.127, with a slope of .675. This suggests that the same individuals

26 FOREST PARK ECOSYSTEMS SERVICES INVENTORY
26 | P a g e
who visited Forest Park recently were likely to have visited the park more regularly over the course
of the past year.
Model Summary
Model R R Square
Adjusted R
Square
Std. Error of
the Estimate
1 .759a .576 .557 1.151
a. Predictors: (Constant), When was your last visit to Forest
Park?
Coefficientsa
Model
Unstandardized Coefficients
Standardized
Coefficients
t Sig. B Std. Error Beta
1 (Constant) 3.127 .355 8.798 .000
When was your last
visit to Forest Park? .675 .121 .759 5.585 .000
a. Dependent Variable: How regularly did you visit the park in the last year?
Question #2: Is there a relationship between how often respondents participate in general
outdoor recreation activities and how often they visit Forest Park?
In this case, the test found significance, with a p-value of .004. The R-value, which
indicates the strength of the relationship was .549, showing a moderate positive relationship. The
R square value, which gives the amount of shared variance and provides much of the predictive
value is .301. The intercept value was 3.155, with a slope of .589. This confirms that individuals
who participate in general outdoor recreation activities on a more regularly are likely to visit Forest
Park more frequently.
Model Summary
Model R R Square
Adjusted R
Square
Std. Error of
the Estimate
1 .549a .301 .271 1.477
a. Predictors: (Constant), How often do you participate in outdoor
recreation activities?
Coefficientsa
Model
Unstandardized Coefficients
Standardized
Coefficients
t Sig. B Std. Error Beta

27 FOREST PARK ECOSYSTEMS SERVICES INVENTORY
27 | P a g e
1 (Constant) 3.155 .556 5.670 .000
How often do you
participate in outdoor
recreation activities?
.589 .187 .549 3.149 .004
a. Dependent Variable: How regularly did you visit the park in the last year?
Question #3: Is there a relationship between number of visits made to all parks in the city
and the number of visits made to Forest Park in the past year?
A regression test did not find a significant association between these two variables.
Question #4: Is there a relationship between how long it takes respondents to get to Forest
Park and how frequently people visited in the last year?
In this case, our regression test did find significance, with a p-value of .004. The R value
was .564, showing a moderate positive relationship. The R-square value, which gives the amount
of shared variance and provides much of the predictive value, is .318. The intercept value was
2.068, with a slope of .531. These results indicate that the longer it takes an individual to get to
Forest Park, the less likely they are to visit regularly.
Model Summary
Model R R Square
Adjusted R
Square Std. Error of the Estimate
1 .564a .318 .287 1.363
a. Predictors: (Constant), How much time does it take you to travel to Forest Park?
Coefficientsa
Model
Unstandardized
Coefficients
Standardized
Coefficients
t Sig. B
Std.
Error Beta
1 (Constant) 2.068 .808 2.558 .018
How much time does it take
you to travel to Forest Park? .531 .166 .564 3.206 .004
a. Dependent Variable: How regularly did you visit the park in the last year?
Question #5: Is there a relationship between how difficult it is to get to Forest Park and the
frequency people visited in the past year?
This test also found a significant relationship, generating a p-value of .018. The R value,
was .468, again showing a moderate positive relationship. The R-square value is .219. The

28 FOREST PARK ECOSYSTEMS SERVICES INVENTORY
28 | P a g e
intercept value was 2.720, with a slope of 1.549. This expands on the results of the previous
regression in associating greater difficulty in accessing Forest Park with fewer visits.
Model Summary
Model R R Square
Adjusted R
Square
Std. Error of the
Estimate
1 .468a .219 .185 1.561
a. Predictors: (Constant), How difficult is transportation for you to
Forest Park?
Coefficientsa
Model
Unstandardized Coefficients
Standardized
Coefficients
t Sig. B Std. Error Beta
1 (Constant) 2.720 .818 3.326 .003
How difficult is
transportation for you to
Forest Park?
1.549 .609 .468 2.542 .018
a. Dependent Variable: How regularly did you visit the park in the last year?
Question #6: Is there a relationship between how long people spend in Forest Park and how
long they spend in other parks?
A regression test did not find a significant association between these two variables.
V. Focus Group Analysis
The following section provides a summary of the discussions held during the course of all
four focus groups. It is intended to highlight patterns observed and is not a complete registry of
individual participant responses. We provide a sample of quotes in Appendix D for additional
reference.
Uses & Perceptions
All of the participants in this study expressed positive perceptions regarding Forest Park.
Most of the views that were expressed were directly related to recreational activities. Several
individuals in the Lents group claimed that they were unaware of any non-recreational services
provided by the park, though the group collectively identified several in their discussion. Similarly,

29 FOREST PARK ECOSYSTEMS SERVICES INVENTORY
29 | P a g e
perceptions held within the SoMa group were
communicated almost exclusively in the context of
recreational experiences.
The most commonly reported uses included
walking, hiking, running, and mountain biking. All SoMa
participants and most Lents participants identified as
hikers or walkers. The Inner NE group was composed
equally of hikers and mountain bikers. Both Inner NE
and Linnton participants were able to cite much broader
range of uses that included meditation, horse riding, bird watching, research, as well as educational
and conservation-related activities. Participants in all groups also noted that they regularly brought
out-of-town visitors to the park. Participants reported benefits of recreating in Forest Park ranging
from physical fitness, to spiritual and mental relaxation, to cultural or environmental awareness.
Participants also identified a number of favorable attributes specifically associated with Forest
Park. Chief among these positive features was the close proximity and easy accessibility to
wilderness, as well as the beauty and tranquility of the park itself. Lents participants praised Forest
Park’s proximity to other attractions, such as the Japanese Garden.
Most participants were also able to identify negative characteristics associated with their
recreational experiences in Forest Park. The most
commonly expressed hindrances were related to
accessing and sharing trails. Inadequate signage both
within and outside the park was a consistent issue
throughout all focus group discussions. Several Lents
participants believed that the park lacks sufficient
advertising, claiming that not enough people know
about it. Some SoMa participants stated that Forest Park
either lacked adequate access, adequate signage, or
both, especially when approaching from downtown.
Many other participants defended the current
accessibility to Forest Park, but conceded that some
Focus Group Quote
“I wonder also about the
clarity or frequency of
trail markers, I saw lots of
people who were
confused about where
they were going. Clarity
in particular is an issue.”
-SoMa group
Focus Group Quote
“There are a lot of trail
runners. [They] can be
disruptive – especially in
mud – to the people who
are walking or hiking.”
- Lents Group

30 FOREST PARK ECOSYSTEMS SERVICES INVENTORY
30 | P a g e
access points were not well marked. The general consensus across focus groups was that quality
of trail signage is poor, citing the Wildwood trail as the only notable exception. Many Lents
participants noted that the park's size could be overwhelming to new users and that a lack of
signage might discourage visitors. Some female participants expressed feeling unsafe as a result
of not being able to easily navigate within the park.
Participants from all but the SoMa group reported experiencing or witnessing some conflict
between user groups. Lents participants identified trail runners and dog-owners as disruptive to
non-runners, suggesting special-use trail designations and off-leash dog parks as possible
solutions. Many individuals also reported a need for increased stroller access. Linnton participants
expressed concern that the park is now less conducive to equestrian activities as a result of less
available parking and fewer safe trails. They were apprehensive about the mounting requests for
additional mountain biking and mixed-use trails. Inner NE participants believed that more trails
should be designated as single-use, or that multiple-use trails should provide better signage to
mitigate conflicts between bikers and hikers. Both the Lents and Inner NE groups cited off-leash
dogs as a source of conflict as well.
For some individuals, a perceived paucity of park maintenance extended to provision of
basic amenities and services. Inner NE participants emphasized a need to provide visitors with
easily accessible water, toilets, and limited mobility access. Both Inner NE and Lents groups
articulated a concern about English ivy and other invasive species, stating that it was
compromising the health of the park. Similarly, SoMa participants felt that a stronger effort to
reduce litter was necessary, specifically energy packets, plastic water bottles, and bagged dog
waste.
Ecosystem Services & Existence Value
Participants in all four groups were able to acknowledge the value of Forest Park’s
existence as separate from the direct benefits they derived through recreation. Many participants
in Lents and Inner NE agreed that the park held importance regardless of whether they visited it
or not. The same participants identified the park as either a Portland landmark or a source of pride
for the city. Some participants were able to identify indirect benefits or ecosystem services, most

31 FOREST PARK ECOSYSTEMS SERVICES INVENTORY
31 | P a g e
notably wilderness habitat, carbon sequestration and
water filtration. Inner NE and Linnton participants
were able to offer a deeper ecological lens to their
discussion than the SoMa and Lents groups. Linnton
participants demonstrated an especially high ability to
draw on a deeper and more intimate awareness of the
park than any other group. This is likely the result of
both their close proximity and connections to the
park. Individuals cited a range of ecosystem assets,
including biodiversity, storm water retention and air filtration, in addition to its existence value
within the region.
Interpretive Center
We observed a moderate split in opinion over the
value of an interpretive center. Infrequent users in the
SoMa group agreed that an interpretive center would be
especially useful to first-time and inexperienced visitors.
Most the participants in the Lents group agreed with this
perspective, further stating that they would also be highly
motivated to visit Forest Park if such a center existed.
Similarly, individuals in the inner NE group felt that an interpretive center would positively
impact their current use of the park while also drawing new users. Participants in the Linnton group
collectively vocalized strong opposition to an interpretive center, while frequent users in the SoMa
group reported being more disinterested than opposed to the proposal.
Supporters identified a number of relevant services that a center could provide. Maps and
other informational resources regarding trails were the most commonly mentioned set of amenities,
followed by toilets and water fountains. Supporters added that such amenities should be made
available throughout the park. Participants in all focus groups agreed that a center would possess
high educational value as well. Most individuals mentioned students as an important target
audience, and suggested pairing the center with outdoor education programs for inner-city schools.
Focus Group Quote
“Even if I never went to Forest
Park again, I think it would
absolutely still be valuable. It’s
part of what makes Portland
Portland. I knew about it before I
moved here.”
- Inner NE group
Focus Group Quote
“Why put all your eggs in
one basket?”
- Linnton group

32 FOREST PARK ECOSYSTEMS SERVICES INVENTORY
32 | P a g e
Many supporters cited the need for informational
materials that promoted ecological awareness and
stewardship practices. One participant mentioned the
possibility of guided tours and night walks, as well as
‘unobtrusive’ trail lights for safer walking in the evening,
though another participant felt that any lighting would
ruin the ambiance of the park. Individuals in the Inner NE
group advocated for promoting responsible recreation
ethics, such as Leave No Trace, and leveraging volunteer
resources to monitor and remove invasive species.
Participants in the Lents group suggested a focus on
highlighting native flora and fauna. Inner NE and
Linnton participants acknowledged the political and
financial value in raising awareness around Forest Park’s
key ecosystem services and the need to conserve them.
Despite showing general support, the SoMa, Lents and Inner NE groups expressed mixed
feelings about locating the interpretive center near the Northwest industrial area and Route 30,
especially with regard to accessibility. SoMa Participants who did not own a car felt that the area
was out of the way. On the other hand, Inner NE participants felt that the proposed location was
ideal and would not exacerbate existing access challenges. Lents participants suggested and agreed
that a shuttle bus operating between park access points would be useful, especially for day hikers
who might normally travel in two cars.
The position of the Linnton group was that many of the aforementioned services, while
worthwhile, did not require an interpretive center. They noted that the Audubon Society currently
provides many of the same services an interpretive center would offer and that scarce funds would
be better spent on expanding their capacity while improving amenities and basic maintenance
throughout the park. They also suggested that a mobile phone platform might be a preferable
medium for delivering informational services. This idea was also raised in the Lents and Inner NE
groups as a potential alternative or supplement to an interpretive center.
Focus Group Quote
“I definitely think a
visitor center would
improve my experience. It
could help new people use
the park, but education
would need to be a big
part of it. People need to
know that it’s there and
what it can offer them.”
- Inner NE group

33 FOREST PARK ECOSYSTEMS SERVICES INVENTORY
33 | P a g e
It should be noted that the Linnton group did not express absolute opposition to the visitor
center, but rather an overwhelming view that resources should not be spent on an interpretive
center at present. Further, many individuals in this group mentioned that the Forest Park Natural
Resources Management Plan (FPNRMP) supports the development of interpretive facilities much
further in the future. They also noted that fundamental scientific studies have not been conducted
that would help establish a baseline for forest health and set goals for mitigating impact from
increased recreational use.
VII. Preliminary Conclusions
The concept of ‘community forests’ introduced in the focus group literature section furthers
the idea that Forest Park is not only an urban natural wilderness area offering many ecosystem
services, but is also a precious asset for a wider community. This is important when considering
that community members have diverse needs, place attachments, outdoor savvy, and familiarity
with the park. This socio-economic-cultural lens may help to inform future resource management,
planning and partner messaging within Portland’s various communities.
Certain focus group results may partially reflect prevailing social norms about Forest Park
usage and understanding of ecosystem services. Our survey results indicate that many participants
share very similar experiences with regard to how they use the park. Despite this, focus group
results revealed a variety of levels of awareness of park ecosystem services (from none to high),
and general intrinsic appreciation for the park. There is considerable difference of opinion on
whether an interpretive center is a good use of limited resources, and whether locating the center
in the Northwest industrial area is a good idea. However, there was more consensus around the
park’s biggest challenges, which include accessing and sharing trails, inadequate signage and
maps, park advertising, safety, conflicts between users, and maintenance issues, especially litter
and invasive species.
More research is needed to understand how outreach materials, current resource conditions,
access and visual prompts affect public perceptions and expectations of park experiences.
Understanding these variables may help Portland Parks and Recreation, as well as the Forest Park
Conservancy, plan for future program and capital needs, including additional visitor services staff,
habitat restoration, and/or a new interpretive center. Cultivating a more representative and

34 FOREST PARK ECOSYSTEMS SERVICES INVENTORY
34 | P a g e
informed base of park users and supporters may not only increase the benevolent presence of
recreational users, but also leverage political will and financial resources for much needed
preservation activities.
Survey results generated from such a small sample size as ours cannot provide enough data
to make definitive conclusions, but may build on other findings. Although Forest Park is a
wilderness park, many users visit the park for just several hours. Survey data indicate that a
majority visit for less than 3 hours. A more extensive survey of recreationists was published in
2012, the results of which should be compared against these preliminary findings. It is possible
that this indicates people’s limited recreation time and/or knowledge about less popular trails. It
may also indicate there is untapped market demand for more guided wilderness hikes and group
interpretive activities that would more fully engage stakeholders for longer periods of time, tap
into users’ desire for social interactions and attract new users.
Though issues of access to the park surfaced consistently throughout this study, we were
unable to capture the views of a key demographic - TriMet users. Participants in the study indicate
that they might use TriMet to access the park if a convenient route for them was established, but
it cannot be assumed so or determined based on the data. Our feedback regarding parking and
crowding issues indicate that diverting drivers toward public transit would be desirable, but would
likely require more than one route. Issues of representation notwithstanding, the fact that most
participants share a similar transportation experience might allow us to turn to other factors in
explaining differences in visitation rates. Nonetheless, more research is needed about
transportation access to the park and any prospective interpretive center location.
Recent research has advocated for cost-effective community engagement and access
improvements for public green spaces because “given the health outcomes that nature can deliver,
inequalities in access and use could exacerbate social disadvantage” (Shanahan et al. 2015). With
more focused research, social marketing programs could be implemented to raise awareness and
then eventually change behaviors concerning Forest Park’s ecosystem, participation, recreational
ethics, and place values. A detailed review of how different visitor resource management
approaches affect their usage and place values might be a good place to begin. Exploring planning
and funding opportunities to increase educational opportunities, with or without an interpretive
center, is the next logical step.

35 FOREST PARK ECOSYSTEMS SERVICES INVENTORY
35 | P a g e
It is clear from the results of this study that continuing to emphasize connections between
ecosystem services, urban recreation and human health benefits will both resonate with current
users of Forest Park and generate additional value. Popular ideas such as using mobile phone
platforms as a ‘virtual interpretive center’ for wildlife recognition, educational or navigational
purposes that may also improve equity and build cultural competency, should also be further
explored. Increasing awareness is, however, just the first step. Deeper public engagement might
include following safety and wilderness rules, joining an ivy removal volunteer event, learning
how to identify birds, deciding to hike all of the trails, or donating to Forest Park Conservancy to
support trails maintenance.
REFERENCES
Acocella, I. (2012). The focus groups in social research: advantages and disadvantages. Quality &
Quantity – International Journal of Methodology, 46 (4), 1125-1136.
Bateman, I., Mace, G., Fezzi, C., Atkinson, G., & Turner, K. (n.d.). Economic analysis for
ecosystem service assessments. Environmental and Resource Economics, 177-218.
Brown, T., Bergstrom, J., & Loomis, J. (2007). Defining, valuing, and providing ecosystem goods
and services. Natural Resources Journal, 47, 329-377.
Burgess, J. (1996). Focusing on fear: The use of focus groups in a project for the Community
Forest Unit, Countryside Commission, UK. Area, 28, (2), 130-135.
Costanza, R., Wilson, M. A., Troy, A., Voinov, A., Liu, S., & D'Agostino, J. (2006). The value of
New Jersey's ecosystem services and natural capital. New Jersey Department of
Environmental Protection.
de Groot, R., Wilson, M., & Boumans, R. (2002). A typology for the classification, description
and valuation of ecosystem functions, goods and services. Ecological Economics, 393-408.
Dobbs, C., Escobedo, F., & Zipperer, W. (2011). A framework for developing urban forest
ecosystem services and goods indicators. Landscape and Urban Planning, 196-206.
Duggleby, W. (2005). What about focus group interaction data? Qualitative Health Research,
15(6), 832-840.
Dwyer, J., McPherson, E., Schroeder, H., & Rowntree, R. (1992). Assessing the benefits and costs
of the urban forest. Journal of Arboriculture, 227-234.
Goulder, L.H., & Kennedy, D. (1997). Valuing ecosystem services: #3 - philosophical bases and
empirical methods. In G.C. Daily (Ed.), Nature's Services: Societal Dependence on
Natural Ecosystems (23-48). Washington, DC: Island.
Grudens-Schuck, N.; Allen, B.L & Larson, K. (2004). Methodology brief: Focus Group
Fundamentals. Extension Community and Economic Development Publications. Book 12.
Hassan, R., & Scholes, R. (2005). Ecosystems and human well-being: Current state and trends:
Findings of the Condition and Trends Working Group of the Millennium Ecosystem
Assessment. Washington, DC: Island Press.

36 FOREST PARK ECOSYSTEMS SERVICES INVENTORY
36 | P a g e
Jim, C., & Chen, W. (2009). Ecosystem services and valuation of urban forests in China. Cities,
187-194.
Kaplowitz, M.D. & Hoehn, J.P. (2001). Do focus groups and individual interviews reveal the same
information for natural resource valuation? Ecological Economics, 36, 237-247.
Krieger, D. J. (2001). The economic value of forest ecosystem services: a review (p. 30).
Washington, DC, USA: Wilderness Society.
Krueger, R. A., & Casey, M. A. (2002). Designing and conducting focus group interviews. In
R.A. Krueger, M.A. Casey, J. Donner, S. Kirsch & J.N. Maack. Social Analysis, Selected
Tools and Techniques (4-23). Social Development Department, The World Bank.
Langemeyer, J., Baró, F., Roebeling, P., & Gómez-Baggethun, E. (2014). Contrasting values of
cultural ecosystem services in urban areas: The case of park Montjuïc in Barcelona.
Ecosystem Services.
Loomis, J., Bonnetti, K. & Echohawk, C. (1999). Demand for and supply of wilderness. In H.K.
Cordell, principal investigator, Outdoor Recreation in American Life: A national
assessment of demand and supply trends (1-26). Champaign, IL: Sagamore Publishing.
Majumdar, S., Deng, J., Zhang, Y., & Pierskalla, C. (2011). Using contingent valuation to estimate
the willingness of tourists to pay for urban forests: A study in Savannah, Georgia. Urban
Forestry & Urban Greening, 10(4), 275-280.
McLafferty, I. (2004). Focus group interviews as a data collecting strategy. Journal of Advanced
Nursing, 48(2), 187-194.
McPherson, G., Nowak, D., Heisler, G., Grimmond, S., Souch, C., Grant, R., & Rowntree, R.
(1997). Quantifying Urban Forest Structure, Function, and Value: The Chicago Urban
Forest Climate Project. Urban Ecosystems, 49-61.
Rabiee, F. (2004). Focus-group interview and data analysis. Proceedings of the Nutrition Society,
63(04), 655-660.
Shanahan, D.F., Lin, B.B., Bush, R., Gaston, K.J., Dean, J.H., Barber, E. & Fuller, R.A. (2015).
Toward Improved Public Health Outcomes From Urban Nature – Windows of
Opportunity. American Journal of Public Health, 105 (3), 470-477.
Sharpe, E.K. & A.W. Ewert (2000). Interferences in Place Attachment: Implications for
Wilderness. USDA Forest Service Proceedings RMRS-P-15-VOL 3.
Simon, J. S. (1999). How to conduct a focus group. The Grantsmanship Center Magazine, Fall.
Trust for Public Lands (2008). “How much value does the City of Philadelphia receive from its
park and recreation system?" The Trust for Public Land’s Center for City Park Excellence
for the Philadelphia Parks Alliance. Philadelphia, USA.
Tyrväinen, L. (2001). Economic valuation of urban forest benefits in Finland. Journal of
Environmental Management, 62 (1), 75-92.

37 FOREST PARK ECOSYSTEMS SERVICES INVENTORY
37 | P a g e
Appendix A. Post-Discussion Individual Respondent Survey
[Note to students: conduct surveys in a private place where others cannot listen to responses]
Focus Group Number: ________ (sequentially in the order done e.g. first, second, etc.)
Respondent Number: ____________ (start from one for each focus group)
Respondent Identification: ________ (Focus Group Number.Respondent ID)
Forest Park Visitation
1. Have you ever visited Forest Park?
___ Yes
___ No
___ Prefers not to answer
2. When was your last visit?
___ Within last Week
___ Within last Month
___ within last 6 Months
___ Within last Year
___ Within last 2 Years
___ Within last 5 Years
___ Within last 10 Years
___ Never visited the Park
___ Prefers not to answer
3. On average, during the previous year how regularly have you visited the park?
___ Daily
___ Twice a Week
___ Weekly
___ Bi-Weekly
___ Monthly
___ Twice a Year
___ Yearly
___ Never visited the Park
___ Prefers not to answer
4. On average, during the previous year how much time on each visit have you typically spent in
the park?
___ < 30 minutes
___ 30 minutes – 1 hour
___ 1 – 2 hours
___ 2 -3 hours

38 FOREST PARK ECOSYSTEMS SERVICES INVENTORY
38 | P a g e
___ 3 – 4 hours
___ 4 – 5 hours
___ > 5 hours
___ Never visited the Park
___ Prefers not to answer
5. By what mode of transport do you typically go to Forest Park? (Choose only one)
___ Car
___ Trimet
___ Bicycle
___ Walk
___ Other
___ I do not go
___ Prefers not to answer
6. Using the transport mode you mentioned in the previous question, approximately how much
time does it take you to travel to Forest Park? ___________________
7. If needed, is it convenient for you to go to Forest Park by Trimet bus, streetcar or Max?
___ Yes
___ No
___ Prefers not to answer
8. If no, please explain
________________________________________________________________________
________________________________________________________________________
9. How difficult for you is transportation to Forest Park?
___ Not at all difficult
___ Somewhat difficult
___ Difficult
___ Very difficult
___ Extremely difficult
___ I do not want to visit
___ Prefers not to answer
10. When you visit the park what activities do your participate in? Please list all that apply.
___ Never visited the Park
___ Hiking/walking
___ Walking dog
___Running
___ Biking
___ Bird Watching

39 FOREST PARK ECOSYSTEMS SERVICES INVENTORY
39 | P a g e
___ Other
___ Prefers not to answer
11. For your outdoor recreational needs, what is the major park or outdoor area other than Forest
Park that you primarily use? ___________________________
Outdoor Activities
12. In general, what outdoor recreation activities do you participate in? Please list all that apply.
___ Hiking
___ Running
___ Fishing
___ Walking
___ Mountain Biking
___ Horseback Riding
___ Bird Watching
___ Off Road Vehicle Use
___ Camping
___ None
___ Other
___ Prefers not to answer
13. In general, how often do you participate in outdoor recreation activities?
___ Daily
___ Twice a Week
___ Weekly
___ Bi-Weekly
___ Monthly
___ Twice a Year
___ Yearly
___ Never
___ Prefers not to answer
14. How many visits to city parks (not just Forest Park) have you made during the past year?
___ Zero
___ 1
___ 2
___ 3
___ 4-6
___ 7-10
___ 11-15
___ 16+
___ Other
___ Prefers not to answer
15. On average, during the last year how much time on each visit have you typically spent in
parks other than Forest Park?

40 FOREST PARK ECOSYSTEMS SERVICES INVENTORY
40 | P a g e
___ < 30 minutes
___ 30 minutes – 1 hour
___ 1 – 2 hours
___ 2 -3 hours
___ 3 – 4 hours
___ 4 – 5 hours
___ > 5 hours
___ Never visited other parks
___ Prefers not to answer
Possible Forest Park Visitors’ Center
16. If a visitors’ center were to be built, would you use it?
___ Yes
___ No
___ Prefers not to answer
17. Do you think your friends and neighbors would use the visitors’ center?
___ Yes
___ No
___ Prefers not to answer
18. What would be one amenity you would find useful in a visitors center?
___ Prefers not to answer
Residency
19. Where do you live?
_____NE or N Portland
_____SE Portland
_____SW Portland
_____NW Portland
_____Clackamas County
_____Washington County
_____Other
_____Prefers not to answer
20. What is your zip code? ____________ ___ Prefers not to answer
21. How long have you lived in the Portland area?
___ I don’t live in the Portland area
___ Moved here in the last year
___ 1-5 years
___ 5 years +
___ Prefers not to answer

41 FOREST PARK ECOSYSTEMS SERVICES INVENTORY
41 | P a g e
Demographics
22. Gender of respondent
___ Male
___ Female
___ Prefers not to answer
23. What is your age?
___ 18-20
___ 21-30
___ 31-40
___ 41-50
___ 51-60
___ 61-70
___ 71-80
___ 81+
___ prefers not to answer
24. How many people are currently in your household?
___ 1
___ 2
___ 3
___ 4
___ 5
___ 6
___ >6
___ prefers not to answer
25. How many children are in your household?
___ 0
___ 1
___ 2
___ 3
___ 4
___ 5
___ >5
___ prefers not to answer
Socioeconomic Information
26. What is your approximate 2014 income?
___ <$20000
___ 20001 - 30000
___ 30001 – 40000
___ 40001 -60000

42 FOREST PARK ECOSYSTEMS SERVICES INVENTORY
42 | P a g e
___ 60001 - 80000
___ 80001 – 100000
___ 100001 – 120000
___ >120000
___ prefers not to answer
27. Do you own a car?
___ Yes
___ No
___ Prefers not to answer
28. Are you retired?
___ Yes
___ No
___ Prefers not to answer
29. Are you unemployed?
___ Yes
___ No
___ Prefers not to answer
30. What is your education level?
___ < High school
___ High school degree
___ Some college
___ Associates degree
___ Bachelor’s degree
___ Graduate degree
___ Prefers not to answer

Appendix B. Survey Key

44 FOREST PARK ECOSYSTEMS SERVICES INVENTORY
44 | P a g e
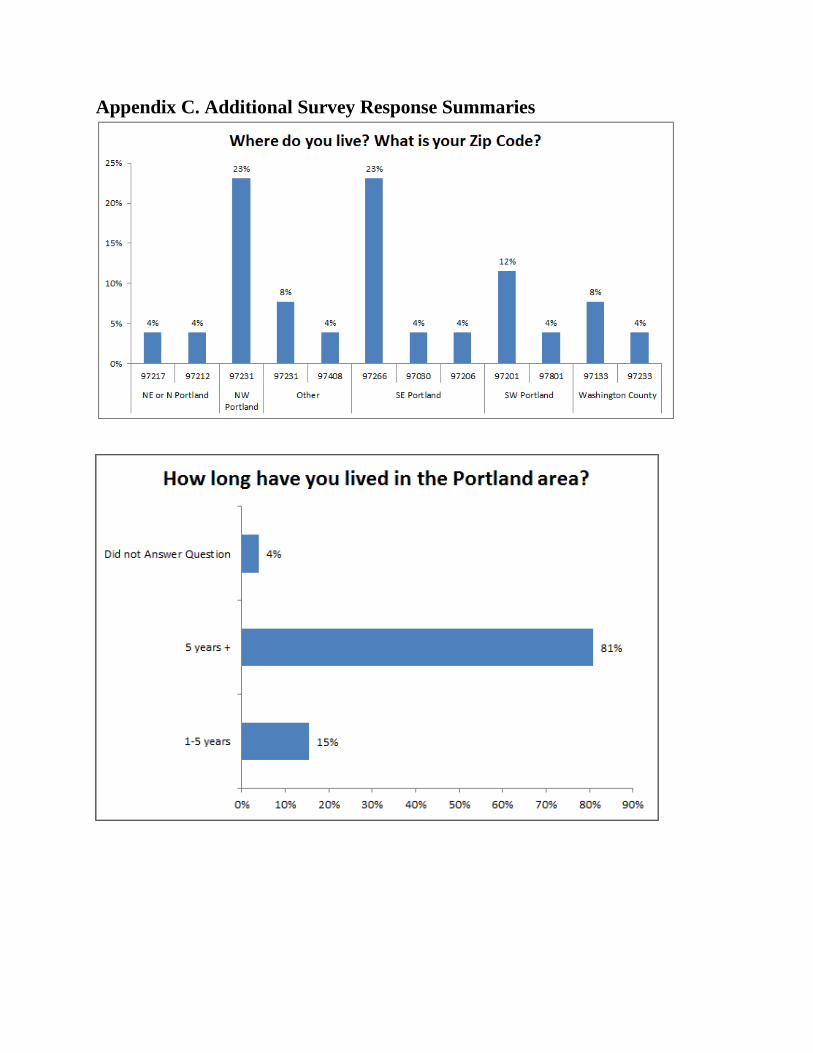
Appendix C. Additional Survey Response Summaries

46 FOREST PARK ECOSYSTEMS SERVICES INVENTORY
46 | P a g e

47 FOREST PARK ECOSYSTEMS SERVICES INVENTORY
47 | P a g e

48 FOREST PARK ECOSYSTEMS SERVICES INVENTORY
48 | P a g e

49 FOREST PARK ECOSYSTEMS SERVICES INVENTORY
49 | P a g e
Appendix D. Selected Quotes from Focus Groups
Uses
“I was crushed that horses were kept out [of Forest Park].”
- Linnton group
“I have to say, safety is an issue for me as a female. I used to live really close and I used to go up
by myself, and you have to be aware of your surroundings – I wouldn’t go there at night for sure.
It’s dark. I think there are a lot of homeless and vagrants.”
“I wonder also about the clarity or frequency of trail markers, I saw lots of people who were
confused about where they were going. Clarity in particular is an issue.”
-SoMa group
“If I had knowledge of additional access points, I would explore more of the park.”
“There are a lot of trail runners. [They] can be disruptive – especially in mud – to the people who
are walking or hiking.”
“For hikers I think the signage is really good – better than a lot of places.”
- Lents group
Perceptions
“[I] like to be able to be in the city but easily get out and be in nature, it’s a good place to work
out, there is the quietness, it’s a good place to meditate.”
“[Forest Park’s] existence has high value for me in general, not even just recreationally. I just
value it.”
“. . .there are also spots of old growth in the park, and they are not very accessible from Portland.
And being around all those trees can do something, it can be very spiritual and primitively
attractive, something that goes beyond just species diversity.”
- SoMa group
“[Forest Park is an] opportunity for students and young people.”
“I do use it mostly for hiking and being in nature. I am not really aware of services for me that it
provides other than that.”
- Lents group
“Even if I never went to Forest Park again, I think it would absolutely still be valuable. It’s part
of what makes Portland Portland. I knew about it before I moved here.”

50 FOREST PARK ECOSYSTEMS SERVICES INVENTORY
50 | P a g e
- Inner NE group
Interpretive Center
“Why put all your eggs in one basket?”
- Linnton group
“I think the location [of the proposed interpretive center] is a deterrent, I don’t want to go way
out there, and if you don’t have a car, you can’t easily get there”
- SoMa group
“[At] most parks I go to, you go to the visitor center first to figure out what trail to go to. Makes
it easier to navigate.”
- Lents group
“I definitely think a visitor center would improve my experience. It could help new people use
the park, but education would need to be a big part of it. People need to know that it’s there and
what it can offer them.”
“Forest Park is big. It can probably handle more visitors and still keep pristine areas in the north
and allow more recreation in the south. More visitors can help with reporting invasive species
and get involved in park cleanups, and that’s more people to support park preservation and
funding.”
- Inner NE group