Embed Size (px)
Citation preview
Forest Products Development &
Marketing Council
of Guyana, Inc.
Market/Export Report
September 2013
Produced By
Forest Products Development & Marketing Council of Guyana, Inc. (FPDMC)
17 Access Road, Kingston Georgetown.
Tel #: 592-223-5135-6
Email: [email protected] Website: www.fpdmcguy.org
2
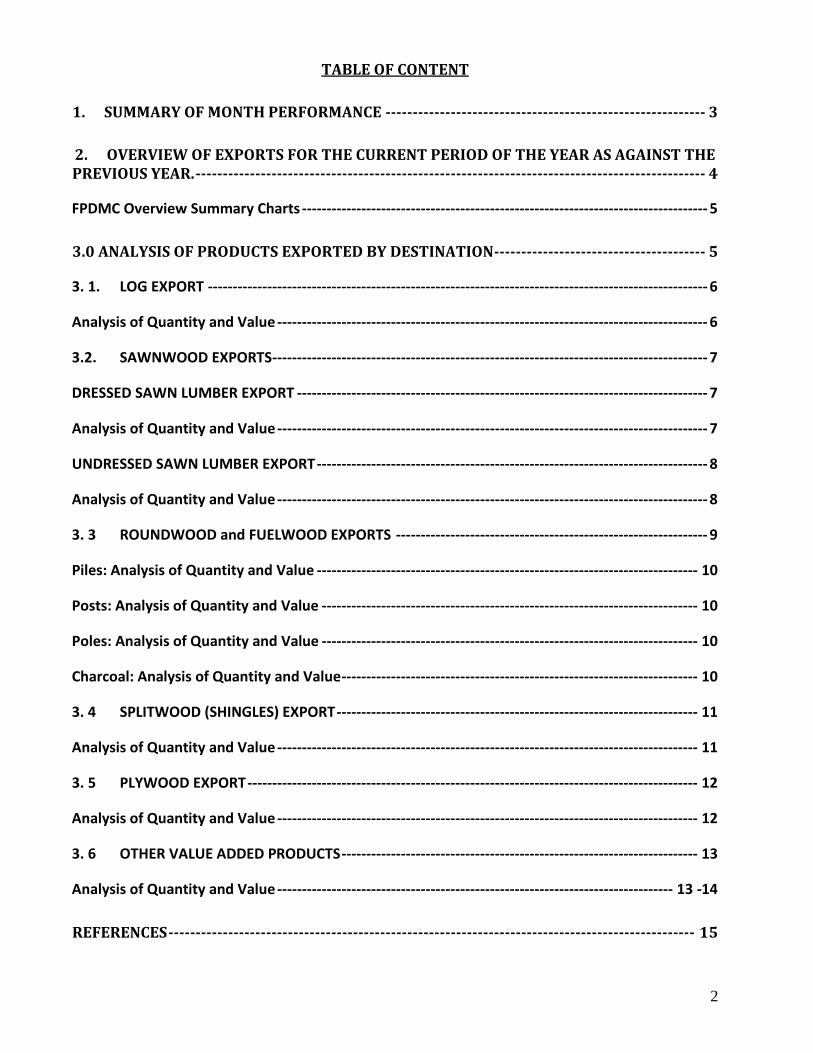
TABLE OF CONTENT
1. SUMMARY OF MONTH PERFORMANCE ----------------------------------------------------------- 3
2. OVERVIEW OF EXPORTS FOR THE CURRENT PERIOD OF THE YEAR AS AGAINST THE PREVIOUS YEAR. ---------------------------------------------------------------------------------------------- 4
FPDMC Overview Summary Charts ---------------------------------------------------------------------------------- 5
3.0 ANALYSIS OF PRODUCTS EXPORTED BY DESTINATION --------------------------------------- 5
3. 1. LOG EXPORT ----------------------------------------------------------------------------------------------------- 6
Analysis of Quantity and Value --------------------------------------------------------------------------------------- 6
3.2. SAWNWOOD EXPORTS ---------------------------------------------------------------------------------------- 7
DRESSED SAWN LUMBER EXPORT ----------------------------------------------------------------------------------- 7
Analysis of Quantity and Value --------------------------------------------------------------------------------------- 7
UNDRESSED SAWN LUMBER EXPORT ------------------------------------------------------------------------------- 8
Analysis of Quantity and Value --------------------------------------------------------------------------------------- 8
3. 3 ROUNDWOOD and FUELWOOD EXPORTS --------------------------------------------------------------- 9
Piles: Analysis of Quantity and Value ----------------------------------------------------------------------------- 10
Posts: Analysis of Quantity and Value ---------------------------------------------------------------------------- 10
Poles: Analysis of Quantity and Value ---------------------------------------------------------------------------- 10
Charcoal: Analysis of Quantity and Value ------------------------------------------------------------------------ 10
3. 4 SPLITWOOD (SHINGLES) EXPORT ------------------------------------------------------------------------- 11
Analysis of Quantity and Value ------------------------------------------------------------------------------------- 11
3. 5 PLYWOOD EXPORT ------------------------------------------------------------------------------------------- 12
Analysis of Quantity and Value ------------------------------------------------------------------------------------- 12
3. 6 OTHER VALUE ADDED PRODUCTS ------------------------------------------------------------------------ 13
Analysis of Quantity and Value -------------------------------------------------------------------------------- 13 -14
REFERENCES ------------------------------------------------------------------------------------------------- 15
3
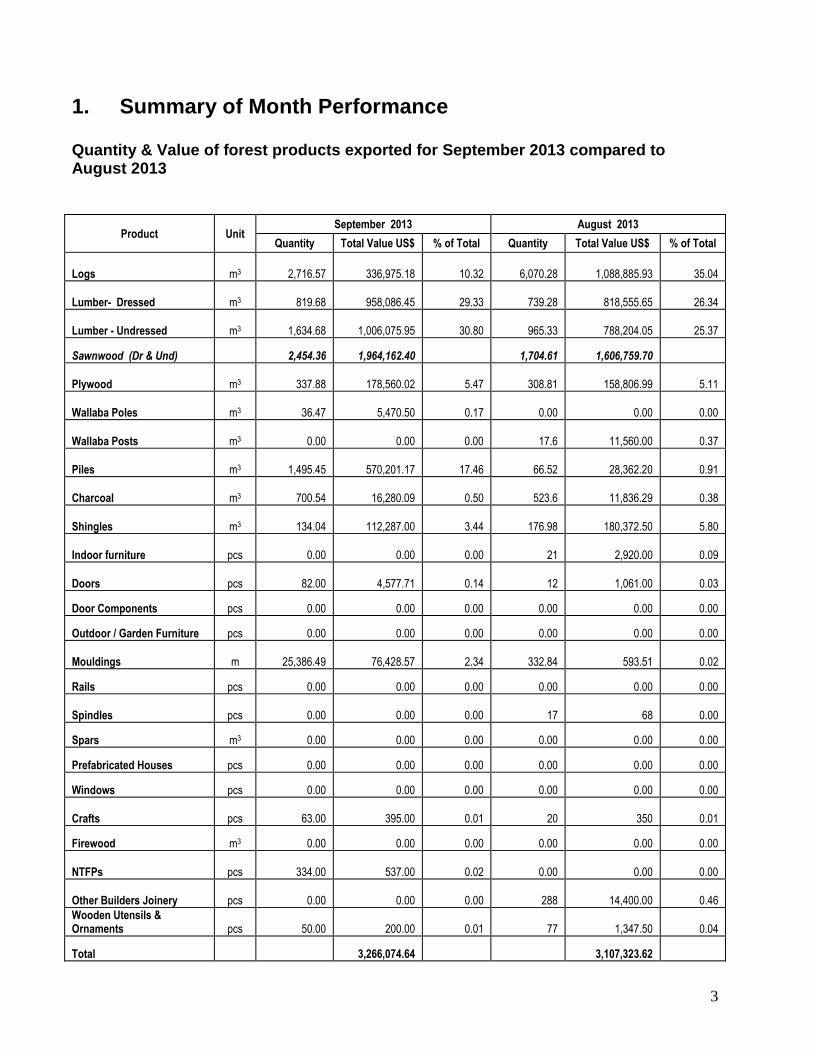
1. Summary of Month Performance Quantity & Value of forest products exported for September 2013 compared to August 2013
Product Unit September 2013 August 2013
Quantity Total Value US$ % of Total Quantity Total Value US$ % of Total
Logs m3 2,716.57 336,975.18
10.32 6,070.28 1,088,885.93
35.04
Lumber- Dressed m3 819.68 958,086.45
29.33 739.28 818,555.65
26.34
Lumber - Undressed m3 1,634.68 1,006,075.95
30.80 965.33 788,204.05
25.37
Sawnwood (Dr & Und) 2,454.36 1,964,162.40 1,704.61 1,606,759.70
Plywood m3 337.88 178,560.02
5.47 308.81 158,806.99
5.11
Wallaba Poles m3 36.47 5,470.50
0.17 0.00 0.00 0.00
Wallaba Posts m3 0.00 0.00 0.00 17.6 11,560.00
0.37
Piles m3 1,495.45 570,201.17
17.46 66.52 28,362.20
0.91
Charcoal m3 700.54 16,280.09
0.50 523.6 11,836.29
0.38
Shingles m3 134.04 112,287.00
3.44 176.98 180,372.50
5.80
Indoor furniture pcs 0.00 0.00 0.00 21 2,920.00
0.09
Doors pcs 82.00 4,577.71
0.14 12 1,061.00
0.03
Door Components pcs 0.00 0.00 0.00 0.00 0.00 0.00
Outdoor / Garden Furniture pcs 0.00 0.00 0.00 0.00 0.00 0.00
Mouldings m 25,386.49 76,428.57
2.34 332.84 593.51
0.02
Rails pcs 0.00 0.00 0.00 0.00 0.00 0.00
Spindles pcs 0.00 0.00 0.00 17 68
0.00
Spars m3 0.00 0.00 0.00 0.00 0.00 0.00
Prefabricated Houses pcs 0.00 0.00 0.00 0.00 0.00 0.00
Windows pcs 0.00 0.00 0.00 0.00 0.00 0.00
Crafts pcs 63.00 395.00
0.01 20 350
0.01
Firewood m3 0.00 0.00 0.00 0.00 0.00 0.00
NTFPs pcs 334.00 537.00
0.02 0.00 0.00 0.00
Other Builders Joinery pcs 0.00 0.00 0.00 288 14,400.00
0.46
Wooden Utensils & Ornaments pcs 50.00 200.00
0.01 77 1,347.50
0.04
Total 3,266,074.64 3,107,323.62
4
2. Overview of exports for the current period of the year as against the previous
year.
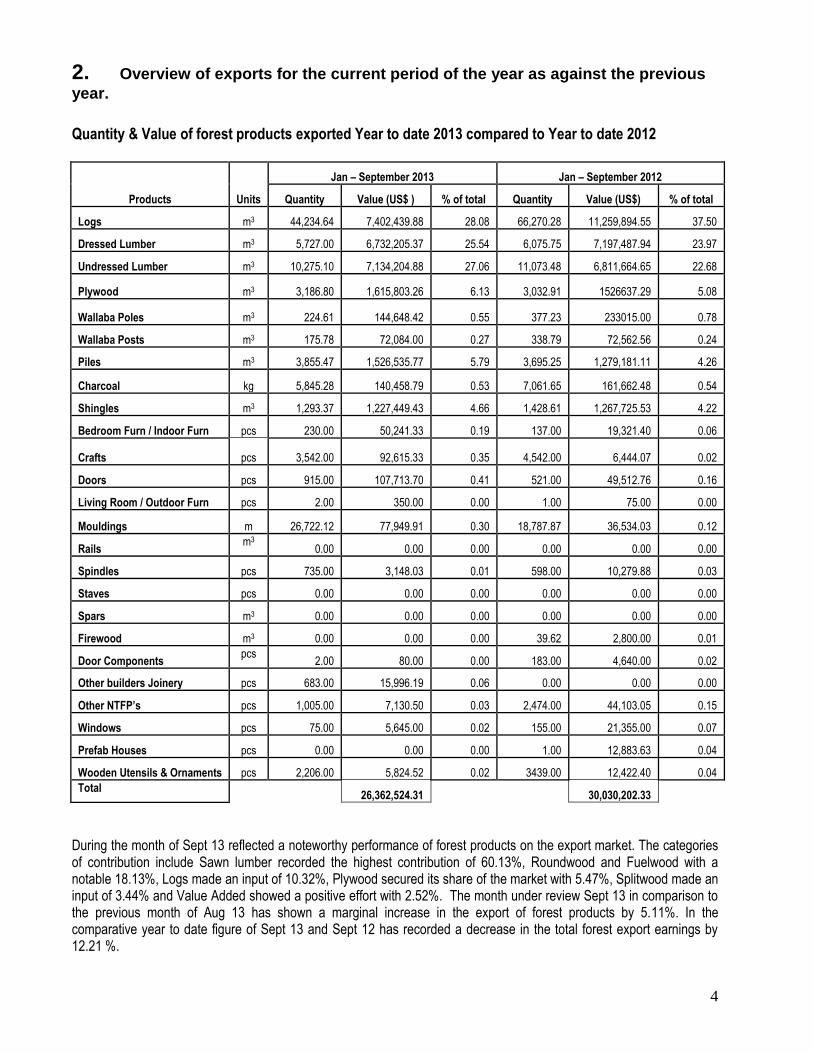
Quantity & Value of forest products exported Year to date 2013 compared to Year to date 2012
Products Units
Jan – September 2013 Jan – September 2012
Quantity Value (US$ ) % of total Quantity Value (US$) % of total
Logs m3 44,234.64 7,402,439.88 28.08 66,270.28 11,259,894.55 37.50
Dressed Lumber m3 5,727.00 6,732,205.37 25.54 6,075.75 7,197,487.94 23.97
Undressed Lumber m3 10,275.10 7,134,204.88 27.06 11,073.48 6,811,664.65 22.68
Plywood m3 3,186.80 1,615,803.26 6.13 3,032.91 1526637.29 5.08
Wallaba Poles m3 224.61 144,648.42 0.55 377.23 233015.00 0.78
Wallaba Posts m3 175.78 72,084.00 0.27 338.79 72,562.56 0.24
Piles m3 3,855.47 1,526,535.77 5.79 3,695.25 1,279,181.11 4.26
Charcoal kg 5,845.28 140,458.79 0.53 7,061.65 161,662.48 0.54
Shingles m3 1,293.37 1,227,449.43 4.66 1,428.61 1,267,725.53 4.22
Bedroom Furn / Indoor Furn pcs 230.00 50,241.33 0.19 137.00 19,321.40 0.06
Crafts pcs 3,542.00 92,615.33 0.35 4,542.00 6,444.07 0.02
Doors pcs 915.00 107,713.70 0.41 521.00 49,512.76 0.16
Living Room / Outdoor Furn pcs 2.00 350.00 0.00 1.00 75.00 0.00
Mouldings m 26,722.12 77,949.91 0.30 18,787.87 36,534.03 0.12
Rails m3
0.00 0.00 0.00 0.00 0.00 0.00
Spindles pcs 735.00 3,148.03 0.01 598.00 10,279.88 0.03
Staves pcs 0.00 0.00 0.00 0.00 0.00 0.00
Spars m3 0.00 0.00 0.00 0.00 0.00 0.00
Firewood m3 0.00 0.00 0.00 39.62 2,800.00 0.01
Door Components pcs
2.00 80.00 0.00 183.00 4,640.00 0.02
Other builders Joinery pcs 683.00 15,996.19 0.06 0.00 0.00 0.00
Other NTFP’s pcs 1,005.00 7,130.50 0.03 2,474.00 44,103.05 0.15
Windows pcs 75.00 5,645.00 0.02 155.00 21,355.00 0.07
Prefab Houses pcs 0.00 0.00 0.00 1.00 12,883.63 0.04
Wooden Utensils & Ornaments pcs 2,206.00 5,824.52 0.02 3439.00 12,422.40 0.04
Total
26,362,524.31
30,030,202.33
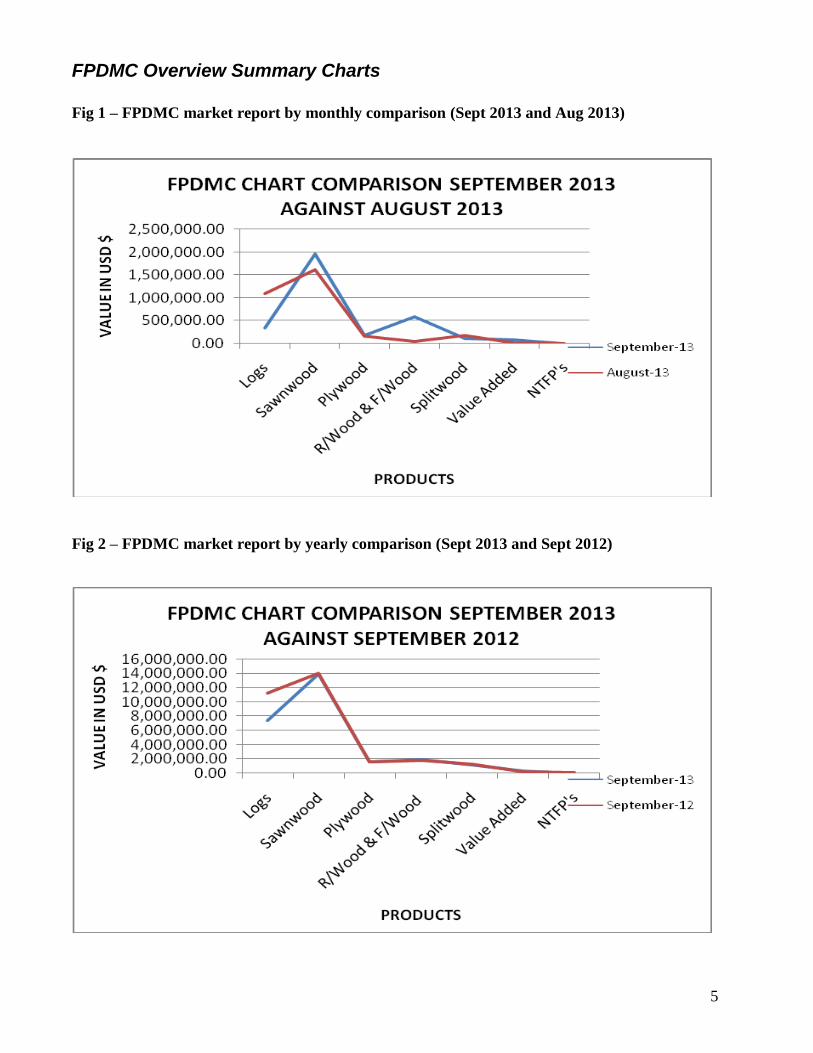
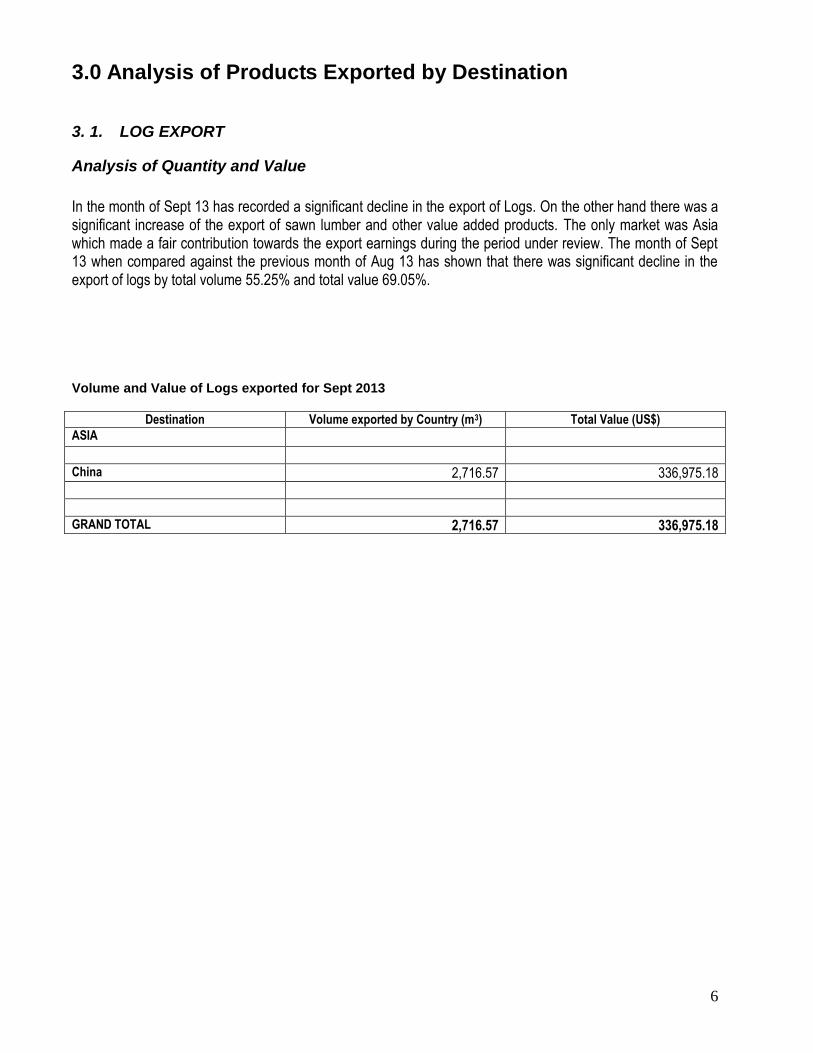
During the month of Sept 13 reflected a noteworthy performance of forest products on the export market. The categories of contribution include Sawn lumber recorded the highest contribution of 60.13%, Roundwood and Fuelwood with a notable 18.13%, Logs made an input of 10.32%, Plywood secured its share of the market with 5.47%, Splitwood made an input of 3.44% and Value Added showed a positive effort with 2.52%. The month under review Sept 13 in comparison to the previous month of Aug 13 has shown a marginal increase in the export of forest products by 5.11%. In the comparative year to date figure of Sept 13 and Sept 12 has recorded a decrease in the total forest export earnings by 12.21 %.
5
FPDMC Overview Summary Charts
Fig 1 – FPDMC market report by monthly comparison (Sept 2013 and Aug 2013)
Fig 2 – FPDMC market report by yearly comparison (Sept 2013 and Sept 2012)
6
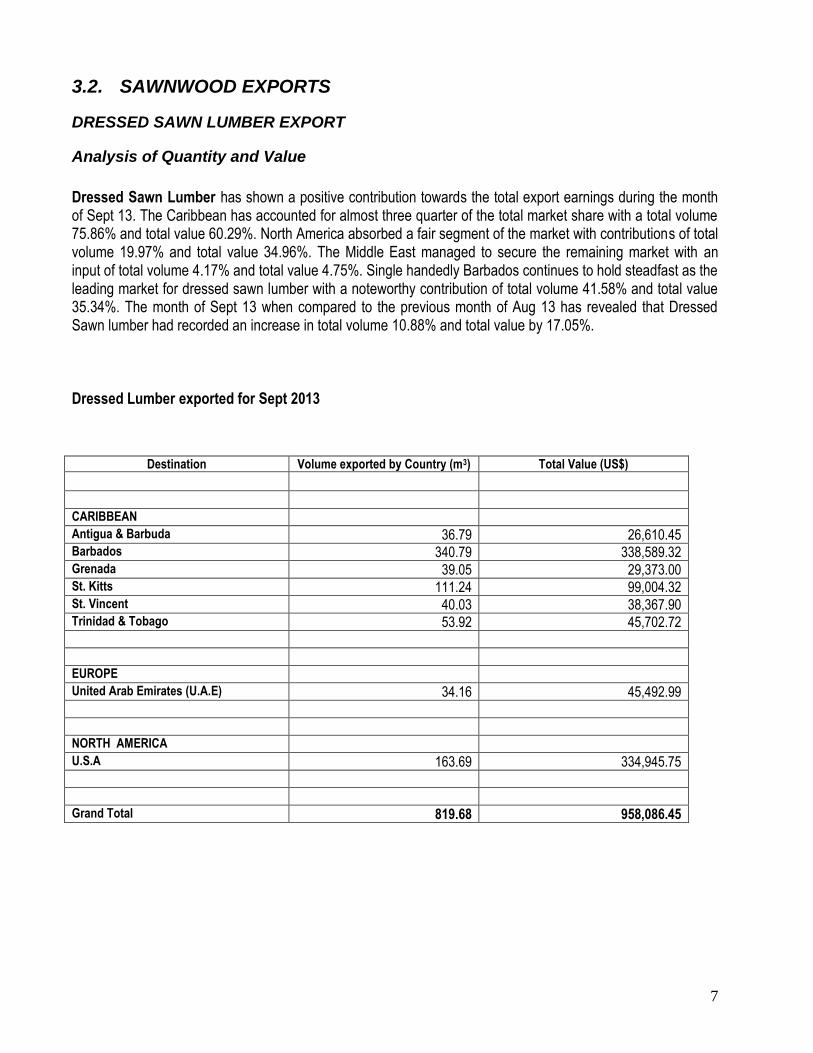
3.0 Analysis of Products Exported by Destination
3. 1. LOG EXPORT
Analysis of Quantity and Value
In the month of Sept 13 has recorded a significant decline in the export of Logs. On the other hand there was a significant increase of the export of sawn lumber and other value added products. The only market was Asia which made a fair contribution towards the export earnings during the period under review. The month of Sept 13 when compared against the previous month of Aug 13 has shown that there was significant decline in the export of logs by total volume 55.25% and total value 69.05%. Volume and Value of Logs exported for Sept 2013
Destination Volume exported by Country (m3) Total Value (US$)
ASIA China 2,716.57 336,975.18 GRAND TOTAL 2,716.57 336,975.18
7
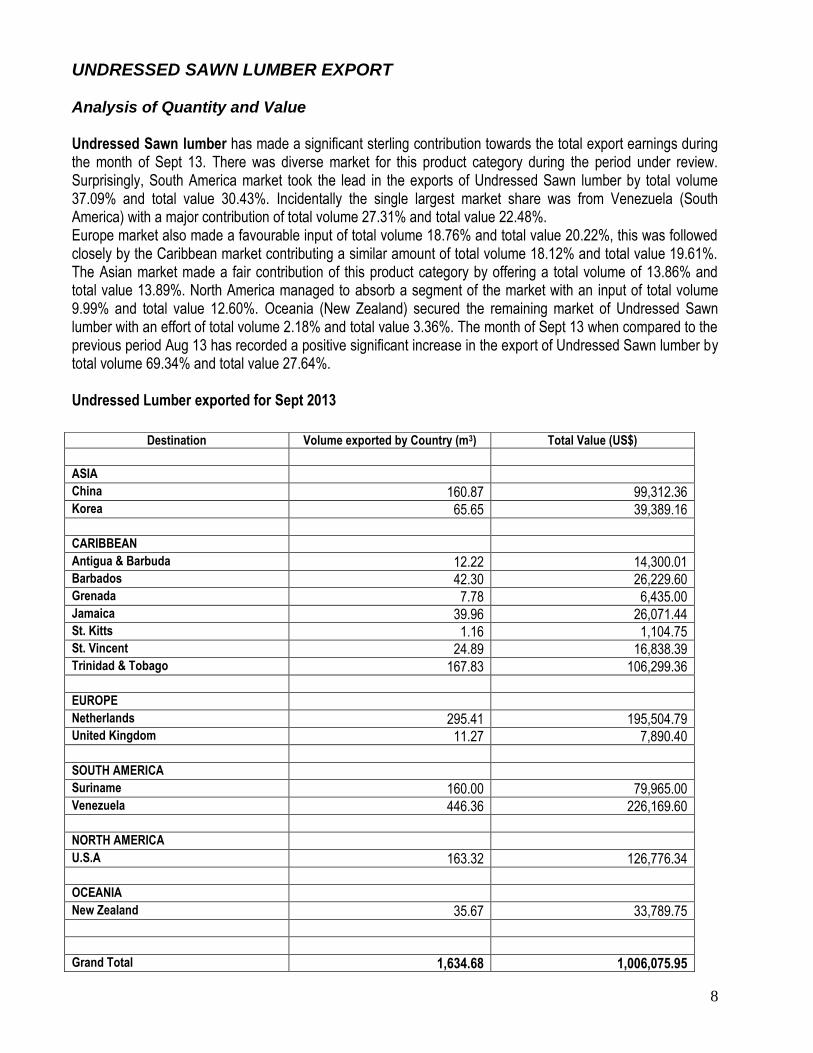
3.2. SAWNWOOD EXPORTS
DRESSED SAWN LUMBER EXPORT
Analysis of Quantity and Value
Dressed Sawn Lumber has shown a positive contribution towards the total export earnings during the month of Sept 13. The Caribbean has accounted for almost three quarter of the total market share with a total volume 75.86% and total value 60.29%. North America absorbed a fair segment of the market with contributions of total volume 19.97% and total value 34.96%. The Middle East managed to secure the remaining market with an input of total volume 4.17% and total value 4.75%. Single handedly Barbados continues to hold steadfast as the leading market for dressed sawn lumber with a noteworthy contribution of total volume 41.58% and total value 35.34%. The month of Sept 13 when compared to the previous month of Aug 13 has revealed that Dressed Sawn lumber had recorded an increase in total volume 10.88% and total value by 17.05%. Dressed Lumber exported for Sept 2013
Destination Volume exported by Country (m3) Total Value (US$)
CARIBBEAN Antigua & Barbuda 36.79 26,610.45 Barbados 340.79 338,589.32 Grenada 39.05 29,373.00 St. Kitts 111.24 99,004.32 St. Vincent 40.03 38,367.90 Trinidad & Tobago 53.92 45,702.72 EUROPE United Arab Emirates (U.A.E) 34.16 45,492.99 NORTH AMERICA U.S.A 163.69 334,945.75 Grand Total 819.68 958,086.45
8
UNDRESSED SAWN LUMBER EXPORT Analysis of Quantity and Value Undressed Sawn lumber has made a significant sterling contribution towards the total export earnings during the month of Sept 13. There was diverse market for this product category during the period under review. Surprisingly, South America market took the lead in the exports of Undressed Sawn lumber by total volume 37.09% and total value 30.43%. Incidentally the single largest market share was from Venezuela (South America) with a major contribution of total volume 27.31% and total value 22.48%. Europe market also made a favourable input of total volume 18.76% and total value 20.22%, this was followed closely by the Caribbean market contributing a similar amount of total volume 18.12% and total value 19.61%. The Asian market made a fair contribution of this product category by offering a total volume of 13.86% and total value 13.89%. North America managed to absorb a segment of the market with an input of total volume 9.99% and total value 12.60%. Oceania (New Zealand) secured the remaining market of Undressed Sawn lumber with an effort of total volume 2.18% and total value 3.36%. The month of Sept 13 when compared to the previous period Aug 13 has recorded a positive significant increase in the export of Undressed Sawn lumber by total volume 69.34% and total value 27.64%. Undressed Lumber exported for Sept 2013
Destination Volume exported by Country (m3) Total Value (US$)
ASIA China 160.87 99,312.36 Korea 65.65 39,389.16 CARIBBEAN Antigua & Barbuda 12.22 14,300.01 Barbados 42.30 26,229.60 Grenada 7.78 6,435.00 Jamaica 39.96 26,071.44 St. Kitts 1.16 1,104.75 St. Vincent 24.89 16,838.39 Trinidad & Tobago 167.83 106,299.36 EUROPE Netherlands 295.41 195,504.79 United Kingdom 11.27 7,890.40 SOUTH AMERICA Suriname 160.00 79,965.00 Venezuela 446.36 226,169.60 NORTH AMERICA U.S.A 163.32 126,776.34 OCEANIA New Zealand 35.67 33,789.75 Grand Total 1,634.68 1,006,075.95
9
3. 3 ROUNDWOOD and FUELWOOD EXPORTS
Piles: Analysis of Quantity and Value
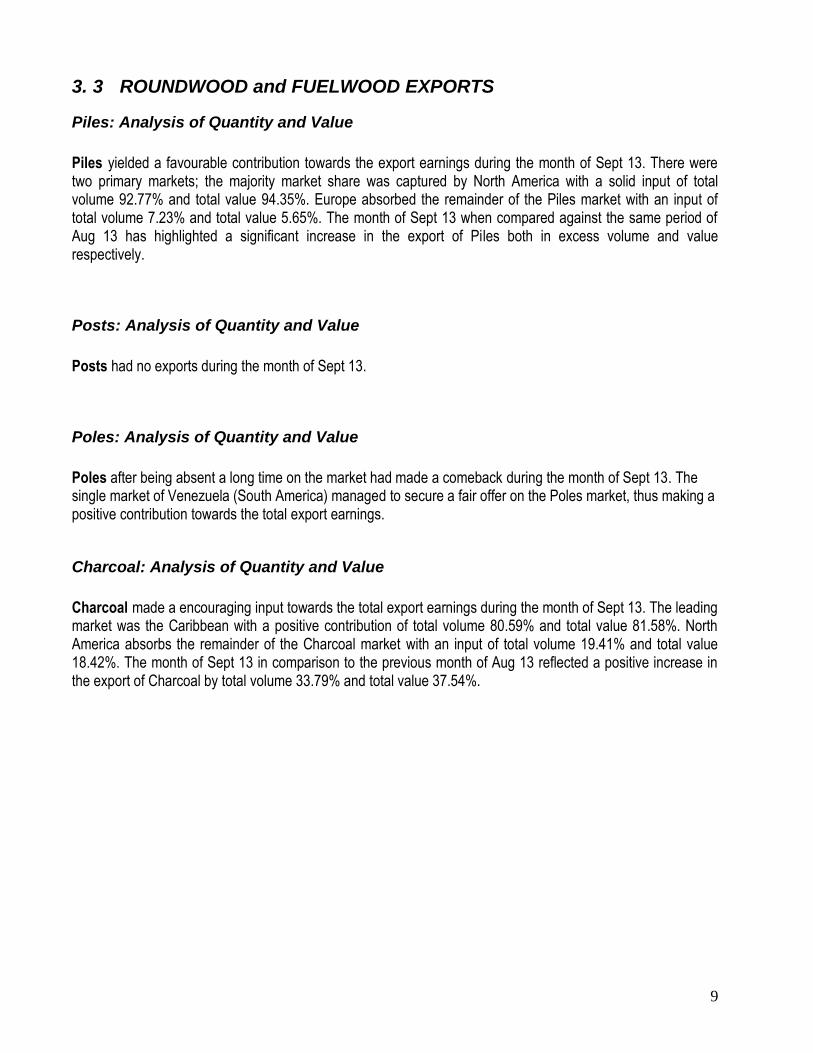
Piles yielded a favourable contribution towards the export earnings during the month of Sept 13. There were two primary markets; the majority market share was captured by North America with a solid input of total volume 92.77% and total value 94.35%. Europe absorbed the remainder of the Piles market with an input of total volume 7.23% and total value 5.65%. The month of Sept 13 when compared against the same period of Aug 13 has highlighted a significant increase in the export of Piles both in excess volume and value respectively.
Posts: Analysis of Quantity and Value
Posts had no exports during the month of Sept 13.
Poles: Analysis of Quantity and Value
Poles after being absent a long time on the market had made a comeback during the month of Sept 13. The single market of Venezuela (South America) managed to secure a fair offer on the Poles market, thus making a positive contribution towards the total export earnings.
Charcoal: Analysis of Quantity and Value
Charcoal made a encouraging input towards the total export earnings during the month of Sept 13. The leading market was the Caribbean with a positive contribution of total volume 80.59% and total value 81.58%. North America absorbs the remainder of the Charcoal market with an input of total volume 19.41% and total value 18.42%. The month of Sept 13 in comparison to the previous month of Aug 13 reflected a positive increase in the export of Charcoal by total volume 33.79% and total value 37.54%.
10
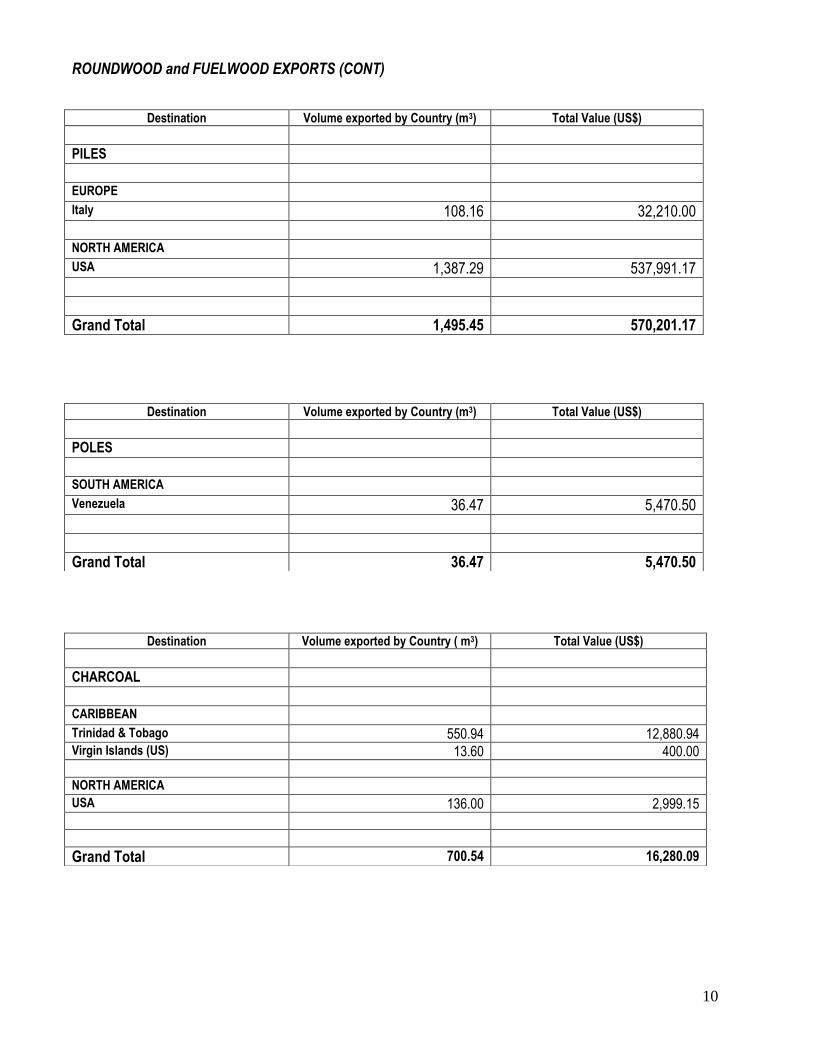
ROUNDWOOD and FUELWOOD EXPORTS (CONT)
Destination Volume exported by Country (m3) Total Value (US$)
PILES EUROPE Italy 108.16 32,210.00 NORTH AMERICA USA 1,387.29 537,991.17
Grand Total 1,495.45 570,201.17
Destination Volume exported by Country (m3) Total Value (US$)
POLES SOUTH AMERICA Venezuela 36.47 5,470.50
Grand Total 36.47 5,470.50
Destination Volume exported by Country ( m3) Total Value (US$)
CHARCOAL CARIBBEAN Trinidad & Tobago 550.94 12,880.94 Virgin Islands (US) 13.60 400.00 NORTH AMERICA USA 136.00 2,999.15
Grand Total 700.54 16,280.09
11
3. 4 SPLITWOOD (SHINGLES) EXPORT
Analysis of Quantity and Value
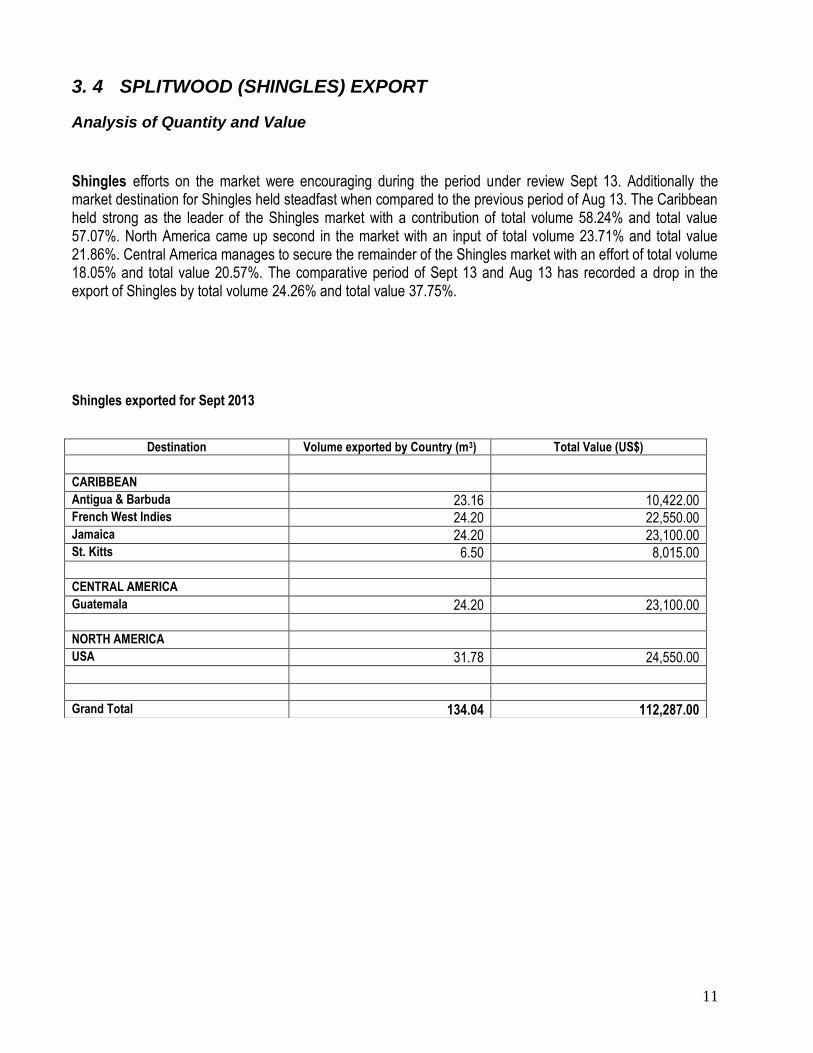
Shingles efforts on the market were encouraging during the period under review Sept 13. Additionally the market destination for Shingles held steadfast when compared to the previous period of Aug 13. The Caribbean held strong as the leader of the Shingles market with a contribution of total volume 58.24% and total value 57.07%. North America came up second in the market with an input of total volume 23.71% and total value 21.86%. Central America manages to secure the remainder of the Shingles market with an effort of total volume 18.05% and total value 20.57%. The comparative period of Sept 13 and Aug 13 has recorded a drop in the export of Shingles by total volume 24.26% and total value 37.75%. Shingles exported for Sept 2013
Destination Volume exported by Country (m3) Total Value (US$)
CARIBBEAN Antigua & Barbuda 23.16 10,422.00 French West Indies 24.20 22,550.00 Jamaica 24.20 23,100.00 St. Kitts 6.50 8,015.00 CENTRAL AMERICA Guatemala 24.20 23,100.00 NORTH AMERICA USA 31.78 24,550.00 Grand Total 134.04 112,287.00
12
3. 5 PLYWOOD EXPORT
Analysis of Quantity and Value
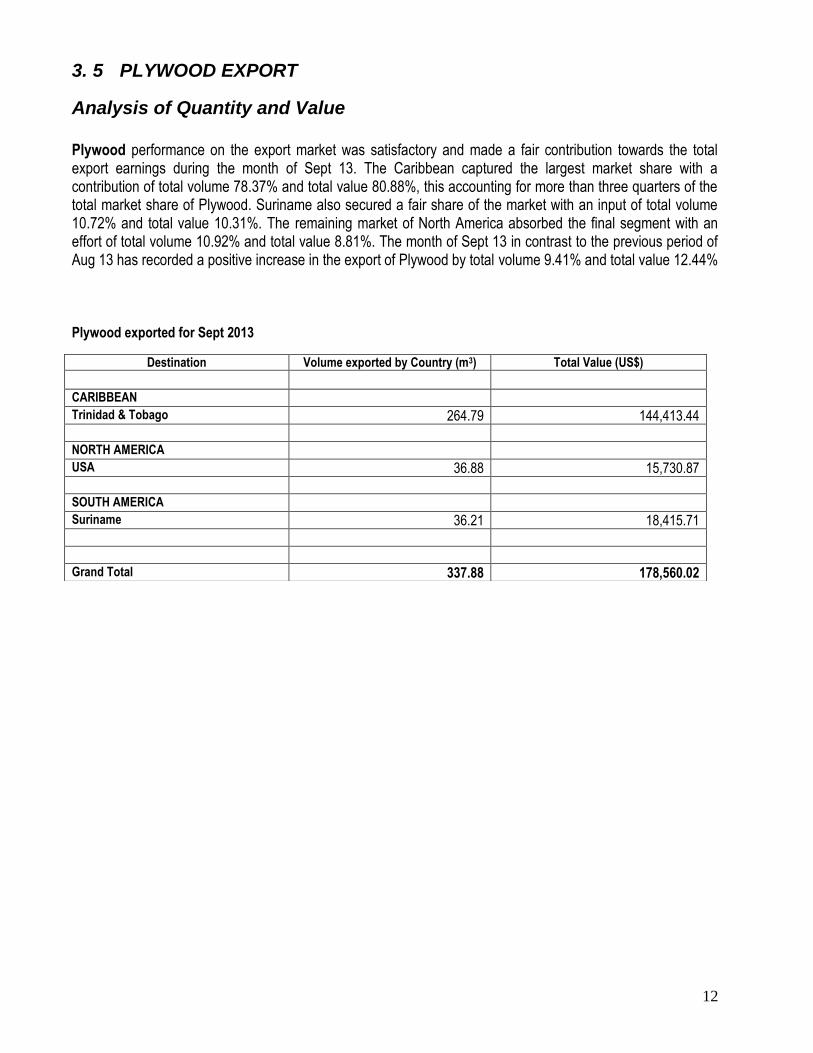
Plywood performance on the export market was satisfactory and made a fair contribution towards the total export earnings during the month of Sept 13. The Caribbean captured the largest market share with a contribution of total volume 78.37% and total value 80.88%, this accounting for more than three quarters of the total market share of Plywood. Suriname also secured a fair share of the market with an input of total volume 10.72% and total value 10.31%. The remaining market of North America absorbed the final segment with an effort of total volume 10.92% and total value 8.81%. The month of Sept 13 in contrast to the previous period of Aug 13 has recorded a positive increase in the export of Plywood by total volume 9.41% and total value 12.44% Plywood exported for Sept 2013
Destination Volume exported by Country (m3) Total Value (US$)
CARIBBEAN Trinidad & Tobago 264.79 144,413.44 NORTH AMERICA USA 36.88 15,730.87 SOUTH AMERICA Suriname 36.21 18,415.71 Grand Total 337.88 178,560.02
13
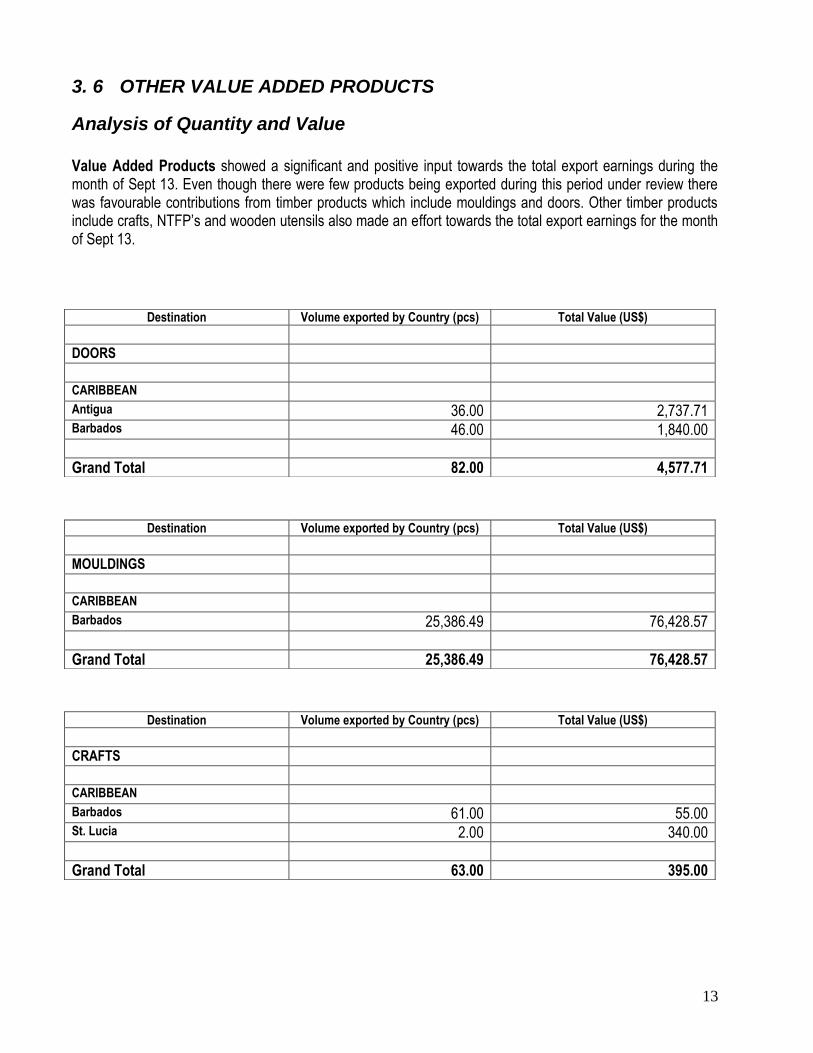
3. 6 OTHER VALUE ADDED PRODUCTS
Analysis of Quantity and Value
Value Added Products showed a significant and positive input towards the total export earnings during the month of Sept 13. Even though there were few products being exported during this period under review there was favourable contributions from timber products which include mouldings and doors. Other timber products include crafts, NTFP’s and wooden utensils also made an effort towards the total export earnings for the month of Sept 13.
Destination Volume exported by Country (pcs) Total Value (US$)
DOORS CARIBBEAN Antigua 36.00 2,737.71 Barbados 46.00 1,840.00
Grand Total 82.00 4,577.71
Destination Volume exported by Country (pcs) Total Value (US$)
MOULDINGS CARIBBEAN Barbados 25,386.49 76,428.57
Grand Total 25,386.49 76,428.57
Destination Volume exported by Country (pcs) Total Value (US$)
CRAFTS CARIBBEAN Barbados 61.00 55.00 St. Lucia 2.00 340.00
Grand Total 63.00 395.00
14
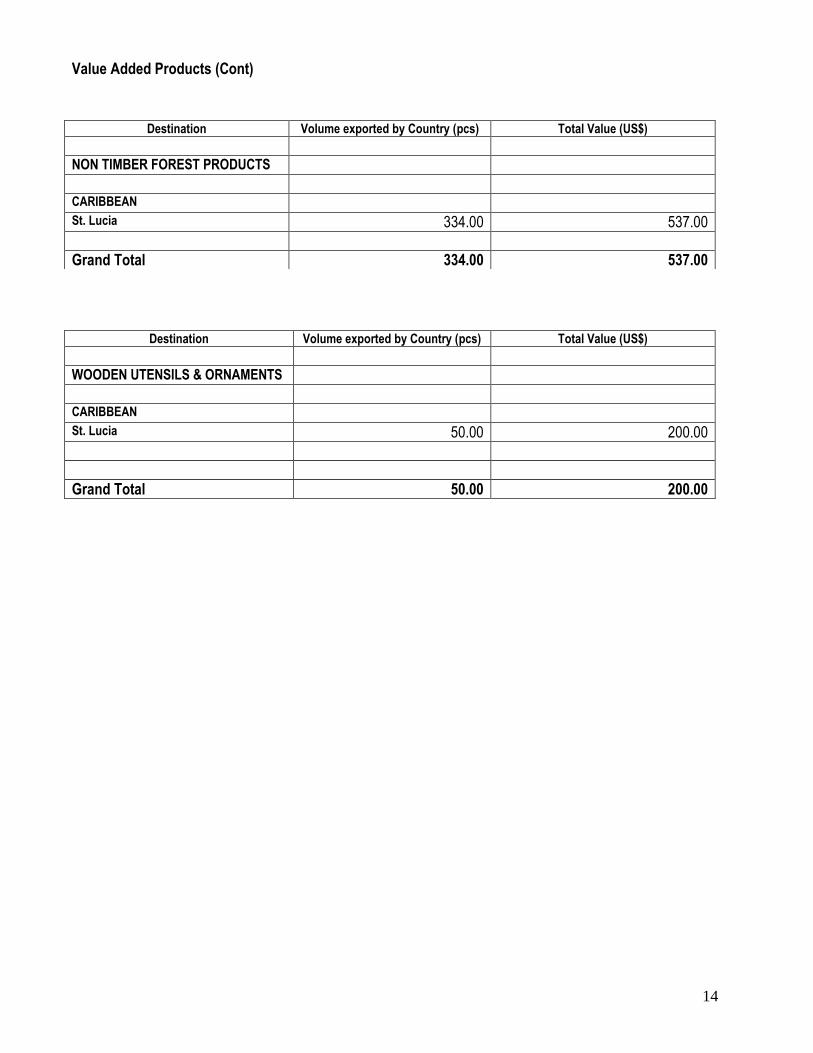
Value Added Products (Cont)
Destination Volume exported by Country (pcs) Total Value (US$)
NON TIMBER FOREST PRODUCTS CARIBBEAN St. Lucia 334.00 537.00
Grand Total 334.00 537.00
Destination Volume exported by Country (pcs) Total Value (US$)
WOODEN UTENSILS & ORNAMENTS CARIBBEAN St. Lucia 50.00 200.00
Grand Total 50.00 200.00
15
References
Guyana Forestry Commission, Production Data, Forest Monitoring Division. Guyana Forestry Commission, Export Data, Forest Monitoring Division.