Embed Size (px)
Citation preview

Forests, Carbon andClimate Change
Forests, Carbon andClimate ChangeA SYNTHESIS OF SCIENCE FINDINGS

© 2006 Oregon Forest Resources Institute
Forests, Carbon andClimate Change
Forests, Carbon andClimate Change
A SYNTHESIS OF SCIENCE FINDINGS
A project of
The Oregon Forest Resources Institute
Oregon State University College of Forestry
Oregon Department of Forestry

Forests, Carbon and Climate Change: A Synthesis of Science Findings Chapter Three
30
Introduction
■ Climate change is a key driver of historicvegetation change.
■ Understanding climate change is importantto the stewardship of forests.
The Natural Climate System —Overview
■ New tools, computing capacity and researchhave revealed much about past climate.
■ Climate naturally cycles, with major warmand cold periods, and shorter nested cycles.
■ Climate often changes abruptly, and oftenvegetation response is dramatic.
The Natural Climate System — APrimer on Past Climates
■ The earth has experienced more than 40warm and cold cycles during the QuaternaryPeriod, i.e., the past 2.5 million years ago.
■ Climate changes in multiple cycles, frommulti-millennial to those that last a fewyears or decades, and worldwide evidenceshows life on earth has responded on eachscale.
Implications of Natural ClimateChange for Vegetation Ecology
■ Ecological conditions constantly change inresponse to climate, and species shift even inthe absence of human influence.
■ Currently, species ranges and demographicsare expected to be highly unstable.
The Human-Dominated ClimateSystem
■ Recent global average temperature is higherthan the past 1,000 years.
■ Trends since 1975 can only be explained bynon-natural forces.
■ Future scenarios depict increases ofapproximately 2.7 to 10.4 oF by 2100 andan increase in carbon dioxide concentrationsof 575-1000 parts per million.
■ Even with CO2
decreases, atmospherewould not stabilize for 100 to 300 years.
Potential Impacts of ClimateChange on Oregon Ecosystems
■ Most scenarios show temperature increasesfrom about 7 to 8 oF from the present timeto the end of the 21st century.
■ The growing season could lengthen at leastfour to six weeks.
■ In models, precipitation decreases 10-40%in summer; in winter has a range from 10%decrease to 24% increase.
■ Biomes could change dramatically;shrubland/grassland could disappear.
■ Vegetation distribution could havesignificant decreases and expansions.
■ Wet maritime forests would lose carbon,while dry ecosystems gain carbon.
■ Suppression of fire vs. uncontrolled firesgreatly alters all the scenarios.
Summary
■ Even with the latest techniques, projectionsabout future climates are difficult toforecast.
CHAPTER THREEHIGHLIGHTS:
CLIMATE CHANGE AT MULTIPLE SCALES
Chapter Three Forests, Carbon and Climate Change: A Synthesis of Science Findings
31
CHAPTER THREECLIMATE CHANGE AT MULTIPLE SCALES
Constance Millar, Ron Neilson,Dominique Bachelet, Ray Drapek and Jim Lenihan
Introduction
Concepts about the natural worldinfluence approaches to forestmanagement. In the popular press,
climate change inevitably refers to global warm-ing, greenhouse gas impacts, novel anthropogenic(human-induced) threats, and internationalpolitics. There is, however, a larger context thatinforms our understanding of changes that areoccurring – that is, Earth’s natural climate systemand its variability.
Climate change is a central focus of paleoecology,the study of past vegetation dynamics. Climatelooms large because it is a key driver of historicvegetation change at multiple spatial and tempo-ral scales, the force that sends species migratingup and down mountain ranges, expanding acrossbasins, or contracting into fragmented popula-tions. Large climate changes over thousands ofyears have triggered speciations (lineage-splittingevents that produce two or more species), and theevolution of major adaptations among andwithin species. On scales of decades and centu-ries, smaller climate changes have driven mixingand re-mixing of plant communities and cata-lyzed shifts in population size. Much as we havecome to terms in vegetation ecology with theconcepts of dynamism, such as the roles of fire,flood, and insects, we tend to view these succes-sional changes against a static background.Significant historic climate changes are oftenconsidered events of the past with little relevanceto the present or future. To the contrary, climatechanges, often abrupt and extreme, characterizethe ongoing stream of natural climate.
Without understanding these natural climateprocesses and the ways in which forest species areadapted to climate changes, decisions may bemade that are counter-productive to the forests
we wish to steward. Further, greater awareness ofthe natural climate system can put in perspectivethe specific effects of human-induced climatechanges. In the past decade, scientists haverecognized that a new, human-dominated climatesystem has emerged that diverges in significantways from the natural system (IPCC 2001). Thisbrings additional challenges to forest manage-ment beyond coping with natural changes inclimate. Because of the long residence time ofcarbon dioxide in the atmosphere, the humaninfluences on the current trajectory appear to beirreversible for decades to centuries, even withmitigation. Thus, given the dynamics of thenatural climate system and the superimposedchanges humans are causing, the 21st century isan important transitional time for undertakingboth mitigation and adaptation actions.
Given this, what can forest and resource manag-ers of private and public forest lands do toaddress these challenges responsibly? While webegin here to outline new management strategiesfor a climate context, detailed case studies anddemonstrations haven’t yet been fully developed.These will be wrought from collaborative discus-sion among colleagues – scientists, resourcemanagers, planners, and the public – and theywill be case-, location-, and project-specific.While general principles will emerge, the bestpreparation is for managers and planners toremain informed about the emerging climatescience in their region, and to use that knowledgeto shape effective local solutions. The goal of thispaper is to outline natural climate patterns andmechanisms as important context for under-standing current and future changes. Further, weprovide an update on conditions of the human-dominated climate system, especially in thePacific Northwest, and finally, briefly introducefive general principles for vegetation managementin the face of the climate change.

Forests, Carbon and Climate Change: A Synthesis of Science Findings Chapter Three
32
The Natural Climate System —Overview
Changes in weather are familiar features ofEarth’s surface, readily recognizable as dailyvariations, seasonal cycles, and annual differencesthat irregularly include extremes of drought, wet,heat, and cold. All forms of life are influenced bythis variability in how and where they live, andmitigate adverse weather effects through condi-tioned responses and evolved adaptations. Untilrecently our knowledge of climate processes overlonger time frames, however, was rudimentary.Understanding came mostly from interpretingindirect effects of climate on the earth’s surface –e.g., glacial moraines as evidence of past ice ages,coastal terraces as clues to former sea levels – andthese gave a view of slow change over time.Without direct methods for understanding pastclimate variability, there was no reason tobelieve that the past climate was relevant tothe present. All this changed with the adventof new methods.
Climate Oscillates
In the past two decades, new tools withhigh precision and resolution, newtheory based on high-speed computingcapacity, and a critical mass of empiri-cal research have revolutionizedunderstanding of earth’s climatesystem. Historic climate is nowunderstood as being far morevariable and complex than previ-ously imagined (Bradley 1999,Cronin 1999, Ruddiman 2001).Several key insights haveemerged. First, climate natu-rally changes over time and thechanges cycle, or oscillate,rather than wander randomlyor follow pervasive lineartrends (Figure 1). So, it isimportant when consideringhuman-dominated climatechange to recognize thatchange itself is natural and
precedented, and to use this natural variability asa reference for evaluation. Because climate iscyclic, distant periods in the past may be moresimilar to the present than the immediate orrecent past. Similarly, past variability may givebetter insight into the future than do currentconditions. For instance, the 20th century andespecially the middle of the 20th century (whenmany of us grew up) were the least variable andwettest decades in the past 1000 years(Graumlich 1993), and thus may inform uspoorly about future variability and potential fordrought.
Figure 1
Globaltemperaturecycles. a)Decadal cyclesdriven by oceancirculation andsea tempera-tures, b)Century cyclesdriven by solarvariability, c)Millennial cyclesdriven bychanges inearth’s orbitaround the sun.These and othercycles interactcontinually and,in combination,result in ongoinggradual andabrupt changesin earth’s naturalclimate system.Source: Millar,2003.

Chapter Three Forests, Carbon and Climate Change: A Synthesis of Science Findings
33
Climate Cycles at Multiple Scales
A second major insight is that climate has variedsimultaneously at multiple and nested scales,operating at multi-millennial, millennial, century,decadal, and interannual scales (Figure 1), andwhich are caused by independent physical mecha-nisms. Major interglacial (warm) and glacial(cold) periods cycle on multi-millennial scales.These are caused by oscillations in earth’s orbitaround the sun, which in turn, control significanttemperature changes. At the century scale, recur-ring variations in the sun’s activity drive cycles ofabout 1200-year periods. The now familiar El-Niño/La Niña cycle (called ENSO, for El-NiñoSouthern Oscillation) is an example of changes atthe interannual scale, and a similar 30 to 40 yearoscillating pattern in the Pacific Decadal Oscilla-tion (PDO) affects the west coast of NorthAmerica. These shorter cycles result from mecha-nisms internal to earth, that is, the cyclic patternsof ocean circulation and ocean temperature. Theseparate mechanisms of these various cyclesinteract and feed back to one another, creatinggradual as well as abrupt changes. Climate at anyone time is the cumulative expression of allmechanisms operating together.
Climate Often Changes Abruptly
Third, the science of past climate informs us thatmajor and minor transitions in climate state oftenoccur abruptly (a few years to decades). Climatestates are highly sensitive, catalyzed by thresholdand feedback events, triggered by random effects,and especially vulnerable during times of highvariability such as the present (NRC 2002). Forexample, although glacial/interglacial periods arelong, changes between states can be abrupt, withswitches to glacial climates occurring in only a fewdecades. A recent example at a different scale isthe western North America regime shift at 1975-1976. Abrupt, coincidental changes in the climateof the previous two decades occurred in manyvariables, including surface air temperature,precipitation, snowpack, and ocean temperature toconditions that have characterized western U.S.since the mid 1970s (Ebbesmeyer et al., 1991).
Vegetation Responds Complexly to ClimateChange
Finally, ecological and physical systems respond toclimate change at each scale. Temperature andprecipitation directly affect water availability inthe form of rain, snow, ice, and glacier, resultingin changes in streamflow, groundwater, aquifers,soil moisture, and erosion. Plants and animalsreact to climate and changes in the hydrologicsystem with shifts, often dramatic, in populationsize, range distributions, and community compo-sitions and dominances. These are often accom-panied by changes in fire regimes and insect/pathogen relations.
In the following sections, we give additional detailson basic principles of natural climate variability.
The Natural Climate System – APrimer on Past Climates
The most widely applied new method for under-standing past climates — studying core samples— was first derived from long ice cores drilledinto polar ice caps (Cuffey et al. 1995). Gasesand atmospheric particles trapped in ice faithfullyrecord atmospheric conditions at the time ofdeposition. Due to annual layering and theability to date layers accurately, analysis of thinsections at regular intervals yields high-resolutionhistoric climate data in a continuous time series.Cores drilled to the bottom of continental icesheets (e.g., Greenland) have yielded high-resolution information on more than 40 climatevariables that extend over 200,000 years (Loriuset al., 1990). The most important are isotopes ofoxygen. Ratios of heavy to normal oxygenisotopes (18O) quantify the relative amount ofoxygen stored in land ice relative to seawater, andprovide strong indicators of surface air tempera-ture at the time the isotopes were trapped in theice. Analysis of these and other climate-relatedisotopes are now routinely extracted from othersituations where undisturbed deposition occurs,such as lake beds, coral reefs, and sea floorsediments. Depending on the depth of the

Forests, Carbon and Climate Change: A Synthesis of Science Findings Chapter Three
34
deposition and the time interval between sectionsanalyzed, such sediment cores yield detailedclimate information at multi-millennial tointerannual scales, as we summarize below.
Multi-Millennial Climate Cycles
Taken together, these long records collectivelydocument the repeating, cyclic nature of climateduring the Quaternary, or past 2.5 million years(Figure 2, Wright 1989; Raymo and Ruddiman1992). Unlike earlier assumptions of persistentice ages, oxygen-isotope records show a repeatingpattern of over 40 glacial (cold) /interglacial
(warm) cycles, with global temperature differencesbetween cycles averaging 11 to 15oF (Petit et al.1999). A startling insight revealed by the oxygen-isotope records is the overall similarity of our past10,000 years to similar warm interglacial periodsthroughout the Quaternary. Recent climate cyclesare not wholly novel after all.
The oxygen-isotope data further reveal a repeatingstructure of climate variability within glacial andinterglacial phases (Lorius et al., 1990). Extensivecold glacial periods were interrupted by warmperiods. A pattern emerged: interglacials beganabruptly, peaked in temperature in early to middlecycle, and ended in a series of steps, each with
abrupt transitions, into the cold of another glacialperiod. The cumulative effect is a sawtoothpattern typical of Quaternary climate recordsaround the world (Figures 1, 2).
Importantly, the pattern of historic temperaturechange synchronizes with changes in carbondioxide and methane. Concentrations of carbondioxide (CO
2) during previous warm interglacial
periods were about the same as the peak naturallevels of the Holocene (the past 10,000 years),about 300 ppm, while during cold glacial periods,concentrations lowered to 190-200 ppm. Thetightly synchronous changes in temperature and
greenhouse gases suggest a mecha-nistic relationship. Althoughvariable CO
2 concentrations are
not the primary cause of cold –warm cycles, it is thought thatthey played a role. There weretimes when changes in CO
2
concentration preceded changesin temperature and vice versa.
The leading theory is that asglaciers advance, the CO
2 concen-
tration is reduced through in-creased carbon sequestration inthe oceans and ocean sediments,creating a negative feedbackinducing further cooling. How-ever, when the planet begins towarm, CO
2 is released from the
oceans, creating a positive feedback and increasingthe rate of warming. It is estimated that about halfof the glacial – interglacial temperature change isdue to the greenhouse gas feedbacks (Petit et al.,1999). This may help explain the asymmetryobserved in glacial – interglacial cycles, with slowcooling and rapid warming. The potential CO
2
increase through the 21st century may be sufficient(at the upper end of the uncertainty bounds) toinduce a temperature increase that is of themagnitude of a full glacial – interglacial cycle(IPCC 2001).
A mechanistic cause for the overall glacial/intergla-cial climatic oscillations was proposed by Serbian
Figure 2Temperaturefluctuationsbetween glacialand interglacialperiods of thepast 2.5 millionyears. Derivedfrom oxygen-isotope analysis ofice cores from theGreenland icesheet. Currentinterglacial period(Holocene) is atthe far left, from0-10,000 yearsago. FromWright, 1989.

Chapter Three Forests, Carbon and Climate Change: A Synthesis of Science Findings
35
mathematician Milatun Milankovitch(Milankovitch 1941) long before detailed past-climate variability had been documented.Milankovitch integrated knowledge about earth’sorbit around the sun into a unified theory ofclimate oscillations. This has been revised subse-quently into a modern orbital theory that is widelyaccepted as the mechanism that controls the iceages (Imbrie et al., 1992, 1993).
Three major cycles of orbital variability recur overtime (Figure 3, Hays et al. 1976): (1) change in theshape of earth’s orbit around the sun from ellipticalto circular (100,000 years), (2) change in the angleof earth’s tilt on its axis (41,000 years), and, (3)change in time of year when the earth is closest tothe sun (23,000 years). The amount of heat fromthe sun reaching the earth at any point in timevaries with the earth’s position in each cycle.Integrating the three cycles mathematically resultsin a curve over time of predicted temperature onearth that corresponds to the observed changes inoxygen-isotope concentration, and thus thesawtooth pattern of periods of warm and cold.(e.g., Figures 1, 2).
Century- to Millennial-Scale Climate Cycles
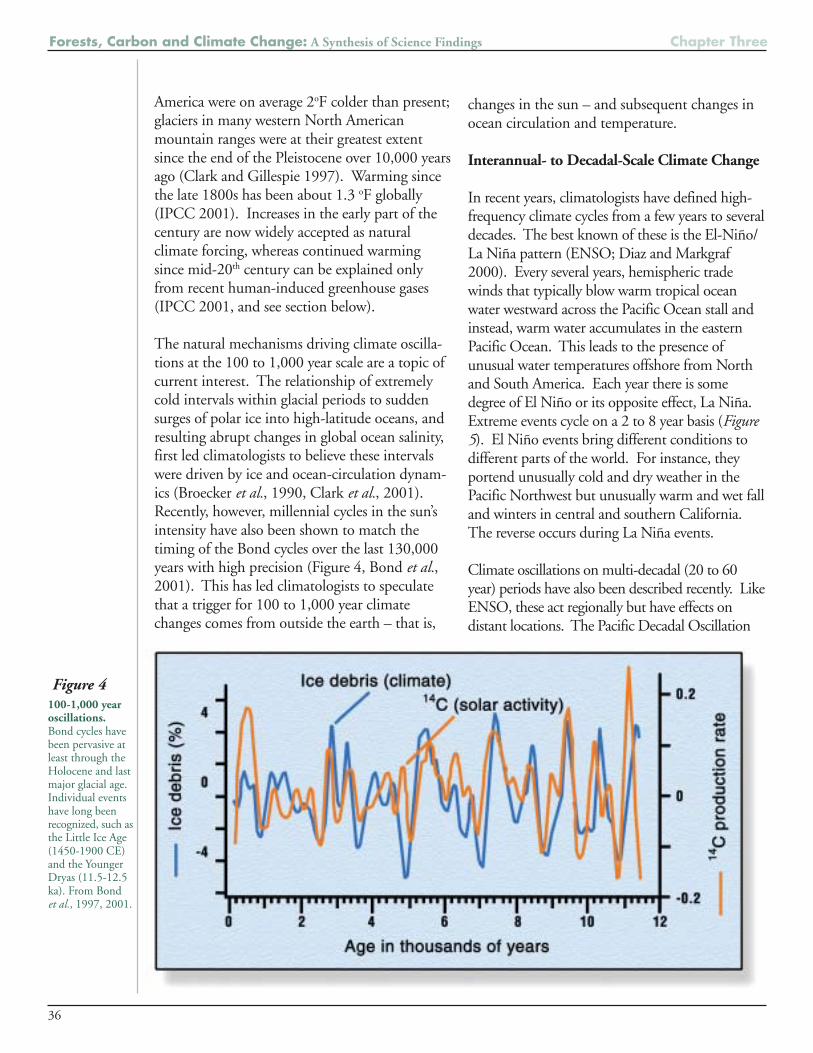
Within these cycles that extend over tens tohundreds of thousands of years are shorter,orbitally-driven climate cycles or “events” —extremely cold or warm intervals — that last fromone hundred to a thousand years. These climateevents are increasingly understood as part of apervasive oscillation pattern, now called “Bondcycles,” documented for at least the last 130,000years (Bond et al., 1997). Bond cycles average1300-1500 years, meaning that each warm or coldphase lasts about 700 years, and the peak warmand cold phases last about 350 to 450 years (Figure4). Climate intervals during the Holocene thatexemplify Bond cycles include the Little Ice Age, asignificant ice advance and global cold period from1450-1920 (Grove 1988; Overpeck et al. 1997);the Medieval Climate Anomaly, a warm, dryinterval from 900-1350 (Hughes and Diaz 1994,Stine 1994, Esper et al., 2002); and the so-called8200 year (ago) cold event (Alley et al., 1997).
Painstaking analysis at high resolution of severalwell-known Bond intervals has documented thatoscillations often begin and end extremelyabruptly. For example, a study of the majorcollapse of ice at the end of the Younger Dryascold event (11,500-12,500 years ago) revealed thata 27oF warming occurred in two 10-year periodsseparated by a 20-year plateau of no detectabletemperature change (White et al., 2001).
Of particular interest at this time scale is thewarming of the 20th century. During the Little IceAge (1450-1920) temperatures in western North
Figure 3Primary orbitalcycles of theearth. Thefundamentalmechanism foroscillatingclimates of thepast 2.5 millionyears. Tempera-tures on earthvary dependingon how muchheat from thesun (solarinsolation)reaches earth’ssurface. This inturn variesdepending onthe exactposition of earthwithin each ofthree orbitalcycles. Math-ematicalintegration ofthe three curvesproduces a graphof temperatureover time thatcloses matchestemperaturereconstructionsfrom 18O, e.g.,Figure 1. Datasource: Science,Variations in theEarth’s Orvit:Pacemaker of theIce Ages. 1976.
Forests, Carbon and Climate Change: A Synthesis of Science Findings Chapter Three
36
America were on average 2oF colder than present;glaciers in many western North Americanmountain ranges were at their greatest extentsince the end of the Pleistocene over 10,000 yearsago (Clark and Gillespie 1997). Warming sincethe late 1800s has been about 1.3 oF globally(IPCC 2001). Increases in the early part of thecentury are now widely accepted as naturalclimate forcing, whereas continued warmingsince mid-20th century can be explained onlyfrom recent human-induced greenhouse gases(IPCC 2001, and see section below).
The natural mechanisms driving climate oscilla-tions at the 100 to 1,000 year scale are a topic ofcurrent interest. The relationship of extremelycold intervals within glacial periods to suddensurges of polar ice into high-latitude oceans, andresulting abrupt changes in global ocean salinity,first led climatologists to believe these intervalswere driven by ice and ocean-circulation dynam-ics (Broecker et al., 1990, Clark et al., 2001).Recently, however, millennial cycles in the sun’sintensity have also been shown to match thetiming of the Bond cycles over the last 130,000years with high precision (Figure 4, Bond et al.,2001). This has led climatologists to speculatethat a trigger for 100 to 1,000 year climatechanges comes from outside the earth – that is,
changes in the sun – and subsequent changes inocean circulation and temperature.
Interannual- to Decadal-Scale Climate Change
In recent years, climatologists have defined high-frequency climate cycles from a few years to severaldecades. The best known of these is the El-Niño/La Niña pattern (ENSO; Diaz and Markgraf2000). Every several years, hemispheric tradewinds that typically blow warm tropical oceanwater westward across the Pacific Ocean stall andinstead, warm water accumulates in the easternPacific Ocean. This leads to the presence ofunusual water temperatures offshore from Northand South America. Each year there is somedegree of El Niño or its opposite effect, La Niña.Extreme events cycle on a 2 to 8 year basis (Figure5). El Niño events bring different conditions todifferent parts of the world. For instance, theyportend unusually cold and dry weather in thePacific Northwest but unusually warm and wet falland winters in central and southern California.The reverse occurs during La Niña events.
Climate oscillations on multi-decadal (20 to 60year) periods have also been described recently. LikeENSO, these act regionally but have effects ondistant locations. The Pacific Decadal Oscillation
Figure 4100-1,000 yearoscillations.Bond cycles havebeen pervasive atleast through theHolocene and lastmajor glacial age.Individual eventshave long beenrecognized, such asthe Little Ice Age(1450-1900 CE)and the YoungerDryas (11.5-12.5ka). From Bondet al., 1997, 2001.

Chapter Three Forests, Carbon and Climate Change: A Synthesis of Science Findings
37
(PDO, Figure 5) affects western North America. Itappears to be regulated by decadal changes in oceancirculation patterns in the high-latitude PacificOcean (as opposed to ENSO’s tropical locus), andyields climate effects and regional patterns similar toextended ENSO effects (Mantua et al., 1997,Zhang et al., 1997). Warm (or positive) phases areextensive periods (10 to 25 years) of El Niño-likeconditions that alternate with cool (or negative)phases of La Niña-like conditions. Other suchmulti-decade, ocean-mediated patterns affect otherparts of the world (Cronin 1999).
Climate as a Force of Ecological Change
Abundant evidence worldwide indicates that lifeon earth has responded to climate change at eachof these scales. Changes in biota over time can bemeasured in many ways, such as from sedimentcores taken from wet areas including meadows,bogs, lakes, and ocean bottoms. In dry environ-ments, packrat middens preserve macrofossils,while in temperate forests, tree-ring recordsarchive annual tree growth.
At multimillennial scales, ecological records of thepast collectively document that, at any one place,compositions of species changed significantly in
correspondence with major climate phases.Often, changes showed complete species turn-over. In relatively flat terrain, such as in north-eastern United States, eastern Canada, parts ofScandinavia, and northern Asia, species shiftednorth and south hundreds of miles, as modeled,for example, for spruce (Picea) in eastern NorthAmerica (Figure 6, Jackson et al., 1987). Bycontrast, in mountainous regions, plant species
PDO and ENSO. PositiveENSO (El-Niño)and PDOperiods bring warm, wetconditions to certain parts ofthe world, while negativeENSO (La Niña) and PDObring cool, dry conditions.From Mantua et al., 1997 andENSO website: http://tao.atmos.washington.edu/pdo/
Figure 5
Figure 6
Shift in ranges ofspruce (Picea)forests in easternNorth America.
Changingtimes (ka isthousands ofyears ago)from the LastGlacialMaximum topresent .From Webbet al., 1987.

Forests, Carbon and Climate Change: A Synthesis of Science Findings Chapter Three
38
responded primarily by moving in elevation, asindicated by conifers of the Great Basin andsouthwestern desert region, which shifted as muchas 4500 ft (Figure 7, Thompson 1988, 1990,
Grayson 1993). Before temperature proxiessuch as oxygen isotopes provided independentmeasures of historic climate, millennial-scaleabrupt climate events were inferred fromchanges in flora and fauna. For instance, theYounger Dryas cold interval was known fromchanges in abundance of the arctic tundraplant Dryas octopetala (Jensen 1935).
Significant and rapid response of vegetation tocentury scale climate change is also well-documented, although elevation shifts arelower and migration distances smaller than forlonger time scales. Many examples now showfluctuating changes of vegetation correspond-ing to Bond cycles, which average 1300-1500years. An illustrative example is the abruptchange in pine versus oak vegetation insouthern Florida that corresponds to Heinrichevents (extremely cold intervals 100 to 1,000years ago) (Figure 8, Grimm et al., 1993). InCalifornia, abrupt changes in the dominanceof oak versus juniper corresponded to rapidclimate oscillations of the last 160,000 years(Heusser 2000). In the Great Basin of NorthAmerica, major changes in population sizeand extent of pinyon pine (P. monophylla)
correspond to Bond-scale cycles (Tausch et al.2004). Whereas recurring patterns emerge atcoarse scales, species responses are individualistic,lags are common, and nonlinear patterns frequent,
so that population increases or decreases maynot appear to be “in synch” with climate change,especially when climate changes are extreme andabrupt (Jackson and Overpeck 2000)
Vegetation responds also to interannual anddecadal variability. At the ENSO scale, changesoccur primarily in plant productivity andabundance within populations. The oscillationscontribute to regional fire regimes, where fuelloads build during wet years and burn duringdry years (Swetnam and Baisan 2003). Theselead to mid-scale vegetation changes as ENSOitself cycles, and thus fire regimes change overtime (Swetnam and Betancourt 1998,Kitzberger et al., 2001). Decadal climate andvegetation oscillations have been well-docu-
Glacial/interglacialshifts inelevation forplant species ofthe SheepRange,southernNevada.Current (solidline) and past(dots) elevationlimits, andindividualisticresponses ofspecies. FromThompson,1990.
Figure 7 Figure 8
Abundance of pine from Lake Tulane, Florida (indicated by pollen%, left panel) correlates with millennial scale cold, or Heinrich, eventsof the last glacial period (indicated by % lithics, or ice-rafted rockdebris, right panel). Data from Grimm et al., 1993.

Chapter Three Forests, Carbon and Climate Change: A Synthesis of Science Findings
39
mented in secondary growth of trees, such asrecurring droughts over the past 2,000 years thatled to reduced ring-widths in ponderosa pine inNew Mexico (Grissino-Mayer 1996). Otherexamples are the recurring pattern of ring-widthsin bigcone Douglas-fir (Pseudotsuga macrocarpa;Biondi et al., 2001), mountain hemlock (Tsugamertensiana; Peterson and Peterson 2001) andsubalpine fir (Abies lasiocarpa; Peterson et al. 2002)that correlate with PDO for up to 400 years in thepast. Vegetation-type conversions from meadow toforest, changes in species growth rates and crownmorphology, and changes in forest density wereassociated with PDO cycles in conifer forests of theSierra Nevada, California (Millar et al., 2004).
In perspective, a key characteristic of Quaternarypaleoecology for the past million years is that eachplant species responds to specific climatic cues withits own unique rate and sensitivity. Individualspecies follow their own ecological trajectories asclimates cycle, leading to changes in communitycompositions that themselves form, dissolve, andmay reform over time. Often non-analog commu-nities (that is, species combinations that do not existcurrently) have formed. From this perspective, plantcommunities exist as transient assemblages; speciesmove individually through time and space followingfavorable climates and environments.
Implications of Natural ClimateChange for Vegetation Ecology
This brief background of natural climate cyclingand its effects on vegetation provides insights intoconcepts of forest dynamics and vegetationecology. We offer a few examples below.
Sustainability
Ecological sustainability is a dominant operatingparadigm for forest management. It implies theendurance of species, communities, and ecosys-tems over time, and is often used as implicit orexplicit forest management and restoration goals(e.g., Jordon et al., 1990, Lele and Norgaard1996). In practice, sustainability has been difficultto describe or to recognize. Generally, it is ac-
cepted to exist when natural species diversity ismaintained, species are abundantly distributedthroughout their recent historic native range,community associations are maintained, naturalprocesses occur at reference intervals and condi-tions, and human disturbance is minimized(Lackey 1995, Hunter 1996).
The complex and recurring cycles of ecologicalchange in response to climate cycling challengethis interpretation of ecological sustainability.Species ranges have, and will — even in theabsence of human influence — shift naturally andindividualistically over small to large distances asspecies follow, and attempt to equilibrate with,changes in climate. In the course of adjustment,plant demography, dominance and abundancelevels change, as do the relationships of plant andanimal species in local communities.
A major conclusion from past records is that, atscales from years to millennia, ecological conditionsare not in equilibrium, do not remain stable, nor arethey sustained, but, by contrast, are in ongoing stateof change (Jackson and Overpeck 2000).Paleorecords challenge interpretations of ecologicalsustainability that have emphasized persistence ofspecies and stability of communities within currentranges. As widely used, such concepts ofsustainability do not adequately accommodatenatural dynamics, and promote misinterpretationsabout the behavior of natural systems.
It is important to note that the time scales underdiscussion are short relative to the lifespans of mostexisting plant species. Many native North Ameri-can plant species originated 20 to 40 million yearsago, and thus have been subjected to the demandsof shifting climates, at both large scales and small,throughout their histories. This implies thatadaptation to abrupt climate changes has hadmany opportunities to evolve. Resilience andsustainability, at least in terms of species persis-tence, appear to have been met through thecapacity of plants to track favorable environ-ments as they shift over time, and throughadjustment in range distribution, habitat,associates, and population characteristics.

Forests, Carbon and Climate Change: A Synthesis of Science Findings Chapter Three
40
Population Size, Population Abundance, andNative Species Range
Changes in population size and abundance, and inoverall range – observed through monitoring orother measures – are often assumed to be human-induced, whereas these may be natural speciesresponses to climate change. For instance, speciesof oak (Quercus) and juniper (Juniperus) expandand contract in complementary fashion: oakpopulation and range distribution expandedrepeatedly during warm climates and contractedduring cool climates while the opposite occurredfor juniper species (Adam and West 1983, Heusser1995). Although oaks in general are widespreadand common in southern Oregon and Californianow, during repeated long glacial periods theywere rare in the region. Although these changesare most obvious between long-term glacial andinterglacial times, significant changes in abun-dance occur at climate scales as short as a decade(Heusser and Sirocko 1997).
This perspective of vegetation dynamics over thepast million years compels us to evaluate causes forchanges in population size, abundance, and nativerange more carefully. Rather than interpretingchange as resulting from undesired human-induced threat, we might investigate insteadwhether these are natural species adaptations. Forinstance, Juniperus expanding in Great Basinrangelands has been considered an exotic invasive,and measures have been taken to remove plants.However, this expansion appears to be an adaptiveresponse to climate change (Nowak et al., 1994).Other things being equal, an ecologically-in-formed resource management action might be toencourage and not thwart juniper expansion.
Although changes in population size and distribu-tion may be natural responses to climate change,causes are often difficult to discern in practice.Lags in adjustment and other imbalances betweenpopulation distributions and climate mean thatpopulation changes may not be synchronous withclimate change, especially when rapid climatechanges occur over short times, making the searchfor mechanistic causes difficult (Jackson and
Overpeck 2000). Because individual plants,unlike animals, cannot “pick up and move,” theymigrate by dying in some areas while expanding inothers. These may appear poorly segregated onthe landscape – with patchiness and irregularitycharacteristic – making the effects difficult toevaluate while they’re happening. Causes may beattributed readily to other proximal factors, such asto insects and pathogens, or human-inducedeffects such as fire suppression, even where climateis the underlying, ultimate factor.
A challenging question for vegetation ecologybecomes, “what is the native range of a species?”The native range is the basis for monitoring itscondition, understanding favorable habitat andecological interactions, diagnosing threats andrisks, determining restoration targets, and indict-ing species as “exotic” (Jackson 1997). Viewedagainst historic changes in distribution andnatural flux, the native range of a species must beconsidered a transient and dynamic process itself,readily capable of moving in space as climateshifts over the landscape.
Population abundances and species’ distributionranges may be relatively stable whenever climate isin a more stable phase, or if the environment of aspecies offers considerable local diversity (Thomp-son 1988, Jackson and Overpeck 2000). In thesecases, shifts in climate may be tracked with rela-tively minor overall geographic changes.
By contrast, in situations that are sensitive tochange, for instance landscapes with little topo-graphic diversity, even small shifts in climate maybring large changes in population condition.Given that the 20th and 21st centuries are undergo-ing rapid change in climate with high variability,we would expect population demographics andspecies ranges to be now highly unstable.
Reference Conditions and Restoration Targets
“Pre-disturbance” or “pre-EuroAmerican impact”conditions are used routinely as reference modelsand descriptions of desired targets for ecologicalrestoration. This assumes, however, that climate

Chapter Three Forests, Carbon and Climate Change: A Synthesis of Science Findings
41
hasn’t changed between the historic targettime and the present.
In western North America, the distur-bance period is regularly assumed to startat European/Asian contact with nativepeoples and their landscape, about 1840-1860, and the centuries prior are used aspre-disturbance reference conditions. Asthat period coincides with the coldest partof the Little Ice Age, however, it makes apoor model for 21st century restoration.Even in eastern North America, whereEuropean contact with the landscape wasseveral centuries earlier, the dominantclimate was Little Ice Age, with ecologicalconditions very different from present.Although “pre-modern contact” timesdiffer around the world, the point re-mains: because of climate change, historicconditions are likely to be very differentfrom present, and thus poor models forforest management or restoration.
The Human–Dominated Cli-mate System
Given the dynamics of the natural climate systemin the past, it is not surprising that climate wouldbe changing now as well. Considering the past1,000 years, the amplitude of natural temperaturecycles has been about +/- 2oF from the average ofthe mid-20th century. It was warmer by thisamount during the Medieval centuries and colderduring the Little Ice Age. The natural mechanismsthat led to the Little Ice Age reversed in the late1800s, and by 1900, temperatures again beganwarming. So where do humans begin to influencethe climate system and global warming?
The Global Perspective
In 1988, the World Meteorological Organizationand the United Nations Environment Programmeformed the Intergovernmental Panel on ClimateChange (IPCC). The role of the IPCC is to assesson a comprehensive, objective, open, and transpar-ent basis the scientific, technical and socio-eco-
nomic information relevant to understanding therisk of human-induced climate change, its poten-tial impacts and options for adaptation andmitigation. The IPCC’s Scientific AssessmentReports, issued in 1990, 1995, 2001, with afourth anticipated for 2007, are widely accepted asrepresenting a synthesis of the world’s scientificconsensus on recent climate change.
A key question the IPCC addresses is: how hasglobal temperature changed over the last 100 years,and how has this compared to the past 1,000 years?Answers to the first question came from compila-tions of instrumental data across earth’s surfaceand indicate a temperature increase of 1.3oF overthe 20th century (Figure 9, IPCC 2001). Tem-perature increase relative to the past 1,000 yearshas resulted in a number of interpretationsdepending on the nature of the climate indicator(such as tree rings, corals, ice cores, etc.) and thestatistical interpretation. The global average
Figure 9Global meansurface airtemperaturechanges (°C)over the past140 and 1000years. FromIPCC, 2001.

Forests, Carbon and Climate Change: A Synthesis of Science Findings Chapter Three
42
temperature in the late 20th century was higherthan global averages over the last 1,000 years,although some regions experienced significantlywarmer conditions. Regardless of relative changein the earlier centuries, the trend of increasingtemperature late in the 20th century is clear in allinterpretations.
Another key question for the IPCC analyses is:are globally observed 20th-century warming trendsthe result of natural processes or human influencesvia greenhouse gas emissions? This question is nowanswered with high confidence: the trends inglobal climate since about 1975 can only beexplained by non-natural forces. Without humaninfluence, the models indicate that the naturalclimate systems would be cooling slightly, as aresult of solar activity and atmospheric dimmingfrom volcanic aerosols. The observed warmingtrends are duplicated in models only whenhuman-induced greenhouse gas emissions(carbon dioxide, methane and others), and theirfeedback effects, are added to the models (IPCC2001).
The IPCC also has been charged to generatemodels of future climates, called scenarios, whichrely on an increasing array of General CirculationModels. Diverse models are used to generate arange of results that derive from different ap-proaches, as well as starting assumptions. Theseinclude, for instance, different emissions condi-tions, such as “business as usual” (no changefrom current practices), doubled, and tripledCO
2 levels. The ensemble of scenarios depict a
global average temperature increase of approxi-mately 2.7 to 10.4oF by 2100 (Figure 10) and arange in CO
2 concentrations of 575 to 1000
ppm. Considering the extreme values in theseranges, the last time global temperature was thiswarm was during the last interglacial period,about 120,000 years ago, and the last time CO
2
concentrations were this high was about 120million years ago when earth was in a radicallydifferent atmospheric, tectonic, and environmen-tal condition than present (Berner 1990).
Elevated levels of atmospheric CO2 have direct
effects on ecosystems in addition to influencingclimate. Some of these arelikely to be detrimental,such as affecting thesuccess of unwantedinvasive species (Ziaska2003), and increasingacidification of oceanswith cascading effects onocean biota. The role ofincreased efficiency ofphotosynthesis by plantshas been touted as benefi-cial for the fertilizingeffect on tree growth andchanges in water-useefficiency. Increasingly,studies show this is not auniversal effect, and thatthe additional photosyn-thate is not always storedin wood nor does itnecessarily result in
accelerated growth. Depending on species, age,and time since exposure, CO
2 may be stored in
Figure 10 Global mean surface air temperatures (°C) projected for the 21st
century and plotted with the observed temperature trend prior to 2001.Multiple lines after 2100 indicate different results from climate models;bars show ranges for each model. From IPCC, 2001.

Chapter Three Forests, Carbon and Climate Change: A Synthesis of Science Findings
43
stems, roots, or fruits. Old-growth forests mayrespond less than young trees, and all forestsstudied show a capacity to acclimate to the highlevels of CO
2 such that growth increases initially,
then declines (Körner et al., 2005).
Cascading environmental effects from a continu-ally warming world are already widely docu-mented and projected to accelerate. Theseinclude decreased arctic ice cover (down 23%since first monitored in 1979); increasing sealevel as sea ice and ice caps melt (CCSP 2005);changes in earth surface albedo (surface reflec-tance) as bare ground is exposed in the Arctic,and especially as shrubs invade (Chapin et al.,2005); worldwide retreat of mountain glaciersand ice caps (averaging approximately 50%decline over the western U.S. during the 20th
century, Mennis and Fountain 2001); decreasedsnowpack accumulation and associated decreasesin streamflow (Dettinger and Cayan 1995);increases in amplitude of extreme weather events(hurricanes, drought, flood, CCSP 2005);“greening up” (i.e., increases in density) oftemperate lowland and montane forests, followedby “browning down” (mortality) as a result ofepic forest dieback and uncharacteristically severewildfires (Westerling et al., 2003, Breshears et al.,2005); and loss of alpine ecosystems as high-elevations species move upward off the tops ofpeaks (Pauli et al., 2003).
An important take-home message from the IPCCanalyses is the time required for the climatesystem to equilibrate reductions in CO
2. Assum-
ing greenhouse gas emissions peak and could berestored to early 20th-century levels within thenext 50 years, the residence time of CO
2 in the
atmosphere is such that it would not stabilize for100 to 300 years, and temperature would notstabilize for the same amount of time (IPCC,2001). Thus, the scenarios for the 21st centuryshow best-case assumptions for greenhouse gasemissions; if they are not controlled, climatechanges will be significantly amplified. Theeffects of human-caused emissions on climate,
combined with land-use changes that affectclimate, give rise to the recognition that a hu-man-dominated climate system is characteristicof the new millennium.
Potential Impacts of Climate Changeon Oregon Ecosystems
The potential future impacts of climate changeon ecosystems in the Northwest have beenestimated using a variety of climate and vegeta-tion models. Following are new estimates thatbuild upon earlier work that contributed to aNational Assessment of the potential impacts ofclimate change, which was sponsored by the U.S.Global Change Research Program (Bachelet etal., 2001).
Temperature and Precipitation
The future climate scenarios presented here usethree general circulation models, coupled withdynamic ocean models, each simulating twoIPCC greenhouse gas emissions scenariosthrough the 21st century, moderately high (A2)and moderately low (B2).1 The three globalclimate models were developed in Canada(CGCM2), the United Kingdom (HADCM3),and Australia (CSIRO).
The scenarios show temperature across Oregonincreasing from the present time to the end of the21st century from about 7 to 8 oF, which canlengthen the growing season by at least four to sixweeks (Figure 11). For precipitation, the sce-narios show a range in winter of 10% decrease to24% increase, but decreases of 10 to 40 % insummer (a relatively small amount since sum-mers are generally dry). The potential winterdecrease is important because previous studieshad shown significant increases in Northwestprecipitation (NAST 2000).
1 Intergovernmental Panel on Climate Change, Special Report on Emissions Scenarios, IPCC SRES A2 and B2 were used in a new andongoing assessment of the impacts of climate change over North America (Price et al., 2004).

Forests, Carbon and Climate Change: A Synthesis of Science Findings Chapter Three
44
The VINCERA Project
A new class of ecosystem model called DGVMs,or Dynamic General Vegetation Models, combinesadditional types of data for improved forecasts ofprojected climate changes on natural ecosystems.These new models combine two traditionallyseparate fields within ecology — the distributionof vegetation, and biogeochemical cycling (hownutrient cycling affects plant productivity). Inaddition, DGVMs also include a third element,wildfire simulation, which can be a large compo-nent of the flux of carbon back to the atmosphere.
Three Dynamic General Vegetation Models —simulating changes in vegetation distribution,carbon balance, and disturbances from droughtand fire — were analyzed more broadly in aproject known as VINCERA, Vulnerability andImpacts of North American Forests to ClimateChange: Ecosystem Responses and Adaptation.
Results from one of these vegetation models,MC1 (MAPSS-CENTURY, version 1), arepresented here.
a. Impacts of Climate on Future Distribution ofVegetation
Figure 12 shows Observed (current) vegetationfor the Northwest, compared with two simula-tions under Historical Climate (1961 to 1990,with and without fire suppression) and sixscenarios of Future Vegetation Distributionsimulated for the end of the 21st century (2070to 2099). This figure depicts six future climatescenarios developed by the three climatemodeling groups, each using two differentassumptions of future greenhouse gas emissions(A2, medium high; B2, medium low).
The two historical simulations are reasonablerenditions of the observed current natural
Historical andsimulated futuretrends intemperature andprecipitationover Oregon.The scenarioswere producedfrom three globalclimate models(GCM), theAustralianClimate Center(CSIRO), theCanadianClimate Center(CGCM2) andthe HadleyCenter of theUnited KingdomMeteorologicalOffice(HADCM3).Each GCM wasrun with twodifferent assumedtrajectories ofgreenhouse gasemissions, amoderately highscenario (A2) anda moderately lowscenario (B2).The emissionsscenarios aredesignated with‘a’ for A2 or ‘b’for B2, coupledwith the GCMdesignation todistinguish eachof the sixscenarios. Seetext for additionalexplanation ofscenarios.
Figure 11

Chapter Three Forests, Carbon and Climate Change: A Synthesis of Science Findings
45
vegetation distribution. Theapparent overabundance ofboreal forest (blue) is not amajor problem, since theboreal trees are functionallyvery similar to the temperateconifer forest shown in theobserved map. The histori-cal simulations demonstratethe effect of fire suppression,implemented in the modelin 1950, on the expansion ofwoodlands and savannas(juniper and ponderosapine) into the sagebrushvegetation in eastern Oregonin recent decades. This is awell-described phenomenonand is currently threateningnumerous sagebrush habitatsfor wildlife.
The simulations of futurevegetation distributioninclude no fire suppressionand yet in all scenarios, theinterior shrublands/grass-lands are overtaken byexpansion of woodlands (e.g.juniper), savannas (e.g.Ponderosa pine), or conti-nental conifer forests (e.g.Douglas-fir), due to in-creases in precipitation,enhanced water use effi-ciency from elevated CO
2
and a lengthened growingseason. The maritime forestsalong the wet coastal regions are displaced inmany future climate scenarios by the “warmtemperate-subtropical mixed forest,” or theinterior conifer forests. Overall, there is anincrease in broadleaf vegetation amidst theconifer forests, both along the coast andinland, suggesting expansions of species suchas alder, maple, madrone, oak, pines andother Klamath region and California species.
Figure 12Vegetation distribution. Observed, simulated historical and future vegetationdistribution. The two historical simulations (with and without fire suppres-sion) show a reasonable comparison to the ‘observed’ current vegetationdistribution. The primary features to note are the maritime forests along thewet coastal regions (dark green) and the interior, dry sagebrush regions (gray).The maritime forests are displaced in many future climate scenarios by the‘Warm Temperate-Subtropical Mixed forest’, or the interior conifer forests. Inall scenarios, the interior shrublands/grasslands are overtaken by expansion ofwoodlands (e.g. Juniper), savannas (e.g. Ponderosa Pine), or continental coniferforests (e.g. Douglas-fir). See text for further details.
Forests, Carbon and Climate Change: A Synthesis of Science Findings Chapter Three
46
b. Impacts of Fire on Future Distribution ofVegetation
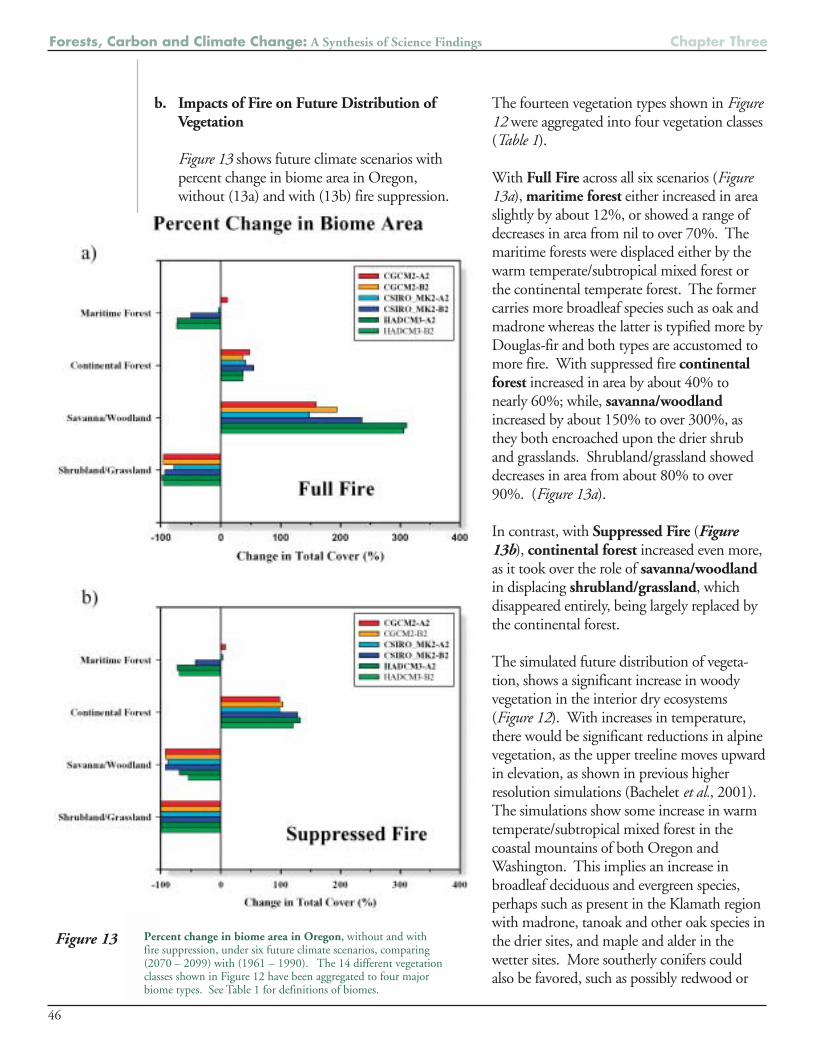
Figure 13 shows future climate scenarios withpercent change in biome area in Oregon,without (13a) and with (13b) fire suppression.
The fourteen vegetation types shown in Figure12 were aggregated into four vegetation classes(Table 1).
With Full Fire across all six scenarios (Figure13a), maritime forest either increased in areaslightly by about 12%, or showed a range ofdecreases in area from nil to over 70%. Themaritime forests were displaced either by thewarm temperate/subtropical mixed forest orthe continental temperate forest. The formercarries more broadleaf species such as oak andmadrone whereas the latter is typified more byDouglas-fir and both types are accustomed tomore fire. With suppressed fire continentalforest increased in area by about 40% tonearly 60%; while, savanna/woodlandincreased by about 150% to over 300%, asthey both encroached upon the drier shruband grasslands. Shrubland/grassland showeddecreases in area from about 80% to over90%. (Figure 13a).
In contrast, with Suppressed Fire (Figure13b), continental forest increased even more,as it took over the role of savanna/woodlandin displacing shrubland/grassland, whichdisappeared entirely, being largely replaced bythe continental forest.
The simulated future distribution of vegeta-tion, shows a significant increase in woodyvegetation in the interior dry ecosystems(Figure 12). With increases in temperature,there would be significant reductions in alpinevegetation, as the upper treeline moves upwardin elevation, as shown in previous higherresolution simulations (Bachelet et al., 2001).The simulations show some increase in warmtemperate/subtropical mixed forest in thecoastal mountains of both Oregon andWashington. This implies an increase inbroadleaf deciduous and evergreen species,perhaps such as present in the Klamath regionwith madrone, tanoak and other oak species inthe drier sites, and maple and alder in thewetter sites. More southerly conifers couldalso be favored, such as possibly redwood or
Figure 13 Percent change in biome area in Oregon, without and withfire suppression, under six future climate scenarios, comparing(2070 – 2099) with (1961 – 1990). The 14 different vegetationclasses shown in Figure 12 have been aggregated to four majorbiome types. See Table 1 for definitions of biomes.

Chapter Three Forests, Carbon and Climate Change: A Synthesis of Science Findings
47
even some pines. However, slow migratoryrates of southerly (California) species wouldlikely limit their presence in Oregon throughthe 21st century (Neilson et al., 2005). Thedrier interior vegetation shows a large increasein savanna/woodland types, suggesting possi-bly juniper and yellow pine species rangeexpansions. Also, if winter temperatures warmsufficiently, then hard frosts could become lessfrequent and open the door to an entire floraof frost-sensitive species from the Southwestpotentially displacing many native easternOregon species over the course of decades tocenturies (Neilson et al., in press).
Hotter temperatures would enhance evapora-tive demand, tending to drought-stress thevegetation. However, that is somewhat
countered, or even reversed, if it is also accom-panied by increases in precipitation, as well asthe increased water use efficiency of thevegetation from elevated CO
2 concentrations.
Decreases in summer precipitation, accompa-nied by a longer growing season, would tendto increase the drought stress. However, thefuture scenarios show an increase in winterprecipitation. There is speculation that asglobal oceans warm, the world could shift into amore positive PDO regime, similar to anextended El Niño (Mote et al., 2003). Theseconditions often shift storms away from theNorthwest, creating dry conditions.
Fire increases significantly in the coast rangeand Willamette Valley in Oregon in the absence
Table 1.MC1 vegetation type aggregation scheme andregional examples of the vegetation classes
Vegetation Class Vegetation Type Regional Examples
Maritime Forest
Continental Forest
Savanna / Woodland
Shrubland / Grassland
Maritime Temperate Conifer ForestCool Temperate Mixed ForestWarm Temperate/Subtropical
Mixed ForestTemperate Deciduous Forest
TundraBoreal ForestContinental Temperate Coniferous
Forest
Temperate Conifer SavannaTemperate Conifer XeromorphicWoodland
Temperate Arid ShrublandC3 GrasslandC4 Grassland
Sitka Spruce – WesternRed Cedar – WesternHemlock - Douglas-fir ForestAlder – Maple – Oak ForestsMixed Conifer ForestPonderosa Pine ForestTanoak–Madrone–Oak ForestCoastal Redwood Forest
Alpine MeadowsAspenSubalpine Forest – True firs –
Mountain HemlockDouglas-fir – Western Hemlock
Forest
Yellow Pine SavannaDouglas-fir–TanoakSavannaMixed Conifer Savanna
Sagebrush SteppePalouse

Forests, Carbon and Climate Change: A Synthesis of Science Findings Chapter Three
48
of fire suppression in all scenarios, especially thedrier Hadley (HADCM3) and Australian(CSIRO) scenarios (Figure 15). The WillametteValley and east slopes of the coast range appear tobe most at risk of increased fire. Much of thisincrease in fire can be mitigated by fire suppres-sion, but would likely require significant mobili-zation of fire fighting resources above currentlevels
However, the coastal forests are heavily managedand have a very complex harvest history and age-class structure. Much of the region is recoveringfrom clear-cut logging and is likely still below thewater-limited carrying capacity and may yet be ina position to benefit from the warmer wintersand elevated CO
2. These younger ecosystems,
with lower stature and less “rough” canopies, mayuse less water and be less likely to experiencedrought stress followed by fire.
c. Extended Growing Season
The increases in temperature would advancethe onset of spring growth, bringing it closerin line with the spring precipitation peak thatis characteristic of the Northwest. Most of thevegetation growth is accomplished in thespring, before the long, dry summer. How-ever, Northwest vegetation, particularly in thedrier interior, tends to be deeply rooted andcan take advantage of the winter rains forpersistence throughout the summer, due to thewinter and spring recharge of the deep soillayers.
Even though the percentage decreases insummer rainfall are large, the summers aregenerally dry in any case, so the absolutemagnitude of the change is not as great as itseems. The effects of increased summertemperatures on evaporative demand are likelyof greater importance. However, since thegrowing season would be longer on bothspring and fall ends, the vegetation woulddemand more water overall, unless the impactof elevated CO
2 concentrations on water use
efficiency and the increased winter precipita-tion are sufficient to offset the demand.
It is not easy to anticipate whether, for ex-ample, the sagebrush ecosystem would in-crease or decrease in certain domains in theNorthwest, as illustrated in Figure 12, sincethere are so many counter-acting forces. Theoverall changes in area of the different aggre-gated ecosystems, specifically for Oregon,simplify the complex changes expressed in themaps and are shown in Figure 13. Theshrubland/grassland vegetation type decreasesdue to woody encroachment. The lengthen-ing of the growing season is especially impor-tant in the interior dry ecosystems, where thetraditionally very cold winters prevent signifi-cant photosynthesis until late spring when therains are typically waning. Thus, even withthe drier scenarios, the interior vegetation canmuch more effectively utilize the winterprecipitation.
Difference inbiomassconsumed byfire (carbon g/m2), comparingthe future averageecosystembiomassconsumed by fire(2070 – 2099)with the current(1961 – 1990)biomassconsumed,without firesuppression(upper panel)and with firesuppression(lower panel).The six futurescenarios arearrayed by GCM(columns) andemissionsscenarios (rows).The GCMdefinitions are asin Figure 11.
Figure 14

Chapter Three Forests, Carbon and Climate Change: A Synthesis of Science Findings
49
The greater the effectiveness of fire suppres-sion, the greater will be the woody expansion,even moving toward a closed canopy in manyregions of the interior (Figure 13). The effect ofthe delicate balance between all the contrastingforces can best be observed in the changes invegetation and ecosystem carbon and onwhether fire consumes more or less biomass.
d) Change in Vegetation Carbon
With climate change, the wet maritime foreststend to lose carbon, even under scenarios withincreased precipitation, (Figure 15). Interiordry ecosystems tend to gain carbon. Theinterior conifer forests lose carbon without firesuppression, but gain carbon with fire suppres-sion. The wet maritime forests are uniqueamong Northwest ecosystems in that thehistorical fire return interval is sufficiently longthat the simulated ecosystems have grown up totheir water-limited carrying capacity. Thus, theincreases in temperature lengthen the effectivegrowing season of the maritime forest, as well asproduce a much higher evaporative demand.The result is that the trees, with their currentleaf area, withdraw more water during the hotsummer than is available in the soil. Therefore,the leaf area is reduced via dieback of leaves,branches and trees, augmented in some cases byincreases in fire With a lower leaf area, imply-ing a less dense forest (as shown by the reducedvegetation carbon), the forest is again able tomaintain a positive water balance throughoutthe summer.
The interior forests show an increase in leaf areaunder the future climate, due to a more favor-able synchrony between their growing seasonand the precipitation, and are also normallymaintained by fire at a lower leaf area thancould be maintained by the water balance. Theincrease in the vegetation density in theseinterior ecosystems is also driven by increases inwinter precipitation and enhanced water useefficiency from elevated CO
2. The interior
savanna/woodland ecosystems are able to puton more biomass even with an increase in fireand without fire suppression. However, the
Percent changein vegetationcarbon,comparing thefuture averageecosystemcarbon density(2070 – 2099)with current(1961 – 1990)carbon density,without firesuppression(upper panel)and with firesuppression(lower panel).The six futurescenarios arearrayed byGCM(columns) andemissionsscenarios(rows). TheGCMdefinitions areas in Figure 11.
Figure 15
presence or absence of fire suppression serves tomodulate whether the interior conifer forestecosystems become carbon sources or sinks(Figures 14, 15).
Summary
With climate change, all ecosystems in the North-west show significant changes in species composi-tion, fire disturbance and carbon balance. Thecomplexities and nuances of counteracting forcescannot be minimized. Even with the newestmodeling techniques, the balances in the real worldare difficult to forecast. However, colder ecosystems(alpine) will be threatened while warmer ecosystemswill increase. Fire is likely to increase, even in wetcoastal ecosystems. Ecosystem carbon gains andlosses will be mixed, but fire suppression or exclu-sion could have a profound positive influence onecosystem carbon sequestration.

Forests, Carbon and Climate Change: A Synthesis of Science Findings Chapter Three
50
In the context of changing climates and increas-ing atmospheric carbon, basic concepts andoverall strategies frame the discussion. These canbe categorized as mitigation, adaptation, andconservation. Mitigation practices aim to reduceemissions of new greenhouse gases, as well as toremove existing CO
2 from the atmosphere.
Adaptation practices include actions to increasethe capacity of forests, ecosystems, and society tofunction productively under changing climatesand greenhouse atmospheres. Conservationpractices include all those actions that reduceenergy use and dependence on fossil-fuels, andthereby relieve stress on forests, ecosystems, andecosystem services. For forest management tomeet these three principles, we outline fivedecision-making strategies. They are ReduceGreenhouse Gases, Resist Change, Create Resil-ience After Disturbance, Respond to Change, andConduct Triage (Millar 2006). While theseguidelines pertain to many situations, the discus-sion here addresses production forest manage-ment on private and public lands. For similardiscussion specific to restoration ecology, conser-vation practices, and lands managed primarily forbiodiversity, see Millar and Brubaker 2006.
(1) Reduce Greenhouse Gases.
To date, discussion in western forestry and land-management circles regarding climate hasfocused on adaptation to anticipated changes. Apriority, however, must be to contribute activelyto mitigation of human-induced climate andatmospheric effects by reducing greenhouse gasemissions. The forestry sector is especially calledto action because the potential for positiveeffects through deliberate forest management islarge, and, conversely, there is great potential fornegative impacts when forests are mis-managedor carbon issues ignored. While the U.S. hasfallen far behind other countries in developingstringent federal standards and emissions caps,many U.S. states including Oregon are takingsteps to establish standards that compare to
Kyoto-protocol countries. These fall under thecategory of sequestering greenhouses gases,reducing unnecessary emissions, and maintain-ing a “house in order.”
Sequester Greenhouse Gases. Plants remove CO2
from the atmosphere during the process ofphotosynthesis, and, with water, convert carbonto wood and other plant parts. Under naturalconditions, carbon is stored in plant parts above-and below-ground until it is returned to theatmosphere via burning (combustion) or decom-position, or further stored in the soil. Carbon isstored, or sequestered, in live plant tissues asstems, leaves, and roots, in dead tissue as stemsand litter, and in soil pools in diverse forms. Thisprocess can be exploited as a mitigation strategy.
Forest management practices designed to achievegoals of removing and storing CO
2 are diverse. A
recent study on carbon sequestration optionsidentified that “afforestation provides the biggestterrestrial sequestration opportunity in Oregon,Washington, and California,” (Kadyszewski et al.2005). Afforestation involves converting non-forest land into forested condition, either restor-ing native forests (e.g., forest that had beencleared) or establishing plantations on land thatwas not previously forested. Other approaches tosequestering carbon duplicate long-recognizedbest forest management practices where the goalsare to maintain healthy, vigorous growing stock,keep sites fully occupied with minimal spatial ortemporal gaps in non-forest conditions, andminimize disturbance by fire, insects, and disease.Responsible sequestration practices delay returnof CO
2 to the atmosphere, both in situ (in the
forest or plantation) and post-harvest.
Once fiber is removed from the forest or planta-tion, its path through the utilization cyclecontinues to affect its carbon emissions status.Options include storing carbon in wood andfiber form as buildings, paper, fiberboard, etc., orused for biomass to fuel electricity production.
Forest Management in the Face of Changing Climates

Chapter Three Forests, Carbon and Climate Change: A Synthesis of Science Findings
51
The latter provides a tremendous opportunity forthe future, as wood removed from the forest notonly reduces greenhouse gas emissions by reduc-ing fire vulnerabilities but provides alternativeenergy to replace fossil-fuel and other highgreenhouse gas-emitting forms of energy.
Reduce Unnecessary Emissions. Wildfire andextensive forest mortality as a result of insect anddisease are primary sources of unintentionalcarbon emissions from forests in western U.S.,and represent catastrophic loss of decades tocenturies worth of carbon storage. This situationis likely to be worsening, in the near term at least,in that forest growth has increased during the20th century due to warming and wetter climatesas well as decades of fire suppression (“green-up”), priming overdense stands for wildfireduring dry years and droughty periods (Lenihanet al., 2005, Westerling and Bryant 2005,Westerling et al., 2003). This effect will exacer-bate in coming decades under continued warm-ing, with increasing catastrophic fire years leadingto what has been modeled as widespread “brown-downs” for many western and eastern forest types(Ron Neilson, results in prep).
Management practices that lower forest vulner-abilities to wildfire and non-fire mortality shouldbe widely implemented. On public forest lands,while there is support for fuel and fire reduction,there has been public pressure to minimizeharvest (thinning) and to use managed firesinstead. While this may be important forecological values, from a carbon-accountingstandpoint it is less desirable. Removing trees(thinning or chipping) from dense or dead standsis appropriate where this practice lessens fire risk,and especially if the fiber is subsequently used asbiomass to fuel energy co-generation or storedlongterm.
Maintain House in Order. While not directlyrelated to vegetation management, energyconservation and reduction of emissions fromresource-related activities should be a priority forforestry and environmental institutions. For
example, based on a 2005 Presidential Memoran-dum, the Chief of the U.S. Forest Service issued adirective on energy and fuel conservation thatrequires 10% agency-wide reductions in energyuse, travel, and use of gas-fueled vehicles. Hefurther proposed changes in agency fleets toinclude hybrid and other clean-fueled transporta-tion, and outlined employee incentives totelecommute, use public transportation, etc.(Bosworth 2005). Many state and utility pro-grams offer rebates and incentives to install solarpanels, wind-generators, and to reduce gas andelectricity usage. Energy audits are readilyperformed and many types of carbon calculatorsare available online. Green tag programs, such asthat run by the Bonneville EnvironmentalFoundation, encourage trading of energy debt(paid by individuals to offset greenhouse gasemissions) to entities that provide clean energysources. Many other businesses and organizations(e.g., Carbon Neutral Company, TerraPass) havebeen developed with missions to mitigate climateeffects by promoting positive and practical actionsto reduce emissions.
(2) Resist Effects of Climate Change.
On the adaptation side of management options,one approach is to resist the influence of climatechange on forest resources. From high-valueplantation investments near rotation to rarespecies with limited available habitat, maintainingthe status quo may be the only option. InOregon, this will almost always involve protectingresources from fire, insect, and disease. Optionsinclude traditional fuel breaks, strategically placedarea treatments, defensible fuel profile zones,group selection, and individual tree removal.Intensive and complete fuel breaks may benecessary around highest risk areas, such aswildland-urban interfaces and valuable planta-tions, while mixed approaches may best protecthabitat for biodiversity.
Abrupt invasions, changes in behavior, and long-distance movements of non-native species areexpected in response to changing climates.

Forests, Carbon and Climate Change: A Synthesis of Science Findings Chapter Three
52
Monitoring non-native species and taking earlyactions to remove and block invasions are impor-tant. This applies to invasive plants, animals(vertebrate and invertebrates), and pathogens.Aggressive early resistance is critical.
Resisting climate change influences on naturalforests and vegetation may require additionalinvestments, intensive management, and arecognition that one is “paddling upstream”against nature. For instance, climate change insome places will drive site conversion so that sitecapacities shift from favoring one species toanother. Maintaining prior species may requiresignificant extra and repeated efforts to supplyneeded nutrients and water, remove competingunderstory, fertilize young plantations, developa cover species, thin, and prune.
(3) Create Resilient Vegetation.
Resilient forests and plantations are those thatnot only resist change but resile (verb: to returnto a prior condition) after disturbance. Resil-iency of vegetation can be increased by manage-ment practices similar to those described forresisting change. These include practices toreduce fire risk, and also aggressive actions toencourage return of the site to desired speciespost-disturbance. Given that the plant estab-lishment phase tends to be most sensitive toclimate-induced changes in site potential,intensive management at young ages may enableretention of the site by a commercially desiredspecies, even if the site is no longer optimal forit. Practices include intensive site preparation,replanting with high-quality stock, diligentstand improvement practices, and minimizinginvasion by non-native species. Unfortunatelymany examples are accumulating where resil-ience is declining in natural forests, and retain-ing resiliency will become more difficult aschanges in climate accelerate.
(4) Respond to Climate Change.
Another adaptation option for management isto anticipate the effects of projected future
climate on vegetation and plan protective andopportunistic measures in response. For this tobe useful requires that climate and responsemodels yield useful projections. While regionalmodeling is becoming increasingly sophisti-cated, outcomes should be considered highlyuncertain at the local spatial and temporal scalesused in forest management. This is partlybecause large uncertainties exist at globalclimate scales that translate and amplify asmodels are downscaled to regional levels.Rather than viewing models as forecasts orpredictions of the future, they are better usedfor attaining insight into the nature of potentialprocess and about generalized trends. Focusingon results that are similar across diverse modelsshould indicate areas of greater likelihood.Ecological response (including fire and insect/disease) to climate is even more difficult thanclimate to model accurately at local scalesbecause threshold and non-linear responses, lagsand reversals, individualistic behaviors, andstochastic and catastrophic events are common.Models typically rely on directional shiftsfollowing equilibrium dynamics of entire plantcommunities, whereas especially in mountain-ous regions, patchy environments increase thelikelihood of complex individualistic responses.Once a forest manager obtains regional infor-mation about future climate scenarios, eitherfrom sophisticated modeling or qualitativeextrapolations, options for managing resourcesin response to anticipated change can be devel-oped. Depending on management goals andthe environmental context, different approachesmay be taken. A sample of these includes thefollowing:
Follow Climate Change. Use coupled anddownscaled climate and vegetation models toanticipate future regional conditions and projectfuture forest stands and plantations into newhabitat and climate space.
Anticipate and Plan for Indirect Effects. Evalu-ate potential for indirect effects, such as changesin fire regimes and exotic insects and pathogen

Chapter Three Forests, Carbon and Climate Change: A Synthesis of Science Findings
53
responses, and plan management accordingly.
Increase Redundancy. While some situationsmay implicate “putting your eggs in one basket”and trusting that climate and vegetation modelsaccurately project the future, for other situa-tions, bet-hedging practices may be a betterchoice. Essentially this group of actions plansfor uncertainty in the future rather than acertain (modeled) scenario, and promotesdecisions that spread risk rather than concen-trating it.
Expand Genetic Diversity Guidelines. While inthe past several decades, genetic guidelines forreforestation have been increasingly refined tofavor local germplasm and close adaptation,relaxing these guidelines may be appropriateunder changing climates as another bet-hedgingpractice.
Establish “Neo-native” Locations. Informationfrom historic species ranges and responses toclimate change offers a different kind of insightinto the future than modeling studies might.For instance, areas that supported species in thepast under similar conditions to those projectedfor the future might be considered sites for newplantations or “neo-native” stands of the species(Millar, 1998).
Experiment with Refugia. Plant ecologists andpaleoecologists recognize that some environ-ments appear more buffered against climate andshort-term disturbances while others are sensi-tive. If such environments can be identifiedlocally, they could be considered sites forlongterm retention of plants, or even for newplantations.
Promote Porous Landscapes. A capacity tomove in response to changing climates is key toadaptation and long-term survival of plants innatural ecosystems. Plants migrate, or “shiftranges,” by dying in unfavorable sites andcolonizing favorable edges including internalmargins. Capacity to do this is aided by porouslandscapes, that is, landscapes that containcontinuous habitat with few physical or bioticrestrictions, and through which plants can movereadily (recruit and establish). Promoting largeforested landscape units with flexible manage-ment goals that can be modified as conditionschange will encourage species to respondnaturally to changing climates and enablemanagers to work with rather than against theflow of change.
(5) Conduct Triage.
Species, plant communities, regional vegetation,and plantations will respond to changingclimates individualistically. Some species andsituations will be sensitive and vulnerable.Depending on their value or risk level, thesemay be targeted either for aggressive interven-tion, or, conversely, intentionally relinquishedto their fates. By contrast, there will be otherspecies and situations that are buffered, at leastinitially, from effects of climate changes orresilient to climate-influenced disturbances.These may need little attention or minimalmodifications of management plans, at least inthe near future. Decision-support tools thathelp managers weigh risk levels, project ex-pected benefits or impacts from intervention,evaluate priorities, and develop simple manage-ment alternatives must be developed.

Forests, Carbon and Climate Change: A Synthesis of Science Findings Chapter Three
54
Conclusions
Change is a natural and ongoing aspect ofearth’s complex climate system, and forms thecontext against which current human effects onclimate can be evaluated. Natural cycles inclimates occur at millennial, century, decadal,and interannual time frames. Climate statesmay shift abruptly over times as short as years ordecades. Over historic time, species haveadapted to climate changes by shifting rangesand (over long time spans) adapting throughgenetic change. Since the 1970s, the interac-tion of climate-driving mechanisms has shiftedto become dominated by anthropogenic influ-ence, predominantly greenhouse gas emissions.As a result, climate of the 21st century andbeyond will react in different ways than in thepast, and will increasingly extend beyondrelevant historic ranges of variation. Directeffects of CO
2 on plants will have both detri-
mental and beneficial effects, depending onspecies and context. Current projections forOregon’s climate future suggest warmingtemperatures by 7 to 8.5oF and somewhatwetter. If these result, more precipitation willfall as rain rather than snow, mountain snow-packs will be greatly reduced, winters will beshorter, streamflows will decline, and the already
extensive summer drought will be longer andmore severe. Significant shifts in forest, shrub,and grasslands, as well as fire regimes, areanticipated.
Perhaps most importantly, regardless of historicprecedence, rapid changes in climate, increasingtemperatures, and increases in extreme events aremuch more difficult for modern society (includ-ing the forestry sector) to cope with than in timeswhen human population was smaller and moreadaptable Our dependence on stable and pre-dictable conditions has led to situations whereeven historically natural levels of climate variabil-ity will have increasingly serious health andeconomic consequences worldwide. Globalpolitical opinion, with some exceptions, is inagreement that the next 50 to 100 years must bea period when greenhouse gas emissions andatmospheric concentrations are brought intocontrol. Managing carbon and coping withclimate changes will be the tacit context forvegetation management in the coming century.
In the face of these changes, forest managers canhelp to mitigate ongoing climate changes andgreenhouse gas emissions, plan strategies to adaptto change, and take actions to conserve energyuse and relieve stress on ecosystems.

Chapter Three Forests, Carbon and Climate Change: A Synthesis of Science Findings
55
Adam, D.P. 1988. Palynology of two upperQuaternary cores from Clear Lake, Lake County,California. USGS Professional Paper 1363.
Adam, D.P. and G.J. West. 1983. Temperatureand precipitation estimates through the lastglacial cycle from Clear Lake, CA. Pollen data.Science 219: 168-170.
Alley, R.B., P.A. Mayewski, T. Sowers, M. Stuiver,K.C. Taylor, and P.U. Clark. 1997. Holoceneclimatic instability: A prominent, widespreadevent 8200 years ago. Geology 25 (6): 483-486.
Bachelet, D., R.P. Neilson, T. Hickler, R.J.Drapek, J.M. Lenihan, M.T. Sykes, B. Smith, S.Sitch, K. Thonicke. 2003. Simulating past andfuture dynamics of natural ecosystems in theUnited States. Global Biogeochemical Cycles17(2):14-1 - 14-21.
Bachelet, D., R.P. Neilson, J.M. Lenihan, andR.J. Drapek. 2001. Climate change effects onvegetation distribution and carbon budget in theUnited States. Ecosystems 4:164-185.
Berner, R.A. 1990. Atmospheric carbon dioxidelevels over Phanerozoic time. Science 249 (4975):1382-1386.
Biondi, R., A. Gershunov, and D.R. Cayan.2001. North Pacific decadal climate variabilitysince 1661. Journal of Climate 14: 5-10.
Bond, G., W. Showers, M. Cheseby, R. Lotti, P.Almasi, P. deMenocal, P. Priore, H. Cullen, I.Hajdas, and G. Bonani. 1997. A pervasivemillennial-scale cycle in North Atlantic Holoceneand glacial climates. Science 278: 1257-1266.
Bond, G., B. Kromer, J. Beer, R. Muscheler, M.Evans, W. Showers, S. Hoffmann, R. Lotti-Bond,I. Hajdas, G. Bonani. 2001. Persistent solarinfluence on North Atlantic climate during theHolocene. Science 294: 2130-2136.
Bosworth, D. 2005. President’s memorandum onenergy and fuel conservation. Internal agencyletter to all employees, October 18, 2005, filecode 1340.
Bradley, R.S. 1999. Paleoclimatology. Reconstruct-ing Climates of the Quaternary. 2nd edition.Academic Press. 610 pages.
Breshears, D.D., N.S. Cobb, P.M. Rich, and 10others. 2005. Regional vegetation die-off inresponse to global-change-type drought. Proceed-ings of the National Academy of Science 102 (42):15144-15148
Broecker, W.S., G. Bond, M. Klas, G. Bonani,and W. Wolfli. 1990. A salt oscillator in theglacial Atlantic? I. The concept. Paleoceanography4: 469-477.
Cayan, D.R., S. Kammerdiener, M.D. Dettinger,J. M. Caprio, and D.H. Peterson. 2001. Changesin the onset of spring in the western UnitedStates. Bull. Am. Met. Soc. 82(3): 399-415.
CCSP (Climate Change Science Program).2005. Our changing planet. The U.S. ClimateChange Science Program for fiscal year 2006. Areport by the Climate Change Science Programand the Subcommittee on Global ChangeResearch. 215 pp.
Chapin, F.S. M. Sturm, M.C. Serreze, and 18others. 2005. Role of land-surface changes inArctic summer warming. Science 310: 657-660.
Clark, D.H. and A.R. Gillespie. 1997. Timingand significance of late-glacial and Holocenecirque glaciation in the Sierra Nevada, California.Quaternary Research 19:117-129.
Clark, P.U., S.J. Marshall, G.K. Clarke, S.Hostetler, J.M. Licciardi, and J.T. Teller. 2001.Freshwater forcing of abrupt climate changeduring the last glaciation. Science 293: 283-287.
Literature Cited

Forests, Carbon and Climate Change: A Synthesis of Science Findings Chapter Three
56
Cronin, T.M. 1999. Principles of paleoclimatol-ogy. Columbia University Press. 560 pages.
Cuffey, K.M., G.D. Clow, R.B. Alley, M. Stuvier,E.D. Waddington, and R.W. Saltus. 1995. LargeArctic temperature change at the Wisconsin-Holocene glacial transition. Science 270:455-458.
Daly, C., D. Bachelet, J. Lenihan, W. Parton, R.Neilson, and D. Ojima. 2000. Dynamic simula-tions of tree-grass interactions for global changestudies. Ecological Applications 10:449–469.
Dansgaard, W., S.J. Johnsen, H.B. Clausen, et al.1993. Evidence for general instability of climatefrom a 250-kyr ice-core record. Nature 364: 218-220.
Davis, M.B., K.D. Woods, S.L. Webb, and R.P.Futyma. 1986. Dispersal versus climate: Expan-sion of Fagus and Tsuga into the Upper GreatLakes region. Vegetatio 67: 93-103.
Dettinger, M. D. and D. R. Cayan. 1995. Large-scale atmospheric forcing of recent trends towardearly snowmelt runoff in California. Journal ofClimate. 8(4) 606-623.
Diaz, H.F. and V. Markgraf (eds.). 2000. El Niñoand the Southern Oscillation: Multiscale Variabil-ity, Global, and Regional impacts. CambridgeUniversity Press.
Ebbesmeyer, C.C., D.R. Cayan, D.R. McClain,F.H. Nichols, D.H. Peterson, and K.T.Redmond. 1991. 1976 step in Pacific climate—Forty environmental changes between 1968-1975 and 1977-1984: Proceedings of the 7th
Annual Pacific Climate (PACLIM) Workshop(Betancourt and Tharp, eds.), InteragencyEcological Study Program Technical Report 26,115-126.
Esper, J., E.R. Cook, and F.H. Schweingruber.2002. Low-frequency signals in long tree-ringchronologies for reconstructing past temperaturevariability. Science 295: 2250-2253.
Graumlich, L. J. 1993. A 1000-year record oftemperature and precipitation in the SierraNevada. Quaternary Research 39, 249.
Grayson, D.K. 1993. The Desert’s Past. ANatural Prehistory of the Great Basin.Smithsonian Institution Press. Washington.356 pgs.
Grimm, E.C., G.L. Jacobson, W.A. Watts, B.C.Hansen and K.A. Maasch. 1993. A 50,000 yearrecord of climate oscillations from Florida and itstemporal correlation with Heinrich events.Science 261: 198-200.
Grissino-Mayer, H.D. 1996. A 2129-year recon-struction of precipitation for northwestern NewMexico, USA. In Tree Rings, Environment, andHumanity, J.S. Dean, D.M. Meko, and T.W.Swetnam (eds.) 191-204. Radiocarbon. Tucson,AZ.
Grove, J.M. 1988. The Little Ice Age. MethuenPublishing, London. 498 pages.
Hays, J.D., J. Imbrie, and N.J. Shackleton. 1976.Variations in the earth’s orbit: Pacemaker of theice ages. Science 194: 1121-1132.
Heinrich, H. 1988. Origin and consequence ofcyclic ice rafting in the northeast Atlantic Oceanduring the past 130,000 years. QuaternaryResearch 29: 142-152.
Heusser, L. 1995. Pollen stratigraphy andpaleoecologic interpretation of the 160 k.y.record from Santa Barbara Basin, Hole 893A. InProceed. Of the Ocean Drilling Program, ScientificResults. J.P. Kennet, J.G. Baldauf, and M. Lyle(eds) 265-277.Vol. 146 Pt. 2. College Station,TX (Ocean Drilling Program).
Heusser, L.E. 2000. Rapid oscillations in westernNorth America vegetation and climate duringoxygen isotope stage 5 inferred from pollen datafrom Santa Barbara Basin (Hole 893A).Palaeogeo,Palaeoclim. and Palaeoecol. 161: 407-421.

Chapter Three Forests, Carbon and Climate Change: A Synthesis of Science Findings
57
Heusser, L.E. and F. Sirocko. 1997. Millennialpulsing of environmental change in southernCalifornia from the past 24 k.y.: A record ofIndo-Pacific ENSO events?. Geology 25:243-246.
Hughes, M.K. and H.F. Diaz. 1994. Was there a“Medieval Warm Period?” and if so, where andwhen? Climate Change 26: 109-142.
Hunter, M.L. 1996. Fundamentals of Conserva-tion Biology. Blackwell Science. Cambridge,Massachusetts. 482 pgs.
Imbrie, J., E. Boyle, S. Clemens, et al.,1992. Onthe structure and origin of major glaciationcycles. 1. Linear responses to Milankovitchforcing. Paleoceanography 7: 701-738.
Imbrie, J., A. Berger, E. Boyle,et al., 1993. Onthe structure and origin of major glaciationcycles. 2. The 100,000 year cycle.Paleoceanography 8:699-735.
IPCC. (International Panel on Climate Change).2001. Climate change 2001. Third AssessmentReport of the Intergovernmental Panel on ClimateChange. 3 reports and overview for policymakers. Cambridge University Press.
Jackson, S.T. 1997. Documenting natural andhuman-caused plant invasions using paleoeco-logical methods. In Assessment and Managementof Plant Invasions, J.O. Luken and J.W. Thieret(eds.) 37-55 Springer-Verlag.
Jackson, S.T. and J.T. Overpeck. 2000. Re-sponses of plant populations and communities toenvironmental changes of the late Quaternary.Paleobiology 25: 194-220.
Jensen, K. 1935. Archaeological dating in thehistory of North Jutland’s vegetation. ActaArchaeologica 5: 185-214.
Jordan, W.R., M.E. Gilpin, J.D. Aber (Eds.). 1990.Restoration Ecology: A Synthetic Approach to EcologicalResearch. Cambridge University Press. 352 pgs.
Kadyszewski , J, S. Brown, N. Martin, A.Dushku. 2005. Opportunities for terrestrialcarbon sequestration in the West. WinrockInternational. Presented at the Second AnnualClimate Change Research Conference, Sept 14-16, 2005, Sacramento. http://www.climatechange.ca.gov/events/2005_confer-ence/presentations/2005-09-15/2005-09-15_KADYSZEWSKI.PDF
Kennett, J.P. 1990. The Younger Dryas coolingevent: An introduction. Paleoceanography 5:891-895.
Kitzberger, T., T.W. Swetnam, and T. T. Veblen.2001. Inter-hemispheric synchrony of forest firesand the El Niño-Southern Oscillation. GlobalEcology and Biogeography 10:315-326.
Körner Ch. et al., 2005: Carbon flux and growthin mature deciduous forest trees exposed toelevated CO
2. Science 309:1360-1362.
Küchler, A. 1975. Potential natural vegetation ofthe United States. 2nd ed. Map 1:3,168,000.American Geographic Society, New York.
Lackey, R.T. 1995. Seven pillars of ecosystemmanagement. Landscape and Urban Planning40(1/3): 21-30
Lele, S. and R.B. Norgaard. 1996. Sustainabilityand the scientist’s burden. Conservation Biology10: 354-165.
Lenihan, J.M., C. Daly, D. Bachelet, R.P.Neilson. 1998. Simulating broad-scale fireseverity in a Dynamic Global Vegetation Model.Northwest Science 72: 91-103.
Lenihan, J.M., R. Drapek, R.P. Neilson, and D.Bachelet. 2005. The response of vegetation,distribution, ecosystem productivity, and fire inCalifornia to future climate scenarios simulatedby the MC1 dynamic vegetation model. In,Climate Action Team Report to the Governorand Legislators. www.climatechange.ca.gov/climate_action_team/reports/

Forests, Carbon and Climate Change: A Synthesis of Science Findings Chapter Three
58
Lorius, C., J. Jouzel, D. Raynaud, J. Hansen, andH. LeTreut. 1990. The ice-core record: Climatesensitivity and future greenhouse warming. Nature347: 139-145.
Mantua, N.J., S.R. Hare, Y. Zhang, J.M.Wallace, and R.C. Francis. 1997. A Pacificinterdecadal climate oscillation with impacts onsalmon production. Bull. Amer. Meteorolog. Soc.78:1069-1079.
Mennis, J.L., and A.G. Fountain. 2001. A spatio-temporal GIS database for monitoring alpineglacier change. Journal of Photogrammetry andRemote Sensing, 67, 967-975
Milankovitch, M. 1941. Canon of insolation andthe ice-age problem. Royal Serbian AcademySpecial Pub. No. 132. (Translated from theGerman by the Israel Program for ScientificTranslations, Jerusalem, 969).
Millar, C.I. 1998. Reconsidering the conserva-tion of Monterey pine. Fremontia 26(3): 12-16.
Millar, C.I. 2003. Climate change; Detectingclimate’s imprint on California forests. SciencePerspectives. USFS Pacific Southwest ResearchStation. Spring issue.
Millar, C.I. 2006. Climate change; Confrontingthe global experiment. In Cooper, S and SFrederickson (eds), Proceedings of the 27th AnnualForest Vegetation Management Conference, Grow-ing the Future, S.L. Cooper (Compiler). January17-19, 2006, Redding, California. University ofCalifornia, Shasta County Cooperative Exten-sion, Redding, California.
Millar, C.I. and L.B. Brubaker. 2006. Climatechange and paleoecology: New contexts forrestoration ecology. In M. Palmer, D. Falk, and J.Zedler (eds) Foundations of Restoration Science.Island Press.
Millar, C.I., R.D. Westfall, D.L. Delany, J.C.King, and L.J. Graumlich. 2004. Response ofsubalpine conifers in the Sierra Nevada, Califor-nia, USA to twentieth-century warming anddecadal climate variability. Arctic, Antarctic, andAlpine Research 36 (2): 181-200.
Mote, P. W., E. A. Parson, A. F. Hamlet, K. N.Ideker, W. S. Keeton, D. P. Lettenmaier, N. J.Mantua, E. L. Miles, D. W. Peterson, D. L.Peterson, R. Slaughter, and A. K. Snover. 2003.Preparing for climatic change: The water, salmon,and forests of the Pacific Northwest. ClimaticChange 61:45-88.
NAST (National Assessment Synthesis Team).2000. Climate Change Impacts on the UnitedStates - Overview Report. Cambridge UniversityPress. Cambridge.
Neilson, R.P., J.M Lenihan, D. Bachelet and R.Drapek. In press. Climate Change ImplicationsFor Sagebrush Ecosystems. In: Transactions of the70th North American Wildlife and Natural Re-sources Conference. Washington D.C., WildlifeManagement Institute.
Neilson, R.P., L.F. Pitelka, A.M. Solomon, R.Nathan, G.F. Midgley, J.M.V. Fragoso, H.Lischke and K. Thompson. 2005. ForecastingRegional to Global Plant Migration in Responseto Climate Change. Bioscience 55: 749-759.
Nowak, C.L., R.S. Nowak, R.J. Tausch, and P.E.Wigand. 1994. Tree and shrub dynamics innorthwestern Great Basin woodland and shrubsteppe during the Late-Pleistocene and Holocene.American Journal of Botany 81: 265-277.
NRC (National Research Council), 2002.Abrupt climate change. Inevitable surprises. Na-tional Research Council, National AcademyPress, Washington, D.C.

Chapter Three Forests, Carbon and Climate Change: A Synthesis of Science Findings
59
Overpeck, J., K. Hughen, D. Hardy, et al., 1997.Arctic environmental change of the last fourcenturies. Science 278: 1251-1256.
Pauli, H., M. Gottfried, T. Dirnboeck, S.Dullinger, and G. Grabherr. 2003. Assessing thelong-term dynamics of endemic plants at summithabitats. Ecological Studies 167: 195-207.
Petit JR, Jouzel J, Raynaud D, Barkov NI,Barnola JM, Basile I, Bender M, Chappellaz J,Davis M, Delaygue G, Delmotte M, KotlyakovVM, Legrand M, Lipenkov VY, Lorius C, PpinL, Ritz C, Saltzman E, Stievenard M (1999)Climate and atmospheric history of the past420000 years from the Vostok ice core, Antarc-tica. Nature 399: 429-436
Peterson, D. W. and D.L. Peterson, D. L. 2001.Mountain hemlock growth responds to climaticvariability at annual and decadal time scales.Ecology, 82(12): 3330-3345.
Peterson, D. W., D. L. Peterson, and G. J. Ettl.2002. Growth responses of subalpine fir toclimatic variability in the Pacific Northwest.Canadian Journal of Forest Resources 32: 1503-1517.
Price, D.T., D. W. McKenney, P. Papadopol, T.Logan, and M. F. Hutchinson. 2004. Highresolution future scenario climate data for NorthAmerica. Proc. Amer. Meteor. Soc. 26th Confer-ence on Agricultural and Forest Meteorology,Vancouver, B.C., 23-26 August, 2004, 13 pp.CD-ROM.
Raymo, M.E. and W.F. Ruddiman. 1992.Tectonic forcing of late Cenozoic climate.Nature 359: 117-122.
Ruddiman, W.F. 2001. Earth’s Climate: Past andFuture. W.H. Freeman Publishers. 465 pages.
Stine, S. 1994. Extreme and persistent drought inCalifornia and Patagonia during Medieval time.Nature 369: 546-549.
Swetnam, T. W. and C. H. Baisan. 2003. Tree-ring reconstructions of fire and climate history inthe Sierra Nevada and Southwestern UnitedStates. Pp 158-195, In, T. T. Veblen, W. Baker,G. Montenegro, and T. W. Swetnam (eds.), Fireand Climatic Change in Temperate Ecosystems ofthe Western Americas. Springer, New York. 444pp.
Swetnam, T.W. and J.L. Betancourt. 1998.Mesoscale disturbance and ecological response todecadal climatic variability in the AmericanSouthwest. Journal of Climate 11: 3128-3147.
Tausch, R, S. Mensing, and C. Nowak. 2004.Climate change and associated vegetation dy-namics during the Holocene - The paleoecologi-cal record 24-48. In. Great Basin RiparianEcosystems: Ecology, Management and Restoration,Jeanne C. Chambers and Jerry R. Miller (eds.)Island Press.
Thompson, R.S. 1988. Western North America.In Vegetation History, B. Huntley and T. WebbIII (eds.) 415-459. Kluwer Academic Press
Thompson, R.S. 1990. Late Quaternary vegeta-tion and climate in the Great Basin. In PackratMiddens. The Last 40,000 Years of Biotic Change,Betancourt, J.L., T. van Devender, and P.S.Martin 201-239. University of Arizona Press.467 pages.
Webb, T. 1986. Is vegetation in equilibrium withclimate? How to interpret Late-Quaternarypollen data. Vegetation 67: 75-91.
Webb, T., III, Bartlein, P.J. and Kutzbach, J.E.,1987. Climatic Change in Eastern NorthAmerica During the Past 18,000 Years: Compari-sons of Pollen Data with Model Results. In: W.F.Ruddiman and H.E. Wright, Jr. (Editors), NorthAmerica and Adjacent Oceans During the LastDeglaciation. Geological Society of America,Boulder, pp. 447-462.

Forests, Carbon and Climate Change: A Synthesis of Science Findings Chapter Three
60
Westerling, A. and B. Bryant. 2005. Climatechange and wildfire in and around California:Fire modeling and loss modeling. In, CaliforniaClimate Action Team Report to the Governor andLegislators. www.climatechange.ca.gov/climate_action_team/reports/
Westerling, A.L., T.J. Brown, A. Gershunov,D.R. Cayan and M.D. Dettinger. 2003. Climateand wildfire in the western United States. Bulle-tin of the American Meteorological Society 84(5):595-604.
White, J.W., T. Popp, S.J. Johnsen, V. Masson, J.Jouzel. 2001. Clocking the speed of climatechange: The end of the Younger Dryas as re-corded by four Greenland ice cores. Abstract.Fall Meeting of the American GeophysicalUnion, December 10-14, 2001. San Francisco,CA. Pg. F22.
Wright, H.E. 1989. The Quaternary. The Geologyof North America. Geolog. Soc. America. A: 513-536.
Zachos, J., M. Pagaini, L. Sloan, E. Thomas, andK. Billups. 2001. Trends, rhythms, and aberra-tions in global climate 65 Ma to present. Science292: 686-693.
Zhang, Y., J.M. Wallace, and D.S. Battisti. 1997.ENSO-like interdecadal variability: 1900-1993.Journal of Climate 10: 1004-1020.
Ziska, L.H. 2003. Evaluation of the growthresponse of six invasive species to past, presentand future atmospheric carbon dioxide. Journal ofExperimental Botany 54: 395-404.