Embed Size (px)
Citation preview


i
The primary objective of monetary policy is to promote a low and stable rate of inflation conducive to a balanced and sustainable economic growth. The adoption in January 2002 of the inflation targeting
framework for monetary policy was aimed at helping to fulfill this objective. One of the key features of inflation targeting is greater transparency, which means greater disclosure and communication by the BSP of its policy actions and decisions. This Inflation Report is published by the BSP as part of its transparency mechanisms under inflation targeting. The objectives of this Inflation Report are: (i) to identify the risks to price stability and discuss their implications for monetary policy; and (ii) to document the economic analysis behind the formulation of monetary policy and convey to the public the overall thinking behind the BSP’s decisions on monetary policy. The broad aim is to make monetary policy easier for the public to understand and enable them to better monitor the BSP’s commitment to the inflation target, thereby helping both in anchoring inflation expectations and encouraging informed debate on monetary policy issues.
The government’s target for annual headline inflation under the inflation targeting framework has been set at 3.0 percent ± 1.0 percentage point (ppt) for 2016‐2020 by the Development Budget Coordination Committee (DBCC). This is consistent with the desired disinflation path over the medium term, favorable trends in inflation dynamics, and expected higher capacity of the economy for growth under a low inflation environment.
The report is published on a quarterly basis, presenting an analysis of the various factors affecting inflation. These include recent price and cost developments, inflation expectations, prospects for aggregate demand and output, labor market conditions, monetary and financial market conditions, fiscal developments, and the international environment. An entire section is devoted to a discussion of monetary policy developments in the most recent quarter, while a separate section provides a comprehensive analysis of the BSP’s view of the inflation outlook for the policy horizon.
The Monetary Board approved this Inflation Report at its meeting on 12 January 2017.
Foreword
AMANDO M. TETANGCO, JR. Governor

ii
The BSP Mandate
The BSP’s main responsibility is to formulate and implement policy in the areas of money, banking and credit, with the primary objective of maintaining stable prices conducive to a balanced and sustainable economic growth in the Philippines. The BSP also aims to promote and preserve monetary stability and the convertibility of the national currency.
Monetary Policy Instruments The BSP’s primary monetary policy instrument is its overnight reverse repurchase (RRP) or borrowing rate. Other instruments to implement the desired monetary policy stance to achieve the inflation target include (a) increasing/decreasing the reserve requirement; (b) conducting auctions for the term deposit facility (TDF);1 (c) adjusting the rediscount rate on loans extended to banking institutions on a short‐term basis against eligible collateral of banks’ borrowers; and (d) outright sales/purchases of the BSP’s holdings of government securities.
Policy Target The BSP’s target for monetary policy uses the Consumer Price Index (CPI) or headline inflation rate, which is compiled and released to the public by the National Statistics Office (NSO). The policy target is set by the Development Budget Coordination Committee (DBCC)2 in consultation with the BSP. The inflation target for 2016‐2020 is 3.0 percent ± 1.0 ppt.3
BSP’s Explanation Clauses
These are the predefined set of acceptable circumstances under which an inflation‐targeting central bank may fail to achieve its inflation target. These clauses reflect the fact that there are limits to the effectiveness of monetary policy and that deviations from the inflation target may sometimes occur because of factors beyond the control of the central bank. Under the inflation targeting framework of the BSP, these exemptions include inflation pressures arising from: (a) volatility in the prices of agricultural products; (b) natural calamities or events that affect a major part of the economy; (c) volatility in the prices of oil products; and (d) significant government policy changes that directly affect prices such as changes in the tax structure, incentives, and subsidies.
1 The TDF was introduced under the interest rate corridor system which was implemented on 3 June 2016. 2 The DBCC, created under Executive Order (E.O.) No. 232 dated 14 May 1970, is an inter‐agency committee tasked primarily to formulate the National Government's fiscal program. It is composed of the Office of the President (OP), Department of Budget and Management (DBM), National Economic and Development Authority (NEDA), and the Department of Finance (DOF). The BSP attends the Committee meetings as a resource agency. 3 On 3 February 2015, the DBCC set an inflation target of 3 ± 1 percent for 2017‐2018. During its meeting on 20 December 2016, the DBCC decided to retain the inflation target of 3 ± 1 percent for 2017‐2018 and also set the same target range for 2019‐2020. These decisions were announced to the public on 22 December 2016.
The Monetary Policy of the Bangko Sentral ng Pilipinas

iii
The Monetary Board
The powers and functions of the BSP, such as the conduct of monetary policy and the supervision over the banking system, are exercised by its Monetary Board, which has seven members appointed by the President of the Philippines. The Monetary Board holds eight (8) monetary policy meetings in a year to review and decide on the stance of monetary policy.
Chairman & Governor
Amando M. Tetangco, Jr.
Members
Carlos G. Dominguez III
Alfredo C. Antonio
Juan D. De Zuñiga, Jr.
Valentin A. Araneta
Felipe M. Medalla
Armando L. Suratos
The Advisory Committee
The Advisory Committee was established as an integral part of the institutional setting for inflation targeting. It is tasked to deliberate, discuss, and make recommendations on monetary policy to the Monetary Board. Like the Monetary Board, the Committee meets eight times a year but may also meet between regular meetings, whenever deemed necessary.
Chairman
Amando M. Tetangco, Jr. Governor
Members
Diwa C. Guinigundo Deputy Governor
Monetary Stability Sector
Nestor A. Espenilla, Jr. Deputy Governor
Supervision and Examination Sector
Ma. Ramona GDT Santiago Assistant Governor Treasury Department
Francisco G. Dakila, Jr. Managing Director
Monetary Policy Sub‐sector

iv
Technical Staff
Head
Zeno Ronald R. Abenoja Director, Department of Economic Research
Members
Edna C. Villa Managing Director, Office of the Governor
Veronica B. Bayangos
Director, Center for Monetary and Financial Policy
Lorelei S. Fernandez Chief Dealer, Treasury Department
Rosabel B. Guerrero
Director, Department of Economic Statistics
Dennis D. Lapid Deputy Director, Department of Economic Research
Dennis M. Bautista
Deputy Director, Department of Economic Research
Ma. Mediatriz M. Boelsch Assistant Chief Dealer, Treasury Department
Thea Josefina Natalia W. Santos
Deputy Director, Capital Markets Specialist Group
Jose Recon S. Tano Deputy Director, Financial Supervision Research and Consumer Protection Sub‐sector
Lara Romina E. Ganapin
Bank Officer V, Department of Economic Research
Cherrie F. Ramos Bank Officer V, Department of Economic Research
Jasmin E. Dacio
Bank Officer V, Department of Economic Research
Eduard Joseph DP Robleza Bank Officer V, Department of Economic Research
Vanessa T. Españo
Bank Officer V, Department of Economic Research
Marites B. Oliva Bank Officer V, Center for Monetary and Financial Policy

v
2017 Schedule of Monetary Policy Meetings, Inflation Report Press Conferences and Publication of MB Highlights
2017 Advisory Committee Meeting
Monetary Board Meeting
Publication of MB Highlights
Inflation Report Press
Conference
Jan 19 (Thu) (22 Dec 2016 MB)
20 (Fri)
(Q4 2016 IR)
Feb 3 (Fri) 9 (Thu)
Mar 17 (Fri) 23 (Thu) 9 (Thu) (9 Feb 2017 MB)
Apr 20 (Thu) (23 Mar 2017 MB)
21 (Fri) (Q1 2017 IR)
May 5 (Fri) 11 (Thu)
Jun 16 (Fri) 22 (Thu) 8 (Thu) (11 May 2017 MB)
Jul 20 (Thu) (22 Jun 2017 MB)
21 (Fri) (Q2 2017 IR)
Aug 4 (Fri) 10 (Thu)
Sep 15 (Fri) 21 (Thu) 7 (Thu) (10 Aug 2017 MB)
Oct 19 (Thu) (21 Sep 2017 MB)
20 (Fri) (Q3 2017 IR)
Nov 3 (Fri) 9 (Thu)
Dec 8 (Fri) 14 (Thu) 7 (Thu)
(9 Nov 2017 MB)

vi
List of Acronyms, Abbreviations, and Symbols
AL BES
Auto Loans Business Expectations Survey
NBQBs Non‐Bank Financial Institutions with Quasi‐Banking Functions
BTr CAMPI
Bureau of the Treasury Chamber of Automotive Manufacturers of the Philippines, Inc.
NEDA NEER NNPL
National Economic and Development Authority Nominal Effective Exchange Rate Net Non‐Performing Loan
CAR Capital Adequacy Ratio NFA Net Foreign Assets; National Food Authority
CBD Central Business District NG National Government
CES Consumer Expectations Survey NGCP National Grid Corporation of the Philippines
CDS Credit Default Swaps NPC National Power Corporation
CI Confidence Index NPI Net Primary Income
COV Coefficient of Variation NPL Non‐Performing Loan
CPI DBCC
Consumer Price Index Development Budget Coordination Committee
OECD Organization for Economic Cooperation and Development
DOE DI
Department of Energy Diffusion Index
OPEC Organization of the Petroleum Exporting Countries
DOF Department of Finance OF Overseas Filipinos
EIA US Energy Information Administration PMI Purchasing Managers’ Index
EM EMBI
Emerging Market JP Morgan Emerging Market Bond Index
PSA Philippine Statistical Authority; Power Supply Agreement
ERC FCDA
Energy Regulatory Commission Foreign Currency Differential Adjustment
PSALM Power Sector Assets and Liabilities Management Corporation
GDP Gross Domestic Product PSEi Philippine Stock Exchange Composite Index
GNI Gross NationaI Income RBs Rural Banks
GNPL Gross Non‐Performing Loan REER Real Effective Exchange Rate
GS Government Securities ROP Republic of the Philippines
IEA International Energy Agency RP Repurchase
IMF International Monetary Fund RR Reserve Requirement
IPP Independent Power Producer RRP Reverse Repurchase
IRI International Research Institute for Climate and Society
RWASDA
Risk‐Weighted Asset Special Deposit Account
LFS LPG
Labor Force Survey Liquefied Petroleum Gas
SEM SME
Single‐Equation Model Small and Medium Enterprise
LTFRB Land Transportation Franchising and SOSFM Society of Fellows in Supply Management, Inc.
Regulatory Board TB Thrift Banks
MB MEM
Monetary Board Multi‐Equation Model
TLPU/KBs
Total Loan Portfolio Universal and Commercial Banks
MERALCO Manila Electric Company VAPI Value of Production Index
MISSI Monthly Integrated Survey of Selected VOPI Volume of Production Index
MTP
Industries Major Trading Partner
WESM Wholesale Electricity Spot Market

vii
Contents
Overview ...................................................................................................... viii
I. Inflation and Real Sector Developments ...................................................... 1
Prices ............................................................................................................................. 1
Private Sector Economists’ Inflation Forecasts. ....................................................... 2
Energy prices. ......................................................................................................... 4
Aggregate Demand and Supply ...................................................................................... 6
Aggregate Demand. ................................................................................................ 6
Other Demand Indicators. ....................................................................................... 7
Aggregate Supply. ................................................................................................. 14
Labor Market Conditions ............................................................................................. 15
II. Monetary and Financial Market Conditions .............................................. 16
Domestic Liquidity and Credit Conditions .................................................................... 16
Interest Rates ............................................................................................................... 19
Financial Market Conditions ........................................................................................ 21
Banking System ............................................................................................................ 23
Exchange Rate ............................................................................................................. 25
III. Fiscal Developments ................................................................................ 27
IV. External Developments ........................................................................... 28
V. Monetary Policy Developments ............................................................... 31
VI. Inflation Outlook ..................................................................................... 32
BSP Inflation Forecasts ................................................................................................. 32
Risks to the Inflation Outlook ....................................................................................... 33
VII. Implications for the Monetary Policy Stance .......................................... 36
Summary of Monetary Policy Decisions ....................................................... 38

viii
Overview
Headline inflation rises though full‐year average remains below 2016 target. Headline inflation for the full year 2016 averaged at 1.8 percent, higher than the 1.4 percent in 2015 but remained below the National Government’s announced target range of 3.0 percent ± 1.0 percentage point. For Q4 2016, average inflation increased to 2.5 percent from 2.0 percent in the previous quarter as both food and non‐food commodities continued to register higher price increases, driven by seasonal demand as well as the adverse impact of weather disturbances. In addition, prices of non‐food commodities rose, owing to oil price increases during the review quarter. Similarly, core inflation was higher at 2.5 percent, from 2.0 percent a quarter ago. This brought full‐year average to 1.9 percent, lower than the year‐ago rate of 2.1 percent. Meanwhile, the BSP’s alternative measures of core inflation showed mixed trends in Q4. The net of volatile items measure increased to 2.0 percent (from 1.7 percent a quarter ago) while the trimmed mean was unchanged at 1.8 percent. In contrast, the weighted median measure fell slightly to 2.0 percent (from 2.1 percent). Nevertheless, the number of CPI items with inflation rates greater than the upper end of the 2016 inflation target declined to 21 items (from 25 items a quarter ago) which together comprised 11.4 percent of the CPI basket. Inflation expectations slightly higher but remain within‐target. The BSP’s survey of private sector economists for December 2016 showed a slightly higher mean inflation forecast compared to the September survey. In particular, mean inflation forecast for 2016 rose to 1.9 percent from 1.8 percent in the previous survey. Similarly, the mean inflation forecasts for 2017 and 2018 increased to 3.0 percent (from 2.7 percent) and 3.1 percent (from 2.8 percent), respectively. The higher inflation expectations were attributed to a weaker peso, higher global oil prices, robust domestic demand, increased probability of further Fed rate hikes as well as the possible impact of the proposed tax reforms and higher government spending. These were seen to outweigh the downside risks coming from China’s economic slowdown and the yuan devaluation, as well as the risk of recession and deflation in Japan and the Eurozone. In contrast, the December 2016 Consensus Economics survey showed a lower mean inflation forecast for 2016 at 1.7 percent (from 1.8 percent) although mean inflation forecast for 2017 was unchanged at 2.9 percent.
Domestic demand remains robust. The domestic economy remained strong based on data for Q3 2016, with real GDP growing by 7.1 percent and outpacing the quarter‐ and year‐ago growth rates of 7.0 percent and 6.2 percent, respectively. For the first three quarters of 2016, real GDP rose by 7.0 percent, at the high end of the National Government’s full‐year growth target of 6.0‐7.0 percent. On the expenditure side, household and government spending as well as fixed capital investments contributed to the robust growth of the economy, offsetting the negative contribution of net exports. On the production side, Q3 growth was driven mainly by the services and industry sectors. Similarly, trends in higher‐frequency demand indicators continued to point to firm demand prospects in the near term. Vehicle sales sustained its double‐digit growth, supported by stable consumer demand amid the attractive payment schemes and various marketing promotions of car dealers. Likewise, energy sales continued to report healthy increases during the review quarter.
Higher inflation in Q4 although still below the 2016 target
Moreover, the outlook for the domestic economy remained positive. The composite Purchasing Managers’ Index remained firmly above the expansion threshold, indicating brisk activity ahead. Similarly, business and consumer expectations surveys reported upbeat prospects over the next quarter. These indicators support the view that the country’s underlying domestic demand remains firm amid significant improvements in employment conditions. The global economy grows at a solid pace. Growth in the US economy accelerated in Q3 2016, reflecting an upturn in private inventory investment, exports, and federal government spending. Economic activity in the euro area likewise held firm on the back of positive household consumption. Similarly, Japan’s economy continued to improve, supported by favorable business sentiment, increasing business fixed investment, and stable private consumption. Output growth in India also increased slightly as most economic sectors reported expansions. Meanwhile, indicators pointed to a subdued

ix
economic recovery in China as investment in fixed assets stabilized. In contrast, outlook for the ASEAN countries deteriorated as manufacturing PMI fell below the 50‐point threshold. Domestic financial system remains resilient despite uncertainties. The domestic financial system remained supportive of economic growth. However, volatility emanating primarily from external factors dampened partially the performance of financial markets. Expectations of a Fed rate hike in December, the uncertainty surrounding the elections in the US and in other European countries as well as continued geopolitical tensions factored into global investors’ negative sentiment, which spilled into the domestic financial markets. The Philippine stock market was subdued during the review quarter, closing lower at an average of 7,123 index points. Debt spreads widened, reacting largely to the shift in US monetary policy and politics. In addition, the peso depreciated as firmer economic growth in the US led to a shift in investor preferences. Nevertheless, investor appetite for local currency government securities remained healthy, albeit at a more moderate pace consistent with market developments. Moreover, the banking system saw a continued increase in assets, lending, and deposits, and with capital adequacy ratios comfortably above the BSP’s prescribed levels and international norms. In addition, based on the latest round of the survey on senior bank loan officers, bank lending standards for loans to both enterprises and households were broadly unchanged in Q4, indicating a generally stable supply of credit. Monetary policy settings were maintained in Q4 2016. The BSP decided to maintain its key policy interest rate for the overnight reverse repurchase or RRP facility at its November and December monetary policy meetings. The reserve requirement ratios were likewise left unchanged. The BSP’s decision to maintain key policy rates was based on its assessment that the inflation environment remained manageable. The latest baseline forecasts of the BSP continue to indicate that inflation is likely to return gradually to a path consistent with the inflation
target in 2017‐2018. Inflation is expected to continue gathering pace in the year ahead, with international oil prices seen to increase as a result of recent agreements by producers to reduce output. Looking ahead, the Philippine economy is expected to be able to absorb external shocks and sustain its growth trajectory. Firm domestic demand conditions and ongoing reforms including on the fiscal front, continue to provide solid footing for steady expansion. The overall balance of risks surrounding the inflation outlook is tilted to the upside, owing in part to the pending petitions for adjustments in electricity rates as well as the initial impact of the National Government’s broad fiscal reform program. Lingering uncertainty in global economic prospects, however, continues to pose a downside risk to the inflation outlook.
Current monetary policy settings remain appropriate
On balance, prevailing conditions for inflation as well as output support the view that current monetary policy settings remain appropriate. Inflation dynamics remain manageable given well‐contained inflation expectations over the policy horizon. Moreover, domestic liquidity growth and credit activity continue to keep pace with the overall requirements of the economy. However, the balance of risks to the inflation outlook remains tilted toward the upside, emphasizing the need for continued vigilance in setting the stance of monetary policy going forward. In the near term, policy settings and the resulting overall monetary conditions remain appropriately supportive of economic activity. At the same time, it provides scope for flexibility in view of continued uncertainty in the global economy as well as the possibility that the US Fed may raise interest rates at a faster pace in 2017. As such, the BSP will continue to monitor domestic and external developments to ensure that the monetary policy stance remains consistent with its price and financial stability objective.

Q4 2016 Inflation Report | 1
I. Inflation and Real Sector Developments
Prices Headline Inflation. Headline inflation for the full year 2016 averaged at 1.8 percent, higher than the 1.4 percent in 2015 but remained below the National Government’s (NG) announced target range of 3.0 percent ± 1.0 percentage point (ppt).
Supply-side factors underpin benign inflation readings in 2016; averages at 1.8 percent
Inflation had been on a broadly upward trajectory throughout 2016, which can be attributed to a number of factors namely, the adverse effects of El Niño event and typhoons on the supply of key food items as well as the rebound in international oil prices in late 2016, which resulted in upward price adjustments of oil‐related commodities. Chart 1. Quarterly Headline Inflation (2006=100) in percent
0
1
2
3
4
5
6
Q12013
Q2 Q3 Q4 Q12014
Q2 Q3 Q4 Q12015
Q2 Q3 Q4 Q12016
Q2 Q3 Q4
Food
Non‐Food
Non‐Alcoholic Beverages
Alcoholic Beverages and Tobacco
Headline Inflation
Source: Philipine Statistical Authority (PSA), BSP Consequently, inflation in Q4 2016 increased further to 2.5 percent from 2.0 percent in the previous quarter. Both food and non‐food commodities registered higher price increases during the quarter, driven by seasonal demand, uptick in domestic petroleum prices, and weather‐related supply disruptions. Core Inflation. Core inflation, which excludes certain volatile food and energy items, averaged at 1.9 percent for the full year 2016 from 2.1 percent in 2015. On the other hand, core inflation in Q4 2016 increased to 2.5 percent from 2.0 percent in the previous quarter.
Table 1. Alternative Core Inflation Measures quarterly averages of year‐on‐year change
Quarter
Official
Headline
Inflation
Official Core
Inflation
Trimmed
Mean 1Weighted
Median 2
Net of
Volatile
Items 3
2014 4.1 3.0 3.5 2.9 2.6
Q1 4.1 3.0 3.3 2.6 2.8
Q2 4.4 3.0 3.6 3.2 2.6
Q3 4.7 3.3 3.8 3.1 2.8
Q4 3.6 2.7 3.3 2.7 2.4
2015 1.4 2.1 1.9 1.9 1.8
Q1 2.5 2.5 3.0 3.0 2.3
Q2 1.7 2.2 2.1 2.2 1.9
Q3 0.6 1.6 1.3 1.2 1.5
Q4 1.0 1.8 1.3 1.3 1.5
2016 1.8 1.9 1.6 1.8 1.6
Q1 1.1 1.6 1.2 1.3 1.3
Q2 1.5 1.7 1.5 1.7 1.3
Q3 2.0 2.0 1.8 2.1 1.7
Q4 2.5 2.5 1.8 2.0 2.01 The trimmed mean represents the average inflation ra te of the (weighted) middle 70 percentin a lowes t‐to‐highest ranking of year‐on‐year infla tion rates for a l l CPI components .2 The weighted median represents the middle inflation rate (corresponding to a cumulative CPIweight of 50 percent) in a lowest‐to‐highest ranking of year‐on‐year inflation rates .3 The net of volati le i tems method excludes the fol lowing i tems: bread and cereals , meat, fi sh,fruit, vegetables , gas , sol id fuels , fuels and lubricants for personal transport equipment, and
passenger transport by road, which represents 39.0 percent of al l i tems. The series has been
recomputed us ing a new methodology that i s al igned with PSA's method of computing the
officia l core inflation, which re‐weights rema ining i tems to comprise 100 percent of the core
basket after excluding non‐core i tems. The previous methodology reta ined the weights of
volati le i tems in the CPI basket while keeping thei r indices cons tant at 100.0 from month to month.
Source: PSA, BSP estimates Meanwhile, the three alternative measures of core inflation computed by the BSP showed mixed trends. Similar to the official core inflation, the net of volatile items increased to 2.0 percent in Q4 2016 from 1.7 percent while the trimmed mean was unchanged during the quarter at 1.8 percent. By contrast, weighted median fell slightly to 2.0 percent in Q4 2016 from 2.1 percent in the previous quarter. The number of items with inflation rates greater than the threshold of 4.0 percent (the upper end of the 2016 inflation target) was lower at 21 items in Q4 2016 from 25 items in the previous quarter. Majority of these items were food commodities. Collectively, these items accounted for 11.4 percent of the total CPI basket, slightly higher than the quarter‐ago share of 10.4 percent.

Q4 2016 Inflation Report | 2
Chart 2. CPI Items with Inflation Rates Above Threshold
0
10
20
30
40
50
60
70
0
5
10
15
20
25
30
35
Q12012
Q2 Q3 Q4 Q12013
Q2 Q3 Q4 Q12014
Q2 Q3 Q4 Q12015
Q2 Q3 Q4 Q12016
Q2 Q3 Q4
Cumulative weight in % (LHS) No. of Items Above Threshold (RHS)
Source: Philippine Statistics Authority, BSP staff estimates Alternatively, CPI items with inflation below 2 percent (the low end of the 2016 inflation target) went down to 132 items in Q4 2016 from 134 items in the previous quarter although equivalent weight of these items still accounted for more than half of the CPI basket at 63.0 percent. Consequently, CPI items within the target range of 2‐4 percent increased to 80 items (from 74 items), but accounted for only a quarter (or 25.5 percent) of the total CPI basket. Food Inflation. Food inflation increased to 3.6 percent in Q4 2016 from 2.8 percent in the previous quarter as prices of most food items increased especially with the onset of the holiday season.
Weather-related supply shortfalls push food inflation higher in Q4 2016
Furthermore, recent weather disturbances (including typhoons) that visited the country continued to have an adverse impact on the supply of certain food products. In particular, price markups were noted for food commodities such as, fish, fruits, vegetables as well as oils and fats. Meanwhile, rice prices also increased during the quarter due mainly to the decline in supply coming from the major rice‐producing regions towards the end of harvest season.
Table 2. Inflation Rates for Selected Food Items quarterly averages in percent (2006=100)
Q1 Q2 Q3 Q4 Q1 Q2 Q3 Q4
Food and Non‐Alcoholic Beverages 4.8 3.0 1.1 1.3 1.6 2.3 2.7 3.5
Food 5.0 3.1 1.1 1.3 1.6 2.4 2.8 3.6
Bread and Cereals 5.7 2.6 ‐0.5 ‐1.6 ‐1.2 ‐0.2 0.9 1.5
Rice 7.2 3.3 ‐0.9 ‐2.5 ‐2.0 ‐0.9 0.5 1.4
Corn 2.4 0.2 ‐0.6 ‐0.4 1.7 2.6 2.5 1.9
Meat 4.2 1.3 0.4 0.8 1.0 2.2 2.0 1.6
Fish 5.1 5.3 3.2 3.7 2.8 2.7 4.3 4.9
Milk, Cheese and Eggs 4.4 3.3 1.9 1.3 1.2 1.5 2.0 2.2
Oils and Fats 2.7 0.9 ‐0.3 ‐0.2 0.3 2.1 3.9 4.6
Fruit 11.4 9.6 4.9 3.5 3.3 4.4 7.0 9.2
Vegetables 1.1 0.3 0.2 9.0 10.3 12.9 9.9 11.7
Sugar, Jam, Honey 3.8 4.2 2.9 3.9 6.4 5.0 3.4 3.0
Food Products, N.E.C. 4.8 4.6 3.8 2.7 3.1 ‐1.0 ‐2.4 ‐0.1
Non‐Alcoholic Beverages 2.1 2.2 1.8 1.4 1.2 1.2 1.2 1.3
Alcoholic Beverages and Tobacco 4.0 3.8 3.7 3.9 4.9 5.5 6.0 6.3
2016
Source of Bas ic Data: PSA, BSP
Commodity2015
Non‐Food Inflation. Non‐food inflation increased to 1.5 percent in Q4 2016 from 1.2 percent in the previous quarter owing to price increases of oil‐related commodity groups. In particular, transport inflation went up due mainly to increases in the domestic prices of petroleum products, influenced largely by rising imported crude oil prices. At the same time, transport services increased due to higher air and sea travel fares especially during the holiday season. Meanwhile, electricity, gas, and other fuels inflation remained negative in Q4 2016, albeit less negative compared to the previous quarter. Table 3. Inflation Rates for Selected Non‐Food Items quarterly averages in percent (2006=100)
Q1 Q2 Q3 Q4 Q1 Q2 Q3 Q4
Non‐Food 0.6 0.5 0.1 0.5 0.5 0.6 1.2 1.5
Clothing and Footwear 3.1 2.6 2.3 2.3 1.9 2.3 2.6 2.6
Housing, Water, Electricity,
Gas and Other Fuels ‐1.1 ‐1.1 ‐1.7 ‐1.2 ‐1.0 ‐1.0 0.2 1.2
Electricty, Gas, and Other Fuels ‐8.7 ‐8.2 ‐9.8 ‐8.8 ‐6.9 ‐6.7 ‐3.2 ‐0.2
Furnishings, Household Equipment
& Routine Maintenance of the House 2.2 2.1 1.7 1.6 1.5 1.6 2.1 2.4
Health 2.7 2.3 1.7 1.8 1.9 2.4 2.7 2.6
Transport ‐0.7 0.0 ‐0.5 0.9 0.3 0.0 0.0 0.9
Transport Services 2.6 2.9 2.5 3.3 1.2 0.7 0.3 0.7
Communication ‐0.1 ‐0.1 0.0 0.0 0.1 0.2 0.1 0.1
Recreation and Culture 1.1 1.1 1.0 1.0 1.1 1.6 1.7 1.7
Education 5.1 4.7 3.6 3.6 3.6 3.0 1.8 1.8
Restaurant and Miscellaneous
Goods and Services 1.6 1.2 1.2 1.3 1.6 2.2 2.4 2.2Source of Bas ic Data: PSA, BSP
Commodity2015 2016
Private Sector Economists’ Inflation Forecasts. Results of the BSP’s survey of private sector economists for December 2016 showed that the mean inflation forecast for the full year 2016 was higher relative to the results in September 2016.4 4 There were 26 respondents in the BSP’s survey of private sector economists in December 2016. The survey was conducted between 7 to 29 December 2016.

Q4 2016 Inflation Report | 3
Mean inflation forecast for 2016 is higher
In particular, the mean inflation forecast for 2016 rose to 1.9 percent from 1.8 percent. The average annual inflation forecast for 2017 and 2018 also went up to 3.0 percent (from 2.7 percent) and 3.1 percent (from 2.8 percent), respectively. Chart 3. BSP Private Sector Economists’ Survey mean forecast for full year; in percent
1
2
3
4
5
Jan 2014
Feb
Mar
Apr
May
Jun
Jul
Aug
Sep
Oct
Nov
Dec
Jan 2015
Feb
Mar
Apr
May
Jun
Jul
Aug
Sep
Oct
Nov
Dec
Jan 2016
Feb
Mar
Apr
May
Jun
Jul
Aug
Sep
Oct
Nov
Dec
2016 2017 2018 Target Range 2016: 1.9
Source: BSP
2017 = 3.0
2018 = 3.1
Analysts attributed their higher inflation expectations to a weaker peso, higher global oil prices, robust domestic demand, and increased probability of further Fed rate hikes. The increase in the mean inflation forecast was also driven by the recent uptick in domestic fuel prices and its impact on housing and transport inflation as well as possible effects on prices of the proposed tax reform measures, along with higher government spending. These were seen to outweigh the downside risks brought by the slowdown of the Chinese economy and the yuan devaluation, as well as the risk of recession and deflation in Japan and the Eurozone. Based on the probability distribution of the forecasts provided by 21 out of 26 respondents, there was a 72.9‐percent probability that average inflation for 2016 will settle between the 1.0‐1.99 percent range. Meanwhile, there was a 24.1‐percent probability that the 2016 inflation rate will fall within the 2‐4 percent target range. For 2017, the respondents assigned a 77.1‐percent probability that inflation will fall within the 2‐4 percent target range.
Chart 4. Probability Distribution for Analysts’ Inflation Forecasts* 2016‐2018
0
10
20
30
40
50
60
70
80
90
100
<1 1.0 – 1.99 2.0 – 3.0 3.1 – 4.0 4.1 – 5.0 5.1 – 6.0 6.1 – 7.0
2016 2017 2018
*Probability distributions were averages of those provided by 21 out of 26 respondents. Source: BSP Survey
Results of the December 2016 Consensus Economics survey showed a lower mean inflation forecast for 2016 at 1.7 percent (from 1.8 percent in September 2016). By contrast, the mean inflation forecast for 2017 was unchanged at 2.9 percent.5 Table 4. Private Sector Forecasts for Inflation, December 2016 annual percentage change
2018
FY Q1 Q2 FY FY
1) Al‐Amanah Islamic Bank 2.50 2.50 2.60 2.60 2.70
2) Banco De Oro 1.76 2.95 3.28 3.30 3.50
3) Bangkok Bank 2.00 3.00 3.25 3.13 3.50
4) Bank of Commerce 1.81 ‐ ‐ ‐ ‐
5) Bank of China 1.70 2.70 2.70 2.70 2.80
6) Bank of the Philippine Islands 1.80 3.10 3.20 3.50 3.00
7) Barclays 1.70 2.60 2.70 2.50 3.00
8) Chinabank 1.80 2.30 2.30 2.30 2.50
9) CTBC Bank 2.50 1.80 2.80 3.20 3.50
10) Deutsche Bank 1.80 ‐ ‐ 3.30 3.10
11) Eastwest Bank 2.40 2.50 2.40 2.60 2.75
12) IDEA 1.80 3.20 3.60 3.60 3.70
13) Korea Exchange Bank 2.80 2.80 2.70 2.80 2.80
14) Land Bank of the Phils 2.00‐2.60 1.70‐1.90 2.20‐2.80 2.50‐3.00 2.50‐3.00
15) Maybank 1.74 2.50 2.90 3.00 3.00
16) Metrobank 1.80 ‐ ‐ 3.10 3.60
17) Multinat'l Inv. Banc 1.70 2.50 2.70 2.80 3.00
18) Mizuho 1.70 2.30 2.50 2.50 ‐
19) Nomura 1.70 3.40 3.40 3.30 3.70
20) PEP 1.78 2.95 3.29 3.34 3.50
21) RCBC 1.70‐1.80 2.80‐3.10 2.90‐3.40 2.80‐3.30 3.10‐3.60
22) Robinsons Bank 1.80 3.00 3.30 3.30 2.00
23) Security Bank 1.80 2.80 3.00 3.10 3.40
24) Standard Chartered 1.70 2.80 2.90 3.00 3.30
25) UBS 1.80 3.10 3.50 3.20 3.20
26) Union Bank 1.80 2.50 2.70 2.90 3.40
Median Forecast 1.8 2.8 2.9 3.1 3.2
Mean Forecast 1.9 2.7 2.9 3.0 3.1
High 2.8 3.4 3.6 3.6 3.7
Low 1.7 1.8 2.3 2.3 2.0
Number of Observations 26 23 23 25 2.4
Government Target 3.0±1.00 3.0±1.00 3.0±1.00 3.0±1.00 3.0±1.00
2016
Source: BSP
2017
Based on the Q4 2016 BSP Business Expectations Survey (BES), majority of firms expected inflation to increase in the current quarter relative to the previous quarter (from a diffusion index of 25.3 percent to 49.4 percent). 5 There were 18 respondents in the Consensus Economics’ survey in December 2016.

Q4 2016 Inflation Report | 4
Inflation expectations trend higher
There were more firms that expected inflation to increase in the next quarter (from a diffusion index of 28.0 percent to 35.5 percent). Similarly, results of the Q4 2016 BSP Consumer Expectations Survey (CES) showed that respondents anticipated inflation to pick up over the next 12 months to 2.7 percent from 1.8 percent in the Q3 2016 survey. Energy prices. The average price of Dubai crude oil increased in Q4 2016 by 11.9 percent relative to the previous quarter. Oil prices exceeded US$50 per barrel in December following policy decisions of major oil producers to cut production.
Global oil prices rise due to decision to reduce supply output
Dubai crude prices continued to rally in October following the Organization of Petroleum Exporting Countries’ (OPEC) preliminary decision to limit production output during its meeting on 28 September in Algeria. However, expectations of: (1) higher production in Libya, (2) easing supply outages in Nigeria due to ceasefire agreement between the government and militants, and (3) Iran’s rising production to pre‐sanction levels are expected to offset the proposed production cut by OPEC. Furthermore, US active rig count has been rising steadily. Based on data from Baker Hughes, rig count reached 634 in December 2016, an increase from 509 in September.6 In December 2016, Dubai crude prices rose anew due to OPEC’s announcement to reduce supply output by 1.2 million barrels per day (mb/d) to 32.5 mb/d, effective 1 January 2017 for the next six months. 7 Moreover, other non‐OPEC 6 Source: “Baker Hughes Rig Count Data | BakerHughes.com, Worldwide Rig Counts” Baker Hughes, Source: http://www.bakerhughes.com/. 7 Source: “OPEC : OPEC 171st Meeting Concludes,” Organization of Petroleum Exporting Countries, November 30,
producers including Russia has committed to reduce production by 558,000 barrels. In Q4 2016, estimated futures prices for Dubai crude oil, which are based on movements of Brent crude oil, showed a higher path for 2017 to 2020 compared to the estimates in the previous quarter. Estimated future prices has already exceeded US$50 per barrel by end‐2017.8 Chart 5. Spot and Estimated Prices of Dubai Crude Oil
20
40
60
80
100
120
140
Q1 2013
Q2
Q3
Q4
Q1 2014
Q2
Q3
Q4
Q1 2015
Q2
Q3
Q4
Q1 2016
Q2
Q3
Q4
Q1 2017
Q2
Q3
Q4
Q1 2018
Q2
Q3
Q4
*Futures prices derived using Brent crude futuresSource: Bloomberg, BSP
30 September 2016
30 December 2016
According to the US Energy Information Administration (EIA)9 report in December 2016, supply would continue to outstrip demand in 2017 by around 0.4 mb/d. Meanwhile, global liquid fuels demand growth forecast was higher in 2017 compared to the previous quarter’s assessment on the back of strong economic data from US as well as robust activity in four major manufacturing regions namely, China, Eurozone, India, and the US. Meanwhile, projections on oil consumption from other energy agencies were mixed. In its December report, OPEC kept its demand growth forecast unchanged relative to the previous quarter10 while the US International Energy Agency (IEA) adjusted its demand growth forecasts higher to 1.30 mb/d for 2017 from 1.20 mb/d in its previous forecast owing to upward adjustments in Chinese consumption and robust US demand data. 11 2016, http://www.opec.org/opec_web/en/press_room/3912.htm. 8 Future prices derived using Brent crude futures data. Source: BSP‐staff calculations, Bloomberg 9 US EIA Short‐Term Energy Outlook, December 2016. Source: https://www.eia.gov/forecasts/steo/ 10 OPEC Monthly Oil Market Report, December 2016. http://www.opec.org/opec_web/en/publications/338.htm 11 IEA Oil Market Report, December 2016. https://www.iea.org/oilmarketreport/omrpublic/

Q4 2016 Inflation Report | 5
Supply would continue to outstrip demand in 2017
Prices of domestic petroleum products also rose relative to previous end‐quarter levels following the increase in international oil prices. In particular, gasoline, kerosene, diesel, and LPG went up by P4.38, P4.10, P3.60, and P3.46 per liter respectively. Relative to year‐ago levels, however, LPG prices recorded a downward adjustment of P0.65 per liter compared to end‐December 2015. Table 5. Domestic Retail Pump Prices peso/liter; end‐quarter prices Quarter Gasoline Kerosene Diesel LPG
2014 Q1 53.75 50.87 44.25 41.73
Q2 54.95 51.51 43.70 40.27
Q3 52.15 47.99 40.70 38.74
Q4 41.20 37.39 30.05 33.87
2015 Q1 42.60 35.59 28.85 31.19
Q2 45.90 37.49 29.65 30.18
Q3 42.25 33.44 26.80 28.00
Q4 38.10 29.07 22.60 32.14
2016 Q1 39.00 30.32 22.80 27.69
Q2 41.15 33.53 27.95 29.12
Q3 41.60 32.71 26.50 28.03
Q4 45.98 36.81 30.10 31.49
2016 Q4 4.38 4.10 3.60 3.46
2016 Q4 7.88 7.74 7.50 (0.65)
Quarter‐on‐Quarter Change
Year‐on‐Year Change
*Average Metro Mani la reta i l pump prices for the big three oi l
companies : Caltex, Petron and Shel l
Source: Department of Energy (DOE) Power. Overall electricity rates went down in Q4 2016 due to lower generation costs and transmission charges. For Q4 2016, the average generation charge dropped by P0.06 per kilowatt hour (kWh) to P3.89 per kWh from P3.95 per kWh in Q3 2016.
Lower generation lead to a decrease in retail electricity prices
The decline in the average electricity rates during the review quarter was driven largely by the lower generation cost from the Wholesale Electricity Spot Market (WESM) in October and November 2016, due to the depreciation of the Philippine peso against the US dollar, which offset the slight
increase recorded in December 2016. Meanwhile, the decrease in WESM’s generation cost was driven mainly by lower demand in electricity. At the same time, transmission charge was lower during the review quarter due mainly to the reduction in the ancillary charges of the National Grid Corporation of the Philippines’ (NGCP).12 Chart 6. Meralco’s Generation Charge PhP/kWh; year‐on‐year growth rates in percent
‐40
‐30
‐20
‐10
0
10
20
30
40
50
0
1
2
3
4
5
6
7
8
9
Q12013
Q2 Q3 Q4 Q12014
Q2 Q3 Q4 Q12015
Q2 Q3 Q4 Q12016
Q2 Q3 Q4
Generation Charge (PhP/kWh) (LHS)
Generation Charge (year‐on‐year growth rates in percent) (RHS)
Source: Meralco Meanwhile, potential sources of upside pressures on electricity charges remain. Meralco has existing petitions for rate increases with ERC as well as petitions for the refund of generation and transmission costs, system loss and lifeline subsidy for 2011. In addition, the Power Sector Assets and Liabilities Management (PSALM) has several pending petitions with ERC for the recovery of foreign exchange related costs as well as the National Power Corporation’s (NPC) Stranded Debt portion of the universal charge. Likewise, the NGCP also filed several petitions to recover connection and other charges for 2011‐2013 as well as costs of repair on damages caused by force majeure events in 2011‐2012.
MWSS implements rate adjustments for concessionaires due to FCDA
Water. Effective 1 July 2016, the all‐in‐water rates of Manila Water Company, Inc. (MWCI) and Maynilad Water Services, Inc (MWSI) slightly went down by P0.02/cu.m. and P0.01/cu.m., respectively. The decrease was due to the foreign currency differential adjustment (FCDA) approved by the 12 Ancillary charges are payments for ancillary services by the NGCP which were underpaid from 2008‐2009.

Q4 2016 Inflation Report | 6
Metropolitan Waterworks and Sewerage System‐Regulatory Office (MWSS‐RO) for Q3 2016.
Aggregate Demand and Supply The Philippine economy expanded by 7.1 percent in Q3 2016, higher than the quarter‐ and year‐ago growth rate of 7 percent and 6.2 percent, respectively..
Real GDP sustains strong growth
The Q3 growth was driven by higher growth in consumer spending and increasing fixed capital investments, particularly in durable equipment and construction. Meanwhile, the services and industry sectors continued to be the main drivers of growth on the production side. On a seasonally‐adjusted basis, quarter‐on‐quarter GDP growth slowed down to 1.2 percent in Q3 2016 from 2.1 percent in Q2 2016.. Gross national income (GNI) growth decelerated to 6.3 percent in Q3 2016 from the previous quarter’s growth of 6.7 percent. Likewise, net primary income grew by 2.5 percent, lower than the quarter‐ and year‐ago growth rate of 5 percent and 6.8 percent, respectively. The slowdown can be attributed mainly to slower growth of compensation inflows. Chart 7. Gross Domestic Product (GDP) and Gross National Income (GNI) at constant prices
2
4
6
8
10
Q12013
Q2 Q3 Q4 Q12014
Q2 Q3 Q4 Q12015
Q2 Q3 Q4 Q12016
Q2 Q3
GDP GNI
Source: PSA
Aggregate Demand. On the expenditure side, household and government spending as well as fixed capital investments contributed to the robust growth of the economy (with contribution to GDP growth of 5 ppts, 0.3 ppt, and 5.5 ppts, respectively), offsetting the negative contribution of net exports (‐3.5 ppts), which was due mainly to the slowdown of exports of services.
Household spending on food and beverages supported demand-side expansion
Household spending, which accounted for more than two‐thirds of the country’s output (68.3 percent of total GDP), rose by 7.3 percent in Q3 2016, a slight deceleration from the 7.4‐percent growth a quarter ago. Top contributors to household spending were food and non‐alcoholic beverages (3.5 ppts), transport (1.1 ppts), as well as miscellaneous goods and services (1.1 ppts). The upbeat consumer spending was driven by low and stable inflation. Chart 8. Gross Domestic Product by Expenditure Shares at constant prices
‐10
0
10
20
30
40
50
60
Q12013
Q2 Q3 Q4 Q12014
Q2 Q3 Q4 Q12015
Q2 Q3 Q4 Q12016
Q2 Q3
HH Consumption Govt Spending Capital Formation
Source: PSA
7.3 pct 3.1 pct 20.0 pct
Growth in investments in capital formation remained at double‐digit rate but slowed down to 20 percent in Q3 2016 from 25 percent in Q2 2016, due to the following: (a) Deceleration of fixed capital growth to
23.5 percent in Q3 2016 from 24.6 percent in Q2 2016); ‐ This can be attributed to lower growth in investments in durable equipment (29.6 percent in Q3 2016 from 36.2 percent a quarter ago) as investments in road

Q4 2016 Inflation Report | 7
vehicles slowed to 39.6 percent from 46.3 percent in the previous quarter.
‐ Meanwhile, private construction doubled its growth to 16.2 percent in Q3 2016 (from 8 percent a quarter ago) while public construction continued to increase, although slower at 20.1 percent in Q3 2016 from 33.2 percent in Q2 2016.
(b) Withdrawals in inventories of P3 billion in
Q3 2016 as compared to the P10.1 billion additions in the same period last year.
Government expenditures grew by 3.1 percent in Q3 2016 from 13.5 percent in Q2 2016 due to the reduction in maintenance spending of various agencies as well as delays in the implementation of the programs and projects of various agencies during the transition period to the new administration.
Overall exports growth decelerated in Q3 2016 to 8.8 percent from the quarter‐ago growth rate of 10 percent. Growth in exports of goods (7.8 percent from 7.2 percent a quarter ago) was driven mainly by the accelerated growth in exports of electronic data processing (28.7 percent in Q3 2016 from 28 percent a quarter ago) and telecommunication (86 percent in Q3 2016 from 76.2 percent a quarter ago). The expansion in exports of was weighed down by the slowdown in exports of services growth (14.2 percent from 19.5 percent). Meanwhile, the weakening of growth in exports of services was primarily due to the lower growth in exports of miscellaneous services (e.g. technical, trade‐related, and other business services and computer services) from 20.4 percent in Q2 2016 to 19 percent in Q3 2016. Table 6. Economic Performance at constant 2000 prices; growth rate in percent
Q1 Q2 Q3 Q4 Q1 Q2 Q3
Household Consumption 6.1 6.4 6.1 6.5 7.0 7.4 7.3
Government Consumption 0.2 2.4 15.7 15.8 11.8 13.5 3.1
Capital Formation 12.5 21.4 14.5 13.3 26.6 25.0 20.0
Fixed Capital Formation 8.8 12.7 13.9 24.2 28.2 24.6 23.5
Exports 10.6 5.1 9.8 10.9 7.3 10.0 8.8
Imports 12.2 12.6 16.2 14.9 19.0 23.2 14.2
Source: PSA
BY EXPENDITURE ITEM2015 2016
Overall imports posted 14.2 percent expansion for the quarter, lower than the quarter‐ago increase of 23.2 percent, owing to the decelerated growth in imports of both goods and services. The contraction in the growth in imports of semiconductors as well as the slowdown in growth of imports of transport equipment mainly
contributed to the 14.3 percent growth of imports of goods for the quarter from 24.8 percent a quarter ago. Meanwhile, growth of imports of services decreased to 13.5 percent (from 17.3 percent a quarter ago) largely due to the deceleration of imports of miscellaneous services (e.g. computer services) by 19.3 percent from 24.1 percent.
Other Demand Indicators. High‐frequency demand indicators continued to support the view of robust economic activity. The property sector continued to exhibit strong demand particularly from the BPO sector, vehicle sales sustained its double‐digit growth while the composite Purchasing Managers’ Index remained firmly above the 50‐point expansion threshold. Similarly, business confidence remained positive for the review quarter and was more upbeat for the next quarter. Finally, consumer confidence reached an all‐time high for the review quarter and remained positive in the period ahead. Property Prices Vacancy Rates, Makati CBD. The office vacancy rate in the Makati CBD in Q3 2016 was lower at 0.8 percent relative to quarter‐ago and year‐ago rates of 1.7 percent and 2.1 percent, respectively.
Lower office vacancy rates due to demand from BPO and traditional offices
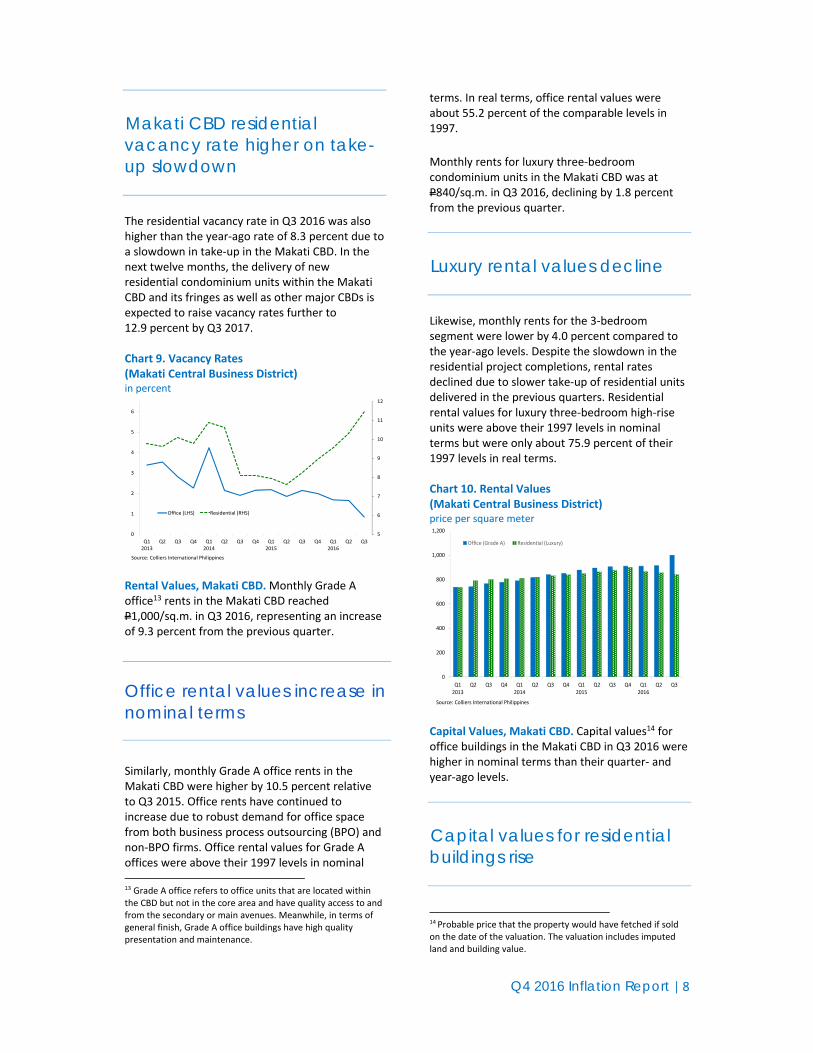
According to Colliers, the tighter vacancy rate for the quarter was due to sustained demand from both BPO and traditional office locators amid limited office supply. Consequently, Colliers expects office vacancy to remain at below one‐percent level (0.7 percent) in the next twelve months due to lower office space completions amid construction delays. The residential vacancy rate in the Makati CBD increased to 11.5 percent in Q3 2016 from 10.2 percent in the previous quarter.
Q4 2016 Inflation Report | 8
Makati CBD residential vacancy rate higher on take-up slowdown
The residential vacancy rate in Q3 2016 was also higher than the year‐ago rate of 8.3 percent due to a slowdown in take‐up in the Makati CBD. In the next twelve months, the delivery of new residential condominium units within the Makati CBD and its fringes as well as other major CBDs is expected to raise vacancy rates further to 12.9 percent by Q3 2017. Chart 9. Vacancy Rates (Makati Central Business District) in percent
5
6
7
8
9
10
11
12
0
1
2
3
4
5
6
Q12013
Q2 Q3 Q4 Q12014
Q2 Q3 Q4 Q12015
Q2 Q3 Q4 Q12016
Q2 Q3
Office (LHS) Residential (RHS)
Source: Colliers International Philippines
Rental Values, Makati CBD. Monthly Grade A office13 rents in the Makati CBD reached P1,000/sq.m. in Q3 2016, representing an increase of 9.3 percent from the previous quarter.
Office rental values increase in nominal terms
Similarly, monthly Grade A office rents in the Makati CBD were higher by 10.5 percent relative to Q3 2015. Office rents have continued to increase due to robust demand for office space from both business process outsourcing (BPO) and non‐BPO firms. Office rental values for Grade A offices were above their 1997 levels in nominal 13 Grade A office refers to office units that are located within the CBD but not in the core area and have quality access to and from the secondary or main avenues. Meanwhile, in terms of general finish, Grade A office buildings have high quality presentation and maintenance.
terms. In real terms, office rental values were about 55.2 percent of the comparable levels in 1997.
Monthly rents for luxury three‐bedroom condominium units in the Makati CBD was at P840/sq.m. in Q3 2016, declining by 1.8 percent from the previous quarter.
Luxury rental values decline
Likewise, monthly rents for the 3‐bedroom segment were lower by 4.0 percent compared to the year‐ago levels. Despite the slowdown in the residential project completions, rental rates declined due to slower take‐up of residential units delivered in the previous quarters. Residential rental values for luxury three‐bedroom high‐rise units were above their 1997 levels in nominal terms but were only about 75.9 percent of their 1997 levels in real terms. Chart 10. Rental Values (Makati Central Business District) price per square meter
0
200
400
600
800
1,000
1,200
Q12013
Q2 Q3 Q4 Q12014
Q2 Q3 Q4 Q12015
Q2 Q3 Q4 Q12016
Q2 Q3
Office (Grade A) Residential (Luxury)
Source: Colliers International Philippines Capital Values, Makati CBD. Capital values14 for office buildings in the Makati CBD in Q3 2016 were higher in nominal terms than their quarter‐ and year‐ago levels.
Capital values for residential buildings rise
14 Probable price that the property would have fetched if sold on the date of the valuation. The valuation includes imputed land and building value.

Q4 2016 Inflation Report | 9
Grade A office capital values in the Makati CBD rose to P121,895/sq.m., higher by 2.9 percent and by 16.6 percent compared to the quarter‐ and year‐ago levels, respectively. Grade A office capital values were also higher than the 1997 levels in nominal terms. Nevertheless, in real terms, office capital values were about 65.8 percent of the comparable levels in 1997. Meanwhile, capital values for luxury residential buildings15 in Makati CBD in Q3 2016 declined to P146,485/sq.m. from their quarter‐ and year‐ago levels. Average prices for three‐bedroom luxury residential condominium units decreased by 0.7 percent quarter‐on‐quarter and 3.0 percent year‐on‐year. Colliers attribute the decline in capital values to muted prospects for the residential market. Capital values for luxury residential buildings were above their 1997 levels in nominal terms. In real terms, residential capital values were about 64.5 percent of the comparable levels in 1997. Chart 9. Capital Values (Makati Central Business District) price per square meter
0
20,000
40,000
60,000
80,000
100,000
120,000
140,000
160,000
Q12013
Q2 Q3 Q4 Q12014
Q2 Q3 Q4 Q12015
Q2 Q3 Q4 Q12016
Q2 Q3
Office (Grade A) Residential (luxury)
Source: Colliers International Philippines
BSP Residential Real Estate Price Index (RREPI).16 Residential real estate prices grew at a slower pace of 2.2 percent in Q3 2016 as the RREPI rose to 113.4 from 111.0 for the same quarter a year ago. The annual growth in residential real estate prices was lower than the 11.3 percent increase registered a quarter ago. 15 In terms of location, luxury residential units are located within the CBD core and have quality access to/from and have superior visibility from the main avenue. Meanwhile, in terms of general finish, luxury residential units have premium presentation and maintenance. 16 The RREPI measures the average changes in prices of different types of housing units over a period of time across different geographical regions where the growth rate of the index measures house inflation. It is computed as a weighted chain‐linked index based on the average appraised value per square meter weighted by the share of floor area of housing units.
Residential property prices increase in Q2 2016
Among the four major types of housing unit, townhouses posted the highest growth in prices (4.9 percent) followed by condominium units (3.1 percent) and single detached housing units (2.4 percent). Meanwhile, prices of duplex units declined (‐5.1 percent). Residential real property prices rose in areas outside NCR (AONCR) by 4.9 percent but declined marginally in NCR by 0.2 percent in Q3 2016. This was due mainly to the faster rate of increase in prices of single detached housing units and townhouses in AONCR compared to those of NCR. Meanwhile, the prices of condominium units increased in both NCR and AONCR. Table 7. Residential Real Estate Price Index Q1 2014=100; growth rate in percent
Overall 2
NCR AONCR
2015Q2 110.3 114.7 106.2
Q3 111.0 115.6 107.0
Q4 113.6 116.2 111.3
2016Q1 115.9 116.5 115.5
Q2 122.8 117.8 125.7
Q3 113.4 115.4 112.2
2015Q2 13.5 17.6 9.9
Q3 4.7 8.0 2.8
Q4 5.2 5.8 6.2
2016Q1 9.4 10.0 9.0
Q2 11.3 2.7 18.4
Q3 2.2 ‐0.2 4.9
2015Q2 4.2 8.3 0.2
Q3 0.6 0.8 0.8
Q4 2.3 0.5 4.0
2016Q1 2.0 0.3 3.8
Q2 6.0 1.1 8.8
Q3 ‐7.7 ‐2.0 ‐10.71Based on bank reports on residential real estate loans granted per
BSP Circular No. 892 dated 16 November 2015.2No index generated for apartments due to very few observations;
Indices for duplex exhibit more volatility due to relatively small number of
reported real estate loans.
Source: BSP
Year‐on‐Year Growth Rates
Quarter‐on‐Quarter Growth Rates
Residential Real Estate Price Index 1
Quarter
Vehicle Sales. Sales of new vehicles17 grew by 15.2 percent y‐o‐y in the first two months of Q4 2016, albeit slower than the 27.3‐percent growth recorded in the same period a year ago. 17 Vehicle sales data is gathered on a monthly basis by the Chamber of Automotive Manufacturers of the Philippines (CAMPI). CAMPI represents the local assemblers and manufacturers of vehicle units in the Philippine automotive industry.

Q4 2016 Inflation Report | 10
Sales of new vehicles remain at double-digit rate
The Chamber of Automotive Manufacturers of the Philippines, Inc. (CAMPI) attributed the continued growth in automotive sales to robust consumer demand that was matched with the attractive payment schemes and aggressive marketing promotions of car dealers. Commercial vehicles, which accounted for about 63.2 percent of total vehicle sales, expanded at a lower rate of 19.8 percent y‐o‐y in the first two months of Q4 2016 relative to 26.5‐percent growth in the same period of 2015. Commercial vehicles sold during the quarter reached 40,456 units from 33,762 units in October‐November 2015. The growth of passenger car sales from CAMPI members also slowed down to 8.0 percent y‐o‐y in October‐November 2016, which accrued to a total of 23,642 units from 21,844 units sold in the same period in 2015. Chart 10. Vehicle Sales number of units
‐15
‐10
‐5
0
5
10
15
20
25
30
35
Q12013
Q2 Q3 Q4 Q12014
Q2 Q3 Q4 Q12015
Q2 Q3 Q4 Q12016
Q2 Q3 Q4*
* October‐November 2016 Source: Chamber of Automotive Manufacturers of the Philippines, Inc. (CAMPI)
Energy Sales. Meralco’s energy sales for Q4 2016 (October‐November) grew by 3.7 percent, lower than the 8.6‐percent growth reported in the same period a year ago.
Energy sales continue to increase
Energy sales expanded with y‐o‐y growth rates of 5.3 percent, 4.8 percent, and 0.8 percent for residential, commercial and industrial sectors, respectively.
Chart 11. Energy Sales year‐on‐year growth in percent
‐10
0
10
20
30
40
50
60
70
Q12013
Q2 Q3 Q4(Oct‐Nov)
Q12014
Q2 Q3 Q4(Oct‐Nov)
Q12015
Q2 Q3 Q4(Oct‐Nov)
Q12016
Q2 Q3 Q4(Oct‐Nov)
Total Energy SalesResidentialCommercialIndustrialOthers
Source: Meralco, BSP calculations
3.7 pct 5.3 pct 4.8 pct 0.8 pct1.4 pct
Capacity Utilization. Based on the Philippine Statistics Authority’s Monthly Integrated Survey of Selected Industries (MISSI), the average capacity utilization rate of the manufacturing sector increased slightly to 83.7 percent in October 2016 from 83.6 percent a month ago.
Capacity utilization in manufacturing remains above 80 percent
Of the 676 respondent‐establishments, 58.1 percent operated at least at 80.0 percent capacity in October 2016. Data showed that the manufacturing companies have been operating above the 80.0 percent capacity since 2010. Chart 12. Monthly Average of Capacity Utilization for Manufacturing in percent
80
81
82
83
84
85
Jan 2013
Feb
Mar
Apr
May Jun
Jul
Aug
Sep
Oct
Nov
Dec
Jan 2014
Feb
Mar
Apr
May Jun
Jul
Aug
Sep
Oct
Nov
Dec
Jan 2015
Feb
Mar
Apr
May Jun
Jul
Aug
Sep
Oct
Nov
Dec
Jan 2016
Feb
Mar
Apr
May Jun
Jul
Aug
Sep
Oct
Source: PSA Volume and Value of Production. Preliminary results of the MISSI showed that volume of production index (VoPI) grew by 8.4 percent year‐on‐year in October 2016, albeit lower than the 9.2 percent growth in the previous month.

Q4 2016 Inflation Report | 11
Manufacturing output sustains growth
The continued expansion in VoPI was led by double‐digit increments in the production of petroleum products (37.0 percent), food manufacturing (14.3 percent), machinery except electrical (24.4 percent), and transport equipment (19.4 percent).
Similarly, the value of production index (VaPI) also grew by 4.3 percent in October 2016. However, this was lower than the month‐ago level of 5.0 percent. The increase was supported by the double‐digit increments in the VaPI of the following sub‐sectors: petroleum products (29.0 percent), food manufacturing (16.8 percent), transport equipment (17.7 percent), and beverages (12.1 percent). Chart 13. Volume and Value Indices of Manufacturing Production year‐on‐year in percent
‐20
‐10
0
10
20
30
40
Jan 2013
Feb
Mar
Apr
May
Jun
Jul
Aug
Sep
Oct
Nov
Dec
Jan 2014
Feb
Mar
Apr
May
Jun
Jul
Aug
Sep
Oct
Nov
Dec
Jan 2015
Feb
Mar
Apr
May
Jun
Jul
Aug
Sep
Oct
Nov
Dec
Jan 2016
Feb
Mar
Apr
May
Jun
Jul
Aug
Sep
Oct
VAPI VOPI
Source: PSA Business Expectations. The business sector turned less optimistic in their economic outlook for Q4 2016, as the overall confidence index (CI) of the Business Expectations Survey (BES)18 declined to 39.8 percent from 45.4 percent in the Q3 2016 survey round. This indicates that the number of 18 The Q4 2016 BES was conducted during the period 3 October ‐ 17 November 2016 among the 1,470 firms surveyed nationwide. Respondents were drawn from the combined list of the Securities and Exchange Commission’s Top 7,000 Corporations in 2010 and Business World’s Top 1,000 Corporations in 2014, consisting of 587 companies in NCR and 883 firms in AONCR, covering all 17 regions. The survey response rate for this quarter was lower at 80.7 percent compared to the 83.8‐percent response rate in the previous quarter. The response rate was lower for both NCR at 80.2 percent (from 80.7 percent in the previous quarter) and AONCR at 81 percent (from 85.8 percent in Q3 2016).
pessimists increased but remained less than that of optimists during the quarter.
Business outlook less optimistic in Q3 but more upbeat in the next quarter
Despite the usual uptick in demand during the Christmas season, business outlook was less buoyant for the current quarter due to (a) perceived concerns over the direction of foreign policies and economic reforms in the country, (b) weakening global demand, (c) foreign exchange losses of importers due to peso depreciation, and (d) lack of supply of raw materials. The sentiment of businesses in the Philippines mirrored the less buoyant business outlook in Thailand, New Zealand, and France but was in contrast to the more bullish views of those in the US, Canada, China, Hong Kong SAR, the Netherlands, and Germany. Table 8. Business Expectations Survey
Current
Quarter
Next
Quarter
2015 Q1 45.2 58.2
Q2 49.2 47.3
Q3 41.4 53.1
Q4 51.3 43.9
2016 Q1 41.9 49.6
Q2 48.7 45.3
Q3 45.4 56.8
Q4 39.8 34.5
Source: BSP
BUSINESS
OUTLOOK
INDEX
For the quarter ahead (Q1 2017), business confidence likewise weakened but continued to be positive as the next quarter index declined to 34.5 percent from 56.8 percent in the previous quarter’s survey results. Respondents attributed their less optimistic outlook for Q1 2017 to the usual slowdown in consumer demand after the holiday season. Other reasons cited by firms were the direction of foreign policies and economic reforms in the country, stiffer competition with the entry of new players in the market, and the wait‐and‐see attitude of investors for the coming year following the results of the US national elections, which could affect the interest rate movements in the country.

Q4 2016 Inflation Report | 12
Consumer Expectations. Results of the latest Consumer Expectations Survey (CES)19 showed continued improvement in consumer outlook for Q4 2016, as the overall confidence index (CI) rose to a new all‐time high of 9.2 percent from 2.5 percent for Q3 2016. This is the second consecutive quarter that consumer confidence registered a positive reading, indicating that the number of households with optimistic views increased and outnumbered those with pessimistic views.
Consumer confidence for the current and next quarters improve notably
According to respondents, the following reasons were behind their rising optimism: (a) improvements in the peace and order situation; (b) effective government policies (e.g., end to job contractualization or “endo” and no‐window‐hour policy in the number coding scheme); (c) anticipated increase in salaries; and (d) availability of more jobs. Respondents also cited assistance from government such as the Pantawid Pamilyang Pilipino Program (4Ps), new administration/president, less corruption, anti‐drug campaign and improvement in services of government agencies (e.g., NBI clearance and birth certificate) which helped boost consumer confidence for the current quarter. The outlook of consumers in the Philippines mirrored the more favorable sentiment of consumers in Canada, China, Euro Area, Indonesia and Switzerland but was in contrast to the less optimistic views of those in Australia, Japan, South Korea, Taiwan, Thailand, United Kingdom and the United States for Q4 2016. 19 The Q4 2016 CES was conducted during the period 3 ‐ 14 October 2016. The CES sample households, which were drawn from the Philippine Statistics Authority (PSA) Master Sample List of Households, were generated using a stratified multi‐stage probability sampling scheme. It has a sample size of 6,036 households, of which 3,098 (51.3 percent) were from NCR and 2,938 (48.7 percent) from AONCR. Of the sample size, 5,836 households responded to the survey, equivalent to a response rate of 96.7 percent (from 96.9 percent in the last quarter’s survey). The respondents consist of 2,988 households (or 96.4 percent response rate) in NCR and 2,848 households (or 96.9 percent response rate) in AONCR.
Table 9. Consumer Expectations Survey
Current
Quarter
Next 3
Months
Next 12
Months
2015 Q1 ‐10.0 4.4 17.3
Q2 ‐16.2 ‐0.4 16.4
Q3 ‐11.6 5.8 15.8
Q4 ‐8.1 5.7 18.0
2016 Q1 ‐5.7 9.1 25.4
Q2 ‐6.4 5.6 26.6
Q3 2.5 27.3 43.8
Q4 9.2 18.8 33.4
CONSUMER
OUTLOOK
INDEX
Source: BSP For the next quarter (Q1 2017) and the year ahead, consumer confidence was less optimistic as the CIs declined but remained positive at 18.8 percent (from 27.3 percent a quarter ago) and 33.4 percent (from 43.8 percent in the previous quarter’s survey results), respectively. This indicates that the number of households with positive outlook decreased but continued to exceed those with negative views. Respondents’ less upbeat outlook for the next quarter and the year ahead stemmed from households’ concerns about (a) higher prices of goods, (b) lower income, (c) unstable stock market, (d) fewer investors in the country, and (e) issues on extrajudicial killings. Purchasing Managers’ Index.20 The composite PMI remained firmly above the 50‐point expansion threshold21 at 55.3 in November 2016, higher than 53.2 in the previous month. The November PMI was also an improvement from last year’s reading at 55.1. The uptick was due mainly to the faster rate of expansion of the services and retail and wholesale sectors.
PMI remains above the 50-point expansion threshold
20 Data based on the monthly purchasing managers’ index report of the Philippine Institute for Supply Management. 21 The actual formula used to calculate the PMI assigns weights to each common element and then multiplies them by 1.0 for improvement, 0.5 for no change, and 0 for deterioration. As a result, an index above 50 indicates economic expansion, and an index below 50 implies a contraction. PMI surveys are conducted on the last week of the month.

Q4 2016 Inflation Report | 13
Chart 14. Purchasing Managers’ Index
40
45
50
55
60
65
70
Jan 2013
Feb
Mar
Apr
May
Jun
Jul
Aug
Sep
Oct
Nov
Dec
Jan 2014
Feb
Mar
Apr
May
Jun
Jul
Aug
Sep
Oct
Nov
Dec
Jan 2015
Feb
Mar
Apr
May
Jun
Jul
Aug
Sep
Oct
Nov
Dec
Jan 2016
Feb
Mar
Apr
May
Jun
Jul
Aug
Sep
Oct
Nov
Composite Manufacturing Retail & Wholesale Trade Services
55.3 53.2 57.7 55.2
Source: Philippine Institute of Supply Management (PISM) The manufacturing PMI decreased by 1.2 index points to 53.2 in November 2016 from 54.4 in October 2016. The sector’s slowdown was attributed to seasonal downturn that typically occurs between November and January of the following year. Some firms also reported having limited available supplies and materials in November. Among the sector’s indices, only the New Orders Index increased even as the Supplier Deliveries Index contracted, shortening lead time by 2.26 index points, which reflects softer demand for production inputs. Consequently, all companies by export categories expanded at a slower rate month‐on‐month except for those whose export volume is between 26 percent and 50 percent of total revenues. Nonetheless, all firms remained firmly above the 50‐point threshold. On a per sector basis, seven of the twelve manufacturing subsectors posted lower indices compared to the month‐ago levels namely, food and beverages, textiles, fuel, rubber and plastic, fabricated metal, communication and medical equipment, and motor vehicles. By contrast, the services PMI increased by 3.0 index points to 55.2 in November 2016 from 52.2 in the previous month. All six indices expanded during the month due to the sudden spike in the number of services rendered. As a result, the amount of work‐in‐progress that firms have yet to complete increased as well. It also gave companies the opportunity to charge a higher price on their services. In addition, organizational, product, and geographic expansions were also cited for the sector’s improved performance. All firms by export categories expanded in November 2016. The most notable increase in the PMI was from companies whose export volume is between 26 percent and 50 percent of total revenues, which registered an index of 87.5 from an already high index of 72.5 in November 2015. Nine out of 13 services subsectors expanded (i.e., construction, hotels and
restaurants, transportation including travel agency, postal and telecommunications, banking and financial intermediation, real estate, renting of goods and equipment, miscellaneous business activities, and business and knowledge), while two subsectors contracted in November (i.e., health and social work and electricity, gas, and water). The provident and insurance subsector was steady during the month. The retail and wholesale PMI also went up by 1.3 index points to 57.7 in November 2016 from 56.4 a month ago. This is consistent with firms’ expectations of demand reaching its peak in November. Firms capitalized on opportunities brought by the seasonal demand through aggressive promotions, marketing, and brand management which resulted in expansion. The surge in demand was reflected in the rise of the Sales Revenue Index and Employment Index, as well as in the decline of the Inventories Index. Longer delivery time, as measured by the Supplier Deliveries Index, may be attributed to both traffic issues and high demand during the month. The said index is expected to stabilize in December 2016 given that the traditional holiday demand typically softens after peaking in November and before settling to its trough in January 2017. All the indices expanded well above the 50‐point threshold. Meanwhile, both the retail and wholesale subsectors increased month‐on‐month. In particular, the retail subsector PMI went up by 2.7 index points to 59.1 in November 2016 from 56.4 in October 2016. The wholesale subsector PMI also increased by 1.01 index points to 56.4 from 55.4 during the same review period. External Demand Exports. Exports of goods remained in negative growth territory, contracting by 3.9 percent in Q3 2016. Nevertheless, exports for Q3 2016 improved slightly compared to the 7.7‐percent and 6.6‐percent declines registered in Q3 2015 and Q2 2016, respectively.
Exports of goods remain negative
The contraction in exports of sugar and related products, forest products, and manufactures was partly tempered by the growth in exports of coconut products, fruits and vegetables, other

Q4 2016 Inflation Report | 14
agro‐based products, mineral products and petroleum products. Table 10. Exports of Goods growth rate in percent
Q3 Q2 Q3
Coconut Products ‐29.0 ‐16.0 10.2
Sugar and Products ‐87.5 ‐73.6 ‐68.6
Fruits and Vegetables ‐10.8 ‐22.3 1.6
Other Agro‐Based Products ‐21.4 ‐15.9 4.0
Forest Products ‐56.2 ‐81.2 ‐28.2
Mineral Products ‐43.5 ‐44.7 0.6
Petroleum Products 0.9 ‐22.6 ‐59.6
Manufactures ‐3.9 ‐3.0 ‐3.9
Special Transactions 133.1 12.7 ‐29.2
Total Exports ‐7.7 ‐6.6 ‐3.9
COMMODITY GROUP20162015
Source: BSP staff computations based on data from the PSA Imports. Imports of goods grew by 7.7 percent in Q3 2016, albeit slower than the 27.3‐percent growth a quarter ago and 12.1 percent expansion in the same quarter a year ago.
Imports of goods decline
The growth in imports was driven by the double‐digit expansion in inward shipments of capital goods and consumer goods, offsetting the contraction in the import bill of mineral fuels and lubricants, and raw materials and intermediate goods. Table 11. Imports of Goods growth rate in percent
Q3 Q2 Q3
Capital Goods 21.0 72.7 23.7
Raw Materials and
Intermediate Goods 39.6 13.1 ‐6.8
Lubricants ‐42.1 ‐12.3 ‐12.1
Consumer Goods 11.4 33.2 35.7
Special Transactions ‐6.4 75.6 29.2
Total Imports 12.1 27.3 7.7
Mineral Fuels and
Source: BSP s ta ff computations based on data from the PSA
COMMODITY GROUP20162015
Aggregate Supply. On the production side of the economy, Q3 growth was driven mainly by the services sector (contributing 4 ppts) and the industry sector (contributing 2.8 ppts). Meanwhile, agriculture contributed 0.2 ppt.
Services sector continues to be the main driver of output growth on the production side
The services sector expanded by 6.9 percent in Q3 2016, lower than the 8.3‐percent growth in Q2 2016 and the 7.2‐percent growth in the same period last year. Major contributors to the sector’s growth were trade and repair of motor vehicles, motorcycles, personal and household goods (2 percentage points), real estate, renting and business activities (1.8 percentage points), and other services (1.2 percentage points). Trade and repair of motor vehicles, motorcycles, personal, and household goods increased by 6.5 percent, a deceleration from the quarter ago growth of 8.8 percent, which can be mainly attributed to the slowdown in the growth in retail trade. Meanwhile, growth of real estate, renting and business activities weakened to 8.8 percent from9.3 percent in the previous quarter, on account of the lower growth of renting and other business activities (13.6 percent from 15.5 percent a quarter ago). Also, the slowdown in the growth of other services was due primarily to the lower growth of hotels and restaurants (at 6.4 percent from 9.3 percent a quarter ago) and recreational, cultural and sporting activities (at 4.7 percent from 14.7 percent). Chart 15. Gross Domestic Product by Industrial Origin (at constant prices) year‐on‐year growth in percent
‐6
‐4
‐2
0
2
4
6
8
10
12
14
Q12013
Q2 Q3 Q4 Q12014
Q2 Q3 Q4 Q12015
Q2 Q3 Q4 Q12016
Q2 Q3
Agriculture Industry Services
Source: PSA
2.9 pct 8.6 pct 6.9 pct
The industry sector grew by 8.6 percent in Q3 2016, higher compared to 7.1 percent in Q2 2016. This was due to the expansion in manufacturing (6.9 percent from 6.2 percent) and construction (15.5 percent from 11.8 percent). The higher growth in manufacturing came mainly from the growth in food manufactures (9.6 percent from 9.7 percent), basic metal industries

Q4 2016 Inflation Report | 15
(74.7 percent from 65.6 percent) and chemical and chemical products (6.3 percent from 3.3 percent). The acceleration in the growth of construction was due to the expansion of both public and private construction. The agriculture, hunting, forestry and fishery (AHFF) sector posted a growth of 2.9 percent. The positive growth for the quarter mainly came from the expansion of palay (16.3 percent from ‐6.1 percent) and corn (10.5 percent from ‐10 percent) production. Table 12. Economic Performance at constant 2000 prices; growth rate in percent
Q1 Q2 Q3 Q4 Q1 Q2 Q3
Agri., Hunting, Forestry and Fishing 1.0 ‐0.1 ‐0.1 ‐0.2 ‐4.4 ‐2.0 2.9
Agriculture and Forestry 1.7 ‐0.1 ‐0.1 0.5 ‐4.1 ‐1.3 4.2
Fishing ‐2.9 0.0 0.0 ‐3.5 ‐5.9 ‐5.2 ‐2.6
Industry Sector 5.3 6.1 6.1 6.5 9.0 7.1 8.6
Mining and Quarrying ‐2.5 ‐8.6 0.5 14.0 11.1 ‐7.6 ‐0.4
Manufacturing 6.0 4.7 5.8 6.1 8.0 6.2 6.9
Construction 3.9 16.6 7.8 8.2 12.4 11.8 15.5
Electricity, Gas and Water Supply 5.0 4.6 7.0 5.2 9.9 10.0 9.5
Service Sector 5.5 6.7 7.2 7.8 7.6 8.3 6.9
Transport, Storage and
Communication 8.4 6.6 8.0 9.1 5.4 7.1 4.9
Trade and Repair of Motor Vehicles,
Motorcycles, Personal and
Household Goods 5.9 6.7 8.4 7.3 7.5 8.8 6.5
Financial Intermediation 4.3 5.8 5.4 8.7 9.7 6.9 8.1
Real Estate, Renting and
Business Activities 6.4 6.9 7.8 7.8 9.0 9.3 8.8
Public Administration and Defense;
Compulsory Social Security ‐4.0 ‐0.8 2.6 7.3 5.2 6.4 3.7
Other Services 6.5 10.6 6.8 7.3 7.4 9.0 7.0
Source: PSA
BY INDUSTRIAL ORIGIN2015 2016
Labor Market Conditions In the October 2016 round of the the Labor Force Survey (LFS), the unemployment rate further declined to 4.7 percent from the quarter‐ and year‐ago rates of 5.4 percent and 5.6 percent, respectively. Among the unemployed persons, 64.4 percent were males. Of the total unemployed, the age group 15 to 24 years comprised 47.6 percent, while the age group 25 to 34 were 30.1 percent. By educational attainment, 20.5 percent of the unemployed were college graduates, 13.8 percent were college undergraduates, and 32.9 percent were high school graduates. For the full year, unemployment rate in 2016 averaged 5.5 percent (preliminary), equivalent to 2.4 million unemployed individuals.
Continued improvement in unemployment rate
The employment rate in October 2016 was estimated at 95.3 percent, an improvement from 94.6 percent in July 2016 survey. Workers in the services sector comprised the largest proportion of the employed population. These workers made up 54.9 percent of the total employed in October 2016. Among them, those engaged in wholesale and retail trade or in the repair of motor vehicles and motorcycles accounted for the largest percentage (at 35.3 percent) of workers in the services sector. Workers in the agriculture sector comprised the second largest group, making up 27.9 percent of the total employed in October 2016, while workers in the industry sector registered 17.2 percent of the total employed. The October 2016 LFS results also showed that in the industry sector, workers in the construction subsector made up the largest group, accounting for 47.5 percent of workers in this sector while those in manufacturing comprised 47.4 percent.
Chart 16. Unemployment and Underemployment in percent
0
5
10
15
20
25
Jan2013
Apr Jul Oct Jan2014
Apr Jul Oct Jan2015
Apr Jul Oct Jan2016
Apr Jul Oct
Unemployment Underemployment
Source: PSA By category, wage and salary workers made up 60.8 percent of the total employed. On the other hand, self‐employed workers accounted for 27.5 percent. Alternatively, by classification, employed persons are either full‐time or part‐time workers. For the October 2016 LFS, 65.9 percent were full‐time workers, while 33.3 percent were part‐time workers.22 By definition, employed persons who express the desire to have additional hours of work in their present job, or to have additional job, or to have a new job with longer working hours are considered underemployed. In October 2016, the underemployment rate, which is the percentage of the underemployed to the total employed, was estimated at 18.0 percent.
22 Full‐time workers refer to those who worked for 40 hours or more during the reference week, while those who worked for less than 40 hours were considered part‐time workers.

Q4 2016 Inflation Report | 16
II. Monetary and Financial Market Conditions
Domestic Liquidity and Credit Conditions Domestic liquidity (M3) grew by 12.7 percent y‐o‐y in November to P9.1 trillion. This was the same pace of expansion recorded in end‐Q3 2016.
Domestic liquidity continues to expand…
Money supply continued to increase due largely to sustained demand for credit. Domestic claims grew by 17.0 percent in November from 16.2 percent in end‐Q3 2016 as credits to the private sector rose further. Net claims on the central government also increased by 24.9 percent in November from 22.6 percent at the end of the previous quarter as a result of withdrawals by the National Government of its deposits with the BSP. Chart 19. Domestic Liquidity year‐on‐year growth rates in percent
0
5
10
15
20
25
30
35
40
Mar2013
Jun Sep Nov Dec Mar2014
Jun Sep Nov Dec Mar2015
Jun Sep Nov Dec Mar2016
Jun Sep Nov
Source: BSP The growth in net foreign assets (NFA) was slower at 9.2 percent y‐o‐y in November from 13.6 percent in end‐Q2 2016. The BSP’s NFA position continued to expand on the back of robust foreign exchange inflows coming mainly from overseas Filipinos’ remittances and business process outsourcing receipts. The NFA of banks likewise rose, driven largely by the increase in banks’ foreign assets resulting from higher interbank loans, deposits with other banks, and investments in marketable debt securities.
Preliminary data as of November 2016 show that outstanding loans of commercial banks, net of reverse repurchase (RRP) placements with the BSP, grew by 18.6 percent y‐o‐y relative to the 17.8 percent and 13.6 percent growth posted at end‐Q3 2016 and end‐Q4 2015, respectively.
...as lending sustains growth due to production activities
The sustained increase in bank lending was due largely to loans for production activities, which expanded by 18.1 percent y‐o‐y in November 2016 from a 17.4‐percent growth in end‐Q3 2016 and 13.7 percent rise in end‐Q4 2015. Chart 20. Loans Outstanding of Commercial Banks year‐on‐year growth rates in percent
10
12
14
16
18
20
22
Mar2013
Jun Sep Nov Dec Mar2014
Jun Sep Nov Dec Mar2015
Jun Sep Nov Dec Mar2016
Jun Sep Nov
Source: BSP
The expansion in production loans was driven primarily by increased lending to the following sectors: real estate activities; electricity, gas, steam and airconditioning supply; wholesale and retail trade, repair of motor vehicles and motorcycles; manufacturing; information and communication; and financial and insurance activities. Meanwhile, loans for household consumption grew by 24.5 percent y‐o‐y as of end‐November 2016, higher than the 22.3 percent and 15.1 percent growth recorded in end‐Q3 2016 and end‐Q4 2015, respectively.

Q4 2016 Inflation Report | 17
Credit Standards. Results of the Q4 2016 Senior Bank Loan Officers’ Survey (SLOS)23 showed that most of the respondent banks maintained their credit standards for loans to both enterprises and households during the quarter based on the modal approach.24 This is the 31st consecutive quarter since Q2 2009 that the majority of banks reported broadly unchanged credit standards.
Banks generally maintain credit standards during the quarter
Meanwhile, the diffusion index (DI) approach25,26 pointed to a net tightening of credit standards for loans extended to both enterprises and households. In the previous quarter, credit standards for both corporate lending and household loans also showed net tightening based on the DI approach. Lending to Enterprises. Most banks (89.7 percent of banks that responded to the question) indicated that credit standards for loans to enterprises remained unchanged during the quarter using the modal approach. However, results based on the DI approach indicated a net tightening of credit standards for business loans, which was attributed by respondent banks to their less favorable economic outlook, deterioration in the profitability of banks’ portfolio, and perceived stricter financial system regulations. In terms of specific credit standards, DI‐based results indicated stricter collateral requirements and loan covenants as well as increased use of interest rate floors amid 23 The survey consists of questions on loan officers’ perceptions relating to the overall credit standards of universal/commercial banks (U/KBs) in the Philippines, as well as to factors affecting the supply of and demand for loans by both enterprises and households. Survey questionnaires were sent to 35 U/KBs, of which, 31 banks responded to the current survey representing a response rate of 88.6 percent. As of end‐October 2016, U/KB loans accounted for about 86.9 percent of the banking system’s total outstanding loans net of BSP RRP agreements. 24 In the modal approach, the results of the survey are analyzed by looking at the option with the highest share of responses. 25 In the diffusion index approach, a positive diffusion index (DI) for credit standards indicates that the proportion of banks that have tightened their credit standards exceeds those that eased (“net tightening”), whereas a negative DI for credit standards indicates that more banks have eased their credit standards compared to those that tightened (“net easing”). 26 During the Q1 2010 to Q4 2012 survey rounds, the BSP used the DI approach in the analysis of survey results. Beginning in Q1 2013, the BSP used both the modal and DI approaches in assessing the results of the survey.
narrower loan margins, increased credit line sizes, and longer loan maturities.27 Table 13. General Credit Standards for Loans to Enterprises (Overall)
Q4 Q1 Q2 Q3 Q4
Tightened Considerably 3.2 3.3 0.0 0.0 3.4
Tightened Somewhat 0.0 6.7 9.7 6.9 3.4
Remained Basically Unchanged 90.3 86.7 87.1 93.1 89.7
Eased Somewhat 6.5 3.3 3.2 0.0 3.4
Eased Considerably 0.0 0.0 0.0 0.0 0.0
Total 100.0 100.0 100.0 100.0 100.0
Diffusion Index for Credit Standards ‐3.2 6.7 6.5 6.9 3.4
Weighted Diffusion Index for Credit Standards 0.0 5.0 3.2 3.4 3.4
Mean 3.0 2.9 2.9 2.9 2.9
Number of Banks Responding 31 30 31 29 29Note: A posi tive diffus ion index for credit s tandards indicates that more banks have tightened their credi t
s tandards compared to those that eased ("net tightening"), whereas a negative di ffus ion index for credi t
s tandards indicates that more banks have eased their credi t s tandards compared to those that tightened
("net eas ing").
Source: BSP
2015 2016
In terms of borrower firm size, banks’ responses showed net tighter overall credit standards for large middle‐market enterprises while those for top corporations, small and medium enterprises (SMEs), and micro enterprises were unchanged based on the DI approach. Results based on the modal approach showed that most of the respondent banks anticipate unchanged credit standards over the next quarter. Meanwhile, the DI approach showed that some respondent banks expect credit standards to tighten over the next quarter largely on account of banks’ less favorable outlook on the economy as well as expectations of a deterioration in profitability of portfolio of banks, stricter financial system regulations, and lower tolerance for risk. Lending to Households. The results of the survey also showed that most of the respondent banks (95.0 percent) continued to report unchanged overall credit standards for loans extended to households. The DI approach, however, showed a net tightening of overall credit standards for household loans in Q4 2016 as banks that reported tighter credit standards outnumbered those that reported an easing of credit standards during the quarter. The tighter credit standards were attributed by respondent banks largely to their 27 The survey questionnaire asks banks to describe changes in six specific categories of credit standards: (1) loan margins (price‐based); (2) collateral requirements; (3) loan covenants; (4) size of credit lines; (5) length of loan maturities; and (6) interest rate floors. A loan covenant is an agreement or stipulation laid down in loan contracts, particularly contracts with enterprises, under which the borrower pledges either to take certain action (an affirmative covenant), or to refrain from taking certain action (a negative covenant); this is consequently part of the terms and conditions of the loan. Meanwhile, an interest rate floor refers to a minimum interest rate for loans. Greater use of interest rate floor implies tightening while less use indicates otherwise.

Q4 2016 Inflation Report | 18
reduced risk tolerance and deterioration in borrowers’ profile. In terms of loan categories, banks’ responses indicated net tightening of overall credit standards for housing loans and auto loans during the quarter. Meanwhile, overall credit standards for credit card loans showed net easing while those for personal/salary loans were unchanged based on the DI approach. Table 14. General Credit Standards for Loans to Households (Overall)
Q4 Q1 Q2 Q3 Q4
Tightened Considerably 0.0 0.0 0.0 0.0 5.0
Tightened Somewhat 4.5 9.5 8.3 9.1 0.0
Remained Basically Unchanged 81.8 81.0 83.3 90.9 95.0
Eased Somewhat 13.6 9.5 8.3 0.0 0.0
Eased Considerably 0.0 0.0 0.0 0.0 0.0
Total 100.0 100.0 100.0 100.0 100.0
Diffusion Index for Credit Standards ‐9.1 0.0 0.0 9.1 5.0
Weighted Diffusion Index for Credit Standards ‐4.5 0.0 0.0 4.5 5.0
Mean 3.1 3.0 3.0 2.9 2.9
Number of Banks Responding 22 21 24 22 20Note: A posi tive diffus ion index for credit s tandards indicates that more banks have tightened their credi t
s tandards compared to those that eased ("net tightening"), whereas a negative di ffus ion index for credi t
s tandards indicates that more banks have eased their credi t s tandards compared to those that tightened
("net eas ing").
Source: BSP
2015 2016
Over the next quarter, results based on the modal approach indicated that the majority of the respondent banks continue to anticipate unchanged overall credit standards. However, the DI approach showed expectations of net easing of overall credit standards for Q1 2017 across all types of household loans (except credit card loans), as respondent banks expect higher tolerance for risk, an improvement in borrowers’ profiles, and more aggressive competition from banks and non‐bank lenders among others. Loan demand. Responses to the survey question on loan demand indicated that the majority of the respondent banks continued to see stable overall demand for loans from both enterprises and households. Using the DI approach, however, results showed a net increase in loan demand28 across all firm sizes and all types of household loans.
Demand for loans from both enterprises and households remain stable
28 The “DI for loan demand” refers to the percentage difference between banks reporting an increase in loan demand and banks reporting a decrease. A positive DI for loan demand indicates that more banks reported an increase in loan demand compared to those stating the opposite, whereas a negative DI for loan demand implies that more banks reported a decrease in loan demand compared to those reporting an increase.
The net increase in loan demand of firms was largely attributed by banks to higher requirements of borrower firms for working capital and accounts receivable financing. Meanwhile, the net increase in demand for household loans largely reflected banks’ more attractive financing terms and higher household consumption. Over the next quarter, most of the respondent banks expect unchanged loan demand from both firms and households. However, a larger proportion of respondents expect overall demand for corporate loans to increase further in the next quarter relative to those who indicated the opposite. Respondent banks cited expectations of higher working capital needs of borrower firms along with improved economic outlook of clients as the key factors behind the expected increase in demand for business loans. Meanwhile, the anticipated net increase in household loan demand was attributed by respondent banks largely to expectations of more attractive financing terms offered by banks. Real Estate Loans. Most of the respondent banks (90.0 percent) also indicated unchanged credit standards for commercial real estate loans in Q4 2016. The DI approach, however, continued to indicate a net tightening of overall credit standards for the fourth consecutive quarter. The tighter overall credit standards for commercial real estate loans reflected respondent banks’ wider loan margins, reduced credit line sizes, stricter collateral requirements, and increased use of interest rate floors.
Credit standards for real estate loans remain steady
Demand for commercial real estate loans was also unchanged in Q4 2016 based on the modal approach. A number of banks, however, indicated increased demand for the said type of loan on the back of increased working capital and accounts receivable financing needs of borrowers, and clients’ improved economic outlook. Over the next quarter, although most of the respondent banks anticipate generally steady loan demand, a number of banks expect demand for commercial real estate loans to continue to increase. Meanwhile, in the case of housing loans extended to households, most of the respondent banks

Q4 2016 Inflation Report | 19
(94.1 percent) reported unchanged credit standards. Using the DI approach, however, a net tightening of credit standards for housing loans was noted for the third consecutive quarter in Q4 2016. The net tightening of credit standards for housing loans was attributed by respondent banks largely to lower risk tolerance and deterioration in profile of borrowers. Over the next quarter, results based on the modal approach showed expectations of broadly unchanged overall credit standards for housing loans. However, results based on the DI approach indicated expectations of a net easing of credit standards for housing loans in Q1 2017 largely due to respondent banks’ anticipation of an increase in their tolerance for risk. At the same time, results continued to show increased demand for housing loans in Q4 2016 as well as expectations of a continued increase in demand for the said type of loan in the next quarter.
Interest Rates Primary Interest Rates. In Q4 2016, the average 91‐day, 182‐day, and 364‐day Treasury bill rates in the primary market increased to 1.440 percent, 1.689 percent, and 1.880 percent from 1.416 percent, 1.452 percent, and 1.679 percent, respectively, in Q3 2016.
T-bill rates in the primary market increase
The results of the auction reflected cautious investors’ sentiment on heightened expectation of a US Fed hike at the end of the year. Chart 21. Treasury Bill Rates in percent
0
1
2
3
Q12013
Q1 Q2 Q3 Q12014
Q4 Q1 Q2 Q12015
Q3 Q4 Q1 Q12016
Q2 Q3 Q4
91‐day T‐bill Rate
182‐day T‐bill Rate
364‐day T‐bill Rate
Source: BTr
Yield Curve. As of end‐December 2016, the secondary market yield for government securities (GS) rose across all tenors relative to the end‐September 2016 levels, after the US Fed hiked its policy rate in the last FOMC meeting for 2016 and on expectations of more interest rate hikes in 2017.
Yield curve rises across all tenors
Debt paper yields were higher by a range of 22.5 bps (3‐year GS) to 165.3 bps (6‐month GS) compared to end‐September 2016 levels. Chart 17. Yields of Government Securities in the Secondary Market in percent
0
1
2
3
4
5
6
3Mo 6Mo 1Yr 2Yr 3yr 4Yr 5Yr 7Yr 10Yr 20Yr 25Yr
Dec 2015
Sep 2016
Dec 2016
Source: Bloomberg
Relative to year‐ago levels, the secondary market yields of GS likewise increased generally by a range of 0.6 bp for the 4‐year GS to 81.8 bps for the 5‐year GS except for the 3‐month, 2‐year, 3‐year and 20‐year GS which declined by 59.1 bps, 11.7 bps, 14.6 bps and 14.5 bps, respectively.
Interest Rate Differentials. The average differentials between domestic and US interest rates, gross and net of tax, narrowed further in Q4 2016 relative to the previous quarter.
Interest rate differentials narrow further
The average 91‐day RP T‐bill rate rose q‐o‐q by 2.4 bps to 1.440 percent in Q4 2016 from 1.416 percent in Q3 2016. Likewise, the average US 90‐day LIBOR and the US 90‐day T‐bill rate increased by 14.3 bps and 5.6 bps, respectively to

Q4 2016 Inflation Report | 20
0.928 percent and 0.490 percent in Q4 2016. These developments led to narrower positive gross and net of tax differentials between the 91‐day RP T‐bill rate and US interest rates. Meanwhile, foreign interest rates rose during the quarter following the release of better‐than‐expected US data on GDP, manufacturing activity, services sector, home and retail sales, and corporate earnings vis a vis lower‐than‐expected data on non‐farm payrolls, consumer spending, orders for durable goods and industrial production. Chart 18. Interest Rate Differentials quarterly averages; in basis points
‐50
0
50
100
150
200
250
Q12013
Q4 Q1 Q2 Q12014
Q3 Q4 Q1 Q12015
Q2 Q3 Q4 Q12016
Q2 Q3 Q4
RP 91‐day T‐bill vs. US 90‐day LIBOR (before tax) RP 91‐day T‐bill vs. US 90‐day T‐bill (before tax)
RP 91‐day T‐bill vs. US 90‐day LIBOR (after tax) RP 91‐day T‐bill vs. US 90‐day T‐bill (after tax)
Source: Bloomberg, BTr and BSP
The positive differential between the BSP's overnight borrowing or RRP rate and the US Fed funds target rate narrowed to a range of 225‐250 bps in Q4 2016 from 250‐275 bps in Q3 2016, reflecting the impact of the 25‐bp increase in the US Fed funds target rate to 0.50‐0.75 percent on 15 December 2016. Chart 19. BSP RRP Rate and US Federal Funds Target Rate in percent
‐1
0
1
2
3
4
5
Q12013
Q4 Q1 Q2 Q12014
Q3 Q4 Q1 Q12015
Q2 Q3 Q4 Q12016
Q2 Q3 Q4
BSP RRP Rate US Federal Funds Target Rate
Source: Bloomberg and BSP
Similarly, the interest rate differential between the BSP’s overnight RRP rate and the US Fed funds target rate adjusted for risk29 narrowed to 145 bps as of end‐December 2016 from 169 bps in end‐September 2016. This development could be traced to the decrease in the positive interest rate differential between the BSP’s RRP rate and the US Fed funds target rate combined with a lower risk premium. Chart 20. Risk‐Adjusted Differentials in basis points
125
150
175
200
225
250
275
300
Q12013
Q4 Q1 Q2 Q12014
Q3 Q4 Q1 Q12015
Q2 Q3 Q4 Q12016
Q2 Q3 Q4
Source: Bloomberg and BSP Meanwhile, there was a marginal decline in the risk premium in end‐December relative to end‐September which could be attributed to the 86‐bps increase in the 10‐year US note to 2.43 percent and the 85‐bps increase in the 10‐year ROP note to 3.23 percent. The 10‐year US and 10‐year ROP notes rose on increased investor appetite for other riskier assets such as equities following the release of upbeat US economic data, result of the November 2016 US presidential elections and the US Fed’s interest rate hike in December 2016. Domestic real lending rate30 decreased further to 0.8 percent in December 2016 from 1.2 percent in September 2016. This was due to the 30‐bp rise in inflation to 2.6 percent combined with the 10‐bp decline in actual bank lending rate31 to 3.4 percent in December 2016.
Real lending rate decreases
29 The difference between the 10‐year ROP note and the 10‐year US Treasury note is used as proxy for the risk premium. 30 Real lending rate is measured as the difference between actual bank lending rate and inflation. 31 The actual bank lending rate for the Philippines is the weighted average interest rate charged by reporting commercial banks on loans and discounts granted during the period.

Q4 2016 Inflation Report | 21
The Philippines’ real lending rate was the second lowest in a sample of 10 Asian countries, with Indonesia recording the highest real lending rate at 8.3 percent while Japan posted the lowest at 0.5 percent. Chart 21. Philippines’ Real Lending Rate in percent
‐1
0
1
2
3
4
Mar2013
Jun Sep Dec Mar2014
Jun Sep Dec Mar2015
Jun Sep Dec Mar2016
Jun Sep Dec
Source: PSA and BSP
Financial Market Conditions The domestic financial system during the review quarter reflected the volatility in the external environment. Nevertheless, it has remained resilient, supported by strong macroeconomic fundamentals.
Domestic financial market conditions reflect external uncertainty
Expectations of a US Fed rate hike in December, the uncertainty which surrounded the US election as well as continued geopolitical tensions contributed to the heightened risk aversion among investors. Nevertheless, the sustained growth of the domestic economy and healthy banking system, as well as continued accommodative policies in several advance economies provided mitigating factors. Stock Market. The Philippine Stock Exchange index (PSEi) closed 9.3 percent lower, q‐o‐q, to average 7,123.3 index points during the review quarter.
Chart 22. Quarterly Average PSEi In basis points
5,000
5,500
6,000
6,500
7,000
7,500
8,000
Q12013
Q2 Q3 Q4 Q12014
Q2 Q3 Q4 Q12015
Q2 Q3 Q4 Q12016
Q2 Q3 Q4
Source: Philippine Stock Exchange, BSP Concerns over global and domestic developments saw investors remain on the sidelines in Q4. As of end‐December 2016, the PSEi closed at 6,840.64 index points, lower by 1.6 percent on a year‐to‐date basis and by 10.3 percent q‐o‐q.
Local stocks end lower amid a volatile environment
On the external front, the following developments weighed heavily on the benchmark index: Donald Trump’s surprising victory in the US presidential elections and the impact of his possible protectionist stance on the Philippine economy; OPEC’s agreement to cut oil production by January 2017 and the resulting higher oil prices and possibly higher domestic inflation; rising geopolitical tensions following the assassination of Russia’s ambassador to Turkey and an apparent terrorist attack against shoppers at a German Christmas market; concerns over the change in European political leadership in Italy and Austria and uncertainty provided by other scheduled elections in 2017 in the Netherlands (March), France (April) and Germany (October); and the US Fed rate hike in December. Mitigating these factors were the positive news of the country’s continued robust growth in Q3 and the ECB’s decision to extend its asset‐buying program beyond the March 2017 cut‐off date. Mirroring the decline in the PSEi, total market capitalization fell by 3.6 percent, q‐o‐q, to reach P14.4 trillion in end‐December. Preliminary data from the PSE also showed that foreign investors posted net sales of P32.9 billion during the quarter‐in‐ review from net purchases of P7.0 billion in Q3. Similarly, domestic price‐earnings ratio decelerated to 18.64x in end‐December from 20.78x in end‐September.

Q4 2016 Inflation Report | 22
Government Securities. Results of the T‐bill auctions showed slightly weak investors’ appetite for short‐dated government securities. Total subscription for the review quarter amounted to P83.35 billion, about 1.4 times the P60.0 billion offered amount. The oversubscription for the quarter, at P23.35 billion, was significantly lower than the P85.70 billion oversubscription in the previous quarter.
Demand for local GS weakens
Accordingly, the Bureau of Treasury (BTr) decided to award in full bids in all tenors in the auction held in October, while opted to award partially in auctions held in November and December as bids submitted were deemed too high on account of relatively weak demand. Chart 23. Total Oversubscription of T‐bill Auctions
0
20
40
60
80
100
120
140
160
180
Q12013
Q2 Q3 Q4 Q12014
Q2 Q3 Q4 Q12015
Q2 Q3 Q4 Q12016
Q2 Q3 Q4
Source: Bureau of the Treasury Sovereign Bond and CDS Spreads. In October, debt spreads widened following the higher probability of a Fed rate hike by December and the increased unpredictability of the outcome of the US presidential election in November. The increase in debt spreads was particularly evident in the Philippines as the rise in negative investor sentiments led to the poor performance of the stock market and the Philippine peso. In November, debt spreads widened further after Donald Trump won unexpectedly over Hillary Clinton in the US presidential election. Investors became wary of the negative impact of the policy directions of US President‐elect Trump on emerging market economies such as the Philippines.32 Prospects of a plan for higher US government spending also cemented the expectation of a rate hike by the Fed in December. 32 Remittances and BPO industry may be adversely affected.
Moreover, the increased concern over Europe’s stability likewise created market jitters. 33 In December, debt spreads took a positive turnaround and narrowed on upbeat investor sentiment as the Fed finally implemented the rate hike, reflecting higher US growth expectations. However, rising geopolitical tensions following the assassination of Russia’s ambassador to Turkey, an apparent terrorist attack against shoppers at a German Christmas market as well as concerns over the change in European political leadership in Italy and Austria provided relative uncertainty in bond spreads.
Debt spreads narrower on improved US economic data
By 30 December, the Philippines’ 5‐year sovereign credit default swaps (CDS) stood at 111 bps, lower than 116 bps registered in end‐Q3. The local spread remained lower than Indonesia’s 158 bps and Malaysia’s 138 bps in the current quarter. Meanwhile, the EMBIG Philippines ended the quarter wider at 110 bps when compared to the previous quarter’s closing of 102 bps. Chart 29. 5‐Year CDS Spreads of Selected ASEAN Countries in basis points
0
50
100
150
200
250
300
Q12013
Q2 Q3 Q4 Q12014
Q2 Q3 Q4 Q12015
Q2 Q3 Q4 Q12016
Q2 Q3 Q4
Philippines Indonesia Thailand Malaysia
Source: Bloomberg 33 Start of BREXIT process and Italy’s referendum on constitutional reform.

Q4 2016 Inflation Report | 23
Chart 30. EMBIG Spreads of Selected ASEAN Countries in basis points
0
50
100
150
200
250
300
350
400
Q12013
Q2 Q3 Q4 Q12014
Q2 Q3 Q4 Q12015
Q2 Q3 Q4 Q12016
Q2 Q3 Q4
EMBIG Philippines EMBIG Malaysia EMBIG Indonesia
Source: Bloomberg
Banking System The Philippine banking system continued to be resilient in supporting the economy’s long‐term growth and financial conditions. This was evident in the steady growth in assets and deposits of banks during the review quarter.
Banking system posts steady growth in assets and deposits
Furthermore, asset quality indicators improved, while capital adequacy ratios remained above international standards, even with the implementation of the tighter Basel III framework. Savings Mobilization. Savings and demand deposits remained the primary source of funds for the banking system. Banks’ total deposits34 as of end‐November 2016 amounted to P7.9 trillion, 13.2 percent or P0.9 trillion higher than the end‐November 2015 level and 2.2 percent higher than end‐September 2016 level. Demand, savings and time deposits expanded by 16.7 percent, 14.7 percent, and 6.4 percent, respectively. Also, foreign currency deposits owned by residents (FCD‐Residents) grew by 15.0 percent, to P1.7 trillion.35 34 This refers to the total peso‐denominated deposits of the banking system. 35 FCD‐Residents, along with M3, forms part of a money supply measure called M4. Meanwhile, M3 consists of savings deposits, time deposits, demand deposits, currency in circulation, and deposit substitutes.
Chart 31. Deposit Liabilities of Banks in billion pesos
0
1,000
2,000
3,000
4,000
5,000
6,000
7,000
8,000
9,000
Mar 2013
Jun
Sep
Nov Dec
Mar 2014
Jun
Sep
Nov Dec
Mar 2015
Jun
Sep
Nov Dec
Mar 2016
Jun
Sep
Nov
Demand Savings Time
Source: BSP Institutional Developments. The total resources of the banking system grew by 11.4 percent to P13.2 trillion as of end‐October 2016 from P11.9 trillion during the same period last year, and by 2.7 percent from P12.9 trillion as of Q2 2016. As a percent of GDP, total resources stood at 93.6 percent.
Total resources of the banking system continue to rise
Chart 32. Total Resources of the Banking System levels in trillion pesos; share in percent
50
60
70
80
90
100
4,000
5,000
6,000
7,000
8,000
9,000
10,000
11,000
12,000
13,000
14,000
Mar 2013
Jun
Sep
Oct
Dec
Mar 2014
Jun
Sep
Oct
Dec
Mar 2015
Jun
Sep
Oct
Dec
Mar 2016
Jun
Sep
Oct
Total Resources (LHS) as % of GDP (RHS)
Source: BSP

Q4 2016 Inflation Report | 24
The number of banking institutions (head offices) fell to 618 offices as of end‐June 2016 from the year‐ and quarter‐ago levels of 638 and 622 offices, respectively, indicating continued consolidation of banks as well as the exit of weaker players in the banking system. By banking classification, banks (head offices) consisted of 41 universal and commercial banks (U/KBs), 64 thrift banks (TBs), and 513 rural banks (RBs). Meanwhile, the operating network (head offices and branches/agencies) of the banking system expanded to 10,936 offices in Q2 2016 from 10,528 offices during the same period in the previous year and 10,849 offices in the first quarter of 2016, due mainly to the increase in the number of branches/agencies of U/KBs, TBs and RBs. The Philippine banking system’s gross non‐performing loan (GNPL) ratio improved to 2.03 percent as of end‐November 2016, relative to the Q3 2016 and year‐ago ratios of 2.14 percent and 2.27 percent, respectively, due mainly to the expansion in the banking system’s total loan portfolio of P6.1 billion a year ago.
Asset quality of Philippine banks continues to improve, y-o-y
Banks’ initiatives to improve their asset quality along with prudent lending regulations helped maintain the GNPL ratio below its pre‐Asian crisis level of 3.5 percent.36 Chart 24. Ratios of Gross Non‐Performing Loans and Net Non‐Performing Loans to Total Loans of the Banking System in percent
0.2
0.3
0.4
0.5
0.6
0.7
0.8
0.9
1.0
1.9
2.1
2.3
2.5
2.7
2.9
3.1
3.3
3.5
3.7
3.9
4.1
Mar2013
Jun Sep Nov Dec Mar2014
Jun Sep Nov Dec Mar2015
Jun Sep Nov Dec Mar2016
Jun Sep Nov
Gross NPLs/Total Loans (LHS) Net NPLs/Total Loans (RHS)
Source: BSP 36 The 3.5 percent NPL ratio was based on the pre‐2013 definition.
Similarly, the net non‐performing loan (NNPL) improved to 0.67 percent as of end‐November 2016, relative to Q3 2016 and year‐ago ratios of 0.74 percent and 0.66 percent, respectively. In computing for the NNPLs, specific allowances for credit losses37 on TLP are deducted from the GNPLs. The said allowances increased to P100.5 billion as of end‐November 2016 from P98.6 billion and P100.3 billion posted in Q3 2016 and a year ago, respectively. The Philippine banking system’s GNPL ratio of 2.0 percent was higher relative to that of South Korea (1.9 percent) and Malaysia (1.3 percent), but lower than that of Indonesia (3.0 percent) and Thailand (2.9 percent).38 The loan exposures of banks remained adequately covered as the banking system registered an NPL coverage ratio of 114.6 percent as of end‐November 2016. This was higher than the Q3 2016 ratio of 113.5 percent but lower than the year‐ago ratio of 117.2 percent. The capital adequacy ratio (CAR) of universal and commercial banks (U/KBs) stood at 15.40 percent on solo basis and 16.15 percent on consolidated basis as of end‐September 2016. These figures remained well‐above the BSP regulatory threshold of 10.0 percent and international minimum of 8.0 percent. The U/KBs’ latest CAR on solo and consolidated basis rose relative to the previous quarter’s 15.37 percent and 16.12 percent, respectively.
Banks maintain high levels of CAR amid tighter capital requirements
37 This type of provisioning applies to loan accounts classified under loans especially mentioned (LEM), substandard‐secured loans, substandard‐unsecured loans, doubtful accounts and loans considered as loss accounts. 38 Sources: IMF and financial stability reports, Indonesia (Banks’ Nonperforming Loans to Gross Loans Ratio, Q3 2016); Malaysia (Banking System’s Net Impaired Loans, Q3 2016); Thailand (Total Financial Institutions’ Gross NPLs, Q3 2016); and South Korea (Domestic Banks’ Substandard or Below Loans [SBLs], Q1 2016).

Q4 2016 Inflation Report | 25
The CAR of U/KBs on a consolidated basis at 16.2 percent was higher than that of South Korea (14.0 percent) but lower than that of Indonesia (20.6 percent), Thailand (18.5 percent) and Malaysia (16.7 percent).39
Exchange Rate The peso depreciated against the US dollar in Q4 2016. On a quarter‐on‐quarter basis, the peso weakened by 4.19 percent to average P49.11/US$1 from the previous quarter’s average of P47.05/US$1. On a y‐o‐y basis, the peso likewise depreciated by 4.6 percent relative to the P46.83/US$1 average in the fourth quarter of 2015.40
Peso weakens on Fed hike prospects
The weakening of the peso during the review quarter was due mainly to global developments such as: (i) the US Fed rate hike in December 2016 and the expectation for more and faster rate increases in 2017; and (ii) the victory of Donald Trump in the US presidential elections. Market expects that the policies to be adopted by Trump to boost spending could be inflationary and could likely lead to higher US interest rates. Chart 25. Quarterly Peso‐Dollar Rate PHp/US$
39
40
41
42
43
44
45
46
47
48
49
50
Q12013
Q2 Q3 Q4 Q12014
Q2 Q3 Q4 Q12015
Q2 Q3 Q4 Q12016
Q2 Q3 Q4
Source: Reference Exchange Rate Bulletin, Treasury Department, BSP 39 Sources: IMF and financial stability reports, Indonesia (Commercial Banks, Regulatory Capital to Risk‐Weighted Assets Ratio Q3 2016); Thailand (Commercial Banks’ Capital Funds Percentage of Risk Assets, Q3 2016); Malaysia (Banking System’s Total Capital Ratio, Q3 2016); and South Korea (Domestic Banks’ Capital Ratio, Q1 2016). 40 Dollar rates or the reciprocal of the peso‐dollar rates were used to compute for the percentage change.
In October 2016, the peso depreciated against the US dollar by 1.90 percent to average P48.35/US$1 relative to the P47.43/US$1 a month ago on the back of positive US economic data which strengthened hopes for an increase in US interest rate by December 2016. On the domestic front, robust US dollar month‐end requirements raised corporate demand for foreign exchange during the period. Similarly, in November, the peso depreciated against the US dollar by 1.64 percent to average P49.16/US$1. The announcement of US President‐elect Donald Trump that the US will withdraw from the Trans‐Pacific Partnership (TPP) trade deal once he takes office and the negative market sentiment due to the expected Fed rate hike by December 2016, triggered risk aversion to regional currencies, including the peso.
In December, the peso depreciated anew by 1.33 percent to average P49.82/US$1 as the outlook for Asian currencies, including the peso remained clouded by expectations that the US Fed could raise rates at a faster pace in the following year. Geopolitical tensions between the United States and China also triggered safe‐haven buying which contributed to the weakening of the peso. Overall, the sustained inflows of foreign exchange from overseas Filipino remittances, foreign direct investments, BPO and tourism receipts, as well as the ample level of the country’s gross international reserves and the country’s robust economic growth continued to provide stability to the peso.41 On a year‐to‐date basis, the peso depreciated against the US dollar by 5.3 percent on 29 December 2016 as it closed at P49.72/US$1. The depreciation was in tandem with the movements in most Asian currencies, except the Japanese yen, New Taiwan dollar, and Thai Baht which appreciated vis‐à‐vis the US dollar.42 41 GIR stood at US$81.45 billion as of end‐November 2016 (revised). 42 Based on the last done deal transaction in the afternoon.

Q4 2016 Inflation Report | 26
Table 15. Year‐to‐Date Changes in Selected Dollar Rates appreciation/(‐depreciation); in percent
2013 2014 2015 2016*
Korean Won 1.1 ‐4.3 ‐6.6 ‐2.6
Thai Baht (Onshore) ‐4.6 ‐0.7 ‐8.9 0.1
Singaporean Dollar ‐2.7 ‐4.5 ‐6.0 ‐2.0
Indian Rupee ‐11.4 ‐2.9 ‐4.9 ‐2.9
Indonesian Rupiah ‐19.1 ‐2.1 ‐9.8 2.3
Philippine Peso ‐7.0 ‐0.7 ‐5.0 ‐5.3
Japanese Yen ‐16.3 ‐12.5 ‐0.5 3.3
Malaysian Ringgit ‐5.5 ‐6.3 ‐18.6 ‐4.2
Chinese Yuan 2.6 ‐2.7 ‐4.3 ‐6.6
New Taiwan Dollar ‐1.9 ‐6.2 ‐3.6 1.9Notes:
‐ Negative value represents depreciation of the currency against the US dollar.
‐ YTD changes are computed as the percent change between the closing prices for the
year indicated versus the closing prices for the preceding year.
* Data as of 4:00 p.m., 29 December 2016
Source: Treasury Department ‐ BSP Meanwhile, volatility as measured by the coefficient of variation (COV) of the peso’s daily closing rates stood at 1.43 percent during review quarter, higher compared to the 1.17 percent registered in Q3 2016.43 On a real trade‐weighted basis, the peso gained external price competitiveness in Q4 2016, against the basket of currencies of all trading partners (TPI), trading partners in advanced (TPI‐A) and developing countries (TPI‐D) as the real effective exchange rate (REER) index of the peso decreased by 1.41 percent, 1.03 percent, and 1.69 percent, respectively, relative to the second quarter of 2016. Behind this development was the nominal depreciation of the peso against these currency baskets.44,45
Relative to Q4 2015, the peso likewise gained external price competitiveness against the TPI, TPI‐A, and TPI‐D baskets. This developed as the 43 The coefficient of variation is computed as the standard deviation of the daily closing exchange rate divided by the average exchange rates for the period. 44 The Trading Partners Index (TPI) measures the nominal and real effective exchange rates of the peso across the currencies of 14 major trading partners of the Philippines, which includes US, Euro Area, Japan, Australia, China, Singapore, South Korea, Hong Kong, Malaysia, Taiwan, Indonesia, Saudi Arabia, United Arab Emirates, and Thailand. The TPI‐Advanced measures the effective exchange rates of the peso across currencies of trading partners in advanced countries comprising of the US, Japan, Euro Area, and Australia. The TPI‐Developing measures the effective exchange rates of the peso across 10 currencies of partner developing countries which includes China, Singapore, South Korea, Hong Kong, Malaysia, Taiwan, Indonesia, Saudi Arabia, United Arab Emirates, and Thailand. 45 The REER index represents the Nominal Effective Exchange Rate (NEER) index of the peso, adjusted for inflation rate differentials with the countries whose currencies comprise the NEER index basket. A decrease in the REER index indicates some gain in the external price competitiveness of the peso, while a significant increase indicates the opposite. The NEER index, meanwhile, represents the weighted average exchange rate of the peso vis‐à‐vis a basket of foreign currencies.
nominal depreciation of the peso offset the impact of widening inflation differential, resulting to a decrease in the REER index of the peso by 4.28 percent, 6.61 percent, and 2.54 percent against the TPI, TPI‐A, and TPI‐D baskets, respectively.

Q4 2016 Inflation Report | 27
III. Fiscal Developments The National Government (NG) recorded a fiscal deficit of P235.2 billion for the period January‐November 2016, almost five times higher compared to the P46.5 billion deficit incurred in January‐November 2015.
NG posts higher deficit as of end-November 2016
Netting out the interest payments in NG expenditures, the primary surplus amounted to P50.2 billion, which is about 21 percent of the P241.3 billion primary surplus recorded in the same period a year ago. Revenues increased by 4.4 percent to P2,030.6 billion in January‐November 2016 compared to P1,945.4 billion in the same period in 2015. The Bureau of Internal Revenue (BIR) and the Bureau of Customs (BOC) contributed P1,450.0 billion and P361.5 billion, respectively. The revenues of the BIR and BOC were higher by 9 percent and 10 percent, respectively, compared to their levels a year ago. Meanwhile, income from Bureau of the Treasury (BTr) fell by 5 percent to P95.3 billion. Table 16. National Government Fiscal Performance in billion pesos
Jan‐Oct Jan‐Nov Jan‐Oct Jan‐Nov Jan‐Oct Jan‐Nov
Surplus/(Deficit) ‐52.6 ‐46.5 ‐216.0 ‐235.2 310.9 405.3 ‐186.6 115.8
Revenues 1,768.0 1,945.4 1,821.4 2,030.6 3.0 4.4 1,978.1 92.1
Expenditures 1,820.6 1,992.0 2,037.4 2,265.8 11.9 13.7 2,164.7 94.1
Source: Bureau of the Treasury (BTr)
2015 2016Q3 2016
Program
Percentage
Share to
Q3 2016
Program
Growth Rate (in percent)
* Tota ls may not add up due to rounding
Expenditures for the period in review amounted to P2,265.8 billion, 13.7 percent higher than the expenditures in the same period in 2015. Excluding interest payments, expenditures went up by 16 percent to P1,980.4 billion. Meanwhile, interest payment was P2.5 billion lower compared to its year‐ago level, reaching P285.4 billion in January‐November 2016.

Q4 2016 Inflation Report | 28
IV. External Developments The JP Morgan Global All‐Industry Output Index was unchanged at 53.3 in November from the same level in October, with solid growth seen in both the manufacturing and service sectors.
The global economy grows at a solid pace
Output expanded in the US, euro area, UK, and Japan. Among emerging economies, output growth was faster in Russia and steady in China. Meanwhile, the downturn in Brazil continued, while India slipped into contraction amid its demonetization process.46 Chart 26. JP Morgan Global All‐Industry Output Index index points
49
50
51
52
53
54
55
56
Q12013
Q2 Q3 Q4 Q12014
Q2 Q3 Q4 Q12015
Q2 Q3 Q4 Q12016
Q2 Q3 Q4(Nov)
Source: Markit Economics US. Real GDP increased by 1.7 percent on a seasonally adjusted y‐o‐y basis in Q3 2016 after expanding by 1.3 percent in the previous quarter. On a q‐o‐q basis, real output growth was likewise faster at 3.5 percent in Q3 2016 from 1.4 percent in Q2 2016. The faster expansion during the quarter reflected an upturn in private inventory investment, exports, and federal government spending.47 46 JP Morgan Global Manufacturing & Services PMI, http://www.markiteconomics.com/ 47 US Bureau of Economic Analysis, “National Income and Product Accounts Gross Domestic Product: Third Quarter 2016 (Third Estimate),” news release, 22 December 2016. https://www.bea.gov/newsreleases/national/gdp/2016/pdf/gdp3q16_3rd.pdf
Growth in the US economy accelerates
Meanwhile, the manufacturing PMI rose to 53.2 in November from 51.9 in October, signaling an expansion in output with a faster increase in new orders.48 Inflation on a y‐o‐y basis rose to 1.7 percent in November from 1.6 percent in October, as the indices for shelter and gasoline continued to increase. Meanwhile, the food index was broadly unchanged. The unemployment rate was lower at 4.6 percent in November from 4.9 percent in October. Total nonfarm payroll employment increased by 178,000 during the month, with gains noted in professional and business services and in health care. The Thomson‐Reuters/University of Michigan Index of Consumer Sentiment increased to 98.2 in December from 93.8 in November49 as consumers turned more optimistic following the contentious election. The Conference Board Consumer Confidence Index also rebounded to 107.1 in November from 100.8 in October.50 Euro Area. On a q‐o‐q basis, real GDP grew by 0.3 percent in Q3 2016, the same pace as in Q2 2016. On a y‐o‐y basis, real GDP growth was also steady at 1.7 percent in Q3 2016 from the previous quarter.51 The expansion in household final consumption expenditure and changes in inventories had positive contributions to growth, which was offset by the negative contribution of net exports. Likewise, the composite PMI for the euro area remained at 53.9 in December from the same level in November, signaling a strong end to the year as the upturn in manufacturing offset the slower pace of growth in services.52 48 Institute for Supply Management, https://www.instituteforsupplymanagement.org 49 University of Michigan Survey of Consumers, http://www.sca.isr.umich.edu/ 50 The Conference Board, http://www.conference‐board.org/ 51 Eurostat news release 244/2016 dated 6 December 2016. 52 Markit Flash Eurozone PMI, http://www.markiteconomics.com/

Q4 2016 Inflation Report | 29
Economic activity in the euro area holds firm
The seasonally‐adjusted unemployment rate eased to 9.8 percent in October from 9.9 percent in September.53 Meanwhile, inflation rose to 0.6 percent in November from 0.5 percent in October, with the highest upward contributions seen to have come from restaurants and cafes, rents, and tobacco.54 The European Commission’s Economic Sentiment Indicator for the euro area was broadly steady at 106.5 in November from 106.4 in October, as a mild deterioration in confidence in the industry sector offset the more upbeat readings in construction and retail trade. Consumer confidence was likewise stronger, reflecting more positive views on overall economic conditions.55 Japan. On a q‐o‐q basis, real GDP increased by 0.5 percent in Q3 2016 after increasing by 0.2 percent in Q2 2016. Similarly, on a y‐o‐y basis, real GDP growth was faster at 0.9 percent in Q3 2016 following the 0.6‐percent expansion in the previous quarter.56 The faster growth during the quarter reflects favorable business sentiment, increasing business fixed investment, and stable private consumption.
Manufacturing activity in Japan continues to improve
The seasonally adjusted manufacturing PMI rose to 51.9 in December from 51.3 in November, signalling the biggest improvement in manufacturing operating conditions since January 2016 as both output and new orders increased at sharper rates.57 Inflation was higher at 0.5 percent in November from 0.1 percent in October. The seasonally adjusted unemployment rate was likewise slightly 53 Eurostat news release 239/2016 dated 1 December 2016. 54 Eurostat news release 256/2016 dated 16 December 2016. 55 European Commission. http://ec.europa.eu/ 56 Department of National Accounts, Economic and Social Research Institute, Cabinet Office. http://www.esri.cao.go.jp/ 57 Nikkei Flash Japan Manufacturing PMI, http://www.markiteconomics.com/
higher at 3.1 percent in November from 3.0 percent a month earlier. China. Real GDP grew by 6.7 percent y‐o‐y in Q3 2016, the same pace as in the first two quarters of the year. Agricultural and industrial production continued to show steady growth, while investment in fixed assets stabilized.
Indicators point to a continued, albeit subdued, recovery in the Chinese economy
Meanwhile, the seasonally adjusted manufacturing PMI eased slightly to 50.9 in November from 51.2 in October, indicating a softer improvement in manufacturing output and total new orders.58 Inflation rose to 2.3 percent in November from 2.1 percent in October. The increases in the prices of food drove inflation. India. Real GDP increased by 7.3 percent y‐o‐y in Q3 2016, faster than the 7.1‐percent expansion in the previous quarter, with public administration, defense, and other services; financial, insurance, real estate, and professional services; manufacturing; and trade, hotels, and transport and communication all expanding by at least 7.0 percent.59
Output growth in India increases in November
Meanwhile, the composite PMI decreased to 49.1 in November from 55.4 in October. Panelists indicated that cash shortages resulting from the ongoing demonetization of 500‐ and 1,000‐rupee notes restricted new orders from clients. Nonetheless, the disruption in activity is seen to be short‐lived, with respondents also expecting a pick‐up in activity once the banknotes are replaced. 58 Caixin China General Manufacturing PMI, http://www.markiteconomics.com/ 59 Ministry of Statistics and Programme Implementation. http://mospi.nic.in/

Q4 2016 Inflation Report | 30
Inflation declined further to 3.6 percent in November from 4.2 percent in October. ASEAN Region. The Nikkei ASEAN Manufacturing PMI remained in contraction territory at 49.4 in November from 49.2 in October, reflecting uneven performances across the region. Three out of the seven nations included in the index saw an improvement in growth—i.e., Philippines, Vietnam, and Myanmar. Meanwhile, contractions were noted in Thailand, Indonesia, Malaysia, and
Singapore.60
Manufacturing conditions worsen in the ASEAN region
Policy Actions by Central Banks. On 4 October 2016, the Reserve Bank of India (RBI) lowered its policy repo rate under the liquidity adjustment facility (LAF) to 6.25 percent as well as the reverse repo rate under the LAF and marginal lending facility (MLF) to 5.75 percent and 6.75 percent, respectively. The decision was driven mainly by the RBI’s objective to keep inflation within the announced target of 2‐6 percent over the medium term. Inflation in India has steadily decelerated since July 2016.
Some central banks ease their monetary policy settings, while the US Fed decides to raise interest rates
Likewise, Bank Indonesia decided to reduce the 7‐day reverse repo (RR) rate by 25 bps to 4.75 percent from 5.0 percent, effective 21 October 2016, to support domestic demand and maintain the economy’s growth momentum, with inflation expected to ease near the low end of the inflation target. Consequently, both deposit and lending facility rates were also cut by 25 bps to 4.00 percent and 5.50 percent, respectively. Inflation in Indonesia has been decelerating in recent months due to subdued domestic demand, 60 Nikkei ASEAN Manufacturing PMI, http://www.markiteconomics.com/
declining global commodity prices, and a stable rupiah.
On 10 November 2016, the Reserve Bank of New Zealand (RBNZ) reduced its official cash rate for the third time in 2016 by another 25 bps to 1.75 percent from 2.0 percent to steer inflation towards the target. Inflation in New Zealand has been below the target of 1‐3 percent for 2016 due largely to negative tradable inflation. Weak global conditions and low interest rates relative to New Zealand continued to put upward pressure on the NZ dollar, further lowering its tradables inflation. Meanwhile, on 14 December 2016, the US Federal Reserve decided to raise the fed funds rate by 25 bps to 0.50‐0.75 percent. This was largely anticipated by the market given rising CPI and PCE inflation in the US, which are now at 1.7 percent (for November) and 1.4 percent (for October), respectively. Furthermore, latest projections from the US Fed also showed higher growth paths for 2017‐2019.

Q4 2016 Inflation Report | 31
V. Monetary Policy Developments During its monetary policy meetings in 10 November and 22 December, the BSP decided to maintain its key policy interest rate at 3.0 percent for the overnight reverse repurchase or RRP facility. The corresponding interest rates on the overnight lending and deposit facilities were also kept steady. The reserve requirement ratios were likewise left unchanged.
The BSP maintains monetary policy settings during the quarter
The BSP’s decision was based on its assessment of the dynamics and risks in the inflation environment over the policy horizon. Latest forecasts continue to indicate that average inflation would likely settle below the target range of 3.0 percent ± 1 percentage point for 2016 and return gradually to a path consistent with the inflation target in 2017‐2018 due to higher oil prices and strong domestic economic activity. The overall balance of risks surrounding the inflation outlook also remains tilted to the upside, owing partly to the pending petitions for adjustments in electricity rates as well as the initial impact of the government’s broad fiscal reform program. Meanwhile, increased uncertainty in global economic prospects continues to pose a key downside risk to the inflation outlook. Nevertheless, inflation expectations remain broadly consistent with the inflation target over the policy horizon. Chart 27. BSP Policy Rates in percent
0
1
2
3
4
5
6
7
Jan 2013
Feb
Mar
Apr
May
Jun
Jul
Aug
Sep
Oct
Nov
Dec
Jan 2014
Feb
Mar
Apr
May
Jun
Jul
Aug
Sep
Oct
Nov
Dec
Jan 2015
Feb
Mar
Apr
May
Jun
Jul
Aug
Sep
Oct
Nov
Dec
Jan 2016
Feb
Mar
Apr
May
Jun
Jul
Aug
Sep
Oct
Nov
Dec
Overnight RRP Rate
Overnight RP Rate
SDA Rate/Overnight Deposit Facility Rate*
* On 3 June 2016, Special Deposit Accounts (SDAs) were replaced by the Overnight Deposit Facility (ODF) in line with the implementation of the Interest Rate Corridor (IRC) System.Source: BSP
At the same time, the BSP also stressed that domestic demand conditions are likely to stay firm, supported by solid private household spending, higher government expenditure, and adequate domestic liquidity amid modest and uneven global economic growth. In addition, the BSP has considered the potential impact of the ongoing monetary policy adjustment in the US on global financial market conditions. With these considerations, the BSP believes that prevailing monetary policy settings remain appropriate. The BSP noted that maintaining monetary policy settings at this juncture will give the BSP more time to assess evolving economic development and calibrate its policy tools as appropriate. Going forward, the BSP will continue to monitor emerging price and output conditions to ensure price and financial stability conducive to sustained economic growth.
Q4 2016 Inflation Report | 32
VI. Inflation Outlook BSP Inflation Forecasts61 The latest BSP baseline forecasts show that inflation could approach the midpoint of the target range in 2017 and 2018, driven by higher oil prices and the continued strength of domestic economic activity. The risks to future inflation appear to be tilted on the upside. Pending petitions for adjustments in electricity rates along with the expected impact of the government’s broad fiscal reform program are the main upside risks to inflation. Meanwhile, the increased uncertainty in the global economic landscape poses the main downside risk to inflation.
Inflation is expected to approach the midpoint of the target range in 2017 and 2018
Demand Conditions. Key demand indicators support the view of robust domestic real sector activity. GDP growth accelerated to 7.1 percent in Q3 2016 from the 7.0 percent growth in the previous quarter. The increase in economic activity was driven mainly by strong investment and sustained private consumption, offsetting soft external demand. This brought average growth to 7.0 percent for the first three quarters of the year. Prospects for the domestic economy continue to remain favorable. GDP expansion could continue to pick up due to the robust growth in the services sector and potential recovery in merchandise trade. The government has identified expenditure measures to address the lag in disbursements and avoid underspending. Private demand is expected to remain firm, aided mainly by sustained remittance inflows and low inflation. Private capital formation should also contribute to economic growth with construction and investments in durable equipment expected to 61 The inflation forecast path in this report refers to the forecasts presented during the 22 December 2016 monetary policy meeting. In the discussion, these forecasts are compared to the forecasts presented in the Q3 2016 Inflation Report (or the forecasts during the 22 September 2016 monetary policy meeting).
remain solid, particularly as more Public‐Private Partnership (PPP) projects get underway. High‐frequency real sector indicators likewise point to favorable growth prospects in the near term. Production indices for the manufacturing sector suggest continued expansion with more than half of all major manufacturing sectors operating above 80 percent of their capacity. The composite PMI also remains firmly above the 50‐point mark at 55.3 in November 2016. There have also been improvements in labor market conditions with lower unemployment rate compared to a year ago, based on the results of the October 2016 Labor Force Survey (LFS). The optimistic economic outlook has also been reflected in the results of the BSP expectations surveys as consumer confidence hits a new record high for Q4 2016. This is broadly in line with the generally favorable macroeconomic conditions. Supply Conditions. Commodity prices are expected to remain manageable, reflecting ample supply conditions. Food inflation could remain benign over the near term given prospects of favorable domestic supply along with timely arrival of rice imports. Meanwhile, oil prices are projected to rise in the medium term following the decision of the Organization of Petroleum Exporting Countries (OPEC) and several non‐OPEC producers to reduce production by 1.2 million barrels per day and 0.6 million barrels per day, respectively.
Oil prices are projected to rise over the medium term
Global agricultural prices could remain at moderate levels over the medium term. Forecasts by the IMF and the World Bank suggest lower benchmark prices of key grains (wheat, maize, and rice) in 2016 before normalizing over the medium term.62,63
62 IMF, Commodity Price Forecasts, December 2016, available online at http://www.imf.org 63 World Bank, Commodity Markets Outlook, October 2016, available online at http://www.worldbank.org

Q4 2016 Inflation Report | 33
In the domestic front, palay and corn production in Q1 2017 could accelerate by 12.3 percent and 18.2 percent, respectively, based on farmers’ planting intentions.64 International oil prices rose sharply as compared to the previous quarter’s level due to the announced production cuts of OPEC and non‐OPEC producers. As suggested by futures prices of oil and forecasts by multilateral agencies, a continued rise is projected over the medium term. Forecast by the EIA suggests that Brent crude oil price could average at US$51.66 per barrel in 2017. Meanwhile, IMF and World Bank expect crude oil prices to average at US$51.22 per barrel and US$55.20 per barrel in 2017, respectively. However, oil prices are inherently volatile. Uncertainties surrounding the oil market could emanate from the degree of compliance among OPEC members to the supply cap agreed during their 30 November 2016 meeting. In addition, the geopolitical tensions in the Middle East, high inventory levels, and potential increase in US shale oil production provide further risks to oil market outlook.65,66,67
Output gap remains positive
The balance of demand and supply conditions as captured by the output gap (or the difference between actual and potential output), provides an indication of potential inflationary pressures in the near term. 68
Given the latest GDP data, preliminary estimates by the BSP show a slightly lower positive output gap in Q3 2016 relative to the previous quarter. The output gap narrowed as the estimated potential output continued to improve during the review period.69
64 PSA, Rice and Corn Situation Outlook Report, October 2016, available online at http://www.psa.gov.ph 65 EIA, Short‐Term Energy Outlook, December 2016, available online at http://www.eia.gov 66 IMF, Commodity Price Forecasts, December 2016, available online at http://www.imf.org 67 World Bank, Commodity Markets Outlook, October 2016, available online at http://www.worldbank.org 68 Inflation tends to rise (fall) when demand for goods and services exert pressure on the economy’s ability to produce goods and services, i.e., when the output gap is positive (negative). 69 Based on the seasonally‐adjusted GDP growth
Key assumptions used to generate the BSP’s inflation forecasts. The BSP's baseline inflation forecasts generated from the BSP’s single equation model (SEM) and the multi‐equation model (MEM) are based on the following assumptions: 1) BSP’s overnight RRP rate at 3.0 percent from
January 2017 to December 2018; 2) NG fiscal deficits for 2017 to 2018, which are
consistent with the DBCC‐approved estimates; 3) Dubai crude oil price assumptions, the trend
of which is consistent with the trend of futures prices of oil in the international market;
4) Increase in nominal wage in June 2017 and June 2018 consistent with labor productivity growth and historical wage increases;
5) Real GDP growth is endogenously determined; and
6) Foreign exchange rate is endogenously determined through the purchasing power parity and interest rate parity relationships.
Risks to the Inflation Outlook The risks to the inflation outlook may be presented graphically through a fan chart. The fan chart depicts the probability of different inflation outcomes based on the central projection (corresponding to the baseline forecast of the BSP) and the risks surrounding the inflation outlook.
Projected inflation path is higher for 2017 and 2018
Compared to the previous inflation report, the latest fan chart presents an upward shift in the inflation projection for 2017 and 2018. The increase in the projected inflation path could be attributed mainly to stronger domestic economic activity, rise in oil prices, weaker domestic currency as well as higher‐than‐expected inflation outturns in the fourth quarter of 2016. The BSP’s review of current inflation dynamics suggests that the risks surrounding the inflation outlook appear to be tilted on the upside. This assessment is depicted in the latest fan chart wherein the projection bands above the central projection are greater than the bands below it.

Q4 2016 Inflation Report | 34
Pending petitions for adjustments in electricity rates along with the projected impact of the government’s broad fiscal reform program are the main upside risks to inflation. Meanwhile, the increased uncertainty in the global economic landscape poses the main downside risk. The pending petitions of Meralco and PSALM continue to represent upside risks to inflation. Included in the Meralco petitions are the December 2013 rate adjustment, which is still under the temporary restraining order of the Supreme Court, and the ₱0.65 per kWh adjustment for the January 2014 billing period that is subject to the Energy Regulatory Commission’s (ERC) approval. PSALM’s petitions meanwhile cover adjustments for fuel and foreign exchange costs. The national government’s proposed fiscal reform package represents an upside risk to inflation. The Department of Finance (DOF) is proposing to Congress the following revenue reforms: (i) reduction in personal income taxes except for the highest income earners; (ii) expansion of the value‐added tax (VAT) base by limiting exemptions only to raw food, education, and health; (iii) increase in excise taxes of petroleum products; and (iv) increase in the excise tax of automobiles.70 The expected net increase in revenue from these reforms, together with some tax administration measures are intended largely for funding the government’s key infrastructure and social spending programs, which could boost domestic economic activity and raise the country’s productive capacity. It is expected that sustained increase in productive public investment and higher capital income from the gradual reduction in corporate income tax could have significant crowding‐in effect on private investment, resulting in a beneficial cycle of higher investment and potential output. In terms of inflationary impact, higher consumption taxes, together with the demand stimulus from the fiscal reform program, could result in higher inflation. 70 Based on the DOF’s presentation to the Senate Ways and Mean Committee last 28 September 2016.
Chart 28. Inflation Projection
Source: BSP estimates
The risks to inflation outlook appear to be tilted on the upside
By contrast, the increased uncertainty in global economic activity is the main downside risk to the inflation outlook. Despite the continued strength of the domestic economy, the impact of US President‐elect Donald Trump’s proposed policies on global trade, the uncertainties over Brexit negotiations, and the continued fragility in the EU’s banking system as well as the potentially disruptive rebalancing in China due to its property sector could lead to more volatile financial markets and slower world economic growth. Moreover, sluggish world economic activity could put additional downward pressures on international commodity prices. The fan chart shows the probability of various outcomes for inflation over the forecast horizon. The darkest band depicts the central projection, which corresponds to the BSP’s baseline inflation forecast. It covers 25 percent of the probability distribution. Each successive pair of bands is drawn to cover a further 25 percent of probability, until 75 percent of the probability distribution is covered. Lastly, the lightest band covers the lower and upper 90 percent of the probability distribution. The bands widen (i.e., “fan out”) as the time frame is extended, indicating increasing uncertainty about outcomes. The band in wire mesh depicts the inflation profile in the previous report.

Q4 2016 Inflation Report | 35
The shaded area, which measures the range of uncertainty, is based on the forecast errors from the past years. In greater detail, it can be enhanced by adjusting the level of skewness of the downside and upside shocks that could affect the inflationary process over the next two years in order to change the balance of the probability area lying above or below the central projection.

Q4 2016 Inflation Report | 36
VII. Implications for the Monetary Policy Stance The prevailing monetary policy settings remain appropriate. The latest BSP baseline forecasts show that inflation could approach the midpoint of the target range in 2017 and 2018. The latest projected inflation path is higher due mainly to stronger domestic economic activity, rise in oil prices, weaker domestic currency as well as higher‐than‐expected inflation outturns in the fourth quarter of 2016. Nevertheless, inflation dynamics remain manageable given well‐contained inflation expectations over the policy horizon. Inflation expectations—based on forecast surveys of private sector economists by the BSP and by Consensus Economics—also continue to be within target over 2017‐2018. At the same time, the balance of risks to the inflation outlook remains tilted toward the upside which argues for maintaining vigilance in setting the stance of monetary policy going forward. The pending petitions for adjustments in electricity rates along with the impact of the government’s overall fiscal reform program are seen as the main upside risks to the baseline forecast. Meanwhile, the increased uncertainty in the global economic landscape poses the main downside risk to inflation.
Domestic demand continues to be firm
Latest demand indicators affirm the earlier assessment that domestic demand conditions remain relatively firm. The economy grew by 7.1 percent in the third quarter, faster compared to the 7.0 percent growth in the previous quarter and from 6.2 percent in the third quarter in 2015. This brought year‐to‐date growth to 7.0 percent, which is at the high end of the government’s growth target of 6‐7 percent in 2016. Strong domestic demand fueled output growth, led by solid household consumption and higher capital formation. On the supply side, growth was driven by the services sector while growth in the industry sector was supported by manufacturing.
Consistent with these developments, other high‐frequency indicators continue to point to sustained growth in the near to medium term. Prospects for aggregate demand are expected to
remain solid based on robust consumer confidence. Consumers’ outlook improved significantly for Q4 2016 with the overall confidence index (CI) reaching an all‐time high of 9.2 percent. Meanwhile, business outlook on the economy turned less optimistic for Q4 2016 due mainly to perceived concerns over the direction of the country’s foreign policy and economic reforms as well as weakening global demand. Nevertheless, the Philippine composite PMI remained above the 50‐point expansion threshold while manufacturing companies continue to operate above the long‐term average capacity utilization of 80.0 percent.
Ample liquidity and sustained bank lending growth indicate that prevailing monetary policy settings continue to be appropriately supportive of economic activity. Domestic liquidity or M3 continued to expand in November 2016 by 12.7 percent while bank lending grew by 18.6 percent.
At the same time, it remains prudent for the BSP to maintain present monetary policy settings in response to the continued uncertainty in the external environment. The latest run of international data shows an improvement in demand across the globe, led mainly by advanced economies while economic activity in the emerging economies remains mixed. However, the impact of US President‐elect Donald Trump’s proposed policies on global trade, the uncertainties over Brexit negotiations, and the rebalancing in China could lead to more volatile financial markets and slower world economic growth. There is likewise scope to maintain monetary policy settings as a way of retaining flexibility following the FOMC’s decision to increase the federal funds rate to a range of between 0.50 percent and 0.75 percent with projected three rate increases in 2017.
In sum, prevailing conditions for inflation as well as output continue to support maintaining present monetary policy settings. Notwithstanding below‐target inflation for 2016, inflation dynamics remain manageable given well‐contained inflation expectations over the policy horizon. Most inflation pressures at present are mainly driven by supply‐side causes. Latest baseline inflation forecasts extending to 2018 show that annual average inflation is likely to settle within the target range. Moreover, further monetary stimulus does

Q4 2016 Inflation Report | 37
not appear warranted given the continued ample liquidity in the system, sustained credit expansion and ramped‐up fiscal spending. Keeping a steady hand on policy levers also remains prudent for the BSP given the challenging global economic environment.

Q4 2016 Inflation Report | 38
Summary of Monetary Policy Decisions
Effectivity Date
Levels (in percent)
Monetary Policy Decisions RRP Overnight
RP Overnight
2 0 0 8
31 Jan 2008 5.00 7.00
The Monetary Board (MB) decided to reduce by 25 basis points (bps) the BSP’s key policy interest rates to 5 percent for the overnight borrowing or reverse repurchase (RRP) facility and 7 percent for the overnight lending or repurchase (RP) facility. The interest rates on term RRPs, RPs, and special deposit accounts (SDAs) were also reduced accordingly. In its assessment of macroeconomic conditions, the MB noted that the latest inflation forecasts indicated that inflation would fall within the 4.0 percent ± 1 percentage point target range in 2008 and the 3.5 ± 1 percentage point target range in 2009.
13 Mar 2008 5.00 7.00
The MB decided to keep the BSP’s key policy interest rates at 5 percent for the overnight borrowing or RRP facility and 7 percent for the overnight lending or RP facility. The MB also decided to implement immediately the following refinements in the SDA facility: (1) the closure of existing windows for the two‐, three‐, and six‐month tenors; and (2) the reduction of the interest rates on the remaining tenors. The interest rates on term RRPs and RPs were also left unchanged.
24 Apr 2008 5.00 7.00
The MB kept the BSP’s key policy interest rates at 5.0 percent for the overnight borrowing or RRP facility and 7.0 percent for the overnight lending or RP facility. The interest rates on term RRPs and RPs were also left unchanged.
5 Jun 2008 5.25 7.25
The MB decided to increase by 25 bps the BSP’s key policy interest rates to 5.25 percent for the RRP facility and 7.25 percent for RP facility as emerging baseline forecasts indicate a likely breach of the inflation target for 2008 along with indications that supply‐driven pressures are beginning to feed into demand. Given the early evidence of second‐round effects, the MB recognized the need to act promptly to rein in inflationary expectations. The interest rates on term RRPs, RPs, and SDAs were also increased accordingly.
17 Jul 2008 5.75 7.75
The MB increased by 50 bps the BSP’s key policy interest rates to 5.75 percent for the overnight borrowing or RRP facility and 7.75 percent for the overnight lending or RP facility. The interest rates on term RRPs, RPs, and SDAs were also increased accordingly.
28 Aug 2008 6.00 8.00
The MB increased by 25 bps the BSP’s key policy interest rates to 6.0 percent for the overnight borrowing or reverse repurchase (RRP) facility and 8.0 percent for the overnight lending or repurchase (RP) facility. The interest rates on term RRPs, RPs, and SDAs were also increased accordingly.

Q4 2016 Inflation Report | 39
Summary of Monetary Policy Decisions
Effectivity Date
Levels (in percent)
Monetary Policy Decisions RRP Overnight
RP Overnight
6 Oct 2008 6.00 8.00
The MB kept the BSP’s key policy interest rates unchanged at 6.0 percent for RRP facility and 8.0 percent for the RP facility. The interest rates on term RRPs, RPs, and SDAs were also left unchanged.
6 Nov 2008 6.00 8.00
The MB decided to keep the BSP’s key policy interest rates steady at 6 percent for the overnight borrowing or RRP facility and 8 percent for the overnight lending or RP facility. The interest rates on term RRPs, RPs, and SDAs were also left unchanged.
18 Dec 2008 5.50 7.50
The MB decided to reduce the BSP’s key policy interest rates by 50 bps to 5.5 percent for the overnight borrowing or RRP facility and 7.5 percent for the overnight lending or RP facility. The interest rates on term RRPs, RPs, and SDAs were also adjusted accordingly. Latest baseline forecasts showed a decelerating inflation path over the policy horizon, with inflation falling within target by 2010. This outlook is supported by the downward shift in the balance of risks, following the easing of commodity prices, the moderation in inflation expectations, and the expected slowdown in economic activity.
2 0 0 9
29 Jan 2009 5.00 7.00
The MB decided to reduce the BSP’s key policy interest rates by another 50 bps to 5 percent for the overnight borrowing or RRP facility and 7 percent for the overnight lending or RP facility. The interest rates on term RRPs, RPs, and SDAs were also adjusted accordingly. Latest baseline forecasts showed a decelerating inflation path over the policy horizon, with inflation falling within target by 2010. The MB based its decision on the latest inflation outlook which shows inflation falling within the target range for 2009 and 2010. The Board noted that the balance of risks to inflation is tilted to the downside due to the softening prices of commodities, the slowdown in core inflation, significantly lower inflation expectations, and moderating demand.
5 Mar 2009 4.75 6.75
The MB decided to reduce the BSP’s key policy interest rates by 25 bps to 4.75 percent for the overnight borrowing or RRP facility and 6.75 percent for the overnight lending or RP facility. The interest rates on term RRPs, RPs, and SDAs were also reduced accordingly. Given possible upside risks to inflation, notably the volatility in oil prices and in exchange rates, increases in utility rates, and potential price pressures coming from some agricultural commodities, the MB decided that a more measured adjustment of policy rates was needed.

Q4 2016 Inflation Report | 40
Summary of Monetary Policy Decisions
Effectivity Date
Levels (in percent)
Monetary Policy Decisions RRP Overnight
RP Overnight
16 Apr 2009 4.50 6.50
The MB reduced key policy rates by another 25 bps to 4.5 percent for the overnight borrowing or RRP facility and 6.5 percent for the overnight lending or RP facility, effective immediately. This rate cut brings the cumulative reduction in the BSP’s key policy rates to 150 bps since December last year. The current RRP rate is the lowest since 15 May 1992. Meanwhile, the interest rates on term RRPs, RPs, and SDAs were also reduced accordingly. In its assessment of macroeconomic conditions, the MB noted that the latest baseline inflation forecasts indicated a lower inflation path over the policy horizon, with average inflation expected to settle within the target ranges in 2009 and 2010. In addition, the MB considered that the risks to inflation are skewed to the downside given expectations of weaker global and domestic demand conditions and a low probability of a significant near‐term recovery in commodity prices.
28 May 2009 4.25 6.25
The MB decided to reduce the BSP’s key policy interest rates by another 25 bps to 4.25 percent for the overnight borrowing or RRP facility and 6.25 percent for the overnight lending or RP facility. The interest rates on term RRPs, RPs, and SDAs were also reduced accordingly. Baseline forecasts indicated a lower inflation path over the policy horizon, with average inflation expected to settle within the target ranges in 2009 and 2010. In addition, the Monetary Board considered that, on balance, the risks to inflation are skewed to the downside given expectations of weaker global and domestic demand conditions and a low probability of a significant near‐term recovery in commodity prices.
9 Jul 2009 4.00 6.00
The MB decided to reduce the BSP's key policy interest rates by 25 bps to 4 percent for the overnight borrowing or RRP facility and 6 percent for the overnight lending or RP facility, effective immediately. The interest rates on term RRPs, RPs, and SDAs were reduced accordingly. This is the sixth time since December 2008 that the BSP has cut its policy interest rates.
20 Aug 2009 1 Oct 2009 5 Nov 2009 17 Dec 2009
4.00 6.00
The MB kept key policy rates unchanged at 4 percent for the RRP facility and 6 percent for the overnight lending RP facility. The decision to maintain the monetary policy stance comes after a series of policy rate cuts since December 2008 totaling 200 bps and other liquidity enhancing measures.
2 0 1 0
28 Jan 2010 11 Mar 2010 22 Apr 2010 3 Jun 2010 15 Jul 2010 26 Aug 2010 7 Oct 2010 18 Nov 2010 29 Dec 2010
4.00 6.00
The MB decided to keep the BSP's key policy interest rates steady at 4 percent for the RRP facility and 6 percent for the RP facility. The interest rates on term RRPs, RPs, and SDAs were also left unchanged.

Q4 2016 Inflation Report | 41
Summary of Monetary Policy Decisions
Effectivity Date
Levels (in percent)
Monetary Policy Decisions RRP Overnight
RP Overnight
2 0 1 1
10 Feb 2011 4.00 6.00
The MB decided to keep the BSP’s key policy interest rates steady at 4 percent for the overnight borrowing or RRP facility and 6 percent for the overnight lending or RP facility. The interest rates on term RRPs, RPs, and SDAs were also left unchanged.
24 Mar 2011 4.25 6.25
The MB decided to increase by 25 bps the BSP’s key policy interest rates to 4.25 percent for the overnight borrowing or RRP facility and 6.25 percent for the overnight lending or RP facility. The interest rates on term RRPs, RPs, and SDAs were also raised accordingly. The MB’s decision was based on signs of stronger and broadening inflation pressures as well as a further upward shift in the balance of inflation risks. International food and oil prices have continued to escalate due to the combination of sustained strong global demand and supply disruptions and constraints.
5 May 2011 4.50 6.50
The MB decided to increase the BSP’s key policy interest rates by another 25 bps to 4.5 percent for the overnight borrowing or RRP facility and 6.5 percent for the overnight lending or RP facility. The interest rates on term RRPs, RPs, and SDAs were also raised accordingly. Baseline inflation forecasts continue to suggest that the 3‐5 percent inflation target for 2011 remains at risk, mainly as a result of expected pressures from oil prices.
16 Jun 2011 4.50 6.50
The MB decided to keep policy rates steady at 4.5 percent for the overnight borrowing or RRP facility and 6.5 percent for the overnight lending or RP facility. At the same time, the Board decided to raise the reserve requirement on deposits and deposit substitutes of all banks and non‐banks with quasi‐banking functions by one percentage point effective on Friday, 24 June 2011. The MB's decision to raise the reserve requirement is a preemptive move to counter any additional inflationary pressures from excess liquidity.
28 Jul 2011 4.50 6.50
The MB maintained the BSP's key policy interest rates at 4.5 percent for the overnight borrowing or RRP facility and 6.5 percent for the overnight lending or RP facility. At the same time, the Board increased anew the reserve requirement on deposits and deposit substitutes of all banks and non‐banks with quasi‐banking functions by one percentage point effective on 5 August 2011. The MB's decision to raise the reserve requirement anew is a forward‐looking move to better manage liquidity.
8 Sep 2011 20 Oct 2011 1 Dec 2011
4.50 6.50 The MB decided to keep the overnight policy rates steady. At the same time, the reserve requirement ratios were kept unchanged.

Q4 2016 Inflation Report | 42
Summary of Monetary Policy Decisions
Effectivity Date
Levels (in percent)
Monetary Policy Decisions RRP Overnight
RP Overnight
2 0 1 2
19 Jan 2012 4.25 6.25
The MB decided to reduce the BSP's key policy interest rates by 25 bps to 4.25 percent for the overnight borrowing or RRP facility and 6.25 percent for the overnight lending or RP facility. The interest rates on term RRPs, RPs, and SDAs were also reduced accordingly The MB's decision is based on its assessment that the inflation outlook remains comfortably within the target range, with expectations well‐anchored and as such, allowed some scope for a reduction in policy rates to help boost economic activity and support market confidence.
1 Mar 2012 4.00 6.00
The MB decided to reduce the BSP's key policy interest rates by another 25 bps to 4.0 percent for the overnight borrowing or RRP facility and 6.0 percent for the overnight lending or RP facility. The interest rates on term RRPs, RPs, and SDAs were also reduced accordingly. The MB is of the view that the benign inflation outlook has allowed further scope for a measured reduction in policy rates to support economic activity and reinforce confidence.
19 Apr 2012 4.00 6.00
The MB decided to keep the BSP’s key policy interest rates steady at 4 percent for the overnight borrowing or RRP facility and 6 percent for the overnight lending or RP facility. The interest rates on term RRPs, RPs, and SDAs were also left unchanged.
14 Jun 2012 4.00 6.00
The MB decided to keep the BSP’s key policy interest rates steady at 4 percent for the overnight borrowing or RRP facility and 6 percent for the overnight lending or RP facility. The interest rates on term RRPs, RPs, and SDAs were also left unchanged. The MB’s decision was based on its assessment that the inflation environment remains manageable. Baseline forecasts continue to track the lower half of the 3‐5 percent target range for 2012 and 2013, while inflation expectations remain firmly anchored. At the same time, domestic macroeconomic readings have improved significantly in Q1 2012.
26 Jul 2012 3.75 5.75
The MB decided to reduce the BSP’s key policy interest rates by 25 bps to 3.75 percent for the overnight borrowing or RRP facility and 5.75 percent for the overnight lending or RP facility. The interest rates on term RRPs, RPs, and SDAs were also reduced accordingly. This is the third time in 2012 that the BSP has cut its policy rates. The MB’s decision was based on its assessment that price pressures have been receding, with risks to the inflation outlook slightly skewed to the downside. Baseline forecasts indicate that inflation is likely to settle within the lower half of the 3‐5 percent target for 2012 and 2013, as pressures on global commodity prices are seen to continue to abate amid weaker global growth prospects. At the same time, the MB is of the view that prospects for global economic activity are likely to remain weak.
13 SEP 2012 3.75 5.75
The MB decided to keep the BSP’s key policy interest rates steady at 3.75 percent for the overnight borrowing or RRP facility and 5.75 percent for the overnight lending or RP facility. The interest rates on term RRPs, RPs, and SDAs were also left unchanged. The MB’s decision was based on its assessment that the inflation environment remains benign,

Q4 2016 Inflation Report | 43
Summary of Monetary Policy Decisions
Effectivity Date
Levels (in percent)
Monetary Policy Decisions RRP Overnight
RP Overnight
with the risks to the inflation outlook appearing to be broadly balanced.
25 Oct 2012 3.50 5.50
The MB decided to reduce the BSP’s key policy interest rates by 25 bps to 3.50 percent for the overnight borrowing or RRP facility and 5.50 percent for the overnight lending or RP facility. The interest rates on term RRPs, RPs, and SDAs were also reduced accordingly. This is the fourth time in 2012 that the BSP has cut its policy rates. The MB’s decision was based on its assessment that the inflation environment continued to be benign with latest baseline forecasts indicating that the future inflation path will remain within target for 2012‐2014. A rate cut would also be consistent with a symmetric response to the risk of below‐target inflation.
13 Dec 2012 3.50 5.50
The MB decided to keep the BSP’s key policy interest rates steady at 3.50 percent for the overnight borrowing or RRP facility and 5.50 percent for the overnight lending or RP facility. The interest rates on term RRPs, RPs, and SDAs were also left unchanged. The MB’s decision was based on its assessment that current monetary settings remained appropriate, as the cumulative 100‐basis‐point reduction in policy rates in 2012 continued to work its way through the economy.
2 0 1 3
24 Jan 2013 3.50 5.50
The MB decided to keep the BSP’s key policy interest rates steady at 3.50 percent for the overnight borrowing or RRP facility and 5.50 percent for the overnight lending or RP facility. The interest rates on term RRPs and RPs were also maintained accordingly. The reserve requirement ratios were kept steady as well. At the same time, the MB decided to set the interest rates on the SDA facility at 3.00 percent regardless of tenor, effective immediately, consistent with the BSP’s continuing efforts to fine‐tune the operation of its monetary policy tools.
14 Mar 2013 3.50 5.50
The MB decided to keep the BSP’s key policy interest rates steady at 3.50 percent for the overnight borrowing or RRP facility and 5.50 percent for the overnight lending or RP facility. The interest rate on the RRP was also set at 3.50 percent regardless of tenor. Following its previous decision to rationalize the SDA facility in January 2013, the MB further reduced the interest rates on the SDA facility by 50 bps to 2.50 percent across all tenors effective immediately.
25 Apr 2013 3.50 5.50
The MB decided to keep the BSP’s key policy interest rates steady at 3.50 percent for the overnight borrowing or RRP facility and 5.50 percent for the overnight lending or RP facility. The interest rate on the RRP was also set at 3.50 percent regardless of tenor. Meanwhile, the SDA rate was further reduced by 50 basis points to 2.0 percent across all tenors.
13 Jun 2013 25 Jul 2013 12 Sep 2013 24 Oct 2013 12 Dec 2013
3.50 5.50
The MB decided to keep the BSP’s key policy interest rates steady at 3.50 percent for the overnight borrowing or RRP facility and 5.50 percent for the overnight lending or RP facility. The interest rates on term RRPs, RPs, and SDA were also maintained.

Q4 2016 Inflation Report | 44
Summary of Monetary Policy Decisions
Effectivity Date
Levels (in percent)
Monetary Policy Decisions RRP Overnight
RP Overnight
2 0 1 4
6 Feb 2014 3.50 5.50
The MB decided to keep the BSP’s key policy interest rates steady at 3.50 percent for the overnight borrowing or RRP facility and 5.50 percent for the overnight lending or RP facility. The interest rates on term RRPs, RPs, and SDA were also maintained.
27 Mar 2014 3.50 5.50
The MB decided to keep the BSP’s key policy interest rates steady at 3.50 percent for the overnight borrowing or RRP facility and 5.50 percent for the overnight lending or RP facility. The interest rates on term RRPs, RPs, and SDA were also maintained. Meanwhile, the MB decided to increase the reserve requirement by one percentage point effective on 11 April 2014.
8 May 2014 3.50 5.50
The MB decided to keep the BSP's key policy interest rates steady at 3.50 percent for the overnight borrowing or RRP facility and 5.50 percent for the overnight lending or RP facility. The interest rates on term RRPs, RPs, and SDA were also maintained. Meanwhile, the MB decided to increase the reserve requirements for U/KBs and TBs by a further one percentage point effective on 30 May 2014.
19 Jun 2014 3.50 5.50
The MB decided to keep the BSP's key policy interest rates steady at 3.50 percent for the overnight borrowing or RRP facility and 5.50 percent for the overnight lending or RP facility. The interest rates on term RRPs and RPs were also maintained. The reserve requirement ratios were left unchanged as well. Meanwhile, the MB decided to raise the interest rate on the SDA facility by 25 basis points from 2.0 percent to 2.25 percent across all tenors effective immediately.
31 Jul 2014 3.75 5.75
The MB decided to increase the BSP's key policy rates by 25 bps to 3.75 percent for the overnight borrowing or RRP facility and 5.75 percent for the overnight lending or RP facility. The interest rates on term RRPs and RPs were also raised accordingly. The rate on special deposit accounts (SDA) was left unchanged. Meanwhile, the reserve requirement ratios were also kept steady.
11 Sep 2014 4.00 6.00
The MB decided to increase the BSP's key policy rates by 25 bps to 4.0 percent for the overnight borrowing or RRP facility and 6.0 percent for the overnight lending or RP facility. The interest rates on term RRPs, RPs, and SDA were also raised accordingly. Meanwhile, the reserve requirement ratios were left unchanged.
23 Oct 2014 11 Dec 2014
4.00 6.00
The MB decided to maintain the BSP’s key policy interest rates at 4.0 percent for the overnight borrowing or reverse repurchase (RRP) facility and 6.0 percent for the overnight lending or repurchase (RP) facility. The interest rates on term RRPs, RPs, and special deposit accounts were also kept steady. The reserve requirement ratios were left unchanged as well.

Q4 2016 Inflation Report | 45
Summary of Monetary Policy Decisions
Effectivity Date
Levels (in percent)
Monetary Policy Decisions RRP Overnight
RP Overnight
2 0 1 5
12 Feb 2015 26 Mar 2015 14 May 2015 25 Jun 2015 13 Aug 2015 24 Sep 2015 12 Nov 2015 17 Dec 2015
4.00 6.00
The MB decided to maintain the BSP’s key policy interest rates at 4.0 percent for the overnight borrowing or reverse repurchase (RRP) facility and 6.0 percent for the overnight lending or repurchase (RP) facility. The interest rates on term RRPs, RPs, and special deposit accounts were also kept steady. The reserve requirement ratios were left unchanged as well.
2 0 1 6
11 Feb 2016 23 Mar 2016 12 May 2016
23 Jun 2016 11 Aug 2016 22 Sep 2016 10 Nov 2016 22 Dec 2016
4.00
3.00
6.00 3.50
The MB decided to maintain the BSP’s key policy interest rates at 4.0 percent for the overnight borrowing or reverse repurchase (RRP) facility and 6.0 percent for the overnight lending or repurchase (RP) facility. The interest rates on term RRPs, RPs, and special deposit accounts were also kept steady. The reserve requirement ratios were left unchanged as well. The BSP formally adopted an interest rate corridor (IRC) system as a framework for conducting its monetary operations. The shift to IRC is an operational adjustment and not a change in the monetary policy stance. The IRC is a system for guiding short‐term market rates towards the BSP policy interest rate which is the overnight reverse repurchase (RRP) rate. The IRC system consists of the following instruments: standing liquidity facilities, namely, the overnight lending facility (OLF) and the overnight deposit facility (ODF); the overnight RRP facility; and a term deposit auction facility (TDF). The interest rates for the standing liquidity facilities form the upper and lower bound of the corridor while the overnight RRP rate is set at the middle of the corridor. The repurchase (RP) and Special Deposit Account (SDA) windows will be replaced by standing overnight lending and overnight deposit facilities, respectively. Meanwhile, the reverse repurchase (RRP) facility will be modified to a purely overnight RRP. In addition, the term deposit facility (TDF) will serve as the main tool for absorbing liquidity. The interest rates for these facilities will be set as follows starting 3 June 2016: 3.5 percent in the overnight lending facility (a reduction of the interest rate for the upper bound of the corridor from the current overnight RP rate of 6.0 percent); 3.0 percent in the overnight RRP rate (an adjustment from the current 4.0 percent); and 2.5 percent in the overnight deposit facility (no change from the current SDA rate).

Q4 2016 Inflation Report | 46
The BSP Inflation Report is published every quarter by the Bangko Sentral ng Pilipinas. The report is available as a complete document in pdf format, together with other general information about inflation targeting and the monetary policy of the BSP, on the BSP’s website:
www.bsp.gov.ph/monetary/inflation.asp If you wish to receive an electronic copy of the latest BSP Inflation Report, please send an e‐mail to [email protected]. The BSP also welcomes feedback from readers on the contents of the Inflation Report as well as suggestions on how to improve the presentation. Please send comments and suggestions to the following addresses:
By post: BSP Inflation Report
c/o Department of Economic Research Bangko Sentral ng Pilipinas
A. Mabini Street, Malate, Manila Philippines 1004
By e‐mail: [email protected]