Embed Size (px)
Citation preview
1
2
FOREWORD BY THE EXECUTIVE MAYOR
This Integrated Development Plan of the Nelson Mandela Bay Municipality
covers the five-year period 2016 - 2021. It has been compiled with the intention of making this a
Golden Period in the history of Nelson Mandela Bay - a period of growth and development in which
the goals of the National Development Plan will be meaningfully approached; a period in which the
current economic and organisational decline evident in the Nelson Mandela Bay Municipality and in
the Nelson Mandela Bay economy in general will be turned around; a period in which the institution
of the Municipality will be re-invigorated, purged of corruption and transformed into an efficient
service delivery machine; and a period in which the economy of our Metro will be diversified,
renewed and expanded, creating decent employment opportunities.
The life-cycle of the IDP that the Nelson Mandela Bay Municipality adopted in May 2011 will come
to an end on 30 June 2016. The fundamental question that we should attempt to answer is whether
the five editions of the IDP approved by Council over the past five years have achieved the broad
objectives of the Municipality in terms of the priorities and needs of the communities of Nelson
Mandela Bay. This IDP is premised on stakeholder engagements with communities, civil society,
labour, business, government, state-owned enterprises and political parties. All the above stated
stakeholder groupings have made their submissions regarding the Municipality’s current IDP and
budget review processes, and those submissions were addressed through internal processes of
Council. Furthermore, this IDP is a ‘building block’ towards the development of a long-term strategy
and vision for the Nelson Mandela Bay region. This long-term strategy and vision will revive and
reinstate the experience of the region as friendly and hospitable; nurture and harness tourism; and
promote and strengthen the economic vibrancy of and investor confidence in the region. Basic
service delivery in line with universal norms and standards and the provision of infrastructure that
continues to connect Nelson Mandela Bay to the world will ensure that we become a smart city that
is well structured and ecologically friendly. The automotive sector will be supported further in
3
ensuring its sustaibability, further initiatives and programmes in creating an inclusive blue oceans
economy, urban agriculture, creative industry and a vibrant township economy will remain a priority
for the municipality.
The Nelson Mandela Bay Investment Council will play a key role in the realisation of regional
economic development and integration. In developing a long-term strategy and vision, the
IDP/Budget must ensure that our plans are geared towards expediting effective, efficient and quality
service delivery to the people. In addition, the IDP/Budget must be able to facilitate processes
towards the development and implementation of a framework to promote integrated growth and
development. The Municipality must be able to develop a five-year financial plan and introduce
effective internal systems to improve cash flow management and enhance revenue and expenditure
patterns.
Both unemployment and inequality remain a challenge in the region; our programmes must
promote economic growth and development through working with communities, the private sector
and labour. Job creation and sustainable livelihoods must be at the centre of all municipal
programmes. The Municipality has to ensure that it complements other spheres of government in
reaching the identified targets. The successful implementation of the IDP and Budget can be
achieved only through a partnership with all spheres of government, communities and the private
sector.
Working Together, We Can Do More!
COUNCILLOR DANIEL JORDAAN
EXECUTIVE MAYOR
4
FOREWORD BY THE CITY MANAGER
The Constitution of the Republic of South Africa mandates the Nelson Mandela Bay Municipality to
give priority to the basic needs and socio-economic development of local communities.
Consultation and engagement with communities and different stakeholders regarding the City’s
development planning processes are therefore critical. Through our public participation
programmes, the communities of Nelson Mandela Bay have reaffirmed their needs, which include
water, employment, roads, electricity, health and educational facilities, SMME empowerment and
support, and sports and recreational facilities.
Some of the identified needs do not fall within the mandate of the Municipality, but communities
tend not to differentiate between local, provincial and national government functions. To ensure
that the needs of local communities are met, this therefore demands that the Municipality ensure
that its planning efforts are better coordinated and integrated with the provincial and national
sectoral departments. The Integrated Development Plan should be seen and indeed become the
central planning tool for the three spheres of government in achieving the aim of accelerating
service delivery to our communities. This IDP is aligned to the National Development Plan 2030
Vision, and it is therefore a stepping stone towards advancing the goals of the National
Development Plan.
Projects identified in this IDP will be closely monitored, and we will be able to measure the
performance of the individual directorates. Some of these projects will be implemented in
partnership with relevant stakeholders. Strengthening relations and partnerships with the business
sector and the institutions of higher learning in the City will be prioritised. In discharging its
responsibility for promoting economic development, the institution will be exploring the economic
opportunities that could be unlocked in terms of the oceans economy and township, tourism and
creative arts industries, in partnership with relevant stakeholders.
5
As 2016 is the year for local government elections in South Africa, the new Council will have an
opportunity to review this IDP, and the review will be subjected to public participation processes.
Many thanks to all who participated and contributed during the development of this new 5-year IDP.
JOHANN METTLER
CITY MANAGER (ACTING)
6
BACKGROUND
The Local Government: Municipal Systems Act No. 32 of 2000 mandates municipalities to undertake
developmental oriented planning, so as to ensure that they achieve their constitutional mandates
(see Sections 152 and 153 of the Constitution). To this end, the Nelson Mandela Bay Municipality’s
Integrated Development Plan (IDP) serves as a strategic framework that guides its five-year planning
and budgeting. In order to provide democratic and accountable government for local communities,
the Municipality consulted both internal and external stakeholders in the IDP development process.
The key projects identified for implementation in the IDP were sourced from communities and other
stakeholders through various public participation platforms.
This IDP is informed by national and provincial government development goals and priorities,
emerging socio-economic trends, the ever-increasing demand and social cry of the people of Nelson
Mandela Bay for better services and other related issues that provide a framework in which the
Municipality can ensure developmental local government. Municipalities operate in an ever-
changing environment, and the Nelson Mandela Bay Municipality, too, is not immune to such
changes. The dynamic nature of local, national and global environments constantly presents local
government with new challenges and new demands. Similarly, the needs and priorities of the
communities within the Nelson Mandela Bay municipal area change from year to year.
To ensure close co-ordination and integration amongst projects, programmes and activities, line
function departments within the Municipality seek to work cohesively not only amongst themselves,
but also with external stakeholders (such as the business community and civil society) and provincial
and national government departments. This integration further seeks to promote integrated service
delivery to communities.
The IDP seeks to achieve sustainable development within Nelson Mandela Bay. To this end, there is
a balanced approach to economic, environmental and social development: the overarching pillars of
sustainable development. In pursuit of economic growth and the provision of services to its citizens,
the Municipality cannot compromise its responsibility for protecting the natural and built
7
environment. It is committed to adhere to good governance principles (participation, efficiency,
effectiveness, accountability, transparency, equity, fairness and the rule of law) and Batho Pele
principles (courtesy and people first, consultation, service excellence, access, information, openness
and transparency, redress and value for money) in the provision of services to local residents.
The IDP is implemented through an annual implementation framework (Service Delivery and Budget
Implementation Plan - SDBIP), which links key performance indicators to the annual budget. Senior
municipal managers conclude annual performance agreements, which serve as a monitoring tool for
departmental performance. The Municipality monitors the implementation of its SDBIP and the
performance of its senior managers through an integrated performance management system.
VISION AND MISSION
The Nelson Mandela Bay Municipality is in the process of developing a long- term vision for the City,
in partnership with all stakeholders. The vision and mission indicated below are provisional; relevant
engagement and consultation processes must be concluded.
Vision
Nelson Mandela Bay will be a metropolitan area that lives up to the values of its icon, Dr Nelson
Mandela. It will become an area with accelerated economic growth, in which the youth will have
opportunities including employment; in which there will be comfort for the aged, dignity and proper
facilities for the poor and social justice for all; and communities that are socially and politically
cohesive. It will also have a stable, efficient and innovative municipal administration, built on sound
financial management and sustainability.
Mission
The Municipality will hold up the values exemplified by and associated with its namesake, Nelson
Mandela, as outlined below:
8
All should have dignified housing: secure, with electricity, water, sanitation, regular refuse
collection, and an adequate road network; in time, universal Wi-fi and up-to-date
technology will be available, as well as efficient and inexpensive public transport.
All should have access to a full range of quality municipal services, including libraries,
sports facilities, swimming pools, cultural facilities and, in emergencies, efficient fire and
disaster management services and dignified cemeteries.
All should have a clean environment, with trees, parks, nature reserves, beaches and
special places to share with loved ones – all of this should be safe to walk in and enjoy,
free from the fear of criminals.
The Nelson Mandela Bay Municipality would play a meaningful role in reducing crime
levels, in partnership with other law enforcement agencies.
A truly non-racial environment will become the natural order of things – audiences at
sport and cultural events will over time reflect our Rainbow Nation: living together and
recreating together should be a daily pleasure and not an occasional occurrence.
The Nelson Mandela Bay Municipality will cooperate with other levels of government,
non- governmental organisations, the business community, educational institutions,
developmental agencies and all others, to effect this mission – particularly, helping to
create an environment conducive to quality education.
In all endeavours, the creation of an economy that offers dignified work and decent wages
for al should become a core value.
In achieving its vision and mission, the Municipality will develop and strengthen partnerships with all
stakeholders.
KEY PERFORMANCE AREAS
The Municipality’s vision and mission are translated into the following five municipal key
performance areas:
9
KPA1: Effective city governance
KPA 2: Integrated service delivery to a well-structured city
KPA 3: Inclusive economic development and job creation
KPA 4: Institutional and capacity development
KPA 5: Financial sustainability and viability
STRATEGIC OBJECTIVES
The following strategic objectives have been set to deliver on the above stated key performance
areas:
• Ensuring access to basic services for all residents;
• Developing and sustaining spatial, natural and built environments;
• Providing integrated and sustainable human settlements;
• Addressing the challenges of poverty, unemployment and social inequality;
• Fostering a safe, secure and healthy environment for employees and communities;
• Positioning Nelson Mandela Bay as a destination of choice to both investors and tourists;
• Developing a prosperous and diverse economy;
• Accelerating service delivery through the acquisition and retention of competent and
efficient human capital;
• Ensuring sound financial management and viability.
FOCUS OF THE 2016 - 2021 “FIVE GOLDEN YEARS” IDP
This IDP paves the way for socio-economic, infrastructural and institutional development for the
next five years and is commonly referred to as “the Five Golden Years IDP”. This IDP seeks to make
this a Golden Period in the development of Nelson Mandela Bay - a period in which the goals of the
National Development Plan will be meaningfully approached. This IDP seeks to create a period in
which the economic and organisational decline currently evident in the Nelson Mandela Bay
Municipality and in the economy of the City will be turned around. It seeks to create a period in
which the institution of the Municipality will be re-invigorated, purged of corruption and
10
transformed into an efficient service delivery machine. It seeks to ensure that the economy of
Nelson Mandela Bay is renewed and grow in size, particularly in decent employment opportunities.
This IDP seeks to attain the following:
- Stronger local ownership from both political and administrative executive;
- Greater visibility of government action within poor, under-serviced areas, as well as the
investment of financial and fiscal resources in such areas;
- Targeted investment;
- Differentiation between areas where government support and investment are most
needed and areas that are fairly well serviced.
In the Five Golden Years, the Municipality will develop further detailed ward-based plans for areas
where targeted investment is most needed.
SITUATIONAL ANALYSIS
This section presents the status quo analysis of the Nelson Mandela Bay Municipality. The
situational analysis and statistics presented in this chapter reveal the developmental challenges
(such as poverty, unemployment and service delivery backlogs) facing the Municipality. This analysis
is crucial in providing the Municipality and its social partners with information in respect of local
socio-economic trends and patterns. The programmes and projects captured in this IDP seek to
address the developmental challenges identified through the situational analysis.
11
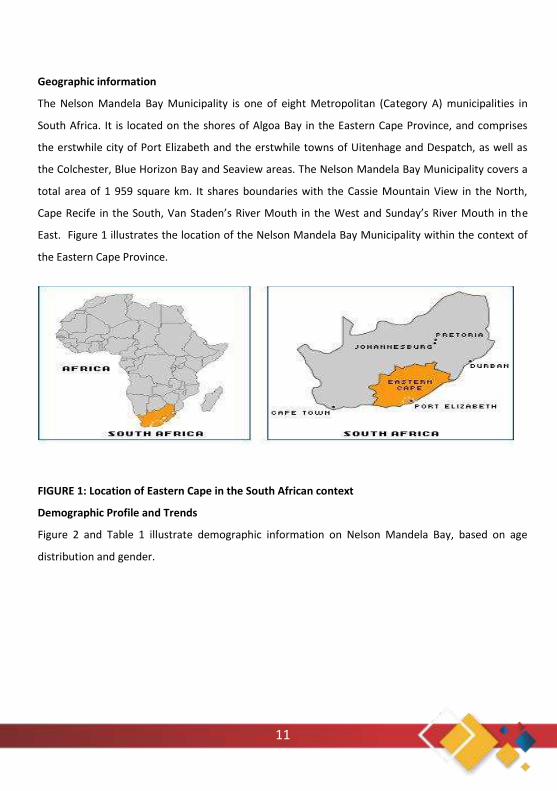
Geographic information
The Nelson Mandela Bay Municipality is one of eight Metropolitan (Category A) municipalities in
South Africa. It is located on the shores of Algoa Bay in the Eastern Cape Province, and comprises
the erstwhile city of Port Elizabeth and the erstwhile towns of Uitenhage and Despatch, as well as
the Colchester, Blue Horizon Bay and Seaview areas. The Nelson Mandela Bay Municipality covers a
total area of 1 959 square km. It shares boundaries with the Cassie Mountain View in the North,
Cape Recife in the South, Van Staden’s River Mouth in the West and Sunday’s River Mouth in the
East. Figure 1 illustrates the location of the Nelson Mandela Bay Municipality within the context of
the Eastern Cape Province.
FIGURE 1: Location of Eastern Cape in the South African context
Demographic Profile and Trends
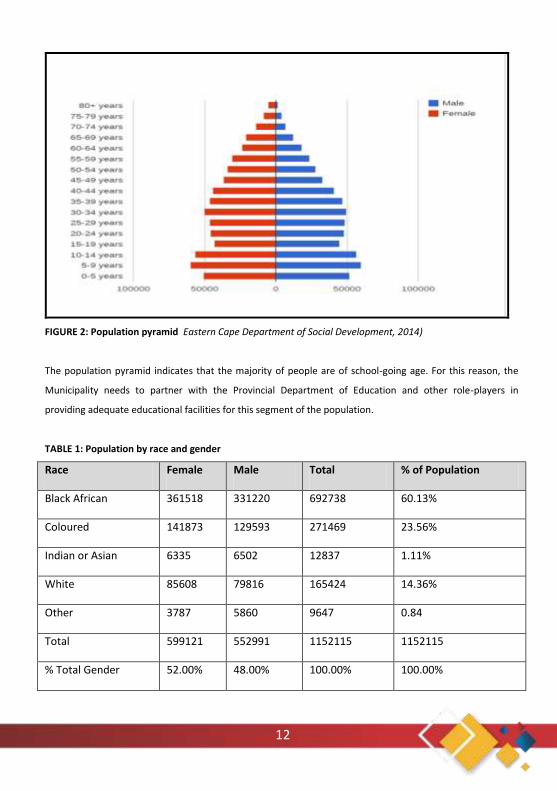
Figure 2 and Table 1 illustrate demographic information on Nelson Mandela Bay, based on age
distribution and gender.
12
FIGURE 2: Population pyramid Eastern Cape Department of Social Development, 2014)
The population pyramid indicates that the majority of people are of school-going age. For this reason, the
Municipality needs to partner with the Provincial Department of Education and other role-players in
providing adequate educational facilities for this segment of the population.
TABLE 1: Population by race and gender
Race Female Male Total % of Population
Black African 361518 331220 692738 60.13%
Coloured 141873 129593 271469 23.56%
Indian or Asian 6335 6502 12837 1.11%
White 85608 79816 165424 14.36%
Other 3787 5860 9647 0.84
Total 599121 552991 1152115 1152115
% Total Gender 52.00% 48.00% 100.00% 100.00%
13
Source: StatsSA 2011 Census
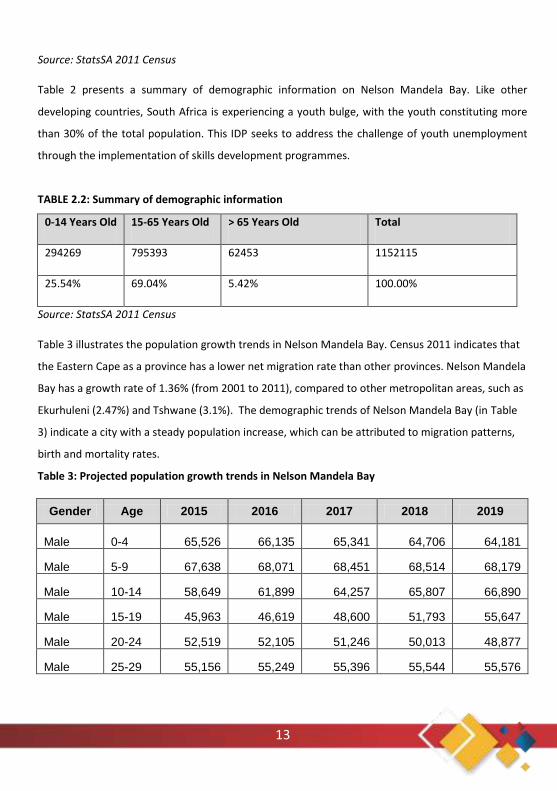
Table 2 presents a summary of demographic information on Nelson Mandela Bay. Like other
developing countries, South Africa is experiencing a youth bulge, with the youth constituting more
than 30% of the total population. This IDP seeks to address the challenge of youth unemployment
through the implementation of skills development programmes.
TABLE 2.2: Summary of demographic information
0-14 Years Old 15-65 Years Old > 65 Years Old Total
294269 795393 62453 1152115
25.54% 69.04% 5.42% 100.00%
Source: StatsSA 2011 Census
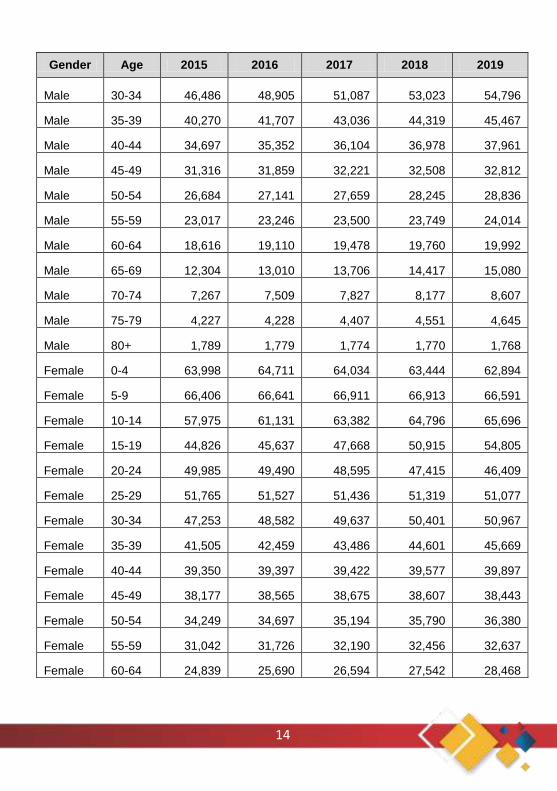
Table 3 illustrates the population growth trends in Nelson Mandela Bay. Census 2011 indicates that
the Eastern Cape as a province has a lower net migration rate than other provinces. Nelson Mandela
Bay has a growth rate of 1.36% (from 2001 to 2011), compared to other metropolitan areas, such as
Ekurhuleni (2.47%) and Tshwane (3.1%). The demographic trends of Nelson Mandela Bay (in Table
3) indicate a city with a steady population increase, which can be attributed to migration patterns,
birth and mortality rates.
Table 3: Projected population growth trends in Nelson Mandela Bay
Gender Age 2015 2016 2017 2018 2019
Male 0-4 65,526 66,135 65,341 64,706 64,181
Male 5-9 67,638 68,071 68,451 68,514 68,179
Male 10-14 58,649 61,899 64,257 65,807 66,890
Male 15-19 45,963 46,619 48,600 51,793 55,647
Male 20-24 52,519 52,105 51,246 50,013 48,877
Male 25-29 55,156 55,249 55,396 55,544 55,576
14
Gender Age 2015 2016 2017 2018 2019
Male 30-34 46,486 48,905 51,087 53,023 54,796
Male 35-39 40,270 41,707 43,036 44,319 45,467
Male 40-44 34,697 35,352 36,104 36,978 37,961
Male 45-49 31,316 31,859 32,221 32,508 32,812
Male 50-54 26,684 27,141 27,659 28,245 28,836
Male 55-59 23,017 23,246 23,500 23,749 24,014
Male 60-64 18,616 19,110 19,478 19,760 19,992
Male 65-69 12,304 13,010 13,706 14,417 15,080
Male 70-74 7,267 7,509 7,827 8,177 8,607
Male 75-79 4,227 4,228 4,407 4,551 4,645
Male 80+ 1,789 1,779 1,774 1,770 1,768
Female 0-4 63,998 64,711 64,034 63,444 62,894
Female 5-9 66,406 66,641 66,911 66,913 66,591
Female 10-14 57,975 61,131 63,382 64,796 65,696
Female 15-19 44,826 45,637 47,668 50,915 54,805
Female 20-24 49,985 49,490 48,595 47,415 46,409
Female 25-29 51,765 51,527 51,436 51,319 51,077
Female 30-34 47,253 48,582 49,637 50,401 50,967
Female 35-39 41,505 42,459 43,486 44,601 45,669
Female 40-44 39,350 39,397 39,422 39,577 39,897
Female 45-49 38,177 38,565 38,675 38,607 38,443
Female 50-54 34,249 34,697 35,194 35,790 36,380
Female 55-59 31,042 31,726 32,190 32,456 32,637
Female 60-64 24,839 25,690 26,594 27,542 28,468
15
Gender Age 2015 2016 2017 2018 2019
Female 65-69 19,035 19,768 20,508 21,236 21,963
Female 70-74 13,261 13,915 14,598 15,266 15,932
Female 75-79 7,972 8,440 9,021 9,604 10,178
Female 80+ 5,744 5,962 6,334 6,715 7,106
Total 1,229,504 1,252,263 1,271,776 1,290,470 1,308,440
Source: StatsSA (2015), StatsSA Mid-Year Population Estimates
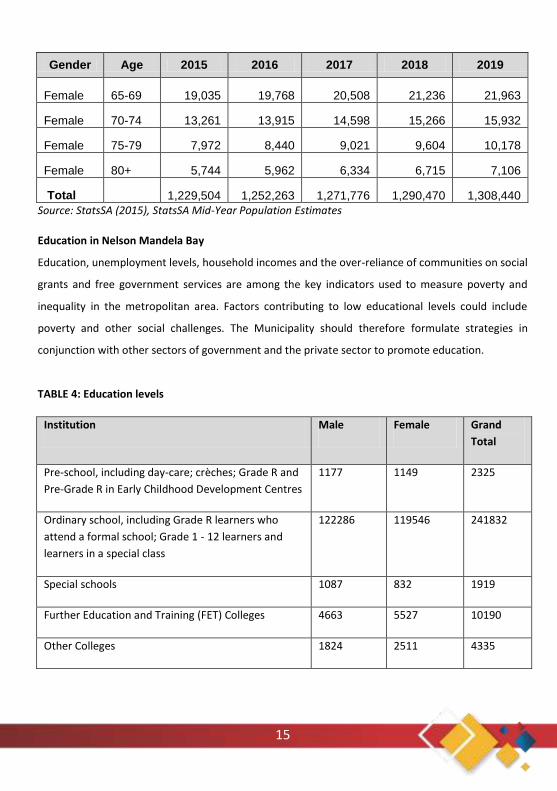
Education in Nelson Mandela Bay
Education, unemployment levels, household incomes and the over-reliance of communities on social
grants and free government services are among the key indicators used to measure poverty and
inequality in the metropolitan area. Factors contributing to low educational levels could include
poverty and other social challenges. The Municipality should therefore formulate strategies in
conjunction with other sectors of government and the private sector to promote education.
TABLE 4: Education levels
Institution Male Female Grand
Total
Pre-school, including day-care; crèches; Grade R and
Pre-Grade R in Early Childhood Development Centres
1177 1149 2325
Ordinary school, including Grade R learners who
attend a formal school; Grade 1 - 12 learners and
learners in a special class
122286 119546 241832
Special schools 1087 832 1919
Further Education and Training (FET) Colleges 4663 5527 10190
Other Colleges 1824 2511 4335
16
Higher Educational Institutions University/University
of Technology
11813 13691 25504
Adult Basic Education and Training Centres (ABET
Centres)
1564 1995 3559
Literacy classes, e.g. Kha Ri Gude; SANLI 277 395 672
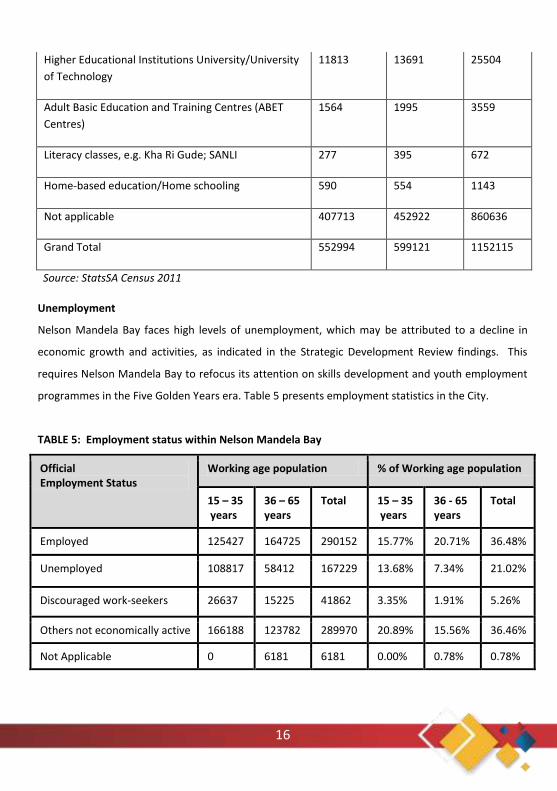
Home-based education/Home schooling 590 554 1143
Not applicable 407713 452922 860636
Grand Total 552994 599121 1152115
Source: StatsSA Census 2011
Unemployment
Nelson Mandela Bay faces high levels of unemployment, which may be attributed to a decline in
economic growth and activities, as indicated in the Strategic Development Review findings. This
requires Nelson Mandela Bay to refocus its attention on skills development and youth employment
programmes in the Five Golden Years era. Table 5 presents employment statistics in the City.
TABLE 5: Employment status within Nelson Mandela Bay
Official Employment Status
Working age population % of Working age population
15 – 35 years
36 – 65 years
Total 15 – 35 years
36 - 65 years
Total
Employed 125427 164725 290152 15.77% 20.71% 36.48%
Unemployed 108817 58412 167229 13.68% 7.34% 21.02%
Discouraged work-seekers 26637 15225 41862 3.35% 1.91% 5.26%
Others not economically active 166188 123782 289970 20.89% 15.56% 36.46%
Not Applicable 0 6181 6181 0.00% 0.78% 0.78%
17
Labour Total 427069 368325 795394 100.00% 100.00% 100.00%
Source: StatsSA Census 2011
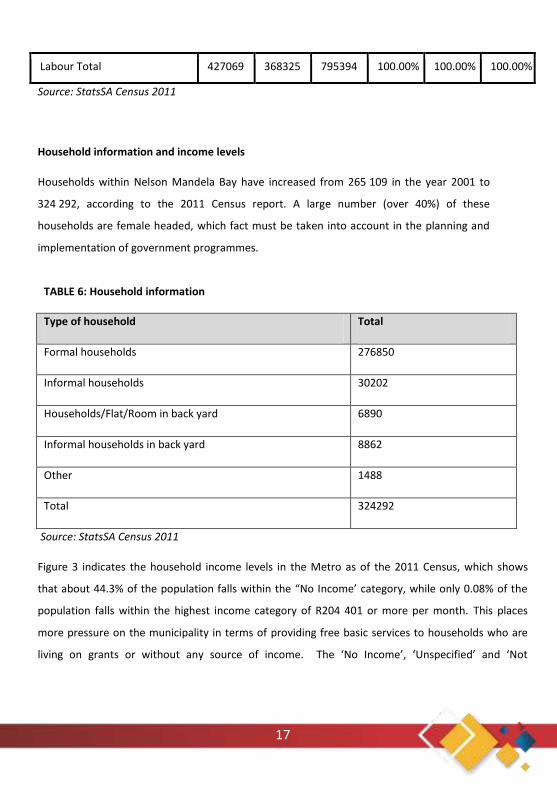
Household information and income levels
Households within Nelson Mandela Bay have increased from 265 109 in the year 2001 to
324 292, according to the 2011 Census report. A large number (over 40%) of these
households are female headed, which fact must be taken into account in the planning and
implementation of government programmes.
TABLE 6: Household information
Type of household Total
Formal households 276850
Informal households 30202
Households/Flat/Room in back yard 6890
Informal households in back yard 8862
Other 1488
Total 324292
Source: StatsSA Census 2011
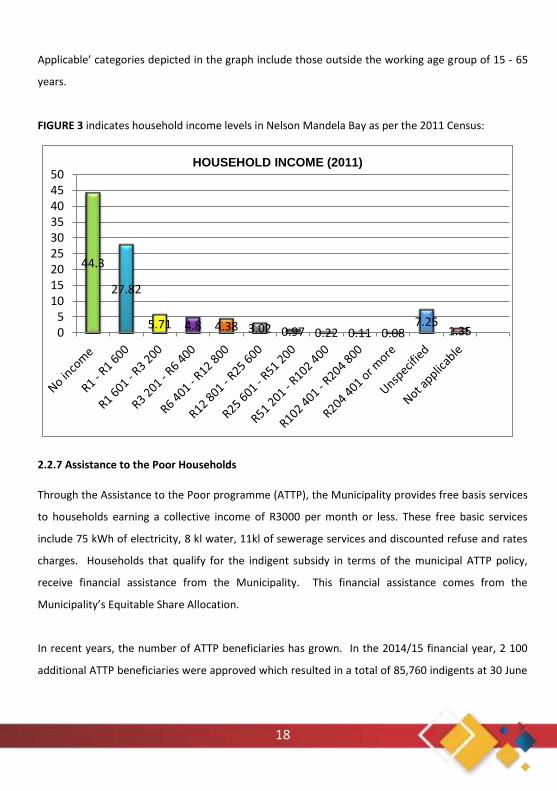
Figure 3 indicates the household income levels in the Metro as of the 2011 Census, which shows
that about 44.3% of the population falls within the “No Income’ category, while only 0.08% of the
population falls within the highest income category of R204 401 or more per month. This places
more pressure on the municipality in terms of providing free basic services to households who are
living on grants or without any source of income. The ‘No Income’, ‘Unspecified’ and ‘Not
18
Applicable’ categories depicted in the graph include those outside the working age group of 15 - 65
years.
FIGURE 3 indicates household income levels in Nelson Mandela Bay as per the 2011 Census:
44.3
27.82
5.71 4.8 4.38 3.02 0.97 0.22 0.11 0.087.25
1.3505
101520253035404550
HOUSEHOLD INCOME (2011)
2.2.7 Assistance to the Poor Households
Through the Assistance to the Poor programme (ATTP), the Municipality provides free basis services
to households earning a collective income of R3000 per month or less. These free basic services
include 75 kWh of electricity, 8 kl water, 11kl of sewerage services and discounted refuse and rates
charges. Households that qualify for the indigent subsidy in terms of the municipal ATTP policy,
receive financial assistance from the Municipality. This financial assistance comes from the
Municipality’s Equitable Share Allocation.
In recent years, the number of ATTP beneficiaries has grown. In the 2014/15 financial year, 2 100
additional ATTP beneficiaries were approved which resulted in a total of 85,760 indigents at 30 June
19
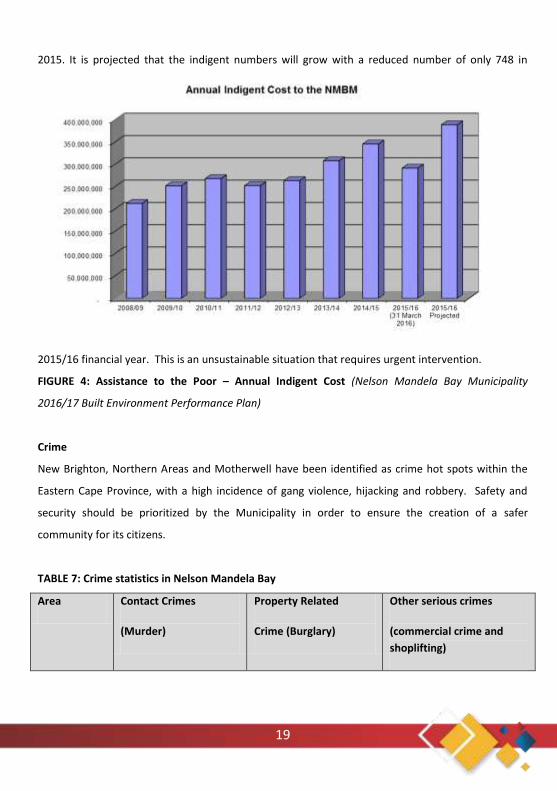
2015. It is projected that the indigent numbers will grow with a reduced number of only 748 in
2015/16 financial year. This is an unsustainable situation that requires urgent intervention.
FIGURE 4: Assistance to the Poor – Annual Indigent Cost (Nelson Mandela Bay Municipality
2016/17 Built Environment Performance Plan)
Crime
New Brighton, Northern Areas and Motherwell have been identified as crime hot spots within the
Eastern Cape Province, with a high incidence of gang violence, hijacking and robbery. Safety and
security should be prioritized by the Municipality in order to ensure the creation of a safer
community for its citizens.
TABLE 7: Crime statistics in Nelson Mandela Bay
Area Contact Crimes
(Murder)
Property Related
Crime (Burglary)
Other serious crimes
(commercial crime and
shoplifting)
20
2012/13 2013/14 2012/13 2013/14 2012/13 2013/14
Motherwell 260 286 2 203 2 183 2 372 2 503
Mount Road 181 201 6 176 5 475 9 271 9 338
Uitenhage 76 65 1 286 1 279 1 722 1 835
Source: Crime figures for the NMB areas as per the 2013/14 SAPS Statistics
Health
The number of people with HIV has declined. However, the Municipality must remain vigilant,
because South Africa still has one of the highest per capita HIV prevalence and infection rates and is
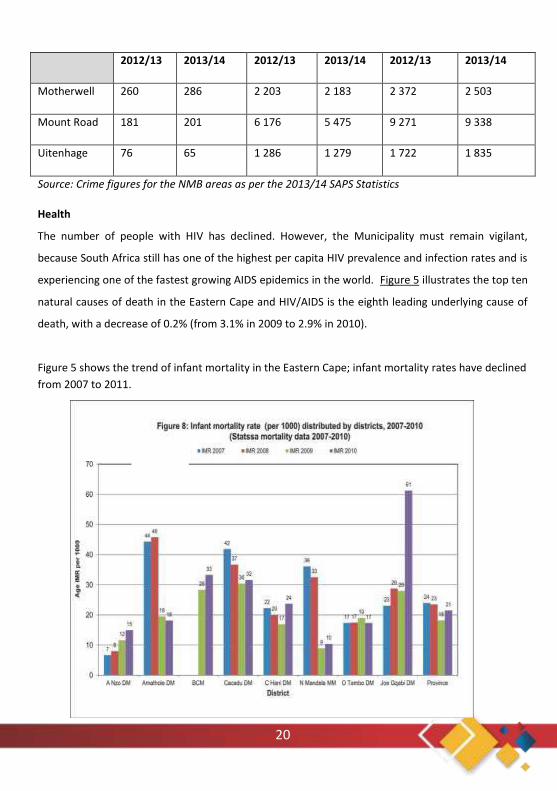
experiencing one of the fastest growing AIDS epidemics in the world. Figure 5 illustrates the top ten
natural causes of death in the Eastern Cape and HIV/AIDS is the eighth leading underlying cause of
death, with a decrease of 0.2% (from 3.1% in 2009 to 2.9% in 2010).
Figure 5 shows the trend of infant mortality in the Eastern Cape; infant mortality rates have declined
from 2007 to 2011.
21
FIGURE 2.9: Infant mortality rate (per 1000) (Eastern Cape Department of Health – Annual Report
2012/13
STATE OF SERVICE DELIVERY IN NELSON MANDELA BAY
Access to water
Access to potable water supply is as follows:
- 100% of households have access to water within a 200 m radius.
- Informal areas receive water through standpipes (within a 200 m radius) and water tanks,
except for communities occupying private land illegally.
The main challenges with water supply within the Municipality are water losses and scarcity of water
in the Municipality which serve as a threat to sustainable water supply for the residents. The
Municipality continues to invest in infrastructure that may unlock water potential to address water
scarcity in the Municipality.
The Municipality has amongst others achieved the following in its attempt to ensure sustainable
water provision to its residents:
- Provision of basic water (access within a 200 m walking distance) to all citizens within the
urban edge;
- Installation of bulk water pipelines to link up the developments in support of the Housing
Programme;
- Construction of reservoirs (Chatty and KwaNobuhle);
- Completion of Phase 1 of the construction of the Nooitgedagt Coega Low Level Scheme
(Phase 2 has also commenced);
Access to Sanitation
- 92% of households are connected to sanitation;
22
- 20 900 buckets are still in circulation as a means of sanitation. This number continues to
decline as a result of the Municipality’s effort to formalize informal settlements and the
provision of state subsidized houses.
The main challenge with the provision of basic sanitation in the Municipality is limited financial
resources to eradicate buckets and infrastructure backlogs. The Municipality has amongst others
achieved the following in its attempt to ensure the provision of basic sanitation to its residents:
- Provision of basic sanitation through the elimination of buckets ;
- Installation of bulk sewer pipelines to link up the developments in support of the Housing
Programme (Chatty, Missionvale and Rosedale);
- Upgrading of the Despatch Wastewater Treatment Works to accept sewage from Joe
Slovo;
Public health
- 99, 99% of formal and informal households are provided with a basic level of refuse
collection (this excludes smallholdings).
Illegal dumping, especially in public open spaces and privately-owned deserted buildings, poses a
challenge in ensuring a clean environment in the Municipality.
The Municipality has amongst others achieved the following through its efforts to ensure effective
waste management:
- Construction of the Groenkloof Education Centre
- Working for the Coast Project employing EPWP Principles
- Refurbishing and Upgrading the Shark Rock Pier
- Upgrading and development of the Public Open Space
- Upgrade of the greenhouses
Access to electricity
- 100% of households in formally demarcated residential areas have access to electricity.
23
- 12% of households have no electricity, including in undemarcated informal areas.
Illegal electricity connections and increased electricity losses continue to threaten sustainable
electricity provision in the Municipality. The Municipality has connected 13 109 erven to electricity
over the past years.
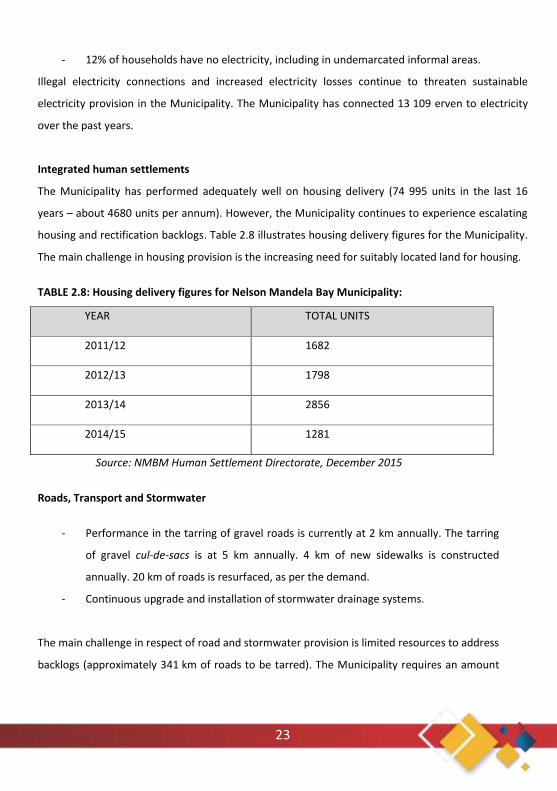
Integrated human settlements
The Municipality has performed adequately well on housing delivery (74 995 units in the last 16
years – about 4680 units per annum). However, the Municipality continues to experience escalating
housing and rectification backlogs. Table 2.8 illustrates housing delivery figures for the Municipality.
The main challenge in housing provision is the increasing need for suitably located land for housing.
TABLE 2.8: Housing delivery figures for Nelson Mandela Bay Municipality:
YEAR TOTAL UNITS
2011/12 1682
2012/13 1798
2013/14 2856
2014/15 1281
Source: NMBM Human Settlement Directorate, December 2015
Roads, Transport and Stormwater
- Performance in the tarring of gravel roads is currently at 2 km annually. The tarring
of gravel cul-de-sacs is at 5 km annually. 4 km of new sidewalks is constructed
annually. 20 km of roads is resurfaced, as per the demand.
- Continuous upgrade and installation of stormwater drainage systems.
The main challenge in respect of road and stormwater provision is limited resources to address
backlogs (approximately 341 km of roads to be tarred). The Municipality requires an amount
24
of approximately R2.5 billion to address this backlog. There is also a shortage of stormwater
drainage in disadvantaged wards, especially in newly developed areas.
The Municipality has achieved the following in terms of road and stormwater provision and
transportation:
- 62.67 km of gravel roads tarred
- 12.41 km of stormwater drainage system installed
- Completion of roadworks infrastructure for the Phase 1 Cleary Park contract area
- Five vehicle operating companies have been established by the mini-bus taxi
operators from the ten mini-bus taxi associations in Nelson Mandela Bay
- Completion of Uitenhage terminus Phase 1.
ASSET MANAGEMENT
Asset management is central to service delivery. When assets are managed properly,
operational and replacement costs are significantly reduced. If assets are not properly
maintained, service disruptions may occur. The Financial Asset Register (FAR) of the
Municipality consists of immovable and immovable assets.
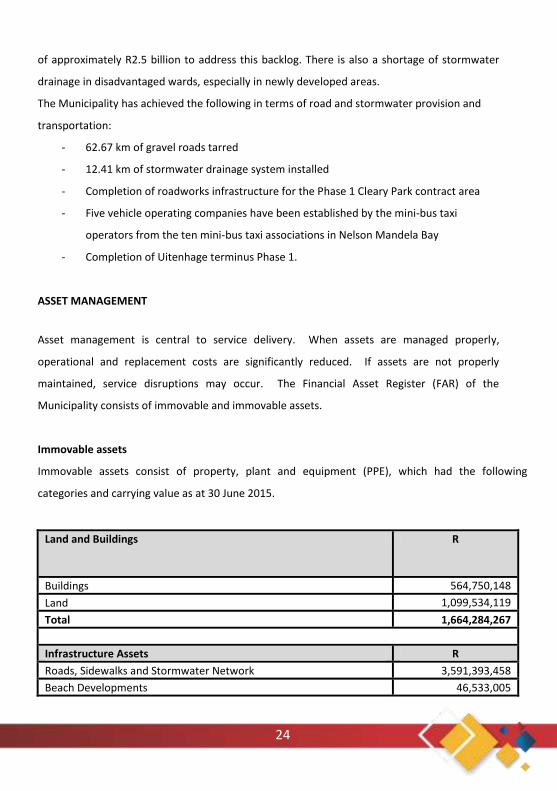
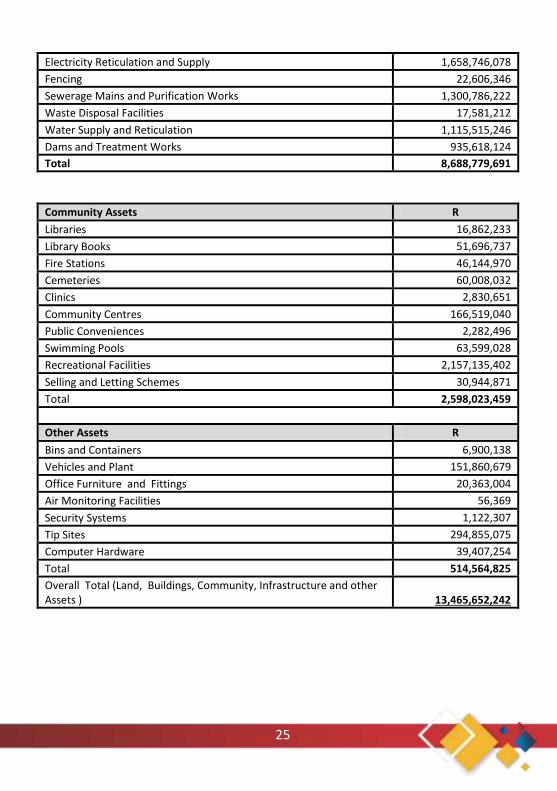
Immovable assets
Immovable assets consist of property, plant and equipment (PPE), which had the following
categories and carrying value as at 30 June 2015.
Land and Buildings R
Buildings 564,750,148
Land 1,099,534,119
Total 1,664,284,267
Infrastructure Assets R
Roads, Sidewalks and Stormwater Network 3,591,393,458
Beach Developments 46,533,005
25
Electricity Reticulation and Supply 1,658,746,078
Fencing 22,606,346
Sewerage Mains and Purification Works 1,300,786,222
Waste Disposal Facilities 17,581,212
Water Supply and Reticulation 1,115,515,246
Dams and Treatment Works 935,618,124
Total 8,688,779,691
Community Assets R
Libraries 16,862,233
Library Books 51,696,737
Fire Stations 46,144,970
Cemeteries 60,008,032
Clinics 2,830,651
Community Centres 166,519,040
Public Conveniences 2,282,496
Swimming Pools 63,599,028
Recreational Facilities 2,157,135,402
Selling and Letting Schemes 30,944,871
Total 2,598,023,459
Other Assets R
Bins and Containers 6,900,138
Vehicles and Plant 151,860,679
Office Furniture and Fittings 20,363,004
Air Monitoring Facilities 56,369
Security Systems 1,122,307
Tip Sites 294,855,075
Computer Hardware 39,407,254
Total 514,564,825
Overall Total (Land, Buildings, Community, Infrastructure and other Assets ) 13,465,652,242
26
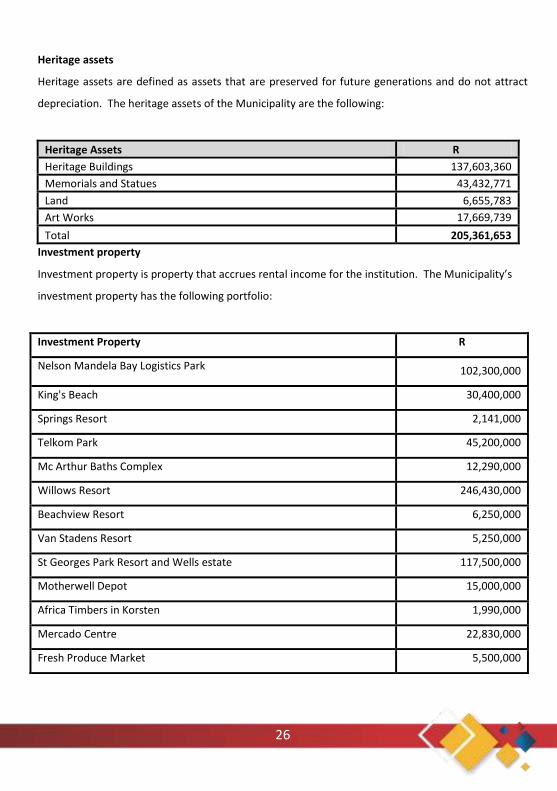
Heritage assets
Heritage assets are defined as assets that are preserved for future generations and do not attract
depreciation. The heritage assets of the Municipality are the following:
Heritage Assets R
Heritage Buildings 137,603,360
Memorials and Statues 43,432,771
Land 6,655,783
Art Works 17,669,739
Total 205,361,653
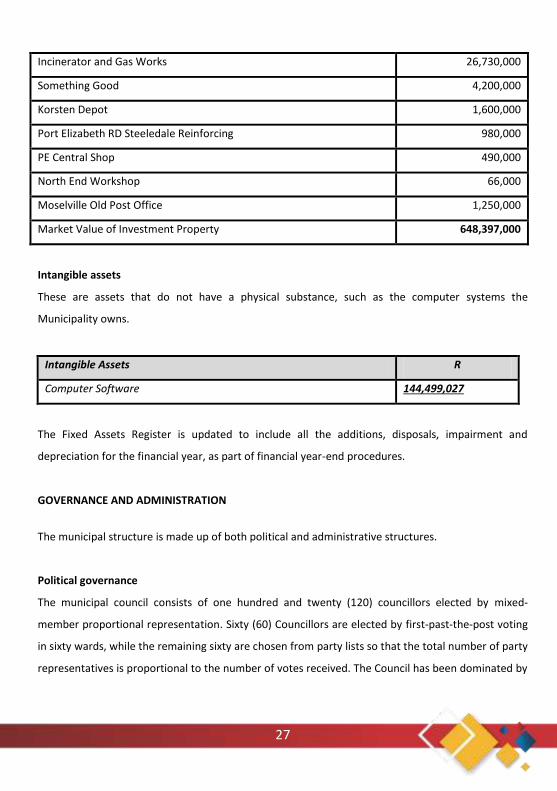
Investment property
Investment property is property that accrues rental income for the institution. The Municipality’s
investment property has the following portfolio:
Investment Property R
Nelson Mandela Bay Logistics Park 102,300,000
King's Beach 30,400,000
Springs Resort 2,141,000
Telkom Park 45,200,000
Mc Arthur Baths Complex 12,290,000
Willows Resort 246,430,000
Beachview Resort 6,250,000
Van Stadens Resort 5,250,000
St Georges Park Resort and Wells estate 117,500,000
Motherwell Depot 15,000,000
Africa Timbers in Korsten 1,990,000
Mercado Centre 22,830,000
Fresh Produce Market 5,500,000
27
Incinerator and Gas Works 26,730,000
Something Good 4,200,000
Korsten Depot 1,600,000
Port Elizabeth RD Steeledale Reinforcing 980,000
PE Central Shop 490,000
North End Workshop 66,000
Moselville Old Post Office 1,250,000
Market Value of Investment Property 648,397,000
Intangible assets
These are assets that do not have a physical substance, such as the computer systems the
Municipality owns.
Intangible Assets R
Computer Software 144,499,027
The Fixed Assets Register is updated to include all the additions, disposals, impairment and
depreciation for the financial year, as part of financial year-end procedures.
GOVERNANCE AND ADMINISTRATION
The municipal structure is made up of both political and administrative structures.
Political governance
The municipal council consists of one hundred and twenty (120) councillors elected by mixed-
member proportional representation. Sixty (60) Councillors are elected by first-past-the-post voting
in sixty wards, while the remaining sixty are chosen from party lists so that the total number of party
representatives is proportional to the number of votes received. The Council has been dominated by
28
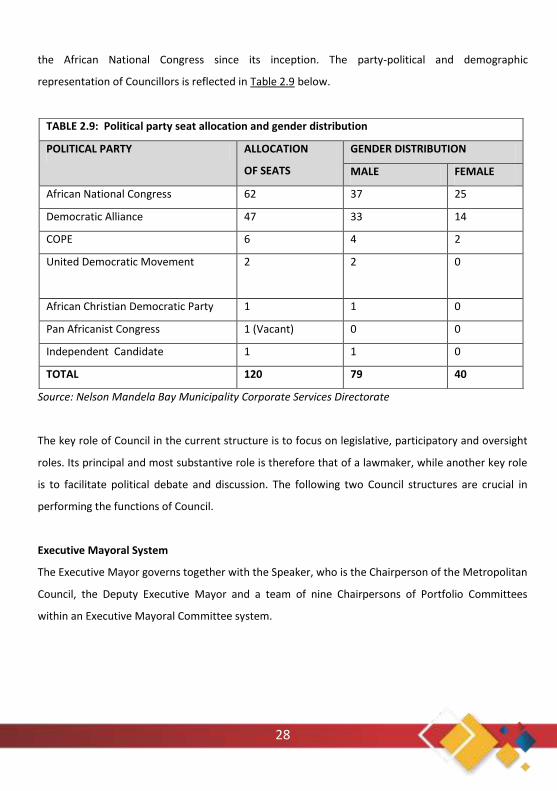
the African National Congress since its inception. The party-political and demographic
representation of Councillors is reflected in Table 2.9 below.
Source: Nelson Mandela Bay Municipality Corporate Services Directorate
The key role of Council in the current structure is to focus on legislative, participatory and oversight
roles. Its principal and most substantive role is therefore that of a lawmaker, while another key role
is to facilitate political debate and discussion. The following two Council structures are crucial in
performing the functions of Council.
Executive Mayoral System
The Executive Mayor governs together with the Speaker, who is the Chairperson of the Metropolitan
Council, the Deputy Executive Mayor and a team of nine Chairpersons of Portfolio Committees
within an Executive Mayoral Committee system.
TABLE 2.9: Political party seat allocation and gender distribution
POLITICAL PARTY ALLOCATION
OF SEATS
GENDER DISTRIBUTION
MALE FEMALE
African National Congress 62 37 25
Democratic Alliance 47 33 14
COPE 6 4 2
United Democratic Movement 2 2 0
African Christian Democratic Party 1 1 0
Pan Africanist Congress 1 (Vacant) 0 0
Independent Candidate 1 1 0
TOTAL 120 79 40
29
Planning and Public Participation
The Constitution of the Republic of South Africa, Act 108 of 1996, places an obligation on
municipalities to encourage the involvement of communities and community organisations in the
matters of local government. With the promulgation of the Municipal Systems Act, 32 of 2000, the
attention of municipalities was focused on the need to encourage the involvement of communities
in their own affairs. Through public participation, the Municipality is able to make development
plans and render services that are more relevant to the needs and conditions of local communities.
Invitations to communities and all stakeholders to attend the Municipality’s public participation
meetings on the IDP and Budget were communicated in time by means of:
Advertisements in local newspapers and the Municipality’s newsletter;
Flyers;
Posters in all wards;
Broadcasting on two regional radio stations; and
Loudhailing.
NELSON MANDELA BAY MUNICIPALITY’S IDP ROLEPLAYERS AND STAKEHOLDERS
The following role-players and stakeholders guide the IDP and Budget development and review
processes of the Municipality:
a) Councillors
b) Communities of Nelson Mandela Bay
c) Organised stakeholder groupings, e.g. chambers of commerce; NGOs; civic groupings;
municipal unions; and ratepayers associations.
d) Institutions of higher learning; government sector departments, surrounding
municipalities and parastatals
e) Special Sectors (youth, women, elderly people and people with disabilities).
f) Municipal Councillors and officials.
g) Ward Committees.
30
NELSON MANDELA BAY MUNICIPALITY’S KEY PRIORITIES AND PROJECTS
• Skills development programmes for unemployed youth.
• Getting the old age homes back onto a stable operating platform.
• Getting the Metro Police Services fully operational.
• Enhance the Municipalities Revenue database in order to ensure a surplus budget with
sound cash backing.
• Revising the Assistance to the Poor application process, so that it is simpler and faster.
• Strengthening Strategic Partnerships essential for investment and growth in the City with
SOE’s, business and academia (i.e Coega IDZ, Nelson Mandela Metropolitan University,
Business Chamber and Trade Unions etc)
• Investment attraction and the diversification of the economy in the Metro (Harnessing the
Automotive sector, development of a Blue Oceans Economy, Creative Industries, Urban
Agriculture and the Township economy)
• Increasing the number of vending stations [at safe sites] in the NMBM.
• Development of an organisational structure aligned to the IDP;
• Provision of integrated ICT Support including Wifi, broadband roll out to whole metro;
• Integrated lease management for municipal properties;
• Implement staff performance management;
• Improve public participation in NMB programmes;
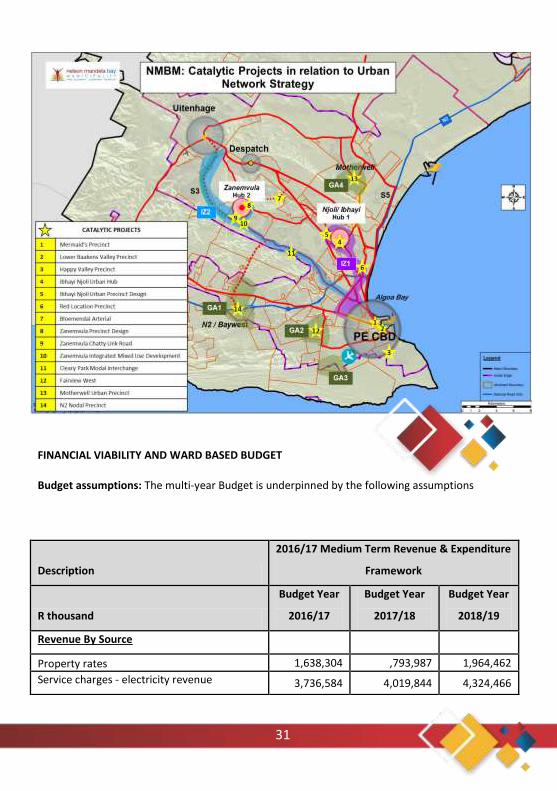
The following diagram shows all the Catalytic projects essential for economic growth and sustainable
development in the City;
31
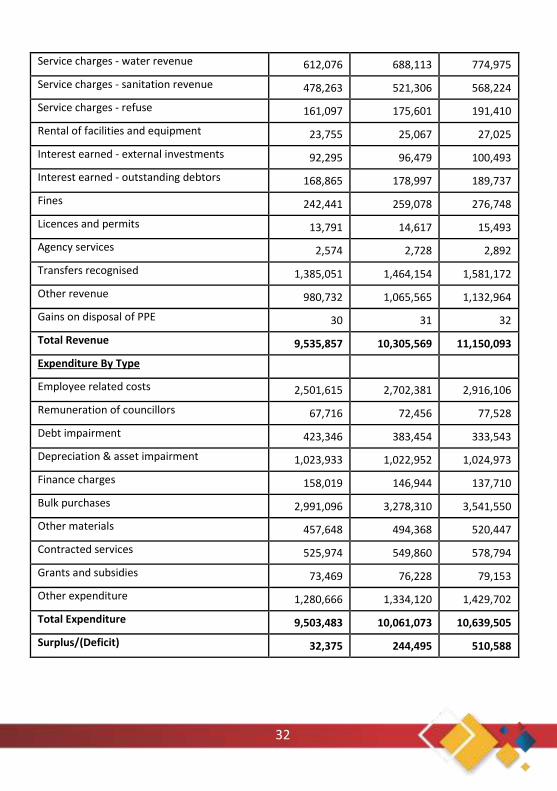
FINANCIAL VIABILITY AND WARD BASED BUDGET
Budget assumptions: The multi-year Budget is underpinned by the following assumptions
Description
2016/17 Medium Term Revenue & Expenditure
Framework
R thousand
Budget Year
2016/17
Budget Year
2017/18
Budget Year
2018/19
Revenue By Source
Property rates 1,638,304 ,793,987 1,964,462
Service charges - electricity revenue 3,736,584 4,019,844 4,324,466
32
Service charges - water revenue 612,076 688,113 774,975
Service charges - sanitation revenue 478,263 521,306 568,224
Service charges - refuse 161,097 175,601 191,410
Rental of facilities and equipment 23,755 25,067 27,025
Interest earned - external investments 92,295 96,479 100,493
Interest earned - outstanding debtors 168,865 178,997 189,737
Fines 242,441 259,078 276,748
Licences and permits 13,791 14,617 15,493
Agency services 2,574 2,728 2,892
Transfers recognised 1,385,051 1,464,154 1,581,172
Other revenue 980,732 1,065,565 1,132,964
Gains on disposal of PPE 30 31 32
Total Revenue 9,535,857 10,305,569 11,150,093
Expenditure By Type
Employee related costs 2,501,615 2,702,381 2,916,106
Remuneration of councillors 67,716 72,456 77,528
Debt impairment 423,346 383,454 333,543
Depreciation & asset impairment 1,023,933 1,022,952 1,024,973
Finance charges 158,019 146,944 137,710
Bulk purchases 2,991,096 3,278,310 3,541,550
Other materials 457,648 494,368 520,447
Contracted services 525,974 549,860 578,794
Grants and subsidies 73,469 76,228 79,153
Other expenditure 1,280,666 1,334,120 1,429,702
Total Expenditure 9,503,483 10,061,073 10,639,505
Surplus/(Deficit) 32,375 244,495 510,588
33
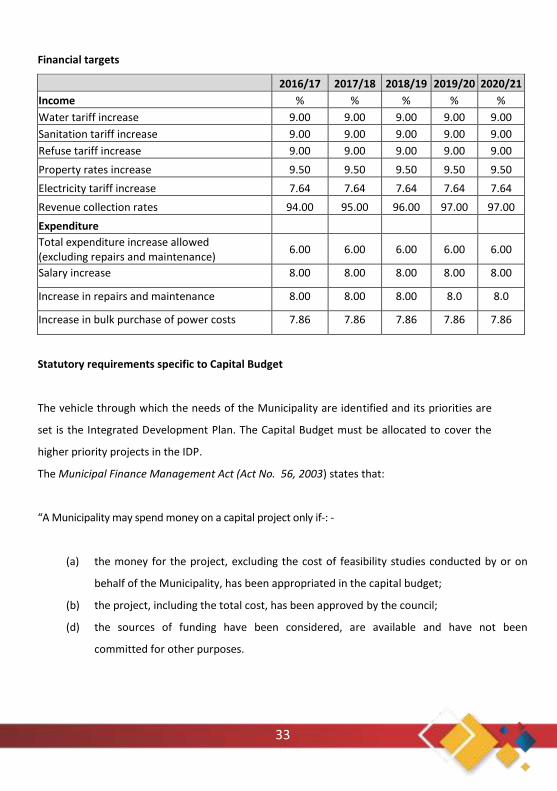
Financial targets
2016/17 2017/18 2018/19 2019/20 2020/21
Income % % % % %
Water tariff increase 9.00 9.00 9.00 9.00 9.00
Sanitation tariff increase 9.00 9.00 9.00 9.00 9.00
Refuse tariff increase 9.00 9.00 9.00 9.00 9.00
Property rates increase 9.50 9.50 9.50 9.50 9.50
Electricity tariff increase 7.64 7.64 7.64 7.64 7.64
Revenue collection rates 94.00 95.00 96.00 97.00 97.00
Expenditure
Total expenditure increase allowed (excluding repairs and maintenance)
6.00 6.00 6.00 6.00 6.00
Salary increase 8.00 8.00 8.00 8.00 8.00
Increase in repairs and maintenance 8.00 8.00 8.00 8.0 8.0
Increase in bulk purchase of power costs 7.86 7.86 7.86 7.86 7.86
Statutory requirements specific to Capital Budget
The vehicle through which the needs of the Municipality are identified and its priorities are
set is the Integrated Development Plan. The Capital Budget must be allocated to cover the
higher priority projects in the IDP.
The Municipal Finance Management Act (Act No. 56, 2003) states that:
“A Municipality may spend money on a capital project only if-: -
(a) the money for the project, excluding the cost of feasibility studies conducted by or on
behalf of the Municipality, has been appropriated in the capital budget;
(b) the project, including the total cost, has been approved by the council;
(d) the sources of funding have been considered, are available and have not been
committed for other purposes.
34
Before approving a capital project in terms of Section 19 (1) (b), the council of a municipality must
consider-
(a) the project cost covering all financial years until the project is operational; and
35
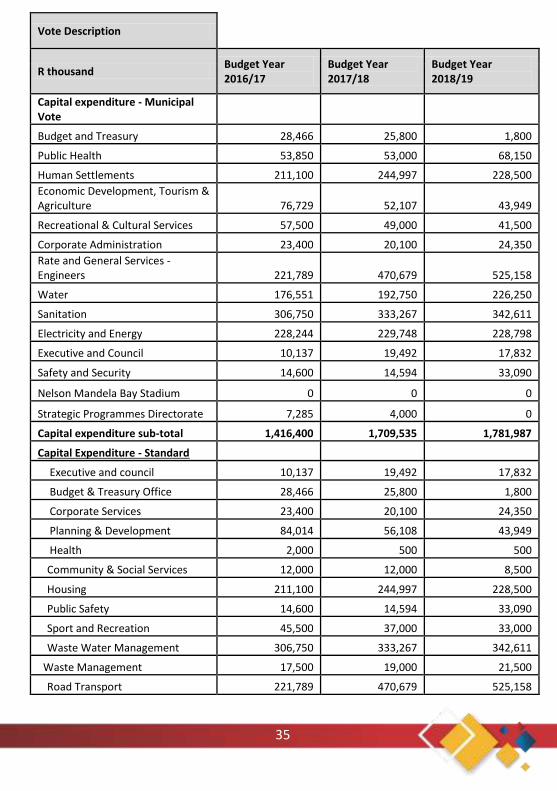
Vote Description
R thousand Budget Year 2016/17
Budget Year 2017/18
Budget Year 2018/19
Capital expenditure - Municipal Vote
Budget and Treasury 28,466 25,800 1,800
Public Health 53,850 53,000 68,150
Human Settlements 211,100 244,997 228,500
Economic Development, Tourism & Agriculture 76,729 52,107 43,949
Recreational & Cultural Services 57,500 49,000 41,500
Corporate Administration 23,400 20,100 24,350
Rate and General Services - Engineers 221,789 470,679 525,158
Water 176,551 192,750 226,250
Sanitation 306,750 333,267 342,611
Electricity and Energy 228,244 229,748 228,798
Executive and Council 10,137 19,492 17,832
Safety and Security 14,600 14,594 33,090
Nelson Mandela Bay Stadium 0 0 0
Strategic Programmes Directorate 7,285 4,000 0
Capital expenditure sub-total 1,416,400 1,709,535 1,781,987
Capital Expenditure - Standard
Executive and council 10,137 19,492 17,832
Budget & Treasury Office 28,466 25,800 1,800
Corporate Services 23,400 20,100 24,350
Planning & Development 84,014 56,108 43,949
Health 2,000 500 500
Community & Social Services 12,000 12,000 8,500
Housing 211,100 244,997 228,500
Public Safety 14,600 14,594 33,090
Sport and Recreation 45,500 37,000 33,000
Waste Water Management 306,750 333,267 342,611
Waste Management 17,500 19,000 21,500
Road Transport 221,789 470,679 525,158
36
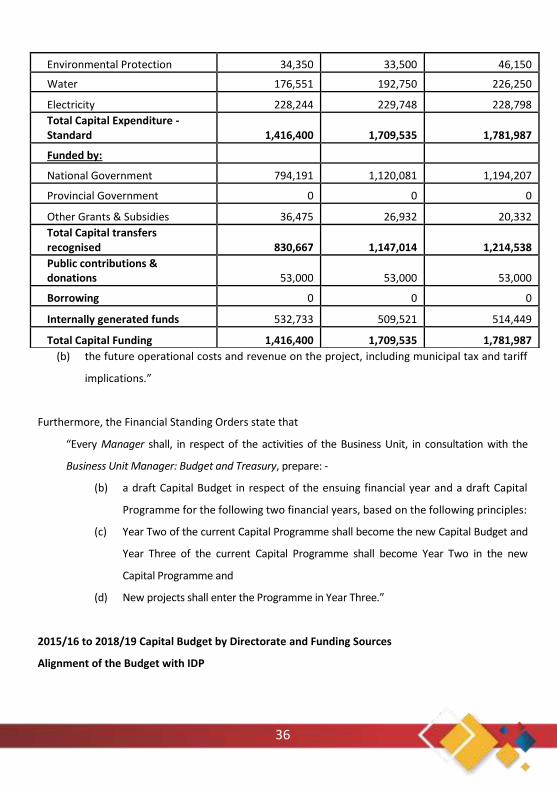
(b) the future operational costs and revenue on the project, including municipal tax and tariff
implications.”
Furthermore, the Financial Standing Orders state that
“Every Manager shall, in respect of the activities of the Business Unit, in consultation with the
Business Unit Manager: Budget and Treasury, prepare: -
(b) a draft Capital Budget in respect of the ensuing financial year and a draft Capital
Programme for the following two financial years, based on the following principles:
(c) Year Two of the current Capital Programme shall become the new Capital Budget and
Year Three of the current Capital Programme shall become Year Two in the new
Capital Programme and
(d) New projects shall enter the Programme in Year Three.”
2015/16 to 2018/19 Capital Budget by Directorate and Funding Sources
Alignment of the Budget with IDP
Environmental Protection 34,350 33,500 46,150
Water 176,551 192,750 226,250
Electricity 228,244 229,748 228,798
Total Capital Expenditure - Standard 1,416,400 1,709,535 1,781,987
Funded by:
National Government 794,191 1,120,081 1,194,207
Provincial Government 0 0 0
Other Grants & Subsidies 36,475 26,932 20,332
Total Capital transfers recognised 830,667 1,147,014 1,214,538
Public contributions & donations 53,000 53,000 53,000
Borrowing 0 0 0
Internally generated funds 532,733 509,521 514,449
Total Capital Funding 1,416,400 1,709,535 1,781,987
37
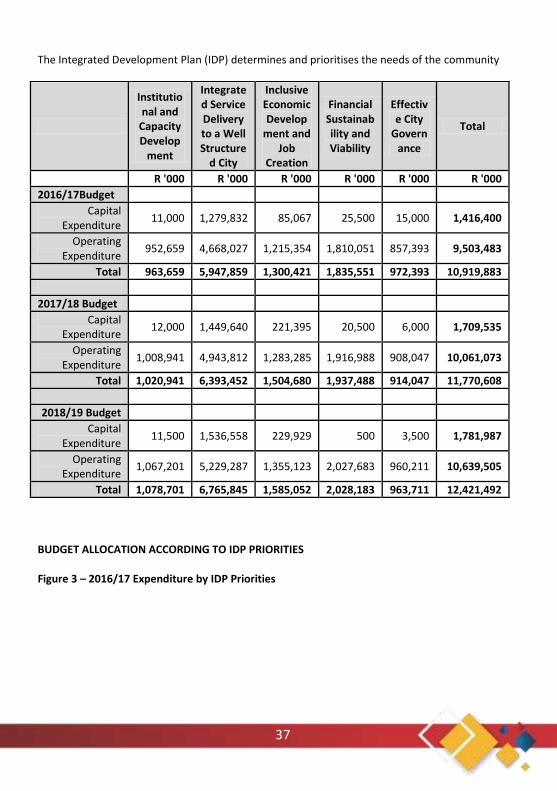
The Integrated Development Plan (IDP) determines and prioritises the needs of the community
BUDGET ALLOCATION ACCORDING TO IDP PRIORITIES
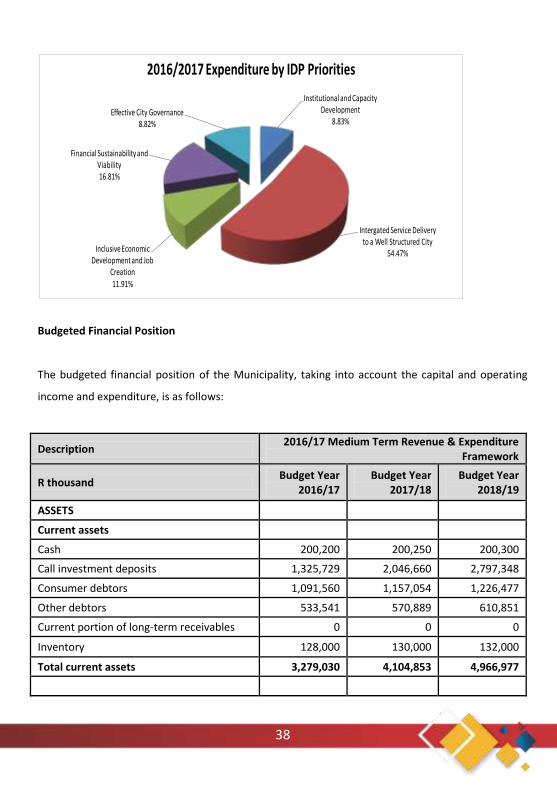
Figure 3 – 2016/17 Expenditure by IDP Priorities
Institutional and
Capacity Develop
ment
Integrated Service Delivery to a Well Structure
d City
Inclusive Economic Develop
ment and Job
Creation
Financial Sustainability and Viability
Effective City
Governance
Total
R '000 R '000 R '000 R '000 R '000 R '000
2016/17Budget
Capital Expenditure
11,000 1,279,832 85,067 25,500 15,000 1,416,400
Operating Expenditure
952,659 4,668,027 1,215,354 1,810,051 857,393 9,503,483
Total 963,659 5,947,859 1,300,421 1,835,551 972,393 10,919,883
2017/18 Budget
Capital Expenditure
12,000 1,449,640 221,395 20,500 6,000 1,709,535
Operating Expenditure
1,008,941 4,943,812 1,283,285 1,916,988 908,047 10,061,073
Total 1,020,941 6,393,452 1,504,680 1,937,488 914,047 11,770,608
2018/19 Budget
Capital Expenditure
11,500 1,536,558 229,929 500 3,500 1,781,987
Operating Expenditure
1,067,201 5,229,287 1,355,123 2,027,683 960,211 10,639,505
Total 1,078,701 6,765,845 1,585,052 2,028,183 963,711 12,421,492
38
Institutional and Capacity Development
8.83%
Intergated Service Delivery to a Well Structured City
54.47%Inclusive Economic Development and Job
Creation11.91%
Financial Sustainability and Viability16.81%
Effective City Governance8.82%
2016/2017 Expenditure by IDP Priorities
Budgeted Financial Position
The budgeted financial position of the Municipality, taking into account the capital and operating
income and expenditure, is as follows:
Description 2016/17 Medium Term Revenue & Expenditure
Framework
R thousand Budget Year
2016/17 Budget Year
2017/18 Budget Year
2018/19
ASSETS
Current assets
Cash 200,200 200,250 200,300
Call investment deposits 1,325,729 2,046,660 2,797,348
Consumer debtors 1,091,560 1,157,054 1,226,477
Other debtors 533,541 570,889 610,851
Current portion of long-term receivables 0 0 0
Inventory 128,000 130,000 132,000
Total current assets 3,279,030 4,104,853 4,966,977
39
Description 2016/17 Medium Term Revenue & Expenditure
Framework
R thousand Budget Year
2016/17 Budget Year
2017/18 Budget Year
2018/19
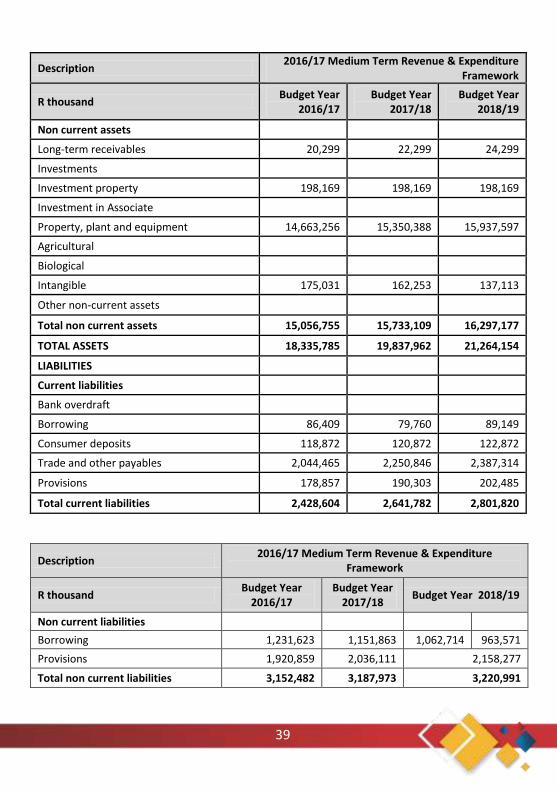
Non current assets
Long-term receivables 20,299 22,299 24,299
Investments
Investment property 198,169 198,169 198,169
Investment in Associate
Property, plant and equipment 14,663,256 15,350,388 15,937,597
Agricultural
Biological
Intangible 175,031 162,253 137,113
Other non-current assets
Total non current assets 15,056,755 15,733,109 16,297,177
TOTAL ASSETS 18,335,785 19,837,962 21,264,154
LIABILITIES
Current liabilities
Bank overdraft
Borrowing 86,409 79,760 89,149
Consumer deposits 118,872 120,872 122,872
Trade and other payables 2,044,465 2,250,846 2,387,314
Provisions 178,857 190,303 202,485
Total current liabilities 2,428,604 2,641,782 2,801,820
Description 2016/17 Medium Term Revenue & Expenditure
Framework
R thousand Budget Year
2016/17 Budget Year
2017/18 Budget Year 2018/19
Non current liabilities
Borrowing 1,231,623 1,151,863 1,062,714 963,571
Provisions 1,920,859 2,036,111 2,158,277
Total non current liabilities 3,152,482 3,187,973 3,220,991
40
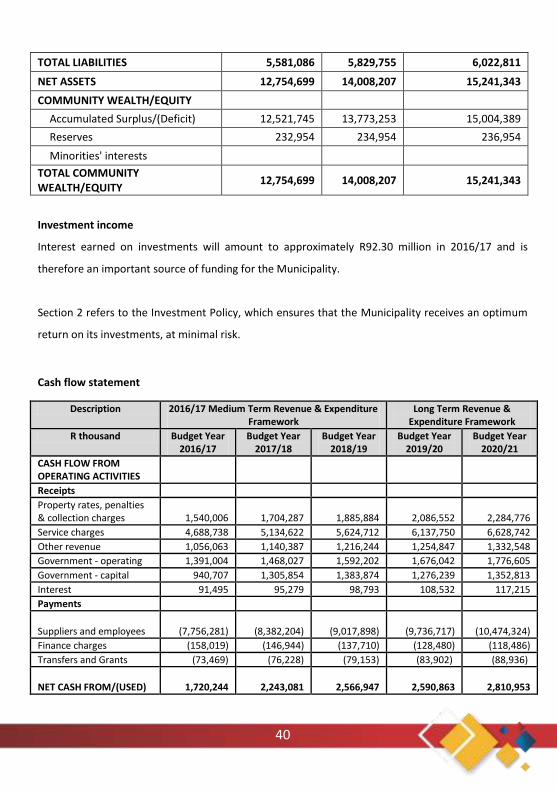
TOTAL LIABILITIES 5,581,086 5,829,755 6,022,811
NET ASSETS 12,754,699 14,008,207 15,241,343
COMMUNITY WEALTH/EQUITY
Accumulated Surplus/(Deficit) 12,521,745 13,773,253 15,004,389
Reserves 232,954 234,954 236,954
Minorities' interests
TOTAL COMMUNITY WEALTH/EQUITY
12,754,699 14,008,207 15,241,343
Investment income
Interest earned on investments will amount to approximately R92.30 million in 2016/17 and is
therefore an important source of funding for the Municipality.
Section 2 refers to the Investment Policy, which ensures that the Municipality receives an optimum
return on its investments, at minimal risk.
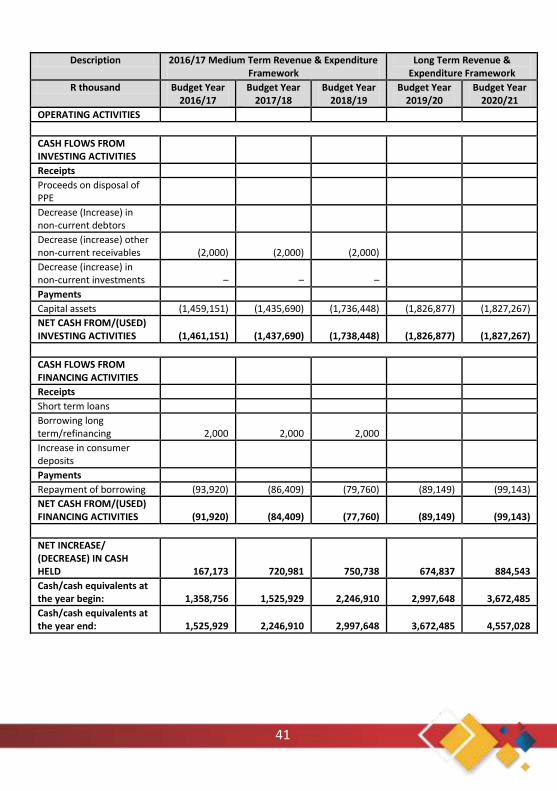
Cash flow statement
Description 2016/17 Medium Term Revenue & Expenditure Framework
Long Term Revenue & Expenditure Framework
R thousand Budget Year 2016/17
Budget Year 2017/18
Budget Year 2018/19
Budget Year 2019/20
Budget Year 2020/21
CASH FLOW FROM OPERATING ACTIVITIES
Receipts
Property rates, penalties & collection charges 1,540,006 1,704,287 1,885,884 2,086,552 2,284,776
Service charges 4,688,738 5,134,622 5,624,712 6,137,750 6,628,742
Other revenue 1,056,063 1,140,387 1,216,244 1,254,847 1,332,548
Government - operating 1,391,004 1,468,027 1,592,202 1,676,042 1,776,605
Government - capital 940,707 1,305,854 1,383,874 1,276,239 1,352,813
Interest 91,495 95,279 98,793 108,532 117,215
Payments
Suppliers and employees (7,756,281) (8,382,204) (9,017,898) (9,736,717)
(10,474,324)
Finance charges (158,019) (146,944) (137,710) (128,480) (118,486)
Transfers and Grants (73,469) (76,228) (79,153) (83,902) (88,936)
NET CASH FROM/(USED) 1,720,244 2,243,081 2,566,947 2,590,863 2,810,953
41
Description 2016/17 Medium Term Revenue & Expenditure Framework
Long Term Revenue & Expenditure Framework
R thousand Budget Year 2016/17
Budget Year 2017/18
Budget Year 2018/19
Budget Year 2019/20
Budget Year 2020/21
OPERATING ACTIVITIES
CASH FLOWS FROM INVESTING ACTIVITIES
Receipts
Proceeds on disposal of PPE
Decrease (Increase) in non-current debtors
Decrease (increase) other non-current receivables (2,000) (2,000) (2,000)
Decrease (increase) in non-current investments – – –
Payments
Capital assets (1,459,151) (1,435,690) (1,736,448) (1,826,877) (1,827,267)
NET CASH FROM/(USED) INVESTING ACTIVITIES (1,461,151) (1,437,690) (1,738,448) (1,826,877) (1,827,267)
CASH FLOWS FROM FINANCING ACTIVITIES
Receipts
Short term loans
Borrowing long term/refinancing 2,000 2,000 2,000
Increase in consumer deposits
Payments
Repayment of borrowing (93,920) (86,409) (79,760) (89,149) (99,143)
NET CASH FROM/(USED) FINANCING ACTIVITIES (91,920) (84,409) (77,760) (89,149) (99,143)
NET INCREASE/ (DECREASE) IN CASH HELD 167,173 720,981 750,738 674,837 884,543
Cash/cash equivalents at the year begin: 1,358,756 1,525,929 2,246,910 2,997,648 3,672,485
Cash/cash equivalents at the year end: 1,525,929 2,246,910 2,997,648 3,672,485 4,557,028
42
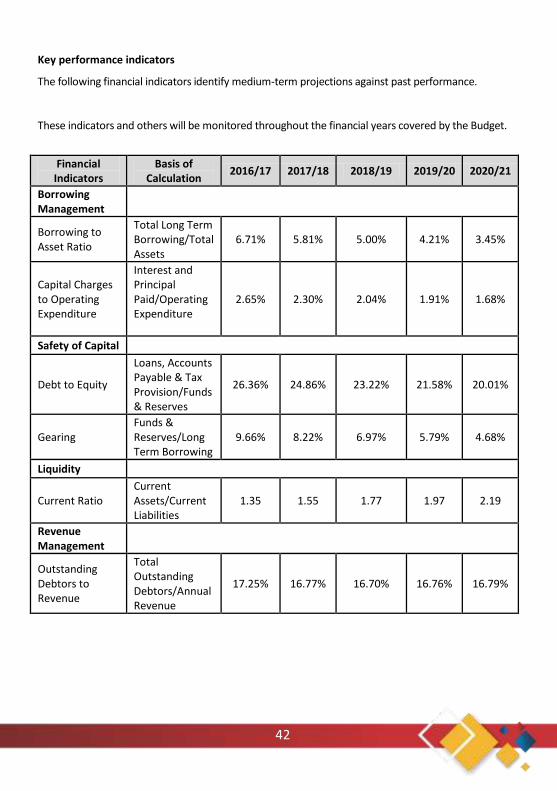
Key performance indicators
The following financial indicators identify medium-term projections against past performance.
These indicators and others will be monitored throughout the financial years covered by the Budget.
Financial Indicators
Basis of Calculation
2016/17 2017/18 2018/19 2019/20 2020/21
Borrowing Management
Borrowing to Asset Ratio
Total Long Term Borrowing/Total Assets
6.71% 5.81% 5.00% 4.21% 3.45%
Capital Charges to Operating Expenditure
Interest and Principal Paid/Operating Expenditure
2.65% 2.30% 2.04% 1.91% 1.68%
Safety of Capital
Debt to Equity
Loans, Accounts Payable & Tax Provision/Funds & Reserves
26.36% 24.86% 23.22% 21.58% 20.01%
Gearing Funds & Reserves/Long Term Borrowing
9.66% 8.22% 6.97% 5.79% 4.68%
Liquidity
Current Ratio Current Assets/Current Liabilities
1.35 1.55 1.77 1.97
2.19
Revenue Management
Outstanding Debtors to Revenue
Total Outstanding Debtors/Annual Revenue
17.25% 16.77% 16.70% 16.76% 16.79%
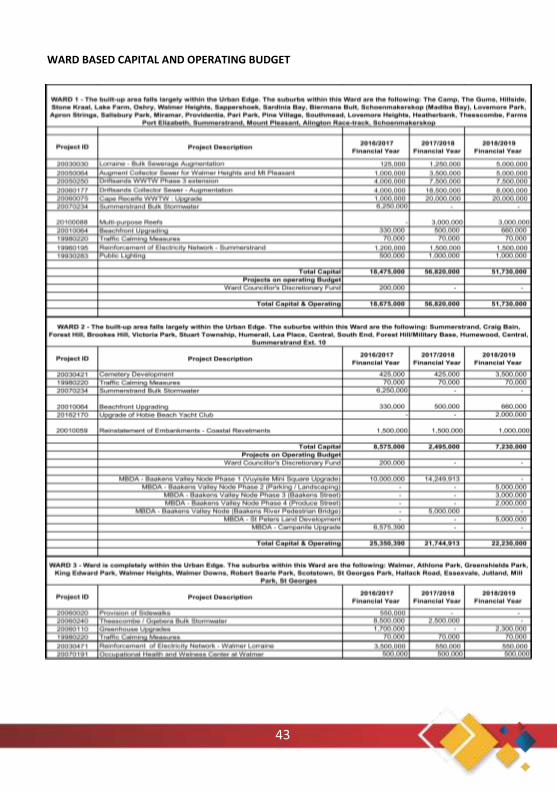
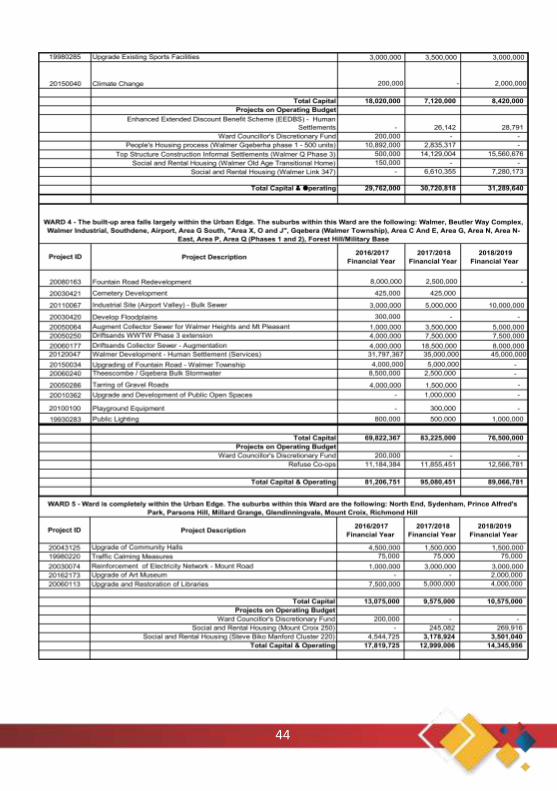
43
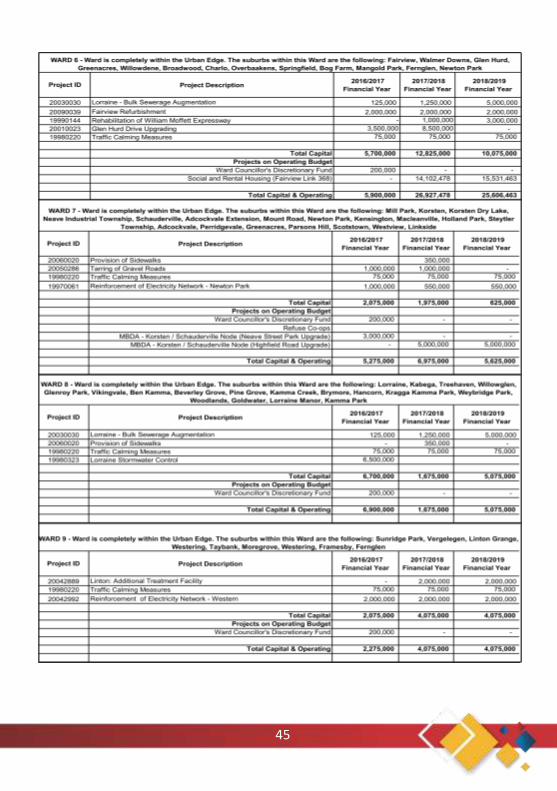
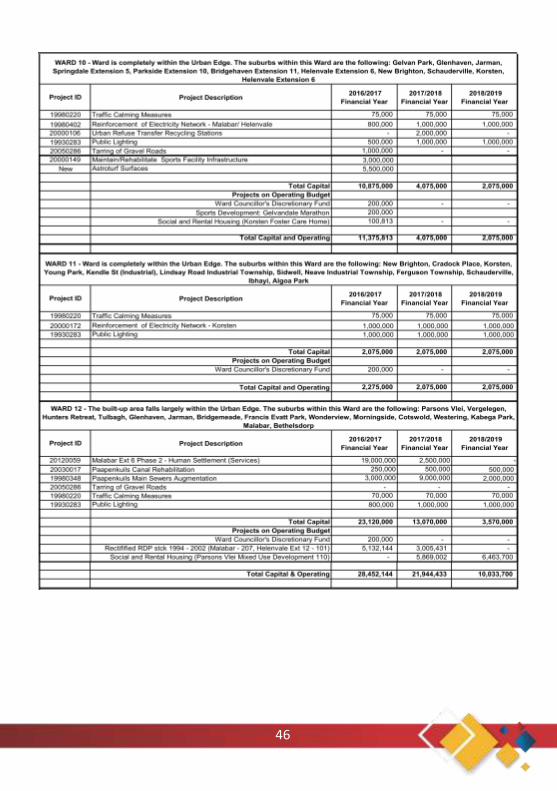
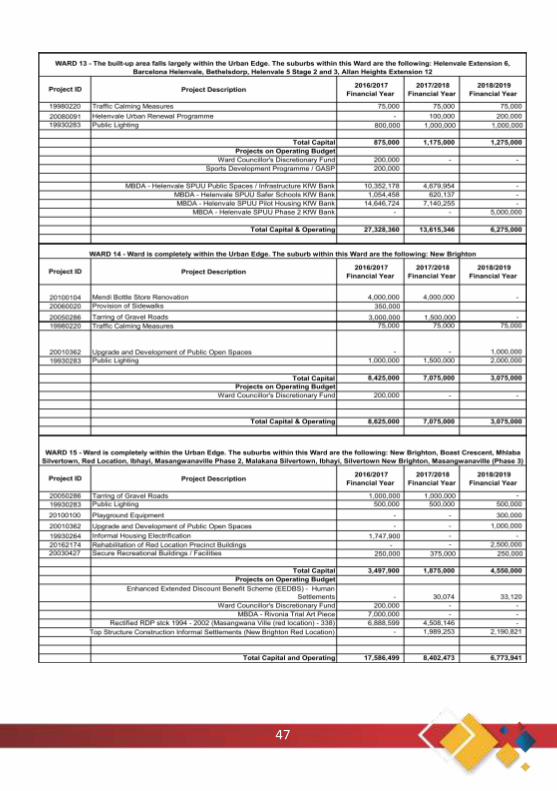
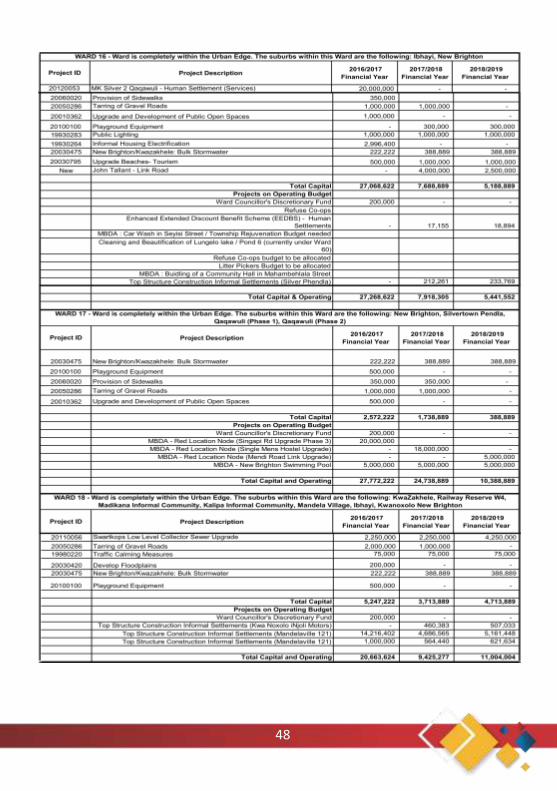
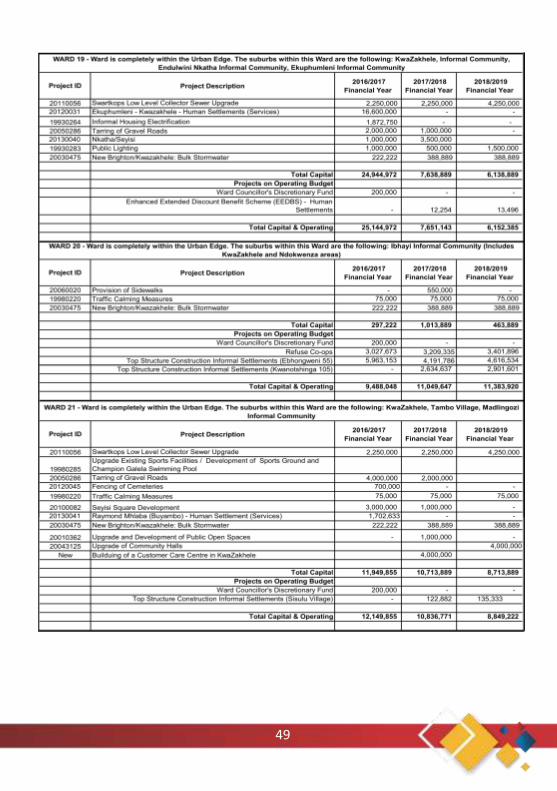
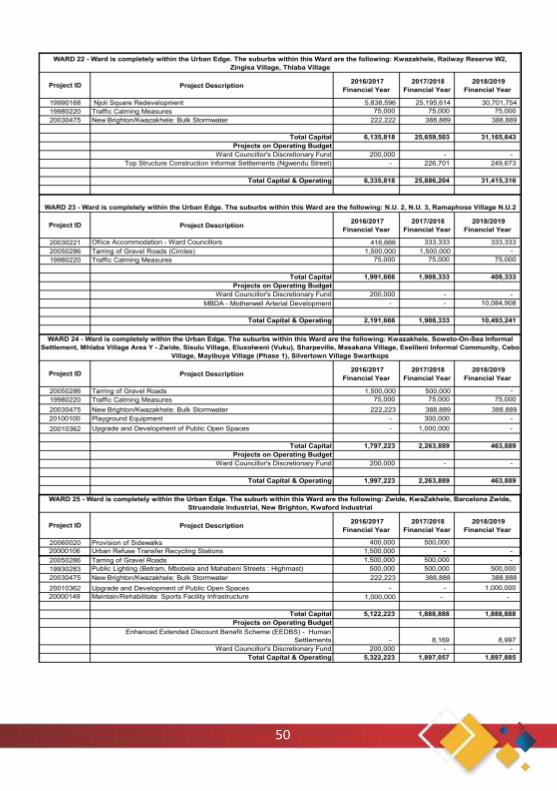
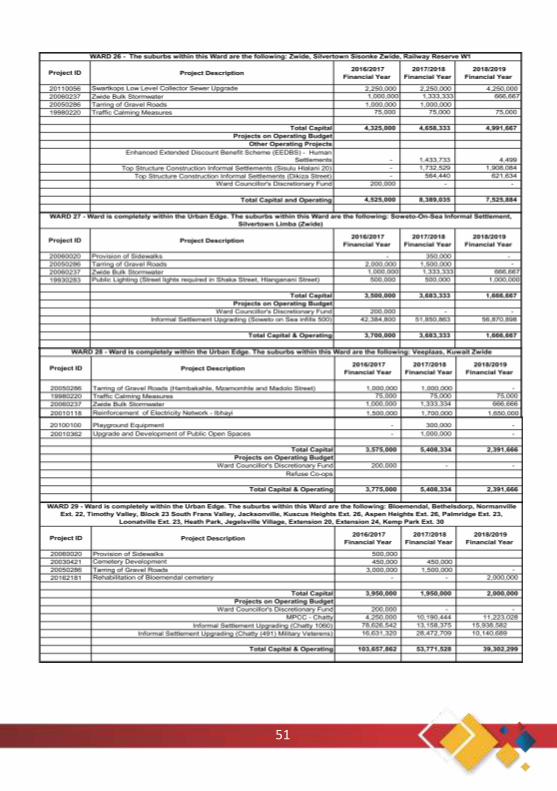
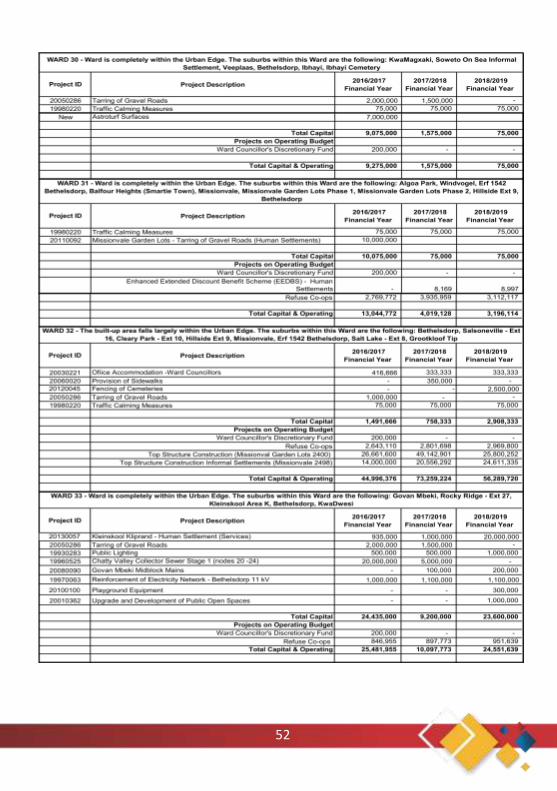
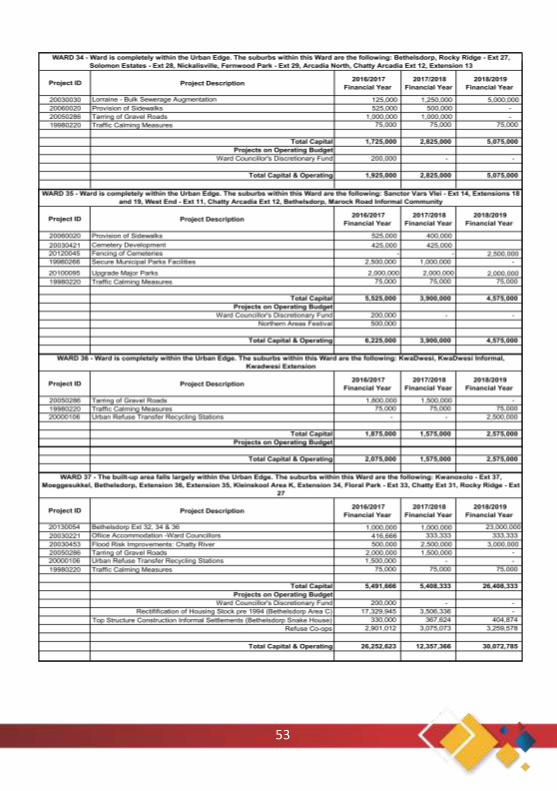
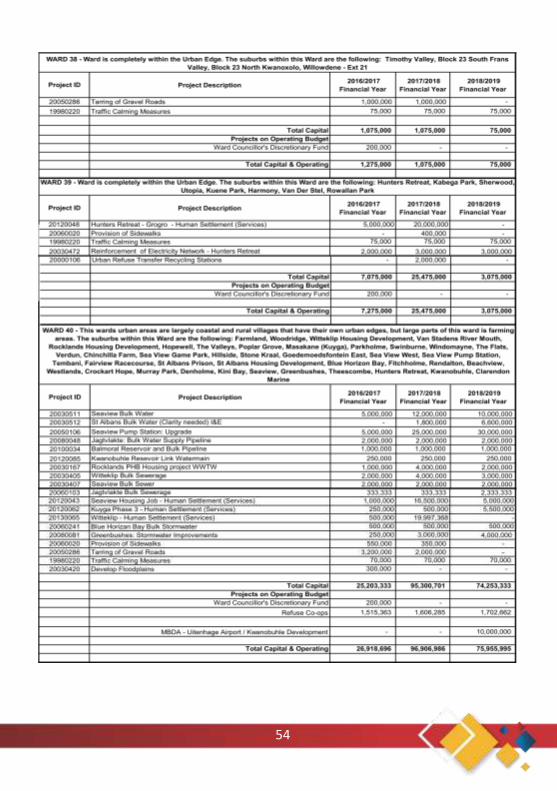
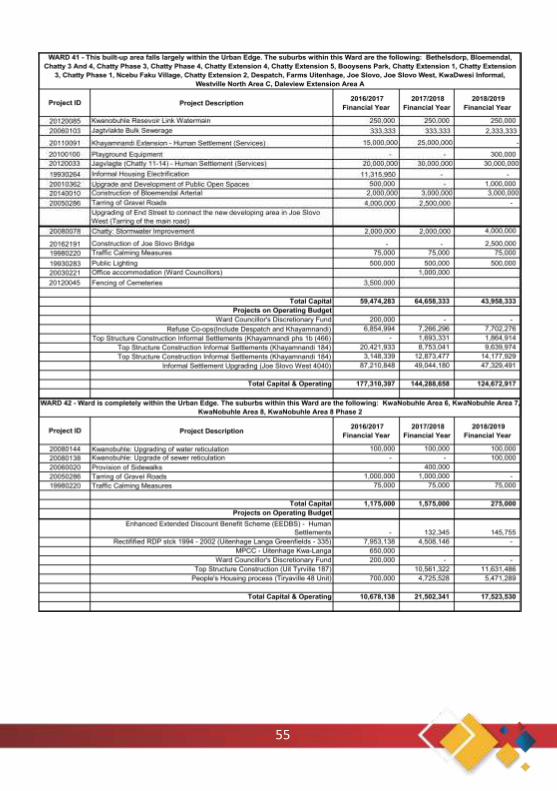
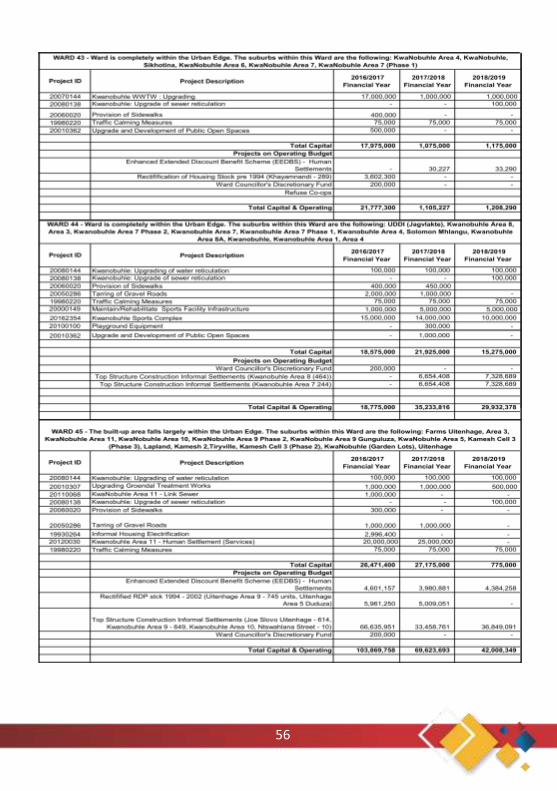
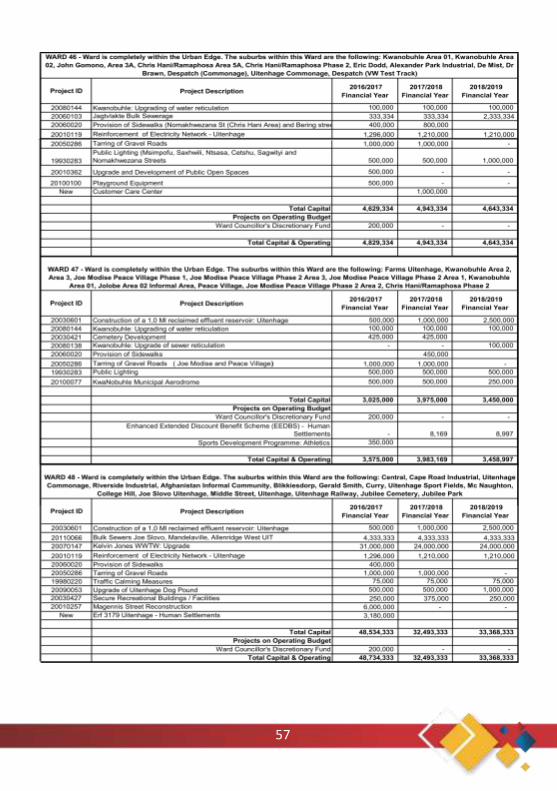
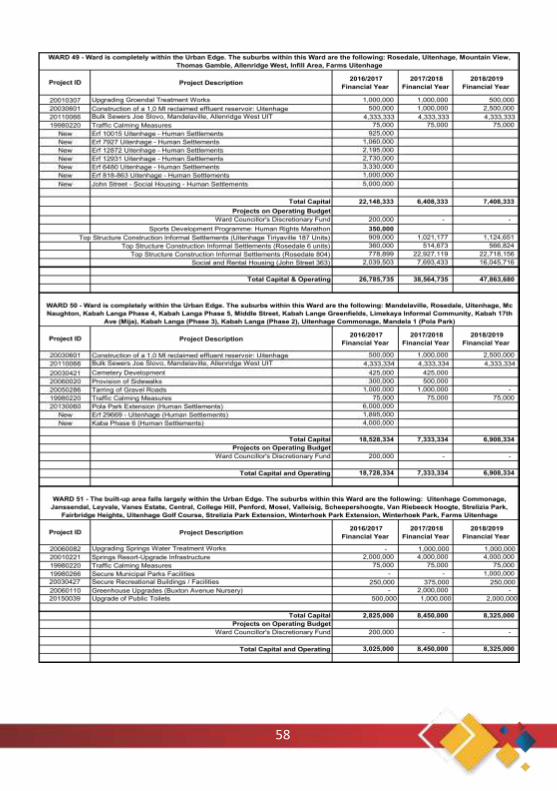
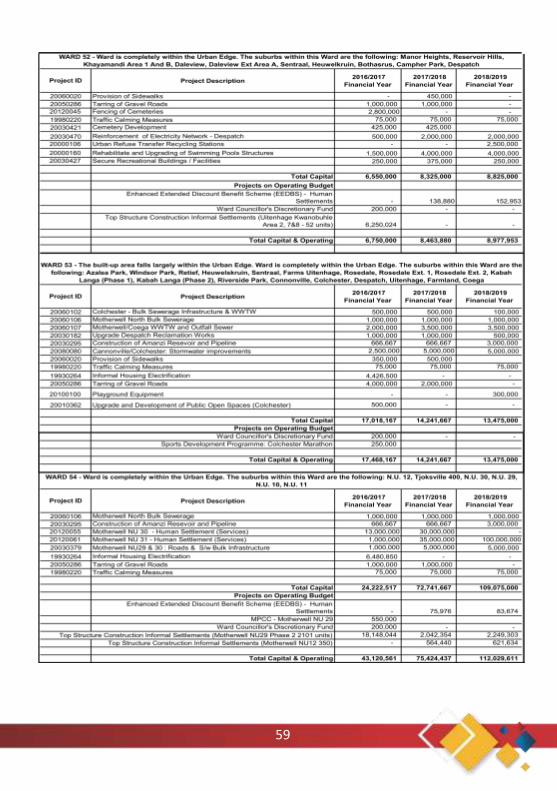
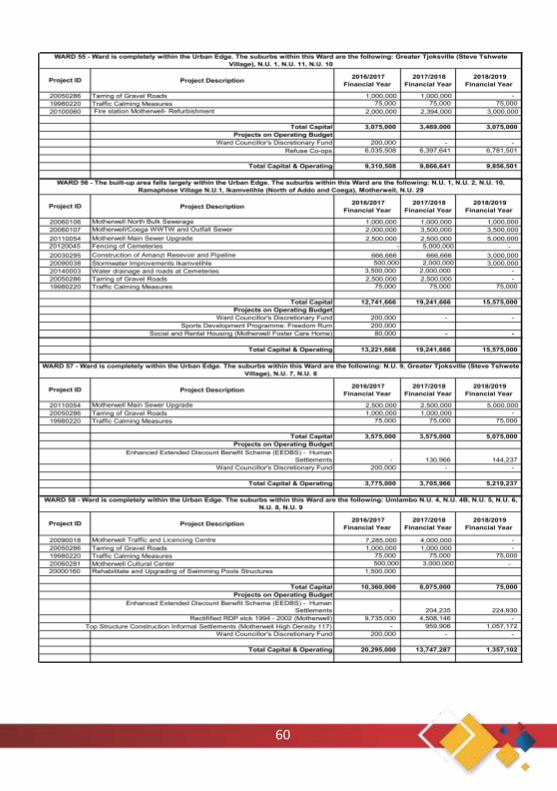
WARD BASED CAPITAL AND OPERATING BUDGET
44
45
46
47
48
49
50
51
52
53
54
55
56
57
58
59
60
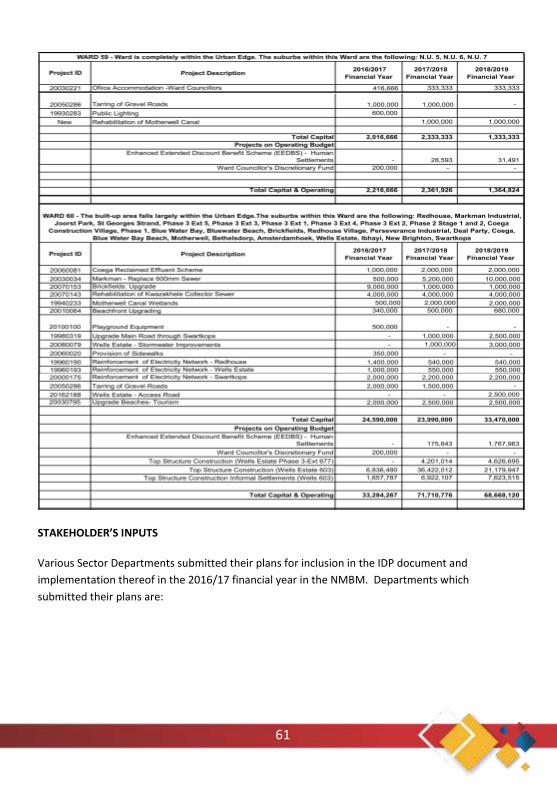
61
STAKEHOLDER’S INPUTS
Various Sector Departments submitted their plans for inclusion in the IDP document and
implementation thereof in the 2016/17 financial year in the NMBM. Departments which
submitted their plans are:
62
Department of Health
The following areas need clinics within the catchment areas due to the rapid expansion of
population and the establishment of new settlements. It has been identified from the underserved
areas in the NMBM that the following clinics will built over the coming 5 years:
Zanemvula Area and Seaview area
Motherwell Extention 29; Langa / Kabah area
Kwanoxolo/ Kleinskool /St. Albans area
The following includes some of the district priorities for 2016/17:
• Implementation of 90-90-90 strategy for TB, Maternal and Child Health and HIV&AIDS by
2020
• Implementation of Ideal Clinic Realization and Maintenance project
• Poverty alleviation projects: Walmer (Gqebera clinic)and Helenvale clinic
• Implementation of Re-engineering of PHC services (RPHC)
• Upgrading of Laetitia Bam and Motherwell CHCs: completion of phases planned for
2016/17
• Clinic maintenance plan (Estimated budget = R6,649,500)
• Phase 2 of provincialisation: transfer of buildings and assets; minor maintenance and
alterations at facilities has a major impact on service delivery and implementing of the
ICRM project
Department of Social Development
A number of projects dealing mainly with support to various Non Profit Organizations dealing with
youth development, poverty alleviation and woman development are the main targeted areas for
development. A total budget of R3 882 0000, 00 is set aside for the implementation of these various
programmes of development for the 2016/17 financial year.
63
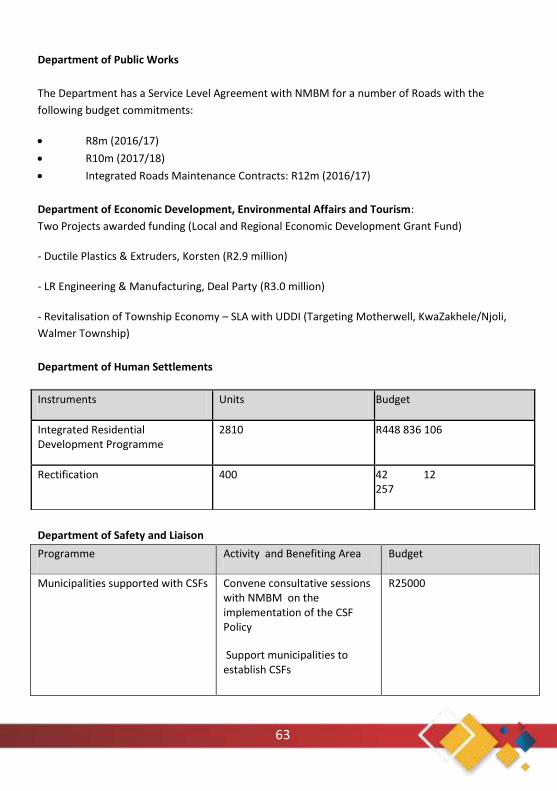
Department of Public Works
The Department has a Service Level Agreement with NMBM for a number of Roads with the
following budget commitments:
R8m (2016/17)
R10m (2017/18)
Integrated Roads Maintenance Contracts: R12m (2016/17)
Department of Economic Development, Environmental Affairs and Tourism:
Two Projects awarded funding (Local and Regional Economic Development Grant Fund)
- Ductile Plastics & Extruders, Korsten (R2.9 million)
- LR Engineering & Manufacturing, Deal Party (R3.0 million)
- Revitalisation of Township Economy – SLA with UDDI (Targeting Motherwell, KwaZakhele/Njoli,
Walmer Township)
Department of Human Settlements
Department of Safety and Liaison
Programme Activity and Benefiting Area Budget
Municipalities supported with CSFs Convene consultative sessions with NMBM on the implementation of the CSF Policy
Support municipalities to establish CSFs
R25000
Instruments Units Budget
Integrated Residential Development Programme
2810 R448 836 106
Rectification 400 42 12 257
64
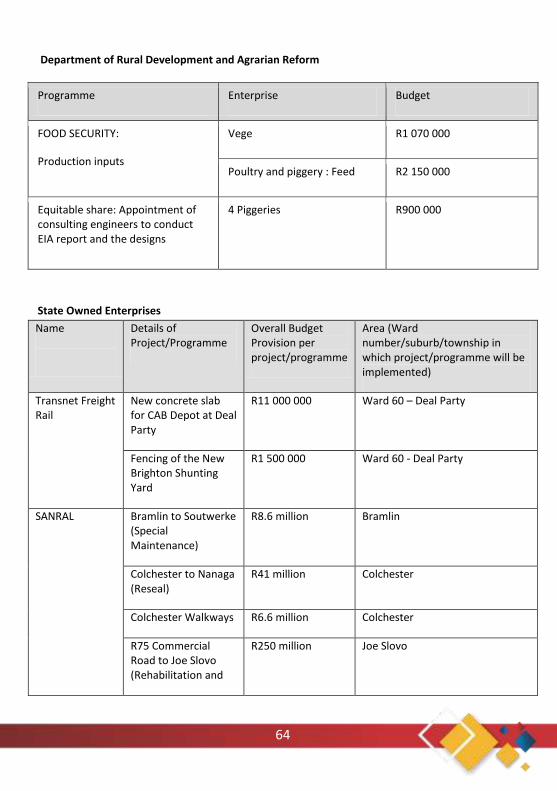
Department of Rural Development and Agrarian Reform
Programme Enterprise Budget
FOOD SECURITY:
Production inputs
Vege R1 070 000
Poultry and piggery : Feed R2 150 000
Equitable share: Appointment of consulting engineers to conduct EIA report and the designs
4 Piggeries R900 000
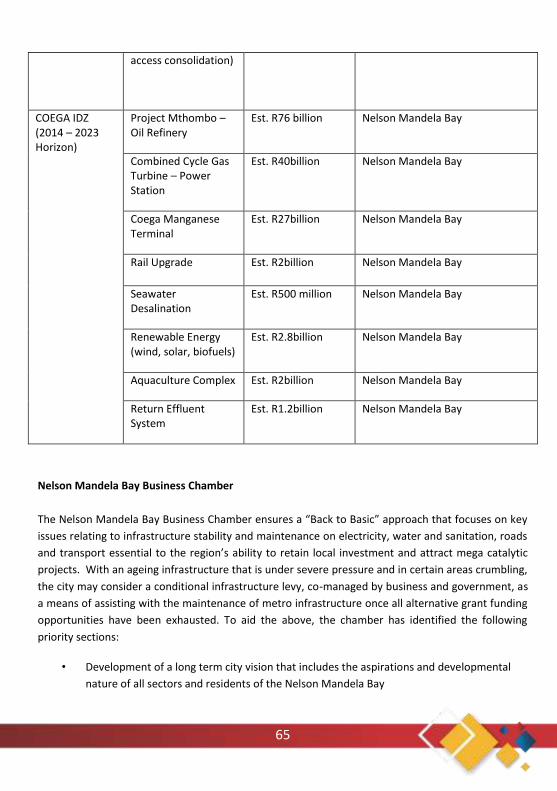
State Owned Enterprises
Name
Details of Project/Programme
Overall Budget Provision per project/programme
Area (Ward number/suburb/township in which project/programme will be implemented)
Transnet Freight Rail
New concrete slab for CAB Depot at Deal Party
R11 000 000 Ward 60 – Deal Party
Fencing of the New Brighton Shunting Yard
R1 500 000 Ward 60 - Deal Party
SANRAL
Bramlin to Soutwerke (Special Maintenance)
R8.6 million Bramlin
Colchester to Nanaga (Reseal)
R41 million Colchester
Colchester Walkways R6.6 million Colchester
R75 Commercial Road to Joe Slovo (Rehabilitation and
R250 million Joe Slovo
65
access consolidation)
COEGA IDZ (2014 – 2023 Horizon)
Project Mthombo – Oil Refinery
Est. R76 billion Nelson Mandela Bay
Combined Cycle Gas Turbine – Power Station
Est. R40billion Nelson Mandela Bay
Coega Manganese Terminal
Est. R27billion Nelson Mandela Bay
Rail Upgrade Est. R2billion Nelson Mandela Bay
Seawater Desalination
Est. R500 million Nelson Mandela Bay
Renewable Energy (wind, solar, biofuels)
Est. R2.8billion Nelson Mandela Bay
Aquaculture Complex Est. R2billion Nelson Mandela Bay
Return Effluent System
Est. R1.2billion Nelson Mandela Bay
Nelson Mandela Bay Business Chamber
The Nelson Mandela Bay Business Chamber ensures a “Back to Basic” approach that focuses on key
issues relating to infrastructure stability and maintenance on electricity, water and sanitation, roads
and transport essential to the region’s ability to retain local investment and attract mega catalytic
projects. With an ageing infrastructure that is under severe pressure and in certain areas crumbling,
the city may consider a conditional infrastructure levy, co-managed by business and government, as
a means of assisting with the maintenance of metro infrastructure once all alternative grant funding
opportunities have been exhausted. To aid the above, the chamber has identified the following
priority sections:
• Development of a long term city vision that includes the aspirations and developmental
nature of all sectors and residents of the Nelson Mandela Bay
66
• Extensive consultation required on the Rates, Tariff Policies and factors leading to annual
proposed increases in Rates, Electricity and Water tariffs).
• Future/current infrastructure development including the maintenance of our Electricity
Water, and Roads infrastructure,
• Economic Development Projects that will aid growth within the city region,
• Transport with specific reference to the Integrated Public Transport System,
• The economic viability of the Nelson Mandela Bay Stadium, and
• Sustainability of a mutually beneficial relationship with the city’s strategic management
team.
Youth Development
The development and growth of any city depends amongst others on a sustainable investment in
youth development programmes geared towards ensuring that the youth become productive
citizens. In ensuring a future for the Nelson Mandela Bay, the Municipality intends to support and
resuscitate the youth development unit that will focus on youth development programmes in order
to respond to the ever-growing needs of the youth in the city and assist towards curbing the
unemployment rate within the city.
The mantra for the development of youth that will reverberate in all corners of the city will be
“teach them how to fish.” A special focus will be placed on a number of programmes. Namely:
Youth Policy development and Resource Mobilisation
Youth Strategic Programmes
Youth in Economic Development
Youth in Education and Skills Development
Youth in Sports
Youth in Arts and Culture
Youth in Economic Development
Youth in Leadership Project
Youth Advocacy
In order to reach objectives indicated within the Youth Development Policy adopted in 2014, such as
developing skills of 3% unemployed youth each year within the Nelson Mandela Bay area,
supervision for these programs and projects should be by allocated to the Executive Mayor’s Office.
67
Special Sectors:
This sector comprises; People with Disabilities, Children, the elderly, youth and women. The
following are some of the key priorities raised by the special sectors in a number of public
participation meetings held in the 2015/2016 financial year.
Skills development for People with Disabilities (PWD)
Technical Schools for People with Disabilities
Rectification of houses
Patrollers in ward 14 request for municipal support-boots, reflector and jackets.
People with disabilities should be considered when the Municipality creates jobs
Houses that are accessible to People with Disabilities
Rectification of houses for PWD
Provision of houses for PWD
Sport facilities for PWD
Economic development support for PWD
Satellite police station to accommodate PWD
Skills development for PWD
Developing key municipal documents in brail
Having an interpreter at public meetings for those who are deaf.
Performance Management and evaluation of Municipal performance
Performance management holds the key to the successful implementation of the Municipality’s
Integrated Development Plan and Budget. It has become an essential business process to focus the
attention of the public and oversight bodies on whether the Municipality is delivering on its
mandates, as well as creating value for money. To ensure that service delivery is provided as
efficiently and economically as possible, the Nelson Mandela Bay Municipality formulates integrated
development plans, allocates its resources to the implementation of these plans, monitors and
measures performance at institutional level (including municipal entities and service providers) and
at individual level; reports the results of its performance to its key internal and external
stakeholders, and manages performance outcomes to ensure continuous improvements.
The Nelson Mandela Bay Municipality has a functional performance management system in place
which allows for regular planning, monitoring, evaluating, reviewing and reporting of performance
at both organisational and individual levels, and for an effective response to substandard
performance and the recognition and rewarding of outstanding performance.
68
Setting of Key Performance Indicators (KPIs) and Targets
Key Performance Indicators are measures which are set to indicate to stakeholders how the
achievement of the strategic goals, objectives and projects of the Municipality are going to be
monitored and measured. To this end, the Municipality sets its key performance indicators at
output, outcome and impact levels to serve mainly as gauges of actual performance.
Performance targets are the planned level of performance or milestones the Municipality sets for
each key performance indicator. Performance targets are informed by baseline performance,
available resources, developmental needs of communities and the developmental priorities of the
Municipality and are set for each quarter of the financial year.
Relationship between Institutional and Individual Performance Management
Institutional performance does not occur in a vacuum, it is integrally linked to the performance of
employees. The performance targets reflected in the organisational scorecards (IDP and SDBIP) are
filtered through to directorates / offices and forms the basis of individual performance scorecards
and the subsequent performance reviews / evaluations.
Performance Monitoring
Performance monitoring is an ongoing process that runs parallel to the implementation of the
Municipality’s key strategic plans and the execution of the performance agreements and
performance plans across its administration, political office-bearers and municipal entities. The
performance monitoring process mainly involves data collection and analysis of the work
completed. It also involves the comparison of and reporting on performance between intervals
(monthly, quarterly, mid-term and annually).
Performance Measurement, Evaluation and Review
69
Progress in the implementation of key performance indicators in line with set targets is quarterly
recorded on the Municipality’s electronic performance information management system,
whereafter it is used for the measurement, evaluation and review of performance at both
institutional and individual levels. It is through regular monitoring and quarterly review/evaluation
of performance that early warning signals can first be detected and the necessary interventions
introduced before risk strikes and before the annual performance assessment stages commence.
Institutional performance reports are subjected to verification, quality assurance and auditing
processes before submission to oversight structures, stakeholders and the public. In recognition of
the importance of regular feedback to communities, the Municipality’s Mid-year Performance
Assessment Report and Annual Report are published.
Monitoring is an integral part of day-to-day operational management, in order to assess progress
against objectives. Evaluation, however, is a decision-making tool that is incorporated into the
Planning Cycle and Performance Management processes of the institution. The Municipality will
focus on the following in terms of monitoring and evaluation:
• Monitoring and evaluation of the IDP implementation for tracking service delivery
progress and sustainability, and evaluating alternative options for service delivery.
• Monitoring, evaluating and reporting on the performance of consultants/ service providers
to ensure that the expected delivery outputs and outcomes are achieved.
• Monitoring and evaluating Ward-based Capital expenditure to ensure that the objectives
are achieved as planned.
• Intended monitoring and evaluation activities
70
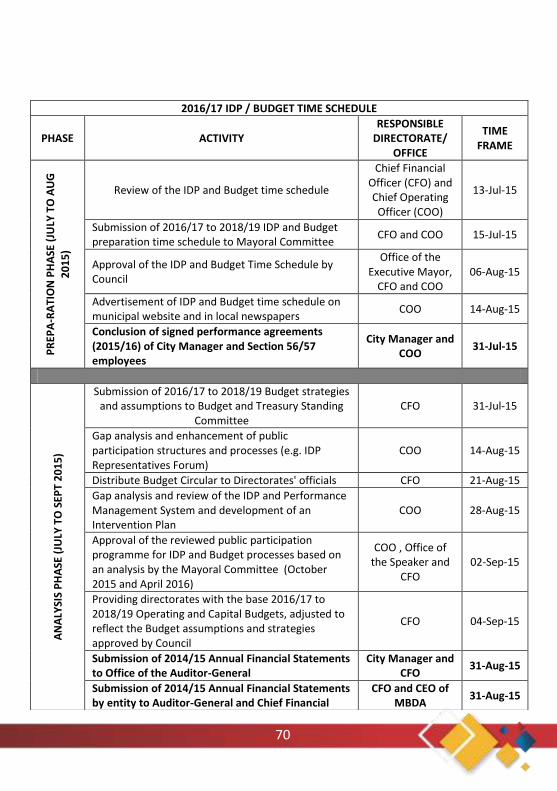
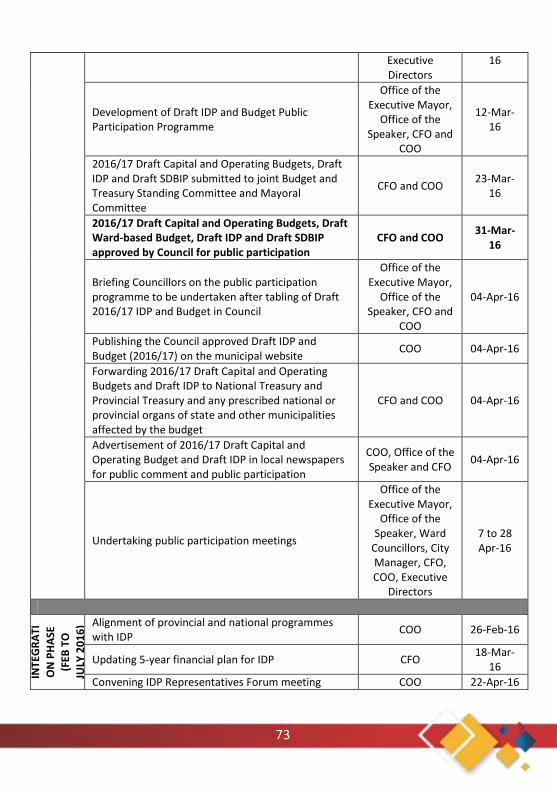
2016/17 IDP / BUDGET TIME SCHEDULE
PHASE ACTIVITY RESPONSIBLE
DIRECTORATE/ OFFICE
TIME FRAME
PR
EPA
-RA
TIO
N P
HA
SE (
JULY
TO
AU
G
20
15
)
Review of the IDP and Budget time schedule
Chief Financial Officer (CFO) and Chief Operating
Officer (COO)
13-Jul-15
Submission of 2016/17 to 2018/19 IDP and Budget preparation time schedule to Mayoral Committee
CFO and COO 15-Jul-15
Approval of the IDP and Budget Time Schedule by Council
Office of the Executive Mayor,
CFO and COO 06-Aug-15
Advertisement of IDP and Budget time schedule on municipal website and in local newspapers
COO 14-Aug-15
Conclusion of signed performance agreements (2015/16) of City Manager and Section 56/57 employees
City Manager and COO
31-Jul-15
AN
ALY
SIS
PH
ASE
(JU
LY T
O S
EPT
20
15
)
Submission of 2016/17 to 2018/19 Budget strategies and assumptions to Budget and Treasury Standing
Committee CFO 31-Jul-15
Gap analysis and enhancement of public participation structures and processes (e.g. IDP Representatives Forum)
COO 14-Aug-15
Distribute Budget Circular to Directorates' officials CFO 21-Aug-15
Gap analysis and review of the IDP and Performance Management System and development of an Intervention Plan
COO 28-Aug-15
Approval of the reviewed public participation programme for IDP and Budget processes based on an analysis by the Mayoral Committee (October 2015 and April 2016)
COO , Office of the Speaker and
CFO 02-Sep-15
Providing directorates with the base 2016/17 to 2018/19 Operating and Capital Budgets, adjusted to reflect the Budget assumptions and strategies approved by Council
CFO 04-Sep-15
Submission of 2014/15 Annual Financial Statements to Office of the Auditor-General
City Manager and CFO
31-Aug-15
Submission of 2014/15 Annual Financial Statements by entity to Auditor-General and Chief Financial
CFO and CEO of MBDA
31-Aug-15
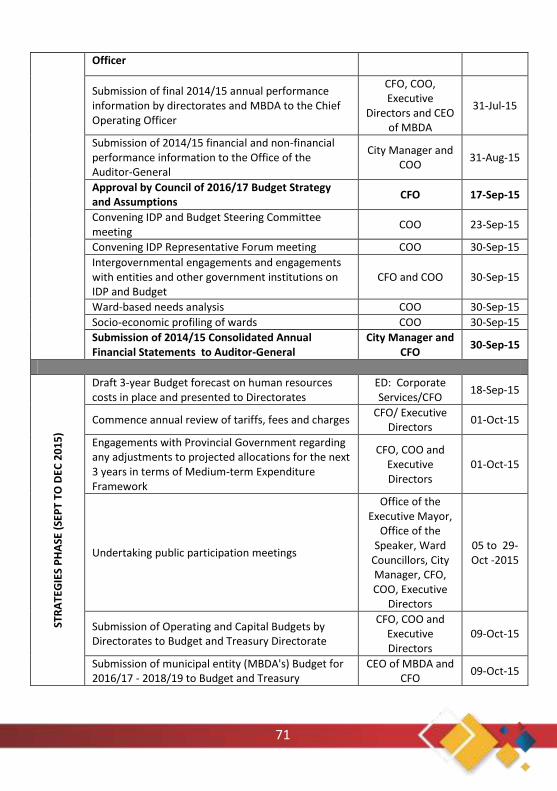
71
Officer
Submission of final 2014/15 annual performance information by directorates and MBDA to the Chief Operating Officer
CFO, COO, Executive
Directors and CEO of MBDA
31-Jul-15
Submission of 2014/15 financial and non-financial performance information to the Office of the Auditor-General
City Manager and COO
31-Aug-15
Approval by Council of 2016/17 Budget Strategy and Assumptions
CFO 17-Sep-15
Convening IDP and Budget Steering Committee meeting
COO 23-Sep-15
Convening IDP Representative Forum meeting COO 30-Sep-15
Intergovernmental engagements and engagements with entities and other government institutions on IDP and Budget
CFO and COO 30-Sep-15
Ward-based needs analysis COO 30-Sep-15
Socio-economic profiling of wards COO 30-Sep-15
Submission of 2014/15 Consolidated Annual Financial Statements to Auditor-General
City Manager and CFO
30-Sep-15
STR
ATE
GIE
S P
HA
SE (
SEP
T TO
DE
C 2
01
5)
Draft 3-year Budget forecast on human resources costs in place and presented to Directorates
ED: Corporate Services/CFO
18-Sep-15
Commence annual review of tariffs, fees and charges CFO/ Executive
Directors 01-Oct-15
Engagements with Provincial Government regarding any adjustments to projected allocations for the next 3 years in terms of Medium-term Expenditure Framework
CFO, COO and Executive Directors
01-Oct-15
Undertaking public participation meetings
Office of the Executive Mayor,
Office of the Speaker, Ward
Councillors, City Manager, CFO, COO, Executive
Directors
05 to 29- Oct -2015
Submission of Operating and Capital Budgets by Directorates to Budget and Treasury Directorate
CFO, COO and Executive Directors
09-Oct-15
Submission of municipal entity (MBDA's) Budget for 2016/17 - 2018/19 to Budget and Treasury
CEO of MBDA and CFO
09-Oct-15
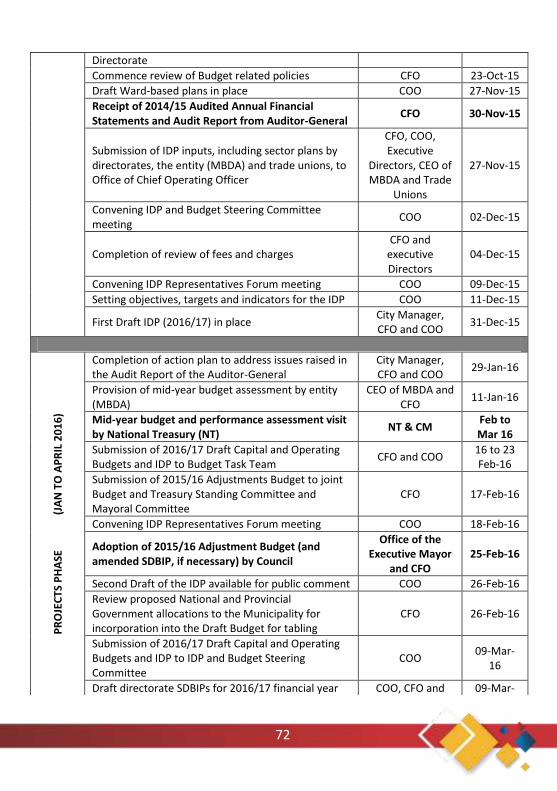
72
Directorate
Commence review of Budget related policies CFO 23-Oct-15
Draft Ward-based plans in place COO 27-Nov-15
Receipt of 2014/15 Audited Annual Financial Statements and Audit Report from Auditor-General
CFO 30-Nov-15
Submission of IDP inputs, including sector plans by directorates, the entity (MBDA) and trade unions, to Office of Chief Operating Officer
CFO, COO, Executive
Directors, CEO of MBDA and Trade
Unions
27-Nov-15
Convening IDP and Budget Steering Committee meeting
COO 02-Dec-15
Completion of review of fees and charges CFO and
executive Directors
04-Dec-15
Convening IDP Representatives Forum meeting COO 09-Dec-15
Setting objectives, targets and indicators for the IDP COO 11-Dec-15
First Draft IDP (2016/17) in place City Manager, CFO and COO
31-Dec-15
PR
OJE
CTS
PH
ASE
(JA
N T
O A
PR
IL 2
01
6)
Completion of action plan to address issues raised in the Audit Report of the Auditor-General
City Manager, CFO and COO
29-Jan-16
Provision of mid-year budget assessment by entity (MBDA)
CEO of MBDA and CFO
11-Jan-16
Mid-year budget and performance assessment visit by National Treasury (NT)
NT & CM Feb to Mar 16
Submission of 2016/17 Draft Capital and Operating Budgets and IDP to Budget Task Team
CFO and COO 16 to 23 Feb-16
Submission of 2015/16 Adjustments Budget to joint Budget and Treasury Standing Committee and Mayoral Committee
CFO 17-Feb-16
Convening IDP Representatives Forum meeting COO 18-Feb-16
Adoption of 2015/16 Adjustment Budget (and amended SDBIP, if necessary) by Council
Office of the Executive Mayor
and CFO 25-Feb-16
Second Draft of the IDP available for public comment COO 26-Feb-16
Review proposed National and Provincial Government allocations to the Municipality for incorporation into the Draft Budget for tabling
CFO 26-Feb-16
Submission of 2016/17 Draft Capital and Operating Budgets and IDP to IDP and Budget Steering Committee
COO 09-Mar-
16
Draft directorate SDBIPs for 2016/17 financial year COO, CFO and 09-Mar-
73
Executive Directors
16
Development of Draft IDP and Budget Public Participation Programme
Office of the Executive Mayor,
Office of the Speaker, CFO and
COO
12-Mar-16
2016/17 Draft Capital and Operating Budgets, Draft IDP and Draft SDBIP submitted to joint Budget and Treasury Standing Committee and Mayoral Committee
CFO and COO 23-Mar-
16
2016/17 Draft Capital and Operating Budgets, Draft Ward-based Budget, Draft IDP and Draft SDBIP approved by Council for public participation
CFO and COO 31-Mar-
16
Briefing Councillors on the public participation programme to be undertaken after tabling of Draft 2016/17 IDP and Budget in Council
Office of the Executive Mayor,
Office of the Speaker, CFO and
COO
04-Apr-16
Publishing the Council approved Draft IDP and Budget (2016/17) on the municipal website
COO 04-Apr-16
Forwarding 2016/17 Draft Capital and Operating Budgets and Draft IDP to National Treasury and Provincial Treasury and any prescribed national or provincial organs of state and other municipalities affected by the budget
CFO and COO 04-Apr-16
Advertisement of 2016/17 Draft Capital and Operating Budget and Draft IDP in local newspapers for public comment and public participation
COO, Office of the Speaker and CFO
04-Apr-16
Undertaking public participation meetings
Office of the Executive Mayor,
Office of the Speaker, Ward
Councillors, City Manager, CFO, COO, Executive
Directors
7 to 28 Apr-16
INTE
GR
ATI
ON
PH
ASE
(F
EB T
O
JULY
20
16
) Alignment of provincial and national programmes with IDP
COO 26-Feb-16
Updating 5-year financial plan for IDP CFO 18-Mar-
16
Convening IDP Representatives Forum meeting COO 22-Apr-16
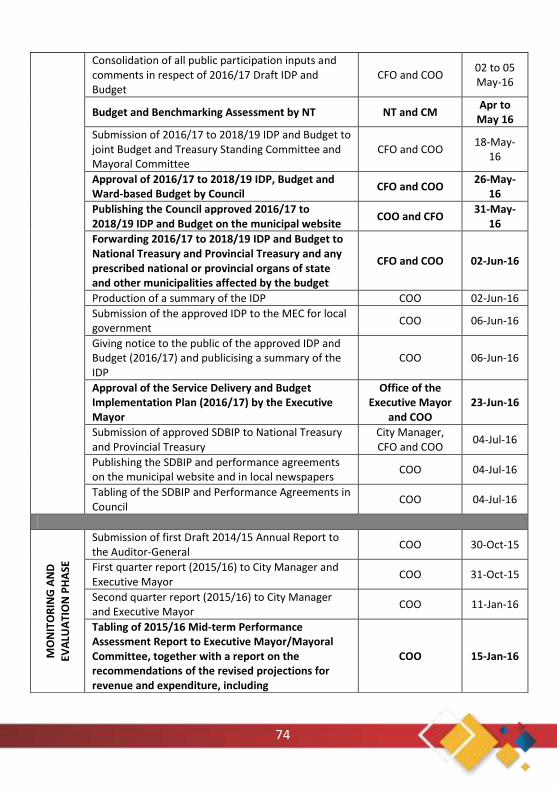
74
Consolidation of all public participation inputs and comments in respect of 2016/17 Draft IDP and Budget
CFO and COO 02 to 05 May-16
Budget and Benchmarking Assessment by NT NT and CM Apr to
May 16
Submission of 2016/17 to 2018/19 IDP and Budget to joint Budget and Treasury Standing Committee and Mayoral Committee
CFO and COO 18-May-
16
Approval of 2016/17 to 2018/19 IDP, Budget and Ward-based Budget by Council
CFO and COO 26-May-
16
Publishing the Council approved 2016/17 to 2018/19 IDP and Budget on the municipal website
COO and CFO 31-May-
16
Forwarding 2016/17 to 2018/19 IDP and Budget to National Treasury and Provincial Treasury and any prescribed national or provincial organs of state and other municipalities affected by the budget
CFO and COO 02-Jun-16
Production of a summary of the IDP COO 02-Jun-16
Submission of the approved IDP to the MEC for local government
COO 06-Jun-16
Giving notice to the public of the approved IDP and Budget (2016/17) and publicising a summary of the IDP
COO 06-Jun-16
Approval of the Service Delivery and Budget Implementation Plan (2016/17) by the Executive Mayor
Office of the Executive Mayor
and COO 23-Jun-16
Submission of approved SDBIP to National Treasury and Provincial Treasury
City Manager, CFO and COO
04-Jul-16
Publishing the SDBIP and performance agreements on the municipal website and in local newspapers
COO 04-Jul-16
Tabling of the SDBIP and Performance Agreements in Council
COO 04-Jul-16
MO
NIT
OR
ING
AN
D
EVA
LUA
TIO
N P
HA
SE
Submission of first Draft 2014/15 Annual Report to the Auditor-General
COO 30-Oct-15
First quarter report (2015/16) to City Manager and Executive Mayor
COO 31-Oct-15
Second quarter report (2015/16) to City Manager and Executive Mayor
COO 11-Jan-16
Tabling of 2015/16 Mid-term Performance Assessment Report to Executive Mayor/Mayoral Committee, together with a report on the recommendations of the revised projections for revenue and expenditure, including
COO 15-Jan-16
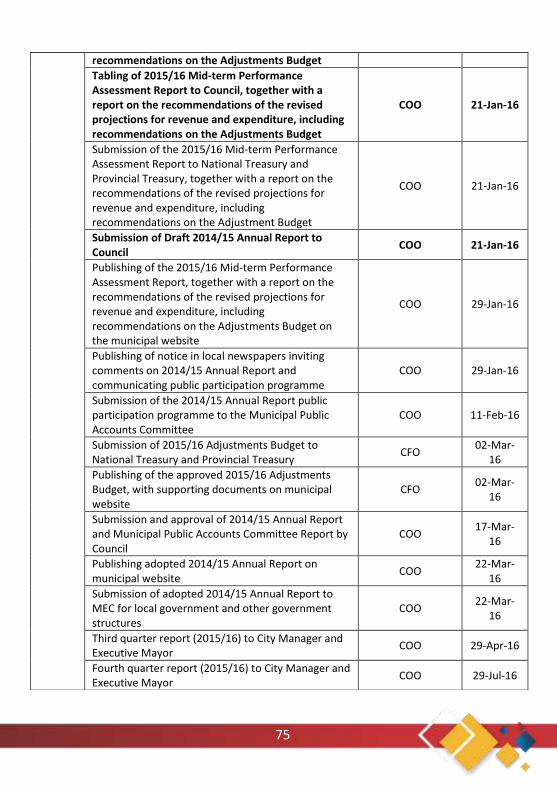
75
recommendations on the Adjustments Budget
Tabling of 2015/16 Mid-term Performance Assessment Report to Council, together with a report on the recommendations of the revised projections for revenue and expenditure, including recommendations on the Adjustments Budget
COO 21-Jan-16
Submission of the 2015/16 Mid-term Performance Assessment Report to National Treasury and Provincial Treasury, together with a report on the recommendations of the revised projections for revenue and expenditure, including recommendations on the Adjustment Budget
COO 21-Jan-16
Submission of Draft 2014/15 Annual Report to Council
COO 21-Jan-16
Publishing of the 2015/16 Mid-term Performance Assessment Report, together with a report on the recommendations of the revised projections for revenue and expenditure, including recommendations on the Adjustments Budget on the municipal website
COO 29-Jan-16
Publishing of notice in local newspapers inviting comments on 2014/15 Annual Report and communicating public participation programme
COO 29-Jan-16
Submission of the 2014/15 Annual Report public participation programme to the Municipal Public Accounts Committee
COO 11-Feb-16
Submission of 2015/16 Adjustments Budget to National Treasury and Provincial Treasury
CFO 02-Mar-
16
Publishing of the approved 2015/16 Adjustments Budget, with supporting documents on municipal website
CFO 02-Mar-
16
Submission and approval of 2014/15 Annual Report and Municipal Public Accounts Committee Report by Council
COO 17-Mar-
16
Publishing adopted 2014/15 Annual Report on municipal website
COO 22-Mar-
16
Submission of adopted 2014/15 Annual Report to MEC for local government and other government structures
COO 22-Mar-
16
Third quarter report (2015/16) to City Manager and Executive Mayor
COO 29-Apr-16
Fourth quarter report (2015/16) to City Manager and Executive Mayor
COO 29-Jul-16

76