Embed Size (px)
Citation preview

i

ii
FOREWORD
I am pleased to put into the hands of readers Volume-4; Issue-8: 2017 (Aug, 2017) of “International Journal
of Advanced Engineering Research and Science (IJAERS) (ISSN: 2349-6495(P)| 2456-1908(O)” , an
international journal which publishes peer reviewed quality research papers on a wide variety of topics
related to Science, Technology, Management and Humanities. Looking to the keen interest shown by the
authors and readers, the editorial board has decided to release print issue also, but this decision the journal
issue will be available in various library also in print and online version. This will motivate authors for quick
publication of their research papers. Even with these changes our objective remains the same, that is, to
encourage young researchers and academicians to think innovatively and share their research findings with
others for the betterment of mankind. This journal has DOI (Digital Object Identifier) also, this will improve
citation of research papers.
I thank all the authors of the research papers for contributing their scholarly articles. Despite many
challenges, the entire editorial board has worked tirelessly and helped me to bring out this issue of the journal
well in time. They all deserve my heartfelt thanks.
Finally, I hope the readers will make good use of this valuable research material and continue to contribute
their research finding for publication in this journal. Constructive comments and suggestions from our
readers are welcome for further improvement of the quality and usefulness of the journal.
With warm regards.
Dr. Swapnesh Taterh
Editor-in-Chief
Date: Sept, 2017

iii
Editorial Board
Dr. C.M. Singh
BE., MS(USA), PhD(USA),Post-Doctoral fellow at NASA (USA)
Professor, Department of Electrical & Electronics Engineering, INDIA
Dr. Ram Karan Singh
BE.(Civil Engineering), M.Tech.(Hydraulics Engineering), PhD(Hydraulics & Water Resources
Engineering),BITS- Pilani
Professor, Department of Civil Engineering,King Khalid University, Saudi Arabia.
Dr. Asheesh Kumar Shah
IIM Calcutta, Wharton School of Business, DAVV INDORE, SGSITS, Indore
Country Head at CrafSOL Technology Pvt.Ltd, Country Coordinator at French Embassy, Project
Coordinator at IIT Delhi, INDIA
Dr. Swapnesh Taterh
Ph.d with Specialization in Information System Security
Associate Professor, Department of Computer Science Engineering
Amity University, INDIA
Dr. Ebrahim Nohani
Ph.D.(hydraulic Structures), Department of hydraulic Structures,Islamic Azad University, Dezful, IRAN.
Dr. Dinh Tran Ngoc Huy
Specialization Banking and Finance, Professor,Department Banking and Finance
Viet Nam
Dr.Sameh El-Sayed Mohamed Yehia
Assistant Professor, Civil Engineering(Structural), Higher Institute of Engineering -El-Shorouk Academy,
Cairo, Egypt
Dr.AhmadadNabihZaki Rashed
Specialization Optical Communication System,Professor,Department of Electronic Engineering,
Menoufia University
Dr. Alok Kumar Bharadwaj
BE(AMU), ME(IIT, Roorkee), Ph.D (AMU),Professor, Department of Electrical Engineering, INDIA
Dr. M. Kannan
Specialization in Software Engineering and Data mining
Ph.D, Professor, Computer Science,SCSVMV University, Kanchipuram, India
Dr.Sambit Kumar Mishra
Specialization Database Management Systems
BE, ME, Ph.D,Professor, Computer Science Engineering
Gandhi Institute for Education and Technology, Baniatangi, Khordha, India

iv
Dr. M. VenkataRamana
Specialization in Nano Crystal Technology
Ph.D,Professor, Physics,Andhara Pradesh, INDIA
DR. C. M. Velu
Prof.& HOD, CSE, Datta Kala Group of Institutions, Pune, India
Dr.RabindraKayastha
Associate Professor, Department of Natural Sciences
School of Science, Kathmandu University, Nepal
Dr. P. Suresh
Specialization in Grid Computing and Networking, Associate Professor, Department of Information
Technology, Engineering College, Erode,Tamil Nadu ,INDIA
Dr. Uma Choudhary
Specialization in Software Engineering Associate Professor, Department of Computer Science Mody
University, Lakshmangarh, India
Dr.Varun Gupta
Network Engineer,National Informatics Center , Delhi ,India
Dr. Hanuman Prasad Agrawal
Specialization in Power Systems Engineering Department of Electrical Engineering, JK Lakshmipat
University, Jaipur, India
Dr.Hou, Cheng-I
Specialization in Software Engineering, Artificial Intelligence, Wisdom Tourism, Leisure Agriculture and
Farm Planning, Associate Professor, Department of Tourism and MICE, Chung Hua University, Hsinchu
Taiwan
Dr. Anil TrimbakraoGaikwad
Associate Professor at BharatiVidyapeeth University, Institute of Management , Kolhapur, India
Dr. Ahmed Kadhim Hussein
Department of Mechanical Engineering, College of Engineering, University of Babylon, Republic of Iraq
Dr.GamalAbd El-Nasser Ahmed Mohamed Said
Computer Lecturer, Department of Computer and Information Technology, Port Training Institute (PTI),
Arab Academy For Science, Technology and Maritime Transport, Egypt
Mr. T. Rajkiran Reddy
Specialization in Networing and Telecom
Research Database Specialist, Quantile Analytics, India
M. HadiAmini
Carnegie Mellon University, USA

v
Vol-4, Issue-8, Aug 2017
Sr
No. Detail
1
Effect of Intermediate Quenching and Tempering on the Mechanical Behaviour of Low Carbon
Steel
Author: Sunday Chukwuyem Ikpeseni
DOI: 10.22161/ijaers.4.8.1
Page No: 001-010
2
Cement Mortar Restorations and Disorders in the Archaeological Site of Chellah
Author: Meriem Benharbit
DOI: 10.22161/ijaers.4.8.2
Page No: 011-014
3
Behavior of the Physiochemical Parameters of Raw Milk Stored in Temporary Horizontal
Storage Tanks
Author: Maria Regina Thomaz, Francieli DalCanton, Josiane Maria Muneron de Mello, Sideney
Becker Onofre
DOI: 10.22161/ijaers.4.8.3
Page No: 015-023
4
Functionalized up conversion rare earth nanoparticles for bio imaging of cancer cells
Author: Chavez-Garca D., Juarez-Moreno K., Campos C. H., Alderete J. B., Hirata G.A.
DOI: 10.22161/ijaers.4.8.4
Page No: 024-031
5
Analysis of fire extinguisher gauge level using OpenCV
Author: Gayatri Behera
DOI: 10.22161/ijaers.4.8.5
Page No: 032-033
6
A Secure IoT Data Integration in Cloud Storage Systems using ABAC Access Control Policy
Author: Ismail Chahid, Abderrahim Marzouk
DOI: 10.22161/ijaers.4.8.6
Page No: 034-037
7
Incompatibility stone-mortar Influence of pH on the sensitivity of rocks to saline alterations
Author: Meriem Benharbit
DOI: 10.22161/ijaers.4.8.7
Page No: 038-042
8
Influence of Coal Rock Hardness and Confining Pressure on load Fluctuation Characteristics of
PDC bit during Gas Extraction Borehole in Soft Coal Seam
Author: Shifeng Wang, Xiaoming Han, Qiangqiang Zhang, Jialiang Li, Detuo Chene
DOI: 10.22161/ijaers.4.8.8
Page No: 044-048

vi
9
A Nondestructive Technique for EM-Parameter Determination of Compound Materials using
Rectangular Waveguide Sensor and Layered Material Media
Author: Abdulkadhum A. Hassan, Janan H. Saadie
DOI: 10.22161/ijaers.4.8.9
Page No: 049-055
10
Gamma Irradiation Effect of <sup>60</sup>Co on the Germination of two subtropical species in
the Tehuacán-Cuicatlán Valley
Author: Ernesto Díaz López, Alejandro Morales Ruíz, Arturo Olivar
Hernández, Patricia Hernández Herrera, Juan Antonio Juárez Cortes,
Jorge Francisco Leon de la Rocha, Nazario Francisco Francisco, Heliodoro Santiago Santia
DOI: 10.22161/ijaers.4.8.10
Page No: 056-061
11
Preliminary Studies of Groundwater Potential and It's Distribution Patterns in the Gumuk at
Jember
Author: Priyantari N., Supriyadi, Suprianto A., Imbani A.N., Astutik L
DOI: 10.22161/ijaers.4.8.11
Page No: 062-069
12
Impact of GST on E-Commerce
Author: Ms. Priti Jadhav, Ms. Manjushree Yewale, Ms. Trupti Kalyankar, Mrs. Vandana Nemane
DOI: 10.22161/ijaers.4.8.12
Page No: 070-073
13
Block Transformation for Encrypted Image through RDH
Author: Pavana K P, Mrs. Aritri D.Ghosh
DOI: 10.22161/ijaers.4.8.13
Page No: 074-079
14
A Multi-Agent Systems Contribution for Audit and Change Management
Author: Nabil Benanbaar, Laila Moussaid, Hicham Medromi
DOI: 10.22161/ijaers.4.8.14
Page No: 080-085
15
Potential of Egg shell powder as replacement of Lime in soil stabilization
Author: Anoop S P, Hizana Beegom, Jwoleena P Johnson, Midhula J, Tharis Muhammed T N,
Prasanth S
DOI: 10.22161/ijaers.4.8.15
Page No: 086-088

International Journal of Advanced Engineering Research and Science (IJAERS) [Vol-4, Issue-8, Aug- 2017]
https://dx.doi.org/10.22161/ijaers.4.8.1 ISSN: 2349-6495(P) | 2456-1908(O)
www.ijaers.com Page | 1
Effect of Intermediate Quenching and Tempering
on the Mechanical Behaviour of Low Carbon Steel Sunday Chukwuyem Ikpeseni
Department of Mechanical Engineering, Delta State University, P.M.B. 1, Abraka, Oleh Campus, Delta State, Nigeria.
Abstract— This research has assessed the impact of
intercritical annealing using the intermediate quenching
technique and tempering on the mechanical properties of
low carbon steel. The procedure involved austenitizing at
850OC for 1hour followed by quenching in water and
thereafter annealed at 730OC, 750OC and 770OC (i.e. α + γ
region) for 30 minutes and then quenched in water again.
Some of the as-quenched samples were tempered at 320OC
for 1hour and cooled in still air. Tensile, hardness and
impact tests as well as microstructure characterization
were conducted for samples from all the heat treatment
schedules. It was observed from the results that martensite
volume fraction increases almost linearly as a function of
temperature. Ductility and impact decreased with increase
in temperature. Tempering deteriorated the assessed
mechanical properties. Hence, for a steel of this
composition, intermediate quenching should not be
followed by tempering.
Keywords— intermediate quenching, intercritical
annealing, mechanical properties, martensite volume
fraction, dual phase steel.
I. INTRODUCTION
The microstructure of steels can be altered by changing
processing parameters, which ultimately affects their
mechanical properties. These process parameters which can
be altered include the base steel composition, mode of
manufacture, type of heat treatment and parameters of heat
treatment such as temperature, soaking time, heating and
cooling rates, cooling media etc.
Intermediate quenching is one of the various types of heat
treatment for developing dual phase (DP) steels. Over the
recent years, DP steels have been widely used in the
automotive industries because of good compromise between
its high strength and reasonable ductility which enhances
performance and crash safety as well as high fuel economy
due to weight reduction as a result of the improve strength.
This weight reduction also impacts positively on the
environment because of drastic reduction in emissions to
the environment. Apart from the automotive industry, DP
steels have found applications in oil and gas industries,
building and structural industries, earth moving equipment
(yellow goods) etc. Furthermore, very tall structures in the
form of skyscrapers are becoming common these days due
high demand on land. Hence, the urgent need to provide
common materials with ultra-high strength at reasonable
cost cannot be over emphasized. This will help to militate
against the frequent occurrence of collapsed buildings in the
country. Again, the high demand for large diameter and
high strength pipes for the conveyance of crude oil and
petroleum productions requires materials with excellent
formability, high strength and good weldability.
Hence, this research is intended to investigate the influence
of intermediate quenching and tempering on the mechanical
behaviour of low carbon steel. Intermediate quenching uses
martensite microstructure as the starting or initial
microstructure for the intercritical annealing heat treatment
process. Bagetal have worked on intermediate quenching,
step quenching and direct quenching using high strength
low alloy (HSLA) steel. Ikpeseni etal had worked on step
quenching and direct quenching using low carbon steel [17,
18]. A good number of researchers have worked on the
effect of processing parameters on the properties of dual
phase steels with encouraging results [1 – 20]. [1 – 3]
examined the effect of cooling rates; the effect of alloying
element on mechanical properties was investigated by [4 –
12]; while [13, 16,17] worked on the effect of the
temperature. Furthermore, [14, 15, 17] examined strain or
deformation effect while [15, 18 - 21] examined the impact
of microstructure on mechanical properties of the
investigated steels.
II. MATERIALS AND METHOD
2.1 Materials
The carbon steel used for this research was supplied by
universal steel Lagos, Nigeria. Its chemical composition
shown in Table 1was determined as documented in [17].

International Journal of Advanced Engineering Research and Science (IJAERS) [Vol-4, Issue-8, Aug- 2017]
https://dx.doi.org/10.22161/ijaers.4.8.1 ISSN: 2349-6495(P) | 2456-1908(O)
www.ijaers.com Page | 2
Table.1: Chemical Composition of the Investigated Steel
Element C Si Mn S P Cr Ni Cu B Ti Fe
Weight
(%) 0.23 0.20 0.73 0.03 0.03 0.12 0.10 0.27 0.001 0.001 98.28
2.2 Methods
2.2.1 Sample preparations
Standard samples for tensile test, impact test, hardness test
and microscopic examination were prepared from the as-
received 16mm diameter rod. All the samples were prepared
following standard procedures.
2.2.2 Heat Treatments
All the samples were first of all normalized in a muffle
furnace at 8500C for 1hr in order to cancel the effects of
previous mechanical, thermal or thermo-mechanical
treatments. After normalizing some of the samples were left
as control, while others were subjected to the intermediate
quenching (an intercritical annealing) heat treatment. This
involved austenitizing at 8500C for 1hr and quenching in
water to produce martensite which was used as the starting
or initial microstructure for the intercritical annealing.
Thereafter, all the samples were intercritically annealed at
various temperatures of 7300C, 7500C and 7700C (i.e. in α +
γ region) for thirty minutes each, followed by quenching in
water. Then some set of these sample were tempered at
3200C for 1hr, while the others are left in their intermediate
quenched state.
2.2.3 Mechanical Properties Testing
Tensile test: an instron Universal tensile testing machine
was used to conduct the tensile test. The sample were tested
at a cross head speed of 20mm/min and were all tested to
fracture at room temperature (25 -270C). All the tensile
properties data were captured by the interfacing computer
system.
Impact test: The charpy impact tester (Avery) was used to
determine the absorbed energy and thereafter the impact
strength (toughness) of the heat treated samples were
evaluated. Again, all the samples were tested to fracture at
room temperature. Thereafter the fractured surfaces were
examined under the scanning electron microscope (SEM) in
order to ascertain the mode of fracture.
Hardness test: The hardness property of samples from all
the heat treatment schedules were examined using the
Vickers hardness testing machine (LM 7 700AT Leco) with
a dwell time of 10 – 15S. The hardness values are digitally
displayed on the machine screen.
2.2.4 Microstructure Characterization
Nikon Eclipse (me 600) was used to examine the
microstructures developed after the various heat treatment
schedules. This was preceded by sample preparation using
standard procedures. A combination of sylvert cloth and
0.2µ diamond paste was used to polish the samples while
2% NITAL was used as etchant. The standard grid point
count technique was used to determine martensite volume
fracture (MVF) as contained in Russ and Dehoff (1999)
[22].
III. RESULTS AND DISCUSSION
3.1 Microstructural Evolution of Intermediately
Quenched Samples
Figures 1a - g show the microstructures
developed after intermediate quenching and
subsequent tempering. The structures revealed
predominantly features of ferrite (light) and
martensite (grey) with dispersion of carbide or
retained austenite (dark) in some of the
microstructures.

International Journal of Advanced Engineering Research and Science (IJAERS) [Vol-4, Issue-8, Aug- 2017]
https://dx.doi.org/10.22161/ijaers.4.8.1 ISSN: 2349-6495(P) | 2456-1908(O)
www.ijaers.com Page | 3
a
b c d
e f g
Fig.1: (a) Photomicrograph of A X400 i.e. Phase structure produced by normalizing at 850oC for one hour. The structure
reveals ferrite (light phase) and pearlite (alternate layers of ferrite - light and cementite – dark).(b) Photomicrograph of IQ730
X200. Sample intermediately quenched at 730OC for 30 minutes. The structure reveals distribution of regularly shaped globular
ferrite (light) and martensite (grey) with little dispersed carbide (dark).
(c) Photomicrograph of IQ730T X200. Sample intermediately quenched at 730OC for 30 minutes and tempered at 320OC for
1hour. The structure reveals distribution of ferrite (light) matrix, tempered martensite (grey) and dispersed fine carbide (dark).
(d) Photomicrograph of IQ750 X200. Sample intermediately quenched at 750OC for 30 minutes. The structure reveals
distribution of fine fibrous martensite (grey) in a ferrite (light) matrix. (e) Photomicrograph of IQ750T X200. Sample
intermediately quenched at 750OC for 30 minutes and tempered at 320OC for 1hour. The structure reveals distribution of
tempered martensite (gray) and nucleated ferrite (bright) mainly along grain boundaries in a network of ferrite (light) matrix.(f)
Photomicrograph of IQ770 X500. Sample intermediately quenched at 770OC for 30 minutes. The structure reveals lath
martensite (grey), ferrite (light) and little dispersed carbide (dark). (g) Photomicrograph of IQ770T X200. Sample
intermediately quenched at 770OC for 30 minutes and tempered at 320OC for 1hour. The structure reveals network of tempered
martensite (gray), ferrite (light) and dispersion of plenty carbide (dark).
Figures 1(b, d and f) are the microstructure photographs of
the as-quenched samples subjected to intermediate quench
treatment.
Martensite (probably with very small percentage of retained
austenite) formed as a product of quenching from the
austenitizing temperature (850oC) was used as the initial
microstructure for this treatment. Intercritical annealing at
the various temperatures gradually transforms the formed
martensite to austenite and ferrite. Austenite formation from
martensite structure was observed to occur by classical
heterogeneous nucleation at imperfect lattice sites like
spheroids in ferrite, matrix /carbide interface, martensite
lath boundaries, and prior austenite grain boundaries [20,
22]. The photomicrographs display tiny but numerous

International Journal of Advanced Engineering Research and Science (IJAERS) [Vol-4, Issue-8, Aug- 2017]
https://dx.doi.org/10.22161/ijaers.4.8.1 ISSN: 2349-6495(P) | 2456-1908(O)
www.ijaers.com Page | 4
globular/fibrous martensites after soaking for 30 minutes,
with some carbide particles precipitated along prior
austenite boundary, in a ferrite matrix in the microstructure
(see Fig. 1b, d). Martensite volume fraction is noticed to
increase as a function of intercritical annealing temperature.
This is so because austenite nucleation at different sites
mentioned above continued and increases at higher
temperatures. Hence the microstructures became greatly
enriched with more martensite on quenching. It was clearly
shown (qualitatively) that martensite grain size remained
fairly the same. Pinning down of the grain boundaries by
precipitated carbide particles in prior boundaries of
austenite must have been responsible for this. Honeycombe
and Bhadeshia[23] stated that these are usually present in
grain boundaries; as such an interaction occurs between the
grain boundary and the particles. They explained that when
there is replacement of a short length grain boundaries by
particles, the interfacial energy help to maintain a stable
configuration such that any attempt for the grain boundary
to move away or separate from the particles, there is an
increase in local energy; as a result the particle exerts a drag
on the boundary.
3.1.1 Effect of Intercritical Annealing Temperature and
Starting Microstructure on the Volume Fraction of
Martensite (MVF)
Martensite was used as starting microstructure for the
intermediate quenching intercritical annealing heat
treatment to produce the dual phase (ferrite-martensite)
structures. The intercritical annealing heat treatment was
conducted at various temperatures in order to produce dual
phase microstructures with varied proportions of martensite
in a ferrite matrix. The effect of intercritical annealing
temperature on MVF is presented in Fig. 2. As indicated, it
is clear that MVF increases almost linearly with intercritical
annealing temperature. This is in agreement with the
observation of earlier published research findings [19,
20,24] As intercritical annealing temperature increases, the
amount of austenite increased which transformed to
martensite upon quenching. The simulated (fitted) linear
curve for the treatment schedule is shown in equation (1) as
obtained from Fig. 2.
VM = 0.325T – 203.4 (1)
R2 = 0.953
where T = intercritical annealing temperature
VM = martensite volume fraction
The high value of R2 indicates a high correlation between
the simulated and experimental data, which also indicates
the validity and reliability of equation (1).
The high martensite volume fraction of intermediate
quenched samples could be attributed to numerous sites for
nucleation of austenite which transforms to martensite upon
quenching. Some of these sites as suggested by Bag et al
[20] include:
a. Prior grain boundaries of austenite
b. Carbide particles precipitated on prior grain
boundaries of austenite
c. Spheroids in ferrite
d. Fine carbide arrays formed on the prior martensitic
plate/lath boundaries.
The shape, size and distribution of martensite in the
microstructures of the samples given the intermediate
quenching treatment stems from the process of reversion of
austenite from the tempered martensite. Austenite
nucleation from the prior martensite could take place at
various locations or sites as listed from a – d above.
Fig.2: Martensite Volume Fraction vs Temperature
y = 0.325x - 203.42R² = 0.953
0
10
20
30
40
50
60
720 740 760 780 800
MV
F (%
)
INTERCRITICAL ANNEALING TEMPERATURE (OC)
IQ

International Journal of Advanced Engineering Research and Science (IJAERS) [Vol-4, Issue-8, Aug- 2017]
https://dx.doi.org/10.22161/ijaers.4.8.1 ISSN: 2349-6495(P) | 2456-1908(O)
www.ijaers.com Page | 5
3.1.2 Effect of Tempering on the Microstructure of
Intermediate Quenched Samples
On tempering, the as-quenched intermediate quenched
samples at 320OC for 1hr, the microstructure consisted of
fine grained tempered martensite and ferrite for IQ730T,
with dispersion of fine carbide – Fig. 1c, while for IQ750T
and IQ770T, the ferrite phase became well defined and
coarse with plenty of carbide especially IQ770T as shown
in Fig. 1e and g.
3.2. Effect of Process Parameters on the Mechanical
Properties
Figures 3 – 6 present the results of the mechanical
properties which show the relationships between the
mechanical properties and intercritical annealing
temperatures.
Fig. 3: Ultimate Tensile Strength vs Temperature
Fig. 4: Strain at Fracture vs Temperature
y = 11.651x - 7785.3R² = 0.9999
y = -8.2493x + 6560.3R² = 0.9452
0
200
400
600
800
1000
1200
1400
720 730 740 750 760 770 780
UTS
(N
/mm
2 )
TEMPERATURE (OC)
IQ
IQT
Linear (IQ)
Linear (IQT)
0
5
10
15
20
25
30
35
40
720 730 740 750 760 770 780
STR
AIN
AT
FRA
CTU
RE
(%)
TEMPERATURE (OC)
IQ
IQT

International Journal of Advanced Engineering Research and Science (IJAERS) [Vol-4, Issue-8, Aug- 2017]
https://dx.doi.org/10.22161/ijaers.4.8.1 ISSN: 2349-6495(P) | 2456-1908(O)
www.ijaers.com Page | 6
Fig. 5: Impact Toughness vs Temperature
Fig. 6: Hardness vs Temperature
3.2.1 Effect of Annealing Temperature on the Mechanical
Properties of Intermediate Quenched Samples
Variation of hardness value temperature for all the samples
is presented in Fig. 6. The hardness of intermediate
quenched samples increases steadily with rise in
temperature within the investigation limit. The rise in
hardness value is attributed to the increasing martensite
volume fraction as intercritical annealing temperature
increases (Fig. 1).
The ultimate tensile strength of samples given the
intermediate quenching intercritical heat treatment,
increased steadily with increasing temperatureas shown in
Fig. 3 (IQ series). The decrease in strain at fracture (i.e.
ductility or total elongation) and impact strength could be
traced to nucleation, growth and recrystallization of ferrite
and austenite from the initial martensite structure, which
upon quenching the nucleated austenite transforms to
martensite. Consequently, strain at fracture and impact
toughness of samples given this same treatment decreased
as temperature increased (Fig. 4 and 5). Continuous
yielding was observed for all the samples given this
particular treatment, which is a common characteristic of
regular dual phase steels. Austenite to martensite
transformation involves volume expansion which introduces
0
0.2
0.4
0.6
0.8
1
1.2
1.4
1.6
1.8
2
720 730 740 750 760 770 780
IMP
AC
T TO
UG
HN
ESS
(J/m
m2 )
TEMPERATURE (OC)
IQ
IQT
0
50
100
150
200
250
300
350
400
720 730 740 750 760 770 780
HA
RD
NES
S (H
v)
TEMPERATURE (OC)
IQ
IQT

International Journal of Advanced Engineering Research and Science (IJAERS) [Vol-4, Issue-8, Aug- 2017]
https://dx.doi.org/10.22161/ijaers.4.8.1 ISSN: 2349-6495(P) | 2456-1908(O)
www.ijaers.com Page | 7
residual stress on the surrounding ferrite as a result of the
strain produced during the transformation [25,26, 27]. Davis
(1979) [28] and Rigsbeeet al (1979) [29] explained that this
change in volume causes neighbouring ferrite grains to be
plastically deformed, thus generates high density of mobile
dislocations in the surrounding ferrite. This ultimately
results to the generation of mobile dislocations. This could
have increased the hardness and ultimate tensile strength,
while ductility was decreased as a function of temperature.
The fall in impact strength and ductility could also be
attributed to decreased carbon content of the martensite at
higher martensite volume fraction, because MVF increases
with increase in temperature and at higher MVF carbon
content of martensite decreases.
Optimum mechanical properties for intermediate quenched
samples are observed at 730OC (i.e. 33% martensite volume
fraction). A comparison of improvement of properties
showed that hardness, ultimate tensile strength, total
elongation and impact strength are 74.4%, 7.2%, 64.7% and
33.1% respectively over the normalized samples. Summary
of all the assessed mechanical properties is presented in
Table 2.
Table.2: Summary of Mechanical Properties Results
SAMPLE UTS(N/mm2) YS
(N/mm2) YS/UTS
TEL
(%)
IS
(J/mm2) HARDNESS
A 670.55 385.96 0.56 21.97 1.30 161.7
IQ730 718.56 416.76 0.58 36.12 1.73 282.0
IQ750 955.70 583.00 0.61 15.65 0.78 327.8
IQ770 1184.64 805.55 0.68 7.63 0.53 358.9
IQ730T 561.28 325.54 0.58 37.11 1.68 225.3
IQ750T 327.50 - - 12.43 0.33 307.4
IQ770T 231.31 120.28 0.52 11.67 0.25 292.2
3.2.2 Effect of Tempering on the Properties of
Intermediate Quenched Sample
Fig.6 shows that tempering the as-quenched intermediately
quenched sample at 320OC for 1hr decreases hardness (IQT
series). However, the hardness increased with temperature
and reached a peak at 750OC. The increased hardness with
increase in martensite volume fraction can be attributed to
the precipitation of carbide on tempering — see Fig. 1e and
g. The decrease in value of hardness observed with
tempered intermediate quenched (IQT) samples could be as
a result of the coarsening of soft ferrite phase as shown in
Fig. 1e and g respectively. This emanated from precipitation
of more ferrite from martensite on tempering.
All the other properties equally deteriorated on tempering at
320OC for 1hour.
Conventional stress – strain curve with discontinuous
yielding was observed for IQ730T (i.e. sample
intermediately quenched with 33% martensite volume
fraction and tempered at 320OC for an hour), while the
others exhibited continuous yielding which is typical of
conventional dual phase steel.
3.3 Fractography
Figure 7 shows the fractured surfaces of the failed impact
test samples upon testing. Figures 7b, c and d present the
fractured surfaces of IQ730, IQ730T and IQ750 samples
respectively. They revealed predominantly dimple fibrous
surface which is typical of materials with good combination
of high strength, ductility and impact toughness. It showed
that IQ730T has majorly dimple fibrous fractured surface
with dislocations cutting across circular obstacles. On the
other hand, Fig. 7e, f and g display the fractured surfaces of
IQ750T, IQ770 and IQ770T respectively, which revealed
majorly pure or quasi cleavage fracture, no wonder the low
impact strength exhibited by these samples (Table 2).

International Journal of Advanced Engineering Research and Science (IJAERS) [Vol-4, Issue-8, Aug- 2017]
https://dx.doi.org/10.22161/ijaers.4.8.1 ISSN: 2349-6495(P) | 2456-1908(O)
www.ijaers.com Page | 8
a
b c d
e f g
Fig. 7: (a)Impact fractured surface ofA (i.e. Sample normalised at 850oC for one hour). Structure reveals fibrous surfaces with
cavity. (b)Impact fractured surface ofIQ730(i.e.Sample intermediately quenched at 730OC for 30 minutes). Structure reveals
fibrous surface.
(c) Impact fractured surface of IQ730T (i.e. Sample intermediately quenched at 730OC for 30 minutes and tempered at 320OC
for 1hour). Structure reveals majorly dimple fibrous fractured surface with dislocations climbing on circular obstacles. (d)
Impact fractured surface of IQ750 (i.e. Sample intermediately quenched at 750OC for 30 minutes). Structure reveals fibrous
fractured surface. (e)Impact fractured surface ofIQ750T(i.e.Sample intermediately quenched at 750OC for 30 minutes and
tempered at 320OC for 1hour). Structure reveals pure cleavage surface. (f) Impact fractured surface of IQ770 (i.e. Sample
intermediately quenched at 770OC for 30 minutes). Structure reveals quasi cleavage fractured surface. (g) Impact fractured
surface of IQ770T (i.e.Sample intermediately quenched at 770OC for 30 minutes and tempered at 320OC for 1hour). Structure
reveals quasi cleavage fractured surface. Presence of some cracks across grain boundaries was also observed.

International Journal of Advanced Engineering Research and Science (IJAERS) [Vol-4, Issue-8, Aug- 2017]
https://dx.doi.org/10.22161/ijaers.4.8.1 ISSN: 2349-6495(P) | 2456-1908(O)
www.ijaers.com Page | 9
IV. CONCLUSION
From the analysis conducted in this research, it can be
concluded that for intermediate quenching heat treatment:
i. Increase in intermediate quenching temperature
leads to increased MVF.
ii. Tensile strength and hardness value of the as-
quenched steel increased with increase in
temperature and MVF while impact toughness and
ductility decreases with increase in temperature
and MVF.
iii. Tempering the as-quenched samples deteriorated
all the properties assessed.
iv. Ferrite/martensite microstructures associated with
conventional DP steels was developed from the
investigated low carbon steel using intermediate
quenching intercritical annealing heat treatment.
It is therefore recommended that unlike the step quenching
technique, for a carbon steel of this composition, it should
not be tempered after intermediate quenching heat
treatment.
REFERENCES
[1] Sakuma, Y.; Matsumura, O. and Takechi, H. (1991):
Mechanical-Properties and Retained Austenite in
Intercritically Heat-Treated Bainite-Transformed Steel
and Their Variation with Si and Mn Additions.
Metallurgical Transactions A, 22 (2): 489-498.
[2] Minote, T.; Torizuka, S.; Ogawa, A. and Niikura, M.
(1996): Modelling of Transformation Behaviour and
Compositional Partitioning in TRIP Steel. ISIJ
International, 36 (2): 201-207.
[3] Speer, J. and D. Matlock (2002): Recent
Developments in Low-Carbon Sheet Steels.Journal of
the Minerals, Metals and Materials Society,54(7): p.
19-24.
[4] Bleck, W. and K. Phiu-On (2005): Microalloying of
Cold-formable Multi Phase Steel Grades. Journal of
the Minerals Metals & Materials Society, 54 (7): 19-
24.
[5] Speich, G.R. (1990): Dual-Phase Steels, in ASM
Handbook, ASM International,424-429.
[6] Llewellyn, D.T. and D.J. Hillis (1996): Dual phase
steels.Ironmaking and Steelmaking, 23(6): 471-478.
[7] Verdeja, J.I., J.A. Pero-Sanz, and J. Asensio (2005):
Multiphase Steels: Structure – Mechanical Properties
Relationships in the Cold Rolled and Continuous
Annealed Condition.Microalloying for NewSteel
Processes and Applications, 500-501: 429-435.
[8] El-Sesy, I.A. and Z.M. El-Baradie (2002): Influence
Carbon and/or Iron Carbide on the Structure and
Properties of Dual-Phase Steels.Materials Letters,
57(3): 580-585.
[9] Oliver, S., T.B. Jones, and G. Fourlaris (2007): Dual
Phase versus TRIP Strip Steels: Comparison of
Dynamic Properties for Automotive Crash
Performance.Materials Science and Technology,
23(4): 423-431.
[10] DeArdo, A.J.; Gray, J.M. and Meyer, L. (1984):
Fundamental Metallurgy of Niobium in Steel. San
Francisco, California, 685-759.
[11] Backe, L. (2009): Modeling the Microstructural
Evolution during Hot Deformation of Microalloyed
Steels. Ph.D. Thesis, Royal Institute of Technology,
Stockholm.
[12] Yamamoto, S.; Ouchi, C. and Osuka, T. (1982): The
Effect of Microalloying Elements on the Recovery and
Recrystallization in Deformed Austenite.
Thermomechanical Processing of Microalloyed
Austenite, Pittsburgh, Pennsylvania, 613-639.
[13] Alaneme K.K., Ranganathan S. and Mojisola T.
(2010): Mechanical Behaviour of Duplex Phase
Structures in a Medium Carbon Low Alloy Steel,
Journal of Minerals and Materials Characterization
and Engineering, 9 (7): 621 – 633.
[14] Calcagnotto, M.; Ponge, D. and Raabe, D. (2008):
Ultrafine Grained Ferrite/Martensite Dual Phase Steel
Fabricated by Large Strain Warm Deformation and
Subsequent Intercritical Annealing. ISIJ International,
48 (8): 1096-1101.
[15] Park, K.T.; Lee, Y.K. and Shin, D.H. (2005):
Fabrication of Ultrafine Grained Ferrite/Martensite
Dual Phase Steel by Severe Plastic Deformation. ISIJ
International, 45 (5): 750-755.
[16] Hanzaki, A.Z.; Hodgson, P.D. and Yue, S. (1997):
Retained Austenite Characteristics in
Thermomechanically Processed Si-Mn
Transformation-induced Plasticity Steels.
Metallurgical and Materials Transactions A, 28 (11):
2405-2414.
[17] Ikpeseni S.C., Onyekpe B.O. and Momoh I.M. (2015):
Effect of Tempering on the Microstructure and
Mechanical Properties of Austenitic Dual Phase Steel.
International Journal of Physical Sciences, 10(16):
490 – 497. DOI: 10.5897/IJPS 2015.4377
[18] Ikpeseni S.C., Onyekpe B.O. and Ovri H. (2015):
Influence of Intercritical Annealing Temperature on
Mechanical Properties and Microstructure of 0.23%C

International Journal of Advanced Engineering Research and Science (IJAERS) [Vol-4, Issue-8, Aug- 2017]
https://dx.doi.org/10.22161/ijaers.4.8.1 ISSN: 2349-6495(P) | 2456-1908(O)
www.ijaers.com Page | 10
Low Alloy Steel. Nigerian Journal of Technology
(NIJOTECH), 349(3): 499 – 505.
http://dx.doi.org/10.4314/njt.v34i3.11
[19] Majid P. (2010): Tensile Strength and Ductility of
Ferrite – Martensite Dual Phase Steels, Association of
Metallurgical Engineers of Serbia (AMES), 187 – 194.
[20] Bag, A.; Ray, K.K. and Dwarakadasa, E.S. (1999):
Influence of Martensite Content and Morphology on
Tensile and Impact Properties of High-Martensite
Dual-Phase Steels. Metallurgical and Materials
Transactions A, 30 (5): 1193-1202.
[21] Ikpeseni S.C. (2016): The Effect Of Microstructure on
the Mechanical Properties and Corrosion
Susceptibility of Dual Phase Steel Developed from
0.234%C Steel. Ph.D. Thesis submitted to P.G.
School, University of Benin, Benin City, Nigeria.
[22] Russ J.C. and Dehoff R.T. (1999): Practical
Stereology. 2nd Ed, Plenum Press, New York.
[23] Honeycombe, R.W.K and Bhadeshia,H.K.D.H,
(1995): Steels, Microstructure and properties,2nd ed.,
Edward Arnold, London.
[24] Dzupon M., Parilak L. Kollarova M. and Sinaiova I.
(2007): Dual Phase Ferrite – Martensitic Steel Micro-
Alloyed with V- Nb. Metabk, 46(1)15-20.
[25] Timokhina, I.B.; Hodgson, P.D. and Pereloma, E.V.
(2004): Effect of Microstructure on the Stability of
Retained Austenite in Transformation-Induced-
Plasticity Steels. Metallurgical and Materials
Transactions A, 35A (8): 2331-2341.
[26] Colla, V.; De Sanctis, M.; Dimatteo, A.; Lovicu, G.;
Solina, A. and Valentini, R. (2009): Strain Hardening
Behavior of Dual-Phase Steels. Metallurgical and
Materials Transactions A, 40A (11): 2557-2567.
[27] Calcagnotto, M.; Ponge, D.; Demir, E. and Raabe, D.
(2010): Orientation Gradients and Geometrically
Necessary Dislocations in Ultrafine Grained Dual-
Phase Steels Studied by 2D and 3D EBSD. Materials
Science and Engineering A, 527 (10-11), 2738-2746.
[28] Davies, R.G. (1979): Early Stages of Yielding and
Strain Aging of a Vanadium-Containing Dual-Phase
Steel. Metallurgical Transactions A, 10 (10): 1549-
1555.
[29] Rigsbee, J.M.; Abraham, J.K.; Davenport, A.T.;
Franklin J.E. and Pickens, J.W. (1979): Structure and
Properties of Dual-phase Steels. Eds. Kot, R.A. and
Morris, J.W. TMS-AIME, New York, 304-329.
International Journal of Advanced Engineering Research and Science (IJAERS) [Vol-4, Issue-8, Aug- 2017]
https://dx.doi.org/10.22161/ijaers.4.8.2 ISSN: 2349-6495(P) | 2456-1908(O)
www.ijaers.com Page | 11
Cement Mortar Restorations and Disorders in
the Archaeological Site of Chellah Meriem Benharbit
Institut National des Sciences de l’Archéologie et du Patrimoine
Abstract— The restoration works undertaken in the
archaeological site of Chellah in the Sixties used cement
for the consolidation of the Roman structures
undercovered. They’re mainly consisting of calcareous
rocks, which density, porosity, and hardness are lower
then cement, and they’re clearely weakened. Indeed, the
capillary increase to which are subjected the structures
allowed to convey salts whose advance is blocked by the
introduced cement mortar. Trapped in the calcareous
rock, the salts contribute to the acceleration of its
degradation.
Keywords—Chellah, restoration, incompatibility, stone,
cement.
I. INTRODUCTION
In the 1960s, Chellah's archaeological site saw the
consolidation of masonry and structures following the
discovery of buildings dating back to Roman times. As a
result of this work, where the cement mortar was
massively used to reinforce the masonry, important
disorders appeared in the calcareous stone. The purpose
of this article is to underline the incompatibility of the
mortars used with the stone used for the construction of
the Roman buildings and to identify the disorders and
saline phases involved in the deterioration of the cut
stone.
II. PRESENTATION OF THE
ARCHAEOLOGICAL SITE OF CHELLAH
The archaeological site of Chellah, located 4 km away
from the Atlantic coastline overlooks the Bou Regreg
valley and occupies an intramural area of about 7
hectares. The site had a Phoenician occupation in the 6th
century BC and Carthaginian in the 12th century BC.
Later, the Romans settled there and founded a city
mentioned by the Greek astrologer and astronomer
Ptolemy under the name of Sala, and a river port serving
as a Mediterranean counter (Basset H., and Levi-
Provençal E., 1929, Basset H., and Terrasse H., 1932,
Boube J., 1966). This prosperous Roman city surpassed
the site of the Merinid precinct, which still encircles it in
the direction of the river. Chellah was then deserted and
abandoned before being occupied again by the Merinid
sultans who built a necropolis named Al-Ribat Al
Mubarak. An inscription in kufic script on the front door
indicates that the work was completed in 739 AD / 1339
AD. The surrounding walls of the Merinides encircle the
remains of the Roman cities, including the capitol, the
forum, the thermal baths, a nymphaeum and a triumphal
arch. A mosque, a medersa, a mausoleum, rooms for
ablutions and several funerary rooms remain. The site,
property of the state, is protected since November 19,
1920 by the royal decree, which defines as national
historical monument the whole complex of Chellah. Since
2012, Chellah is part of the the sites of Rabat inscribed on
the list of World Heritage of UNESCO as cultural
property.
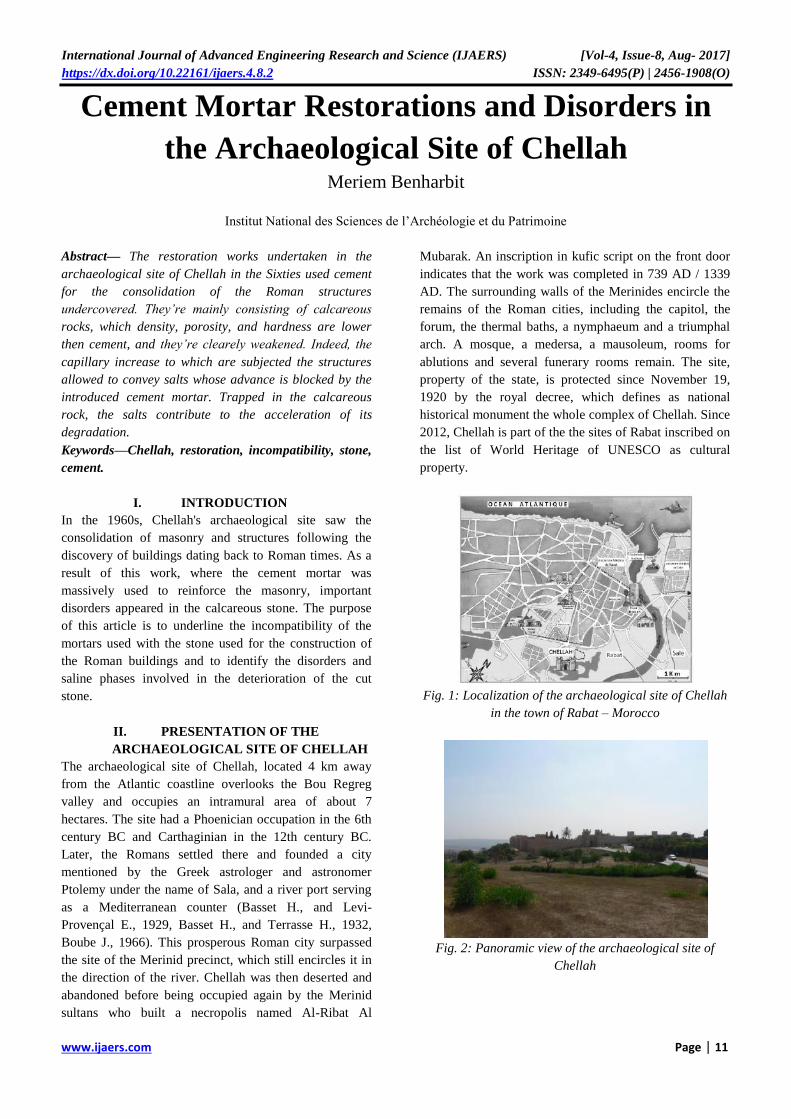
Fig. 1: Localization of the archaeological site of Chellah
in the town of Rabat – Morocco
Fig. 2: Panoramic view of the archaeological site of
Chellah

International Journal of Advanced Engineering Research and Science (IJAERS) [Vol-4, Issue-8, Aug- 2017]
https://dx.doi.org/10.22161/ijaers.4.8.2 ISSN: 2349-6495(P) | 2456-1908(O)
www.ijaers.com Page | 12
III. CHARACTERIZATION OF MATERIALS
USED IN CHELLAH
The cut stone used in the construction of the Roman
structures, of plio-quaternary age, is outlined in the form
of a system of elongated dune cords juxtaposed parallel to
the line of the Atlantic coast from El Jadida to Larache. It
corresponds to the local appellation of calcarenite of Salé.
The rock, of beige color, shows stratification levels (So).
The grain is predominantly millimetric. The petrographic
study of the calcarenite shows a detrital fraction
composed of rock debris and quartz grains and a
bioclastic fraction (Lamellibranchiata, brachiopods and
echinoderms shell fragments). These elements, which
may present specific variations in terms of content and
particle size, are linked by a mainly calcareous phase.
The mechanical strength of the salt stone is about 50 MPa
(Asebriy L., 2010). It is in fact sufficient to allow its use
as a building stone but remains relatively weak, making
its extraction, size and sculpture quite easy compared to
other massive rocks of the region.
The rock has an important porosity ranging from 25 to
35% (Rahmouni A., et al., 2013) releasing cavities of
varying shape and size. This porosity conditions the
sustainability of the rock in the long term: it regulates
fluid transfers, gives the material a surface roughness for
fixing pollutants, and also opens the way to biological
colonization.
Fig. 3: Macroscopic aspect of the calcarenite of Salé
IV. STATEMENT OF THE DESORDS
The archaeological site of Chellah is an excellent exemple
of natural site.The materials are exposed there to the
severe weather, with the animal and vegetable biological
breakdown, and the action of the man (Benharbit, 2017) .
To these factors, the consequences of defective
restoration works undertaken in the Sixties in order to
consolidate the structures of the buildings, are added.
There are also various figures of deterioration such as
illustrated in glossary ICOMOS (2008) going, from the
least harmful, of simple efflorescences saltworks to more
or less dense saline encrustings “fig. 4 and 5”. However,
other figures witnessing of more advanced disorders are
also present: sandy disintegration “Fig.6”, alveolation
“Fig.7” and gullying “Fig.8”.
Fig. 4: Damage Salt develops as encrustation covering
the stone in interface with cement mortar
Fig. 5: Details of the saline efflorecences and encrusting
on the calcarenite of Salé, at the interface stone-mortar

International Journal of Advanced Engineering Research and Science (IJAERS) [Vol-4, Issue-8, Aug- 2017]
https://dx.doi.org/10.22161/ijaers.4.8.2 ISSN: 2349-6495(P) | 2456-1908(O)
www.ijaers.com Page | 13
Fig. 6: Granular decomposition of a block of calcarenite,
consequence of the use of a hard cement mortar. The rock
has grown into a single alveolus.
.
Fig. 7: formation, on the stone surface, of deep
interconnected cavities
Fig.8: In contact with cement mortar, the rock has deep
grooves that hollow out the material highlighting the
hardest levels
V. DETERMINATION OF SALINE PHASES
Sampling was carried out on the saline coverings
developed at the stone-mortar interface and observed
using the Moroccan Foundation for Advanced Science,
Innovation and Research (MAScIR) environmental field
emission electron microscope (FEG). Observations show
that the surface of the rock is lined with deposits of
potassium sulphate. “Fig. 9” and cracks propagating
between the aggregates" Fig. 10 ".
Fig.9: observation with the MEB (X 1600) of potassium
sulphate deposits recovering the surface of the calcareous
rock
Fig.10: development of microcracks propagating on the
surface of the rock
Analysis of the salt deposits formed shows the presence
of potassium sulphate K2SO4. This salt is commonly used
as a fertilizer, potassium being an element that promotes
the accumulation of reserves in both raciness and fruit.
Fig.11: elementary spectrum of analysis obtained with the
MEB of crystallizations saltworks showing of the
potassium and sulphur peaks

International Journal of Advanced Engineering Research and Science (IJAERS) [Vol-4, Issue-8, Aug- 2017]
https://dx.doi.org/10.22161/ijaers.4.8.2 ISSN: 2349-6495(P) | 2456-1908(O)
www.ijaers.com Page | 14
In Chellah, masonries are not isolated at their base. The
capillary increase of water since the ground convey these
salts which forward owing to the porosity of the rock. The
cement mortar used to joint the blocks of calcarenite
constitutes an obstacle for the mobility of the fluids which
concentrate and deposit, during evaporation, the elements
dissolved in the porosity of the rock. These salts generate
disorders which are studied since the the 19th
century (Turner, 1833). The constraints exerted by salts in
the course of growth on the walls of the porous network
of the rocks (Scherer 2004, Putnis and Mauthe, 2001) can
in the long term create and/or to widen cracks in the
rocks.
VI. CONCLUSION
The restorations undertaken in the Sixties used the cement
mortar to consolidate the structutres of the buildings
going back to the Roman occupation. Cement’s higher
quality supposed then, dependening on its hardness and
to the promptitude of the catch, had contributed to its very
broad use in the field of the restoration. This hardness is
unfortunately not the pledge of durability desired for
masonries. Indeed, the strong sealing of the ciment mortar
forbid the water contained in the stone to migrate in the
mortar and to evaporate. Salts are trapped on the level of
the porous calcareous rock contributing thus to the
acceleration of its degradation. Various facies of
degradation developed on the site: efflorescences
saltworks, sandy disintegration and gullying of the blocks
of rock under the effect of the pressures of crystallization
which lead to the progressive unsetting of the components
of the calcarenite.
The analyzed superficial saline efflorescences indicated
potassium sulphates used like fertilizer and which forward
in the rock owing to capillary lift.
REFERENCES
[1] Basset H., et Lévi-Provençal E., Chella : une
nécropole mérinide, E. Larose éditeur, Paris, 1929.
[2] Basset H., et Terrasse H., Sanctuaires et forteresses
almohades, coll. Hesperis, I.H.E.M., Larose éditeur,
Paris, 1932.
[3] Boube J., « Fouilles archéologiques à Sala :
problèmes de la recherche historique au Maroc »
dans Hespéris - Tamuda, T. 7, 1966, p. 23-32.
[4] Asebriy L., 2010. Les monuments historiques de la
ville de Rabat: étude des processus d’altération et
propositions de solutions durables de prévention et de
restauration. Workshop International Patrimoine
géologique et Développement durable de la Région
de Rabat Salé Zemmour Zaer, du 14 au 16 Décembre
2010 à Rabat.
[5] Rahmouni, A., Boulanouar, A., Boukalouch, M.,
Géraud, Y., Samaouali, A., Harnafi, M. & Sebbani, J.
2013. Prediction of Porosity and Density of
Calcarenite Rocks from P-Wave Velocity
Measurements. International Journal of Geosciences,
4, 1292-1299.
[6] Benharbit M., « Le site archéologique de Chellah,
panorama des facteurs de dégradation », 95p. 1ère
édition : juillet 2017. Top Presse Edition-Rabat.
[7] ICOMOS-ISCS : Illustrated glossary on stone
deterioration patterns Glossaire illustré sur les formes
d’altération de la pierre ISBN :978-2-918086-00-0
EAN :9782918086000 Impression septembre 2008,
Ateliers 30 Impression,Champigny/Marne,France
[8] Turner E., « Report on a lecture on the chemistry of
geology ». London and Edimburgh Philosophical
magazine, Journal of Science. 1833. Vol. 3, n°21.
[9] Scherer G. W., « Stress from crystallization of salt »,
Cement and Concrete Research, 34, 2004, p. 1613-
1624.
[10] Putnis, A. and Mauthe G., The effect of pore size on
cementation in porous rocks, Geofluids, 1, 2001,
pp.37-41

International Journal of Advanced Engineering Research and Science (IJAERS) [Vol-4, Issue-8, Aug- 2017]
https://dx.doi.org/10.22161/ijaers.4.8.3 ISSN: 2349-6495(P) | 2456-1908(O)
www.ijaers.com Page | 15
Behavior of the Physiochemical Parameters of
Raw Milk Stored in Temporary Horizontal
Storage Tanks Maria Regina Thomaz, Francieli DalCanton, Josiane Maria Muneron de Mello, Sideney
Becker Onofre
Universidade Comunitária da Região de Chapecó - UNOCHAPECÓ - Center of Exact and Environmental Sciences - CEA -
Graduate's Program in Technology and Innovation Management - PPGTI - Av. Senador Attílio Fontana, 591-E EFAPI -
89809-000 - Chapecó - Santa Catarina - Brazil. E-mail: [email protected].
Abstract—Milk is a product with a high nutritional value,
and it may appear in daily meals in its natural form or
processed and transformed into various milk products. To
be processed in industry, milk must have the proper
quality conditions for its consumption, and the levels of
its constituents must fall within the standards indicated by
Normative Instruction no. 62 (2011). Due to its
composition, its constituents tend to separate when at
rest. In this context, the objective of this work was to
evaluate the behavior of the physiochemical parameters
of chilled raw milk stored in temporary horizontal storage
tanks. With the milk at rest in the tank, collections were
made of the milk at the times of 0, 60, 120, 180, 210, 240,
270 and 300 minutes. These collections were performed
at two points of the tank: at the top collection point (Ps)
and the bottom collection point (Pi) of the tank. After the
collection of the samples, the following parameters were
determined: fat (G), non-fatty solids (SNF), density (D),
cryoscopic index (95), protein (P), lactose (L) and solids
(SI). After completion of the tests, it was possible to verify
that the solid constituents of the milk showed different
behaviors, since the fat separated completely at 210
minutes promoting a stabilization in the separation of the
fat. This same behavior was found for Density and the
Cryoscopic Index. The other solid constituents of the milk
didn't separate, maintaining themselves stable in both the
bottom and top of the tank. As such, the conclusion can be
drawn that fat is the only physiochemical compound that
separates from milk at rest, thus affecting its Density and
Cryoscopic Index.
Keywords - Fat, milk, rest, storage, temporary horizontal
tank.
I. INTRODUCTION
Milk is a white and opaque liquid. It's appearance is the
result of the reflection of light by fat globules, insoluble
phosphates and casein, with variations ranging from
cream to bluish. It has a slightly sweet taste because of
the presence of lactose, sodium chloride, fats and
proteins. It is a homogeneous mixture with a high
nutritional value and it plays a fundamental role in human
nutrition, in addition to providing energy and nutrients for
subsistence (Koblitz, 2011; Gonzaga et al., 2015).
According to the Normative Instruction no. 62/2011 of
the Ministry of Agriculture, Livestock and Food Supply
(MAPA), milk is the product arising from the complete
and uninterrupted milking of healthy. well-nourished and
rested cows in hygienic conditions (Brazil, 2011).
Controlling the physiochemical and microbiological
quality of the milk arriving in industrial and processing
units is crucial to ensure the health of the population and
should be a routine procedure (Tronco 2008; Azevedo
2014).
To be processed in industry, the milk must have the
proper quality and consumption conditions and levels
within the standards indicated by the Normative
Instruction No. 62 of December 29, 2011 from the
Ministry of Agriculture, Livestock and Food Supply
(MAPA), whose parameters are used as indicators to
provide the conditions in which the milk was obtained
and processed or to identify any fraud of the product
(Brazil, 2011).
When the milk arrives at the reception platform of the
dairy industry, milk samples should be collected directly
in the truck and go through a series of analyses through
rapid tests. Standing out as one of the main analyses
required by legislation are the acidity, density, color,
smell and texture tests, but the most important factor to be
analyzed is the temperature of the milk. This temperature
should remain in a range of 7ºC to 10ºC (Brazil, 2011).
The minimum quality requirements that refrigerated raw
milk in rural properties must comply with, and which can
be considered as the acceptable contamination limits of
milk, are: a fat content of at least 3% titratable acidity
between 0.14 and 0.18 g of lactic acid, density at 15°C
between 1.028 and 1.034 g/cm³, dry degreased extract
International Journal of Advanced Engineering Research and Science (IJAERS) [Vol-4, Issue-8, Aug- 2017]
https://dx.doi.org/10.22161/ijaers.4.8.3 ISSN: 2349-6495(P) | 2456-1908(O)
www.ijaers.com Page | 16
(ESD) of at least 8.5g/100g, cryoscopic index of -
0.530°H to -0,550°H, equivalent to -0,512°C and
0.531°C, and a minimum of 2.9 g of proteins (Brazil,
2011; Moura et al., 2013; Liu et al., 2016).
Dairy industries pay producers not only for the volume of
milk, but also for its quality, where a low TBC (Total
Bacteria Count), a low SCC (Somatic Cell Count), and
high levels of protein and fat contribute to more
remuneration (Rezende et al., 2012; Almeida, 2013).
The physiochemical characteristics of milk and their
inter-relationships are a valuable tool to evaluate the
productive performance of dairy cattle, to provide
information about the physiological state of the lactation,
and to diagnose metabolic disorders and their possible
impacts on the industrial processing and the final quality
of milk products (Rowbotham and Ruegg, 2016).
In the tanks of the trucks arriving at the dairy industry,
samples are collected for laboratory tests, which must be
taken after agitation for five to ten minutes by means of
an agitator of the total volume of the tank (Di Domenico,
2009; Ponce, 2009; Bittante et al., 2012; Tonini, 2014)
The fat globules are suspended in water and have a lower
density than it. This causes the formation of a fat layer on
top of the rest of the milk, which must be constantly
stirred to prevent the formation of a too thick layer of fat
at the top. In milk that hasn't been sufficiently
homogenized, differences show up in the composition of
the milk removed from the bottom of the cooler, through
the tap, and from the top, with the aid of the collection
ladle (Durr et al., 2001; 2014; Buza et al., 2014).
Due to the differences in the chemical composition of the
milk, the exact behavior of the physiochemical
parameters of the milk stored in the isothermal tanks of
the trucks waiting for analysis in the platform of dairy
industries so its quality can be determined, is not known.
In this context, the objective of this work was to evaluate
the behavior of the physiochemical parameters of chilled
raw milk stored in temporary storage tanks.
II. MATERIALS AND METHODS
2.1 MILK SAMPLES
This study used chilled raw milk 'in natura' granted by a
dairy producer located in the city of Chapecó - Santa
Catarina. The milk samples supplied by the dairy
producer were of milk collected on the same day as the
analysis. These samples were transported in a cold
chamber to the test laboratories of the Universidade
Comunitária da Região de Chapecó - Unochapeco. The
official analyses were performed in the Food Technology
Laboratory of the Chapecó Campus.
The samples were kept in the temporary horizontal tank,
in a controlled temperature environment of 7.00 ºC ± 2.0,
as determined by the Normative Instruction no. 62
(Brazil, 2011) of the Ministry of Agriculture, Livestock
and Food Supply - MAPA, which establishes that chilled
raw milk in Brazil must pass through an analysis to assess
its quality. All analyses were performed in triplicate.
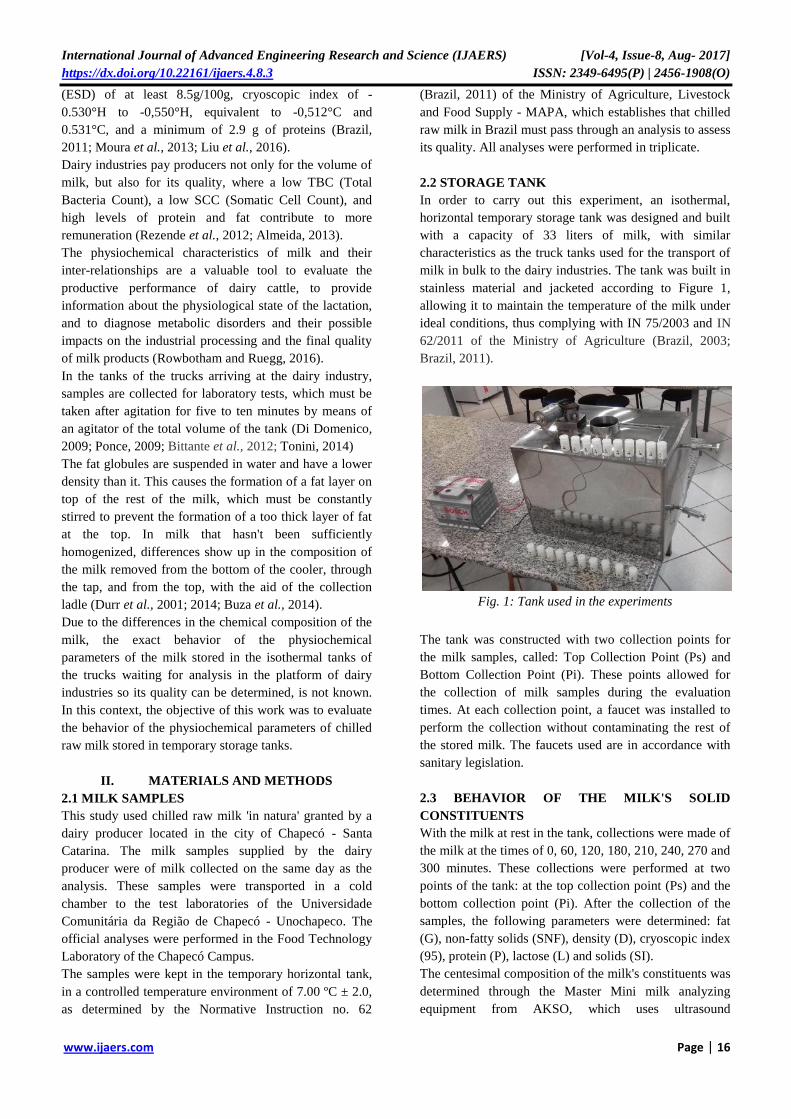
2.2 STORAGE TANK
In order to carry out this experiment, an isothermal,
horizontal temporary storage tank was designed and built
with a capacity of 33 liters of milk, with similar
characteristics as the truck tanks used for the transport of
milk in bulk to the dairy industries. The tank was built in
stainless material and jacketed according to Figure 1,
allowing it to maintain the temperature of the milk under
ideal conditions, thus complying with IN 75/2003 and IN
62/2011 of the Ministry of Agriculture (Brazil, 2003;
Brazil, 2011).
Fig. 1: Tank used in the experiments
The tank was constructed with two collection points for
the milk samples, called: Top Collection Point (Ps) and
Bottom Collection Point (Pi). These points allowed for
the collection of milk samples during the evaluation
times. At each collection point, a faucet was installed to
perform the collection without contaminating the rest of
the stored milk. The faucets used are in accordance with
sanitary legislation.
2.3 BEHAVIOR OF THE MILK'S SOLID
CONSTITUENTS
With the milk at rest in the tank, collections were made of
the milk at the times of 0, 60, 120, 180, 210, 240, 270 and
300 minutes. These collections were performed at two
points of the tank: at the top collection point (Ps) and the
bottom collection point (Pi). After the collection of the
samples, the following parameters were determined: fat
(G), non-fatty solids (SNF), density (D), cryoscopic index
(95), protein (P), lactose (L) and solids (SI).
The centesimal composition of the milk's constituents was
determined through the Master Mini milk analyzing
equipment from AKSO, which uses ultrasound

International Journal of Advanced Engineering Research and Science (IJAERS) [Vol-4, Issue-8, Aug- 2017]
https://dx.doi.org/10.22161/ijaers.4.8.3 ISSN: 2349-6495(P) | 2456-1908(O)
www.ijaers.com Page | 17
technology to analyze the samples. The method is based
on an ultrasound spectroscopy based on the undulating
movement that propagates in the medium where the
product is inserted.
The deformations of the milk molecules indicate if it was
altered in its composition. In addition, the physiochemical
analysis of the milk through ultrasound spectroscopy has
advantages over traditional methods since samples don't
need to be prepared, minimal volumes of the intact
samples need to be used, no chemical reagents or specific
glassware are necessary and results can be obtained in
few minutes.
Before the analyses, the equipment was properly
calibrated and cleaned according to the manufacturer's
instructions. After adding a milk sample to a 25 ml
cuvette, the device sucks in the quantity of milk needed
for analysis and shows the values of the constituents of
the milk under analysis on the screen (Ponsano et al.,
2007).
2.4 STATISTICAL ANALYSIS
The Microcal Origin software, version 7.0 (Microcal
Software Inc., Northamptomn, MA, USA), was used for
the statistical data analysis, ANOVA using the Tukey test,
with a significance level of 5%, was used for the analysis
of variance. The physiochemical parameters were
evaluated by the difference of the sample means
according to the Normative Instruction no. 62 (2011). All
activities were performed in triplicate.
III. RESULTS AND DISCUSSION
The behavior of the physiochemical parameters of the
milk stored in a temporary horizontal tank is presented in
Table 1, 2 and 3. In Table 1 and Figure 2 the fat behavior
can be seen.
Table.1: Behavior of the fat in storage tanks in 8
evaluation times.
Time
(Minutes)
Mean Top Collection
Point
Mean Bottom
Collection Point
0 3.85±0.05aA 3.75±0.05aA
60 4.95±0.05abA 3.85±0.05aA
120 9.70±0.60bA 3.05±0.05aB
180 13.60±0.20bA 3.15±0.05aB
210 15.75±0.15cA 2.75±0.05bB
240 15.85±0.05cA 2.85±0.05bB
270 16.25±0.05cA 2.70±0.10bB
300 16.67±0.05cA 2.70±0.20bB * Means and deviations followed by the same small case letter
in the vertical axis and capital letters on the horizontal axis do
not differ statistically between themselves by the Tukey test at
the level of probability of 5%.
The analysis of the data in Table 1 reveals that there were
variations in the fat levels, both in the samples collected
from the top point and those collected from the bottom
point. One can see that at the starting time (zero minutes),
the observed levels in both points were of 3.85±0.05 and
3.75±0.05 for the top and bottom evaluation points,
respectively. As can be seen, the levels don't differ
significantly among themselves at the level of 5% in
Tukey's Test.
After the 60 minute mark of the milk at rest, one can see
that the fat levels increased until the time of 210 minutes,
with values of 4.95±0.05, 9.70±0.60, 13.60±0.20 and
15.75±0.15 at the times of 60, 120, 180 and 210 minutes,
respectively. As can be seen, the levels found differ
significantly among themselves at the level of 5% in
Tukey's Test. This behavior can be observed in the curves
for the fat separation from the milk, shown in Figure 2.
Fig. 2: Separation of the fat in milk stored in a temporary
horizontal tank.
After 210 minutes, a stabilization of the fat levels can be
observed, because the values found were 15.85±0.05,
16.25±0.05 and 16.67±0.05 at the times of 240, 270 and
300 minutes, respectively. When these data are analyzed,
they show that there is no statistically significant
differences between the data at the evaluation times. This
behavior suggests that the movement of the fat from the
lower to the higher regions of the tank stabilized. One can
therefore infer that the time of separation of the fat and
milk when stored under the conditions of this study is 210
minutes, or 3.5 hours.
In a study conducted by Wangdi, Vijchulata and
Chairatanayuth (2014), in Thailand, the characteristics
were investigated of the separation by gravity of the fat
globules in chilled milk. Similar to this study, the milk
samples collected from the tanker truck remained at rest
for a period of 8 hours, with five samples being taken,
which remained at rest for the times of 0, 2, 4, 6 and 8
hours, in a place with a temperature of 4 °C. While in the
present study samples were collected at the top and
R² = 0,9981
R² = 0,9703
2
4
6
8
10
12
14
16
18
0 100 200 300
Fat
(%
)
Time (minutes)

International Journal of Advanced Engineering Research and Science (IJAERS) [Vol-4, Issue-8, Aug- 2017]
https://dx.doi.org/10.22161/ijaers.4.8.3 ISSN: 2349-6495(P) | 2456-1908(O)
www.ijaers.com Page | 18
bottom points through a faucet, in Thailand the milk
samples were collected by means of a pipette at the top
(between 250 and 200 ml), middle (between 150 and 100
ml) and lowest point (between 50 and 0 ml) of the
container in which the sample was stored.
In the Thai study, there was a significant influence of time
on the fat levels, starting at the top point, where the fat
content increased from 3.85 to 5.07%, an increase of
about 31.69% after a time interval of 2 hours. The fat
content continued to increase in the top sample and at the
end of the 8 hours of the milk at rest, the fat content
increased to 7.07%, consisting in a total increase of
83.63% compared to the initial fat content of 3.85%. This
is corroborated in the present study, where in 120 minutes
(2 hours), the fat content increased from 3.85±0.05 to
9.70±0.60, an increase of 152% from the initial value of
3.85% and the value continued to increase, but the rate of
change decreased with the increase of time intervals.
The behavior of the fat content obtained from the samples
collected at the bottom collection point (Pi) is the
opposite of the one obtained from the samples collected at
the top collection point (Ps), because as the analysis time
progresses, the fat content of the collected samples can be
seen to decrease after 180 minutes of storage, moving
from 3.15±0.05 to 2.75±0.05% at 210 minutes. As such,
one can see that there is a statistically significant
difference between the two means in these times. It is also
clear that from 210 minutes to 300 minutes of rest, there
was a stabilization in the fat content, going from
2.75±0.05 at 210 minutes to 2.70±0.20 at 300 minutes.
As shown in Table 1 and Figure 2, there was a gradual
reduction of the fat content at the bottom collection point
and one can see that the largest value occurred at 120
minutes (2 hours), which was 81.33%, going from
3.75±0.05 to 3.05±0.05. Just as in the work by Wandi,
Vijchulata and Chairatanayuth (2014), who found a
gradual reduction in fat content in the middle and lowest
points, with an average decrease of around 8.05% and
12.99% for the medium and lower fractions, respectively.
After 8 hours of the milk at rest, the decrease in fat
content was around 20.8% in the middle and 28.80% at
the bottom.
Servello et al., (2004) developed an extensive study to
define the optimal time of agitation and, in his work, a fat
loss rate of around 30% was observed at the bottom of the
tank after three hours of the milk at rest. Jackson (1981),
on the other hand, observed a fat loss rate of 60%, but in
1.5 hours. This difference may be due to the different
methods used in the collection of the samples.
In the evaluation of the quality of chilled raw milk as a
function of the transportation and storage conditions in
isothermal tanks and industrial silos performed by Brazil
et al., (2012), the fat content in the milk stored in a
refrigerated tank was 3.53% and in the silo 3.45%, lower
than the values found in this work.
The data found here are in agreement with the
recommendations of IN no. 62/2011, which established
that the fat content in milk should be 3.0 g/100 g of milk
(Brazil, 2011), with the composition of milk varying
widely between breeds and in lesser intensity between
animals of the same breed. It hover around 35g/liter. The
fat contributes to a better palatability of the product. It is
responsible for a large number of essential fatty acids.
Each gram of fat provides 9 calories. The nutritive value
of fat is due to the fat-soluble vitamins (A, D, E and K)
and the presence of the carotene precursors of vitamin A
(Tronco, 2008).
According to Foschiera (2004), the fat is formed by
globules of different sizes, suspended in the aqueous
phase. Each globule is surrounded by a phospholipid
membrane and it is this layer that prevents the union of all
the globules. According to Koblitz, (2011), maintaining
the milk at rest leads to the separation of this component,
forming a top layer. Since it is less dense than water, the
fatty matter floats when the milk is at rest, forming the so-
called cream layer, the main component of the milk sub-
products butter and cream (Florião, 2013).
Cunha et al., (2013) found no significant differences in
the mean levels of lactose, protein, fat and SCC of the
milk samples collected before and after the training of
transporters. Although no statistical difference was found
in the mean levels of fat between the collection times, the
coefficient of variation (CV) of the data was 10.09%,
which was a greater value than the CV for lactose and
protein levels, which were 2.92 and 4.18%, respectively.
According to Goodrigge et al., (2004), the collection in
the lower or top layers from the milk tank may explain the
variations concerning fat contents, since the fat globules
tend to concentrate on the top layer of chilled milk.
Regarding the density of the milk measured according to
storage time, one can see that the values obtained are
similar in all samples, both in samples collected at the top
collection point (Ps) and in samples collected at the
bottom collection point (Pi). These data can be seen in
Table 2.
The values obtained reveal a density of 1.039±0.05 for the
collection at Ps at the beginning of the process, time zero,
and a density of 1.014±0.35 at the time of 210 minutes.
The analysis of these data, although very similar, show
they are statistically significantly different by the Tukey
test at a probability of 5%. From the time of 210 up to the
time of 300 minutes, an equilibrium in the density could
be seen, since the values went to 1.012±0.70. These
density values, therefore, are no different, when
evaluated. The same behavior was observed in the
samples taken from the bottom collection point (Pi) for

International Journal of Advanced Engineering Research and Science (IJAERS) [Vol-4, Issue-8, Aug- 2017]
https://dx.doi.org/10.22161/ijaers.4.8.3 ISSN: 2349-6495(P) | 2456-1908(O)
www.ijaers.com Page | 19
the density values across the test times. The density can
be modified by adding water or prior skimming, because
water has a higher density than fat, 1g/cm3 and
0,9301g/cm3, respectively.
The behavior of density in this study is corroborated by
the literature, which points out that the higher the fat
content, the lower the density, with skimmed milk having
a higher density than whole milk, because according to
Castro (2005), density is the relationship that exists
between the mass and volume of a body. As such, one can
see the relationship between the solids and the solvent in
milk.
This study revealed that in the 300 minutes of storage, the
samples collected in Ps and Pi had a density of
1.012±0.70 and 1.045±0.20, respectively. It should be
emphasized that these samples show levels of 16.67±0.05
and 2.70±0.20% for fat in the samples collected at the
time of 300 minutes in the Ps and Pi, respectively.
Table 2: Physiochemical parameters of the milk - Non-fatty solids - SNF, Density and Cryoscopic Index (Means followed by
Standard Deviation)
Time* SNFs1
SNFi2
Ds3
Di4
ICs5
ICi6
0 8.25±0.50aA# 8.80±0.05aA 1.039±0.05aA 1.039±0.30aA -0.545±0.002aA -0.548±0.004aA
60 8.33±0.13aA 8.86±0.05aA 1.037±0.05aA 1.039±0.55aA -0.542±0.001aA -0.549±0.005aA
120 8.83±0.55aA 8.72±0.10 aA 1.028±1.30aA 1.040±0.05 aAB -0.542±0.004aA -0.544±0.005aA
180 8.50±0.10 aA 8.95±0.05aA 1.020±0.60 aAB 1.041±0.20aB -0.545±0.005aA -0.543±0.004aA
210 8.14±0.10 aA 8.71±0.10 aA 1.014±0.35bB 1.045 ± 0.08bA -0,553±0.015bA -0.520±0.000bB
240 8.14±0.00aA 8.77±0.05aA 1.013±0.25bB 1.044±0.30bA -0.554±0.005bA -0.528±0.002bB
270 8.18±0.10aA 8.93±0.16aA 1.012±0.75bB 1.044±0.05bB -0.552±0.001bA -0.524±0.006bB
300 8.49±0.25aA 8.91±0.18aA 1.012±0.70bB 1,045±0,20bA -0.553±0.027bA -0.523±0.003bB
* Time in Minutes. 1Non-fatty solids (SNF) Top Point. 2Non-fatty solids (SNF) Bottom Point. 3Density - Top Point. 4Density - Bottom Point. 5Cryoscopic Index - Top Point.6Cryoscopic Index - Bottom.
# Means and deviations followed by the same small case letter in the vertical axis and capital letters on the horizontal axis do not differ
statistically between themselves by the Tukey test at the level of probability of 5%.
Table 3: Physiochemical parameters of the milk - Proteins, Lactose and Solids (Means followed by Standard Deviation)
Time Ps1
Pi2
Ls3
Li4
SIs5
SIi6
0 3.03±0.05aA#
3.41±0.05aA 4.52±0.04aA 4.69±0.15aA 0.70±0.00aA
0.70±0.00aA
60 3.12±0.03aA 3.42±0.05aA
4.51±0.11aA 4.74±0.31aA 0.70±0.00aA 0.70±0.00aA
120 3.24±0.20aA 3.40±0.05aA
4.89±0.30aA 4.62±0.11aA 0.70±0.00aA 0.70±0.00aA
180 3.12±0.05aA 3.43±0.06aA
4.68±0.05aA 4.82±0.04aA 0.70±0.00aA 0.70±0.00aA
210 2.98±0.09aA 3.42±0.04aA
4.46±0.20aA 4.59±0.12aA 0.70±0.00aA 0.70±0.00aA
240 2.99±0.06aA 3.42±0.06aA
4.45±0.05aA 4.65±0.04aA 0.70±0.00aA 0.70±0.00aA
270 3.01±0.10aA 3.44±0.03aA
4.47±0.05aA 4.79±0.08aA 0.70±0.00aA 0.70±0.00aA
300 3.10±0.05aA 3.43±0.05aA
4.69±0.15aA 4.78±0.04aA 0.70±0.00aA 0.70±0.00aA
* Time in Minutes. 1Proteins - Top Point. 2Proteins - Bottom Point. 3Lactose - Top Point. 4Lactose - Bottom Point. 5Solids - Top Point. 6Solids - Bottom.
#Means and deviations followed by the same small case letter in the vertical axis and capital letters on the horizontal axis do not differ
statistically between themselves by the Tukey test at the level of probability of 5%.
The density of the milk may be associated to the
Cryoscopic Index (IC), a test serving to control the
volume of water present in the milk, recommending the
addition of water or removal of its components, or even
the addition of some compound to mask a problem
(Tronco, 2008; Botaro and Santos, 2016).
The cryoscopic point is defined as the temperature at
which the milk passes from a liquid to a solid state. The
freezing temperature of milk is lower than water due to
the substances contained in it, such as lactose and mineral
salts. The freezing point can vary depending on the
season of the year, feed, breed, health status, age, among
others (Alberton, 2012). The higher the freezing point,
therefore, the greater the water content in the milk
(Robim et al., 2012).
The behavior of this parameter on the data obtained in
this study corroborate the fat content found in the samples
taken at the established times in each collection point.
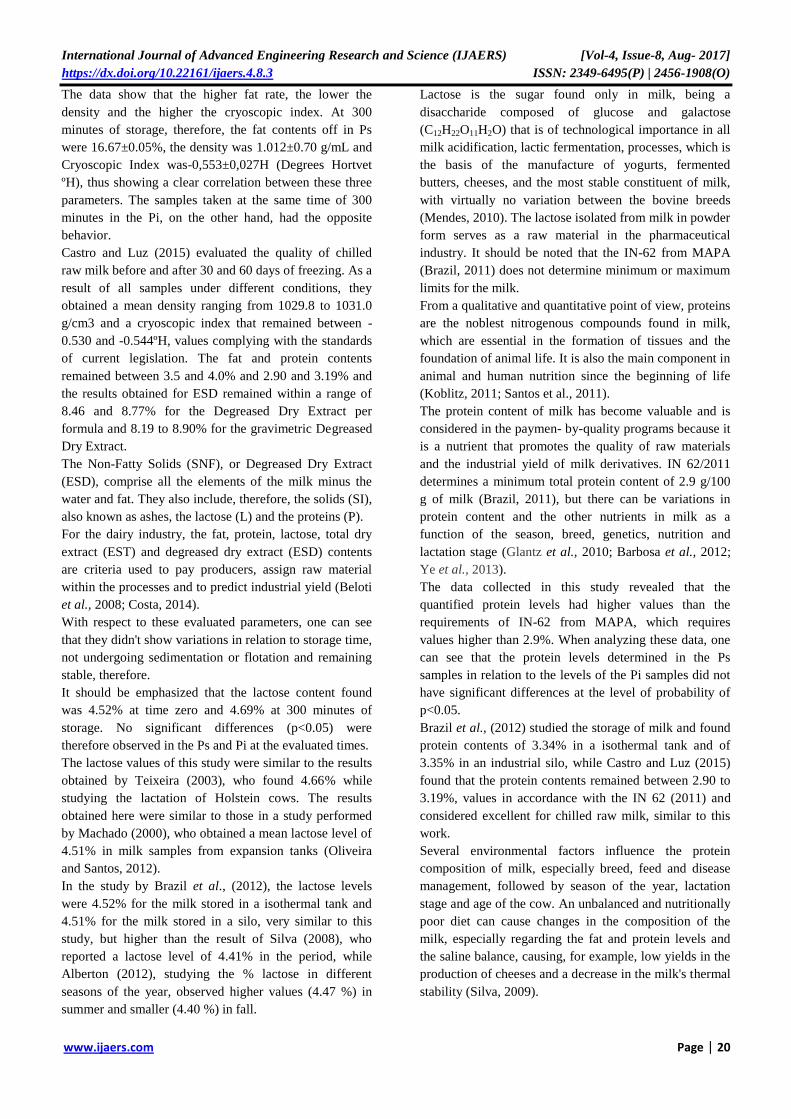
International Journal of Advanced Engineering Research and Science (IJAERS) [Vol-4, Issue-8, Aug- 2017]
https://dx.doi.org/10.22161/ijaers.4.8.3 ISSN: 2349-6495(P) | 2456-1908(O)
www.ijaers.com Page | 20
The data show that the higher fat rate, the lower the
density and the higher the cryoscopic index. At 300
minutes of storage, therefore, the fat contents off in Ps
were 16.67±0.05%, the density was 1.012±0.70 g/mL and
Cryoscopic Index was-0,553±0,027H (Degrees Hortvet
ºH), thus showing a clear correlation between these three
parameters. The samples taken at the same time of 300
minutes in the Pi, on the other hand, had the opposite
behavior.
Castro and Luz (2015) evaluated the quality of chilled
raw milk before and after 30 and 60 days of freezing. As a
result of all samples under different conditions, they
obtained a mean density ranging from 1029.8 to 1031.0
g/cm3 and a cryoscopic index that remained between -
0.530 and -0.544ºH, values complying with the standards
of current legislation. The fat and protein contents
remained between 3.5 and 4.0% and 2.90 and 3.19% and
the results obtained for ESD remained within a range of
8.46 and 8.77% for the Degreased Dry Extract per
formula and 8.19 to 8.90% for the gravimetric Degreased
Dry Extract.
The Non-Fatty Solids (SNF), or Degreased Dry Extract
(ESD), comprise all the elements of the milk minus the
water and fat. They also include, therefore, the solids (SI),
also known as ashes, the lactose (L) and the proteins (P).
For the dairy industry, the fat, protein, lactose, total dry
extract (EST) and degreased dry extract (ESD) contents
are criteria used to pay producers, assign raw material
within the processes and to predict industrial yield (Beloti
et al., 2008; Costa, 2014).
With respect to these evaluated parameters, one can see
that they didn't show variations in relation to storage time,
not undergoing sedimentation or flotation and remaining
stable, therefore.
It should be emphasized that the lactose content found
was 4.52% at time zero and 4.69% at 300 minutes of
storage. No significant differences (p<0.05) were
therefore observed in the Ps and Pi at the evaluated times.
The lactose values of this study were similar to the results
obtained by Teixeira (2003), who found 4.66% while
studying the lactation of Holstein cows. The results
obtained here were similar to those in a study performed
by Machado (2000), who obtained a mean lactose level of
4.51% in milk samples from expansion tanks (Oliveira
and Santos, 2012).
In the study by Brazil et al., (2012), the lactose levels
were 4.52% for the milk stored in a isothermal tank and
4.51% for the milk stored in a silo, very similar to this
study, but higher than the result of Silva (2008), who
reported a lactose level of 4.41% in the period, while
Alberton (2012), studying the % lactose in different
seasons of the year, observed higher values (4.47 %) in
summer and smaller (4.40 %) in fall.
Lactose is the sugar found only in milk, being a
disaccharide composed of glucose and galactose
(C12H22O11H2O) that is of technological importance in all
milk acidification, lactic fermentation, processes, which is
the basis of the manufacture of yogurts, fermented
butters, cheeses, and the most stable constituent of milk,
with virtually no variation between the bovine breeds
(Mendes, 2010). The lactose isolated from milk in powder
form serves as a raw material in the pharmaceutical
industry. It should be noted that the IN-62 from MAPA
(Brazil, 2011) does not determine minimum or maximum
limits for the milk.
From a qualitative and quantitative point of view, proteins
are the noblest nitrogenous compounds found in milk,
which are essential in the formation of tissues and the
foundation of animal life. It is also the main component in
animal and human nutrition since the beginning of life
(Koblitz, 2011; Santos et al., 2011).
The protein content of milk has become valuable and is
considered in the paymen- by-quality programs because it
is a nutrient that promotes the quality of raw materials
and the industrial yield of milk derivatives. IN 62/2011
determines a minimum total protein content of 2.9 g/100
g of milk (Brazil, 2011), but there can be variations in
protein content and the other nutrients in milk as a
function of the season, breed, genetics, nutrition and
lactation stage (Glantz et al., 2010; Barbosa et al., 2012;
Ye et al., 2013).
The data collected in this study revealed that the
quantified protein levels had higher values than the
requirements of IN-62 from MAPA, which requires
values higher than 2.9%. When analyzing these data, one
can see that the protein levels determined in the Ps
samples in relation to the levels of the Pi samples did not
have significant differences at the level of probability of
p<0.05.
Brazil et al., (2012) studied the storage of milk and found
protein contents of 3.34% in a isothermal tank and of
3.35% in an industrial silo, while Castro and Luz (2015)
found that the protein contents remained between 2.90 to
3.19%, values in accordance with the IN 62 (2011) and
considered excellent for chilled raw milk, similar to this
work.
Several environmental factors influence the protein
composition of milk, especially breed, feed and disease
management, followed by season of the year, lactation
stage and age of the cow. An unbalanced and nutritionally
poor diet can cause changes in the composition of the
milk, especially regarding the fat and protein levels and
the saline balance, causing, for example, low yields in the
production of cheeses and a decrease in the milk's thermal
stability (Silva, 2009).

International Journal of Advanced Engineering Research and Science (IJAERS) [Vol-4, Issue-8, Aug- 2017]
https://dx.doi.org/10.22161/ijaers.4.8.3 ISSN: 2349-6495(P) | 2456-1908(O)
www.ijaers.com Page | 21
The results obtained in this study can serve as support for
the technical departments of dairy industries to monitor
and qualify the raw material and consequently improve
the industrial yield.
It is also hoped that this work will strengthen the
commercial relations system between economic agents
acting in the milk production chain. It is also expected
that Milk Production Associations can use this
information as indicators and to assist in the interface
between primary production, industry and the consumers
of the product.
IV. CONCLUSION
Through this study analyzing the solid constituents of
milk, one can conclude that only the fat separates
completely from the other constituents, concentrating on
the top of the cold milk.
Milk samples taken improperly or without
homogenization from the isothermal tanks awaiting
unloading of the milk on reception platforms, may
compromise the quality of milk and the physiochemical
and microbiological characteristics of the product.
Payment by quality is a motivating factor for the
producer, but it is not enough that the milk leaves the
property in compliance with standard IN 62 (2011). If the
sample taken on the platform does not match the sample
from the property, the producer will be penalized.
REFERENCES
[1] Alberton, J. (2012). O estudo da qualidade do leite
de amostras obtidas de tanques de resfriamento em
três regiões do estado do Paraná. Arquivos de
Ciências Veterinárias e Zoológicas da Unipar, 15(1):
5-12.
[2] Almeida, T. V. (2013). Parâmetros de qualidade do
leite cru bovino: contagem bacteriana total e
contagem de células somáticas. Goiânia: Seminários
Aplicados.
[3] Antos, G., Lopes, M. A. (2014). Indicadores
econômicos de sistemas de produção de leite em
confinamento total com alto volume de produção
diária. Ciência Animal Brasileira, 15(3): 239-248.
[4] Azevedo, C. S. (2014). Ocorrência de leite instável
não ácido (LINA) na região da Grande
Florianópolis-SC (Monografia de Graduação).
Universidade Federal de Santa Catarina,
Florianópolis.
[5] Barbosa, R. S., Fischer, V., Ribeiro, M. E. R.,
Zanela, M. B., Stumpf, M. T., Kolling, G. J., Júnior,
J. S., Barros, L. E., & Egito, A. S. (2012).
Caracterização eletroforética de proteínas e
estabilidade do leite em vacas submetidas à restrição
alimentar. Pesquisa Agropecuária Brasileira, 47(4):
621-628.
[6] Beloti, V., Ribeiro Júnior, J. C., Tamanini, R.,
Yamada, A. K., Cavaletti, L., Shecaira, C. de L.,
Novaes, D. G., & Silva, F. F. (2011). Qualidade
microbiológica e físico-química do leite cru
refrigerado produzido no município de
Sapopema/PR. Revista Científica Eletrônica de
Medicina Veterinária, 9(16).
[7] Bittante, G., Penasa, M., & Cecchinato, A. (2012).
Invited review: Genetics and modeling of milk
coagulation properties. Journal of Dairy Science,
95(12): 6843-6870.
[8] Botaro, B., & Santos, M. V. (2016). Entendendo a
variação da crioscopia do leite. Piracicaba:
Milkpoint. Disponível em:
https://www.milkpoint.com.br/. Acesso em: 20 de
dezembro 2016.
[9] Brasil, R. B., Silva, M. A. P., Carvalho, T. S.,
Cabral, J. F., Nicolau, E. S., & Neves, R. B. S.
(2012). Avaliação da qualidade do leite cru em
função do tipo de ordenha e das condições de
transporte e armazenamento. Revista do Instituto de
Laticínios Cândido Tostes, 389(67): 34-42.
[10] Brasil. (2002). Instrução Normativa n. 75, de 28 de
outubro de 2003. Regulamento Técnico para
Seleção, Projeto, Fabricação e Manutenção de
Tanques Isotérmicos Destinados à Coleta e ao
Transporte de Leite e Derivados Fluidos. Brasília,
DF. Secretaria de Inspeção de Produto Animal.
Diário Oficial da República Federativa do Brasil.
[11] Brasil. (2011). Instrução Normativa n. 51, de 29 de
dezembro de 2011, que altera o art. 1º, da Instrução
Normativa MAPA nº 51, de 18 de setembro de 2002.
Diário Oficial da República Federativa do Brasil.
[12] Brasil. (2011). Instrução Normativa n. 62, de 29 de
dezembro de 2011, que altera o art. 1º, da Instrução
Normativa MAPA nº 51, de 18 de setembro de 2002.
Diário Oficial da República Federativa do Brasil.
[13] Buza, M. H., Holden, L. A., White, R. A., & Ishler,
V. A. (2014). Evaluating the effect of ration
composition on income over feed cost and milk
yield. Journal of Dairy Science, 97(5): 3073-3080.
[14] Castro, A. D., & Luz, R. (2015). Avaliação da
qualidade do leite in natura antes, pós 30 e 60 dias
de congelamento (Monografia de Graduação
Tecnológica). Centro Universitário Univates,
Lajeado.
[15] Castro, P. S. (2005). Apostila de aulas práticas:
tecnologia de leites e derivados. Goiás: Universidade
Católica de Goiás.
[16] Costa, J. F. (2014). Atributos de qualidade
associados à ocorrência de proteólise em leite cru

International Journal of Advanced Engineering Research and Science (IJAERS) [Vol-4, Issue-8, Aug- 2017]
https://dx.doi.org/10.22161/ijaers.4.8.3 ISSN: 2349-6495(P) | 2456-1908(O)
www.ijaers.com Page | 22
granelizado (Dissertação de Mestrado).
Universidade Federal de Juiz de Fora, Juiz de Fora.
[17] Cunha, A. F., Parreira, D. S., Silva, S. Q., &
Cerqueira, M. M. O. P. (2013). Efeitos do
treinamento de transportadores de leite na
determinação da qualidade do leite cru refrigerado.
Acta Veterinaria Brasilica, 7(3): 241-246.
[18] Di Domenico, Q. (2009). Acompanhamento da
rotina de análises do laboratório de recepção e leite:
avaliação dos resultados das amostras de qualidade
do leite de uma indústria de produtos lácteos
(Monografia de Graduação). Universidade do Estado
de Santa Catarina, Chapecó.
[19] Durr, J. W. (2012). Como produzir leite de
qualidade (4. ed.). Brasília: SENAR.
[20] Durr, J. W., Fontaneli, R. S., & Moro, D. V. (2001).
Determinação laboratorial dos componentes do leite.
In F. H. D. González, J. W. Durr, & R. S. Fontaneli
(Ed.), Uso do leite para monitorar a nutrição e o
metabolismo de vacas leiteiras (p. 23-29). Porto
Alegre: UFRGS.
[21] Florião, M. M. (2013). Boas práticas em
bovinocultura leiteira com ênfase em sanidade
preventiva. Niterói: Programa Rio Rural.
[22] Foschiera, J. L. (2004). Indústria de laticínios:
industrialização do leite, análises, produção de
derivados. Porto Alegre: Suliani.
[23] Glantz, M., Devold, T. G., Vegarud, G. E.,
Lindmark Månsson, H., Stålhammar, H., &
Paulsson, M. (2010). Importance of casein micelle
size and milk composition for milk gelation. Journal
of Dairy Science, 93: 1444-1451.
[24] Gonzaga, N., Daniel, G. C., Mareze, J., Marioto, L.
R. M., Tamanini, R., & Beloti, V. (2015). Evolução
da qualidade microbiológica e físico-química do
leite pasteurizado. Semina, 36(1): 47-54.
[25] Goodridge, L. D., Hill, A., & Lencki, R. (2004). A
review of international standards and the scientific
literature on farm milk bulk tank sampling protocols.
Journal Dairy Science, 87: 3099-3104.
[26] Jackson, A. C. (1981). Agitation and sampling of
tankers and storage tanks. Journal Society Dairy
Technology, 34: 98-103.
[27] Koblitz, M. G. B. (2011). Matérias-primas
alimentícias: composição e controle de qualidade.
Rio de Janeiro: Guanabara Koogan.
[28] Liu, S., Zhang, R., Kang, R., Meng, J., & Ao, C.
(2016). Milk fatty acids profiles and milk production
from dairy cows fed different forage quality diets.
Animal Nutrition, 2: 329-333.
[29] Machado, P. F., Pereira, A. R., & Sarries, G. A.
(2000). Composição do leite de tanques de rebanhos
brasileiros distribuídos segundo sua contagem de
células somáticas. Revista Brasileira de Zootecnia,
29(6): 1883-1886.
[30] Mendes, C. G. (2010). Análises físico-químicas e
pesquisa de fraude no leite informal comercializado
no município de Mossoró, RN. Ciência Animal
Brasileira, 11(2): 349-356.
[31] Moura, J. F. P., Pimenta Filho, E. C., Gonzaga Neto,
S., & Candido, E. P. (2013). Avaliação tecnológica
dos sistemas de produção de leite bovino no Cariri
da Paraíba. Revista Brasileira de Saúde e Produção
Animal, 14(1): 121-131.
[32] Oliveira, E. N. A., & Santos, D. C. (2012).
Avaliação da qualidade físico-química de leites
pasteurizados. Revista do Instituto Adolfo Lutz,
71(1): 93-197.
[33] Ponce, P. (2009). Composición láctea y SUS
interrelaciones: expresión genética, nutricional,
fisiológica y metabólica de La lactación en las
condiciones del trópico. Revista Salud Animal,
31(2): 69-76.
[34] Ponsano, E. G. H., Perri, S. H. V., Madureira, F. C.
P., Paulino, R. Z., & Camossi, L. G. (2007).
Correlação entre métodos tradicionais e
espectroscopia de ultra-som na determinação de
características físico-químicas do leite. Arquivo
Brasileiro de Medicina Veterinária e Zootecnia,
59(4): 1052-1057.
[35] Rezende, E. S. J., Pinto, S. M., Pereira, J. L. A. R.,
& Labigalini, I. (2012). Qualidade higiênico-
sanitária do leite cru em três mesorregiões de Minas
Gerais. Revista do Instituto de Laticínios Cândido
Tostes, 67(387): 64-69.
[36] Robim, M. S., Cortez, M. A. S., Silva, A. C. O.,
Torres Filho, R. A., Gemal, N. H., & Nogueira, E.
B. (2012). Pesquisa de fraude no leite UAT integral
comercializado no estado do Rio de Janeiro e
comparação entre os métodos de análises
físicoquímicas oficiais e o método de ultrassom.
Revista do Instituto de Laticínios Cândido Tostes,
67(389): 43-50.
[37] Rowbotham, R. F., & Ruegg, P. L. (2016).
Association of bedding types with management
practices and indicators of milk quality on larger
Wisconsin dairy farms. Journal of Dairy Science,
98(11): 7865-7885.
[38] Santos, N. A. F., Lacerda, L. M., & Ribeiro, A. C.
(2011). Avaliação da composição e qualidade físico-
química do leite pasteurizado padronizado
comercializado na cidade de São Luís, MA.
Arquivos do Instituto Biológico, 78(1): 109-113.
[39] Servello, V., Hill, A. R., & Lencki, R. W. (2004).
Towards an optimum mixing protocol for on-farm

International Journal of Advanced Engineering Research and Science (IJAERS) [Vol-4, Issue-8, Aug- 2017]
https://dx.doi.org/10.22161/ijaers.4.8.3 ISSN: 2349-6495(P) | 2456-1908(O)
www.ijaers.com Page | 23
bulk milk sampling. Journal Dairy Science, 87(9):
2846-2853.
[40] Silva, M. A. P. (2009). Influência do transporte a
granel na qualidade do leite cru refrigerado. Revista
do Instituto Adolfo Lutz, 68(3): 381-387.
[41] Tonini, C. B. (2014). Avaliação da qualidade do
leite e caracterização de laticínios do estado do
Espírito Santo (Dissertação de Mestrado).
Universidade Federal do Espírito Santo, Alegre.
[42] Teixeira, N. M., Freitas, A. F., & Barra, R. B.
(2003). Influência de fatores de meio ambiente na
variação mensal da composição e contagem de
células somáticas do leite em rebanhos no Estado de
Minas Gerais. Arquivo Brasileiro de Medicina
Veterinária e Zootecnia, 55(4): 491-499.
[43] Tronco, M. (2008). Manual para Inspeção da
Qualidade do Leite (3. ed.). Santa Maria: UFSM.
[44] Venturoso, P. C., Almeida, K. E., Rodrigues, A. M.,
Damin, M. R., & Oliveira, M. N. (2007).
Determinação da composição físico-química de
produtos lácteos: estudo exploratório de comparação
dos resultados obtidos por metodologia oficial e por
ultra-som. Revista Brasileira de Ciências
Farmacêuticas, 43(4): 123-129.
[45] Ye, R., & Harte, F. (2013). Casein maps: effect of
ethanol, pH, temperature, and CaCl2 on the particle
size of reconstituted casein micelles. Journal of
Dairy Science, 96(2): 799-805.
[46] Wangdi, J., Vijchulata, P., & Chairatanayuth, P.
(2014). Gravity Separation Characteristics of Cows’
Raw Milk Fat Globules. International Journal of
Innovation and Applied Research, 2(10): 13-22.
International Journal of Advanced Engineering Research and Science (IJAERS) [Vol-4, Issue-8, Aug- 2017]
https://dx.doi.org/10.22161/ijaers.4.8.4 ISSN: 2349-6495(P) | 2456-1908(O)
www.ijaers.com Page | 24
Functionalized up conversion rare earth
nanoparticles for bio imaging of cancer cells Chávez-García D.1, Juárez-Moreno K.2,3, Campos C. H.4, Alderete J. B.4, Hirata G.A.2
1Centro de Enseñanza Técnica y Superior. Campus Ensenada. Camino a Microondas Trinidad S/N Km. 1, Moderna
Oeste, Ensenada, Baja California, C.P. 22860, México. E-mail: [email protected] 2Centro de Nanociencias y Nanotecnología, Universidad Nacional Autónoma de México, Carretera Tijuana-Ensenada. Km. 107,
Ensenada, Baja California, C.P. 22860, México. E-mail: [email protected], [email protected] 3CONACYT ResearchFellow at Centro de Nanociencias y Nanotecnología, Universidad Nacional Autónoma de México,
Carretera Tijuana-Ensenada. Km. 107, Ensenada, Baja California, C.P. 22860, Mexico.E-mail: [email protected] 4Facultad de Ciencias Químicas, Universidad de Concepción. EdmundoLarenas 129, Concepción, Chile. E-mails:
[email protected]; [email protected]
Abstract—In recent yearsupconversion nanoparticles
(UCNPs)have being investigated due to their potential
applications in biomedicine such as fluorescent biolabels,
among many others. The luminescence of this kind of NP’s
are effectively activatedby near infrared radiation (NIR)
and upconvertto luminescence in the visible region. Besides,
their luminescence is not faded as compared with organic
dyes and fluorescent proteins. In this study, UCNPs made of
Y2O3:Yb3+, Er3+ (1%, 10% mol) and Gd2O3:Yb3+, Er3+ (1%,
10% mol) were functionalized with aminosilanes and folic
acid (UCNP-NH2-FA) and characterized with transmission
electron microscopy (TEM), Fourier transform infrared
spectroscopy (FTIR) and luminescence measurements.
Moreover, cytotoxicity was analyzed via colorimetric assays
MTT (methy-134 thiazolyltetrazolium) in two cancer cell
lines: cervical adenocarcinoma cells (HeLa) and breast
cancer cells MB-MDA-231. It is found that the
functionalized UCNPs were non-cytotoxic in all cancer cell
lines. Confocal images revealed that UCNP-NH2-FA
conjugates as a target to attract cells with overexpressed
folate receptor (FR). The UCNPs offer a great potential to
be used as bio labels because their fluorescence was clearly
localized into cell cytoplasm.
Keywords— luminescence, nanophosphors, lanthanide,
biomedical
I. INTRODUCTION
Nanotechnology has arisen with different types of
nanoparticles and nanomaterials for several applications in
biomedicine. Our special interest is in bioimaging
applications, using upconversion nanoparticles(UCNPs) to
identify certain types of cancer cells [1,2]. The
nanoparticles can upconvert the near infrared (NIR) energy
(λ= 980 nm) into visible light[3]. In this context, the
UCNPs of Y2O3:Yb3+, Er3+ (1%, 10% mol) and Gd2O3:Yb3+,
Er3+ (1%, 10% mol) were synthesized by sol-gel method[4],
the hosts were the oxides Y2O3 and Gd2O3 and they were
combined with two rare earth ions Er3+and Yb3+. The ion
Yb3+ receives the energy from the NIR laser at 980 nm
wavelength and it shows high quantum yield. The excited
Yb3+ ion transfers the energy to the Er3+ ions, which results
in their excitation to a higher level 4I11/2. The ions have a
non-radiative decay to 4I13/2 level and further radiative decay
to theground state with 661 nm of wavelength emission
(red) this event is called energy transfer upconversion
(ETU)[5]. The color of the emission varies according with
the percentage of dopants elements [6].One of the
challenges of the biolabels, is the chemical durability of the
UCNPs, in this study theyhave a silica core shell that is
useful because we prevent possible cytotoxicity into the
cells[7]. Also, the functionalization of the UCNPs with
specific ligands is necessary to label specific cancer
cells.There are different types of biological ligands; in this
case, folic acid has been use for several authors with
successful results with cervical adenocarcinoma cells
(HeLa) and breast cancer cells MB-MDA-231[8]. After the
UCNPs were coated with a thin silica shell by Stöber
method[9], they were functionalized with amine group
(APTES/TEOS) to enable folic acid (FA) conjugation[10].
The FAare able to bind to the folate receptor (FR) available
on cancer cells surface.Further this bindingprovoke the
internalization of the NPs into the cytoplasm via
endocytosis[11]. The FR has three isoforms (α, β and γ), the
studied cells have FR-α overexpressed[12].The cytotoxicity
of the UCNPs was tested by a cell viability assay based on
the reduction of the MTT reagent (methy-134
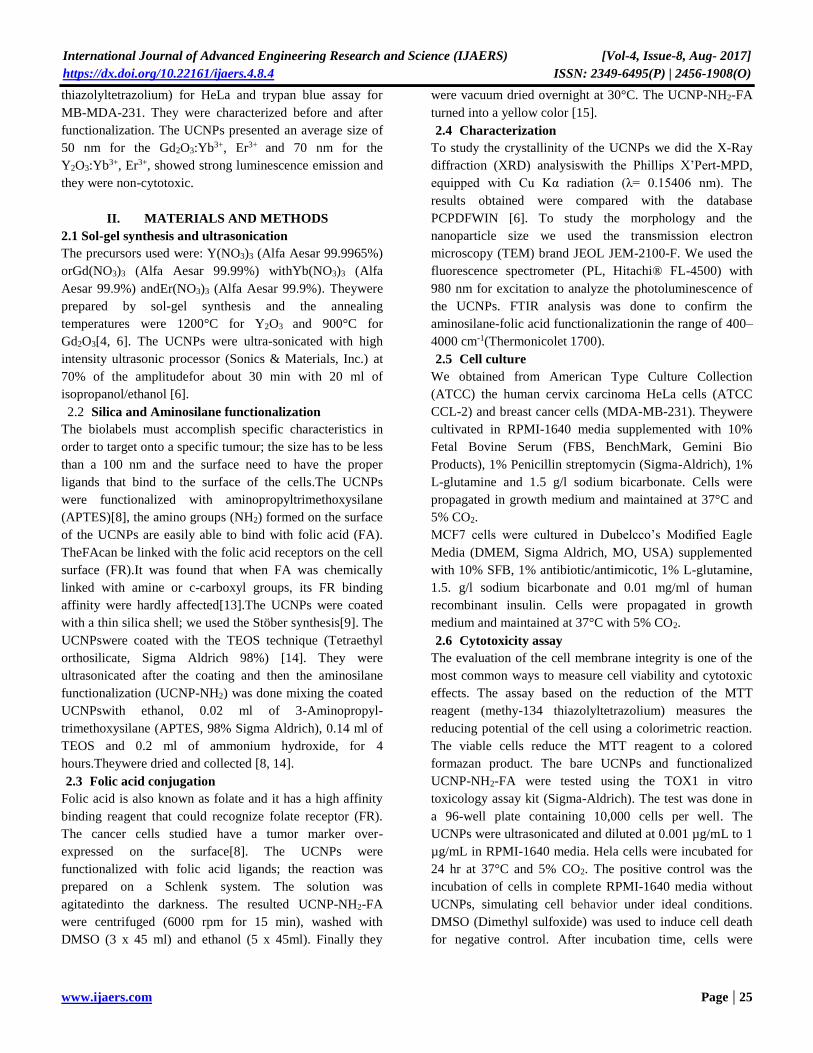
International Journal of Advanced Engineering Research and Science (IJAERS) [Vol-4, Issue-8, Aug- 2017]
https://dx.doi.org/10.22161/ijaers.4.8.4 ISSN: 2349-6495(P) | 2456-1908(O)
www.ijaers.com Page | 25
thiazolyltetrazolium) for HeLa and trypan blue assay for
MB-MDA-231. They were characterized before and after
functionalization. The UCNPs presented an average size of
50 nm for the Gd2O3:Yb3+, Er3+ and 70 nm for the
Y2O3:Yb3+, Er3+, showed strong luminescence emission and
they were non-cytotoxic.
II. MATERIALS AND METHODS
2.1 Sol-gel synthesis and ultrasonication
The precursors used were: Y(NO3)3 (Alfa Aesar 99.9965%)
orGd(NO3)3 (Alfa Aesar 99.99%) withYb(NO3)3 (Alfa
Aesar 99.9%) andEr(NO3)3 (Alfa Aesar 99.9%). Theywere
prepared by sol-gel synthesis and the annealing
temperatures were 1200°C for Y2O3 and 900°C for
Gd2O3[4, 6]. The UCNPs were ultra-sonicated with high
intensity ultrasonic processor (Sonics & Materials, Inc.) at
70% of the amplitudefor about 30 min with 20 ml of
isopropanol/ethanol [6].
2.2 Silica and Aminosilane functionalization
The biolabels must accomplish specific characteristics in
order to target onto a specific tumour; the size has to be less
than a 100 nm and the surface need to have the proper
ligands that bind to the surface of the cells.The UCNPs
were functionalized with aminopropyltrimethoxysilane
(APTES)[8], the amino groups (NH2) formed on the surface
of the UCNPs are easily able to bind with folic acid (FA).
TheFAcan be linked with the folic acid receptors on the cell
surface (FR).It was found that when FA was chemically
linked with amine or c-carboxyl groups, its FR binding
affinity were hardly affected[13].The UCNPs were coated
with a thin silica shell; we used the Stöber synthesis[9]. The
UCNPswere coated with the TEOS technique (Tetraethyl
orthosilicate, Sigma Aldrich 98%) [14]. They were
ultrasonicated after the coating and then the aminosilane
functionalization (UCNP-NH2) was done mixing the coated
UCNPswith ethanol, 0.02 ml of 3-Aminopropyl-
trimethoxysilane (APTES, 98% Sigma Aldrich), 0.14 ml of
TEOS and 0.2 ml of ammonium hydroxide, for 4
hours.Theywere dried and collected [8, 14].
2.3 Folic acid conjugation
Folic acid is also known as folate and it has a high affinity
binding reagent that could recognize folate receptor (FR).
The cancer cells studied have a tumor marker over-
expressed on the surface[8]. The UCNPs were
functionalized with folic acid ligands; the reaction was
prepared on a Schlenk system. The solution was
agitatedinto the darkness. The resulted UCNP-NH2-FA
were centrifuged (6000 rpm for 15 min), washed with
DMSO (3 x 45 ml) and ethanol (5 x 45ml). Finally they
were vacuum dried overnight at 30°C. The UCNP-NH2-FA
turned into a yellow color [15].
2.4 Characterization
To study the crystallinity of the UCNPs we did the X-Ray
diffraction (XRD) analysiswith the Phillips X’Pert-MPD,
equipped with Cu Kα radiation (λ= 0.15406 nm). The
results obtained were compared with the database
PCPDFWIN [6]. To study the morphology and the
nanoparticle size we used the transmission electron
microscopy (TEM) brand JEOL JEM-2100-F. We used the
fluorescence spectrometer (PL, Hitachi® FL-4500) with
980 nm for excitation to analyze the photoluminescence of
the UCNPs. FTIR analysis was done to confirm the
aminosilane-folic acid functionalizationin the range of 400–
4000 cm-1(Thermonicolet 1700).
2.5 Cell culture
We obtained from American Type Culture Collection
(ATCC) the human cervix carcinoma HeLa cells (ATCC
CCL-2) and breast cancer cells (MDA-MB-231). Theywere
cultivated in RPMI-1640 media supplemented with 10%
Fetal Bovine Serum (FBS, BenchMark, Gemini Bio
Products), 1% Penicillin streptomycin (Sigma-Aldrich), 1%
L-glutamine and 1.5 g/l sodium bicarbonate. Cells were
propagated in growth medium and maintained at 37°C and
5% CO2.
MCF7 cells were cultured in Dubelcco’s Modified Eagle
Media (DMEM, Sigma Aldrich, MO, USA) supplemented
with 10% SFB, 1% antibiotic/antimicotic, 1% L-glutamine,
1.5. g/l sodium bicarbonate and 0.01 mg/ml of human
recombinant insulin. Cells were propagated in growth
medium and maintained at 37°C with 5% CO2.
2.6 Cytotoxicity assay
The evaluation of the cell membrane integrity is one of the
most common ways to measure cell viability and cytotoxic
effects. The assay based on the reduction of the MTT
reagent (methy-134 thiazolyltetrazolium) measures the
reducing potential of the cell using a colorimetric reaction.
The viable cells reduce the MTT reagent to a colored
formazan product. The bare UCNPs and functionalized
UCNP-NH2-FA were tested using the TOX1 in vitro
toxicology assay kit (Sigma-Aldrich). The test was done in
a 96-well plate containing 10,000 cells per well. The
UCNPs were ultrasonicated and diluted at 0.001 µg/mL to 1
µg/mL in RPMI-1640 media. Hela cells were incubated for
24 hr at 37°C and 5% CO2. The positive control was the
incubation of cells in complete RPMI-1640 media without
UCNPs, simulating cell behavior under ideal conditions.
DMSO (Dimethyl sulfoxide) was used to induce cell death
for negative control. After incubation time, cells were

International Journal of Advanced Engineering Research and Science (IJAERS) [Vol-4, Issue-8, Aug- 2017]
https://dx.doi.org/10.22161/ijaers.4.8.4 ISSN: 2349-6495(P) | 2456-1908(O)
www.ijaers.com Page | 26
washed with phosphate buffer solution pH 7.4 (PBS 1x) and
MTT reagent was added to the plate. Cytotoxicity was
evaluated by absorbance measurements with an ELISA
plate reader (Thermo Scientific, USA) at 570 and 690 nm.
All data obtained from incubated UCNPs were normalized
to data from three positive control wells with no UCNPs in
three independent experiments[16].
2.7 Trypan blue assay
Vital dyes, such as trypan blue, are normally excluded from
the inside of healthy cells; but if the cell membrane has
been compromised, they cross the membrane and stain
intracellular components. This staining method is described
as a dye exclusion method, because cells are very selective
in the compounds that pass through the membrane, the
trypan blue is not absorbed by viable cells however, it
traverses the membrane in a dead cell.Thetrypan blue assay
was used to measure the cytotoxicity of the UCNPs (bare
and functionalized) with breast cancer cells (MB-MDA-
231).The cell viability was calculated as the number of
viable cells divided by the total number of cells within the
grids on the hemacytometer. The cells are considered non-
viable if they take up trypan blue. The solution of trypan
blue was prepared with 0.4% solution of in buffered
isotonic salt solution pH 7.4 (PBS 1x) and 0.1 mL of trypan
blue stock solution to 1 mL of cells. The cells were loaded
on the hemacytometer and examined immediately under a
microscope at low magnification. The quantities of blue
staining cells were counted and the number of total cells
was also verified [17]. All experiments were done in
triplicate and the results were expressed as mean ± standard
deviation of three independent experiments. The data were
evaluated by analysis of variance (ANOVA), followed by
Tukey’s Multiple Comparison Test, using Graph Pad Prism
6.0 software. The results were considered statistically
significant when p < 0.05.
2.9 Confocal microscopy cell imaging
In this study, the nucleus of the fixed cells was strained
withthe fluorescentstainDAPI (4', 6-diamidino-2-
phenylindole). This dye binds strongly to A-T (adenine-
thymine) rich regions in DNA and it is used extensively in
fluorescence microscopy.We seeded 300,000 cells in
RPMI-1640 media and incubated overnight at 37 °C and 5
% CO2 into a culture Petri dishes coated with Poly-d-lysine
(Mat-Tek P35GC1.5-10C). The HeLa and breast cancer
cells (MB-MDA-231) wereincubated with 1 µg/mL of
UCNP-NH2-FA for 24h at 37 °C and 5 % CO2. After
incubation, the cells were rinsed with PBS 1x and fixedwith
4 % formaldehyde-PBS solution at 4 °C for 15 min.Then
they were permeabilized with 0.5 % Triton X/PBS 1x for 15
min at 4 °C. The nuclear staining was achieved by
incubated the cells with DAPI at 0.5 ng/µL in darkness for
10 min at RT, followed by five washes with PBS. Nuclear
staining with DAPI was also visualized with an inverted
laser-scanning microscope OlympusFluoView FV1000
(Japan) using an argon ion laser for excitationat 405 nm
wavelength and filters for emission of DAPI.
UCNPsfluorescent was detected using the NIR laser (980
nm) and RFP (red fluorescent protein) filter channel
(excitation at 487 nm and emission at 610 nm). Cells were
visualized with a 63 × (DIC), 1.4 N.A. planapochromaticoil
immersion objectives. The imaging parameters used
produced no detectable background signal from any source
other than from UCNPs and DAPI. The MetaMorph
software for Olympus was used to capture the images [18].
III. RESULTS
3.1 TEM images of UCNPs
The compositions obtained for the UCNPs synthesized by
the sol-gel method wereand (Y0.89Yb0.1Er0.01)2O3 and
(Gd0.89Yb0.1Er0.01)2O3 respectively.In figure 1 are shown the
TEM images of bare and functionalized UCNPs of
Y2O3:Er3+/Yb3+ (1%, 10% mol) and Gd2O3:Er3+/Yb3+ (1%,
10% mol). The form of the UCNPs is mostly spherical. The
average size of UCNPs Y2O3:Er3+/Yb3+ were 70 nm (+/- 10
nm) and 50 nm for Gd2O3:Er3+/Yb3+. We observed
agglomerates in all the UCNPs. The silica shell is
approximately of 5 nm thick.
Fig.1: TEM images of UCNPs Y2O3: Er3+/Yb3+ (1%, 10% mol) (a) bare and (b) functionalizedUCNP-NH2-FA.TEM images of
Gd2O3: Er3+/Yb3+ (1%, 10% mol) (c) bare and (d) functionalized UCNP-NH2-FA.
(a) (b) (c) (d)

International Journal of Advanced Engineering Research and Science (IJAERS) [Vol-4, Issue-8, Aug- 2017]
https://dx.doi.org/10.22161/ijaers.4.8.4 ISSN: 2349-6495(P) | 2456-1908(O)
www.ijaers.com Page | 27
3.2 Upconversion luminescence
In figure 2 are shown the upconversion luminescence
spectra of bare and functionalized UCNP-NH2-FA with 980
nm laser excitation. The red emission of the nanoparticles
Y2O3:Er3+, Yb3+(1%, 10% mol) was at 661 nm of
wavelength(figure 2-a) and also the same fluorescence
applying for the Gd2O3:Er3+, Yb3+UCNPs (figure 2-b), with
the electronic transitionof the Er3+ ion in the
level4F9/2→4I15/2 (660 nm). This is because the UCNPs have
the same dopants in different hosts, so the luminescence
effects are the same due to the energy transfer process from
Yb3+ ion to the Er3+ ion. The difference between both
UCNPs is the size; the Y2O3 UCNPs are bigger due to the
size of the lattice.
Fig.2: The upconversion emission spectra with 980 nm excitation for bare and functionalized UCNPs of (a) Y2O3:Er3+/Yb3+ (1%,
10% mol) and (b) Gd2O3:Er3+/Yb3+ (1%, 10% mol)
3.3FTIR analysis
The Fourier transform infrared spectroscopy analysis
(FTIR) was used to verify the functionalization UCNP-
NH2-FA. With this technique, we verify thepresence of the
amine groups and folic acid on the surface of the
nanoparticles with an infraredspectrum of absorption or
emission.The figures4-aand 4-c show the FTIR spectra of
bare UCNPs. Figures 4-b and 4-dshow the aminosilane-
folic acid functionalization (UCNP-NH2-FA).
0
20
40
60
80
100
120
4001,4002,4003,400
Tra
nsm
itan
ce (
%)
Wavenumber (cm-1)
1498 1381
C-N stretch
3401
-OH
(a)
0
10
20
30
40
50
60
70
500150025003500
Tra
nsm
itan
ce (
%)
Wavenumber (cm-1)
3288
FA
FA1540 1506
AMINE-FA1577
1029
C-O STRETCH
(a) (b)
(b)

International Journal of Advanced Engineering Research and Science (IJAERS) [Vol-4, Issue-8, Aug- 2017]
https://dx.doi.org/10.22161/ijaers.4.8.4 ISSN: 2349-6495(P) | 2456-1908(O)
www.ijaers.com Page | 28
Fig.4: FTIR spectra of (a) bare UCNPs Y2O3:Er3+/Yb3+(1%,10% mol), (b) UCNPs with aminosilane functionalization, (c) bare
UCNPs Gd2O3:Er3+/Yb3+(1%,10% mol), (d) functionalized UCNP-NH2-FA.
3.4 Cytotoxicity assay and cellular imaging.
The cytotoxicity results with the MTT assay for bare and
functionalizedUCNP-NH2-FAincubated on HeLa are shown
in figure 5.The UCNPs tend to agglomerate and precipitate
after the addition to the well of the 96-well plate, even after
been ultrasonicated, this reason causes interference with the
absorbance reading of the plate.The results for Y2O3:Er3+,
Yb3+ are on figure 5-afor HeLa cellsand Gd2O3:Er3+, Yb3+
are in figure 5-b. On both assays the functionalized UCNPs
showed no cytotoxicity on both cancer cell lines.
Fig.5: Cell viability assay of (A) bare UCNP Y2O3:Er3+/Yb3+ (1%,10%) (lined bars) and functionalized UCNP-FR (black bars)
with HeLa cells, (B) bare UCNP Gd2O3:Er3+/Yb3+ (1%,10%) (lined bars) and functionalized UCNP-FR (black bars) with HeLa
cells.
The cell viability for breast cancer cell MB-MDA-231 is
shown in figure 6 shows with trypan blue assay with 0.1
and 1 µg/mL of UCNPs concentration. The results indicated
in figure 6-a for UCNPs Y2O3:Er3+, Yb3+ that there are no
cytotoxicity of functionalized UCNPs with 65.71 % and
80.56% of cells viability. For the UCNPs Gd2O3:Er3+, Yb3+,
the cell viability is more than 83% on both concentrations,
as shown in figure 6-b.
0
20
40
60
80
100
120
4001,4002,4003,400
Tra
nsm
itan
ce (
%)
Wavenumber (cm-1)
1385 15083398
-OHC-N stretch
0
10
20
30
40
50
60
5001,5002,5003,500
Tra
nsm
itan
ce (
%)
Wavenumber (cm-1)
1602 15103317 2993 1653
C-O stretch
AMINE-FA
FA
1045
FA
Bare UCNPs
UCNP-NH2-FA Bare UCNPs
UCNP-NH2-FA
(c) (d)
(a) (b) Nanoparticles concentration g/mL Nanoparticles concentration g/mL
Ce
ll
via
bil
ity
(
%
)
Ce
ll
via
bil
ity
(
%
)

International Journal of Advanced Engineering Research and Science (IJAERS) [Vol-4, Issue-8, Aug- 2017]
https://dx.doi.org/10.22161/ijaers.4.8.4 ISSN: 2349-6495(P) | 2456-1908(O)
www.ijaers.com Page | 29
Fig.7: Results of trypan blue assay for breast cancer cells (MB-MDA-231) with the incubations of UCNP-NH2-FA of (a)
Y2O3:Er3+/Yb3+and (b)Gd2O3:Er3+/Yb3+with two different concentrations.
3.5 Cancer cell imaging with UCNPs
The UCNP-NH2-FAwere excited with a 980 nm laser in cell
culture medium with the characteristic green upconversion
emissions; they were incubated in both cancer cell lines
with a concentration of 1 µg/mL for 24 hours into the cells,
then they were properly fixed and prepared in order to
obtain imaging with the confocal microscope. The nucleus
(N)stained with DAPI, was excited with 405 nm to obtain
461 nm of emission (blue) of the DAPI dye, shown in
figures 8-a, 8-d, 9-a and 8-d. Figure 8 shows the UCNPsinto
HeLa cells and figure 9 shows UCNPs into breast cancer
cells (MB-MDA-231). In figures 8-b, 8-e, 9-b and 9-e it is
seen the localization of functionalized UCNPs only excited
with NIR 980 nm +RFP (red fluorescent protein) 8-c, 8-f, 9-
c and 9-f shows the merge of the images. The UCNPs were
clearlylocalized in the cytoplasmic region as expected, since
folic acid ligands were used for UCNPinternalization.The
confocal images of the UCNPs into the cells were observed
in the laser-scanning microscope Olympus FluoView
FV1000 (Japan).
Fig.8: Fluorescence redemission by Y2O3:Er3+/Yb3+ (1%,10% mol) incubated with HeLa cells (concentration 1 µg/mL) for 24 h.
(a) Staining with DAPI show nuclei of HeLa, MB-MDA-231 and MCF-7 cells labeled as “N” (b) Laser NIR 980 nm + RFP
shows the functionalized UCNPs into the cell. (c) Overlay DAPI, Laser 980 nm +RFP localize the UCNPs activity in the
cytoplasm of the cells (white arrows).
65.71
80.56
34.29 19.44
0%10%20%30%40%50%60%70%80%90%
100%
0.1 1 C+
Per
cen
tag
e
Nanoparticles concentration
(µg/mL)
% Dead
cells
% Live
cells
83.78 83.33
16.22 16.67
0%
10%
20%
30%
40%
50%
60%
70%
80%
90%
100%
0.1 1 C+
Per
cen
tan
ge
Nanoparticles concentration
(µg/mL)
% Dead
cells
% Live
cells
HeLa
ATCC
CCL-2
1 µg/mL
MB-MDA-
231
1 µg/mL
30 µm
30 µm
N N
N
30 µm 30 µm
N
N N
(a) (b)
(a) (c) (b)
(d)
)
(c)
(e) (f)

International Journal of Advanced Engineering Research and Science (IJAERS) [Vol-4, Issue-8, Aug- 2017]
https://dx.doi.org/10.22161/ijaers.4.8.4 ISSN: 2349-6495(P) | 2456-1908(O)
www.ijaers.com Page | 30
Fig.9: Fluorescence red emission by Gd2O3:Er3+/Yb3+ (1%,10% mol) incubated with HeLa cells (concentration 1 µg/mL) for 24
h. (a) Staining with DAPI show nuclei of HeLa, MB-MDA-231 and MCF-7 cells labeled as “N” (b) Laser NIR 980 nm + RFP
shows the functionalized UCNPs into the cell. (c) Overlay DAPI, Laser 980 nm +RFP localize the UCNPs activity in the
cytoplasm of the cells (white arrows).
IV. DISCUSSION AND CONCLUSIONS
The UCNPs synthesized by the sol-gel methodwith the
hosts Y2O3 and Gd2O3 co-doped with Er3+ and Yb3+had a
shape mostly spheroidal with an average diameters of 70
nm and 50 nm (±10 nm) respectively.The
photoluminescence analysis showed outstanding optical
properties for bare and functionalized UCNPs, they have a
stable luminescence, photostability and long lifetimes of
excited states, so they overcome the problems of the
currently used organic dyes. The UCNPs showed red
emission spectra (660 nm). The FTIR spectra showed the
prescence of the amine-folic acid bonds (NH2-FA) on the
surface of the UCNPs (1612 to 1512 cm-1), the FA ligands
(3331 cm-1) and the wagging –NH2 (669-793 cm-1).We
evaluated the viability of the cells with bare and
functionalized UCNPs with the MTT assay. The ability of
the cells to reduce MTT is an indicator ofmitochondrial
integrity and its functional activity is interpreted as measure
of cell viability after exposure to the UCNPs evaluated.The
HeLa cells incubation with different bare Y2O3:Er3+/Yb3+
and G2O3:Er3+/Yb3+at 0.001 and 0.01 µg/mLconcentrations
caused a 40% of cell death. But,with UCNP-NH2-FA, all
the cells had more than 80% of viability, thus the cell death
and the cytotoxic effect was reduced for all of the tested
concentrations. For breast cancer cells MB-MDA-231,
trypan blue assay showed more than 80% cell viability for
the tested concentrations, confirming that the UCNPs are
non-cytotoxic.The studies with the confocal microscope
showed the UCNPs localized into the cell cytoplasm with
no cytotoxicity effects to other possible cells, which
confirms that they can be used as biolabels for the cancer
cells studied. Further studies with in vivo murine models
with breast and cervix cancer need to be tested to be
considered as an important tool to diagnostic cancer.
V. ACKNOWLEDGEMENTS
The authors wish to acknowledge financial support from
DGAPA-UNAM (Grant No. 111017). Technical support
provided by E. Aparicio, F. Ruiz. M. Ponce, Dr. F.
Castillónand L.Pérezare gratefully acknowledged. Karla
Juarez-Moreno is a member of the International Network of
Bio nanotechnology with impact in Biomedicine, Food and
Biosafety (CONACYT, Mexico).
REFERENCES
[1] Wang M., Abbineni G., Clevenger A.: Upconversion
nanoparticles: synthesis, surface modification and
biological applications.Nanomedicine.7, 710–729
(2011).
[2] Min L., Ying Z., Shu W., Ming L., Duan Z., Chen Y.,
Li Y., Xu F., Lu T.: Recent advances in synthesis and
surface modification of lanthanide-doped
upconversion nanoparticles for biomedical
applications. Biotechnol. Ad.30, 1551-1561 (2012).
[3] Matsuura D.: Green and blue upconversion
luminescence of trivalent-rare-earth ion-doped Y2O3
nanocrystals. Appl. Phys. Letters. 81, 4526-4528
(2010)
[4] Taxak V., Khatkar S., Han S., Kumar R., Kumar M.:
Tartaric acid assisted sol gel synthesis of Y2O3:Eu3+
nanoparticles. J. Alloys Compds. 469(1), 224-228
(2009).
HeLa
ATCC
CCL-2
1 µg/mL
MB-MDA-
231
1 µg/mL
(b) (a) (c)
(d) (e) (f)

International Journal of Advanced Engineering Research and Science (IJAERS) [Vol-4, Issue-8, Aug- 2017]
https://dx.doi.org/10.22161/ijaers.4.8.4 ISSN: 2349-6495(P) | 2456-1908(O)
www.ijaers.com Page | 31
[5] Blasse G., Grabmaier B. Luminescent Materials,
Telos, Berlin, Springer-Verlag (1994).
[6] Chávez D., Contreras O., Hirata G.: Synthesis and
upconversion luminescence of nanoparticles Y2O3 and
Gd2O3 Co-doped with Yb3+ and Er3+. Nanomaterials
and Nanotechnology,6, 7-17 (2016).
[7] Da Costa M., Doughan S., Han Y., Krull U.:
Lanthanide upconversion nanoparticles and
applications in bioassays and bioimaging: A review.
Anal. Chim. Acta,832, 1–33 (2014).
[8] Sudimack, J., Lee, R.J.: Targeted drug delivery via the
folate receptor. Adv. Drug Deliv.Rev. 41, 147–162
(2000).
[9] StöberW., Fink A., Bohn E.: Controlled growth of
monodisperse silica spheres in the micron size range.J.
of Colloid and Interface Science,26 (1), 62-69 (1968).
[10] Sounderya N., Zhang Y.: Upconversion Nanoparticles
for Imaging Cells. Proceedings 23, 741–1744 (2009).
[11] Lu, Y., Sega, E., Leamon, C.P., Low, P.S.: Folate
receptor-targeted immunotherapy of cancer:
mechanism and therapeutic potential. Adv. Drug Deliv.
Rev. 56, 1161–1176 (2000).
[12] Yee, K., Seow, E., Zhang, Y., Chyn, Y.: Biomaterials
Targeting CCL21 e folic acid e upconversion
nanoparticles conjugates to folate receptor- a
expressing tumor cells in an endothelial-tumor cell
bilayer model. Biomaterials. 34, 4860–4871 (2013).
[13] Ai J., Xu Y., Li D., Liu Z., Wanga E.: Folic acid as
delivery vehicles: targeting folate conjugated
fluorescent nanoparticles to tumors imaging. Talanta.
101, 32–37 (2012).
[14] Chávez D., Juárez-Moreno K., Hirata G.: Aminosilane
functionalization and cytotoxicity effects of
upconversion nanoparticles Y2O3 and Gd2O3 Co-doped
with Yb3+ and Er3+. Nanobiomedicine. 3, 1-7 (2016).
[15] Chávez-García D., Juárez-Moreno K., Hirata G.A.:
Synthesis, aminosilane-folic acid functionalization and
cytotoxicity of the upconversion nanoparticle
Y2O3+:Er3+, Yb3+ for cancer cell detection. RIIT. 4,
24, 1-11 (2017).
[16] Hemmer E., Yamano, Kishimoto, Venkatachalam,
Hyodo, Soga: Cytotoxic aspects of gadolinium oxide
nanostructures for up-conversion and NIR
bioimaging.ActaBiomaterialia.9, 4734-4743 (2013).
[17] Strober W.: Trypan blue exclusion test of cell
viability.Pub med.3 (2001).
[18] Sanchez-Sanchez L., Tapia-Moreno A., Juarez-
Moreno K., Patterson D., Cadena-Nava R., Douglas T.
and Vazquez-Duhalt R.: Design of a VLP nanovehicle
for CYP450 enzymatic activity delivery”, J.
Nanobiotechnol.13, 66-76 (2015).

International Journal of Advanced Engineering Research and Science (IJAERS) [Vol-4, Issue-8, Aug- 2017]
https://dx.doi.org/10.22161/ijaers.4.8.5 ISSN: 2349-6495(P) | 2456-1908(O)
www.ijaers.com Page | 32
Analysis of fire extinguisher gauge level using
OpenCV Gayatri Behera
Abstract— Computer Vision domain holds the promise of
finding solutions to the most arduous issues of today.
Analyzing and deciphering an image clearly with the aim of
gathering more insight, especially without any human
intervention is the ideal goal. With this aim in mind, it
would be highly desired to have an autonomous detector
that measures the reading given by a fire gauge which is
mounted off a fire exterminator.
Keywords— Feature extraction, image processing,
OpenCV.
I. INTRODUCTION
This problem is primarily focused in the domain of disaster-
averting; with an inclination towards fire-fighting.
Any fire can be controlled by making use of fire
extinguishers that help douse out a flame by spray out CO2
(carbon-dioxide). These fire extinguishers are installed at
multiple locations in any establishment depending on the
number of people frequenting the place, size of the
establishment, nature of work conducted at the
establishment etc. These cylinders have a dimension of
about 30cm – 50 cm and typically weigh around 2.5kg –
18kg or so. The fire extinguishers are typically mounted
with a fire gauge meter that helps track the pressure exerted
on carbon dioxide still pending within the cylinder.
Regular maintenance work involves the monitoring of these
gauges manually by maintenance workers to ensure that the
content level is up to the mark. This would involve regular
up-keep and monitoring by the said personnel at regular
fixed intervals. This is a necessity, not just to get an
estimate of the content level but also to ensure that proper
health of the cylinder is being maintained. Such measures
may not be entirely feasible if and when the establishment
in question is very vast in size or lacks sufficient number of
people to man the premises. This could create unimaginable
difficulties in that, if a particular cylinder is partially full or
not fully equipped to douse out a flame then it could lead to
substantial loss of property and worse - injury as well as
loss of life.
An ingenious work around could be to utilise the CCTV
(closed circuittele-vision) cameras installed at such places
to maintain the up-keep of cylinders installed at such
premises. In fact, the inclusion of CCTV systems in
manning them can help in taking daily as well as weekly
updates.
A brief manner in which this can be done would involve
taking snapshots of the video stream gathered from these
cameras at regular, predefined intervals. Further processing
and filtering of the image. Segmenting out the image to
determine the features and areas of interest i.e. the fire
gauge meter section. Ultimately, this would help in reaching
a conclusion.
II. WORKING
The abstract code would involve writing code in Python,
utilizing OpenCV - Python’s feature-rich library that caters
exclusively to the computer vision domain.
The initial steps would involve procuring images of a
certain preset dimension. Allowances can be made later on,
to accommodate live video feed too.
The steps would involve:-
1. Fetching of the image of pre-defined configurations
2. Implementation of initial, filtering on the images to
convert the image from a colored image to a gray-
scale image
3. Smoothening of the image to remove noise, blurring
effects from these images.
4. Performing color identification to identify particular
color pixels in a certain region.
5. Cropping out or segmenting this region.
6. Drawing a conclusion.
System Flow:
Make use of OpenCV library by Python to read and perform
filtering of the images. ThePython version used would be -
2.7 on Windows 8.1/10 environment. IDEused was Visual
studio 2015 community edition - which provides support for
installation of all other Python packages through the IDE
itself, namely - Numpy, Matplotlib and OpenCV (but
provided Python 2.7 has been installed before).
OpenCV: It provides certain in-built commands such as
imread(), imshow() to take in as well as display images.
cvtColor() to convert images from one color scale to
another. Also, support for certain filters for edge detection,
blurring etc. is provided.

International Journal of Advanced Engineering Research and Science (IJAERS) [Vol-4, Issue-8, Aug- 2017]
https://dx.doi.org/10.22161/ijaers.4.8.5 ISSN: 2349-6495(P) | 2456-1908(O)
www.ijaers.com Page | 33
Numpy: It helps in reading the image as an array of
numbers. That helps in identifying important features that
can be further isolated and which would aid in
classification. For instance - the Numpy value of an image
provides information not just about the image dimension
and size, but also about particular pixel values which in turn
indicate the presence of a certain color. Each pixel in an
image has an RGB component – which denotes the extent
of the colors – Red, Green and Blue. In case of the fire
extinguisher cylinder, the pressure gauge measures the
pressure exerted in psi on the pressurized gas.The gauge
meter is separated into two color-coded regions i.e green
and red. Green indicates the “Safe” zone and Red that the
pressure is well within the normal range.
Fig.1: Standard fire extinguisher pressure gauge image
Conversion of this image to the it’s gray-scale equivalent
yields the below result –
Fig.2: (a) Standard fire extinguisher pressure gauge
image on gray-scale conversion. (b) On segmenting out the
red-colored region.
Segmenting the image based on the pixel values that would
identify the region based on it’s underlying color.
III. RESULTS
Utilizing this approach helped identify fire extinguishers
which would not function as expected in the advent of a fire
emergency. The relative position of the dial on the
particular color region indicates the health of the fire
extinguisher. In this case, it came out to lie in the “danger”
or red zone, so the fire extinguisher could be duly replaced
or repaired before-hand.
REFERENCES
[1] www.opencv.org/
[2] http://ieeexplore.ieee.org/document/6240859/?reload=t
rue
[3] http://www.pyimagesearch.com/

International Journal of Advanced Engineering Research and Science (IJAERS) [Vol-4, Issue-8, Aug- 2017]
https://dx.doi.org/10.22161/ijaers.4.8.6 ISSN: 2349-6495(P) | 2456-1908(O)
www.ijaers.com Page | 34
A Secure IoT Data Integration in Cloud Storage
Systems using ABAC Access Control Policy Ismail Chahid, Abderrahim Marzouk
IR2M Laboratory, Faculty of Science and Technology, University Hassan 1st Settat, Morocco
Abstract— Internet of Things has become one of the most
emerging technologies now days, which is growing rapidly
in the telecommunications field. It is as a network of
physical objects, peoples, vehicles, buildings, and other
items, which are having a unique identity and are able to
interchange data using embedded electronics, sensors, and
software equipment to reach common goals. The large
scale of real time data collected and exchanged between
objects in IoT grows exponentially which represent a big
challenge in term of storing and processing. Cloud
Computing has emerged as a key technology to solve the
problem of IoT data storage and processing by offering
multiple choices of resources provided by cloud service
provider, including storage, processing, memory and
network bandwidth. Nevertheless, as many other
technologies, Cloud computing has some issues regarding
IoT data storage. One of the major issues is Security and
Privacy. In this paper, we will present a proposed
architecture for a Secure IoT data integration in Cloud
Storage Systems.
Keywords— Cloud Computing; Internet of Things;
Security; Data.
I. INTRODUCTION
In the recent years, Internet of Things (IoT) has become
one of the most promising technologies in the
telecommunication field. It represent a new paradigm in
which interconnected and heterogeneous entities such as
physical objects, peoples, vehicles, devices, buildings and
other objects are having a unique identity (ID) and are able
to interchange data using embedded electronics, sensors,
and software equipment to reach common goals [1]. This
new step in technology sector will have a high impact on
different areas including smart homes, assisted living, e-
health, industrial manufacturing and environmental
monitoring. The main technologies parts involved in
Internet of Things are Wireless Sensor Networks (WSN),
Radio-frequency identification (RFID), machine-to-
machines interfaces (M2M), micro-electromechanical
systems (MEMS) and Internet. All this technologies
combined with different entities in IoT environment will
increase the amount of data collected exponentially which
represent a big challenge in term of processing and Storing.
Cloud Computing appear to be an ideal choice to solve the
problem of processing and storing data collected from
different IoT devices [2], since it provide a multiple choice
of resources including high performance processing,
storage, memory and network bandwidth that are accessible
on demand anywhere [3]. However, Cloud Computing
technology comes with some issues that are Security and
Privacy concerns [4]. Many organizations, companies and
individuals are using sensitive and confidential data in their
transactions. This data is collected from IoT devices and
moved into cloud storage to be processed using different
computing techniques like virtual machines. Many security
challenges can be encountered during this process like
accessibility vulnerability, and virtualization vulnerability.
which makes it hard for organisations to adopt this
technology due to previous mentioned concerns. This paper
is organized as follows. In section 2, we present the
previous released research that deal with the topic of IoT
data security in Cloud Storage. Section 3 discuss the IoT
architecture and the authentication of IoT devices to the
Cloud. Moreover, in section 4 we discuss the ABAC
Access Policy and finally we present the proposed
architecture for IoT Data integration to the Cloud.
II. RELATED WORK
Security issues is on of big concerns in term of storing
processing and managing data in both IoT and Cloud
environment. In [5] authors presented a survey on secure
integration of IoT and Cloud Computing, and then they
proposed a model for securing this integration. A secure
storage system was proposed for storing IoT data in [6], the
authors applied a Role Based Access Control policy
(RBAC) combined with AES/RSA encryption to manage
authenticity and data security, but Role-based access
controls (RBAC) may not suffice in the IoT because of the
lack of flexibility.. In [7] an authentication model was
described based on different access use case scenarios in
IoT Clouds. A multi-layer cloud architectural model was
proposed in [8] for IoT-based smart homes, the main idea
focus on the development of a Public cloud that collect data
from different private cloud vendors using Ontology-based
security service framework.

International Journal of Advanced Engineering Research and Science (IJAERS) [Vol-4, Issue-8, Aug- 2017]
https://dx.doi.org/10.22161/ijaers.4.8.6 ISSN: 2349-6495(P) | 2456-1908(O)
www.ijaers.com Page | 35
III. IOT DATA INTEGRATION IN THE CLOUD
A. Internet of Things Architecture
IoT architecture can be represented with four categories of
interconnected systems such as things, gateways, network
and cloud as showed in Figure 1.
Things: Today large amounts of things are found in
industrial and commercial settings, it is also in users mobile
and home. Already, cars, device sensors, and mobile
phones are accessing the Internet through broadband
wireless networks. IoT technology solution requires
intelligent things capable of filtering and managing data
locally and connecting to gateways easily.
Gateways: The majority of existing things are not capable
to connect to the internet to share data with the cloud
because of their design. To solve this issue, gateway act as
intermediate between internet and things.
Network Infrastructure: Internet is a complex system of
interconnected IP networks that links billions of computers
together. Network infrastructure comprises gateways,
routers, repeaters, switches and other devices that controls
the data traffic and connect with cable and telecom
networks operated by different service providers
Cloud: Cloud contains huge number of interconnected
virtualized servers and standard servers connected together.
To support the IoT environment cloud infrastructure runs
different applications, which are capable to analyse the data
collected from different devices and sensors to make the
correct decision.
Fig. 1: IoT Architecture
B. Cloud Computing Architecture
According to the official NIST definition, "cloud
computing is a model for enabling ubiquitous, convenient,
on-demand network access to a shared pool of
configurable computing resources (e.g., networks, servers,
storage, applications and services) that can be rapidly
provisioned and released with minimal management effort
or service provider interaction."
Cloud Service Providers (CSP) offer their "services"
according to standard models defined by NIST, are
Infrastructure as a Service (IaaS), Platform as a Service
(PaaS), and Software as a Service (SaaS) Figure 2.
Fig. 2: Cloud Computing Layers

International Journal of Advanced Engineering Research and Science (IJAERS) [Vol-4, Issue-8, Aug- 2017]
https://dx.doi.org/10.22161/ijaers.4.8.6 ISSN: 2349-6495(P) | 2456-1908(O)
www.ijaers.com Page | 36
C. Authentication for IoT Clouds
Nowadays, Cloud Computing can provide access to IoT-
based resources through special designed applications with
specific interconnected structures. Thus, a new iteration in
the "as-a-service" model is added to Cloud Concept, which
is IoT as a Service or simply (IoTaaS). This new model
requires a complex authentication scheme. Authentication
refers specifically to verifying the identity of a device. It
aims to prove that all entities are what they claim to be.
This ensures that communications are only transmitted to
the intended recipient; The authentication completely
reassures the recipient on the origin of the communication.
In the IoT universe, several scenarios are possible:
authentication of devices on cloud services, users on
devices, objects on objects.
In IoT development field, Authentication standards are a
major requirement to execute operations in the efficient
way. There is a variety of competing standards. One of
them is Fast Online Identity (FIDO) alliance and the other
one is M2M. They are both growing authentication and
access architectures intended for all IoT markets.
To maintain security, trust, privacy and confidentiality of
the integrated data, Internet of Things requires a solid and
proven approach.
PKI infrastructure is an interoperable and standard-based
technology that has been used in IoT. It comes with a
specific scheme to provide main security assessments like
privacy data integrity and authentication [9]. The design of
PKI infrastructure makes it easily adapted for IoT
requirements in term of diversity, velocity and volume.
There are many models of integration of the PKI
Infrastructure in IoT, one of the models is the hardware
based cryptographic device TPM which is a ship that
needs to be integrated to the device.
Enabling strong identities at the hardware level protects
against identity theft and the compromise of keys that
would endanger the entire interconnected system. If a
change occurs, the entire ecosystem is notified and the
administrators can respond accordingly.
IV. ABAC ROLE BASED ACCESS POLICY
Access control is based on the identity of a user requesting
execution of a capability to perform an operation (e.g.,
read) on an object (e.g., a file). This can be done directly
either as in Discretionary Access Control or Mandatory
Access Control or through predefined attribute types, such
as roles or groups assigned to that user as in Role Based
Access Control or RBAC.
Role-based access controls (RBAC) by themselves may
not suffice in the IoT because they are not flexible enough.
An RBAC-only system would increase risks in IoT
systems and services that possess the following
characteristics:
- Unpredictable environments: IoT services within
unpredictable environments, such as those
environments dealing with many people at once.
Where crowd dynamics and emotions can create
responses to different conditions that are very
hard to project.
- Contrary functions: IoT services with
dramatically different, or even opposite,
functional requirements under abnormal versus
normal conditions—for instance, a fire door
during an actual fire (abnormal condition) that
must open, versus the same door under non-fire
conditions that must sound alarms and not open
easily.
RBAC cannot effectively account for these sorts of
properties alone, and in the IoT, with the increasing
prominence of the logical-kinetic/cyber-physical interface,
attributes will play an important role in authorization
exercises.
Attribute-based access control (ABAC) is an access
control method where subject requests to perform
operations on objects are granted or denied based on
assigned attributes of the subject, assigned attributes of the
object, environment conditions, and a set of policies that
are specified in terms of those attributes and conditions
[10].
ABAC has three main functional points, which is as
follows:
The PEP or Policy Enforcement Point: is a component
that serves for protecting apps & data in which ABAC is
applied. The PEP inspects the request and describe the
user’s attributes to the Policy Decision Point PDP.
The PDP or Policy Decision Point is the component that
makes the determination of whether a user’s request is
authorised or not by evaluating incoming requests against
policies it has been configured with. The PDP returns a
Permit / Deny decision. The PDP may also use PIPs to
retrieve missing metadata
The PIP or Policy Information Point serves as the retrieval
source of attributes and bridges the PDP to external
sources of attributes e.g. LDAP or databases.
The proposed architecture for the authentication of things
in IoT-Clouds is a combination of ABAC Technology and
PKI Infrastructure (Figure 3). It forces a smart object in
IoT to pass a double check authentication system to ensure
that the data is collected from the correct IoT object and
not from a fake one. For the users that needs to get access
the IoT data stored in the cloud, we used another multi
authentication factor which is the mobile two factors
authentication MPTFA [11].

International Journal of Advanced Engineering Research and Science (IJAERS) [Vol-4, Issue-8, Aug- 2017]
https://dx.doi.org/10.22161/ijaers.4.8.6 ISSN: 2349-6495(P) | 2456-1908(O)
www.ijaers.com Page | 37
Fig. 3: Proposed Architecture
IV.
CONCLUSION & PERSPECTIVES
In our proposed architecture, we tried to make it possible
for storage systems in IoT-Cloud infrastructures to ensure
that data collected from things and smart objects is
authentic and secure by combining three different
authentication technologies: ABAC Access Control, PKI
Infrastructure system, and MPTFA.
In our future work, we will try to implement an adoptable
cryptosystem in the proposed architecture to increase the
security level in cloud storage systems.
REFERENCES
[1] Luigi Atzori , et al The Internet of Things: A survey,
doi:10.1016/j.comnet.2010.05.010
[2] The intel IoT platforme, white paper, intel 2015
[3] NIST SP 800-145, The NIST Definition of Cloud
Computing, 2011
[4] Amit SangroyaSaurabh Kumar Towards Analyzing
Data Security Risks in Cloud Computing
Environments, DOI: 10.1007/978-3-642-12035-0_25
[5] C Stergiou, et al., Secure Integration of IoT and Cloud
Computing, Future Generation Computer Systems
(2016), DOI: 10.1016/j.future.2016.11.031
[6] Jayant D. Bokefode et al., Developing A Secure Cloud
Storage System for Storing IoT Data by Applying
Role Based Encryption. doi:
10.1016/j.procs.2016.06.007.
[7] Luciano Barreto et al., An Authentication Model for
IoT Clouds, DOI: 10.1145/2808797.2809361.
[8] Ming Tao, Jinglong Zuo et al., Multi-layer cloud
architectural model and ontology-based security
service framework for IoT-based smart homes, DOI:
10.1016/j.future.2016.11.011
[9] Aysha Albarqi et al, Public Key Infrastructure: A
Survey Journal of Information Security, 2015, 6, 31-
37
TPM
[10] Guide to Attribute Based Access Control (ABAC)
Definition and Considerations, NIST Special
Publication 800-162,
[11] Ayu Tiwari, Sudip Sanyal, Ajith Abraham, Svein
Johan Knapskog, Sugata Sanyal, “A Multi-Factor
Security Protocol for Wireless Payment – Secure Web
Authentication Using Mobile Devices”, IADIS,
International Conference Applied Computing, pp.
160- 167, 2007.

International Journal of Advanced Engineering Research and Science (IJAERS) [Vol-4, Issue-8, Aug- 2017]
https://dx.doi.org/10.22161/ijaers.4.8.7 ISSN: 2349-6495(P) | 2456-1908(O)
www.ijaers.com Page | 38
Incompatibility stone-mortar Influence of pH on
the sensitivity of rocks to saline alterations Meriem Benharbit
Institut National des sciences de l’Archéologie et du Patrimoine, Rabat, Maroc
Abstract—This paper discusses incompatibilities between
stones and mortars. The aim is to understand the
evolution of rocks of acid nature, sandstones in this case,
in the presence of mortars of an alkaline nature, such as
cement mortars used for jointing or coatings. Accelerated
aging tests combining alkaline alteration and salt
alteration were simultaneously carried out in order to
study the synergy between these two processes of
degradation. The degradation process is follow-up by
observing the induced alteration patterns, the
identification of the newly appeared mineral phases and
the evolution of the ultrasonic propagation speed of the
materials tested. The obtained results allow showing that
the pH-salt crystallization synergy is particularly
aggressive towards the studied materials and that the
sustainability of the rocks subjected to circulations of
basic solutions due to the proximity of mortars of alkaline
nature is seriously reduced.
Keywords— durability, incompatibilities, mortar, pH,
stone, salts.
I. INTRODUCTION
The aim of this work is to study the behavior of
monument stones through an approach based on
accelerated cycles of aging in a research theme aiming to
study the influence of the chemical nature of mortars on
the durability of implemented stones. The juxtaposition in
a masonry of materials with different mechanical and
chemical qualities can be an additional source of
disorders and degradations. The problem of compatibility
between waxes stones and mortars is essential [1]. It is
indeed necessary to define the behavior of the "stone-
mortar" assembly with regard to the factors of alteration
in order to improve the durability of the structures.
Among the agents of alteration, the soluble salts, which
pass through the masonry by means of capillary ascents or
rainwater, play a preponderant role in the degradation of
the stones used. In fact, accelerated aging tests were
carried out to analyze the behavior of materials in the
laboratory. The aim of this study is to subject rock
samples to the simultaneous action of salts and alkaline
solution to see to what extent the alkaline mortars can
weaken the stones with which they are associated. The
building stones studied are red vosgian sandstone, beige
vosgian sandstone, coal sandstone and molière sandstone.
II. MATERIALS STUDIES
The studied sandstones, of varied provenances, are used
in many historical monuments and in particular in the
construction of the famous Strasbourg Cathedral with
respect to the vosgian sandstones in particular. Coal
sandstone comes from the coal basin of the Cevennes. It
constitutes the bulk of the waste rock from the coalfields
dating from the Stephanian. The molière sandstone comes
from the Permian lands of the Montredon-Labessonié
region in the Tarn. The Beige and Red Vosgian
sandstones come from the Formation of the "Sandstone at
lower Voltzia" of the upper Buntsandstein of the Triassic
of the Vosges.
The characterization of the studied materials (Fig. 1) was
determined by various analytical techniques including
optical microscopy (Figs. 2, 3, 4, and 5) for the
petrographic aspect. The characterization of the porous
space was done by mercury porosimetry.
Fig. 1: Macroscopic aspect of sandstone materials,
reflecting the differences in mineralogical composition
and matrix that gives the rocks their specific color, 1-
molière sandstone, 2-coal sandstone, 3- beige vosgian
sandstone, 4- red vosgian sandstone.
The apparent volumetric mass, the compressive strength
and the propagation velocity of the ultrasound defined the
mechanical cohesion of the materials. The characteristics
of the studied stones are grouped in Table 1.

International Journal of Advanced Engineering Research and Science (IJAERS) [Vol-4, Issue-8, Aug- 2017]
https://dx.doi.org/10.22161/ijaers.4.8.7 ISSN: 2349-6495(P) | 2456-1908(O)
www.ijaers.com Page | 39
Fig. 2-3-4-5: Optical microscopy of sandstones. The
molière sandstone (1) presents aggregates of
microcrystalline quartz, detrital quartz, and muscovite
flakes bathed in a clay-ferruginous matrix ; Coal
sandstone (2) shows fragments of detrital and
polycrystalline quartz, muscovite flakes and a clay matrix
; Beige vosgian sandstone (3) shows fragments of detrital
quartz, quartz fed by secondary silica, fragments of
metamorphic rock and muscovite ; The red vosgian
sandstone (4) has elements of secondary feeding detrital
quartz, aggregates of micrograiny quartz and a hematite
rich matrix.
Table.1: Main characteristics of studied sandstone
coal
sandstone
molière
sandstone
beige
vosgian
sandstone
red
vosgian
sandstone
Mercury
porosity
13.6 % 13.9 % 3.6 % 6.5 %
Apparent
volumetric
mass
( g/cm3)
2,3 2,22 1,82 1,99
Mechanical
resistance
( MPa)
ꓕ au lit :
60
ꓕ au lit :
60
ꓕ au lit :
24
ꓕ au lit :
37
Ultrasonic
propagation
speed (m/s)
2760 2870 1840 1890
III. EXPERIMENTAL PROCEDURE
The experimental protocol adopted is as follows:
sandstone samples are subdivided into two batches. The
first batch is first subjected to an alkaline bath for 28 days
at 60 °C in a saturated solution based on calcium
hydroxide imparting a pH of 12.6 similar to that of the
solutions passing through the alkaline mortars .
In a second step, samples of control rock and those of the
batch treated at pH 12.6 are then subjected to an
accelerated aging test by salt alteration according to the
experimental protocol recommended by RILEM [1]. The
salt used is sodium sulfate. The immersion solution is
prepared from 14% sodium sulfate decahydrate with a
concentration of 14 g of salt for 86 g of water. Samples
are subjected to repeated cycles of consecutive imbibition
and drying. Samples are immersed in the saline solution
for 2 hours at room temperature. The second phase of the
cycle consists of desiccation for at least 16 hours under
conditions of high relative humidity at the beginning of
drying. This phase makes it possible to reach the
saturation of the solution and then the crystallization of
the salts.
IV. RESULTS
The observation of thin plates of rocks of the treated
batch at pH 12.6 shows the development of an important
microcracking of the quartz grains constituting the
sandstones. The microcracking revealed is generalized to
all the materials studied (Figs. 6-7-8-9-10-11-12-13).
Such disturbances have already been noted [2] in
sandstones, granites and mortars, and attributed to the
synergy of several processes: thermal effects (variations
in temperature), hydric (successions of humidification-
drying cycles, chemicals (dissolutions) and mechanical
(saline crystallizations).

International Journal of Advanced Engineering Research and Science (IJAERS) [Vol-4, Issue-8, Aug- 2017]
https://dx.doi.org/10.22161/ijaers.4.8.7 ISSN: 2349-6495(P) | 2456-1908(O)
www.ijaers.com Page | 40
Fig.6-7: Observation of thin blade of the coal sandstone
before (6) and after (7) treatment with pH 12.6
Fig. 8-9: Observation of thin blade of the red vosgian
sandstone before (8) and after (9) treatment with pH 12.6
Fig. 10-11: Observation of thin blade of the molière
sandstone before (10) and after (11) treatment with pH
12.6
Fig. 12-13: Observation of thin blade of the beige vosgian
sandstone before (12) and after (13) treatment with pH
12.6
Following the accelerated aging test by the salts, the two
batches of samples studied show, over the course of the
cycles, a high granular disintegration leading to the
complete degradation of the test tubes (Fig. 14). The
results obtained confirm the abundant data in the
literature concerning the problem of the saline alteration
of the stones used in the historical monuments [3], [4],
[5], [6].

International Journal of Advanced Engineering Research and Science (IJAERS) [Vol-4, Issue-8, Aug- 2017]
https://dx.doi.org/10.22161/ijaers.4.8.7 ISSN: 2349-6495(P) | 2456-1908(O)
www.ijaers.com Page | 41
Fig.14: Illustration of facies of alteration of sandstone
under the effect of saline crystallizations.
The alteration process is monitored by measurements of
the propagation speed of the ultrasound. This measure,
which has the advantage of being non-destructive, reflects
the degree of cohesion and compactness of the materials
[7]. Regardless of the studied material, ultrasonic
propagation velocity measurements could not be carried
out during last cycles, whereas the rock maintained a state
of cohesion allowing the test to continue. The attenuation
of the waves at this stage is such that no readable signal
can cross these materials. The degradation of the
specimens following saline crystallization is accompanied
by the progressive fall in the propagation speed of the
sound.
The results are plotted in the figures (15-16-17-18) where
V(%) represents the variation of the ultrasonic velocity
as a function of the saline alteration cycles.
V (%) = 100 (Vc - Vx) / Vc with:
Vc = ultrasonic propagation velocity measured through
the samples of the control batch;
Vx = ultrasonic propagation velocity measured through
the materials after x cycles.
Fig.15: Variation according to salt alteration cycles of
rate of loss of ultrasonic speed of the control and treated
samples at pH 12.6 for 28 days at 60°C.
Fig.16: Variation according to salt alteration cycles of
rate of loss of ultrasonic speed of the control and treated
samples at pH 12.6 for 28 days at 60°C.
Fig. 17: Variation according to salt alteration cycles of
rate of loss of ultrasonic speed of the control and treated
samples at pH 12.6 for 28 days at 60°C.
Fig.18: Variation according to salt alteration cycles of
rate of loss of ultrasonic speed of the control and treated
samples at pH 12.6 for 28 days at 60°C.
It should be noted that the batch treated with the basic pH
shows a reduction in the propagation speed of the sound
that is greater than the control samples, for all classes of
rocks combined. These results can be attributed to the
microcrack network revealed in quartz crystals following
the alkaline attack. The play of the dilation and the
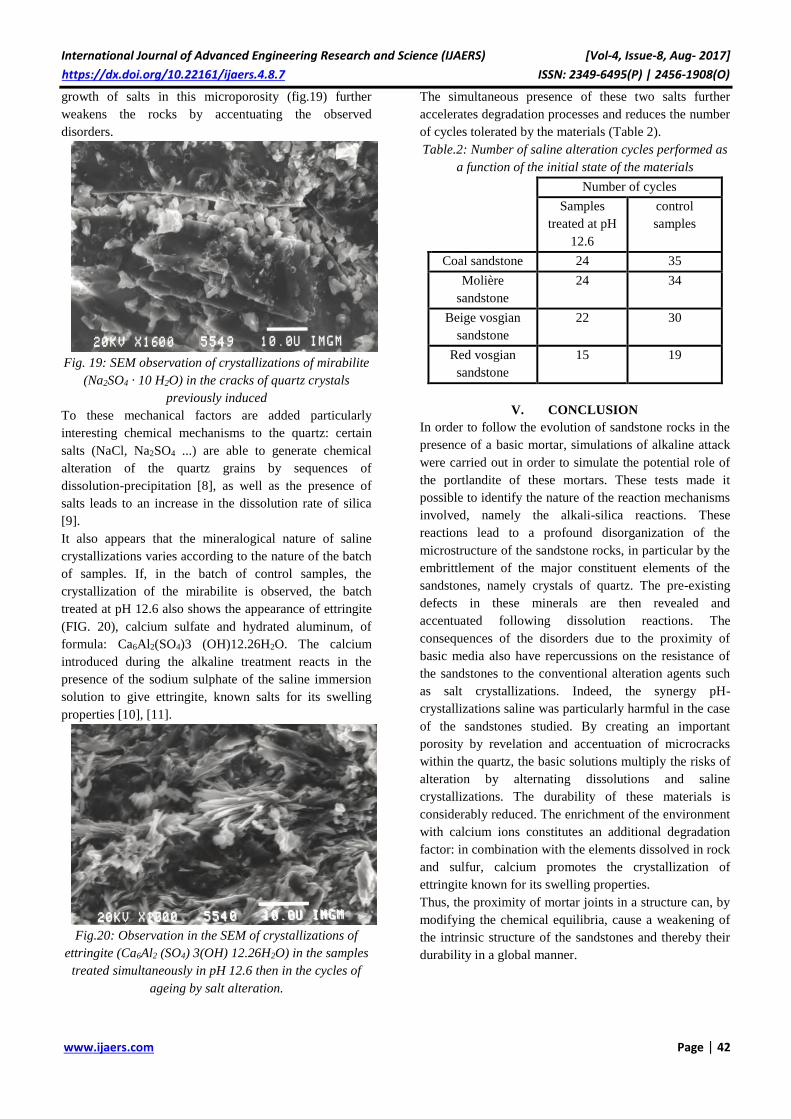
International Journal of Advanced Engineering Research and Science (IJAERS) [Vol-4, Issue-8, Aug- 2017]
https://dx.doi.org/10.22161/ijaers.4.8.7 ISSN: 2349-6495(P) | 2456-1908(O)
www.ijaers.com Page | 42
growth of salts in this microporosity (fig.19) further
weakens the rocks by accentuating the observed
disorders.
Fig. 19: SEM observation of crystallizations of mirabilite
(Na2SO4 · 10 H2O) in the cracks of quartz crystals
previously induced
To these mechanical factors are added particularly
interesting chemical mechanisms to the quartz: certain
salts (NaCl, Na2SO4 ...) are able to generate chemical
alteration of the quartz grains by sequences of
dissolution-precipitation [8], as well as the presence of
salts leads to an increase in the dissolution rate of silica
[9].
It also appears that the mineralogical nature of saline
crystallizations varies according to the nature of the batch
of samples. If, in the batch of control samples, the
crystallization of the mirabilite is observed, the batch
treated at pH 12.6 also shows the appearance of ettringite
(FIG. 20), calcium sulfate and hydrated aluminum, of
formula: Ca6Al2(SO4)3 (OH)12.26H2O. The calcium
introduced during the alkaline treatment reacts in the
presence of the sodium sulphate of the saline immersion
solution to give ettringite, known salts for its swelling
properties [10], [11].
Fig.20: Observation in the SEM of crystallizations of
ettringite (Ca6Al2 (SO4) 3(OH) 12.26H2O) in the samples
treated simultaneously in pH 12.6 then in the cycles of
ageing by salt alteration.
The simultaneous presence of these two salts further
accelerates degradation processes and reduces the number
of cycles tolerated by the materials (Table 2).
Table.2: Number of saline alteration cycles performed as
a function of the initial state of the materials
Number of cycles
Samples
treated at pH
12.6
control
samples
Coal sandstone 24 35
Molière
sandstone
24 34
Beige vosgian
sandstone
22 30
Red vosgian
sandstone
15 19
V. CONCLUSION
In order to follow the evolution of sandstone rocks in the
presence of a basic mortar, simulations of alkaline attack
were carried out in order to simulate the potential role of
the portlandite of these mortars. These tests made it
possible to identify the nature of the reaction mechanisms
involved, namely the alkali-silica reactions. These
reactions lead to a profound disorganization of the
microstructure of the sandstone rocks, in particular by the
embrittlement of the major constituent elements of the
sandstones, namely crystals of quartz. The pre-existing
defects in these minerals are then revealed and
accentuated following dissolution reactions. The
consequences of the disorders due to the proximity of
basic media also have repercussions on the resistance of
the sandstones to the conventional alteration agents such
as salt crystallizations. Indeed, the synergy pH-
crystallizations saline was particularly harmful in the case
of the sandstones studied. By creating an important
porosity by revelation and accentuation of microcracks
within the quartz, the basic solutions multiply the risks of
alteration by alternating dissolutions and saline
crystallizations. The durability of these materials is
considerably reduced. The enrichment of the environment
with calcium ions constitutes an additional degradation
factor: in combination with the elements dissolved in rock
and sulfur, calcium promotes the crystallization of
ettringite known for its swelling properties.
Thus, the proximity of mortar joints in a structure can, by
modifying the chemical equilibria, cause a weakening of
the intrinsic structure of the sandstones and thereby their
durability in a global manner.

International Journal of Advanced Engineering Research and Science (IJAERS) [Vol-4, Issue-8, Aug- 2017]
https://dx.doi.org/10.22161/ijaers.4.8.7 ISSN: 2349-6495(P) | 2456-1908(O)
www.ijaers.com Page | 43
REFERENCES
[1] RILEM, Commission 25-PEM, Essais recommandés
pour mesurer l’altération des pierres et évaluer
l’efficacité des méthodes de traitement. Matériaux de
construction, V.13, N. 75, p. 175-252.
[2] Quénné B., “ Transformations minéralogiques et
texturales de matériaux rocheux, mortiers et bétons
d’ouvrages variés-Approche de la cinétique des
mécanismes et identification des facteurs
responsables”. Thèse Université de Nancy I, 1990.
[3] El-Gohary M., “Chemical deterioration of egyptian
limestone affected by saline water”, International
Journal of Conservation Science, Vol. 2, n° 1,
Janvier-mars 2011, p. 17-28
[4] Verges-Belmin V., Bromblet Ph., « Altération de la
pierre par les sels », Monumental, 2001, p. 226-233
[5] Deneker M. F. C., “Le rôle des sulfates de sodium
dans l’altération des pierres du patrimoine bâti :
méthodes indirectes d’identification pour l’approche
expérimentale”. Thèse de l’université de Cergy-
Pontoise, 2014.
[6] Angeli M., “Multiscale study of stone decay by salt
crystallization in porous networks”. Thèse de
l’université de Cergy-Pontoise. 2007
[7] Ahmad Abdelraheem A., Pamplona M., Simon S.,
“Ultrasonic testing for the investigation and
characterization of stone, a non-destructive and
transportable tool ”, Reviews in conservation, 2009,
n° 10, p. 43-53
[8] Magee A.W., Bull P.A., and Goudie A.S., “Before
rock decay, chemical weathering of constituent
grains by salts”. Symposium international d’Athènes
sur « la géologie de l’ingénieur appliquée aux travaux
anciens, monuments et sites historiques » V. 2, p.
779-786. 1988.
[9] Morris R.C. and Fletcher A.B., “Increased solybility
of quartz following ferrous-ferric iron reaction”.
Nature, 330, 551-561.1987 ;
[10] Brunetaud X., “Etude de l’influence de différents
paramètres et de leurs interactions sur la cinétique et
l’amplitude de la réaction sulfatique interne au
béton”. Thèse de l’école centrale des arts et
manufactures, école centrale Paris, 2005.
[11] Leklou N., “Contribution à la connaissance de la
réaction sulfatique interne”. Thèse de l’université
Paul-Sabatier de Toulouse III. 2008.

International Journal of Advanced Engineering Research and Science (IJAERS) [Vol-4, Issue-8, Aug- 2017]
https://dx.doi.org/10.22161/ijaers.4.8.8 ISSN: 2349-6495(P) | 2456-1908(O)
www.ijaers.com Page | 44
Influence of Coal Rock Hardness and Confining
Pressure on load Fluctuation Characteristics of
PDC bit during Gas Extraction Borehole in Soft
Coal Seam
ShifengWanga, XiaomingHanb*, QiangqiangZhangc, Jialiang Lid, DetuoChene,
a,b,c,d,e School of Mechanical and Power Engineering,HenanPolytechnic University, Jiaozuo 454000, China )
*Corresponding author at School of Mechanical and Power Engineering, Henan Polytechnic University, Jiaozuo 454000,
China. E-mail addresses: ( Xiaoming Han).
Abstract— Load fluctuation characteristics have a great
influence on drilling performance. so, study the influence of
coal rock hardness and confining pressure on the load
fluctuation characteristics of PDC bitbecome more and
more important. Gas drainage drilling experiment table
was built and Gas drainage drilling experiment was carried
out under different coal rock hardness and confining
pressure.The results indicate that drilling torque and feed
resistance are decreased with the increase ofcoal rock
hardness. Vibration amplitude of drilling torque and feed
resistance increase with increase of coal rock hardness
when the value of coal rock hardnessis larger than 1.3.
Vibration amplitude of feed resistance is maximumwhen the
value of coal rock hardness is 1.03 and Vibration amplitude
of feed resistance is minimum when the value of coal rock
hardness is 1.03. Drilling torque and feed resistance are
increased with the increase of confining pressure. Vibration
amplitude of feed resistance decreases from 3MPa to 7MPa
then increases. Vibration amplitude of drilling torque and
feed resistance are all minimum when the value of
confining pressure is 7MPa. It provides a good basis for
setting the appropriate feeding speed and rotation speed in
actual work.
Keywords— coal rock hardness, PDC, borehole.
I. INTRODUCTION
All metallurgical and mechanical aspects of failure that can
occur for a drill pipeare considered and discussed. And
finally, this comprehensive review leads to a conclusion
that categorizes the primary sources of drill pipe failure into
seven major groups and makes some recommendations to
avoid them[1].The ANASYS software was applied to
analyze the inherent frequencies of the vertical vibration,
horizontal vibration and rotary vibration during the
different drilling depth. The excitation frequency to the
drilling rod could be changed by the rotary speed adjusted
at drilling rig working period. Thus the resonance caused
by the vibration could be reduced and could provide the
guidance to the success of the geological
exploration[2].Transverse vibrations of drillstrings caused
by axial loading and impact with the wellbore wall is
studied[3].A linear quadratic regulator (LQR) controller is
designed based on a linearized model and is shown to be
effective in eliminating this type of oscillations. It is also
shown that for some operational parameters the control
action may excite large bending vibrations due to coupling
with the torsional motion[4].With an increase in borehole
pressure, the side crack length decrease significantly;
furthermore, the main mode of rock failure shifts from
tension to shear[5].The fractal dimension of cracks in the
coal seam roofing is affected by the thickness of coal seam,
spacing of coal seam and the lithological characteristics of
overlying rock strata. With the increase of the thickness of
coal seam (composite thickness of coal seam), the fractal
dimension of cracks increases[6].In orderto increase the
drilling performer of PDC bit, lots of research have been
done, however, papers aboutinfluence of coal rock hardness
and confining pressure on the load fluctuation
characteristics of PDC bitis few. So drilling experiment
table is built andcarried out underdifferent coal rock
hardnessand confining pressure. In this paper, influence of
coal rock hardness and confining pressure on drill pipe
vibration is researched and some conclusions are obtained.
II. DRILLING EXPERIMENT TABLE IS BUILT
2.1Test bench
According to the theory of rock cutting and breaking, the

International Journal of Advanced Engineering Research and Science (IJAERS) [Vol-4, Issue-8, Aug- 2017]
https://dx.doi.org/10.22161/ijaers.4.8.8 ISSN: 2349-6495(P) | 2456-1908(O)
www.ijaers.com Page | 45
establishment of the gas drainage drilling test bench (Fig1)
is built. The test bench mainly has two parts, the power
system and the testing system. The test rig drilling
experiments is not only used in drilling coal rock with PDC
bit ,but also in a variety of types of bits drilling test.
1-fluid cylinder; 2-coal wall support; 3-clamper; 4-advanced gear; 5-gyroscope; 6-control Table; 7-test coal wall; 8-drilling
bit; 9-drill pipe; 10-flow sensor; 11-pressure pickup; 12-data acquisition; 13-display interface; 14-flow digital display meter;
15-draught fan
1-clinostat;2-feeding device;3-clamping device;4-drill pipe; 5-coal wall support;6-PDC bit;7-hydraulic cylinder;
8-test coal wall Fig .1. Gas drainage drilling experiment table
2.1.1Power system
The dynamic system of the test bench adopts ZDY1900S
full hydraulic drilling machine. The rig is mainly composed
of a host machine, pumping station and control station.
Pump station is driven by the motor rotation, the hydraulic
oil will be transferred to the feed passage and the rotary
actuator, the control console on the pole realizes the drill
rotation and feed. The drilling machine not only provides
power for the drilling tool, but also provides the confining
pressure load for the confining pressure loading device on
the top of the coal wall support. At the top of the coal wall
support, HSG90/63 engineering hydraulic cylinder is
provided, the rated working pressure of the hydraulic
cylinder is 16MPa, and the stroke is 640mm, so as to meet
the requirement of applying the confining pressure to the
coal wall. The hydraulic circuit of the hydraulic circuit is
additionallyprovided with two-way hydraulic lock, so as to
ensure the stablity of the confining pressure in the operation
of the hydraulic cylinder.
2.1.2 Test system
YSV dynamic signal acquisition and analysis software were
used in testing system for drilling test data acquisition
system; FST800-201G222A-16B pressure sensors are
arranged in the hydraulic motor and hydraulic cylinder oil
import to drill drilling torque to tests the feed resistance
signal. The main performance parameters of the sensor:
range: 0-31.5Mpa; sensitivity: 158.73 output voltage: 0-5V;
standard engineering unit: mv/Mpa; measurement accuracy:
0.5%FS; the flow of the hydraulic system using the model
for the turbine flow sensor LWGY-15A, the nominal
pressure 6.4MPa, maximum pressure loss is 0.0035MPa,
the turbine flow sensor and the hydraulic motor return oil
pressure sensor on the pipeline in series.According to the
above power system and the test system composed of
drilling test bench, provide the maximum torque of
1900Nm and maximum speed of 300r / min, to the process
of 600mm. According to the working performance of the
drilling rig, the displacement of the main oil pump in the
pump station is changed to change the rotating speed of the
drilling machine. The speed range of the drill bit is
85-300r/min. Adjust the displacement of the auxiliary oil

International Journal of Advanced Engineering Research and Science (IJAERS) [Vol-4, Issue-8, Aug- 2017]
https://dx.doi.org/10.22161/ijaers.4.8.8 ISSN: 2349-6495(P) | 2456-1908(O)
www.ijaers.com Page | 46
pump in the pump station to change the feed rate of the
drilling mechanism. The feed rate range of drilling
mechanism is 0-3m/min.
III. INFLUENCE OF COAL ROCK HARDNESS
AND CONFINING PRESSURE ON LOAD
FLUCTUATION CHARACTERISTICS
3.1 Influence of coal rock hardness on load fluctuation
characteristics
To research the influence ofcoal rock hardness(f) on load
fluctuation, drilling coal rock experiment is carried out
under different coal rock hardness(f=0.65, 1.03, 1.3, 2.4,
3.24). Working condition parameters in the process of
drilling coal rock are as follows: confining pressure is
7MPa, feed speed is 0.5 m/min, rake angle of PDC bit is
10 °,rotation speed is 190r/min. Feeding resistance and
drilling torque is got under different rotation speed is shown
in table1.Fig.2 and Fig.3 show influence of rotation speed
on load fluctuation characteristics.
Table1:Drilling torque and feeding resistance under different coal rock hardness
Fig.2: Influence of coal rock hardness ondrilling torque’s
load fluctuation characteristics
Fig.3: Influence of coal rock hardness on feeding
resistance’s load fluctuation characteristics
Table 1 , Fig1 and Fig2showthat drilling torque and feed
resistance are decreased with the increase ofcoal rock
hardness. Vibration amplitude of drilling torque and feed
resistanceincrease with increase of coal rock hardness when
the value of coal rock hardnessis larger than 1.3. Vibration
amplitude of feed resistance is Maximum value when the
value of coal rock hardness is 1.03and Vibration amplitude
of feed resistance is Minimum value when the value of coal
rock hardness is 1.03.
3.2 Influence of confining pressure on load fluctuation
characteristics
To research the influence ofconfining pressure on load
fluctuation, drilling coal rock experiment is carried out
under different confining pressure (3MPa, 5MPa, 7MPa,
9MPa). Working condition parameters in the process of
drilling coal rock are as follows: feed speed is 0.7 m/min,
rake angle of PDC bit is 10 °,rotation speed is 190r/min.
Feeding resistance and drilling torque is got under different
rotation speed is shown in table1.Fig.3 and Fig.4 show
influence of rotation speed on load fluctuation
characteristics.
Coal rock
hardness
(f)
Drilling torque (N·m) Feeding resistance( KN)
Maximum
value(N·m)
average
value(N·m)
standard
deviation
Maximum
value( KN)
average
value( KN)
standard
deviation
0.65 370.7 353.2 18.7 3.9 3.2 0.39
1.03 378.4 364.7 11.6 4.9 4.0 0.65
1.3 417.2 385.5 19.2 4.9 4.8 0.27
2.4
3.24
428.6
459.7
400.3
420.1
21.5
24.8
5.3
5.9
5.0
5.2
0.33
0.53

International Journal of Advanced Engineering Research and Science (IJAERS) [Vol-4, Issue-8, Aug- 2017]
https://dx.doi.org/10.22161/ijaers.4.8.8 ISSN: 2349-6495(P) | 2456-1908(O)
www.ijaers.com Page | 47
Table2:Drilling torque and feeding resistance under differentconfining pressure
Fig.3(a): Influence of confining pressure ondrilling torque’s
load fluctuation characteristics
Fig.4: Influence of confining pressure onfeeding resistance’s
load fluctuation characteristics
Table 2 , Fig3 and Fig4showdrilling torque and feed
resistance are increased with the increase of confining
pressure. Vibration amplitude of feed resistance decreases
from 3MPa to 7MPa then increases. Vibration amplitude of
drilling torqueand feed resistanceareall minimum when the
value of confining pressure is 7MPa.
IV. CONCLUSIONS
Drilling torque and feed resistance are decreased with the
increase ofcoal rock hardness. Vibration amplitude of
drilling torque and feed resistanceincrease with increase of
coal rock hardness when the value of coal rock hardnessis
larger than 1.3. Vibration amplitude of feed resistance is
Maximum value when the value of coal rock hardness is
1.03and Vibration amplitude of feed resistance is Minimum
value when the value of coal rock hardness is 1.03.Drilling
torque and feed resistance are increased with the increase of
confining pressure. Vibration amplitude of feed resistance
decreases from 3MPa to 7MPa then increases. Vibration
amplitude of drilling torqueand feed resistanceareall
minimum when the value of confining pressure is 7MPa. In
the paper, vibration amplitude of drilling torque and feed
resistance was researched, but many forms of vibration
include torsional vibration, longitudinal vibration and
lateral vibration during drilling drills coal rock, study these
forms is next important task.
V. ACKNOWLEDGEMENTS
This work was supported by the National Science
Foundation of China (grant number 51404096); Henan
Province Science and Technology Project (grant number
162102210229); Henan province youth backbone teachers
funding scheme (grant number 2015GGJS-067) and Henan
province education department applied research project
fund (grant number 15A440).
REFERENCES
[1] Zamani, S. M., Hassanzadeh-Tabrizi, S. A., &Sharifi,
H. (2016). Failure analysis of drill pipe: a
review. Engineering Failure Analysis, 59, 605-623.
[2] Zhang, J. C., Duan, L. C., & Wang, H. B. (2009).
Analysis on drilling rod vibration mode of coalfield
geological exploration based on ansys. Coal Science
& Technology.8:64-66.
[3] Yigit, A. S., &Christoforou, A. P. (1996).Coupled
axial and transverse vibrations of
oilwelldrillstrings. Journal of Sound &
Vibration, 195(4), 617-627.
[4] Yigit, A. S., &Christoforou, A. P. (2000).Coupled
torsional and bending vibrations of actively controlled
drillstrings. Journal of Sound & Vibration,234(1),
confining
pressure
(MPa)
Drilling torque(N·m) Feeding resistance( KN)
Maximum
value(N·m
)
average
value(N·m
)
standard
deviation
Maximum
value( KN)
average
value( KN)
standard
deviation
3 335.8 317.2 13.5 3.16 2.50 0.48
5 398.9 351.8 15.9 4.04 3.45 0.42
7 400.1 366.1 12.8 4.61 3.93 0.39
9 422.1 375.3 21.1 5.56 4.74 0.48

International Journal of Advanced Engineering Research and Science (IJAERS) [Vol-4, Issue-8, Aug- 2017]
https://dx.doi.org/10.22161/ijaers.4.8.8 ISSN: 2349-6495(P) | 2456-1908(O)
www.ijaers.com Page | 48
67-83.
[5] Shi, X., Cai, W., Meng, Y., Jin, W., Li, G., & Tao, Z.
(2014). Numerical study of effects of borehole
pressure on bit-teeth induced rock
fragmentation. Electronic Journal of Geotechnical
Engineering, 19, 4743-4752.
[6] Hu, Y. Z., Liu, C. Y., & Li, J. W. (2015). Fractal
analysis of cracks due to mixed mining of coal seam
group. Electronic Journal of Geotechnical
Engineering, 20(17), 9749-9760.

International Journal of Advanced Engineering Research and Science (IJAERS) [Vol-4, Issue-8, Aug- 2017]
https://dx.doi.org/10.22161/ijaers.4.8.9 ISSN: 2349-6495(P) | 2456-1908(O)
www.ijaers.com Page | 49
A Nondestructive Technique for EM-Parameter
Determination of Compound Materials using
Rectangular Waveguide Sensor and Layered
Material Media Abdulkadhum A. Hassan 1, Janan H. Saadie2
1 Department of Electrical Engineering, Faculty of Engineering, Kufa University, Al-Najaf, Iraq 2 Department of Material Engineering, Faculty of Engineering, Kufa University, Al-Najaf, Iraq
Abstract— In this paper, an improved technique of using
open-ended rectangular waveguide sensor for
simultaneous non-destructive complex electromagnetic
parameters determination of compound absorbing
materials is developed. The technique is based on
employing a layered material medium, which consists of
material to be tested and known materials, sandwiched
between sensor aperture and perfect conductor plate to
obtain two complex reflection coefficients necessary to
achieve this purpose. Finite-Difference Time-Domain
method is adapted to account for the finite flange size of
the sensor and numerically calculate the sensor reflection
coefficient under different test conditions. The technique
can be employed for cases of single layer and multilayer
medium planar sheet measurement. The parameters of the
material under test are obtained by fitting both the
calculated and measured reflection coefficients using the
iterative optimization technique. The details related to the
analysis, FDTD modeling and testing procedure of the
proposed technique is discussed. The simulations and
experimental results are compared with the published data
by literatures and companies to validate the proposed
technique. The technique is promising for potential
applications such as design and fabrication of sheet or
layered coating materials and nanocomposite material and
bio-medium characterization.
Keywords— FDTD; Non-destructive test, Dielectric and
magnetic characterization, layered medium, rectangular
waveguide sensor.
I. INTRODUCTION
Radar absorbing materials (RAMs) is essential in a wide
range of applications such as radar detection, shielding and
electromagnetic compatibility technology [1-5]. These
materials are usually designed and fabricated from
compound materials as a sheet or coated on metallic
structures in order to reduce unwanted reflections or to
reduce the radar cross section area of an object. Moreover,
these materials are usually used in a specific application to
provide a certain performance of reflectivity over a given
frequency range especially at microwave and millimetre
wave [6]. The design of radar absorbing materials is
constrained by many factors, including thickness, weight,
and absorbing properties, which are described by both
complex permittivity εr= ε' – j ε" and complex permeability
µr= µ' – jµ" over broadband frequency range. These
properties are strongly influenced by the frequency at the
microwave frequency range [7-8].
For many years, evaluation of electromagnetic properties
of materials has been known to be a fundamental aspect of
microwave and millimetre-wave technology especially
radar absorbing materials [9-11]. It has aroused
considerable interests in developing measurement
techniques to characterize these materials quickly,
accurately, and conveniently. Recently, various techniques
are proposed and developed to characterize
electromagnetic properties of radar absorbing materials at
microwave frequency range with their respective
advantages and drawbacks among the others is open-ended
rectangular waveguide sensor [12-13]. This technique is
widely used to determine both complex permittivity εr and
complex permeability µr over a wide band of frequency
range [14] due to its simplicity and openness in its
structure. Moreover, it requires less sample preparation.
These merits make the technique suitable for
characterizing the electromagnetic properties of materials
under laboratory and field conditions since the sensor is
placed directly against the material under test [15].
Currently, Finite Difference Time Domain (FDTD)
method is employed to simulate absorbing ability of radar
absorbing materials to electromagnetic waves [16]. Also,
with increasing the use of nanocomposite materials, there
is a demand for characterization of these materials, starting
from the designing process up to the fabrication stage [17]
due to its ability to handle complex structures and
geometries. In this paper, a technique of using rectangular

International Journal of Advanced Engineering Research and Science (IJAERS) [Vol-4, Issue-8, Aug- 2017]
https://dx.doi.org/10.22161/ijaers.4.8.9 ISSN: 2349-6495(P) | 2456-1908(O)
www.ijaers.com Page | 50
waveguide sensor irradiating into a layered material
medium in conjunction with FDTD method is proposed to
simultaneously determine both complex permittivity and
permeability (εr and µr) of compound absorbing materials.
The structure, which consists of material under test backed
by known low loss material, is sandwiched between sensor
aperture with finite flange and perfect conductor plate to
measure two complex reflection coefficients necessary to
determine εr and µr. FDTD method is employed to
theoretically calculate the sensor reflection coefficients
under different physical test conditions. It is also can be
evolved to simulate the design of the electromagnetic wave
absorber. The calculated reflection coefficients of the
sensor are imposed on the measured values to extract εr
and µr by iterative-optimization technique over an X-band
of microwave frequency range. To effectively model these
materials, the thickness variation and frequency
characteristics of εr and µr of these materials are studied.
The FDTD simulations and measurement results on
selected samples of compound absorbing materials are
presented and some guidelines for this technique of
measurement are highlighted.
II. PRINCIPLES AND ANALYSIS
Figure 1 shows the geometry of the proposed technique
used to perform εr and µr measurement. As shown, the
geometry consists of finite flange open-ended rectangular
Fig.1: Geometry of the proposed technique:
waveguide sensor in Cartesian coordinates with wide and
narrow dimensions (a and b) placed directly against
layered material medium consisting of the material under
test with unknown εr and µr and known thickness d1,
followed by known εr, µr and thickness material and the
whole structure is backed by a perfect conductor to
increase measurement sensitivity. The backing known
material used should be low loss material to increase
measurement accuracy [18]. As shown in Fig. 1, the
reflection coefficient symbolized Гo (a, b, εr, µr, f, d) is a
complicated function of the waveguide sensor dimension
a, b, test frequency f, sample thickness d, and the
parameters of the material under test εr and µr. The energy
radiated from the sensor penetrates through the layered
material medium and reflected back into the aperture.
Consequently, the reflection coefficient calculated at the
sampling point carries the desired information of material
under test. The EM-parameter extraction of material under
test by the inverse problem process includes finding the
values of εr and µr which minimize the difference between
the reflection coefficient theoretically determined (Гth) and
the measured one (Гm) obtained under different test
conditions. Therefore, for accurate extraction of εr and µr,
the theoretical reflection coefficient of the sensor must be
accurately predicted. Using the approximate solution for
theoretical reflection coefficient introduces error in the
extracted values of εr and µr. Hence, the problem geometry
is formulated using FDTD method to account for the finite
size of waveguide flange and accurately predict the
reflection coefficient under different test conditions.
1. The Proposed Technique
The main objective of this work is to develop a technique
for simultaneous εr and µr determination of compound
absorbing materials during the design phase and
fabrication process respectively. In principle, to extract
four parameters, two complex reflection coefficients are
required. For measurement purposes, in order to determine
two complex quantities (εr and µr ) with the assumption
that the material under test is backed by conductor, it is
necessary to perform a certain experimental procedure to
measure the needed two independent complex reflection
coefficients under two different test conditions. Physically,
the two conditions can be achieved by different ways.
Using the proposed technique, the following two ways can
be performed to obtain these two conditions as shown in
Fig. 2 (a and b).
(a) (b)
Fig.2: Conditions of reflection coefficient measurement
(a) Single layer test (b)Two layers test
1.1 Single-Layer Test

International Journal of Advanced Engineering Research and Science (IJAERS) [Vol-4, Issue-8, Aug- 2017]
https://dx.doi.org/10.22161/ijaers.4.8.9 ISSN: 2349-6495(P) | 2456-1908(O)
www.ijaers.com Page | 51
This test is to be performed to obtain one of the two
needed reflection coefficients. In this test, the material
under test with unknown εr and µr and known thickness d1
(only single layer) is sandwiched between the rectangular
waveguide sensor and the perfect conductor as shown in
Fig. 2 (a). The measured reflection coefficient ρm1 is
described using (1):
1 ( , , , ) (1)m o r r f d
As can be seen in (1), the reflection coefficient is
frequency dependent while the frequency is an
independent variable. It is to be noted that both complex
permittivity εr and permeability µr of most materials are
also frequency dependent and they are slowly varying with
frequency.
1.2 Multilayer Structure Test
This test is to be performed to obtain the second reflection
coefficient. A medium with two layers is used for this
purpose as shown in Fig. 2 (b). In this test, the sensor is
placed in close contact with a multilayer structure
consisting of the material under test with unknown εr and
µr followed by known material and the whole structure is
backed by the perfect conductor. The measured reflection
coefficient ρ2m is described using (2):
2 ( , ', , ', , , ') (2)m o r r r r f d d
Where ρm1 and ρm2 are the reflection coefficients measured
at different test conditions, εr, εr', µr and µr
' are relative
permittivity and relative permeability of the tested sample
and known material, d1 and d2' are thicknesses of material
under test and known material respectively. It is to be
noted that using medium with two layers provides enough
information to extract εr and µr of material under test
(using both single layer and two layers tests) while using
only single layer test provides the required information if
frequency-varying method or thickness-varying method is
employed. The proposed technique can be also applied to
perform multiparameter measurement (complex
permittivity, complex permeability, and thickness) using a
medium with N different layers. The rectangular
waveguide sensor used in the measurement has practically
a flange with finite dimension which makes it possible to
test high loss sheet samples. For finite flange rectangular
waveguide sensor, by using the FDTD method, both
electric and magnetic fields distributions are calculated at
different physical test conditions. Consequently, the
reflection coefficient Γ0 of the sensor can be determined
according to the theory of transmission-line.
2. Numerical Modeling using FDTD Method
The Finite-Difference Time-Domain method has been
initially proposed by Yee [19] to numerically solve the
Maxwell equations and developed by Taflove [20]. It has
been proven to be the most popular numerical technique
successfully applied for the solution of electromagnetic
problems with complex geometries [21]. In this paper,
FDTD method is employed to calculate the sensor aperture
reflection coefficient since it is quite difficult, in this case,
to apply the analytical approach. Figure 2 (a and b) shows
the analytical model of the problem in 3D Cartesian
coordinates considering only the dominant TE10 mode of
the field with sensor dimensions of a and b respectively.
The boundary space of the problem is divided into two
regions. The first region is the interior of the waveguide
(region 1) while the second region is the multilayer
structure backed by perfect conductor. Each region within
the geometry is assumed to be linear, isotropic and
homogeneous in nature and characterized by both ε and
µ. The set of Maxwell’s curls equations are given using (3)
and (4):
1(3)
ExH
t
1(4)
HxE
t
Using 3D Cartesian coordinate system (x,y,z), eqs. (3) and
(4) are expressed in a system of six coupled Maxwell’s
differential equation. For x-coordinate of both electric and
magnetic fields' components, the differential equations are
described using (5) and (6):
1( ) (5)
yx zEH E
t y z
1( ) (6)
yx zHE H
t y z
Yee has proposed an approach to numerically solve these
equations by which the problem space is divided into a
mesh with lattices. A point (i,j,k) in lattice space is
denoted as:
( , , ) ( , , )i j k i x j y k z
where Δ is the increment in x, y, z directions. According to
Yee procedure, both electric field E and magnetic field H
are distributed to be interleaved with respect to cell whose
origin is located at (i, j, k). The components of both
electric and magnetic fields are updated in discrete time-
steps of Δt interval. Mathematical theorems for the FDTD
formulation, concerning issues such as accuracy,
convergence, computational complexity and stability is
provided in [20]. Following Yee procedure, the x-direction

International Journal of Advanced Engineering Research and Science (IJAERS) [Vol-4, Issue-8, Aug- 2017]
https://dx.doi.org/10.22161/ijaers.4.8.9 ISSN: 2349-6495(P) | 2456-1908(O)
www.ijaers.com Page | 52
components of both electric and magnetic fields are
described using (7) and (8):
1 1
( , 1, ) ( , , ) ( , , 1) ( , , )2 2( , , ) ( ) (7)
n n n nn n z i j k z i j k y i j k y i j k
x x i j k
E E E EtH H
y z
1 1 1
1 2 2 2
1 ( , , ) ( , 1, ) ( , , ) ( , , 1)
( , , ) ( , , )( ) (8)
n n nn
n n z i j k z i j k y i j k y i j k
x i j k x i j k
H H H HtE E
y z
Following the same procedure, the other field components
can be obtained and will not repeat here. It is to be noted
that in this formulation the EM parameter ε and μ of
material under test can be constant, or they can be changed
with frequency. This allows modeling of material
properties for lossless and lossy over required broadband
analysis. The total space of the problem is discreetized into
cubic cells with fine space dimensions to increase the
accuracy of calculations. To limit the domain of
computational space, the simulation of open problems is
usually carried out by placing absorbing boundary
conditions (ABCs) in the terminating planes of the grid. In
this paper first-order Mur ABC [22] is used for the
following reasons:
- It can be applied to the boundary with a dielectric
discontinuities
- As compared to other absorbing boundary conditions, It
is computationally much easier to implement.
A forward-moving TE10 wave is lunched at the excitation
plane A-A’. Maxwell’s equations solving algorithm
involves a continuous sampling of electric and magnetic
fields in a finite region at equidistance points in a spatial
lattice. The electromagnetic field component distribution
(both electric field and magnetic field) is observed within
waveguide and multilayer structure until the steady state
condition is obtained. The sampling point (B-B') is chosen
to be located far away from aperture to avoid higher order
modes. The complex reflection coefficient Γo of the sensor
is calculated by applying transmission-line theory using
(9):
(9)oj a o
o o
a o
Y Ye
Y Y
where Ya is the aperture admittance and Yo is the
characteristic admittances of sensor aperture.
III. SIMULATIONS AND EXPERIMENTAL
RESULTS
1. FDTD Scheme Validation
To verify and validate the FDTD formulation of the
problem using the proposed technique, the complex
reflection coefficients of X-band rectangular waveguide
sensor irradiating into layered material medium is
calculated using 3D FDTD code developed for this
purpose. In this work, we passed the developed code by
comparing the results of numerical simulations of
reflection coefficients with those obtained experimentally
using standard WR-90 rectangular waveguide with flange
length chosen to be 50 mm [23]. The comparison is made
for two cases; the case when only the material under test as
shown in Fig. 2 (a) is considered and for the case when a
medium of two layers is considered as shown in Fig. 2 (b).
In the first case, the sample used is compound absorbing
material with r =14.95 - j.0. 3318 and of μr = 1.35 – j
1.647 and thickness of 2.8 mm while for the second case,
the same sample under test is used followed by the second
layer with known r and μr and thickness and the whole
structure is backed by a perfect conductor. Teflon as low
loss material is chosen [18] to be known material with
thickness of 8 mm. Simulations and measurements are
performed at a frequency of 10 GHz using a HP-8510B
automatic network analyzer and the results are shown in
table 1. For the two considered cases, the FDTD
simulations and experimental results are in good
agreement validating the computational tool.
Table 1. Comparison of the sensor reflection coefficient
obtained using FDTD modeling versus experimental
results for two cases considered. Results are obtained at
f = 10 GHz.
Case Method ǀ ǀ
(Magnitude)
(Phase)
(Phase in
Degree)
dedeDegree)
Single layer FDTD 0.4391 -139.38
Experiment 0.4424 -138.17
Two layers FDTD 0.4062 -140.28
Experiment 0.4132 -137.98
2. EM-Parameter Determination
The analysis based on FDTD modeling in the previous
sections is to be verified experimentally in order to assess
the validity of the proposed technique for simultaneously
determination r and μr of compound absorbing materials.
Several experiments are conducted for this purpose over
the given microwave frequency range. Table 2 shows a
comparison between the measured results of εr and µr of a
compound absorber sample and corresponding previously
published data in [24] where it is seen that they are fairly
consistent. The FDTD calculations and measurement are
performed at a frequency of 10 GHz with sample thickness
of 2.08 mm. The extraction process of both εr and µr are
performed iteratively using numerical optimization
technique.

International Journal of Advanced Engineering Research and Science (IJAERS) [Vol-4, Issue-8, Aug- 2017]
https://dx.doi.org/10.22161/ijaers.4.8.9 ISSN: 2349-6495(P) | 2456-1908(O)
www.ijaers.com Page | 53
Table.2: Comparison between the measured results of
εrand µr of a compound absorbing material and reference
data Results are obtained at f = 10 GHz.
As stated in previous sections, the sensor reflection
coefficient is sensitive to more than one variables with
operating frequency as independent variable while both εr
and µr are frequency dependent ( i.e r(f) and μr(f)). Also,
the sample thickness is another limiting factor in the
measurement process. Another test is performed to study
the influences of these factors on r and μr measurement.
The variations of real parts and imaginary parts of both r
and μr are separately investigated with frequency and
sample thickness in this study and the results are illustrated
in Fig. 3(a and b). Figure 3-a shows the real parts (' and
μ')variations of the r and μr while the variations of the
imaginary parts (tanδε and tanδµ) of r and μr are shown in
Fig. 3-b. The measurements are performed on another
compound absorbing material with two thicknesses having
a ratio of 2. The first sample thickness is chosen to be 2.44
mm and the second one is of 4. 88 mm thickness. Twelve
frequency points are selected for the measurement to cover
the X-band frequency range. It is clear from the two
figures that good agreement is obtained between the
measured values (both real parts and imaginary parts for
sample of 2.44 mm thickness. For sample with 4.88 mm
thickness, a large discrepancy is observed in the results of
measurement for both permittivity and permeability. The
results obtained showed that the sample thickness has an
influence on measurement accuracy and sensitivity. It is
quite difficult to obtain accuracy in measurement of
thicker sample high loss materials such compound
materials. This is due to. that the reflection decreases with
increasing the thickness of absorbing material. This is the
reason why thickness measurement accuracy becomes
poorer for thicker lossy materials. Hence, backing the
layered material medium by perfect conductor enhances
the measurement sensitivity and accuracy.
(a)
(b)
Fig.2: The measured permittivity and permeability of
compound absorbing material with two thicknesses
compared with reference data. (a) Real parts (b) Loss
tangent.
IV. PARAMETERS εr, μr EXTRACTION
For open-ended rectangular waveguide loaded with
material under test, the reflection coefficient (or its
equivalent aperture admittance Ya) is theoretically
formulated as a function of sample εr and µr parameters,
sample thickness d and operating frequency f. As with
most material characterization methods, there exists no
closed form, which relates both εr and µr to the theoretical
reflection coefficient (Γthy). Hence, in order to
simultaneously extract εr and µr , inverse problem
technique must be employed numerically for this purpose
using an iterative optimization technique. By using the Г0
value, both obtaining from theoretical analysis and
experimental under two different test conditions, the
complex parameters εr and μr of the tested sample can be
extracted. In this regard, the extracted values of εr and µr
should be those values taken by which the difference
between the calculated and the measured values of the
sensor reflection coefficient is minimized by inverse
Method
"ɛ j-' ɛ r =ɛ
"µj-' µ r =µ
ε' ε” μ' μ"
Proposed
Technique 15.21 0.37 1.73 0.87
Reference
Data[24] 15.26 0.68 1.71 0.84

International Journal of Advanced Engineering Research and Science (IJAERS) [Vol-4, Issue-8, Aug- 2017]
https://dx.doi.org/10.22161/ijaers.4.8.9 ISSN: 2349-6495(P) | 2456-1908(O)
www.ijaers.com Page | 54
' '' ' '' ' '' ' '' 2( , , , , ) ( ( ) ( , , , , , )) (10)
1
Nf f f di m i c i
i
problem. Consequently, an iterative solution using
optimization technique is sought to compute εr and µr for a
given value of reflection coefficient Гo to optimize the
objective function φ using (10).
where fi is the operating frequency of the measurement
data set measured at N frequency points. It is clear from
(10) that by using the values of the measured and the
FDTD calculated reflection coefficients, the objective
function (φ) can be optimized iteratively. Minimizing
process usually starts with initial guess values for εr and µr.
These iterative algorithms are guaranteed in most cases to
produce a correct convergence, but this process consumes
much time. The technique discussed in this paper is easy to
use. It needs only reflection coefficient measurement, then
the remaining task is to process the measurement data in a
convenient way.
V. CONCLUSION
An improved technique for simultaneous non-destructive
EM-parameter of sheet compound absorbing material
determination using rectangular waveguide sensor
irradiating into layered medium has been numerically
investigated and assessed. The FDTD simulations and
experiments results of both εr and µr variations (real and
imaginary parts) with the thickness of the sample over an
X-band of the microwave frequency range have shown that
the sample under test thickness is strongly influencing εr
and µr measurement accuracy. The obtained results
suggest that using the proposed technique for εr and µr
measurement is suitable for high loss materials with a
thickness of several millimeters. For this reason, the
layered structure is backed by a perfect conductor to
improve measurement accuracy and sensitivity. The
proposed technique can be applied to test a single layer
and multilayer material under test where it is quite difficult
to use the traditional methods such as thickness-varying
method and frequency-varying method for this purpose.
The measurement geometry described in this paper is
limited to two layer structure, which yield enough
information to determine simultaneously electric and
magnetic parameters. Since the sensor’s reflection
coefficient is sensitive to εr and µr and sample thickness,
the technique can be used to perform simultaneous
multiparameter measurement (both complex permittivity
and permeability and thickness).
REFERENCES
[1] K.J. Vinoy and R.M. Vha, (1996), Radar absorbing
materials: from theory to design and
characterization, Kluwer ress, Boston, MA.
[2] S. M Abbas, A. K. Dixit, R. Chatterjee, and T. C.
Goel,( 2007), Complex permittivity, complex
permeability and microwave absorption properties of
ferrite-polymer composite, J. Magn. Magn. Mater.,
vol. 309, pp. 20-24.
[3] K. Lakshmi, H. John, K. T. Mathew, R. Joseph, and
K. E. George (2009), Microwave absorption
reflection and EMI shielding of PU-PANI composite,
Acta Materialia, vol. 57, 371.
[4] D. Zabetakis, M. Dinderman, and P. Schoen (2005),
Metal-coated cellulose bars for use in composites
applicable to microwave technology, Adv. Mater.,
vol. 17, no 734,.
[5] H. Bayrakdar (2011), Complex permittivity, complex
permeability and microwave absorption properties of
ferrite-parafen polymer composites, J. Magn. Magn.
Mater., vol. 323, pp.1882-1885.
[6] J.D.C. Dias, I.M. Martin, and M.C. Rezende (2012),
Reflectivity of hybrid microwave absorbers based on
NiZn ferrite and carbon black, J Aerosp. Technol
Manag, vol. 4, no. 3, pp. 267-274.
[7] M.C. Rezendeet al, (2002)., Radar cross section
measurements (8-12 GHz) of magnetic and dielectric
microwave absorbing thin sheets,, Revista de Física
Aplicada e Instrumentaç, vol. 1, no. 1, pp. 1-10.
[8] A. M. Gama and M. C. Rezende (2010), Complex
permeability and permittivity variation of carbonyl
iron rubber in the frequency range of 2 to 18 GHz”
Journal of Aerospace Technology and Management,
vol. 2, no 1, pp. 59-62.
[9] R. Collier, and D. Skinner (2007), Microwave
Measurements. Third Edit. IET Eletrical
Measurement Series, London, United Kingdom.
[10] G. Roussy, H. Chaabane, and H. Esteban (2004),
Permittivity and permeability measurement of
microwave packaging materials, IEEE Tran. Microw.
Theory Tech., vol. 52, no. 3, pp. 903–907..
[11] K.A.Korolev, S.Chen, and M.N. Asfar (2008),
Complex magnetic permeability and dielectric
permittivity of ferrites in Millimetre waves, IEEE
Trans. Magn., vol. 44, no. 4, pp. 435–437.
[12] C. P. L. Rubinger and L. C. Costa (2007), Building a
resonant cavity for the measurement of microwave
dielectric permittivity of high loss materials,
Microwave Opt. Tech. Lett., vol. 49, pp. 1687-1690.
[13] L. F. Chen, C. K. Ong, C. P. Neo, V. V. Varadan, and
V. K. Varadan (2004), Microwave Electronics
Measurement and Material Characterization, John
Willey and Sons, West Sussex, England.
[14] D. L. Faircloth, M. E. Baginski and S. M.
Wentworth, (2006), Complex permittivity and
permeability extraction for multi-layered samples
using s-parameter waveguide measurements, IEEE

International Journal of Advanced Engineering Research and Science (IJAERS) [Vol-4, Issue-8, Aug- 2017]
https://dx.doi.org/10.22161/ijaers.4.8.9 ISSN: 2349-6495(P) | 2456-1908(O)
www.ijaers.com Page | 55
Trans. Micro. Theo. Tech. 54(3), pp. 1201–1208.
[15] J. W. Stewart and M. J. Havrilla (2006),
Electromagnetic characterization of a magnetic
material using an open-ended waveguide probe and a
rigorous full-wave multimode model, J. Electromag.
Waves Appl, vol. 20, no. 14, pp. 2037-2052.
[16] D. H. Kim, D. Kim† and C. M. Choi (2010), A Study
on the Design and Fabrication of an Electromagnetic
Wave Absorber for the 94-GHz Band, Journal of the
Korean Physical Society, vol. 56, no. 4, pp. 110-111.
[17] W. Zhang, H. Xiong, S. Wang, Li M. and Y. Gu
(2015), Electromagnetic characteristics of carbon
nanotube film materials, Chinese Journal of
Aeronautics, 28(4), pp.1245–1254,.
[18] G. D. Dester (2010), Error Analysis of A Two-Layer
Method for the Electromagnetic Characterization of
Conductor- Backed Absorbing Material Using an
Open-ended Waveguide Probe, Prog.
Electromag.Res.B, vol.26, pp. 11-21.
[19] K. S. Yee (1966), Numerical solution of initial
boundary-value problems involving Maxwell’s
equations in isotropic media, IEEE Trans Antenna
Propag. AP, 14, pp. 302-307.
[20] A. Taflove and S. C. Hagness (2005), Computational
electrodynamics,: The Finite Difference Time
Domain method, third ed., Artech-House, Norwood,
Massachusetts.
[21] A. Abdulkadhum Hassan , D. Xu, and N. Maode
(2000), EM-Properties Measurement of Concave-
surface Coating Materials Using a Modifieed Open-
ended Coaxial Probe,” Microwave and Optical
Technology. Letters, vol. 27, no. 4, pp. pp 278- 281.
[22] G. Mur (1981), Absorbing boundary condition for the
finite-difference approximation of the time-domain
electromagnetic field equations, IEEE Trans.
Eectromag. Compat EMC-22, pp 377-382.
[23] A. Abdulkadhum Hasan (2013), Error Analysis of
Rectangular Waveguide Probe with Finite Flange for
Non-destructive EM-Properties and Thickness
Measurement, Proceeding of IEEE Symposium on
Intelligent Systems and Applications.
[24] N. Maode, S. Yong, Y. Jinkui, F. Chrnpung, and X.
Deming (1999), An improved open-ended waveguide
measurement technique on parametersε and μ of
high-loss materials, IEEE Trans.Instrum. Meas., vol.
47, no. 2, pp. 476-481.
International Journal of Advanced Engineering Research and Science (IJAERS) [Vol-4, Issue-8, Aug- 2017]
https://dx.doi.org/10.22161/ijaers.4.8.10 ISSN: 2349-6495(P) | 2456-1908(O)
www.ijaers.com Page | 56
Gamma Irradiation Effect of 60Co on the
Germination of two subtropical species in the
Tehuacán-Cuicatlán Valley Ernesto Díaz López1*, Alejandro Morales Ruíz1, Arturo Olivar Hernández1, Patricia
Hernández Herrera1, Juan Antonio Juárez Cortes1, Jorge Francisco Leon de la Rocha1,
Nazario Francisco Francisco1, Heliodoro Santiago Santiago1, Cándido Humberto Bravo
Delgado2, Jesús Manuel Campos Pastelín2, Humberto Rafael Bravo Delgado3, Erika Teresa
Díaz Oreján3, Juan Manuel Loeza Corte3
1Cuerpo Académico “Ecofisiología aplicada a cultivos en zonas áridas”. Universidad Tecnológica de Tehuacán (UTT).
Prolongación de la 1 Sur No. 1101. San Pablo Tepetzingo, Tehuacán Puebla. C. P. 75859. (*Autor responsable:
[email protected] ). 2Cuerpo Academíco “Energías sustentables en zonas áridas”. Universidad de la Cañada (UNCA). Carretera Teotitlán-San
Antonio Nanahuatipam s/n Teotitlán de Flores Magón, Oaxaca. C. P. 68540. 3Cuerpo Académico Ingeniería en ProcesosAlimentarios UTTehuacán. Universidad Tecnológica de Tehuacán (UTT).
Prolongación de la 1 Sur No. 1101. San Pablo Tepetzingo, Tehuacán Puebla. C. P. 75859.
Abstract—In order to know the influence of 60Co gamma
radiation, on the germination of two semitropical species,
roselle seeds and sunflower were irradiated at the
Transelektro LGI-01 of the InstitutoNacional de
InvestigacionesNucleares, At doses 0, 5, 10, 15, 20, 25, 30
and 35 Gy, to determine the radiosensitivity curve and to
determine the LD50 of both species, under a randomized
complete block design with factorial arrangement, Where
the study factors were: radiation doses and species. The
results indicate that sunflower is more sensitive to gamma
radiation than roselle, so the LD50 for sunflower and roselle
was not reached, because the doses of radiation used, did
not achieve 0% germination. Thus, the radiosensitivity
curves were fitted to a linear model, with a high coefficient
of determination. From the present investigation, It can be
concluded that to determine the LD50 in the species in
question, It is necessary to increase the dose of irradiation,
perhaps up to 1000 Gy.
Keywords— LD50, mutation, ionizing radiation, mutagen,
mosaic.
I. INTRODUCTION
Sunflower (Helianthus annuus L.) and roselle (Hibiscus
sabdariffa L.), are considered crops of semi-arid zones,and
although these present a wide range of adaptability due to
their rusticity and phenotypic plasticity,which have been
little used to be introduced in tropical areas of the world
including Mexico.Sunflower is a plant that originates in
northeastern Mexico and southeastern United States
(Povereneet al., 2002). This species for many years was
used as oilseed,since their seeds are obtained fatty acids
with high nutritional value (Gallegos et al., 2003),but
nowadays it has gained importance from the ornamental
point of view,due to the great size of its foliage and to the
beauty of its chapter which has favored,that is used in
flower arrangements and as a cut flower (Melgares,
2001).With regard to roselle,is a plant that belongs to the
family malvaceae and has its center of origin in Africa
specifically in Sudan,although some authors like Vavilov,
mention that its origin is the Abyssinian center (López,
2002).This crop for many years has been used as medicinal
because of its diuretic properties,although of its stems also
is extracted fiber for the elaboration of ropes which are
resistant to the salinity and its seeds,a very fine oil is
obtained as the one extracted from Luffa cylindrical
L.which can be used for the preparation of cosmetics, in
addition to possessing antimicrobial properties (Amaya et
al., 2000).On the other hand, the genetic improvement of
plant species has gone through multiple stages,from
selection, introgression, crossing, to the use of potent
physical and chemical mutagens, a process called
Mutagenesis,to obtain cultivars that meet the characteristics

International Journal of Advanced Engineering Research and Science (IJAERS) [Vol-4, Issue-8, Aug- 2017]
https://dx.doi.org/10.22161/ijaers.4.8.10 ISSN: 2349-6495(P) | 2456-1908(O)
www.ijaers.com Page | 57
desired by the breeder.This technique is based on the
application of physical agents such as gamma radiation
emitted by certain radioactive elements such as 60Co (Aroset
al., 2012).This type of radiation has a very short wavelength
of 10-12 m, which allows a very high penetration power and
is used by geneticists, Causing damage to the DNA
molecule causing mutations at the molecular level (Almeida
et al., 2004), Which will manifest in the phenotype of
organisms in the form of somatic mutations known as
"Mosaic".This advantage of generating mutations in the
plant, can be of great utility since in the same way,
resistance to some adverse environmental conditions such
as drought,which is of great help in selecting materials that
may present the resistance genes to drought,Or even induce
this quality to genotypes with the help of gamma radiations
(González et al., 2007).To achieve this, when irradiating
seeds or propagules, It is necessary to do studies on the
effect of ionizing radiation on these structures, which is
known as radiosensitivity curve,which allows us to
determine even the average lethal dose known as LD50.For
this reason the main objective of the present study
was:determine the radiosensitivity and LD50 curve in roselle
seeds and sunflower caryopsids under eight 60Co gamma ray
levels.
II. MATERIALS AND METHODS.
2.1 Location of the experiment.
The present study was carried out in the laboratory of soils
of the Universidad Tecnologica de Tehuacan, during the
spring of 2015, located in San Pablo TepetzingoTehuacan
Puebla, Mexicoat 18º 24 'north latitude, 97º 20' longitude
west and 1409 altitude.
2.2 Genetic material.
The germplasm of roselle (Hibiscus sabdariffa L.) was
collected from an accession on the coast of Oaxaca, Mexico
in PinotepaNacional at a location of 16º 21 'north, 98º 02'
west and 28 altitude,whose characteristics are: average
postage 0.50 to 1.50 m high and red chalices,the sunflower
cariopsides (Helianthus annuus L.) cv. Victoria, were
donated by the germplasm bank of Ecofisiología de
Cultivos of Colegio de Postgraduados,which were irradiated
in the Transelektro LGI-01 of the InstitutoNacional de
InvestigacionesNucleares (ININ) in Ocoyoacac, Mexico.
2.3 Determination of radiosensitivity curve.
This was calculated for both irradiated materials,
performing a test of germination,Disinfecting seeds and
caryopsids with a solution of 1% sodium hypochlorite and
placed in petri dishes with filter paper, depositing 10 seeds
per box and equally 10 cariopsides per box, separately for
later incubation in a room of growth at constant temperature
at 25oC,And the percentage of germination was calculated
using the following expression PG = (Gs / Ss) * 100
where:PG, Percentage of germination; Gs, Germinated
seeds; Ss, seed sown(Gil & Miranda, 2008), After
determining the percentage of germination, the
rediosensitivity curve was calculated by means of a linear
regression plotting the percentage of germination vs
radiation dose and obtaining the model of adjustment by
least squares.From the obtained model an interpolation was
made, taking the dependent variable the value of 50% of
germination, and clearing the independent variable to
determine the LD50 of both species under study (Infante and
Zarate, 1990).
2.4 Experimental design.
The design used was complete random blocks with three
replicates and factorial arrangement following the
mathematical model:Yijk = μ + Aj + Bk +βi + (AB)jk +
εijkwhere: Yijk is the response variable of the i-th radiation
dose in the j-th species of the k-th block;µ, is the true
overall mean;Ai, is the effect of the i-th radiation dose;Bj, is
the effect of the j-th species under study; Βk, is the effect of
the k-th block; (AB)ij, is the effect of the interactiondosis of
radiation i on the species j under study and εijk, is the
experimental error of the i-th radiation dose on the j-th
species in the k-th block,thus the study factors were
integrated by: the radiation dose and the species under
study.The experimental unit consisted of a roselle seed and
a sunflower.
2.5 Response variable.
This was only constituted by the percentage of germination
in both study factors and when it was significant, the Tukey
test was applied to a level of significance of 5% of
probability of error.
III. RESULTS.
The analysis of variance and the comparison test of means
for dose and species, showed highly significant differences
for: treatments, both study factors as well as
repetitions.Radiation x species interaction was only
significant.Regarding the coefficient of variation, this
oscillated between 6.34% for radiation dose, whereas for the
species it was 10.50%,indicating that the experimental data
were very reliable during the development of the
experiment (Table 1). For the radiation factor, the highest
percentage of germination occurred in the control and the
dose of 5 Gy with 96.50 and 92.02%, respectively,being
also statistically equal.Levels 10, 15, 20 and 25 Gy of
radiation were found to be statistically equal but differ

International Journal of Advanced Engineering Research and Science (IJAERS) [Vol-4, Issue-8, Aug- 2017]
https://dx.doi.org/10.22161/ijaers.4.8.10 ISSN: 2349-6495(P) | 2456-1908(O)
www.ijaers.com Page | 58
numerically,In this way the high levels of gamma radiation
30 and 35 Gy presented the lowest values of germination
with 81.90 and 79.50%.Regarding the species factor, the
highest germination was in roselle with 89.31%, surpassing
sunflower that only obtained 80.43%.The radiosensitivity
curve for germination with respect to the radiation in
roselle, is presented in figure 1.In it is observed that the
mathematical model was linearly adjusted in a decreasing
way, whose coefficient of determination turned out to be
highly significant 0.98 **, and whose slope was -0.37
indicating that for each Gy of radiation, supplied to
roselleseeds, there was a decrease of 0.37% germination.On
the other hand the germination of sunflower caryopsids,
submitted to different levels of radiation, maintained a
tendency similar to roselle, keeping the linear model
decreasing. For this case the coefficient of determination
was 0.92* and slope -0.50, for each unit of radiation the
germination of sunflower caryopsids is reduced by 0.50%
(Figure 2).
Table.1: Analysis of variance and multiple comparison test, for two study factors based on 60Co gamma radiation, in the
Tehuacán-Cuicatlán Valley. 2016.
Radiation factor G (%) Species factor G (%)
T0 96.50 a Roselle 89.31 a¶
T5 92.02 a Sunflower 80.43 b
T10 89.60 ab
T15 87.17 ab
T20 86.75 ab
T25 83.82 ab
T30 81.90 b
T35 79.50 b
HSD 6.40 5.69
CV % 6.34 10.50
ANOVA
Treatments **
Repetitions **
Radiation (R) **
Species (S) **
R x S * ¶Means within columns with the same literal are statistically the same according to Tukey at (P≤0.05). G, germination;
HSD, honestly significant difference; CV, coefficient of variation.**; *; n.s, significant at 0.01; 0.05 and not significant.
Fig.1: Radiosensitivity curve in Jamaican seeds (Hibiscus sabdariffa L.), subjected to eight levels of 60Co gamma irradiation in
the Tehuacán-Cuicatlan Valley. 2016. PG, Percentage of germination; R, radiation.
PG = -0.37R + 95.2
r² = 0.95**
0
10
20
30
40
50
60
70
80
90
100
0 5 10 15 20 25 30 35 40
Ger
min
aci
ón
(%
)
Radiación gamma 60Co (Gy)
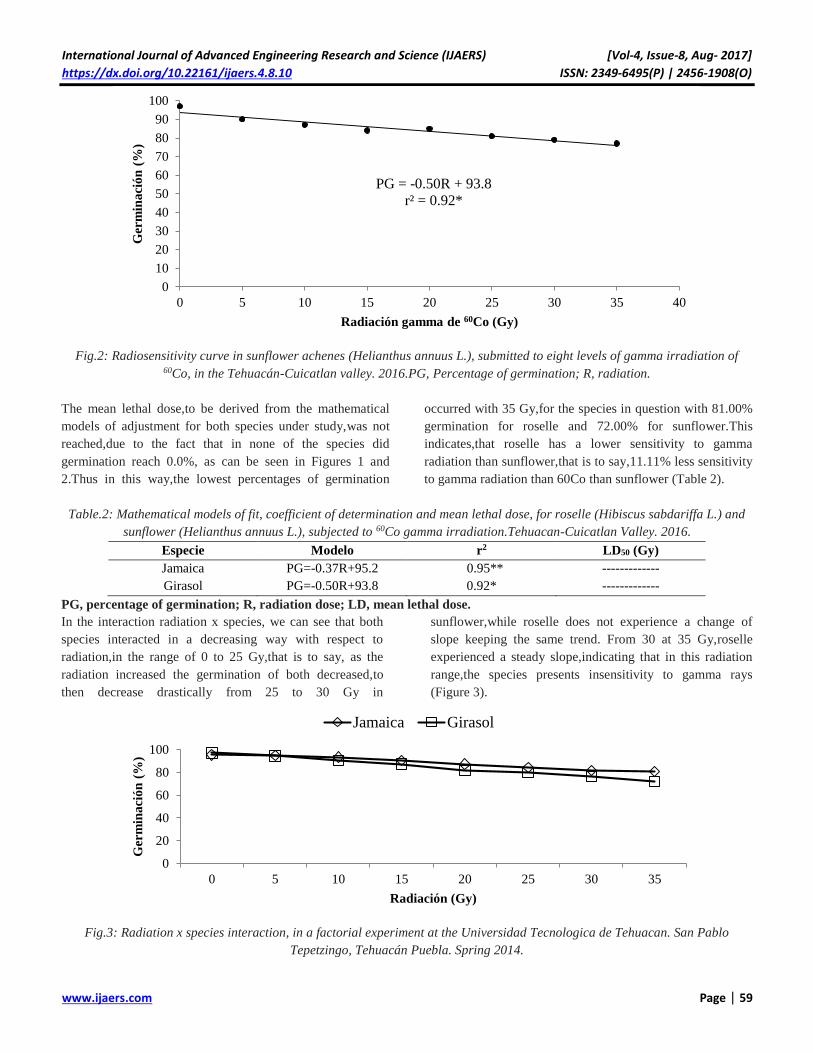
International Journal of Advanced Engineering Research and Science (IJAERS) [Vol-4, Issue-8, Aug- 2017]
https://dx.doi.org/10.22161/ijaers.4.8.10 ISSN: 2349-6495(P) | 2456-1908(O)
www.ijaers.com Page | 59
Fig.2: Radiosensitivity curve in sunflower achenes (Helianthus annuus L.), submitted to eight levels of gamma irradiation of
60Co, in the Tehuacán-Cuicatlan valley. 2016.PG, Percentage of germination; R, radiation.
The mean lethal dose,to be derived from the mathematical
models of adjustment for both species under study,was not
reached,due to the fact that in none of the species did
germination reach 0.0%, as can be seen in Figures 1 and
2.Thus in this way,the lowest percentages of germination
occurred with 35 Gy,for the species in question with 81.00%
germination for roselle and 72.00% for sunflower.This
indicates,that roselle has a lower sensitivity to gamma
radiation than sunflower,that is to say,11.11% less sensitivity
to gamma radiation than 60Co than sunflower (Table 2).
Table.2: Mathematical models of fit, coefficient of determination and mean lethal dose, for roselle (Hibiscus sabdariffa L.) and
sunflower (Helianthus annuus L.), subjected to 60Co gamma irradiation.Tehuacan-Cuicatlan Valley. 2016.
Especie Modelo r2 LD50 (Gy)
Jamaica PG=-0.37R+95.2 0.95** -------------
Girasol PG=-0.50R+93.8 0.92* -------------
PG, percentage of germination; R, radiation dose; LD, mean lethal dose.
In the interaction radiation x species, we can see that both
species interacted in a decreasing way with respect to
radiation,in the range of 0 to 25 Gy,that is to say, as the
radiation increased the germination of both decreased,to
then decrease drastically from 25 to 30 Gy in
sunflower,while roselle does not experience a change of
slope keeping the same trend. From 30 at 35 Gy,roselle
experienced a steady slope,indicating that in this radiation
range,the species presents insensitivity to gamma rays
(Figure 3).
Fig.3: Radiation x species interaction, in a factorial experiment at the Universidad Tecnologica de Tehuacan. San Pablo
Tepetzingo, Tehuacán Puebla. Spring 2014.
PG = -0.50R + 93.8
r² = 0.92*
0
10
20
30
40
50
60
70
80
90
100
0 5 10 15 20 25 30 35 40
Ger
min
aci
ón
(%
)
Radiación gamma de 60Co (Gy)
0
20
40
60
80
100
0 5 10 15 20 25 30 35
Ger
min
aci
ón
(%
)
Radiación (Gy)
Jamaica Girasol

International Journal of Advanced Engineering Research and Science (IJAERS) [Vol-4, Issue-8, Aug- 2017]
https://dx.doi.org/10.22161/ijaers.4.8.10 ISSN: 2349-6495(P) | 2456-1908(O)
www.ijaers.com Page | 60
IV. DISCUSSION
Germination decreased as the radiation dose increased,both
in Jamaican seeds and in sunflower caryopsids,the latter
presenting a reduction of 11.11% in germination compared
to roselle.This response coincides with that observed and
reported by Díazet al. (2003),who worked with
Tigridiapavonia (L.f) D.C. And mention a progressive
reduction in the budding of the bulbs of this species,when
subjected to gamma rays of 60Co in a range of 5 to 30 Gy
despite being different species.On the other hand, Ramírezet
al. (2006), mention that dose 500 Gy,result in a significant
decrease in the germination of tomato hybrids of up to
23%,data that differ from those reported in this present
study,the above may be due to the differences between
species in which both studies were carried out and the high
germination percentage of the tomato hybrids,as well as the
different doses of radiation used.The results presented in
this study,indicate that both structures are sensitive to
gamma radiation of 60Co,and are of great importance for
being the basis for establishing doses of radiation,when it is
desired to improvement genetic using the mutagenesis
technique and thus eliminate the doses that are lethal when
killing more than 50% of the study population,which was
not reached in this investigation.For this reason the
establishment of radiosensitivity curves is of great
importance in this type of studies.
V. CONCLUSIONS
From the present investigation carried out, under the
conditions of the valley Tehuacan-Cuicatlan, the following
conclusions were derived:
In the low doses of gamma irradiation of 60Co, both
species presented an equal germination, statistically
speaking.
Sunflower presented the lowest germination than
Jamaican, when applying high dose of gamma rays.
Sunflower prove be more susceptible to gamma
radiation, as it decreased its germination, compared
to roselle.
The germination vs radiation adjustment models
were linear with high determination coefficients for
both species.
The LD50 could not be determined, because in both
species the zero germination percentage was never
reached.
For further studies, where it is intended to establish
the LD50 of the species in question, it will be
necessary to irradiate up to 1 kGy to obtain a positive
response.
ACKNOWLEDGEMENTS
The authors of the present study are grateful for the
financial support received from PRODEP for the project,
“Mejoramiento genético de atributos agronomicos en
jamaica (Hibiscus sabdariffa L.) para generar
metabolitos secundarios en zonas áridas”, Developed by
the academic body, “Ecofisiología aplicada a cultivos en
zonas áridas”, With registration UTTEH-04,as well as the
staff of the radiobiology laboratory of theInstituto Nacional
de Investigaciones Nucleares (ININ), Dr. Eulogio de la
Cruz Torres and M. en C. Juan Manuel García
Andrade,for the support received during the irradiation of
the genetic material.
REFERENCES
[1] Amaya, L., Díaz, F., García, N., Moncada, M. and
Guerrero, G. 2007.Obtaining the oil of the seeds of
Luffacylindrica and evaluation of its potential use in
the cosmetic industry.ScientiaetTechnica. 33: 287-289.
[2] Aros, D., Olate, E., Valdés, S. and Infante, R.
2012.Gamma irradiationonAlstroemeria aurea G. in
vitrorhizomes:
anaproachtotheappropriatedosageforbreedingpurposes.
Revista de la Facultad de Ciencias Agrarias
UNCUYO. 44(1): 191-197.
[3] Almeida, E., Fuentes, J. L., Sánchez, A., Carro, S.
andPrieto, E., 2004.Effect of gamma radiation on the
survival and induction of SOS response in Escherichia
coli cells deficient in nucleotide cleavage repair and by
recombination.Journal Cubana de Investigación
Biomédica. 23(4): 242-248.
[4] Díaz, L. E., Pichardo, R. J.C., De la Cruz, T.
E.,Normán, M. T., Sandoval, R. F. and Vázquez, G. L.
2003.Induced variability in Tigridiapavonia (L.f) D.C
var. Sandra. By irradiation of bulbs with gamma rays
of 60Co.RevistaChapingoSerieHorticultura. 9(2): 235-
241.
[5] Gallegos, I. J.A., Rocha, G. N., González, l. R., Zuno,
F. F., and Vidaña, F. S. A. 2003.Characterization of
two varieties of sunflower with potential for the
production of oil extracted with hexane and
isopropanol.Grasas y aceites. 54(3): 245-252.
[6] Gil, C.A.I. and Miranda, L.D. 2008.Effect of
temperature, immersion in water and concentration of
phytorregulators on the germination of papaya seeds
(Carica papaya L.).Revista colombiana de ciencias
hortícolas. 2(1): 9-20.
[7] González, L. M., Estrada, A., Zaldivar, N.
andArgentel, L. 2007.Tolerance to drought in different

International Journal of Advanced Engineering Research and Science (IJAERS) [Vol-4, Issue-8, Aug- 2017]
https://dx.doi.org/10.22161/ijaers.4.8.10 ISSN: 2349-6495(P) | 2456-1908(O)
www.ijaers.com Page | 61
wheat varieties, based on some variables of the water
regime and concentration of pigments in seedling
stay.Revista Ciencias Técnicas Agropecuarias. 16(1):
45-49.
[8] Infante, S. and Zarate, L. P. 1990.Statistical methods:
a multidisciplinary approach. 2nd edition.México:
Trillas.
[9] López, B. L. 2002.Industrial crops.Ed. Mundi-prensa.
[10] Melgares, J. 2001.The cultivation of sunflower
(Helianthus annuus L.) for cut flower.Flormarket.
2(2): 55-61.
[11] Poverene, M.M., Cantamutto, M. A., Carrera, A. D.,
Ureta, M.S., Salaberry, M.T., Echeverría, M.M. and
Rodríguez, R. H. 2002.The wild sunflower (Helianthus
spp.) In Argentina: characterization for the release of
transgenic cultivars.Journal of Investigaciones
Agropecuarias. 31(2): 97-116.
[12] Ramírez, R., González, L, M., Camejo, Y., Zaldivar,
N. and Fernández, Y. 2006.Radiosensitivity study and
selection of the range of stimulating doses of X-rays in
four tomato varieties (Lycopersiconesculentum
Mill.).Cultivos tropicales. 27(1): 63-67.

International Journal of Advanced Engineering Research and Science (IJAERS) [Vol-4, Issue-8, Aug- 2017]
https://dx.doi.org/10.22161/ijaers.4.8.11 ISSN: 2349-6495(P) | 2456-1908(O)
www.ijaers.com Page | 62
Preliminary Studies of Groundwater Potential
and It's Distribution Patterns in the Gumuk at
Jember Priyantari N., Supriyadi, Suprianto A., Imbani A.N., Astutik L
Jurusan Fisika, FMIPA, Universitas Jember, Jln. Kalimantan 37, Jember 68121
Abstract— Gumuk is a natural phenomenon that occurs in
East Java, especially in Jember. The existence of gumuk
scattered in the district of Jember has mined intensively,
causing their numbers have declined dramatically.
Collecting data in this study conducted on each of the
gumuk using waypoint on GPS device consisting of
latitude and longitude coordinates. Waypoint data is
modified into shapefile (shp) then it is processed using
ArcView Gis 3.3. Based on our preliminary studies in 2
Subdistrict of Pakusari and Ledokombo identified as
cumulate gumuk while in the subdistrict of Arjasa as
spread gumuk. The groundwater potential in cumulate and
spread gumuk need to be investigated so that further
confirming the role of gumuks as a water storage.
Groundwater potential estimated using self potential
methods. The results obtained in the cumulate gumuk have
potential value 2 mV to -14 mV, the goundwater potential
in the gumuk can be assumed to be dominant. While on the
spread gumuk, soil water anomaly uneven, only at some
point. The groundwater potential in this gumuk less
dominant than the cumulate gumuk. From this study could
be concluded that the distribution of cumulate gumuk more
abundant groundwater potential than spread gumuk.
Keywords— gumuk, cumulate gumuk, spread gumuk,
groundwater potential, self potential.
I. INTRODUCTION
District of Jember Regency has unique and specific
landscape, with the existence of gumuk. Gumuk is small
hills composed of rocks and has a varying size (large and
height). Gumuk is included in the C category of quarry
mining with result stone plates, sand, and stone use as
foundation whereas hill mostly consist of soil
(Sulistyaningsih, et al,. 1997). The number of gumuk was
never officially inventoried, but the number was estimated
at more than 1000, so Jember District was also dubbed the
"District of a thousand gumuk". According to the theory of
Verbeek and Vennema (in Fariha, 2013), the existence of
the gumuk in Jember occurred due to the eruption of Mount
Raung in the past that drains lava. The lava flows are
covered by volcanic material with a thickness of tens
meters and erosion occurs on soft parts comprising
volcanic sediments of thousands years to produce the
topographic shape of the gumuk as it is today.
The existence of gumuk spreaded in Jember now has been
much eroded and flattened to the ground. Many of those
gumuks have been converted into residential and
agricultural areas. In 1990, the housing construction
began to proggres quickly in Jember and most of land
included gumuk, flatened and use as housing contruction.
Besides, gumuk also mostly mined result stone plates
causing the number has been reduced drastically.
According to Kepel (2000), in macro scale, gumuk
numbering thousands plays an important role in the
groundwater system in the downstream area because the
existence of the gumuk mostly located in the upstream. On
a micro scale, the gumuk plays a role for the surrounding
area, evidenced by the emergence of springs around a
portion of the gumuk, with varying discharges. Springs
encountered in the gumuk area are generally seepage.
It is necessary to re-inventory the current number of
gumuk with its geological conditions. The distribution can
be obtained through GPS (Global Positioning System) used
to determine the point of coordinates Latitude and
Longitude coordinates in each gumuk. GPS is a navigation
satellite system designed to provide three-dimensional
position and speed and information about time(Abidin,
2006).
The condition of subsurface structure can be observed
using self-potential method. Self potential method is one
of the geophysical methods whose basic principle is
measure static natural voltage which is in the group of
points on the ground surface. This method can be used to
determine an area that potentially minerals and metals.
Background potentials are formed by the flow of liquids,
biolistrik activity in plants and caused by differences in
electrolyte concentrations in groundwater as well as other
geochemical activities. The value of background potentials
depends on the geological resources below the surface
shown in table 1 below.

International Journal of Advanced Engineering Research and Science (IJAERS) [Vol-4, Issue-8, Aug- 2017]
https://dx.doi.org/10.22161/ijaers.4.8.11 ISSN: 2349-6495(P) | 2456-1908(O)
www.ijaers.com Page | 63
Table.1: Type of SP anomaly from various mineral
Sources Type of anomaly
Mineral Potentials
- Sulphide (pyrite, chalcopyrite, pyrrhotite, sphalerite, galena)
- Graphite (magnetite and other electronically conducting minerals)
- Coal
- Manganese
- Quarrtz veins
- Pegmatites
Potensial Background
- Fluid steaming, geochemical reaction, etc
- Bioelectric (plants, trees)
- Groundwater movement
- Topography
Negative ~ hundreds of mV
Negative ~ hundreds of mV
Negative ~ hundreds of mV
Negative ~ hundreds of mV
Positive ~ tens of mV
Positive ~ tens of mV
Positive +/- negative ≤ 100 mV
Negative ≤ 300 mV
Positive or negative up to hunderds of mV
Negative, up to 2 V
(Source : Reynolds, 1997).
Jardani et al (2006) in their research about self-potential
signals associated with preferential groundwater flow
pathways in sinkholes state that most of negative
anomalies were located along the trend where sinkholes
were identified from surface features. The sinkholes are
organized along these ridges channel because these ridges
high volumes of groundwater flow. Jinadasa and de Silva
(2009) do research on resistivity imaging and self-
potential applications in groundwater investigations in
hard crystalline rocks. from their research, area of
negative self potential anomalies correlate well with
possibly areas of groundwater accumulations. Base on
previous research and table 1, the groundwater potential
in the gumuk can be identified using a negative self-
potential anomaly.
There are two kinds of data acquisition technique in self-
potential method that is fixed base and leap frog
technique. In fixed base technique, one of the electrodes
is fixed at one point and the other electrode is moved at
each measurement, whereas in leapfrog technique the two
electrodes are moved at each measurement. Both
techniques are very effective for knowing subsurface
structures, but leapfrog techniques are more cost-effective
and time-efficient than fixed base techniques (Sharma,
1997). Goto et.al (2012) using leapfrog method in SP
observation for investigation groundwater flow system in
a nonvolcanic mountain slope. Onojasun (2015) also
using leapfrogging approach in delineating groundwater
contaminant plums using self-potential surveying method
in Perth Area, Australia.
II. METHODS
The data were collected in 3 sub-districts, i.e.
Ledokombo, Pakusari and Arjasa. Gumuk choosen as
research location at those sub district are gumuk that still
intact and had not been mined at all. Data acquisition in the
using GPS to determine Latitude and longitude coordinates
of the location and elevation of each gumuk. GPS survey
data in the form point is usually processed by converting into
segment data such as topographic contour data before
further processing in the GIS. Latitude and longitude
coordinat obtained from GPS device as waypoint.
Waypoint data is converted to shapefile (shp) then
processed futher using ArcView GIS. Last result as map
of gumuk distribution in 3 sub-distrik which will become
the reference in knowing the current position and
condition of the gumuk.
Meanwhile, to know the potential of groundwater in the
gumuk area is done by taking the line along the 200 m in
the gumuk with each spacing 5 m for each line. The data
acquisitin location for groundwater potential in
Ledokombo sub district, taken in Lembengan Village with
coordinates 8o09’50” S dan 113043’054” E. While in
Pakusari sub district taken in Subo Village with
coordinates 8009’56,2” S dan 113046’16,5” E. The last
location in Arjasa sub District, Biting Village with
coordinates 8006’46,5” S dan 113046’09,4” E. Location
taken, is expected to represent the area of the gumuk.
Technique of data acquisition using leap frog technique.
The data acquisition technique can be seen in Figure 1.
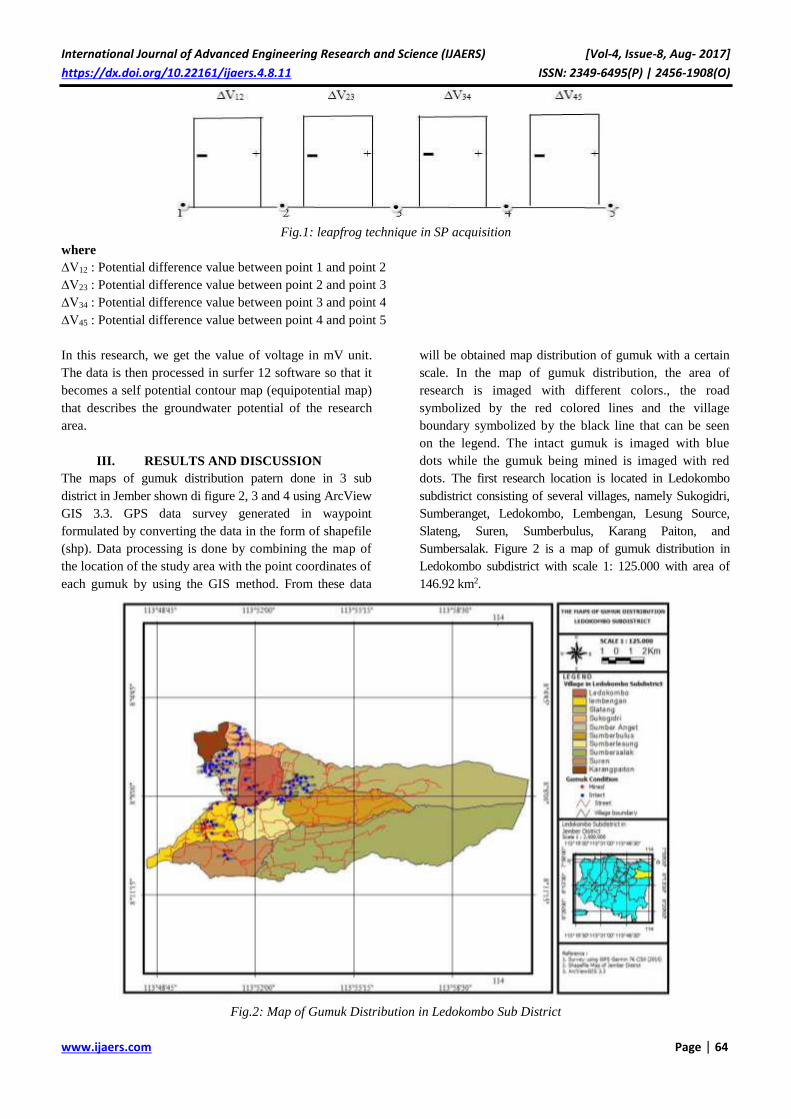
International Journal of Advanced Engineering Research and Science (IJAERS) [Vol-4, Issue-8, Aug- 2017]
https://dx.doi.org/10.22161/ijaers.4.8.11 ISSN: 2349-6495(P) | 2456-1908(O)
www.ijaers.com Page | 64
Fig.1: leapfrog technique in SP acquisition
where
∆V12 : Potential difference value between point 1 and point 2
∆V23 : Potential difference value between point 2 and point 3
∆V34 : Potential difference value between point 3 and point 4
∆V45 : Potential difference value between point 4 and point 5
In this research, we get the value of voltage in mV unit.
The data is then processed in surfer 12 software so that it
becomes a self potential contour map (equipotential map)
that describes the groundwater potential of the research
area.
III. RESULTS AND DISCUSSION
The maps of gumuk distribution patern done in 3 sub
district in Jember shown di figure 2, 3 and 4 using ArcView
GIS 3.3. GPS data survey generated in waypoint
formulated by converting the data in the form of shapefile
(shp). Data processing is done by combining the map of
the location of the study area with the point coordinates of
each gumuk by using the GIS method. From these data
will be obtained map distribution of gumuk with a certain
scale. In the map of gumuk distribution, the area of
research is imaged with different colors., the road
symbolized by the red colored lines and the village
boundary symbolized by the black line that can be seen
on the legend. The intact gumuk is imaged with blue
dots while the gumuk being mined is imaged with red
dots. The first research location is located in Ledokombo
subdistrict consisting of several villages, namely Sukogidri,
Sumberanget, Ledokombo, Lembengan, Lesung Source,
Slateng, Suren, Sumberbulus, Karang Paiton, and
Sumbersalak. Figure 2 is a map of gumuk distribution in
Ledokombo subdistrict with scale 1: 125.000 with area of
146.92 km2.
Fig.2: Map of Gumuk Distribution in Ledokombo Sub District

International Journal of Advanced Engineering Research and Science (IJAERS) [Vol-4, Issue-8, Aug- 2017]
https://dx.doi.org/10.22161/ijaers.4.8.11 ISSN: 2349-6495(P) | 2456-1908(O)
www.ijaers.com Page | 65
Based on the results of the research described in table 2,
the number of gumuk in Ledokombo subdistrict as 92
gumuk, consisting of 83 gumuk in intact condition and 9
gumuk being mined. The largest number of gumuk in this
sub-district is in Sumber Anget Village which is 29 gumuk,
consist of 28 gumuk in intact condition and 1 gumuk is
being mined. While the fewest gumuk in Suren the village
as 3 gumuk, consisting of 2 gumuk in intact condition and
1 gumuk being mined. Based on the geological map of
Jember district, the rock formations in Ledokombo sub
district consist of Raung rock, Argopuro Tuff, and Bagor
Form.
Table.2: Number of Gumuk in Ledokombo Subdistrict
No
Village intact mined Rock formation
(Rocfffformation 1 Sukogidri 8 - Batuan Raung & Tuff Argopuro 2 Sumber Anget 28 1 Batuan Raung & Tuff Argopuro
3 Ledokombo 10 - Tuff Argopuro
4 Lembengan 10 7 Tuff Argopuro
5 Sumber Lesung 9 - Tuff Argopuro
6 Slaten 16 - Form Bagor & Tuff Argopuro
7 Suren 2 1 Tuff Argopuro
8 Sumberbulus - - -
9 Sumbersalak - - -
10 Karang Paiton - - -
The measured groundwater potency in the study location can be shown in the form of contour maps. The result of the
potential contour of gumuk in Lembengan Village of Ledokombo SubDistrict is shown by figure 3 below:
Fig.3: Map of contours potential distribution of gumuk in Lembengan Village, Ledokombo Sub District
Anomalies of groundwater potential in line 1 and 2 with
coordinates 08º07’05” to 08º07’11” S and 113º50’39” E
With a range of values from 0 mV up to -14 mV. Then
there is also an anomaly of groundwater potential on line
4 with coordinates 08º07’09” to 08º07’10” S and
113º50’41” E potential value of -2 mV to -8 mV. The
amount of groundwater potential in the research area is
15% of the research area.
The second research is located in Pakusari sub-district
consisting of Bedadung, Patemon, Sumberpinang, Subo,
Jatian, Pakusari and Kertosari villages. Figure 4 is a map
of the gumuk distribution in Pakusari Sub District with
scale 1: 60.000 and the area 29,11 Km2. In Figure 4, can
be seen that the distribution of gumuk in Pakusari sub-
district is evenly distributed and the condition of the
gumuk that is being mined is less than the gumuk under
intact condition.

International Journal of Advanced Engineering Research and Science (IJAERS) [Vol-4, Issue-8, Aug- 2017]
https://dx.doi.org/10.22161/ijaers.4.8.11 ISSN: 2349-6495(P) | 2456-1908(O)
www.ijaers.com Page | 66
Fig.4: Map of Gumuk Distribution in Pakusari Subdistrict
The number of gumuk in Pakusari Sub-district is 71
gumuk, consisting of 56 gumuk in intact condition and
15 gumuk in mining process. In table 3 is seen that the
largest number of gumuk in Pakusari Village is 18 gumuk
consisting of 17 gumuk in intact condition and 1 gumuk
in mined condition. While the fewest guduk in Patemon
Village as 4 gumuk and in intact condition. Based on the
geological map of Jember District the rock formations in
Pakusari sub-district consist of Tuff Argopuro and Bagor
Form.
Table.3: Number of Gumuk in Pakusari Sub District
No Village intact mined Rock Formation
1 Bedadung 2 3 Tuff Argopuro 2 Patemon 4 - Tuff Argopuro
3 Sumberpinang 9 1 Tuff Argopuro
4 Subo 12 2 Tuff Argopuro
5 Jatian 8 6 Tuff Argopuro & Fom Bogor
6 Pakusari 17 1 Tuff Argopuro
7 Kertosari 4 2 Tuff Argopuro
The measured self potential at the research site can be displayed in the form of contour maps. The result of the potential
contour of the spreading of dune in Subo Village of Pakusari District is shown by figure 1.5 below:

International Journal of Advanced Engineering Research and Science (IJAERS) [Vol-4, Issue-8, Aug- 2017]
https://dx.doi.org/10.22161/ijaers.4.8.11 ISSN: 2349-6495(P) | 2456-1908(O)
www.ijaers.com Page | 67
Fig.5: Map of potential contour distribution of gumuk in Subo Village Pakusari SubDistrict
At the gumuk in Subo Villages, pakusari subdistrict, some
potensial groundwater potency were shown in 08º09’52”
sampai dengan 08º09’53” S dan 113º46’18” E with range
of potential value 2 mV to -4 mV. Groundwater potential
areas is 24% of this research area.
The third location is in Arjasa Subdistrict, the result of its
gumuk distribution is seen in Figure 6 with the scale of 1:
75.000 and the area of 43.75 Km2.
Fig.6: Map Distribution of Gumuk in Arjasa Sub District

International Journal of Advanced Engineering Research and Science (IJAERS) [Vol-4, Issue-8, Aug- 2017]
https://dx.doi.org/10.22161/ijaers.4.8.11 ISSN: 2349-6495(P) | 2456-1908(O)
www.ijaers.com Page | 68
Based on table 4. the number of gumuk that is in
District Arjasa as 10 gumuk, consisting of 9 gumuk in
intact condition and 1 gumuk is being mined. The area
where the distribution of the gumuk is located in 3
villages, Biting, Candijati, and Arjasa. This sub-district
is a subdistrict that has the least number of gumuk
compared to other sub-districts, this is because the gumuk
in this region many have been mined, so the number of
gumuknya decreases. Rock formations contained in the
region are the formation of Bagor Form Stone,
Argopuro Breccia, and Argopuro Tuff.
Table.4: Number of Gumuk in District Arjasa
No Village intact
Utuh
mined Rock Formation
1 Biting 5 1 Form Bagor, Breksi Argopuro, dan Tuff Argopuro
2 Candijati 2 - Breksi Argopuro
3 Arjasa 2 - Breksi Argopuro
4 Kamal - - -
5 Darsono - - -
6 Kemuning Lor - - -
The results of the self potential contour of gumuk distribution in Biting Village, Arjasa Sub District is shown by Figure 5
below:)
Fig.5: Map of potential contour distribution in Biting Village, Arjasa Sub District
The potential of groundwater in the spread of gumuk
spread in the village of Biting Arjasa District has a range
of values 0 mV to -10 mV, groundwater anomalies shown
uneven in the gumuk area only at some point. The area of
groundwater potential is 4% of the research area.
The number of gumuk in Jember district decreases due to
switching function to residential areas and most of them have
been mined. This lead to decreasing of spring water which are
generally found around gumuk. Gumuk ecosystem,
functionally play big role for human life, i.e forming a
local hydrologic cycle that has an important role in
creating a microclimate for agricultural landscape and
preserve the water cycle. The hydrological cycle of the
gumuk can be likened to a water reservoir capable of
storing rainwater as an input and then drain to the area
under it continuously. Therefore, Jember District
Government should make spatial planning for non-
existent of gumuk and can be developed into productive
economic activities without destroying its formation
IV. CONCLUSION
Based on the measurement results of the gumuk
distribution and the potency of groundwater obtained
pattern of gumuk distribution divide into cumulate gumuk
and spread gumuk. Gumuk is assumed to have a cumulate
pattern if the distance between the gumuk not too far
away and when viewed from a distance it will be seen
forming a single gumuk. This type of gumuk based on

International Journal of Advanced Engineering Research and Science (IJAERS) [Vol-4, Issue-8, Aug- 2017]
https://dx.doi.org/10.22161/ijaers.4.8.11 ISSN: 2349-6495(P) | 2456-1908(O)
www.ijaers.com Page | 69
research results are in Sub District Ledokombo and
Pakusari. While the gumuk is assumed to have spread
pattern if the distance between gumuk far enough and its
position is not seen as one unity. This type of gumuk
based on research results are in Sub District Arjasa. The
results obtained on the cumulate gumuk have a potential
range of 2 mV to -14 mV, so that the potency of
groundwater in the cumulate gumuk can be assumed to be
dominant. Whereas in the spead gumuk anomalous
groundwater shown unevenly, in the gumuk area only at
some point. Potency soilwater in gumuk spreads less
dominant compared with cumulate gumuk.
REFERENCES
[1] Abidin, H. Z. 2007. Penentuan Posisi dengan
GPS dan Aplikasinya. Jakarta: PT. Pradnya
Paramita.
[2] Fariha, H. 2012. Aplikasi Metode Geolistrik
Resistivitas 2 Dimensi (2D) Untuk Mendeteksi
Struktur Bawah Permukaan Pada Daerah Gumuk Di
Kabupaten Jember. skripsi. Jember: Universitas
Jember.
[3] Goto,T, Kazuya Kondo, Rina Ito, Keisuke Esaki,
Yasuo Oouchi, Yutaka Abe, and Maki Tsujimura,
2012, Implications of Self-Potential Distribution for
Groundwater Flow System in a Nonvolcanic
Mountain Slope. International Journal of
Geophysics, Volume 2012
[4] Jardani,A., J.P.Dupont, and A.Revil. 2006. Self-
potential signals associated with preferential
groundwater flow pathways in sinkholes. Journal of
Geophysical Research, Volume 111, Issue B9
[5] Jinadasa, S.U.P. and R.P. de Silva. 2009. Resistivity
imaging and self-potential applications in
groundwater investigations in hard crystalline rocks,
Journal of the National Science Foundation of Sri
Lanka, 37 (1)
[6] Kepel (Kelompok Peduli Lingkungan). 2000.
Program Konservasi Ekosistem Gumuk. [serial on
line]. http://kepel.itgo.com/gumuk/index.htm [3
Maret 2015].
[7] Onojasun, Okan Evans. 2012. Delineating
Groundwater Contaminant Plums Using Self-
Potential Surveying Method In Perth Area,
Australia, INTERNATIONAL JOURNAL OF
SCIENTIFIC & TECHNOLOGY RESEARCH
VOLUME 4, ISSUE 11, NOVEMBER 2015,ISSN
2277 -8616
[8] Reynolds, J.M. 2011. An Introduction to Applied
and Enviromental Geophysics 2nd edition. New
York: John Wiley & Sons.
[9] Sulistyaningsih N., Sutikto T., Bowo C., Regar
A.F.C., dan Sudibya J. 1997. Sumbangan ekologis
Formasi Gumuk di DATI II Kabupaten Jember.
Jember: Universitas Jember
[10] Sharma, P.V. 1997. Environmental and Geophysics.
New York: Cambridge University Press.

International Journal of Advanced Engineering Research and Science (IJAERS) [Vol-4, Issue-8, Aug- 2017]
https://dx.doi.org/10.22161/ijaers.4.8.12 ISSN: 2349-6495(P) | 2456-1908(O)
www.ijaers.com Page | 70
Impact of GST on E-Commerce Ms. Priti Jadhav, Ms. Manjushree Yewale, Ms. Trupti Kalyankar, Mrs. Vandana Nemane
Dr. D. Y. Patil ACS College, Pimpri, India
Abstract— E-commerce as anything that involves an online
transaction. E-commerce provides multiple benefits to the
consumers in form of availability of goods at lower cost,
wider choice and saves time. The general category of e-
commerce can be broken down into two parts: E-
merchandise: E-finance. E commerce involves conducting
business using modern communication instruments:
telephone, fax, e-payment, money transfer systems, e-data
interchange and the Internet. Online businesses like
financial services, travel, entertainment, and groceries are
all likely to grow. Forces influencing the distribution of
global e-commerce and its forms include economic factors,
political factors, cultural factors and supranational
institutions.
Goods and Service Tax or GST as it is known is all set to be
a game changer for the Indian economy. Overall it is known
to be beneficial to both the consumer, business and the
Government. In India, there are different indirect taxes
applied on goods and services by central and state
government. GST is intended to include all these taxes into
one tax with seamless ITC and charged on both goods and
services. Thus excise duty, special additional duty, service
tax, VAT to name a few will get repealed and will be added
into GST. For this, GST will have 3 parts CGST, SGST and
IGST. The central taxes like excise duty will be subsumed
into CGST and state taxes like VAT into SGST. This going
to be forward on all transactions of both goods and
services, only one tax will apply which is GST comprising
of CGST and SGST. IGST would be applied instead of
SGST for interstate transactions. Input credit of all these
taxes will be available against all the respective outputs.
This paper is outcome of a review of various research
studies carried out on Impact of GST on E-commerce. This
paper examines different aspects like No threshold for GST
registration, No Benefit under Composition Scheme, Tax
Collection at Source by Marketplace Operator. Finally in
the conclusion one country and one tax will help Indian
Economy to grow Rapidly.
Keywords— E-commerce, GST, Traditional business,
Opportunities.
I. INTRODUCTION
India’s e-commerce market is estimated to have crossed Rs.
211,005 crore in December 2016 as per the study conducted
by Internet and Mobile Association of India. The report
further claim that India is expected to generate $100 billion
online retail revenue by the year 2020.
The uprising of Electronic Commerce in India has also
resulted in conception of online marketplaces. A
Marketplace is an e-commerce platform owned by the E-
commerce Operator such as Flipkart, Snapdeal and
Amazon. Some of the features of a marketplace model are:
Marketplace enables third-party sellers to register
and sell online on their platform.
Marketplace charges a subscription fees/
commission on sale value from listed sellers.
Third-party sellers under this model gain access to
a larger customer base, registered with
marketplace.
Customer on the other hand gain access to multiple
sellers and competitive prices for desired products.
Items purchased on such marketplaces are either
shipped by Merchant/Third-party seller directly or
through the fulfillment center managed by
Marketplace Operator.
Government has also allowed Foreign Direct Investments
under such model to promote e-commerce marketplace
business model in India.
Marketplaces has provided retailers with additional channel
of sales and reach which was unimaginable for an offline
seller. Major marketplaces claim to have lacs of sellers
affiliated with their platform with millions of SKUs. While
the number of sellers and their business have increased
significantly, GST has specifically taken up marketplaces
and has come out with rules & regulations specific to this
segment.
Introduction of these regulations requirements has
compelled the online seller community to embrace GST
regime. Some of these compliance are:
No threshold for GST registration: Government has
specified a threshold limit for all the businesses. A business
is liable to register under Goods and Services Tax once such
threshold limit is breached. However such limit is not
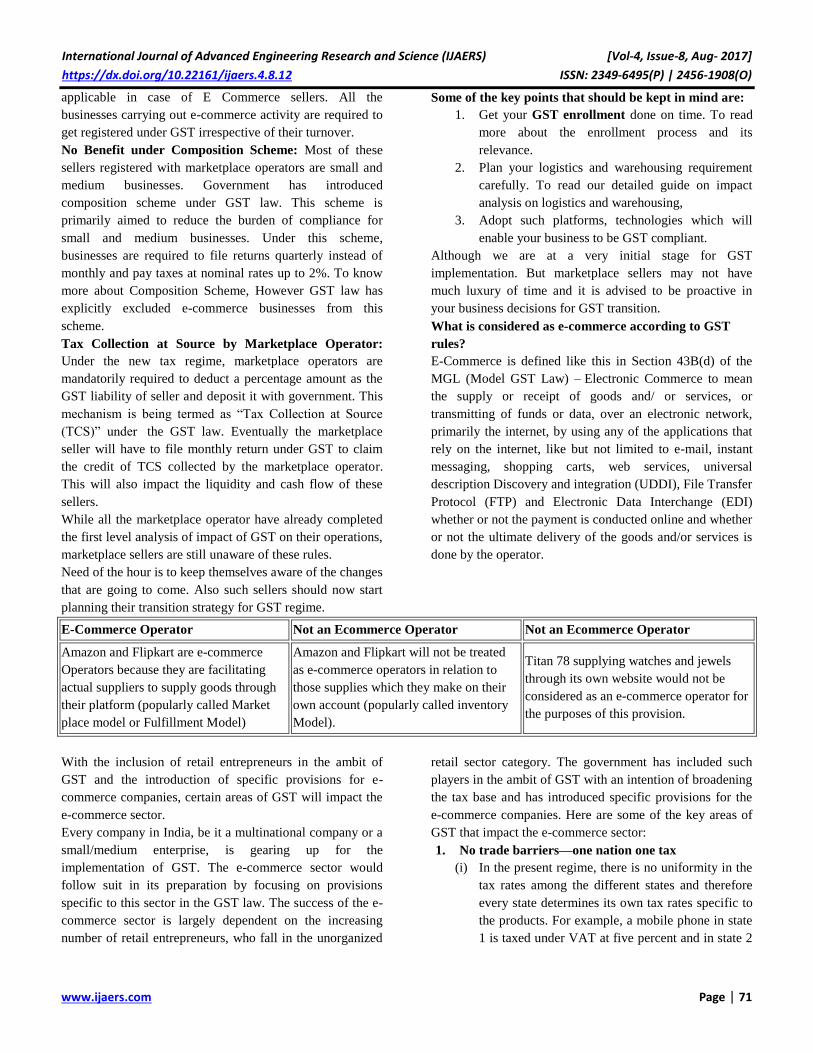
International Journal of Advanced Engineering Research and Science (IJAERS) [Vol-4, Issue-8, Aug- 2017]
https://dx.doi.org/10.22161/ijaers.4.8.12 ISSN: 2349-6495(P) | 2456-1908(O)
www.ijaers.com Page | 71
applicable in case of E Commerce sellers. All the
businesses carrying out e-commerce activity are required to
get registered under GST irrespective of their turnover.
No Benefit under Composition Scheme: Most of these
sellers registered with marketplace operators are small and
medium businesses. Government has introduced
composition scheme under GST law. This scheme is
primarily aimed to reduce the burden of compliance for
small and medium businesses. Under this scheme,
businesses are required to file returns quarterly instead of
monthly and pay taxes at nominal rates up to 2%. To know
more about Composition Scheme, However GST law has
explicitly excluded e-commerce businesses from this
scheme.
Tax Collection at Source by Marketplace Operator:
Under the new tax regime, marketplace operators are
mandatorily required to deduct a percentage amount as the
GST liability of seller and deposit it with government. This
mechanism is being termed as “Tax Collection at Source
(TCS)” under the GST law. Eventually the marketplace
seller will have to file monthly return under GST to claim
the credit of TCS collected by the marketplace operator.
This will also impact the liquidity and cash flow of these
sellers.
While all the marketplace operator have already completed
the first level analysis of impact of GST on their operations,
marketplace sellers are still unaware of these rules.
Need of the hour is to keep themselves aware of the changes
that are going to come. Also such sellers should now start
planning their transition strategy for GST regime.
Some of the key points that should be kept in mind are:
1. Get your GST enrollment done on time. To read
more about the enrollment process and its
relevance.
2. Plan your logistics and warehousing requirement
carefully. To read our detailed guide on impact
analysis on logistics and warehousing,
3. Adopt such platforms, technologies which will
enable your business to be GST compliant.
Although we are at a very initial stage for GST
implementation. But marketplace sellers may not have
much luxury of time and it is advised to be proactive in
your business decisions for GST transition.
What is considered as e-commerce according to GST
rules?
E-Commerce is defined like this in Section 43B(d) of the
MGL (Model GST Law) – Electronic Commerce to mean
the supply or receipt of goods and/ or services, or
transmitting of funds or data, over an electronic network,
primarily the internet, by using any of the applications that
rely on the internet, like but not limited to e-mail, instant
messaging, shopping carts, web services, universal
description Discovery and integration (UDDI), File Transfer
Protocol (FTP) and Electronic Data Interchange (EDI)
whether or not the payment is conducted online and whether
or not the ultimate delivery of the goods and/or services is
done by the operator.
E-Commerce Operator Not an Ecommerce Operator Not an Ecommerce Operator
Amazon and Flipkart are e-commerce
Operators because they are facilitating
actual suppliers to supply goods through
their platform (popularly called Market
place model or Fulfillment Model)
Amazon and Flipkart will not be treated
as e-commerce operators in relation to
those supplies which they make on their
own account (popularly called inventory
Model).
Titan 78 supplying watches and jewels
through its own website would not be
considered as an e-commerce operator for
the purposes of this provision.
With the inclusion of retail entrepreneurs in the ambit of
GST and the introduction of specific provisions for e-
commerce companies, certain areas of GST will impact the
e-commerce sector.
Every company in India, be it a multinational company or a
small/medium enterprise, is gearing up for the
implementation of GST. The e-commerce sector would
follow suit in its preparation by focusing on provisions
specific to this sector in the GST law. The success of the e-
commerce sector is largely dependent on the increasing
number of retail entrepreneurs, who fall in the unorganized
retail sector category. The government has included such
players in the ambit of GST with an intention of broadening
the tax base and has introduced specific provisions for the
e-commerce companies. Here are some of the key areas of
GST that impact the e-commerce sector:
1. No trade barriers—one nation one tax
(i) In the present regime, there is no uniformity in the
tax rates among the different states and therefore
every state determines its own tax rates specific to
the products. For example, a mobile phone in state
1 is taxed under VAT at five percent and in state 2

International Journal of Advanced Engineering Research and Science (IJAERS) [Vol-4, Issue-8, Aug- 2017]
https://dx.doi.org/10.22161/ijaers.4.8.12 ISSN: 2349-6495(P) | 2456-1908(O)
www.ijaers.com Page | 72
at 14.50 percent. As a result, the sellers in state 2
would not want to sell locally but would prefer to
sell from state 1, resulting in loss of revenue for
state.
(ii) E-commerce operators have set up distribution
centres only in certain locations and collect the
VAT applicable on sales made from such centres.
In order to compensate for the loss of VAT
revenue, many states have recently imposed entry
tax on goods coming from other states, which
discourages sales made from other states. The
entry tax acts as a trade barrier, restricts free
movement of goods from one state to another and
increases the cost for traders.
(iii) However, such trade barriers will cease to exist as
GST is inclusive of entry tax. The destination state
earns the revenue from GST on sales regardless of
where the sale was made. Further, there is no rate
arbitrage under GST because the classification of
goods and rate of GST is common across states.
2. Tax collection at source (TCS)
It is mandatory for all e-commerce operators to collect tax
at the rate of two percent as TCS on the net value of sales
made by suppliers through e-commerce operators. Such
TCS has to be deducted in each state and deposited
accordingly. This brings in significant compliance
challenges to sellers and may discourage sales through
marketplace model. However, this may not be applicable
for inventory based models, where the e-commerce operator
makes the sale from its own inventory. The key purpose of
this provision is to encourage compliances under GST and
provide a mechanism for the government to track suppliers
who sell through e-commerce operators.
3. Increase in compliances for e-commerce operators
The e-commerce operators should report all supplies made
by the seller and the TCS collected thereof on a monthly
basis. The sales reported by the e-commerce operator will
have to match with the sales declared by the supplier
himself at the end of every month, and any difference will
be added to the turnover of the supplier and consequently be
liable to discharge GST on such additional turnover.
The e-commerce operator has to report the product/service
code and the applicable rates for each item level
individually. This requires them to map every sale done by
the dealer and ensure TCS is deducted at the right value.
The implementation of compliance is cumbersome for both
e-commerce operator and the supplier.
Additionally, the e-commerce operators will have to register
in each state and file the reports separately on a monthly
basis. This process increases the challenges in compliance
and costs of running the business.
4. Mandatory registration of sellers and
unavailability of composition scheme
GST mandates that all sellers supplying through an e-
commerce operator need to be registered under GST
irrespective of the threshold limit of Rs 20 lakh. These
sellers cannot opt for composition scheme, where they pay a
flat tax at the rate of two percent and do not maintain details
of each product sold. In this scenario, it is not feasible for
small businesses to maintain a detailed record of purchases
and sales and pay higher rate of tax. Because of this, many
small retailers may not prefer to work with an e-commerce
company, which impacts the business for e-commerce
operators.
5. Increase in credits
The GST law has extended the meaning of ‘input tax’ to
cover any goods/services used by the company in the course
of business, which has widened the ambit of input GST
credits. This has removed the requirement to establish the
direct nexus of inputs/input services with the final
product/service provided by companies. For e-commerce
operators and sellers, the unavailability of credit towards
excise duty and VAT on goods and service tax on certain
services adds to the cost of running the business, which
would be avoided under GST on account of increase in
credits.
II. CONCLUSION
As we can see, the GST law may have a negative impact on
the e-commerce sector. Given that e-commerce sector in
India is one of the most rapidly advancing sectors and the
government is vigorously promoting digitised economy, the
introduction of such cumbersome compliances cringes the
growth of this sector.
Statutory framework introduced by the government should
be towards the advancement of business rather than creating
obstacles. The GST law should provide an enabling
environment that encourages e-commerce operators and
suppliers
In the run-up to one of the biggest tax reforms in the
country, the market is abuzz with new rules and guidelines
about the Goods and Services Tax (GST). How will GST
really impact your business? How will your financial
reporting change? Find out the answers to all this and more,
directly from industry and tax experts who will share their
expertise on Your Story’s new series ‘India on GST’.

International Journal of Advanced Engineering Research and Science (IJAERS) [Vol-4, Issue-8, Aug- 2017]
https://dx.doi.org/10.22161/ijaers.4.8.12 ISSN: 2349-6495(P) | 2456-1908(O)
www.ijaers.com Page | 73
REFERENCES
[1] https://cleartax.in/s/impact-of-gst-on-e-commerce-
marketplace-sellers
[2] http://www.profitbooks.net/gst-impact-on-ecommerce-
business/
[3] https://yourstory.com/2017/06/gst-india-benefit-
barrier-e-commerce-sector/
[4] http://economictimes.indiatimes.com/industry/services
/retail/gst-impact-on-e-commerce-marketplaces-put-
an-embargo-on-non-compliant-
merchants/articleshow/59431750.
[5] https://www.legalraasta.com/gst/impact-of-gst-on-e-
commerce/
[6] https://www.zoho.com/books/guides/gst-for-
ecommerce.html

International Journal of Advanced Engineering Research and Science (IJAERS) [Vol-4, Issue-8, Aug- 2017]
https://dx.doi.org/10.22161/ijaers.4.8.13 ISSN: 2349-6495(P) | 2456-1908(O)
www.ijaers.com Page | 74
Block Transformation for Encrypted Image
through RDH Pavana K P1, Mrs. Aritri D.Ghosh2
1Student M.Tech Digital electronics, Dept. of ECE, CMR Institute of technology, Bengaluru, India
2Assistent Professor Dept. of ECE, CMR Institute of technology, Bengaluru, India
Abstract—For a greater amount of ubiquity of
information outsourcing to cloud, it may be vital to
preserve those security of information furthermore
empower those cloud server should handle the
information effortlessly toward same period. With
accomplish such requirements, “Reversible Data hiding
by Encrypted image (RDH EI)” makes enormous
challenge for analysts. In this novel, proposed a
framework for “Block transformation for EI through
RDH”. Contrasting with past Encryption based schemes,
RDH EI based framework let the user to transmit the
semantic of original image into semantic of target image
with similar size. The transmitted picture or image looks
similar as target image, which is utilized as Encrypted
image (EI), and will outsource to Cloud server. Hence,
Cloud server can embed the data into EI through RDH
technique for Plain text image. Also image can retrieve
back as original without any degradation. Data hiding
will be done by least significant bit replacement, also RIT
mainly includes block pairing and block transformation
process which satisfies image quality.
Keywords— Reversible image transformation (RIT),
Encrypted image (EI), LSB, Reversible data hiding
(RDH).
I. INTRODUCTION
These days outsourced capacity through cloud gets more
mainstream service, particularly to media files such as
images, videos, which have huge storage room. On deal
with the outsourced images, those cloud server might
implant A percentage extra information under the
images, for example, picture classification Also
documentation data and utilization such information
should identify those ownership alternately check the
integument from claiming pictures. Also reversible data
hiding technology is needed, by which the original
image can be losslessly restored after the embedded
message is extracted. Data security basically means
protection of data from illegal users and provides high
security to check data medication. This area of data
security has gained more attention over the recent period
of time due to the huge increase in data transmission rate
over the network. In order to recover the security types
in data transfers over the internet, many techniques have
been developed like: cryptography, steganography. Also
cloud service for outsourced storage makes it interesting
to protect the privacy of image contents. For instance,
recently many private photos of actress leaked from
cloud. For this RDH is helpful for managing the
outsourced images, it cannot protect the image content,
encryption is the most popular technique for protecting
privacy. So it is fascinating to implement RDH in
encrypted images but will not get any information about
the image contents. Inspired by the needs of privacy
protection, many methods have been presented to extend
RDH methods to encryption domain. From the
viewpoint of compression, these methods on RDH-EI
belong to the frameworks [14] “vacating room after
encryption (VRAE)” and “reserving room before
encryption (RRBE)”
For both frameworks, VRAE and RRBE the image owner
will send a cipher text formed image to the cloud.
However the cipher texts with the special form of messy
codes are easy to cause the attention of the cloud server
who may try to dig out information on the encryption
users. In fact the cloud server is assumed to be curious to
collect information from the outsourced files [15], and
obviously the encrypted images are more attractive to a
curious cloud server. Therefore, the fact that the user is
outsourcing encrypted images, itself is also a kind of
privacy of the user, which should be protected.
II. LITERATURE REVIEW
There are many techniques available for reversible data
hiding in encrypted image as follows Lai et al. [2]
propose an image transformation technique, which selects
a target image similar to the secret image, then replaces
each block of the target image by a similar block of the
secret image and embeds the map between secret blocks
and target blocks; it forms an Encrypted image of the
secret image. A greedy search method is used to find the
most similar block. Although Lai et al.’s method is
reversible, it is only suitable for a target image similar
with the secret image, and the visual quality of encrypted
image is not so good.

International Journal of Advanced Engineering Research and Science (IJAERS) [Vol-4, Issue-8, Aug- 2017]
https://dx.doi.org/10.22161/ijaers.4.8.13 ISSN: 2349-6495(P) | 2456-1908(O)
www.ijaers.com Page | 75
In 2003 J Tian proposed the “reversible data embedding
(RDE) utilizing of difference expansion” [7]. He
presented a max-capacity with high-quality, RDE
technique for digital-images. This technique can apply for
both digital-audio & for digital-video also. He evaluates
the dissimilarity between neighboring pixel-values. In this
paper author considered only grayscale images. The
author explored the redundancy in digital-images, which
achieved a high embedding capacity, and remain the
distortion law. This correspondence [3] proposed a
lossless, reversible and data hiding schemes for public-
key-encrypted images probabilistic and homomorphic
properties of cryptosystems. With these schemes, the
pixel reorganization is avoided and the
encryption/decryption is performed on the cover pixels
directly so that the amount of encrypted data and the
computational complexity are lowered. Due to data
embedding on encrypted domain may result in a little bit
distortion in plaintext domain due to the homomorphic
property, the embedded data can be extracted and the
original content can be recovered from the directly
decrypted image. With the combined technique, a receiver
may extract a part of embedded data before decryption,
and extract another part of embedded data and recover the
original plaintext image after decryption This technique
[5] Z Qian et al proposed a “Distributed Source coding
(DSC) with RDH in EI”. After Encryption of 0riginal
image by content user, the Data Hider compress the
elected bits series considered from encrypted image
which makes the room for secret-data/message. From the
receiver side, secret bit sequence can be withdraw if the
receiver know unique embedding key. If receiver knows
encryption-key then he can recuperate original image
exactly with higher-quality by using image estimation
algorithm. Finally if receiver knows “Embedded key” &
“Encryption-key”, then receiver can embed the secret
message and perfectly recover the actual image by
utilizing of “Distributed source decoding method”. The
aim of author is to enhance the embedding payload in
encrypted-images. So he applied the separable RDH
methodology for encrypted images through “Slepian-wolf
source encoding” mechanism. He concludes that his work
achieves the great embedding payload with good image
recovery quality, and avoids the room reserving
operations by the sender.
The reversibly embed the message into the host sequence
by modifying its histogram with methods like histogram
shifting [6]. Recently, Zhang et al. proposed the optimal
histogram modification algorithm [8], for RDH by
estimating the optimal modification probability. Zhang
divided the encrypted image into several blocks. By
flipping 3 LSBs (least significant bits) of the half of
pixels in each block, room can be vacated for the
embedded bit. The data extraction and image recovery
proceed by finding which part has been flicked in one
block. This process can be recognized with the help of
spatial association in the decrypted image. The decoder
side by further exploiting the spatial correlation using a
dissimilar estimation equation and side match technique.
For both methods in [10] and [11], decrypting image and
extracting data must be jointly executed. Recently, Zhou
et al. [12] proposed a novel RDH-EI method for joint
decryption and extraction, in which the correlation of
plaintexts is further exploited by distinguishing the
encrypted and non-encrypted pixel blocks with a two-
class SVM classifier. To separate the data extraction from
image decryption, Zhang [13] emptied out space for data
embedding by directly using the typical manner of cipher
text compression that is, compressing the encrypted pixels
in a lossless manner by using the syndromes of parity-
check matrix of channel codes. Recently Weiming Zhang,
Hui Wang, Dong dong Hou, and Nenghai Yu propose a
novel context [1], for RDH-EI based on reversible image
transformation (RIT). Dissimilar from all preceding
encryption-based frameworks, in which the encryption
texts may attract the notation of the curious cloud, RIT-
based context allows the user to transform the contented
of original image into the content of another cover image
with the same size. The transformed image that looks
similar as the cover image is used as the “encrypted
image,” Reversible data hiding in images is a technique
that hides data in digital images for secret
communication. It is a method to hide other missive into
cover media with a revocable manner so that the
innovative cover content can be perfectly restored after
extraction of the hidden message. In this paper will be
using the method as [1] for transformation where the
concept of mosaic image for data security, dividing the
image into blocks with respect to cover and will be doing
data hiding using LSB replacement with less complexity
also achieved exact recovery by extracting the hidden
data.
III. PROPOSED SYSTEM
Here in this we proposed framework for RDH-EI by
using reversible image transformation (RIT). RIT
transforms the content of original image I into the content
of another target image J, with equal size and the
transformed image looks similar as target image or cover
image which will be used as “encrypted image” and
which will be outsourced to cloud. And cloud server can
embed data into the encrypted image using RDH method
that is least significant bit replacement with less
complexity and gives high quality of image also original
image can be retrieved back in lossless way through
encryption key.

International Journal of Advanced Engineering Research and Science (IJAERS) [Vol-4, Issue-8, Aug- 2017]
https://dx.doi.org/10.22161/ijaers.4.8.13 ISSN: 2349-6495(P) | 2456-1908(O)
www.ijaers.com Page | 76
Input image (I)Encrypted image
E(I)
Data EmbeddingData removingWatermarked
Image Ew(I)
Encrypted image
E(I)
Original Image
(I)
Key (K)
Key (K)
Sender
Cloud
Receiver
Fig.1: Proposed system
For color images, we transform the color channel R, G,
and B respectively in the same manner. So we just take
gray images (one channel) as an example to describe the
method. For an original image I, we randomly select a
target image J having the same size with I from an image
database. Firstly, we divide the original image I and the
target image J into N non-overlapping blocks
respectively, and then pair the blocks of I and J as a
sequence such that (B1,T1),...,(BN ,TN ), where Bi is an
original block of I and Ti is the corresponding target block
of J, 1≤ i ≤ N. We will transform Bi toward Ti and
generate a Ti’ similar to Ti. After that, we replace each Ti
with Ti’ in the target image J to get the transformed image
J’. Finally we embed some accessorial information (AI)
into J’ with an RDH method and generate the ultimate
“encrypted image” E(I).These AI is necessary for
recovering I from J’. Before being embedded, these AI
will be compressed and encrypted with a key K shared
with the receiver, so only a receiver having K can decrypt
E(I). the proposed transformation process consists of
three steps: block pairing, block transformation and AI
embedding.
A. BLOCK PAIRING
To make the transformed image J’ look like target image
J, we hope, after transformation, each transformed block
will have close mean and standard deviation (SD) using
equation (1) and (2) with the target block. So we first
compute the mean and SD of each block of I and J
respectively. Let a block B be a set of pixels such that B =
{p1, p2,..., pn}, and then the mean and SD of this block is
calculated as follows:
(1)
(2)
When matching blocks between original image and target
image, we hope two blocks with closest SDs to be a pair.
In Lee et al.’s method, the blocks of original image and
target image are sorted in ascending order according to
their SDs respectively, and then each original block is
paired up with a corresponding target tile in turn
according to the order. To recover the original image
from the transformed image, the positions of the original
blocks should be recorded and embedded into the
transformed image with an RDH method. If the image is
divided into N blocks, N log N bits are needed to record
block indexes. Obviously, the smaller the block size is,
the better the quality of transformed image will be, but
which will result in a large N. therefore, the amount of
information used to record the index for each block may
be so large that it will cause much distortion when
embedding these information into the transformed image.
In fact there may not exist enough redundant space to
store these additional information. For instance, if we
divide a 1024×1024 image into 4×4 blocks, 216 ×16 bits
are needed to record the positions of blocks. To compress
the block indexes, we first classify the blocks according
to their SD values before pairing up. In fact, we found
that the SD values of most blocks concentrate in a small
range close to zero and the frequency quickly drops down
with the increase of the SD value from boss base image
database. Therefore we divide the blocks into two classes
with unequal proportions class 0 for blocks with smaller
SD, and class 1 for blocks with larger SD and pair up the
blocks belonging to the same class. By assigning the
majority of blocks to the class 0, we can avoid the large
deviation of SDs between a pair of blocks and efficiently
compress the indexes at the same time. In this paper, we
propose to divide both the original and target images into
non-overlapping 4× 4 blocks and calculate the SDs of
each block. We first divide the blocks of original image I
into 2 classes according to the quantile of SDs. Denote
that the %α quantile of SDs by Nα, We assign the blocks
with SDs € [0, Nα] to “Class 0,” and blocks with SDs €
(Nα , N100 ] to “Class 1.” And then we will scan the blocks
in the raster order, i.e., from left to right and from top to
bottom, and assign a class label, 0 or 1, to each block.
Next, we label the blocks of target image based on the
classes’ volumes of original image. Assuming that the ith
class in the original image includes ni blocks for i= 0 or 1,
we scan the target image in the raster order, and label the
first n0 blocks with the smallest SDs as Class 0, and the
rest n1 blocks as Class 1. As a result, each class in the
target image includes the same number of blocks as the

International Journal of Advanced Engineering Research and Science (IJAERS) [Vol-4, Issue-8, Aug- 2017]
https://dx.doi.org/10.22161/ijaers.4.8.13 ISSN: 2349-6495(P) | 2456-1908(O)
www.ijaers.com Page | 77
corresponding class in the original image. We pair the
original block up with target block in the following
manner. Scan the original image and target image in
raster order respectively and pair the jth block of the class
i in the original image up with the jth block of the class i
in the target image for i = 0, 1 and j= 1, . . . , ni. For each
pair of blocks (B,T), as will see later section, the original
block B will be transformed to target block T by mean
shifting and block rotation, yielding T. By replacing each
T with T’ in the target image, the sender will generate the
transformed image. Note that both operations of mean
shifting and block rotation will not change the SD value,
so T’ has the same SD as B. Therefore, the SDs in
transformed image is only a permutation of those in
original image. When classifying the blocks of
transformed image according to %α quantile of SDs, the
receiver can get a CIT that is same with the CIT of target
image. Therefore to restore the original image from the
transformed image, the receiver only needs to know the
CIT of the original image.
B. BLOCK TRANSFORMATION
Let the original block B = {p1, p2,···, pn}, and the
corresponding target block T = {p1’,p2’….,pn’}. And
calculate the means of B and T and denote them by uB
and uT respectively. The transformed block T’= {p1”,
p2”,…..pn”} is generated by the mean shifting as follows:
pi” = pi + uT – uB (3)
Where (uT −uB) is the difference between the means of
target block and original block. We want to shift each
pixel value of original block by amplitude (uT −uB) and
thus the transformed block has the same mean with the
corresponding target block. However, because the pixel
value pi” should be an integer, to keep the transformation
reversible, we round the difference to be the closest
integer as
∆u = round (uT – uB ) (4)
And shift the pixel value by ∆u, namely, each pi” is gotten
by
pi” = pi + ∆u (5)
Note that the pixel value pi” should be an integer between
0 and 255, so the transformation may result in some
overflow/underflow pixel values. To avoid such
transformed blocks abstained by (5), we assume that the
maximum overflow pixel value is OVmax for Δu ≥0 or
the minimum underflow pixel value is UNmin for Δu<0.
If overflow/underflow occurs in some blocks, we
eliminate them by modifying Δu
(6)
We use the modified Δu to shift the pixels of block B, and
thus all the pixels’ values are controlled into the range of
[0,255]. However the range of Δu’s value is still very
large which cannot be efficiently compressed. Thus we
further modify Δu as
(7)
In which the quantization step, λ, is an even parameter.
Then it just needs to record Δu’=2 |Δu|/λ, by which it has
the advantage of not to record the sign of Δu. Because
when Δu’ is an even number it means Δu ≥0 and when
Δu’ is an odd number it means Δu<0. Since when λ is
large the amount of information recording Δu’ will be
small but the offset between the modified Δu and the
original Δu will be large, a tradeoff must made by
choosing λ. We set λ =8 in the following experiments.
Finally, to maintain the similarity between the
transformed image and target image as much as possible,
we further rotate the shifted block into one of the four
directions 00, 900, 1800 or 2700. The optimal direction is
chosen for minimizing the root mean square error (MSE)
between the rotated block and the target block. After
shifting transformation and rotation, we get a new block
T’. With these new blocks, we replace the corresponding
blocks in the target image and generate the transformed
image J’. The parameters, Δu’ and rotation directions,
will be compressed, encrypted and then embedded into
the transformed image J’ as AI to output the “encrypted
image” E (I).
C. REVERSIBLE DATA HIDING
Fig.2. Embedding data
Fig.3. Reverse data hiding
Message encoding on an image can be divided in to two
parts, one portion is data hiding other is reversible data
hiding. In data hiding part there is a digital image in
which we encode secret message by removing LSB of
image pixel and add our secret message on corresponding
LSB position, then the output image is called stego
image. For retrieve the secret message program splits the
image into its channels and applies the inverse lifting

International Journal of Advanced Engineering Research and Science (IJAERS) [Vol-4, Issue-8, Aug- 2017]
https://dx.doi.org/10.22161/ijaers.4.8.13 ISSN: 2349-6495(P) | 2456-1908(O)
www.ijaers.com Page | 78
scheme to each channel to the level specified by the user.
When the transformation is completed, the program
retrieves the message out of the pixels of the cover image.
Different streams of digital media can be used as a cover
stream for a secret message. Stegnography is the art of
writing secret message so that only the sender and the
intended recipient are aware of the hidden message. A
successful information hiding should result in the
extraction of the hide data from the image with high
degree of data integrity. Current trends favor using digital
image files as the cover files to hide another digital file
that contains the secret message or information.
IV. RESULT
The experimental result for the method block
transformation, embedding the data, restoration achieved
through MAT lab tool using GUI, MAT lab implements
GUIs as figure windows containing various styles of
control objects, there we must program each object to
perform the intended action when activated by the user of
the GUI, all of these tasks are simplified by GUIDE, The
process of implementing a GUI involves two tasks that is
Layout the GUI components
Programming the GUI components
GUIDE primarily is a set of layout tool. Which generates
an M-file that contains code to handle the initialization
and launching GUI also this file provides a frame work
for the implementation of the callbacks the functions that
execute when users activate components in the GUI, and
FIG- file contains a complete description of the GUI
figure
Let us show complete result analysis, by taking original
image as lenna image and target image or cover image as
baboon image which is shown below of equal size as
1024x1024 and done reversible image transformation
process as explained and data hiding will gives the
following outputs,
(a) (b)
Fig.4. (a) Original image. (b) Cover image
Once we select with the images, will be doing block
pairing step where can see the plots for SD value
distribution as shown below
Fig.5. Plots of SD values for R G B channel
Later will do transformation step by considering several
mathematical steps as explained above and embed the
data into the transformed image using LSB replacement,
corresponding transformed and embedded image will be
shown below
(a) (b)
Fig.6. (a) Transformed image. (b) Embedded image
To recover image back, we need to extract the hidden data
and do anti transformation gives the recover image which
is as same as original that is called lossless recovery.
Which will be shown in below figures
(a) (b)
Fig.7. Recover image. (a) Wright key. (b) Wrong key

International Journal of Advanced Engineering Research and Science (IJAERS) [Vol-4, Issue-8, Aug- 2017]
https://dx.doi.org/10.22161/ijaers.4.8.13 ISSN: 2349-6495(P) | 2456-1908(O)
www.ijaers.com Page | 79
V. CONCLUSION
The proposed work formulates the novel for “RDH EI”
which allows the secure block transmission for EI. “RIT”
based “RDH - EI” changes the content of original image
into content of another target image where secure the
original image contents by transforming entire original to
target and the outcome looks target image which is also
the encrypted image. Since an EI contains plaintext image
form, which neglect the annotation of cloud server. That
will free from cloud server to select any conventional
RDH method for plaintext image to implant watermark.
Here the reversible image transmission based scheme will
be used to restore as the original image in lossless fashion
hence it achieves reversibility. From this technique, user
can transmit the actual image to randomly selected cover
image with equal size. Also the method fulfill the
requirements on image quality with embedding capacity.
Since the method works with key, gives back original
image with maximum accuracy hence the method most
helpful for all secured communication systems.
REFERENCES
[1] Weiming Zhang, Hui Wang, Dong dong Hou, and
Nenghai Yu propose a novel framework for RDH-EI
based on reversible image transformation IEEE
Trans on Multimedia, vol.18, no.8, aug 2016.
[2] I.-J. Lai and W.-H. Tsai, “Secret-fragment-visible
mosaic image–a new computer art and its
application to information hiding,” IEEE Trans.
Information Forensics and Security, vol. 6, no. 3, pp.
936–945, 2011.
[3] Xinpeng Zhang, Jing Long, Zichi Wang, and Hang
Cheng, “Lossless and Reversible Data Hiding in
Encrypted Images with Public Key Cryptography,”
IEEE Trans. on Circuits and Systems for Video
Technology, 2015.
[4] X. Hu, W. Zhang, X. Li, and N. Yu, “Minimum rate
prediction and optimized histograms modification
for reversible data hiding,” IEEE Trans. Inf.
Forensics Security, vol. 10, no. 3, 653–664, Mar.
2015.
[5] Z. Qian, and X. Zhang, “Reversible data hiding in
encrypted image with distributed source encoding,”
IEEE Trans. on Circuits and Systems for Video
Technology, vol. 26, no. 4, pp. 636-646, Apr. 2016.
[6] Z. Ni, Y .Shi, N. Ansari, and S. Wei, “Reversible
data hiding,” IEEE Trans. Circuits Syst. Video
Technol., vol. 16, no. 3, pp. 354–362, Mar. 2006.
[7] J. Tian, “Reversible data embedding using a
difference expansion,” IEEE Trans. Circuits Syst.
Video Technol., vol. 13, no. 8, pp. 890–896, Aug.
2003.
[8] W. Zhang, X. Hu, X. Li, and N. Yu, “Recursive
histogram modification: Establishing equivalency
between reversible data hiding and lossless data
compression,” IEEE Trans. Image Process., vol. 22,
no.7,pp.2775–2785, Jul. 2013.
[9] X. Zhang, “Reversible data hiding in encrypted
images,” IEEE Signal Process. Lett., vol. 18, no. 4,
pp. 255–258, Apr. 2011.
[10] W. Hong, T. Chen, and H. Wu, “An improved
reversible data hiding in encrypted images using
side match,” IEEE Signal Process. Lett., vol. 19, no.
4, pp. 199–202, Apr. 2012.
[11] J. Zhou et al., “Secure reversible image data hiding
over encrypted domain via key modulation,” IEEE
Trans. Circuits Syst. Video Technol., vol. 26, no. 3,
pp. 441–452, Mar. 2016.
[12] X. Zhang, “Separable reversible data hiding in
encrypted image,” IEEE Trans. Inf. Forensics
Security, vol. 7, no. 2, pp. 826–832, Apr. 2012.
[13] K. Ma, W. Zhang, X. Zhao, N. Yu, and F. Li,
“Reversible data hiding in encrypted images by
reserving room before encryption,” IEEE Trans. Inf.
Forensics Security, vol. 8, no. 3, pp. 553–562, Mar.
2013.
[14] S. Yu, C. Wang, K. Ren, and W. Lou, “Achieving
secure, scalable, and fine-grained data access control
in cloud computing,” in Proc. IEEE INFOCOM,
Mar. 2010, pp. 1–9.
International Journal of Advanced Engineering Research and Science (IJAERS) [Vol-4, Issue-8, Aug- 2017]
https://dx.doi.org/10.22161/ijaers.4.8.14 ISSN: 2349-6495(P) | 2456-1908(O)
www.ijaers.com Page | 80
A Multi-Agent Systems Contribution for Audit
and Change Management Nabil Benanbaar1, Laila Moussaid2, Hicham Medromi3
(EAS- LRI) Systems Architecture Team, ENSEM, Hassan II University, BP.8118, Oasis Casablanca, Morocco
Abstract— The progress made in Information Technology
and the popularity of best practices have grown to give
rise to new applications such as IT GRC. the good use of
these applications requires communication and
exchanges between these architectures. In front for a high
number of standards and best practices, the model of
management in Information system department becomes
very dynamic. In this model, audit and change
management are two problematics that are rarely
automated in the function of information systems. These
systems must adapt to new management methods and
practices in order to improve innovation and
management within companies. The major challenge of
these standards and best practices is to adapt the target
processes to the existing context and to have automatic
mechanisms for auditing and generating a plan of
evolution in an application.
In this paper we propose an approach for Audit and
Change Management in IT GRC tools. Our approach
uses multi-agent systems to give the evolution plan in
order to generate a road map for implementation the IT
governance framework.
Keywords— IT Governance, Audit and Change
Management, best IT framework, IT GRC, Multi–Agent.
I. INTRODUCTION
The evolution of information systems since the 1960 has
enabled the profound changes having evolved the needs
of management tools in information systems. The
appearance of the term Information System is indicative
of the changes in attitudes: this stems resulted the
emergence of new actors and new management entities of
information systems. This management approach reveals
the challenge of the evolution of the information system,
which must be managed and controlled by strategic
alignment.
Strategic alignment is an approach to align the strategy of
information system on the business rules of company.
This approach has purpose of enhancing the value in use
of the information system and makes it an asset to the
company. To do this, a new system design was passed;
this system is based on modeling a multi-Architecture
environment, the aim of this practice is to define how
organizations can align Information Technology (IT)
strategy with business strategy ensures that companies
can measure their performance.
Today, this mode of management is called IT
Governance.
IT Governance describes how an Information System
(IS) is directed and controlled by defining approaches and
good principles to implement the search for performance
and reducing costs and risks. It can also define the
relationship between IS users, the key processes and the
common points between technical and functional
architectures [1].
In this paper, we will focus on IT GRC architectures.
GRC is the acronym for "Governance, Risk and
Compliance". It is a concept that describes the integration
of activities to improve the efficiency and effectiveness of
many functions of organizations.
By way of explanation, IT Governance, IT Risk and IT
Compliance, ensures that enterprise objectives are
achieved by evaluating stakeholder needs, conditions and
options, setting direction through prioritization and
decision making, and monitoring performance,
compliance and progress against agreed-on direction and
objectives [2].
Currently, implementing the techniques and tools of
Audit and change management becomes a key element of
the innovation and management system within
companies.
II. STAT OF ART
Like Enterprise Resource Planning (ERP), GRC is
becoming one of the most important business
requirements of an organization [3], mainly due to rapid
globalization, increasing regulation and growing demand
for transparency for companies, [4], [5], and [6].
The GRC methods are based on the process approach.
A. IT Processes
IT Governance, IT Risk and IT Compliance are based on
a set of processes to ensure that the objectives assigned to
the IS are well considered. There are a variety of
processes to meet the needs of the activities of an IS
department. These processes can be divided as follows:
• Management planning: is the process of definition and
assessing an organization's goals and creating a realistic
detailed plan of action for meeting those goals. The basic

International Journal of Advanced Engineering Research and Science (IJAERS) [Vol-4, Issue-8, Aug- 2017]
https://dx.doi.org/10.22161/ijaers.4.8.14 ISSN: 2349-6495(P) | 2456-1908(O)
www.ijaers.com Page | 81
steps in the management planning process involve
creating a road map that outlines each task the company
must accomplish to meet its overall objectives.
• Service Management: refers to the entirety of activities
that are performed by an organization to plan, design,
deliver, operate and control information technology (IT)
services offered to customers.
• Project Management: is the discipline of initiating,
planning, executing, controlling, and closing the work of
a team to achieve specific goals and meet specific success
criteria.
• Cost Management: is the process of planning and
controlling the budget of a business. Cost management is
a form of management accounting that allows a business
to predict impending expenditures to help reduce the
chance of going over budget.
• Software Management: is the process of planning and
leading software projects. It is a sub-discipline of project
management in which software projects are planned,
implemented, monitored and controlled. Realizes
software and implements them using programming
languages.
• Security Management: This is a broad field that
encompasses several aspects; these processes protect by
appropriate measures and detect as soon as possible the
security problems that could threaten the information
system of an organization.
• Provider Management: the processes that give
specialist advice and support with contracts between
customers and provider in order to get more value in the
customer-provider relationship.
• Resource Management: The process of using a
company's resources in the most efficient way possible.
These resources can include goods and equipment,
financial resources, and human resource.
• Quality Management: Set of activities allowing the
determination of the quality policy and its implementation
in order to maintain and improve the services and
products of an IT organization.
B. IT GRC Processes
Today, there are several best IT frameworks in the IT
market to implement the IT GRC concept, each standard
is specialized in a specific field. In the following, we will
cite the main best practices and standards used by
companies in the IT domain.
• COBIT (Control Objectives for Information and
related Technology): is a framework developed and
delivered by ISACA (Information Systems Audit and
Control Association), he Allows to control the objectives
and to manage the IT processes, to do this, COBIT
provides a set of practices to manage the levels of control
that must be applied on IT processes and resources.
• ITIL (Information Technology Infrastructure
Library): is a set of detailed practices for IT service
management (ITSM) that focuses on aligning IT services
with the needs of business. The main goal of ITIL is to
improve service to the customer.
• CMMI (Capability Maturity Model Integration): was
developed by a group from industry, government, and the
Software Engineering Institute (SEI). CMMI models
provide guidance for developing or improving
engineering processes of an organization. A CMMI model
may also be used as a framework for appraising the
process maturity of the organization. The main goal of
CMMI is to ensure to customers of a certain level of
maturity of the company’s engineering processes.
• PMBOK (Project Management Body of Knowledge):
developed by the Project Management Institute (PMI),
PMBOK is a guide and global standards provide
guidelines, rules and characteristics for project, program
and portfolio management. The PMBOK Guide is
process-based, meaning it describes work as being
accomplished by processes. The main goal of PMBOK is
to improve life cycle management of any project, program
and project portfolio.
• ISO 27001(International Standard Organization):
specifies the requirements for establishing, implementing,
maintaining and continually improving an information
security management system within the context of the
organization. It also includes requirements for the
assessment and treatment of information security risks
tailored to the needs of the organization. The main goal of
ISO 27001 is to protect the information asset and to
comply with legal and regulatory requirements.
• ISO 20000: Is a service management system (SMS)
standard. It specifies requirements for the service provider
to plan, establish, implement, execute, monitor, review,
maintain and improve an SMS. Requirements include
design, transition, provision and improvement of services
to meet service requirements.
C. Overview of EAS-IT GRC
The IT GRC assures the alignment of the objectives of the
organization as regards needs defined by the stakeholders.
This is illustrated by the progress strategic of a given
organization and also by the taken decisions. The
proposed solution supplies a high-level model for the IT
GRC who will allow the implementation of the IT GRC
in an intelligent way. We give a brief description of every
layer of the platform EAS-IT GRC (figure 1) for a good
understanding of the global architecture [7].
IT GRC platform is composed of four principle layers:
• Strategic layer: based on COBIT framework; ensuring
permanent alignment of IT and Business with

International Journal of Advanced Engineering Research and Science (IJAERS) [Vol-4, Issue-8, Aug- 2017]
https://dx.doi.org/10.22161/ijaers.4.8.14 ISSN: 2349-6495(P) | 2456-1908(O)
www.ijaers.com Page | 82
stakeholders’ participation. Its role is to propose new
processes of management for the IT department.
• Decision layer: assures making a comparative analysis
between the best frameworks for each IT process in order
to make a decision for the best reference to set up.
• Processing layer: This layer is composed of different
systems, which can be implemented; it defines the
processes and actions to be deployed according to the
chosen framework.
• Communication layer: It is responsible for all
communications between layers of the IT GRC platform.
Fig.1: EAS-IT GRC solution
III. PROPOSED ARCHITECTURE EAC-ACM
The bibliographic study on IT solutions GRC enabled us
to identify several architectures and solutions of IT
governance for companies. The analysis of these solutions
allowed us to identify limitations of the IT GRC relative
to the actual needs of different companies. Among these
limitations we quote:
• The company's IT strategic plan changes after 3 to 5
years because of the new vision of the company, the
current IT GRC platforms do not offer solutions for
aligning the IS with the strategy business.
• The change in the company's IS strategy directly implies
a change in practices of users IT system, which requires
auditing existing activities to propose new solutions, the
current IT GRC platforms do not allow auditing of
existing practices based on best practices and standards.
• The change in IS governance requires new actions to be
taken; the current IT GRC platforms cannot generate an
IT action plan to implement the new solutions.
In this paper, we focus on the following issue: How can
we audit existing practices and plan changes
automatically in IT governance in order to implement a
new actions and recommendations?
A. Proposed Architecture
Our approach based on EAS-IT GRC allows the audit and
generation an IT planning in order to assist the change
management.
Our proposal proposes a new layer for audit and change
management using Multi-Agent Systems (MAS) in order
to automate the link between the actions to be
implemented and the roadmap for IT planning towards
the implementation of the IT governance.
This proposal is structured in two phases: Audit and Gap
Analysis, and change management.
The phase of ensuring Audit and Gap Analysis involves
the following steps:
• Information gathering: this step allows to list the
processes to be implemented communicated by the
communication layer and explore the current practices in
order to update the knowledge base of the information
system.
• GAP Analysis: this step allows GAP Analysis between
the existing and the proposals of improvements.
• Proposal for recommendations: this step allows the
identification of actions to be realized within the
framework of the change brought by the new governance.
• Prioritization of actions: this step allows the
identification of the urgency and impact of every action to
be realized within the framework of the change brought
by the new governance.
The phase of change management involves the following
steps:
• Classification of actions: this step allows the
classification for every action by using the priority of
each action.
• Identification of position: this step allows identifying
the position of each action in the IT planning.
• Identification of duration: this step allows the
identification of duration of implementation of every
activity.
• Generation of IT action plan: This step allows the
generation and display of the action plan.
EAS-ACM (figure 2) is composed of two multi agent
systems (MAS): Audit and GAB analysis and change
management.
We believe that developing an expert system will bring
significant advantages such as the statistics calculated
from the facts base and the use the tools for analysis.
Our system is also based on multi agent systems because
agents exhibit a high level of autonomy and function
successfully in situations with a high level of uncertainty.

International Journal of Advanced Engineering Research and Science (IJAERS) [Vol-4, Issue-8, Aug- 2017]
https://dx.doi.org/10.22161/ijaers.4.8.14 ISSN: 2349-6495(P) | 2456-1908(O)
www.ijaers.com Page | 83
Fig.2: EAS-ACM architecture
B. System Expert
Expert system is one of the areas of artificial intelligent.
An expert system also known as knowledge based system
is a computer program that contains the knowledge and
analytical skills of one or more human experts in a
specific problem domain. The goal of the design of the
expert system is to capture the knowledge of a human
expert relative to some specific domain and code this in a
computer in such a way that the knowledge of the expert
is available to a less experienced user [8].
It is divided into two sub-systems: The inference engine
and the knowledge base
The Knowledge base contains accumulated experience
and a set of rules.
The inference engine applies the rules to the known facts
to deduce new facts.
This process would iterate as each new fact in the
knowledge base could trigger additional rules in the
inference engine.
Inference engines work primarily in one of two modes:
Forward chaining and backward chaining. Forward
chaining starts with the known facts and asserts new facts.
Backward chaining starts with goals, and works backward
to determine what facts must be asserted so that the goals
can be achieved. Four main characteristics distinguish an
expert system from a conventional program are as the
following:
Expertise: Expert systems use a large amount of
knowledge about a particular domain, this knowledge is
often subjective, possibly incomplete and subject to
change. However, expert systems must have the skills to
use this knowledge efficiently in order to solve complex
problems quickly.
Symbolic reasoning: In an expert system, the knowledge
is explicitly represented in symbolic form, in a structure
called the knowledge base.
The inference engines manipulate this knowledge using a
set of heuristic rules appropriate to the given domain.
Depth: Expert systems operate in a narrow domain,
dealing with hard and challenging problems. They have to
use complex rules.
Self-knowledge: An expert system has the feature of
explanation capability. It should be able to explain how it
has arrived at a particular conclusion.
Besides to that, an expert system can advise, modifies,
update, expand and deals with uncertain and irrelevant
data
C. Agent and Multi Agent System
An agent is a computer system within an environment and
with an autonomous behavior made for achieving the
objectives that were set during its design [9].
A multi-agent system (MAS) is a system that contains a
set of agents that interact with communications protocols
and are able to act on their environment. Different agents
have different spheres of influence, in the sense that they
have control (or at least can influence) on different parts
of the environment. These spheres of influence may
overlap in some cases; the fact that they coincide may
cause dependencies reports between agents [10].
Starting from the definitions cited above, we can identify
the following agent types [11]
• The reactive agent is often described as not being
"clever" by itself. It is a very simple component that
perceives the environment and is able to act on it. Its
capacity meets mode only stimulus-action that can be
considered a form of communication.
• The cognitive agent is an agent more or less intelligent,
mainly characterized by a symbolic representation of
knowledge and mental concepts. It has a partial
representation of the environment, explicit goals, it is
capable of planning their behavior, remember his past
actions, communicate by sending messages, negotiate,
etc.
• The intentional agent or BDI (Belief, Desire and
Intention) is an intelligent agent that applies the model of
human intelligence and human perspective on the world
using mental concepts such as knowledge, beliefs,
intentions, desires, choices, commitments. Its behavior
can be provided by the award of beliefs, desires and
intentions.
• The rational agent is an agent that acts in a manner
allowing it to get the most success in achieving the tasks
they were assigned. To this end, we must have measure of
performance, if possible objective associated with a
particular task that the agent should run.
• The adaptive agent is an agent that adapts to any
changes that the environment can have. He is very
intelligent as he is able to change its objectives and its
knowledge base when they change.

International Journal of Advanced Engineering Research and Science (IJAERS) [Vol-4, Issue-8, Aug- 2017]
https://dx.doi.org/10.22161/ijaers.4.8.14 ISSN: 2349-6495(P) | 2456-1908(O)
www.ijaers.com Page | 84
• The communicative agent is an agent that is used to
communicate information to all around him. This
information can be made of his own perceptions as it may
be transmitted by other agents.
IV. EAC-ACM FUNCTIONALITIES
In our proposal, we are interested in the study of the two
main components of our system that is the Audit and
change management.
The main objective of EAC-ACM is to generate the IT
planning to meet the needs of the new politic of IT
Governance.
In the following, we will present two integrated multi-
agent systems constitutes the EAS-ACM toolkit: “MAS-
audit and Gap analysis” and “MAS change management”.
A. MAS-Audit and Gap Analysis
This System asks the users of the practices existing,
analyses the answers to questions using its knowledge
base, and calculates the difference in order to generate the
recommendations. Our system displays the
recommendations and asks the user to define the urgency
and the impact of each action.
Our expert system is based on the data collection and
analysis of the environment by the agents.
Its knowledge base contains the best practices
communicated by the processing layer as well as the rules
of calculation of the mathematical formulas.
Data collection is carried out by agents by means of
questionnaires, and the answers are recorded, and
analyzed by the expert system of our architecture.
The answers to the questionnaire should give a view on
the priority of the actions to be implemented in the
company. A. MAS-Audit and Gap Analysis consists of
four agents which are:
• Agent collect: After receiving all the activities and
processes from layer communication, this agent has the
role of displaying a survey to the user in order to gather
the current practices.
• Agent Analyst: This agent analyzes the difference
between the existing and the practices recommended by
the communication layer in order to discover changes.
• Agent recommendations: At this level, this agent
generates the list of new activities and updates the
knowledge base of expert system.
After this all, this agent is responsible of gathering the
impact and urgency of every action to be realized within
the framework of the change brought by the new
governance
• Agent Priority Calculation: This agent allows the
calculation of the priority of each action with this
formula:
Priority = Impact * urgency
B. MAS-Change Management
The major goal of this agent system is to generate the IT
action plan in order to deploy the new practices.
To achieve this goal, we must calculate the position and
duration of each action; for it, we propose two formulas
mathematics which use the value of the priority to be able
to calculate the date of starting up of the implementation
of the activity as well as the duration estimated to deploy
all the actions.
The MAS-Change Management of our platform is
responsible of producing a report concerning the IT action
plan.
Agents involved in the running of this agent system are:
• Agent Classification: based on the priority of each
action, this agent allows displaying activities with a
chronological order.
• Agent Position Calculation: this calculates the value of
position of every action with formula:
Position = 1/Priority * Q
Q represents a number from 1 to 3
Q is equal to 1 if the activity is concerning an
organization
Q is equal to 2 if the activity is relative to a tool
Q is equal for three if the activity is relative in the
implementation of a new management method.
• Agent Duration Calculation: in order to draw the road
map, this calculates the value of duration of
implementation of every action according to the following
rule base
An activity bound to an Organizational change must be
realized in a deadline 1 month
An activity bound to a Technological change must be
realized in a deadline 2 months
An activity bound to a change Methodology must be
realized in a deadline 3 months
The duration is represented by a bar which defined the
week number or month to realize the recommendations.
• Agent Treatment: The calculation of position and
duration for the set of the activities will allow us to take
out with a detailed action plan of the implementation of
the best practices of IT governance; this allows the
generation and display the road map.
• Agent Report: it produces a report containing an
overview of the road map in question, this will give a
visibility onto the projects with short, average and long
term relative to the implementation of best practice IT
within a department of Information systems.
V. CONCLUSION
In this paper, we proposed the use of a Multi-Agent
System in a multi-system architecture to discover and set
up the new practices brought by IT framework. The
objective is to generate the road map for change

International Journal of Advanced Engineering Research and Science (IJAERS) [Vol-4, Issue-8, Aug- 2017]
https://dx.doi.org/10.22161/ijaers.4.8.14 ISSN: 2349-6495(P) | 2456-1908(O)
www.ijaers.com Page | 85
management in order to deploy new IT governance
processes. The use of a knowledge base containing all the
information about the company IT framework is required
to explore the changes and thus be able to propose an IT
action plan for the implementation of new practices.
Future work involves developing a simulation of our
prototype based on multi-agent systems.
REFERENCES
[1]. Gary Hardy Using IT governance and COBIT to
deliver value with IT and respond to legal, regulatory
and compliance challenges information security
technical report11 2006 page 55-61
[2]. M.N. Kooper, R. Maes, E.E.O. Roos Lindgreen “On
the governance of information: Introducing a new
concept of governance to support the management of
information”. International Journal of Information
Management: The Journal for Information Professio-
Professionals, Volume 31 Issue 3, June, 2011, Pages
195-200
[3]. Gill, S., & Purushottam, U. (2008). Integrated GRC-is
your organization ready to move. Governance, risk
and compliance. SETLabs Briefings, 37-46.
[4]. Frigo, M. L., & Anderson, R. J. (2009). A strategic
framework for governance, risk, and compliance.
Strategic Finance, 90(8), 20.
[5]. Tarantino, A. (2008). Governance, risk, and
compliance handbook: technology, finance,
environmental, and international guidance and best
practices. John Wiley & Sons.
[6]. Wagner, S., & Dittmar, L. (2006). The unexpected
benefits of Sarbanes-Oxley. Harvard business review,
84(4), 133.
[7]. Aziza Chakir, Meriyem Chergui, Soukaina
Elhasnaoui, Hicham MEDROMI, Adil Sayouti,
Intelligent Plateform to Select The Best IT-GRC
Framework For Treatment The Needs Of Stakeholders
(International Journal of Applied Engineering
Research ISSN 0973-4562 Volume 11, Number 12
(2016) pp 7829-7835)
[8]. Dennis Ritchi (1996), artificial Intelligent, Tata
McGraw-Hill, New Delhi.
[9]. M. Wooldridge, Intelligent Agents, Multi agent
systems, In The MIT Press, “A modern Approach to
Distributed Artificial Intelligence”, (England
Massachutts London: MIT Press Cambridge, 1995, p.
27-78)
[10]. M. Wooldridge, An Introduction to Multi-Agent
Systems, Wiley & Sons, 2000.
[11]. S. Maalal, M. Addou, “A practical application of a
method of designing multi-agent systems based on the
AUML language and the MDA approach”,
Proceedings of the Fourth Workshop on Information
Technologies and Communication WOTIC‟11,
Casablanca, Morocco, p.104, 2011.

International Journal of Advanced Engineering Research and Science (IJAERS) [Vol-4, Issue-8, Aug- 2017]
https://dx.doi.org/10.22161/ijaers.4.8.15 ISSN: 2349-6495(P) | 2456-1908(O)
www.ijaers.com Page | 86
Potential of Egg shell powder as replacement of
Lime in soil stabilization Anoop S P1, Hizana Beegom1, Jwoleena P Johnson1, Midhula J1, Tharis Muhammed T
N1, Prasanth S2
1Under graduate students in Civil Engineering, UKF College of Engineering & Technology, Kollam, Kerala, India
2Assistant Professor in Civil Engineering, UKF College of Engineering, Kollam, Kerala, India
Abstract— This paper presents a study on the properties
of soil stabilized by using lime and egg shell powder.
Tests were conducted to assess the potential of egg shell
powder in replacing lime, which can make the overall
stabilization process economical and eco-friendly. Results
obtained show that all the treated mixes gave much better
strength than untreated soil. Egg shell powder was
introduced in quantities of 0.5%, 1%, 1.5% and 2% of the
weight of soil. Tests were conducted replacing up to 50%
of the lime used for stabilization. It was observed that
25% replacement of lime by egg shell powder gave better
strength properties and can be adopted for practical
purposes.
Keywords— Lime, Soil stabilization, Egg shell,
improvement, Geotechnical, replacement
I. INTRODUCTION
Improvement of soil properties is necessary in the modern
scenario as soils with the required properties are not
readily available for construction activities. There have
been a lot of issues reported when structures were
constructed on weak and soft soils like problems of shear
failure, excessive settlement, differential settlement etc.
The alternatives left with us are making the soil at site
suitable for the expected load by improving its properties
or adopting a deep foundation. Adoption of deep
foundation is not at all an economically viable solution.
Hence improvement of soil properties and in-situ
treatment of soil are gaining importance these days. Soil
stabilization is an economically feasible solution to one of
the major construction problems. Researchers all over the
world have studied various materials which can be used in
conjunction with soil to improve soil properties. (Basha,
2005) studied the stabilization of soil with Rice husk ash
and cement. (Brooks, 2009) conducted stabilization
studies on stabilization using fly ash and rice husk ash.
(Kamon, 1991 ) conducted researches on stabilization of
soil using lime and industrial wastes. (Paul, 2014)
conducted studies on soil stabilization using egg shell
powder and quarry dust. (Anoop S P, 2017) conducted
studies on improving soil using lime and elephant dung
strips. Of all the various studies conducted around the
world, the most commonly used and effective stabilizer
was found to be lime. Lime is a not an industrial waste or
a by-product, the manufacture of lime requires heating in
the order of 750° C, which contribute to the fact that
stabilization of large areas of soil with lime alone will
increase the cost required for stabilization. In this study
an attempt is made to replace lime with egg shell powder
and to find out the extent up to which lime can be
replaced by egg shell powder without compromising on
the strength.
Egg shell powder is an ideal material to replace lime in
the stabilization process due to its similar chemical
composition. The chief ingredient in egg shell powder is
calcium carbonate as in the case of lime. Egg shells are
disposed from hotels, restaurants etc in huge quantities
and they are currently facing disposal problems. Use of
egg shell powder in soil stabilization reduces the disposal
problems associated with egg shell generations.
Moreover, powdering of egg shell can be done easily. Egg
shell powder generation does not involve generation of
CO2 as in the case of lime where heating is done up to
750°C. Hence use of egg shell powder in soil stabilization
will make the overall stabilization process economical,
sustainable and eco-friendly.
II. MATERIALS AND MIXES
The materials used for this study consist of Soil, Lime
and Egg shell powder. Soft clayey soil from Chathanoor
area of Kollam district in Kerala was used for the study.
Lime was purchased from the local markets and Egg
shells were collected from hotels and restaurants in
Parippally. The egg shells, thus collected were crushed
and made into powder form. This was then sieved through
75 micron IS sieve so as to bring it to the size range of
fine grained soil. The egg shell powder used for the study
is shown in Fig 1

International Journal of Advanced Engineering Research and Science (IJAERS) [Vol-4, Issue-8, Aug- 2017]
https://dx.doi.org/10.22161/ijaers.4.8.15 ISSN: 2349-6495(P) | 2456-1908(O)
www.ijaers.com Page | 87
Fig.1: Egg shell powder
The materials mentioned above were mixed in various
proportions for studying its effect on the soil stabilization
process. First of all, the untreated soil was tested and its
strength was obtained to understand whether there is need
for stabilization. To this untreated soil mix, optimum lime
content calculated as per ASTM D 6276 standards was
added. The optimum lime content was found to be 4% of
the weight of soil. Then egg shell powder was introduced
as a replacement to lime in the stabilization process. The
proportions of lime and egg shell powder were varied
keeping the total replacement amount a constant. The
various mixes used in this study are mentioned in table 1.
Table.1: Mixes used in this study
Mix designation Details
C Untreated soil
C + 4L Clay + 4% weight of soil replaced by
lime
C+3.5L+0.5ESP
Clay + 3.5% lime replacement and
0.5% weight replaced by egg shell
powder
C+3L+1 ESP Clay + 3% lime replacement and 1%
weight replaced by egg shell powder
C+2.5L+1.5ESP
Clay + 2.5% lime replacement and
1.5% weight replaced by egg shell
powder
C+2L+2 ESP Clay + 2% lime replacement and 2%
weight replaced by egg shell powder
III. TESTS CONDUCTED
Experimental tests were conducted on untreated soil as
well on lime and egg shell powder modified mixes in
order to study the effect of addition of egg shell powder.
The various tests conducted were atterberg limits,
compaction and unconfined compression test. All these
tests were carried out as per IS 2720 standards.
IV. RESULTS AND DISCUSSIONS
The soil mixes mentioned above were tested and the
results obtained are summarized in table 2. Unconfined
compressive strength of in situ soil was found to be only
0.45 kg/cm2 which indicate the necessity for soil
stabilization. When the soil was mixed with optimum
lime content, there was a drastic change in the strength of
soil sample. The strength almost doubled upon
introduction of lime.
Table.2: Results of experimental tests on untreated and
modified soil mixes
Sample
Liqu
id
limit
(%)
Plasti
c
limit
(%)
OM
C
(%)
γd
(g/cc
)
Mean
UCC
(kg/c
m2)
Untreated soil 24 11 18 1.76 0.45
C+ 4L 30 12.41 20 1.8 0.88
C+3.5L+0.5ESP 33 12.71 20 1.83 0.85
C+3L+1ESP 34 13.08 22 1.87 0.92
C+2.5L+1.5ESP 35 13.1 22 1.77 0.81
C+2L+2ESP 35 13.01 22 1.77 0.68
There were not much variations in the atterberg limits of
the soil sample on addition of egg shell powder. Egg shell
powder was not found to alter the flow and consistency
behavior of the soil sample. The variation of atterberg
limits with the addition of egg shell powder is shown
graphically in Fig 2.
Fig.2: Variation of atterberg limits with Egg shell powder
Compaction tests showed an increase in the dry density
upto 25% replacement of lime by egg shell powder.
Above 25% replacement of lime by egg shell powder, dry
density started to decrease. Egg shell powder is not that
compatible a material as lime and hence when added in
large quantities to replace lime, soil properties could not
be improved. The variations in dry density on the addition
of egg shell powder to lime modified mix is shown in Fig
3.
0
5
10
15
20
25
30
35
40
0 1 2 3
Att
erb
erg
lim
its
(%)
Egg shell powder (%)
Liquid limit
Plastic limit

International Journal of Advanced Engineering Research and Science (IJAERS) [Vol-4, Issue-8, Aug- 2017]
https://dx.doi.org/10.22161/ijaers.4.8.15 ISSN: 2349-6495(P) | 2456-1908(O)
www.ijaers.com Page | 88
Fig.3: Variation of dry density of soil on adding egg shell
powder
All the soil mixes were tested for their unconfined
compressive strength. The results show that there is an
increase in unconfined compressive strength upto 25%
replacement of lime by egg shell powder. Above this
level of replacement, the strength was found to decline.
Addition of small dosages of egg shell powder improved
the strength of lime modified mix. As the replacement
percentage increased, the strength started to fall as shown
in figure 4. This may be due to the fact that egg shell
powder is not an efficient material as lime and increasing
egg shell powder will reduce the total lime content.
Addition of small dosages of egg shell powder increased
the rate of pozzolanic reaction occurring and hence gave a
higher strength. All the modified mixes gave much better
strength than untreated soil as shown in Fig 4.
Fig.4: Variation of UCC with Egg shell powder
V. CONCLUSIONS
Egg shell powder was found to be a very good alternative
in replacing the costly lime used for soil stabilization. The
use of egg shell powder in soil stabilization will reduce
the disposal problems of egg shell as well as make the
stabilization process economically and sustainable. From
the study, it was seen that egg shell powder can replace
upto 25% of the lime used for stabilization process. This
replacement also increased the strength of treated soil.
Thus it can be concluded that egg shell powder is an ideal
material to replace lime in the soil stabilization process
owing to its similar chemical compositions and properties
REFERENCES
[1] Amu, O. O., A. B. Fajobi, and B. O. Oke. "Effect of
eggshell powder on the stabilizing potential of lime
on an expansive clay soil." Journal of Applied
Sciences 5.8 (2005): 1474-1478.
[2] Bowles, Joseph E. "Physical and geotechnical
properties of soils." (1979).
[3] Petry, Thomas M., and Dallas N. Little. "Review of
stabilization of clays and expansive soils in
pavements and lightly loaded structures—history,
practice, and future." Journal of Materials in Civil
Engineering 14.6 (2002): 447-460.
1
1.2
1.4
1.6
1.8
2
0 1 2 3
Max
Dry
De
nsi
ty (
g/cc
)
Egg shell powder (%)
0
0.2
0.4
0.6
0.8
1
0 1 2 3
un
con
fin
ed
co
mp
ress
ive
st
ren
gth
Egg shell powder (%)
Modifiedsoil
Untreatedsoil