Embed Size (px)
Citation preview

UNITED STATES
SECURITIES AND EXCHANGE COMMISSION Washington, D.C. 20549
________________
FORM 10-K (Mark One)
X ANNUAL REPORT PURSUANT TO SECTION 13 OR 15(d) OF THE SECURITIES EXCHANGE ACT OF 1934 For the fiscal year ended December 31, 2005 OR TRANSITION REPORT PURSUANT TO SECTION 13 OR 15(d) OF THE SECURITIES EXCHANGE ACT OF 1934
For the transition period from __________to
Commission File Number 001-14273
CORE LABORATORIES N.V. (Exact name of Registrant as specified in its charter)
The Netherlands Not Applicable
(State or other jurisdiction of incorporation or organization) (I.R.S. Employer Identification No.)
Herengracht 424 1017 BZ Amsterdam
The Netherlands Not Applicable (Address of principal executive offices) (Zip Code)
Registrant's telephone number, including area code: (31-20) 420-3191
Securities registered pursuant to Section 12(b) of the Act: Title of each class Name of exchange on which registered
Common Shares, EUR 0.01 Par Value Per Share New York Stock Exchange
Securities registered pursuant to Section 12(g) of the Act: None
Indicate by check mark if the registrant is a well-known seasoned issuer, as defined in Rule 405 of the Securities Act. Yes _X_ No __
Indicate by check mark if the registrant is not required to file reports pursuant to Section 13 or Section 15(d) of the Exchange Act. Yes __ No _X_
Indicate by check mark whether the registrant (1) has filed all reports required to be filed by Section 13 or 15(d) of the Securities Exchange Act of 1934 during the preceding 12 months (or for such shorter period that the registrant was required to file such reports), and (2) as been subject to such filing requirements for the past 90 days. Yes __Xh __ No ___
Indicate by check mark if disclosure of delinquent filers pursuant to Item 405 of Regulation S-K is not contained herein, and will not be
contained, to the best of Registrant's knowledge, in definitive proxy or information statements incorporated by reference in Part III of this Form 10-K or any amendment to this Form 10-K. _X_
Indicate by check mark whether the registrant is a large accelerated filer, an accelerated filer, or a non-accelerated filer. See definition of "accelerated filer and large accelerated filer" in Rule 12b-2 of the Exchange Act. Large accelerated filer _X_ Accelerated filer ___ Non-accelerated filer ___
Indicate by check mark whether the registrant is a shell company (as defined in Rule 12b-2 of the Exchange Act). Yes __ No _X_
As of June 30, 2005, the number of common shares outstanding was 26,097,353. At that date, the aggregate market value of common shares held by non-affiliates of the registrant was approximately $670,082,171.
As of February 22, 2006, the number of common shares outstanding was 25,833,963.
DOCUMENTS INCORPORATED BY REFERENCE DOCUMENT Part of 10-K
1. Proxy statement to be filed pursuant to Regulation 14A under the Securities Exchange Act of 1934 with respect to the 2006 annual meeting of shareholders
PART III

CORE LABORATORIES N.V. FORM 10-K FOR THE FISCAL YEAR ENDED DECEMBER 31, 2005
TABLE OF CONTENTS
Page PART I Item 1. Business 1 Item 1A. Risk Factors 5 Item 1B. Unresolved Staff Comments 8 Item 2. Properties 8 Item 3. Legal Proceedings 8 Item 4. Submission of Matters to a Vote of Security Holders 8 PART II Item 5. Market for Registrant's Common Equity, Related Stockholder Matters and Issuer Purchases of Equity Securities 9 Item 6. Selected Financial Data 10 Item 7. Management's Discussion and Analysis of Financial Condition and Results of Operation 11 Item 7A. Quantitative and Qualitative Disclosures about Market Risk 24 Item 8. Financial Statements and Supplementary Data 24 Item 9. Changes in and Disagreements with Accountants on Accounting and Financial Disclosure 25 Item 9A. Controls and Procedures 25 Item 9B. Other Information 25 PART III Item 10. Directors and Executive Officers of the Registrant 25 Item 11. Executive Compensation 25 Item 12. Security Ownership of Certain Beneficial Owners and Management and Related Stockholder Matters 25 Item 13. Certain Relationships and Related Transactions 25 Item 14. Principal Accountant Fees and Services 25 PART IV Item 15. Exhibits, Financial Statement Schedules 26
i

1
PART I ITEM 1. BUSINESS General
Core Laboratories N.V. ("Core Laboratories", "we", "our" or "us") is a Netherlands limited liability company. We were established in 1936 and are one of the world's leading providers of proprietary and patented reservoir description, production enhancement and reservoir management services to the oil and gas industry. These services are directed toward enabling our clients to improve reservoir performance and increase oil and gas recovery from their producing fields. We have over 70 offices in more than 50 countries and have approximately 4,500 employees. Business Strategy
Our business strategy is to provide advanced technologies that improve reservoir performance by (i) continuing the development of proprietary technologies through client-driven research and development, (ii) expanding the services and products offered throughout our global network of offices and (iii) acquiring complementary technologies that add key technologies or market presence and enhance existing products and services.
Development of New Technologies, Services and Products
We conduct research and development to meet the needs of our clients who are continually seeking new services and technologies to lower their costs of finding, developing and producing oil and gas. While the aggregate number of wells being drilled per year has fluctuated relative to market conditions, oil and gas producers have, on a proportional basis, increased expenditures on technology services to improve their understanding of the reservoir and increase production of oil and gas from their producing fields. We intend to continue concentrating our efforts on services and technologies that improve reservoir performance and increase oil and gas recovery.
International Expansion of Services and Products
Another component of our business strategy is to broaden the spectrum of services and products offered to our clients on a global basis. We intend to continue using our worldwide network of offices to offer many of our new services and products that have been developed internally or obtained through acquisitions. This allows us to enhance our revenues through efficient utilization of our worldwide network.
Acquisitions
We continually review potential acquisitions to add key services and technologies, enhance market presence or complement existing businesses. In November 2004, we acquired certain assets from Authentix, Inc. to expand our specialty tracer technology for our Production Enhancement business. The assets acquired consisted of licenses and intellectual property and certain analytical equipment. In addition, we entered into a four-year service agreement whereby Authentix, Inc. will continue to enhance the technology we have purchased and provide fluid sample analysis.
More information relating to our acquisitions is included in Note 3 of the Notes to Consolidated Financial Statements in this
Annual Report on Form 10-K. Operations
We derive our revenues from services and product sales to clients primarily in the oil and gas industry.
Our reservoir optimization services and technologies are interrelated and are organized into three complementary segments. Disclosure relating to the results of these business segments is included in Note 15 of the Notes to Consolidated Financial Statements.
- Reservoir Description: Encompasses the characterization of petroleum reservoir rock, fluid and gas samples. We provide analytical and field services to characterize properties of crude oil and petroleum products to the oil and gas industry.
- Production Enhancement: Includes products and services relating to reservoir well completions, perforations, stimulations
and production. We provide integrated services to evaluate the effectiveness of well completions and to develop solutions aimed at increasing the effectiveness of enhanced oil recovery projects.

2
- Reservoir Management: Combines and integrates information from reservoir description and production enhancement services to increase production and improve recovery of oil and gas from our clients' reservoirs.
We offer our services worldwide through our global network of offices. Services accounted for approximately 76%, 77% and 79%
of our revenues from operations for the years ended December 31, 2005, 2004 and 2003, respectively.
We manufacture products primarily in four facilities for distribution on a global basis. Product sales, generated principally in our Production Enhancement segment, accounted for approximately 24%, 23% and 21% of our revenues from operations for the years ended December 31, 2005, 2004 and 2003, respectively.
Our product sales backlog at December 31, 2005 was approximately $8.8 million compared to $8.6 million at December 31, 2004. Sources of raw material are readily available and our sales backlog should be completed in 2006.
Reservoir Description
Commercial oil and gas fields consist of porous and permeable reservoir rocks that contain natural gas, crude oil and water. Due to the density differences of the fluids, natural gas typically caps the field and overlies an oil layer, which overlies the water. We provide services that characterize the porous reservoir rock and all three reservoir fluids. Services relating to these fluids include determining quality and measuring quantity of the fluids and their derived products. This includes determining the value of different crude oil and natural gases by analyzing the individual components of complex hydrocarbons. These data sets are used by oil companies to determine the most efficient method by which to recover, process and refine these hydrocarbons to produce the maximum value added to crude oil and natural gas.
We analyze samples of reservoir rocks for their porosity, which determines reservoir storage capacity, and for their permeability, which defines the ability of the fluids to flow through the rock. These measurements are used to determine how much oil and gas are present in a reservoir and the rates at which the oil and gas can be produced. We also use our proprietary services and technologies to correlate the reservoir description data to wireline logs and seismic data by determining the different acoustic velocities of reservoir rocks containing water, oil and natural gas. These measurements are used in conjunction with our reservoir management services to develop programs to produce more oil and gas from the reservoir.
Production Enhancement
We produce data to describe a reservoir system that is used to enhance oil and gas production so that it will exceed the average oilfield recovery factor, which is approximately 40%. Two production enhancement methods commonly used are (i) hydraulic fracturing of the reservoir rock to improve flow and (ii) flooding a reservoir with water, carbon dioxide, nitrogen or hydrocarbon gases to force more oil and gas to the wellbore. Many oilfields today are hydraulically fractured and flooded to maximize oil and gas recovery. Our services and technologies play a key role in the success of both methods.
The hydraulic fracturing of a producing formation is achieved by pumping a proppant material in a gel slurry into the reservoir zone at extremely high pressures. This forces fractures to open in the rock and "props" or holds the fractures open so that reservoir fluids can flow to the production wellbore. Our data on rock type and strength are critical for determining the proper design of the hydraulic fracturing job. In addition, our testing indicates whether the gel slurry is compatible with the reservoir fluids so that damage does not occur to the porous rock network. Our proprietary and patented ZeroWash™ tracer technology is used to determine that the proppant material was properly placed in the fracture to ensure effective flow and increased recovery.
SpectraChemSM is another proprietary and patented technology developed for optimizing hydraulic fracture performance. SpectraChemSM is used to aid operators in determining the efficiency of the fracture fluids used. SpectraChemSM tracers allow operators to evaluate the quantity of fracture fluid that returns to the wellbore during the clean-up period after a hydraulic fracturing event. This technology also allows our clients to evaluate load recovery, gas breakthrough, fluid leakoff and breaker efficiency, all of which are important factors for optimizing natural gas production after the formation is hydraulically fractured.
We conduct dynamic flow tests of the reservoir fluids through the reservoir rock, at actual reservoir pressure and temperature, to realistically simulate the actual flooding of a producing zone. We use patented technologies, such as our Saturation Monitoring by the Attenuation of X-rays (SMAX™), to help design the enhanced recovery project. After a field flood is initiated, we are often involved in monitoring the progress of the flood to ensure the maximum amount of incremental production is being achieved through the use of our SpectraFloodTM technology which we developed to optimize sweep efficiency during field floods.
Our unique completion monitoring system, Completion Profiler™, helps to determine flow rates from reservoir zones after they have been hydraulically fractured. This provides our clients with production information without additional well time.
3
Our PackScan™ patented technology, which is used as a tool to monitor the wellbore in an unconsolidated reservoir, has contributed to our revenue growth. PackScan™ measures the density changes in the area around the tool and is designed to observe the changes within the wellbore to verify the completeness of the gravel pack protection of the wellbore.
In addition to our many patented reservoir analysis technologies, we have established ourselves as a global leader in the manufacture and distribution of high-performance perforating products. Our unique understanding of complex reservoirs supports our ability to supply perforating systems engineered to maximize well productivity by reducing, eliminating and overcoming formation damage caused during the completion of oil and gas wells. Our "systems" approach to the perforating of an oil or gas well has resulted in numerous patented products. Our HERO™ perforating system is quickly becoming an industry leader in enhancing reservoir performance.
We have an experienced Technical Services team to support clients through our global network of offices for the everyday use of our perforating systems and the rapid introduction of new products. Our personnel are capable of providing client training and on-site assistance. Our patented X-SPAN™ casing patch is supported by the Technical Services operating group and used to seal certain reservoir zones from the producing wellbore.
Reservoir Management
Reservoir description and production enhancement information, when applied across an entire oilfield, is used to maximize daily production and the ultimate total recovery from the reservoir. We are involved in numerous large-scale reservoir management projects, applying proprietary and state-of-the-art techniques from the earliest phases of a field development program until the last economic barrel of oil is recovered.
These projects are of increasing importance to oil companies as the incremental barrel is often the lowest cost and most profitable barrel in the reservoir. Producing incremental barrels increases our clients' cash flows which we believe will result in additional capital expenditures by our clients, and ultimately further opportunities for us. Marketing and Sales
We market and sell our services and products through a combination of print advertising, technical seminars, trade shows and sales representatives. Direct sales and marketing are carried out by our sales force, technical experts and operating managers, as well as by sales representatives and distributors in various markets where we do not have offices. Research and Development
The market for our products and services is characterized by changing technology and frequent product introduction. As a result, our success is dependent upon our ability to develop or acquire new products and services on a cost-effective basis and to introduce them into the marketplace in a timely manner. Many of our acquisitions have allowed us to obtain the benefits of the acquired company's research and development projects without the significant costs that would have been incurred if we had attempted to develop the products and services ourselves. Research and development expenditures are charged to expense as incurred. We intend to continue committing substantial financial resources and effort to the development and acquisition of new products and services. Over the years, we have made a number of technological advances, including the development of key technologies utilized in our operations. Substantially all of the new technologies have resulted from requests and guidance from our clients, particularly major oil companies. While we have acquired many of our new technologies, we incur expenses relating to our ongoing research and development program. Patents and Trademarks
We believe our patents, trademarks and other intellectual property rights are an important factor in maintaining our technological advantage, although no one patent is considered essential to our success. Typically, we will seek to protect our intellectual technology in all jurisdictions where we believe the cost of such protection is warranted. While we have patented some of our key technologies, we do not patent all of our proprietary technology even where regarded as patentable. In addition to patents, in many instances we protect our trade secrets through confidentiality agreements with our employees and our clients. International Operations
We operate facilities in more than 50 countries. Our non-U.S. operations accounted for approximately 56%, 58% and 60% of our revenues from operations during the years ended December 31, 2005, 2004 and 2003, respectively. Some of our revenues in the U.S. are generated by projects on oilfields which are located outside the U.S.

4
While we are subject to fluctuations and changes in currency exchange rates relating to our international operations, we attempt to limit our exposure to foreign currency fluctuations by limiting the amount in which our foreign contracts are denominated in a currency other than the U.S. dollar to an amount generally equal to the expenses expected to be incurred in such foreign currency. However, the ultimate decision as to the proportion of the foreign currency component within a contract usually resides with our clients. Consequently, we are not able to always match our currency exposure. We have not historically engaged in and are not currently engaged in any significant hedging or currency trading transactions designed to compensate for adverse currency fluctuations. The following graphs summarize our revenues by geographic region for the years ended December 31, 2005, 2004 and 2003:
Geographic Breakdown of Revenues
2005
United States44%
Europe/Africa/
ME23%
Canada13%
Latin & South America
7%
Former Soviet Union
5%
Asia Pacific8%
2004
United States42%
Europe/Africa/
ME24%
Canada13%
Latin & South America
8%
Former Soviet Union
6%
Asia Pacific7%
2003
Asia Pacific7%
Former Soviet Union
6%
Latin & South
America11%
Canada11%
Europe/Africa/ME
25%
United States40%
Environmental Regulation
We are subject to stringent governmental laws and regulations pertaining to protection of the environment and the manner in which chemicals and gases used in our analytical and manufacturing processes are handled and disposed. Consistent with our quality assurance and control principles, we have established proactive environmental policies for the management of these chemicals and gases as well as the handling and disposal of wastes resulting from our operations. Compliance with these laws and regulations may require the acquisition of permits for regulated activities, capital expenditures to limit or prevent emissions and discharges, and special precautions for disposal of certain wastes. Failure to comply with these laws and regulations may result in the assessment of administrative, civil and criminal penalties, the imposition of remedial obligations, and even the issuance of injunctive relief. Changes in environmental laws and regulations occur frequently, and any changes that result in more stringent and costly waste handling, disposal or cleanup requirements have the potential to have a material adverse effect on our operations and financial position.
Our analytical and manufacturing processes involve the handling and use of numerous chemicals and gases as well as the generation of wastes. Spills or releases of these chemicals, gases, and wastes at our facilities or at offsite locations where they are transported for disposal could subject us to environmental liability, which may be strict, joint and several, for the costs of cleaning up chemicals and wastes released into the environment and for damages to natural resources, and it is not uncommon for neighboring landowners and other third parties to file claims for personal injury and property damage allegedly caused by such spills or releases. Under such laws, we could be required to remove previously disposed wastes, remediate environmental contamination, and undertake measures to prevent future contamination. While we believe that we are in substantial compliance with current applicable environmental laws and regulations and that continued compliance with existing requirements will not have a material adverse impact on us, we cannot give any assurance that this trend will continue in the future. Competition
The businesses in which we engage are competitive. Some of our competitors are divisions or subsidiaries of companies that are larger and have greater financial and other resources than we have. While no one company competes with us in all of our product and service lines, we face competition in these lines, primarily from independent regional companies. We compete in different product and service lines to various degrees on the basis of price, technical performance, availability, quality and technical support. Our ability to compete successfully depends on elements both within and outside of our control, including successful and timely development of new products and services, performance and quality, client service, pricing, industry trends and general economic trends.

5
Reliance on the Oil and Gas Industry
Our business and operations are substantially dependent upon the condition of the global oil and gas industry. Future downturns in the oil and gas industry, or in the oilfield services business, may have a material adverse effect on our financial position, results of operations or cash flows.
The oil and gas industry is highly cyclical and has been subject to significant economic downturns at various times as a result of numerous factors affecting the supply of and demand for oil and natural gas, including the level of capital expenditures of the oil and gas industry; the level of drilling activity; the level of production activity; market prices of oil and gas; economic conditions existing in the world; interest rates and the cost of capital; environmental regulations; tax policies; political requirements of national governments; coordination by the Organization of Petroleum Exporting Countries ("OPEC"); cost of producing oil and natural gas; and technological advances. Employees
As of December 31, 2005, we had approximately 4,500 employees. We do not have any material collective bargaining agreements and consider relations with our employees to be good. Web Site Access to Our Periodic SEC Reports
Our primary internet address is http://www.corelab.com. We file or furnish Quarterly Reports on Form 10-Q and Annual Reports on Form 10-K, as well as Current Reports on Form 8-K with the U.S. Securities and Exchange Commission ("SEC"). These reports are available free of charge through our web site as soon as reasonably practicable after they are filed or furnished electronically with the SEC. We may from time to time provide important disclosures to investors by posting them in the investor relations section of our web site, as allowed by SEC rules.
Materials we file with the SEC may be read and copied at the SEC's Public Reference Room at 100F Street, N.E., Washington, D.C. 20549. Information on the operation of the Public Reference Room may be obtained by calling the SEC at 1-800-SEC-0330. The SEC also maintains an internet website at http://www.sec.gov that contains reports, proxy and information statements, and other information regarding our company that we file electronically with the SEC. ITEM 1A. RISK FACTORS
Our forward-looking statements are based on assumptions that we believe to be reasonable but that may not prove to be accurate. All of our forward-looking information is, therefore, subject to risks and uncertainties that could cause actual results to differ materially from the results expected. Although it is not possible to identify all factors, these risks and uncertainties include the risk factors discussed below.
Future downturns in the oil and gas industry, or in the oilfield services business, may have a material adverse effect on our
financial condition or results of operations. The oil and gas industry is highly cyclical and demand for the majority of our oilfield products and services is substantially
dependent on the level of expenditures by the oil and gas industry for the exploration, development and production of crude oil and natural gas reserves, which are sensitive to oil and natural gas prices and generally dependent on the industry's view of future oil and gas prices. There are numerous factors affecting the supply of and demand for our products and services, which include:
- market prices of oil and gas and expectations about future prices; - cost of producing oil and natural gas; - the level of drilling and production activity; - mergers, consolidations and downsizing among our clients; - coordination by OPEC; - the impact of commodity prices on the expenditure levels of our clients; - financial condition of our client base and their ability to fund capital expenditures;

6
- adverse weather conditions; - civil unrest in oil producing countries; - level of consumption of oil, gas and petrochemicals by consumers; and - availability of services and materials for our clients to grow their capital expenditures.
The oil and gas industry has historically experienced periodic downturns, which have been characterized by diminished demand
for our oilfield products and services and downward pressure on the prices we charge. A significant downturn in the oil and gas industry could result in a reduction in demand for oilfield services and could harm our operating results.
We depend on the results of our international operations, which expose us to risks inherent in doing business abroad. We conduct our business in over 50 countries; business outside of the United States accounts for approximately 56%, 58% and
60% of our consolidated revenues during the years ended December 31, 2005, 2004 and 2003, respectively. Our operations are subject to the various laws and regulations of those respective countries as well as various risks peculiar to each country, which may include:
- global economic conditions; - political actions and requirements of national governments including trade restrictions, embargoes and expropriations of
assets; - potential adjustments to tax liabilities in multiple jurisdictions; - civil unrest; - acts of terrorism; - fluctuations and changes in currency exchange rates; - the impact of inflation; and - current conditions in Venezuela, Nigeria, Iran and Iraq.
Historically, economic downturn and political events have resulted in lower demand for our products and services in certain
markets. The ongoing conflict in Iraq and the potential for activity from terrorist groups that the U.S. government has cautioned against have further heightened our exposure to international risks. The global economy is highly influenced by public confidence in the geopolitical environment and the situation in the Middle East continues to be highly fluid; therefore, we expect to experience heightened international risks.
As a result of the political and financial instability in Venezuela, the Bolivar ("VEB") declined in value relative to other currencies.
In February 2003, the Venezuelan government imposed an exchange rate of 1,596 VEB per U.S. dollar ("USD"). In February 2004, the government devalued the VEB by 20% to 1,915 VEB per USD. Effective March 2, 2005, the Venezuelan government devalued the VEB by an additional 12% to 2,147 VEB per USD resulting in a foreign exchange loss of approximately $0.3 million in the first quarter of 2005. At December 31, 2005, our net monetary assets denominated in VEB in Venezuela were $2.1 million. We continue to monitor our operations and financial position in this region.
If we are not able to develop or acquire new products or our products become technologically obsolete, our results of operations
may be adversely affected. The market for our products and services is characterized by changing technology and frequent product introduction. As a result,
our success is dependent upon our ability to develop or acquire new products and services on a cost-effective basis and to introduce them into the marketplace in a timely manner. While we intend to continue committing substantial financial resources and effort to the development of new products and services, we may not be able to successfully differentiate our products and services from those of our competitors. Our clients may not consider our proposed products and services to be of value to them; or if the proposed products and services are of a competitive nature, our clients may not view them as superior to our competitors' products and services. In

7
addition, we may not be able to adapt to evolving markets and technologies, develop new products, or achieve and maintain technological advantages.
If we are unable to continue developing competitive products in a timely manner in response to changes in technology, our
businesses and operating results may be materially and adversely affected. In addition, continuing development of new products inherently carries the risk of inventory obsolescence with respect to our older products.
If we are unable to obtain patents, licenses and other intellectual property rights covering our products and services, our
operating results may be adversely affected. Our success depends in part on our ability to obtain patents, licenses and other intellectual property rights covering our products
and services. To that end, we have obtained certain patents and intend to continue to seek patents on some of our inventions and services. While we have patented some of our key technologies, we do not patent all of our proprietary technology, even when regarded as patentable. The process of seeking patent protection can be long and expensive. There can be no assurance that patents will be issued from currently pending or future applications or that, if patents are issued, they will be of sufficient scope or strength to provide meaningful protection or any commercial advantage to us. In addition, effective copyright and trade secret protection may be unavailable or limited in certain countries. Litigation, which could demand financial and management resources, may be necessary to enforce our patents or other intellectual property rights. Also, there can be no assurance that we can obtain licenses or other rights to necessary intellectual property on acceptable terms.
There are risks related to our acquisition strategy. If we are unable to successfully integrate and manage businesses that we
have acquired and any businesses acquired in the future, our results of operations and financial condition could be adversely affected.
One of our key business strategies is to acquire technologies, operations and assets that are complementary to our existing
businesses. There are financial, operational and legal risks inherent in any acquisition strategy, including:
- increased financial leverage; - increased interest expense; and - difficulties involved in combining disparate company cultures and facilities.
The success of any completed acquisition will depend on our ability to integrate effectively the acquired business into our existing
operations. The process of integrating acquired businesses may involve unforeseen difficulties and may require a disproportionate amount of our managerial and financial resources. In addition, possible future acquisitions may be larger and for purchase prices significantly higher than those paid for recent and pending acquisitions. No assurance can be given that we will be able to continue to identify additional suitable acquisition opportunities, negotiate acceptable terms, obtain financing for acquisitions on acceptable terms or successfully acquire identified targets. Our failure to achieve consolidation savings, to incorporate the acquired businesses and assets into our existing operations successfully or to minimize any unforeseen operational difficulties could have a material adverse effect on our financial condition and results of operation.
We are subject to a variety of environmental laws and regulations, which may result in increased costs to our business.
We are subject to a variety of governmental regulations relating to the use, storage, discharge and disposal of chemicals and gases used in our analytical and manufacturing processes. Environmental claims or the failure to comply with present or future environmental laws and regulations could result in the assessment of damages or imposition of fines against us or the suspension or cessation of operations. New regulations could require us to acquire costly equipment or to incur other significant expenses. If we fail to control the use, or adequately restrict the discharge of, hazardous substances, we could be subject to future material liabilities. In addition, public interest in the protection of the environment has increased dramatically in recent years. We anticipate that the trend of more expansive and stricter environmental laws and regulations will continue, the occurrence of which may require us to increase our capital expenditures or could result in increased operating expenses.
Because we are a Netherlands company, it may be difficult for you to sue our supervisory directors or us and it may not be possible to obtain or enforce judgments against us.
Although we are a Netherlands company, our assets are located in a variety of countries. In addition, not all members of our supervisory board of directors are residents of the same countries as other supervisory directors. As a result, it may not be possible for you to effect service of process within certain countries upon our supervisory directors, or to enforce against our supervisory directors or us judgments of courts of certain countries predicated upon civil liabilities under a country's federal securities laws. Because there
8
is no treaty between certain countries and The Netherlands providing for the reciprocal recognition and enforcement of judgments, some countries' judgments are not automatically enforceable in The Netherlands or in the United States, where the principal market for our shares is located. In addition, there is doubt as to whether a court in one country would impose civil liability on us or on the members of our supervisory board of directors in an original action brought against us or our supervisory directors in a court of competent jurisdiction in another country and predicated solely upon the federal securities laws of that other country. ITEM 1B. UNRESOLVED STAFF COMMENTS None. ITEM 2. PROPERTIES
Currently, we have over 70 offices (totaling approximately 1.8 million square feet of space) in more than 50 countries. In these locations, we lease approximately 1.3 million square feet of space and own approximately 0.5 million square feet of space. We serve our worldwide clients through five Advanced Technology Centers ("ATCs") that are located in Houston, Texas; Calgary, Canada; Jakarta, Indonesia; Rotterdam, The Netherlands; and Aberdeen, Scotland. The ATCs provide support for our 50 regional specialty centers located throughout the global energy producing provinces. In addition, we have manufacturing facilities located in Godley, Texas, and Red Deer, Alberta, Canada, which are included in our Production Enhancement business segment. Our facilities are adequately utilized for current operations. However, expansion into new facilities may be required to accommodate future growth. ITEM 3. LEGAL PROCEEDINGS
From time to time, we may be subject to legal proceedings and claims that arise in the ordinary course of business.
In May 2005, the United States District Court for the Southern District of Texas dismissed with prejudice the class action lawsuit that had been filed in April 2003 against us and certain of our officers in the United States District Court for the Southern District of New York, alleging, among other things, that the defendants violated Sections 10(b) and 20(a) of the Securities Exchange Act of 1934 by making false and misleading statements about the Company's financial results for 2001 and 2002 In connection with the dismissal, no monies were paid to the plaintiff, but the parties agreed to be responsible for their own costs and legal fees.
During the second quarter of 2005, we received a request from the SEC to provide a sworn statement and certain information regarding our participation in the United Nations Oil-for-Food Program. The SEC has issued a formal order of investigation that names more than a dozen companies involved in the Oil-for-Food Program, including Core Laboratories. We have informed the SEC that we do have a subsidiary that had contracts with the United Nations to monitor the quantity of oil sold by the Government of Iraq under the Oil-for-Food Program, but neither we nor our subsidiaries purchased oil under the Oil-for-Food Program or sold any goods destined for Iraq under the Oil-for-Food Program. ITEM 4. SUBMISSION OF MATTERS TO A VOTE OF SECURITY HOLDERS None.

9
PART II ITEM 5. MARKET FOR REGISTRANT'S COMMON EQUITY, RELATED STOCKHOLDER MATTERS AND ISSUER PURCHASES OF EQUITY SECURITIES Price Range of Common Shares
Our common shares trade on the New York Stock Exchange ("NYSE") under the symbol "CLB". The range of high and low sales prices per share of the common shares as reported by the NYSE are set in the following table for the periods indicated.
High Low 2005
First Quarter $ 27.34 $ 21.59 Second Quarter 27.15 23.12 Third Quarter 33.06 26.91 Fourth Quarter 39.25 27.94
2004 First Quarter $ 21.58 $ 15.86 Second Quarter 24.50 19.80 Third Quarter 24.59 19.83 Fourth Quarter 25.50 21.95
On February 22, 2006, the closing price, as quoted by the NYSE, was $45.60 per share and there were 25,833,963 common shares
issued and outstanding held by approximately 220 record holders and approximately 8,200 beneficial holders. These amounts exclude shares held by us as treasury shares.
See "Item 12. Security Ownership of Certain Beneficial Owners and Management" for discussion of equity compensation plans. Dividend Policy
We have never paid dividends on our common shares and currently have no plans to pay dividends on the common shares. We expect that we will retain all available earnings generated by our operations for the development and growth of our business. Any future determination as to the payment of dividends will be made at the discretion of our Supervisory Board and will depend upon our operating results, financial condition, capital requirements, income tax treatment of payments, general business conditions and such other factors as they deem relevant. Because we are a holding company that conducts substantially all of our operations through subsidiaries, our ability to pay cash dividends on the common shares is also dependent upon the ability of our subsidiaries to pay cash dividends or otherwise distribute or advance funds to us and on the terms and conditions of our existing and future credit arrangements. See "Liquidity and Capital Resources" included in "Item 7. Management's Discussion and Analysis of Financial Condition and Results of Operations." Share Repurchases in the Fourth Quarter of 2005
The following table provides information about purchases of equity securities that are registered by us pursuant to Section 12 of the Exchange Act during the three months ended December 31, 2005:
PERIOD
TOTAL NUMBER OF
SHARES PURCHASED
AVERAGE PRICE
PAID PER SHARE
October 1-31, 2005 341,000 $ 29.86 November 1-30, 2005 (1) 84,590 $ 34.09 December 1-31, 2005 (2) 39,500 $ 33.28 Total 465,090 $ 30.92 (1) Contains 12,190 shares valued at $0.4 million, or $32.26 per share, acquired
pursuant to the terms of a compensation plan, in settlement by the participants of personal tax burdens that may result from the issuance of common shares under this arrangement in November 2005.
(2) Contains 30,000 shares valued at $1.0 million, or $32.26 per share, acquired
pursuant to the terms of a compensation plan, in settlement by the participants of personal tax burdens that may result from the issuance of common shares under this arrangement in December 2005.

10
Under Dutch law and our articles of association, and subject to certain Dutch statutory provisions, we may repurchase up to 10%
of our issued share capital in open market purchases. In connection with our initial public offering in September 1995, our shareholders authorized our Management Board to make such repurchases for a period of 18 months. At each annual meeting subsequent to 1995, our shareholders have renewed that authorization. At our annual meeting on April 15, 2005, our shareholders approved a further extension of this authority for an additional 18-month period from the date of the annual meeting until October 15, 2006 and authorized the repurchase of an additional 2,617,435 shares. The number of shares that may yet be purchased under the announced program is 1,594,420 at December 31, 2005.
ITEM 6. SELECTED FINANCIAL DATA
The selected consolidated financial information contained below is derived from our Consolidated Financial Statements and should be read in conjunction with "Management's Discussion and Analysis of Financial Condition and Results of Operations" and our audited Consolidated Financial Statements.
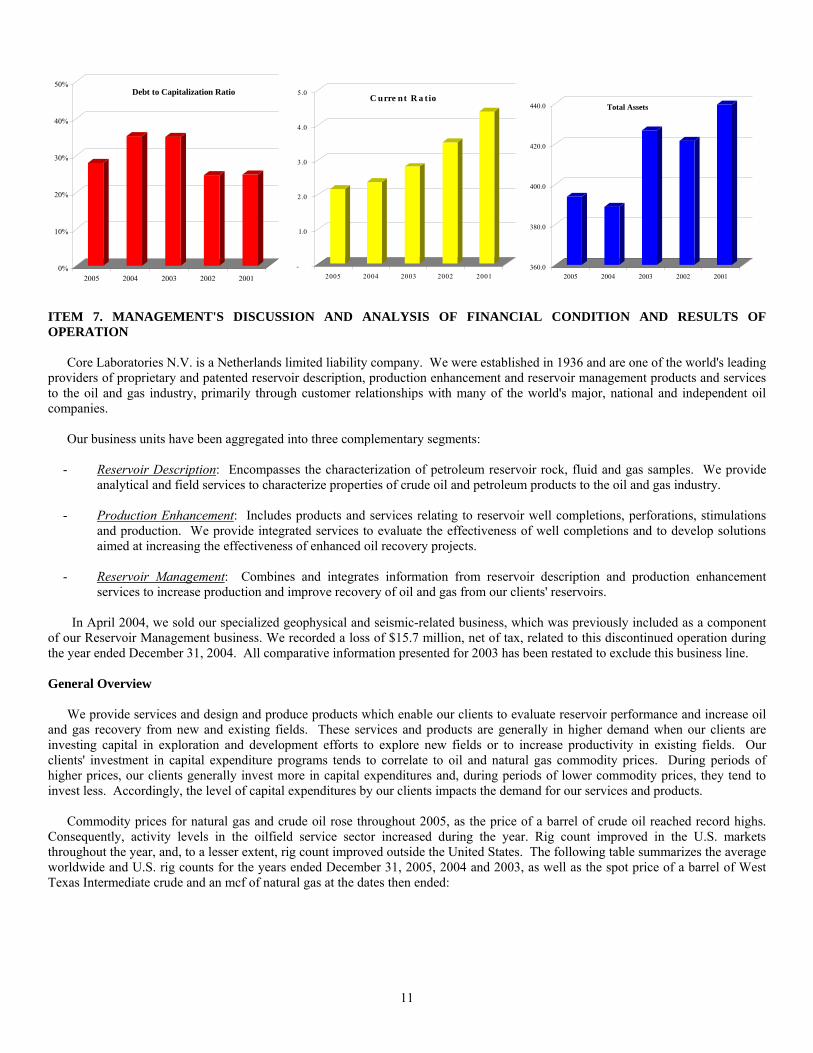
The Consolidated Financial Statements for the fiscal year 2001 were audited by Arthur Andersen LLP ("Andersen"), a firm that ceased operations. A copy of the report previously issued by Andersen on our financial statements as of December 31, 2001 and for each of the three years in the period ended December 31, 2001 has been included in earlier filings on Form 10-K. Such audit report has not been reissued by Andersen. Years Ended December 31, 2005 20041 20031 2002 20012 (in thousands, except per share and other data) Financial Statement Data:3 Revenues $ 483,467 $ 427,427 $ 373,167 $ 330,768 $ 337,170Income from continuing operations 31,717 28,022 20,792 9,594 23,442Income before cumulative effect of change in accounting principle 31,211 12,290 18,700 6,478 20,632Net income (loss) 31,211 12,290 18,700 (9,062) 20,632Working capital 83,689 84,233 105,079 125,589 139,342Total assets 394,601 388,797 426,731 421,601 439,500Long-term debt and capital lease obligations, including current maturities 88,648 113,200 128,101 89,180 95,627Shareholders' equity 214,257 190,296 220,412 258,146 275,606Earnings Per Share Information: Income from continuing operations: Basic $ 1.22 $ 1.04 $ 0.69 $ 0.29 $ 0.71 Diluted $ 1.13 $ 0.97 $ 0.67 $ 0.29 $ 0.68Net income (loss): Basic $ 1.20 $ 0.46 $ 0.62 $ (0.27) $ 0.62 Diluted $ 1.11 $ 0.43 $ 0.60 $ (0.27) $ 0.60Weighted average common shares outstanding: Basic 26,038 26,896 30,209 33,174 33,075 Diluted 28,008 28,761 31,179 33,174 34,272Other Data: Current Ratio4 2.2:1 2.3:1 2.7:1 3.5:1 4.5:1D ebt to Capitalization Ratio5 28% 35% 35% 25% 25%________________ 1) See Note 3 of the Notes to Consolidated Financial Statements for a discussion of acquisitions made in 2004 and 2003. 2) In 2001, we recorded restructuring, write-offs and other charges of $8,725,000. 3 All periods have been restated to reflect discontinued operations sold in 2004. See Note 2 of the Notes to the Consolidated Financial Statements. 4) Current ratio is calculated as follows: current assets divided by current liabilities. 5) Debt to capitalization ratio is calculated as follows: debt divided by the sum of cash, debt and shareholders' equity.
11
0%
10%
20%
30%
40%
50%
2005 2004 2003 2002 2001
Debt to Capitalization Ratio
-
1.0
2.0
3.0
4.0
5.0
2005 2004 2003 2002 2001
C urre nt R a tio
360.0
380.0
400.0
420.0
440.0
2005 2004 2003 2002 2001
Total Assets
ITEM 7. MANAGEMENT'S DISCUSSION AND ANALYSIS OF FINANCIAL CONDITION AND RESULTS OF OPERATION
Core Laboratories N.V. is a Netherlands limited liability company. We were established in 1936 and are one of the world's leading providers of proprietary and patented reservoir description, production enhancement and reservoir management products and services to the oil and gas industry, primarily through customer relationships with many of the world's major, national and independent oil companies.
Our business units have been aggregated into three complementary segments:
- Reservoir Description: Encompasses the characterization of petroleum reservoir rock, fluid and gas samples. We provide analytical and field services to characterize properties of crude oil and petroleum products to the oil and gas industry.
- Production Enhancement: Includes products and services relating to reservoir well completions, perforations, stimulations
and production. We provide integrated services to evaluate the effectiveness of well completions and to develop solutions aimed at increasing the effectiveness of enhanced oil recovery projects.
- Reservoir Management: Combines and integrates information from reservoir description and production enhancement
services to increase production and improve recovery of oil and gas from our clients' reservoirs.
In April 2004, we sold our specialized geophysical and seismic-related business, which was previously included as a component of our Reservoir Management business. We recorded a loss of $15.7 million, net of tax, related to this discontinued operation during the year ended December 31, 2004. All comparative information presented for 2003 has been restated to exclude this business line. General Overview
We provide services and design and produce products which enable our clients to evaluate reservoir performance and increase oil and gas recovery from new and existing fields. These services and products are generally in higher demand when our clients are investing capital in exploration and development efforts to explore new fields or to increase productivity in existing fields. Our clients' investment in capital expenditure programs tends to correlate to oil and natural gas commodity prices. During periods of higher prices, our clients generally invest more in capital expenditures and, during periods of lower commodity prices, they tend to invest less. Accordingly, the level of capital expenditures by our clients impacts the demand for our services and products.
Commodity prices for natural gas and crude oil rose throughout 2005, as the price of a barrel of crude oil reached record highs. Consequently, activity levels in the oilfield service sector increased during the year. Rig count improved in the U.S. markets throughout the year, and, to a lesser extent, rig count improved outside the United States. The following table summarizes the average worldwide and U.S. rig counts for the years ended December 31, 2005, 2004 and 2003, as well as the spot price of a barrel of West Texas Intermediate crude and an mcf of natural gas at the dates then ended:

12
Rig Count/Oil and Gas Prices
As of December 31, 2005 2004 2003 Worldwide Rig Count1 2,993 2,555 2,334U.S. Rig Count1 1,470 1,246 1,114Crude Oil Price per Barrel (WTI Spot)2 $ 59.82 $ 43.36 $ 32.58Natural Gas Price Spot Average per MCF2 $ 9.52 $ 6.15 $ 6.14 1) Baker Hughes Incorporated - World-wide averages 2) Obtained from Lehman Brothers - The Original Oil Service Monthly for 2003 and the U.S. Department of Energy
Henry Hub spot price at 12/30/05 & 12/30/04 per the New York Mercantile Exchange
The price of natural gas in 2005 continued to increase throughout the year when compared with the price in 2004 and 2003. These higher prices were attributable to various market factors including a general decline in natural gas production in recent years, evidenced by lower production rates from maturing fields and combined with steeper decline curves from newly discovered fields. General oil and gas market conditions in the United States improved and contributed to general price increases for oil and gas products in 2005. Oil prices per barrel of unrefined crude continued to climb to record levels due to increased demand and concerns over global supply.
Our activity levels continue to increase as oilfield activities by our customers increase. These higher activity levels resulted in increased revenues for us in 2005, primarily for our Reservoir Description and Production Enhancement business segments.
Given these higher revenues, in conjunction with efforts to contain our cost structure, we were able to generate operating income that was 31% greater than the prior year. Our Reservoir Description segment showed improvement in almost all operations, primarily as a result of the spending levels of our clients aimed at characterizing and analyzing reservoirs, crude oil, and derivative products. Operating income from our Production Enhancement segment was up 56% over the prior year as more wells in North America were drilled and stimulated than in the prior year, which provides greater opportunity for our clients to use our products and services. In April 2004, we sold our seismic business, which had become less profitable in recent years, due to increased competition which contributed to lower margins. The results for our Reservoir Management group improved over prior year due primarily to a re-focus of our efforts on integrated solutions for clients. Outlook
We continue our efforts to expand our market presence by opening strategic facilities and realizing synergies within our business lines. As companies in the oil and gas industry consolidate, some of our clients have used, and may continue to use, their global presence and market influence to seek economies of scale and pricing concessions. We believe our market presence provides us a unique opportunity to service these customers.
We have established internal earnings targets that are based on current market conditions. Based on discussions with our clients and our view of the industry, we anticipate that in 2006 North American spending by our clients will increase approximately 10%, in line with increases in 2005. We believe that the activity levels outside of North America will increase compared to 2005 levels as we expand our international revenue base through direct product sales and technical services. However, attaining our internal targets is dependent on sustained North American and international oilfield activity.
We expect to meet ongoing working capital needs, capital expenditure requirements and funding of our share repurchase program from a combination of cash on hand, cash flow from operating activities and available borrowings under our revolving credit facility. Critical Accounting Policies and Estimates
Our financial statements are prepared in conformity with generally accepted accounting principles ("GAAP") in the U.S. and require us to make estimates and assumptions during their preparation which requires judgment. Our accounting policies and procedures are explained in Note 2 to the Notes to the Consolidated Financial Statements contained elsewhere in this Annual Report on Form 10-K. The following transaction types require significant judgment and, therefore, are considered critical accounting policies as of December 31, 2005:

13
Revenue Recognition
Revenues are recognized as services are completed or as product title is transferred. All advance client payments are classified as unearned revenues until services are performed or product title is transferred. We recognize revenue when we determine that the following criteria are met: (i) persuasive evidence of an arrangement exists; (ii) delivery has occurred or services have been rendered; (iii) the fee is fixed or determinable; and (iv) collectibility is reasonably assured. Revenues from long-term contracts are recorded as services are rendered in proportion to the work performed. All known or anticipated losses on contracts are provided for currently. Training and consulting service revenues are recognized as the services are performed. We apply the provisions of the Emerging Issues Task Force ("EITF") 00-21, "Revenue Arrangements with Multiple Deliverables" to account for certain contracts with identifiable units of accounting. Allowance for Doubtful Accounts
We perform ongoing credit evaluations of our clients and monitor collections and payments in order to maintain a provision for estimated uncollectible accounts based on our historical collection experience and our current aging of client receivables outstanding in addition to clients' representations and our understanding of the economic environment in which our clients operate. Based on our review, we establish or adjust allowances for specific customers and the accounts receivable as a whole. Our allowance for doubtful accounts at December 31, 2005 was $4.5 million compared to $6.1 million at December 31, 2004. Long-Lived Assets, Intangibles and Goodwill
Property, plant and equipment are carried at cost. Major renewals and improvements are capitalized and depreciated over the respective asset's remaining useful life. Maintenance and repair costs are charged to expense as incurred. When long-lived assets are sold or retired, the remaining costs and related accumulated depreciation are removed from the accounts and any resulting gain or loss is included in income.
Property, plant and equipment held and used is reviewed for impairment whenever events or changes in circumstances indicate the carrying amounts may not be recoverable over the remaining service life. Indicators of possible impairment include extended periods of idle use or significant declines in activity levels in regions where specific assets or groups of assets are located.
Provisions for asset impairment are charged to income when the net book value of the assets, or carrying value, is determined to be unrecoverable and the carrying value exceeds the fair value of the assets, calculated as the present value of estimated future cash flows. The calculation of fair value requires estimates of future cash flows, and such estimates can change based on market conditions, technological advances in the industry or changes in regulations governing the industry. We did not record impairment charges related to our long-lived assets held for use in continuing operations during the years ended December 31, 2005, 2004 or 2003.
We review our goodwill, the excess of the purchase price over the fair value of net assets acquired in business combinations, at least annually for impairment or more frequently if an event occurs which may indicate impairment during the year. We evaluated assets with indefinite lives, including goodwill and certain intangible assets, for impairment comparing the fair value of our reportable segments to their net carrying value as of the balance sheet date, after excluding inter-company transactions and allocating corporate assets to the reportable segments. Fair value is determined by projecting future cash flows on a discounted basis. If the carrying value of the reportable segment exceeds the fair value determined, impairment may be indicated. If impairment is indicated, the fair value of the reportable segment would be determined. Any remaining goodwill would be deemed impaired and charged to income during the period the impairment was identified. Any subsequent impairment loss could result in a material adverse effect upon our financial position and results of operations. Inventory Valuation Allowances
Our valuation reserve for inventory is based on historical regional sales trends, and various other assumptions and judgments including future demand for this inventory. Should these assumptions and judgments not occur, our valuation allowance would be adjusted to reflect actual results. Our industry is subject to technological change and new product development that could result in obsolete inventory. Our valuation reserve for inventory at December 31, 2005 was $2.4 million compared to $1.8 million at December 31, 2004. If we over or underestimate demand for inventory, it could result in a material adverse effect upon our financial position and results of operations. Income Taxes
Our income tax expense includes income taxes of The Netherlands, the U.S. and other foreign countries as well as local, state and provincial income taxes. We recognize deferred tax assets or liabilities for the differences between the financial statement carrying amount and tax basis of assets and liabilities using enacted tax rates in effect for the years in which the asset is recovered or the

14
liability is settled. Any valuation allowance recorded is based on estimates and assumptions of taxable income into the future and a determination is made of the magnitude of deferred tax assets which are more likely than not to be realized. Valuation allowances of our net deferred tax assets aggregated $13.8 million and $14.2 million at December 31, 2005 and 2004, respectively. If these estimates and related assumptions change in the future, we may be required to record additional valuation allowances against our deferred tax assets and our effective tax rate may increase which could result in a material adverse effect on our financial position, results of operations and cash flows. Stock Options
We apply Accounting Principles Board ("APB") Opinion No. 25, "Accounting for Stock Issued to Employees", which does not require us to recognize compensation costs related to employee stock options which have exercise prices at least equal to the market value of the stock on the date of grant. Accordingly, we have not recognized compensation cost for our stock options issued. We have, however, included option shares in the diluted shares outstanding calculation that is used to determine diluted earnings per share. We are not required to account for our stock-based compensation plans using the fair value recognition provision of SFAS No. 123, "Accounting for Stock-Based Compensation." Accounting for our stock based compensation plans using the fair value recognition provisions of SFAS No. 123 could negatively impact our financial position and results of operations, as it requires that the fair value of stock options issued be estimated using pricing models that have an inherent degree of uncertainty, and that expense be recognized over the vesting period of the related options. In December 2004, the FASB issued SFAS No. 123R, "Share-Based Payment," which revises SFAS No. 123 and supersedes ABP Opinion No. 25. This statement will require us to measure the cost of employee services received in exchange for an award of equity instruments based on the grant-date fair value of the award, with limited exceptions. We have adopted this statement as of January 1, 2006. As of December 31, 2005, we have no unvested stock options. Accordingly, the adoption of SFAS No. 123R had minimal impact on our financial statements. Estimates
The preparation of financial statements in accordance with U.S. GAAP requires us to make certain estimates and assumptions that affect the reported amounts of assets and liabilities and disclosure of assets and liabilities at the date of the financial statements and the reported amounts of revenues and expenses during the reporting period. We evaluate our estimates on an ongoing basis and determine the adequacy of our estimates based on our historical experience and various other assumptions that we believe are reasonable under the circumstances. By nature, these judgments are subject to an inherent degree of uncertainty. We consider an accounting estimate to be critical if it is highly subjective and if changes in the estimate under different assumptions would result in a material impact on our financial condition and results of operations. The following table summarizes key estimates and assumptions used to prepare our Consolidated Financial Statements for the years ended December 31, 2005, 2004 and 2003.
Account Nature of Estimates Required Assumptions Used Allowance for doubtful accounts We evaluate whether client receivables are
collectible. See "Allowance for Doubtful Accounts."
Inventory reserves We forecast client demand, considering changes in technology which could result in obsolescence.
See "Inventory Valuation Allowances."
Depreciation and amortization We estimate the useful lives and salvage values of our assets.
Useful lives assigned reflect our best estimate based on historical data of the respective asset's useful life and salvage value. These assets could become impaired if our operating plans or business environment changes.
Pensions and other postretirement benefits
We utilize an actuary to determine the value of the projected benefit obligation under a Dutch pension plan. This valuation requires various estimates and assumptions concerning mortality, future pay increases and discount rate used to value our obligations. In addition, we recognize net periodic benefit cost based upon these estimates.
The actuarial assumptions used are based upon professional judgment and historical experience, including trends in mortality rates, and credit market rates (discount rate).
15
Stock-based compensation We evaluate the probability that certain of our stock-based plans will meet targets established within the respective agreements and result in the vesting of such awards.
See "Stock-Based Compensation." Comparisons to either our stock price, a return on our stock price compared to certain stock indices or a return on equity calculation.
Income taxes We estimate the likelihood of the recoverability of our deferred tax assets (particularly, net operating loss carry-forwards).
See "Income Taxes." We examine our historical and projected operating results, review the eligible carry-forward period and tax planning opportunities and consider other relevant information. Changes in tax laws for the jurisdictions in which we operate could significantly impact our estimates.
Long-lived assets, intangibles and goodwill
We evaluate the recoverability of our assets periodically, but at least annually, by examining current and projected operating results to identify any triggering events, which may indicate impairment. We compare the carrying value of the assets to a projection of fair value, utilizing judgment as to the identification of reporting units, the allocation of corporate assets amongst reporting units and the determination of the appropriate discount rate.
See "Long-Lived Assets, Intangibles and Goodwill." Our impairment analysis is subjective and includes estimates based on assumptions regarding future growth rates and operating expenses.
Off-Balance Sheet Arrangements
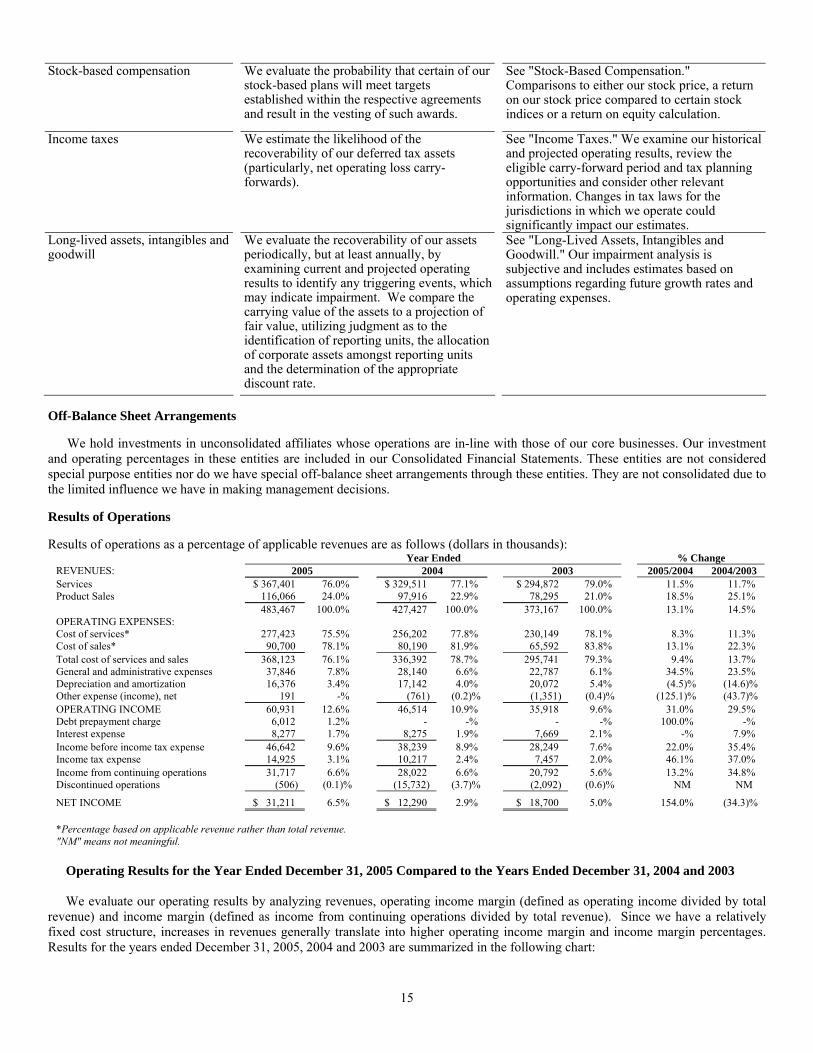
We hold investments in unconsolidated affiliates whose operations are in-line with those of our core businesses. Our investment and operating percentages in these entities are included in our Consolidated Financial Statements. These entities are not considered special purpose entities nor do we have special off-balance sheet arrangements through these entities. They are not consolidated due to the limited influence we have in making management decisions. Results of Operations Results of operations as a percentage of applicable revenues are as follows (dollars in thousands):
Year Ended % Change REVENUES: 2005 2004 2003 2005/2004 2004/2003 Services $ 367,401 76.0% $ 329,511 77.1% $ 294,872 79.0% 11.5% 11.7% Product Sales 116,066 24.0% 97,916 22.9% 78,295 21.0% 18.5% 25.1% 483,467 100.0% 427,427 100.0% 373,167 100.0% 13.1% 14.5% OPERATING EXPENSES: Cost of services* 277,423 75.5% 256,202 77.8% 230,149 78.1% 8.3% 11.3% Cost of sales* 90,700 78.1% 80,190 81.9% 65,592 83.8% 13.1% 22.3% Total cost of services and sales 368,123 76.1% 336,392 78.7% 295,741 79.3% 9.4% 13.7% General and administrative expenses 37,846 7.8% 28,140 6.6% 22,787 6.1% 34.5% 23.5% Depreciation and amortization 16,376 3.4% 17,142 4.0% 20,072 5.4% (4.5)% (14.6)% Other expense (income), net 191 -% (761) (0.2)% (1,351) (0.4)% (125.1)% (43.7)% OPERATING INCOME 60,931 12.6% 46,514 10.9% 35,918 9.6% 31.0% 29.5% Debt prepayment charge 6,012 1.2% - -% - -% 100.0% -% Interest expense 8,277 1.7% 8,275 1.9% 7,669 2.1% -% 7.9% Income before income tax expense 46,642 9.6% 38,239 8.9% 28,249 7.6% 22.0% 35.4% Income tax expense 14,925 3.1% 10,217 2.4% 7,457 2.0% 46.1% 37.0% Income from continuing operations 31,717 6.6% 28,022 6.6% 20,792 5.6% 13.2% 34.8% Discontinued operations (506) (0.1)% (15,732) (3.7)% (2,092) (0.6)% NM NM
NET INCOME $ 31,211 6.5% $ 12,290 2.9% $ 18,700 5.0% 154.0% (34.3)%
*Percentage based on applicable revenue rather than total revenue. "NM" means not meaningful.
Operating Results for the Year Ended December 31, 2005 Compared to the Years Ended December 31, 2004 and 2003
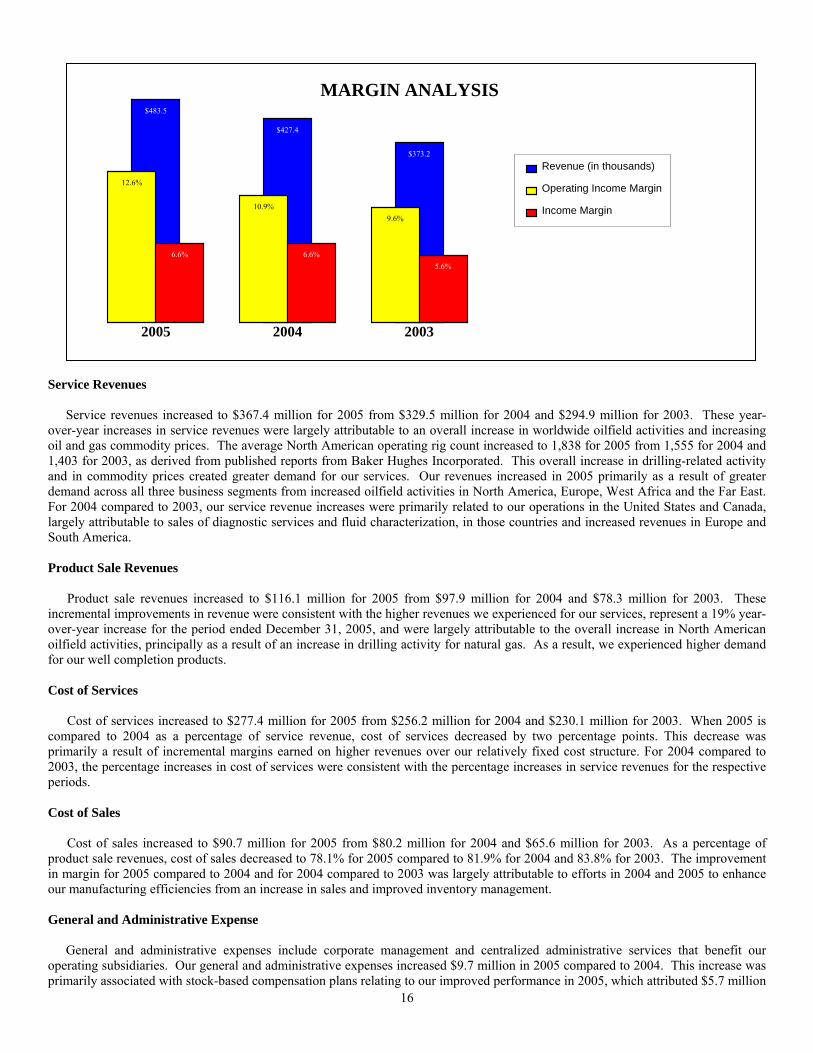
We evaluate our operating results by analyzing revenues, operating income margin (defined as operating income divided by total
revenue) and income margin (defined as income from continuing operations divided by total revenue). Since we have a relatively fixed cost structure, increases in revenues generally translate into higher operating income margin and income margin percentages. Results for the years ended December 31, 2005, 2004 and 2003 are summarized in the following chart:
16
$483.5
$427.4
$373.2
12.6%
10.9% 9.6%
6.6% 6.6% 5.6%
2005 2004 2003
Revenue (in thousands)
Operating Income Margin
Income Margin
MARGIN ANALYSIS
Service Revenues
Service revenues increased to $367.4 million for 2005 from $329.5 million for 2004 and $294.9 million for 2003. These year-over-year increases in service revenues were largely attributable to an overall increase in worldwide oilfield activities and increasing oil and gas commodity prices. The average North American operating rig count increased to 1,838 for 2005 from 1,555 for 2004 and 1,403 for 2003, as derived from published reports from Baker Hughes Incorporated. This overall increase in drilling-related activity and in commodity prices created greater demand for our services. Our revenues increased in 2005 primarily as a result of greater demand across all three business segments from increased oilfield activities in North America, Europe, West Africa and the Far East. For 2004 compared to 2003, our service revenue increases were primarily related to our operations in the United States and Canada, largely attributable to sales of diagnostic services and fluid characterization, in those countries and increased revenues in Europe and South America. Product Sale Revenues
Product sale revenues increased to $116.1 million for 2005 from $97.9 million for 2004 and $78.3 million for 2003. These incremental improvements in revenue were consistent with the higher revenues we experienced for our services, represent a 19% year-over-year increase for the period ended December 31, 2005, and were largely attributable to the overall increase in North American oilfield activities, principally as a result of an increase in drilling activity for natural gas. As a result, we experienced higher demand for our well completion products. Cost of Services
Cost of services increased to $277.4 million for 2005 from $256.2 million for 2004 and $230.1 million for 2003. When 2005 is compared to 2004 as a percentage of service revenue, cost of services decreased by two percentage points. This decrease was primarily a result of incremental margins earned on higher revenues over our relatively fixed cost structure. For 2004 compared to 2003, the percentage increases in cost of services were consistent with the percentage increases in service revenues for the respective periods. Cost of Sales
Cost of sales increased to $90.7 million for 2005 from $80.2 million for 2004 and $65.6 million for 2003. As a percentage of product sale revenues, cost of sales decreased to 78.1% for 2005 compared to 81.9% for 2004 and 83.8% for 2003. The improvement in margin for 2005 compared to 2004 and for 2004 compared to 2003 was largely attributable to efforts in 2004 and 2005 to enhance our manufacturing efficiencies from an increase in sales and improved inventory management. General and Administrative Expense
General and administrative expenses include corporate management and centralized administrative services that benefit our operating subsidiaries. Our general and administrative expenses increased $9.7 million in 2005 compared to 2004. This increase was primarily associated with stock-based compensation plans relating to our improved performance in 2005, which attributed $5.7 million

17
to the increase, as well as higher accounting fees of $1.0 million related to the implementation of Rule 404 of the Sarbanes-Oxley Act of 2002 and various other elements. General and administrative expenses increased $5.4 million in 2004 compared to 2003, primarily associated with stock-based compensation plans and increased outside services and consulting costs incurred to assist us with documentation and assessment of the adequacy of our internal controls over financial reporting, as required by the Sarbanes-Oxley Act of 2002. Depreciation and Amortization Expense
Depreciation and amortization expense decreased $0.8 million in 2005 compared to 2004. This decrease in depreciation and amortization expense was primarily due to a general run-off of depreciation expense associated with older assets offset by an increase in capital expenditures in 2005. Depreciation and amortization expense decreased $2.9 million in 2004 compared to 2003. This decline in depreciation and amortization expense was primarily associated with reduced capital expenditures in 2004 compared to 2003, and a general run-off of depreciation expense associated with older assets. Other Expense (Income), Net
The components of other expense (income), net, were as follows (in thousands):
Year Ended 2005 2004 2003 Minority interest $ (57) $ 1 $ 482 (Gain) loss on sale of assets (293) 550 357 Equity in (income) loss of affiliates (36) 265 (52) Foreign exchange loss (gain) 1,619 (788) (410) Interest income (402) (189) (186) Gain on involuntary sale of asset (875) - - Gain on insurance recovery (334) - - Other 569 (600) (1,542) Total other expense (income), net $ 191 $ (761) $ (1,351)
In 2003, the British government notified us that it would exercise its right of eminent domain thereby involuntarily acquiring the
property of one of our operating facilities. Prior to December 31, 2003, we received an initial payment from the British government for $0.6 million as compensation for this property. In the second quarter of 2005, we negotiated and received a final settlement which resulted in a $0.9 million gain.
During the first quarter of 2005, a building at our manufacturing plant in Godley, Texas, was damaged by fire, resulting in the loss of the building, some inventory, as well as other business equipment and supplies. In June 2005, we filed claims with our insurance carrier for reimbursement of these costs resulting in a net gain of $0.3 million. We filed a claim for business interruption costs associated with this fire during the third quarter and expect to settle these claims during 2006. No impact from the claim for the business interruption has been recorded in the results of operations as of December 31, 2005. Debt Prepayment Charge
In December 2005, we repaid our Senior Notes. In connection with the early prepayment, we incurred a prepayment penalty of $6.0 million. See "Credit Facilities and Available Future Liquidity". Interest Expense
Interest expense remained basically unchanged in 2005 compared to 2004, due to higher borrowing rates under our long-term revolving credit facility, which increased to an average of 4.4% for 2005 compared to an average of 2.95% for 2004, which was offset by a lower outstanding balance. Interest expense increased $0.6 million in 2004 compared to 2003, due to higher borrowing rates under our long-term revolving credit facility, which increased to an average of 2.95% for 2004 compared to an average of 2.81% for 2003. Income Tax Expense
Income tax expense increased $4.7 million in 2005 compared to 2004. This increase was due to an increase in income before income taxes of $8.5 million coupled with an increase in the effective tax rate for the year. The effective tax rate was 32.0% for 2005, 26.7% for 2004 and 26.4 % for 2003. The change in the tax rate is primarily a result of more earnings in relatively higher tax rate

18
jurisdictions. For 2004, income tax expense increased $2.8 million compared to 2003. This increase was primarily due to an increase in net income before income taxes of $10.0 million. Discontinued Operations
As a result of the sale of our seismic business in April 2004, we recorded a loss for discontinued operations totaling $15.7 million, net of tax. This loss included charges related to the impairment of goodwill, certain intangible assets and other long-lived assets totaling $11.2 million and a charge of $1.2 million to the provision for doubtful accounts, as well as other working capital adjustments. In 2003, results related to the discontinued operations resulted in a loss of $2.1 million. In 2005, we finalized the terms under the contract for sale of the business through a negotiated payment of $0.5 million, net of taxes. Segment Analysis
The following charts and tables summarize the operating results for our three complementary business segments.
2005 Revenues by Segment
Reservoir Management6%
Production Enhancement36%
Reservoir Description58%
2004 Revenues by Segment
Reservoir Management5%
Production Enhancement34%
Reservoir Description61%
2003 Revenues by Segment
Reservoir Management4%
Production Enhancement
31%
Reservoir Description65%
Segment Revenues
For the Years Ended December 31, (dollars in thousands) 2005 % Change 2004 % Change 2003 Reservoir Description $ 280,979 8.5% $ 258,864 8.0% $ 239,646Production Enhancement 175,894 19.6% 147,119 25.6% 117,153Reservoir Management 26,594 24.0% 21,444 31.0% 16,368 Total Revenues $ 483,467 13.1% $ 427,427 14.5% $ 373,167
Segment Operating Income (Loss)
For the Years Ended December 31,
(dollars in thousands) 2005 % Change 2004 % Change 2003 Reservoir Description $ 37,341 33.9% $ 27,877 24.5% $ 22,400Production Enhancement 30,413 56.2% 19,472 75.1% 11,122Reservoir Management 4,035 55.9% 2,588 44.5% 1,791Corporate and other1 2 (10,858) NM2 (3,423) NM2 605 Operating Income $ 60,931 31.0% $ 46,514 29.5% $ 35,918 1. "Corporate and other" represents those items that are not directly related to a particular segment. 2. "NM" means not meaningful
Segment Operating Income (Loss) Margins1
For the Years Ended December 31, 2005 2004 2003
Margin Margin Margin Reservoir Description 13.3% 10.8% 9.3% Production Enhancement 17.3% 13.2% 9.5% Reservoir Management 15.2% 12.1% 10.9% Total Company 12.6% 10.9% 9.6% 1. Calculated by dividing "Operating Income (Loss)" by "Revenue".

19
Reservoir Description
Revenues for our Reservoir Description segment increased by 8.5% in 2005 compared to 2004, and grew 8.0% in 2004 compared to 2003. These revenue increases resulted from increased oilfield activity during recent years. A significant portion of the revenues earned by this business segment are derived from core samples tested and inspection services performed for oil and gas industry clients. We experienced an increase in demand for our reservoir rock analysis as well as our fluid analysis services in North America, West Africa, Middle East and the Far East. Revenues were also positively impacted by increased demand for out fluid characterization services in Europe. For 2004 compared to 2003, we experienced higher revenues in North America, Europe and the Far East, partially offset by a revenue decline in Mexico, where several contracts expired. Revenue growth in North America was primarily attributable to increased demand for our inspection and analysis services by our clients as well as demand for core analysis throughout North America. Revenue increases in Europe and the Far East were primarily due to improved economic conditions in the sectors where our clients operate, which resulted in increased demand for our inspection and analysis services.
Operating income and operating income margin for the Reservoir Description segment increased due to continued growth of higher value-added and higher margin products which resulted in increases in margins throughout the majority of the regions with significant increases in Europe and improvements in operating results in Mexico. For 2004 compared to 2003, operating income increased primarily as a result of incremental margins earned on higher revenues over our relatively fixed cost structure. Increases in North America and Europe more than offset operating income declines in Mexico and certain regions of the former Soviet Union, where we continued to experience margin erosion due to increased competition. Production Enhancement
Revenues for our Production Enhancement business segment grew 19.6% in 2005 compared to 2004, primarily due to the introduction of new technology and to the increase in North America natural gas drilling activity in 2005 relative to 2004. With the increase in drilling activities, the demand for our well perforating and completion products and diagnostic services has also increased, the primary products and services offered by this segment. Revenues increased by 25.6% in 2004 compared to 2003, primarily due to the introduction of new technology and as a result of increased oilfield activities in North America, resulting in higher demand for our perforating gun systems and hydraulic fracture diagnostic services.
Operating income for this segment increased to $30.4 million in 2005 from $19.5 million in 2004, an increase of 56.2%. The increase in 2005 was due to increased sales of higher-margin services and products including new enhanced recovery technology, such as SpectraScan™, SpectraChem™ and our HERO™ perforating charges and gun systems, as well as improved manufacturing efficiencies. Additionally, the demand for the Company's technology in fracture diagnostics continued to increase as drilling activity increased in unconventional reservoirs. The increase in operating income margin to 13.2% in 2004 compared to 9.5% in 2003 was due primarily to manufacturing efficiencies which contributed to incremental margins earned on revenues over our relatively fixed cost structure and a more favorable product mix. The product mix in 2004 was impacted by increased sales of higher-margin services and products including new enhanced recovery technology, such as SpectraFlood™, and our HERO™ perforating charge and gun systems. Reservoir Management
Revenues for our Reservoir Management segment increased by 24.0% in 2005 compared to 2004 and 31.0% in 2004 compared to 2003. The continued increase was due to higher revenue for multi-client reservoir studies, especially studies pertaining to unconventional gas reservoirs, and increased international demand for our reservoir monitoring systems. Significant studies in 2005 were Reservoir Characterization and Production Properties of Gas Shales and Geological, Petrophysical, and Geomechanical Properties of Tight Gas Sands and in 2004 they included A Regional Study of the Reservoir Lithologies from Fields and Basins in Libya, as well as Reservoir Quality, Reservoir Quality Prediction and Seal Rock Evaluation Deep Shelf Gulf of Mexico and several other proprietary studies.
Operating income for this segment increased 55.9% in 2005 compared to 2004 primarily due to incremental margins earned from the continued expansion of the multi-client reservoir study sales in the U.S. and expansion of studies being performed off the coast of Africa. Operating income for this segment increased in 2004 compared to 2003 primarily due to an increase in revenues from our integrated multi-disciplinary studies, and participation of our clients in those projects.

20
Liquidity and Capital Resources General
We have historically financed our activities through cash on hand, cash flows from operations, bank credit facilities, equity financing and the issuance of debt. Cash flow from operating activities provides the primary source of funds to finance operating needs, capital expenditures and our share repurchase program. If necessary, we supplement this cash flow with borrowings under bank credit facilities to finance some capital expenditures and business acquisitions. As we are a Netherlands holding company, we conduct substantially all of our operations through subsidiaries. Our cash flow is largely dependent upon the ability of our subsidiaries to pay cash dividends or otherwise distribute or advance funds to us.
We utilize the non-GAAP financial measure of free cash flow to evaluate our cash flows and results of operations. Free cash flow is defined as net cash provided by operating activities from continuing operations before the impact of the debt prepayment charge, less capital expenditures. Management believes that free cash flow provides useful information to investors as it represents the cash, in excess of capital expenditures, available to operate the business and fund non-discretionary obligations. The following table reconciles this non-GAAP financial measure to the most directly comparable measure calculated and presented in accordance with U.S. GAAP for the years ended December 31, 2005, 2004 and 2003:
Year Ended December 31, 2005 2004 2003 Free Cash Flow Calculation (unaudited, in thousands) Net cash provided by operating activities-
continuing operations $ 74,778 $ 54,499 $ 58,928 Add: debt prepayment charge 6,012 - - Less: capital expenditures (19,095) (10,888) (18,377)
Free cash flow $ 61,695 $ 43,611 $ 40,551 The increase in free cash flow in 2005 compared to 2004 and 2003 was due to an increase in net income adjusted for stock-based
compensation, as discussed below. Working capital was $83.7 million and $84.2 million at December 31, 2005 and 2004, respectively.
Cash Flows
The following table summarizes cash flows from continuing operations for the years ended December 31, 2005, 2004 and 2003:
Year Ended December 31, 2005 2004 2003 Continuing Operations (unaudited, in thousands) Cash provided by/(used in):
Operating activities $ 74,778 $ 54,499 $ 58,928 Investing activities (16,364) (12,008) (29,158) Financing activities (60,701) (60,327) (21,100)
Net change in cash and cash equivalents $ (2,287) $ (17,836) $ 8,670
The increase in cash flow from operating activities in 2005 compared to 2004 was primarily due to an increase in net income adjusted for stock-based compensation, debt refinancing charges, and the increase in long term deferred revenue from the sale of analysis studies. For 2004 compared to 2003, the decrease in cash flows from operations was primarily due to the timing of payments related to accrued expenses, which contributed a larger net cash in-flow in 2003, and the impact of inventory, which required the use of cash in 2004 of $0.9 million compared to a source of operating cash flow in 2003 of $3.4 million, partially offset by an increase in net income from continuing operations.
Cash flow used for investing activities increased $4.4 million in 2005 over 2004 due to an increase in capital expenditures for 2005 offset by no acquisitions being made and a higher level of proceeds received from disposal of property, principally as a result of a settlement we reached with the British government after they exercised their right of eminent domain over one of our locations. Capital expenditures made in 2005 were for replacement of in-place equipment and for additional equipment and instrumentation in growing markets. For 2004, investing activities declined to $12.0 million for 2004 compared to $29.2 million for 2003. This overall decline was due to the use of only $1.8 million for acquisitions in 2004 compared to $10.7 million in 2003, and a $7.5 million decline in capital expenditures. Significant capital expenditures in 2003 included $2.1 million related to an upgrade of our company-wide

21
information system, and new facilities located in Godley, Texas and Amsterdam totaling $4.8 million. Purchase acquisitions in 2003 included the assets of GOEX for approximately $10.7 million.
Cash flow used by financing activities increased in 2005 compared to 2004 and to 2003, as we continued to pay down debt in 2005. Our financing activities reflected a net repayment of debt of $26.8 million in 2005 and $17.1 million in 2004, while 2003 financing activities reflected net borrowings of $36.0 million. In 2005, we used $41.4 million to repurchase 1,468,515 shares of our common stock, while in 2004 we used $51.3 million to repurchase 2,378,500 shares of our common stock and in 2003 we used $58.0 million to repurchase 4,687,050 shares of our common stock. This share repurchase program was approved by our shareholders at our annual meeting in May 2002 and repurchases began on October 10, 2002. Under the program, we were authorized to repurchase up to 10% of our outstanding common shares. This authorization was extended by our shareholders at our annual meetings in May 2003, a special meeting in October 2003, and again in annual meetings in June 2004 and April 2005.
At our April 2005 annual meeting of shareholders, we were authorized to continue our share repurchase program of up to 10% of our outstanding common shares through October 15, 2006. In addition, we were authorized to cancel 2,282,441 of these repurchased shares, with a cost of $52.2 million. Pursuant to this authorization, these shares were cancelled during the second quarter of 2005. During the year ended December 31, 2005, we repurchased 1,468,515 shares of our common stock for an aggregate amount of $41.4 million, or an average price of $28.22 per share. As of February 22, 2006, we had authority to repurchase 1,445,905 additional shares. The repurchase of shares in the open market is at the discretion of management. We regard these treasury shares as a temporary investment which may be used to finance future acquisitions. However, under the Dutch Commercial Code ("DCC"), we can only hold a maximum of 10% of our outstanding shares in treasury. Therefore, it may be necessary to cancel some or all of these shares to remain in compliance with the DCC. We believe this share repurchase program has been beneficial to our shareholders. Our share price has increased from $8.05 per share when the program was announced in 2002 to $37.36 per share on December 31, 2005, an increase of approximately 364%.
In 2004, we recorded a net cash inflow of $17.6 million as a result of our discontinued operations which included $18.2 million of proceeds from the sale of the specialized geophysical and seismic business and cash received from the settlement of a patent infringement lawsuit, partially offset by a use of operating cash flows. Credit Facilities and Available Future Liquidity
We maintain a revolving credit facility (the "Credit Facility"). In March 2005, we amended this facility extending the maturity date of the facility from June 26, 2006 to March 24, 2010. The amendment also provided for lower borrowing costs and commitment fees and modified certain debt covenant terms, as defined in the amended agreement. In December 2005, we amended this facility to increase the aggregate borrowing commitment under the original credit facility from $75.0 million to $125.0 million, extended the maturity dated from March 24, 2010 to December 20, 2010, and added an option to increase the commitment under the credit facility to $175.0 million, if certain conditions are met.
The Credit Facility bears interest at variable rates from LIBOR plus 0.625% to a maximum of LIBOR plus 1.50%. At December 31, 2005, the weighted average interest rate of amounts outstanding under the Credit Facility was 5.38%. The weighted average interest rate under this facility was 4.40% for the year ended December 31, 2005. The Credit Facility matures in December 2010 and requires interest payments only until maturity. These interest payments are based on the interest period selected. Our outstanding balance under the Credit Facility at December 31, 2005 was $86.0 million and our available borrowing capacity under the Credit Facility at December 31, 2005 was $31.5 million. Our available capacity is reduced by outstanding letters of credit and performance guarantees and bonds totaling $7.5 million at December 31, 2005 related to certain projects in progress.
In July 1999, we issued $75.0 million in senior notes, $35.0 million Series A and $40.0 million Series B ("Senior Notes"), that bear interest at an average fixed rate of 8.16% and require annual principal payments of $7.0 million for Series A that began on July 22, 2005, continuing annually through July 2009, and $8.0 million for Series B beginning on July 22, 2007 and continuing annually through July 2011, in addition to semi-annual interest payments. On December 29, 2005, we repurchased all of our outstanding Senior Notes. The Senior Notes were redeemed, in accordance with the Note and Guarantee Agreement dated July 22, 1999, for face value plus accrued and unpaid interest and a make-whole premium as prescribed in the Senior Note agreement. Such redemption was completed on December 29, 2005 and was funded utilizing a combination of excess cash and borrowings under the Credit Facility. The total cash paid in connection with the repurchase was $76.4 million of which $68.0 million related to the principal amount of the Senior Notes, $2.4 million related to the accrued interest and $6.0 million for a make-whole premium which is included in "Debt Prepayment Charge" in the accompanying Consolidated Statements of Operations.
The terms of the Credit Facility require us to meet certain financial covenants, including, but not limited to, certain operational and minimum equity and cash flow ratios. We believe that we are in compliance with all such covenants contained in our credit agreement. All of our material wholly owned subsidiaries are guarantors or co-borrowers under the Credit Facility.

22
We have unsecured letters of credit, performance guarantees and bonds totaling $1.5 million at December 31, 2005.
In addition to our repayment commitments under our credit facilities, we have capital lease obligations related to the purchase of equipment, and non-cancelable operating lease arrangements under which we lease property including land, buildings, office equipment and vehicles.
The following table summarizes our future contractual obligations under these arrangements:
Total Less than
1 year 1-3 Years 3-5 Years More than
5 Years (unaudited, in thousands) Contractual Obligations: Long-term debt $ 88,612 $ 2,512 $ 100 $ 86,000 $ -Capital leases 36 32 4 - -Operating leases 28,419 5,562 7,308 4,608 10,941Pension and other (a) 2,250 1,750 500 - - Total contractual obligations $ 119,317 $ 9,856 $ 7,912 $ 90,608 $ 10,941
(a) Our Dutch pension plan requires annual employer contributions. Amounts payable in the future will be based on future workforce factors which cannot be projected beyond one year.
We have no significant purchase commitments or similar obligations outstanding at December 31, 2005.
We had tax net operating loss carry-forwards in various tax jurisdictions of approximately $63.1 million at December 31, 2005. If
unused, those carry-forwards which are subject to expiration may expire during the years 2006 through 2025. For 2005, $3.7 million of operating loss carry-forwards which carried a full valuation allowance, expired unused. Although we cannot assure that these operating loss carry-forwards will be utilized, we anticipate that we will have sufficient taxable income in future years to allow us to fully utilize the carry-forwards that are not subject to a valuation allowance as of December 31, 2005.
We expect our investment in capital expenditures to be approximately $18.0 million in 2006. In addition, we plan to continue to repurchase our common shares on the open market through our stock repurchase program. Our ability to continue this repurchase program depends on, among other things, market conditions and our ability to generate free cash flow.
Our ability to maintain and increase our operating income and cash flows is largely dependent upon continued investing activities. We believe our future cash flows from operating activities, supplemented by our borrowing capacity under existing facilities and our ability to issue additional equity should be sufficient to meet our contractual obligations, capital expenditures, working capital needs and to finance future acquisitions. Accounting Pronouncements
In May 2005, the FASB issued SFAS No. 154, "Accounting Changes and Error Corrections, a Replacement of APB Opinion No. 20 and FASB Statement No. 3." This statement requires retrospective application of changes in accounting principle to prior periods' financial statements, rather than the use of the cumulative effect of a change in accounting principle, unless impracticable. If impracticable to determine the impact on prior periods, then the new accounting principle should be applied to the balances of assets and liabilities as of the beginning of the earliest period for which retrospective application is practicable, with a corresponding adjustment to equity, unless impracticable for all periods presented, in which case prospective treatment should be applied. This statement applies to all voluntary changes in accounting principle, as well as those required by the issuance of new accounting pronouncements if no specific transition guidance is provided. This statement does not change the previously-issued guidance for reporting a change in accounting estimate or correction of an error. SFAS No. 154 becomes effective for accounting changes and corrections of errors made in fiscal years beginning after December 15, 2005. We do not expect this pronouncement to have a material impact on our financial position and results of operations.
In December 2004, the FASB issued SFAS No. 123R, "Share-Based Payment," which revises SFAS No. 123 and supersedes ABP Opinion No. 25. This statement will require us to measure the cost of employee services received in exchange for an award of equity instruments based on the grant-date fair value of the award, with limited exceptions. We have adopted this new standard effective January 1, 2006 using the modified-prospective transition method. As of December 31, 2005, all outstanding stock options have been fully vested. Upon adoption, this statement had minimal impact on our financial position and results of operations. Results from prior periods have not been restated.
In November 2004, the FASB issued SFAS No. 151, "Inventory Costs." This pronouncement amends previous guidance to clarify the accounting for abnormal amounts of idle facility expense, freight, shipping and handling costs and spoilage, and generally requires
23
that those items be recognized as current period charges. In addition, this pronouncement requires that fixed production overhead allocations to conversion costs be based on the normal capacity of the production facilities. This statement becomes effective for inventory costs incurred during fiscal years beginning after June 15, 2005, and will be applied prospectively. Upon adoption on January 1, 2006, this statement had minimal impact on our financial position and results of operations. Forward-Looking Statements
This discussion contains forward-looking statements within the meaning of Section 27A of the Securities Act of 1933 and Section 21E of the Securities Exchange Act of 1934, concerning among other things, our expected revenues, expenses and profit, our prospects, and business strategies and development, all of which are subject to certain risks, uncertainties and assumptions. When used in this document, words such as "anticipate", "believe", "expect", "plan", "intend", "estimate", "project", "budget", "forecast", "will", "should", "could", "may", "predict" and similar expressions are intended to identify forward-looking statements. We based our statements on our current expectations, estimates, historical trends, current conditions and other factors we believe are appropriate under the circumstances. Such statements are subject to various risks and uncertainties related to the oil and gas industry, business conditions, international markets, international political climates and other factors that are beyond our control. We caution you that these statements are not guarantees of future performance. Accordingly, our actual outcomes and results may differ materially from what we express or forecast in the forward-looking statements. Should one or more of these risks or uncertainties materialize, or should our underlying assumptions prove incorrect, our actual results may vary materially from those expected, estimated or projected.

24
ITEM 7A. QUANTITATIVE AND QUALITATIVE DISCLOSURES ABOUT MARKET RISK Market Risk
We are exposed to market risk, which is the potential loss arising from adverse changes in market prices and rates. We have not entered, or intend to enter, into derivative financial instruments for hedging or speculative purposes. We do not believe that our exposure to market risks, which are primarily related to interest rate changes, is material. Interest Rate Risk
We are exposed to interest rate risk on our Credit Facility debt, which carries a variable interest rate. At December 31, 2005, our variable rate debt outstanding of $86.0 million approximated its fair value. A one percent change in the interest rate would result in a change of approximately $0.9 million in interest expense on an annual basis. Foreign Currency Risk
We operate in a number of international areas which exposes us to foreign currency exchange rate risk. We do not currently hold or issue forward exchange contracts or other derivative instruments for hedging or speculative purposes. (A foreign exchange contract is an agreement to exchange different currencies at a given date and at a specified rate.) Foreign exchange gains and losses are the result of fluctuations in the U.S. Dollar against foreign currencies and are included in other expense (income) in the statements of operations. We recognized foreign exchange losses in countries where the USD weakened against the local currency and we had net monetary liabilities denominated in the local currency and in countries where the USD strengthened against the local currency and we had net monetary assets denominated in the local currency. We recognized foreign exchange gains in countries where the USD strengthened against the local currency and we had net monetary liabilities denominated in the local currency and in countries where the USD weakened against the local currency and we had net monetary assets denominated in the local currency. Foreign exchange gains and losses are summarized in the following table (in thousands):
Year Ended
Losses (gains) by currency 2005 2004 2003 British Pound $ 269 $ (88) $ 57 Canadian Dollar (147) (457) (1,065) Euro 279 96 161 Russian Ruble 236 (370) (187) Venezuelan Bolivar 399 580 148 Other currencies 583 (549) 476
Total losses (gains) $ 1,619 $ (788) $ (410)
As a result of the political and financial instability in Venezuela, the Bolivar ("VEB") declined in value relative to other currencies. In February 2003, the Venezuelan government imposed an exchange rate of 1,596 VEB per U.S. dollar ("USD"). In February 2004, the government devalued the VEB by 20% to 1,915 VEB per USD. Effective March 2, 2005, the Venezuelan government devalued the VEB by an additional 12% to 2,147 VEB per USD resulting in a foreign exchange loss of approximately $0.3 million in the first quarter of 2005. At December 31, 2005, our net monetary assets denominated in VEB in Venezuela were $2.1 million. We continue to monitor our operations and financial position in this region. Credit Risk
Our financial instruments that potentially subject us to concentrations of credit risk consist primarily of cash and cash equivalents and accounts receivable. All cash and cash equivalents are on deposit at commercial banks or investment firms. Our trade receivables are with a variety of domestic, international and national oil and gas companies. Management considers this credit risk to be limited due to the creditworthiness and financial resources of these financial institutions and companies. ITEM 8. FINANCIAL STATEMENTS AND SUPPLEMENTARY DATA
For the financial statements and supplementary data required by this Item 8, see Index to Consolidated Financial Statements and Schedules at Item 15.

25
ITEM 9. CHANGES IN AND DISAGREEMENTS WITH ACCOUNTANTS ON ACCOUNTING AND FINANCIAL DISCLOSURE
None. ITEM 9A. CONTROLS AND PROCEDURES Disclosure Controls and Procedures
Our management, under the supervision of and with the participation of our Chief Executive Officer and Chief Financial Officer, has evaluated the effectiveness of Core Laboratories N.V.'s disclosure controls and procedures, as such term is defined in Rules 13a-15(e) and 15d-15(e) under the Securities Exchange Act of 1934, as amended (the "Exchange Act"), as of the end of the period covered by this report. Based on such evaluation, our Chief Executive Officer and Chief Financial Officer have concluded that, as of the end of such period, our disclosure controls and procedures are effective to provide reasonable assurance that the information required to be disclosed by the Company in its reports filed or submitted under the Exchange Act is recorded, processed, summarized and reported within the time periods specified in the rules and forms of the Securities and Exchange Commission and such information is accumulated and communicated to management as appropriate to allow timely decisions regarding required disclosure. Our management does not expect that our disclosure controls and procedures or our internal control over financial reporting will prevent all errors and all fraud. Further, the design of disclosure controls and internal control over financial reporting must reflect the fact that there are resource constraints, and the benefits of controls must be considered relative to their costs. Because of the inherent limitations in all control systems, no evaluation of controls can provide absolute assurance that all control issues and instances of fraud, if any, within a company have been detected. Management's Report on Internal Control over Financial Reporting
The management of Core Laboratories N.V. (the "Company") is responsible for establishing and maintaining adequate internal control over financial reporting, as that term is defined in Exchange Act Rules 13a-15(f) and 15d-15(f). Our internal control over financial reporting is designed to provide reasonable assurance regarding the reliability of financial reporting and the preparation of financial statements for external purposes in accordance with generally accepted accounting principles.
Because of its inherent limitations, internal control over financial reporting may not prevent or detect misstatements. Also,
projections of any evaluation of effectiveness to future periods are subject to the risk that controls may become inadequate because of changes in conditions, or that the degree of compliance with the policies or procedures may deteriorate.
Our management conducted an evaluation of our internal control over financial reporting as of December 31, 2005. In making this
assessment, management used the criteria set forth in Internal Control − Integrated Framework issued by the Committee of Sponsoring Organizations of the Treadway Commission. Based on this assessment using these criteria, our management determined that our internal control over financial reporting was effective as of December 31, 2005.
Management's assessment of the effectiveness of the Company's internal control over financial reporting as of December 31, 2005,
has been audited by PricewaterhouseCoopers LLP, an independent registered public accounting firm, as stated in their report which is included herein. Changes in Internal Control over Financial Reporting
There have not been any changes in our internal control over financial reporting, as such term is defined in Rules 13a-15(f) and 15d-15(f) under the Exchange Act, during our fiscal quarter ended December 31, 2005 that have materially affected, or are reasonably likely to materially affect, our internal control over financial reporting. ITEM 9B. OTHER INFORMATION
None.
PART III
Part III (Items 10 through 14) will be incorporated by reference pursuant to Regulation 14A under the Securities Exchange Act of 1934. The Registrant expects to file a definitive proxy statement with the SEC within 120 days after the close of the year ended December 31, 2005.

26
PART IV ITEM 15. EXHIBITS, FINANCIAL STATEMENT SCHEDULES (a) Financial Statements
1. The following reports, financial statements and schedules are filed herewith on the pages indicated:
Page
Report of Independent Registered Public Accounting Firm-PricewaterhouseCoopers LLP F-1 Consolidated Balance Sheets as of December 31, 2005 and 2004 F-2 Consolidated Statements of Operations for the Years Ended December 31, 2005, 2004 and 2003 F-3 Consolidated Statements of Changes in Shareholders' Equity for the Years Ended December 31, 2005, 2004 and 2003 F-4 Consolidated Statements of Cash Flows for the Years Ended December 31, 2005, 2004 and 2003 F-5 Notes to Consolidated Financial Statements F-6
2. Financial Statement Schedule
Schedule II - Valuation and Qualifying Account
(b) Exhibits
The following exhibits are incorporated by reference to the filing indicated or are filed herewith.
Exhibit No. Exhibit Title Incorporated by Reference from the
Following Documents
3.1 - Articles of Association of the Company, as amended (including English translation)
Form F-1, September 20, 1995 (File No. 000-26710)
4.1 - Form of certificate representing Common Shares Form 10-K, March 31, 1999 (File
No. 000-26710)
10.1 - Core Laboratories N.V. 1995 Long-Term Incentive Plan (as amended and restated effective as of May 29, 1997)
Proxy Statement dated May 2, 1997 for Annual Meeting of Shareholders
10.2 - Core Laboratories N.V. 1995 Non-employee Director Stock Option Plan
(as amended and restated effective as of May 29, 1997) Proxy Statement dated May 2, 1997
for Annual Meeting of Shareholders
10.3 - Form of Indemnification Agreement to be entered into by the Company and certain of its directors and officers
Form F-1, September 20, 1995 (File No. 33-96466)
10.4 - Amended and Restated Credit Agreement among Core Laboratories N.V.,
Core Laboratories, Inc., Core Laboratories (U.K.) Limited, Bankers Trust Company, NationsBank, N.A. and the Bank Group, dated as of July 18, 1997
Form S-3, October 31, 1997 (File No. 333-392655)
10.5 Core Laboratories Supplemental Executive Retirement Plan effective as of
January 1, 19981 Form 10-K, March 31, 1998 (File
No. 000-26710)
10.6 - Core Laboratories Supplemental Executive Retirement Plan for John D. Denson effective January 1, 19991
Form 10-Q, August 16, 1999 (File No. 001-14273)
10.7 - Core Laboratories Supplemental Executive Retirement Plan for Monty L.
Davis effective January 1, 19991 Form 10-Q, August 16, 1999 (File
No. 001-14273)
10.8 - Amendment to Core Laboratories Supplemental Executive Retirement Plan filed January 1, 1998, effective July 29, 19991
Form 10-Q, August 16, 1999 (File No. 001-14273)

27
10.9 - Note and Guarantee Agreement by Core Laboratories, Inc. for Guaranteed Senior Notes, Series A, and Guaranteed Senior Notes, Series B, dated as of July 22, 1999
Form 10-Q, August 16, 1999 (File No. 001-14273)
10.10 - First Amendment to Core Laboratories N.V. 1995 Long-Term Incentive
Plan (as amended and restated effective as of May 29, 1997) Form 10-K, March 15, 2001 (File
No. 001-14273)
10.11 - Second Amendment to Core Laboratories N.V. 1995 Non-employee Director Stock Option Plan (as amended and restated effective as of May 29, 1997)
Form 10-K, March 15, 2001 (File No. 001-14273)
10.12 - Form of Restated Employment Agreement between Core Laboratories
N.V. and David Michael Demshur dated as of December 31, 20011 Form 10-K, March 25, 2002 (File
No. 001-14273)
10.13 - Form of Restated Employment Agreement between Core Laboratories N.V. and Richard Lucas Bergmark dated as of December 31, 20011
Form 10-K, March 25, 2002 (File No. 001-14273)
10.14 - Form of Restated Employment Agreement between Core Laboratories
N.V. and John David Denson dated as of December 31, 20011 Form 10-K, March 25, 2002 (File
No. 001-14273)
10.15 - Form of Restated Employment Agreement between Core Laboratories N.V. and Monty Lee Davis dated as of December 31, 20011
Form 10-K, March 25, 2002 (File No. 001-14273)
10.16 - Form of Executive Share Matching Restricted Share Agreement between
Core Laboratories N.V. and David Demshur dated as of June 1, 20021 Form 10-K, April 4, 2003 (File No.
001-14273)
10.17 - Form of Executive Share Matching Restricted Share Agreement between Core Laboratories N.V. and Richard Bergmark dated as of June 1, 20021
Form 10-K, April 4, 2003 (File No. 001-14273)
10.18 - Form of Executive Share Matching Restricted Share Agreement between
Core Laboratories N.V. and John Denson dated as of June 1, 20021 Form 10-K, April 4, 2003 (File No.
001-14273)
10.19 - Form of Executive Share Matching Restricted Share Agreement between Core Laboratories N.V. and Monty Davis dated as of June 1, 20021
Form 10-K, April 4, 2003 (File No. 001-14273)
10.20 - Amendment to Core Laboratories N.V. 1995 Long-Term Incentive Plan
(as Amended and Restated Effective as of May 29, 1997) Form 10-Q, May 15, 2003 (File No.
001-14273)
10.21 - Amendment to Core Laboratories Supplement Executive Retirement Plan1 Form 10-Q, May 15, 2003 (File No. 001-14273)
10.22 Amendment to Restated Employment Agreement dated December 31,
2001 between Core Laboratories N.V. and David Demshur1 Form 10-Q, May 15, 2003 (File No.
001-14273)
10.23 - Amendment to Restated Employment Agreement dated December 31, 2001 between Core Laboratories N.V. and Richard L. Bergmark1
Form 10-Q, May 15, 2003 (File No. 001-14273)
10.24 - Amendment to Restated Employment Agreement dated December 31,
2001 between Core Laboratories N.V. and Monty L. Davis1 Form 10-Q, May 15, 2003 (File No.
001-14273)
10.25 - Amendment to Restated Employment Agreement dated December 31, 2001 between Core Laboratories N.V. and John D. Denson1
Form 10-Q, May 15, 2003 (File No. 001-14273)
10.26 - Summary of Director Compensation Filed Herewith
10.27 - Form of Restricted Share Award Program Agreement Form 8-K, September 9, 2004 (File
No. 001-14273)
10.28 - Form of Performance Share Award Restricted Share Agreement (ROE Based)
Form 8-K, September 9, 2004 (File No. 001-14273)
10.29 - Form of Performance Share Award Restricted Share Agreement (Restated) Form 8-K, September 9, 2004 (File
No. 001-14273)

28
10.30 Third Amended and Restated Credit Agreement among Core Laboratories N.V., Core Laboratories LP, JP Morgan Chase Bank, N.A., Bank of America, N.A., JP Morgan Securities Inc. and Banc of America Securities LLC, dated as of March 24, 2005
Form 10-Q, May 4, 2005 (File No. 001-14273)
10.31 Form of Restricted Share Award Program Agreement Form 10-Q, May 4, 2005 (File No.
001-14273)
10.32 Form of Performance Share Award Restricted Share Agreement (ROE Based)
Form 10-Q, May 4, 2005 (File No. 001-14273)
10.33 First Amendment to the Third Amended and Restated Credit Agreement
among Core Laboratories N.V., Core Laboratories LP, JP Morgan Chase Bank, N.A., Bank of America, N.A., JP Morgan Securities Inc. and Banc of America Securities LLC, dated as of December 20, 2005
Form 8-K, December 23, 2005 (File No. 001-14273)
21.1 - Subsidiaries of the Registrant Filed Herewith
23.1 - Consent of PricewaterhouseCoopers LLP Filed Herewith
31.1 - Certification of Chief Executive Officer Pursuant to Rule 13a-14 of the
Securities Exchange Act of 1934, As Adopted Pursuant to Section 302 of the Sarbanes-Oxley Act of 2002
Filed Herewith
31.2 - Certification of Chief Financial Officer Pursuant to Rule 13a-14 of the
Securities Exchange Act of 1934, As Adopted Pursuant to Section 302 of the Sarbanes-Oxley Act of 2002
Filed Herewith
32.1 - Certification of Chief Executive Officer Pursuant to 18 U.S.C. Section
1350, As Adopted Pursuant to Section 906 of the Sarbanes-Oxley Act of 2002
Furnished Herewith
32.2 - Certification of Chief Financial Officer Pursuant to 18 U.S.C. Section
1350, As Adopted Pursuant to Section 906 of the Sarbanes-Oxley Act of 2002
Furnished Herewith
1) Management contracts or compensatory plans or arrangements.
29
SIGNATURES
Pursuant to the requirements of Section 13 or 15(d) of the Securities Exchange Act of 1934, the Registrant has duly caused this report to be signed on its behalf by the undersigned, thereunto duly authorized.
CORE LABORATORIES N.V. By: Core Laboratories International B.V. Date: February 23, 2006 By: /s/ JAN WILLEM SODDERLAND Jan Willem Sodderland Managing Director
Pursuant to the requirements of the Securities Exchange Act of 1934, this report has been signed below by the following persons on behalf of the Registrant and in the capacities indicated, on the 23rd day of February 2006.
Signature
Title
/s/ DAVID M. DEMSHUR President, Chief Executive Officer,
David M. Demshur Chairman and Supervisory Director
/s/ RICHARD L. BERGMARK Executive Vice President, Chief Richard L. Bergmark Financial Officer, Treasurer and
Supervisory Director
/s/ C. BRIG MILLER Chief Accounting Officer C. Brig Miller
/s/ JOSEPH R. PERNA Supervisory Director
Joseph R. Perna
/s/ JACOBUS SCHOUTEN Supervisory Director Jacobus Schouten
/s/ RENE R. JOYCE Supervisory Director
Rene R. Joyce
/s/ MICHAEL C. KEARNEY Supervisory Director Michael C. Kearney
/s/ D. JOHN OGREN Supervisory Director
D. John Ogren
/s/ ALEXANDER VRIESENDORP Supervisory Director Alexander Vriesendorp

REPORT OF INDEPENDENT REGISTERED PUBLIC ACCOUNTING FIRM
To the Supervisory Board of Directors and Shareholders of Core Laboratories N.V.:
We have completed integrated audits of Core Laboratories N.V.'s 2005 and 2004 Consolidated Financial Statements and of its
internal control over financial reporting as of December 31, 2005, and an audit of its 2003 Consolidated Financial Statements in accordance with the standards of the Public Company Accounting Oversight Board (United States). Our opinions, based on our audits, are presented below.
Consolidated financial statements and financial statement schedule
In our opinion, the accompanying consolidated balance sheets and the related consolidated statements of operations, of changes in
shareholders' equity and of cash flows present fairly, in all material respects, the financial position of Core Laboratories N.V. (a Netherlands corporation) and its subsidiaries (the "Company") at December 31, 2005 and 2004, and the results of their operations and their cash flows for each of the three years in the period ended December 31, 2005 in conformity with accounting principles generally accepted in the United States of America. In addition, in our opinion, the financial statement schedule listed in the index appearing under Item 15(a)(2) presents fairly, in all material respects, the information set forth therein when read in conjunction with the related Consolidated Financial Statements. These financial statements and financial statement schedule are the responsibility of the Company's management. Our responsibility is to express an opinion on these financial statements and financial statement schedule based on our audits. We conducted our audits of these statements in accordance with the standards of the Public Company Accounting Oversight Board (United States). Those standards require that we plan and perform the audit to obtain reasonable assurance about whether the financial statements are free of material misstatement. An audit of financial statements includes examining, on a test basis, evidence supporting the amounts and disclosures in the financial statements, assessing the accounting principles used and significant estimates made by management, and evaluating the overall financial statement presentation. We believe that our audits provide a reasonable basis for our opinion.
Internal control over financial reporting
Also, in our opinion, management's assessment, included in Management's Report on Internal Control Over Financial Reporting
appearing under Item 9A of Part II of this Form 10-K, that the Company maintained effective internal control over financial reporting as of December 31, 2005 based on criteria established in Internal Control - Integrated Framework issued by the Committee of Sponsoring Organizations of the Treadway Commission (COSO), is fairly stated, in all material respects, based on those criteria. Furthermore, in our opinion, the Company maintained, in all material respects, effective internal control over financial reporting as of December 31, 2005, based on criteria established in Internal Control - Integrated Framework issued by the COSO. The Company's management is responsible for maintaining effective internal control over financial reporting and for its assessment of the effectiveness of internal control over financial reporting. Our responsibility is to express opinions on management's assessment and on the effectiveness of the Company's internal control over financial reporting based on our audit. We conducted our audit of internal control over financial reporting in accordance with the standards of the Public Company Accounting Oversight Board (United States). Those standards require that we plan and perform the audit to obtain reasonable assurance about whether effective internal control over financial reporting was maintained in all material respects. An audit of internal control over financial reporting includes obtaining an understanding of internal control over financial reporting, evaluating management's assessment, testing and evaluating the design and operating effectiveness of internal control, and performing such other procedures as we consider necessary in the circumstances. We believe that our audit provides a reasonable basis for our opinions.
A company's internal control over financial reporting is a process designed to provide reasonable assurance regarding the
reliability of financial reporting and the preparation of financial statements for external purposes in accordance with generally accepted accounting principles. A company's internal control over financial reporting includes those policies and procedures that (i) pertain to the maintenance of records that, in reasonable detail, accurately and fairly reflect the transactions and dispositions of the assets of the company; (ii) provide reasonable assurance that transactions are recorded as necessary to permit preparation of financial statements in accordance with generally accepted accounting principles, and that receipts and expenditures of the company are being made only in accordance with authorizations of management and directors of the company; and (iii) provide reasonable assurance regarding prevention or timely detection of unauthorized acquisition, use, or disposition of the company's assets that could have a material effect on the financial statements.
Because of its inherent limitations, internal control over financial reporting may not prevent or detect misstatements. Also,
projections of any evaluation of effectiveness to future periods are subject to the risk that controls may become inadequate because of changes in conditions, or that the degree of compliance with the policies or procedures may deteriorate.
PricewaterhouseCoopers LLP
Houston, Texas February 22, 2006
F-1

CORE LABORATORIES N.V. CONSOLIDATED BALANCE SHEETS
December 31, 2005 and 2004 (In thousands, except share and per share data)
2005 2004
ASSETS CURRENT ASSETS:
Cash and cash equivalents $ 13,743 $ 16,030 Accounts receivable, net of allowance for doubtful accounts of $4,526 and $6,064 at 2005 and 2004, respectively 99,129 95,449 Inventories, net 29,104 29,426 Prepaid expenses and other current assets 11,269 10,739 TOTAL CURRENT ASSETS 153,245 151,644
PROPERTY, PLANT AND EQUIPMENT, net 81,342 79,622 INTANGIBLES, net 6,720 7,057 GOODWILL 132,618 132,615 DEFERRED TAX ASSET 11,452 7,650 OTHER ASSETS 9,224 10,209
TOTAL ASSETS $ 394,601 $ 388,797 LIABILITIES AND SHAREHOLDERS' EQUITY
CURRENT LIABILITIES: Current maturities of long-term debt and capital lease obligations $ 2,544 $ 2,976 Accounts payable 32,557 28,632 Accrued payroll and related costs 17,371 20,085 Taxes other than payroll and income 5,660 4,111 Unearned revenues 3,233 2,632 Accrued interest 186 2,835 Current liabilities of discontinued operations 800 297 Other accrued expenses 7,205 5,843 TOTAL CURRENT LIABILITIES 69,556 67,411
LONG-TERM DEBT AND CAPITAL LEASE OBLIGATIONS 86,104 110,224 DEFERRED COMPENSATION 7,585 6,268 OTHER LONG-TERM LIABILITIES 16,034 13,529 COMMITMENTS AND CONTINGENCIES MINORITY INTEREST 1,065 1,069 SHAREHOLDERS' EQUITY:
Preference shares, EUR 0.01 par value; 3,000,000 shares authorized, none issued or outstanding - - Common shares, EUR 0.01 par value; 100,000,000 shares authorized, 26,797,354 issued and 25,774,339 outstanding at 2005 and 28,038,787 issued and 26,201,846 outstanding at 2004 474 484 Additional paid-in capital 103,832 123,332 Deferred compensation (940) (2,486) Retained earnings 141,448 110,237 Treasury shares (at cost), 1,023,015 at 2005 and 1,836,941 at 2004 (30,557) (41,271) TOTAL SHAREHOLDERS' EQUITY 214,257 190,296 TOTAL LIABILITIES AND SHAREHOLDERS' EQUITY $ 394,601 $ 388,797
The accompanying notes are an integral part of these Consolidated Financial Statements.
F-2

CORE LABORATORIES N.V. CONSOLIDATED STATEMENTS OF OPERATIONS For the Years Ended December 31, 2005, 2004 and 2003
(In thousands, except per share data)
2005 2004 2003 REVENUES: Services $ 367,401 $ 329,511 $ 294,872 Sales 116,066 97,916 78,295 483,467 427,427 373,167 OPERATING EXPENSES: Cost of services, exclusive of depreciation shown below 277,423 256,202 230,149 Cost of sales, exclusive of depreciation shown below 90,700 80,190 65,592 General and administrative expenses 37,846 28,140 22,787 Depreciation 15,938 16,800 19,796 Amortization 438 342 276 Other expense (income), net 191 (761) (1,351)OPERATING INCOME 60,931 46,514 35,918 Debt prepayment charge 6,012 - - Interest expense 8,277 8,275 7,669 Income before income tax expense 46,642 38,239 28,249 Income tax expense 14,925 10,217 7,457 Income from continuing operations 31,717 28,022 20,792 Loss from discontinued operations (net of tax benefit of $285, $111 and $538 in 2005, 2004 and 2003, respectively) (506) (15,732) (2,092)NET INCOME $ 31,211 $ 12,290 $ 18,700 EARNINGS PER SHARE INFORMATION: Basic earnings per share before loss from discontinued operations $ 1.22 $ 1.04 $ 0.69 Loss from discontinued operations (0.02) (0.58) (0.07)Basic earnings per share $ 1.20 $ 0.46 $ 0.62 Diluted earnings per share before loss from discontinued operations $ 1.13 $ 0.97 $ 0.67 Loss from discontinued operations (0.02) (0.54) (0.07)Diluted earnings per share $ 1.11 $ 0.43 $ 0.60 WEIGHTED AVERAGE COMMON SHARES OUTSTANDING: Basic 26,038 26,896 30,209 Diluted 28,008 28,761 31,179
The accompanying notes are an integral part of these Consolidated Financial Statements.
F-3

CORE LABORATORIES N.V. CONSOLIDATED STATEMENTS OF CHANGES IN SHAREHOLDERS' EQUITY
For the Years Ended December 31, 2005, 2004 and 2003 (In thousands, except share data)
Common Shares Additional Treasury Stock Total Number of Par Paid-In Deferred Retained Number of Shareholders' Shares Value Capital Compensation Earnings Shares Amount Equity BALANCE, January 1, 2003 33,275,910 $ 546 $ 187,364 $ - $ 79,247 860,400 $ (9,011) $ 258,146 Stock options exercised 154,560 2 1,532 - - - - 1,534 Repurchases of common shares - - - - - 4,687,050 (57,968) (57,968)Cancellation of common shares (3,330,892) (39) (36,349) - - (3,330,892) 36,388 - Net income - - - - 18,700 - - 18,700 BALANCE, December 31, 2003 30,099,578 509 152,547 - 97,947 2,216,558 (30,591) 220,412 Stock options exercised, net of capital taxes 697,326 9 8,478 - - - - 8,487 Stock-based compensation - - 2,900 (2,900) - - - - Amortization of deferred
compensation - - - 414 - - - 414 Repurchases of common shares - - - - - 2,378,500 (51,307) (51,307)Cancellation of common shares (2,758,117) (34) (40,593) - - (2,758,117) 40,627 - Net income - - - - 12,290 - - 12,290 BALANCE, December 31, 2004 28,038,787 484 123,332 (2,486) 110,237 1,836,941 (41,271) 190,296 Stock options exercised, net of capital taxes 655,255 8 8,207 - - - - 8,215 Stock-based awards issued 385,753 5 9,235 - - - - 9,240 Stock-based compensation - - 11,300 (3,740) - - - 7,560 Amortization of deferred compensation - - - 5,286 - - - 5,286 Tax benefit of stock options exercised - - 3,895 - - - - 3,895 Repurchases of common shares - - - - - 1,468,515 (41,446) (41,446)Cancellation of common shares (2,282,441) (23) (52,137) - - (2,282,441) 52,160 - Net income - - - - 31,211 - - 31,211 BALANCE, December 31, 2005 26,797,354 $ 474 $ 103,832 $ (940) $ 141,448 1,023,015 $ (30,557) $ 214,257
The accompanying notes are an integral part of these Consolidated Financial Statements.
F-4

CORE LABORATORIES N.V. CONSOLIDATED STATEMENTS OF CASH FLOWS For the Years Ended December 31, 2005, 2004 and 2003
(In thousands)
2005 2004 2003 CASH FLOWS FROM OPERATING ACTIVITIES: Net income $ 31,211 $ 12,290 $ 18,700 Loss from discontinued operations, net of tax 506 15,732 2,092 Income from continuing operations 31,717 28,022 20,792 Adjustments to reconcile income to net cash provided by operating activities: Net provision for (recoveries of) doubtful accounts 789 (441) 1,355 Provision for inventory obsolescence 3,255 2,887 2,263 Equity in (earnings) loss of affiliates (36) 265 (52) Minority interest (57) 1 482 Stock-based compensation 15,683 5,535 3,178 Depreciation and amortization 16,376 17,142 20,072 Debt issuance costs amortization and finance charges 685 255 168 (Gain) loss on sale of fixed assets (293) 550 357 Gain on the sale of investment held at cost - (82) - Gain on the involuntary sale of fixed assets (875) - - Gain on insurance recovery (334) - - Increase in value of life insurance policies (282) (301) (611) Deferred income taxes 81 (2,739) (860) Changes in assets and liabilities, net of effects of acquisitions: Accounts receivable (5,331) (5,804) (5,034) Inventories (2,988) (904) 3,428 Prepaid expenses and other current assets 1,889 2,709 3,710 Other assets 2,199 (687) (29) Accounts payable 3,926 3,142 4,314 Accrued expenses 4,550 3,844 6,870 Other long-term liabilities 3,824 1,105 (1,475) Net cash provided by operating activities - continuing operations 74,778 54,499 58,928 Net cash (used in) provided by operating activities - discontinued operations - (303) 923 Net cash provided by operating activities 74,778 54,196 59,851 CASH FLOWS FROM INVESTING ACTIVITIES: Capital expenditures (19,095) (10,888) (18,377) Patents and other intangibles (103) (209) (199) Acquisitions, net of cash acquired - (1,782) (10,733) Proceeds from sale of investment held at cost - 328 - Proceeds from sale of assets 3,930 1,342 607 Premiums on life insurance (1,096) (799) (456) Discontinued operations - 17,944 (6,968) Net cash (used in) provided by investing activities (16,364) 5,936 (36,126)CASH FLOWS FROM FINANCING ACTIVITIES: Repayment of debt borrowings (108,766) (32,108) (8,996) Proceeds from debt borrowings 82,000 14,962 45,000 Capital lease obligations (216) (361) (148) Stock options exercised 8,215 8,487 1,534 Debt refinancing costs (488) - (522) Repurchase of common shares (41,446) (51,307) (57,968) Discontinued operations - - (815) Net cash used in financing activities (60,701) (60,327) (21,915)NET CHANGE IN CASH AND CASH EQUIVALENTS (2,287) (195) 1,810 CASH AND CASH EQUIVALENTS, beginning of year 16,030 16,225 14,415 CASH AND CASH EQUIVALENTS, end of year $ 13,743 $ 16,030 $ 16,225 Supplemental disclosures of cash flow information:
Cash payments for interest $ 9,927 $ 7,576 $ 7,210 Cash payments for income taxes $ 15,898 $ 11,540 $ 8,903
Non-cash investing and financing activities: Capital lease additions $ 18 $ 5 $ 678 Insurance premium financed $ 2,412 $ 2,601 $ 2,588 Common stock issued related to compensation plans $ 9,240 $ - $ -
The accompanying notes are an integral part of these Consolidated Financial Statements.
F-5

CORE LABORATORIES N.V. NOTES TO THE CONSOLIDATED FINANCIAL STATEMENTS
DECEMBER 31, 2005 1. DESCRIPTION OF BUSINESS
Core Laboratories N.V. ("Core Laboratories", "we", "our" or "us") is a Netherlands limited liability company. We were established in 1936 and are one of the world's leading providers of proprietary and patented reservoir description, production enhancement and reservoir management services to the oil and gas industry. These services are directed toward enabling our clients to improve reservoir performance and increase oil and gas recovery from their producing fields. We have over 70 offices in more than 50 countries and have approximately 4,500 employees.
Our business units have been aggregated into three complementary segments which provide products and services for improving reservoir performance and increasing oil and gas recovery from new and existing fields: (1) Reservoir Description, (2) Production Enhancement and (3) Reservoir Management. For a description of product types and services offered by these business segments, see Note 15, Segment Reporting. 2. SUMMARY OF SIGNIFICANT ACCOUNTING POLICIES
Principles of Consolidation
The accompanying Consolidated Financial Statements include the accounts of Core Laboratories and its subsidiaries and have been prepared in accordance with generally accepted accounting principles ("GAAP") in the United States of America ("U.S."). All inter-company transactions and balances have been eliminated in consolidation. The equity method of accounting is used to record our interest in investments in which we have less than a majority interest and do not exercise significant control. We use the cost method to record certain other investments in which we own less than 20% of the outstanding equity and do not exercise significant control. We record minority interest associated with consolidated subsidiaries that are less than 100% owned. In addition, we consolidate an entity over which we have significant influence, but we have no stock ownership. We are considered the primary beneficiary of this entity, but our exposure is limited to our investment, which was insignificant at December 31, 2005.
Use of Estimates
The preparation of financial statements in accordance with U.S. GAAP requires management to make certain estimates and assumptions that affect the reported amounts of assets and liabilities and disclosure of assets and liabilities at the date of the financial statements and the reported amounts of revenues and expenses during the reporting period. We evaluate our estimates on an ongoing basis and utilize our historical experience, as well as various other assumptions that we believe are reasonable in a given circumstance, in order to make these estimates. Actual results could differ from our estimates, as assumptions and conditions change.
The following accounts, among others, require us to use critical estimates and assumptions:
- allowance for doubtful accounts; - inventory reserves; - depreciation and amortization; - income taxes; - long-lived assets, intangibles and goodwill; and - pensions and other postretirement benefits.
Accounting policies related to these accounts and the nature of these estimates are further discussed under the applicable caption.
For each of these critical estimates it is at least reasonably possible that changes in these estimates will occur in the short term which may impact our financial position or results of operations.
F-6
Comprehensive Income
Comprehensive income is comprised of net income and other charges or credits to equity that are not the result of transactions with owners. For the years ended December 31, 2005, 2004 and 2003, there were no items of other comprehensive income except net income.
Cash and Cash Equivalents
Cash and cash equivalents include all short-term, highly liquid instruments purchased with an original maturity of three months or less. These items are carried at cost, which approximates market value. For the years ended December 31, 2005, 2004 and 2003, cash equivalents included time deposits and money market investment accounts.
Concentration of Credit Risk
Our financial instruments that potentially subject us to concentrations of credit risk relate primarily to cash and cash equivalents and trade accounts receivable. All cash and cash equivalents are on deposit at commercial banks or investment firms with significant financial resources. Our trade receivables are with a variety of domestic, international and national oil and gas companies. We had no clients who provided more than 10% of our revenues for the years ended December 31, 2005, 2004 and 2003. We consider our credit risk related to trade accounts receivable to be limited due to the creditworthiness and financial resources of our clients. We evaluate our estimate of the allowance for doubtful accounts on an on-going basis throughout the year.
Accounts Receivable
Trade accounts receivable are recorded at their invoiced amounts and do not bear interest. We perform ongoing credit evaluations of our clients and monitor collections and payments in order to maintain a provision for estimated uncollectible accounts based on our historical collection experience and our current aging of client receivables outstanding, in addition to client's representations and our understanding of the economic environment in which our clients operate. Based on our review we establish or adjust allowances for specific customers and the accounts receivable as a whole, and recognize expense. When an account is determined to be uncollectible, we charge the receivable to our allowance for doubtful accounts. Our allowance for doubtful accounts totaled $4.5 million and $6.1 million at December 31, 2005 and 2004, respectively.
Inventories
Inventories consist of manufactured goods, materials and supplies used for sales or services to clients. Inventories are stated at the lower of average cost or estimated net realizable value, and are reflected net of valuation reserves. Inventory costs are recorded at standard cost which approximates the first-in, first-out method.
Prepaid Expenses and Other Current Assets
Prepaid expenses and other current assets are comprised primarily of prepaid insurance, value added taxes and rents.
Property, Plant and Equipment
Property, plant and equipment are stated at cost. Allowances for depreciation and amortization are calculated using the straight-line method based on the estimated useful lives of the related assets as follows:
Buildings and leasehold improvements 3 - 40 years Machinery and equipment 3 - 10 years
Expenditures for repairs and maintenance are charged to expense as incurred and major renewals and improvements are
capitalized. Cost and accumulated depreciation applicable to assets retired or sold are removed from the accounts, and any resulting gain or loss is included in operations. We incurred and expensed approximately $3.6 million, $3.4 million and $3.3 million in repair and maintenance costs for the years ended December 31, 2005, 2004 and 2003, respectively.
We review our assets for impairment when events or changes in circumstances indicate that the net book value of property, plant and equipment may not be recovered over its remaining service life. We evaluate our property, plant and equipment for impairment if a triggering event occurs which may indicate that an impairment is probable. Under these circumstances, we compare the sum of the estimated future cash flows related to the asset group, on an undiscounted basis, and an estimate of realizable value to the carrying value of the assets. If impairment is still indicated, we compare the fair value of the assets, determined using discounted cash flows
F-7
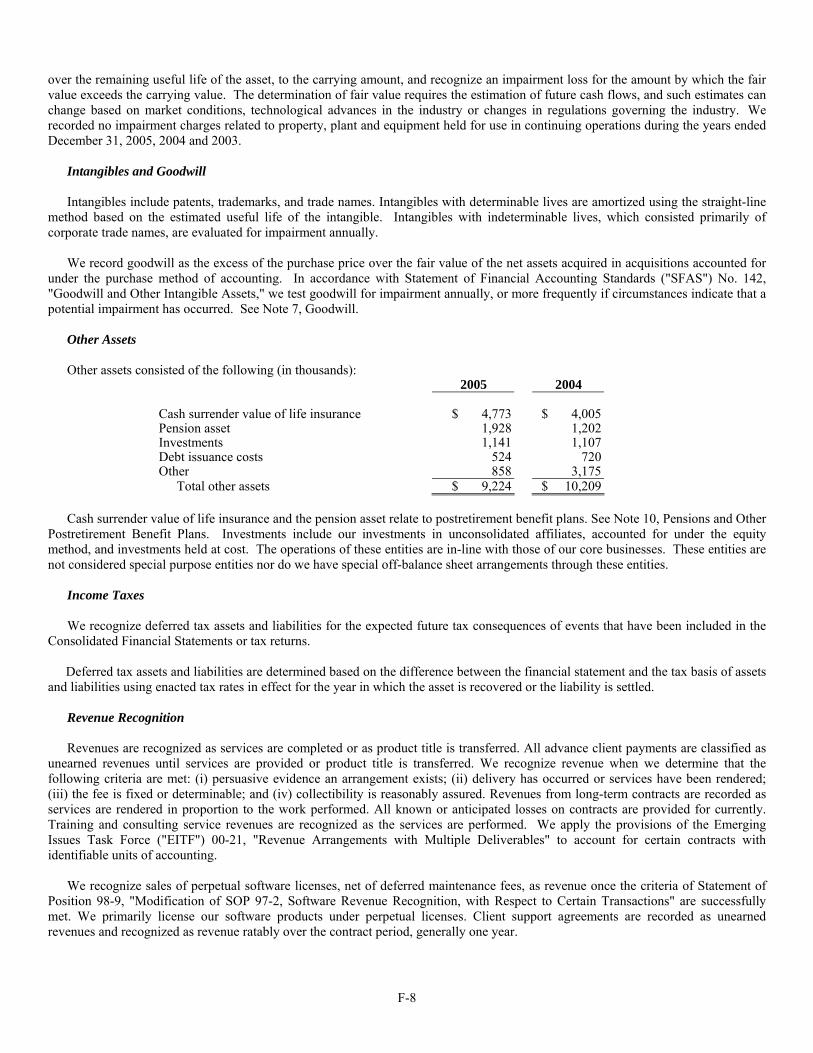
over the remaining useful life of the asset, to the carrying amount, and recognize an impairment loss for the amount by which the fair value exceeds the carrying value. The determination of fair value requires the estimation of future cash flows, and such estimates can change based on market conditions, technological advances in the industry or changes in regulations governing the industry. We recorded no impairment charges related to property, plant and equipment held for use in continuing operations during the years ended December 31, 2005, 2004 and 2003.
Intangibles and Goodwill
Intangibles include patents, trademarks, and trade names. Intangibles with determinable lives are amortized using the straight-line method based on the estimated useful life of the intangible. Intangibles with indeterminable lives, which consisted primarily of corporate trade names, are evaluated for impairment annually.
We record goodwill as the excess of the purchase price over the fair value of the net assets acquired in acquisitions accounted for under the purchase method of accounting. In accordance with Statement of Financial Accounting Standards ("SFAS") No. 142, "Goodwill and Other Intangible Assets," we test goodwill for impairment annually, or more frequently if circumstances indicate that a potential impairment has occurred. See Note 7, Goodwill.
Other Assets
Other assets consisted of the following (in thousands): 2005 2004 Cash surrender value of life insurance $ 4,773 $ 4,005 Pension asset 1,928 1,202 Investments 1,141 1,107 Debt issuance costs 524 720 Other 858 3,175 Total other assets $ 9,224 $ 10,209
Cash surrender value of life insurance and the pension asset relate to postretirement benefit plans. See Note 10, Pensions and Other
Postretirement Benefit Plans. Investments include our investments in unconsolidated affiliates, accounted for under the equity method, and investments held at cost. The operations of these entities are in-line with those of our core businesses. These entities are not considered special purpose entities nor do we have special off-balance sheet arrangements through these entities.
Income Taxes
We recognize deferred tax assets and liabilities for the expected future tax consequences of events that have been included in the Consolidated Financial Statements or tax returns.
Deferred tax assets and liabilities are determined based on the difference between the financial statement and the tax basis of assets and liabilities using enacted tax rates in effect for the year in which the asset is recovered or the liability is settled.
Revenue Recognition
Revenues are recognized as services are completed or as product title is transferred. All advance client payments are classified as unearned revenues until services are provided or product title is transferred. We recognize revenue when we determine that the following criteria are met: (i) persuasive evidence an arrangement exists; (ii) delivery has occurred or services have been rendered; (iii) the fee is fixed or determinable; and (iv) collectibility is reasonably assured. Revenues from long-term contracts are recorded as services are rendered in proportion to the work performed. All known or anticipated losses on contracts are provided for currently. Training and consulting service revenues are recognized as the services are performed. We apply the provisions of the Emerging Issues Task Force ("EITF") 00-21, "Revenue Arrangements with Multiple Deliverables" to account for certain contracts with identifiable units of accounting.
We recognize sales of perpetual software licenses, net of deferred maintenance fees, as revenue once the criteria of Statement of Position 98-9, "Modification of SOP 97-2, Software Revenue Recognition, with Respect to Certain Transactions" are successfully met. We primarily license our software products under perpetual licenses. Client support agreements are recorded as unearned revenues and recognized as revenue ratably over the contract period, generally one year.
F-8
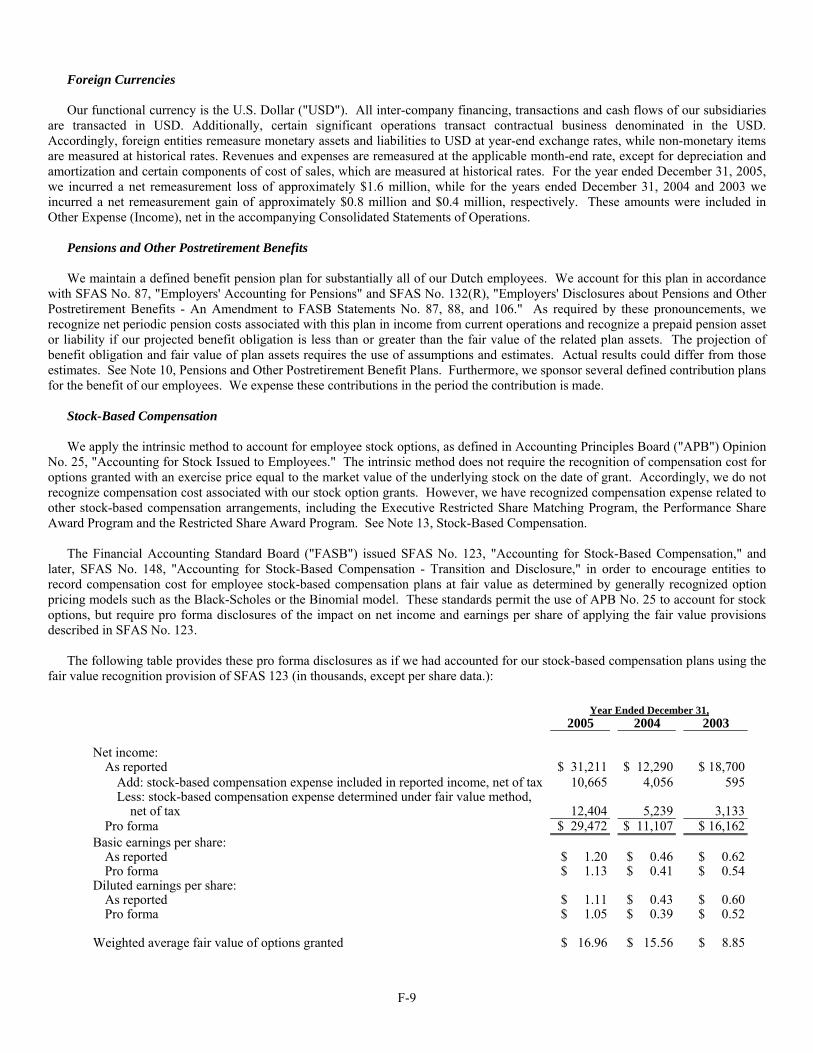
Foreign Currencies
Our functional currency is the U.S. Dollar ("USD"). All inter-company financing, transactions and cash flows of our subsidiaries are transacted in USD. Additionally, certain significant operations transact contractual business denominated in the USD. Accordingly, foreign entities remeasure monetary assets and liabilities to USD at year-end exchange rates, while non-monetary items are measured at historical rates. Revenues and expenses are remeasured at the applicable month-end rate, except for depreciation and amortization and certain components of cost of sales, which are measured at historical rates. For the year ended December 31, 2005, we incurred a net remeasurement loss of approximately $1.6 million, while for the years ended December 31, 2004 and 2003 we incurred a net remeasurement gain of approximately $0.8 million and $0.4 million, respectively. These amounts were included in Other Expense (Income), net in the accompanying Consolidated Statements of Operations.
Pensions and Other Postretirement Benefits
We maintain a defined benefit pension plan for substantially all of our Dutch employees. We account for this plan in accordance with SFAS No. 87, "Employers' Accounting for Pensions" and SFAS No. 132(R), "Employers' Disclosures about Pensions and Other Postretirement Benefits - An Amendment to FASB Statements No. 87, 88, and 106." As required by these pronouncements, we recognize net periodic pension costs associated with this plan in income from current operations and recognize a prepaid pension asset or liability if our projected benefit obligation is less than or greater than the fair value of the related plan assets. The projection of benefit obligation and fair value of plan assets requires the use of assumptions and estimates. Actual results could differ from those estimates. See Note 10, Pensions and Other Postretirement Benefit Plans. Furthermore, we sponsor several defined contribution plans for the benefit of our employees. We expense these contributions in the period the contribution is made.
Stock-Based Compensation
We apply the intrinsic method to account for employee stock options, as defined in Accounting Principles Board ("APB") Opinion No. 25, "Accounting for Stock Issued to Employees." The intrinsic method does not require the recognition of compensation cost for options granted with an exercise price equal to the market value of the underlying stock on the date of grant. Accordingly, we do not recognize compensation cost associated with our stock option grants. However, we have recognized compensation expense related to other stock-based compensation arrangements, including the Executive Restricted Share Matching Program, the Performance Share Award Program and the Restricted Share Award Program. See Note 13, Stock-Based Compensation.
The Financial Accounting Standard Board ("FASB") issued SFAS No. 123, "Accounting for Stock-Based Compensation," and later, SFAS No. 148, "Accounting for Stock-Based Compensation - Transition and Disclosure," in order to encourage entities to record compensation cost for employee stock-based compensation plans at fair value as determined by generally recognized option pricing models such as the Black-Scholes or the Binomial model. These standards permit the use of APB No. 25 to account for stock options, but require pro forma disclosures of the impact on net income and earnings per share of applying the fair value provisions described in SFAS No. 123.
The following table provides these pro forma disclosures as if we had accounted for our stock-based compensation plans using the fair value recognition provision of SFAS 123 (in thousands, except per share data.):
Year Ended December 31, 2005 2004 2003 Net income: As reported $ 31,211 $ 12,290 $ 18,700 Add: stock-based compensation expense included in reported income, net of tax 10,665 4,056 595
Less: stock-based compensation expense determined under fair value method, net of tax 12,404 5,239 3,133
Pro forma $ 29,472 $ 11,107 $ 16,162Basic earnings per share: As reported $ 1.20 $ 0.46 $ 0.62 Pro forma $ 1.13 $ 0.41 $ 0.54Diluted earnings per share: As reported $ 1.11 $ 0.43 $ 0.60 Pro forma $ 1.05 $ 0.39 $ 0.52 Weighted average fair value of options granted $ 16.96 $ 15.56 $ 8.85
F-9

The determination of the fair value of stock options was estimated using a Black-Scholes option-pricing model and required the use of highly subjective assumptions related to the volatility of our common stock, the expected term that the options would be outstanding and a risk-free rate. We do not include an estimated dividend yield in our calculations, since we have not paid dividends on our common stock historically and do not foresee paying dividends in the future. The following assumptions were used to calculate compensation expense for purposes of these pro forma results:
New Option Grants 2005 2004 2003 Risk free interest rate 4.6% 4.0% 3.7% Expected volatility 55.2% 56.6% 58.0% Expected lives (in years) 9.18 9.12 6.60
In December 2004, the FASB issued SFAS No. 123R, "Share-Based Payment," which revises SFAS No. 123 and supersedes APB
No. 25. This statement will require us to measure the cost of employee services received in exchange for an award of equity instruments based on the grant-date fair value of the award, with limited exceptions. We have adopted this statement as of January 1, 2006. See Note 17, Recent Accounting Pronouncements.
Earnings Per Share
We compute basic earnings per common share by dividing net income available to common shareholders by the weighted average number of common shares outstanding during the period. Diluted earnings per common and potential common share include additional shares in the weighted average share calculations associated with the incremental effect of dilutive employee stock options, restricted stock awards and contingently issuable shares, as determined using the treasury stock method. The following table summarizes the calculation of weighted average common shares outstanding used in the computation of diluted earnings per share (in thousands):
For the Year Ended December 31, 2005 2004 2003 Weighted average basic common shares outstanding 26,038
26,896 30,209
Effect of dilutive securities: Stock options 1,573 1,438 795 Contingent shares 353 348 175 Restricted stock and other 44 79 - Weighted average diluted common and potential common shares outstanding 28,008
28,761 31,179
We exclude the effect of anti-dilutive shares associated with these securities from the calculation of the diluted weighted average
shares. If these shares had been included, the impact would have been a decrease in diluted weighted average shares outstanding of 4,315 shares, 33,693 shares and 1.7 million shares for the years ended December 31, 2005, 2004 and 2003, respectively.
Discontinued Operations
We account for discontinued operations in accordance with SFAS No. 144, "Accounting for the Impairment or Disposal of Long-Lived Assets." In April 2004, we sold our specialized geophysical and seismic-related assets and business. Based on the sale price and estimates of fair value, we adjusted the related assets to their estimated fair value in 2004 and recognized impairment charges related to the sale. Historical results for discontinued operations were adjusted to eliminate corporate allocations and inter-company transactions. Our results of operations for 2003 represent the audited financial statements restated for these discontinued operations. See Note 16, Discontinued Operations.
Reclassifications
Certain reclassifications were made to prior year amounts in order to conform to the current year's presentation. These
reclassifications had no impact on reported net income for the years ended December 31, 2005, 2004 and 2003.
F-10
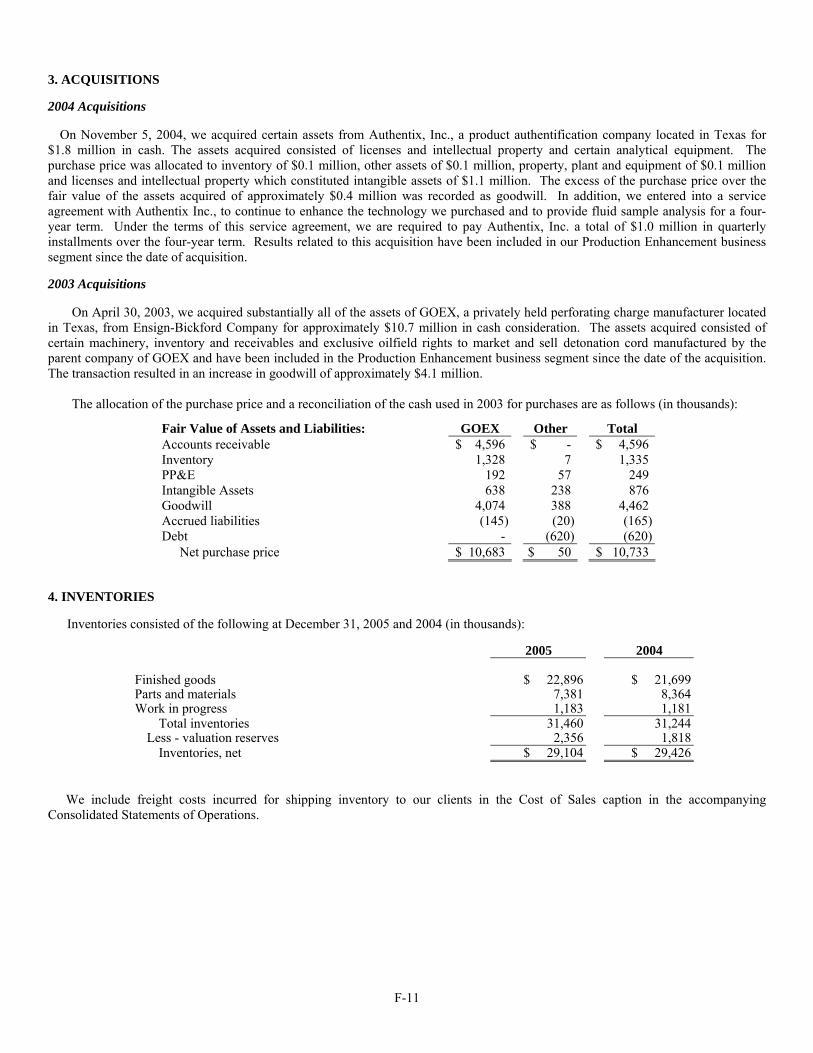
3. ACQUISITIONS 2004 Acquisitions
On November 5, 2004, we acquired certain assets from Authentix, Inc., a product authentification company located in Texas for $1.8 million in cash. The assets acquired consisted of licenses and intellectual property and certain analytical equipment. The purchase price was allocated to inventory of $0.1 million, other assets of $0.1 million, property, plant and equipment of $0.1 million and licenses and intellectual property which constituted intangible assets of $1.1 million. The excess of the purchase price over the fair value of the assets acquired of approximately $0.4 million was recorded as goodwill. In addition, we entered into a service agreement with Authentix Inc., to continue to enhance the technology we purchased and to provide fluid sample analysis for a four-year term. Under the terms of this service agreement, we are required to pay Authentix, Inc. a total of $1.0 million in quarterly installments over the four-year term. Results related to this acquisition have been included in our Production Enhancement business segment since the date of acquisition. 2003 Acquisitions On April 30, 2003, we acquired substantially all of the assets of GOEX, a privately held perforating charge manufacturer located in Texas, from Ensign-Bickford Company for approximately $10.7 million in cash consideration. The assets acquired consisted of certain machinery, inventory and receivables and exclusive oilfield rights to market and sell detonation cord manufactured by the parent company of GOEX and have been included in the Production Enhancement business segment since the date of the acquisition. The transaction resulted in an increase in goodwill of approximately $4.1 million. The allocation of the purchase price and a reconciliation of the cash used in 2003 for purchases are as follows (in thousands):
Fair Value of Assets and Liabilities: GOEX Other Total Accounts receivable $ 4,596 $ - $ 4,596 Inventory 1,328 7 1,335 PP&E 192 57 249 Intangible Assets 638 238 876 Goodwill 4,074 388 4,462 Accrued liabilities (145) (20) (165) Debt - (620) (620) Net purchase price $ 10,683 $ 50 $ 10,733
4. INVENTORIES
Inventories consisted of the following at December 31, 2005 and 2004 (in thousands):
2005 2004 Finished goods $ 22,896 $ 21,699Parts and materials 7,381 8,364Work in progress 1,183 1,181 Total inventories 31,460 31,244 Less - valuation reserves 2,356 1,818 Inventories, net $ 29,104 $ 29,426
We include freight costs incurred for shipping inventory to our clients in the Cost of Sales caption in the accompanying
Consolidated Statements of Operations.
F-11

5. PROPERTY, PLANT AND EQUIPMENT
The components of property, plant and equipment were as follows at December 31, 2005 and 2004 (in thousands):
2005 2004 Land $ 5,905 $ 6,002Building and leasehold improvements 56,537 54,511Machinery and equipment 118,062 109,296 Total property, plant and equipment 180,504 169,809 Less - accumulated depreciation and amortization 99,162 90,187 Property, plant and equipment, net $ 81,342 $ 79,622
Our property, plant and equipment amounts include assets held under capital lease arrangements which totaled $0.1 million and
$0.3 million at December 31, 2005 and 2004, respectively. Amortization of these capital lease amounts was $0.2 million, $0.2 million and $0.2 million for each of the years ended December 31, 2005, 2004 and 2003, respectively, and has been included in depreciation expense on the accompanying Statements of Operations. 6. INTANGIBLES
The components of intangibles as of December 31, 2005 and 2004 are as follows (in thousands):
2005 2004
Original
life in years
Gross Carrying
Value
Accumulated Amortization
Gross Carrying
Value
Accumulated Amortization
Acquired trade secrets 3-20 $ 1,514 $ 427 $ 1,562 $ 372Acquired patents and trademarks 10 2,337 1,508 2,310 1,391Agreements not to compete 3-7 810 257 810 119Acquired trade names 30 392 33 392 27Acquired trade names Indefinite 3,892 - 3,892 - Total intangibles $ 8,945 $ 2,225 $ 8,966 $ 1,909
Our estimated amortization expense related to these intangibles for the next five years is summarized in the following table (in
thousands): December 31, 2006 $ 397 December 31, 2007 $ 353 December 31, 2008 $ 315 December 31, 2009 $ 302 December 31, 2010 $ 302
Certain intangibles, primarily related to trade names, are deemed to have an indefinite life and are not amortized. These
intangibles are included in an impairment analysis performed at least annually. 7. GOODWILL
The changes in the carrying amount of goodwill for each business segment for the years ended December 31, 2005, 2004 and 2003 were as follows (in thousands):
Reservoir Description
Production Enhancement
Reservoir Management
Total
Balance at December 31, 2002 $ 64,562 $ 60,309 $ 2,845 $ 127,716 Goodwill acquired during the year 388 4,074 - 4,462
Balance at December 31, 2003 64,950 64,383 2,845 132,178 Goodwill acquired during the year - 437 - 437 Balance at December 31, 2004 64,950 64,820 2,845 132,615 Other - 3 - 3 Balance at December 31, 2005 $ 64,950 $ 64,823 $ 2,845 $ 132,618
F-12

We test goodwill for impairment at least annually or more frequently if circumstances indicate a potential impairment. For
purposes of this test, we compare the fair value of our reporting units, which are our reportable segments, to their net carrying value as of the balance sheet date, after excluding inter-company transactions and allocating corporate assets to the reportable segments. Fair value is determined by determining the present value of projecting future cash flows discounted at our cost of capital rate. If the carrying value of the reportable segment exceeds the fair value determined, impairment may be indicated. If impairment is indicated, the fair value of the reportable segment would be determined, much like a purchase price allocation under the purchase accounting method prescribed in SFAS No. 141, "Business Combinations." Any remaining goodwill would be deemed impaired and charged to income during the period the impairment was identified. We performed this impairment testing at December 31, 2005. No impairment was indicated, and therefore, no impairment has been recorded in 2005 related to continuing operations. See Note 16, Discontinued Operations.
The increase in goodwill for the years ended December 31, 2005 and 2004 was related to the acquisition of certain assets of
Authentix, Inc., as discussed at Note 3, Acquisitions. 8. DEBT AND CAPITAL LEASE OBLIGATIONS
Debt at December 31, 2005 and 2004 is summarized in the following table (in thousands):
2005 2004 Credit Facility $ 86,000 $ 35,000Senior notes - 75,000Capital lease obligations 36 234Other indebtedness 2,612 2,966 Total debt and capital lease obligations 88,648 113,200Less - short-term debt included in other indebtedness 2,412 2,601Less - current maturities of long-term debt and capital lease obligations 132 375 Long-term debt and capital lease obligations, net $ 86,104 $ 110,224
We maintain a revolving credit facility (the "Credit Facility"). In March 2005, we amended this facility extending the maturity
date of the facility from June 26, 2006 to March 24, 2010. The amendment also provided for lower borrowing costs and commitment fees and modified certain debt covenant terms, as defined in the amended agreement. In December 2005 we amended this facility increasing the aggregate borrowing commitment under the original credit facility from $75.0 million to $125.0 million, extended the maturity dated from March 24, 2010 to December 20, 2010, and added an option to increase the commitment under the credit facility to $175.0 million, if certain conditions are met.
The Credit Facility bears interest at variable rates from LIBOR plus 0.625% to a maximum of LIBOR plus 1.50%. At December 31, 2005, the weighted average interest rate of amounts outstanding under the Credit Facility was 5.38%. The weighted average interest rate under this facility was 4.40% for the year ended December 31, 2005. The Credit Facility matures in December 2010 and requires interest payments only until maturity. These interest payments are based on the interest period selected. Our available borrowing capacity under the Credit Facility at December 31, 2005 was approximately $31.5 million. Our available capacity is reduced by outstanding letters of credit and performance guarantees and bonds totaling $7.5 million at December 31, 2005 related to certain projects in progress.
In July 1999, we issued $75.0 million in senior notes, $35.0 million Series A and $40.0 million Series B ("Senior Notes"), that bear an average fixed rate of 8.16% and require annual principal payments of $7.0 million for Series A that began on July 22, 2005, continuing annually through July 2009, and $8.0 million for Series B beginning on July 22, 2007 and continuing annually through July 2011, in addition to semi-annual interest payments. On December 29, 2005, we repurchased all of our outstanding Senior Notes. The Senior Notes were redeemed, in accordance with the Note and Guarantee Agreement dated July 22, 1999, for face value plus accrued and unpaid interest and a make-whole premium as prescribed in the Senior Note agreement. Such redemption was completed on December 29, 2005 and was funded utilizing a combination of excess cash and borrowings under the Credit Facility. The total cash paid in connection with the repurchase was $76.4 million of which $68.0 million related to the principal amount of the Senior Notes, $2.4 million related to the accrued interest and $6.0 million for a make-whole premium which is included in "Debt Prepayment Charge" in the accompanying Consolidated Statements of Operations.
The terms of the Credit Facility require us to meet certain financial covenants, including, but not limited to, certain operational and minimum equity and cash flow ratios. All of our material wholly owned subsidiaries are guarantors or co-borrowers under the Credit Facility.
F-13

We have unsecured letters of credit, performance guarantees and bonds totaling $1.5 million at December 31, 2005.
Other indebtedness includes approximately $2.4 million of debt incurred relating to the financing of our corporate insurance.
Scheduled maturities of long-term debt and capital lease obligations are as follows (in thousands):
2006 $ 2,544 2007 104 2008 - 2009 - 2010 86,000 Thereafter - Total long-term debt and capital lease obligations $ 88,648
9. INCOME TAXES
The components of income before income tax expense for 2005, 2004 and 2003 are as follows (in thousands):
2005 2004 2003 United States $ 9,802 $ 5,258 $ (661)Other countries 36,840 32,981 28,910 Operating income before income tax expense $ 46,642 $ 38,239 $ 28,249
The components of income tax expense for 2005, 2004 and 2003 are as follows (in thousands):
2005 2004 2003 Current: United States $ (100) $ (183) $ 561 Other countries 12,717 11,248 7,214 State and provincial 2,227 1,891 542 Total current 14,844 12,956 8,317 Deferred: United States 4,486 204 324 Other countries (4,259) (2,998) (1,487) State and provincial (146) 55 303 Total deferred 81 (2,739) (860) Income tax expense from continuing operations $ 14,925 $ 10,217 $ 7,457
The difference between income tax expense computed using The Netherlands statutory income tax rate of 31.5% in 2005 and
34.5% in 2004 and 2003 and our income tax expense as reported in the accompanying Consolidated Statements of Operations for 2005, 2004 and 2003 are as follows (in thousands):
2005 2004 2003 Tax at The Netherlands income tax rate $ 14,692 $ 13,193 $ 9,746 International earnings taxed at rates lower than
The Netherlands statutory rate (5,598) (7,056) (6,145)Extraterritorial income exclusion benefit (193) (197) - Non-deductible expenses 2,787 2,562 3,246 Change in valuation allowance 1,156 (231) (235)State and provincial taxes 2,081 1,946 845 Income tax expense from continuing operations $ 14,925 $ 10,217 $ 7,457
Deferred tax assets and liabilities result from various temporary differences between the financial statement carrying amount and
their tax basis. Deferred tax assets and liabilities as of December 31, 2005 and 2004 are summarized as follows (in thousands):
F-14
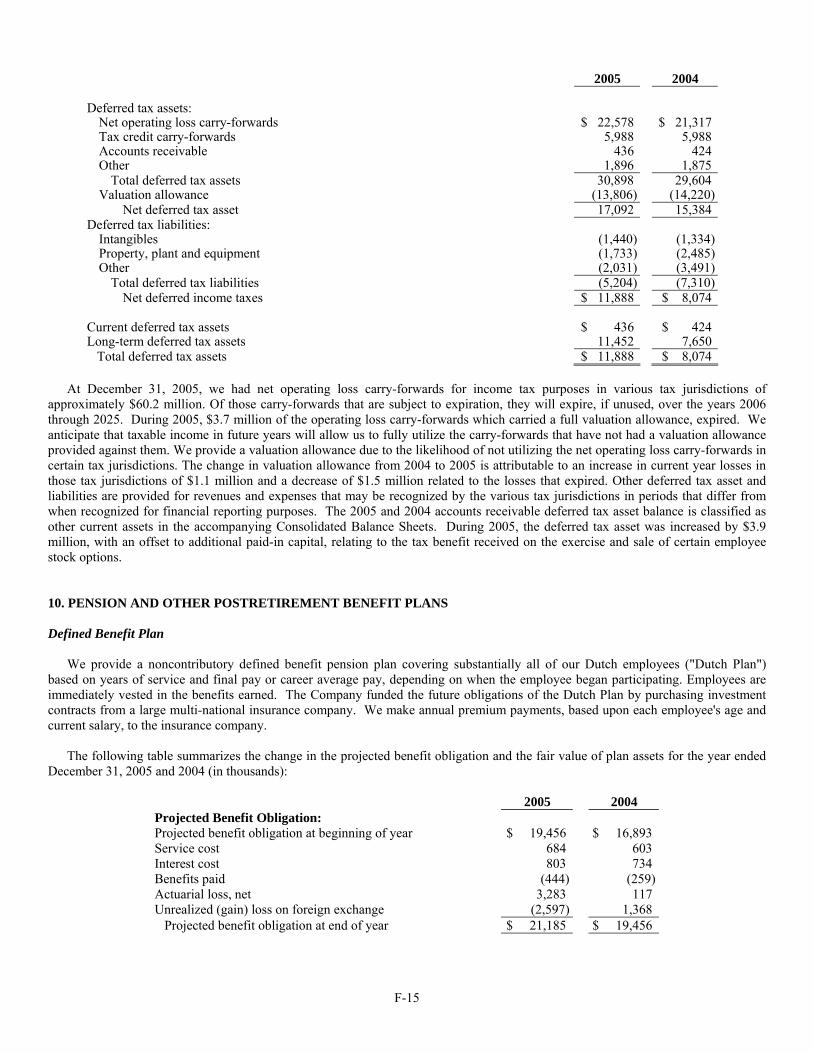
2005 2004 Deferred tax assets: Net operating loss carry-forwards $ 22,578 $ 21,317 Tax credit carry-forwards 5,988 5,988 Accounts receivable 436 424 Other 1,896 1,875 Total deferred tax assets 30,898 29,604 Valuation allowance (13,806) (14,220) Net deferred tax asset 17,092 15,384 Deferred tax liabilities: Intangibles (1,440) (1,334) Property, plant and equipment (1,733) (2,485) Other (2,031) (3,491) Total deferred tax liabilities (5,204) (7,310) Net deferred income taxes $ 11,888 $ 8,074 Current deferred tax assets $ 436 $ 424 Long-term deferred tax assets 11,452 7,650 Total deferred tax assets $ 11,888 $ 8,074
At December 31, 2005, we had net operating loss carry-forwards for income tax purposes in various tax jurisdictions of
approximately $60.2 million. Of those carry-forwards that are subject to expiration, they will expire, if unused, over the years 2006 through 2025. During 2005, $3.7 million of the operating loss carry-forwards which carried a full valuation allowance, expired. We anticipate that taxable income in future years will allow us to fully utilize the carry-forwards that have not had a valuation allowance provided against them. We provide a valuation allowance due to the likelihood of not utilizing the net operating loss carry-forwards in certain tax jurisdictions. The change in valuation allowance from 2004 to 2005 is attributable to an increase in current year losses in those tax jurisdictions of $1.1 million and a decrease of $1.5 million related to the losses that expired. Other deferred tax asset and liabilities are provided for revenues and expenses that may be recognized by the various tax jurisdictions in periods that differ from when recognized for financial reporting purposes. The 2005 and 2004 accounts receivable deferred tax asset balance is classified as other current assets in the accompanying Consolidated Balance Sheets. During 2005, the deferred tax asset was increased by $3.9 million, with an offset to additional paid-in capital, relating to the tax benefit received on the exercise and sale of certain employee stock options. 10. PENSION AND OTHER POSTRETIREMENT BENEFIT PLANS Defined Benefit Plan
We provide a noncontributory defined benefit pension plan covering substantially all of our Dutch employees ("Dutch Plan") based on years of service and final pay or career average pay, depending on when the employee began participating. Employees are immediately vested in the benefits earned. The Company funded the future obligations of the Dutch Plan by purchasing investment contracts from a large multi-national insurance company. We make annual premium payments, based upon each employee's age and current salary, to the insurance company.
The following table summarizes the change in the projected benefit obligation and the fair value of plan assets for the year ended December 31, 2005 and 2004 (in thousands):
2005 2004 Projected Benefit Obligation: Projected benefit obligation at beginning of year $ 19,456 $ 16,893 Service cost 684 603 Interest cost 803 734 Benefits paid (444) (259)Actuarial loss, net 3,283 117 Unrealized (gain) loss on foreign exchange (2,597) 1,368
Projected benefit obligation at end of year $ 21,185 $ 19,456
F-15

Fair Value of Plan Assets: Fair value of plan assets at beginning of year $ 20,195 $ 16,893 Actual gain on plan assets 660 580 Employer contributions 1,506 1,539 Benefits paid (444) (259)Unrealized (loss) gain on foreign exchange (2,734) 1,442
Fair value of plan assets at end of year $ 19,183 $ 20,195 Pension Asset Recognized: Funded status of the plan - (under) over funded $ (2,002) $ 739 Unrecognized net actuarial loss 3,930 463
Long-term pension asset $ 1,928 $ 1,202 Accumulated Benefit Obligation $ 18,010 $ 17,189
The following actuarial assumptions were used to determine the actuarial present value of our projected benefit obligation at
December 31, 2005 and 2004:
2005 2004 Weighted average assumed discount rate 4.00% 4.50% Weighted average rate of compensation increase 3.00% 3.00%
The discount rate used to determine our projected benefit obligation at December 31, 2005 was decreased from 4.50% to 4.00%.
The decrease in the discount rate was consistent with a general decline in long-term interest rates in The Netherlands during 2005. This change in discount rates resulted in an unrecognized actuarial loss as of December 31, 2005 and 2004.
The components of net periodic pension cost under this plan for the years ended December 31, 2005 and 2004 included:
2005 2004 Service cost $ 684 $ 603 Interest cost 803 734 Expected return on plan assets (909) (814)Unrecognized pension asset (82) (81) Net periodic pension cost $ 496 $ 442
This net periodic pension cost was calculated using the following assumptions:
2005 2004 Weighted average assumed discount rate 4.50% 4.75% Expected long-term rate of return on plan assets 4.50% 4.75% Weighted average rate of compensation increase 3.00% 3.00%
Plan assets at December 31, 2005 and 2004 consisted of insurance contracts with returns comparable with governmental debt
securities. Our expected long-term rate of return assumptions are based on the expected returns on these contracts. Dutch law dictates the minimum requirements for pension funding. Our goal is to meet these minimum funding requirements, while our insurance carrier invests to minimize risks associated with future benefit payments.
Our 2006 minimum funding requirements are expected to be approximately $1.5 million. Our estimate of future annual contributions is based on current funding requirements, and we believe these contributions will be sufficient to fund the plan. Expected benefit payments under this plan for the next five years are as follows (in thousands):
Year Ended December 31, Amount 2006 $ 306 2007 $ 362 2008 $ 404 2009 $ 447 2010 $ 484 Succeeding five years $ 4,244
F-16

Defined Contribution Plans
We maintain four defined contribution plans (the "Plans") for the benefit of eligible employees in the United States, Canada and the United Kingdom. In accordance with the terms of each plan, we match the required portion of employee contributions up to specified limits and under certain plans, we may make discretionary contributions annually in accordance with the Plans. For the years ended December 31, 2005, 2004 and 2003, we expensed approximately $2.5 million, $2.4 million and $1.8 million respectively, for our matching and discretionary contributions to the Plans. Deferred Compensation Arrangements
We have entered into deferred compensation contracts for certain key officers and an outside director. The benefits under these contracts are fully vested and benefits are paid when the participants attain 65 years of age. The charge to expense for officer deferred compensation in 2005, 2004 and 2003 was approximately $0.6 million, $0.5 million and $1.4 million, respectively. Life insurance policies with cash surrender values have been purchased for the purpose of funding the deferred compensation contracts.
We have adopted a non-qualified deferred compensation plan that allows certain highly compensated employees to defer a portion of their salary, commission and bonus, as well as the amount of any reductions in their deferrals under the 401(k) Plan, due to certain limitations imposed by the Internal Revenue Code of 1986, as amended. The plan also provides for employer contributions to be made on behalf of participants equal in amount to certain forfeitures of, and/or reductions in, employer contributions that participants could have received under the 401(k) Plan in the absence of certain limitations imposed by the Internal Revenue Code. Employer contributions to the deferred compensation plan were $0.1 million, $0.1 million and $0.1 million of the years ended December 31, 2005, 2004 and 2003, respectively. These employer contributions vest ratably over a period of five years.
Vesting in all employer contributions is accelerated upon the death of the participant or a change in control. Employer contributions under the plans are forfeited upon a participant's termination of employment to the extent they are not vested at that time. 11. COMMITMENTS AND CONTINGENCIES
From time to time, we may be subject to legal proceedings and claims that arise in the ordinary course of business.
In May 2005, the United States District Court for the Southern District of Texas dismissed with prejudice the class action lawsuit that had been filed in April 2003 against us and certain of our officers in the United States District Court for the Southern District of New York, alleging, among other things, that the defendants violated Sections 10(b) and 20(a) of the Securities Exchange Act of 1934 by making false and misleading statements about the Company's financial results for 2001 and 2002 In connection with the dismissal, no monies were paid to the plaintiff, but the parties agreed to be responsible for their own costs and legal fees.
During the second quarter of 2005, we received a request from the SEC to provide a sworn statement and certain information regarding our participation in the United Nations Oil-for-Food Program. The SEC has issued a formal order of investigation that names more than a dozen companies involved in the Oil-for-Food Program, including Core Laboratories. We have informed the SEC that we do have a subsidiary that had contracts with the United Nations to monitor the quantity of oil sold by the Government of Iraq under the Oil-for-Food Program, but neither we nor our subsidiaries purchased oil under the Oil-for-Food Program or sold any goods destined for Iraq under the Oil-for-Food Program.
We do not maintain any off-balance sheet debt or other similar financing arrangements nor have we formed any special purpose entities for the purpose of maintaining off-balance sheet debt.
Scheduled minimum rental commitments under non-cancelable operating leases at December 31, 2005, consist of the following (in thousands):
2006 $ 5,562 2007 4,100 2008 3,208 2009 2,593 2010 2,015 Thereafter 10,941 Total commitments $ 28,419
F-17

Operating lease commitments relate primarily to rental of equipment and office space. Rental expense for operating leases, including amounts for short-term leases with nominal future rental commitments, was approximately $7.6 million, $7.8 million and $7.6 million for the years ended December 31, 2005, 2004 and 2003, respectively. 12. CAPITAL STOCK Treasury Shares
On October 10, 2002, we activated a share repurchase program approved by shareholders at our annual meeting in May 2002. The program has continued to be extended at our annual meeting authorizing the purchase of up to 10% of our outstanding shares and is extended through October 15, 2006. The cancellation of shares has also been approved by shareholders at prior shareholder meetings. The repurchase of shares in the open market is at the discretion of management. From the activation of the share repurchase program through December 31, 2005, we have repurchased 9,394,465 shares for an aggregate purchase price of approximately $159.7 million, or an average price of $17.00 per share and have cancelled 8,371,450 shares at a cost of $129.2 million. We are incorporated in The Netherlands and under the Dutch Commercial Code, a corporation can hold a maximum of 10% of their outstanding shares in treasury. At December 31, 2005, we had the authority to repurchase 1,594,420 additional shares under our stock repurchase program. Subsequent to year end through February 22, 2006, we have repurchased approximately 148,515 shares at a total cost of approximately $6.6 million, of which 42,015 shares at a total cost of approximately $1.8 million related to the issuance of shares related to Tranche 2 of the Performance Share Award Program. 13. STOCK-BASED COMPENSATION
We have granted stock options and restricted stock awards under two stock option plans: the 1995 Long-term Incentive Plan (the "Plan") and the 1995 Non-employee Director Stock Option Plan (the "Non-employee Director Plan"). 1995 Long-term Incentive Plan
The Plan, as amended, provided for a maximum of 5,400,000 common shares to be granted to eligible employees. Awards under this plan are provided to encourage stock ownership by corporate and divisional management, as we believe that widespread common share ownership by key employees is an important means of encouraging superior performance and retaining employees. Stock options which have been granted under this plan have historically been granted at market value on the date of grant, are exercisable for a period of 10 years and vest in equal installments over four years. Common share options were, and restricted stock award grants are, considered annually based on competitive multiples of base salary. Senior executives typically have a higher multiple and, as such, have a greater portion of their total compensation linked to our long-term success. In determining the appropriate grant multiples, we target the market median among publicly held oilfield service companies of similar size. At December 31, 2005, approximately 100,000 shares were available for future issuance under the Plan.
In addition to stock options, the Plan also provides for the following three compensation programs: (1) the Executive Restricted Share Matching Program ("ESMP"), (2) the Performance Share Award Program ("PSAP") and (3) the Restricted Share Award Program ("RSAP"). Executive Restricted Share Matching Program:
The ESMP was implemented in June 2002 to encourage personal investment in our common stock by our executive officers. Under the program, we matched on a one-for-one basis each share that an executive purchased on the open market or held in his deferred compensation, 401(k) or other retirement account as of June 1, 2002, up to a maximum of 50,000 shares per participant. The ESMP is a variable stock award plan under which we have recorded compensation expense totaling $(0.1) million, $2.2 million and $0.8 million for the years ended December 31, 2005, 2004 and 2003, respectively.
In accordance with the program, the 132,853 shares previously issued to the participants became vested on June 1, 2005 and we recorded common stock and additional paid-in-capital totaling $3.4 million. In addition, on June 1, 2005, 48,425 shares of common stock were surrendered by the participants in order to settle any personal tax liabilities which may result from the award. These shares were valued at $1.2 million, or $25.54 per share, and were surrendered by the participants, and have been included as treasury shares at cost. Pursuant to the ESMP, on June 1, 2005, we issued an additional 76,200 restricted shares (the "Restricted Gross-Up Shares") in the aggregate to the participants to reimburse them for tax liabilities resulting from the vesting of the original grant of 132,853 restricted shares under the ESMP and their eventual vesting in the Restricted Gross-Up Shares. In order to vest in the Restricted Gross-Up Shares, a participant generally must remain in our employment until June 1, 2007, and maintain continuous ownership until
F-18

such date of (a) the equivalent number of shares the participant initially purchased in order to receive the original restricted matching share award plus (b) a number of the shares received in the restricted matching share award (which number of shares is generally equal to all of the shares included in the restricted matching share award less a percentage of such shares surrendered by the participant to pay applicable taxes upon their vesting). A participant may become vested in some or all of the Restricted Gross-Up Shares prior to June 1, 2007, in the event of a change in control or the termination of the participant's employment by reason of death, disability, an involuntary termination without cause, or after attainting the age of 60 and completing 10 years of employment with us. We account for the Restricted Gross-Up Shares as a variable award and have recorded compensation expense of $0.8 million related to these restricted shares as of December 31, 2005.
For diluted weighted average shares outstanding at December 31, 2005, we calculated 44,459 contingently issuable shares under the Restricted Gross-Up Shares, assuming the shares were fully vested as of the date of issuance. Performance Share Award Program:
Under the Performance Share Award Program, certain executives were awarded rights to receive a pre-determined number of common shares if certain performance targets are met, as defined in the applicable agreements for the respective three-year performance period. Rights relating to an aggregate of 125,000 shares ("Tranche 1"), 125,000 shares ("Tranche 2"), 120,000 shares ("Tranche 3") and 120,000 shares ("Tranche 4") were issued with respect to the performance periods ending on December 31, 2004, 2005, 2006 and 2007, respectively. Unless there is a change in control as defined in the PSAP, none of these awards will vest if the specified performance targets are not met as of the last day of the respective performance periods.
To meet the performance targets under Tranche 1 and Tranche 2, our common stock must perform as well as or better than the 50th percentile of the return earned by the common stock of the companies comprising the Philadelphia Oil Services Sector Index ("OSX") for the applicable performance period. If our common shares perform as well as or better than the 50th percentile but below the 75th percentile of the companies comprising the OSX, then the number of rights eligible to vest would be interpolated between 20% and 100% of the shares granted. If our common shares perform as well as or better than the 75th percentile of the companies comprising the OSX, then 100% of the rights would be eligible to vest.
The performance targets for Tranche 3 are similar to those for Tranches 1 and 2 for rights relating to 60,000 shares. Rights related to an additional 60,000 shares granted under Tranche 3 will be eligible to vest if our calculated return on equity ("ROE), as defined in the PSAP, equals or exceeds a pre-determined target return on equity of 18%. Pursuant to the agreement, return on equity is calculated by dividing earnings before interest and income tax from continuing operations for the performance period by ending shareholders' equity for the performance period. Unless there is a change in control, none of these 60,000 shares will be issued if our return on equity does not equal or exceed 12% for the three-year performance period ending December 31, 2006. If our return on equity for the performance period equals 12%, then 20% of the shares will be issued, and if our return on equity equals or exceeds 18%, then 100% of the shares will be issued. If our return on equity for the performance period is greater than 12% but less than 18%, then the number of shares to be issued would be interpolated based on the terms of the agreement. If a change in control occurs prior to the last day of the performance period and while the executive officer is employed by us, then all of the executive officer's performance shares will vest as of the date of the change in control.
The performance target for Tranche 4, for which the performance period began on January 1, 2005 and ends on December 31, 2007, is based on a calculated ROE similar to the terms for Tranche 3 discussed above, except that the pre-determined target ROE is 24%. Unless there is a change in control, none of these 120,000 shares will be issued if the ROE for Core Laboratories is less than 20% for the three-year performance period. If our ROE for the performance period equals 20%, then 50% of the shares will be issued, and if our ROE for the performance period equals or exceeds 24%, then 100% of the shares will be issued. If our ROE for the performance period is greater than 20% but less than 24%, then the number of shares to be issued would be interpolated based on the terms of the agreement.
In February 2005, the Options Subcommittee of our Board of Supervisory Directors determined that the performance target criteria had been met related to an aggregate of 125,000 shares under Tranche 1. We issued these 125,000 common shares on February 28, 2005, and recorded common stock and additional paid in capital totaling $3.3 million, of which $2.9 million was recognized as compensation expense in 2004 and $0.4 million was recognized in 2005 related to the change in the fair value of the shares between December 31, 2004 and the date of issuance. Simultaneously, we repurchased 48,000 of these common shares from the participants at the closing market price on that day to settle personal tax liabilities which may result from the issuance of these shares, as permitted by the agreement. We recorded these repurchased shares as treasury stock with an aggregate cost of $1.3 million, at $26.89 per share.
In January 2006, the Options Subcommittee of our Board of Supervisory Directors determined that the performance target criteria had been met relating to an aggregate of 125,000 shares under Tranche 2. We issued these 125,000 common shares on January 17, 2006, and recorded common stock and additional paid in capital totaling $5.4 million, of which $4.7 million was recognized as
F-19

compensation expense in 2005 and $0.7 million was recognized in 2006 relating to the change in the fair value of the shares between December 31, 2005 and the date of issuance. Simultaneously, we repurchased 42,015 of these common shares from the participants at the closing market price on that day to settle personal tax liabilities which may result from the issuance of these shares, as permitted by the agreement. We recorded these repurchased shares as treasury stock with an aggregate cost of $1.8 million, at $42.98 per share.
We included $3.0 million and $1.5 million of compensation expense in our results of operations based on our December 31, 2005 stock price for the year ended December 31, 2005 related to Tranche 3 and Tranche 4 of the PSAP, respectively, as management believes it is probable that the performance requirements related to these shares will be met.
For diluted weighted average shares outstanding at December 31, 2005, we calculated 259,561 contingently issuable shares under the PSAP based on our common stock's performance relative to the OSX and our ROE, assuming the shares were fully vested as of that date. These contingently issuable shares include 125,000 shares related to Tranche 2, for which the performance period has ended as of December 31, 2005, but shares were not yet issued. According to the terms of the PSAP, these shares are not considered vested until the Options Subcommittee of our Board of Supervisory Directors verifies in writing that the performance targets were met. Therefore, these shares are not considered issued for purposes of calculating basic earnings per share at December 31, 2005. Restricted Share Award Program:
In 2004, the Options Subcommittee of our Board of Supervisory Directors approved the Restricted Share Award Program (the "RSAP") to continue to attract and retain the best employees, and to better align employee interests with those of our shareholders. Under this arrangement, in 2004, we granted to key employees contingent rights to receive an aggregate of 130,500 shares of our common stock. This arrangement was a fixed award which required us to recognize compensation expense over a seven-year vesting period that began on January 1, 2004. The award contained a performance accelerator, whereby, if our average closing stock price was equal to or above $25 per share over a period of 20 consecutive trading days which ended within the measurement period, which began on the 21st trading day after September 1, 2005 and was to end on September 1, 2007, then all of the shares would vest and we would record stock-based compensation expense equal to the unamortized balance of this fixed award. Because our average closing stock price attained the $25 per share level and triggered the acceleration event within the measurement period, all 127,900 shares that were outstanding on that date vested causing us to recognize compensation expense totaling $2.5 million under this arrangement for the year ended December 31, 2005.
In 2005, the Options Subcommittee of our Board of Supervisory Directors approved awards of 142,600 restricted shares of our common stock under the RSAP at a grant date fair value of $26.80, of which 139,400 were outstanding at December 31, 2005. Similar to the grant discussed previously, this arrangement is a fixed award which will require us to recognize compensation expense totaling $3.8 million over a seven-year vesting period that began on January 1, 2005. This award also contains two performance accelerators either of which, if satisfied, or if certain other events occur as specified in the related agreements, may require earlier recognition of this expense. The first performance accelerator requires that our average closing stock price attain a level equal to or above $28 per share over a period of 20 consecutive trading days ending within the period beginning on the 21st trading day after April 1, 2006 and ending on April 1, 2008. The second performance accelerator requires the average closing stock price to attain a level equal to or above $32 per share over a period of 20 consecutive trading days ending within the period beginning on the last trading day after April 1, 2008 and ending April 1, 2010. We have recorded compensation expense totaling $2.8 million under this arrangement for the year ended December 31, 2005 as management believes it is probable that the first performance accelerator related to these shares will be met. 1995 Non-employee Director Stock Option Plan
The 1995 Non-employee Director Stock Option Plan provides common shares for grant to our eligible Supervisory Directors. The maximum number of shares initially available for award under this plan was limited to 100,000 common shares. The plan was amended and restated effective May 1997 and May 2000 to authorize an additional 600,000 common shares for grant. Under this plan, each non-employee director is generally granted an option to acquire 1,000 common shares on the date such individual first becomes an eligible director. In addition, an option to acquire 10,000 common shares will be granted to each non-employee Supervisory Director (20,000 common shares if such non-employee Supervisory Director is the Chairman) each year generally on the first date in the calendar year set by the Supervisory Board for the issuance of stock options to more than 10 employees under our 1995 Long-Term Incentive Plan, as amended. Only non-employee Supervisory Directors are eligible for these options grants, under which options are exercisable for a period of up to 10 years and vest on the first anniversary of the date of grant. Options under this plan are granted at market value on the date of grant.
As of December 31, 2005, approximately 168,000 shares were available for issuance under the 1995 Non-employee Director Stock Option Plan.
F-20

The following table presents the change in outstanding stock options issued under the 1995 Long-term Incentive Plan and the 1995 Non-employee Director Stock Option Plan for the years ended December 31, 2005, 2004 and 2003.
Shares Range of Exercise
Prices
Weighted Average
Exercise Price Balance as of December 31, 2002 3,853,925 $ 0.01 - 61.19 $ 13.67 Options granted 646,000 8.84 - 11.15 8.85 Options exercised (154,560) 0.96 - 14.00 9.93 Options canceled (255,449) 9.50 - 19.38 15.26Balance as of December 31, 2003 4,089,916 0.01 - 61.19 12.97 Options granted 71,000 23.00 23.00 Options exercised (697,326) 0.01 - 22.56 12.22 Options canceled (110,426) 7.09 - 61.19 13.92Balance as of December 31, 2004 3,353,164 0.01 - 61.19 12.94 Options granted 71,000 25.00 25.00 Options exercised (655,255) 1.50 - 19.52 12.83
$ 13.41
Options canceled (5,750) 8.84 - 23.00 15.63Balance as of December 31, 2005 2,763,159 $ 0.01 - 61.19
The following table summarizes stock options outstanding and exercisable as of December 31, 2005 by exercise price range:
Options Outstanding
Options Exercisable
Shares
Weighted Average
Remaining Life
Weighted Average
Exercise Price Shares
Weighted Average
Exercise PriceRange of Exercise Prices: $0.01 $ 0.01
9.36
84,0001.9
41,465 3.3 $ 0.01 41,465 $7.09 to $12.13 1,306,755 5.3 1,306,755 9.36$13.06 to $17.57 724,038 4.5 15.01 724,038 15.01$18.38 to $23.00 606,624 4.0 19.53 606,624 19.53$25.00 to $26.00 8.6 25.10 84,000 25.10$61.19 277 61.19 277 61.19 2,763,159 4.9 $ 13.41 2,763,159 $ 13.41
In November 2005, the Options Subcommittee of our Board of Supervisory Directors approved, effective December 31, 2005, a
modification of all unvested options, whereby, all unvested options then outstanding became fully vested. Prior to the modification, there were 322,072 stock options that were unvested, which represented less than 12% of the total stock options that were outstanding. The options were vested in anticipation of the adoption of SFAS No. 123R as the Option Subcommittee determined that the administrative costs of applying the provisions of SFAS No. 123R to the few remaining unvested options far exceeded the benefit of allowing these options to vest as originally scheduled under the plans. As a result of the modification, we determined that the increase in the intrinsic value of the unvested options over the original grant price was approximately $7.9 million. We have recorded, at December 31, 2005, an amount approximating $0.1 million, which represents management's estimate of those employees that would receive a benefit by leaving the Company with fully vested options prior to the original vesting date of the option grant. Should the actual rate of employees leaving the Company with such a benefit differ from management's initial estimate at December 31, 2005, an adjustment to expense will be recorded as the difference between the actual benefit rate and the initial benefit estimate.
F-21

14. OTHER EXPENSE (INCOME)
Year Ended 2004
The components of other expense (income), net, are as follows (in thousands):
2005 2003 Minority interest $ (57) $ 1 $ 482 (Gain) loss on sale of assets (293) 550
265
(402) (189) - -
$ (761) $ (1,351)
357 Equity in (income) loss of affiliates (36) (52) Foreign exchange loss (gain) 1,619 (788) (410) Interest income (186) Gain on involuntary sale of asset (875) Gain on insurance recovery (334) - - Other 569 (600) (1,542) Total other expense (income), net $ 191
In 2003, the British government notified us that it would exercise its right of eminent domain thereby involuntarily acquiring the
property of one of our operating facilities. Prior to December 31, 2003, we received an initial payment from the British government for $0.6 million as compensation for this property. In the second quarter of 2005, we negotiated and received an additional settlement which resulted in a $0.9 million gain.
During the first quarter of 2005, a building at our manufacturing plant in Godley, Texas, was damaged by fire, resulting in the loss of the building, some inventory, as well as other business equipment and supplies. In June 2005, we filed claims with our insurance carrier for reimbursement of these costs resulting in a net gain of $0.3 million. We filed a claim for business interruption costs associated with this fire during the third quarter and expect to settle these claims during 2006. No impact from the claim for the business interruption has been recorded in the results of operations as of December 31, 2005. Foreign Currency Risk
We operate in a number of international areas which exposes us to foreign currency exchange rate risk. We do not currently hold or issue forward exchange contracts or other derivative instruments for hedging or speculative purposes. (A foreign exchange contract is an agreement to exchange different currencies at a given date and at a specified rate.) Foreign exchange gains and losses are the result of fluctuations in the U.S. Dollar against foreign currencies and are included in other expense (income) in the statements of operations. We recognized foreign exchange losses in countries where the USD weakened against the local currency and we had net monetary liabilities denominated in the local currency; as well as countries where the USD strengthened against the local currency and we had net monetary assets denominated in the local currency. We recognized foreign exchange gains in countries where the USD strengthened against the local currency and we had net monetary liabilities denominated in the local currency and in countries where the USD weakened against the local currency and we had net monetary assets denominated in the local currency. Foreign exchange gains and losses are summarized in the following table (in thousands):
Year Ended
2005
Losses (gains) by currency 2004 2003 British Pound $ 269 $ (88) $ 57 Canadian Dollar
161 Russian Ruble
148 Other currencies
Total losses (gains)
(147) (457) (1,065) Euro 279 96
236 (370) (187) Venezuelan Bolivar 399 580
583 (549) 476 $ 1,619 $ (788) $ (410)
In February 2003, the Venezuelan government imposed an exchange rate of 1,596 Bolivar ("VEB") per USD. In February 2004,
the government devalued the VEB by 20% to 1,915 VEB per USD. Effective March 2, 2005, the Venezuelan government devalued the VEB by an additional 12% to 2,147 VEB per USD. At December 31, 2005, our net monetary assets denominated in VEB in Venezuela were $2.1 million.
F-22
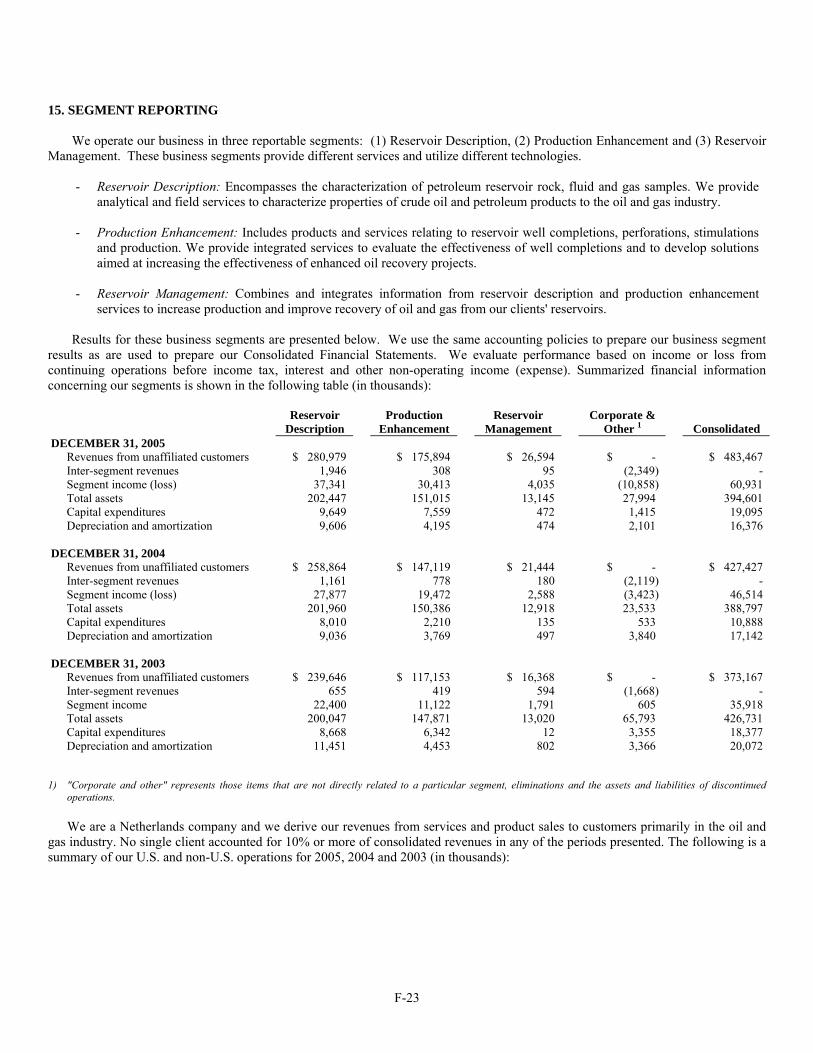
15. SEGMENT REPORTING
Reservoir Description: Encompasses the characterization of petroleum reservoir rock, fluid and gas samples. We provide analytical and field services to characterize properties of crude oil and petroleum products to the oil and gas industry.
Production Enhancement: Includes products and services relating to reservoir well completions, perforations, stimulations and production. We provide integrated services to evaluate the effectiveness of well completions and to develop solutions aimed at increasing the effectiveness of enhanced oil recovery projects.
-
Consolidated
We operate our business in three reportable segments: (1) Reservoir Description, (2) Production Enhancement and (3) Reservoir
Management. These business segments provide different services and utilize different technologies.
-
-
Reservoir Management: Combines and integrates information from reservoir description and production enhancement services to increase production and improve recovery of oil and gas from our clients' reservoirs.
Results for these business segments are presented below. We use the same accounting policies to prepare our business segment
results as are used to prepare our Consolidated Financial Statements. We evaluate performance based on income or loss from continuing operations before income tax, interest and other non-operating income (expense). Summarized financial information concerning our segments is shown in the following table (in thousands):
Reservoir
Description Production
Enhancement Reservoir
Management Corporate &
Other 1 DECEMBER 31, 2005 $ -
Inter-segment revenues 1,946 95 (2,349) - 4,035
151,015 13,145 27,994 394,601
16,376
(2,119) - (3,423) 46,514
150,386 12,918 23,533 388,797 8,010
Depreciation and amortization 17,142
DECEMBER 31, 2003 $ 117,153 $ - $ 373,167 Inter-segment revenues 655
1,791 35,918 200,047 13,020
8,668 12 3,355 11,451 4,453
1) "Corporate and other" represents those items that are not directly related to a particular segment, eliminations and the assets and liabilities of discontinued operations.
Revenues from unaffiliated customers $ 280,979 $ 175,894 $ 26,594 $ 483,467 308 Segment income (loss) 37,341 30,413 (10,858) 60,931 Total assets 202,447 Capital expenditures 9,649 7,559 472 1,415 19,095 Depreciation and amortization 9,606 4,195 474 2,101 DECEMBER 31, 2004
Revenues from unaffiliated customers $ 258,864 $ 147,119 $ 21,444 $ - $ 427,427 Inter-segment revenues 1,161 778 180 Segment income (loss) 27,877 19,472 2,588
Total assets 201,960 Capital expenditures 2,210 135 533 10,888 9,036 3,769 497 3,840
Revenues from unaffiliated customers $ 239,646 $ 16,368
419 594 (1,668) - Segment income 22,400 11,122 605
Total assets 147,871 65,793 426,731 Capital expenditures 6,342 18,377 Depreciation and amortization 802 3,366 20,072
We are a Netherlands company and we derive our revenues from services and product sales to customers primarily in the oil and
gas industry. No single client accounted for 10% or more of consolidated revenues in any of the periods presented. The following is a summary of our U.S. and non-U.S. operations for 2005, 2004 and 2003 (in thousands):
F-23

United States Canada
Other Countries Consolidated
DECEMBER 31, 2005
GEOGRAPHIC INFORMATION
Revenues $ 214,843 $ 64,607 $ 204,017 $ 483,467 Operating income 38,921 187,210 394,601
Revenues Operating income 11,133 46,514
192,380 388,797
DECEMBER 31, 2003 Revenues $ 42,311
Total assets 179,249 35,348 212,134 426,731
16. DISCONTINUED OPERATIONS
In March 2004, the Board of Supervisory Directors approved a plan to exit the specialized geophysical and seismic-related business that was included in our Reservoir Management segment.
On April 22, 2004, we sold our specialized geophysical and seismic-related assets and business to Paradigm Geotechnology ("Paradigm"), a privately held company, for approximately $18.2 million in cash proceeds in addition to certain assumed liabilities. The amount of consideration paid was determined in arms-length negotiations between the parties. The transaction includes certain assets and liabilities in Calgary and Houston and two entities in Mexico. In late 2004, we paid $1.5 million to Paradigm related to the working capital adjustment provision of the sales agreement. Furthermore, in connection with the sales agreement, we paid employee costs of approximately $0.1 million in 2005 and $1.0 million in 2004. Proceeds from the sale of this business were used to pay down debt and continue our stock repurchase program. As part of the sales agreement an indemnification provision provided for valuation losses incurred by Paradigm for a period of five years after the sales date. During December 2005, we finalized the terms under the contract for sale of the business through a negotiated payment of $0.5 million, net of taxes.
The results of operations of the specialized geophysical and seismic-related business sold or disposed of are reported as Discontinued Operations on the Consolidated Statements of Operations and the assets and liabilities associated with these discontinued operations are classified as Assets and Liabilities Held for Sale.
Based on the sales price and estimates of fair value, we adjusted the related assets to their estimated fair value in 2004. As a result, we recognized losses at that time for the impairment of goodwill, intangible assets and long-lived assets. In addition, we recorded a charge to increase the allowance for doubtful accounts. These charges have been included in the loss from discontinued operations. The 2004 pre-tax charges are summarized below (in thousands):
Impairment of goodwill to fair value
Impairment of long-lived assets to fair value 1,200
30,693 15,624 14,614 60,931 Total assets 168,470
DECEMBER 31, 2004
$ 177,918 $ 56,553 $ 192,956 $ 427,427 25,082 10,299
Total assets 159,890 36,527
$ 151,042 $ 179,814 $ 373,167 Operating income 15,369 3,897 16,652 35,918
U.S. revenues derived from exports were approximately $35.5 million, $30.6 million and $22.4 million in 2005, 2004 and 2003, respectively. Operating income and total assets associated with our corporate operations have been included in the results for the United States.
$ 4,887
Impairment of intangibles to fair value 3,092 3,266
Provision for doubtful accounts Total $ 12,445
Historical results for discontinued operations have been adjusted to eliminate corporate allocations and inter-company
transactions. These results of operations, as adjusted, are presented in the following table for the years ended December 31, 2005, 2004 and 2003 (in thousands):
F-24

Year Ended December 31, 2005 2004 2003 Revenue $ 3,639 $ 32,470 $ - Pretax loss $ 791 $ 15,843 $ 2,630
The summarized balance sheet lines of the specialized geophysical and seismic-related business as of December 31, 2005 and December 31, 2004 have been reclassified as shown below (in thousands):
Loss after tax benefit $ 506 $ 15,732 $ 2,092
2005 2004
Accounts payable $ 800 $ 59 Other accrued expenses - 238
Current liabilities of discontinued operations $ 800 $ 297
17. RECENT ACCOUNTING PRONOUNCEMENTS
In May 2005, the FASB issued SFAS No. 154, "Accounting Changes and Error Corrections, a Replacement of APB Opinion No.
20 and FASB Statement No. 3." This statement requires retrospective application of changes in accounting principle to prior periods' financial statements, rather than the use of the cumulative effect of a change in accounting principle, unless impracticable. If impracticable to determine the impact on prior periods, then the new accounting principle should be applied to the balances of assets and liabilities as of the beginning of the earliest period for which retrospective application is practicable, with a corresponding adjustment to equity, unless impracticable for all periods presented, in which case prospective treatment should be applied. This statement applies to all voluntary changes in accounting principle, as well as those required by the issuance of new accounting pronouncements if no specific transition guidance is provided. This statement does not change the previously-issued guidance for reporting a change in accounting estimate or correction of an error. SFAS No. 154 becomes effective for accounting changes and corrections of errors made in fiscal years beginning after December 15, 2005. We do not expect this pronouncement to have a material impact on our financial position and results of operations.
In December 2004, the FASB issued SFAS No. 123R, "Share-Based Payment," which revises SFAS No. 123 and supersedes ABP Opinion No. 25. This statement will require us to measure the cost of employee services received in exchange for an award of equity instruments based on the grant-date fair value of the award, with limited exceptions. We have adopted this new standard effective January 1, 2006 using the modified-prospective transition method. As of December 31, 2005, all outstanding stock options have been fully vested. Upon adoption, this statement had minimal impact on our financial position and results of operations. Results from prior periods have not been restated.
In November 2004, the FASB issued SFAS No. 151, "Inventory Costs." This pronouncement amends previous guidance to clarify the accounting for abnormal amounts of idle facility expense, freight, shipping and handling costs and spoilage, and generally requires that those items be recognized as current period charges. In addition, this pronouncement requires that fixed production overhead allocations to conversion costs be based on the normal capacity of the production facilities. This statement becomes effective for inventory costs incurred during fiscal years beginning after June 15, 2005, and will be applied prospectively. We expect the adoption of this statement to have minimal impact on our financial position and results of operations.
F-25
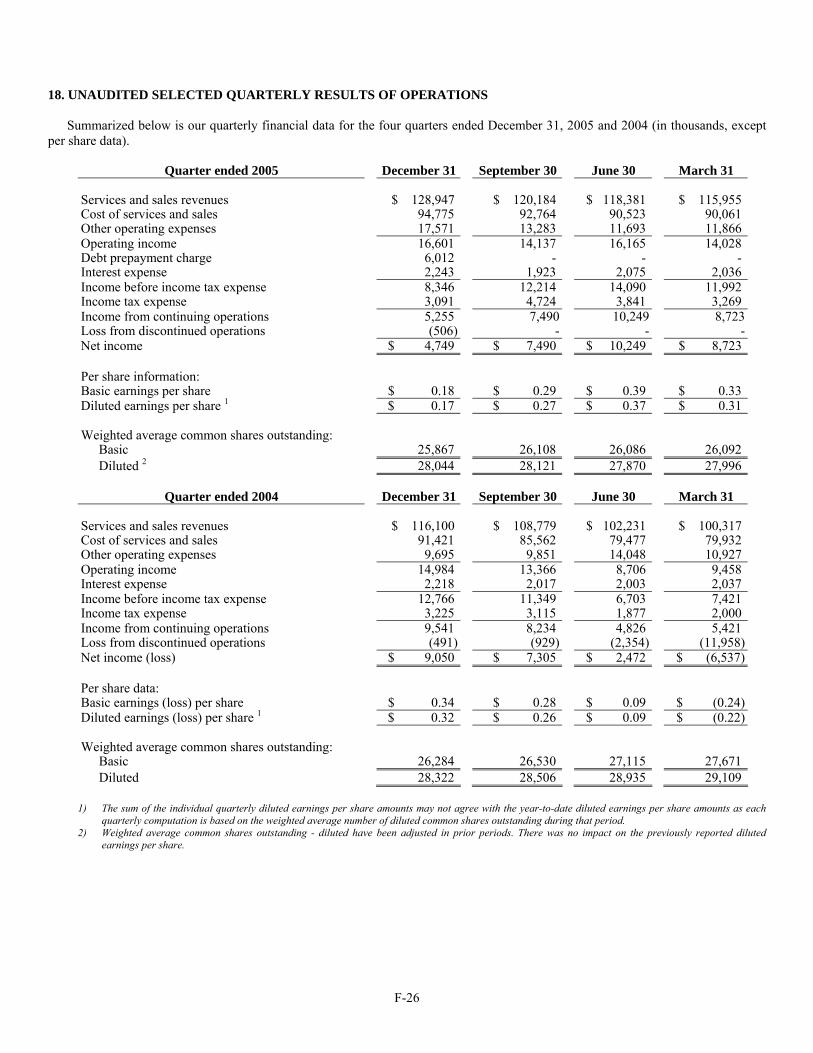
18. UNAUDITED SELECTED QUARTERLY RESULTS OF OPERATIONS
Summarized below is our quarterly financial data for the four quarters ended December 31, 2005 and 2004 (in thousands, except per share data).
Quarter ended 2005 September 30 June 30 March 31
December 31
Services and sales revenues $ 128,947 $ 120,184 $ 118,381 $ 115,955 Cost of services and sales 94,775
17,571 14,137
92,764 90,523 90,061 Other operating expenses 13,283 11,693 11,866 Operating income 16,601 16,165 14,028 Debt prepayment charge Interest expense 2,243 1,923 2,075 2,036
12,214 14,090
6,012 - - -
Income before income tax expense 8,346 11,992 Income tax expense 3,091
5,255 7,4904,724 3,841 3,269
Income from continuing operations 10,249 8,723Loss from discontinued operations (506) - - Net income $ 8,723
-$ 4,749 $ 7,490 $ 10,249
Per share information: Basic earnings per share
$ 0.17 $ 0.27 $ 0.18 $ 0.29 $ 0.39 $ 0.33
Diluted earnings per share 1 $ 0.37 $ 0.31 Weighted average common shares outstanding:
26,108 26,086 26,092 28,044
Basic 25,867
Diluted 2 28,121 27,870 27,996
Quarter ended 2004 December 31 September 30 June 30 March 31 Services and sales revenues $ 116,100 $ 108,779 $ 102,231 $ 100,317 Cost of services and sales 91,421 85,562 79,477 79,932 Other operating expenses 9,695 9,851 14,048 10,927 Operating income 14,984 13,366 8,706 9,458 Interest expense 2,218 2,037 2,017 2,003 Income before income tax expense 12,766 11,349 6,703 7,421 Income tax expense 3,225 3,115
4,826 1,877 2,000
Income from continuing operations 9,541 8,234 5,421 Loss from discontinued operations (491) (929) (2,354) (11,958)Net income (loss) $ 9,050 $ 7,305 $ 2,472 $ (6,537) Per share data:
$ (0.24)Basic earnings (loss) per share $ 0.34 $ 0.28 $ 0.09 Diluted earnings (loss) per share 1 $ 0.32 $ 0.26 $ 0.09 $ (0.22)
Weighted average common shares outstanding: Basic 26,284 26,530 27,115 27,671 Diluted 28,322 28,506 28,935 29,109
1) The sum of the individual quarterly diluted earnings per share amounts may not agree with the year-to-date diluted earnings per share amounts as each
quarterly computation is based on the weighted average number of diluted common shares outstanding during that period. 2) Weighted average common shares outstanding - diluted have been adjusted in prior periods. There was no impact on the previously reported diluted
earnings per share.
F-26
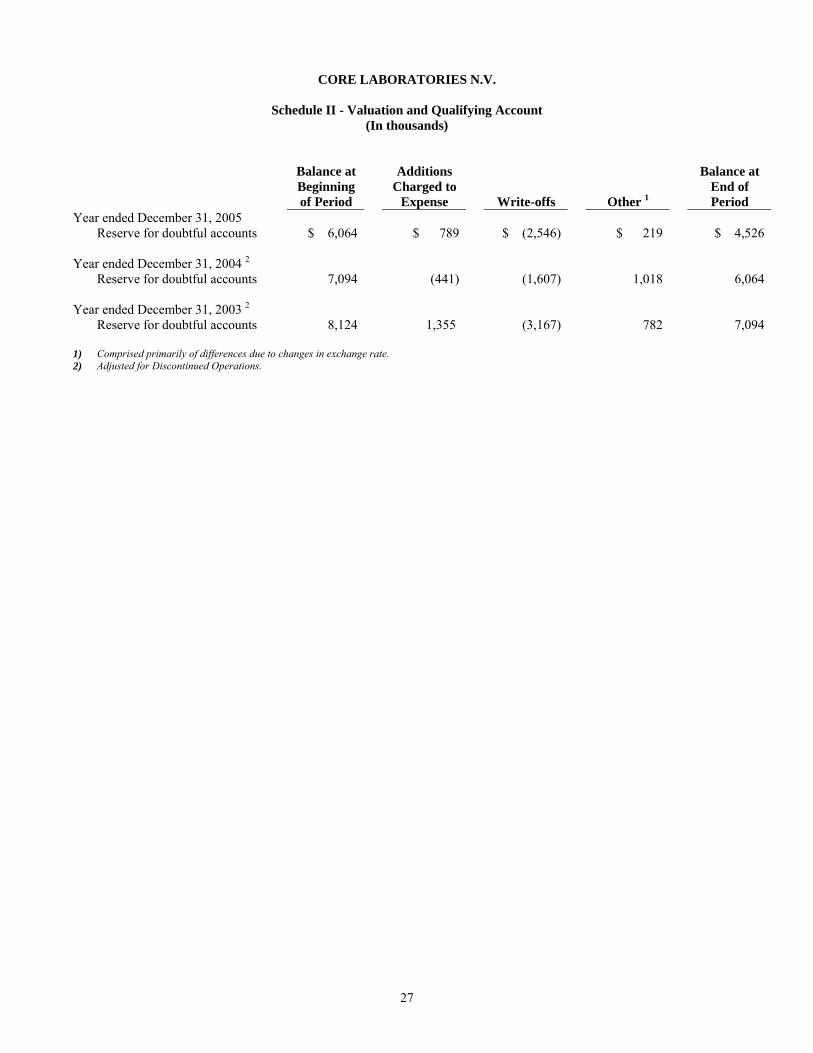
CORE LABORATORIES N.V.
Schedule II - Valuation and Qualifying Account (In thousands)
Expense Write-offs Other 1 Period
Year ended December 31, 2005
Balance at Additions Balance at Beginning Charged to End of of Period
Reserve for doubtful accounts
Year ended December 31, 2004 2
Year ended December 31, 2003 2
Comprised primarily of differences due to changes in exchange rate.
2)
$ 6,064 $ 789 $ (2,546) $ 219 $ 4,526
Reserve for doubtful accounts 7,094 (441) (1,607) 1,018 6,064
Reserve for doubtful accounts 8,124 1,355 (3,167) 782 7,094 1)
Adjusted for Discontinued Operations.
27
Exhibit 10.26
Each Supervisory Director of Core Laboratories who is not our full-time employee is reimbursed for all out-of-pocket expenses incurred in attending any Supervisory Board or committee meeting. Effective January 1, 2005, each Supervisory Director who is not our full-time employee is paid: (1) an annual retainer of $30,000, payable semiannually in arrears; or if the Audit Committee Chair, an annual retainer of $45,000, or if the chair of either the Compensation Committee or Nominating and Governance Committee, an annual retainer of $35,000; (2) $1,500 per meeting of the Supervisory Board at which the individual is present in person; and (3) $1,500 per meeting for each committee meeting at which the individual is present in person. Supervisory Directors who are our full-time employees receive no compensation for serving as Supervisory Directors.
NON-EMPLOYEE DIRECTOR COMPENSATION SUMMARY
Our 1995 Non-employee Director Stock Option Plan, as amended, which we refer to as the "Nonemployee Director Plan,"
provides for the issuance of up to 700,000 of our common shares to eligible Supervisory Directors. Under the Non-employee Director Plan, each non-employee director is generally granted an option to acquire 1,000 common shares on the date such individual first becomes an eligible director. In addition, an option to acquire 10,000 common shares will be granted to each non-employee Supervisory Director (20,000 common shares if such non-employee Supervisory Director is the Chairman) each year generally on the first date in the calendar year set by the Supervisory Board for the issuance of stock options to more than ten employees under our 1995 Long-term Incentive Plan, as amended. Supervisory Directors who are also our employees receive no grants under the Nonemployee Director Plan. Options granted will be exercisable for a period of up to ten years and will vest one year following the date of grant. The exercise price of options granted under the Nonemployee Director Plan will be equal to the market price of our common shares on the date of grant.
28

Exhibit 21.1
Legal Seat Core Laboratories Resources, N.V. 100%
Investment in Subsidiaries Listing
Co. No. Name Ownership % 21 Curacao, Netherlands Antilles 23
Core Laboratories International Trading N.V. Curacao, Netherlands Antilles 27 Core Laboratories I.P. Inc. 35 Curacao, Netherlands Antilles
Curacao, Netherlands Antilles
Delaware, United States 100%
53 Jakarta, Indonesia 70%
62
Core Laboratories Netherlands B.V. Amsterdam, The Netherlands
66 Corelab Nigeria Limited 100%
101
105 Saybolt Estonia Ltd.
Bangkok, Thailand Saybolt United Kingdom Ltd.
100%
100% 123 Coatzacoalcos, Mexico 130
Core Laboratories Panama, S.A. Panama City, Panama 100% 133 Cayman 100%
Saybolt Analyt Holding B.V. 137 100%
Odessa, Ukraine Saybolt Bulgaria Ltd.
141 100% 142 Ventspils, Latvia 100%
Saybolt de Ecuador S.A. Quito, Ecuador Saybolt Bahamas Ltd.
100%
155 Saybolt Aruba N.V. Aruba, Netherlands Antilles Bonaire, Netherlands Antilles 100% Aruba 100%
Core Laboratories International Licensing N.V. Curacao, Netherlands Antilles 100% 25 100%
Curacao, Netherlands Antilles 100% Core Laboratories Holding Inc. 100%
48 Core Laboratories Middle East Services B.V. 100% 49 Core Export Sales, Inc. Bridgetown, Barbados 100% 50 Core Laboratories L.P. 100% 52 Core Laboratories Canada Limited Alberta, Canada
PT Corelab Indonesia 55 Core Laboratories SDN BHD Kuala Lumpur, Malaysia 100% 56 Core Laboratories Australia PTY LTD Perth, Australia 100%
Core Laboratories International B.V. Amsterdam, The Netherlands 100% 63 Core Laboratories Sales N.V. Curacao, Netherlands Antilles 100% 64 Core Laboratories (U.K.) Limited London, United Kingdom 100% 65 100%
Lagos, Nigeria 70 Core Laboratories Venezuela S.A. Caracas, Venezuela 100% 73 Core Laboratories Corporate Holding B.V. The Netherlands 100% 74 Corelab Brasil Ltda Brasil 100% 75 Core Laboratories (Barbados) Ltd. Curacao, Netherlands Antilles 100%
100 Saybolt International B.V. Vlaardingen, The Netherlands 100% Saybolt Holding B.V. Vlaardingen, The Netherlands 100%
102 Saybolt Denmark A/S Copenhagen, Denmark 100% 103 Saybolt van Duyn GmbH Essen, Germany 100% 104 Saybolt Espana S.A. Madrid, Spain 100%
Tallinn, Estonia 100% 106 Saybolt Finland Oy Hamina, Finland 100% 107 Saybolt France S.A. Port-Le_Bouc, France 99.5% 108 Saybolt Italia S.R.L. Siracusa, Italy 100% 109 Saybolt Malta Ltd. Kalafran, Malta 100% 111 Saybolt Greece, Ltd. Athens, Greece 100% 112 Saybolt (Portugal) Inspeccao de Productos Petroliferos, Lda. Lisbon, Portugal 100% 115 Saybolt South Africa PTY LTD Cape Town, South Africa 100% 116 Saybolt Sweden AB Gothenburg, Sweden 100% 117 Saybolt Thailand Ltd. 100% 118 Purfleet, United Kingdom 100% 119 Saybolt Meteorology & Instrumentation B.V. Vlaardingen, The Netherlands 120 Saybolt Nederland B.V. Vlaardingen, The Netherlands 100% 122 Saybolt North American Holding B.V. Vlaardingen, The Netherlands
Saybolt de Mexico S.A. de C.V. 100% Saybolt L.P. New Jersey, United States 100%
132 E.W. Saybolt & Co. (Cayman) Ltd.
134 Vlaardingen, The Netherlands 100% Saybolt Evrasia ZAO Moscow, Russia Federation
138 Saybolt−Ukraine 100% 139 Bulgaria 100%
Saybolt Baltija, Ltd. Klaipeda, Lithuania Saybolt Latvia
145 100% 148 Freeport, Bahamas 100% 151 Saybolt de Costa Rica, S.A. San Jose, Costa Rica 152 Saybolt West Indies N.V. Kingston, Jamaica 100% 153 Saybolt Colombia Ltda. Barranquilla, Colombia 95%
100% 156 Saybolt Bonaire N.V. 157 Saybolt Caribbean N.V.
29

Co. No. Name Legal Seat Ownership % 158 Saybolt Curacao N.V. Curacao, Netherlands Antilles 100% 159 Saybolt Trinidad & Tobago Ltd. Marabella, Trinidad 100%
100%
65% 100%
175
Saybolt Belgium China 100%
181
Core Laboratories Angola Ltd.
Core Laboratories (H.K.) Limited Hong Kong United Kingdom
100%
Owen Oil Tools de Mexico, S.A. de C.V. Owen Oil Tools de Venezuela, C.A.
100%
213 100% The Petrak Group S.A.
Delaware, United States
United States
Core Laboratories Global N.V.
Labton Limited
160 Saybolt Eastern Hemisphere B.V. Vlaardingen, The Netherlands 162 Saybolt Bahrain Klaipeda, Lithuania 100% 165 Saybolt (M) SDN BHD Kuala Lumpur, Malaysia 40% 166 PT Saybolt Indonesia Jakarta, Indonesia 170 Saybolt Azerbaijan, Ltd. Azerbaijan 171 Saybolt Azerbaijan B.V. Azerbaijan 50%
Core Laboratories El Salvador S.A. de C.V. El Salvador 100% 176 Saybolt Shelf I BV Vlaardingen, The Netherlands 100% 177 Belgium 100% 179 Saybolt (Tianjin) Meteorology & Instrumentation Company
Saybolt Latin America Holding B.V. Vlaardingen, The Netherlands 100% 182 Saybolt Qatar London, United Kingdom 100% 183 Angola 100% 188 Saybolt (Singapore) PTE LTD Singapore 100% 190 100% 192 Quantoil Ltd. 100% 195 E.W. Saybolt & Co. S.A. Panama City, Panama 200 Owen Oil Tools L.P. Texas, United States 100% 204 Tabasco, Mexico 100% 205 Anaco, Anzoategui, Venezuela 100% 209 Owen Oil Tools Argentina, S.A. Argentina 100% 210 Owen Compliance Services, Inc. Texas, United States 100% 212 Owen de Mexico S.A. de C.V. Mexico
Owen Oil Tools (U.K.) Ltd. Croydon, United Kingdom 220 Zug, Switzerland 100% 222 Saybolt Services Ltd. United Kingdom 100% 226 Core Laboratories LLP (Kazakhstan) 100% 231 DP Saybolt Turkmenistan (formerly Petrak Turkmenistan Ltd.) Turkenbashi, Turkmenistan 100% 260 Petroleum Analysts ZAO Moscow, Russia Federation 100% 261 OOO Lab Technics Texas, United States 100% 262 Saybolt Belarus (formerly IP Saybolt (Belorussia)) Vlaardingen, The Netherlands 100% 270 Saybolt Test OOO Bashkortostan, Russian Federation 100% 273 Saybolt Armenia Yerevan, Armenia 100% 276 Saybolt Bashkortostan Bashkortostan, Russian Federation 60% 277 SP TOO Saybolt Kazakhstan Kazakhstan 90% 278 Saybolt Mongol HHK Vlaardingen, The Netherlands 100% 290 Core Lab de Mexico, S.A. de C.V. Mexico City, Mexico 100% 292 Core Lab Operations S.A. de C.V. Mexico 100% 293 Pro Technics de Mexico, S.A. de C.V. Mexico 100% 294 Core Lab Services S.A. de C.V. Mexico 100% 297 Core Lab Petroleum Services S.A. de C.V. Mexico 99% 298 Core Lab Executives S.A. de C.V. Mexico 99% 310 TomoSeis Corporation United States 100% 320 Core Petrophysics, Inc. 100% 325 Stim-Lab, Inc. Oklahoma, United States 100% 350 Curacao, Netherlands Antilles 100% 370 Coherence Technology Company, Inc. Denver, Colorado 100% 375 CTC Pulsonic Nigeria Limited Lagos, Nigeria 80% 381 Production Enhancement Corporation United States 100% 388 PENCOR de Venezuela, C.A. Venezuela 100% 391 PENCOR International Ltd. Jersey Channel Islands 100% 400 Coreton Limited Croydon, United Kingdom 100% 402 Croydon, United Kingdom 100% 411 FE & FEFH Holding, Inc. Calgary, Canada 100%
30

Exhibit 23.1
CONSENT OF INDEPENDENT REGISTERED PUBLIC ACCOUNTING FIRM
We hereby consent to the incorporation by reference in the Registration Statements on Form S-8 (Nos. 333-73772, 333-73774, 333-80473 and 333-43859) of Core Laboratories N.V. of our report dated February 22, 2006 relating to the consolidated financial statements, financial statement schedule, management's assessment of the effectiveness of internal control over financial reporting and the effectiveness of internal control over financial reporting, which appears in this Form 10-K.
PricewaterhouseCoopers LLP Houston, Texas February 23, 2006
31

Exhibit 31.1 CERTIFICATION OF CHIEF EXECUTIVE OFFICER
OF CORE LABORATORIES N.V. PURSUANT TO 15 U.S.C. SECTION 7241, AS ADOPTED
PURSUANT TO SECTION 302 OF THE SARBANES-OXLEY ACT OF 2002
I, David M. Demshur, certify that:
2. Based on my knowledge, this report does not contain any untrue statement of a material fact or omit to state a material fact necessary to make the statements made, in light of the circumstances under which such statements were made, not misleading with respect to the period covered by this report;
(a) All significant deficiencies and material weaknesses in the design or operation of internal control over financial reporting which are reasonably likely to adversely affect the registrant's ability to record, process, summarize and report financial information; and
1. I have reviewed this Annual Report on Form 10-K of Core Laboratories N.V. (the "Registrant");
3. Based on my knowledge, the financial statements, and other financial information included in this report, fairly present in all material respects the financial condition, results of operations and cash flows of the registrant as of, and for, the periods presented in this report; 4. The registrant's other certifying officer and I are responsible for establishing and maintaining disclosure controls and procedures (as defined in Exchange Act Rules 13a-15(e) and 15d-15(e)) and internal control over financial reporting (as defined in Exchange Act Rules 13a-15(f) and 15d-15(f)) for the registrant and have: (a) Designed such disclosure controls and procedures, or caused such disclosure controls and procedures to be designed under our supervision, to ensure that material information relating to the registrant, including its consolidated subsidiaries, is made known to us by others within those entities, particularly during the period in which this report is being prepared; (b) Designed such internal control over financial reporting, or caused such internal control over financial reporting to be designed under our supervision, to provide reasonable assurance regarding the reliability of financial reporting and the preparation of financial statements for external purposes in accordance with generally accepted accounting principles;
(c) Evaluated the effectiveness of the registrant's disclosure controls and procedures and presented in this report our conclusions about the effectiveness of the disclosure controls and procedures, as of the end of the period covered by this report based on such evaluation; and (d) Disclosed in this report any change in the registrant's internal control over financial reporting that occurred during the registrant's most recent fiscal quarter (the registrant's fourth fiscal quarter in the case of an annual report) that has materially affected, or is reasonably likely to materially affect, the registrant's internal control over financial reporting; and 5. The registrant's other certifying officer and I have disclosed, based on our most recent evaluation of internal control over financial reporting, to the registrant's auditors and the audit committee of the registrant's board of directors (or persons performing the equivalent functions):
(b) Any fraud, whether or not material, that involves management or other employees who have a significant role in the registrant's internal control over financial reporting.
Date: February 23, 2006 /s/ David M. Demshur____ David M. Demshur Chief Executive Officer
32

Exhibit 31.2 CERTIFICATION OF CHIEF FINANCIAL OFFICER
OF CORE LABORATORIES N.V. PURSUANT TO 15 U.S.C. SECTION 7241, AS ADOPTED
(c) Evaluated the effectiveness of the registrant's disclosure controls and procedures and presented in this report our conclusions about the effectiveness of the disclosure controls and procedures, as of the end of the period covered by this report based on such evaluation; and
PURSUANT TO SECTION 302 OF THE SARBANES-OXLEY ACT OF 2002
I, Richard L. Bergmark, certify that:
1. I have reviewed this Annual Report on Form 10-K of Core Laboratories N.V. (the "Registrant"); 2. Based on my knowledge, this report does not contain any untrue statement of a material fact or omit to state a material fact necessary to make the statements made, in light of the circumstances under which such statements were made, not misleading with respect to the period covered by this report; 3. Based on my knowledge, the financial statements, and other financial information included in this report, fairly present in all material respects the financial condition, results of operations and cash flows of the registrant as of, and for, the periods presented in this report; 4. The registrant's other certifying officer and I are responsible for establishing and maintaining disclosure controls and procedures (as defined in Exchange Act Rules 13a-15(e) and 15d-15(e)) and internal control over financial reporting (as defined in Exchange Act Rules 13a-15(f) and 15d-15(f)) for the registrant and have: (a) Designed such disclosure controls and procedures, or caused such disclosure controls and procedures to be designed under our supervision, to ensure that material information relating to the registrant, including its consolidated subsidiaries, is made known to us by others within those entities, particularly during the period in which this report is being prepared; (b) Designed such internal control over financial reporting, or caused such internal control over financial reporting to be designed under our supervision, to provide reasonable assurance regarding the reliability of financial reporting and the preparation of financial statements for external purposes in accordance with generally accepted accounting principles;
(d) Disclosed in this report any change in the registrant's internal control over financial reporting that occurred during the registrant's most recent fiscal quarter (the registrant's fourth fiscal quarter in the case of an annual report) that has materially affected, or is reasonably likely to materially affect, the registrant's internal control over financial reporting; and
5. The registrant's other certifying officer and I have disclosed, based on our most recent evaluation of internal control over financial reporting, to the registrant's auditors and the audit committee of the registrant's board of directors (or persons performing the equivalent functions): (a) All significant deficiencies and material weaknesses in the design or operation of internal control over financial reporting which are reasonably likely to adversely affect the registrant's ability to record, process, summarize and report financial information; and
(b) Any fraud, whether or not material, that involves management or other employees who have a significant role in the registrant's internal control over financial reporting.
Date: February 23, 2006 /s/ Richard L. Bergmark____ Richard L. Bergmark Chief Financial Officer
33

Exhibit 32.1
Certification By David M. Demshur, Chief Executive Officer
of Core Laboratories N.V. Pursuant to 18 U.S.C. Section 1350
I, David M. Demshur, Chief Executive Officer of Core Laboratories N.V. (the "Company"), hereby certify that the
accompanying Annual Report on Form 10-K for the year ended December 31, 2005, filed by the Company with the Securities and Exchange Commission on the date hereof fully complies with the requirements of Section 13(a) or 15(d) of the Securities Exchange Act of 1934 (the "Report").
I further certify that the information contained in the Report fairly presents, in all material respects, the financial condition and results of operations of the Company.
Date: February 23, 2006 /s/ David M. Demshur____ David M. Demshur Chief Executive Officer
34
Exhibit 32.2 Certification By
Richard L. Bergmark, Chief Financial Officer of Core Laboratories N.V.
Pursuant to 18 U.S.C. Section 1350
I, Richard L. Bergmark, Chief Financial Officer of Core Laboratories N.V. (the "Company"), hereby certify that the accompanying Annual Report on Form 10-K for the year ended December 31, 2005, filed by the Company with the Securities and Exchange Commission on the date hereof fully complies with the requirements of Section 13(a) or 15(d) of the Securities Exchange Act of 1934 (the "Report").
I further certify that the information contained in the Report fairly presents, in all material respects, the financial condition and results of operations of the Company.
Date: February 23, 2006 /s/ Richard L. Bergmark____ Richard L. Bergmark Chief Financial Officer
35