Embed Size (px)
Citation preview
UNITED STATES SECURITIES AND EXCHANGE COMMISSION
Washington, D. C. 20549
FORM 10-Q
(Mark One) ( X ) QUARTERLY REPORT PURSUANT TO SECTION 13 OR 15(d) OF THE SECURITIES EXCHANGE ACT OF 1934 For the quarterly period ended June 30, 2016 Or ( ) TRANSITION REPORT PURSUANT TO SECTION 13 OR 15(d) OF THE SECURITIES EXCHANGE ACT OF 1934 For the transition period from to Commission File Number: 0-9068
WEYCO GROUP, INC. (Exact name of registrant as specified in its charter)
WISCONSIN 39-0702200 (State or other jurisdiction of incorporation or organization) (I.R.S. Employer Identification No.)
333 W. Estabrook Boulevard P. O. Box 1188
Milwaukee, Wisconsin 53201 (Address of principal executive offices)
(Zip Code)
(414) 908-1600 (Registrant’s telephone number, including area code)
Indicate by check mark whether the registrant (1) has filed all reports required to be filed by Section 13 or 15(d) of the Securities Exchange Act of 1934 during the preceding 12 months (or for such shorter period that the registrant was required to file such reports), and (2) has been subject to such filing requirements for the past 90 days. Yes X No ____ Indicate by check mark whether the registrant has submitted electronically and posted on its corporate Web site, if any, every Interactive Data File required to be submitted and posted pursuant to Rule 405 of Regulation S-T (Section 232.405 of this chapter) during the preceding 12 months (or for such shorter period that the registrant was required to submit and post such files). Yes X No ____ Indicate by check mark whether the registrant is a large accelerated filer, an accelerated filer, a non-accelerated filer, or a smaller reporting company. See definitions of “large accelerated filer”, “accelerated filer” and “smaller reporting company” in Rule 12b-2 of the Exchange Act. Large accelerated filer Accelerated filer X Non-accelerated filer Smaller reporting company Indicate by check mark whether the registrant is a shell company (as defined in Rule 12b-2 of the Exchange Act). Yes No X_
As of July 29, 2016, there were 10,539,527 shares of common stock outstanding.

1
PART I. FINANCIAL INFORMATION Item 1. Financial Statements.
The following unaudited consolidated condensed financial statements have been prepared by Weyco Group, Inc. (the “Company”) pursuant to the rules and regulations of the Securities and Exchange Commission. Certain information and footnote disclosures normally included in annual financial statements prepared in accordance with generally accepted accounting principles have been condensed or omitted pursuant to those rules and regulations, although the Company believes that the disclosures made are adequate to make the information not misleading. It is suggested that these consolidated condensed financial statements be read in conjunction with the financial statements and notes thereto included in the Company’s latest annual report on Form 10-K.
June 30, December 31,
2016 2015
Cash and cash equivalents 15,303$ 17,926$
Marketable securities, at amortized cost 3,281 4,522
Accounts receivable, net 39,293 54,009
Accrued income tax receivable 2,725 -
Inventories 76,613 97,184
Prepaid expenses and other current assets 4,161 5,835
Total current assets 141,376 179,476
Marketable securities, at amortized cost 21,462 20,685
Property, plant and equipment, net 33,476 31,833
Goodw ill 11,112 11,112
Trademarks 34,748 34,748
Other assets 21,420 21,143
Total assets 263,594$ 298,997$
LIABILITIES AND EQUITY:
Short-term borrow ings 15,241$ 26,649$
Accounts payable 4,507 13,339
Dividend payable - 2,147
Accrued liabilities 9,537 17,484
Accrued income tax payable - 31
Deferred income tax liabilities 2,084 1,537
Total current liabilities 31,369 61,187
Deferred income tax liabilities 623 70
Long-term pension liability 28,442 30,188
Other long-term liabilities 2,533 2,823
Equity:
Common stock 10,557 10,767
Capital in excess of par value 46,920 45,759
Reinvested earnings 153,777 160,325
Accumulated other comprehensive loss (17,113) (18,467)
Total Weyco Group, Inc. equity 194,141 198,384
Noncontrolling interest 6,486 6,345
Total equity 200,627 204,729
Total liabilities and equity 263,594$ 298,997$
The accompanying notes to consolidated condensed financial statements (unaudited) are an integral part of these financial statements.
WEYCO GROUP, INC. AND SUBSIDIARIES
CONSOLIDATED CONDENSED BALANCE SHEETS (UNAUDITED)
(Dollars in thousands)
ASSETS:

2
2016 2015 2016 2015
Net sales 56,867$ 63,934$ 135,767$ 141,986$
Cost of sales 34,576 39,511 86,349 88,826
Gross earnings 22,291 24,423 49,418 53,160
Selling and administrative expenses 20,719 21,091 44,031 44,042
Earnings from operations 1,572 3,332 5,387 9,118
Interest income 190 236 394 496
Interest expense (94) (12) (167) (30)
Other income (expense), net 155 (348) 309 (626)
Earnings before provision for income taxes 1,823 3,208 5,923 8,958
Provision for income taxes 745 1,123 2,213 3,281
Net earnings 1,078 2,085 3,710 5,677
Net earnings attributable to noncontrolling interest 78 45 23 4
Net earnings attributable to Weyco Group, Inc. 1,000$ 2,040$ 3,687$ 5,673$
Weighted average shares outstanding
Basic 10,546 10,801 10,601 10,785
Diluted 10,600 10,892 10,647 10,880
Earnings per share
Basic 0.09$ 0.19$ 0.35$ 0.53$
Diluted 0.09$ 0.19$ 0.35$ 0.52$
Cash dividends declared (per share) 0.21$ 0.20$ 0.41$ 0.39$
Comprehensive income 1,056$ 2,454$ 5,182$ 4,720$
Comprehensive (loss) income attributable to noncontrolling interest (31) 17 141 (284)
Comprehensive income attributable to Weyco Group, Inc. 1,087$ 2,437$ 5,041$ 5,004$
The accompanying notes to consolidated condensed financial statements (unaudited) are an integral part of these financial statements.
(In thousands, except per share amounts)
WEYCO GROUP, INC. AND SUBSIDIARIES
CONSOLIDATED CONDENSED STATEMENTS OF EARNINGS AND COMPREHENSIVE INCOME (UNAUDITED)
Six Months Ended June 30, Three Months Ended June 30,

3
2016 2015
CASH FLOWS FROM OPERATING ACTIVITIES:
Net earnings 3,710$ 5,677$
Adjustments to reconcile net earnings to net cash
provided by (used for) operating activities -
Depreciation 1,835 1,738
Amortization 194 222
Bad debt expense 45 111
Deferred income taxes 772 (483)
Net foreign currency transaction (gains) losses (148) 443
Stock-based compensation 727 721
Pension contribution (2,400) (357)
Pension expense 1,667 1,874
Increase in cash surrender value of life insurance (115) (115)
Changes in operating assets and liabilities -
Accounts receivable 14,616 11,407
Inventories 20,558 (17,000)
Prepaid expenses and other assets 1,519 2,678
Accounts payable (8,827) (8,450)
Accrued liabilities and other (2,329) (5,759)
Accrued income taxes (2,755) (1,411)
Net cash provided by (used for) operating activities 29,069 (8,704)
CASH FLOWS FROM INVESTING ACTIVITIES:
Purchase of marketable securities (2,245) (600)
Proceeds from maturities of marketable securities 2,670 4,150
Life insurance premiums paid (155) (155)
Purchase of property, plant and equipment (3,475) (958)
Net cash (used for) provided by investing activities (3,205) 2,437
CASH FLOWS FROM FINANCING ACTIVITIES:
Cash dividends paid (6,483) (6,256)
Shares purchased and retired (6,106) (2,421)
Proceeds from stock options exercised 453 2,512
Payment of contingent consideration (5,217) -
Proceeds from bank borrowings 58,993 75,935
Repayments of bank borrowings (70,401) (63,216)
Income tax benefits from stock-based compensation - 451
Net cash (used for) provided by financing activities (28,761) 7,005
Effect of exchange rate changes on cash and cash equivalents 274 (142)
Net (decrease) increase in cash and cash equivalents (2,623)$ 596$
CASH AND CASH EQUIVALENTS at beginning of period 17,926 12,499
CASH AND CASH EQUIVALENTS at end of period 15,303$ 13,095$
SUPPLEMENTAL CASH FLOW INFORMATION:
Income taxes paid, net of refunds 3,989$ 4,735$
Interest paid 158$ 30$
The accompanying notes to consolidated condensed financial statements (unaudited) are an integral part of these financial statements.
(Dollars in thousands)
WEYCO GROUP, INC. AND SUBSIDIARIES
CONSOLIDATED CONDENSED STATEMENTS OF CASH FLOWS (UNAUDITED)
Six Months Ended June 30,
4
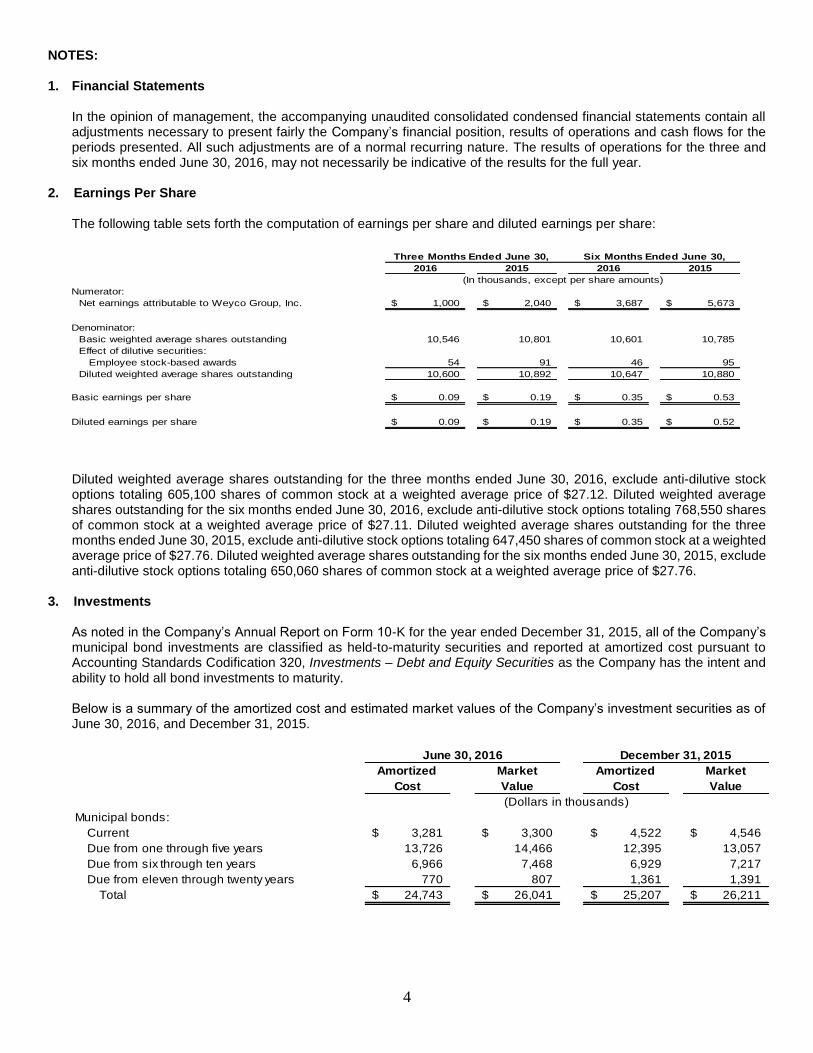
NOTES: 1. Financial Statements
In the opinion of management, the accompanying unaudited consolidated condensed financial statements contain all adjustments necessary to present fairly the Company’s financial position, results of operations and cash flows for the periods presented. All such adjustments are of a normal recurring nature. The results of operations for the three and six months ended June 30, 2016, may not necessarily be indicative of the results for the full year.
2. Earnings Per Share The following table sets forth the computation of earnings per share and diluted earnings per share:
Diluted weighted average shares outstanding for the three months ended June 30, 2016, exclude anti-dilutive stock options totaling 605,100 shares of common stock at a weighted average price of $27.12. Diluted weighted average shares outstanding for the six months ended June 30, 2016, exclude anti-dilutive stock options totaling 768,550 shares of common stock at a weighted average price of $27.11. Diluted weighted average shares outstanding for the three months ended June 30, 2015, exclude anti-dilutive stock options totaling 647,450 shares of common stock at a weighted average price of $27.76. Diluted weighted average shares outstanding for the six months ended June 30, 2015, exclude anti-dilutive stock options totaling 650,060 shares of common stock at a weighted average price of $27.76.
3. Investments
As noted in the Company’s Annual Report on Form 10-K for the year ended December 31, 2015, all of the Company’s municipal bond investments are classified as held-to-maturity securities and reported at amortized cost pursuant to Accounting Standards Codification 320, Investments – Debt and Equity Securities as the Company has the intent and ability to hold all bond investments to maturity. Below is a summary of the amortized cost and estimated market values of the Company’s investment securities as of June 30, 2016, and December 31, 2015.
Amortized Market Amortized Market
Cost Value Cost Value
Municipal bonds:
Current 3,281$ 3,300$ 4,522$ 4,546$
Due from one through five years 13,726 14,466 12,395 13,057
Due from six through ten years 6,966 7,468 6,929 7,217
Due from eleven through twenty years 770 807 1,361 1,391
Total 24,743$ 26,041$ 25,207$ 26,211$
June 30, 2016 December 31, 2015
(Dollars in thousands)
2016 2015 2016 2015
Numerator:
Net earnings attributable to Weyco Group, Inc. 1,000$ 2,040$ 3,687$ 5,673$
Denominator:
Basic weighted average shares outstanding 10,546 10,801 10,601 10,785
Effect of dilutive securities:
Employee stock-based awards 54 91 46 95
Diluted weighted average shares outstanding 10,600 10,892 10,647 10,880
Basic earnings per share 0.09$ 0.19$ 0.35$ 0.53$
Diluted earnings per share 0.09$ 0.19$ 0.35$ 0.52$
Six Months Ended June 30,Three Months Ended June 30,
(In thousands, except per share amounts)

5
The unrealized gains and losses on investment securities at June 30, 2016, and at December 31, 2015, were as follows:
Unrealized Unrealized Unrealized Unrealized
Gains Losses Gains Losses
Municipal bonds 1,309$ (11)$ 1,014$ (10)$
June 30, 2016 December 31, 2015
(Dollars in thousands)
The estimated market values provided are level 2 valuations as defined by Accounting Standards Codification 820, Fair Value Measurements and Disclosures (“ASC 820”). The Company reviewed its portfolio of investments as of June 30, 2016, and determined that no other-than-temporary market value impairment exists.
4. Intangible Assets
The Company’s indefinite-lived and amortizable intangible assets as recorded in the Consolidated Condensed Balance Sheets (Unaudited) consisted of the following as of June 30, 2016:
Weighted Gross
Average Carrying Accumulated
Life (Years) Amount Amortization Net
Indefinite-lived intangible assets:
Goodwill 11,112$ -$ 11,112$
Trademarks 34,748 - 34,748
Total indefinite-lived intangible assets 45,860$ -$ 45,860$
Amortizable intangible assets:
Non-compete agreement 5 200$ (200)$ -$
Customer relationships 15 3,500 (1,244) 2,256
Total amortizable intangible assets 3,700$ (1,444)$ 2,256$
June 30, 2016
(Dollars in thousands)
The Company’s indefinite-lived and amortizable intangible assets as recorded in the Consolidated Condensed Balance Sheets (Unaudited) consisted of the following as of December 31, 2015:
Weighted Gross
Average Carrying Accumulated
Life (Years) Amount Amortization Net
Indefinite-lived intangible assets:
Goodwill 11,112$ -$ 11,112$
Trademarks 34,748 - 34,748
Total indefinite-lived intangible assets 45,860$ -$ 45,860$
Amortizable intangible assets:
Non-compete agreement 5 200$ (193)$ 7$
Customer relationships 15 3,500 (1,128) 2,372
Total amortizable intangible assets 3,700$ (1,321)$ 2,379$
December 31, 2015
(Dollars in thousands)
The Company’s amortizable intangible assets are included within other assets in the Consolidated Condensed Balance Sheets (Unaudited).

6
5. Segment Information
The Company has two reportable segments: North American wholesale operations (“wholesale”) and North American retail operations (“retail”). The chief operating decision maker, the Company’s Chief Executive Officer, evaluates the performance of the Company’s segments based on earnings from operations. Therefore, interest income or expense, other income or expense, and income taxes are not allocated to the segments. The “other” category in the tables below includes the Company’s wholesale and retail operations in Australia, South Africa, Asia Pacific and Europe, which do not meet the criteria for separate reportable segment classification. Summarized segment data for the three and six months ended June 30, 2016 and 2015, was as follows:
6. Employee Retirement Plans
The components of the Company’s net pension expense were as follows:
2016 2015 2016 2015
Benefits earned during the period 444$ 410$ 819$ 821$
Interest cost on projected benefit obligation 610 674 1,225 1,347
Expected return on plan assets (630) (592) (1,215) (1,184)
Net amortization and deferral 476 445 838 890
Net pension expense 900$ 937$ 1,667$ 1,874$
Six Months Ended June 30, Three Months Ended June 30,
(Dollars in thousands)
Three Months Ended
June 30, Wholesale Retail Other Total
Product sales 40,864$ 4,721$ 10,686$ 56,271$
Licensing revenues 596 - - 596
Net sales 41,460$ 4,721$ 10,686$ 56,867$
Earnings from operations 1,019$ 228$ 325$ 1,572$
Product sales 47,377$ 5,021$ 10,827$ 63,225$
Licensing revenues 709 - - 709
Net sales 48,086$ 5,021$ 10,827$ 63,934$
Earnings from operations 2,193$ 489$ 650$ 3,332$
Six Months Ended
June 30, Wholesale Retail Other Total
Product sales 102,501$ 9,805$ 22,255$ 134,561$
Licensing revenues 1,206 - - 1,206
Net sales 103,707$ 9,805$ 22,255$ 135,767$
Earnings from operations 4,352$ 474$ 561$ 5,387$
Product sales 107,825$ 9,941$ 22,816$ 140,582$
Licensing revenues 1,404 - - 1,404
Net sales 109,229$ 9,941$ 22,816$ 141,986$
Earnings from operations 7,004$ 761$ 1,353$ 9,118$
2016
2015
(Dollars in thousands)
(Dollars in thousands)
2016
2015

7
7. Stock-Based Compensation Plans
During the three and six months ended June 30, 2016, the Company recognized approximately $363,000 and $727,000, respectively, of compensation expense associated with stock option and restricted stock awards granted in years 2012 through 2015. During the three and six months ended June 30, 2015, the Company recognized approximately $361,000 and $721,000, respectively, of compensation expense associated with stock option and restricted stock awards granted in years 2011 through 2014. The following table summarizes the Company’s stock option activity for the six month period ended June 30, 2016:
The following table summarizes the Company’s stock option exercise activity for the three and six months ended June 30, 2016 and 2015:
The following table summarizes the Company’s restricted stock award activity for the six-month period ended June 30, 2016:
8. Short-Term Borrowings
At June 30, 2016, the Company had a $60 million unsecured revolving line of credit with a bank expiring November 4, 2016. The line of credit bears interest at LIBOR plus 0.75%. At June 30, 2016, outstanding borrowings were approximately $15.2 million at an interest rate of 1.2%. The highest balance on the line of credit during the quarter was approximately $24.4 million.
9. Contingent Consideration
Contingent consideration was comprised of two contingent payments that the Company was obligated to pay the former shareholders of The Combs Company (“Bogs”) related to the Company’s acquisition of Bogs in 2011. The estimate of contingent consideration was formula-driven and was based on Bogs achieving certain levels of gross margin dollars between January 1, 2011, and December 31, 2015. The first earn-out payment was due in 2013 and was paid on March 28, 2013, in the amount of $1,270,000. The second earn-out payment was due in the first quarter of 2016 and was paid on March 23, 2016, in the amount of $5,217,000.
Weighted
Weighted Average
Average Remaining Aggregate
Exercise Contractual Intrinsic
Shares Price Term (Years) Value*
Outstanding at December 31, 2015 1,351,826 26.09$
Exercised (18,950) 23.92$
Forfeited or expired (7,050) 26.63$
Outstanding at June 30, 2016 1,325,826 26.12$ 3.6 2,425,000$
Exercisable at June 30, 2016 577,806 25.61$ 2.6 1,369,000$
of in-the-money outstanding and exercisable stock options.
* The aggregate intrinsic value of outstanding and exercisable stock options is defined as the difference betw een the closing price of
the Company's stock on June 30, 2016, the last trading day of the quarter, of $27.78 and the exercise price multiplied by the number
2016 2015 2016 2015
Total intrinsic value of stock options exercised 72$ 101$ 73$ 1,158$
Cash received from stock option exercises 441$ 363$ 453$ 2,512$
Income tax benefit from the exercise of stock options 29$ 39$ 29$ 451$
Six Months Ended June 30, Three Months Ended June 30,
(Dollars in thousands)
Weighted
Weighted Average
Shares of Average Remaining Aggregate
Restricted Grant Date Contractual Intrinsic
Stock Fair Value Term (Years) Value*
Non-vested at December 31, 2015 55,250 26.45$
Issued - -
Vested (900) 26.94
Forfeited - -
Non-vested at June 30, 2016 54,350 26.44$ 2.3 1,510,000$
* The aggregate intrinsic value of non-vested restricted stock was calculated using the closing price of the Company's stock on
June 30, 2016, the last trading day of the quarter, of $27.78 multiplied by the number of non-vested restricted shares outstanding.
8
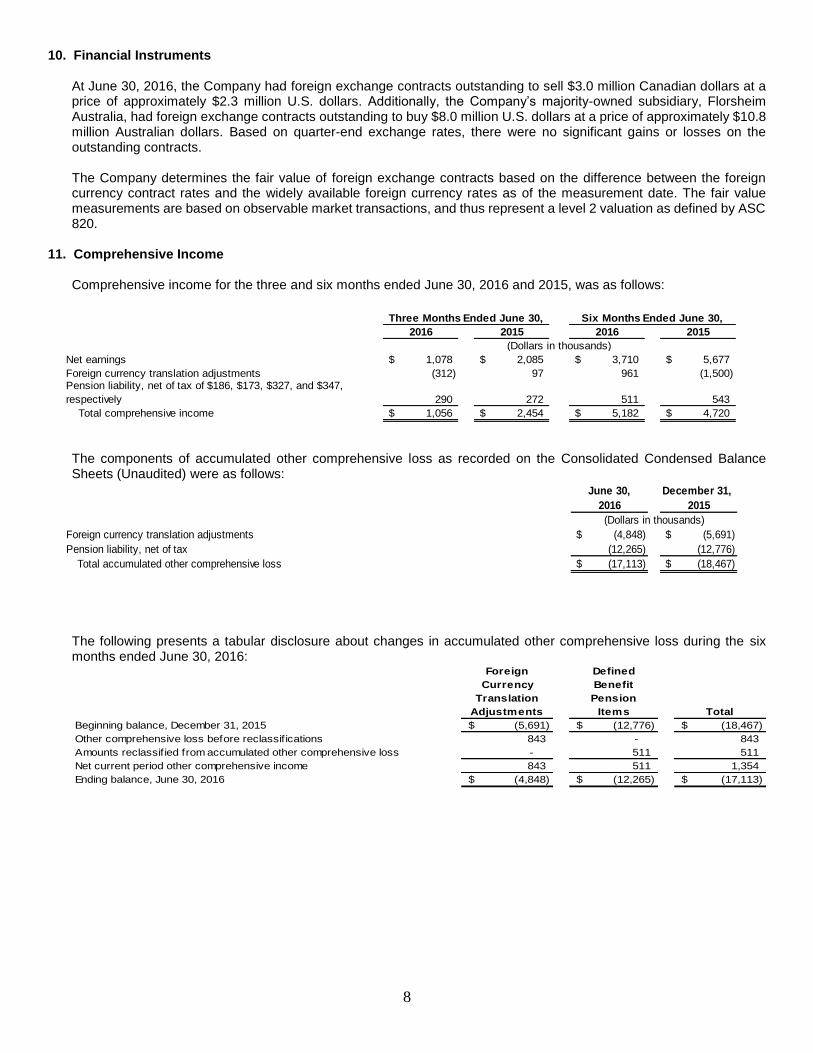
10. Financial Instruments
At June 30, 2016, the Company had foreign exchange contracts outstanding to sell $3.0 million Canadian dollars at a price of approximately $2.3 million U.S. dollars. Additionally, the Company’s majority-owned subsidiary, Florsheim Australia, had foreign exchange contracts outstanding to buy $8.0 million U.S. dollars at a price of approximately $10.8 million Australian dollars. Based on quarter-end exchange rates, there were no significant gains or losses on the outstanding contracts. The Company determines the fair value of foreign exchange contracts based on the difference between the foreign currency contract rates and the widely available foreign currency rates as of the measurement date. The fair value measurements are based on observable market transactions, and thus represent a level 2 valuation as defined by ASC 820.
11. Comprehensive Income
Comprehensive income for the three and six months ended June 30, 2016 and 2015, was as follows:
The components of accumulated other comprehensive loss as recorded on the Consolidated Condensed Balance Sheets (Unaudited) were as follows:
The following presents a tabular disclosure about changes in accumulated other comprehensive loss during the six months ended June 30, 2016:
Foreign
Currency
Translation
Adjustments
Defined
Benefit
Pension
Items Total
Beginning balance, December 31, 2015 (5,691)$ (12,776)$ (18,467)$
Other comprehensive loss before reclassif ications 843 - 843
Amounts reclassif ied from accumulated other comprehensive loss - 511 511
Net current period other comprehensive income 843 511 1,354
Ending balance, June 30, 2016 (4,848)$ (12,265)$ (17,113)$
2016 2015 2016 2015
Net earnings 1,078$ 2,085$ 3,710$ 5,677$
(312) 97 961 (1,500)
290 272 511 543
Total comprehensive income 1,056$ 2,454$ 5,182$ 4,720$
Foreign currency translation adjustments
Six Months Ended June 30,Three Months Ended June 30,
(Dollars in thousands)
Pension liability, net of tax of $186, $173, $327, and $347,
respectively
June 30, December 31,
2016 2015
Foreign currency translation adjustments (4,848)$ (5,691)$
Pension liability, net of tax (12,265) (12,776)
Total accumulated other comprehensive loss (17,113)$ (18,467)$
(Dollars in thousands)

9
The following presents a tabular disclosure about reclassification adjustments out of accumulated other comprehensive loss during the six months ended June 30, 2016:
Amortization of defined benefit pension items
Prior service cost (57)$ (1)
Actuarial losses 895 (1)
Total before tax 838
Tax benefit (327)
Net of tax 511$
Affected line item in the
statement where net
income is presented
Amounts reclassified
from accumulated other
comprehensive loss for
the six months ended
June 30, 2016
(1) These amounts were included in the computation of net periodic pension cost. See Note 6 for additional details. 12. Equity
A reconciliation of the Company’s equity for the six months ended June 30, 2016, is as follows:
Accumulated
Capital in Other
Common Excess of Reinvested Comprehensive Noncontrolling
Stock Par Value Earnings Loss Interest
Balance, December 31, 2015 10,767$ 45,759$ 160,325$ (18,467)$ 6,345$
Net earnings - - 3,687 - 23
Foreign currency translation
adjustments - - - 843 118
Pension liability adjustment,
net of tax - - - 511 -
Cash dividends declared - - (4,358) - -
Stock options exercised 19 434 - - -
Stock-based compensation
expense - 727 - - -
Income tax benefit from
stock options exercised - - - - -
Shares purchased and retired (229) - (5,877) - -
Balance, June 30, 2016 10,557$ 46,920$ 153,777$ (17,113)$ 6,486$
(Dollars in thousands)

10
Item 2. Management’s Discussion and Analysis of Financial Condition and Results of Operations. FORWARD-LOOKING STATEMENTS This report contains certain forward-looking statements with respect to the Company’s outlook for the future. These statements represent the Company's reasonable judgment with respect to future events and are subject to risks and uncertainties that could cause actual results to differ materially. Such statements can be identified by the use of words such as “anticipates,” “believes,” “estimates,” “expects,” “forecasts,” “intends,” “is likely,” “plans,” “predicts,” “projects,” “should,” “will,” or variations of such words, and similar expressions. Forward-looking statements, by their nature, address matters that are, to varying degrees, uncertain. Therefore, the reader is cautioned that these forward-looking statements are subject to a number of risks, uncertainties or other factors that may cause actual results to differ materially from those described in the forward-looking statements. These risks and uncertainties include, but are not limited to, the risk factors described under Item 1A, “Risk Factors,” of the Company’s Annual Report on Form 10-K for the year-ended December 31, 2015. GENERAL The Company designs and markets quality and innovative footwear for men, women and children under a portfolio of well-recognized brand names including: “Florsheim,” “Nunn Bush,” “Stacy Adams,” “BOGS,” “Rafters” and “Umi.” Inventory is purchased from third-party overseas manufacturers. The majority of foreign-sourced purchases are denominated in U.S. dollars. The Company has two reportable segments, North American wholesale operations (“wholesale”) and North American retail operations (“retail”). In the wholesale segment, the Company’s products are sold to leading footwear, department, and specialty stores, primarily in the United States and Canada. The Company also has licensing agreements with third parties who sell its branded apparel, accessories and specialty footwear in the United States, as well as its footwear in Mexico and certain markets overseas. Licensing revenues are included in the Company’s wholesale segment. The Company’s retail segment consisted of 12 Company-owned retail stores and an internet business in the United States as of June 30, 2016. Sales in retail outlets are made directly to consumers by Company employees. The Company’s “other” operations include the Company’s wholesale and retail businesses in Australia, South Africa, Asia Pacific (collectively, “Florsheim Australia”) and Europe (“Florsheim Europe”). The majority of the Company’s operations are in the United States, and its results are primarily affected by the economic conditions and the retail environment in the United States. EXECUTIVE OVERVIEW Second Quarter Highlights
Consolidated net sales for the second quarter of 2016 were $56.9 million, down 11% compared to last year’s second quarter net sales of $63.9 million. Earnings from operations were $1.6 million this quarter, compared to $3.3 million in the second quarter of 2015. Consolidated net earnings attributable to Weyco Group, Inc. were $1.0 million in the second quarter of 2016, down compared to $2.0 million in last year’s second quarter. Diluted earnings per share were $0.09 in the second quarter of 2016 and $0.19 per share in the second quarter of 2015. The decrease in consolidated net sales for the quarter occurred mainly in the Company’s wholesale segment. Wholesale net sales decreased $6.6 million, due to soft consumer spending in the footwear and apparel segments during the quarter, and lower sales of the Company’s BOGS brand following a mild winter in North America. Sales also decreased slightly in the Company’s North American retail segment, and in its other foreign businesses. Consolidated earnings from operations decreased $1.8 million for the quarter, mainly due to the lower sales volumes in the Company’s North American wholesale segment.

11
Year-to-Date Highlights Consolidated net sales for the first half of 2016 were $135.8 million, down 4% from net sales of $142.0 million in the first half of last year. Earnings from operations were $5.4 million in the first six months of 2016, compared to $9.1 million in the first six months of 2015. Consolidated net earnings attributable to Weyco Group, Inc. were $3.7 million in the first six months of 2016, compared to $5.7 million in the same period last year. Diluted earnings per share to date in 2016 were $0.35, versus $0.52 per share in the same period of 2015. The decrease in consolidated net sales for the six months ended June 30, 2016, occurred mainly in the Company’s wholesale segment. Wholesale net sales decreased $5.5 million in the first six months of 2016, compared to the same period last year, due to lower sales of the BOGS and Nunn Bush brands. Consolidated earnings from operations were $5.4 million for the six months ended June 30, 2016, compared to $9.1 million in the same period last year. The decrease was mainly from lower earnings from operations in the Company’s wholesale segment, but also due to decreased operating earnings in its retail segment and other businesses. Financial Position Highlights At June 30, 2016, cash and marketable securities totaled $40.0 million and outstanding debt totaled $15.2 million. During the first six months of 2016, the Company generated $29 million of cash from operations, mainly by reducing its inventory levels in 2016. The Company used funds to pay $6.5 million in dividends, to repurchase $6.1 million of its common stock, and to pay down its line of credit. Also, the Company paid $5.2 million for the final earn-out payment related to the 2011 acquisition of Bogs. SEGMENT ANALYSIS Net sales and earnings from operations for the Company’s segments in the three and six months ended June 30, 2016 and 2015, were as follows:
% %
2016 2015 Change 2016 2015 Change
Net Sales
North American Wholesale 41,460$ 48,086$ -14% 103,707$ 109,229$ -5%
North American Retail 4,721 5,021 -6% 9,805 9,941 -1%
Other 10,686 10,827 -1% 22,255 22,816 -2%
Total 56,867$ 63,934$ -11% 135,767$ 141,986$ -4%
Earnings from Operations
North American Wholesale 1,019$ 2,193$ -54% 4,352$ 7,004$ -38%
North American Retail 228 489 -53% 474 761 -38%
Other 325 650 -50% 561 1,353 -59%
Total 1,572$ 3,332$ -53% 5,387$ 9,118$ -41%
Six Months Ended June 30, Three Months Ended June 30,
(Dollars in thousands)

12
North American Wholesale Segment Net Sales Net sales in the Company’s North American wholesale segment for the three and six months ended June 30, 2016 and 2015, were as follows:
Stacy Adams, Nunn Bush, and Florsheim, the Company’s three major men’s footwear brands, were all impacted by soft consumer spending in the footwear and apparel segments during the second quarter 2016. Nunn Bush had reduced shipments to department stores and off-price retailers. A significant part of Nunn Bush’s business is with mid-tier department stores, and they have reduced their inventory models in reaction to the consumer shift toward E-commerce. BOGS net sales also decreased for the second quarter and to date in 2016. The second quarter for BOGS is the brand’s smallest quarter and represents less than 10 percent of its revenues due the seasonal nature of the brand. Because of the mild winter last year, retailers carried over inventory which impacted shipments in the quarter and caused retailers to be conservative with Fall 2016 orders. Looking forward to the second half of 2016 for BOGS, backlogs for the brand remain down and the Company estimates BOGS annual sales will be down approximately 25%. Licensing revenues consist of royalties earned on the sales of branded apparel, accessories and specialty footwear in the United States and on branded footwear in Mexico and certain overseas markets. Earnings from Operations Earnings from operations in the North American wholesale segment were $1.0 million in the second quarter of 2016, versus $2.2 million in the second quarter of 2015. For the six months ended June 30, 2016, earnings from operations for the wholesale segment were $4.4 million, down from $7.0 million in the same period last year. The decreases reflected the lower sales volumes for the quarter and to date in 2016. Wholesale gross earnings decreased $1.4 million and $2.2 million for the three and six months ended June 30, 2016, respectively, due to lower sales volumes. Wholesale gross earnings were 32.6% of net sales in the second quarter of 2016 compared with 31.0% in last year’s second quarter. For the six months ended June 30, wholesale gross earnings were 30.5% of net sales in 2016 compared with 31.0% in 2015. Higher gross earnings as a percent of net sales for the second quarter mainly resulted from the Company’s effort to increase selling prices on select products to improve its gross margins. Lower gross earnings as a percent of net sales to date in 2016 resulted from lower gross margins in the Company’s Canadian business in the first quarter of 2016, as its inventory is purchased in U.S. dollars, and the Canadian dollar had weakened compared to the U.S. dollar in 2016 versus 2015. The Company’s cost of sales does not include distribution costs (e.g., receiving, inspection or warehousing costs). Distribution costs were $2.8 million for the second quarter of 2016 versus $2.6 million for the same period of 2015. For the six-month periods ended June 30, 2016 and 2015, distribution costs were $6.0 million and $5.4 million, respectively. The increase was primarily due to additional storage costs incurred in 2016. Distribution costs were included in selling and administrative expenses. The Company’s gross earnings may not be comparable to other companies, as some companies may include distribution costs in cost of sales.
North American Wholesale Segment Net Sales
% %
2016 2015 Change 2016 2015 Change
North American Net Sales
Stacy Adams 14,330$ 15,158$ -5% 37,231$ 35,609$ 5%
Nunn Bush 12,732 15,345 -17% 29,547 32,714 -10%
Florsheim 10,618 11,149 -5% 24,252 23,753 2%
BOGS/Rafters 2,738 5,190 -47% 10,488 14,534 -28%
Umi 447 535 -16% 983 1,215 -19%
Total North American Wholesale 40,865$ 47,377$ -14% 102,501$ 107,825$ -5%
Licensing 595 709 -16% 1,206 1,404 -14%
Total North American Wholesale
Segment 41,460$ 48,086$ -14% 103,707$ 109,229$ -5%
Three Months Ended June 30,
(Dollars in thousands)
Six Months Ended June 30,
(Dollars in thousands)

13
North American wholesale segment selling and administrative expenses include, and are primarily related to, distribution costs, salaries and commissions, advertising costs, employee benefit costs and depreciation. As a percent of net sales, wholesale selling and administrative expenses were 31% and 27% for the quarters ended June 30, 2016 and 2015, respectively. For the six months ended June 30, wholesale selling and administrative expenses were 27% of net sales in 2016 and 25% of net sales in 2015. The increase in selling and administrative expenses as a percent of sales for the quarter and to date in 2016 is due to decreased net sales in 2016, as many of the Company’s selling and administrative costs are fixed in nature and do not correlate with changes in sales volume. North American Retail Segment Net Sales Net sales in the Company’s North American retail segment decreased $300,000 and $136,000, in the second quarter and for the six months ended June 30, 2016, respectively. Same store sales, which include sales of both the U.S. internet business and brick and mortar stores, decreased 2% for the quarter and increased 2% for the year-to-date period, as compared to the same periods in 2015. Sales for the quarter and year-to date were negatively impacted by the interruption of business caused by remodeling two stores during 2016. Earnings from Operations Retail earnings from operations decreased $261,000 and $287,000 for the three and six months ended June 30, 2016, respectively, compared to the same periods in 2015. These decreases were primarily due to lower sales at the Company’s brick and mortar stores. Gross earnings as a percent of net sales were 64.9% in the second quarter of 2016 compared to 66.1% in the second quarter of 2015. For the six months ended June 30, retail gross earnings as a percent of net sales were 64.9% in 2016 and 66.0% in 2015. Selling and administrative expenses for the retail segment include, and are primarily related to, rent and occupancy costs, employee costs, advertising expense and freight. Selling and administrative expenses as a percent of net sales were 60% and 56% for the three-month periods ended June 30, 2016 and 2015, respectively. For the six months ended June 30, selling and administrative expenses as a percent of net sales were 60% in 2016 and 58% in 2015. Other The Company’s other net sales were $10.7 million in the second quarter of 2016, down 1% as compared to $10.8 million in 2015. Florsheim Australia’s net sales decreased by 5% for the quarter, but were mostly offset by increased sales at Florsheim Europe. For the six months ended June 30, 2016, other net sales were $22.3 million, down 2% from $22.8 million in the same period last year. Florsheim Australia’s sales through June 30th were down 6% in 2016 compared to the same period last year, but that loss was partially offset by increased sales at Florsheim Europe. Collectively, the earnings from operations of the Company’s other businesses were $325,000 this quarter, compared to $650,000 in the second quarter of 2015. For the six months ended June 30, 2016, earnings from operations of the Company’s other businesses were $561,000 compared to $1.4 million in the same period last year. These decreases were mainly due to lower sales and gross margins at Florsheim Australia. Florsheim Australia purchases its inventory in U.S. dollars, and its gross margins have been negatively impacted by the weakness of its local currency compared to the U.S. dollar.
14
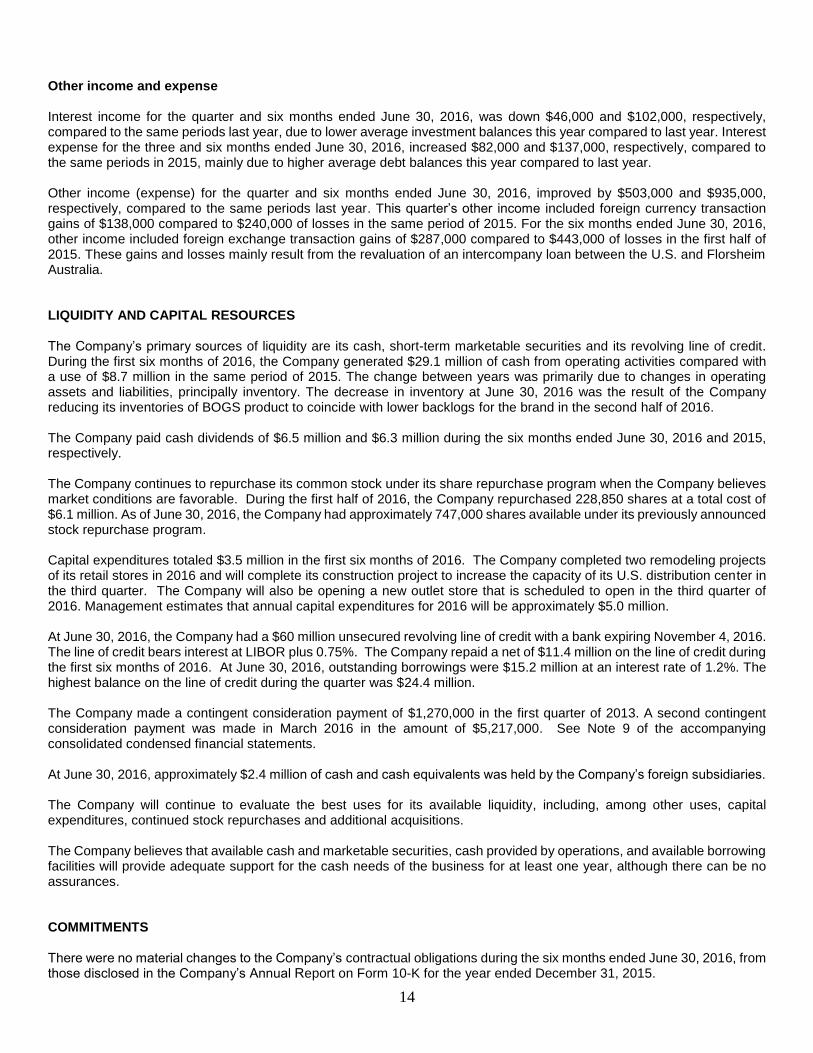
Other income and expense Interest income for the quarter and six months ended June 30, 2016, was down $46,000 and $102,000, respectively, compared to the same periods last year, due to lower average investment balances this year compared to last year. Interest expense for the three and six months ended June 30, 2016, increased $82,000 and $137,000, respectively, compared to the same periods in 2015, mainly due to higher average debt balances this year compared to last year. Other income (expense) for the quarter and six months ended June 30, 2016, improved by $503,000 and $935,000, respectively, compared to the same periods last year. This quarter’s other income included foreign currency transaction gains of $138,000 compared to $240,000 of losses in the same period of 2015. For the six months ended June 30, 2016, other income included foreign exchange transaction gains of $287,000 compared to $443,000 of losses in the first half of 2015. These gains and losses mainly result from the revaluation of an intercompany loan between the U.S. and Florsheim Australia. LIQUIDITY AND CAPITAL RESOURCES The Company’s primary sources of liquidity are its cash, short-term marketable securities and its revolving line of credit. During the first six months of 2016, the Company generated $29.1 million of cash from operating activities compared with a use of $8.7 million in the same period of 2015. The change between years was primarily due to changes in operating assets and liabilities, principally inventory. The decrease in inventory at June 30, 2016 was the result of the Company reducing its inventories of BOGS product to coincide with lower backlogs for the brand in the second half of 2016. The Company paid cash dividends of $6.5 million and $6.3 million during the six months ended June 30, 2016 and 2015, respectively. The Company continues to repurchase its common stock under its share repurchase program when the Company believes market conditions are favorable. During the first half of 2016, the Company repurchased 228,850 shares at a total cost of $6.1 million. As of June 30, 2016, the Company had approximately 747,000 shares available under its previously announced stock repurchase program. Capital expenditures totaled $3.5 million in the first six months of 2016. The Company completed two remodeling projects of its retail stores in 2016 and will complete its construction project to increase the capacity of its U.S. distribution center in the third quarter. The Company will also be opening a new outlet store that is scheduled to open in the third quarter of 2016. Management estimates that annual capital expenditures for 2016 will be approximately $5.0 million. At June 30, 2016, the Company had a $60 million unsecured revolving line of credit with a bank expiring November 4, 2016. The line of credit bears interest at LIBOR plus 0.75%. The Company repaid a net of $11.4 million on the line of credit during the first six months of 2016. At June 30, 2016, outstanding borrowings were $15.2 million at an interest rate of 1.2%. The highest balance on the line of credit during the quarter was $24.4 million. The Company made a contingent consideration payment of $1,270,000 in the first quarter of 2013. A second contingent consideration payment was made in March 2016 in the amount of $5,217,000. See Note 9 of the accompanying consolidated condensed financial statements. At June 30, 2016, approximately $2.4 million of cash and cash equivalents was held by the Company’s foreign subsidiaries. The Company will continue to evaluate the best uses for its available liquidity, including, among other uses, capital expenditures, continued stock repurchases and additional acquisitions. The Company believes that available cash and marketable securities, cash provided by operations, and available borrowing facilities will provide adequate support for the cash needs of the business for at least one year, although there can be no assurances. COMMITMENTS There were no material changes to the Company’s contractual obligations during the six months ended June 30, 2016, from those disclosed in the Company’s Annual Report on Form 10-K for the year ended December 31, 2015.

15
Item 3. Quantitative and Qualitative Disclosures About Market Risk. There have been no material changes from those reported in the Company’s Annual Report on Form 10-K for the year ended December 31, 2015. Item 4. Controls and Procedures. The Company maintains disclosure controls and procedures designed to ensure that the information the Company must disclose in its filings with the Securities and Exchange Commission is recorded, processed, summarized and reported on a timely basis. The Company’s Chief Executive Officer and Chief Financial Officer have reviewed and evaluated the Company’s disclosure controls and procedures as defined in Rules 13a-15(e) and 15d-15(e) under the Securities Exchange Act of 1934, as amended (the “Exchange Act”), as of the end of the period covered by this report (the “Evaluation Date”). Based on such evaluation, such officers have concluded that, as of the Evaluation Date, the Company’s disclosure controls and procedures are effective in bringing to their attention on a timely basis material information relating to the Company required to be included in the Company’s periodic filings under the Exchange Act. Such officers have also concluded that, as of the Evaluation Date, the Company’s disclosure controls and procedures are effective in accumulating and communicating information in a timely manner, allowing timely decisions regarding required disclosures. There have been no significant changes in the Company’s internal control over financial reporting (as defined in Exchange Act Rules 13a-15(f) and 15d-15(f)) that occurred during the Company’s most recent fiscal quarter that have materially affected, or are reasonably likely to materially affect, the Company’s internal control over financial reporting.
PART II. OTHER INFORMATION Item 1. Legal Proceedings. None Item 1A. Risk Factors. There have been no material changes to the risk factors affecting the Company from those disclosed in the Company’s Annual Report on Form 10-K for the year ended December 31, 2015. Item 2. Unregistered Sales of Equity Securities and Use of Proceeds. The table below presents information pursuant to Item 703(a) of Regulation S-K regarding the purchase of the Company’s common stock by the Company in the three month period ended June 30, 2016.
Item 6. Exhibits. See the Exhibit Index included herewith for a listing of exhibits.
Total Number of Maximum Number
Total Average Shares Purchased as of Shares
Number Price Part of the Publicly that May Yet Be
of Shares Paid Announced Purchased Under
Period Purchased Per Share Program the Program (1)
4/1/2016 - 4/30/2016 33,916 27.67$ 33,916 830,303
5/1/2016 - 5/31/2016 46,638 27.06$ 46,638 783,665
6/1/2016 - 6/30/2016 36,357 27.81$ 36,357 747,308
Total 116,911 25.86$ 116,911
(1) In 1998 the Company's stock repurchase program was established. On several occasions since the program's inception, the Board of
Directors has extended the number of shares authorized for repurchase under the program. In total, 6.5 million shares have been
authorized for repurchase.
16
SIGNATURES
Pursuant to the requirements of the Securities Exchange Act of 1934, the registrant has duly caused this report to be signed on its behalf by the undersigned thereunto duly authorized.
WEYCO GROUP, INC.
Dated: August 5, 2016 /s/ John F. Wittkowske
John F. Wittkowske
Senior Vice President and Chief Financial Officer
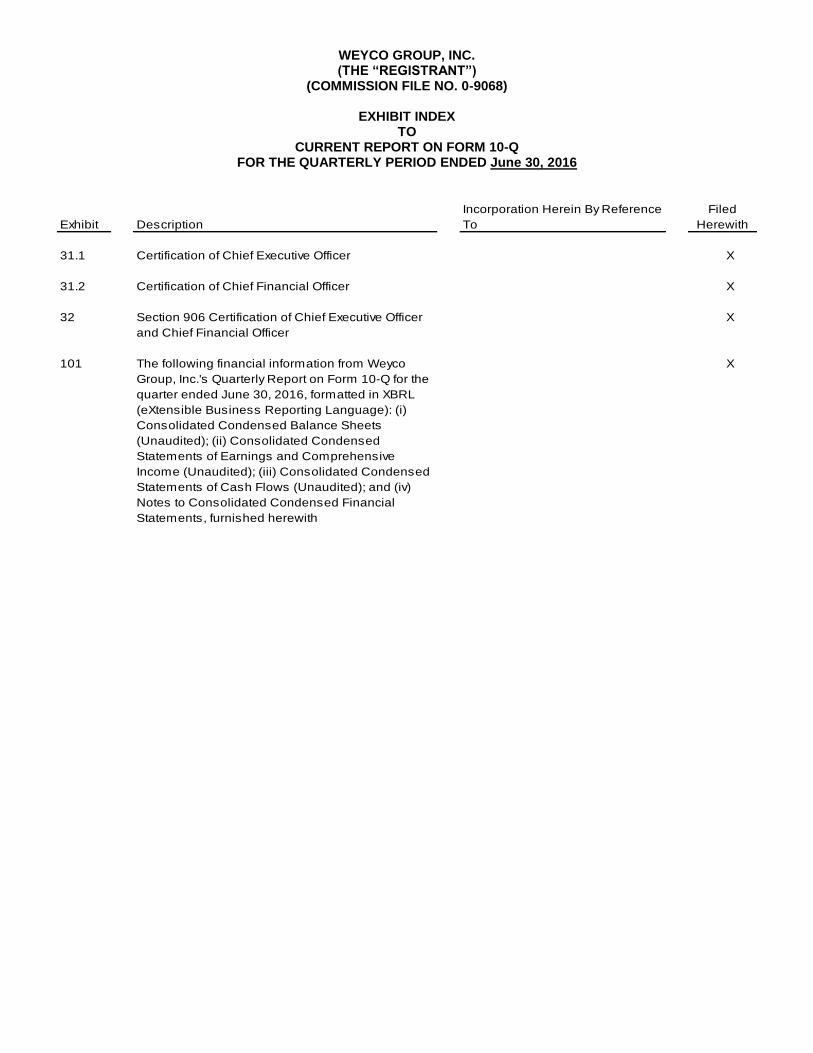
WEYCO GROUP, INC. (THE “REGISTRANT”)
(COMMISSION FILE NO. 0-9068)
EXHIBIT INDEX TO
CURRENT REPORT ON FORM 10-Q FOR THE QUARTERLY PERIOD ENDED June 30, 2016
Exhibit Description
Incorporation Herein By Reference
To
Filed
Herewith
31.1 Certification of Chief Executive Officer X
31.2 Certification of Chief Financial Officer X
32 Section 906 Certification of Chief Executive Officer
and Chief Financial Officer
X
101 The following financial information from Weyco
Group, Inc.'s Quarterly Report on Form 10-Q for the
quarter ended June 30, 2016, formatted in XBRL
(eXtensible Business Reporting Language): (i)
Consolidated Condensed Balance Sheets
(Unaudited); (ii) Consolidated Condensed
Statements of Earnings and Comprehensive
Income (Unaudited); (iii) Consolidated Condensed
Statements of Cash Flows (Unaudited); and (iv)
Notes to Consolidated Condensed Financial
Statements, furnished herewith
X

EXHIBIT 31.1 CERTIFICATION
I, Thomas W. Florsheim, Jr., certify that: 1. I have reviewed this quarterly report on Form 10-Q of Weyco Group, Inc.; 2. Based on my knowledge, this report does not contain any untrue statement of a material fact or omit to state a material fact necessary to make the statements made, in light of the circumstances under which such statements were made, not misleading with respect to the period covered by this report; 3. Based on my knowledge, the financial statements, and other financial information included in this report, fairly present in all material respects the financial condition, results of operations and cash flows of the registrant as of, and for, the periods presented in this report; 4. The registrant's other certifying officer and I are responsible for establishing and maintaining disclosure controls and procedures (as defined in Exchange Act Rules 13a-15(e) and 15d-15(e)) and internal control over financial reporting (as defined in Exchange Act Rules 13a-15(f) and 15d-15(f)) for the registrant and have: a) Designed such disclosure controls and procedures, or caused such disclosure controls and procedures to be designed under our supervision, to ensure that material information relating to the registrant, including its consolidated subsidiaries, is made known to us by others within those entities, particularly during the period in which this report is being prepared; b) Designed such internal control over financial reporting, or caused such internal control over financial reporting to be designed under our supervision, to provide reasonable assurance regarding the reliability of financial reporting and the preparation of financial statements for external purposes in accordance with generally accepted accounting principles; c) Evaluated the effectiveness of the registrant's disclosure controls and procedures and presented in this report our conclusions about the effectiveness of the disclosure controls and procedures, as of the end of the period covered by this report based on such evaluation; and d) Disclosed in this report any change in the registrant’s internal control over financial reporting that occurred during the registrant’s most recent fiscal quarter (the registrant’s fourth fiscal quarter in the case of an annual report) that has materially affected, or is reasonably likely to materially affect, the registrant’s internal control over financial reporting; and 5. The registrant's other certifying officer and I have disclosed, based on our most recent evaluation of internal control over financial reporting, to the registrant's auditors and the audit committee of the registrant's board of directors (or persons performing the equivalent functions): a) All significant deficiencies and material weaknesses in the design or operation of internal control over financial reporting which are reasonably likely to adversely affect the registrant’s ability to record, process, summarize and report financial information; and b) Any fraud, whether or not material, that involves management or other employees who have a significant role in the registrant’s internal control over financial reporting.
Dated: August 5, 2016 /s/ Thomas W. Florsheim, Jr.
Thomas W. Florsheim, Jr.
Chief Executive Officer

1
EXHIBIT 31.2 CERTIFICATION
I, John F. Wittkowske, certify that: 1. I have reviewed this quarterly report on Form 10-Q of Weyco Group, Inc.; 2. Based on my knowledge, this report does not contain any untrue statement of a material fact or omit to state a material fact necessary to make the statements made, in light of the circumstances under which such statements were made, not misleading with respect to the period covered by this report; 3. Based on my knowledge, the financial statements, and other financial information included in this report, fairly present in all material respects the financial condition, results of operations and cash flows of the registrant as of, and for, the periods presented in this report; 4. The registrant's other certifying officer and I are responsible for establishing and maintaining disclosure controls and procedures (as defined in Exchange Act Rules 13a-15(e) and 15d-15(e)) and internal control over financial reporting (as defined in Exchange Act Rules 13a-15(f) and 15d-15(f)) for the registrant and have: a) Designed such disclosure controls and procedures, or caused such disclosure controls and procedures to be designed under our supervision, to ensure that material information relating to the registrant, including its consolidated subsidiaries, is made known to us by others within those entities, particularly during the period in which this report is being prepared; b) Designed such internal control over financial reporting, or caused such internal control over financial reporting to be designed under our supervision, to provide reasonable assurance regarding the reliability of financial reporting and the preparation of financial statements for external purposes in accordance with generally accepted accounting principles; c) Evaluated the effectiveness of the registrant's disclosure controls and procedures and presented in this report our conclusions about the effectiveness of the disclosure controls and procedures, as of the end of the period covered by this report based on such evaluation; and d) Disclosed in this report any change in the registrant’s internal control over financial reporting that occurred during the registrant’s most recent fiscal quarter (the registrant’s fourth fiscal quarter in the case of an annual report) that has materially affected, or is reasonably likely to materially affect, the registrant’s internal control over financial reporting; and 5. The registrant's other certifying officer and I have disclosed, based on our most recent evaluation of internal control over financial reporting, to the registrant's auditors and the audit committee of the registrant's board of directors (or persons performing the equivalent functions): a) All significant deficiencies and material weaknesses in the design or operation of internal control over financial reporting which are reasonably likely to adversely affect the registrant’s ability to record, process, summarize and report financial information; and b) Any fraud, whether or not material, that involves management or other employees who have a significant role in the registrant’s internal control over financial reporting.
Dated: August 5, 2016 /s/ John F. Wittkowske
John F. Wittkowske
Chief Financial Officer

EXHIBIT 32 CERTIFICATION OF PERIODIC FINANCIAL REPORTS
We, Thomas W. Florsheim, Jr., Chief Executive Officer, and John F. Wittkowske, Chief Financial Officer, of Weyco Group, Inc. each certify, pursuant to Section 906 of the Sarbanes-Oxley Act of 2002, that, to the best of our knowledge:
(1) The Periodic Report on Form 10-Q for the quarter ended June 30, 2016, (the “Periodic Report”) to which this statement is an exhibit fully complies with the requirements of Section 13(a) or 15(d) of the Securities Exchange Act of 1934 (15 U.S.C. 78m or 78o(d)) and
(2) The information contained in the Periodic Report fairly presents, in all material respects, the financial condition and results of operations of Weyco Group, Inc.
Dated: August 5, 2016 /s/ Thomas W. Florsheim, Jr.
Thomas W. Florsheim, Jr.
Chief Executive Officer
/s/ John F. Wittkowske
John F. Wittkowske
Chief Financial Officer
A signed original of this written statement required by Section 906, or other document authenticating, acknowledging, or otherwise adopting the signature that appears in type form within the electronic version of this written statement required by Section 906, has been provided to Weyco Group, Inc. and will be retained by Weyco Group, Inc. and furnished to the Securities and Exchange Commission or its staff upon request.