Embed Size (px)
Citation preview
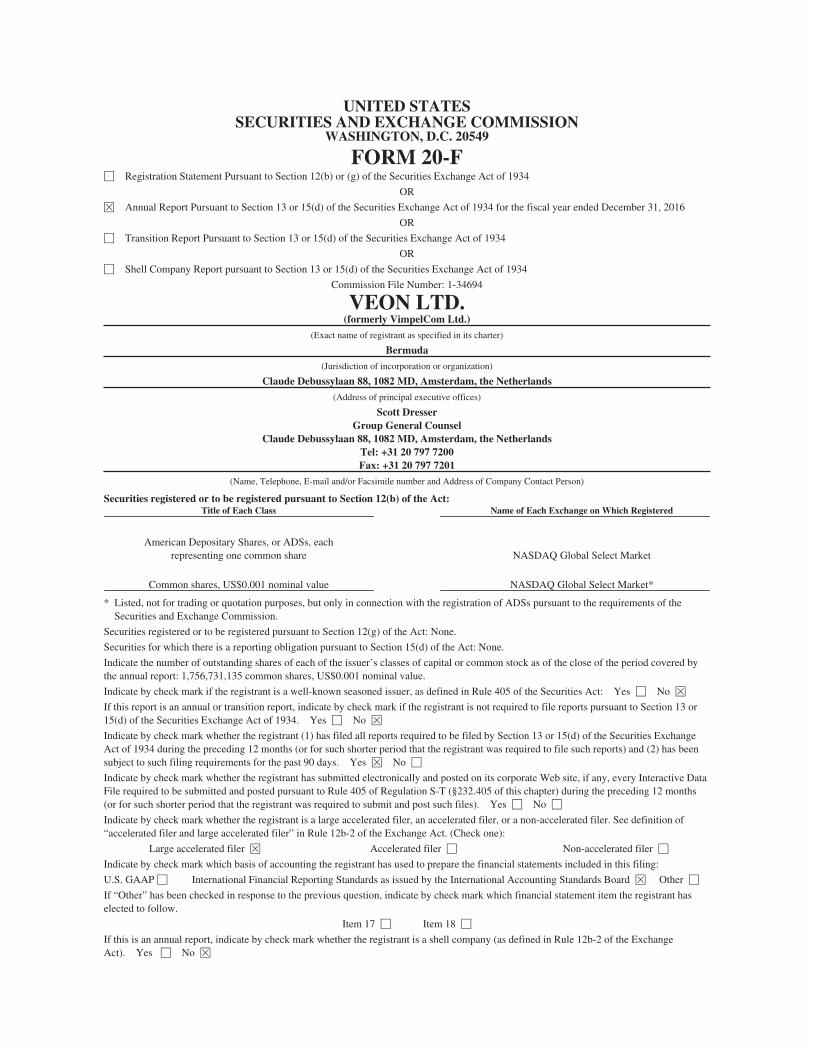
UNITED STATESSECURITIES AND EXCHANGE COMMISSION
WASHINGTON, D.C. 20549
FORM 20-F‘ Registration Statement Pursuant to Section 12(b) or (g) of the Securities Exchange Act of 1934
OR
È Annual Report Pursuant to Section 13 or 15(d) of the Securities Exchange Act of 1934 for the fiscal year ended December 31, 2016
OR
‘ Transition Report Pursuant to Section 13 or 15(d) of the Securities Exchange Act of 1934
OR
‘ Shell Company Report pursuant to Section 13 or 15(d) of the Securities Exchange Act of 1934
Commission File Number: 1-34694
VEON LTD.(formerly VimpelCom Ltd.)
(Exact name of registrant as specified in its charter)
Bermuda
(Jurisdiction of incorporation or organization)
Claude Debussylaan 88, 1082 MD, Amsterdam, the Netherlands
(Address of principal executive offices)
Scott DresserGroup General Counsel
Claude Debussylaan 88, 1082 MD, Amsterdam, the NetherlandsTel: +31 20 797 7200Fax: +31 20 797 7201
(Name, Telephone, E-mail and/or Facsimile number and Address of Company Contact Person)
Securities registered or to be registered pursuant to Section 12(b) of the Act:Title of Each Class Name of Each Exchange on Which Registered
American Depositary Shares, or ADSs, eachrepresenting one common share NASDAQ Global Select Market
Common shares, US$0.001 nominal value NASDAQ Global Select Market*
* Listed, not for trading or quotation purposes, but only in connection with the registration of ADSs pursuant to the requirements of theSecurities and Exchange Commission.
Securities registered or to be registered pursuant to Section 12(g) of the Act: None.
Securities for which there is a reporting obligation pursuant to Section 15(d) of the Act: None.
Indicate the number of outstanding shares of each of the issuer’s classes of capital or common stock as of the close of the period covered bythe annual report: 1,756,731,135 common shares, US$0.001 nominal value.
Indicate by check mark if the registrant is a well-known seasoned issuer, as defined in Rule 405 of the Securities Act: Yes ‘ No È
If this report is an annual or transition report, indicate by check mark if the registrant is not required to file reports pursuant to Section 13 or15(d) of the Securities Exchange Act of 1934. Yes ‘ No È
Indicate by check mark whether the registrant (1) has filed all reports required to be filed by Section 13 or 15(d) of the Securities ExchangeAct of 1934 during the preceding 12 months (or for such shorter period that the registrant was required to file such reports) and (2) has beensubject to such filing requirements for the past 90 days. Yes È No ‘
Indicate by check mark whether the registrant has submitted electronically and posted on its corporate Web site, if any, every Interactive DataFile required to be submitted and posted pursuant to Rule 405 of Regulation S-T (§232.405 of this chapter) during the preceding 12 months(or for such shorter period that the registrant was required to submit and post such files). Yes ‘ No ‘
Indicate by check mark whether the registrant is a large accelerated filer, an accelerated filer, or a non-accelerated filer. See definition of“accelerated filer and large accelerated filer” in Rule 12b-2 of the Exchange Act. (Check one):
Large accelerated filer È Accelerated filer ‘ Non-accelerated filer ‘
Indicate by check mark which basis of accounting the registrant has used to prepare the financial statements included in this filing:
U.S. GAAP ‘ International Financial Reporting Standards as issued by the International Accounting Standards Board È Other ‘
If “Other” has been checked in response to the previous question, indicate by check mark which financial statement item the registrant haselected to follow.
Item 17 ‘ Item 18 ‘
If this is an annual report, indicate by check mark whether the registrant is a shell company (as defined in Rule 12b-2 of the ExchangeAct). Yes ‘ No È
TABLE OF CONTENTS
ITEM 1. Identity of Directors, Senior Management and Advisors . . . . . . . . . . . . . . . . . . . . . . . . . . . . . . 7ITEM 2. Offer Statistics and Expected Timetable . . . . . . . . . . . . . . . . . . . . . . . . . . . . . . . . . . . . . . . . . . . 7ITEM 3. Key Information . . . . . . . . . . . . . . . . . . . . . . . . . . . . . . . . . . . . . . . . . . . . . . . . . . . . . . . . . . . . . . 7ITEM 4. Information on the Company . . . . . . . . . . . . . . . . . . . . . . . . . . . . . . . . . . . . . . . . . . . . . . . . . . . . 43ITEM 4A. Unresolved Staff Comments . . . . . . . . . . . . . . . . . . . . . . . . . . . . . . . . . . . . . . . . . . . . . . . . . . . . 97ITEM 5. Operating and Financial Review and Prospects . . . . . . . . . . . . . . . . . . . . . . . . . . . . . . . . . . . . . . 98ITEM 6. Directors, Senior Management and Employees . . . . . . . . . . . . . . . . . . . . . . . . . . . . . . . . . . . . . . 154ITEM 7. Major Shareholders and Related Party Transactions . . . . . . . . . . . . . . . . . . . . . . . . . . . . . . . . . . 164ITEM 8. Financial Information . . . . . . . . . . . . . . . . . . . . . . . . . . . . . . . . . . . . . . . . . . . . . . . . . . . . . . . . . . 168ITEM 9. The Offer and Listing . . . . . . . . . . . . . . . . . . . . . . . . . . . . . . . . . . . . . . . . . . . . . . . . . . . . . . . . . . 170ITEM 10. Additional Information . . . . . . . . . . . . . . . . . . . . . . . . . . . . . . . . . . . . . . . . . . . . . . . . . . . . . . . . . 171ITEM 11. Quantitative and Qualitative Disclosures About Market Risk . . . . . . . . . . . . . . . . . . . . . . . . . . . 185ITEM 12. Description of Securities other than Equity Securities . . . . . . . . . . . . . . . . . . . . . . . . . . . . . . . . 186ITEM 13. Defaults, Dividend Arrearages and Delinquencies . . . . . . . . . . . . . . . . . . . . . . . . . . . . . . . . . . . 188ITEM 14. Material Modifications to the Rights of Security Holders and Use of Proceeds . . . . . . . . . . . . . 188ITEM 15. Controls and Procedures . . . . . . . . . . . . . . . . . . . . . . . . . . . . . . . . . . . . . . . . . . . . . . . . . . . . . . . 188ITEM 15T. Controls and Procedures . . . . . . . . . . . . . . . . . . . . . . . . . . . . . . . . . . . . . . . . . . . . . . . . . . . . . . . 189ITEM 16. [Reserved] . . . . . . . . . . . . . . . . . . . . . . . . . . . . . . . . . . . . . . . . . . . . . . . . . . . . . . . . . . . . . . . . . . 189ITEM 16A. Audit Committee Financial Expert . . . . . . . . . . . . . . . . . . . . . . . . . . . . . . . . . . . . . . . . . . . . . . . 189ITEM 16B. Code of Ethics . . . . . . . . . . . . . . . . . . . . . . . . . . . . . . . . . . . . . . . . . . . . . . . . . . . . . . . . . . . . . . . 189ITEM 16C. Principal Accountant Fees and Services . . . . . . . . . . . . . . . . . . . . . . . . . . . . . . . . . . . . . . . . . . . 190ITEM 16D. Exemptions from the Listing Standards for Audit Committees . . . . . . . . . . . . . . . . . . . . . . . . . . 190ITEM 16E. Purchases of Equity Securities by the Issuer and Affiliated Purchasers . . . . . . . . . . . . . . . . . . . 190ITEM 16F. Change in Registrant’s Certifying Accountant . . . . . . . . . . . . . . . . . . . . . . . . . . . . . . . . . . . . . . 191ITEM 16G. Corporate Governance . . . . . . . . . . . . . . . . . . . . . . . . . . . . . . . . . . . . . . . . . . . . . . . . . . . . . . . . . 191ITEM 16H Mine Safety Disclosure . . . . . . . . . . . . . . . . . . . . . . . . . . . . . . . . . . . . . . . . . . . . . . . . . . . . . . . . 192ITEM 17. Financial Statements . . . . . . . . . . . . . . . . . . . . . . . . . . . . . . . . . . . . . . . . . . . . . . . . . . . . . . . . . . 193ITEM 18. Financial Statements . . . . . . . . . . . . . . . . . . . . . . . . . . . . . . . . . . . . . . . . . . . . . . . . . . . . . . . . . . 193ITEM 19. Exhibits . . . . . . . . . . . . . . . . . . . . . . . . . . . . . . . . . . . . . . . . . . . . . . . . . . . . . . . . . . . . . . . . . . . . 194
EXPLANATORY NOTE
On March 30, 2017, VimpelCom Ltd. changed its name to VEON Ltd. Please see Exhibit 1.2 to this AnnualReport an Form 20-F.
References in this Annual Report on Form 20-F to “VEON” and the “VEON Group,” as well as referencesto “our company,” “the company,” “our group,” “the group,” “we,” “us,” “our” and similar pronouns, arereferences to VEON Ltd. as of March 30, 2017 and to VimpelCom Ltd. prior to March 30, 2017, an exemptedcompany limited by shares registered in Bermuda, and its consolidated subsidiaries. References to VEON Ltd.are to VEON Ltd. alone as of March 30, 2017 and to VimpelCom Ltd. alone prior to March 30, 2017. All sectionreferences appearing in this Annual Report on Form 20-F are to sections of this Annual Report on Form 20-F,unless otherwise indicated. This Annual Report on Form 20-F includes audited consolidated financial statementsas of and for the years ended December 31, 2016, 2015 and 2014 prepared in accordance with InternationalFinancial Reporting Standards, or “IFRS,” as issued by the International Accounting Standards Board, or“IASB,” and presented in U.S. dollars. VEON Ltd. adopted IFRS as of January 1, 2009.
In this Annual Report on Form 20-F, references to (i) “U.S. dollars” and “US$” are to the lawful currency ofthe United States of America, (ii) “Russian rubles,” “rubles” or “RUB” are to the lawful currency of the RussianFederation, (iii) “Pakistani rupees” or “PKR” are to the lawful currency of Pakistan, (iv) “Algerian dinar” or“DZD” are to the lawful currency of Algeria, (v) “Bangladeshi taka” or “BDT” are to the lawful currency of
1
Bangladesh, (vi) “Ukrainian hryvnia,” “hryvnia” or “UAH” are to the lawful currency of Ukraine,(vii) “Uzbek som” or “UZS” are to the lawful currency of Uzbekistan, (viii) “Kazakh tenge” or “KZT” are to thelawful currency of the Republic of Kazakhstan, (ix) “Kyrgyz som” are to the lawful currency of Kyrgyzstan, (x)“Armenian dram” are to the lawful currency of the Republic of Armenia, (xi) “Tajik somoni” are to the lawfulcurrency of Tajikistan, (xii) “Georgian lari” are to the lawful currency of Georgia, (xiii) “Lao kip” are to thelawful currency of Laos and (xiv) “€,” “EUR” or “euro” are to the single currency of the participating memberstates of the European and Monetary Union of the Treaty Establishing the European Community, as amendedfrom time to time. In addition, references to “EU” are to the European Union, references to “LIBOR” are to theLondon Interbank Offered Rate, references to “EURIBOR” are to the Euro Interbank Offered Rate, references to“MosPRIME” are to the Moscow Prime Offered Rate, references to “KIBOR” are to the Karachi InterbankOffered Rate and references to “Bangladeshi T-Bill” are to Bangladeshi Treasury Bills.
This Annual Report on Form 20-F contains translations of certain non-U.S. currency amounts into U.S.dollars at specified rates solely for the convenience of the reader. These translations should not be construed asrepresentations that the relevant non-U.S. currency amounts actually represent such U.S. dollar amounts or couldbe converted, were converted or will be converted into U.S. dollars at the rates indicated. Unless otherwiseindicated, U.S. dollar amounts have been translated from euro, Pakistani rupee, Algerian dinar, Lao Kip andBangladeshi taka amounts at the exchange rates provided by Bloomberg Finance L.P. and from Russian ruble,Ukrainian hryvnia, Kazakh tenge, Uzbek som, Armenian dram, Georgian lari and Kyrgyz som amounts at officialexchange rates, as described in more detail under “Item 5—Operating and Financial Review and Prospects—Certain Ongoing Factors Affecting Our Financial Position and Results of Operations—Foreign CurrencyTranslation” below.
The discussion of our business and the telecommunications industry in this Annual Report on Form 20-Fcontains references to certain terms specific to our business, including numerous technical and industry terms.Such terms are defined in “Exhibit 99.1—Glossary of Terms.”
Certain amounts and percentages that appear in this Annual Report on Form 20-F have been subject torounding adjustments. As a result, certain numerical figures shown as totals, including in tables, may not be exactarithmetic aggregations of the figures that precede or follow them.
As of November 5, 2016, VEON Ltd. owns a 50.0% share of the Italy Joint Venture (as defined herein). Weaccount for the Italy Joint Venture using the equity method. We do not control the Italy Joint Venture. Allinformation related to the Italy Joint Venture is the sole responsibility of the Italy Joint Venture’s management,and no information contained herein, including, but not limited to, the Italy Joint Venture’s financial and industrydata, market projections and strategy, has been prepared by or on behalf of, or approved by, our management.VEON Ltd. is not making, and has not made, any written or oral representation or warranty, express or implied,of any nature whatsoever, with respect to any Italy Joint Venture information included in this Annual Report onForm 20-F, other than the financial information that is derived directly from our financial statements.
Accounting Treatment of our Historical WIND Business and the new Italy Joint Venture.
On November 5, 2016, we completed a transaction to form a joint venture holding company with CKHutchison Holdings Limited (“Hutchison”), through which we jointly own and operate our historical WIND andHutchison’s historical 3 Italia telecommunications businesses in Italy. Italy is no longer a reportable segment.We account for the Italy Joint Venture using the equity method. However, financial and operational informationfor Italy is included in this Annual Report on Form 20-F because completion of the Italy Joint Venture occurredten months into the 2016 financial year, and because the Italy Joint Venture is a significant part of our business.
From January 1, 2016 to November 5, 2016, we classified our Italian business unit as an asset held for saleand discontinued operation in our financial statements. In connection with this classification, VEON Ltd. nolonger accounted for depreciation and amortization expenses of the Italian assets. The financial data for 2015,2014, 2013 and 2012 reflects the classification of Italy as an asset held for sale and a discontinued operation.
2
The data for 2012 is unaudited. The intercompany positions were disclosed as related party transactions andbalances. The transaction was successfully completed on November 5, 2016. Under the transaction, VEON Ltd.contributed its entire shareholding in the operations in Italy, in exchange for a 50% interest in the newly formedItaly Joint Venture. As a result, the company does not control the Italy Joint Venture’s operations in Italy. Pleaserefer to Notes 6, 13 and 26 to our audited consolidated financial statements included elsewhere in this AnnualReport on Form 20-F for further information.
Non-IFRS Financial Measures
Adjusted EBITDA and Adjusted EBITDA Margin. Adjusted EBITDA and Adjusted EBITDA Margin arenon-IFRS financial measures. VEON calculates Adjusted EBITDA as profit/(loss) for the year beforedepreciation, amortization, impairment loss, finance costs, income tax expense and the other line items reflectedin the reconciliation table in “Item 5—Certain Performance Indicators—Adjusted EBITDA.” Our consolidatedAdjusted EBITDA includes certain reconciliation adjustments necessary because our Russia segment excludescertain expenses from its Adjusted EBITDA. As a result of the reconciliations, our consolidated AdjustedEBITDA differs from the aggregation of Adjusted EBITDA of each of our reportable segments. AdjustedEBITDA Margin is calculated as Adjusted EBITDA divided by total operating revenue, expressed as apercentage. Adjusted EBITDA and Adjusted EBITDA Margin should not be considered in isolation or as asubstitute for analyses of the results as reported under IFRS. Our management uses Adjusted EBITDA andAdjusted EBITDA margin as supplemental performance measures and believes that Adjusted EBITDA andAdjusted EBITDA Margin provide useful information to investors because they are indicators of the strength andperformance of the company’s business operations, including its ability to fund discretionary spending, such ascapital expenditures, acquisitions and other investments, as well as indicate its ability to incur and service debt.In addition, the components of Adjusted EBITDA and Adjusted EBITDA Margin include the key revenue andexpense items for which the company’s operating managers are responsible and upon which their performance isevaluated. Adjusted EBITDA and Adjusted EBITDA Margin also assist management and investors by increasingthe comparability of the company’s performance against the performance of other telecommunicationscompanies that provide EBITDA (earnings before interest, taxes, depreciation and amortization) or OIBDA(operating income before depreciation and amortization) information. This increased comparability is achievedby excluding the potentially inconsistent effects between periods or companies of depreciation, amortization andimpairment losses, which items may significantly affect operating profit between periods. However, our AdjustedEBITDA results may not be directly comparable to other companies’ reported EBITDA or OIBDA results due tovariances and adjustments in the components of EBITDA (including our calculation of Adjusted EBITDA) orcalculation measures. Additionally, a limitation of EBITDA’s or Adjusted EBITDA’s use as a performancemeasure is that it does not reflect the periodic costs of certain capitalized tangible and intangible assets used ingenerating revenue or the need to replace capital equipment over time. Reconciliation of Adjusted EBITDA toprofit for the year, the most directly comparable IFRS financial measure, is presented in “Item 5—CertainPerformance Indicators—Adjusted EBITDA” below.
Capital Expenditures. In this Annual Report on Form 20-F, we present capital expenditures, which arepurchases of new equipment, new construction, upgrades, software, other long-lived assets and related reasonablecosts incurred prior to intended use of the non-current asset, accounted at the earliest event of advance paymentor delivery. Long-lived assets acquired in business combinations are not included in capital expenditures. In thisAnnual Report on Form 20-F, we present capital expenditures for all periods excluding our historical Italianoperations (WIND) following its classification as asset held for sale and a discontinued operation and excludingthe Italy Joint Venture. We also present capital expenditures without licenses. Reconciliation of capitalexpenditures to cash paid for purchase of property, plant and equipment and intangible assets, the most directlycomparable IFRS financial measure, is presented in “Item 5—Key Information—Liquidity and CapitalResources—Future Liquidity and Capital Requirements” below. For more information, please see “—AccountingTreatment of our Historical WIND Business and the new Italy Joint Venture” and Note 6 to our auditedconsolidated financial statements included elsewhere in this Annual Report on Form 20-F.
3
Functional currency financial measures. In the discussion and analysis of our results of operations, wepresent certain financial measures in functional currency terms. These non-IFRS financial measures include theresults of operations of our reportable segments in jurisdictions with local functional currencies, and exclude theimpact of translating the functional currency amounts to U.S. dollars. We analyze the performance of ourreportable segments on a functional currency basis to increase the comparability of results between periods.Because changes in foreign exchange rates have a non-operating impact on the results of operations (as a resultof translation to US$, our reporting currency), our management believes that evaluating their performance on afunctional currency basis provides an additional and meaningful assessment of performance to our managementand to investors. For information regarding our translation of foreign currency-denominated amounts into U.S.dollars, see “Item 5—Operating and Financial Review and Prospects—Certain Ongoing Factors Affecting OurFinancial Position and Results of Operations—Foreign Currency Translation” and Notes 2 and 5 to our auditedconsolidated financial statements included elsewhere in their Annual Report on Form 20-F.
Market and Industry Data
This Annual Report on Form 20-F contains industry, market and competitive position data that are based onthe industry publications and studies conducted by third parties noted herein and therein, as well as our owninternal estimates and research. These industry publications and third-party studies generally state that theinformation that they contain has been obtained from sources believed to be reliable, although they do notguarantee the accuracy or completeness of such information. While we believe that each of these publicationsand third-party studies is reliable, we have not independently verified the market and industry data obtained fromthese third-party sources. While we believe our internal research is reliable and the definition of our market andindustry are appropriate, neither such research nor these definitions have been verified by any independentsource.
Certain market and industry data in this Annual Report on Form 20-F is sourced from the report of AnalysysMason, dated March 16, 2017. Mobile penetration rate is defined as mobile connections divided by population.Population figures for the mobile penetration rates provided by Analysys Mason are sourced from the EconomistIntelligence Unit. Mobile connections are on a three-month active basis such that any SIM card that has not beenused for more than three months is excluded.
Trademarks
We have proprietary rights to trademarks used in this Annual Report on Form 20-F which are important toour business, many of which are registered under applicable intellectual property laws. Solely for convenience,trademarks and trade names referred to in this Annual Report on Form 20-F may appear without the “®” or “TM”symbols, but such references are not intended to indicate, in any way, that we will not assert, to the fullest extentpossible under applicable law, our rights or the rights of the applicable licensor to these trademarks and tradenames. We do not intend our use or display of other companies’ trade names, trademarks or service marks toimply a relationship with, or endorsement or sponsorship of us by, any other companies. Each trademark, tradename or service mark of any other company appearing in this Annual Report on Form 20-F is the property of itsrespective holder.
CAUTIONARY NOTE REGARDING FORWARD-LOOKING STATEMENTS
This Annual Report on Form 20-F contains estimates and forward-looking statements within the meaning ofSection 27A of the Securities Act of 1933, as amended (the “Securities Act”) and Section 21E of the U.S.Securities Exchange Act of 1934, as amended (the “Exchange Act”). Our estimates and forward-lookingstatements are mainly based on our current expectations and estimates of future events and trends, which affector may affect our businesses and operations. Although we believe that these estimates and forward-lookingstatements are based upon reasonable assumptions, they are subject to numerous risks and uncertainties and aremade in light of information currently available to us. Many important factors, in addition to the factors
4
described in this Annual Report on Form 20-F, may adversely affect our results as indicated in forward-lookingstatements. You should read this Annual Report on Form 20-F completely and with the understanding that ouractual future results may be materially different and worse from what we expect.
All statements other than statements of historical fact are forward-looking statements. The words “may,”“might,” “will,” “could,” “would,” “should,” “expect,” “plan,” “anticipate,” “intend,” “seek,” “believe,”“estimate,” “predict,” “potential,” “continue,” “contemplate,” “possible” and similar words are intended toidentify estimates and forward-looking statements.
Our estimates and forward-looking statements may be influenced by various factors, including withoutlimitation:
• our plans to implement our strategic priorities, including with respect to our performancetransformation program; targets and strategic initiatives in the various countries in which we operate;business to business growth and other new revenue streams; digitalizing our business model; portfolioand asset optimization; improving customer experience and optimizing our capital structure;
• our anticipated performance and guidance for 2017 and 2018;
• our ability to generate sufficient cash flow to meet our debt service obligations and our expectationsregarding working capital and the repayment of our debt;
• our expectations regarding our capital expenditures and operational expenditures in and after 2016 andour ability to meet our projected capital requirements;
• our plans to upgrade and build out our networks and to optimize our network operations;
• our goals regarding value, experience and service for our customers, as well as our ability to retain andattract customers and to maintain and expand our market share positions;
• our plans to develop, provide and expand our products and services, including operational and networkdevelopment and network investment, such as expectations regarding the roll-out and benefits of 3G/4G/LTE networks or other networks; broadband services and integrated products and services, such asfixed-mobile convergence;
• our ability to execute our business strategy successfully and to complete, and achieve the expectedsynergies from, our existing and future transactions, such as the new joint venture with Hutchison,through which we will jointly own and operate our telecommunications businesses comprised of thehistorical Hutchison business, 3 Italia S.p.A. (“3 Italia”) and the historical VEON business, WindTelecomunicazioni S.p.A. (“WIND”), in Italy (a transaction and resulting business that we refer to asthe “Italy Joint Venture” in this Annual Report on Form 20-F) and our merger with Warid TelecomPakistan LLC (“WTPL”) and Bank Alfalah Limited (“Bank Alfalah”), which resulted in the merger ofour telecommunications businesses in Pakistan (a transaction we refer to as the “Pakistan Merger” inthis Annual Report on Form 20-F);
• our ability to integrate acquired companies, joint ventures or other forms of strategic partnerships intoour existing businesses in a timely and cost-effective manner and to realize anticipated synergiestherefrom;
• our expectations as to pricing for our products and services in the future, improving our monthlyaverage revenue per customer and our future costs and operating results;
• our plans regarding our dividend payments and policies, as well as our ability to receive dividends,distributions, loans, transfers or other payments or guarantees from our subsidiaries;
• our ability to meet license requirements and to obtain, maintain, renew or extend licenses, frequencyallocations and frequency channels and obtain related regulatory approvals;
• our plans regarding the marketing and distribution of our products and services, as well as our customerloyalty programs;
5
• our expectations regarding our competitive strengths, customer demands, market trends and futuredevelopments in the industry and markets in which we operate;
• possible adverse consequences resulting from our agreements announced on February 18, 2016 withthe U.S. Securities and Exchange Commission (“SEC”), the U.S. Department of Justice (“DOJ”), andthe Dutch Public Prosecution Service (Openbaar Ministerie) (“OM”), including the DeferredProsecution Agreement (the “DPA”) with the DOJ filed with the United States District Court for theSouthern District of New York, the judgment entered by the United States District Court for theSouthern District of New York related to the agreement with the SEC, including the consentincorporated therein (the “SEC Judgment”) and the settlement agreement with the OM (the “DutchSettlement Agreement”), as well as any litigation or additional investigations related to or resultingfrom the agreements, including the DPA and the SEC Judgment, including the retention of anindependent compliance monitor as required the DPA and the SEC Judgment, any changes in companypolicy or procedure resulting from the review by the independent compliance monitor or otherwiseundertaken by VEON Ltd., the duration of the independent compliance monitor’s review, andVEON Ltd.’s compliance with the terms of the resolutions with the DOJ, SEC, and OM; and
• other statements regarding matters that are not historical facts.
These statements are management’s best assessment of the company’s strategic and financial position and offuture market conditions, trends and other potential developments. While they are based on sources believed tobe reliable and on our management’s current knowledge and best belief, they are merely estimates or predictionsand cannot be relied upon. We cannot assure you that future results will be achieved. The risks and uncertaintiesthat may cause our actual results to differ materially from the results indicated, expressed or implied in theforward-looking statements used in this Annual Report on Form 20-F include:
• risks relating to changes in political, economic and social conditions in each of the countries in whichwe operate (including as a result of armed conflict) such as any harm, reputational or otherwise, thatmay arise due to changing social norms, our business involvement in a particular jurisdiction or anotherwise unforeseen development in science or technology;
• in each of the countries in which we operate, risks relating to legislation, regulation, taxation andcurrency, including laws, regulations, decrees and decisions governing the telecommunicationsindustry, costs of compliance, currency and exchange controls, currency fluctuations, taxationlegislation, abrupt changes in the regulatory environment, laws on foreign investment, anti-corruptionand anti-terror laws, economic sanctions and their official interpretation by governmental and otherregulatory bodies and courts;
• risks relating to a failure to meet expectations regarding various strategic initiatives, including, but notlimited to, the performance transformation program;
• risks related to solvency and other cash flow issues, including our ability to raise the necessaryadditional capital and incur additional indebtedness, the ability of our subsidiaries to make dividendpayments, our ability to develop additional sources of revenue and unforeseen disruptions in ourrevenue streams;
• risks that various courts or regulatory agencies with whom we are involved in legal challenges, taxdisputes or appeals may not find in our favor;
• risks relating to our company and its operations in each of the countries in which we operate, includingdemand for and market acceptance of our products and services, regulatory uncertainty regarding ourlicenses, frequency allocations and numbering capacity, constraints on our spectrum capacity,availability of line capacity, intellectual property rights protection, labor issues, interconnectionagreements, equipment failures and competitive product and pricing pressures;
• risks related to developments from competition, unforeseen or otherwise, in each of the countries inwhich we operate including our ability to keep pace with technological change and evolving industrystandards;
6
• risks associated with developments in the investigations by, and the agreements with, the DOJ, SECand OM and any additional investigations or litigation that may be initiated relating to or arising out ofany of the foregoing, and the costs associated therewith, including relating to remediation efforts andenhancements to our compliance programs, and the review by the independent compliance monitor;
• risks related to the activities of our strategic shareholders, lenders, employees, joint venture partners,representatives, agents, suppliers, customers and other third parties;
• risks associated with our existing and future transactions, including with respect to realizing theexpected synergies of closed transactions, such as the Italy Joint Venture and/or the Pakistan Merger,satisfying closing conditions for new transactions, obtaining regulatory approvals and implementingremedies;
• risks associated with data protection, cyber-attacks or systems and network disruptions, or theperception of such attacks or failures in each of the countries in which we operate, including the coststhat would be associated with such events and the reputation harm that could arise therefrom;
• risks related to the ownership of our American Depositary Receipts, including those associated withVEON Ltd.’s status as a Bermuda company and a foreign private issuer; and
• other risks and uncertainties.
These factors and the other risk factors described in “Item 3—Key Information—D. Risk Factors” are notnecessarily all of the factors that could cause actual results to differ materially from those expressed in any of ourforward-looking statements. Other unknown or unpredictable factors also could harm our future results. New riskfactors and uncertainties emerge from time to time and it is not possible for our management to predict all riskfactors and uncertainties, nor can we assess the impact of all factors on our business or the extent to which anyfactor, or combination of factors, may cause actual results to differ materially from those contained in anyforward-looking statements. Under no circumstances should the inclusion of such forward-looking statements inthis Annual Report on Form 20-F be regarded as a representation or warranty by us or any other person withrespect to the achievement of results set out in such statements or that the underlying assumptions used will infact be the case. Therefore, you are cautioned not to place undue reliance on these forward-looking statements.The forward-looking statements included in this Annual Report on Form 20-F are made only as of the date of thisAnnual Report on Form 20-F. We cannot assure you that any projected results or events will be achieved. Exceptto the extent required by law, we disclaim any obligation to update or revise any of these forward-lookingstatements, whether as a result of new information, future events or otherwise, after the date on which thestatements are made or to reflect the occurrence of unanticipated events.
PART I
ITEM 1. Identity of Directors, Senior Management and Advisors
Not required.
ITEM 2. Offer Statistics and Expected Timetable
Not required.
ITEM 3. Key Information
A. Selected Financial Data
The following selected consolidated financial data as of and for each of the five years ended December 31,2016 has been derived from our historical consolidated financial statements, which as of and for the years endedDecember 31, 2016, 2015 and 2014 have been audited by PricewaterhouseCoopers Accountants N.V., anindependent registered public accounting firm, and as of and for the years ended December 31, 2013 and 2012,
7
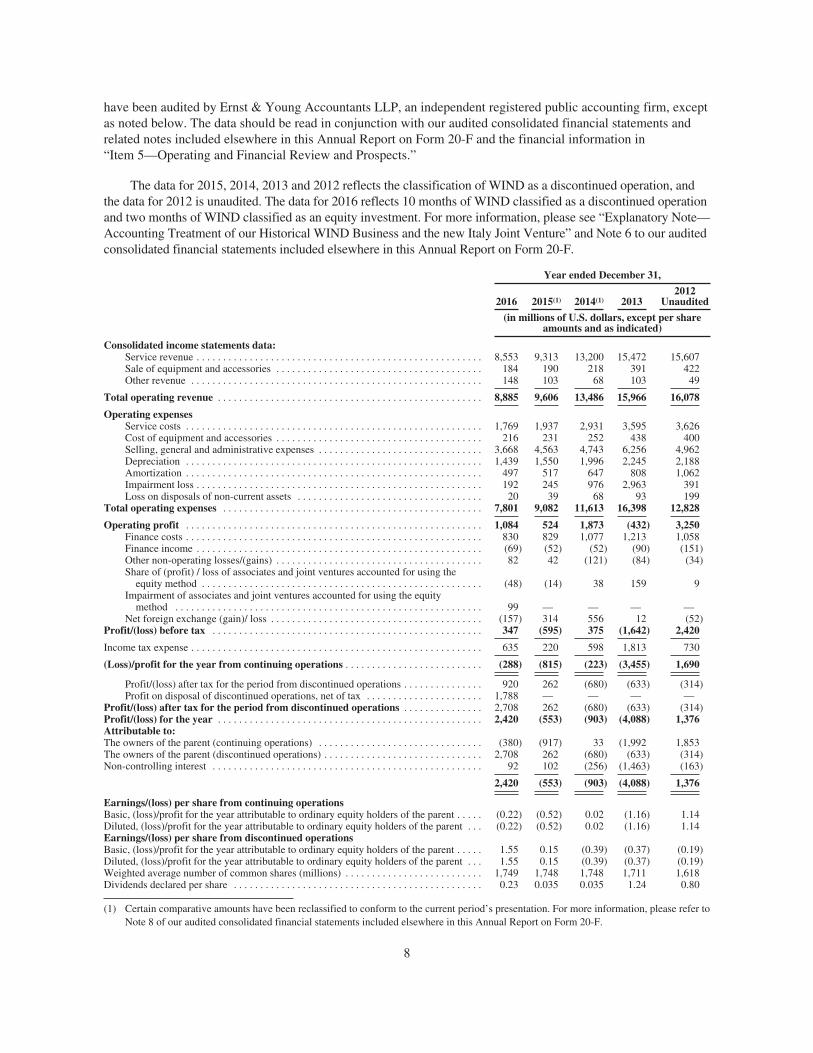
have been audited by Ernst & Young Accountants LLP, an independent registered public accounting firm, exceptas noted below. The data should be read in conjunction with our audited consolidated financial statements andrelated notes included elsewhere in this Annual Report on Form 20-F and the financial information in“Item 5—Operating and Financial Review and Prospects.”
The data for 2015, 2014, 2013 and 2012 reflects the classification of WIND as a discontinued operation, andthe data for 2012 is unaudited. The data for 2016 reflects 10 months of WIND classified as a discontinued operationand two months of WIND classified as an equity investment. For more information, please see “Explanatory Note—Accounting Treatment of our Historical WIND Business and the new Italy Joint Venture” and Note 6 to our auditedconsolidated financial statements included elsewhere in this Annual Report on Form 20-F.
Year ended December 31,
2016 2015(1) 2014(1) 20132012
Unaudited
(in millions of U.S. dollars, except per shareamounts and as indicated)
Consolidated income statements data:Service revenue . . . . . . . . . . . . . . . . . . . . . . . . . . . . . . . . . . . . . . . . . . . . . . . . . . . . . . 8,553 9,313 13,200 15,472 15,607Sale of equipment and accessories . . . . . . . . . . . . . . . . . . . . . . . . . . . . . . . . . . . . . . . 184 190 218 391 422Other revenue . . . . . . . . . . . . . . . . . . . . . . . . . . . . . . . . . . . . . . . . . . . . . . . . . . . . . . . 148 103 68 103 49
Total operating revenue . . . . . . . . . . . . . . . . . . . . . . . . . . . . . . . . . . . . . . . . . . . . . . . . . . 8,885 9,606 13,486 15,966 16,078
Operating expensesService costs . . . . . . . . . . . . . . . . . . . . . . . . . . . . . . . . . . . . . . . . . . . . . . . . . . . . . . . . 1,769 1,937 2,931 3,595 3,626Cost of equipment and accessories . . . . . . . . . . . . . . . . . . . . . . . . . . . . . . . . . . . . . . . 216 231 252 438 400Selling, general and administrative expenses . . . . . . . . . . . . . . . . . . . . . . . . . . . . . . . 3,668 4,563 4,743 6,256 4,962Depreciation . . . . . . . . . . . . . . . . . . . . . . . . . . . . . . . . . . . . . . . . . . . . . . . . . . . . . . . . 1,439 1,550 1,996 2,245 2,188Amortization . . . . . . . . . . . . . . . . . . . . . . . . . . . . . . . . . . . . . . . . . . . . . . . . . . . . . . . . 497 517 647 808 1,062Impairment loss . . . . . . . . . . . . . . . . . . . . . . . . . . . . . . . . . . . . . . . . . . . . . . . . . . . . . . 192 245 976 2,963 391Loss on disposals of non-current assets . . . . . . . . . . . . . . . . . . . . . . . . . . . . . . . . . . . 20 39 68 93 199
Total operating expenses . . . . . . . . . . . . . . . . . . . . . . . . . . . . . . . . . . . . . . . . . . . . . . . . . 7,801 9,082 11,613 16,398 12,828
Operating profit . . . . . . . . . . . . . . . . . . . . . . . . . . . . . . . . . . . . . . . . . . . . . . . . . . . . . . . . 1,084 524 1,873 (432) 3,250Finance costs . . . . . . . . . . . . . . . . . . . . . . . . . . . . . . . . . . . . . . . . . . . . . . . . . . . . . . . . 830 829 1,077 1,213 1,058Finance income . . . . . . . . . . . . . . . . . . . . . . . . . . . . . . . . . . . . . . . . . . . . . . . . . . . . . . (69) (52) (52) (90) (151)Other non-operating losses/(gains) . . . . . . . . . . . . . . . . . . . . . . . . . . . . . . . . . . . . . . . 82 42 (121) (84) (34)Share of (profit) / loss of associates and joint ventures accounted for using the
equity method . . . . . . . . . . . . . . . . . . . . . . . . . . . . . . . . . . . . . . . . . . . . . . . . . . . . . (48) (14) 38 159 9Impairment of associates and joint ventures accounted for using the equity
method . . . . . . . . . . . . . . . . . . . . . . . . . . . . . . . . . . . . . . . . . . . . . . . . . . . . . . . . . . 99 — — — —Net foreign exchange (gain)/ loss . . . . . . . . . . . . . . . . . . . . . . . . . . . . . . . . . . . . . . . . (157) 314 556 12 (52)
Profit/(loss) before tax . . . . . . . . . . . . . . . . . . . . . . . . . . . . . . . . . . . . . . . . . . . . . . . . . . . 347 (595) 375 (1,642) 2,420
Income tax expense . . . . . . . . . . . . . . . . . . . . . . . . . . . . . . . . . . . . . . . . . . . . . . . . . . . . . . . 635 220 598 1,813 730
(Loss)/profit for the year from continuing operations . . . . . . . . . . . . . . . . . . . . . . . . . . (288) (815) (223) (3,455) 1,690
Profit/(loss) after tax for the period from discontinued operations . . . . . . . . . . . . . . . 920 262 (680) (633) (314)Profit on disposal of discontinued operations, net of tax . . . . . . . . . . . . . . . . . . . . . . 1,788 — — — —
Profit/(loss) after tax for the period from discontinued operations . . . . . . . . . . . . . . . 2,708 262 (680) (633) (314)Profit/(loss) for the year . . . . . . . . . . . . . . . . . . . . . . . . . . . . . . . . . . . . . . . . . . . . . . . . . . 2,420 (553) (903) (4,088) 1,376Attributable to:The owners of the parent (continuing operations) . . . . . . . . . . . . . . . . . . . . . . . . . . . . . . . (380) (917) 33 (1,992 1,853The owners of the parent (discontinued operations) . . . . . . . . . . . . . . . . . . . . . . . . . . . . . . 2,708 262 (680) (633) (314)Non-controlling interest . . . . . . . . . . . . . . . . . . . . . . . . . . . . . . . . . . . . . . . . . . . . . . . . . . . 92 102 (256) (1,463) (163)
2,420 (553) (903) (4,088) 1,376
Earnings/(loss) per share from continuing operationsBasic, (loss)/profit for the year attributable to ordinary equity holders of the parent . . . . . (0.22) (0.52) 0.02 (1.16) 1.14Diluted, (loss)/profit for the year attributable to ordinary equity holders of the parent . . . (0.22) (0.52) 0.02 (1.16) 1.14Earnings/(loss) per share from discontinued operationsBasic, (loss)/profit for the year attributable to ordinary equity holders of the parent . . . . . 1.55 0.15 (0.39) (0.37) (0.19)Diluted, (loss)/profit for the year attributable to ordinary equity holders of the parent . . . 1.55 0.15 (0.39) (0.37) (0.19)Weighted average number of common shares (millions) . . . . . . . . . . . . . . . . . . . . . . . . . . 1,749 1,748 1,748 1,711 1,618Dividends declared per share . . . . . . . . . . . . . . . . . . . . . . . . . . . . . . . . . . . . . . . . . . . . . . . 0.23 0.035 0.035 1.24 0.80
(1) Certain comparative amounts have been reclassified to conform to the current period’s presentation. For more information, please refer toNote 8 of our audited consolidated financial statements included elsewhere in this Annual Report on Form 20-F.
8
As of December 31,
2016 2015 2014 2013(2)2012
Unaudited(2)
(in millions of U.S. dollars)
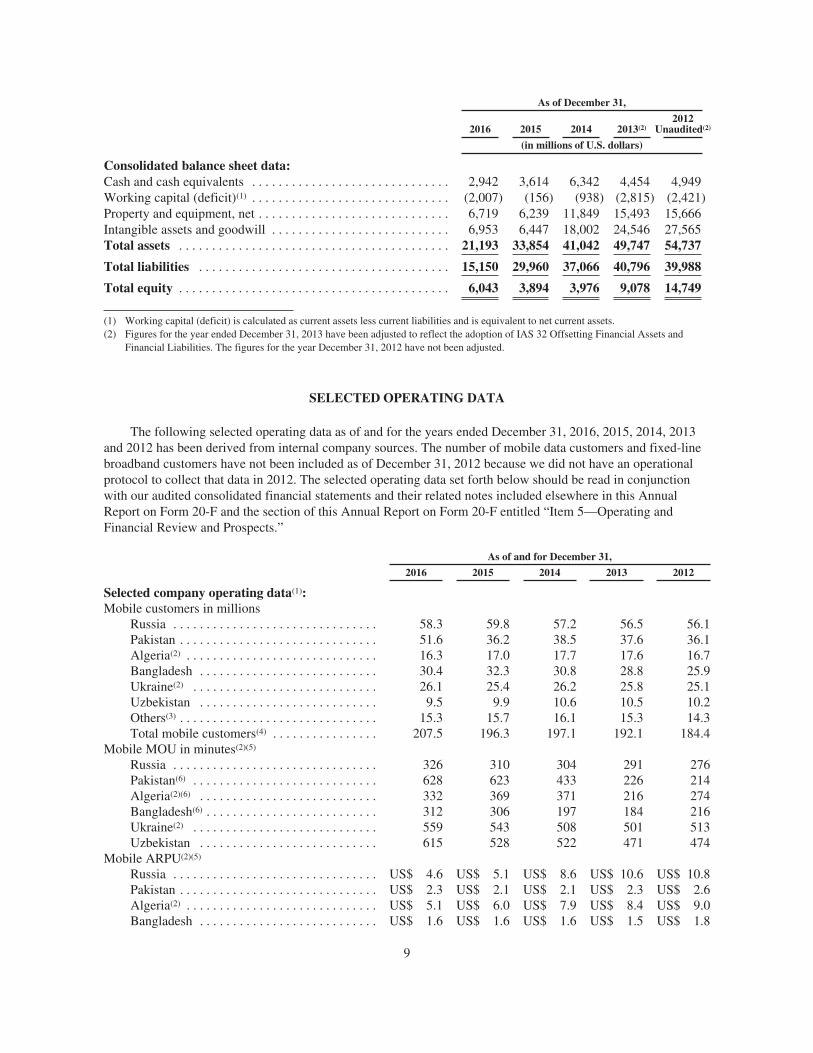
Consolidated balance sheet data:Cash and cash equivalents . . . . . . . . . . . . . . . . . . . . . . . . . . . . . . 2,942 3,614 6,342 4,454 4,949Working capital (deficit)(1) . . . . . . . . . . . . . . . . . . . . . . . . . . . . . . (2,007) (156) (938) (2,815) (2,421)Property and equipment, net . . . . . . . . . . . . . . . . . . . . . . . . . . . . . 6,719 6,239 11,849 15,493 15,666Intangible assets and goodwill . . . . . . . . . . . . . . . . . . . . . . . . . . . 6,953 6,447 18,002 24,546 27,565Total assets . . . . . . . . . . . . . . . . . . . . . . . . . . . . . . . . . . . . . . . . . 21,193 33,854 41,042 49,747 54,737
Total liabilities . . . . . . . . . . . . . . . . . . . . . . . . . . . . . . . . . . . . . . 15,150 29,960 37,066 40,796 39,988
Total equity . . . . . . . . . . . . . . . . . . . . . . . . . . . . . . . . . . . . . . . . . 6,043 3,894 3,976 9,078 14,749
(1) Working capital (deficit) is calculated as current assets less current liabilities and is equivalent to net current assets.(2) Figures for the year ended December 31, 2013 have been adjusted to reflect the adoption of IAS 32 Offsetting Financial Assets and
Financial Liabilities. The figures for the year December 31, 2012 have not been adjusted.
SELECTED OPERATING DATA
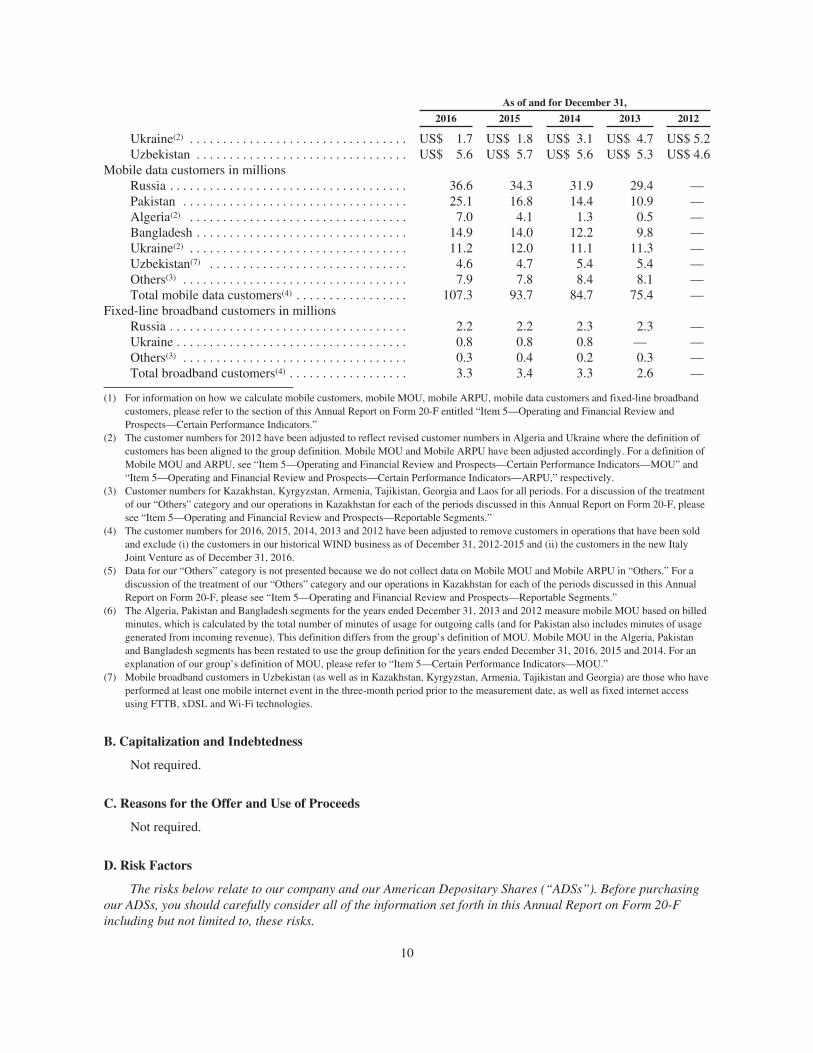
The following selected operating data as of and for the years ended December 31, 2016, 2015, 2014, 2013and 2012 has been derived from internal company sources. The number of mobile data customers and fixed-linebroadband customers have not been included as of December 31, 2012 because we did not have an operationalprotocol to collect that data in 2012. The selected operating data set forth below should be read in conjunctionwith our audited consolidated financial statements and their related notes included elsewhere in this AnnualReport on Form 20-F and the section of this Annual Report on Form 20-F entitled “Item 5—Operating andFinancial Review and Prospects.”
As of and for December 31,
2016 2015 2014 2013 2012
Selected company operating data(1):Mobile customers in millions
Russia . . . . . . . . . . . . . . . . . . . . . . . . . . . . . . . 58.3 59.8 57.2 56.5 56.1Pakistan . . . . . . . . . . . . . . . . . . . . . . . . . . . . . . 51.6 36.2 38.5 37.6 36.1Algeria(2) . . . . . . . . . . . . . . . . . . . . . . . . . . . . . 16.3 17.0 17.7 17.6 16.7Bangladesh . . . . . . . . . . . . . . . . . . . . . . . . . . . 30.4 32.3 30.8 28.8 25.9Ukraine(2) . . . . . . . . . . . . . . . . . . . . . . . . . . . . 26.1 25.4 26.2 25.8 25.1Uzbekistan . . . . . . . . . . . . . . . . . . . . . . . . . . . 9.5 9.9 10.6 10.5 10.2Others(3) . . . . . . . . . . . . . . . . . . . . . . . . . . . . . . 15.3 15.7 16.1 15.3 14.3Total mobile customers(4) . . . . . . . . . . . . . . . . 207.5 196.3 197.1 192.1 184.4
Mobile MOU in minutes(2)(5)
Russia . . . . . . . . . . . . . . . . . . . . . . . . . . . . . . . 326 310 304 291 276Pakistan(6) . . . . . . . . . . . . . . . . . . . . . . . . . . . . 628 623 433 226 214Algeria(2)(6) . . . . . . . . . . . . . . . . . . . . . . . . . . . 332 369 371 216 274Bangladesh(6) . . . . . . . . . . . . . . . . . . . . . . . . . . 312 306 197 184 216Ukraine(2) . . . . . . . . . . . . . . . . . . . . . . . . . . . . 559 543 508 501 513Uzbekistan . . . . . . . . . . . . . . . . . . . . . . . . . . . 615 528 522 471 474
Mobile ARPU(2)(5)
Russia . . . . . . . . . . . . . . . . . . . . . . . . . . . . . . . US$ 4.6 US$ 5.1 US$ 8.6 US$ 10.6 US$ 10.8Pakistan . . . . . . . . . . . . . . . . . . . . . . . . . . . . . . US$ 2.3 US$ 2.1 US$ 2.1 US$ 2.3 US$ 2.6Algeria(2) . . . . . . . . . . . . . . . . . . . . . . . . . . . . . US$ 5.1 US$ 6.0 US$ 7.9 US$ 8.4 US$ 9.0Bangladesh . . . . . . . . . . . . . . . . . . . . . . . . . . . US$ 1.6 US$ 1.6 US$ 1.6 US$ 1.5 US$ 1.8
9
As of and for December 31,
2016 2015 2014 2013 2012
Ukraine(2) . . . . . . . . . . . . . . . . . . . . . . . . . . . . . . . . . US$ 1.7 US$ 1.8 US$ 3.1 US$ 4.7 US$ 5.2Uzbekistan . . . . . . . . . . . . . . . . . . . . . . . . . . . . . . . . US$ 5.6 US$ 5.7 US$ 5.6 US$ 5.3 US$ 4.6
Mobile data customers in millionsRussia . . . . . . . . . . . . . . . . . . . . . . . . . . . . . . . . . . . . 36.6 34.3 31.9 29.4 —Pakistan . . . . . . . . . . . . . . . . . . . . . . . . . . . . . . . . . . 25.1 16.8 14.4 10.9 —Algeria(2) . . . . . . . . . . . . . . . . . . . . . . . . . . . . . . . . . 7.0 4.1 1.3 0.5 —Bangladesh . . . . . . . . . . . . . . . . . . . . . . . . . . . . . . . . 14.9 14.0 12.2 9.8 —Ukraine(2) . . . . . . . . . . . . . . . . . . . . . . . . . . . . . . . . . 11.2 12.0 11.1 11.3 —Uzbekistan(7) . . . . . . . . . . . . . . . . . . . . . . . . . . . . . . 4.6 4.7 5.4 5.4 —Others(3) . . . . . . . . . . . . . . . . . . . . . . . . . . . . . . . . . . 7.9 7.8 8.4 8.1 —Total mobile data customers(4) . . . . . . . . . . . . . . . . . 107.3 93.7 84.7 75.4 —
Fixed-line broadband customers in millionsRussia . . . . . . . . . . . . . . . . . . . . . . . . . . . . . . . . . . . . 2.2 2.2 2.3 2.3 —Ukraine . . . . . . . . . . . . . . . . . . . . . . . . . . . . . . . . . . . 0.8 0.8 0.8 — —Others(3) . . . . . . . . . . . . . . . . . . . . . . . . . . . . . . . . . . 0.3 0.4 0.2 0.3 —Total broadband customers(4) . . . . . . . . . . . . . . . . . . 3.3 3.4 3.3 2.6 —
(1) For information on how we calculate mobile customers, mobile MOU, mobile ARPU, mobile data customers and fixed-line broadbandcustomers, please refer to the section of this Annual Report on Form 20-F entitled “Item 5—Operating and Financial Review andProspects—Certain Performance Indicators.”
(2) The customer numbers for 2012 have been adjusted to reflect revised customer numbers in Algeria and Ukraine where the definition ofcustomers has been aligned to the group definition. Mobile MOU and Mobile ARPU have been adjusted accordingly. For a definition ofMobile MOU and ARPU, see “Item 5—Operating and Financial Review and Prospects—Certain Performance Indicators—MOU” and“Item 5—Operating and Financial Review and Prospects—Certain Performance Indicators—ARPU,” respectively.
(3) Customer numbers for Kazakhstan, Kyrgyzstan, Armenia, Tajikistan, Georgia and Laos for all periods. For a discussion of the treatmentof our “Others” category and our operations in Kazakhstan for each of the periods discussed in this Annual Report on Form 20-F, pleasesee “Item 5—Operating and Financial Review and Prospects—Reportable Segments.”
(4) The customer numbers for 2016, 2015, 2014, 2013 and 2012 have been adjusted to remove customers in operations that have been soldand exclude (i) the customers in our historical WIND business as of December 31, 2012-2015 and (ii) the customers in the new ItalyJoint Venture as of December 31, 2016.
(5) Data for our “Others” category is not presented because we do not collect data on Mobile MOU and Mobile ARPU in “Others.” For adiscussion of the treatment of our “Others” category and our operations in Kazakhstan for each of the periods discussed in this AnnualReport on Form 20-F, please see “Item 5—Operating and Financial Review and Prospects—Reportable Segments.”
(6) The Algeria, Pakistan and Bangladesh segments for the years ended December 31, 2013 and 2012 measure mobile MOU based on billedminutes, which is calculated by the total number of minutes of usage for outgoing calls (and for Pakistan also includes minutes of usagegenerated from incoming revenue). This definition differs from the group’s definition of MOU. Mobile MOU in the Algeria, Pakistanand Bangladesh segments has been restated to use the group definition for the years ended December 31, 2016, 2015 and 2014. For anexplanation of our group’s definition of MOU, please refer to “Item 5—Certain Performance Indicators—MOU.”
(7) Mobile broadband customers in Uzbekistan (as well as in Kazakhstan, Kyrgyzstan, Armenia, Tajikistan and Georgia) are those who haveperformed at least one mobile internet event in the three-month period prior to the measurement date, as well as fixed internet accessusing FTTB, xDSL and Wi-Fi technologies.
B. Capitalization and Indebtedness
Not required.
C. Reasons for the Offer and Use of Proceeds
Not required.
D. Risk Factors
The risks below relate to our company and our American Depositary Shares (“ADSs”). Before purchasingour ADSs, you should carefully consider all of the information set forth in this Annual Report on Form 20-Fincluding but not limited to, these risks.
10
In addition to those risk factors, there may be additional risks and uncertainties of which management is notaware or focused on or that management deems immaterial. Our business, financial condition or results ofoperations or prospects could be materially adversely affected by any of these risks. The trading price of oursecurities could decline due to any of these risks, and you may lose all or part of your investment.
Risks Related to Our Business
Substantial amounts of indebtedness and debt service obligations could materially decrease our cash flow,adversely affect our business and financial condition and prevent us from raising additional capital.
We have substantial amounts of indebtedness and debt service obligations. As of December 31, 2016, theoutstanding principal amount of our external debt for bonds, bank loans, equipment financing, and loans fromothers amounted to approximately US$10.5 billion. For more information regarding our outstandingindebtedness, see “Item 5—Operating and Financial Review and Prospects—Liquidity and Capital Resources—Financing Activities.”
Agreements under which we borrow funds contain obligations, which include covenants that impose on uscertain operating and financial restrictions. Some of these covenants relate to our financial performance orfinancial condition, such as levels or ratios of earnings, debt and assets and may have the effect of preventing usor our subsidiaries from incurring additional debt. Failure to meet these obligations may result in a default, whichcould increase the cost of securing additional capital and lead to the acceleration of our loans and the loss ofassets that secure the defaulted debts, where they are secured, or to which our creditors otherwise have recourse.Such a default and acceleration of the obligations under one or more of these agreements (including as a result ofcross-default or cross-acceleration) could have a material adverse effect on our business, financial condition,results of operations or prospects, and in particular on our liquidity and our shareholders’ equity. In addition,covenants in our debt agreements could impair our liquidity and our ability to expand or finance our futureoperations. For a discussion of agreements under which we borrow funds, see “Item 5—Operating and FinancialReview and Prospects—Liquidity and Capital Resources—Financing Activities” and Note 18 to our auditedconsolidated financial statements included elsewhere in this Annual Report on Form 20-F. Please also see “—Adisposition by one or both of our largest shareholders of their respective stakes in VEON Ltd. or a change incontrol of VEON Ltd. could harm our business” for information regarding change of control provisions in someof our debt agreements.
Aside from the risk of default, given our substantial amounts of indebtedness and limits imposed by our debtobligations, our business could suffer significant negative consequences such as the need to dedicate a substantialportion of our cash flow from operations to payments on our debt, thereby reducing funds available for payingdividends, working capital, capital expenditures, acquisitions, joint ventures and other purposes necessary for usto maintain our competitive position and to maintain flexibility and resiliency in the face of general adverseeconomic and industry conditions.
We may not be able to successfully implement our strategic priorities.
We are rapidly transforming with the aim to reinvent the business across all geographies and operations.This transformation involves re-engineering fundamentals, working to revitalize the business and implementing anew digital model. However, there can be no assurance that our strategy will be successfully implemented andwill not cause changes in our operational efficiencies or structure. In addition, although we are working toimprove revenue trends in our Algeria segment, there can be no assurance that the current trend of decreasingrevenue in Algeria will be reversed.
A failure to obtain the anticipated benefits of our performance transformation program including revenuetargets; cost optimization or a delay in the implementation of our transformation programs could significantlyaffect our business, financial condition, results of operations, cash flows or prospects.
11
In addition, the implementation of our strategic priorities could result in increased costs, conflicts withstakeholders, business interruptions and difficulty in recruiting and retaining key personnel, which could harmour business, financial condition, results of operations, cash flows or prospects.
We may not be able to raise additional capital.
We may need to raise additional capital in the future, including through debt financing. If we incuradditional indebtedness, the risks that we now face related to our indebtedness and debt service obligations couldincrease. Specifically, we may not be able to generate enough cash to pay the principal, interest and otheramounts due under our indebtedness. In addition, we may not be able to borrow money within the local orinternational capital markets on acceptable terms, or at all. The sanctions imposed by the United States, theEuropean Union, and other countries in connection with developments in Russia and Ukraine, and additionalsanctions which may be imposed in the future, may also negatively affect our ability to raise external financing,particularly if the sanctions are broadened. For a discussion of the sanctions imposed against Ukraine and Russia,see “Exhibit 99.2—Regulation of Telecommunications.” Our ability to raise additional capital may also berestricted by covenants in our financing agreements or affected by any downgrade of our credit ratings, includingfor reasons outside our control, which may materially harm our business, financial condition, results ofoperations and prospects. If we are unable to raise additional capital, we may be unable to make necessary ordesired capital expenditures, to take advantage of investment opportunities, to refinance existing indebtedness orto meet unexpected financial requirements, and our growth strategy and liquidity may be negatively affected.This could cause us to be unable to repay indebtedness as it comes due, to delay or abandon anticipatedexpenditures and investments or otherwise limit operations, which could materially harm our business, financialcondition, results of operations or prospects.
We are exposed to foreign currency exchange loss and currency fluctuation and translation risks.
A significant amount of our costs, expenditures and liabilities are denominated in U.S. dollars and euros,including capital expenditures and borrowings, while a significant amount of our revenue is denominated incurrencies other than the U.S. dollar and the euro. Thus, declining values of local currencies against the U.S.dollar or the euro could make it more difficult for us to repay or refinance our U.S. dollar denominated debt and/or euro denominated purchase equipment and services. The values of the Russian, Algerian, Ukrainian andKazakh currencies, for example, have declined significantly in response to political and economic issues sinceDecember 31, 2013, and may continue to decline. Currency fluctuations and volatility may impact our results ofoperations and result in foreign currency transaction and translation losses in the future. For example, in 2016,total operating revenues in functional currency terms were relatively stable compared to 2015, but in U.S. dollarterms, total operating revenues decreased by 8%. For more information about foreign currency translation andour results of operations, see the sections entitled “Item 5—Operating and Financial Review and Prospects—Results of Operations,” “Item 5—Operating and Financial Review and Prospects—Certain Ongoing FactorsAffecting Our Financial Position and Results of Operations—Foreign Currency Translation,” “Item 11—Quantitative and Qualitative Disclosures About Market Risk” and Notes 5 and 18 to our audited consolidatedfinancial statements included elsewhere in this Annual Report on Form 20-F.
The countries in which we operate have experienced periods of high levels of inflation, including certaincases of hyperinflation. Our profit margins could be harmed if we are unable to sufficiently increase our prices tooffset any significant future increase in the inflation rate, which may be difficult with our mass market customersand our price sensitive customer base. Inflationary pressure in the countries where we have operations couldmaterially harm our business, financial condition, results of operations, cash flows or prospects. “Item 5—Operating and Financial Review and Prospects—Certain Ongoing Factors Affecting Our Financial Position andResults of Operations—Inflation.”
Changes in exchange rates could also impact our ability to comply with covenants under our debtagreements. Exchange rate risks could harm our business, financial condition, results of operations or prospects.We cannot ensure that our existing or future hedging strategies will sufficiently hedge against these risks.
12
As a holding company, VEON Ltd. depends on the ability of its subsidiaries to pay dividends and thereforeon the performance of its subsidiaries, and is affected by changes in exchange controls and currencyrestrictions in the countries in which its subsidiaries operate.
VEON Ltd. is a holding company and does not conduct any revenue-generating business operations of itsown. Its principal assets are the direct and indirect equity interests it owns in its operating subsidiaries. It isdependent upon cash dividends, distributions, loans or other transfers it receives from its subsidiaries to makedividend payments to its shareholders (including holders of ADSs), to repay debts, and to meet its otherobligations. The ability of VEON Ltd.’s subsidiaries to pay dividends and make payments or loans to VEON Ltd.depends on the success of their businesses and is not guaranteed. Although VEON Ltd. has a global strategy setby leadership, management at each operation is responsible for executing many aspects of that strategy, and it isnot certain local management will be able to execute that strategy effectively.
VEON Ltd.’s subsidiaries are separate and distinct legal entities. Any right that VEON Ltd. has to receiveany assets of or distributions from any subsidiary upon its bankruptcy, dissolution, liquidation or reorganization,or to realize proceeds from the sale of the assets of any subsidiary, will be junior to the claims of that subsidiary’screditors, including trade creditors.
The ability of VEON Ltd.’s subsidiaries to pay dividends and make payments or loans to VEON Ltd., and toguarantee VEON Ltd.’s debt, will depend on their operating results and may be restricted by applicablecovenants in debt agreements and corporate, tax and other laws and regulations. These covenants, laws andregulations include restrictions on dividends, limitations on repatriation of earnings, limitations on the making ofloans and repayment of debts, monetary transfer restrictions and foreign currency exchange restrictions in certainagreements and/or certain jurisdictions in which VEON Ltd.’s subsidiaries operate. For further details on therestrictions on dividend payments, see “Item 5—Operating and Financial Review and Prospects—CertainOngoing Factors Affecting Our Financial Position and Results of Operations—Foreign Currency Controls andCurrency Restrictions” and “—Risks Related to Our Markets—The banking systems in many countries in whichwe operate remain underdeveloped, there are a limited number of creditworthy banks in these countries withwhich we can conduct business and currency control requirements restrict activities in certain markets in whichwe have operations.” Furthermore, our ability to withdraw funds and dividends from our subsidiaries andoperating companies may depend on the consent of our strategic partners where applicable. See “—Our strategicpartnerships and relationships carry inherent business risks.”
We have incurred and are continuing to incur costs and related management oversight obligations inconnection with our obligations under the DPA, the SEC Judgment and the Dutch Settlement Agreement,which may be significant.
VEON Ltd. is subject to a DPA with the DOJ, the SEC Judgment and the Dutch Settlement Agreement withthe OM. See “Item 8—Financial Information—A. Consolidated Statements and Other Financial Information—A.7. Legal Proceedings” and Notes 25 and 27 to our audited consolidated financial statements included elsewherein this Annual Report on Form 20-F. In conjunction with the DPA and pursuant to the SEC Judgment, VEONLtd. is required to retain, at our own expense, an independent compliance monitor. The independent compliancemonitor has been appointed. Pursuant to the DPA and the SEC Judgment, the monitorship will continue for aperiod of three years from 2016, and the term of the monitorship may be terminated early or extended dependingon certain circumstances, as ultimately determined and approved by the DOJ and the SEC. The monitor willassess and monitor our compliance with the terms of the DPA and the SEC Judgment by evaluating factors suchas our corporate compliance program, internal accounting controls, recordkeeping and financial reportingpolicies and procedures. The monitor may recommend changes to our policies, procedures, and internalaccounting controls that we must adopt unless they are unduly burdensome or otherwise inadvisable, in whichcase we may propose alternatives, which the DOJ and the SEC may or may not accept. In addition, VEON Ltd.incurred fines and disgorgement payable to the U.S. and Dutch authorities in connection with the entry into theDPA, the SEC Judgment and the Dutch Settlement Agreement. VEON Ltd. has incurred significant costs in
13
connection with the disposition of these investigations and agreements, including retention of legal counsel andother vendors/advisors and other costs related to the investigations undertaken in connection with these matters.VEON Ltd. currently cannot estimate the additional costs that it is likely to incur in connection with compliancewith the DPA, the SEC Judgment and the Dutch Settlement Agreement, including the ongoing obligationsrelating to the monitorship, its obligations to cooperate with the agencies regarding their investigations of otherparties, the monitorship, and the costs of implementing the changes, if any, to its internal controls, policies andprocedures required by the monitor. However, such costs could be significant.
Under the DPA and pursuant to the SEC Judgment, VEON Ltd. has obligations to implement, and continueto implement, a compliance and ethics program designed to prevent and detect violations of the U.S. ForeignCorrupt Practices Act (the “FCPA”) and other applicable anti-corruption laws throughout its operations. Further,VEON Ltd. must continue to undertake a review of its existing internal accounting controls, policies, andprocedures regarding compliance with the FCPA and other applicable anti-corruption laws. The implementationof these programs and the review of our internal accounting controls, policies, and procedures regardingcompliance with the FCPA and other applicable anti-corruption laws is ongoing and may take significantmanagement time and resources.
We could be subject to criminal prosecution or civil sanction if we breach the DPA with the DOJ, the SECJudgment or the Dutch Settlement Agreement, and we may face other potentially negative consequencesrelating to the investigations by, and agreements with, the DOJ, SEC and OM, including additionalinvestigations and litigation.
Failure to comply with the terms of the DPA, whether such failure relates to alleged improper payments,internal controls failures, or other non-compliance, could result in criminal prosecution by the DOJ, including(but not limited to) for the charged conspiracy to violate the anti-bribery and the books and records provisions ofthe FCPA and violation of the internal controls provisions of the FCPA that were included in the information thatwas filed in connection with the DPA. Under such circumstance, the DOJ would be permitted to rely upon theadmissions we made in the DPA and would benefit from our waiver of certain procedural and evidentiarydefenses.
Pursuant to the SEC Judgment, VEON Ltd. is permanently enjoined from committing or aiding and abettingany future violations of the anti-fraud, corrupt payments, books and records, reporting and internal controlprovisions of the federal securities laws and related SEC rules. Failure to comply with this injunction could resultin the imposition of civil or criminal penalties, a new SEC enforcement action or both.
Any criminal prosecution by the DOJ as a result of a breach of the DPA or civil or criminal penaltiesimposed as a result of noncompliance with the SEC Judgment could subject us to penalties and other costs andcould have a material adverse effect on our business, financial condition, results of operations, cash flows orprospects.
We may also face other potentially negative consequences relating to the investigations by, and agreementswith, the DOJ, SEC and OM. None of the DPA, the SEC Judgment or the Dutch Settlement Agreement preventsthese authorities from carrying out certain additional investigations with respect to the facts not covered in theagreements or in other jurisdictions, or prevents authorities in other jurisdictions from carrying out investigationsinto, or taking actions with respect to the issuance or renewal of our licenses or otherwise in relation to, these orother matters. Furthermore, the Norwegian Government has held parliamentary hearings concerning theinvestigations in the past and may schedule further hearings. Similarly, the agreements do not foreclose potentialthird party or additional shareholder litigation related to these matters. For example, a consolidated class actionlawsuit has been filed in a U.S. district court against VEON in relation to our prior disclosure regarding ouroperations in Uzbekistan, and relies upon the investigations by the DOJ, SEC and OM. We may incur significantcosts in connection with this or future lawsuits. Any collateral investigations, litigation or other government orthird party actions resulting from these, or other, matters could have a material adverse effect on our business,financial condition, results of operations, cash flows or prospects.
14
In addition, any ongoing media and governmental interest in the prior investigations, the agreements andlawsuits, and any announced investigations and/or arrests of our former executive officers could impact theperception of us and result in reputational harm to our company.
Efforts to merge with or acquire other companies or product lines, or to otherwise form strategicpartnerships with third parties, may divert management attention and resources away from our businessoperations, and if we complete a merger, an acquisition or other strategic partnership, we may incur orassume additional liabilities or experience integration problems.
We seek from time to time to merge with or acquire other companies or product lines, or to form strategicpartnerships through the formation of joint ventures or otherwise, for various strategic reasons, including toacquire more frequency spectrum, new technologies and service capabilities; add new customers; increase marketpenetration or expand into new markets. In particular, on November 5, 2016, we completed a transaction to forma joint venture holding company with Hutchison, through which we jointly own and operate our historical WINDand Hutchison’s historical 3 Italia telecommunications businesses in Italy (see “Item 5—Operating and FinancialReview and Prospects—Key Developments and Trends—Italy Joint Venture”); and on July 1, 2016 wecompleted a transaction with WTPL and Bank Alfalah, which resulted in the merger of our telecommunicationsbusinesses in Pakistan (see “Item 5—Operating and Financial Review and Prospects—Key Developments andTrends—Pakistan Merger”). Our ability to successfully grow through acquisitions or strategic partnershipsdepends upon our ability to identify, negotiate, complete and integrate suitable companies and to obtain anynecessary financing and the prior approval of any relevant regulatory bodies or courts. These efforts could divertthe attention of our management and key personnel from our business operations. As a result of any such merger,acquisition or strategic partnerships or failure of any anticipated merger, acquisition or strategic partnership tomaterialize (including any such failure caused by regulatory or third-party challenges), we may also experience:
• difficulties in realizing expected synergies or integrating acquired companies, joint ventures or otherforms of strategic partnerships, personnel, products, property and technologies into our existingbusiness;
• increased capital expenditure costs;
• difficulties relating to the acquired or formed companies’ compliance with telecommunicationslicenses and permissions, compliance with laws, regulations and contractual obligations, ability toobtain and maintain favorable interconnect terms, frequencies and numbering capacity and ability toprotect our intellectual property;
• delays, or failure, in realizing the synergy benefits or costs of a merged or acquired or formed companyor products;
• higher costs of integration than we anticipated;
• difficulties in retaining key employees of the merged or acquired business or strategic partnerships whoare necessary to manage our businesses;
• difficulties in maintaining uniform standards, controls, procedures and policies throughout ourbusinesses;
• risks that different geographic regions present, such as currency exchange risks, developments incompetition and regulatory, political, economic and social developments;
• adverse customer reaction to the business combination; and
• increased liability and exposure to contingencies that we did not contemplate at the time of theacquisition or strategic partnership.
In addition, an acquisition or strategic partnership could materially impair our operating results by causingus to incur debt or requiring us to amortize merger or acquisition expenses and merged or acquired assets. We
15
may not be able to assess ongoing profitability and identify all actual or potential liabilities or issues of abusiness prior to an acquisition, merger or strategic partnership. If we acquire, merge with or form strategicpartnerships with businesses or assets, which result in assuming unforeseen liabilities in respect of which wehave not obtained contractual protections or for which protection is not available, this could harm our business,financial condition, results of operations, cash flows or prospects. As we investigate industry consolidation, ourrisks may increase. Our integration and consolidation of such businesses may also lead to changes in ouroperational efficiencies or structure. For information about our acquisitions, please see Note 6 to our auditedconsolidated financial statements included elsewhere in this Annual Report on Form 20-F.
Further, we may not be able to divest some of our activities as planned, such as any potential towers sales(which could cause costs to be materially higher than anticipated), and the divestitures we carry out couldnegatively impact our business.
Integration of the Warid and Mobilink (now Jazz) brands is subject to significant uncertainties and risks.
Although the Pakistan Merger is now complete, there can be no assurance that we will not experiencedifficulties in integrating the operations of Warid and Mobilink brands (now jointly operating under the Jazzbrand), that we will realize expected synergies, that the integration process will not negatively affect ourcustomer base, revenue or market share or that we will not incur higher than expected costs. In addition, theintegration of the businesses in Pakistan will require substantial time and focus from management, which couldadversely affect their ability to operate the businesses.
The Italy Joint Venture is subject to integration and performance risks.
A portion of our operations is conducted through the Italy Joint Venture. Although the transaction closed onNovember 5, 2016, the Italy Joint Venture may be subject to integration risks, which may affect its business orresults of operations. In addition, a failure by the Italy Joint Venture to perform as anticipated or realize itsbusiness plans, could, in turn, have a material adverse effect on our financial condition and results of operations.
On March 22, 2017, the Italian telecommunications regulator AGCOM issued a notice to the Italy JointVenture in relation to compliance with the EU Regulation 2015/2120 (the “open internet access regulation”),which regulates, among other things, traffic management practices in the EU, including Italy. The Italy JointVenture has until April 15, 2017 to inform AGCOM of the measures it has taken, if any, to ensure compliance.The Italy Joint Venture believes that this notice will not have a material impact on its digital offering.
Our strategic partnerships and relationships carry inherent business risks.
We participate in strategic partnerships and joint ventures in a number of countries, including Russia(Euroset), Kazakhstan (KaR-Tel LLP and TNS-Plus LLP), Algeria (OTA), Uzbekistan (Buzton JV), Kyrgyzstan(Sky Mobile LLC, Terra LLC), Georgia (Mobitel LLC), Tajikistan (Tacom LLC) and Laos (VimpelCom LaoCo., Ltd). We also own 50% of the Italy Joint Venture. In addition, in Algeria and Laos, our local partners areeither government institutions or directly related to the local government, which could increase our exposure tothe risks described in “—Risks Related to Our Markets.”
We do not always have a controlling stake in our affiliated companies and even when we do, our actionswith respect to these affiliated companies may be restricted to some degree by shareholders’ agreements enteredinto with our strategic partners. If disagreements develop with our partners, our business, financial condition,results of operations, cash flows or prospects may be harmed. Our ability to withdraw funds and dividends fromthese entities may depend on the consent of partners. Agreements with some of these partners include change ofcontrol provisions, put and call options and similar provisions, which could give other participants in theseinvestments the ability to purchase our interests, compel us to purchase their interests or enact other penalties. Ifone of our strategic partners becomes subject to investigation, sanctions or liability, VEON might be adverselyaffected. Furthermore, strategic partnerships in emerging markets are accompanied by risks inherent to thosemarkets, such as an increased possibility of a partner defaulting on obligations, or losing a partner with importantinsights in that region.
16
A disposition by one or both of our largest shareholders of their respective stakes in VEON Ltd. or achange in control of VEON Ltd. could harm our business.
We derive benefits and resources from the participation of L1T VIP Holdings S.à r.l. (“LetterOne”) andTelenor East Holding II AS (“Telenor East”), in our company such as industry expertise, management oversightand business acumen. In September 2016, Telenor East partially divested its stake in VEON Ltd. pursuant to anunderwritten offering and simultaneously issued a bond, which is exchangeable under certain conditions forVEON Ltd.’s ADSs. Further, it announced its intention to divest the remainder of its stake in VEON Ltd. Thecompletion of the divestiture of Telenor East’s remaining stake is subject to uncertainties with respect to timingand demand for an offering. If LetterOne or Telenor East were to dispose of their stake in VEON Ltd., we wouldbe deprived of those benefits, which could harm our business, financial condition, results of operations, cashflows or prospects. See “Item 5—Operating and Financial Review and Prospects—Key Developments andTrends—Telenor Share Sale and Exchangeable Bond Issuance.”
Some of our financing agreements (representing approximately US$1.4 billion in outstanding indebtednessas of December 31, 2016) have “change of control” provisions that may require us to make a prepayment if aperson or group of persons (with limited exclusions) acquire beneficial or legal ownership of or control overmore than 50.0% of our share capital. If such a change of control provision is triggered and we fail to agree withlenders on the necessary amendments to the loan documentation and then fail to make any required prepayment,it could trigger cross-default or cross-acceleration provisions of our other debt agreements, which could lead toour obligations being declared immediately due and payable. This could harm our business, financial condition,results of operations, cash flows or prospects.
Our strategic shareholders may pursue diverse development strategies, and this may hinder our ability toexpand and/or compete in such regions.
As of March 15, 2017, VEON Ltd.’s largest shareholders, LetterOne and Telenor East, and their respectiveaffiliates, beneficially owned, in the aggregate, approximately 71.6% of our issued and outstanding shares, withLetterOne beneficially owning approximately 47.9% of our issued and outstanding shares and Telenor Eastbeneficially owning approximately 23.7% of our issued and outstanding shares. As a result, these shareholders, ifacting together, have the ability to determine the outcome of matters submitted to our shareholders for approval.These two shareholders have sufficient voting rights to jointly elect a majority of our supervisory board, andcould, alternatively, enter into a shareholders’ or similar agreement impacting the composition of our supervisoryboard. A new supervisory board could take corporate actions or block corporate decisions by VEON Ltd. withrespect to capital structure, financings, dispositions, acquisitions and commercial transactions that might not bein the best interest of the minority shareholders or other security holders. For more information on our largestshareholders, see “Item 7—Major Shareholders and Related Party Transactions—A. Major Shareholders.”
At various times from 2005-2012, our strategic shareholders have had different strategies from us and fromone another and have engaged in litigation against one another and our company with respect to disagreementsover strategy. In addition, in Pakistan and Bangladesh, our subsidiaries directly compete with subsidiaries ofTelenor ASA (“Telenor”). See “Item 5—Operating and Financial Review and Prospects—Key Developmentsand Trends—Pakistan Merger.” We understand that LetterOne has an indirect minority interest in companies thatcompete with our subsidiaries in Ukraine, Kazakhstan and Georgia. It is possible that we will compete withTelenor and/or LetterOne in other markets in the future.
We cannot assure you that our relationship with LetterOne and Telenor or LetterOne’s and Telenor’srelationship with one another will not deteriorate as a result of differing or competing business strategies, whichcould harm our business, financial condition, results of operations, cash flows or prospects.
17
Litigation and disputes among our two largest shareholders and us could materially affect our business.
In the past, our two largest shareholders, LetterOne and Telenor East, have been involved in disputes andlitigation regarding our group companies, against one another and VEON Ltd. Further disputes among our twolargest shareholders and us could harm our business, financial condition, results of operations, cash flows orprospects. For more information on our two largest shareholders, see “Item 7—Major Shareholders and RelatedParty Transactions—A. Major Shareholders” below.
We may not be able to detect and prevent fraud, other misconduct or unethical actions by our employees,joint venture partners, representatives, agents, suppliers, customers or other third parties.
We may be exposed to fraud or other misconduct committed by our employees, joint venture partners,representatives, agents, suppliers, customers or other third parties that could subject us to litigation, financiallosses and sanctions imposed by governmental authorities, as well as affect our reputation. Such misconductcould include misappropriating funds, conducting transactions that are outside of authorized limits, engaging inmisrepresentation or fraudulent, deceptive or otherwise improper activities, including in return for any type ofbenefits or gains or otherwise not complying with applicable laws or our internal policies and procedures. Therisk of liability for fraud and other misconduct could increase as we expand certain areas of our business, such asMFS, which requires us to hold customer funds in e-accounts. For a description of the key trends with respect toour business, see “Item 5—Operating and Financial Review and Prospects—Key Developments and Trends.”
We regularly review and update our policies and procedures and internal controls which are primarilydesigned to provide reasonable assurance that we, our employees, representatives, agents, suppliers and otherthird parties comply with applicable law and our internal policies. Further, we conduct, as appropriate,assessments of, and due diligence on, our employees, representatives, agents, suppliers, customers and other thirdparties. However, there can be no assurance that such policies, procedures, internal controls and diligence willwork effectively at all times or protect us against liability for actions of our employees, representatives, agents,suppliers, customers or other third parties.
Further, our brand may be adversely impacted from any association, action or inaction which is perceivedby stakeholders or customers to be inappropriate or unethical and not in keeping with the group’s stated purposeand values. This reputation risk may arise in many different ways, including:
• failure to act in good faith and in accordance with the group’s values and code of conduct;
• failure (real or perceived) to comply with the law or regulation, or association (real or implied) withillegal activity;
• failures in corporate governance, management or technical systems;
• failure to comply with internal standards and policies;
• association with controversial sectors or clients;
• association with controversial transactions, projects, countries or governments;
• association with controversial business decisions, including but not restricted to, decisions relating to:products (in particular new products), delivery channels, promotions/advertising, acquisitions, branchrepresentation, sourcing/supply chain relationships, staff locations, treatment of financial transactions;and
• association with poor employment practices.
18
Our MFS and digital financial services (“DFS”) offerings are complex and increase our exposure to fraud,money laundering and reputational risk.
The provision of MFS and DFS, included as part of our new VEON personal internet platform, is complexand involves regulatory and compliance requirements. It may involve cash handling, exposing us to risk of fraudand money laundering and potential reputational damage if these were to occur. Any violation of anti-moneylaundering laws or regulations on our MFS or DFS networks could have a material adverse effect on ourfinancial condition and results of operation.
In addition, MFS and DFS each requires us to process sensitive personal consumer data (including, incertain instances, consumer names, addresses, credit and debit card numbers and bank account details) as part ofour business, and therefore we must comply with strict data protection and privacy laws. For risks associatedwith possible unauthorized disclosure of such personal data, please see “—Our brand, business, financialcondition, results of operations and prospects may be harmed in the event of cyber-attacks or severe systems andnetwork failures, or the perception of such attacks or failures, leading to the loss of integrity and availability ofour telecommunications, digital and financial services and/or leaks of confidential information, includingcustomer information.”
Our MFS and DFS business requires us to maintain a certain level of systems availability, and failure tomaintain agreed levels of service availability or to reliably process our customers’ transactions due toperformance issues, system interruptions or other failures could result in a loss of revenues, payment ofcontractual or consequential damages, reputational harm, additional operating expenses in order to remediate anyfailures, and exposure to other losses and liabilities.
We may be adversely impacted by work stoppages and other labor matters.
Although we consider our relations with our employees to be generally good, there can be no assurance thatour operations will not be impacted by unionization efforts, strikes or other types of labor disputes or disruptions.For instance, the implementation of internal operational and team adjustments necessary to implement ourperformance transformation program could result in employee dissatisfaction. For example, in February 2016,Banglalink Digital Communications Limited (“BDCL”) experienced labor disruptions in connection with theimplementation of our announced performance transformation program. We may also experience strikes or otherlabor disputes or disruptions in connection with social unrest or political events. For a discussion of ouremployees represented by unions or collective bargaining agreements, please see “Item 6—D. Employees.”Furthermore, work stoppages or slow-downs experienced by our customers or suppliers could result in lowerdemand for our services and products. In the event that we, or one or more of our customers or suppliers,experience a labor dispute or disruption, it could result in increased costs, negative media attention and politicalcontroversy, and harm our business, financial condition, results of operations, cash flows or prospects.
Our majority stake in an Egyptian public company may expose us to legal and political risk andreputational harm.
Our subsidiary in Egypt, Global Telecom Holding (“GTH”), is a public company listed on the EgyptianStock Exchange and is therefore subject to corresponding laws and regulations, including laws and regulationsfor the protection of minority shareholder rights. In February 2017, GTH completed a share buy-back for 10% ofthe total issued share capital of GTH, and on March 20, 2017, cancelled its global depositary receipt listing onthe Main Market for Listed Securities of the London Stock Exchange. Upon ratification by the EgyptianFinancial Supervisory Authority of the board minutes for the cancellation of the GDR program, our shareholdingin GTH will increase to 57.7% from 51.9%. See “Item 5—Operating and Financial Review and Prospects—KeyDevelopments and Trends—GTH Share Buy-Back and Cancellation of GDR Program.” GTH is the holdingcompany for a number of our assets in Africa and Asia, including Algeria, Bangladesh and Pakistan. GTH isexposed to the risk of unpredictable and adverse government action and severe delays in obtaining necessary
19
government approvals stemming from unrest in Egypt during recent years. Furthermore, GTH is, and may in thefuture be, subject to significant tax claims under existing or new Egyptian tax law and this could expose GTH toincreased tax liability. For more information on tax claims of the Egyptian authorities please see “—Legal andRegulatory Risks—We could be subject to tax claims that could harm our business” and Note 27 to our auditedconsolidated financial statements included elsewhere in this Annual Report on Form 20-F.
Adoption of new accounting standards could affect reported results and financial position.
Accounting standardization bodies and other authorities may change accounting regulations that govern thepreparation and presentation of our financial statements. Those changes could have a significant impact on theway we account for certain operations and present our financial position and operating income. In someinstances, a modified standard or a new requirement with retroactive nature may have to be implemented, whichrequires us to restate previous financial statements.
For details of the implementation of new standards and interpretations issued, see Notes 3 and 4 to ouraudited consolidated financial statements included elsewhere in this Annual Report on Form 20-F. In particular,VEON Ltd. is required to adopt the new accounting standards IFRS 9 Financial Instruments and IFRS 15Revenue from Contracts with Customers, each effective from January 1, 2018, and IFRS 16 Leases, effective forthe financial years from January 1, 2019. These changes could have a material impact on our financialstatements. Such impact is under analysis as of the date of this Annual Report on Form 20-F.
Risks Related to the Industry
The telecommunications industry is highly capital intensive and requires substantial and ongoingexpenditures of capital.
The telecommunications industry is highly capital intensive, as our success depends to a significant degreeon our ability to keep pace with new developments in technology, to develop and market innovative products andto update our facilities and process technology, which may require additional capital expenditures in the future.The amount and timing of our capital requirements will depend on many factors, including acceptance of anddemand for our products and services, the extent to which we invest in new technology and research anddevelopment projects, and the status and timing of competitive developments. If we do not have sufficientresources from our operations to finance necessary capital expenditures, we may be required to raise additionaldebt or equity financing, which may not be available when needed or on terms favorable to us or at all. If we areunable to obtain adequate funds on acceptable terms, or at all, we may be unable to develop or enhance ourproducts, take advantage of future opportunities or respond to competitive pressures, which could harm ourbusiness, financial condition, results of operations, cash flows or prospects. For more information on our futureliquidity needs, see “Item 5—Operating and Financial Review and Prospects—Liquidity and CapitalResources—Future Liquidity and Capital Requirements.”
Our revenue is often unpredictable, and our revenue sources are short-term in nature.
Future revenue from our prepaid mobile customers, our primary source of revenue, and our contract mobilecustomers is unpredictable. For instance, in the year ended December 31, 2016, over 87% of our customers ineach of the jurisdictions in which we operate, which excludes the Italy Joint Venture, were prepaid customers.We do not require our prepaid mobile customers to enter into long-term service contracts and cannot be certainthat they will continue to use our services in the future. We require our contract mobile customers to enter intoservice contracts; however, many of these service contracts can be canceled by the customer with limitedadvance notice and without significant penalty, pursuant to the contract terms and/or applicable legislation. Theloss of a larger number of customers than anticipated could result in a loss of a significant amount of expectedrevenue. Because we incur costs based on our expectations of future revenue, failure to accurately predictrevenue could harm our business, financial condition, results of operations, cash flows or prospects.
20
We operate in competitive markets, and we may face greater competition as a result of market andregulatory developments.
The markets in which we operate are competitive in nature, and we expect that competition will continue toincrease. For example, the French operator Iliad is expected to launch in the Italian market in 2017 as a newmobile operator and as a beneficiary of the remedy package we agreed with the European Commission for thecompletion of the Italy Joint Venture. Each of the items discussed immediately below regarding increasedcompetition could materially harm our business, financial condition, results of operations, cash flows orprospects:
• we cannot assure you that our revenue will grow in the future, as competition puts pressure on ourprices;
• with the increasing pace of technological developments, including in particular new digitaltechnologies, and regulatory changes impacting our industry, future business drivers are increasinglydifficult to predict, and we cannot assure you that we will adapt to these changes at a competitive pace;
• we may be forced to utilize more aggressive marketing schemes to retain existing customers and attractnew ones, including lower tariffs, handset subsidies or increased dealer commissions;
• in more mature or saturated markets, such as Russia (see “Item 4—Information on the Company—Description of Our Business—Mobile Business in Russia” and “Item 4—Information on theCompany—Description of Our Business—Fixed-Line Business in Russia”) there are limits on theextent to which we can continue to grow our customer base, and we may be unable to deliver superiorcustomer experience relative to our competitors, which may negatively impact our revenue and marketshare;
• in markets where we are limited in the growth of our customer base, the continued growth in ourbusiness and results of operations will depend, in part, on our ability to extract greater revenue fromour existing customers, including through the expansion of data services and the introduction of nextgeneration technologies, which may prove difficult to accomplish;
• as we expand the scope of our services, such as new networks and fixed-line residential andcommercial broadband services, we may encounter a greater number of competitors that providesimilar services;
• the liberalization of the regulations in certain areas in which we operate could greatly increasecompetition;
• competitors may operate more cost effectively or have other competitive advantages such as greaterfinancial resources, market presence and network coverage, stronger brand name recognition, highercustomer loyalty and goodwill and more control over domestic transmission lines;
• competitors may reach customers more effectively through a better use of digital and physicaldistribution channels;
• competitors, particularly current and former state-controlled telecommunications service providers,may receive preferential treatment from the regulatory authorities and benefit from the resources oftheir shareholders;
• current or future relationships among our competitors and third parties may restrict our access tocritical systems and resources;
• new competitors or alliances among competitors could rapidly acquire significant market share, and wecannot assure you that we will be able to forge similar relationships;
• reduced demand for our core services of voice, messaging and data and the development of services byapplication developers (commonly referred to as OTT players) could significantly impact our futureprofitability;
21
• competitors may partner with OTT players to provide integrated customer experiences, and we may beunable to implement offers, products and technology to support our commercial partnerships; and
• in markets where we do not have bundled offerings, our existing service offerings could becomedisadvantaged as compared to those offered by competitors (who can offer bundled combinations offixed-line, broadband, public Wi-Fi, TV and mobile).
For more information on the competition in our markets, see “Item 4—Information on the Company.”
We may be unable to develop additional sources of revenue in markets where the potential for additionalgrowth of our customer base is limited.
The mobile markets in Russia, Algeria, Ukraine, Kazakhstan, Kyrgyzstan, Armenia, Georgia, Tajikistan andItaly have each reached mobile penetration rates exceeding 100.0%, according to Analysys Mason. Increasingcompetition, market saturation and technological development lead to the increased importance of data servicesin the Russian market and, to a lesser extent, the markets of other Commonwealth of Independent States (“CIS”)countries. As a result, we will focus less on customer market share growth and more on revenue market sharegrowth in each of these markets. The key components of our growth strategy in these markets will be to increaseour share of the high-value customer market, increase usage of data and improve customer loyalty. If we fail todevelop these additional sources of revenue, it could harm our business, financial condition, results of operations,cash flows or prospects.
Our failure to keep pace with technological changes and evolving industry standards could harm ourcompetitive position and, in turn, materially harm our business.
The telecommunications industry is characterized by rapidly evolving technology, industry standards andservice demands, which may vary by country or geographic region. Accordingly, our future success will dependon our ability to adapt to the changing technological landscape and the regulation of standards utilizing thesetechnologies. It is possible that the technologies or equipment we utilize today will become obsolete or subject tocompetition from new technologies in the future for which we may be unable to obtain the appropriate license ina timely manner or at all. We may not be able to meet all of these challenges in a timely and cost-effectivemanner.
Further, we operate or are developing 3G networks, 4G/LTE networks and networks beyond 4G/LTE insome markets in which we operate. New network development requires significant financial investments andthere can be no assurance that we will be able to develop 3G, 4G/LTE or other networks on commerciallyreasonable terms, that we will not experience delays in developing our networks or that we will be able to meetall of the license terms and conditions imposed by the countries in which we operate or that we will be grantedsuch licenses at all. In addition, mobile penetration rates for 4G/LTE compatible devices may not currentlysupport the cost of 4G/LTE development in certain markets, and such rates will need to increase to becommercially viable. If we experience substantial problems with our 3G or 4G/LTE services, or if we fail tointroduce new services on a timely basis relative to our competitors, it may impair the success of such services,or delay or decrease revenue and profits and therefore may hinder recovery of our significant capital investmentsin 3G or 4G/LTE services as well as our growth.
Our brand, business, financial condition, results of operations and prospects may be harmed in the eventof cyber-attacks or severe systems and network failures, or the perception of such attacks or failures,leading to the loss of integrity and availability of our telecommunications, digital and financial servicesand/or leaks of confidential information, including customer information.
Our operations and business continuity depend on how well we protect and maintain our networkequipment, information technology (“IT”) systems and other assets. Due to the nature of the services we offer
22
across our geographical footprint, we are exposed to cybersecurity threats that could negatively impact ourbusiness activities through service degradation, alteration or disruption. Cybersecurity threats could also lead tothe compromise of our physical assets dedicated to processing or storing customer information, financial data andstrategic business information, exposing this information to possible leakage, unauthorized dissemination andloss of confidentiality. These events could result in reputational harm, lawsuits against us by customers or otherthird parties, violations of data protection laws, adverse actions by telecommunications regulators and otherauthorities, loss of revenue from business interruption, loss of market share and significant additional costs. Inaddition, the potential liabilities associated with these events could exceed the cyber insurance coverage wemaintain.
Although we devote significant resources to the development and improvement of our IT and securitysystems, including the appointment of a Director of Cyber Security in 2015, we could still experience cyber-attacks and IT and network failures and outages, due to factors including:
• unauthorized access to customer and business information;
• accidental alteration or destruction of information during processing due to human errors;
• the spread of malicious software that compromises the confidentiality, integrity or availability oftechnology assets;
• alteration of technology assets caused, accidentally or voluntarily, by employees or third parties;
• accidental misuse of assets by users with possible degradation of both network services and availablecomputing resources (e.g. denial-of-service);
• malfunction of technology assets or services caused by obsolescence, wear or defects in design ormanufacturing;
• faults during standard or extraordinary maintenance procedures; and
• unforeseen absence of key personnel.
From time to time we have experienced cyber-attacks of varying degrees to gain access to our computersystems and networks. As of the date of this Annual Report on Form 20-F, we have suffered minor direct andindirect cybersecurity incidents, that have been promptly contained by the response teams, generating limited ornegligible impacts. However, such attacks may be successful in the future and may develop over long periods oftime during which they can remain undetected.
If our services are affected by such attacks and this degrades our services, our products and services may beperceived as being vulnerable to cyber risk and the integrity of our data protection systems may be questioned.As a result, users and customers may curtail or stop using our products and services, and we may incur legal andfinancial exposure.
Furthermore, we are subject to data protection laws and regulations of state authorities regardinginformation security in jurisdictions in which we operate. For example, data protection laws and regulations inRussia establish two categories of information with corresponding levels of protection – state secret and otherdata (personal data of customers, correspondence privacy and information on rendered telecommunicationservices), and operators must implement the required level of data protection. See “Exhibit 99.2—Regulation ofTelecommunications—Regulation of Telecommunications in Russia—Data Protection.” In general, mobileoperators are directly liable for actions of third parties to whom they forward personal data for processing. Ifsevere customer data security breaches are detected, regulatory authorities could sanction our company,including suspending our operations for some time and levying fines and penalties. Violation of data protectionlaws is a criminal offense in some countries, and individuals can be imprisoned or fined. Our failure to complywith data protection laws and regulations, and our inability to operate our fixed-line or wireless networks, as aresult of cybersecurity threats may result in significant expense or loss of market shares. These events,
23
individually or in the aggregate, could harm our brand, business, financial condition, results of operations orprospects.
We may have to expend significant resources to protect against security breaches.
Regulatory authorities around the world are considering a number of legislative and regulatory proposalsconcerning data protection, including measures to ensure that our encryption of users’ data does not hinder lawenforcement agencies’ access to that data. In addition, the interpretation and application of consumer and dataprotection laws in the United States, the European Union and elsewhere are often uncertain and in flux. It ispossible that these laws may be interpreted and applied in a manner that is inconsistent with our data practices. Ifso, in addition to the possibility of fines, this could result in an order requiring that we change our data practices,which could have an adverse effect on our business and results of operations. Complying with these various lawscould cause us to incur substantial costs or require us to change our business practices in a manner adverse to ourbusiness.
Our ability to profitably provide telecommunications services depends in part on the commercial terms ofour interconnection agreements.
Our ability to secure and maintain interconnection agreements with other wireless and local, domestic andinternational fixed-line operators on cost-effective terms is critical to the economic viability of our operations.Interconnection is required to complete calls that originate on our respective networks but terminate outside ourrespective networks, or that originate from outside our respective networks and terminate on our respectivenetworks. A significant increase in our interconnection costs, or decrease in our interconnection rates, as a resultof new regulations, commercial decisions by other fixed-line operators, increased inflation rates in the countriesin which we operate or a lack of available line capacity for interconnection could harm our ability to provideservices, which could in turn harm our business, financial condition, results of operations, cash flows orprospects. See “Item 4—Information on the Company—Interconnection Agreements.”
Our existing equipment and systems may be subject to disruption and failure for various reasons,including the threat of terrorism, which could cause us to lose customers, limit our growth or violate ourlicenses.
Our business depends on providing customers with reliability, capacity and security. Our technologicalinfrastructure is vulnerable to damage or disruptions from other events, including natural disasters, militaryconflicts, power outages, terrorist acts, government shutdown orders, changes in government regulation,equipment or system failures, human error or intentional wrongdoings, such as breaches of our network orinformation technology security. We operate in countries which may have an increased threat of terrorism and apossible attack on, or near our premises, equipment or points of sale could result in causalities, property damage,business interruption, legal liability and/or damage to our brand or reputation.
In addition, our business may be disrupted by computer viruses or other technical or operational issues. Wecannot be sure that our network system will not be the target of a virus or subject to other technical or operationalissues, or, if it is, that we will be able to maintain the integrity of our customers’ data or that a virus or othertechnical or operational issues will not disrupt our network, causing significant harm to our operations. Also, inrecent years, during installations of new software, we have experienced network service interruptions.
In some regions, our equipment for provision of mobile services resides in a limited number of locations orbuildings. Disruption to the security or operation of these locations or buildings could result in disruption of ourmobile services in those regions.
Interruptions of services could harm our business reputation and reduce the confidence of our customers andconsequently impair our ability to obtain and retain customers and could lead to a violation of the terms of ourlicenses, each of which could materially harm our business. In addition, the potential liabilities associated withthese events could exceed the business interruption insurance we maintain.
24
We depend on third parties for certain services and products important to our business.
We rely on third parties for services and products important for our operations. We currently purchase themajority of our network-related equipment from a core number of suppliers, principally Ericsson, Huawei, NokiaSolutions and Networks, Cisco Systems and ZTE Corporation (“ZTE”) although some of the equipment that weuse is available from other suppliers. The successful build-out and operation of our networks depends heavily onobtaining adequate supplies of switching equipment, radio access network solutions, base stations and otherequipment on a timely basis. From time to time, we have experienced delays in receiving equipment. Forexample, in March 2016, the U.S. Department of Commerce’s Bureau of Industry and Security imposedrestrictions on exports and re-exports of U.S. products, software and technology to ZTE and three of its affiliates.These restrictions were lifted in March 2017, however, there can be no assurance that third parties suppliers willnot be subject to similar programs in the future. Our business could be materially harmed if export and re-exportrestrictions impact our suppliers’ ability to procure products, technology, or software from the United States thatis necessary for the production and timely and satisfactory delivery of the supplies and equipment that we sourcefrom these suppliers.
Also, we may outsource all or a portion of our networks in certain markets in which we operate such as Russiaand Kazakhstan. The Italy Joint Venture also outsources a portion of its networks. See “Item 4—Information on theCompany—Property, Plant and Equipment—Mobile Telecommunications Equipment and Operations—SiteProcurement and Maintenance” and “Item 5—Operating and Financial Review and Prospects—Key Developmentsand Trends—Disposal of Non-Core Assets and Network and Tower Sharing Agreements.” Furthermore, in June2016, we entered into a US$1 billion long-term global software agreement with Ericsson to develop, implement andservice over a seven year period, new software and cloud technologies across our customer-facing IT infrastructure.See “Item 4—Information on the Company—Property, Plant and Equipment—Information Technology.” Ourbusiness could be materially harmed if our agreements with these or other third parties were to terminate or ifnegative developments (financial, legal, regulatory or otherwise) regarding such parties, or a dispute between us andsuch parties, causes the parties to no longer be able to deliver the required services on a timely basis or at all orotherwise fulfill their obligations under our agreements with them.
In addition, we rely on roaming partners to provide services to our customers while they are outside thecountries in which we operate and on interconnect providers to complete calls that originate on our networks butterminate outside our networks, or that originate outside our networks and terminate on our networks. We alsorely on handset providers to provide the equipment used on our networks. In addition, many of our mobileproducts and services are sold to customers through third party channels. The third party retailers, agents anddealers that we use to distribute and sell products are not under our control and may stop distributing or sellingour products at any time or may more actively promote the products and services of our competitors. Should thisoccur with particularly important retailers, agents or dealers, we may face difficulty in finding new retailers, salesagents or dealers that can generate the same level of revenue. Any negative developments regarding the thirdparties on which we depend could materially harm our business, financial condition, results of operations, cashflows or prospects.
Allegations of health risks related to the use of mobile telecommunication devices and base stations couldharm our business.
There have been allegations that the use of certain mobile telecommunication devices and equipment maycause serious health risks. The actual or perceived health risks of mobile devices or equipment could diminishcustomer growth, reduce network usage per customer, spark product liability lawsuits or limit availablefinancing. In addition, the actual or perceived health risks may result in increased regulation of networkequipment and restrictions on the construction of towers or other infrastructure. Each of these possibilities hasthe potential to seriously harm our business.
25
Our intellectual property rights are costly and difficult to protect, and we cannot guarantee that the stepswe have taken to protect our intellectual property rights will be adequate.
We regard our copyrights, service marks, trademarks, trade dress, trade secrets and similar intellectualproperty, including our rights to certain domain names, as important to our continued success. For example, ourwidely recognized logos, such as “Beeline” (Russia, Kazakhstan, Uzbekistan, Armenia, Tajikistan, Georgia, Laosand Kyrgyzstan), “Kyivstar” (Ukraine), “Mobilink” (now “Jazz” in Pakistan), “Djezzy” (Algeria), “banglalink”(Bangladesh), our historical business in Italy’s logo, (“WIND”) have played an important role in building brandawareness for our services and products. We rely upon trademark and copyright law, trade secret protection andconfidentiality or license agreements with our employees, customers, partners and others to protect ourproprietary rights. However, intellectual property rights are especially difficult to protect in many of the marketsin which we operate. In these markets, the regulatory agencies charged to protect intellectual property rights areinadequately funded, legislation is underdeveloped, piracy is commonplace and enforcement of court decisions isdifficult. See “—Legal and Regulatory Risks—New intellectual property laws or regulations may require us toinvest substantial resources in compliance or may be unclear.”
We are in the process of registering the VEON name as a trademark in the jurisdictions in which we operate.As of the date of this Annual Report on Form 20-F, we have achieved registration of the VEON name in severaljurisdictions and have applied for registration in several jurisdictions for which our application is still outstanding.The timeline and process required to obtain trademark registration can vary widely between jurisdictions. We havereceived third party objections to some of our applications and we are currently working to resolve these, but therecan be no assurance that we will resolve them in a timely or satisfactory manner, or at all, which could affect ourability to roll out our VEON personal internet platform as anticipated.
As we continue our digital transformation, we will need to ensure that we have adequate legal rights to theownership or use of necessary source code and other intellectual property rights associated with our systems,products and services. For example, our VEON personal internet platform is being developed using source codecreated in conjunction with third parties. We rely on a combination of contractual provisions and intellectualproperty law to protect our proprietary technology and software, access to and use of source code and othernecessary intellectually property. There can be no assurance that our efforts to protect our intellectual propertyrights will be successful. Our failure to protect our ownership and use rights to our source code and otherintellectual property, including as the result of disputes with our contractual counterparties, could have a materialadverse effect on our results of operations and financial condition.
In addition, litigation may be necessary to enforce our intellectual property rights, to determine the validityand scope of the proprietary rights of others, or to defend against claims of infringement. As the number ofconvergent product offerings and overlapping product functions increase, the possibility of intellectual propertyinfringement claims against us may increase. Any such litigation may result in substantial costs and diversion ofresources, and adverse litigation outcomes could harm our business, financial condition, results of operations,cash flows or prospects.
We depend on our senior management and highly skilled personnel, and, if we are unable to retain ormotivate key personnel, hire qualified personnel, or implement our strategic goals or corporate culturethrough our personnel, we may not be able to maintain our competitive position or to implement ourbusiness strategy.
Our performance and ability to maintain our competitive position and to implement our business strategy isdependent to a large degree on our senior management team and on the talents and efforts of highly skilledpersonnel, including the local management teams of our subsidiaries. In the markets in which we operate,competition for qualified personnel with relevant expertise is intense. There is sometimes limited availability ofindividuals with the requisite knowledge of the telecommunications industry, the relevant experience and, in thecase of expatriates, the ability or willingness to accept work assignments in certain of these jurisdictions.
26
In addition, our compensation schemes may not always be successful in attracting new qualified employeesand retaining and motivating our existing employees. The loss of any key personnel or an inability to attract,train, retain and motivate qualified members of senior management or highly skilled personnel could have anadverse impact on our ability to compete and to implement new business models and could harm our business,financial condition, results of operations, cash flows or prospects. In addition, we might not succeed in instillingour corporate culture and values in new or existing employees, which could delay or hamper the implementationour strategic priorities.
Our continued success is also dependent on our personnel’s ability to adapt to rapidly changingenvironments and to perform in pace with our continuous innovations and industry developments. Although wedevote significant attention to recruiting and training, there can be no assurance that our existing personnel willsuccessfully be able to adapt to and support our strategic priorities.
Legal and Regulatory Risks
We operate in a highly regulated industry and are subject to a large variety of laws and extensiveregulatory requirements.
As a global telecommunications company that operates in a number of markets, we are subject to differentlaws and regulations in each of the jurisdictions in which we provide services. Mobile, internet, fixed-line, voiceand data markets are all generally subject to extensive regulatory requirements, including strict licensing regimes,as well as anti-monopoly and consumer protection regulations. The applicable rules are generally subject todifferent interpretations and the relevant authorities may challenge the positions that we take. Regulations may beespecially strict in the markets of those countries in which we are considered to hold a significant market position(Ukraine, Kazakhstan, Tajikistan and Uzbekistan), a dominant market position (Russia and Armenia) or areconsidered a dominant company (Kyrgyzstan). Our operations in Pakistan and Algeria previously held significantmarket positions. In Pakistan, this designation has been suspended while the courts consider an appeal by PMCL.In Algeria, the regulator withdrew this designation in September 2016. For further information on our marketdesignations, see “Exhibit 99.2—Regulation of Telecommunications.” As we expand certain areas of ourbusiness and provide new services, such as MFS, we may be subject to additional laws and regulations.Regulatory compliance may be costly and involve a significant expenditure of resources, thus negativelyaffecting our financial condition and results of operations.
Certain regulations may require us to reduce roaming prices and mobile and/or fixed-line termination rates,require us to offer access to our network to other operators, and result in the imposition of fines if we fail tofulfill our service commitments. For example, a proposed regulation in the European Union may abolish end-userroaming charges in the European Union, and other jurisdictions in which we operate (including Russia,Kyrgyzstan and Armenia) are considering the regulation of roaming prices, which could negatively impact ourroaming margins.
Data privacy laws and regulations apply broadly to the collection, use, storage, disclosure and security ofpersonal information that identifies or may be used to identify an individual, such as names and contactinformation. Many countries have additional laws that regulate the processing, retention and use ofcommunications data (both content and meta-data). These laws and regulations are subject to frequent revisionsand differing interpretations, and have generally become more stringent over time. Most of the jurisdictionswhere we operate have laws that restrict data transfers overseas unless criteria are met and/or are developing orimplementing laws on data localization requiring data to be stored locally. These laws may restrict our flexibilityto leverage our data and build new or consolidate existing technologies and may conflict with other laws we aresubject to, exposing us to regulatory risk. For more information, see “Exhibit 99.2—Regulation ofTelecommunications.” As a data controller headquartered in the Netherlands and offering services to customersworldwide, including within the European Union, we are subject to the European data protection regime. TheItaly Joint Venture is also subject to this regime.
27
In recent years, U.S. and European lawmakers and regulators have expressed concern over the retention andinterception of telecommunications data. The European Commission proposed a draft of the new ePrivacyRegulation on January 10, 2017, which is targeted to apply from May 25, 2018. It will regulate the processing ofelectronic communications data carried out in connection with the provision and the use of publicly availableelectronic communications services to users in the European Union, regardless of whether the processing itselftakes place in the European Union. The draft proposal regulates the retention and interception of communicationsdata as well as the use of location and traffic data for value added services, imposes stricter requirements onelectronic marketing, and changes to the requirements for use of tracking technologies like cookies. Unlike thecurrent ePrivacy Directive, restrictions on the use of traffic and location data for value added services and therequirements on data retention and interception will likely apply to over-the-top service providers as well astraditional telecommunications service providers, which could broaden our exposure to data protection liability,restrict our ability to leverage our data and increase the costs of running our local companies. The draft alsoextends the strict opt-in marketing rules with limited exceptions to business to business communications, andsignificantly increases penalties.
The EU Data Protection Directive, as implemented into national laws by the EU member states, imposesstrict obligations and restrictions on the processing of personal data. The new EU-wide General Data ProtectionRegulation (GDPR) will become effective on May 25, 2018 (alongside the ePrivacy Regulation), replacing thecurrent EU data protection laws, and will implement more stringent operational requirements for processors andcontrollers of personal data. These rules affect services offered by our EU entities and may conflict with the lawsand guidance in other markets in which we operate. We are also subject to evolving EU laws on data export, aswe may transfer personal data from the European Union to other jurisdictions. This could limit our ability to useand share personal data or could cause us to incur costs or require us to change our business practices in a manneradverse to our business.
Any failure or perceived failure by us to comply with privacy or security laws, policies, legal obligations orindustry standards may result in governmental enforcement actions and investigations, blockage of our servicesin the relevant market, fines and penalties (for example, of up to 20,000,000 Euros or up to 4% of the totalworldwide annual turnover of the preceding financial year (whichever is higher) under the GDPR and draftePrivacy Regulation), litigation and/or adverse publicity, which could have an adverse effect on our reputationand business. If the third parties we work with violate applicable laws, contractual obligations or suffer a securitybreach, such violations may also put us in breach of our obligations under privacy laws and regulations and/orcould in turn have a material adverse effect on our business.
In some countries, we are required to obtain approval for offers and advertising campaigns, which can delayour marketing campaigns and require restructuring of business initiatives. We may also be required to obtainapprovals for certain acquisitions, reorganizations or other transactions, and failure to obtain such approvals mayimpede or harm our business and our ability to expand our operations. Laws and regulations in certain of thejurisdictions in which we operate oblige us to install surveillance equipment to ensure that our networks arecapable of allowing the government to monitor data and voice traffic on our networks. For further information,see “Exhibit 99.2—Regulation of Telecommunications.”
Adverse regulations or regulatory actions could place significant competitive and pricing pressure on ouroperations, could result in fines or other penalties and could harm our business, financial condition, results ofoperations, cash flows or prospects. For more information on the regulatory environment in which we operate,see “Exhibit 99.2—Regulation of Telecommunications.”
We face uncertainty regarding our frequency allocations and may experience limited spectrum capacityfor providing wireless services.
To establish and commercially launch mobile telecommunications networks, we need to receive frequencyallocations for bandwidths within the frequency spectrums in the regions in which we operate. There are a
28
limited number of frequencies available for mobile operators in each of the regions in which we operate or holdlicenses to operate. We are dependent on access to adequate frequency allocation in each such market in order tomaintain and expand our customer base. In addition, frequency allocations may be issued for periods that areshorter than the terms of our licenses, and such allocations may not be renewed in a timely manner, or at all. Forinstance, we have in the past been unable to obtain frequency allocations necessary to test or expand ournetworks in Russia and currently are one of the largest operators in Bangladesh, but hold a small amount of thefrequency spectrum. If our frequencies are revoked or we are unable to renew our frequency allocations or obtainnew frequencies to allow us to provide mobile services on a commercially feasible basis, our network capacityand our ability to provide mobile services would be constrained and our ability to expand would be limited,which could harm our business, financial condition, results of operations, cash flows or prospects.
We may be subject to increases in payments for frequency allocations under the terms of some of ourlicenses.
Legislation in many countries in which we operate, including Russia, requires that we make payments forfrequency spectrum usage. As a whole, the fees for all available frequency assignments, as well as allottedfrequency bands for different mobile communications technologies, have been significant. Any significantincrease in the fees payable for the frequencies that we use or for additional frequencies that we need could havea negative effect on our financial results. We expect that the fees we pay for radio-frequency spectrum couldsubstantially increase in some or all of the countries in which we operate, and any such increase could harm ourbusiness, financial condition, results of operations, cash flows or prospects.
We are subject to anti-corruption laws.
We are subject to a number of anti-corruption laws, including the FCPA in the United States and the anti-corruption provisions of the Dutch Criminal Code in the Netherlands. Our failure to comply with anti-corruptionlaws applicable to us could result in penalties, which could harm our reputation and harm our business, financialcondition, results of operations, cash flows or prospects. The FCPA generally prohibits companies and theirintermediaries from making improper payments to foreign officials for the purpose of obtaining or keepingbusiness and/or other benefits. The FCPA also requires public companies to maintain accurate books and recordsand devise a system of sufficient internal accounting controls. We regularly review and update our policies andprocedures and internal controls designed to provide reasonable assurance that we, our employees, distributorsand other intermediaries comply with the anti-corruption laws to which we are subject. However, there areinherent limitations to the effectiveness of any policies, procedures and internal controls, including the possibilityof human error and the circumvention or overriding of the policies, procedures and internal controls. There canbe no assurance that such policies or procedures or internal controls will work effectively at all times or protectus against liability under these or other laws for actions taken by our employees, distributors and otherintermediaries with respect to our business or any businesses that we may acquire.
We operate in countries which pose elevated risks of corruption violations. If we are not in compliance withanti-corruption laws and other laws governing the conduct of business with government entities and/or officials(including local laws), we may be subject to criminal and civil penalties and other remedial measures, whichcould harm our business, financial condition, results of operations, cash flows or prospects. Investigations of anyactual or alleged violations of such laws or policies related to us could harm our business, financial condition,results of operations, cash flows or prospects.
Please see also “Risks Related to Our Business—We have incurred and are continuing to incur costs andrelated management oversight obligations in connection with our obligations under the DPA, the SEC Judgmentand the Dutch Settlement Agreement, which may be significant,” “—We could be subject to criminal prosecutionor civil sanction if we breach the DPA with the DOJ, the SEC Judgment or the Dutch Settlement Agreement, andwe may face other potentially negative consequences relating to the investigations by, and agreements with,
29
the DOJ, SEC and OM, including additional investigations and litigation” and “Item 8—Financial Information—A. Consolidated Statements and Other Financial Information—A.7. Legal Proceedings” and Notes 25 and 27 toour audited consolidated financial statements included elsewhere in this Annual Report on Form 20-F.
New or proposed changes to laws or new interpretations of existing laws in the markets in which weoperate may harm our business.
We are subject to a variety of national and local laws and regulations in the countries in which we dobusiness. These laws and regulations apply to many aspects of our business. Violations of applicable laws orregulations could damage our reputation or result in regulatory or private actions with substantial penalties ordamages. In addition, any significant changes in such laws or regulations or their interpretation, or theintroduction of higher standards or more stringent laws or regulations, could have an adverse impact on ourbusiness, financial condition, results of operations and prospects. For example, in Pakistan, new regulations anddraft laws have been proposed that could separately (i) require any mobile operator with over a 25% marketshare, such as our subsidiary in Pakistan, to seek approval from the Pakistan Telecommunication Authority(“PTA”) before changing its tariffs; and (ii) introduce obligations on telecommunications operators requiringthem to upgrade systems and security as well as maintain backups and retain mobile data for a sufficient periodof time as well as allow for real time recording of data for extended periods.
Following various terrorist attacks, the Government of Pakistan introduced Standard Operating Procedures(“SOP”) requiring all mobile operators to re-verify their entire customer base through biometric verification, withthe exception of SIM cards issued in the names of companies for use by employees. For our subsidiary inPakistan, this involved the re-verification of more than 38 million SIM cards, and SIM cards that could not beverified had to be blocked by the operators. As a result of the re-verification, the Mobilink brand (now Jazz) lostcustomers, retaining 87% of its subscriber base. In Bangladesh, the regulator initiated similar SIM re-verificationrequirements from December 16, 2015, which resulted in 3.8 million SIM cards being blocked by Banglalink andfor which we may incur additional fees or which may require additional time and/or resources from managementat VEON Ltd. and/or BDCL. Similar actions were recently introduced in Algeria, and we anticipate that they willbe introduced in Ukraine in 2017. See “Exhibit 99.2—Regulation of Telecommunications.” Such requirementscould result in customer losses and claims from legitimate customers that are incorrectly blocked, as well asfines, license suspensions and other liabilities for failure to comply with the requirements. To the extentre-verification and/or new verification requirements are imposed in the jurisdictions in which we operate, it couldhave an adverse impact on our business, financial condition, results of operations and prospects. For moreinformation about the effect of re-verification on our results of operations, see “Item 5—Operating and FinancialReview and Prospects—Results of Operations.”
In addition, many jurisdictions in which we operate, including Federal Law No 374-FZ in Russia, haveadopted data processing laws, which prohibit the collection and storage of personal data on servers locatedoutside of the respective jurisdictions. Violation of these laws by an operator may lead to a seizure of theoperator’s database and equipment and/or a ban on the processing of personal data by such operator, which, inturn, could lead to the inability to provide services to customers. See “—Risks Related to the Industry—Ourbrand, business, financial condition, results of operations and prospects may be harmed in the event of cyber-attacks or severe systems and network failures, or the perception of such attacks or failures, leading to the loss ofintegrity and availability of our telecommunications, digital and financial services and/or leaks of confidentialinformation, including customer information.”
In certain jurisdictions in which we operate, the relevant regulators set MTRs. If any such regulator setMTRs that are lower for us than the MTRs of our competitors, our interconnection costs may be higher and ourinterconnection revenues may be lower, relative to our competitors. In Algeria, for example, the MTRs set by theregulator are significantly lower for Optimum Telecom Algeria S.p.A. (“Optimum”) than for our competitors.For a discussion of developments in the regulation of MTRs, and other important government regulationsimpacting our business, see “Exhibit 99.2—Regulation of Telecommunications.”
30
In addition, we are subject to certain sanctions and embargo laws and regulations of the United States, theUnited Nations, the European Union, and certain other jurisdictions in connection with our activities and suchlaws and regulations may be expanded or amended from time to time in a manner that could materially adverselyaffect our business, financial condition, results of operations, cash flows or prospects. There can be no assurancethat, notwithstanding our compliance safeguards, we will not be found in the future to have been in violation ofapplicable sanctions and embargo laws, particularly as the scope of such laws may be unclear and subject todiscretionary interpretations by regulators, which may change over time. Moreover, certain of our financingarrangements include representations and covenants requiring compliance with or limitation of activities undersanctions laws of additional jurisdictions enumerated in the financing arrangements, as well as mandatoryprepayment requirements in the event of a breach thereof. See “—Risks Related to Our Business—Substantialamounts of indebtedness and debt service obligations could materially decrease our cash flow, adversely affectour business and financial condition and prevent us from raising additional capital.”
New intellectual property laws or regulations may require us to invest substantial resources in complianceor may be unclear.
Current and new intellectual property laws may affect the ability of companies, including us, to protect theirinnovations and defend against claims of patent infringement. The costs of compliance with these laws andregulations are high and are likely to increase in the future. Claims have been, or may be threatened and/or filedagainst us for intellectual property infringement based on the nature and content in our products and services, orcontent generated by our users.
We may be subject to legal liability associated with providing new online services or content as part of ourstrategic priorities.
We currently, and as part of our strategic priorities will continue to, host and provide a wide variety ofservices and products that enable users to conduct business, and engage in various online activities.
The law relating to the liability of providers of these online services and products for the activities of theirusers is still unsettled in some jurisdictions. Claims may be threatened or brought against us for defamation,negligence, breaches of contract, copyright or trademark infringement, unfair competition, tort, includingpersonal injury, fraud, or other theories based on the nature and content of information that we use and store. Inaddition, we may be subject to domestic or international actions alleging that certain content we have generatedor third-party content that we have made available within our services violates applicable law.
We also offer third-party products, services and content. We may be subject to claims concerning theseproducts, services or content by virtue of our involvement in marketing, branding, broadcasting, or providingaccess to them, even if we do not ourselves host, operate, provide, or provide access to these products, services orcontent. Defense of any such actions could be costly and involve significant time and attention of ourmanagement and other resources, may result in monetary liabilities or penalties, and may require us to changeour business in an adverse manner.
Recent anti-terror legislation passed in Russia could result in additional operating costs and may harm ourbusiness.
Federal Law No 374-FZ dated July 6, 2016 (“Federal Law No 374-FZ”) amending anti-terrorism legislationimposed certain obligations on communication providers, including, among others, the obligation to storeinformation confirming the fact of receipt, transmission, delivery and/or processing of voice data, text messages,pictures, sounds, video or other communications (i.e., meta-data reflecting these communications) for a period ofthree years, as well as to store the contents of communications, including voice data, text messages, pictures,sounds, video or other communications for a period of up to six months (the latter requirement will come intoforce starting from July 1, 2018). In addition, in accordance with Federal Law No 374-FZ, communication
31
providers are obliged to supply to the investigation and prosecution authorities the information about the usersand any other information “which is necessary for these authorities to achieve their statutory goals,” and toprovide to the investigation and prosecution authorities any information and codes necessary to decode theinformation. In addition, under local law, operators will be required to block services for users whose personaldata does not correspond to the data registered and stored by operator. This may lead to administrative fines andcould impact the effectiveness of our licenses.
Most of the provisions of Federal Law No 374-FZ entered into force on July 20, 2016. However, thepractical effects of Federal Law No 374-FZ are still unclear, since subordinate legislation is yet to be adopted.The implementation and support of the legislation could result in substantial costs for the design and productionof specialized equipment and tools, as no currently commercially available products satisfy the requirementsimposed by the new law. These costs are currently expected to be borne by telecommunications companies, and,together with diversion of management’s attention and resources, could materially adversely affect our businessand operations. We expect operators to compensate for losses through increased retail tariffs, which may, in turn,have a negative effect on demand for telecommunications services.
Our licenses may be suspended or revoked and we may be fined or penalized for alleged violations of law,regulations or license terms.
We are required to meet certain terms and conditions under our licenses (such as nationwide coverage andnetwork build-out requirements), including meeting certain conditions established by the legislation regulatingthe communications industry. If we fail to comply with the conditions of our licenses or with the requirementsestablished by the legislation regulating the communications industry, or if we do not obtain or comply withpermits for the operation of our equipment, use of frequencies or additional licenses for broadcasting directly orthrough agreements with broadcasting companies, the applicable regulator could decide to levy fines, suspend,terminate or refuse to renew the license or permit. Such regulatory actions could adversely impact our ability tocarry out divestitures in the relevant jurisdictions.
The occurrence of any of these events could materially harm our ability to build out our networks inaccordance with our plans and to retain and attract customers, could harm our reputation and could harm ourbusiness, financial condition, results of operations, cash flows or prospects. For more information on our licensesand their related requirements, please see the sections of this Annual Report on Form 20-F entitled “Item 4—Information on the Company—Licenses.”
Our licenses are granted for specified periods and they may not be extended or replaced upon expiration.
The success of our operations is dependent on the maintenance of our licenses to providetelecommunications services in the jurisdictions in which we operate. Most of our licenses are granted forspecified terms, and there can be no assurance that any license will be renewed upon expiration. Some of ourlicenses will expire in the near term, including a license in Algeria that expired in 2016 and for which we arewaiting for an official confirmation of renewal. See also, “Item 4—Information on the Company—Licenses.”These licenses are also subject to ongoing review by the relevant regulatory authorities. If renewed, our licensesmay contain additional obligations, including payment obligations (which may involve a substantial renewal orextension fee), or may cover reduced service areas or scope of service. Furthermore, the governments in certainjurisdictions in which we operate may hold auctions (including auctions for the 4G/LTE spectrum or moreadvanced spectrums) in the future. If we are unable to maintain or obtain licenses for provision oftelecommunications services or if our licenses are not renewed or are renewed on less favorable terms, ourbusiness and results of operations could be materially harmed. For more information about spectrum allocationsand our licenses, including their expiration dates, please see the section of this Annual Report on Form 20-Fentitled “Item 4—Information on the Company.”
32
It may not be possible for us to procure in a timely manner, or at all, the permissions and registrationsrequired for our base stations.
The laws of the countries in which we operate generally prohibit the operation of telecommunicationsequipment without a relevant permit from the appropriate regulatory body. Due to complex regulatoryprocedures, it is frequently not possible for us to procure in a timely manner, or at all, the permissions andregistrations required for our base stations, including construction permits and registration of our title to landplots underlying our base stations, or other aspects of our network before we put the base stations into operation,or to amend or maintain the permissions in a timely manner when it is necessary to change the location ortechnical specifications of our base stations. At times, there can be a number of base stations or othercommunications facilities and other aspects of our networks for which we are awaiting final permission tooperate for indeterminate periods. This problem may be exacerbated if there are delays in issuing necessarypermits.
We also regularly receive notices from regulatory authorities in countries in which we operate warning usthat we are not in compliance with aspects of our licenses and permits and requiring us to cure the violationswithin a certain time period. We have closed base stations on several occasions in order to comply withregulations and notices from regulatory authorities. Any failure by our company to cure such violations couldresult in the applicable license being suspended and subsequently revoked through court action. Although wegenerally take all necessary steps to comply with any license violations within the stated time periods, includingby switching off base stations that do not have all necessary permits until such permits are obtained, we cannotassure you that our licenses or permits will not be suspended and not subsequently be revoked in the future. If weare found to operate telecommunications equipment without an applicable license or permit, we could experiencea significant disruption in our service or network operation, which could harm our business, financial condition,results of operations, cash flows or prospects.
We are, and may in the future be, involved in disputes and litigation with regulators, competitors andthird parties.
We are party to lawsuits and other legal, regulatory antitrust proceedings and commercial disputes, the finaloutcome of which is uncertain and there can be no assurance that we will not be a party to additional proceedingsin the future. Litigation and regulatory proceedings are inherently unpredictable. For more information on thesedisputes, see “Item 8—Financial Information—A. Consolidated Statements and Other Financial Information—A.7. Legal Proceedings” and Notes 25 and 27 to our audited consolidated financial statements included elsewherein this Annual Report on Form 20-F. An adverse outcome in, or any disposition of, these or other proceedings(including any that may be asserted in the future) could harm our business, financial condition, results ofoperations, cash flows or prospects.
We could be subject to tax claims that could harm our business.
Tax audits in the countries in which we operate are conducted regularly. We have been subject to substantialclaims by tax authorities in Russia, Algeria, Egypt, Pakistan, Bangladesh, Ukraine, Kazakhstan, Armenia,Georgia, Uzbekistan, Kyrgyzstan, Tajikistan and Italy. These claims have resulted, and future claims may result,in additional payments, including interest, fines and other penalties, to the tax authorities.
Although we are permitted to challenge, in court, the decisions of tax inspectorates, there can be noassurance that we will prevail in our litigation with tax authorities. In addition, there can be no assurance that thetax authorities will not claim on the basis of the same asserted tax principles they have claimed against us forprior tax years, or on the basis of different tax principles, that additional taxes are owed by us for prior or futuretax years, or that the relevant governmental authorities will not decide to initiate a criminal investigation and/orprosecution in connection with claims by tax inspectorates for prior tax years.
33
The adverse resolution of these or other tax matters that may arise could harm our business, financialcondition and results of operations. For more information regarding tax claims, and their effects on our financialstatements, see “Item 8—Financial Information—A. Consolidated Statements and Other Financial Information—A.7. Legal Proceedings” and Notes 25 and 27 to our audited consolidated financial statements includedelsewhere in this Annual Report on Form 20-F.
Unpredictable tax systems give rise to significant uncertainties and risks that could complicate our taxplanning and business decisions.
The tax systems in the markets in which we operate may be unpredictable and give rise to significantuncertainties, which could complicate our tax planning and business decisions, especially in emerging markets inwhich we operate, where there is significant uncertainty relating to the interpretation and enforcement of taxlaws. Any additional tax liability imposed on us by tax authorities in this manner, as well as any unforeseenchanges in applicable tax laws or changes in the tax authorities’ interpretations of the respective double taxtreaties in effect, could harm our future results of operations, cash flows or the amounts of dividends available fordistribution to shareholders in a particular period. We may be required to accrue substantial amounts forcontingent tax liabilities and the amounts accrued for tax contingencies may not be sufficient to meet any liabilitywe may ultimately face. From time to time, we may also identify tax contingencies for which we have notrecorded an accrual. Such unaccrued tax contingencies could materialize and require us to pay additionalamounts of tax.
On January 1, 2016, a new tax law became effective in Uzbekistan, pursuant to which mobiletelecommunications companies are subject to income tax rates based on profitability levels (7.5% tax forprofitability levels up to 20%, and 50% tax for profitability levels exceeding 20%) and the tax per subscriber wasincreased by 100%, resulting in an increase in the statutory tax rate from 7.5% for the year ended December 31,2015 to 50.0% for the year ended December 31, 2016 and an effective tax rate of 53.3% for the year endedDecember 31, 2016, which negatively impacted our results in Uzbekistan. In Bangladesh, supplementary dutyhas been increased due to additional subnational tax from 3% to 5% with effect from June 2016 and a 1%surcharge was implemented on mobile services from March 9, 2016. The minimum tax rate has also beenincreased in Bangladesh from 0.5% to 0.75% with effect from January 2015. In Algeria, a new finance law in2017 increased VAT from 7% to 19% on data services and from 17% to 19% on voice services, and alsoincreased taxes on recharges from 5% to 7%. Such changes could have an adverse impact on our business,financial condition, results of operations or cash flows in these countries and on our group.
Moreover, as a result of the 2016 U.S. election and ongoing activity in the U.S. Congress relating to taxreform proposals, there is in particular a heightened possibility of significant changes to U.S. federal tax laws,which could affect our limited operations in the United States.
The introduction of new tax laws or the amendment of existing tax laws, such as laws relating to transferpricing rules or the deduction of interest expenses in the markets in which we operate, may also increase the riskof adjustments being made by the tax authorities and, as a result, could have a material impact on our business,financial performance and results of operations.
Repeated tax audits and extension of liability beyond the limitation period may result in additional taxassessments.
Tax declarations together with related documentation are subject to review and investigation by a number ofauthorities, which are empowered to impose fines and penalties on taxpayers.
In Russia, for example, tax returns remain open and subject to inspection by tax and/or customs authoritiesfor three calendar years immediately preceding the year in which the decision to conduct an audit is taken. Lawsenacted in Russia in recent years increase the likelihood that our tax returns that were reviewed by tax authorities
34
could be subject to further review or audit during or beyond the eligible three-year limitation period by a superiortax authority.
Tax audits may result in additional costs to our group if the relevant tax authorities conclude that entities ofthe group did not satisfy their tax obligations in any given year. Such audits may also impose additional burdenson our group by diverting the attention of management resources. The outcome of these audits could harm ourbusiness, financial condition, results of operations, cash flows or prospects. Under such review the relevant taxauthorities may conclude that we had significantly underpaid taxes relating to earlier periods, which could harmour business, financial condition, results of operations, cash flows or prospects.
In addition, in recent years, the Russian tax authorities have aggressively brought tax evasion claims relatingto Russian companies’ use of tax-optimization schemes, and press reports have speculated that these enforcementactions have been selective and politically motivated. We have also been the subject of repeat complex andthematic tax audits in Kazakhstan, Tajikistan and Kyrgyzstan. For further information on tax audits, see“Item 8—Financial Information—A. Consolidated Statements and Other Financial Information—A.7. LegalProceedings” and Notes 25 and 27 to our audited consolidated financial statements included elsewhere in thisAnnual Report on Form 20-F.
Adverse decisions of tax authorities or changes in tax treaties, laws, rules or interpretations could have amaterial adverse effect on our business, results of operations, financial conditions or cash flows.
The tax laws and regulations in the Netherlands, our current resident state for tax purposes, may be subjectto change and there may be changes in enforcement of tax law. Additionally, European and other tax laws andregulations are complex and subject to varying interpretations. We cannot be sure that our interpretations areaccurate or that the responsible tax authority agrees with our views. If our tax positions are challenged by the taxauthorities, we could incur additional tax liabilities, which could increase our costs of operations and have amaterial adverse effect on our business, financial condition or results of operations.
Within the Organisation for Economic Co-operation and Development (“OECD”) there is an initiativeaimed at avoiding base erosion and profit shifting (“BEPS”) for tax purposes. This OECD BEPS project hasresulted in further developments in other countries and in particular in the European Union. One of thedevelopments is the agreement on the EU Anti-Tax Avoidance Directive (“ATAD”). All EU Member Statesmust implement the minimum standards as set out in the ATAD. The implementation of these measures againsttax avoidance in the legislation of the jurisdictions in which we do business could have a material adverse effecton us. For example, the implementation of the general interest limitation rule (Article 4 ATAD) could result in anincrease of our tax liabilities as certain interest costs could no longer be deductible. Another development is therecently published proposal for a Council Directive on a Common Corporate Tax Base (“CCTB”) and there-launch of the Common Consolidated Corporate Tax Base, first tabled in 2011. If enacted, these directivescould also impact our tax position, either positively or negatively. For instance, under the proposed CCTB, ourtaxable result realized in each of the EU Member States will be calculated on the same basis in each of these EUMember States, irrespective of whether the national corporate income tax system differs from the CCTB (notingthat Member States can opt to continue to have their own corporate income tax rate). Based on the draft wordingof the CCTB, the CCTB participation exemption regime would be less favorable in comparison to the Dutchregime because a minimum of a 10% shareholding would be required, as compared to the current 5% under theDutch regime. On the other hand, the CCTB potentially introduces a notional interest deduction on equity, whichthe current Dutch rules do not make available. As a result, it is difficult to assess the impact of the enactment ofthese directives on our business.
The Italy Joint Venture may be subject to a deferral or to a limitation of the deduction of interest expensesin Italy.
For taxpayers like the Italy Joint Venture, Italian tax law permits the deduction of some interest expense upto a specified limit. A further deduction of interest expense is permitted up to an additional threshold. The
35
amount of unused interest expense deduction may be carried forward to future years. Based on these rules, theItaly Joint Venture currently is able to carry forward accrued and unused deductions to future fiscal years. Anyfuture changes in current Italian tax laws or in their interpretation may have an adverse impact on thedeductibility of interest expenses for the Italy Joint Venture which, in turn, could harm our business, financialcondition, results of operations or prospects.
We operate in uncertain judicial and regulatory environments.
In many of the emerging market countries where we operate, the application of the laws of any particularcountry is frequently unclear and may result in unpredictable judicial or regulatory outcomes.
The uncertain judicial and regulatory environments in which we operate could result in:
• restrictions or delays in obtaining additional numbering capacity, receiving new licenses andfrequencies, receiving regulatory approvals for rolling out our networks in the regions for which wehave licenses, receiving regulatory approvals for changing our frequency plans and importing andcertifying our equipment;
• difficulty in complying with new or existing legislation and the terms of any notices or warningsreceived from the regulatory authorities in a timely manner;
• adverse rulings by courts or government authorities resulting from a change in interpretation orinconsistent application of existing law;
• significant additional costs and delays in implementing our global strategies and operating or businessplans; and
• a more challenging operating environment.
If we are found to be involved in practices that do not comply with applicable laws or regulations, we maybe exposed to significant fines, the risk of prosecution or the suspension or loss of our licenses, frequencyallocations, authorizations or various permissions, any of which could harm our business, financial condition,results of operations, cash flows or prospects.
Laws restricting foreign investment could materially harm our business.
We could be materially harmed by existing laws restricting foreign investment or the adoption of new lawsor regulations restricting foreign investment, including foreign investment in the telecommunications industry inRussia, Kazakhstan or other markets in which we operate. See “Exhibit 99.2—Regulation ofTelecommunications.”
For example, in Russia, the Federal Law “On the Procedure for Foreign Investments in Business Entities ofStrategic Importance for National Defense and State Security” (the “Russian Foreign Investment Law”), limitsforeign investment in companies that are deemed to be strategic. Our subsidiary PJSC “Vimpel-Communications” (“PJSC VimpelCom”) is deemed to be a strategic enterprise under the Russian ForeignInvestment Law. As a result, any acquisition by a foreign investor of direct or indirect control over more than50.0% of its voting shares, or 25.0% in the case of a company controlled by a foreign government, requires theprior approval of the Government Commission on Control of Foreign Investment in the Russian Federationpursuant to the Russian Foreign Investment Law. Additionally, under Russian law, companies controlled byforeign governments are prohibited absolutely from acquiring control over strategic enterprises, and theGovernment Commission on Control of Foreign Investment in the Russian Federation, or the FederalAntimonopoly Service of the Russian Federation, the “FAS”, which administers application of the RussianForeign Investment Law, has challenged acquisitions of our shares in the past. In Kazakhstan, according to thenational security law, a foreign company cannot directly or indirectly own more than a 49% stake in a fixed-line
36
business operator without the consent of the Kazakhstani government. As a result, our ability to obtain financingfrom foreign investors may be limited, should prior approval be refused, delayed or require foreign investors tocomply with certain conditions, which could materially harm our business, financial condition, results ofoperations, cash flows or prospects.
Furthermore the Federal Assembly, as the national legislature of the Russian Federation, is currentlyconsidering a draft bill which would introduce restrictions on the ability of foreign investors to controlaudiovisual service providers operating in Russia. In particular, foreign ownership would be restricted to 20%,subject to certain exemptions, including that the restrictions would not apply to audiovisual service providers thatqualify as a strategic enterprise under the Russian Foreign Investment Law. It is not yet certain if this draft billwill be adopted and, if adopted, which specific restrictions on foreign investments could apply to the audiovisualindustry and the company itself. If adopted, and depending on the final terms, the bill may affect our Pay-TV andVEON messenger projects by imposing additional costs and/or jeopardizing revenue projections.
Risks Related to Our Markets
The international economic environment could cause our business to decline.
After late 2008, the economies in our markets were adversely affected by the international economic crisis,and economies in markets in which we operate continue to suffer. Among other things, the crisis led to aslowdown in gross domestic product growth, increase of inflation, devaluations of the currencies in Russia andother markets in which we operate and a decrease in commodity prices. In addition, because Russia, Kazakhstanand Algeria produce and export large amounts of oil, their economies are particularly vulnerable to fluctuationsin the price of oil on the world market. Since June 2014, global oil prices have been falling and are currently atrelatively low levels. The timing of a return to sustained economic growth and consistently positive economictrends is difficult to predict. The recessionary effects, debt crisis and euro crisis in Europe and low oil pricescontinue to pose potentially significant macroeconomic risks to our group.
Low oil prices, together with the impact of economic sanctions—including those promulgated by the UnitedStates, which restrict certain financial transactions and dealings, even by non-U.S. persons, involving certainindustries and parties in Russia—and the significant devaluation of the ruble, have negatively impacted andcontinue to have an adverse effect on the Russian economy and economic outlook and may also negativelyimpact our ability to raise external financing, particularly if the sanctions are broadened. The current difficulteconomic environment and any future downturns in the economies of markets in which we operate or mayoperate in the future could diminish demand for our services, increase our costs, constrain our ability to retainexisting customers and collect payments from them and prevent us from executing our strategies. Adverseeconomic conditions could also hurt our liquidity and prevent us from obtaining financing needed to fund ourdevelopment strategy, to take advantage of future opportunities to respond to competitive pressures, to refinanceexisting indebtedness or to meet unexpected financial requirements, which could harm our business, financialcondition, results of operations, cash flows or prospects.
Deterioration of macroeconomic conditions in the countries in which we operate and/or a significantdifference between the performance of an acquired company and the business case assumed at the time ofacquisition could require us to write down the value of the goodwill. In addition, the different possibledevelopments as a result of a financial and economic crisis, in particular related to customer behavior,competition reaction in this environment in terms of offers and pricing or in response to new entrants, regulatoryadjustments in relation to reductions in consumer prices and our ability to adjust costs and investments inkeeping with possible changes in revenue may adversely affect our forecasts and lead to a write-down in tangibleand intangible assets.
A write-down recorded for tangible and intangible assets lowering their book values could impact certaincovenants under our debt agreements, which could result in a deterioration of our financial condition, results of
37
operations or cash flows. For further information on the impairment of tangible and intangible assets andrecoverable amounts (particularly key assumptions and sensitivities), see Note 10 to our audited consolidatedfinancial statements included elsewhere in this Annual Report on Form 20-F.
Our operations may be adversely affected by ongoing developments in Russia and Ukraine.
The current situation in Russia and Ukraine, and the related responses of the United States, member states ofthe European Union, the European Union itself and certain other nations, have the potential to materiallyadversely affect our business in Russia and Ukraine where we have significant operations, which in turn couldmaterially harm our financial condition, results of operations, cash flows or prospects.
In connection with the situation in Russia and Ukraine, the United States, the European Union, and anumber of countries have imposed (i) sanctions that block the property of certain designated businesses,organizations and individuals, (ii) sectoral sanctions that prohibit certain types of transactions with specificallydesignated businesses operating in certain sectors of the Russian economy, currently including the financialservices, energy, and defense sectors, and (iii) territorial sanctions restricting investment in and trade withCrimea. The U.S. and EU sanctions target entities owned and/or controlled by designated entities and individuals.Further, under the U.S. sanctions regime, even non-U.S. persons who engage in certain prohibited transactionsmay be exposed to secondary sanctions, such as the denial of certain privileges, including financing andcontracting with U.S. persons or within the United States. In addition, the United States and the European Unionhave implemented certain export control restrictions related to Russia’s energy sector and military capabilities.Ukraine has also enacted sanctions with respect to certain Russian entities and individuals. Russia has respondedwith countermeasures to such international and Ukrainian restrictions and sanctions, currently including limitingthe import of certain goods from the United States, the European Union, Ukraine and other countries, imposingvisa bans on certain persons, and imposing restrictions on the ability of Russian companies to comply withsanctions imposed by other countries. Russia announced sanctions against Turkey in response to an incidentinvolving Russian and Turkish military aircraft in November 2015, including imposing a ban on Russiancompanies hiring Turkish workers and the imposition of visa requirements, as of January 1, 2016. Suchsanctions, export controls and/or other measures, including sanctions on additional persons or businesses(including vendors, joint venture and business partners, affiliates and financial institutions) imposed by theUnited States, the European Union, Ukraine, Russia, and/or other countries, could materially adversely affect ourbusiness, financial condition, results of operations, cash flows or prospects.
Ukraine has assigned a “temporary occupied territories” status to Crimea and an “anti-terrorist operationzone” status to certain Eastern Ukraine regions which are currently not under the Ukrainian government’scontrol, and has imposed certain restrictions and prohibitions on trade in goods and services in such territories.Our Ukrainian subsidiary, “Kyivstar” JSC, shut down its network in Crimea in 2014 as well as its network incertain parts of Eastern Ukraine in 2015 and, in each case, has written off the relevant assets. Under terms of itstelecommunications licenses, “Kyivstar” JSC is obliged to provide services throughout Ukraine. “Kyivstar” JSChas notified the regulatory authorities that “Kyivstar” JSC has stopped providing services in these areas and hasrequested clarification from such authorities regarding telecommunications operations in such areas. SinceSeptember 2014, legislation has been in effect in Ukraine that authorizes the cancellation of telecommunicationslicenses for sanctioned parties. There can be no assurance that the escalation of the current situation will not leadto the cancellation or suspension of, or other actions under, certain or all of our Ukrainian telecommunicationslicenses, or other sanctions, which could have a material adverse effect on our business in Ukraine, which in turncould harm our business, financial condition, results of operations, cash flows or prospects.
The situation in Crimea and Eastern Ukraine has resulted, and may in the future result, in damage or loss ofassets, disruption of services, and regulatory issues which has, and may in the future, adversely impact our group.In addition, if there were an extended continuation or further increase in conflict in Crimea, Eastern Ukraine or inthe region, it could result in further instability and/or worsening of the overall political and economic situation inUkraine, Russia, Europe and/or in the global capital markets generally, which could adversely impact our group.
38
Moreover, the instability in Crimea and Eastern Ukraine specifically, and in the region more generally, economicsanctions and related measures, and other geopolitical developments (including with respect to the currentconflict and international interventions in Syria) could harm our business, financial condition, results ofoperations, cash flows or prospects. In particular, we could be materially adversely impacted by a continueddecline of the Russian ruble against the U.S. dollar or the euro and the general economic performance of Russia.
Investors in emerging markets, where most of our operations are located, are subject to greater risks thaninvestors in more developed markets, including significant political, legal and economic risks and risksrelated to fluctuations in the global economy.
Most of our operations are in emerging markets. Investors in emerging markets should be aware that thesemarkets are subject to greater risks than more developed markets, including in some cases significant political,legal and economic risks. Emerging market governments and judiciaries often exercise broad, uncheckeddiscretion and are susceptible to abuse and corruption and rapid reversal of political and economic policies onwhich we depend. Political and economic relations among the countries in which we operate are often complexand have resulted, and may in the future result, in conflicts, which could materially harm our business, financialcondition, results of operations, cash flows or prospects. The economies of emerging markets are vulnerable tomarket downturns and economic slowdowns elsewhere in the world. As has happened in the past, financialproblems or an increase in the perceived risks associated with investing in emerging economies could dampenforeign investment in these markets and materially adversely affect their economies. Turnover of political leadersor parties in emerging markets as a result of a scheduled election upon the end of a term of service or in othercircumstances may also affect the legal and regulatory regime in those markets to a great extent than turnover inestablished countries. These developments could severely limit our access to capital and could materially harmthe purchasing power of our customers and, consequently, our business.
Further, the nature of much of the legislation in emerging markets, the lack of consensus about the scope,content and pace of economic and political reform and the rapid evolution of the legal systems in emergingmarkets, place the enforceability and, possibly, the constitutionality of, laws and regulations in doubt and resultin ambiguities, inconsistencies and anomalies. The legislation often contemplates implementing regulations thathave not yet been promulgated, leaving substantial gaps in the regulatory infrastructure. Any of these factorscould affect our ability to enforce our rights under our licenses or our contracts, or to defend our company againstclaims by other parties.
Many of the emerging markets in which we operate are susceptible to significant social unrest or militaryconflicts. In some of the countries in which we operate, the local authorities may order our subsidiaries totemporarily shut down their entire network or part or all of our networks may be shut down due to actionsrelating to military conflicts or nationwide strikes. For example, in 2016, our subsidiary in Pakistan was orderedto shut down parts of its mobile network and services on a regular basis due to the security situation in thecountry. Governments or other factions, including those asserting authority over specific territories in areas ofconflict, could make inappropriate use of the network, attempt to compel us to operate our network in conflictzones or disputed territories and/or force us to broadcast propaganda or illegal instructions to our customers orothers (or face consequences for failure to do so). Forced shutdowns, inappropriate use of our network and/orcompelling us to operate our network and/or broadcast propaganda or illegal instructions could materially harmour business, financial condition, results of operations, cash flows or prospects.
Investors should fully appreciate the significance of the risks involved in investing in an emerging marketscompany and are urged to consult with their own legal, financial and tax advisors.
Social instability in the countries in which we operate could lead to increased support for centralizedauthority and a rise in nationalism, which could harm our business.
Social instability in the countries in which we operate, coupled with difficult economic conditions, couldlead to increased support for centralized authority and a rise in nationalism. These sentiments could lead to
39
restrictions on foreign ownership of companies in the telecommunications industry or nationalization,expropriation or other seizure of certain assets or businesses. In most of the countries in which we operate, thereis relatively little experience in enforcing legislation enacted to protect private property against nationalization orexpropriation. As a result, we may not be able to obtain proper redress in the courts, and we may not receiveadequate compensation if in the future the governments decide to nationalize or expropriate some or all of ourassets. If this occurs, our business could be harmed.
In addition, ethnic, religious, historical and other divisions have, on occasion, given rise to tensions and, incertain cases, military conflict. The spread of violence, or its intensification, could have significant politicalconsequences, including the imposition of a state of emergency, which could materially adversely affect theinvestment environment in the countries in which we operate.
The physical infrastructure in many countries in which we operate is in poor condition and furtherdeterioration in the physical infrastructure could harm our business.
In many countries in which we operate, the physical infrastructure, including transportation networks, powergeneration and transmission and communications systems, is in poor condition. In some of the countries in whichwe operate, including Ukraine, the physical infrastructure has been damaged by military conflict. In some of thecountries in which we operate, including Russia, the public switched telephone networks have reached capacitylimits and need modernization, which may inconvenience our customers and will require us to make additionalcapital expenditures. In addition, continued growth in local, long distance and international traffic, including thatgenerated by our customers, and development in the types of services provided may require substantial investmentin public switched telephone networks. Any efforts to modernize infrastructure may result in increased charges andtariffs, potentially adding costs to our business. The deterioration of the physical infrastructure harms the economiesof these countries, disrupts the transportation of goods and supplies, adds costs to doing business and can interruptbusiness operations. Further deterioration in the physical infrastructure in many of the countries in which we operatecould harm our business, financial condition, results of operations, cash flows or prospects.
The banking systems in many countries in which we operate remain underdeveloped, there are a limitednumber of creditworthy banks in these countries with which we can conduct business and currencycontrol requirements restrict activities in certain markets in which we have operations.
The banking and other financial systems in many countries in which we operate are not well developed orregulated, and laws relating to banks and bank accounts are subject to varying interpretations and inconsistentapplications. Such banking risk cannot be completely eliminated by diversified borrowing and conducting creditanalyses. Uncertain banking laws may also limit our ability to attract future investment. A banking crisis in anyof these countries or the bankruptcy or insolvency of the banks from which we receive, or with which we hold,our funds could result in the loss of our deposits or negatively affect our ability to complete banking transactionsin these countries, which could harm our business, financial condition and results of operations.
In addition, central banks and governments in the markets in which we operate may restrict or preventinternational transfers or impose foreign exchange controls or other currency restrictions, which could prevent usfrom making payments, including the repatriation of dividends and payments to third party suppliers, particularlyin Uzbekistan, Ukraine, Bangladesh and Pakistan. For more information on currency restrictions, see “Item 5—Operating and Financial Review and Prospects—Certain Ongoing Factors Affecting Our Financial Position andResults of Operations—Foreign Currency Controls and Currency Restrictions.” Furthermore, local banks havelimitations on the amounts of loans that they can provide to single borrowers, which could limit the availabilityof functional currency financing in these countries. There can be no assurance that we will be able to obtainapprovals under the foregoing restrictions or limitations, each of which could harm our business, financialcondition, cash flows, results of operations and prospects.
40
Risks Related to the Ownership of our ADSs
Our ADS price may be volatile, and purchasers of ADSs could incur substantial losses.
Our ADS price may be volatile. The stock market in general has experienced extreme volatility that hasoften been unrelated to the operating performance of particular companies. As a result of this volatility, holdersof our ADSs may not be able to sell their ADSs at or above the price at which they purchase our ADSs. Themarket price for our ADSs may be influenced by many factors, including:
• the success of competitive products or technologies;
• regulatory developments in the foreign countries where we operate;
• developments or disputes concerning licenses or other proprietary rights;
• the recruitment or departure of key personnel;
• quarterly or annual variations in our financial results or those of companies that are perceived to besimilar to us;
• market conditions in the industries in which we compete and issuance of new or changed securitiesanalysts’ reports or recommendations;
• the failure of securities analysts to cover our shares or changes in financial estimates by analysts;
• investor perception of our company and of the industry in which we compete; and
• general economic, political and market conditions.
The sale of shares could adversely affect the market price of our ADSs.
Telenor East’s issuance of exchangeable bonds, and subsequent exchanges of the existing and any futureexchangeable bonds for VEON Ltd.’s ADSs, as well as our filing of a registration statement registering resale ofVEON Ltd.’s ADSs deliverable upon exchange of the exchangeable bonds and/or any additional divestures byTelenor may negatively affect the market for VEON Ltd.’s ADSs. The sale of any of the VEON Ltd.’s shares onthe public markets or the perception that such sales may occur, commonly called “market overhang,” mayadversely affect the market for, and the market price of, VEON Ltd.’s ADSs.
Various factors may hinder the declaration and payment of dividends.
The payment of dividends is subject to the discretion of VEON Ltd.’s supervisory board and VEON Ltd.’sassets consist primarily of investments in its operating subsidiaries. For the financial year ended December 31,2016, we intend to pay a dividend in the aggregate amount of US$23 cents per share, comprised of US$3.5 centsper share paid as an interim dividend in December 2016 and US$19.5 cents per share, with a record date ofMarch 30, 2017 and which is intended to be paid on April 12, 2017. Various factors may cause the supervisoryboard to determine not to pay dividends or not to increase dividends from current levels. Such factors includeVEON Ltd.’s financial condition, its earnings and equity free cash flow, its leverage, its capital requirements,contractual restrictions, legal proceedings and such other factors as VEON Ltd.’s supervisory board may considerrelevant. For more information on our policy regarding dividends, see “Item 5—Operating and Financial Reviewand Prospects—Key Developments and Trends—New dividend policy,” “Item 8—Financial Information—A.Consolidated Statements and Other Financial Information—A.8. Policy on Dividend Distributions,” “—RisksRelated to Our Business—As a holding company, VEON Ltd. depends on the ability of its subsidiaries to paydividends and therefore on the performance of its subsidiaries, and is affected by changes in exchange controlsand currency restrictions in the countries in which its subsidiaries operate” and “—Risks Related to OurBusiness—Our strategic partnerships and relationships carry inherent business risks.”
41
Holders of our ADSs may not receive distributions on our common shares or any value for them if it isillegal or impractical to make them available to them.
The depositary of our ADSs has agreed to pay holders of our ADSs the cash dividends or other distributionsit or the custodian for our ADSs receives on our common shares or other deposited securities after deducting itsfees and expenses. Holders of our ADSs will receive these distributions in proportion to the number of ourcommon shares that their ADSs represent. However, the depositary is not responsible for making such paymentsor distributions if it is unlawful or impractical to make a distribution available to any holders of ADSs. Forexample, it would be unlawful to make a distribution to a holder of ADSs if such distribution consists ofsecurities that require registration under the Securities Act but that are not properly registered or distributedpursuant to an applicable exemption from registration. The depositary is not responsible for making a distributionavailable to any holders of ADSs if any government approval or registration required for such distribution cannotbe obtained after reasonable efforts made by the depositary. We have no obligation to take any other action topermit the distribution of our ADSs, common shares, rights or anything else to holders of our ADSs. This meansthat holders of our ADSs may not receive the distributions we make on our common shares or any value for themif it is illegal or impractical for us to make them available. These restrictions may materially reduce the value ofthe ADSs.
VEON Ltd. is a Bermuda company governed by Bermuda law, which may affect your rights as ashareholder or holder of ADSs.
VEON Ltd. is a Bermuda exempted company. As a result, the rights of VEON Ltd.’s shareholders aregoverned by Bermuda law and by VEON Ltd.’s bye-laws. The rights of shareholders under Bermuda law maydiffer from the rights of shareholders of companies incorporated in other jurisdictions. In addition, holders ofADSs do not have the same rights under Bermuda law and VEON Ltd.’s bye-laws as registered holders ofVEON Ltd.’s common shares. Substantially all of our assets are located outside the United States. It may bedifficult for investors to enforce in the United States judgments obtained in U.S. courts against VEON or itsdirectors and executive officers based on civil liability provisions of the U.S. securities laws. Uncertainty existsas to whether courts in Bermuda will enforce judgments obtained in other jurisdictions, including theUnited States, under the securities laws of those jurisdictions, or entertain actions in Bermuda under the securitieslaws of other jurisdictions.
As a foreign private issuer within the meaning of the Exchange Act and the rules of NASDAQ, we aresubject to different U.S. securities laws and NASDAQ governance standards than domestic U.S. issuers.This may afford less protection to holders of our securities, and such holders may not receive corporateand company information and disclosure that they are accustomed to receiving or in a manner in whichthey are accustomed to receiving it.
As a foreign private issuer, the rules governing the information that we disclose differ from those governingU.S. corporations pursuant to the Exchange Act. Although we currently report periodic financial results andcertain material events, we are not required to file quarterly reports on Form 10-Q or provide current reports onForm 8-K disclosing significant events within four business days of their occurrence. In addition, we are exemptfrom the SEC’s proxy rules, and proxy statements that we distribute will not be subject to review by the SEC.Our exemption from Section 16 rules regarding sales of our shares by insiders means that holders of oursecurities will have less data in this regard than shareholders of U.S. companies that are subject to this part of theExchange Act. As a result, holders of our securities may not have all the data that you are accustomed to havingwhen making investment decisions with respect to domestic U.S. public companies.
Our ADSs are listed on the NASDAQ Global Select Market; however, as a Bermuda company, we arepermitted to follow “home country practice” in lieu of certain corporate governance provisions under theNASDAQ listing rules that are applicable to a U.S. company. The primary difference between our corporategovernance practices and the NASDAQ rules relates to NASDAQ listing rule 5605(b)(1), which provides that
42
each U.S. company listed on Nasdaq must have a majority of independent directors, as defined in the NASDAQrules. Bermuda law does not require that we have a majority of independent directors. As a foreign private issuer,we are exempt from complying with this NASDAQ requirement, and we do not have a majority of independentdirectors, as defined in the NASDAQ rules. Accordingly, VEON Ltd.’s shareholders will not have the sameprotections as are afforded to shareholders of companies that are subject to all of the NASDAQ corporategovernance requirements. For more information on the significant differences between our corporate governancepractices and those followed by U.S. companies under the NASDAQ listing rules, see “Item 16G—CorporateGovernance.”
Holders of ADSs may be restricted in their ability to exercise voting rights and the information providedwith respect to shareholder meetings.
Holders of ADSs generally have the right under the deposit agreement to instruct the depositary to exercisethe voting rights for the equity shares represented by such holder’s ADSs. At our request, the depositary will mailto holders any notice of shareholders’ meeting received from us together with information explaining how toinstruct the depositary to exercise the voting rights of the common shares represented by ADSs. If the depositarytimely receives voting instructions from a holder of ADSs, it will endeavor to vote the securities represented bythe holder’s ADSs in accordance with such voting instructions. However, the ability of the depositary to carry outvoting instructions may be limited by practical and legal limitations and the terms of the common shares ondeposit. We cannot assure you that you will receive voting materials in time to enable you to return votinginstructions to the depositary in a timely manner.
We may lose our foreign private issuer status in the future, which could result in significant additionalcosts and expenses.
We could cease to be a foreign private issuer if a majority of our outstanding voting securities are directly orindirectly held of record by U.S. residents and we fail to meet additional requirements necessary to avoid loss offoreign private issuer status. Based on a review of our register of members maintained in Bermuda, as ofMarch 15, 2017 100% of our issued common shares were held of record by BNY (Nominees) Limited in theUnited Kingdom, as agent of The Bank of New York Mellon, for the purposes of our ADS program. As ofMarch 15, 2017, 23 record holders of VEON Ltd.’s ADRs, holding an aggregate of 353,454,732 common shares(20.12%), were listed as having addresses in the United States. The regulatory and compliance costs to us underU.S. securities laws under such event may be significantly higher than costs we incur as a foreign private issuer,which could have a material adverse effect on our business and financial results.
ITEM 4. Information on the Company
Overview
VimpelCom is rebranding to VEON and has changed its name to VEON, effective as of March 30, 2017.VEON is an international communications and technology company, headquartered in Amsterdam, and driven bya vision to unlock new opportunities for customers as they navigate the digital world. Present in some of theworld’s most dynamic markets, VEON provides more than 200 million customers with voice, fixed broadband,data and digital services. VEON offers services to customers in 12 countries including Russia, Pakistan, Algeria,Uzbekistan, Ukraine, Bangladesh, Kazakhstan, Kyrgyzstan, Tajikistan, Armenia, Georgia and Laos. We provideservices under the “Beeline,” “Kyivstar,” “banglalink,” “Jazz” and “Djezzy” brands. As of December 31, 2016,we had 207.5 million mobile customers and 41,994 employees. For a breakdown of total revenue by category ofactivity and geographic segments for each of the last three financial years, see “Item 5—Operating and FinancialReview and Prospects.”
The Italy Joint Venture offers services to customers in Italy. It provides services under the “WIND” and “3”brands and had 31.3 million customers and 9,356 employees as of December 31, 2016.
43
Our rebranding to VEON seeks to reflect our aim to move from being considered solely atelecommunications company to being considered more broadly as a technology company. VEON is being usedas the branding name for both the company and its new personal internet platform. Technology is continuing torevolutionize the way users communicate, travel, bank, shop, consume and are entertained. While othertelecommunications companies have tried to respond to the digital challenge through acquiring technologycompanies, merging with media players or setting up incubators to host innovation, we have instead created ournew VEON personal internet platform. It is built on the re-engineering of our legacy systems and dataarchitecture, which will enable us to offer new, personalized and contextual services. We believe that it willultimately eliminate or greatly reduce the comparatively inefficient bricks-and-mortar service model and replaceit with a smooth, easy, fun, contextual and intuitive experience.
As part of our VEON rebranding, we aim to implement a digital vision and strategy, moving towards atechnology company with an asset-light business model in comparison to the capital-intensive traditionaltelecommunications model. We aim to reduce our capital expenditure to revenue ratio and reduce our IT, capitalexpenditure and distribution costs. We have secured network sharing agreements and aim to reduce the assets onour balance sheet. In the future, we anticipate that we will own only the core assets needed to operate ourbusiness. For further information on our strategic disposal of assets see “Item 5—Operating and FinancialReview and Prospects—Key Developments and Trends—Disposal of Non-Core Assets and Network and TowerSharing Agreements.” We anticipate that we will invest approximately US$100 million per annum over the nextfive years as part of the rollout of our VEON brand, in the context of our group capital expenditure budget ofover US$1.5 billion per year. For further information on our capital expenditures, please see “Item 5—Liquidityand Capital Resources—Further Liquidity and Capital Requirements.” We anticipate that we will finance theinvestments (or the VEON personal internet platform) with operational cash flow, cash on our balance sheet andexternal financing that we currently have in place.
The VEON personal internet platform integrates data analytics and artificial intelligence, with the aim ofputting the user in control. With zero-rating as a fundamental component, as currently envisioned, VEON userswill be able to use the VEON platform to stay connected for free, even when they are out of credit. We intend towork with music, transport, banking, e-commerce and other businesses, all of which will be integrated into asingle personalized internet platform, VEON. We believe that these relationships, particularly those with localbusinesses in each of the countries in which we operate, will help grow those regional economies. We are alsoworking through our technology landscape to deploy a fully digital end-to-end solution to benefit our customers.The digital stack and data management platform will be the core of our IT, while our network will becomesoftware defined, intelligent and dynamic. In addition, we have announced partnerships with STUDIO+, Deezerand MasterCard, which will integrate new services into the platform for VEON users.
VEON Ltd. is an exempted company limited by shares registered under the Companies Act 1981 ofBermuda, as amended (the “Companies Act”), on June 5, 2009, and our registered office is located at VictoriaPlace, 31 Victoria Street, Hamilton HM 10, Bermuda. The VEON Group’s headquarters are located at ClaudeDebussylaan 88, 1082 MD, Amsterdam, the Netherlands. Our telephone number is +31 20 797 7200. VEON Ltd.is registered with the Dutch Trade Register (registration number 34374835) as a company formally registeredabroad (formeel buitenlandse kapitaalvennootschap), as this term is referred to in the Dutch Companies FormallyRegistered Abroad Act (Wet op de formeel buitenlandse vennootschappen), which means that we are deemed aDutch resident company for tax purposes in accordance with applicable Dutch tax regulations.
Our legal representative in the United States is Puglisi & Associates, 850 Library Ave, Suite 204, Newark,DE 19711 (+1 (30) 738 6680). Our agent for service of process in the United States is CT Corporation, 11 EighthAvenue, New York, NY 10011 (+1 (212) 894 8400).
History and Development
Our predecessor PJSC VimpelCom (formerly OJSC “Vimpel-Communications”) was founded in 1992.Since then, VEON has a rich history of adapting to shifts in the marketplace. Prior to 2014, VEON focused on
44
development and expansion throughout Russia and the CIS, then into Asia, Europe and Africa through acombination of organic growth and acquisitions. More recently, VEON has turned its focus to enhancing itsoperations in its core markets and investing in high-speed networks.
The most significant events in the development of our business include the following:
• In November 1996, our predecessor PJSC VimpelCom became the first Russian company since 1903 tolist shares on the New York Stock Exchange;
• Telenor, Norway’s leading telecommunications company became a strategic partner in PJSCVimpelCom in December 1998 and the Alfa Group Consortium (“Alfa Group”) acquired strategicownership interests in 2001;
• VEON began its expansion into the CIS by acquiring local operators or entering into joint ventureswith local partners in Kazakhstan (2004), Ukraine (2005), Tajikistan (2005), Uzbekistan (2006),Georgia (2006) and Armenia (2006);
• In 2009 and 2010, Telenor ASA, the parent company of the Telenor Group, and Altimo Holdings &Investments Ltd. combined their ownership of PJSC VimpelCom and Ukrainian mobile operator“Kyivstar” under a new company called VimpelCom Ltd. The new headquarters were established inAmsterdam;
• In 2011, VEON completed the acquisition of Wind Telecom S.p.A., an international provider of mobileand fixed-line telecommunications and internet services with operations in a number of countriesincluding Italy, Algeria, Bangladesh and Pakistan;
• On September 10, 2013, VEON Ltd. switched the listing of its ADSs to the NASDAQ Global SelectMarket from the New York Stock Exchange;
• On January 30, 2015, VEON Ltd. completed the sale by its subsidiary GTH of a non-controlling 51%interest in Omnium Telecom Algérie (OTA) S.p.A. (“OTA”) to the Fonds National d’Investissement inAlgeria;
• In March 2015, WIND Telecomunicazioni S.p.A. (“WIND”) sold 90% of the shares of its whollyowned tower subsidiary, Galata S.p.A. (“Galata”) to Cellnex Telecom Terrestre SA, formerly namedAbertis Telecom Terrestre SAU (“Cellnex”) and entered into tower services agreements with Galata;these agreements are now held by the Italy Joint Venture;
• On July 1, 2016, Pakistan Mobile Communications Limited (“PMCL”) merged with Warid TelecomPakistan LLC (“WTPL”) and Bank Alfalah Limited (“Bank Alfalah”), which resulted in the merger ofour telecommunications businesses in Pakistan (a transaction we refer to as the “Pakistan Merger” inthis Annual Report on Form 20-F);
• In September 2016, Telenor East sold 163,875,000 of VEON Ltd.’s ADSs pursuant to an underwrittenoffering and also announced its intention to divest the remainder of its stake in VEON Ltd. In addition,Telenor East issued a US$1,000,000,000 0.25% bond due 2019, which is exchangeable forVEON Ltd.’s ADSs. See “Item 5—Operating and Financial Review and Prospects—KeyDevelopments and Trends—Telenor Share Sale and Exchangeable Bond Issuance;”
• On November 5, 2016, we formed a joint venture holding company with Hutchison, through which wejointly own and operate our historical WIND and Hutchison’s historical 3 Italia telecommunicationsbusinesses in Italy. The companies were then merged in January 2017 (see “Item 5—Operating andFinancial Review and Prospects—Key Developments and Trends—Italy Joint Venture” and Notes 6,13 and 26 to our audited consolidated financial statements included elsewhere in this Annual Report onForm 20-F);
• In February 2017, GTH completed a share buy-back for 10% of the total issued share capital of thatcompany. In conjunction with the share buy-back, GTH cancelled listing of the global depositary
45
receipts (“GDRs”) on the Official List of the Financial Conduct Authority and the trading of GDRs onthe Main Market for Listed Securities of the London Stock Exchange on March 20, 2017. See “Item5—Operating and Financial Review and Prospects—Key Developments and Trends—GTH ShareBuy-Back and Cancellation of GDR Program;”
• On February 27, 2017, we announced our new name “VEON,” which was approved by theshareholders on March 30, 2017; and
• We expect to have a second listing of our common shares on Euronext Amsterdam, to broaden ourEuropean investor base, with potential inclusion in European indices and extended stock coverage.Such listing is expected to become effective in the second quarter of 2017.
Leadership
VEON has made changes in its management and board composition to focus on significant experience andexpertise in compliance, transformation and digital.
During 2016 and 2017, as of the date of this Annual Report on Form 20-F, VEON made a number of strategicmanagement appointments to lead the company in its next phase of development. New appointments included:
• Kjell Morten Johnsen as Head of Major Markets and Chief Executive Officer of PJSC VimpelCom;
• Mark MacGann as Group Chief External Affairs Officer; and
• Joshua Drew as Acting Group Chief Compliance Officer.
The following people transitioned to new roles from existing positions within VEON:
• Aamir Hafeez Ibrahim as Chief Executive Officer of Pakistan;
• Jeffrey Hedberg as Group Chief People Officer;
• Matthieu Galvani as Chief Executive Officer of Algeria; and
• Enrique Aznar as Chief Values and Culture Transformation Officer.
In March 2017, Joshua Drew was appointed as Acting Group Chief Compliance Officer following theresignation of Daniel Chapman. He will report directly to Scott Dresser, Group General Counsel. Mr. Drew hasbeen a key member of the legal team since July 2016, when he joined us from Hewlett-Packard Enterprise, wherehe spent over five years in global roles with responsibility for anti-corruption compliance and investigations. Heis also a former federal prosecutor in the U.S., including time with the U.S. Department of Justice’s Fraudsection, which has responsibility for FCPA enforcement. This appointment has been discussed with the AuditCommittee (which oversees compliance with the DPA, the SEC Judgment and the Dutch Settlement Agreement),the independent compliance monitor, the DOJ and the SEC. We are currently in the process of appointing apermanent Group Chief Compliance Officer.
In addition, Stan Chudnovsky and Jørn P. Jensen joined the supervisory board, and Jørn Jensen replacedTrond Ø Westlie as chairman of the audit committee.
For more information on our directors and senior management, see “Item 6—Directors, Senior Managementand Employees—A. Directors and Senior Management” below.
Organizational Structure
VEON Ltd. is the holding company for a number of operating subsidiaries and holding companies in variousjurisdictions. In the third quarter of 2015, we adopted a new regional structure, consisting of the three followingbusiness units, all of which report to our headquarters in Amsterdam:
• Major Markets (Russia and the Italy Joint Venture);
46
• Emerging Markets (which includes our operations in Pakistan, Algeria and Bangladesh); and
• Eurasia (which includes our operations in Ukraine, Kazakhstan, Uzbekistan, Kyrgyzstan, Armenia,Tajikistan and Georgia).
Notwithstanding our new regional structure described above, we currently operate and manage VEON Ltd.on a geographical basis. In accordance with IFRS rules, this results in seven reportable segments. These segmentsare based on the different economic environments and varied stages of development across the geographicalmarkets we serve, each of which requires different investment and marketing strategies.
Our reportable segments currently consist of the seven following segments:
• Russia;
• Pakistan (which was split out of the former “Africa & Asia” reportable segment);
• Algeria;
• Bangladesh (which was split out of the former “Africa & Asia” reportable segment);
• Ukraine;
• Uzbekistan (which was split out of the former “CIS” reportable segment); and
• HQ (transactions related to management activities within the group).
Italy is no longer a reportable segment following the completion of the Italy Joint Venture. For moreinformation, please see Notes 6, 13 and 26 to our audited consolidated financial statements included elsewhere inthis Annual Report on Form 20-F, “Item 5—Operating and Financial Review and Prospects—Key Developmentsand Trends—Italy Joint Venture” and “Explanatory Note—Accounting Treatment of our Historical WINDBusiness and the new Italy Joint Venture.”
We also provide customer numbers for “Others,” which includes all results of our operations in Kazakhstan,Kyrgyzstan, Armenia, Tajikistan, Georgia and Laos.
From January 1, 2015 through June 30, 2016, management organized our business in eight reportablesegments consisting of our seven current reporting segments and Kazakhstan. In the second quarter of 2016,management decided to no longer include Kazakhstan as a separate reportable segment due to the decreasingimpact of operations in Kazakhstan on the overall business. As a result, the activities in Kazakhstan have beenintegrated into our Others category in this Annual Report on Form 20-F. Our annual consolidated financialstatements for the years ended December 31, 2015 and December 31, 2014 included in this Annual Report onForm 20-F have been restated for this organizational change.
47
The table below sets forth our operating companies and significant subsidiaries, including those subsidiariesthat hold our principal telecommunications licenses, and our percentage ownership interest, direct and indirect, ineach subsidiary as of December 31, 2016. Unless otherwise indicated, our percentage ownership interest isidentical to our voting power in each of the subsidiaries.
Countryof Incorporation
PercentageOwnership
Interest(Direct and
Indirect)
VimpelCom Amsterdam B.V. . . . . . . . . . . . . . . . . . . . . . . . . . . . . . . . . . . Netherlands 100.0%VimpelCom Holdings B.V. . . . . . . . . . . . . . . . . . . . . . . . . . . . . . . . . . . . . Netherlands 100.0%(1)
Wind Telecom S.p.A. . . . . . . . . . . . . . . . . . . . . . . . . . . . . . . . . . . . . . . . . Italy 100%(2)
PJSC “Vimpel-Communications” (“PJSC VimpelCom”) . . . . . . . . . . . . Russia 100.0%(3)
Golden Telecom Inc. . . . . . . . . . . . . . . . . . . . . . . . . . . . . . . . . . . . . . . . . . Delaware 100%(4)
“Kyivstar” PJSC . . . . . . . . . . . . . . . . . . . . . . . . . . . . . . . . . . . . . . . . . . . . Ukraine 100.0%(5)
B.V. VimpelCom Finance S.à r.l. . . . . . . . . . . . . . . . . . . . . . . . . . . . . . . . Netherlands/Luxembourg 100.0%(6)
VIP Kazakhstan Holding AG . . . . . . . . . . . . . . . . . . . . . . . . . . . . . . . . . . Switzerland 75.0%(7)
LLP “KaR-Tel” . . . . . . . . . . . . . . . . . . . . . . . . . . . . . . . . . . . . . . . . . . . . . Kazakhstan 75.0%(8)
LLC “Tacom” . . . . . . . . . . . . . . . . . . . . . . . . . . . . . . . . . . . . . . . . . . . . . . Tajikistan 98.0%(9)
LLC “Unitel” . . . . . . . . . . . . . . . . . . . . . . . . . . . . . . . . . . . . . . . . . . . . . . Uzbekistan 100.0%(10)
LLC “Mobitel” . . . . . . . . . . . . . . . . . . . . . . . . . . . . . . . . . . . . . . . . . . . . . Georgia 80.0%(11)
CJSC “Armenia Telephone Company” . . . . . . . . . . . . . . . . . . . . . . . . . . Armenia 100.0%(12)
Menacrest AG . . . . . . . . . . . . . . . . . . . . . . . . . . . . . . . . . . . . . . . . . . . . . . Switzerland 99.9%(13)
LLC “Sky Mobile” . . . . . . . . . . . . . . . . . . . . . . . . . . . . . . . . . . . . . . . . . . Kyrgyzstan 50.1%(14)
VimpelCom Lao Co. Ltd. . . . . . . . . . . . . . . . . . . . . . . . . . . . . . . . . . . . . . Lao PDR 78.0%(15)
Weather Capital S.à r.l. . . . . . . . . . . . . . . . . . . . . . . . . . . . . . . . . . . . . . . . Luxembourg 100.0%(16)
Weather Capital Special Purpose 1 S.A. . . . . . . . . . . . . . . . . . . . . . . . . . . Luxembourg 100.0%(17)
Global Telecom Holding S.A.E. . . . . . . . . . . . . . . . . . . . . . . . . . . . . . . . . Egypt 51.9%(18)
Oratel International Inc. Limited . . . . . . . . . . . . . . . . . . . . . . . . . . . . . . . Malta 100.0%(19)
Moga Holding Limited . . . . . . . . . . . . . . . . . . . . . . . . . . . . . . . . . . . . . . . Malta 100.0%(20)
Omnium Telecom Algérie (OTA) S.p.A. . . . . . . . . . . . . . . . . . . . . . . . . . Algeria 23.7%(21)
Optimum Telecom Algeria S.p.A. . . . . . . . . . . . . . . . . . . . . . . . . . . . . . . Algeria 23.7%(22)
Pakistan Mobile Communications Limited . . . . . . . . . . . . . . . . . . . . . . . Pakistan 44.0%(23)
Banglalink Digital Communications Limited . . . . . . . . . . . . . . . . . . . . . . Bangladesh 51.9%(24)
Wind Tre S.p.A. . . . . . . . . . . . . . . . . . . . . . . . . . . . . . . . . . . . . . . . . . . . . Italy 50.0%(25)
(1) VimpelCom Amsterdam B.V. holds 100% directly.(2) VimpelCom Holdings B.V. holds 92.24% directly. Wind Telecom S.p.A. holds 7.76% of its own shares.(3) VimpelCom Holdings B.V. holds 100% minus one share directly. VEON Ltd. holds one share directly.(4) PJSC VimpelCom holds 100% directly and indirectly through a wholly owned Cypriot holding company and two Delaware holding
companies.(5) VEON Ltd. holds 0.01% directly and VimpelCom Holdings B.V. holds 73.80% directly. “Kyivstar” JSC holds 26.19% of its own shares.(6) PJSC VimpelCom holds 100% directly.(7) B.V. VimpelCom Finance S.à r.l. holds 75.0% directly.(8) VIP Kazakhstan Holding AG holds 75.0% directly.(9) VimpelCom Holdings B.V. holds 98.0% indirectly through a wholly owned Swiss holding company.(10) PJSC VimpelCom holds 100% indirectly through wholly owned Dutch and BVI holding companies.(11) VimpelCom Holdings B.V. holds 80.0% indirectly through a number of wholly owned companies.(12) PJSC VimpelCom owns 100% directly.(13) B.V. VimpelCom Finance S.à r.l. holds 50.1% indirectly through a Swiss holding company and a Cypriot holding company.(14) Menacrest AG holds 100% directly.(15) B.V. VimpelCom Finance S.à r.l. holds 78.0% indirectly through a wholly owned Dutch holding company. The local shareholder of
VimpelCom Lao Co. Ltd. is the government of the Lao People’s Democratic Republic.(16) VimpelCom Holdings B.V. holds 100% indirectly through a wholly owned Luxembourg holding company.(17) Weather Capital S.à r.l. owns 100% directly.(18) Weather Capital S.à r.l. holds 1.9% directly and Weather Capital Special Purpose 1 S.A. holds 50.00% directly.(19) Global Telecom Holding S.A.E. owns 100% directly and indirectly through a Maltese holding company.(20) Global Telecom Holding S.A.E. owns 100% directly and indirectly through a Maltese holding company.
48
(21) Global Telecom Holding S.A.E. holds a controlling interest of 45.6% directly and indirectly through Oratel International Inc. Limitedand Moga Holding Limited. The Algerian National Investment Fund, Fonds National d’Investissement, holds 51% directly in OmniumTelecom Algérie (OTA) S.p.A. and a local minority shareholder named Cevital S.p.A. holds directly the remaining 3.4%.
(22) Omnium Telecom Algeria S.p.A. holds 99.99% directly.(23) As of July 1, 2016, Global Telecom Holding S.A.E. holds 84.7% of PMCL indirectly through two wholly owned Maltese subsidiaries
and a nominee shareholder. See “Item 5—Operating and Financial Review and Prospects—Key Developments and Trends—PakistanMerger.”
(24) Global Telecom Holding S.A.E. holds 99.99% indirectly through a wholly owned Maltese subsidiary.(25) VimpelCom Holdings B.V. owns 50.0% indirectly through two Luxembourg holding companies and one Italian holding company.
Description of Our Business
VEON, through its operating companies, provides customers with mobile and fixed-linetelecommunications services in certain markets, which are described more fully below.
Our Mobile Telecommunications Businesses
The table below presents the primary mobile telecommunications services we offer to our customers and abreakdown of prepaid and postpaid subscriptions as of December 31, 2016.
Mobile Service Description Russia Pakistan Algeria Bangladesh Ukraine Uzbekistan Others
Mobile telecommunications services undercontract and prepaid plans for bothcorporate and consumer segments
—of which prepaid . . . . . . . . . . . . . . . . 89.1% 98.3% 92.2% 93.0% 90.0% 97.6% —(4)
—of which postpaid . . . . . . . . . . . . . . . 10.9% 1.7%(3) 7.8%(3) 7.0% 10.0% 2.4% —(4)
Value added and call completion services(1) Yes Yes Yes Yes Yes Yes Yes(4)
National and international roamingservices(2) . . . . . . . . . . . . . . . . . . . . . . . . . Yes Yes Yes Yes Yes Yes Yes (4)
Wireless Internet access . . . . . . . . . . . . . . . . Yes Yes Yes Yes Yes Yes Yes(4)
Mobile financial services . . . . . . . . . . . . . . . Yes Yes Yes Yes Yes Yes NoMobile bundles . . . . . . . . . . . . . . . . . . . . . . . Yes Yes No Yes Yes Yes Yes(4)
(1) Value added services include messaging services, content/infotainment services, data access services, location based services, media, andcontent delivery channels.
(2) Access to both national and international roaming services allows our customers and customers of other mobile operators to receive andmake international, local and long distance calls while outside of their home network.
(3) Includes postpaid and hybrid (monthly fee with recharge possibility) customers.(4) For a breakdown of prepaid and postpaid subscriptions and a description of the mobile services we offer in Kazakhstan, Kyrgyzstan,
Armenia, Tajikistan, Laos and Georgia, see “—Mobile Business in Others—Description of Mobile Services in Others.”
Mobile Business in Russia
Description—Mobile Business in Russia
In Russia, through our operating company PJSC VimpelCom and our “Beeline” brand, we primarily offermobile telecommunications services to our customers under two types of payment plans: postpaid plans andprepaid plans. As of December 31, 2016, approximately 89.1% of our customers in Russia were on prepaid plans,representing 19% of our revenue in Russia, and approximately 10.9% of our customers in Russia were onpostpaid plans, representing 81% of our revenue in Russia.
49
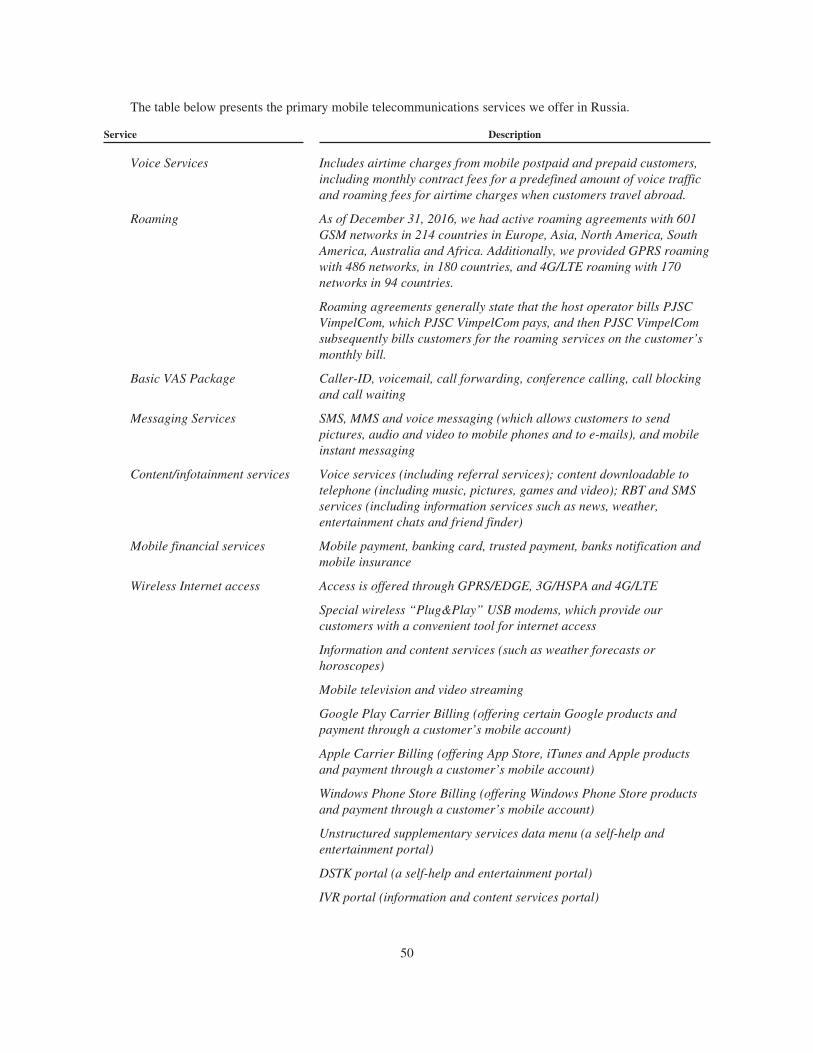
The table below presents the primary mobile telecommunications services we offer in Russia.
Service Description
Voice Services Includes airtime charges from mobile postpaid and prepaid customers,including monthly contract fees for a predefined amount of voice trafficand roaming fees for airtime charges when customers travel abroad.
Roaming As of December 31, 2016, we had active roaming agreements with 601GSM networks in 214 countries in Europe, Asia, North America, SouthAmerica, Australia and Africa. Additionally, we provided GPRS roamingwith 486 networks, in 180 countries, and 4G/LTE roaming with 170networks in 94 countries.
Roaming agreements generally state that the host operator bills PJSCVimpelCom, which PJSC VimpelCom pays, and then PJSC VimpelComsubsequently bills customers for the roaming services on the customer’smonthly bill.
Basic VAS Package Caller-ID, voicemail, call forwarding, conference calling, call blockingand call waiting
Messaging Services SMS, MMS and voice messaging (which allows customers to sendpictures, audio and video to mobile phones and to e-mails), and mobileinstant messaging
Content/infotainment services Voice services (including referral services); content downloadable totelephone (including music, pictures, games and video); RBT and SMSservices (including information services such as news, weather,entertainment chats and friend finder)
Mobile financial services Mobile payment, banking card, trusted payment, banks notification andmobile insurance
Wireless Internet access Access is offered through GPRS/EDGE, 3G/HSPA and 4G/LTE
Special wireless “Plug&Play” USB modems, which provide ourcustomers with a convenient tool for internet access
Information and content services (such as weather forecasts orhoroscopes)
Mobile television and video streaming
Google Play Carrier Billing (offering certain Google products andpayment through a customer’s mobile account)
Apple Carrier Billing (offering App Store, iTunes and Apple productsand payment through a customer’s mobile account)
Windows Phone Store Billing (offering Windows Phone Store productsand payment through a customer’s mobile account)
Unstructured supplementary services data menu (a self-help andentertainment portal)
DSTK portal (a self-help and entertainment portal)
IVR portal (information and content services portal)
50
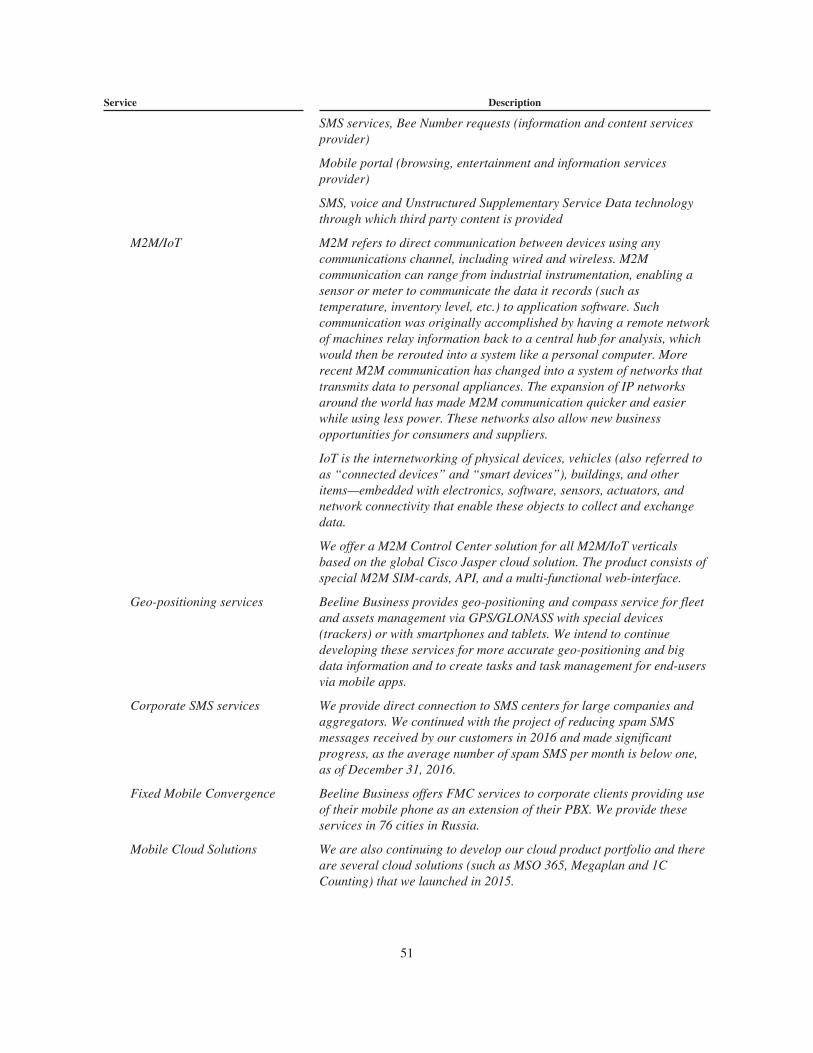
Service Description
SMS services, Bee Number requests (information and content servicesprovider)
Mobile portal (browsing, entertainment and information servicesprovider)
SMS, voice and Unstructured Supplementary Service Data technologythrough which third party content is provided
M2M/IoT M2M refers to direct communication between devices using anycommunications channel, including wired and wireless. M2Mcommunication can range from industrial instrumentation, enabling asensor or meter to communicate the data it records (such astemperature, inventory level, etc.) to application software. Suchcommunication was originally accomplished by having a remote networkof machines relay information back to a central hub for analysis, whichwould then be rerouted into a system like a personal computer. Morerecent M2M communication has changed into a system of networks thattransmits data to personal appliances. The expansion of IP networksaround the world has made M2M communication quicker and easierwhile using less power. These networks also allow new businessopportunities for consumers and suppliers.
IoT is the internetworking of physical devices, vehicles (also referred toas “connected devices” and “smart devices”), buildings, and otheritems—embedded with electronics, software, sensors, actuators, andnetwork connectivity that enable these objects to collect and exchangedata.
We offer a M2M Control Center solution for all M2M/IoT verticalsbased on the global Cisco Jasper cloud solution. The product consists ofspecial M2M SIM-cards, API, and a multi-functional web-interface.
Geo-positioning services Beeline Business provides geo-positioning and compass service for fleetand assets management via GPS/GLONASS with special devices(trackers) or with smartphones and tablets. We intend to continuedeveloping these services for more accurate geo-positioning and bigdata information and to create tasks and task management for end-usersvia mobile apps.
Corporate SMS services We provide direct connection to SMS centers for large companies andaggregators. We continued with the project of reducing spam SMSmessages received by our customers in 2016 and made significantprogress, as the average number of spam SMS per month is below one,as of December 31, 2016.
Fixed Mobile Convergence Beeline Business offers FMC services to corporate clients providing useof their mobile phone as an extension of their PBX. We provide theseservices in 76 cities in Russia.
Mobile Cloud Solutions We are also continuing to develop our cloud product portfolio and thereare several cloud solutions (such as MSO 365, Megaplan and 1CCounting) that we launched in 2015.
51
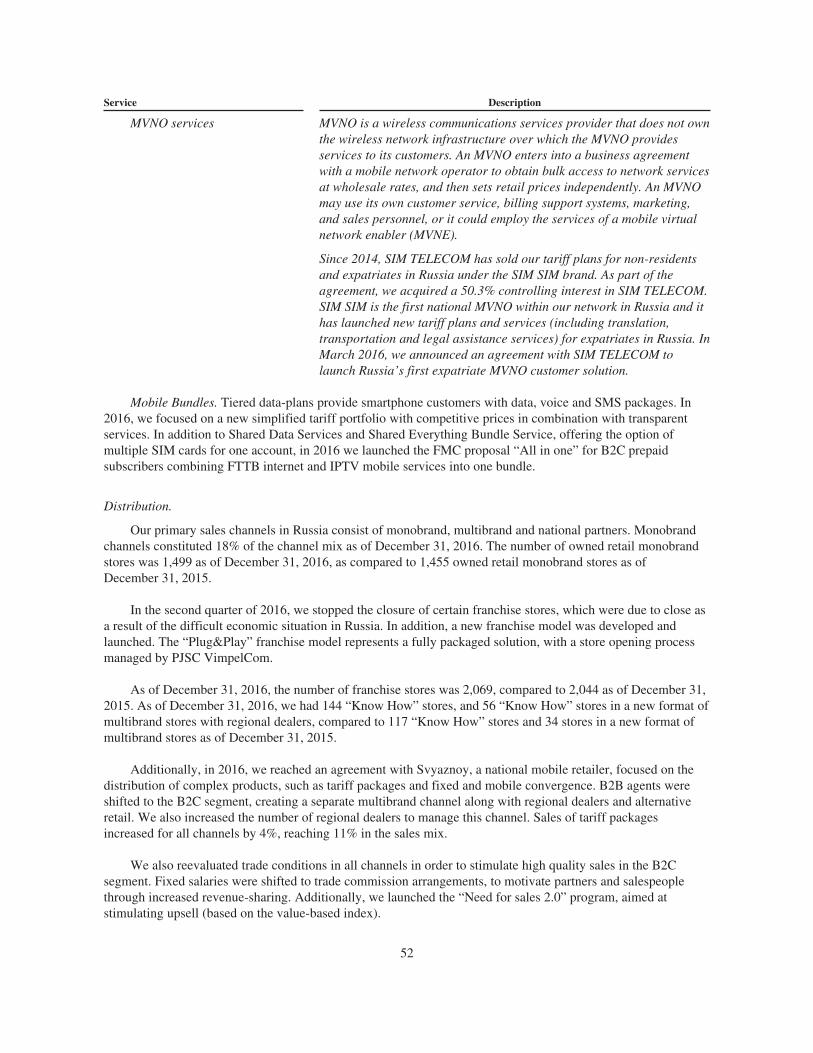
Service Description
MVNO services MVNO is a wireless communications services provider that does not ownthe wireless network infrastructure over which the MVNO providesservices to its customers. An MVNO enters into a business agreementwith a mobile network operator to obtain bulk access to network servicesat wholesale rates, and then sets retail prices independently. An MVNOmay use its own customer service, billing support systems, marketing,and sales personnel, or it could employ the services of a mobile virtualnetwork enabler (MVNE).
Since 2014, SIM TELECOM has sold our tariff plans for non-residentsand expatriates in Russia under the SIM SIM brand. As part of theagreement, we acquired a 50.3% controlling interest in SIM TELECOM.SIM SIM is the first national MVNO within our network in Russia and ithas launched new tariff plans and services (including translation,transportation and legal assistance services) for expatriates in Russia. InMarch 2016, we announced an agreement with SIM TELECOM tolaunch Russia’s first expatriate MVNO customer solution.
Mobile Bundles. Tiered data-plans provide smartphone customers with data, voice and SMS packages. In2016, we focused on a new simplified tariff portfolio with competitive prices in combination with transparentservices. In addition to Shared Data Services and Shared Everything Bundle Service, offering the option ofmultiple SIM cards for one account, in 2016 we launched the FMC proposal “All in one” for B2C prepaidsubscribers combining FTTB internet and IPTV mobile services into one bundle.
Distribution.
Our primary sales channels in Russia consist of monobrand, multibrand and national partners. Monobrandchannels constituted 18% of the channel mix as of December 31, 2016. The number of owned retail monobrandstores was 1,499 as of December 31, 2016, as compared to 1,455 owned retail monobrand stores as ofDecember 31, 2015.
In the second quarter of 2016, we stopped the closure of certain franchise stores, which were due to close asa result of the difficult economic situation in Russia. In addition, a new franchise model was developed andlaunched. The “Plug&Play” franchise model represents a fully packaged solution, with a store opening processmanaged by PJSC VimpelCom.
As of December 31, 2016, the number of franchise stores was 2,069, compared to 2,044 as of December 31,2015. As of December 31, 2016, we had 144 “Know How” stores, and 56 “Know How” stores in a new format ofmultibrand stores with regional dealers, compared to 117 “Know How” stores and 34 stores in a new format ofmultibrand stores as of December 31, 2015.
Additionally, in 2016, we reached an agreement with Svyaznoy, a national mobile retailer, focused on thedistribution of complex products, such as tariff packages and fixed and mobile convergence. B2B agents wereshifted to the B2C segment, creating a separate multibrand channel along with regional dealers and alternativeretail. We also increased the number of regional dealers to manage this channel. Sales of tariff packagesincreased for all channels by 4%, reaching 11% in the sales mix.
We also reevaluated trade conditions in all channels in order to stimulate high quality sales in the B2Csegment. Fixed salaries were shifted to trade commission arrangements, to motivate partners and salespeoplethrough increased revenue-sharing. Additionally, we launched the “Need for sales 2.0” program, aimed atstimulating upsell (based on the value-based index).
52
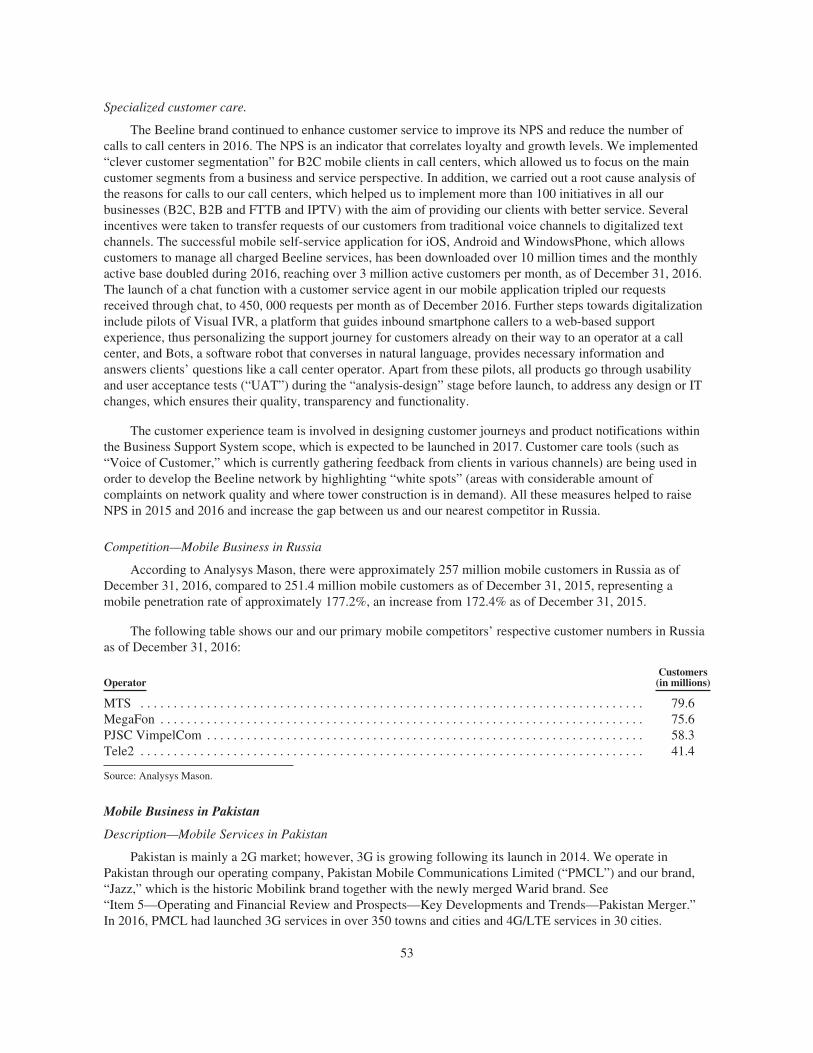
Specialized customer care.
The Beeline brand continued to enhance customer service to improve its NPS and reduce the number ofcalls to call centers in 2016. The NPS is an indicator that correlates loyalty and growth levels. We implemented“clever customer segmentation” for B2C mobile clients in call centers, which allowed us to focus on the maincustomer segments from a business and service perspective. In addition, we carried out a root cause analysis ofthe reasons for calls to our call centers, which helped us to implement more than 100 initiatives in all ourbusinesses (B2C, B2B and FTTB and IPTV) with the aim of providing our clients with better service. Severalincentives were taken to transfer requests of our customers from traditional voice channels to digitalized textchannels. The successful mobile self-service application for iOS, Android and WindowsPhone, which allowscustomers to manage all charged Beeline services, has been downloaded over 10 million times and the monthlyactive base doubled during 2016, reaching over 3 million active customers per month, as of December 31, 2016.The launch of a chat function with a customer service agent in our mobile application tripled our requestsreceived through chat, to 450, 000 requests per month as of December 2016. Further steps towards digitalizationinclude pilots of Visual IVR, a platform that guides inbound smartphone callers to a web-based supportexperience, thus personalizing the support journey for customers already on their way to an operator at a callcenter, and Bots, a software robot that converses in natural language, provides necessary information andanswers clients’ questions like a call center operator. Apart from these pilots, all products go through usabilityand user acceptance tests (“UAT”) during the “analysis-design” stage before launch, to address any design or ITchanges, which ensures their quality, transparency and functionality.
The customer experience team is involved in designing customer journeys and product notifications withinthe Business Support System scope, which is expected to be launched in 2017. Customer care tools (such as“Voice of Customer,” which is currently gathering feedback from clients in various channels) are being used inorder to develop the Beeline network by highlighting “white spots” (areas with considerable amount ofcomplaints on network quality and where tower construction is in demand). All these measures helped to raiseNPS in 2015 and 2016 and increase the gap between us and our nearest competitor in Russia.
Competition—Mobile Business in Russia
According to Analysys Mason, there were approximately 257 million mobile customers in Russia as ofDecember 31, 2016, compared to 251.4 million mobile customers as of December 31, 2015, representing amobile penetration rate of approximately 177.2%, an increase from 172.4% as of December 31, 2015.
The following table shows our and our primary mobile competitors’ respective customer numbers in Russiaas of December 31, 2016:
OperatorCustomers
(in millions)
MTS . . . . . . . . . . . . . . . . . . . . . . . . . . . . . . . . . . . . . . . . . . . . . . . . . . . . . . . . . . . . . . . . . . . . . . . . . . . . 79.6MegaFon . . . . . . . . . . . . . . . . . . . . . . . . . . . . . . . . . . . . . . . . . . . . . . . . . . . . . . . . . . . . . . . . . . . . . . . . . 75.6PJSC VimpelCom . . . . . . . . . . . . . . . . . . . . . . . . . . . . . . . . . . . . . . . . . . . . . . . . . . . . . . . . . . . . . . . . . . 58.3Tele2 . . . . . . . . . . . . . . . . . . . . . . . . . . . . . . . . . . . . . . . . . . . . . . . . . . . . . . . . . . . . . . . . . . . . . . . . . . . . 41.4
Source: Analysys Mason.
Mobile Business in Pakistan
Description—Mobile Services in Pakistan
Pakistan is mainly a 2G market; however, 3G is growing following its launch in 2014. We operate inPakistan through our operating company, Pakistan Mobile Communications Limited (“PMCL”) and our brand,“Jazz,” which is the historic Mobilink brand together with the newly merged Warid brand. See“Item 5—Operating and Financial Review and Prospects—Key Developments and Trends—Pakistan Merger.”In 2016, PMCL had launched 3G services in over 350 towns and cities and 4G/LTE services in 30 cities.
53
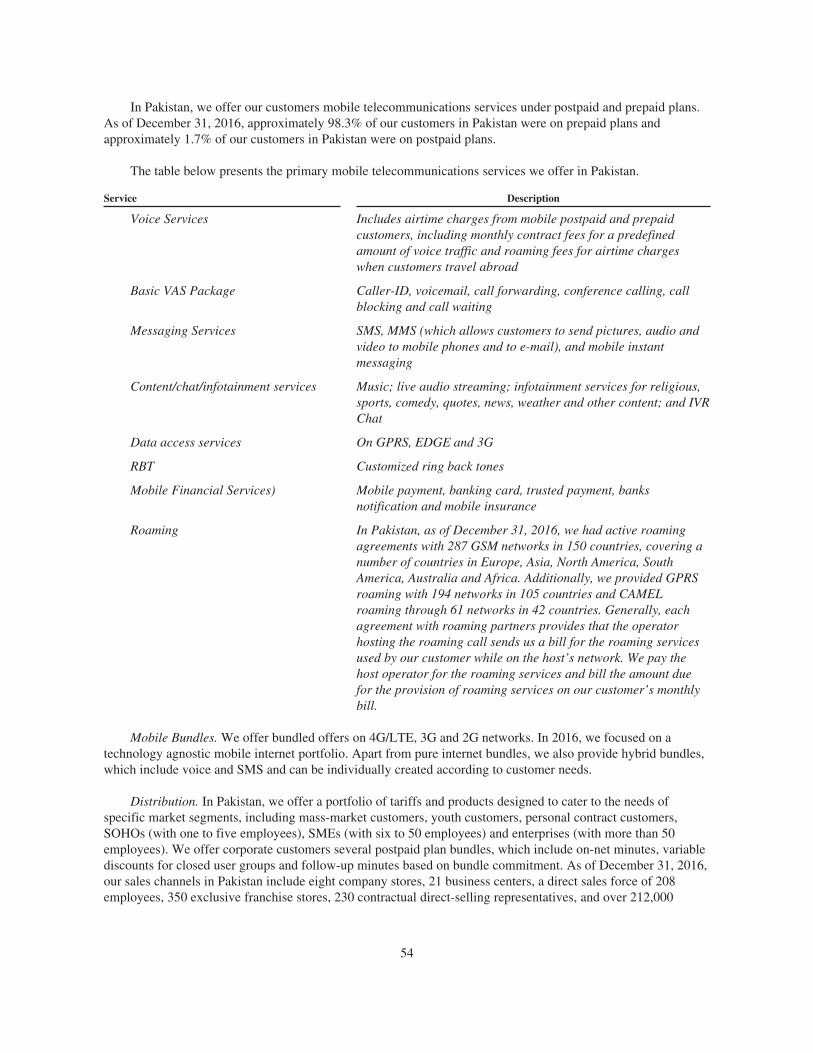
In Pakistan, we offer our customers mobile telecommunications services under postpaid and prepaid plans.As of December 31, 2016, approximately 98.3% of our customers in Pakistan were on prepaid plans andapproximately 1.7% of our customers in Pakistan were on postpaid plans.
The table below presents the primary mobile telecommunications services we offer in Pakistan.
Service Description
Voice Services Includes airtime charges from mobile postpaid and prepaidcustomers, including monthly contract fees for a predefinedamount of voice traffic and roaming fees for airtime chargeswhen customers travel abroad
Basic VAS Package Caller-ID, voicemail, call forwarding, conference calling, callblocking and call waiting
Messaging Services SMS, MMS (which allows customers to send pictures, audio andvideo to mobile phones and to e-mail), and mobile instantmessaging
Content/chat/infotainment services Music; live audio streaming; infotainment services for religious,sports, comedy, quotes, news, weather and other content; and IVRChat
Data access services On GPRS, EDGE and 3G
RBT Customized ring back tones
Mobile Financial Services) Mobile payment, banking card, trusted payment, banksnotification and mobile insurance
Roaming In Pakistan, as of December 31, 2016, we had active roamingagreements with 287 GSM networks in 150 countries, covering anumber of countries in Europe, Asia, North America, SouthAmerica, Australia and Africa. Additionally, we provided GPRSroaming with 194 networks in 105 countries and CAMELroaming through 61 networks in 42 countries. Generally, eachagreement with roaming partners provides that the operatorhosting the roaming call sends us a bill for the roaming servicesused by our customer while on the host’s network. We pay thehost operator for the roaming services and bill the amount duefor the provision of roaming services on our customer’s monthlybill.
Mobile Bundles. We offer bundled offers on 4G/LTE, 3G and 2G networks. In 2016, we focused on atechnology agnostic mobile internet portfolio. Apart from pure internet bundles, we also provide hybrid bundles,which include voice and SMS and can be individually created according to customer needs.
Distribution. In Pakistan, we offer a portfolio of tariffs and products designed to cater to the needs ofspecific market segments, including mass-market customers, youth customers, personal contract customers,SOHOs (with one to five employees), SMEs (with six to 50 employees) and enterprises (with more than 50employees). We offer corporate customers several postpaid plan bundles, which include on-net minutes, variablediscounts for closed user groups and follow-up minutes based on bundle commitment. As of December 31, 2016,our sales channels in Pakistan include eight company stores, 21 business centers, a direct sales force of 208employees, 350 exclusive franchise stores, 230 contractual direct-selling representatives, and over 212,000
54
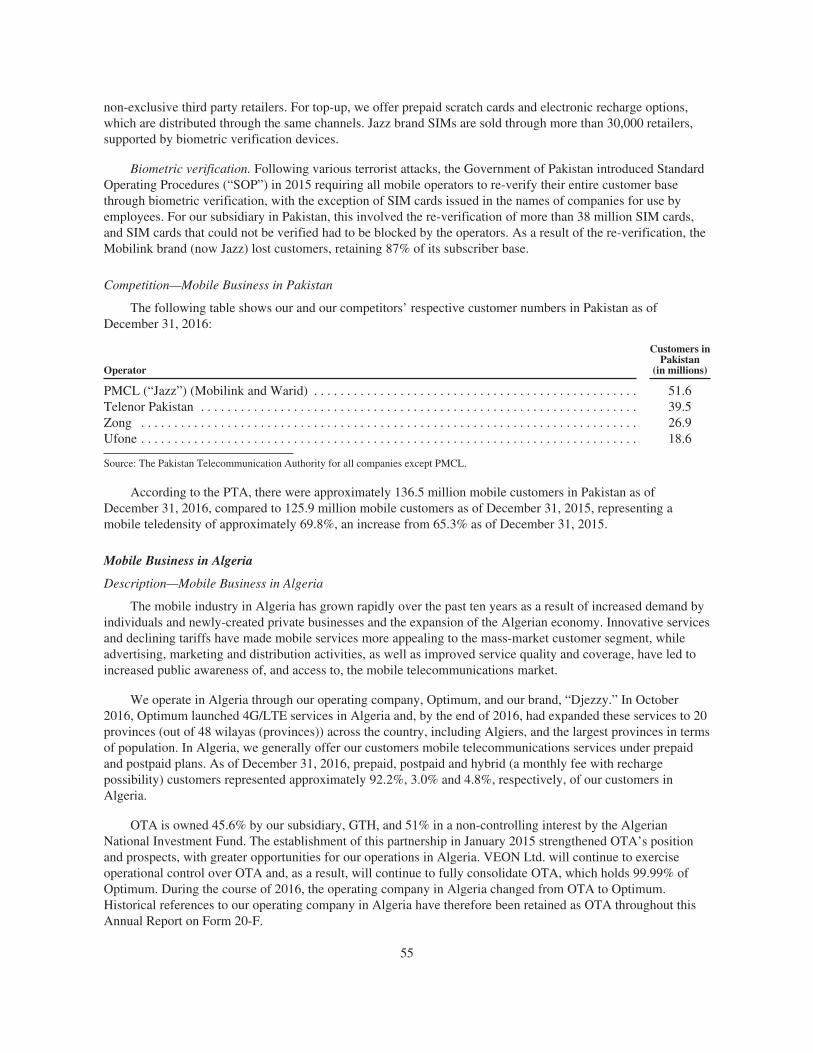
non-exclusive third party retailers. For top-up, we offer prepaid scratch cards and electronic recharge options,which are distributed through the same channels. Jazz brand SIMs are sold through more than 30,000 retailers,supported by biometric verification devices.
Biometric verification. Following various terrorist attacks, the Government of Pakistan introduced StandardOperating Procedures (“SOP”) in 2015 requiring all mobile operators to re-verify their entire customer basethrough biometric verification, with the exception of SIM cards issued in the names of companies for use byemployees. For our subsidiary in Pakistan, this involved the re-verification of more than 38 million SIM cards,and SIM cards that could not be verified had to be blocked by the operators. As a result of the re-verification, theMobilink brand (now Jazz) lost customers, retaining 87% of its subscriber base.
Competition—Mobile Business in Pakistan
The following table shows our and our competitors’ respective customer numbers in Pakistan as ofDecember 31, 2016:
Operator
Customers inPakistan
(in millions)
PMCL (“Jazz”) (Mobilink and Warid) . . . . . . . . . . . . . . . . . . . . . . . . . . . . . . . . . . . . . . . . . . . . . . . . . 51.6Telenor Pakistan . . . . . . . . . . . . . . . . . . . . . . . . . . . . . . . . . . . . . . . . . . . . . . . . . . . . . . . . . . . . . . . . . . 39.5Zong . . . . . . . . . . . . . . . . . . . . . . . . . . . . . . . . . . . . . . . . . . . . . . . . . . . . . . . . . . . . . . . . . . . . . . . . . . . 26.9Ufone . . . . . . . . . . . . . . . . . . . . . . . . . . . . . . . . . . . . . . . . . . . . . . . . . . . . . . . . . . . . . . . . . . . . . . . . . . . 18.6
Source: The Pakistan Telecommunication Authority for all companies except PMCL.
According to the PTA, there were approximately 136.5 million mobile customers in Pakistan as ofDecember 31, 2016, compared to 125.9 million mobile customers as of December 31, 2015, representing amobile teledensity of approximately 69.8%, an increase from 65.3% as of December 31, 2015.
Mobile Business in Algeria
Description—Mobile Business in Algeria
The mobile industry in Algeria has grown rapidly over the past ten years as a result of increased demand byindividuals and newly-created private businesses and the expansion of the Algerian economy. Innovative servicesand declining tariffs have made mobile services more appealing to the mass-market customer segment, whileadvertising, marketing and distribution activities, as well as improved service quality and coverage, have led toincreased public awareness of, and access to, the mobile telecommunications market.
We operate in Algeria through our operating company, Optimum, and our brand, “Djezzy.” In October2016, Optimum launched 4G/LTE services in Algeria and, by the end of 2016, had expanded these services to 20provinces (out of 48 wilayas (provinces)) across the country, including Algiers, and the largest provinces in termsof population. In Algeria, we generally offer our customers mobile telecommunications services under prepaidand postpaid plans. As of December 31, 2016, prepaid, postpaid and hybrid (a monthly fee with rechargepossibility) customers represented approximately 92.2%, 3.0% and 4.8%, respectively, of our customers inAlgeria.
OTA is owned 45.6% by our subsidiary, GTH, and 51% in a non-controlling interest by the AlgerianNational Investment Fund. The establishment of this partnership in January 2015 strengthened OTA’s positionand prospects, with greater opportunities for our operations in Algeria. VEON Ltd. will continue to exerciseoperational control over OTA and, as a result, will continue to fully consolidate OTA, which holds 99.99% ofOptimum. During the course of 2016, the operating company in Algeria changed from OTA to Optimum.Historical references to our operating company in Algeria have therefore been retained as OTA throughout thisAnnual Report on Form 20-F.
55
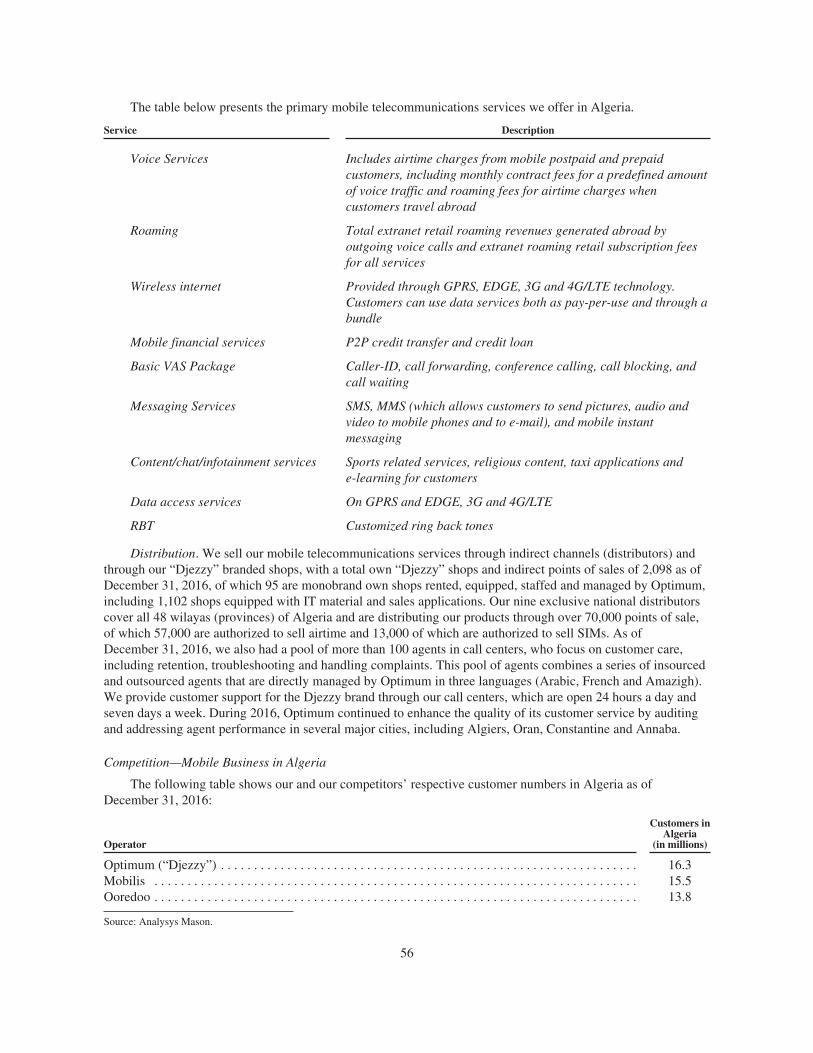
The table below presents the primary mobile telecommunications services we offer in Algeria.
Service Description
Voice Services Includes airtime charges from mobile postpaid and prepaidcustomers, including monthly contract fees for a predefined amountof voice traffic and roaming fees for airtime charges whencustomers travel abroad
Roaming Total extranet retail roaming revenues generated abroad byoutgoing voice calls and extranet roaming retail subscription feesfor all services
Wireless internet Provided through GPRS, EDGE, 3G and 4G/LTE technology.Customers can use data services both as pay-per-use and through abundle
Mobile financial services P2P credit transfer and credit loan
Basic VAS Package Caller-ID, call forwarding, conference calling, call blocking, andcall waiting
Messaging Services SMS, MMS (which allows customers to send pictures, audio andvideo to mobile phones and to e-mail), and mobile instantmessaging
Content/chat/infotainment services Sports related services, religious content, taxi applications ande-learning for customers
Data access services On GPRS and EDGE, 3G and 4G/LTE
RBT Customized ring back tones
Distribution. We sell our mobile telecommunications services through indirect channels (distributors) andthrough our “Djezzy” branded shops, with a total own “Djezzy” shops and indirect points of sales of 2,098 as ofDecember 31, 2016, of which 95 are monobrand own shops rented, equipped, staffed and managed by Optimum,including 1,102 shops equipped with IT material and sales applications. Our nine exclusive national distributorscover all 48 wilayas (provinces) of Algeria and are distributing our products through over 70,000 points of sale,of which 57,000 are authorized to sell airtime and 13,000 of which are authorized to sell SIMs. As ofDecember 31, 2016, we also had a pool of more than 100 agents in call centers, who focus on customer care,including retention, troubleshooting and handling complaints. This pool of agents combines a series of insourcedand outsourced agents that are directly managed by Optimum in three languages (Arabic, French and Amazigh).We provide customer support for the Djezzy brand through our call centers, which are open 24 hours a day andseven days a week. During 2016, Optimum continued to enhance the quality of its customer service by auditingand addressing agent performance in several major cities, including Algiers, Oran, Constantine and Annaba.
Competition—Mobile Business in Algeria
The following table shows our and our competitors’ respective customer numbers in Algeria as ofDecember 31, 2016:
Operator
Customers inAlgeria
(in millions)
Optimum (“Djezzy”) . . . . . . . . . . . . . . . . . . . . . . . . . . . . . . . . . . . . . . . . . . . . . . . . . . . . . . . . . . . . . . . 16.3Mobilis . . . . . . . . . . . . . . . . . . . . . . . . . . . . . . . . . . . . . . . . . . . . . . . . . . . . . . . . . . . . . . . . . . . . . . . . . 15.5Ooredoo . . . . . . . . . . . . . . . . . . . . . . . . . . . . . . . . . . . . . . . . . . . . . . . . . . . . . . . . . . . . . . . . . . . . . . . . . 13.8
Source: Analysys Mason.
56
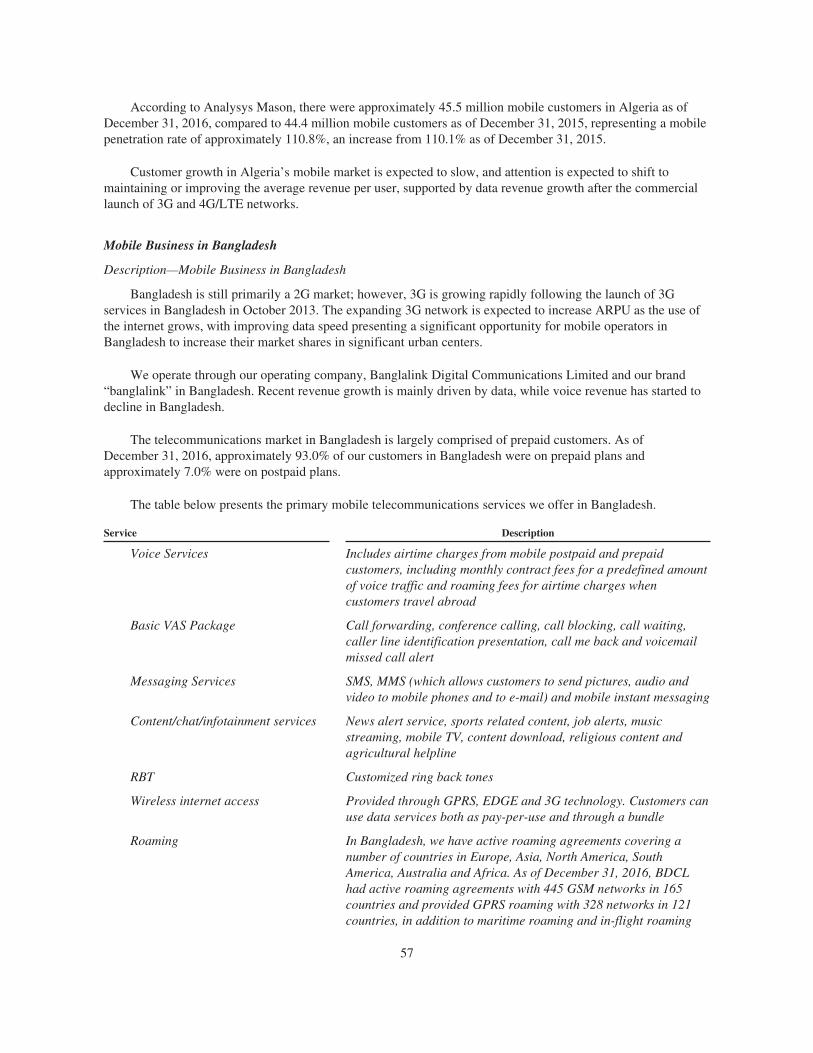
According to Analysys Mason, there were approximately 45.5 million mobile customers in Algeria as ofDecember 31, 2016, compared to 44.4 million mobile customers as of December 31, 2015, representing a mobilepenetration rate of approximately 110.8%, an increase from 110.1% as of December 31, 2015.
Customer growth in Algeria’s mobile market is expected to slow, and attention is expected to shift tomaintaining or improving the average revenue per user, supported by data revenue growth after the commerciallaunch of 3G and 4G/LTE networks.
Mobile Business in Bangladesh
Description—Mobile Business in Bangladesh
Bangladesh is still primarily a 2G market; however, 3G is growing rapidly following the launch of 3Gservices in Bangladesh in October 2013. The expanding 3G network is expected to increase ARPU as the use ofthe internet grows, with improving data speed presenting a significant opportunity for mobile operators inBangladesh to increase their market shares in significant urban centers.
We operate through our operating company, Banglalink Digital Communications Limited and our brand“banglalink” in Bangladesh. Recent revenue growth is mainly driven by data, while voice revenue has started todecline in Bangladesh.
The telecommunications market in Bangladesh is largely comprised of prepaid customers. As ofDecember 31, 2016, approximately 93.0% of our customers in Bangladesh were on prepaid plans andapproximately 7.0% were on postpaid plans.
The table below presents the primary mobile telecommunications services we offer in Bangladesh.
Service Description
Voice Services Includes airtime charges from mobile postpaid and prepaidcustomers, including monthly contract fees for a predefined amountof voice traffic and roaming fees for airtime charges whencustomers travel abroad
Basic VAS Package Call forwarding, conference calling, call blocking, call waiting,caller line identification presentation, call me back and voicemailmissed call alert
Messaging Services SMS, MMS (which allows customers to send pictures, audio andvideo to mobile phones and to e-mail) and mobile instant messaging
Content/chat/infotainment services News alert service, sports related content, job alerts, musicstreaming, mobile TV, content download, religious content andagricultural helpline
RBT Customized ring back tones
Wireless internet access Provided through GPRS, EDGE and 3G technology. Customers canuse data services both as pay-per-use and through a bundle
Roaming In Bangladesh, we have active roaming agreements covering anumber of countries in Europe, Asia, North America, SouthAmerica, Australia and Africa. As of December 31, 2016, BDCLhad active roaming agreements with 445 GSM networks in 165countries and provided GPRS roaming with 328 networks in 121countries, in addition to maritime roaming and in-flight roaming
57
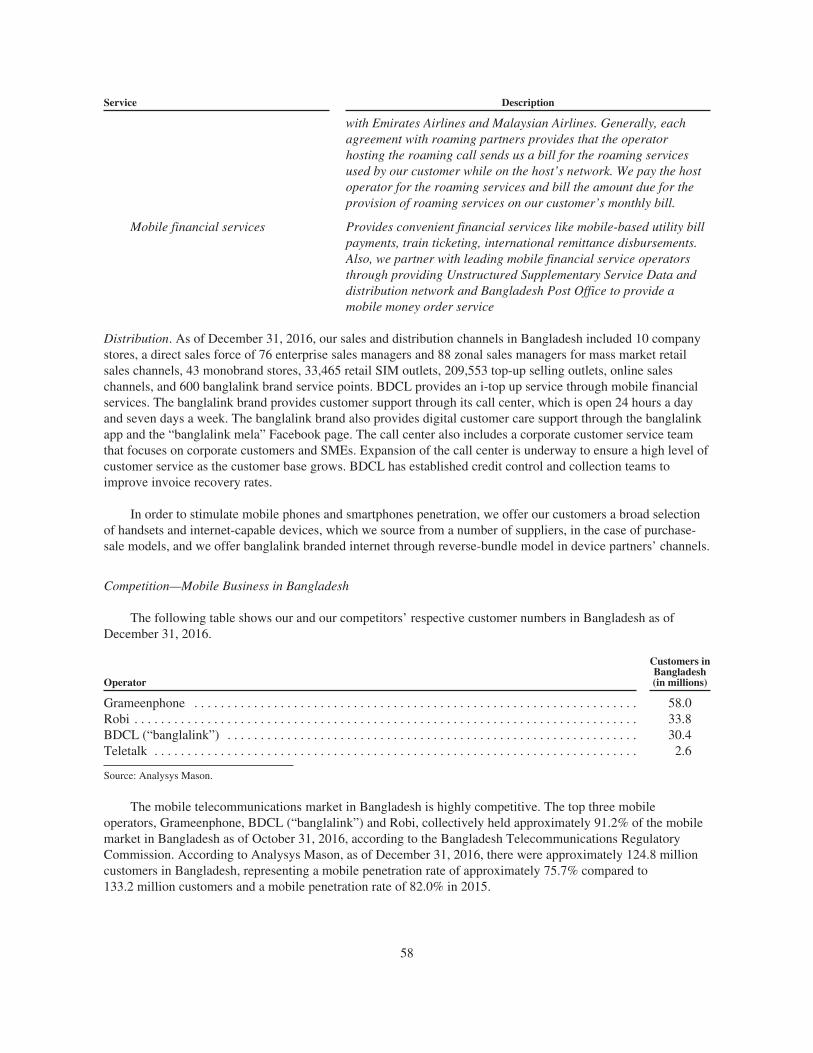
Service Description
with Emirates Airlines and Malaysian Airlines. Generally, eachagreement with roaming partners provides that the operatorhosting the roaming call sends us a bill for the roaming servicesused by our customer while on the host’s network. We pay the hostoperator for the roaming services and bill the amount due for theprovision of roaming services on our customer’s monthly bill.
Mobile financial services Provides convenient financial services like mobile-based utility billpayments, train ticketing, international remittance disbursements.Also, we partner with leading mobile financial service operatorsthrough providing Unstructured Supplementary Service Data anddistribution network and Bangladesh Post Office to provide amobile money order service
Distribution. As of December 31, 2016, our sales and distribution channels in Bangladesh included 10 companystores, a direct sales force of 76 enterprise sales managers and 88 zonal sales managers for mass market retailsales channels, 43 monobrand stores, 33,465 retail SIM outlets, 209,553 top-up selling outlets, online saleschannels, and 600 banglalink brand service points. BDCL provides an i-top up service through mobile financialservices. The banglalink brand provides customer support through its call center, which is open 24 hours a dayand seven days a week. The banglalink brand also provides digital customer care support through the banglalinkapp and the “banglalink mela” Facebook page. The call center also includes a corporate customer service teamthat focuses on corporate customers and SMEs. Expansion of the call center is underway to ensure a high level ofcustomer service as the customer base grows. BDCL has established credit control and collection teams toimprove invoice recovery rates.
In order to stimulate mobile phones and smartphones penetration, we offer our customers a broad selectionof handsets and internet-capable devices, which we source from a number of suppliers, in the case of purchase-sale models, and we offer banglalink branded internet through reverse-bundle model in device partners’ channels.
Competition—Mobile Business in Bangladesh
The following table shows our and our competitors’ respective customer numbers in Bangladesh as ofDecember 31, 2016.
Operator
Customers inBangladesh(in millions)
Grameenphone . . . . . . . . . . . . . . . . . . . . . . . . . . . . . . . . . . . . . . . . . . . . . . . . . . . . . . . . . . . . . . . . . . . 58.0Robi . . . . . . . . . . . . . . . . . . . . . . . . . . . . . . . . . . . . . . . . . . . . . . . . . . . . . . . . . . . . . . . . . . . . . . . . . . . . 33.8BDCL (“banglalink”) . . . . . . . . . . . . . . . . . . . . . . . . . . . . . . . . . . . . . . . . . . . . . . . . . . . . . . . . . . . . . . 30.4Teletalk . . . . . . . . . . . . . . . . . . . . . . . . . . . . . . . . . . . . . . . . . . . . . . . . . . . . . . . . . . . . . . . . . . . . . . . . . 2.6
Source: Analysys Mason.
The mobile telecommunications market in Bangladesh is highly competitive. The top three mobileoperators, Grameenphone, BDCL (“banglalink”) and Robi, collectively held approximately 91.2% of the mobilemarket in Bangladesh as of October 31, 2016, according to the Bangladesh Telecommunications RegulatoryCommission. According to Analysys Mason, as of December 31, 2016, there were approximately 124.8 millioncustomers in Bangladesh, representing a mobile penetration rate of approximately 75.7% compared to133.2 million customers and a mobile penetration rate of 82.0% in 2015.
58
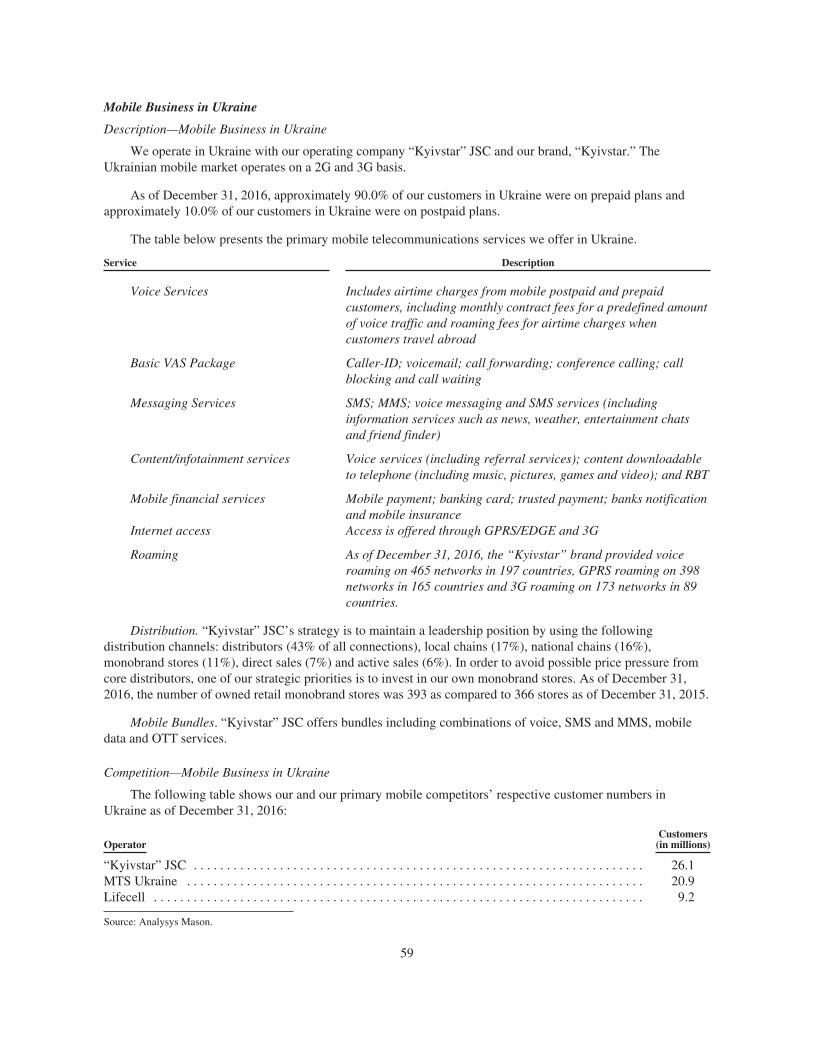
Mobile Business in Ukraine
Description—Mobile Business in Ukraine
We operate in Ukraine with our operating company “Kyivstar” JSC and our brand, “Kyivstar.” TheUkrainian mobile market operates on a 2G and 3G basis.
As of December 31, 2016, approximately 90.0% of our customers in Ukraine were on prepaid plans andapproximately 10.0% of our customers in Ukraine were on postpaid plans.
The table below presents the primary mobile telecommunications services we offer in Ukraine.
Service Description
Voice Services Includes airtime charges from mobile postpaid and prepaidcustomers, including monthly contract fees for a predefined amountof voice traffic and roaming fees for airtime charges whencustomers travel abroad
Basic VAS Package Caller-ID; voicemail; call forwarding; conference calling; callblocking and call waiting
Messaging Services SMS; MMS; voice messaging and SMS services (includinginformation services such as news, weather, entertainment chatsand friend finder)
Content/infotainment services Voice services (including referral services); content downloadableto telephone (including music, pictures, games and video); and RBT
Mobile financial services Mobile payment; banking card; trusted payment; banks notificationand mobile insurance
Internet access Access is offered through GPRS/EDGE and 3G
Roaming As of December 31, 2016, the “Kyivstar” brand provided voiceroaming on 465 networks in 197 countries, GPRS roaming on 398networks in 165 countries and 3G roaming on 173 networks in 89countries.
Distribution. “Kyivstar” JSC’s strategy is to maintain a leadership position by using the followingdistribution channels: distributors (43% of all connections), local chains (17%), national chains (16%),monobrand stores (11%), direct sales (7%) and active sales (6%). In order to avoid possible price pressure fromcore distributors, one of our strategic priorities is to invest in our own monobrand stores. As of December 31,2016, the number of owned retail monobrand stores was 393 as compared to 366 stores as of December 31, 2015.
Mobile Bundles. “Kyivstar” JSC offers bundles including combinations of voice, SMS and MMS, mobiledata and OTT services.
Competition—Mobile Business in Ukraine
The following table shows our and our primary mobile competitors’ respective customer numbers inUkraine as of December 31, 2016:
OperatorCustomers
(in millions)
“Kyivstar” JSC . . . . . . . . . . . . . . . . . . . . . . . . . . . . . . . . . . . . . . . . . . . . . . . . . . . . . . . . . . . . . . . . . . . . 26.1MTS Ukraine . . . . . . . . . . . . . . . . . . . . . . . . . . . . . . . . . . . . . . . . . . . . . . . . . . . . . . . . . . . . . . . . . . . . . 20.9Lifecell . . . . . . . . . . . . . . . . . . . . . . . . . . . . . . . . . . . . . . . . . . . . . . . . . . . . . . . . . . . . . . . . . . . . . . . . . . 9.2
Source: Analysys Mason.
59
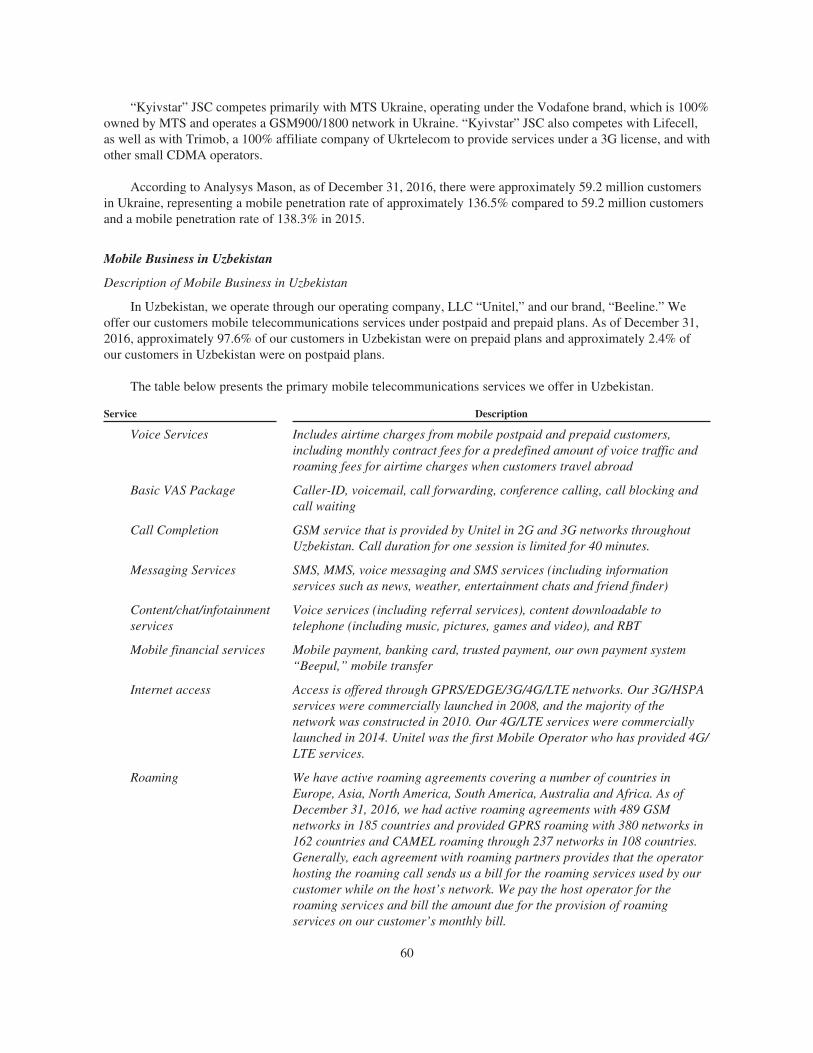
“Kyivstar” JSC competes primarily with MTS Ukraine, operating under the Vodafone brand, which is 100%owned by MTS and operates a GSM900/1800 network in Ukraine. “Kyivstar” JSC also competes with Lifecell,as well as with Trimob, a 100% affiliate company of Ukrtelecom to provide services under a 3G license, and withother small CDMA operators.
According to Analysys Mason, as of December 31, 2016, there were approximately 59.2 million customersin Ukraine, representing a mobile penetration rate of approximately 136.5% compared to 59.2 million customersand a mobile penetration rate of 138.3% in 2015.
Mobile Business in Uzbekistan
Description of Mobile Business in Uzbekistan
In Uzbekistan, we operate through our operating company, LLC “Unitel,” and our brand, “Beeline.” Weoffer our customers mobile telecommunications services under postpaid and prepaid plans. As of December 31,2016, approximately 97.6% of our customers in Uzbekistan were on prepaid plans and approximately 2.4% ofour customers in Uzbekistan were on postpaid plans.
The table below presents the primary mobile telecommunications services we offer in Uzbekistan.
Service Description
Voice Services Includes airtime charges from mobile postpaid and prepaid customers,including monthly contract fees for a predefined amount of voice traffic androaming fees for airtime charges when customers travel abroad
Basic VAS Package Caller-ID, voicemail, call forwarding, conference calling, call blocking andcall waiting
Call Completion GSM service that is provided by Unitel in 2G and 3G networks throughoutUzbekistan. Call duration for one session is limited for 40 minutes.
Messaging Services SMS, MMS, voice messaging and SMS services (including informationservices such as news, weather, entertainment chats and friend finder)
Content/chat/infotainmentservices
Voice services (including referral services), content downloadable totelephone (including music, pictures, games and video), and RBT
Mobile financial services Mobile payment, banking card, trusted payment, our own payment system“Beepul,” mobile transfer
Internet access Access is offered through GPRS/EDGE/3G/4G/LTE networks. Our 3G/HSPAservices were commercially launched in 2008, and the majority of thenetwork was constructed in 2010. Our 4G/LTE services were commerciallylaunched in 2014. Unitel was the first Mobile Operator who has provided 4G/LTE services.
Roaming We have active roaming agreements covering a number of countries inEurope, Asia, North America, South America, Australia and Africa. As ofDecember 31, 2016, we had active roaming agreements with 489 GSMnetworks in 185 countries and provided GPRS roaming with 380 networks in162 countries and CAMEL roaming through 237 networks in 108 countries.Generally, each agreement with roaming partners provides that the operatorhosting the roaming call sends us a bill for the roaming services used by ourcustomer while on the host’s network. We pay the host operator for theroaming services and bill the amount due for the provision of roamingservices on our customer’s monthly bill.
60
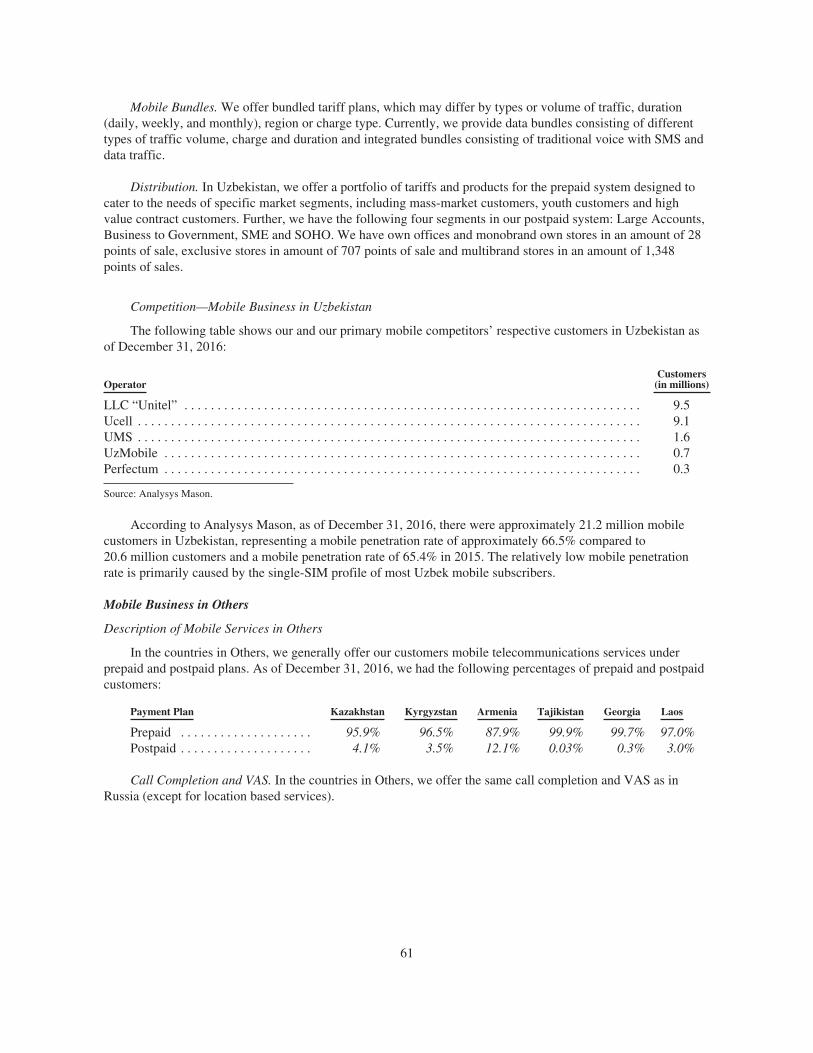
Mobile Bundles. We offer bundled tariff plans, which may differ by types or volume of traffic, duration(daily, weekly, and monthly), region or charge type. Currently, we provide data bundles consisting of differenttypes of traffic volume, charge and duration and integrated bundles consisting of traditional voice with SMS anddata traffic.
Distribution. In Uzbekistan, we offer a portfolio of tariffs and products for the prepaid system designed tocater to the needs of specific market segments, including mass-market customers, youth customers and highvalue contract customers. Further, we have the following four segments in our postpaid system: Large Accounts,Business to Government, SME and SOHO. We have own offices and monobrand own stores in an amount of 28points of sale, exclusive stores in amount of 707 points of sale and multibrand stores in an amount of 1,348points of sales.
Competition—Mobile Business in Uzbekistan
The following table shows our and our primary mobile competitors’ respective customers in Uzbekistan asof December 31, 2016:
OperatorCustomers
(in millions)
LLC “Unitel” . . . . . . . . . . . . . . . . . . . . . . . . . . . . . . . . . . . . . . . . . . . . . . . . . . . . . . . . . . . . . . . . . . . . . 9.5Ucell . . . . . . . . . . . . . . . . . . . . . . . . . . . . . . . . . . . . . . . . . . . . . . . . . . . . . . . . . . . . . . . . . . . . . . . . . . . . 9.1UMS . . . . . . . . . . . . . . . . . . . . . . . . . . . . . . . . . . . . . . . . . . . . . . . . . . . . . . . . . . . . . . . . . . . . . . . . . . . . 1.6UzMobile . . . . . . . . . . . . . . . . . . . . . . . . . . . . . . . . . . . . . . . . . . . . . . . . . . . . . . . . . . . . . . . . . . . . . . . . 0.7Perfectum . . . . . . . . . . . . . . . . . . . . . . . . . . . . . . . . . . . . . . . . . . . . . . . . . . . . . . . . . . . . . . . . . . . . . . . . 0.3
Source: Analysys Mason.
According to Analysys Mason, as of December 31, 2016, there were approximately 21.2 million mobilecustomers in Uzbekistan, representing a mobile penetration rate of approximately 66.5% compared to20.6 million customers and a mobile penetration rate of 65.4% in 2015. The relatively low mobile penetrationrate is primarily caused by the single-SIM profile of most Uzbek mobile subscribers.
Mobile Business in Others
Description of Mobile Services in Others
In the countries in Others, we generally offer our customers mobile telecommunications services underprepaid and postpaid plans. As of December 31, 2016, we had the following percentages of prepaid and postpaidcustomers:
Payment Plan Kazakhstan Kyrgyzstan Armenia Tajikistan Georgia Laos
Prepaid . . . . . . . . . . . . . . . . . . . . 95.9% 96.5% 87.9% 99.9% 99.7% 97.0%Postpaid . . . . . . . . . . . . . . . . . . . . 4.1% 3.5% 12.1% 0.03% 0.3% 3.0%
Call Completion and VAS. In the countries in Others, we offer the same call completion and VAS as inRussia (except for location based services).
61
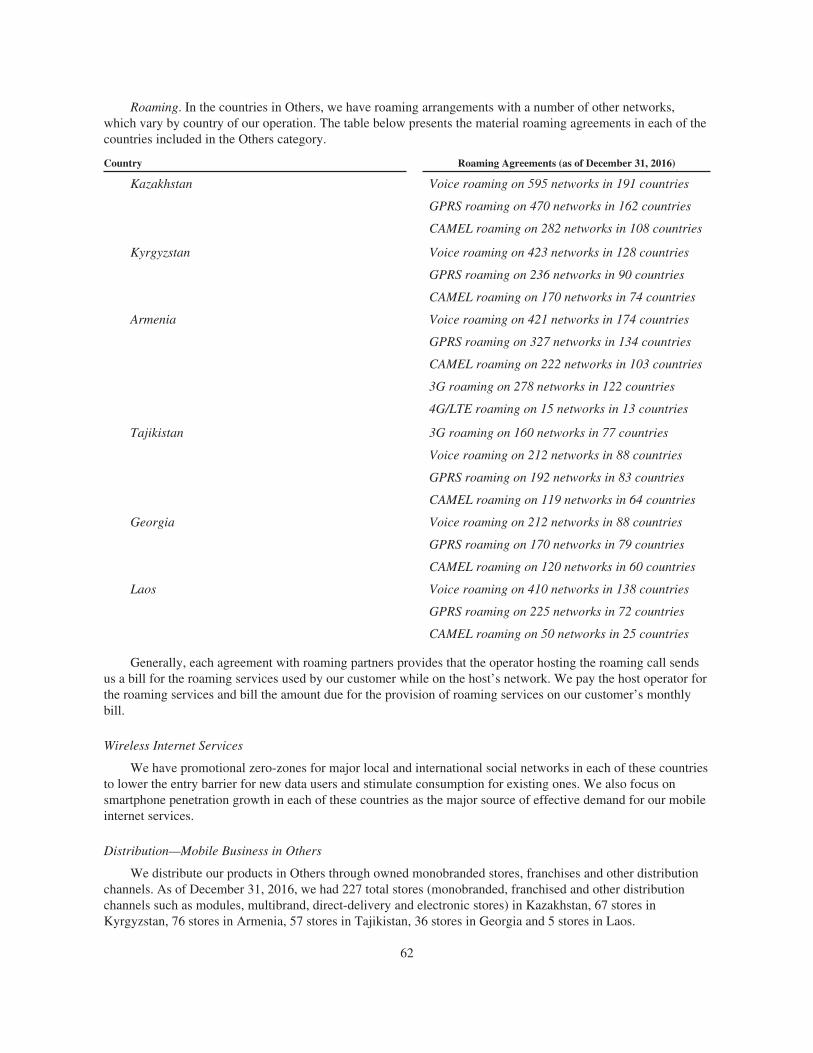
Roaming. In the countries in Others, we have roaming arrangements with a number of other networks,which vary by country of our operation. The table below presents the material roaming agreements in each of thecountries included in the Others category.
Country Roaming Agreements (as of December 31, 2016)
Kazakhstan Voice roaming on 595 networks in 191 countries
GPRS roaming on 470 networks in 162 countries
CAMEL roaming on 282 networks in 108 countries
Kyrgyzstan Voice roaming on 423 networks in 128 countries
GPRS roaming on 236 networks in 90 countries
CAMEL roaming on 170 networks in 74 countries
Armenia Voice roaming on 421 networks in 174 countries
GPRS roaming on 327 networks in 134 countries
CAMEL roaming on 222 networks in 103 countries
3G roaming on 278 networks in 122 countries
4G/LTE roaming on 15 networks in 13 countries
Tajikistan 3G roaming on 160 networks in 77 countries
Voice roaming on 212 networks in 88 countries
GPRS roaming on 192 networks in 83 countries
CAMEL roaming on 119 networks in 64 countries
Georgia Voice roaming on 212 networks in 88 countries
GPRS roaming on 170 networks in 79 countries
CAMEL roaming on 120 networks in 60 countries
Laos Voice roaming on 410 networks in 138 countries
GPRS roaming on 225 networks in 72 countries
CAMEL roaming on 50 networks in 25 countries
Generally, each agreement with roaming partners provides that the operator hosting the roaming call sendsus a bill for the roaming services used by our customer while on the host’s network. We pay the host operator forthe roaming services and bill the amount due for the provision of roaming services on our customer’s monthlybill.
Wireless Internet Services
We have promotional zero-zones for major local and international social networks in each of these countriesto lower the entry barrier for new data users and stimulate consumption for existing ones. We also focus onsmartphone penetration growth in each of these countries as the major source of effective demand for our mobileinternet services.
Distribution—Mobile Business in Others
We distribute our products in Others through owned monobranded stores, franchises and other distributionchannels. As of December 31, 2016, we had 227 total stores (monobranded, franchised and other distributionchannels such as modules, multibrand, direct-delivery and electronic stores) in Kazakhstan, 67 stores inKyrgyzstan, 76 stores in Armenia, 57 stores in Tajikistan, 36 stores in Georgia and 5 stores in Laos.
62
Competition—Mobile Business in Others
Kazakhstan
According to Analysys Mason, as of December 31, 2016, there were approximately 25.6 million customersin Kazakhstan, representing a mobile penetration rate of approximately 143.0%, compared to 25.9 millioncustomers and a mobile penetration rate of approximately 147.1% in 2015. We held the second position in themarket in 2016, according to Analysys Mason.
Kyrgyzstan
According to Analysys Mason, as of December 31, 2016, there were approximately 7.8 million customers inKyrgyzstan, representing a mobile penetration rate of approximately 134.5%, compared to 7.6 million customersand a mobile penetration rate of approximately 132.7% in 2015. We held the second position in the market in2016, according to Analysys Mason.
Armenia
According to Analysys Mason, as of December 31, 2016, there were approximately 3.6 million customers inArmenia, representing a mobile penetration rate of approximately 119.4%, compared to 3.6 million customersand a mobile penetration rate of approximately 120.0% in 2015. We held the second position in the market in2016, according to Analysys Mason.
Tajikistan
According to Analysys Mason, as of December 31, 2016, there were approximately 9.8 million customers inTajikistan, representing a mobile penetration rate of approximately 110.1%, compared to 10.5 million customersand a mobile penetration rate of approximately 120.5% in 2015. We held the fourth position in the market in2016, according to Analysys Mason.
Georgia
According to Analysys Mason, as of December 31, 2016, there were approximately 5.4 million customers inGeorgia, representing a mobile penetration rate of approximately 134.8%, compared to 5.4 million customers anda mobile penetration rate of approximately 136.1% in 2015. We held the third position in the market in 2016,according to Analysys Mason.
Laos
The Lao telecommunication market is strictly regulated by fixed price floors and limited promotion periods.The impact of these regulations has primarily been on VimpelCom Lao’s ability to offer customer-friendly pricedservices, such as promotions and discounts, in comparison to local competitors.
According to Analysys Mason, as of December 31, 2016, there were approximately 4.6 million customers inLaos, representing a mobile penetration rate of approximately 64.4%, compared to 4.7 million customers and amobile penetration rate of approximately 66.4% in 2015. We held the fourth position in the market in 2016,according to Analysys Mason.
Our Fixed-line Telecommunications and Our Fixed-line Internet Business
We offer voice, data and internet services to corporations, operators and consumers using a metropolitanoverlay network in major cities throughout Russia, Ukraine and Uzbekistan. In our fixed-line/mobile integratedbusiness structure in Russia, Ukraine and Uzbekistan, fixed-line telecommunications use inter-city fiber opticand satellite-based networks.
63
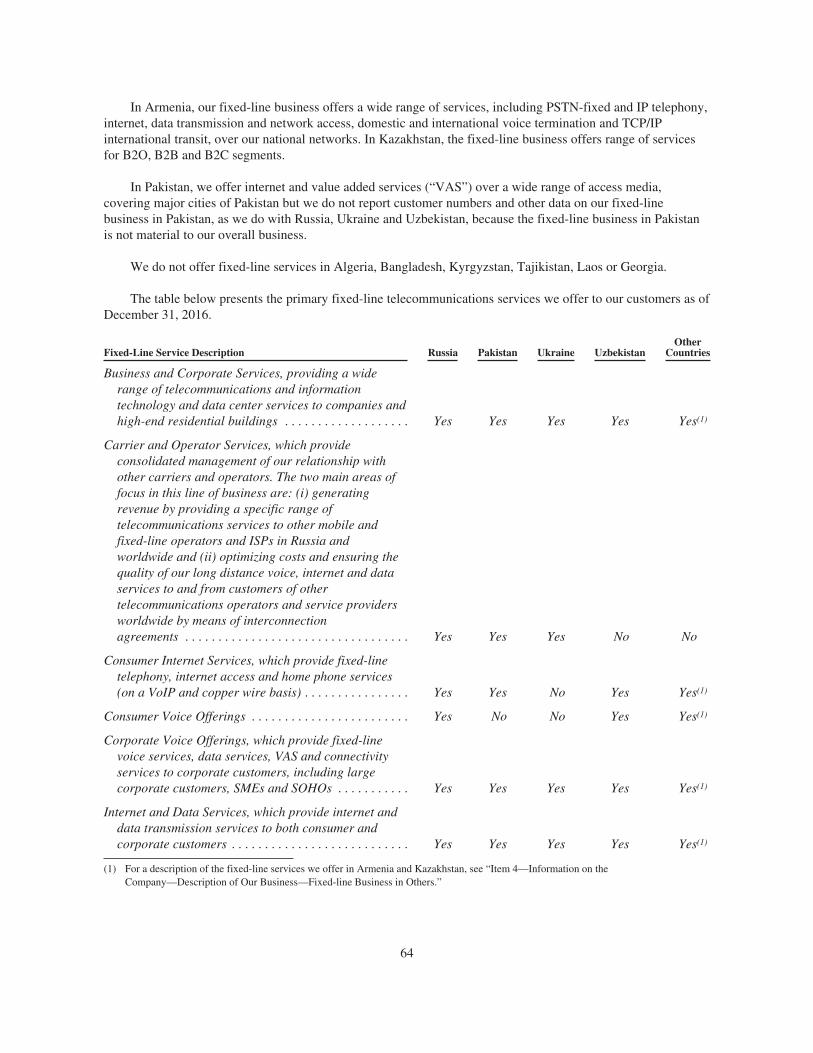
In Armenia, our fixed-line business offers a wide range of services, including PSTN-fixed and IP telephony,internet, data transmission and network access, domestic and international voice termination and TCP/IPinternational transit, over our national networks. In Kazakhstan, the fixed-line business offers range of servicesfor B2O, B2B and B2C segments.
In Pakistan, we offer internet and value added services (“VAS”) over a wide range of access media,covering major cities of Pakistan but we do not report customer numbers and other data on our fixed-linebusiness in Pakistan, as we do with Russia, Ukraine and Uzbekistan, because the fixed-line business in Pakistanis not material to our overall business.
We do not offer fixed-line services in Algeria, Bangladesh, Kyrgyzstan, Tajikistan, Laos or Georgia.
The table below presents the primary fixed-line telecommunications services we offer to our customers as ofDecember 31, 2016.
Fixed-Line Service Description Russia Pakistan Ukraine UzbekistanOther
Countries
Business and Corporate Services, providing a widerange of telecommunications and informationtechnology and data center services to companies andhigh-end residential buildings . . . . . . . . . . . . . . . . . . . Yes Yes Yes Yes Yes(1)
Carrier and Operator Services, which provideconsolidated management of our relationship withother carriers and operators. The two main areas offocus in this line of business are: (i) generatingrevenue by providing a specific range oftelecommunications services to other mobile andfixed-line operators and ISPs in Russia andworldwide and (ii) optimizing costs and ensuring thequality of our long distance voice, internet and dataservices to and from customers of othertelecommunications operators and service providersworldwide by means of interconnectionagreements . . . . . . . . . . . . . . . . . . . . . . . . . . . . . . . . . . Yes Yes Yes No No
Consumer Internet Services, which provide fixed-linetelephony, internet access and home phone services(on a VoIP and copper wire basis) . . . . . . . . . . . . . . . . Yes Yes No Yes Yes(1)
Consumer Voice Offerings . . . . . . . . . . . . . . . . . . . . . . . . Yes No No Yes Yes(1)
Corporate Voice Offerings, which provide fixed-linevoice services, data services, VAS and connectivityservices to corporate customers, including largecorporate customers, SMEs and SOHOs . . . . . . . . . . . Yes Yes Yes Yes Yes(1)
Internet and Data Services, which provide internet anddata transmission services to both consumer andcorporate customers . . . . . . . . . . . . . . . . . . . . . . . . . . . Yes Yes Yes Yes Yes(1)
(1) For a description of the fixed-line services we offer in Armenia and Kazakhstan, see “Item 4—Information on theCompany—Description of Our Business—Fixed-line Business in Others.”
64
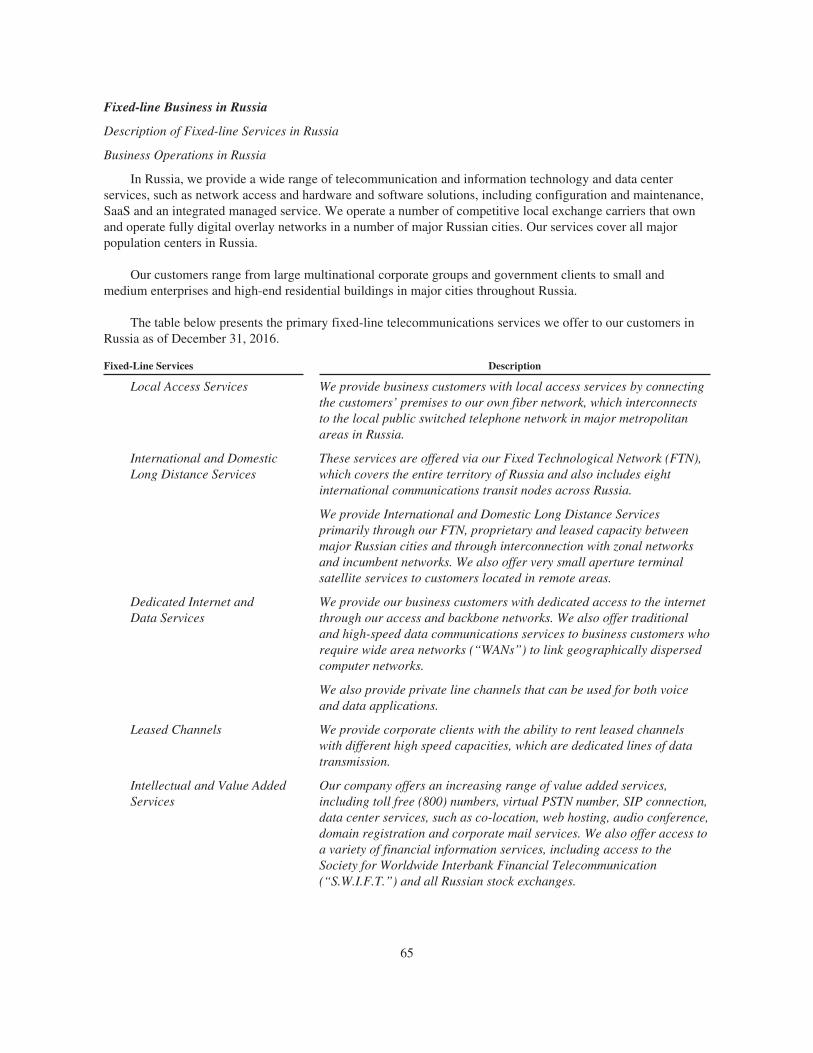
Fixed-line Business in Russia
Description of Fixed-line Services in Russia
Business Operations in Russia
In Russia, we provide a wide range of telecommunication and information technology and data centerservices, such as network access and hardware and software solutions, including configuration and maintenance,SaaS and an integrated managed service. We operate a number of competitive local exchange carriers that ownand operate fully digital overlay networks in a number of major Russian cities. Our services cover all majorpopulation centers in Russia.
Our customers range from large multinational corporate groups and government clients to small andmedium enterprises and high-end residential buildings in major cities throughout Russia.
The table below presents the primary fixed-line telecommunications services we offer to our customers inRussia as of December 31, 2016.
Fixed-Line Services Description
Local Access Services We provide business customers with local access services by connectingthe customers’ premises to our own fiber network, which interconnectsto the local public switched telephone network in major metropolitanareas in Russia.
International and DomesticLong Distance Services
These services are offered via our Fixed Technological Network (FTN),which covers the entire territory of Russia and also includes eightinternational communications transit nodes across Russia.
We provide International and Domestic Long Distance Servicesprimarily through our FTN, proprietary and leased capacity betweenmajor Russian cities and through interconnection with zonal networksand incumbent networks. We also offer very small aperture terminalsatellite services to customers located in remote areas.
Dedicated Internet andData Services
We provide our business customers with dedicated access to the internetthrough our access and backbone networks. We also offer traditionaland high-speed data communications services to business customers whorequire wide area networks (“WANs”) to link geographically dispersedcomputer networks.
We also provide private line channels that can be used for both voiceand data applications.
Leased Channels We provide corporate clients with the ability to rent leased channelswith different high speed capacities, which are dedicated lines of datatransmission.
Intellectual and Value AddedServices
Our company offers an increasing range of value added services,including toll free (800) numbers, virtual PSTN number, SIP connection,data center services, such as co-location, web hosting, audio conference,domain registration and corporate mail services. We also offer access toa variety of financial information services, including access to theSociety for Worldwide Interbank Financial Telecommunication(“S.W.I.F.T.”) and all Russian stock exchanges.
65
Fixed-Line Services Description
Fixed Corporate and CloudServices
We offer to our corporate customers IPTV services, certain MicrosoftOffice packages (including SaaS), web-videoconferencing services(based on Cisco WebEx and TelePresence technologies) and sale, rentaland technical support for telecommunications equipment. Our companyis the first telecommunications operator in Russia authorized byMicrosoft to resell cloud service MS Office 365.
In 2014, we launched a portal for cloud services on www.beeline.ru. Theportal will be extended with other cloud services of third parties andwith existing Beeline products.
Managed Services We offer our corporate clients packages of integrated services thatinclude fixed-line telephony and internet access, along with additionalservices such as virtual PBX, and security services, such as firewall,distributed denial of service protection and local area network. Thisproduct allows customers to access their systems from various locations.
We offer and deploy managed Wi-Fi networks (indoor and outdoor) on aclient’s site (office, restaurant, shops etc.) based on IEEE 802.11b/g/n/acwireless technology. We can offer VAS services such as SSIDcustomization, first page customization, filtering, forwarding to thepredefined page, advertisement allocation, statistic offering, and limitationof time and data level.
Equipment Sales We offer equipment manufactured by Cisco Systems, Alcatel-Lucent,Avaya, Panasonic, Huawei and other manufacturers. As part of ourturnkey approach, we also offer custom solutions and services for the lifecycle of the equipment, including its design, configuration, installation,consulting and maintenance.
Mobile VPN We offer our corporate clients secure remote access to corporateinformation, databases and corporate applications. Remote access isavailable from different mobile devices, including USB modems, tabletsand smartphones.
IP Addresses We provide to our corporate customers IP address services, which helpto identify devices connected to mobile internet or a corporate network.
Wholesale Operations in Russia
Our carrier and operator services division in Russia provides a range of carrier and operator services,including voice, internet and data transmission over our own networks and roaming services.
Voice Services. For international operators, we provide call termination to fixed-line and mobile destinationsin Russia, Ukraine, Kazakhstan, Uzbekistan and Baltic states. For operators in Ukraine, Kazakhstan, Uzbekistan,we provide call termination to Russian and international fixed-line and mobile destinations. For Russianoperators, we provide international, domestic, zonal and local voice call transmission services.
Internet Services. Our carrier and operator services division provides IP transit service to operatorsthroughout the world. International operators require connectivity to the Russian internet segment. In addition,our carrier and operator services division provides data center services to content providers.
Data Services. We offer three types of data services: private networks, local access, and domestic andinternational channels.
66
We have our own local network nodes in the majority of business and trade centers in the largest cities ofRussia.
We have interconnection agreements with international global data network operators who provide aone-stop shop concept for worldwide data network services for multinational companies. Under theseinterconnection agreements, we provide MPLS-based IP VPN, local, domestic and international private lines,equipment and equipment maintenance in Russia.
We also provide high-speed domestic and international channels to international and Russian operators tosell excess backbone network capacity.
Fixed-line Broadband Internet Access.
In Russia, we offer fixed-line broadband internet access. One of our strategic goals is to develop broadbandservices based on the most up-to-date engineering solutions.
In 2016, we launched FMC product services in all branches in Russia. As of December 31, 2016 we hadmore than 500,000 FMC customers. FMC greatly increased MNP portations and decreased churn.
FTTB Operations
Currently the Beeline FTTB IPTV product is run in seven out of eight super-regions of Russia. We provideIPTV services in 135 cities in 35 regions of Russia, and as of December 31, 2016, we had more than 1.0 millionIPTV customers.
Fixed-Line Residential Operations
xDSL Services. For xDSL services, we offer an unlimited tariff plan, and tariff plans that depend onconnection speed.
Pay TV (cable TV) Services. We offer two tariff plans: “Social” for customers who need basic TV channels,which includes 10-15 TV channels, and “Commercial,” which includes 45-55 TV channels. As of December 31,2016, we had more than 44,000 customers including both “Social” and “Commercial” customers.
Distribution—Fixed-Line Business in Russia
We utilize a direct sales force in Moscow, operating both with fixed-line and mobile corporate customersand supported by specialists in technical sales support, marketing, customer service and end-user training. Inaddition, we employ a team of regional sales managers and a dedicated sales force in each of our regional branchoffices, as well as having sales incentive plans with our regional partners.
Competition—Fixed-Line Business in Russia
Business Operations
Our fixed-line telecommunications business marketed as “Beeline Business” competes principally on thebasis of convergent services and bundles, installation time, network quality, geographical network reach,customer service, range of services offered and price. We face significant competition from other serviceproviders, including:
• Rostelecom, the state-controlled telecommunications company, for services in St. Petersburg and allregional cities in Russia;
• MTS, for services to corporate customers and the SME market;
67
• TransTelecom, owned by Russian Railways, for corporate data network services across Russia;
• Orange Business, for corporate data network services, convergent mobile and fixed-line services; and
• MegaFon, which provides convergent mobile and fixed-line services.
Wholesale Operations
For voice services, our main competitors are the long distance carriers Rostelecom, TransTelecom andOJSC “Multiregional TransitTelecom.” For voice services, our main competitors are the long distance carriersRostelecom, TransTelecom and OJSC “Multiregional TransitTelecom.”
Residential and Fiber–To–The–Building (FTTB) Operations
In terms of end-user internet penetration, the consumer internet access business in Russia is alreadysaturated and end-user internet penetration is high.
Competition for customers in Russia is intense and we expect it to increase in the future as a result of widermarket penetration, consolidation of the industry, the growth of current operators and the appearance of newtechnologies, products and services. As a result of increasing competition, internet providers are utilizing newmarketing efforts (for example, aggressive price promotions) in order to retain existing customers and attract newones.
Our main competitors in the fixed-line broadband market in Russia are Rostelecom, MTS and itssubsidiaries, Avado, Err-Telecom, NetbyNet and various local home network providers. Competition is basedprimarily on network coverage, pricing plans, internet connection speed, services quality, customer service level,brand identity and a range of value added and other customer services offered.
Fixed-line Business in Pakistan
Description of Fixed-Line Services in Pakistan
Our fixed-line business in Pakistan includes internet and VAS over a wide range of access media, coveringmajor cities of Pakistan. We also offer domestic and international long distance services, point-to-point leasedlines, dedicated internet services through our access network, VPN services, VAS, such as web hosting, emailhosting and domain registration, DSL and xDSL services, WiMax services, VSAT services, Metro Fiber (whichprovides last mile access to the enterprise sectors in Karachi, Lahore, Rawalpindi and Islamabad), and P2P radiosfor connecting to our network. Our long-haul fiber optic network covers more than 6,500 kilometers and,supplemented by wired and wireless networks, over 100 cities across Pakistan.
We provide the following services for corporate and individual business customers: high-speed internetaccess (including fiber optic lines and xDSL), telephony, and long distance and international long distancetelephony on prepaid cards; telephone communication services, based on copper wires and the modern digitalfiber optic network; dedicated lines of data transmission; and dedicated line access and fixed-line mobileconvergence.
Distribution—Fixed-line Business in Pakistan
In Pakistan, we utilize a direct sales force for corporate customers. We employ a team of regional salesmanagers in three different regions supported by a dedicated sales force and account managers. For consumerDSL, we use direct sales channels, indirect sales channels and telesales. Our telesales are conducted in Lahore inthe Central Region with a team of telesales executives led by a sales manager. We offer WiMax services to theconsumer market only in Karachi. Direct sales are supported by a dedicated sales force of business developmentofficers. Indirect sales are supported by retail business development officers who offer services through ourfranchise network. Our telesales channel also offers WiMax services.
68
Competition—Fixed-line Business in Pakistan
In Pakistan, our fixed-line business faces significant competition from other providers of fixed-linecorporate services, carrier and operator services and consumer internet services. We believe that our maincompetitors for fixed-line corporate services are Pakistan Telecommunication Corporation, or “PTCL,” Multinet,Wateen, Supernet, Cybernet, Nexlinx and Nayatel. We believe that our main competitors for carrier and operatorservices are PTCL, Wateen, World Call, Wi-Tribe, and Telenor Pakistan. We believe that our main competitorsfor consumer internet services are PTCL, Wateen, World Call, Wi-Tribe and Qubee.
Fixed-line Business in Ukraine
Description of Fixed-line Services in Ukraine
Business Operations
We have constructed and own, as of December 31, 2016, a 43,822 kilometer fiber optic network, including20,068 kilometers between cities, 14,848 kilometers inside cities, and 8,906 kilometers local FOL for FTTB,which is interconnected to the local PSTN in Kyiv, to other major metropolitan areas in Ukraine and to ourgateway. We provide data and internet access services in almost all metropolitan cities in Ukraine.
Our fixed-line services include corporate internet access, VPN services, data center, contact center, fixed-line telephony and a number of VAS. Internet access services include connection to the internet via ADSL,symmetrical and Ethernet interfaces at speeds ranging from 256 kilobytes per second to 10 gigabytes per second.Fixed-line voice services are available in 30 major cities of Ukraine.
Wholesale Operations
Our joint carrier and operator services division in Ukraine provides local, international and intercity longdistance voice traffic transmission services to Ukrainian fixed-line and mobile operators on the basis of ourproprietary DLD/ILD network, as well as IP transit and data transmission services through our own domestic andinternational fiber optic backbone and IP/MPLS data transmission network.
We derive most of our carrier and operator services revenue in Ukraine from voice call termination servicesto our own mobile network and voice transit to other local and international destinations.
Consumer Operations
In Ukraine, we offer fixed-line and wireless internet services. We began providing fixed-line broadbandservices in Ukraine in 2008 and, as of December 31, 2016, provided services in 116 cities in Ukraine (excludingcities in Crimea and the ATO zone). In connection with these services, we have been engaged in a project toinstall FTTB for fixed-line broadband services in approximately 40,070 residential buildings in 116 cities,providing over 55,066 access points.
Distribution—Fixed-line Business in Ukraine
Business Operations
Our company emphasizes high customer service quality and reliability for its corporate large accounts whileat the same time focusing on the development of its SME offerings. We sell to corporate customers through adirect sales force and various alternative distribution channels such as IT servicing organizations and businesscenter owners, and to SME customers through dealerships, direct sales, own retail and agent networks.
We use a customized pricing model for large accounts which includes service or tariff discounts, volumediscounts, progressive discount schemes and volume lock pricing. We use standardized and campaign-basedpricing for SME customers.
69
Fixed-line services have significant potential considering our existing market share in the B2B market andour ability to provide integrated solutions with mobile services, which creates brand preference. Fixed-lineservices are used as an effective tool to acquire, develop and retain corporate large accounts, especially infinancial, agricultural and retail sectors.
Wholesale Operations
For voice and data services, our main competitors are Datagroup, Ukrtelecom, and Farlep-Invest (UcomlineLLC).
Consumer Operations
Our residential marketing strategy is focused on attracting new customers. We offer several tariff plans,each one targeted at a different type of customer. During 2016, our consumer fixed-line internet services businesswas supported by below the line advertising, including a leaflets distribution, in areas where the service isprovided.
In November 2016, we launched FMC (Fixed Mobile Convergence—charging subscribers who use bothmobile and fixed fiber connect from a single account) for an increasing range of mobile users in our fixed-linebroadband internet base.
We also offer a wide range of FTTB services tariffs for fixed-line broadband internet access targeted atdifferent customer segments. We currently have four unlimited tariff plans with monthly fees, which offerdifferent speeds up to 100 Mbps for active internet users. In addition, in 2015, we launched OTT TV services inpartnership with Viasat.
Competition—Fixed-line Business in Ukraine
Business Operations
In the voice services market for business customers, we compete with Ukrtelecom, Datagroup, Vega, and anumber of other small operators. We were the third largest B2B internet provider in the country as ofDecember 31, 2016, according to management’s estimates. There is a high level of competition with more than400 ISPs in Ukraine. Our main competitors in the corporate market for data services are also Ukrtelecom, Vegaand Datagroup.
Wholesale Operations
In Ukraine, carrier and operator services market competitors include Datagroup, Ukrtelecom, and Vega.
Consumer Operations
Our main competitors for provision of consumer internet services in Ukraine are Volia and Ukrtelecom.From December 31, 2015 to December 31, 2016, we increased the number of our broadband customers inUkraine (excluding customers in the ATO zone) by 0.4% from 808,477 to 811,910.
Fixed-line Business in Uzbekistan
Description of Fixed-line Services in Uzbekistan
Business Operations
In Uzbekistan, we provide a wide range of fixed-line services, such as network access and hardware andsoftware solutions, including configuration and maintenance. We provide the following services for corporateand individual business customers: high-speed internet access (including fiber optic lines and xDSL), telephony,and long distance and international long distance telephony on prepaid cards; telephone communication services,through our copper cable network and our modern digital fiber optic network; dedicated lines of datatransmission; and dedicated line access and fixed-line mobile convergence.
70
Currently, the most popular services on the Uzbek telecommunications market are internet services.
Residential and FTTB Operations
In Uzbekistan, we offer the same fixed-line broadband and wireless internet services as in Russia. For moreinformation, see “—Fixed-line Business in Russia.”
Distribution—Fixed-line Business in Uzbekistan
One of our priorities in Uzbekistan is the development of ICT, which supports economic development inUzbekistan. Our strategy includes maintaining our current market position by retaining our large corporate clientcustomer base.
Competition—Fixed-line Business in Uzbekistan
We operate large independent fixed-line services in Uzbekistan, where we compete with the state-ownedprovider, Uztelecom, as well as East Telecom, Sarkor Telecom, Sharq Telecom, TPS and EVO. There is a highlevel of competition in the capital city of Tashkent, but the fixed-line internet market in most of the regionsremains undeveloped.
Fixed-line Business in Others
Description of Fixed-line Services in Others
We offer certain fixed-line services in Kazakhstan and Armenia.
Business Operations
Kazakhstan. We focus on customer experience for large enterprises through offering high-quality services.Our main business clients are concentrated in the financial and oil and gas sectors, with a new focus oninternational companies. We provide the following services for corporate clients: high-speed internet access;local, long distance and international voice services over IP; local, intercity and international leased channels andIP VPN services; cloud services; and integrated corporate networks (including integrated network voice, data andother services). We use the following technologies: fiber optic lines (more than 25,000 buildings are covered byour FTTB network), wireless technologies, satellite technologies, and the TV-Everywhere platform (which isprovided through the vendor, Computer Telephony Integration).
Armenia. Our subsidiary ArmenTel provides a range of telecommunications services in Armenia, includingPSTN-fixed and IP telephony, internet, data transmission and network access, domestic and international voicetermination and TCP/IP international transit traffic services. We operate a nationwide network in Armenia andprovide the following services for corporate and individual customers: local telephony services; international anddomestic long distance services; broadband access services (including ADSL and fiber optic lines); and VoIPservices.
Wholesale Operations
Armenia. Our subsidiary ArmenTel is the Armenian incumbent operator offering countrywide wholesaleservices, such as leased line service and wholesale broadband services, as well as wholesale international voicetermination and origination services for other local operators and service providers.
Residential and FTTB Operations
Kazakhstan. We offer the same fixed-line broadband and wireless internet services as in Russia. For moreinformation, see “—Fixed-line Business in Russia.”
71
We have launched new products for Beeline subscribers, including OTT TV, which is available on smartphones, TVs, tablets and PCs. In addition, we have launched VAS such as “Forsage” (to allow FTTB subscribersto restore initial speeds according to their tariff plans), “Turbo” (to allow subscribers to exceed the speeds in theirtariff plans), “Invite your friend” (to attract and retain subscribers by providing bonuses which can be used tomake broadband payments) and “Moving” (to keep login and password details). We also update our offers toreflect seasonal campaigns.
Armenia. In Armenia, we offer PSTN-fixed and IP telephony services, as well as fixed-line broadbandinternet access based on ADSL and FTTB technologies, dial-up services and wireless internet access based onCDMA technology. In the fourth quarter of 2015, we launched FMC services and currently offer FMC bundles tosubscribers (for example, fixed internet plus mobile voice plus mobile data).
Distribution—Fixed-line Business in Others
Kazakhstan. We are focusing on customer base and revenue growth, which we aim to promote by expandingour transport infrastructure, strengthening our position in the market, developing our sales efforts and dataservices.
Armenia. In Armenia, our strategy includes focusing on customer retention and ARPU growth bydeveloping new services, including internet access through a fiber optic network with a guaranteed speed tocorporate customers and government organizations.
Competition—Fixed-line Business in Others
Kazakhstan. We provide internet, data transmission and traffic termination services in Kazakhstan, wherewe believe we compete primarily with state-owned provider Kazakhtelecom, KazTransCom, TransTelecom(owned by Kazakhstan Temir Zholy, the national railway company), Astel (a leader in the provision of satelliteservices) and several other small local operators.
Armenia. We offer a broad spectrum of fixed-line services to government, corporate and private customers.There are more than 10 active operators in Armenia. We believe that the largest operators are U!Com andRostelecom.
Interconnection Agreements
Our mobile and fixed-line businesses are dependent on interconnection services, which are required tocomplete calls that originate on our respective networks but terminate outside our respective networks, or thatoriginate from outside our respective networks and terminate on our respective networks. In order to provide alocal, domestic and international network, we have interconnection agreements in the markets in which weoperate.
Russia. We have several interconnection agreements with mobile and fixed-line operators in Russia underwhich we provide traffic termination services. During 2016, we had the following MTRs in Russia: average costper minute of national traffic 0.9413 RUB (approximately US$0.0155) and average price per minute of nationaltraffic 0.9571 RUB (approximately US$0.0158), which was broadly stable as compared to the 2014 and 2015historical periods.
Pakistan. We have several interconnection agreements with mobile and fixed-line operators in Pakistan andin the territories of Azad Jammu and Kashmir (“AJK”) and Gilgit-Baltistan (“GB”), under which we providetraffic termination services. Our MTR in 2016 was PKR 0.90/min (US$0.00865), which was broadly stable ascompared to the 2014 and 2015 historical periods.
72
Algeria. We have several interconnection agreements with mobile, VoIP and fixed-line operators in Algeriaunder which we provide traffic termination services. In 2016, we had MTRs of 1 DZD ex-VAT/min (US$0.01)for voice termination and 2 DZD ex-VAT/SMS (US$0.02) for SMS termination. The national incominginterconnect rate increased for the year ended December 31, 2016 as compared to the year ended December 31,2015, while the outgoing interconnect rate decreased over the same period. The movements in the historicalMTRs for 2015 and 2014 have been favorable to our business, however, asymmetry continued to exist betweenOTA and other operators.
Bangladesh. We have several interconnection agreements with ICX, IGW, mobile operators, IPTSP andfixed-line operators in Bangladesh under which we provide traffic termination services. Our MTR in 2016 wasBDT 0.22/min (US$0.003), which was broadly stable as compared to the 2014 and 2015 historical periods.
Ukraine. We have several interconnection agreements with mobile and fixed-line operators in Ukraineunder which we provide traffic termination services. The following rates were effective in 2016 for terminationof national traffic to a (regulated), which were broadly stable as compared to the 2014 and 2015 historicalperiods:
• mobile network: 0.23 UAH/min (US$0.0085)
• fixed network on intercity level: 0.23 UAH/min (US$0.0085)
• fixed network on local level: 0.11 UAH/min (US$0.0040)
• fixed network on city level: 0.02 UAH/min (US$0.0007)
Uzbekistan. We have several interconnection agreements with mobile and fixed-line operators in Uzbekistanunder which we provide traffic termination services. The MTR for the 90% state owned mobile operatorUzbektelecom JSC Perfectum Mobile was 0.05 sums (local Uzbek currency, US$0.0000154) in 2016, which wasbroadly stable as compared to the 2014 and 2015 historical periods.
Others. We have several agreements with mobile and fixed-line operators in each of the countries in ourOthers category under which we provide traffic termination services.
Licenses
We hold the following licenses in each of the countries in which we operate for mobile and fixed-lineservices. For a description of the risks associated with our licenses, please see “Item 3—Key Information—D.Risk Factors—Legal and Regulatory Risks—Our licenses may be suspended or revoked and we may be fined orpenalized for alleged violations of law, regulations or license terms” and “Item 3—Key Information—D. RiskFactors—Legal and Regulatory Risks—Our licenses are granted for specified periods and they may not beextended or replaced upon expiration,” and “Item 3—Key Information—D. Risk Factors—Risks Related to theIndustry—Our failure to keep pace with technological changes and evolving industry standards could harm ourcompetitive position and, in turn, materially harm our business.”
Mobile Telecommunications Licenses in Russia
GSM Licenses
PJSC VimpelCom holds super-regional GSM licenses (GSM900, GSM1800, GSM900/1800 and 4G/LTE1800 standards) for the following seven out of eight super-regions in Russia: Moscow, Central and Central BlackEarth, North Caucasus, North-West, Siberia, Ural and Volga. These licenses will expire between September 2017and April 2018, and we plan to file applications for renewal of all our licenses prior to their expiration.
73
PJSC VimpelCom does not currently hold a GSM super-regional license for the Far East super-region ofRussia, but it holds GSM licenses in a number of regions of the Far East super-region. These licenses expire onvarious dates between 2019 and 2021, and we plan to file applications for renewal of all of our licenses prior totheir expiration.
In addition to the seven super-regional GSM licenses, PJSC VimpelCom holds a GSM license for theOrenburg region, and in total, our GSM licenses cover approximately 97% of Russia’s population.
3G Licenses
PJSC VimpelCom holds one of three 3G licenses in Russia. PJSC VimpelCom has extended its license,which was due to expire in May 2017, until May 2022.
LTE 2600 Licenses:
PJSC VimpelCom holds 4G/LTE 2600 licenses in 32 subjects of Russia. The licenses expire on April 15,2026 and we plan to apply for renewal of these licenses prior to their expiration.
4G/LTE License
In July 2012, PJSC VimpelCom was awarded a mobile license, a data transmission license, a voicetransmission license and a telematic license for the provision of 4G/LTE services in Russia. These licenses allowPJSC VimpelCom to provide services using radio-electronic devices in Russia via networks that use 4G/LTEstandard equipment within any of the following frequency bands: 735-742.5/776-783.5 MHz;813.5-821/854.5-862 MHz; and 2550-2560/2670-2680 MHz. Certain channels allocated to us in accordance withthe licenses have restrictions on their use. To remove restrictions, we have to perform certain organizationaltechnical measures including, among others, radio frequency bands releasing spectrum conversion, refarming andreallocation between operators. The roll out of the 4G/LTE network is using a phased approach based on apre-defined schedule pursuant to the requirements of the license.
Mobile Telecommunications Licenses in Pakistan
2G License
PMCL was awarded a 15-year 2G license in 1992. In 2007, PMCL renewed its 2G license for a further termof 15 years. As of December 31, 2016, PMCL had a balance of US$43.65 million to be paid to the PTA for therenewal of its 2G license. Such amount is payable in yearly installments of US$14.5 million, payable inDecember of each year, until December 2019. This 2G license does not entitle PMCL to provide services in AJKand GB.
3G License
In 2014, following a competitive auction process, PMCL was awarded a 15-year license to operate anationwide 3G telecommunications network in Pakistan for an aggregate initial spectrum fee ofUS$300.9 million, which was paid at the time PMCL acquired the license. This 3G license does not entitlePMCL to provide services in AJK and GB. In 2006, PMCL was awarded a 15-year license to provide mobiletelecommunications services in AJK and GB.
Further, Warid acquired a 15 year technology neutral license in 2004 for US$291 million. US$145.5 millionwas paid upfront while the rest was to be paid in ten equal annual installments starting with a four year graceperiod.
74
In addition, PMCL and its subsidiaries have other licenses, including LDI, WLL, local loop licenses,licenses to provide non-voice communication services, and licenses to provide class VAS in Pakistan, AJK andGB. The licensees must also pay annual fees to the PTA and make universal service fund contributions and/orresearch and development fund contributions, as applicable, in a total amount equal to a percentage of thelicensees’ annual gross revenues (less certain allowed deductions) for such services.
License fees
Under the terms of its 2G and 3G licenses, as well as its license for services in AJK and GB, PMCL mustpay annual fees to the PTA and make universal service fund contributions and/or research and development fundcontributions, as applicable (not all of the foregoing are applicable to all licenses), in a total amount equal to2.5% of PMCL’s annual gross revenues (less certain allowed deductions) for such services, supplemental tospectrum administrative fees.
PMCL’s total license fees (annual license fees plus revenue sharing) in Pakistan (excluding the yearlyinstallments noted above) were US$27.1 million, US$21.1 million and US$20.7 million for the years endedDecember 31, 2016, 2015 and 2014, respectively. PMCL’s total spectrum administrative fee payments inPakistan were US$1.0 million for each of the years ended December 31, 2016, 2015 and 2014.
Mobile Telecommunications Licenses in Algeria
2G License
In 2001, OTA was awarded a 15-year license to operate a 2G telecommunications network for an aggregatefee of approximately US$737 million. The license expired in 2016; however, renewal is automatic if the holderhas satisfied all of the obligations under the license, which we have. The Autorité de Régulation de la Poste etdes Télécommunications (“ARPT”) must provide the holder with a notice of non-renewal six months prior to theexpiry of the license if it will not be renewed. We have not received such notice. The renewal has not been madeofficial because the Ministry of Post, Information Technology and Communications (“MPTIC”) is currentlyreviewing the GSM license terms and will publish a decree renewing the license. We anticipate that the decreewill not be published before the fourth quarter of 2017 and that the license will be issued on the same economicterms.
VSAT License
In 2003, OTA acquired a VSAT data-voice license for an aggregate fee of US$2.05 million and renewed thelicense in 2014 for an additional period of five years, at no additional cost.
3G License
In 2013, OTA was awarded a 15-year license to operate a 3G telecommunications network for an aggregatefee of approximately US$38 million, which was paid in full in 2013. Under the terms of its 3G license, OTA isrequired to pay an additional annual revenue sharing fee of 1% based on 3G revenues less interconnection costs.
4G/LTE License
In 2016, Optimum was awarded a 15-year license to operate a 4G/LTE telecommunications network for anaggregate fee of US$36 million (based on then-current exchange rates), which was paid in full in 2016. Under theterms of its 4G/LTE license, Optimum is required to pay an additional annual revenue sharing fee of 1% basedon 4G/LTE revenues less interconnection costs.
License fees
Under the terms of its 2G, 3G, 4G/LTE and VSAT licenses, OTA is required to pay revenue sharingallocations to the Algerian government and contributions for:
• The universal service fund (3% of revenues less interconnection costs);
• Management of the numbering plan (0.2% of revenues less interconnection costs); and
75
• Research, training and standardization (0.3% of revenues less interconnection costs).
OTA’s total license fees (spectrum charges plus revenue sharing) in Algeria were US$62.1 million,US$64.3 million and US$85.4 million for the years ended December 31, 2016, 2015 and 2014, respectively, ofwhich US$25.9 million, US$29.2 million and US$30.9 million was related to spectrum charges, andUS$36.2 million, US$35.1 million and US$54.5 million was related to revenue sharing, respectively, over thesame periods.
Mobile Telecommunications Licenses in Bangladesh
2G License
In November 1996, BDCL was awarded a 15-year GSM license to establish, operate and maintain a digitalmobile telephone network to provide 2G services throughout Bangladesh. The license was renewed in November2011 for a further 15-year term.
3G License
In September 19, 2013, following a competitive auction process, BDCL was awarded a 15-year license touse 5 MHz of 3G spectrum, for which it paid a total cost of BDT 8,677.4 million (inclusive of 5% VAT)(US$111.6 million equivalent), including both a license acquisition fee and a spectrum assignment fee.
License fees
Under the terms of its 2G and 3G mobile licenses, BDCL is required to pay to the BangladeshTelecommunication Regulatory Commission (“BTRC”) (i) an annual license fee of BDT 50.0 million (equivalentto US$0.6 million) for each mobile license; (ii) 5.5% of BDCL’s annual audited gross revenue, as adjustedpursuant to the applicable guidelines; and (iii) 1% of its annual audited gross revenue (payable to Bangladesh’ssocial obligation fund), as adjusted pursuant to the applicable guidelines. The annual license fees are payable inadvance of each year, and the annual revenue sharing fees are each payable on a quarterly basis and reconciled atthe end of each year.
BDCL’s total license fees (annual license fees plus revenue sharing) in Bangladesh were equivalent toUS$41.68 million, US$40.6 million and US$37.1 million for the years ended December 31, 2016, 2015 and2014, respectively.
In addition to license fees, BDCL pays annual spectrum charges to the BTRC, calculated according to thesize of BDCL’s network, its frequencies, the number of its customers and its bandwidth. The annual spectrumcharges are payable on a quarterly basis and reconciled at the end of each year. BDCL’s annual spectrum chargeswere equivalent to US$9.8 million, US$9.9 million and US$9.1 million for the years ended December 31, 2016,2015 and 2014, respectively.
Mobile Telecommunications Licenses in Ukraine
GSM Licenses
In Ukraine, “Kyivstar” JSC holds GSM900 and GSM1800 cellular licenses to provide telecommunicationsservices throughout the territory of Ukraine. These licenses were received on October 5, 2011 for a term of 15years each and will expire on October 5, 2026.
3G Licenses
On February 25, 2015, after an auction process, “Kyivstar” JSC was awarded one of three licenses toprovide nationwide 3G services in the 2100 MHz band. The license was issued on April 1, 2015 and is valid for aperiod of 15 years (until April 1, 2030).
76
We have also obtained a range of national and regional radio frequency licenses for the use of radiofrequency resources in the referred standards and in specified standards—RRL and WiMax. Our network coversapproximately 98% of Ukraine’s population (except the Anti-Terrorist Operation (“ATO”) zone where“Kyivstar” JSC is not able to use and control its network).
Mobile Telecommunications Licenses in Uzbekistan
GSM900/1800, 3G and 4G/LTE
We hold a national license for GSM900/1800, 3G and 4G/LTE covering the entire territory of Uzbekistan.The most recent license was an extension granted in May 2016 for 15 years, is effective until August 7, 2031 andrequires annual license fee payments.
Unitel LLC also has international communication services license valid until 2026 and for data transfervalid until 2019.
Mobile Telecommunications Licenses in the countries in Others
Country Licenses (as of December 31, 2016) License Expiration
Kazakhstan License to provide mobile services(GSM900/1800, UMTS/WCDMA2100, 4G/LTE800/1800)
Unlimited
Kyrgyzstan National license to use radiospectrum of 800 MHz for theentire territory of Kyrgyzstan(technology neutral)796-801MHz/83-842MHz
September 28, 2025
National license to use radiospectrum of 800 MHz for theentire territory of Kyrgyzstan(technology neutral)791-796MHz/832-837MHz
December 27, 2026
National license to use radiospectrum of 900 MHz, 1800 MHzand 2100 MHz for the entireterritory of Kyrgyzstan(technology neutral)
October 30, 2019
National license for electriccommunication service activity
Unlimited term
National license for base stationtransmission
December 3, 2019
National license for services ondata traffic
Unlimited term
Armenia Network operation license for theentire territory of Armenia
March 3, 2028
National licenses to use radiospectrum of 900 MHz, 1800 MHz
March 3, 2023
77
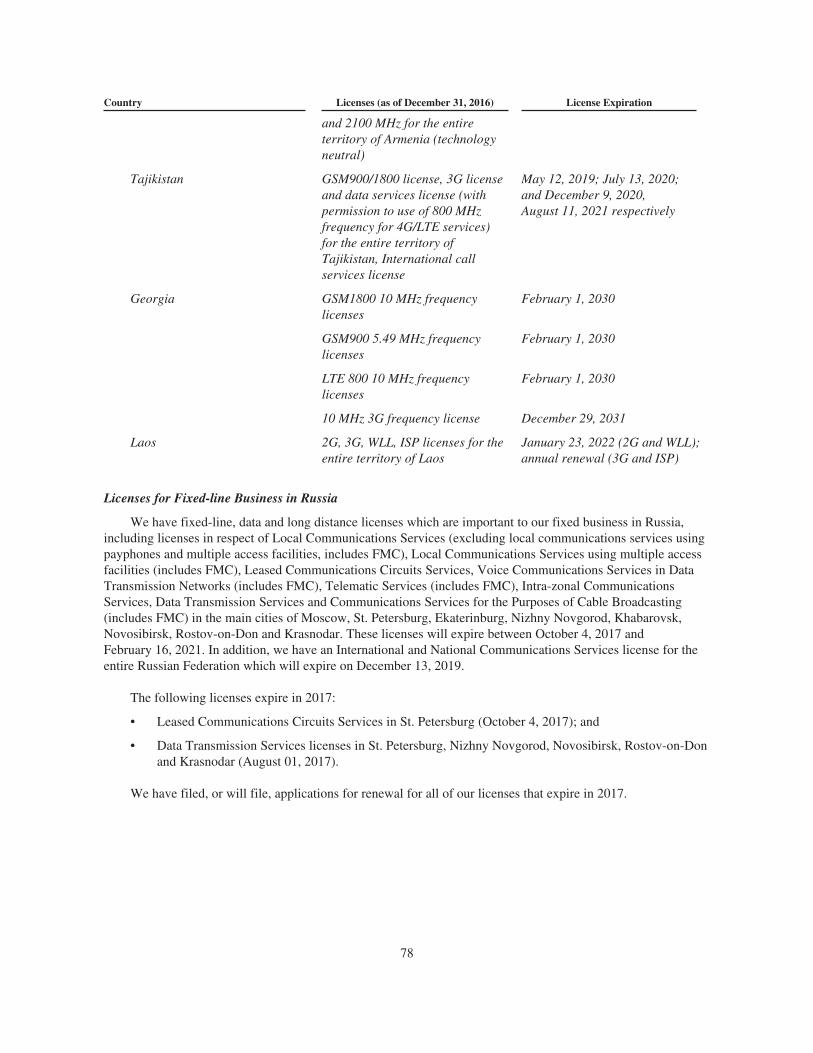
Country Licenses (as of December 31, 2016) License Expiration
and 2100 MHz for the entireterritory of Armenia (technologyneutral)
Tajikistan GSM900/1800 license, 3G licenseand data services license (withpermission to use of 800 MHzfrequency for 4G/LTE services)for the entire territory ofTajikistan, International callservices license
May 12, 2019; July 13, 2020;and December 9, 2020,August 11, 2021 respectively
Georgia GSM1800 10 MHz frequencylicenses
February 1, 2030
GSM900 5.49 MHz frequencylicenses
February 1, 2030
LTE 800 10 MHz frequencylicenses
February 1, 2030
10 MHz 3G frequency license December 29, 2031
Laos 2G, 3G, WLL, ISP licenses for theentire territory of Laos
January 23, 2022 (2G and WLL);annual renewal (3G and ISP)
Licenses for Fixed-line Business in Russia
We have fixed-line, data and long distance licenses which are important to our fixed business in Russia,including licenses in respect of Local Communications Services (excluding local communications services usingpayphones and multiple access facilities, includes FMC), Local Communications Services using multiple accessfacilities (includes FMC), Leased Communications Circuits Services, Voice Communications Services in DataTransmission Networks (includes FMC), Telematic Services (includes FMC), Intra-zonal CommunicationsServices, Data Transmission Services and Communications Services for the Purposes of Cable Broadcasting(includes FMC) in the main cities of Moscow, St. Petersburg, Ekaterinburg, Nizhny Novgorod, Khabarovsk,Novosibirsk, Rostov-on-Don and Krasnodar. These licenses will expire between October 4, 2017 andFebruary 16, 2021. In addition, we have an International and National Communications Services license for theentire Russian Federation which will expire on December 13, 2019.
The following licenses expire in 2017:
• Leased Communications Circuits Services in St. Petersburg (October 4, 2017); and
• Data Transmission Services licenses in St. Petersburg, Nizhny Novgorod, Novosibirsk, Rostov-on-Donand Krasnodar (August 01, 2017).
We have filed, or will file, applications for renewal for all of our licenses that expire in 2017.
78
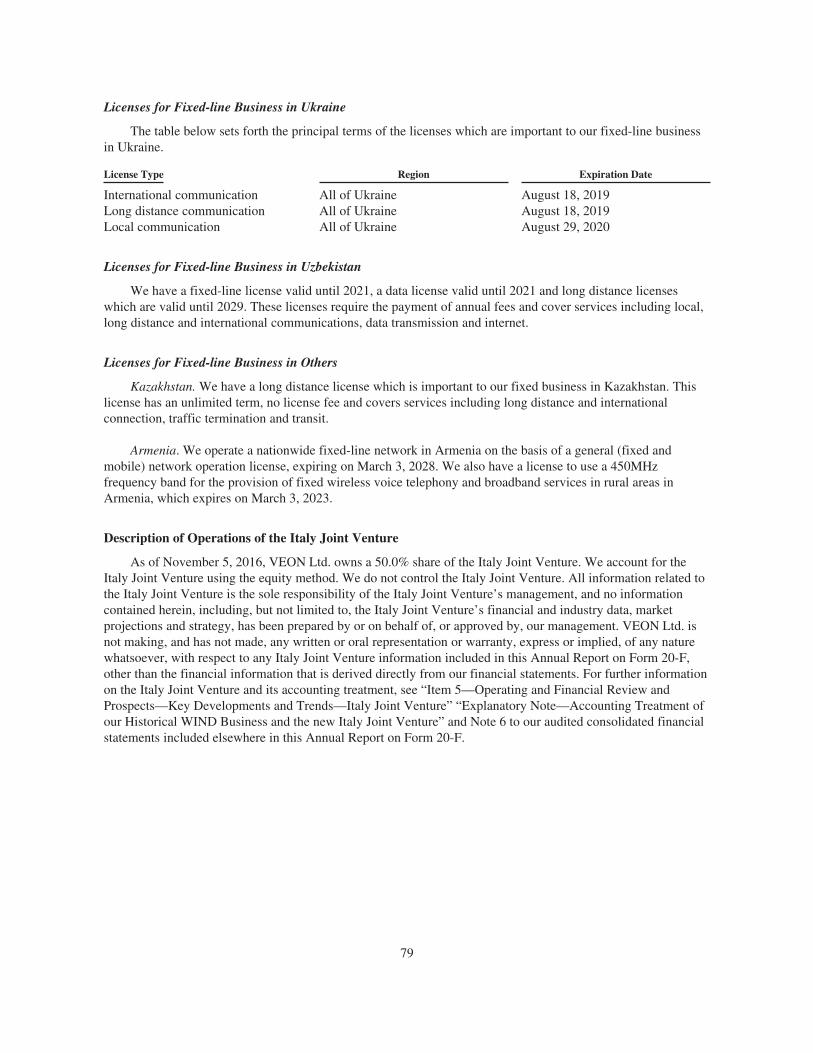
Licenses for Fixed-line Business in Ukraine
The table below sets forth the principal terms of the licenses which are important to our fixed-line businessin Ukraine.
License Type Region Expiration Date
International communication All of Ukraine August 18, 2019Long distance communication All of Ukraine August 18, 2019Local communication All of Ukraine August 29, 2020
Licenses for Fixed-line Business in Uzbekistan
We have a fixed-line license valid until 2021, a data license valid until 2021 and long distance licenseswhich are valid until 2029. These licenses require the payment of annual fees and cover services including local,long distance and international communications, data transmission and internet.
Licenses for Fixed-line Business in Others
Kazakhstan. We have a long distance license which is important to our fixed business in Kazakhstan. Thislicense has an unlimited term, no license fee and covers services including long distance and internationalconnection, traffic termination and transit.
Armenia. We operate a nationwide fixed-line network in Armenia on the basis of a general (fixed andmobile) network operation license, expiring on March 3, 2028. We also have a license to use a 450MHzfrequency band for the provision of fixed wireless voice telephony and broadband services in rural areas inArmenia, which expires on March 3, 2023.
Description of Operations of the Italy Joint Venture
As of November 5, 2016, VEON Ltd. owns a 50.0% share of the Italy Joint Venture. We account for theItaly Joint Venture using the equity method. We do not control the Italy Joint Venture. All information related tothe Italy Joint Venture is the sole responsibility of the Italy Joint Venture’s management, and no informationcontained herein, including, but not limited to, the Italy Joint Venture’s financial and industry data, marketprojections and strategy, has been prepared by or on behalf of, or approved by, our management. VEON Ltd. isnot making, and has not made, any written or oral representation or warranty, express or implied, of any naturewhatsoever, with respect to any Italy Joint Venture information included in this Annual Report on Form 20-F,other than the financial information that is derived directly from our financial statements. For further informationon the Italy Joint Venture and its accounting treatment, see “Item 5—Operating and Financial Review andProspects—Key Developments and Trends—Italy Joint Venture” “Explanatory Note—Accounting Treatment ofour Historical WIND Business and the new Italy Joint Venture” and Note 6 to our audited consolidated financialstatements included elsewhere in this Annual Report on Form 20-F.
79
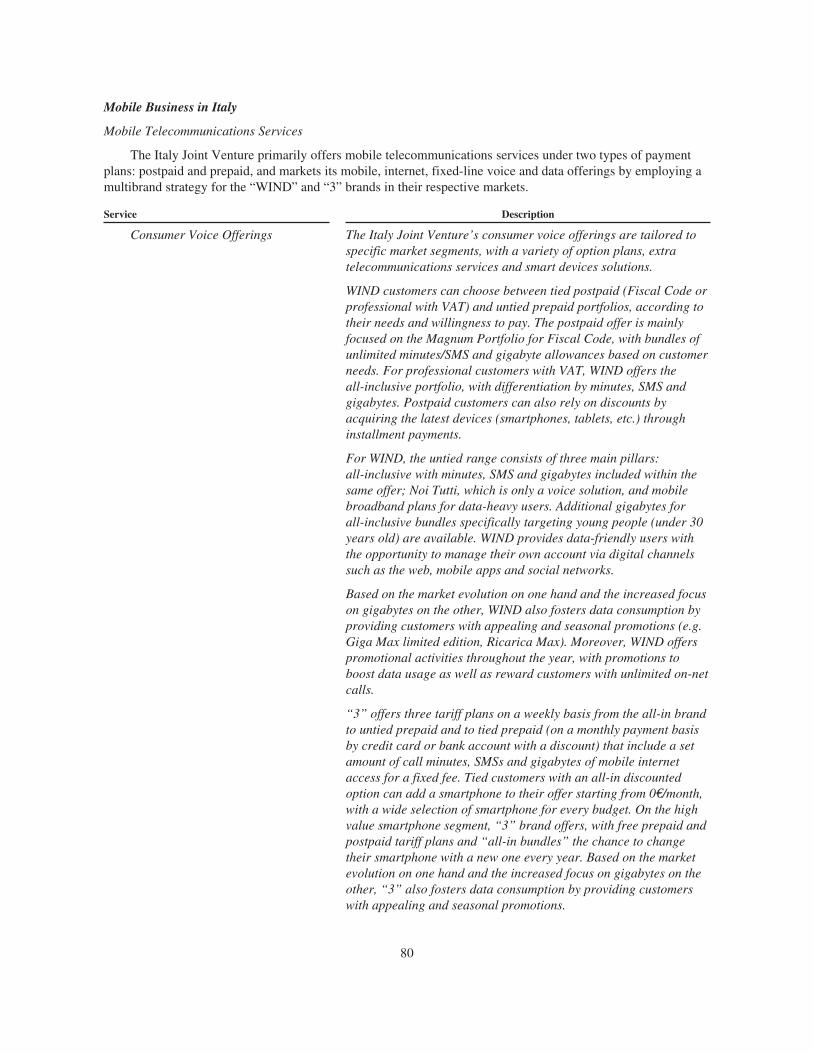
Mobile Business in Italy
Mobile Telecommunications Services
The Italy Joint Venture primarily offers mobile telecommunications services under two types of paymentplans: postpaid and prepaid, and markets its mobile, internet, fixed-line voice and data offerings by employing amultibrand strategy for the “WIND” and “3” brands in their respective markets.
Service Description
Consumer Voice Offerings The Italy Joint Venture’s consumer voice offerings are tailored tospecific market segments, with a variety of option plans, extratelecommunications services and smart devices solutions.
WIND customers can choose between tied postpaid (Fiscal Code orprofessional with VAT) and untied prepaid portfolios, according totheir needs and willingness to pay. The postpaid offer is mainlyfocused on the Magnum Portfolio for Fiscal Code, with bundles ofunlimited minutes/SMS and gigabyte allowances based on customerneeds. For professional customers with VAT, WIND offers theall-inclusive portfolio, with differentiation by minutes, SMS andgigabytes. Postpaid customers can also rely on discounts byacquiring the latest devices (smartphones, tablets, etc.) throughinstallment payments.
For WIND, the untied range consists of three main pillars:all-inclusive with minutes, SMS and gigabytes included within thesame offer; Noi Tutti, which is only a voice solution, and mobilebroadband plans for data-heavy users. Additional gigabytes forall-inclusive bundles specifically targeting young people (under 30years old) are available. WIND provides data-friendly users withthe opportunity to manage their own account via digital channelssuch as the web, mobile apps and social networks.
Based on the market evolution on one hand and the increased focuson gigabytes on the other, WIND also fosters data consumption byproviding customers with appealing and seasonal promotions (e.g.Giga Max limited edition, Ricarica Max). Moreover, WIND offerspromotional activities throughout the year, with promotions toboost data usage as well as reward customers with unlimited on-netcalls.
“3” offers three tariff plans on a weekly basis from the all-in brandto untied prepaid and to tied prepaid (on a monthly payment basisby credit card or bank account with a discount) that include a setamount of call minutes, SMSs and gigabytes of mobile internetaccess for a fixed fee. Tied customers with an all-in discountedoption can add a smartphone to their offer starting from 0€/month,with a wide selection of smartphone for every budget. On the highvalue smartphone segment, “3” brand offers, with free prepaid andpostpaid tariff plans and “all-in bundles” the chance to changetheir smartphone with a new one every year. Based on the marketevolution on one hand and the increased focus on gigabytes on theother, “3” also fosters data consumption by providing customerswith appealing and seasonal promotions.
80
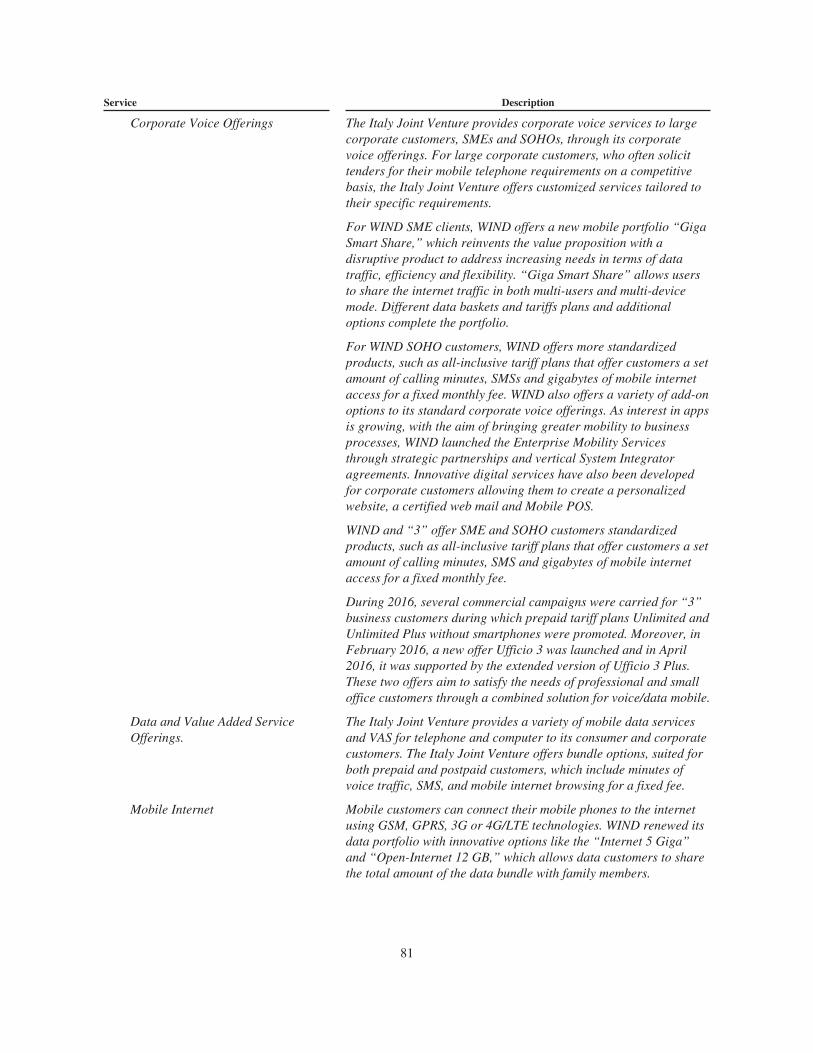
Service Description
Corporate Voice Offerings The Italy Joint Venture provides corporate voice services to largecorporate customers, SMEs and SOHOs, through its corporatevoice offerings. For large corporate customers, who often solicittenders for their mobile telephone requirements on a competitivebasis, the Italy Joint Venture offers customized services tailored totheir specific requirements.
For WIND SME clients, WIND offers a new mobile portfolio “GigaSmart Share,” which reinvents the value proposition with adisruptive product to address increasing needs in terms of datatraffic, efficiency and flexibility. “Giga Smart Share” allows usersto share the internet traffic in both multi-users and multi-devicemode. Different data baskets and tariffs plans and additionaloptions complete the portfolio.
For WIND SOHO customers, WIND offers more standardizedproducts, such as all-inclusive tariff plans that offer customers a setamount of calling minutes, SMSs and gigabytes of mobile internetaccess for a fixed monthly fee. WIND also offers a variety of add-onoptions to its standard corporate voice offerings. As interest in appsis growing, with the aim of bringing greater mobility to businessprocesses, WIND launched the Enterprise Mobility Servicesthrough strategic partnerships and vertical System Integratoragreements. Innovative digital services have also been developedfor corporate customers allowing them to create a personalizedwebsite, a certified web mail and Mobile POS.
WIND and “3” offer SME and SOHO customers standardizedproducts, such as all-inclusive tariff plans that offer customers a setamount of calling minutes, SMS and gigabytes of mobile internetaccess for a fixed monthly fee.
During 2016, several commercial campaigns were carried for “3”business customers during which prepaid tariff plans Unlimited andUnlimited Plus without smartphones were promoted. Moreover, inFebruary 2016, a new offer Ufficio 3 was launched and in April2016, it was supported by the extended version of Ufficio 3 Plus.These two offers aim to satisfy the needs of professional and smalloffice customers through a combined solution for voice/data mobile.
Data and Value Added ServiceOfferings.
The Italy Joint Venture provides a variety of mobile data servicesand VAS for telephone and computer to its consumer and corporatecustomers. The Italy Joint Venture offers bundle options, suited forboth prepaid and postpaid customers, which include minutes ofvoice traffic, SMS, and mobile internet browsing for a fixed fee.
Mobile Internet Mobile customers can connect their mobile phones to the internetusing GSM, GPRS, 3G or 4G/LTE technologies. WIND renewed itsdata portfolio with innovative options like the “Internet 5 Giga”and “Open-Internet 12 GB,” which allows data customers to sharethe total amount of the data bundle with family members.
81
Service Description
“3” offers several different tariff data plans to fulfil the needs ofevery mobile internet user: untied prepaid plans for occasional ortablet users and tied prepaid offers (monthly payment by credit cardor bank account) that include a Wi-Fi router and set amount ofgigabytes for a fixed fee. Contract data plans include a Wi-Firouter and set amount of gigabytes, plus an overall advantagecalled “Night Free,” a special feature that allows customersunlimited data traffic free of charge every night from 0:00 to 8:00am. Finally, “3” developed an innovative offer called “Express,” asingle-use data SIM specially tailored for tourists that allowscustomer to buy a fixed amount of gigabytes and use them within avery long timeframe (3 months).
PC Mobile Internet Mobile customers can connect their mobile phones to a computer tobe used as a modem to browse the internet using GSM, GPRS, 3Gor 4G/LTE technologies. In addition, the Italy Joint Venture’scustomers can directly connect their PC to the internet using adongle with a SIM card.
SMS and MMS SMS offerings provide users with information such as news, sports,weather forecasts, horoscopes, finance and TV programminginformation, as well as a selection of games, ringtones, a chatservice for customers as well as services specifically targeted atstudents. MMS provides multimedia (photo, video and sound)content, such as sports events, news, gossip and music.
Content and Innovative Services WIND renewed its partnership with Google and Microsoft forcarrier billing and enhanced roll out of mobile ticketing. WIND iscontinually improving the MyWind App and launched the Wind TalkApp, an Instant Messaging App connected to the MyWind App withexclusive features of airtime, credit transfer, P2P, and direct Chatwith its Customer Care and with its shops.
In 2014, WIND introduced a concept called “Digital Home & Life”in the main WIND store in Rome. In the store, as well as online,WIND’s customers can choose and buy new technological devicesto interact with their smartphone and, within their house, tomanage aspects of their life and home, such as wellness andentertainment.
At the beginning of November 2016, WIND released on both theAndroid and IOS digital stores, the new VEON app. The app is aninnovative engagement platform that combines traditionalcommunication features with the most innovative OTT services. Thenew app is available to everyone, but WIND’s customers haveadditional advantages in terms of free data traffic and otherexclusive rewards such as one gigabyte as a free welcome, 100megabytes per day, chat and calls without consuming traffic and a10% discount on the current offer when registering a credit card.
The Italy Joint Venture is also continually improving and updatingthree main apps for former 3 customers under the “3” brand tooffer the best user experience to its customers: Area Clienti 3,3Mobility and MyWebFamily.
82
Service Description
Area Clienti 3 is a Self Care app that allows “3” customers toverify phone credit and keep thresholds for voice and data trafficunder control. Customers can also use the app to configure andcustomize their tariff plan by activating/deactivating additionaloptions and services. The app also has a dedicated area for the TopUp feature and a control panel to manage VAS deactivation. AreaClienti 3 is also used as a main channel for upselling new offersdedicated to customers.
The 3Mobility App offers a simplified user interface to use theMobile Ticketing service: through the app all “3” customers canpurchase tickets for public transports (Bus, Metro, etc.), parkingand ZTL using their phone credit or billing account. From the app,each customer can select the city where the service is available andget their ticket with one click. The ticket purchase is then confirmedby SMS.
MyWebFamily is an app dedicated to 3 Mobile Broadbandcustomers that allows them to remotely manage Wi-Fi devices suchas WebCube and WebPocket. Customers can keep data traffic andthresholds under control, check the internet connection of theirWi-Fi router and manage all attached devices (Tablet, PC,smartphones, etc.).
Roaming The Italy Joint Venture’s mobile customers can use mobile services,including SMS, MMS and data services where available, whileroaming in other countries. Roaming coverage outside Italy isprovided through WIND’s roaming agreements with approximately503 international operators in 220 countries as of December 31,2016, as well as 3 Italia’s roaming agreements with approximately491 international operators in 190 countries as of December 31,2016.
Handset Offerings The Italy Joint Venture offers its customers a broad selection ofhandsets and internet devices sourced from a number of suppliers.The Italian market is a predominantly prepaid market and, as aresult, mobile operators generally have provided limited handsetsubsidies and only to higher value customers.
Distribution—Mobile Business in Italy
For corporate customers in Italy, the Italy Joint Venture uses different marketing strategies depending on thenature and size of a customer’s business. For large corporate customers and SMEs, the Italy Joint Venture’smarketing efforts are more customized and institutional in nature, and include one-on-one meetings andpresentations, local presentations and presentations at exhibitions. For the SOHO market, the Italy Joint Ventureadvertises in the professional and general press and use airport billboards.
The Italy Joint Venture sells consumer mobile products and services, including SIM cards, scratch cards andhandsets through a significant number of points of sale. As of December 31, 2016, the Italy Joint Venture had153 owned stores and 496 exclusive franchised outlets both operating under the WIND name as well as 486flagship stores and 717 franchising operating under the “3” name. During 2016, the Italy Joint Venture has alsoutilized 3,037 non-exclusive points of sale and 804 electronic chain store outlets both coming from the WINDpoint of sales infrastructure, as well as 5,350 other point of sale coming from the “3” point of sales infrastructure.The Italy Joint Venture also sells a portion of its consumer services online through its websites.
83
Customer experience is a strategic element of differentiation in the market for the Italy Joint Venture.Through the Customer Experience Development Function, the Italy Joint Venture aims to ensure the continuousimprovement of customer satisfaction, developing a customer experience model with the fundamental support ofall business functions. The model development is carried out using the Net Promoter System methodology. TheNPS is an indicator that correlates loyalty and growth levels. NPS is now central to the Italy Joint Venture’sstrategy; in addition to being measured periodically through market research, NPS is also used as a tool forcontinuous monitoring of customer perception when interacting with all of the Italy Joint Venture’s touch points.Using this measurement and through the mapping of all the phases of the customer journey, the Italy JointVenture can better assess the level of customer satisfaction and implement improvement actions.
Competition—Mobile Business in Italy
The mobile telecommunication market in Italy in which the Italy Joint Venture operates is characterized byhigh levels of competition among service providers. The Italy Joint Venture expects this market to remaincompetitive in the near term, and competition may be exacerbated by further consolidation and globalization ofthe telecommunications industry. Additionally, in the second half of 2017, the French operator Iliad is expectedto launch in the Italian market as a new mobile operator and as a beneficiary of the remedy package agreed withthe European Commission for the completion of the Italy Joint Venture. In the Italian mobile telecommunicationsmarket, the Italy Joint Venture’s main competitors are Telecom Italia, operating under the “TIM” brand name,and Vodafone Italy, operating under the “Vodafone” brand name. Telecom Italia and Vodafone Italy have wellestablished positions in the Italian mobile market. During 2016, Italian operators have continued to develop voiceand data services offers with promotions, discounts, bundle upgrades and complementary services, with theintention of attracting new customers and maintaining established customers with advantages and/or discounts.The traffic cap in bundle offerings continued to increase over time, particularly in relation to internet navigation,while new value-added digital services were launched for both consumer (e.g. media) and professional users (e.g.business software and cloud services). The 4G/LTE network continued to be the core of the offerings of themajor players and is frequently included in promotions. Innovative value added services continued to play animportant role in operator strategies and were included in multimedia services offers, with a focus on M2Mapplications and IoT.
Telecom Italia, as the incumbent in the market, has the advantage of longstanding relationships with Italiancustomers. Vodafone Italy is well positioned in the market and is perceived as having a technologically advancedand reliable network in the market. According to Analysys Mason, the network operators in Italy offered mobiletelecommunications services to approximately 85.9 million registered customers as of December 31, 2016,representing a mobile penetration rate of approximately 143.7% of the Italian population compared to87.1 million customers and a mobile penetration rate of approximately 145.7% in 2015.
The following table shows the Italy Joint Venture’s and its principal competitors’ respective mobilecustomer numbers in Italy as of December 31, 2016:
OperatorCustomers
(in millions)
Italy Joint Venture (WIND plus 3 Italia) . . . . . . . . . . . . . . . . . . . . . . . . . . . . . . . . . . . . . . . . . . . . . . . . 31.3Telecom Italia . . . . . . . . . . . . . . . . . . . . . . . . . . . . . . . . . . . . . . . . . . . . . . . . . . . . . . . . . . . . . . . . . . . . . 30.6Vodafone Italy . . . . . . . . . . . . . . . . . . . . . . . . . . . . . . . . . . . . . . . . . . . . . . . . . . . . . . . . . . . . . . . . . . . . 24.1
Source: Analysys Mason.
Mobile Telecommunications Licenses in Italy
GSM1800 and GSM900
The Italy Joint Venture has a license to provide mobile telephone services in Italy using digital GSM1800and GSM900 technology. This license is due to expire on June 30, 2018. In the Italian Budget Law 2017, the
84
Italian government sets out the conditions and formal procedure to be followed by operators holding GSMspectrum rights of use wishing to extend such rights until December 31, 2029 and also obtain freedom to usesuch spectrum under a technology neutrality regime.
3G license
Both WIND and 3 Italia (now comprising the Italy Joint Venture) acquired 3G licenses in 2001, which wereinitially expected to expire in 2021, but were extended to December 2029. In light of the authorization receivedfrom the Italian Ministry of Economic Development (“MISE”) regarding the transfer of spectrum rights of usefrom WIND and 3 Italia to the French operator, Iliad as remedy taker in the completion of the Italy Joint Venture(7 blocks of 2x5MHz each in 900, 1800, 2100 and 2600MHz bands), the Italy Joint Venture will have to submit arequest for the extension to the MISE for the 2100MHz spectrum rights of use from December 2021 to December2029.
4G/LTE
WIND and 3 Italia have licenses for 4G/LTE spectrum rights of use in 800, 1800 and 2600 MHz bands.Such spectrum rights are due to expire in December 2029. Below is a list of the mobile access spectrum blocks,on a band by band basis, that will be held by the Italy Joint Venture once the release of spectrum to Iliad has beencompleted, which the Italy Joint Venture anticipates will be by 2019:
• 800 Band—2 blocks of 2x5 MHz
• 900 Band—2 blocks of 2x5 MHz
• 1800 Band—4 blocks of 2x5 MHz
• 2000 TDD Band 5+5 MHz
• 2100 Band—4 blocks of 2x5 MHz
• 2600 Band—4 blocks of 2x5 MHz
• 2600 TDD Band 15+15 MHz
Fixed-line Business in Italy
Description of Fixed-line Services in Italy
In Italy, the Italy Joint Venture offers a wide range of fixed-line voice and internet broadband services. TheItaly Joint Venture offers these services to both consumer and corporate customers under the Infostrada brand(our fixed-line voice, broadband and data services brand in Italy).
The Italy Joint Venture’s fixed-line voice customer base in Italy consisted of approximately 2.7 millioncustomers as of December 31, 2016. Its direct customers mainly comprise LLU customers.
The Italy Joint Venture offers voice and broadband internet services to direct customers by renting fromTelecom Italia the “last mile” of the access network, which is disconnected from Telecom Italia equipment andconnected to the Italy Joint Venture’s equipment in telephone exchanges. In the areas where the Italy JointVenture does not have direct access to the network via LLU, customers can request wholesale services thoughthe Italy Joint Venture, though the Italy Joint Venture no longer actively markets such wholesale services. InApril 2016, WIND signed a strategic and commercial partnership with Enel Open Fiber (“EOF”) for thenationwide development of the ultra-broadband fixed-line network in Italy. In May 2016, the first customerswere connected in Perugia throughout the EOF infrastructure with the possibility to reach up to 250municipalities in the future.
85
Service Description
Internet and Data Services In the broadband access market in Italy, the Italy Joint Venturemainly offers its products directly through LLU and Fiber. The ItalyJoint Venture offers broadband mainly to direct customers, so longas the line is ADSL or ADSL 2+ capable.
In 2016, the contract offer “Casa3” was launched, which isdedicated to the home internet customer, as a competitivealternative to DSL, that includes a custom designed, 3-brandedWi-Fi router (PocketCube), plus “Night Free” functionality.
The Italy Joint Venture also offers fixed-line voice and broadbandservices, both DSL and Fiber in Italy, through bundled offeringssuch as “All Inclusive” and “Absolute” packages, which for a fixedmonthly fee, provide customers with a fixed-line voice service andunlimited connectivity to broadband. In addition, the Italy JointVenture offers a discount to fixed-line customers who also aremobile subscribers with an All Inclusive postpaid or prepaid offer.
For LLU customers only, the Italy Joint Venture continues to offerthe “ADSL Vera” concept that allows a variable maximumdownload speed up to 20 Mbps, depending on the quality of thecopper network utilized, with no additional charges. For Fibercustomers may access a speed of up to 100 megabytes.
For corporate customers, the Italy Joint Venture has developedseveral innovative and digital services such as Cloud includingIaaS (Infrastructure as a Service), Data Center, and SaaS,characterized for being fast, simple and flexible.
Consumer Voice Offerings Throughout Italy, the Italy Joint Venture provides traditionalanalog voice telephone service, or “PSTN access,” digital fixed-line telephone service, or “ISDN access,” and VAS, such as callerID, voicemail, conference calls, call restriction, informationservices and call forwarding. However, an increasing number ofcustomers in Italy subscribe to bundled fixed-line voice and internetbroadband offerings.
The Italy Joint Venture provides PSTN, ISDN and VoIP fixed-linevoice services, data services, VAS and connectivity services tocorporate customers, including large corporate customers, SMEsand SOHOs.
For larger corporate customers, the Italy Joint Venture typicallytailors its offers to the needs of the customer and, where applicable,to competitive bidding requirements. The Italy Joint Venture offersits large corporate customers direct access to its network throughmicrowave links, direct fiber optic connections or, where the ItalyJoint Venture does not offer direct access, via LLU, dedicated linesleased from Telecom Italia. The Italy Joint Venture also offers largecorporate customers national toll free and shared toll. The ItalyJoint Venture typically offers SME and SOHO customers off theshelf plans rather than bespoke offerings.
The Italy Joint Venture’s offerings are tailored for SOHOcustomers and include the “All Inclusive Business,” providing
86
Service Description
unlimited calls to national fixed and mobile networks and unlimitedinternet access and the “WIND Impresa” offer, which provides 6 to60 simultaneous voice calls on VoIP technology and a combinedservice for renting, running, and maintaining telephone switch-boards. For SME customers, the Italy Joint Venture offers the “AllInclusive Aziende,” a VOIP and connectivity service with fiber upto 50 megabytes and the “Wind Smart Office,” small large andextra-large. The Virtual IP PBX offer provides 3/15 simultaneouscalls to and from landline phones, fiber up to 50 megabytes andunlimited calls to all fixed and mobile national and internationaloperators.
Distribution—Fixed-line Business in Italy
In Italy, the Italy Joint Venture markets its fixed-line voice, broadband and data services primarily throughits “Infostrada” brand.
The main sales channels for fixed-line voice and broadband services are represented by the shops and thetoll-free number “159.” In the internet access market for consumer customers, the “Infostrada” web portal is animportant and growing distribution channel. The Italy Joint Venture utilize sales agencies, call centers and adirect sales force to target sales of fixed-line voice and internet services to corporate customers. In 2016, WIND,and subsequently the Italy Joint Venture, continued to adopt almost exclusively pull sales channels, which aremore effective and efficient, in order to increase the fixed business marginality.
Competition—Fixed-line Business in Italy
In the Italian fixed-line voice market, the incumbent operator, Telecom Italia, maintains a dominant marketposition. Telecom Italia benefits from cost efficiencies inherent in its existing telecommunications infrastructureover which it provides its fixed-line coverage. As the main Italian telecommunications provider, Telecom Italiaalso benefits from corporate and public sector customers, coupled with recognition and familiarity. Swisscomand Vodafone have entered the fixed-line internet, voice and data markets by buying Fastweb S.p.A. and Tele2(successively rebranded TeleTu), respectively. We expect that the fixed-line telecommunications market willremain competitive as a result of the presence of international competitors, with the introduction and growth ofnew technologies, products and services. During the 2016 year, operators have announced increasing speed inbundles, including digital services such as streaming video for consumer profiles and solutions supporting thedigitalization of enterprises. Operators have continued the extension of the fiber optic network, with directinvestment and with different agreements and partnerships. According to our internal estimates, four serviceproviders, Telecom Italia, the Italy Joint Venture (with its fixed-line voice, broadband and data services brandInfostrada), Vodafone Italy and Fastweb accounted for approximately 94.5% of the total broadband fixedservices actually accessed in the Italian market as of December 31, 2016.
Based on the Italy Joint Venture’s internal estimates, as of December 31, 2016, Telecom Italia hadapproximately 7.2 million broadband customers in Italy, representing a market share of approximately 48.6% ofbroadband retail connections, followed by FastWeb with approximately 2.4 million broadband customers,representing a market share of approximately 15.9% of broadband retail connections, the Italy Joint Venture withapproximately 2.3 million active broadband customers, representing a market share of approximately 15.6% ofbroadband retail connections and by Vodafone, with approximately 2.1 million broadband customersrepresenting a market share of approximately 14.3% of broadband retail connections. All other fixed-lineoperators had in the aggregate approximately 0.8 million broadband customers, representing a market share ofapproximately 5.5% of broadband retail connections.
87
Licenses—Fixed-line Business in Italy
In Italy, fixed-line services are provided pursuant to several 20-year licenses obtained from the ItalianMinistry of Economic Development in 1998. Such licenses expire in 2018 and are renewable according to Codeof Communication terms.
Research and Development—Italy
The Italy Joint Venture has been providing significant additional investment to drive development of Italy’sdigital infrastructure, increasing reliability, coverage and speed. During 2016, WIND, and following the ItalyJoint Venture transaction, the Italy Joint Venture continued to invest in research initiatives for new technologiesand broadband services in both the fixed-line and mobile sectors, with a particular focus on “green” aspects andopportunities from the big data approach. WIND established a Financed Projects team in 2008 to monitor, studyand test technological and business trends from a medium/long-term perspective, in cooperation with internalbusiness and technology divisions, to follow the innovation opportunities aligned with WIND’s strategy. Theteam developed relationships with leading national and international universities and research institutions,co-sponsoring new ideas and participating in EU development initiatives. We do not separate our research anddevelopment spending in our accounts.
Mobile Telecommunications Equipment and Operations—Italy
The Italy Joint Venture has a tower services agreement with Galata for an initial term of 15 years for theprovision of a broad range of services on the sites. As of December 31, 2016, the Italy Joint Venture owned 287radio centers (for all of which it owns the towers and equipment rooms, and for approximately 120 out of 287, italso owns the land where the radio centers are located), 586 towers, approximately 1,800 towers on rentedlocations, excluding roof top sites, on which antennas for radio coverage are installed (considering also the effectof the Galata towers transaction), and approximately 1,000 other minor towers. For information regarding thesale of a majority stake of WIND Italy’s tower subsidiary, Galata, see “Item 5—Operating and Financial Reviewand Prospects—Key Developments and Trends—Disposal of Non-Core Assets and Network and Tower SharingAgreements.”
Fixed-line Telecommunications Equipment and Operations—Italy
The Italy Joint Venture has an integrated network infrastructure providing high capacity transmissioncapabilities and extensive coverage throughout Italy. The Italy Joint Venture mobile and fixed-line networks aresupported by over 34,997 kilometers of fiber optic cable backbone in Italy and 6,656 kilometers of fiber opticcable MANs, as of December 31, 2016. This network in Italy uses a common system platform, which is referredto as the “intelligent network,” for both our mobile and fixed-line networks.
As of December 31, 2016, the Italy Joint Venture had 1,938 LLU sites for direct customer connections(approximately 70% of the population is covered), and had interconnections with the incumbent operator in orderto offer voice and data services to the rest of the population.
IP Network, based on MPLS hierarchical backbone and connected to main national and internationaloperators, is developed in all of Italy and it is able to offer fixed and mobile broadband services to consumer andcorporate customers.
The Italy Joint Venture internet network access is implemented by an all-IP network, with over 50 POPs, fordirect (xDSL) and indirect internet access services, as well as VPN (xDSL, Fiber Optics). The IP nodes accessnetwork consists of 61 BRAS for consumer services and 84 Edge Routers for Business application, located inPOPs to ensure optimal coverage of the national territory.
88
WIND has a commercial agreement with Metroweb and Enel Open Fiber to enable WIND to providecustomers with access to “fiber to the home” technology. WIND began to offer high-speed services in fiber to thehome technology in Milan in 2013 under a contract with Metroweb, where it marketed offers in fiber optictechnology, which allows the end user to reach download speeds of up to 100 Mbps and upload speeds of up to10 Mbps. During 2016, our “fiber to the home” service has been extended to Torino, Bologna and Perugia withthe intent, in the next future, to cover other cities through leveraging on the agreement signed with Enel OpenFiber. In 2015, WIND also developed a commercial offer based on Fiber to the Cabinet technologies.
Regulatory
For a description of the material effects of government regulations on our main telecommunicationsbusinesses, see “Exhibit 99.2—Regulation of Telecommunications.”
Seasonality
Our mobile telecommunications business is subject to certain seasonal effects. Generally, revenue from ourcontract and prepaid tariff plans tends to increase during the December holiday season, and then decrease inJanuary and February. Mobile revenue is also higher in the summer months, when roaming revenue increasessignificantly as customers tend to travel more during these months. Guest roaming revenue on our networks alsotends to increase in the summer period. Our fixed-line telecommunications business is also subject to certainseasonal effects. Among the influencing factors is the number of working days in a given period, as well asperiods of vacations. Generally, our revenue from our fixed-line telecommunications business is lower whenthere are fewer working days in a period or a greater number of customers are on vacation, such as during theDecember holiday season and in the summer months.
Research and Development
We are working to develop our digital interaction, and in 2016, opened software development centers inAmsterdam and London. These centers are focused primarily on developing the VEON internet platform. Inaddition, we are experimenting with a number of approaches to big data/analytics in order to facilitate datamonetization across our operating companies.
We continue to move toward a high-speed broadband connection environment deploying new technologiesin fixed-line and mobile networks. We are also introducing new network technologies aiming to improvecustomer experience, optimize network usage and increase investment efficiency, such as step-by-step migrationto new Radio Access technologies and next generation architecture through NFV. We continue to implementedtechnologies to improve voice quality, such as TFO, TrFO, AMR, HD voice codecs and VoLTE. TFO and TrFOare technologies that remove voice transcoding operations during the call so the voice quality can be improvedand resources in media gateways can be saved. AMR is a technology that dynamically adapts the coding rate tothe radio conditions in order to deliver optimum voice quality. HD Voice is a set of high definition codecs thatprovides high-definition voice quality during the call. VoLTE is a technology that enables voice calls over 4G/LTE network with higher voice quality and lower call setup times. These technologies are being implemented incommercial networks in VEON Ltd.’s operational companies after testing to ensure the quality of the network. Inaddition, we are testing new technologies for Voice Over Wi-Fi, which will enable better indoor coverage forvoice (and data) communication in our customer’s home and offices.
In the area of data services, we have successfully migrated all mobile data traffic in five countries to avirtualized technology, ZTE’s vEPC, which has proven to be a very stable technology that will bring substantialcost savings in operations and investments compared to legacy solutions for mobile data. For information onexport and re-export controls on ZTE, see “Item 3—Key Information—D. Risk Factors—Risks Related to theIndustry—We depend on third parties for certain services and products important to our business.” Theintroduction of network virtualization will continue in all countries of operation during 2017 based onprocurement tender results achieved in 2016. It will then also include areas other than data services.
89
We are investing in radio access technologies that will ensure a high level of quality of our mobilebroadband services in the future, such as 3G/HSPA+ and 4G/LTE, and we are rolling out Single-RAN networktechnology to optimize our investments and support multiple mobile communications standards on a singlenetwork and set of equipment. We have acquired new spectrum in several operating companies to boost ournetwork capacity, enhance spectral efficiency and enable the launch of new Radio Access NetworksTechnologies, e.g. the 4G/LTE spectrum in 1800 MHz band in Russia, Algeria and other countries. We have alsomigrated old solutions for fixed wireless replacement to 4G/LTE solutions in the 450 MHz band in Armenia,which will give data services comparable to ADSL to customers that did not have the possibility to get internetconnectivity before, in addition to provide superior 4G/LTE coverage at very low cost.
We have now launched 4G/LTE in all countries, except in Ukraine and Bangladesh where the regulators have notyet released any 4G/LTE spectrum. The 4G/LTE spectrum in those countries is expected to be released in 2017.
In Pakistan, we achieved 4G/LTE service to Jazz (previously Mobilink) customers through the acquisitionof Warid and the subsequent merger of the networks. The merger also enabled 3G services to all Waridcustomers, who previously only had 2G and 4G/LTE service. The two networks, including all technologies (2G/3G/4G/LTE), were fully merged during 2016. With the merged network, we are now able to dismantleoverlapping base stations and merge the core network nodes into a common network, achieving major savings inoperational costs.
In Russia, we have signed a letter of intent with Huawei for the joint research and testing of technologiesunderlying 5G networks. Our cooperation with Huawei is intended to define the steps for the development of 5G“Beeline” networks as part of VEON’s strategy of digital transformation. In addition, it will assist Huawei increating solutions which fully meet market requirements. Under the agreement, we expect that in the first quarterof 2017, we will test innovative LTE-U technology (LTE-Unlicensed) and LTE-Advanced Pro features, designedto improve the user experience with respect to data transmission. These studies will help develop newtechnologies and standards, and assist PJSC VimpelCom in creating a next generation of network, improveservice quality and launch new digital services to its customers.
We have also signed a management services agreement with Huawei for full network maintenanceoutsourcing in Russia for five years. In addition, we are in the advanced stages of negotiating an agreementconcerning network management with Nokia in Russia, which we expect to execute in the near term.
We are also developing the IoT in Russia. Throughout 2017, several companies in Russia expect to developand test IoT technology, computer interaction (M2M), virtual radio and solutions for public safety. In addition,the parties have agreed to test a number of features to increase network speed and reduce network latency duringdata transmission.
For a discussion of research and development for the Italy Joint Venture, please see “—Description ofOperations of the Italy Joint Venture—Research and Development—Italy.”
For a discussion of the risks associated with new technology, please see the section of this Annual Report onForm 20-F entitled “Item 3—Key Information—D. Risk Factors—Risks Related to the Industry—Our failure tokeep pace with technological changes and evolving industry standards could harm our competitive position and,in turn, materially harm our business.”
Property, Plant and Equipment
Information Technology
In June 2016, we entered into a US$1 billion long-term global software agreement with Ericsson. Under theagreement, Ericsson has agreed to develop, implement, and service over a seven year period, new software andcloud technologies across VEON’s customer-facing IT infrastructure. We continue to work closely with Ericssonon the timing and rollout of the development and implementation across the group. For a discussion of the risksassociated with our dependence on third parties for certain services and products important to our business,
90
please see the section of this Annual Report on Form 20-F entitled “Item 3—Key Information—D. RiskFactors—Risks Related to the Industry— We depend on third parties for certain services and products importantto our business.”
Mobile Telecommunications Equipment and Operations
Mobile Telecommunications Network Infrastructure
GSM, 3G and 4G/LTE Advanced technologies are based on “open 3GPP standards,” which means thatstandard compliant equipment from any supplier can be added to expand the initial network. Our GSM/GPRS/EDGE/3G/4G/LTE/LTE Advanced networks, which use mainly Ericsson, Huawei, Nokia Solutions andNetworks, Cisco Systems and ZTE Corporation equipment, are integrated wireless networks of radio base stationequipment, circuit and packet core equipment and digital wireless switches connected by fixed microwavetransmission links, fiber optic cable links and leased lines. We manage all major suppliers centrally to benefitfrom the group’s purchasing scale and monitor the commercial terms across the group. We select suppliers basedmainly on compliance with technical and functional requirements and total cost, seeking to optimize networkoperations and provide the best value and experience to our customers.
Site Procurement and Maintenance
We enter into agreements for the location of base stations in the form of either leases or cooperationagreements that provide us with the use of certain spaces for our base stations and equipment. Under these leasesor cooperation agreements, we typically have the right to use premises located in attics or on the top floors ofbuildings for base stations, space on roofs of buildings for radio units and antennas or space on greenfield land toplace our towers and equipment shelters.
During 2016, we entered into several agreements with other operators for radio network sharing, where weeither share the passive equipment, physical site and towers, or active sharing, where we also combine theoperation of the radio equipment and/or share spectrum with other operators. Network sharing brings not onlysubstantial savings on site rentals and maintenance costs but also on investments in equipment for rollout of newbase stations. In Russia, we have agreements with MTS and MegaFon in different regions and for differenttechnology combinations, respectively. In August 2016, we have entered into a network sharing agreement withKcell Joint Stock Company (“Kcell”) for the joint deployment of 4G/LTE services in Kazakhstan. The agreementaims to benefit customers without restricting competition between the two companies. The two mobile networkoperators will undertake joint planning of the combined network in order to generate greater cost efficiencies anda significantly accelerated roll-out of 4G/LTE across the country. The shared network will be managed bycombined teams from Beeline Kazakhstan and Kcell.
For a discussion of the mobile telecommunications equipment and operations for the Italy Joint Venture,please see “—Description of Operations of the Italy Joint Venture—Mobile Telecommunications Equipment andOperations—Italy.”
Fixed-line Telecommunications Equipment and Operations
Russia
Our fixed infrastructure consists of two primary parts – our transport network and fixed core network.
91
Our transport network is designed and is continually developed to carry voice, data and internet traffic ofmobile network, FTTB and our fixed-line customers. The main technologies in a transport network are fiberoptics and microwave links. In some cases, satellites are used to provide connection with remote andhard-to-reach areas. Following and acquisition of fixed regional operators, we now have copper line connection,which we use in limited amounts for B2C services. Our fiber optics network consists of four parts designed forspecific goals: international lines, domestic main lines, zonal and local.
International lines are located outside Russia and are designed to ensure connection with internationaloperators and channels for our clients.
Main lines are the backbone of our fiber optics for Mobile, Fix and FTTB. Consisting of the Big EuropeanRing (main fiber ring) and a few rings in the Central, Ural, Siberia and South and North Caucasus regions, thenetwork connects the major cities in the Western part of Russia and the Eastern part up to and including Siberia.We also lease capacity from Rostelecom and TransTelecom to reach the Far-Eastern part of Russia, and ournetwork extends to Yakutsk, Vladivostok and Sakhalin. Two chords links provide additional protection andcapacity for the Big European Ring. The total length of our Intercity optical cable network is 63,195 kilometers.There are protected optical lines connecting Moscow and St. Petersburg, and which pass to Stockholm, Londonand Frankfurt. Two independent optical lines connect our optical networks in Russia and Ukraine. Three cross-boundary lines to Kazakhstan provide our connections to Kazakh, Uzbek and other Asian telecommunicationoperators. The active infrastructure of main lines is based on DWDM technology, with IP on top, and isorganized into a single architecture called IP backbone. Zonal or intraregional transport networks connect oursites and sites in small towns and the countryside within each federal territory. We also have local fiber networksconstructed in more than 220 cities, which are designed for multiservice traffic within city borders built on MENtechnology. All of the networks are connected and share resources where required. The total length of our zonaland local fiber cables is 108,469 kilometers. Our primary vendors of active optical equipment are Cisco, Juniper,Huawei, Ciena and ECI. Microwave technology is mainly used to provide access to the final destination (basestation or client). We use modern, high capacity (150+ Mbps) microwaves from leading telecommunicationvendors such as Ericsson, Huawei, Nec, Aviat.
We use a three tiered architecture for our fixed core network (voice) to ensure correct and efficient trafficmanagement and answer business demands: local, zonal and federal. The local voice networks are mainly used toprovide telephony services for B2B customers and are in 189 cities. In an effort to minimize payments toincumbent local operators for voice transit and reduce traffic loop by direct connection with external mobile andfixed operators, we introduced zonal switches in 57 Russian regions (regional level).
Our federal transit network consists of six international transit exchanges, eight intercity communicationstransit exchanges installed in each of the federal districts of Russia, and connection points (access nodes) locatedin each region of Russia. We use this network to optimize our investments for serving of interregional andinternational traffic and to simplify architecture management, as well as realize our fixed operator federal license.
Ukraine
Our transport network is designed to provide a full range of telecommunications services for corporate andenterprise customers, including: Private Leasing Channel, voice, IP voice, L2VPN, IP VPN, and internet access.The information provided below does not include the Donetsk and Lugansk regions of Eastern Ukraine.
Our transport network is based on our optical cable network utilizing DWDM, SDH and IP/MPLSequipment. The DWDM and SDH networks connect all the main regional and mid-sized cities of Ukraine. Allour DWDM and SDH optical networks are fully ring-protected (except for secondary towns) and can be self-healing which is necessary to prevent downtime of the transmission network. Our core IP/MPLS network is fullymesh-protected, meaning that the recovery mechanisms which provide different levels of protection orrestoration against different failure modes are available for network uptime. It connects all the main regionalcities of Ukraine. The total length of our fiber optic cables is 20,068 kilometers.
92
Our interregional and metro transport networks are based on our optical cable and microwave systemsutilizing SDH, PDH, Ethernet and IP/MPLS technologies. We have deployed metro SDH and IP/MPLS opticalnetworks in more than 116 cities of Ukraine. The total length of fiber cables constructed within cities is 23,754kilometers.
As of December 31, 2016, we had constructed and owned a 43,822 kilometer fiber optic network, including20,068 kilometers between cities, 14,848 kilometers inside cities, and 8,906 kilometers of local FOL for FTTB,which is connected to the local PSTN in Kyiv, to other major metropolitan areas in Ukraine, and to our gateway.
Uzbekistan
In Uzbekistan, we provide a wide range of fixed-line services, such as network access and hardware andsoftware solutions, including configuration and maintenance. Our joint venture’s (Buzton) network providesinternational telephony and internet access through JSC Uzbektelecom. Buzton’s network consists of 95 nodessituated throughout Uzbekistan. We have our own basic fiber optic digital network in the cities of Tashkent,Zarafshan, and Uchkuduk, covering more than 485 kilometers with connection to 30,456 FTTB ports, and coppercables, providing services through 14,848 ADSL ports, that allow users to connect and to access services innearly all regions of Uzbekistan. Our main line in Tashkent is based on fiber optic equipment.
Armenia
ArmenTel’s fixed-line infrastructure covers all districts of Armenia with a full set of equipment(international gateway, digital-analog exchanges, remote access telephone nodes, MSANs, internet protocoldigital customer line access multiplexers, fiber and copper wire access networks, fiber optic backbone networkand data access network). Its network consists of 221,008 ADSL ports, 2,015 buildings provided with FTTB fiberaccess and 167 Central Offices (telephone exchanges, MSANs, remote nodes), of which 130 are digital.ArmenTel also provides interconnection with international operators and national mobile operators in Armenia.ArmenTel’s CDMA Wireless Local Loop network is used to provide fixed-line telephone services to ruralcustomers but it will be replaced by a 4G/LTE solution on a 450 MHz spectrum. After successful trials, thereplacement launched during 2016.
Kazakhstan
Our subsidiaries TNS-Plus LLP and KaR-Tell LLP provide a wide range of fixed-line telecommunicationsservices, including internet access, ADSL, FTTB, Wi-Fi, WiMax, VoIP, VPN and VSAT. TNS-Plus owns morethan 13,000 kilometers of fiber optic main lines across Kazakhstan, which are based on Huawei SDH/DWDMequipment. As of December 31, 2016, we had approximately 260,000 customers connected via FTTB technologyin Kazakhstan.
FTTB
Our company is rolling out FTTB networks in Russia, Ukraine and Kazakhstan. Technically, FTTB offershigher transmission speed, more bandwidth and better security compared to all existing xDSL and other quasi-broadband solutions. In Russia, where the local loop has not been unbundled and the quality of copper lines isgenerally poor, construction of fiber networks helps to create alternative high quality access to customers’residences.
As of December 31, 2016, we had more than 2.1 million customers connected to our FTTB network inRussia. The network operates in 147 cities across Russia, 32 across Kazakhstan and three across Uzbekistan.
Italy Joint Venture
For a discussion of the fixed-line telecommunications equipment and operations for the Italy Joint Venture,please see “—Description of Operations of the Italy Joint Venture—Fixed-line Telecommunications Equipmentand Operations—Italy.”
93
Intellectual Property
We rely on a combination of trademarks, service marks and domain name registrations, copyright protectionand contractual restrictions to establish and protect our technologies, brand name, logos, marketing designs andinternet domain names. We have registered and applied to register certain trademarks and service marks inconnection with our mobile telecommunications businesses. We have also registered and applied to registercertain trademarks and service marks with the World Intellectual Property Organization in order to protect them.
Our registered trademarks and service marks include our brand name, logos and certain advertising features.Our copyrights are principally in the area of computer software for service applications developed in connectionwith our mobile and fixed-line network platform and for the language and designs we use in marketing andadvertising our mobile services.
For a discussion of the risks associated with new technology, please see the section of this Annual Report onForm 20-F entitled “Item 3—Key Information—D. Risk Factors—Risks Related to the Industry—Ourintellectual property rights are costly and difficult to protect, and we cannot guarantee that the steps we havetaken to protect our intellectual property rights will be adequate” and “Item 3—Key Information—D. RiskFactors—Legal and Regulatory Risks—New intellectual property laws or regulations may require us to investsubstantial resources in compliance or may be unclear.”
Buildings
The primary elements of our material tangible fixed assets are our networks, as discussed above at“—Mobile Telecommunications Equipment and Operations” and “—Fixed-line Telecommunications Equipmentand Operations.”
In Russia, we own five buildings consisting of approximately 26,000 square meters at 10, Ulitsa 8 Marta inMoscow. We use these buildings as an administrative office, technical center, warehouse and operating facility.In addition, we own five buildings on Lesnoryadsky Pereulok in Moscow, constituting approximately 15,360square meters, which are used as an administrative office, warehouse and operating facility. These buildings alsohouse the main switches for our Moscow 3G/GSM network and our main and reserve IT centers. We have otheroffices at 4, Krasnoproletarskaya Street, in the center of Moscow. These consist of two leased administrativebuildings of approximately 30,000 square meters. We own a portion of a building in the center of Moscow onUlitsa 1st Tverskaya Yamskaya consisting of approximately 3,000 square meters that we use as a customerservice center, administrative and sales office. We also own office buildings in some of our regional license areasand lease space on an as-needed basis.
In Pakistan, our subsidiary PMCL owns a number of properties consisting of over 28,000 square meters inKarachi, Lahore, Faisalabad and Islamabad. These properties are used for PMCL’s operations and include datacenters, office buildings and switching stations. PMCL also leases properties across Pakistan, AJK and GB,including its headquarters and BTS sites. In addition, Warid owns a number of properties totaling 21,686 squaremeters that are mostly used for MSCs, technical installations and data centers.
In Algeria, our subsidiary Optimum leases its headquarters, call center, transmission towers, sites for mobileswitching centers and data centers and owns a small parcel of land used for a cable station in Ain Benian.
In Bangladesh, our subsidiary Banglalink does not own any material real property. Banglalink leasesproperties across Bangladesh, including its headquarters, call centers, towers, mobile switching centers and datacenters.
In Ukraine, our subsidiary, “Kyivstar” JSC, owns a series of buildings consisting of 34,067 square meters atDegtyarivska, 53 in Kyiv. We use these buildings for offices, call centers, switching centers and a print center. Inaddition, we own a number of buildings throughout Ukraine consisting of over 62,258 square meters that we useas office space, switching centers, call centers, sales centers, date centers and storage units.
94
In Uzbekistan, we own 11 buildings consisting of approximately 25,951 square meters, which are used asadministrative offices, technical centers and switching centers. In addition, we lease properties across Uzbekistanthat we use for offices, sales centers, warehouses, archive centers, switching centers and parking.
Corporate Social Responsibility
We have a long-term corporate responsibility strategy, consisting of two main elements: maintaining thetrust of our stakeholders by behaving in a responsible way, which is key to securing our “license to operate;” andadding tangible value to society through products, services and social investments, by recognizing theopportunities to leverage our technology, our commercial expertise, and the commitment of our employees. Tofurther our goals, we launched our, “Make Your Mark” corporate responsibility program in 2014.
Our approach to the identification, management and evaluation of corporate responsibility is guided by threemain factors:
• Stakeholders: A range of stakeholders have legitimate concerns and expectations about how ourcompany operates. By engaging with them, we understand and evaluate these issues and plan how bestto improve our business. We follow a number of multi-stakeholder defined standards and guidelines.Our reporting meets Global Reporting Initiative (“GRI”) version 4 guidelines at the “core” level,follows the guidance in the AA1000 Accountability Principles Standard and is influenced by theguidance issued by the International Integrated Reporting Council (“IIRC”). Several of our marketshave adopted International Organization for Standardization standards, and the social accountabilitystandard;
• Materiality: We prioritize these issues logically, by assessing the materiality of individual issues to ourstrategy and their importance to our stakeholders. Each material issue is scored against pre-definedcriteria; and
• Responsiveness: Having identified the priorities, we form our strategy and governance approach, takeappropriate action and report on our progress through our corporate strategy framework overview. Thisoverview includes analysis of the strategy elements and business principles, relevance to the businessstrategy, relevance to stakeholders and finally, a status summary. Within the corporate responsibility(“CR”) report, CR performance is disclosed periodically, which is used by the corporate responsibilityteam to determine the effectiveness of policy and design novel policy and management approaches.
Our corporate responsibility program is overseen by our corporate responsibility team, which reports to ourGroup Chief External Affairs Officer who, in turn, reports to the Chief Executive Officer. The team has access tothe top operational committee for issue-by-issue decisions.
We are accountable to our stakeholders and customers through the publication of our annual CorporateResponsibility report, which is published each year.
We share periodic updates with internal stakeholders, including members of management, to inform themabout key corporate responsibility related developments.
Disclosure of Activities under Section 13(r) of the Exchange Act
Under Section 219 of the Iran Threat Reduction and Syria Human Rights Act of 2012, which added Section13(r) to the Exchange Act, we are required to disclose whether we or any of our affiliates are knowingly engagedin certain activities, transactions or dealings relating to Iran or certain designated individuals or entities.Disclosure is required even when the activities were conducted outside the United States by non-U.S.entities—including non-U.S. entities that are not otherwise owned or controlled by U.S. entities or persons—andeven when such activities were conducted in compliance with applicable law.
95
The following information is disclosed pursuant to Section 13(r) of the Exchange Act. None of theseactivities involved our U.S. affiliates.
• Our Armenian subsidiary, ArmenTel, and Telecommunications Company of Iran, or “TCI,” an IranianGovernment-owned company, have an agreement for the provision of voice services, which has been inplace since 2003. Under the agreement, ArmenTel sent direct traffic to TCI and TCI sent both directand transit traffic to ArmenTel. We (including ArmenTel) did not provide any telecommunicationsequipment or technology to TCI. However, in 2013 ArmenTel discontinued providing voice servicesunder the agreement. During 2016, ArmenTel received traffic from TCI under the 2003 contract forvoice services. The gross revenue received from these activities involving TCI was approximatelyUS$370,407 and net profits were approximately US$275,537. During 2016, ArmenTel providedtelecommunications services to the Embassy of Iran in Yerevan. The gross revenue for these servicesin 2016 was approximately US$28,000 and net profits were approximately US$24,000. ArmenTelintends to continue the services to the Embassy of Iran.
• During 2001, our Russian subsidiary, PJSC VimpelCom, began providing telecommunicationsservices, including mobile and fixed-line services, to the Embassy of Iran in Moscow. The grossrevenue for these services in 2016 was approximately US$8,684 and net profits were approximatelyUS$6,252. PJSC VimpelCom intends to continue the services to the Embassy of Iran.
• During 2008, our Tajikistan subsidiary, LLC Tacom, began providing telecommunications services tothe Embassy of Iran in Dushanbe. The gross revenue for these services in 2016 was approximatelyUS$9,318 and net profits were approximately US$8,477. LLC Tacom intends to continue the servicesto the Embassy of Iran.
• During 2014, our Kyrgyzstan subsidiary, Sky Mobile LLC, began providing mobiletelecommunications services to the Embassy of Iran in Bishkek. The gross revenue for these services in2016 was approximately US$1,140 and net profits were approximately US$524. Sky Mobile LLCintends to continue the services to the Embassy of Iran.
• During 2016, our Algerian subsidiary, OTA and subsequently its wholly owned subsidiary, OptimumTelecom Algeria S.p.A. (“Optimum”), provided telecommunications services to the Embassy of Iran inAlgiers. The gross revenue for these services in 2016 was approximately US$956 with net profits ofapproximately US$1,119. Optimum intends to continue the services to the Embassy of Iran.
• We have active roaming agreements with GSM mobile network operators in various countriesthroughout the world, including with TCI, MTN Irancell, Taliya Mobile and Telecommunication KishCompany (also known as TKC KIFZO) and RighTel in Iran. TCI and MTN Irancell are owned orcontrolled by the Iranian Government, and our other roaming partners in Iran may be affiliated with theIranian Government. Pursuant to our roaming agreements with these companies, our customers receivecustomary international roaming services on their networks, and their customers receive such serviceswhile roaming on our networks outside those countries. We intend to continue our roaming agreementswith TCI, MTN Irancell, Taliya Mobile, TKC KIFZO and RighTel for the foreseeable future. During2016, our gross revenue received from roaming arrangements with TCI, MTN Irancell and RighTelwas approximately US$642,076, US$12,728 and US$1,340 respectively; net profits from roamingarrangements with TCI were US$567,445, and net losses from MTN Irancell and RighTel wereapproximately US$61,513 and US$4,289 respectively. During 2016, we received no gross revenuefrom roaming arrangements with Taliya Mobile and TKC KIFZO with no net profits.
Telenor may be deemed an affiliate based on its indirect share ownership in us through Telenor East and theofficers of the Telenor Group who are on our board. Telenor East has provided us with the information includedbelow relevant to Section 13(r) of the Exchange Act. This information relates solely to activities conducted byTelenor subsidiaries and does not relate to any activities conducted by us. We are not representing the accuracyor completeness of such information and undertake no obligation to correct or update this information.
96
Various Telenor subsidiaries have entered into roaming agreements and interconnection agreements withIranian telecommunication companies. Pursuant to those roaming agreements, the Telenor subsidiaries’customers are able to roam in the particular Iranian network (outbound roaming) and customers of such Iranianoperators are able to roam in the relevant subsidiaries’ network (inbound roaming). For outbound roaming,Telenor subsidiaries pay the relevant Iranian operator roaming fees for use of its network by Telenorsubsidiaries’ customers, and for inbound roaming the Iranian operator pays the relevant Telenor subsidiaries’roaming fees for use of its network by its customers.
Telenor subsidiaries were party to the following roaming agreements and interconnection agreements withIranian telecommunication companies in 2016:
(1) Telenor Norge AS, a Norwegian subsidiary, has roaming agreements with Mobile TelecommunicationCompany of Iran (“MCI”) and MTN Irancell. During 2016, Telenor Norge AS recorded net revenue related tothese roaming agreements of US$8,319.45 to MCI and net expenses of US$249,335.76 to MTN Irancell.
(2) Telenor Sverige AB, a Swedish subsidiary, has roaming agreements with MCI, MTN Irancell and TaliyaMobile. During 2016, Telenor Sverige AB recorded net revenues related to its roaming agreement with MCI ofUS$27,552.27, net expenses related to its roaming agreement with MTN Irancell of US$41,558.97 and netexpenses related to its roaming agreement with Taliya Mobile of US$19,379.55.
(3) Telenor A/S, a Danish subsidiary, has roaming agreements with MCI and MTN Irancell. During 2016,Telenor A/S recorded net expenses related to its roaming agreement with MCI of US$35,434 and net expensesrelated to its roaming agreement with MTN Irancell of US$100,279.
(4) Telenor d.o.o. Beograd Omladinskih brigada 90, a Serbian subsidiary, has a roaming agreement withMCI. During 2016, Telenor d.o.o. Beograd Omladinskih brigada 90 recorded net revenues of US$1,584.27related to this roaming agreement.
(5) Telenor Hungary Plc, a Hungarian subsidiary, has a roaming agreement with MCI. During 2016, TelenorHungary Plc, recorded net revenues of US$23,066.44 related to this roaming agreement.
(6) Telenor Bulgaria EAD, a Bulgarian subsidiary, has a roaming agreement with MCI. During 2016,Telenor Bulgaria EAD recorded net revenues of US$12,541.30 related to this roaming agreement.
(7) DiGi.Com Bhd, a Malaysian subsidiary, has a roaming agreement with MCI. During 2016, DiGi.ComBhd recorded net revenues of US$23,055.68 related to this roaming agreement.
(8) Telenor Pakistan (Private) Ltd., a Pakistani subsidiary, has roaming agreements with MCI, MTN Irancelland Taliya. During 2016, Telenor Pakistan (Private) Ltd. recorded net expenses of US$892.69 related to theroaming agreement with MCI and net revenue of US$21,225.52 related to the roaming agreement with MTNIrancell.
(9) Total Access Communications Plc. (“dtac”), a Thai subsidiary, has roaming agreements with MCI andMTN Irancell. During 2016, dtac recorded net expenses related to these roaming agreements of US$39.63 toMCI and US$11.17 to MTN Irancell.
(10) Telenor Global Services AS, a Norwegian subsidiary, has an interconnection agreement withTelecommunication Company of Iran, the parent company of MCI. During 2016, Telenor Global Servicesrecorded net revenue of US$355,951.23 related to this interconnection agreement.
Telenor and its subsidiaries intend to continue these agreements.
ITEM 4A. Unresolved Staff Comments
None.
97
ITEM 5. Operating and Financial Review and Prospects
The following discussion and analysis should be read in conjunction with our audited consolidated financialstatements and the related notes included elsewhere in this Annual Report on Form 20-F. This discussioncontains forward-looking statements that involve risks and uncertainties. Our actual results could differmaterially from those anticipated in the forward-looking statements as a result of numerous factors, includingthe risks discussed in “Item 3—Key Information—D. Risk Factors.”
Basis of Presentation of Financial Results
Our audited consolidated financial statements set forth elsewhere in this Annual Report on Form 20-Finclude the accounts of VEON Ltd. and its consolidated subsidiaries. All inter-company accounts andtransactions have been eliminated. We have used the equity method of accounting for companies in which wehave significant influence, such as the Italy Joint Venture. Generally, this represents voting rights of at least20.0% and not more than 50.0%.
From January 1, 2016 to November 5, 2016, we classified our Italian business unit as an asset held for saleand discontinued operation in our consolidated financial statements. In connection with this classification,VEON Ltd. no longer accounted for depreciation and amortization expenses of the Italian operation. Thefinancial data for 2015 and 2014 reflects the classification of Italy as an asset held for sale and a discontinuedoperation. The intercompany positions were disclosed as related party transactions and balances. OnNovember 5, 2016, the balance sheet of Italy was deconsolidated and an investment in a joint venture, in whichVEON Ltd. has joint control, was recorded. Please refer to Notes 6, 13 and 26 to our audited consolidatedfinancial statements included elsewhere in this Annual Report on Form 20-F for further information.
We and our subsidiaries paid taxes computed on income reported for local statutory tax purposes. We basedthis computation on local statutory tax rules, which differ substantially from IFRS. Certain items that arecapitalized under IFRS are recognized under local statutory accounting principles as an expense in the year paid.In contrast, numerous expenses reported in the financial statements prepared under IFRS are not tax deductibleunder local legislation. As a consequence, our effective tax rate was different under IFRS from the statutory rate.
Critical Accounting Policies
Please refer to Notes 3 and 4 to our audited consolidated financial statements included elsewhere in thisAnnual Report on Form 20-F.
Reportable Segments
We present our reportable segments based on economic environments and stages of development indifferent geographical areas, requiring different investment and marketing strategies.
As of December 31, 2016, our reportable segments consist of the seven following segments:
• Russia;
• Pakistan;
• Algeria;
• Bangladesh;
• Ukraine;
• Uzbekistan; and
• HQ (transactions related to management activities within the group).
98
Italy is no longer a reportable segment following the completion of the Italy Joint Venture. For moreinformation, please see Notes 6, 13 and 26 to our audited consolidated financial statements included elsewhere inthis Annual Report on Form 20-F, “—Key Developments and Trends—Italy Joint Venture” and “ExplanatoryNote—Accounting Treatment of our Historical WIND Business and the new Italy Joint Venture.”
For historical periods prior to the year ended December 31, 2016, we reported an “HQ and Others” segment,comprised of our current “HQ” segment and our current “Others” category (which includes customer numbers inKazakhstan, Kyrgyzstan, Armenia, Tajikistan, Georgia and Laos). As of December 31, 2016, “Others” is nolonger a reportable segment but only a reconciling column in our financial statements and therefore, we reportrevenue and Adjusted EBITDA for “Others” only as a reconciling line item between our seven reportablesegments and our total revenue and Adjusted EBITDA. For comparability purposes, the financial data for theyears ended December 31, 2015 and 2014 has been represented to show our revenue and Adjusted EBITDA ineach of HQ and Others on a stand-alone basis, with Others including Kazakhstan, as discussed further below. Wealso include herein customer numbers for the “Others” category, which includes our customers in Kazakhstan,Kyrgyzstan, Armenia, Tajikistan, Georgia and Laos.
From January 1, 2015 through June 30, 2016, management organized our business in eight reportablesegments consisting of our seven current reporting segments, taking into account the change described abovefrom “HQ and Others” to solely “HQ,” and Kazakhstan. In the second quarter of 2016, management decided tono longer include Kazakhstan as a separate reportable segment due to the decreasing impact of operations inKazakhstan on the overall business and therefore we included Kazakhstan in the “Others” category for the yearended December 31, 2016, which is now reported separately from “HQ”. Our annual consolidated financialstatements for the years ended December 31, 2015 and December 31, 2014 included in this Annual Report onForm 20-F have been restated for this organizational change such that Kazakhstan is included in the “Others”reconciling column for those years. Customer numbers for Kazakhstan are included in our “Others” categorypresented herein.
Key Developments and Trends
Customer and revenue growth
The mobile markets in Russia, Algeria, Ukraine, Kazakhstan, Kyrgyzstan, Armenia, Georgia, Tajikistan andItaly have each reached mobile penetration rates exceeding 100.0%. As a result, we will focus less on customermarket share growth and more on revenue market share growth in each of these markets. The key components ofour growth strategy in these markets will be to increase our share of the high-value customer market, increaseusage of data, improve customer loyalty and retain our customers.
The remaining mobile markets in which we operate, including Pakistan and Bangladesh, are still in a phaseof customer growth with mobile penetration rates substantially lower than in our other markets. In these markets,our management expects revenue growth to come primarily from customer growth in the short-term andincreasing usage of voice and data traffic in the medium term.
Our management expects revenue growth in our mobile business to come primarily from an increase in datarevenue and the ability to upsell our customers, and in our fixed-line business from broadband, as well asbusiness and corporate services.
New dividend policy
Our supervisory board approved a new dividend policy following the completion of the Italy Joint Venture,improved cash flows and stabilization of the macroeconomic environment. For the financial year endedDecember 31, 2016, we intend to pay a dividend in the aggregate amount of US$23 cents per share, comprised ofUS$3.5 cents per share paid as an interim dividend in December 2016 and US$19.5 cents per share, with a recorddate of March 30, 2017 and which is intended to be paid on April 12, 2017. Thereafter, we aim to pay asustainable and progressive dividend based on the evolution of our equity free cash flow, which is defined as netcash flow from operating activities less net cash used in investing activities, as reported in our consolidatedfinancial statements.
99
Strong competition in Russia
In Russia, we see continued signs of strong competition in the market, with pricing pressure on devices andincreased data allowances, while the macro environment remains challenging. We are aiming to improve thecustomer proposition in Russia by focusing on customer service, offering integrated bundles including voice,text, and data, and introducing innovative products and services.
Italy Joint Venture
On August 6, 2015, VEON Ltd., which indirectly owned 100% of Wind Telecomunicazioni S.p.A.(“WIND”), together with its subsidiary VimpelCom Amsterdam B.V., and Hutchison, together with certain of itssubsidiaries, entered into a contribution and framework agreement to form an equal joint venture holdingcompany, the “Italy Joint Venture,” that would own and operate their telecommunications businesses in Italy. OnSeptember 1, 2016, the European Commission approved the 50/50 Italy Joint Venture of WIND and 3 Italia, andthe French operator Iliad as an appropriate remedy taker. On October 24, 2016, VEON and Hutchison alsoreceived final approval from the Ministry of Economic Development (Ministero dello Sviluppo Economico)(“MISE”) in Italy for their 50/50 Italy Joint Venture to merge their mobile businesses. The transaction wascompleted on November 5, 2016.
Each of Hutchison and VEON Ltd. indirectly holds 50% of the shares in the Italy Joint Venture, andtherefore, as a consequence of the completion, VEON no longer owns a majority interest or has control over theoperations of WIND. Pursuant to the terms of a shareholders’ deed, no party may reduce its aggregate indirectholding in the Italy Joint Venture below 50% for the first year following completion. After the first year, eitherparty may sell its shares in the Italy Joint Venture to third parties after offering a right of first offer to the otherparty. Once three years following the completion of the Italy Joint Venture have elapsed, each shareholder caninvoke a buy/sell mechanism at any time.
The scale and financial strength of the combined business, characterized by strong spectrum assets, willenable the Italy Joint Venture to improve coverage, accelerate 4G/LTE mobile broadband rollout and providegreater reliability and enhanced download speeds to its customers. The Italy Joint Venture benefits from scaleand synergies which are expected to unlock investment in Italy’s digital infrastructure. Further, its delivery ofmobile broadband is expected to play an important part in supporting the Italian government’s goal in its DigitalItaly Plan, which aims to achieve 85% take-up of 100 megabytes broadband coverage by 2020. The investmentwill also complement the Enel Open Fibre project, which is already supported by WIND. As of December 31,2016, the Italy Joint Venture had 31.3 million mobile customers.
We account for the Italy Joint Venture using the equity method. We do not control the Italy Joint Venture.For further information on the basis of finance treatment of the Italy operations see Notes 6, 13 and 26 to ouraudited consolidated financial statements included elsewhere in this Annual Report on Form 20-F and“Explanatory Note—Accounting Treatment of our Historical WIND Business and the new Italy Joint Venture.”
Pakistan Merger
On November 26, 2015, WTPL (the parent company and majority shareholder of Warid), Bank Alfalah,International Wireless Communications Pakistan Limited (a wholly owned subsidiary of GTH) and PakistanMobile Communications Ltd (an indirect subsidiary of VEON, “PMCL”) entered into an agreement to mergetheir telecommunications businesses in Pakistan (the “Pakistan Merger”). WTPL and Bank Alfalah (together the“Dhabi Group Shareholders”) agreed to acquire approximately 15% of the shares of PMCL in exchange for theacquisition of 100% of the shares of Warid by PMCL.
On July 1, 2016, the transaction to merge PMCL and Warid was completed. Accordingly, PMCL holds100% of Warid’s shares, and the Dhabi Group Shareholders have acquired 15% of the shares of PMCL, subjectto potential post-completion adjustments against a pre-agreed formula.
100
Historically, Warid was in competition in Pakistan with subsidiaries of our shareholder, Telenor. Due to thestructural and economic links between Telenor and VEON, the Competition Commission of Pakistan issued anorder in 2011 and strengthened the order in 2016 following the merger, placing certain restrictions on the tradingand sharing agreements between Telenor and the newly merged entity.
The historical Mobilink and Warid brands now operate on a joint basis under the “Jazz” brand. Thecombined entity now has a single board and management structure.
Over 50 million customers in Pakistan now benefit from high-speed mobile telecommunications and abest-in-class digital mobile network from the combined PMCL and Warid entity. It is expected that the combinedentity will be the leading telecommunications provider of 2G, 3G and 4G/LTE services in Pakistan, providinghigher quality national voice and data coverage, faster downloads, and a wider portfolio of products and services.
Disposal of Non-Core Assets and Network and Tower Sharing Agreements
As part of our strategy under our new VEON brand, we aim to move towards an asset-light network modelthrough the disposal of non-core assets, potential sales of tower businesses and the sharing of networks.
On November 30, 2016, we exited the telecommunications market in Zimbabwe through the sale by GTH ofTelecel International Limited to ZARNet (Private) Limited (“ZARNet”).
In March 2015, our wholly owned subsidiary, WIND Italy, sold 90% of the shares of its wholly ownedtowers subsidiary, Galata, to Cellnex. WIND Italy has a put option, and Cellnex has a call option, over the 10%of the share capital of Galata retained by WIND Italy. Through the historical WIND agreement, the Italy JointVenture now has a tower services agreement with Galata for an initial term of 15 years for the provision of abroad range of services on the sites contributed to Galata by WIND Italy and the sites subsequently built byGalata hosting WIND Italy’s equipment.
In December 2014, our wholly owned subsidiary, PJSC VimpelCom, entered into an agreement with MTSfor the joint planning, development and operation of 4G/LTE networks in 36 regions of Russia with an agreedextension of up to 41 regions. In December 2015, PJSC VimpelCom and MTS signed an amendment to theDecember 2014 agreement that provides for the sharing of 2600 MHz 4G/LTE frequencies in 20 of the 36regions of Russia that were covered by the original 2014 agreement. In each of these regions, PJSC VimpelComand MTS plan to share airwaves and radio frequency channels across all base stations that they jointly usepursuant to the 2014 agreement, and the amendment allows for further expansion of the list of regions covered bythe agreement.
Similarly, in December 2015, PJSC VimpelCom entered into an agreement with MegaFon for the jointplanning, development and operation of 4G/LTE networks in ten regions of Russia.
In August 2016, we have entered into a network sharing agreement with Kcell for the joint deployment of4G/LTE services in Kazakhstan. For further information, see “Item 4—Information on the Company—Property,Plant and Equipment—Mobile Telecommunications Equipment and Operations—Site Procurement andMaintenance.”
Multi-Currency Term Loan and Revolving Facilities Agreement
On February 16, 2017, VEON Ltd. entered into a new multi-currency term loan and revolving facilitiesagreement (the “TL/RCF”) of up to US$2.25 billion for VimpelCom Holdings B.V. (“VIP Holdings”). TheTL/RCF replaced the now cancelled US$1.8 billion revolving credit facility signed in 2014. The term loanfacility has a five-year tenor and the revolving credit facility has an initial tenor of three years, with VIPHoldings having the right to request two one-year extensions to the tenor of the revolving credit facility, subject
101
to lender consent. Several international banks have committed to the TL/RCF in an aggregate amount ofUS$2.108 billion. The TL/RCF includes an option to increase the amount of the facility up to the full amount ofUS$2.25 billion, which would consist of a term loan facility of US$562,500,000 and a revolving credit facility ofUS$1,687,500,000. VIP Holdings will have the option to make each drawdown under the facilities in eitherU.S. dollars or euros.
Telenor Share Sale and Exchangeable Bond Issuance
In September 2016, Telenor East sold 163,875,000 of VEON Ltd.’s ADSs pursuant to an underwrittenoffering. We did not receive any proceeds from the offering, and Telenor East’s sale of the ADSs did not result indilution of our issued and outstanding shares. The ADSs were offered only by means of a prospectus and anaccompanying prospectus supplement forming a part of the effective Registration Statement.
In addition, in a transaction outside the United States to non-US persons pursuant to Regulation S under theSecurities Act, Telenor East issued a US$1,000,000,000 0.25% bond due 2019 that is exchangeable under certainconditions for up to a total at issuance of 204,081,633 of VEON Ltd.’s ADSs (subject to adjustment) at anexchange price representing a premium of 40% to the public offering price of the ADSs at the issue date.
Telenor East has announced its intention to divest the remainder of its stake in VEON Ltd.
Management Changes in Operating Companies
In 2016, we had management changes in key roles at several operating companies. On September 5, 2016VEON accepted the resignation of Mikhail Slobodin as CEO of PJSC VimpelCom and appointed Kjell Johnsen,who leads VEON’s Major Markets, as Head of Russia. We also appointed a new CEO in Algeria and AamirIbrahim succeeded Jeffrey Hedberg as CEO in Pakistan following the Pakistan Merger and Mr. Hedberg’s newappointment as Group Chief People Officer. While we anticipate an integration period for these managementchanges, we believe that the new appointments will continue to drive the company’s transformation.
Biometric SIM verification in Bangladesh
In December 2015, the government of Bangladesh introduced biometric SIM verification, which is amandated initiative that requires mobile phone operators to verify each customer using fingerprints in order toensure authentic registration, proper accountability and increased security. This verification initiative hasimpacted revenue dynamics and customer growth across the market, resulted in 3.8 million SIM cards beingblocked by Banglalink and may require additional funds and/or focus and resources on the part of BDCL’s orVEON Ltd.’s management.
GTH Share Buy-Back and Cancellation of GDR Program
In February 2017, our owned Egyptian subsidiary, GTH, completed a fixed price buy-back program toacquire up to 10% of the total issued share capital of GTH at a price per share of Egyptian pounds 7.90 and for atotal consideration of up to Egyptian pounds 4.1 billion (the “Share Buy-Back”). GTH launched the ShareBuy-Back primarily to maximize shareholder value, to reduce GTH’s share capital and as a supportive action tothe cancellation of the listing of its GDRs on the Official List of the Financial Conduct Authority and the tradingof GDRs on the Main Market for Listed Securities of the London Stock Exchange (the “GDR Listing”), in orderto provide the holders of GDRs in GTH an opportunity to dispose of all or some of their GDRs prior to thecancellation of the GDR Listing, which was approved during the extraordinary general assembly meeting of theshareholders on February 6, 2017. As a result, the GDR Listing ceased on March 20, 2017. GTH will keep itssingle listing on the Egyptian Stock Exchange in Cairo. Upon ratification by the Egyptian Financial SupervisoryAuthority of the board minutes for the cancellation of the GDR program, our shareholding in GTH will increaseto 57.7% from 51.9%.
102
Factors Affecting Comparability of Our 2016, 2015 and 2014 Financial Position and Results of Operations
Our comparability between the periods presented below was affected by the classification of Italy as anasset held for sale and a discontinued operation from January 1, 2016 to November 5, 2016 and its subsequentdeconsolidation and the acquisition of an investment in a joint venture. For more information, please see Note 6to our audited consolidated financial statements included elsewhere in this Annual Report on Form 20-F, “—KeyDevelopments and Trends—Italy Joint Venture” and “Explanatory Note—Accounting Treatment of ourHistorical WIND Business and the new Italy Joint Venture.”
On July 1, 2016, VEON Ltd., together with its subsidiary GTH, acquired 100% of the voting shares inWarid, a mobile telecommunications provider. VEON Ltd. consolidated Warid financials in the Pakistan segmentstarting from July 1, 2016, which affects comparability with previous periods. For more information regardingour acquisitions and dispositions, see “—Key Developments and Trends—Pakistan Merger” and Note 6 to ouraudited consolidated financial statements incorporated herein.
We do not provide comparable financial information for periods preceding the date on which we acquired,consolidated or commenced operations in a particular country or segment, or following the date of disposalunless required by IFRS applied by VEON Ltd.
In general, our selected operating and financial data, audited consolidated financial statements and relatednotes included elsewhere in this Annual Report on Form 20-F and the following discussion and analysis reflectthe contribution of the operators we acquired from their respective dates of acquisition or consolidation andtherefore such acquisitions affect the comparability of data between periods.
In 2016, we reached resolutions with the SEC, the DOJ and the OM relating to previously disclosedinvestigations under the FCPA and relevant Dutch laws and paid fines and disgorgements to the SEC, the DOJand the OM. All fines are paid and accounted for in 2016, though we anticipate some ongoing compliance costsgoing forward. For further details related to these agreements, please see “Item 8—Financial Information—A.Consolidated Statements and Other Financial Information—A.7. Legal Proceedings,” Notes 25 and 27 to ouraudited consolidated financial statements included elsewhere in this Annual Report on Form 20-F, “Item 3—KeyInformation—D. Risk Factors—Risks Related to Our Business—We have incurred and are continuing to incurcosts and related management oversight obligations in connection with our obligations under the DPA, the SECJudgment and the Dutch Settlement Agreement, which may be significant” and “Item 3—Key Information—D.Risk Factors—Risks Related to Our Business—We could be subject to criminal prosecution or civil sanction ifwe breach the DPA with the DOJ, the SEC Judgment or the Dutch Settlement Agreement, and we may face otherpotentially negative consequences relating to the investigations by, and agreements with, the DOJ, SEC and OM,including additional investigations and litigation” in this Annual Report on Form 20-F.
Certain Ongoing Factors Affecting Our Financial Position and Results of Operations
Our financial position and results of operations for the three years ended December 31, 2016 as reflected inour audited consolidated financial statements included elsewhere in this Annual Report on Form 20-F have beeninfluenced by the factors listed below. For a discussion of the key developments trends, commitments or eventsthat are likely to have a material effect on our results of operation for the current financial year, see “—KeyDevelopments and Trends.”
Economic trends
Our financial position and results of operations are affected by the economic conditions in the countries inwhich we operate, including a macroeconomic slowdown in Russia, Ukraine and other countries in 2014 and2015. Low oil prices, together with the impact of economic sanctions – including those promulgated by theUnited States, which restrict certain financial transactions and dealings, even by non-U.S. persons, involvingcertain industries and parties in Russia and resulting from the current situation in Ukraine – and the significant
103
devaluation of the ruble, negatively impacted the Russian economy and economic outlook. In both 2014 and2015, the significant depreciation of the ruble against the U.S. dollar in particular negatively impacted our resultsof operations and resulted in a foreign currency exchange loss in 2014 and 2015. In addition, the significantdevaluation of the Ukrainian hryvnia in 2015 (partly due to the National Bank of Ukraine’s decision in February2015 to suspend its interventions to support the currency), the Algerian dinar in 2015, and the Kazakh tenge in2015 (in the absence of a currency stabilization policy in Kazakhstan) negatively impacted revenues in ourUkraine and Algeria segments, and our historical Kazakhstan segment, respectively, and our results of operationsin 2015. However, we have seen stabilization of most of the currencies and macroeconomic conditions in thecountries in which we operate during 2016.
Inflation
Inflation affects the purchasing power of our mass market customers, as well as corporate clients. Thevalues of the Russian, Ukrainian, Kazakh and Algerian currencies, for example, have declined significantly inresponse to political and economic issues since December 31, 2013, and, although the rates appeared to stabilizein some countries in 2016, they may continue to decline.
The table below shows the inflation rates for the years ended December 31, 2016, 2015 and 2014, and thesource of the inflation rates.
December 31,
Country 2016 2015 2014 Source
Russia 5.4% 12.9% 11.4% The Russian Federal State Statistics ServicePakistan 3.7% 3.2% 4.3% The Pakistan Bureau of StatisticsAlgeria 5.2%(1) 4.4% 5.3% The Central Bank of AlgeriaBangladesh 5.0% 6.1% 6.1% The Central Bank of BangladeshUkraine 12.4% 43.3% 24.9% The State Statistics Committee of UkraineUzbekistan 8.0% 9.1% 9.8% The International Monetary FundKyrgyzstan (0.5)%(2) 4.9%(3) 10.5% The International Monetary FundArmenia (1.1)% (0.1)% 4.6% The National Statistical Service of the Republic of ArmeniaTajikistan 7.0% 11.7% 7.4% The International Monetary FundGeorgia 1.8% 4.9% 2.0% The Ministry of Economic Development of the Republic of
GeorgiaLaos 2.5% 0.9% 2.4% The Bank of the Lao People’s Democratic RepublicKazakhstan 8.5% 13.6% 7.4% The Agency of Statistics of the Republic of Kazakhstan
(1) As at October 31, 2016.(2) As at November 30, 2016.(3) As at October 31, 2015.
For a discussion of the inflation rates for the Italy Joint Venture, please see “—Italy—Inflation.”
Please also see “Item 3—Key Information—D. Risk Factors—Risks Related to Our Business—We areexposed to foreign currency exchange loss and currency fluctuation and convertibility translation risks,” and“Item 3—Key Information—D. Risk Factors—Risks Related to Our Markets—The international economicenvironment could cause our business to decline.”
Foreign Currency Translation
Our audited consolidated financial statements included elsewhere in this Annual Report on Form 20-F arepresented in U.S. dollars. Amounts included in these financial statements were presented in accordance withIAS 21, The Effects of Changes in Foreign Exchange Rates, using the current rate method of currency translationwith the U.S. dollar as the reporting currency. The current rate method assumes that assets and liabilitiesmeasured in the functional currency are translated into U.S. dollars at exchange rates prevailing on the balancesheet date; whereas revenue, expenses, gains and losses are translated into U.S. dollars at historical exchange
104
rates prevailing on the transaction dates. We translate income statement amounts using the average exchangerates for the period. Translation adjustments resulting from the process of translating financial statements intoU.S. dollars are reported in accumulated other comprehensive income, a separate component of equity.
Our results of operations are affected by increases or decreases in the value of the U.S. dollar or our functioncurrencies. A higher average exchange rate correlates to a weaker functional currency. We have listed below therelevant exchange rates for each of our countries of operation for the years ended December 31, 2016, 2015 and2014. These should not be construed as a representation that such currency will in the future be convertible intoU.S. dollars or other foreign currency at the exchange rate shown, or at any other exchange rates.
Russia
The national currency of Russia is the Russian ruble. We have determined that the functional currency forRussia is the Russian ruble. As of December 31, 2016, 2015 and 2014, the official Central Bank of RussiaRussian ruble-U.S. dollar exchange rates were 60.66, 72.88 and 56.26 Russian rubles per U.S. dollar,respectively. During 2016, the average Russian ruble to U.S. dollar exchange rate was 10.0% higher than theaverage Russian ruble to U.S. dollar exchange rate during 2015. During 2015, the average Russian ruble-U.S.dollar exchange rate was 58.7% higher than the average Russian ruble-U.S. dollar exchange rate during 2014.
Pakistan
The national currency of Pakistan is the Pakistani rupee. We have determined that the functional currencyfor Pakistan is the Pakistani rupee. As of December 31, 2016, 2015 and 2014, the Pakistani rupee-U.S. dollarexchange rates were 104.37, 104.73 and 100.52 Pakistani rupee per U.S. dollar respectively, as provided byBloomberg Finance L.P. During the 2016, the average Pakistani rupee to U.S. dollar exchange rate was 1.9%higher than the average Pakistani rupee to U.S. dollar exchange rate during 2015. During 2015, the averagePakistani rupee-U.S. dollar exchange rate was 1.7% higher than the average Pakistani rupee-U.S. dollar exchangerate during 2014.
Algeria
The national currency of Algeria is the Algerian dinar. We have determined that the functional currency forAlgeria is the Algerian dinar. As of December 31, 2016, 2015 and 2014, the Algerian dinar-U.S. dollar exchangerates were 110.40, 107.10 and 87.92 Algerian dinar per U.S. dollar respectively, as provided by BloombergFinance L.P. During 2016, the average Algerian dinar to U.S. dollar exchange rate was 9.0% higher than theaverage Algerian dinar to U.S. dollar exchange rate during 2015. During 2015, the average Algerian dinar-U.S.dollar exchange rate was 24.5% higher than the average Algerian dinar-U.S. dollar exchange rate during 2014.
Bangladesh
The national currency of Bangladesh is the Bangladeshi taka. We have determined that the functionalcurrency for Bangladesh is the Bangladeshi taka. As of December 31, 2016, 2015 and 2014, the Bangladeshitaka-U.S. dollar exchange rates were 78.92, 78.25 and 77.93 Bangladeshi taka per U.S. dollar respectively, asprovided by Bloomberg Finance L.P. During 2016, the average Bangladeshi taka to U.S. dollar exchange ratewas 0.6% higher than the average Bangladeshi taka to U.S. dollar exchange rate during 2015. During 2015, theaverage Bangladeshi taka-U.S. dollar exchange rate was 0.5% higher than the average Bangladeshi taka-U.S.dollar exchange rate during 2014.
Ukraine
The national currency of Ukraine is the Ukrainian hryvnia. We have determined that the functional currencyof our subsidiary in Ukraine is the Ukrainian hryvnia, as it reflects the economic substance of the underlyingevents and circumstances of the company. The Ukrainian hryvnia is not a convertible currency outside Ukraine.As of December 31, 2016, 2015 and 2014, the official National Bank of Ukraine (NBU) hryvnia-U.S. dollar
105
exchange rates were 27.19, 24.00 and 15.77 Ukrainian hryvnia per U.S. dollar, respectively. During 2016, theaverage Ukrainian hryvnia to U.S. dollar exchange rate was 17.0% higher than the average Ukrainian hryvnia toU.S. dollar exchange rate during 2015. During 2015, the average Ukrainian hryvnia-U.S. dollar NBU exchangerate was 83.3% higher than the average Ukrainian hryvnia-U.S. dollar NBU exchange rate during 2014.
Uzbekistan
The national currency of Uzbekistan is the Uzbek som. Historically, the functional currency of ouroperations in Uzbekistan has been the U.S. dollar as opposed to the Uzbek som. During 2014, we concluded thatthe Uzbek som should be the functional currency for Uzbekistan as it more clearly reflects the economicsubstance of the underlying events and circumstances of the company. The change did not have material impacton our operations. The Uzbek som is not a convertible currency outside Uzbekistan. As of December 31, 2016,2015 and 2014, the official Central Bank of the Republic of Uzbekistan som-U.S. dollar exchange rates were3,231.48, 2,809.98 and 2,422.4 Uzbek som per U.S. dollar, respectively. During 2016, the average Uzbek som toU.S. dollar exchange rate was 15.5% higher than the average Uzbek som to U.S. dollar exchange rate during2015. During 2015, the average Uzbek som-U.S. dollar exchange rate was 11.1% higher than the average Uzbeksom-U.S. dollar exchange rate during 2014.
Other Countries
Kazakhstan
The national currency of the Republic of Kazakhstan is the Kazakh tenge. We have determined that thefunctional currency of our subsidiary in Kazakhstan is the Kazakh tenge, as it reflects the economic substance ofthe underlying events and circumstances of the company. The Kazakh tenge is not a convertible currency outsideKazakhstan. As of December 31, 2016, 2015 and 2014, the official National Bank of Kazakhstan tenge-U.S.dollar exchange rates were 333.29, 339.47 and 182.35 Kazakh tenge per U.S. dollar, respectively. During 2016,the average Kazakh tenge to U.S. dollar exchange rate was 53.8% higher than the average Kazakh tenge to U.S.dollar exchange rate during 2015. During 2015, the average Kazakh tenge-U.S. dollar exchange rate was 24.1%higher than the average Kazakh tenge-U.S. dollar exchange rate during 2014.
Kyrgyzstan
The national currency of Kyrgyzstan is the Kyrgyz som. We have determined that the functional currency ofour subsidiary in Kyrgyzstan is the Kyrgyz som, as it reflects the economic substance of the underlying eventsand circumstances of the company. The Kyrgyz som is not a convertible currency outside Kyrgyzstan. As ofDecember 31, 2016, 2015 and 2014, the official National Bank of the Kyrgyz Republic Kyrgyz som-U.S. dollarexchange rates were 69.23, 75.90 and 58.89 Kyrgyz som per U.S. dollar, respectively. During 2016, the averageKyrgyz som to U.S. dollar exchange rate was 8.4% higher than the average Kyrgyz som to U.S. dollar exchangerate during 2015. During 2015, the average Kyrgyz som-U.S. dollar exchange rate was 20.2% higher than theaverage Kyrgyz som-U.S. dollar exchange rate during 2014.
Armenia
The national currency of Armenia is the Armenian dram. We have determined that the functional currencyof our subsidiary in Armenia is the Armenian dram, as it reflects the economic substance of the underlyingevents and circumstances of the company. The Armenian dram is not a convertible currency outside Armenia. Asof December 31, 2016, 2015 and 2014, the official Central Bank of Armenia Armenian dram-U.S. dollarexchange rates were 483.94, 483.75 and 474.97 Armenian drams per U.S. dollar, respectively. During 2016, theaverage Armenian dram to U.S. dollar exchange rate was 0.6% higher than the average Armenian dram to U.S.dollar exchange rate during 2015. During 2015, the average Armenian dram-U.S. dollar exchange rate was14.9% higher than the average Armenian dram-U.S. dollar exchange rate during 2014.
106
Tajikistan
The national currency of Tajikistan is the Tajik somoni. The Tajik somoni is not a convertible currencyoutside Tajikistan. We have determined that the functional currency of our subsidiary in Tajikistan is the U.S.dollar, as it reflects the economic substance of the underlying events and circumstances of the company becausethe company generates most of its revenue from international traffic termination which is priced and paid in theU.S. dollars. In addition, a substantial part of capital expenditures is purchased from international suppliers andpriced and paid in the U.S. dollars.
Georgia
The national currency of Georgia is the Georgian lari. We have determined that the functional currency ofour subsidiary in Georgia is the Georgian lari, as it reflects the economic substance of the underlying events andcircumstances of the company. The Georgian lari is not a convertible currency outside Georgia. As ofDecember 31, 2016, 2015 and 2014, the official National Bank of Georgia Georgian lari-U.S. dollar exchangerates were 2.65, 2.39, and 1.86 Georgian lari per U.S. dollar, respectively. During 2016, the average Georgian larito U.S. dollar exchange rate was 4.3% higher than the average Georgian lari to U.S. dollar exchange rate during2015. During 2015, the average Georgian lari-U.S. dollar exchange rate was 28.6% higher than the averageGeorgian lari-U.S. dollar exchange rate during 2014.
Laos
The national currency of Laos is the Lao kip. We have determined that the functional currency of oursubsidiary in Laos is the Lao kip, as it reflects the economic substance of the underlying events andcircumstances of the company. The Lao kip is not a convertible currency outside Laos. As of December 31,2016, 2015 and 2014, Lao kip-U.S. dollar exchange rates were 8,184.00, 8,148.00 and 8,099.05 Lao kip per U.S.dollar respectively, as provided by Bloomberg Finance L.P. During 2016, the average Lao kip to U.S. dollarexchange rate was 0.1% lower than the average Lao kip to U.S. dollar exchange rate during 2015. During 2015,the average Lao kip-U.S. dollar exchange rate was 1.0% higher than the average Lao kip-U.S. dollar exchangerate during 2014.
Italy Joint Venture
For a discussion of foreign currency translation for the Italy Joint Venture, please see “—Italy—ForeignCurrency Translation.”
We have implemented a number of risk management activities to minimize currency risk and exposure incertain of the countries in which we, or the Italy Joint Venture operates, as further described in the section of thisAnnual Report on Form 20-F entitled “Item 11—Quantitative and Qualitative Disclosures About Market Risk.”
Foreign Currency Controls and Currency Restrictions
We face currency restrictions or local regulations that impact our ability to extract cash from some of ouroperating companies.
The official currency in Uzbekistan is not convertible outside Uzbekistan due to local government orbanking regulations, delays and restrictions on exchange rates. In addition, currency restrictions have made itdifficult to acquire equipment produced outside of Uzbekistan for use in building and maintaining the company’stelecommunications network. In December 2016, a draft Resolution of the President of Uzbekistan wasintroduced outlining reforms in currency control planned in 2017, including gradual introduction of freeconversion of currency. However, it is not yet clear what the changes will be, and when they will be introduced.
107
In Ukraine, “Kyivstar” JSC cannot expatriate dividends to VEON Ltd. because of restrictions imposed bythe National Bank of Ukraine in 2014 to regulate money, credit and currency in Ukraine. Although several ofthese restrictions were substantially softened and partially abolished in June 2016, several restrictions remain inplace in order to prevent any negative impact of currency outflow on the financial market. For example, onlydividends accrued in 2014-2015 may be distributed; the monthly amount subject to repatriation is limited toUS$5.0 million (in equivalent); there is a detailed examination by the National Bank of Ukraine of all foreigncurrency purchases at the inter-bank currency market for more than US$50,000 equivalent; the purchase ofcurrency (not to exceed US$50,000 equivalent) cannot be made earlier than on the third working day; there is aban on the purchase of foreign currency if a client has a US$25,000 equivalent existing already on its accounts;and there is an obligatory sale of 65% of incomings in a foreign currency. For more information about risksrelated to currency exchange rate fluctuations, see “Item 11—Quantitative and Qualitative Disclosures AboutMarket Risk” and Notes 5 and 18 to our audited consolidated financial statements included elsewhere in thisAnnual Report on Form 20-F.
The banking system in Algeria is still in a period of improvement. The Central Bank has increased thecontrols on banks, imports (including the implementation of specific licenses for some products), and on theinternational transfers of funds. From October 2013, a special dispensation from the Bank of Algeria wasrequired for importing 3G equipment and systems. The dispensation was granted in October 2013 and requiredprior approval from the ARPT and the MPTIC of the detailed lists of equipment and systems to be imported. Inaddition, there was a ban in place for our non-3G equipment and systems, which, together with the approvalprocedure for 3G equipment and systems, caused delays in our procurement process. However, the ban was liftedon January 28, 2015, and from that date, Optimum has been able to import equipment and exchange foreigncurrency.
In Bangladesh, strict foreign exchange regulations require regulatory approval before a company can engagein certain foreign exchange transactions.
Similarly, in Pakistan, foreign currency financing agreements must be registered with the State Bank ofPakistan, and if there is a default, any default interest payment may require regulatory approval. In addition, theState Bank of Pakistan’s approval is also required for hedging loans denominated in foreign currencies.
Tax
In the future, we expect that our results of operations may be affected by a new finance law in Algeria,coming into effect in 2017, which will increase VAT from 7% to 19% on data services and from 17% to 19% onvoice services, and additionally, will increase taxes on recharges from 5% to 7%.
For more information on the regulatory environment in which we operate, see Exhibit 99.2—Regulation ofTelecommunications.
Certain Performance Indicators
The following discussion analyzes certain operating data, including Adjusted EBITDA, mobile customers,mobile MOU, mobile ARPU, mobile data customers and fixed-line broadband customers that are not included inour financial statements. We provide this operating data because it is regularly reviewed by our management andour management believes it is useful in evaluating our performance from period to period as set out below. Ourmanagement believes that presenting information about Adjusted EBITDA, customers, mobile MOU, mobileARPU and mobile data customers is useful in assessing the usage and acceptance of our mobile and broadbandproducts and services. This operating data is unaudited.
108
Adjusted EBITDA
The following table shows our Adjusted EBITDA and Adjusted EBITDA margin for the years endedDecember 31, 2016, 2015 and 2014. Adjusted EBITDA and Adjusted EBITDA margin are non-IFRS financialmeasures.
Year ended December 31,
2016 2015(1) 2014(1)
(in millions of U.S. dollars)
Other data:Adjusted EBITDA(1) . . . . . . . . . . . . . . . . . . . . . . . . . . . . . . . . . . . . . . . . . . . 3,232 2,875 5,560Adjusted EBITDA margin(1) . . . . . . . . . . . . . . . . . . . . . . . . . . . . . . . . . . . . . 36.4% 29.9% 41.2%
(1) Please see “Explanatory Note—Non-IFRS Financial Measures” for more information on how we calculate Adjusted EBITDA andAdjusted EBITDA Margin.
A reconciliation of Adjusted EBITDA to profit/(loss) before tax for the years ended December 31, 2016,2015 and 2014, is presented below.
Year ended December 31,
2016 2015 2014
(in millions of U.S. dollars)
Adjusted EBITDA . . . . . . . . . . . . . . . . . . . . . . . . . . . . . . . . . . . . . . . . . . . . . . . . 3,232 2,875 5,560Depreciation . . . . . . . . . . . . . . . . . . . . . . . . . . . . . . . . . . . . . . . . . . . . . . . . . (1,439) (1,550) (1,996)Amortization . . . . . . . . . . . . . . . . . . . . . . . . . . . . . . . . . . . . . . . . . . . . . . . . . (497) (517) (647)Impairment loss . . . . . . . . . . . . . . . . . . . . . . . . . . . . . . . . . . . . . . . . . . . . . . . (192) (245) (976)Loss on disposals of non-current assets . . . . . . . . . . . . . . . . . . . . . . . . . . . . (20) (39) (68)Finance costs . . . . . . . . . . . . . . . . . . . . . . . . . . . . . . . . . . . . . . . . . . . . . . . . . (830) (829) (1,077)Finance income . . . . . . . . . . . . . . . . . . . . . . . . . . . . . . . . . . . . . . . . . . . . . . . 69 52 52Other non-operating losses/(gains) . . . . . . . . . . . . . . . . . . . . . . . . . . . . . . . . (82) (42) 121Shares of (loss)/profit of associates and joint ventures accounted for using
the equity method . . . . . . . . . . . . . . . . . . . . . . . . . . . . . . . . . . . . . . . . . . . 48 14 (38)Impairment of associates and joint ventures accounted for using the equity
method . . . . . . . . . . . . . . . . . . . . . . . . . . . . . . . . . . . . . . . . . . . . . . . . . . . . (99) — —Net foreign exchange gain/(loss) . . . . . . . . . . . . . . . . . . . . . . . . . . . . . . . . . 157 (314) (556)
Profit/(loss) before tax . . . . . . . . . . . . . . . . . . . . . . . . . . . . . . . . . . . . . . . . . . . . . 347 (595) 375
The following table shows our cash flows as of and for the years ended December 31, 2016, 2015 and 2014.
As of and for the year endedDecember 31,
2016 2015 2014
(in millions of U.S. dollars)
Cash flow data:Net cash from/(used in) operating activities . . . . . . . . . . . . . . . . . . . . . . . . 1,875 2,033 5,279
from continued operations . . . . . . . . . . . . . . . . . . . . . . . . . . . . . . . . . . . . 1,192 1,104 4,613from discontinued operations . . . . . . . . . . . . . . . . . . . . . . . . . . . . . . . . . 683 929 666
Net cash from/(used in) investing activities . . . . . . . . . . . . . . . . . . . . . . . . (2,671) (2,634) (3,977)
from continued operations . . . . . . . . . . . . . . . . . . . . . . . . . . . . . . . . . . . . (2,022) (2,494) (2,993)from discontinued operations . . . . . . . . . . . . . . . . . . . . . . . . . . . . . . . . . (649) (140) (984)
Net cash from/(used in) before financing activities . . . . . . . . . . . . . . . . . . . (796) (601) 1,302Net cash from/(used in) financing activities . . . . . . . . . . . . . . . . . . . . . . . . (126) (1,439) 1,329
from continued operations . . . . . . . . . . . . . . . . . . . . . . . . . . . . . . . . . . . . (106) (732) 2,007from discontinued operations . . . . . . . . . . . . . . . . . . . . . . . . . . . . . . . . . (20) (707) (678)
109
Mobile Customers
We offer both postpaid and prepaid services to mobile customers. As of December 31, 2016, the number ofour mobile customers reached 207.5 million. Mobile customers are generally customers in the registeredcustomer base as of a given measurement date who engaged in a revenue generating activity at any time duringthe three months prior to such measurement date. Such activity includes any outgoing calls, customer feeaccruals, debits related to service, outgoing SMS and MMS, data transmission and receipt sessions, but does notinclude incoming calls, SMS and MMS or abandoned calls. Our total number of mobile customers also includescustomers using mobile internet service via USB modems. The following table indicates our mobile customerfigures in millions for the periods indicated:
As of December 31,
2016 2015 2014
Russia . . . . . . . . . . . . . . . . . . . . . . . . . . . . . . . . . . . . . . . . . . . . . . . . . . . . . . . 58.3 59.8 57.2Pakistan . . . . . . . . . . . . . . . . . . . . . . . . . . . . . . . . . . . . . . . . . . . . . . . . . . . . . . 51.6 36.2 38.5Algeria . . . . . . . . . . . . . . . . . . . . . . . . . . . . . . . . . . . . . . . . . . . . . . . . . . . . . . . 16.3 17.0 17.7Bangladesh . . . . . . . . . . . . . . . . . . . . . . . . . . . . . . . . . . . . . . . . . . . . . . . . . . . 30.4 32.3 30.8Ukraine . . . . . . . . . . . . . . . . . . . . . . . . . . . . . . . . . . . . . . . . . . . . . . . . . . . . . . 26.1 25.4 26.2Uzbekistan . . . . . . . . . . . . . . . . . . . . . . . . . . . . . . . . . . . . . . . . . . . . . . . . . . . . 9.5 9.9 10.6Others(1) . . . . . . . . . . . . . . . . . . . . . . . . . . . . . . . . . . . . . . . . . . . . . . . . . . . . . . 15.3 15.7 16.1Total number of mobile customers(2) . . . . . . . . . . . . . . . . . . . . . . . . . . . . . . 207.5 196.3 197.1
(1) Includes operations in Kazakhstan, Kyrgyzstan, Armenia, Tajikistan, Georgia and Laos for all periods. For a discussion of the treatmentof our “Others” category and our operations in Kazakhstan for each of the periods discussed in this Annual Report on Form 20-F, pleasesee “—Reportable Segments.”
(2) The customer numbers for 2016, 2015 and 2014 have been adjusted to remove customers in operations that have been sold and exclude(i) the customers in our historical WIND business as of December 31, 2014 and 2015 and (ii) the customers in the new Italy JointVenture as of December 31, 2016.
MOU
Mobile MOU measures the monthly average minutes of voice service use per mobile customer. Wegenerally calculate mobile MOU by dividing the total number of minutes of usage for incoming and outgoingcalls during the relevant period (excluding guest roamers) by the average number of mobile customers during theperiod and dividing by the number of months in that period.
The Algeria, Pakistan and Bangladesh segments for the years ended December 31, 2013 and 2012 measuredmobile MOU based on billed minutes, which is calculated by the total number of minutes of usage for outgoingcalls (and for Pakistan also includes minutes of usage generated from incoming revenue). This definition differsfrom the definition of MOU above. Mobile MOU in the Algeria, Pakistan and Bangladesh segments has beenrestated to use the group definition for the years ended December 31, 2016, 2015 and 2014.
ARPU
Mobile ARPU measures the monthly average revenue per mobile user. We generally calculate mobileARPU by dividing our mobile service revenue during the relevant period, including data revenue, roamingrevenue and interconnect revenue, but excluding revenue from connection fees, sales of handsets and accessoriesand other non-service revenue, by the average number of our mobile customers during the period and dividing bythe number of months in that period.
Mobile Data Customers
Mobile data customers are mobile customers who have engaged in revenue generating activity during thethree months prior to the measurement date as a result of activities including USB modem Internet access using2.5G/3G/4G/LTE/HSPA+ technologies. Our historical WIND business measures mobile data customers based on
110
the number of active contracts signed and includes customers who have performed at least one mobile Internetevent during the previous month. For Algeria, mobile data customers are 3G customers who have performed atleast one mobile data event on the 3G network during the previous four months.
Fixed-Line Broadband Customers
Fixed broadband customers are fixed customers in the registered customer base who were engaged in arevenue generating activity using fixed broadband Internet access in the three-month period prior to themeasurement date. In Russia and Ukraine, such activity includes monthly internet access using FTTB, xDSL andWi-Fi technologies.
Recent Accounting Pronouncements
Please refer to Note 3 to our audited consolidated financial statements included elsewhere in this AnnualReport on Form 20-F for a discussion of new accounting pronouncements not yet adopted by the company.
Results of Operations
Overview
Our total operating revenue was US$8,885 million for the year ended December 31, 2016, compared toUS$9,606 million for the year ended December 31, 2015. Our operating profit was US$1,084 million for the yearended December 31, 2016, compared to US$524 million for the year ended December 31, 2015. The profit forthe year attributable to the owners of the parent was US$2,328 million for the year ended December 31, 2016,compared to a loss of US$655 million for the year ended December 31, 2015. For a discussion of the materialchanges between periods, see “—Consolidated Results—Year Ended December 31, 2016 Compared to YearEnded December 31, 2015.”
We use the U.S. dollar as our reporting currency. The functional currencies of our group are the Russianruble in Russia, the Pakistani rupee in Pakistan, the Algerian dinar in Algeria, the Bangladeshi taka inBangladesh, the Ukrainian hryvnia in Ukraine, the Kazakh tenge in the Republic of Kazakhstan, the Uzbek somin Uzbekistan, the Kyrgyz som in Kyrgyzstan, the Armenian dram in the Republic of Armenia, the U.S. dollar inTajikistan, the Georgian lari in Georgia and the Lao kip in Laos. The functional currency of the Italy JointVenture is the euro.
Due to the significant fluctuation of the non-U.S. dollar functional currencies against the U.S. dollar in the periodscovered by this discussion and analysis, changes in our consolidated operating results in functional currencies differfrom changes in our operating results in reporting currencies during some of these periods. In the following discussionand analysis, we have indicated our operating results in both reporting and functional currencies and the devaluation orappreciation of functional currencies where it is material to explaining our operating results. For more informationabout exchange rates relating to our functional currencies, see “—Certain Ongoing Factors Affecting Our FinancialPosition and Results of Operations—Foreign Currency Translation” below.
111
Consolidated results
The financial results for 2015 and 2014 reflect the classification of WIND as a discontinued operation. Ourfinancial results for 2016 include the 10 months ended October 31, 2016 with WIND classified as a discontinuedoperation and the two months ended December 31, 2016 with the Italy Joint Venture accounted for as an equityinvestment.
Year ended December 31,
2016 2015(1) 2014(1)
(in millions of U.S. dollars, except pershare amounts and as indicated)
Consolidated income statements data:Service revenue . . . . . . . . . . . . . . . . . . . . . . . . . . . . . . . . . . . . . . . . . . . . . . . . . . . . . . . . . . . 8,553 9,313 13,200Sale of equipment and accessories . . . . . . . . . . . . . . . . . . . . . . . . . . . . . . . . . . . . . . . . . . . . . 184 190 218Other revenue . . . . . . . . . . . . . . . . . . . . . . . . . . . . . . . . . . . . . . . . . . . . . . . . . . . . . . . . . . . . . 148 103 68
Total operating revenue . . . . . . . . . . . . . . . . . . . . . . . . . . . . . . . . . . . . . . . . . . . . . . . . . . . . . . . 8,885 9,606 13,486
Operating expensesService costs . . . . . . . . . . . . . . . . . . . . . . . . . . . . . . . . . . . . . . . . . . . . . . . . . . . . . . . . . . . . . . 1,769 1,937 2,931Cost of equipment and accessories . . . . . . . . . . . . . . . . . . . . . . . . . . . . . . . . . . . . . . . . . . . . 216 231 252Selling, general and administrative expenses . . . . . . . . . . . . . . . . . . . . . . . . . . . . . . . . . . . . 3,668 4,563 4,743Depreciation . . . . . . . . . . . . . . . . . . . . . . . . . . . . . . . . . . . . . . . . . . . . . . . . . . . . . . . . . . . . . . 1,439 1,550 1,996Amortization . . . . . . . . . . . . . . . . . . . . . . . . . . . . . . . . . . . . . . . . . . . . . . . . . . . . . . . . . . . . . 497 517 647Impairment loss . . . . . . . . . . . . . . . . . . . . . . . . . . . . . . . . . . . . . . . . . . . . . . . . . . . . . . . . . . . 192 245 976Loss on disposals of non-current assets . . . . . . . . . . . . . . . . . . . . . . . . . . . . . . . . . . . . . . . . . 20 39 68
Total operating expenses . . . . . . . . . . . . . . . . . . . . . . . . . . . . . . . . . . . . . . . . . . . . . . . . . . . . . . . 7,801 9,082 11,613
Operating profit . . . . . . . . . . . . . . . . . . . . . . . . . . . . . . . . . . . . . . . . . . . . . . . . . . . . . . . . . . . . . . 1,084 524 1,873Finance costs . . . . . . . . . . . . . . . . . . . . . . . . . . . . . . . . . . . . . . . . . . . . . . . . . . . . . . . . . . . . . 830 829 1,077Finance income . . . . . . . . . . . . . . . . . . . . . . . . . . . . . . . . . . . . . . . . . . . . . . . . . . . . . . . . . . . (69) (52) (52)Other non-operating losses/(gains) . . . . . . . . . . . . . . . . . . . . . . . . . . . . . . . . . . . . . . . . . . . . 82 42 (121)Share of (profit) / loss of associates and joint ventures accounted for using the equity
method . . . . . . . . . . . . . . . . . . . . . . . . . . . . . . . . . . . . . . . . . . . . . . . . . . . . . . . . . . . . . . . . (48) (14) 38Impairment of associates and joint ventures accounted for using the equity method . . . . . . 99 — —Net foreign exchange (gain)/ loss . . . . . . . . . . . . . . . . . . . . . . . . . . . . . . . . . . . . . . . . . . . . . (157) 314 556
Profit/(loss) before tax . . . . . . . . . . . . . . . . . . . . . . . . . . . . . . . . . . . . . . . . . . . . . . . . . . . . . . . . . 347 (595) 375
Income tax expense . . . . . . . . . . . . . . . . . . . . . . . . . . . . . . . . . . . . . . . . . . . . . . . . . . . . . . . . 635 220 598
(Loss)/profit for the year from continuing operations . . . . . . . . . . . . . . . . . . . . . . . . . . . . . . . (288) (815) (223)
Profit/(loss) after tax for the period from discontinued operations . . . . . . . . . . . . . . . . . . . . 920 262 (680)Profit on disposal of discontinued operations, net of tax . . . . . . . . . . . . . . . . . . . . . . . . . . . . 1,788 — —
Profit/(loss) after tax for the period from discontinued operations . . . . . . . . . . . . . . . . . . . . 2,708 262 (680)Profit/(loss) for the year . . . . . . . . . . . . . . . . . . . . . . . . . . . . . . . . . . . . . . . . . . . . . . . . . . . . . . . . 2,420 (553) (903)Attributable to:
The owners of the parent (continuing operations) . . . . . . . . . . . . . . . . . . . . . . . . . . . . . . . . . (380) (917) 33The owners of the parent (discontinued operations) . . . . . . . . . . . . . . . . . . . . . . . . . . . . . . . 2,708 262 (680)Non-controlling interest . . . . . . . . . . . . . . . . . . . . . . . . . . . . . . . . . . . . . . . . . . . . . . . . . . . . . 92 102 (256)
2,420 (553) (903)
Earnings/(loss) per share from continuing operationsBasic, (loss)/profit for the year attributable to ordinary equity holders of the parent . . . . . . . . . . (0.22) (0.52) 0.02Diluted, (loss)/profit for the year attributable to ordinary equity holders of the parent . . . . . . . . . (0.22) (0.52) 0.02Earnings/(loss) per share from discontinued operationsBasic, (loss)/profit for the year attributable to ordinary equity holders of the parent . . . . . . . . . . 1.55 0.15 (0.39)Diluted, (loss)/profit for the year attributable to ordinary equity holders of the parent . . . . . . . . . 1.55 0.15 (0.39)Weighted average number of common shares (millions) . . . . . . . . . . . . . . . . . . . . . . . . . . . . . . . 1,749 1,748 1,748Dividends declared per share . . . . . . . . . . . . . . . . . . . . . . . . . . . . . . . . . . . . . . . . . . . . . . . . . . . . . 0.23 0.035 0.035
(1) Certain comparative amounts have been reclassified to conform to the current period’s presentation. For more information, please refer toNote 8 of our audited consolidated financial statements included elsewhere in this Annual Report on Form 20-F.
112
The tables below show for the periods indicated selected information about the results of operations in eachof our reportable segments. For more information regarding our segments, see Note 7 to our audited consolidatedfinancial statements included elsewhere in this Annual Report on Form 20-F.
Segmentation of Total Operating Revenue (in millions of U.S. dollars)
Year ended December 31,
2016 2015 2014
in millions of U.S. dollars
Russia(1) . . . . . . . . . . . . . . . . . . . . . . . . . . . . . . . . . . . . . . . . . . . . . . . . . . . . . . . . . 4,097 4,583 7,428Pakistan . . . . . . . . . . . . . . . . . . . . . . . . . . . . . . . . . . . . . . . . . . . . . . . . . . . . . . . . . 1,295 1,014 1,010Algeria . . . . . . . . . . . . . . . . . . . . . . . . . . . . . . . . . . . . . . . . . . . . . . . . . . . . . . . . . . 1,040 1,273 1,692Bangladesh . . . . . . . . . . . . . . . . . . . . . . . . . . . . . . . . . . . . . . . . . . . . . . . . . . . . . . 621 604 563Ukraine . . . . . . . . . . . . . . . . . . . . . . . . . . . . . . . . . . . . . . . . . . . . . . . . . . . . . . . . . 586 622 1,062Uzbekistan . . . . . . . . . . . . . . . . . . . . . . . . . . . . . . . . . . . . . . . . . . . . . . . . . . . . . . . 663 711 718HQ(2) . . . . . . . . . . . . . . . . . . . . . . . . . . . . . . . . . . . . . . . . . . . . . . . . . . . . . . . . . . . 10 — —Others(3) . . . . . . . . . . . . . . . . . . . . . . . . . . . . . . . . . . . . . . . . . . . . . . . . . . . . . . . . . 573 799 1,013
Total . . . . . . . . . . . . . . . . . . . . . . . . . . . . . . . . . . . . . . . . . . . . . . . . . . . . . . . . . . . 8,885 9,606 13,486
(1) Certain comparative amounts have been reclassified to conform to the current period’s presentation. For more information, please refer toNote 8 of our audited consolidated financial statements included elsewhere in this Annual Report on Form 20-F.
(2) HQ includes transactions related to management activities within the group, reported as a stand-alone segment for the year endedDecember 31, 2016 and restated as a separate segment for the years ended December 31, 2015 and 2014. For a discussion of thetreatment of our “HQ” segment for each of the periods discussed in this Annual Report on Form 20-F, please see “—ReportableSegments.”
(3) Beginning with the year ended December 31, 2016, “Others” is no longer a reportable segment and therefore is included herein for theyear December 31, 2016 only as a reconciling category between our total revenue and the revenue of our seven reportable segments. Forhistorical periods, “Others” has been included as a stand-alone segment for purposes of reconciliation with the historical “HQ andOthers” segment data. For a discussion of the treatment of our “Others” segment and our operations in Kazakhstan for each of theperiods discussed in this Annual Report on Form 20-F, please see “—Reportable Segments.”
Segmentation of Total Operating Revenue (as a percentage of total operating revenue)
Year ended December 31,
2016 2015 2014
(percentage of totaloperating revenue)
Russia(1) . . . . . . . . . . . . . . . . . . . . . . . . . . . . . . . . . . . . . . . . . . . . . . . . . . . . . . 46% 48% 55%Pakistan . . . . . . . . . . . . . . . . . . . . . . . . . . . . . . . . . . . . . . . . . . . . . . . . . . . . . . 15% 11% 7%Algeria . . . . . . . . . . . . . . . . . . . . . . . . . . . . . . . . . . . . . . . . . . . . . . . . . . . . . . . 12% 13% 13%Bangladesh . . . . . . . . . . . . . . . . . . . . . . . . . . . . . . . . . . . . . . . . . . . . . . . . . . . 7% 6% 4%Ukraine . . . . . . . . . . . . . . . . . . . . . . . . . . . . . . . . . . . . . . . . . . . . . . . . . . . . . . 7% 6% 8%Uzbekistan . . . . . . . . . . . . . . . . . . . . . . . . . . . . . . . . . . . . . . . . . . . . . . . . . . . . 7% 7% 5%HQ(2) . . . . . . . . . . . . . . . . . . . . . . . . . . . . . . . . . . . . . . . . . . . . . . . . . . . . . . . . 0% — —Others(3) . . . . . . . . . . . . . . . . . . . . . . . . . . . . . . . . . . . . . . . . . . . . . . . . . . . . . . 6% 8% 8%
(1) Certain comparative amounts have been reclassified to conform to the current period’s presentation. For more information, please refer toNote 8 of our audited consolidated financial statements included elsewhere in this Annual Report on Form 20-F.
(2) HQ includes transactions related to management activities within the group. For a discussion of the treatment of our “HQ” segment foreach of the periods discussed in this Annual Report on Form 20-F, please see “—Reportable Segments.”
(3) Beginning with the year ended December 31, 2016, “Others” is no longer a reportable segment and therefore is included herein for theyear December 31, 2016 only as a reconciling category between our total revenue and the revenue of our seven reportable segments. Forhistorical periods, “Others” has been included as a stand-alone segment for purposes of reconciliation with the historical “HQ andOthers” segment data. For a discussion of the treatment of our “Others” segment and our operations in Kazakhstan for each of theperiods discussed in this Annual Report on Form 20-F, please see “—Reportable Segments.”
113
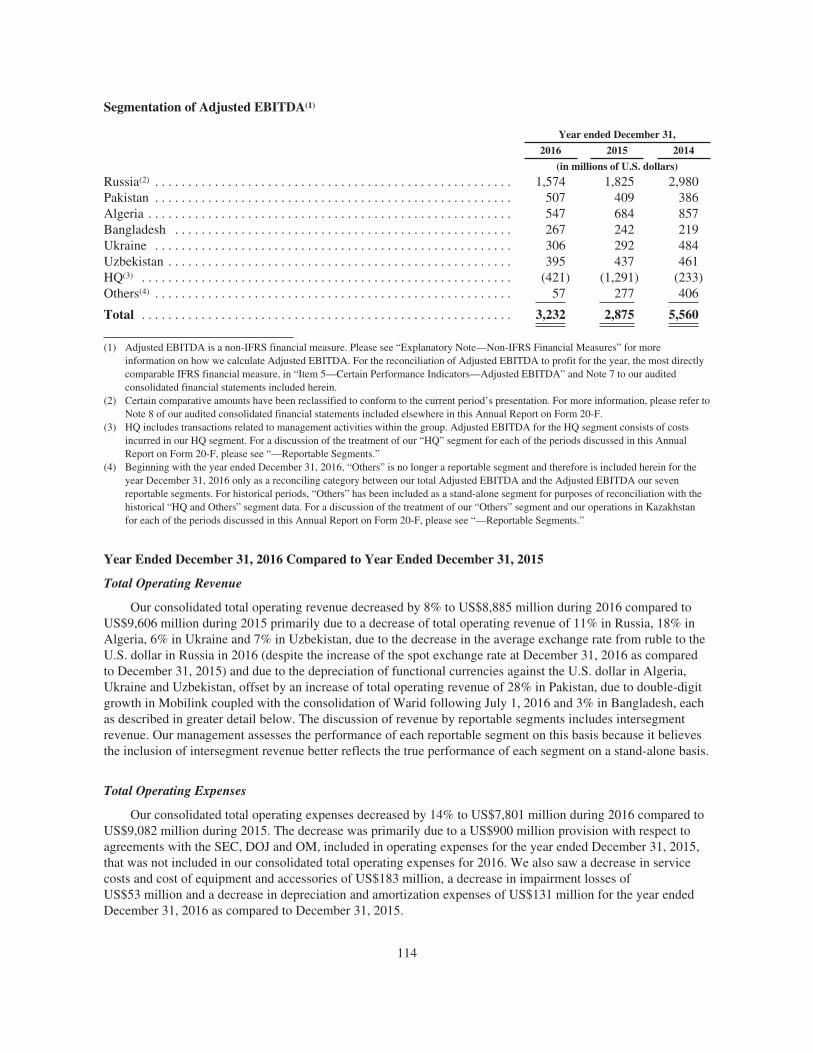
Segmentation of Adjusted EBITDA(1)
Year ended December 31,
2016 2015 2014
(in millions of U.S. dollars)
Russia(2) . . . . . . . . . . . . . . . . . . . . . . . . . . . . . . . . . . . . . . . . . . . . . . . . . . . . . . 1,574 1,825 2,980Pakistan . . . . . . . . . . . . . . . . . . . . . . . . . . . . . . . . . . . . . . . . . . . . . . . . . . . . . . 507 409 386Algeria . . . . . . . . . . . . . . . . . . . . . . . . . . . . . . . . . . . . . . . . . . . . . . . . . . . . . . . 547 684 857Bangladesh . . . . . . . . . . . . . . . . . . . . . . . . . . . . . . . . . . . . . . . . . . . . . . . . . . . 267 242 219Ukraine . . . . . . . . . . . . . . . . . . . . . . . . . . . . . . . . . . . . . . . . . . . . . . . . . . . . . . 306 292 484Uzbekistan . . . . . . . . . . . . . . . . . . . . . . . . . . . . . . . . . . . . . . . . . . . . . . . . . . . . 395 437 461HQ(3) . . . . . . . . . . . . . . . . . . . . . . . . . . . . . . . . . . . . . . . . . . . . . . . . . . . . . . . . (421) (1,291) (233)Others(4) . . . . . . . . . . . . . . . . . . . . . . . . . . . . . . . . . . . . . . . . . . . . . . . . . . . . . . 57 277 406
Total . . . . . . . . . . . . . . . . . . . . . . . . . . . . . . . . . . . . . . . . . . . . . . . . . . . . . . . . 3,232 2,875 5,560
(1) Adjusted EBITDA is a non-IFRS financial measure. Please see “Explanatory Note—Non-IFRS Financial Measures” for moreinformation on how we calculate Adjusted EBITDA. For the reconciliation of Adjusted EBITDA to profit for the year, the most directlycomparable IFRS financial measure, in “Item 5—Certain Performance Indicators—Adjusted EBITDA” and Note 7 to our auditedconsolidated financial statements included herein.
(2) Certain comparative amounts have been reclassified to conform to the current period’s presentation. For more information, please refer toNote 8 of our audited consolidated financial statements included elsewhere in this Annual Report on Form 20-F.
(3) HQ includes transactions related to management activities within the group. Adjusted EBITDA for the HQ segment consists of costsincurred in our HQ segment. For a discussion of the treatment of our “HQ” segment for each of the periods discussed in this AnnualReport on Form 20-F, please see “—Reportable Segments.”
(4) Beginning with the year ended December 31, 2016, “Others” is no longer a reportable segment and therefore is included herein for theyear December 31, 2016 only as a reconciling category between our total Adjusted EBITDA and the Adjusted EBITDA our sevenreportable segments. For historical periods, “Others” has been included as a stand-alone segment for purposes of reconciliation with thehistorical “HQ and Others” segment data. For a discussion of the treatment of our “Others” segment and our operations in Kazakhstanfor each of the periods discussed in this Annual Report on Form 20-F, please see “—Reportable Segments.”
Year Ended December 31, 2016 Compared to Year Ended December 31, 2015
Total Operating Revenue
Our consolidated total operating revenue decreased by 8% to US$8,885 million during 2016 compared toUS$9,606 million during 2015 primarily due to a decrease of total operating revenue of 11% in Russia, 18% inAlgeria, 6% in Ukraine and 7% in Uzbekistan, due to the decrease in the average exchange rate from ruble to theU.S. dollar in Russia in 2016 (despite the increase of the spot exchange rate at December 31, 2016 as comparedto December 31, 2015) and due to the depreciation of functional currencies against the U.S. dollar in Algeria,Ukraine and Uzbekistan, offset by an increase of total operating revenue of 28% in Pakistan, due to double-digitgrowth in Mobilink coupled with the consolidation of Warid following July 1, 2016 and 3% in Bangladesh, eachas described in greater detail below. The discussion of revenue by reportable segments includes intersegmentrevenue. Our management assesses the performance of each reportable segment on this basis because it believesthe inclusion of intersegment revenue better reflects the true performance of each segment on a stand-alone basis.
Total Operating Expenses
Our consolidated total operating expenses decreased by 14% to US$7,801 million during 2016 compared toUS$9,082 million during 2015. The decrease was primarily due to a US$900 million provision with respect toagreements with the SEC, DOJ and OM, included in operating expenses for the year ended December 31, 2015,that was not included in our consolidated total operating expenses for 2016. We also saw a decrease in servicecosts and cost of equipment and accessories of US$183 million, a decrease in impairment losses ofUS$53 million and a decrease in depreciation and amortization expenses of US$131 million for the year endedDecember 31, 2016 as compared to December 31, 2015.
114
Adjusted EBITDA
Our consolidated Adjusted EBITDA increased by 12% to US$3,232 million during 2016 compared toUS$2,875 million during 2015, primarily due to a US$900 million provision with respect to agreements with theSEC, DOJ and OM, included in operating expenses for the year ended December 31, 2015, that was not includedin our consolidated total operating expenses for 2016, which was partially offset by a decrease in revenue during2016. Adjusted EBITDA is a non-IFRS financial measure. Please see “Explanatory Note—Non-IFRS FinancialMeasures” for more information on how we calculate Adjusted EBITDA. For the reconciliation of AdjustedEBITDA to profit for the year, the most directly comparable IFRS financial measure, in “Item 5—CertainPerformance Indicators—Adjusted EBITDA” and Note 7 to our audited consolidated financial statementsincluded herein.
Depreciation and Amortization Expenses
Our consolidated depreciation and amortization expenses decreased by 6% to US$1,936 million in 2016compared to US$2,067 million in 2015. The decrease was primarily the result of depreciation of our functionalcurrencies against the U.S. dollar, partially offset by accelerated depreciation due to the equipment swap inUkraine and Pakistan.
Impairment Loss
Our consolidated impairment loss decreased by 22% to US$192 million in 2016 compared toUS$245 million in 2015. The impairment loss in 2016 primarily related to goodwill impairment in Kyrgyzstan ofUS$49 million; goodwill, property, equipment and intangible assets impairment in Tajikistan of US$76 million;property, equipment and intangible assets impairment in Georgia for US$29 million and a US$30 millionimpairment in connection with our transformation strategy and commitment to network modernization, includingour plans for re-evaluating our existing network. The impairment loss in 2015 primarily related to goodwillimpairment in Ukraine of US$51 million and in Armenia of US$44 million. For further information on ourimpairment loss, please see Note 10 of our audited consolidated financial statements included elsewhere in thisAnnual Report on Form 20-F.
Loss on Disposals of Non-current Assets
Our consolidated loss on disposals of non-current assets decreased by 49% to US$20 million during 2016compared to US$39 million during 2015, mainly due to relatively higher cash considerations received for assetssold.
Operating Profit
Our consolidated operating profit increased by 107% to US$1,084 million in 2016 compared toUS$524 million in 2015 due to the decrease of a provision with respect to agreements with the SEC, DOJ andOM, included in operating expenses for the year ended December 31, 2015, that was not included in ourconsolidated total operating expenses for 2016, and lower operating expenses, partially offset by overall decreasein revenue.
Non-operating Profits and Losses
Finance Costs and Finance Income
Our consolidated finance costs were broadly stable and amounted to US$830 million in 2016 compared toUS$829 million in 2015. Our finance income increased by 33% to US$69 million for the year endedDecember 31, 2016 compared to US$52 million for the year ended December 31, 2015, primarily due toincreased interest from bank deposits.
115
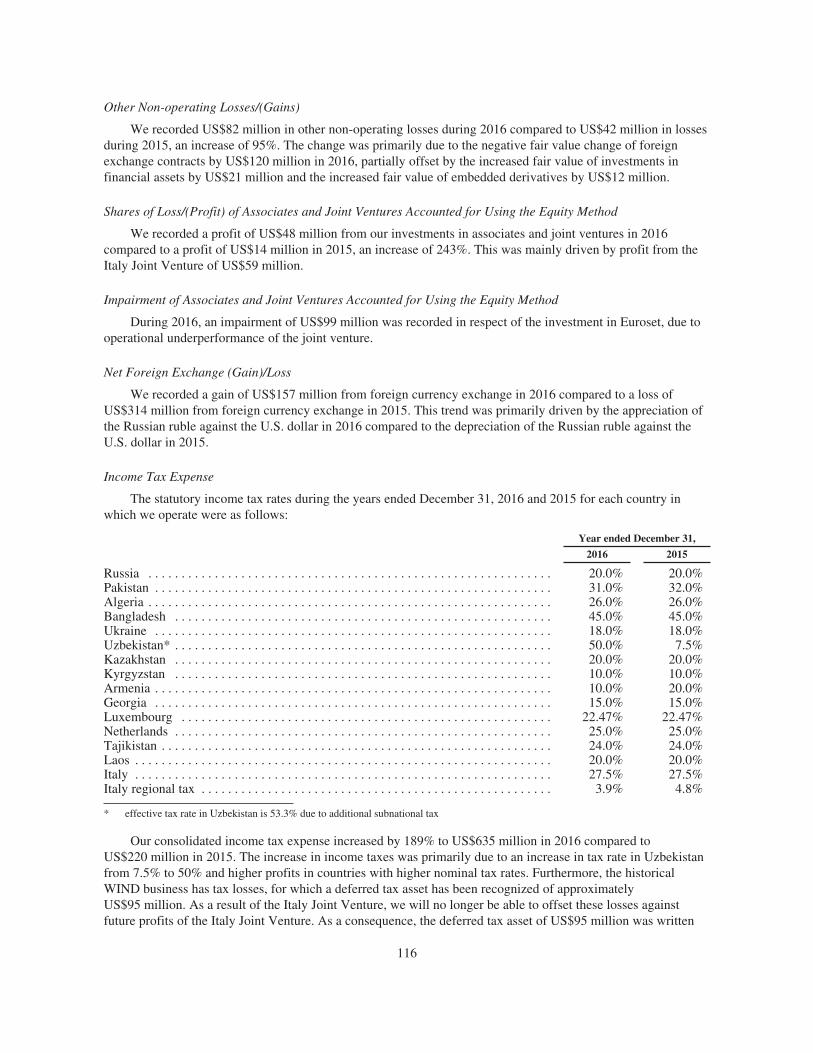
Other Non-operating Losses/(Gains)
We recorded US$82 million in other non-operating losses during 2016 compared to US$42 million in lossesduring 2015, an increase of 95%. The change was primarily due to the negative fair value change of foreignexchange contracts by US$120 million in 2016, partially offset by the increased fair value of investments infinancial assets by US$21 million and the increased fair value of embedded derivatives by US$12 million.
Shares of Loss/(Profit) of Associates and Joint Ventures Accounted for Using the Equity Method
We recorded a profit of US$48 million from our investments in associates and joint ventures in 2016compared to a profit of US$14 million in 2015, an increase of 243%. This was mainly driven by profit from theItaly Joint Venture of US$59 million.
Impairment of Associates and Joint Ventures Accounted for Using the Equity Method
During 2016, an impairment of US$99 million was recorded in respect of the investment in Euroset, due tooperational underperformance of the joint venture.
Net Foreign Exchange (Gain)/Loss
We recorded a gain of US$157 million from foreign currency exchange in 2016 compared to a loss ofUS$314 million from foreign currency exchange in 2015. This trend was primarily driven by the appreciation ofthe Russian ruble against the U.S. dollar in 2016 compared to the depreciation of the Russian ruble against theU.S. dollar in 2015.
Income Tax Expense
The statutory income tax rates during the years ended December 31, 2016 and 2015 for each country inwhich we operate were as follows:
Year ended December 31,
2016 2015
Russia . . . . . . . . . . . . . . . . . . . . . . . . . . . . . . . . . . . . . . . . . . . . . . . . . . . . . . . . . . . . . 20.0% 20.0%Pakistan . . . . . . . . . . . . . . . . . . . . . . . . . . . . . . . . . . . . . . . . . . . . . . . . . . . . . . . . . . . . 31.0% 32.0%Algeria . . . . . . . . . . . . . . . . . . . . . . . . . . . . . . . . . . . . . . . . . . . . . . . . . . . . . . . . . . . . . 26.0% 26.0%Bangladesh . . . . . . . . . . . . . . . . . . . . . . . . . . . . . . . . . . . . . . . . . . . . . . . . . . . . . . . . . 45.0% 45.0%Ukraine . . . . . . . . . . . . . . . . . . . . . . . . . . . . . . . . . . . . . . . . . . . . . . . . . . . . . . . . . . . . 18.0% 18.0%Uzbekistan* . . . . . . . . . . . . . . . . . . . . . . . . . . . . . . . . . . . . . . . . . . . . . . . . . . . . . . . . . 50.0% 7.5%Kazakhstan . . . . . . . . . . . . . . . . . . . . . . . . . . . . . . . . . . . . . . . . . . . . . . . . . . . . . . . . . 20.0% 20.0%Kyrgyzstan . . . . . . . . . . . . . . . . . . . . . . . . . . . . . . . . . . . . . . . . . . . . . . . . . . . . . . . . . 10.0% 10.0%Armenia . . . . . . . . . . . . . . . . . . . . . . . . . . . . . . . . . . . . . . . . . . . . . . . . . . . . . . . . . . . . 10.0% 20.0%Georgia . . . . . . . . . . . . . . . . . . . . . . . . . . . . . . . . . . . . . . . . . . . . . . . . . . . . . . . . . . . . 15.0% 15.0%Luxembourg . . . . . . . . . . . . . . . . . . . . . . . . . . . . . . . . . . . . . . . . . . . . . . . . . . . . . . . . 22.47% 22.47%Netherlands . . . . . . . . . . . . . . . . . . . . . . . . . . . . . . . . . . . . . . . . . . . . . . . . . . . . . . . . . 25.0% 25.0%Tajikistan . . . . . . . . . . . . . . . . . . . . . . . . . . . . . . . . . . . . . . . . . . . . . . . . . . . . . . . . . . . 24.0% 24.0%Laos . . . . . . . . . . . . . . . . . . . . . . . . . . . . . . . . . . . . . . . . . . . . . . . . . . . . . . . . . . . . . . . 20.0% 20.0%Italy . . . . . . . . . . . . . . . . . . . . . . . . . . . . . . . . . . . . . . . . . . . . . . . . . . . . . . . . . . . . . . . 27.5% 27.5%Italy regional tax . . . . . . . . . . . . . . . . . . . . . . . . . . . . . . . . . . . . . . . . . . . . . . . . . . . . . 3.9% 4.8%
* effective tax rate in Uzbekistan is 53.3% due to additional subnational tax
Our consolidated income tax expense increased by 189% to US$635 million in 2016 compared toUS$220 million in 2015. The increase in income taxes was primarily due to an increase in tax rate in Uzbekistanfrom 7.5% to 50% and higher profits in countries with higher nominal tax rates. Furthermore, the historicalWIND business has tax losses, for which a deferred tax asset has been recognized of approximatelyUS$95 million. As a result of the Italy Joint Venture, we will no longer be able to offset these losses againstfuture profits of the Italy Joint Venture. As a consequence, the deferred tax asset of US$95 million was written
116
down. In addition, in 2015 we decreased the provisions for future withholding taxes on intercompany dividendsby US$200 million. For information regarding our income tax, see Note 11 to our audited consolidated financialstatements included elsewhere in this Annual Report on Form 20-F.
(Loss)/profit for the year from continuing operations
In 2016, our consolidated loss for the period from continuing operations was US$288 million, compared toUS$815 million of loss in 2015, primarily as a result of the US$900 million provision with respect to agreementswith the SEC, DOJ and OM, included in operating expenses for the year ended December 31, 2015, that was notincluded in our consolidated total operating expenses for 2016, and for the other reasons described above. See“—Factors Affecting Comparability of Our 2016, 2015 and 2014 Financial Position and Results of Operations.”
Profit/(loss) for the year from discontinued operations
In 2016, our consolidated profit after tax for the period from discontinued operations, which is comprisedprimarily of our historical WIND operations in Italy, was US$2,708 million, compared to US$262 million ofprofit for the year ended December 31, 2015. The completion of the Italy Joint Venture transaction resulted in anon-cash gain on disposal of US$1,788 million, which is the difference between the book value of thedeconsolidated Italian operations and the fair value of the investment in the new joint venture recorded on thebalance sheet.
Profit for the Year Attributable to the Owners of the Parent
In 2016, the consolidated profit for the period attributable to the owners of the parent was US$2,328 millioncompared to a loss of US$655 million in 2015. The increase was mainly due to the gain recognized on thedisposal of the discontinued operation and other factors as discussed above.
Profit for the Year Attributable to Non-controlling Interest
Our profit for the period attributable to non-controlling interest was US$92 million in 2016 compared to aprofit of US$102 million, a decrease of 9.8%, in 2015 as a result of decreased profit for the year in Kazakhstanand Kyrgyzstan, partially offset by increased profit by Global Telecom Holding Group.
Year Ended December 31, 2015 Compared to Year Ended December 31, 2014
Total Operating Revenue
Our consolidated total operating revenue decreased by 29% to US$9,606 million during 2015 compared toUS$13,486 million during 2014 primarily due to decreases of total operating revenue of 38% in Russia, 25% inAlgeria and 41% in Ukraine, largely related to the depreciation of functional currencies against the U.S. dollar in2015, as described in greater detail below. The discussion of revenue by reportable segments includesintersegment revenue. Our management assesses the performance of each reportable segment on this basisbecause it believes the inclusion of intersegment revenue better reflects the true performance of each segment ona stand-alone basis.
Total Operating Expenses
Our consolidated total operating expenses decreased by 22% to US$9,082 million during 2015 compared toUS$11,613 million during 2014, and represented 95% and 86% of total operating revenue in 2015 and 2014,respectively. The decrease in absolute terms was primarily due to a decrease in service costs and cost of
117
equipment and accessories of US$1,015 million, lower impairment losses by US$731 million and a decrease indepreciation and amortization expenses of US$576 million. Our service costs and cost of equipment andaccessories was reclassified for the year ended December 31, 2015 to conform to the current period’spresentation. For more information, please refer to Note 8 of our audited consolidated financial statementsincluded elsewhere in this Annual Report on Form 20-F. Such decreases in 2015 compared to 2014, were largelyrelated to depreciation of functional currencies against the U.S. dollar in 2015, partially offset by recognizedexceptional items in a total amount of US$1,051 million in 2015, including the US$900 million provision withrespect to agreements with the SEC, DOJ and OM, included in operating expenses for the year endedDecember 31, 2015, and transformation costs of US$138 million related to our performance transformationprogram. In 2014, we recognized exceptional items in a total amount of US$65 million, mainly related to theclosing of the sale by GTH, of a non-controlling 51% interest in OTA to the Fonds National d’Investissement.
Service Costs
Our consolidated service costs decreased by 34% to US$1,937 million during 2015 compared toUS$2,931 million during 2014. As a percentage of consolidated total operating revenue, our service costsdecreased to 20% during 2015 compared to 22% during 2014. The decrease in absolute terms was primarily dueto decreased revenues related to currency devaluations of functional currencies against the U.S. dollar.
Cost of Equipment and Accessories
Our consolidated cost of equipment and accessories decreased by 8% to US$231 million in 2015 comparedto US$252 million in 2014. This decrease was primarily due to a devaluation of functional currencies against theU.S. dollar.
Selling, General and Administrative Expenses
Our consolidated selling, general and administrative expenses decreased by 4% to US$4,563 million during2015 compared to US$4,743 million during 2014. This decrease was primarily due to the depreciation offunctional currencies against the U.S. dollar, partially offset by recognized exceptional items in a total amount ofUS$1,051 million in 2015, including the US$900 million Uzbekistan provision in connection with theinvestigations by the SEC, DOJ and OM and transformation costs of US$138 million related to our performancetransformation program. In 2014, we recognized exceptional items in a total amount of US$65 million, mainlyrelated to the closing of the Algeria Transaction. For more information about our provisions, see Note 25 to ouraudited consolidated financial statements included elsewhere in this Annual Report on Form 20-F. As apercentage of consolidated total operating revenue, our consolidated selling, general and administrative expensesincreased to 47% in 2015 compared to 35% in 2014, mainly due to the exceptional items mentioned above.
Adjusted EBITDA
Our consolidated adjusted EBITDA decreased by 48% to US$2,875 million during 2015 compared toUS$5,560 million during 2014, primarily due to decreased revenues related to currency devaluations and theexceptional items mentioned above. Adjusted EBITDA is a non-IFRS financial measure. Please see “ExplanatoryNote—Non-IFRS Financial Measures” for more information on how we calculate Adjusted EBITDA. For thereconciliation of Adjusted EBITDA to profit for the year, the most directly comparable IFRS financial measure,in “Item 5—Certain Performance Indicators—Adjusted EBITDA” and Note 7 to our audited consolidatedfinancial statements included herein.
Depreciation and Amortization Expenses
Our consolidated depreciation and amortization expenses decreased by 22% to US$2,067 million in 2015compared to US$2,643 million in 2014. The decrease was primarily the result of depreciation of our functionalcurrencies against the U.S. dollar.
118
Impairment Loss
Our consolidated impairment loss was US$245 million in 2015 compared to US$976 million in 2014. Theimpairment loss in 2015 primarily related to impairment of obsolete network equipment in Pakistan ofUS$52 million, in Russia of US$28 million, obsolete network equipment and goodwill in Ukraine ofUS$66 million and impairment of goodwill in Armenia of US$44 million. The impairment loss in 2014 primarilyrelated to impairment of goodwill and other assets related to Ukraine of US$767 million, in Pakistan ofUS$163 million, and goodwill and other assets in Laos, Georgia, Bangladesh, Burundi and Central AfricanRepublic of US$172 million which was partially offset by an impairment release as a result of the sale of ourdebt and equity interest in Wind Canada of US$110 million.
Loss on Disposals of Non-current Assets
Our consolidated loss on disposals of non-current assets decreased by 43% to US$39 million during 2015compared to US$68 million during 2014, primarily due to depreciation of our functional currencies against theU.S. dollar.
Operating Profit
Our consolidated operating profit decreased to US$524 million in 2015 compared to US$1,873 million in2014 due to an overall decrease in revenue and the exceptional items mentioned above, offset by lowerimpairment. Our consolidated operating profit as a percentage of total operating revenue in 2015 decreased to 5%compared to 14% in 2014.
Non-operating Profits and Losses
Finance Costs and Finance Income
Our consolidated finance costs decreased by 23% to US$829 million in 2015 compared to US$1,077 millionin 2014, primarily due to a decrease in interest expense as a result of the redemption of certain bonds in April2015 through a cash tender offer by VimpelCom Amsterdam B.V. that resulted in the repurchase ofUS$1,838 million of bonds, as well as lower U.S. dollar equivalents of ruble-denominated interest expenses as aresult of the ruble depreciation. Our consolidated finance income remained at US$52 million in 2015.
Other Non-operating Losses/(Gains)
We recorded US$42 million in other non-operating losses during 2015 compared to US$121 million in gainsduring 2014. The change was primarily due to the positive movement in fair value of other derivatives ofUS$114 million recorded in 2014.
Shares of Loss/(Profit) of Associates and Joint Ventures Accounted for Using the Equity Method
We recorded a profit of US$14 million from our equity in associates and joint ventures in 2015 compared toa loss of US$38 million in 2014. The change was primarily due to the improved results of Euroset and the lossrecorded on the sale of Wind Canada in 2014.
Net Foreign Exchange (Gain)/Loss
We recorded a loss of US$314 million from foreign currency exchange in 2015 compared to a loss ofUS$556 million from foreign currency exchange in 2014. The loss in 2015 was primarily due to a revaluation ofour U.S. dollar net financial liabilities in both Russia and Ukraine primarily due to depreciation of the Russianruble and the Ukrainian hryvnia against the U.S. dollar in 2015. The loss in 2014 was primarily due torevaluation of our U.S. dollar net financial liabilities in Russia due to depreciation of the Russian ruble againstthe U.S. dollar in 2014.
119
Income Tax Expense
The statutory income tax rates during the years ended December 31, 2015 and 2014 for each country inwhich we operate were as follows:
Year ended December 31,
2015 2014
Russia . . . . . . . . . . . . . . . . . . . . . . . . . . . . . . . . . . . . . . . . . . . . . . . . . . . . . . . . . . . . . 20.0% 20.0%Pakistan . . . . . . . . . . . . . . . . . . . . . . . . . . . . . . . . . . . . . . . . . . . . . . . . . . . . . . . . . . . 32.0% 33.0%Algeria . . . . . . . . . . . . . . . . . . . . . . . . . . . . . . . . . . . . . . . . . . . . . . . . . . . . . . . . . . . . 26.0% 23.0%Bangladesh . . . . . . . . . . . . . . . . . . . . . . . . . . . . . . . . . . . . . . . . . . . . . . . . . . . . . . . . . 45.0% 45.0%Ukraine . . . . . . . . . . . . . . . . . . . . . . . . . . . . . . . . . . . . . . . . . . . . . . . . . . . . . . . . . . . 18.0% 18.0%Uzbekistan . . . . . . . . . . . . . . . . . . . . . . . . . . . . . . . . . . . . . . . . . . . . . . . . . . . . . . . . . 7.5% 8.0%Kazakhstan . . . . . . . . . . . . . . . . . . . . . . . . . . . . . . . . . . . . . . . . . . . . . . . . . . . . . . . . . 20.0% 20.0%Kyrgyzstan . . . . . . . . . . . . . . . . . . . . . . . . . . . . . . . . . . . . . . . . . . . . . . . . . . . . . . . . . 10.0% 10.0%Armenia . . . . . . . . . . . . . . . . . . . . . . . . . . . . . . . . . . . . . . . . . . . . . . . . . . . . . . . . . . . 20.0% 20.0%Georgia . . . . . . . . . . . . . . . . . . . . . . . . . . . . . . . . . . . . . . . . . . . . . . . . . . . . . . . . . . . 15.0% 15.0%Luxembourg . . . . . . . . . . . . . . . . . . . . . . . . . . . . . . . . . . . . . . . . . . . . . . . . . . . . . . . . 22.47% 22.47%Netherlands . . . . . . . . . . . . . . . . . . . . . . . . . . . . . . . . . . . . . . . . . . . . . . . . . . . . . . . . 25.0% 25.0%Tajikistan . . . . . . . . . . . . . . . . . . . . . . . . . . . . . . . . . . . . . . . . . . . . . . . . . . . . . . . . . . 24.0% 25.0%Laos . . . . . . . . . . . . . . . . . . . . . . . . . . . . . . . . . . . . . . . . . . . . . . . . . . . . . . . . . . . . . . 20.0% 20.0%Italy . . . . . . . . . . . . . . . . . . . . . . . . . . . . . . . . . . . . . . . . . . . . . . . . . . . . . . . . . . . . . . 27.5% 27.5%Italy regional tax . . . . . . . . . . . . . . . . . . . . . . . . . . . . . . . . . . . . . . . . . . . . . . . . . . . . 4.82% 4.55%
Our consolidated income tax expense decreased by 63% to US$220 million in 2015 compared toUS$598 million in 2014. The decrease in income taxes was primarily due to a decrease in provisions for futurewithholding taxes on intercompany dividends booked in 2015. In addition, our income tax expenses were higherin 2014 due to the tax consequences relating to the sale by GTH of a non-controlling 51% interest in OTA to theFonds National d’Investissement that were recorded in 2014.
For more information regarding income tax expenses please refer to Note 11 of our audited consolidatedfinancial statements included herein.
(Loss)/profit for the year from continuing operations
In 2015, our consolidated loss for the year from continuing operations was US$815 million, compared toUS$223 million of loss for 2014. The loss for the year ended December 31, 2015 was primarily attributable toexceptional items in total amount of US$1,051 million described above. See “—Key Developments andTrends—Investigations” and Note 25 to our audited consolidated financial statements included elsewhere in thisAnnual Report on Form 20-F.
(Loss)/profit after tax for the year from discontinued operations
In 2015, our consolidated profit after tax for the year from discontinued operations, which is comprisedprimarily of our historical WIND operations in Italy, was US$262 million, compared to US$680 million of lossfor 2014. In functional currency terms, total operating revenue for WIND in Italy decreased by 4% in 2015compared to 2014, primarily due to a decrease in our mobile revenues and a decrease in fixed-line revenues,attributable to a decline in voice volumes and a decrease in indirect customer base (subscribers who accessWIND’s network through Telecom Italia’s network but who are managed commercially by WIND, includingboth corporate and consumer subscribers). The 2015 results were positively influenced by the net effect ofWIND’s sale of 90% of the shares of its towers subsidiary, Galata, to Cellnex in the first quarter 2015 and areduction in financial expenses resulting from refinancing activities carried out in 2014 and 2015.
120
Profit for the Year Attributable to the Owners of the Parent
In 2015, the consolidated loss for the year attributable to the owners of the parent was US$655 millioncompared to a loss of US$647 million in 2014. The movement was mainly due to an overall decrease in revenueand the exceptional items mentioned above.
Profit for the Year Attributable to Non-controlling Interest
Our profit for the year attributable to non-controlling interest was US$102 million in 2015 compared to aloss of US$256 million in 2014, mainly due to the profit recorded at the GTH level. This primarily relates to theAlgerian results and the change in ownership that occurred during 2015.
Russia
Results of operations in US$
Year ended December 31, ‘15 – ‘16 ‘14 – ‘15
2016 2015(1) 2014(1) % change
in millions of U.S. dollars (except as indicated)
Total operating revenue . . . . . . . . . . . . . . . . . . . . . . . . . . . . . 4,097 4,583 7,428 (11)% (38)%Mobile service revenue . . . . . . . . . . . . . . . . . . . . . . . . . . . 3,276 3,624 5,845 (10)% (38)%—of which FMC . . . . . . . . . . . . . . . . . . . . . . . . . . . . . . . . 23 — — — ——of which mobile data . . . . . . . . . . . . . . . . . . . . . . . . . . . 778 719 1,003 8% (28)%Fixed-line service revenue . . . . . . . . . . . . . . . . . . . . . . . . 665 789 1,373 (16)% (42)%Sales of equipment, accessories and other . . . . . . . . . . . . 156 170 210 (8)% (20)%
Operating expenses . . . . . . . . . . . . . . . . . . . . . . . . . . . . . . . . . 2,523 2,758 4,448 (9)% (38)%Adjusted EBITDA . . . . . . . . . . . . . . . . . . . . . . . . . . . . . . . . . . 1,574 1,825 2,980 (14)% (39)%Adjusted EBITDA margin . . . . . . . . . . . . . . . . . . . . . . . . . . . 38% 40% 40% (1.4p.p.) (0.3p.p.)
(1) Certain comparative amounts have been reclassified to conform to the current period’s presentation. For more information, please refer toNote 8 of our audited consolidated financial statements included elsewhere in this Annual Report on Form 20-F.
Results of operations in RUB
Year ended December 31, ‘15 – ‘16 ‘14 – ‘15
2016 2015(1) 2014(1) % change
in millions of RUB (except as indicated)
Total operating revenue . . . . . . . . . . . . . . . . . . . . . . . . . . . . 273,003 277,241 280,765 (2)% (1)%Mobile service revenue . . . . . . . . . . . . . . . . . . . . . . . . . . 218,192 219,031 220,305 0% (1)%—of which FMC . . . . . . . . . . . . . . . . . . . . . . . . . . . . . . . 1,496 — — — ——of which mobile data . . . . . . . . . . . . . . . . . . . . . . . . . . 51,773 43,581 38,065 19% 14%Fixed-line service revenue . . . . . . . . . . . . . . . . . . . . . . . 44,418 47,748 52,064 (7)% (8)%Sales of equipment, accessories and other . . . . . . . . . . . 10,393 10,462 8,396 (1)% 25%
Operating expenses . . . . . . . . . . . . . . . . . . . . . . . . . . . . . . . . 168,213 167,096 168,830 1% (1)%Adjusted EBITDA . . . . . . . . . . . . . . . . . . . . . . . . . . . . . . . . . 104,790 110,145 111,935 (5)% (2)%Adjusted EBITDA margin . . . . . . . . . . . . . . . . . . . . . . . . . . 38% 40% 40%(1.3p.p.) (0.1p.p.)
(1) Certain comparative amounts have been reclassified to conform to the current period’s presentation. For more information, please refer toNote 8 of our audited consolidated financial statements included elsewhere in this Annual Report on Form 20-F.
121
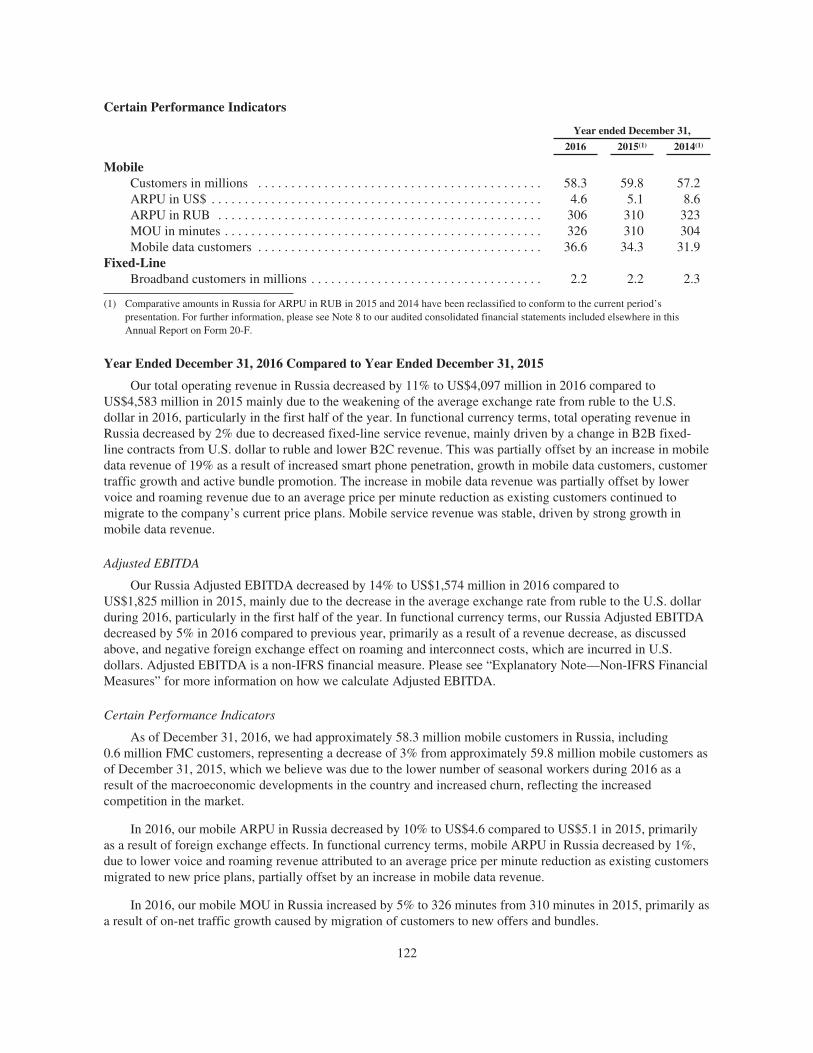
Certain Performance Indicators
Year ended December 31,
2016 2015(1) 2014(1)
MobileCustomers in millions . . . . . . . . . . . . . . . . . . . . . . . . . . . . . . . . . . . . . . . . . . . 58.3 59.8 57.2ARPU in US$ . . . . . . . . . . . . . . . . . . . . . . . . . . . . . . . . . . . . . . . . . . . . . . . . . . 4.6 5.1 8.6ARPU in RUB . . . . . . . . . . . . . . . . . . . . . . . . . . . . . . . . . . . . . . . . . . . . . . . . . 306 310 323MOU in minutes . . . . . . . . . . . . . . . . . . . . . . . . . . . . . . . . . . . . . . . . . . . . . . . . 326 310 304Mobile data customers . . . . . . . . . . . . . . . . . . . . . . . . . . . . . . . . . . . . . . . . . . . 36.6 34.3 31.9
Fixed-LineBroadband customers in millions . . . . . . . . . . . . . . . . . . . . . . . . . . . . . . . . . . . 2.2 2.2 2.3
(1) Comparative amounts in Russia for ARPU in RUB in 2015 and 2014 have been reclassified to conform to the current period’spresentation. For further information, please see Note 8 to our audited consolidated financial statements included elsewhere in thisAnnual Report on Form 20-F.
Year Ended December 31, 2016 Compared to Year Ended December 31, 2015
Our total operating revenue in Russia decreased by 11% to US$4,097 million in 2016 compared toUS$4,583 million in 2015 mainly due to the weakening of the average exchange rate from ruble to the U.S.dollar in 2016, particularly in the first half of the year. In functional currency terms, total operating revenue inRussia decreased by 2% due to decreased fixed-line service revenue, mainly driven by a change in B2B fixed-line contracts from U.S. dollar to ruble and lower B2C revenue. This was partially offset by an increase in mobiledata revenue of 19% as a result of increased smart phone penetration, growth in mobile data customers, customertraffic growth and active bundle promotion. The increase in mobile data revenue was partially offset by lowervoice and roaming revenue due to an average price per minute reduction as existing customers continued tomigrate to the company’s current price plans. Mobile service revenue was stable, driven by strong growth inmobile data revenue.
Adjusted EBITDA
Our Russia Adjusted EBITDA decreased by 14% to US$1,574 million in 2016 compared toUS$1,825 million in 2015, mainly due to the decrease in the average exchange rate from ruble to the U.S. dollarduring 2016, particularly in the first half of the year. In functional currency terms, our Russia Adjusted EBITDAdecreased by 5% in 2016 compared to previous year, primarily as a result of a revenue decrease, as discussedabove, and negative foreign exchange effect on roaming and interconnect costs, which are incurred in U.S.dollars. Adjusted EBITDA is a non-IFRS financial measure. Please see “Explanatory Note—Non-IFRS FinancialMeasures” for more information on how we calculate Adjusted EBITDA.
Certain Performance Indicators
As of December 31, 2016, we had approximately 58.3 million mobile customers in Russia, including0.6 million FMC customers, representing a decrease of 3% from approximately 59.8 million mobile customers asof December 31, 2015, which we believe was due to the lower number of seasonal workers during 2016 as aresult of the macroeconomic developments in the country and increased churn, reflecting the increasedcompetition in the market.
In 2016, our mobile ARPU in Russia decreased by 10% to US$4.6 compared to US$5.1 in 2015, primarilyas a result of foreign exchange effects. In functional currency terms, mobile ARPU in Russia decreased by 1%,due to lower voice and roaming revenue attributed to an average price per minute reduction as existing customersmigrated to new price plans, partially offset by an increase in mobile data revenue.
In 2016, our mobile MOU in Russia increased by 5% to 326 minutes from 310 minutes in 2015, primarily asa result of on-net traffic growth caused by migration of customers to new offers and bundles.
122
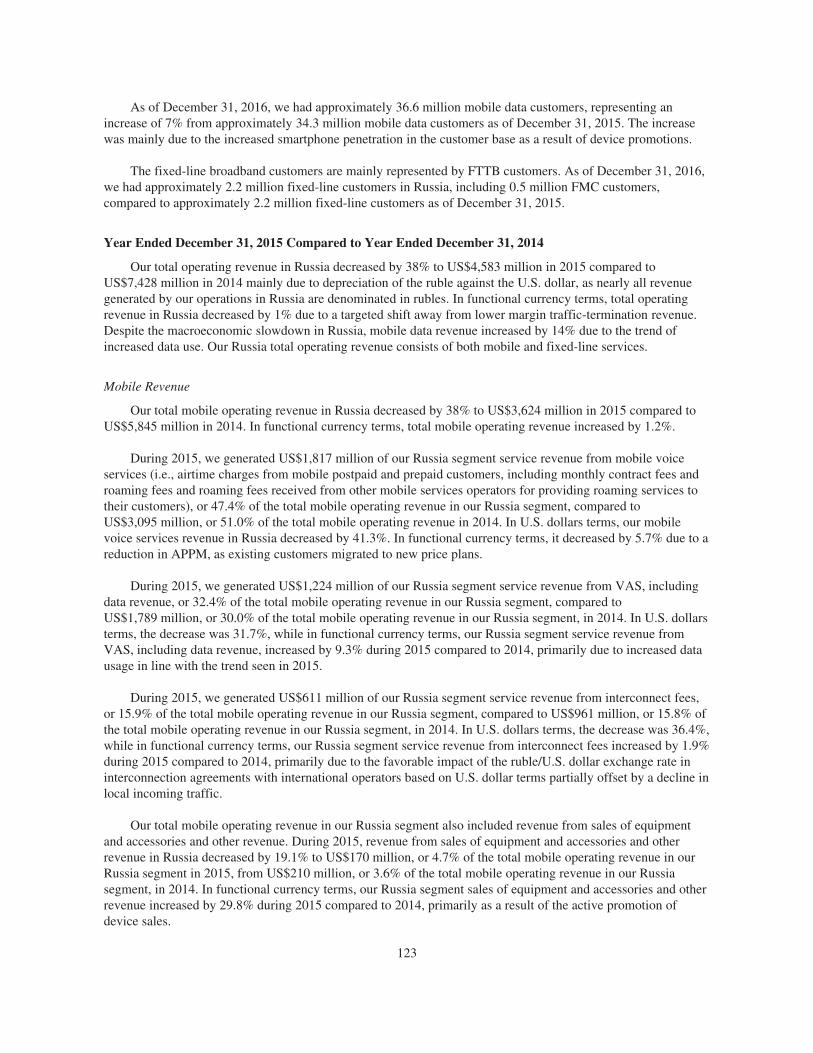
As of December 31, 2016, we had approximately 36.6 million mobile data customers, representing anincrease of 7% from approximately 34.3 million mobile data customers as of December 31, 2015. The increasewas mainly due to the increased smartphone penetration in the customer base as a result of device promotions.
The fixed-line broadband customers are mainly represented by FTTB customers. As of December 31, 2016,we had approximately 2.2 million fixed-line customers in Russia, including 0.5 million FMC customers,compared to approximately 2.2 million fixed-line customers as of December 31, 2015.
Year Ended December 31, 2015 Compared to Year Ended December 31, 2014
Our total operating revenue in Russia decreased by 38% to US$4,583 million in 2015 compared toUS$7,428 million in 2014 mainly due to depreciation of the ruble against the U.S. dollar, as nearly all revenuegenerated by our operations in Russia are denominated in rubles. In functional currency terms, total operatingrevenue in Russia decreased by 1% due to a targeted shift away from lower margin traffic-termination revenue.Despite the macroeconomic slowdown in Russia, mobile data revenue increased by 14% due to the trend ofincreased data use. Our Russia total operating revenue consists of both mobile and fixed-line services.
Mobile Revenue
Our total mobile operating revenue in Russia decreased by 38% to US$3,624 million in 2015 compared toUS$5,845 million in 2014. In functional currency terms, total mobile operating revenue increased by 1.2%.
During 2015, we generated US$1,817 million of our Russia segment service revenue from mobile voiceservices (i.e., airtime charges from mobile postpaid and prepaid customers, including monthly contract fees androaming fees and roaming fees received from other mobile services operators for providing roaming services totheir customers), or 47.4% of the total mobile operating revenue in our Russia segment, compared toUS$3,095 million, or 51.0% of the total mobile operating revenue in 2014. In U.S. dollars terms, our mobilevoice services revenue in Russia decreased by 41.3%. In functional currency terms, it decreased by 5.7% due to areduction in APPM, as existing customers migrated to new price plans.
During 2015, we generated US$1,224 million of our Russia segment service revenue from VAS, includingdata revenue, or 32.4% of the total mobile operating revenue in our Russia segment, compared toUS$1,789 million, or 30.0% of the total mobile operating revenue in our Russia segment, in 2014. In U.S. dollarsterms, the decrease was 31.7%, while in functional currency terms, our Russia segment service revenue fromVAS, including data revenue, increased by 9.3% during 2015 compared to 2014, primarily due to increased datausage in line with the trend seen in 2015.
During 2015, we generated US$611 million of our Russia segment service revenue from interconnect fees,or 15.9% of the total mobile operating revenue in our Russia segment, compared to US$961 million, or 15.8% ofthe total mobile operating revenue in our Russia segment, in 2014. In U.S. dollars terms, the decrease was 36.4%,while in functional currency terms, our Russia segment service revenue from interconnect fees increased by 1.9%during 2015 compared to 2014, primarily due to the favorable impact of the ruble/U.S. dollar exchange rate ininterconnection agreements with international operators based on U.S. dollar terms partially offset by a decline inlocal incoming traffic.
Our total mobile operating revenue in our Russia segment also included revenue from sales of equipmentand accessories and other revenue. During 2015, revenue from sales of equipment and accessories and otherrevenue in Russia decreased by 19.1% to US$170 million, or 4.7% of the total mobile operating revenue in ourRussia segment in 2015, from US$210 million, or 3.6% of the total mobile operating revenue in our Russiasegment, in 2014. In functional currency terms, our Russia segment sales of equipment and accessories and otherrevenue increased by 29.8% during 2015 compared to 2014, primarily as a result of the active promotion ofdevice sales.
123
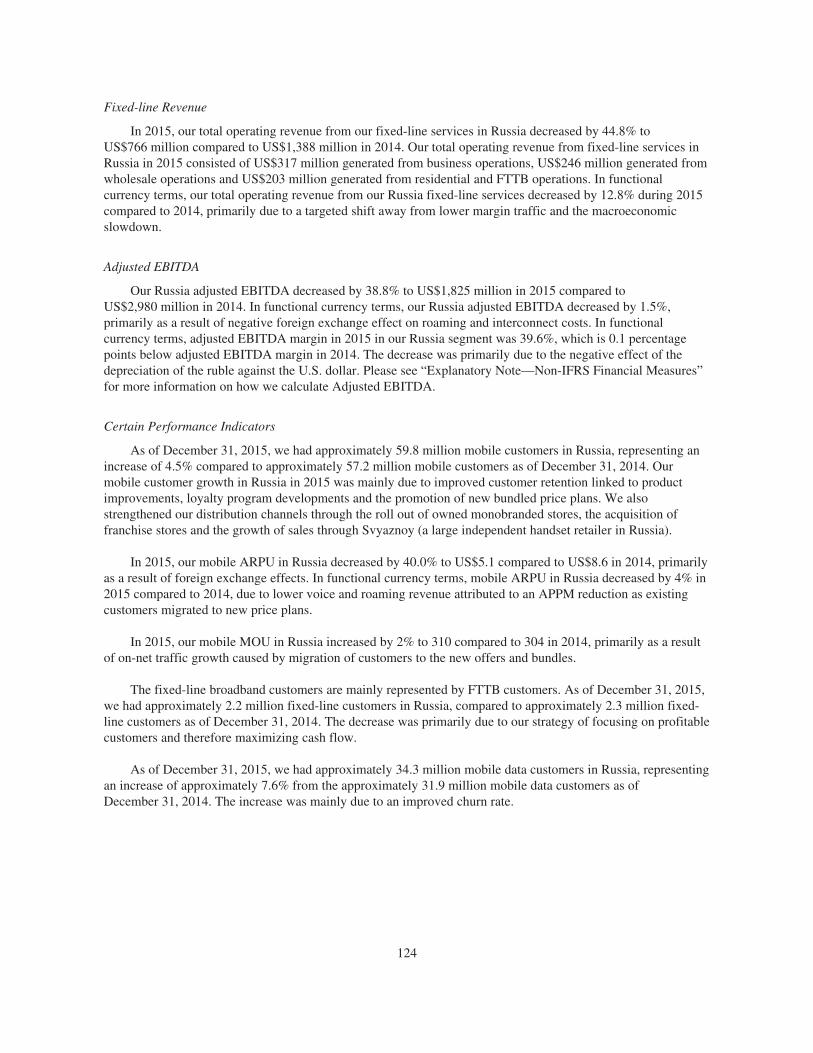
Fixed-line Revenue
In 2015, our total operating revenue from our fixed-line services in Russia decreased by 44.8% toUS$766 million compared to US$1,388 million in 2014. Our total operating revenue from fixed-line services inRussia in 2015 consisted of US$317 million generated from business operations, US$246 million generated fromwholesale operations and US$203 million generated from residential and FTTB operations. In functionalcurrency terms, our total operating revenue from our Russia fixed-line services decreased by 12.8% during 2015compared to 2014, primarily due to a targeted shift away from lower margin traffic and the macroeconomicslowdown.
Adjusted EBITDA
Our Russia adjusted EBITDA decreased by 38.8% to US$1,825 million in 2015 compared toUS$2,980 million in 2014. In functional currency terms, our Russia adjusted EBITDA decreased by 1.5%,primarily as a result of negative foreign exchange effect on roaming and interconnect costs. In functionalcurrency terms, adjusted EBITDA margin in 2015 in our Russia segment was 39.6%, which is 0.1 percentagepoints below adjusted EBITDA margin in 2014. The decrease was primarily due to the negative effect of thedepreciation of the ruble against the U.S. dollar. Please see “Explanatory Note—Non-IFRS Financial Measures”for more information on how we calculate Adjusted EBITDA.
Certain Performance Indicators
As of December 31, 2015, we had approximately 59.8 million mobile customers in Russia, representing anincrease of 4.5% compared to approximately 57.2 million mobile customers as of December 31, 2014. Ourmobile customer growth in Russia in 2015 was mainly due to improved customer retention linked to productimprovements, loyalty program developments and the promotion of new bundled price plans. We alsostrengthened our distribution channels through the roll out of owned monobranded stores, the acquisition offranchise stores and the growth of sales through Svyaznoy (a large independent handset retailer in Russia).
In 2015, our mobile ARPU in Russia decreased by 40.0% to US$5.1 compared to US$8.6 in 2014, primarilyas a result of foreign exchange effects. In functional currency terms, mobile ARPU in Russia decreased by 4% in2015 compared to 2014, due to lower voice and roaming revenue attributed to an APPM reduction as existingcustomers migrated to new price plans.
In 2015, our mobile MOU in Russia increased by 2% to 310 compared to 304 in 2014, primarily as a resultof on-net traffic growth caused by migration of customers to the new offers and bundles.
The fixed-line broadband customers are mainly represented by FTTB customers. As of December 31, 2015,we had approximately 2.2 million fixed-line customers in Russia, compared to approximately 2.3 million fixed-line customers as of December 31, 2014. The decrease was primarily due to our strategy of focusing on profitablecustomers and therefore maximizing cash flow.
As of December 31, 2015, we had approximately 34.3 million mobile data customers in Russia, representingan increase of approximately 7.6% from the approximately 31.9 million mobile data customers as ofDecember 31, 2014. The increase was mainly due to an improved churn rate.
124
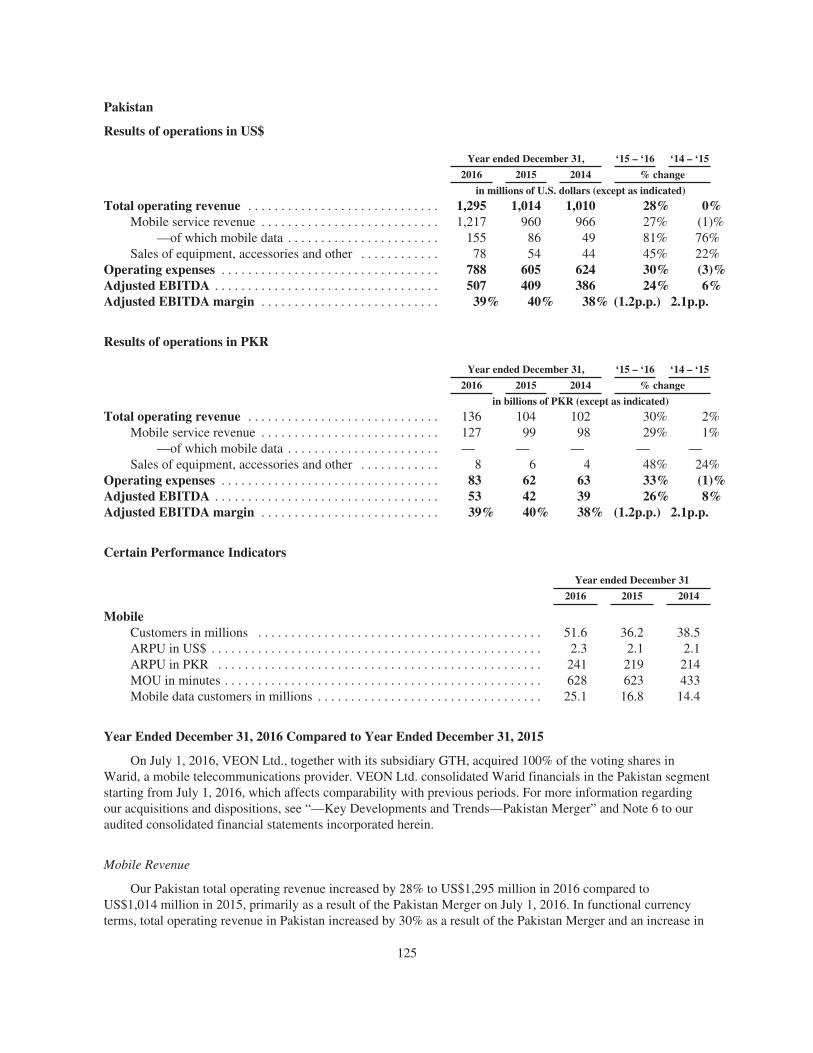
Pakistan
Results of operations in US$
Year ended December 31, ‘15 – ‘16 ‘14 – ‘15
2016 2015 2014 % change
in millions of U.S. dollars (except as indicated)
Total operating revenue . . . . . . . . . . . . . . . . . . . . . . . . . . . . . 1,295 1,014 1,010 28% 0%Mobile service revenue . . . . . . . . . . . . . . . . . . . . . . . . . . . 1,217 960 966 27% (1)%
—of which mobile data . . . . . . . . . . . . . . . . . . . . . . . 155 86 49 81% 76%Sales of equipment, accessories and other . . . . . . . . . . . . 78 54 44 45% 22%
Operating expenses . . . . . . . . . . . . . . . . . . . . . . . . . . . . . . . . . 788 605 624 30% (3)%Adjusted EBITDA . . . . . . . . . . . . . . . . . . . . . . . . . . . . . . . . . . 507 409 386 24% 6%Adjusted EBITDA margin . . . . . . . . . . . . . . . . . . . . . . . . . . . 39% 40% 38% (1.2p.p.) 2.1p.p.
Results of operations in PKR
Year ended December 31, ‘15 – ‘16 ‘14 – ‘15
2016 2015 2014 % change
in billions of PKR (except as indicated)
Total operating revenue . . . . . . . . . . . . . . . . . . . . . . . . . . . . . 136 104 102 30% 2%Mobile service revenue . . . . . . . . . . . . . . . . . . . . . . . . . . . 127 99 98 29% 1%
—of which mobile data . . . . . . . . . . . . . . . . . . . . . . . — — — — —Sales of equipment, accessories and other . . . . . . . . . . . . 8 6 4 48% 24%
Operating expenses . . . . . . . . . . . . . . . . . . . . . . . . . . . . . . . . . 83 62 63 33% (1)%Adjusted EBITDA . . . . . . . . . . . . . . . . . . . . . . . . . . . . . . . . . . 53 42 39 26% 8%Adjusted EBITDA margin . . . . . . . . . . . . . . . . . . . . . . . . . . . 39% 40% 38% (1.2p.p.) 2.1p.p.
Certain Performance Indicators
Year ended December 31
2016 2015 2014
MobileCustomers in millions . . . . . . . . . . . . . . . . . . . . . . . . . . . . . . . . . . . . . . . . . . . 51.6 36.2 38.5ARPU in US$ . . . . . . . . . . . . . . . . . . . . . . . . . . . . . . . . . . . . . . . . . . . . . . . . . . 2.3 2.1 2.1ARPU in PKR . . . . . . . . . . . . . . . . . . . . . . . . . . . . . . . . . . . . . . . . . . . . . . . . . 241 219 214MOU in minutes . . . . . . . . . . . . . . . . . . . . . . . . . . . . . . . . . . . . . . . . . . . . . . . . 628 623 433Mobile data customers in millions . . . . . . . . . . . . . . . . . . . . . . . . . . . . . . . . . . 25.1 16.8 14.4
Year Ended December 31, 2016 Compared to Year Ended December 31, 2015
On July 1, 2016, VEON Ltd., together with its subsidiary GTH, acquired 100% of the voting shares inWarid, a mobile telecommunications provider. VEON Ltd. consolidated Warid financials in the Pakistan segmentstarting from July 1, 2016, which affects comparability with previous periods. For more information regardingour acquisitions and dispositions, see “—Key Developments and Trends—Pakistan Merger” and Note 6 to ouraudited consolidated financial statements incorporated herein.
Mobile Revenue
Our Pakistan total operating revenue increased by 28% to US$1,295 million in 2016 compared toUS$1,014 million in 2015, primarily as a result of the Pakistan Merger on July 1, 2016. In functional currencyterms, total operating revenue in Pakistan increased by 30% as a result of the Pakistan Merger and an increase in
125
voice, interconnect, SMS and data revenues supported by customer growth. Our data revenue grew by 81% as aresult of the Pakistan Merger, successful data monetization initiatives, data device promotions and 3G networkexpansion. In addition, mobile financial services revenue grew by 46% in functional currency terms in 2016 ascompared to 2015 due to an increase in the number of transactions and an increase in sales by our agents. OurPakistan segment sales of equipment and accessories and other revenue increased by 45%, primarily driven bynetwork sharing activities.
Adjusted EBITDA
Our Adjusted EBITDA in Pakistan increased by 24% to US$507 million in 2016 compared toUS$409 million in 2015. In functional currency terms, our Adjusted EBITDA increased by 26% in 2016compared to the previous year, primarily due to the Pakistan Merger, higher revenue, as discussed above,performance transformation initiatives and a decrease in network costs. This increase was partially offset byintegration costs. Please see “Explanatory Note—Non-IFRS Financial Measures” for more information on howwe calculate Adjusted EBITDA.
Certain Performance Indicators
As of December 31, 2016, we had approximately 51.6 million customers in Pakistan, representing anincrease from 36.2 million customers as of December 31, 2015, primarily as a result of the Pakistan Merger inJuly 1, 2016 and simplification of tariffs, resulting in higher gross additions.
In 2016, our mobile ARPU in Pakistan increased by 8% to US$2.3 compared to US$2.1 in 2015. Infunctional currency terms, mobile ARPU in Pakistan increased in 2016 by 10% compared to 2015, mainly due todata revenue growth and changes in customer pricing.
In 2016, our mobile MOU in Pakistan increased 1% to 628 minutes from 623 minutes in 2015 as a result ofthe decrease in dual SIMs in the market following a SIM-verification process in Pakistan.
As of December 31, 2016, we had approximately 25.1 million mobile data customers in Pakistan,representing an increase of approximately 50% from the approximately 16.8 million mobile data customers as ofDecember 31, 2015. The increase was mainly due to the Pakistan Merger on July 1, 2016, the 3G expansion andincreased smartphone penetration in the customer base.
Year Ended December 31, 2015 Compared to Year Ended December 31, 2014
Our Pakistan total operating revenue increased by 0.3% to US$1,014 million in 2015 compared toUS$1,010 million in 2014. In functional currency terms, total operating revenue in Pakistan increased by 2.1%due to data revenue growth and higher MFS revenue, which was partially offset by a decline in voice revenuecaused by changes to hybrid offerings with decreased voice content. Our Pakistan total operating revenueconsists of revenue from providing mobile services.
Mobile Revenue
In 2015, we generated US$614 million of our Pakistan segment service revenue from mobile voice services(i.e., airtime charges from mobile contract and prepaid customers, including monthly contract fees and roamingfees, as well as roaming fees received from other mobile service operators for providing roaming services to theircustomers), or 60.5% of the total operating revenue in our Pakistan segment, compared to US$653 million, or64.7% of the total operating revenue in our Pakistan segment, in 2014. In U.S. dollar terms, our mobile voiceservices revenue in Pakistan decreased by 6.0%. In functional currency terms, it decreased by 4.3%, primarilydue to a decline in voice revenue caused by changes to hybrid offerings with decreased voice content.
126
In 2015, we generated US$132 million of our Pakistan segment service revenue from interconnect fees, or13.0% of the total operating revenue in our Pakistan segment, compared to US$135 million, or 13.4% of the totaloperating revenue in our Pakistan segment, in 2014. In U.S. dollar terms, our Pakistan segment service revenuefrom interconnect fees decreased by 2.5%, while in functional currency terms, it decreased by 0.8%, due to lowerlocal incoming traffic.
In 2015, we generated US$214 million of our Pakistan segment service revenue from VAS, including datarevenue, or 21.1% of the total operating revenue in our Pakistan segment, compared to US$178 million, or 17.6%of the total operating revenue in our Pakistan segment, in 2014. In U.S. dollar terms, our Pakistan segmentservice revenue from VAS, including data revenue, increased by 20.2%, while in functional currency terms, itincreased by 22.4%, due to data and MFS revenues growth, as a result of successful retail promotions and anincreased footprint for our MFS agents in Pakistan.
Our total operating revenue in our Pakistan segment also includes revenue from sales of equipment andaccessories and other revenue. In 2015, revenue from sales of equipment and accessories and other revenue inPakistan was US$54 million compared to US$44 million in 2014. In functional currency terms, our Pakistansegment sales of equipment and accessories and other revenue increased by 24.1%, primarily as a result of anincrease in revenues from site sharing and other services such as leasing lines, DSL and wireless internet.
Adjusted EBITDA
Our Pakistan adjusted EBITDA increased by 5.9% to US$409 million in 2015 compared to US$386 millionin 2014. In functional currency terms, our Pakistan adjusted EBITDA increased by 7.7% in 2015, primarily dueto slightly higher revenue and lower service costs as a result of cost efficiency initiatives, mainly in procurementand utilities. In functional currency terms, adjusted EBITDA margin in 2015 in our Pakistan segment was 40.4%,which is 2.1 percentage points higher than adjusted EBITDA margin in 2014. Please see “ExplanatoryNote—Non-IFRS Financial Measures” for more information on how we calculate Adjusted EBITDA.
Certain Performance Indicators
As of December 31, 2015, we had approximately 36.2 million customers in Pakistan, representing adecrease from 38.5 million customers as of December 31, 2014, primarily due to the required disconnection ofapproximately 5.6 million customers in May 2015 resulting from the implementation of the regulator’s SIM cardre-verification procedures (see “Item 3—Key Information—D. Risk Factors—Legal and Regulatory Risks—Newor proposed changes to laws or new interpretations of existing laws in the markets in which we operate may harmour business”).
In 2015, our mobile ARPU in Pakistan remained stable at US$2.1 (equal to 2014). In functional currencyterms, mobile ARPU in Pakistan increased in 2015 by 3% compared to 2014 mainly due to the successfulcompletion of the SIM re-verification process, which resulted in the disconnection of lower revenue customers.
In 2015, our mobile MOU in Pakistan increased 44.0% to 623 from 433 in 2014 as a result of the success ofour bundle offers and network modernization completed in 2014, which substantially increased network capacity.
As of December 31, 2015, we had approximately 16.8 million mobile data customers in Pakistan,representing an increase of approximately 16.6% from the approximately 14.4 million mobile data customers asof December 31, 2014. The increase was mainly due to the 3G expansion and increased smartphone penetrationin the customer base.
127
Algeria
Results of operations in US$
Year ended December 31, ‘15 – ‘16 ‘14 – ‘15
2016 2015 2014 % change
in millions of U.S. dollars (except as indicated)
Total operating revenue . . . . . . . . . . . . . . . . . . . . . . . . . . . . . 1,040 1,273 1,692 (18)% (25)%Mobile service revenue . . . . . . . . . . . . . . . . . . . . . . . . . . . 1,031 1,259 1,678 (18)% (25)%
—of which mobile data . . . . . . . . . . . . . . . . . . . . . . . 76 46 20 65% 131%Sales of equipment, accessories and other . . . . . . . . . . . . 9 14 14 (36)% 2%
Operating expenses . . . . . . . . . . . . . . . . . . . . . . . . . . . . . . . . . 493 589 835 (16)% (29)%Adjusted EBITDA . . . . . . . . . . . . . . . . . . . . . . . . . . . . . . . . . . 547 684 857 (20)% (20)%Adjusted EBITDA margin . . . . . . . . . . . . . . . . . . . . . . . . . . . 53% 54% 51% (1.1p.p.) 3.0p.p.
Results of operations in DZD
Year ended December 31, ‘15 – ‘16 ‘14 – ‘15
2016 2015 2014 % change
in billions of DZD (except as indicated)
Total operating revenue . . . . . . . . . . . . . . . . . . . . . . . . . . . . . 114 128 136 (11)% (6)%Mobile service revenue . . . . . . . . . . . . . . . . . . . . . . . . . . . 113 127 135 (11)% (7)%
—of which mobile data . . . . . . . . . . . . . . . . . . . . . . . 8 5 2 78% 185%Sales of equipment, accessories and other . . . . . . . . . . . . 1 1 1 (31)% 28%
Operating expenses . . . . . . . . . . . . . . . . . . . . . . . . . . . . . . . . . 54 59 68 (9)% (13)%Adjusted EBITDA . . . . . . . . . . . . . . . . . . . . . . . . . . . . . . . . . . 60 69 69 (13)% 0%Adjusted EBITDA margin . . . . . . . . . . . . . . . . . . . . . . . . . . . 53% 54% 50% (1.2p.p.) 3.4p.p.
Certain Performance Indicators
Year ended December 31
2016 2015 2014
MobileCustomers in millions . . . . . . . . . . . . . . . . . . . . . . . . . . . . . . . . . . . . . . . 16.3 17.0 17.7ARPU in US$ . . . . . . . . . . . . . . . . . . . . . . . . . . . . . . . . . . . . . . . . . . . . . 5.1 6.0 7.9ARPU in DZD . . . . . . . . . . . . . . . . . . . . . . . . . . . . . . . . . . . . . . . . . . . . . 562 603 639MOU in minutes . . . . . . . . . . . . . . . . . . . . . . . . . . . . . . . . . . . . . . . . . . . 332 369 371Mobile data customers . . . . . . . . . . . . . . . . . . . . . . . . . . . . . . . . . . . . . . 7.0 4.1 1.3
Year Ended December 31, 2016 Compared to Year Ended December 31, 2015
Our Algeria total operating revenue decreased by 18% to US$1,040 million in 2016 compared toUS$1,273 million in 2015 partly due to the depreciation of the Algerian dinar against the U.S. dollar. Infunctional currency terms, total operating revenue in Algeria decreased by 11% due to a change in customerbilling terms, the forced migration of customers from legacy tariffs, aggressive price competition and distributionchallenges as compared to 2015. Our data revenue increased due to increased data usage in terms of amount ofmegabytes used and number of data users, primarily as a result of the revived 3G roll-out following the lifting ofgovernmental restrictions in November 2015. Our segment sales of equipment and accessories and other revenuedecreased by 36% due in part to the depreciation of the Algerian dinar against the U.S. dollar, partially offset byaffordable device promotions launched during 2016. For a description of the risks associated with the currentoperating conditions in Algeria, see “Item 3—Key Information—D. Risk Factors—Legal and RegulatoryRisks—We operate in a highly regulated industry and are subject to a large variety of laws and extensiveregulatory requirements” and “Item 3—Key Information—D. Risk Factors—Legal and RegulatoryRisks—Unpredictable tax systems give rise to significant uncertainties and risks that could complicate our taxplanning and business decisions.”
128
Adjusted EBITDA
Our Algeria Adjusted EBITDA decreased by 20% to US$547 million in 2016 compared to US$684 millionin 2015. In functional currency terms, our Algeria Adjusted EBITDA decreased by 13% in 2016 compared to theprevious year, primarily due to a decrease in total revenues, as discussed above, partially offset by a decrease inoperating expenses due to commercial and other general and administrative expense cost optimization andheadcount reduction as a result of our performance transformation program. In addition to the decrease inrevenue, our Adjusted EBITDA in Algeria was negatively impacted by costs in relation to structural measures toimprove performance and stabilize our customer base, including distribution transformation and monobrandroll-out, acceleration of our 4G/LTE network deployment and promotion of micro-campaigns with tailoredservices to increase satisfaction, data monetization activities and smartphone promotions, coupled with bundleoffers. Please see “Explanatory Note—Non-IFRS Financial Measures” for more information on how we calculateAdjusted EBITDA.
Certain Performance Indicators
Customers in our Algeria segment decreased to approximately 16.3 million as of December 31, 2016compared to 17.0 million customers as of December 31, 2015. The 4% decrease was mainly due to the combinedimpact of historic 3G coverage shortfalls, changes in customer billing terms, forced migration and distributionchallenges.
In 2016, our mobile ARPU in Algeria decreased by 15% to US$5.1 compared to US$6.0 in 2015. Infunctional currency terms, our mobile ARPU in Algeria decreased by 7%, mainly due to aggressive pricecompetition and high-value customer churn.
In 2016, our mobile MOU in Algeria decreased by 10% to 332 minutes compared to 369 minutes in 2015.This decrease was due to high-value customer churn.
As of December 31, 2016, we had approximately 7.0 million mobile data customers in Algeria, representingan increase of approximately 69% from the approximately 4.1 million mobile data customers in Algeria as ofDecember 31, 2015. The increase was mainly due to the rapid 3G expansion during the last twelve months.
Year Ended December 31, 2015 Compared to Year Ended December 31, 2014
Our Algeria total operating revenue decreased by 24.7% to US$1,273 million in 2015 compared toUS$1,692 million in 2014 mainly due to the depreciation of the Algerian dinar against the U.S. dollar. Infunctional currency terms, total operating revenue in Algeria decreased by 6% due to aggressive pricecompetition, device promotion by competitors and delays in the launch of OTA’s 3G network. Our Algeria totaloperating revenue consists of revenue from providing mobile services.
Mobile Revenue
In 2015, we generated US$1,041 million of our Algeria segment service revenue from mobile voice services(i.e., airtime charges from mobile contract and prepaid customers, including monthly contract fees and roamingfees, as well as roaming fees received from other mobile service operators for providing roaming services to theircustomers), or 81.7% of our total operating revenue in our Algeria segment, compared to US$1,442 million, or85.2% of the total operating revenue in our Algeria segment, in 2014. In U.S. dollar terms, our mobile voiceservices revenue in Algeria decreased by 27.8% as a result of the depreciation of the Algerian dinar against theU.S. dollar. In functional currency terms, it decreased by 10.2% due to decreased voice ARPU resulting primarilyfrom aggressive price competition.
In 2015, we generated US$99 million of our Algeria segment service revenue from interconnect fees, or7.8% of the total operating revenue in our Algeria segment, compared to US$120 million, or 7.1% of the totaloperating revenue in our Algeria segment, in 2014. In U.S. dollar terms, our Algeria segment service revenue
129
from interconnect fees decreased by 17.6%, while in functional currency terms, it increased by 3.1%, due to anincrease in the MTRs set by the regulator in Algeria for Optimum from DZD 0.96 per minute to DZD 1.1(approximately US$0.01 to US$0.011 as of December 31, 2015) per minute.
In 2015, we generated US$108 million of our Algeria segment service revenue from VAS, including datarevenue, or 8.4% of the total operating revenue in our Algeria segment, compared to US$102 million, or 6.0% ofthe total operating revenue in our Algeria segment, in 2014. In U.S. dollar terms, our Algeria segment servicerevenue from VAS, including data revenue, increased by 5.1%, while in functional currency terms, it increasedby 31.3%, due to increased data usage in terms of amount of megabytes used and number of data users(2.9 million users in 2015 compared with 0.8 million users in 2014).
Our total operating revenue in our Algeria segment also includes revenue from sales of equipment andaccessories and other revenue. During 2015, revenue from sales of equipment and accessories and other revenuein Algeria was US$14 million, whereas in 2014 revenue from sales of equipment and accessories and otherrevenue was US$14 million. In functional currency terms, our Algeria segment sales of equipment andaccessories and other revenue increased by 28.3%, primarily as a result of subsidies offered and devicepromotions launched during 2015.
Adjusted EBITDA
Our Algeria adjusted EBITDA decreased by 20.2% to US$684 million in 2015 compared to US$857 millionin 2014. In functional currency terms, our Algeria adjusted EBITDA remained stable in 2015, primarily due to adecrease in total revenues (DZD 8,600 million (approximately US$86 million)), offset by a decrease in operatingexpenses (DZD 8,700 million (approximately US$87 million)) due to a one-off charge recorded in 2014 relatedto a provision for Cevital litigation of DZD 4,300 million (approximately US$53 million). In 2015, we recorded aone-off charge of DZD 120 million (approximately US$12 million) related to the performance transformationprogram, as well as a decrease in certain expenses such as personnel costs, security and billing in relation tooperational improvements. Please see “Explanatory Note—Non-IFRS Financial Measures” for more informationon how we calculate Adjusted EBITDA.
Certain Performance Indicators
As of December 31, 2015, we had approximately 17.0 million customers in our Algeria segment, incomparison with 17.7 million customers as of December 31, 2014. The 3.9% decrease was mainly due to areduction of high-value customers.
In 2015, our mobile ARPU in Algeria decreased by 23.8% to US$6.0 compared to US$7.9 in 2014. Infunctional currency terms, our mobile ARPU in Algeria decreased by 5.7%, mainly due to aggressive pricecompetition.
In 2015, our mobile MOU in Algeria was mostly stable, slightly decreasing by 0.7% to 369 from 371 in2014. This decrease was due to a slight decrease in total traffic (78.8 billion minutes in 2014 compared to76.6 billion minutes in 2015) coupled with a slight decrease in average customer base (17.6 million in 2014compared to 17.3 million in 2015).
We did not have broadband customers in Algeria as of December 31, 2015.
130
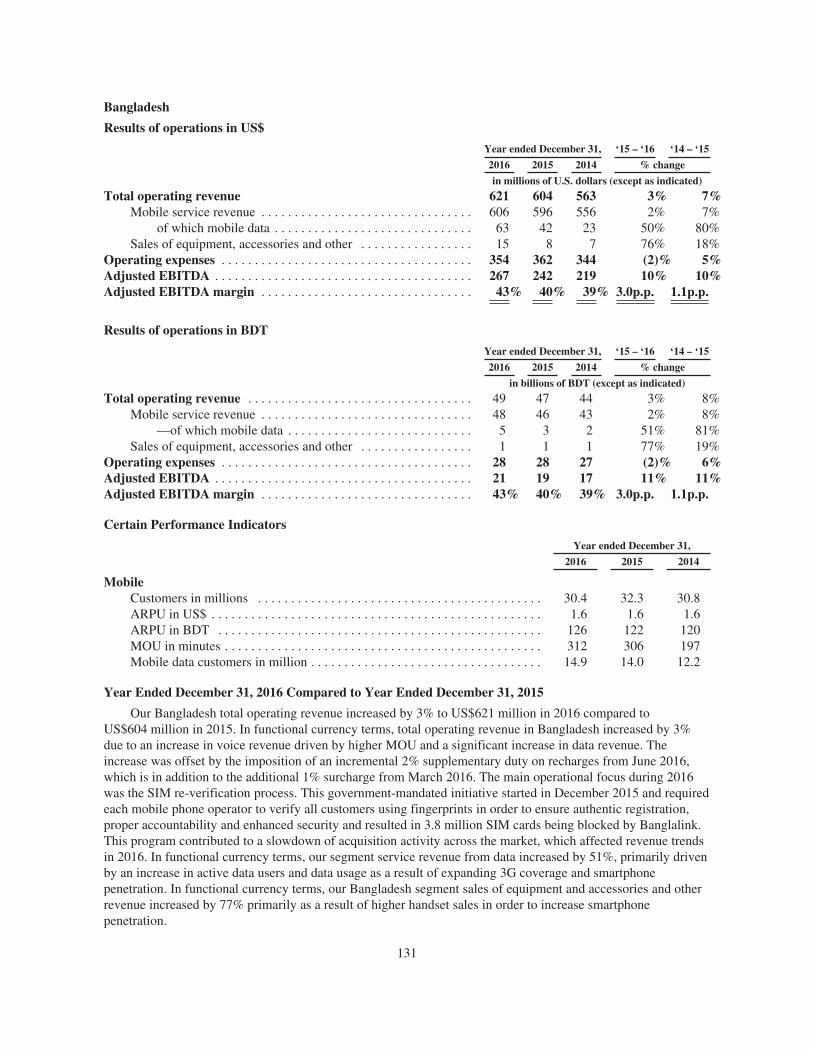
Bangladesh
Results of operations in US$
Year ended December 31, ‘15 – ‘16 ‘14 – ‘15
2016 2015 2014 % change
in millions of U.S. dollars (except as indicated)
Total operating revenue 621 604 563 3% 7%Mobile service revenue . . . . . . . . . . . . . . . . . . . . . . . . . . . . . . . . 606 596 556 2% 7%
of which mobile data . . . . . . . . . . . . . . . . . . . . . . . . . . . . . . 63 42 23 50% 80%Sales of equipment, accessories and other . . . . . . . . . . . . . . . . . 15 8 7 76% 18%
Operating expenses . . . . . . . . . . . . . . . . . . . . . . . . . . . . . . . . . . . . . . 354 362 344 (2)% 5%Adjusted EBITDA . . . . . . . . . . . . . . . . . . . . . . . . . . . . . . . . . . . . . . . 267 242 219 10% 10%Adjusted EBITDA margin . . . . . . . . . . . . . . . . . . . . . . . . . . . . . . . . 43% 40% 39% 3.0p.p. 1.1p.p.
Results of operations in BDT
Year ended December 31, ‘15 – ‘16 ‘14 – ‘15
2016 2015 2014 % change
in billions of BDT (except as indicated)
Total operating revenue . . . . . . . . . . . . . . . . . . . . . . . . . . . . . . . . . . 49 47 44 3% 8%Mobile service revenue . . . . . . . . . . . . . . . . . . . . . . . . . . . . . . . . 48 46 43 2% 8%
—of which mobile data . . . . . . . . . . . . . . . . . . . . . . . . . . . . 5 3 2 51% 81%Sales of equipment, accessories and other . . . . . . . . . . . . . . . . . 1 1 1 77% 19%
Operating expenses . . . . . . . . . . . . . . . . . . . . . . . . . . . . . . . . . . . . . . 28 28 27 (2)% 6%Adjusted EBITDA . . . . . . . . . . . . . . . . . . . . . . . . . . . . . . . . . . . . . . . 21 19 17 11% 11%Adjusted EBITDA margin . . . . . . . . . . . . . . . . . . . . . . . . . . . . . . . . 43% 40% 39% 3.0p.p. 1.1p.p.
Certain Performance Indicators
Year ended December 31,
2016 2015 2014
MobileCustomers in millions . . . . . . . . . . . . . . . . . . . . . . . . . . . . . . . . . . . . . . . . . . . 30.4 32.3 30.8ARPU in US$ . . . . . . . . . . . . . . . . . . . . . . . . . . . . . . . . . . . . . . . . . . . . . . . . . . 1.6 1.6 1.6ARPU in BDT . . . . . . . . . . . . . . . . . . . . . . . . . . . . . . . . . . . . . . . . . . . . . . . . . 126 122 120MOU in minutes . . . . . . . . . . . . . . . . . . . . . . . . . . . . . . . . . . . . . . . . . . . . . . . . 312 306 197Mobile data customers in million . . . . . . . . . . . . . . . . . . . . . . . . . . . . . . . . . . . 14.9 14.0 12.2
Year Ended December 31, 2016 Compared to Year Ended December 31, 2015
Our Bangladesh total operating revenue increased by 3% to US$621 million in 2016 compared toUS$604 million in 2015. In functional currency terms, total operating revenue in Bangladesh increased by 3%due to an increase in voice revenue driven by higher MOU and a significant increase in data revenue. Theincrease was offset by the imposition of an incremental 2% supplementary duty on recharges from June 2016,which is in addition to the additional 1% surcharge from March 2016. The main operational focus during 2016was the SIM re-verification process. This government-mandated initiative started in December 2015 and requiredeach mobile phone operator to verify all customers using fingerprints in order to ensure authentic registration,proper accountability and enhanced security and resulted in 3.8 million SIM cards being blocked by Banglalink.This program contributed to a slowdown of acquisition activity across the market, which affected revenue trendsin 2016. In functional currency terms, our segment service revenue from data increased by 51%, primarily drivenby an increase in active data users and data usage as a result of expanding 3G coverage and smartphonepenetration. In functional currency terms, our Bangladesh segment sales of equipment and accessories and otherrevenue increased by 77% primarily as a result of higher handset sales in order to increase smartphonepenetration.
131
Adjusted EBITDA
Our Bangladesh Adjusted EBITDA increased by 10% to US$267 million in 2016 compared toUS$242 million in 2015. In functional currency terms, our Bangladesh Adjusted EBITDA increased by 11% in2016 compared to the same period in the previous year, primarily due to increased revenue, as discussed above,and the implementation of performance transformation initiatives, in particular headcount reduction and adecrease in commercial costs. Please see “Explanatory Note—Non-IFRS Financial Measures” for moreinformation on how we calculate Adjusted EBITDA.
Certain Performance Indicators
As of December 31, 2016, we had approximately 30.4 million customers in Bangladesh, representing adecrease from 32.3 million customers as of December 31, 2015, which was primarily due to an introduction ofgovernment mandated identity verification procedures at the end of 2015, which resulted in a slowdown ofcustomer growth across the market and the blocking of unverified SIMs in 2016. For further information on therisks associated with SIM re-verification, see “Item 3—Key Information—D. Risk Factors—Legal andRegulatory Risks—New or proposed changes to laws or new interpretations of existing laws in the markets inwhich we operate may harm our business.”
In 2016, our mobile ARPU in Bangladesh did not change and was US$1.6. In functional currency terms,mobile ARPU in Bangladesh increased in 2016 by 3% to BDT 126 compared to BDT 122 in 2015, mainly due tohigh growth in data revenue.
In 2016, our mobile MOU in Bangladesh increased 2% to 312 minutes from 306 minutes in 2015 mainlydue to lower average price per minute, driven by aggressive competition.
As of December 31, 2016, we had approximately 14.9 million mobile data customers in Bangladesh,representing a decrease of approximately 7% from the approximately 14.0 million mobile data customers as ofDecember 31, 2015. The decrease is due to the blocking of unverified SIMs, discussed above, while active datausers increased mainly due to the 3G expansion and increased smartphone penetration.
Year Ended December 31, 2015 Compared to Year Ended December 31, 2014
Our Bangladesh total operating revenue increased by 7.3% to US$604 million in 2015 compared toUS$563 million in 2014. In functional currency terms, total operating revenue in Bangladesh increased by 7.9%due to a 4.9% increase in the number of mobile customers and an increase in data usage in 2015, which waspartially offset by the impact of intensified price competition and the negative impact of supplementary dutiesimposed in the third quarter of 2015. Our Bangladesh total operating revenue consists of revenue from providingmobile services.
Mobile Revenue
In 2015, we generated US$450 million of our Bangladesh segment service revenue from mobile voiceservices (i.e., airtime charges from mobile contract and prepaid customers, including monthly contract fees androaming fees, as well as roaming fees received from other mobile service operators for providing roamingservices to their customers), or 74.5% of our total operating revenue in our Bangladesh segment, compared toUS$440 million, or 78.1% of the total operating revenue in our Bangladesh segment, in 2014. In U.S. dollarterms, our mobile voice services revenue in Bangladesh increased by 2.3%. In functional currency terms, itincreased by 2.9%, primarily due to an increase in customer base and higher ARPU.
In 2015, we generated US$57 million of our Bangladesh segment service revenue from interconnect fees, or9.4% of the total operating revenue in our Bangladesh segment, compared to US$53 million, or 9.4% of the total
132
operating revenue in our Bangladesh segment, in 2014. In U.S. dollar terms, our Bangladesh segment servicerevenue from interconnect fees increased by 7%. In functional currency terms, it increased by 7.5%, primarilydue to an increase in our customer base, as well as higher MOU.
In 2015, we generated US$86 million of our Bangladesh segment service revenue from VAS, including datarevenue, or 14.2% of the total operating revenue in our Bangladesh segment, compared to US$60 million, or10.6% of the total operating revenue in our Bangladesh segment, in 2014. In U.S. dollar terms, our Bangladeshsegment service revenue from VAS, including data and messaging revenue, increased by 43.6%. In functionalcurrency terms, it increased by 44.4%, primarily due to increased data usage derived from the banglalink brand’s3G network, as our network coverage expanded in 2015.
Our total operating revenue in our Bangladesh segment also includes revenue from sales of equipment andaccessories and other revenue. In 2015, revenue from sales of equipment and accessories and other revenue inBangladesh was US$9 million, compared to US$7 million in 2014. In U.S. dollar terms, our Bangladesh segmentsales of equipment and accessories and other revenue increased by 17.9% primarily as a result of higher handsetsales and an increase in revenues from site sharing.
Adjusted EBITDA
Our Bangladesh adjusted EBITDA increased by 10.5% to US$242 million in 2015 compared toUS$219 million in 2014. In functional currency terms, our Bangladesh adjusted EBITDA increased by 11% in2015, primarily due to increased revenue and reduced SIM tax from BDT 300 (approximately US$3.8) to BDT100 (approximately US$1.3) per connection, which was partially offset by a provision of US$12 million for adisputed SIM replacement tax with the tax authorities, a bad debt provision of US$6 million mainly forBangladesh Telecommunications Company Limited (government owned PSTN) and a provision of US$4 millionrelated to the performance transformation program. In functional currency terms, the adjusted EBITDA margin in2015 in our Bangladesh segment was 40.1%, which was 1.1 percentage points higher than the adjusted EBITDAmargin in 2014. Please see “Explanatory Note—Non-IFRS Financial Measures” for more information on how wecalculate Adjusted EBITDA.
Certain Performance Indicators
As of December 31, 2015, we had approximately 32.3 million customers in Bangladesh, representing anincrease from 30.8 million customers as of December 31, 2014, which was primarily due to our aggressivecustomer acquisition campaigns supported by competitive start-up offers.
In 2015, our mobile ARPU in Bangladesh was stable at US$1.6 compared to 2014. In functional currencyterms, mobile ARPU in Bangladesh increased in 2015 by 1.6% compared to 2014 mainly due to high growth indata revenue.
In 2015, our mobile MOU in Bangladesh increased 56% to 306 from 197 in 2014 mainly due to the priceelasticity impact of lower APPM driven by aggressive competition.
As of December 31, 2015, we had approximately 14.0 million mobile data customers in Bangladesh,representing an increase of approximately 14.6% from the approximately 12.2 million mobile data customers asof December 31, 2014. The increase was mainly due to the 3G expansion and increased smartphone penetrationin the customer base.
133
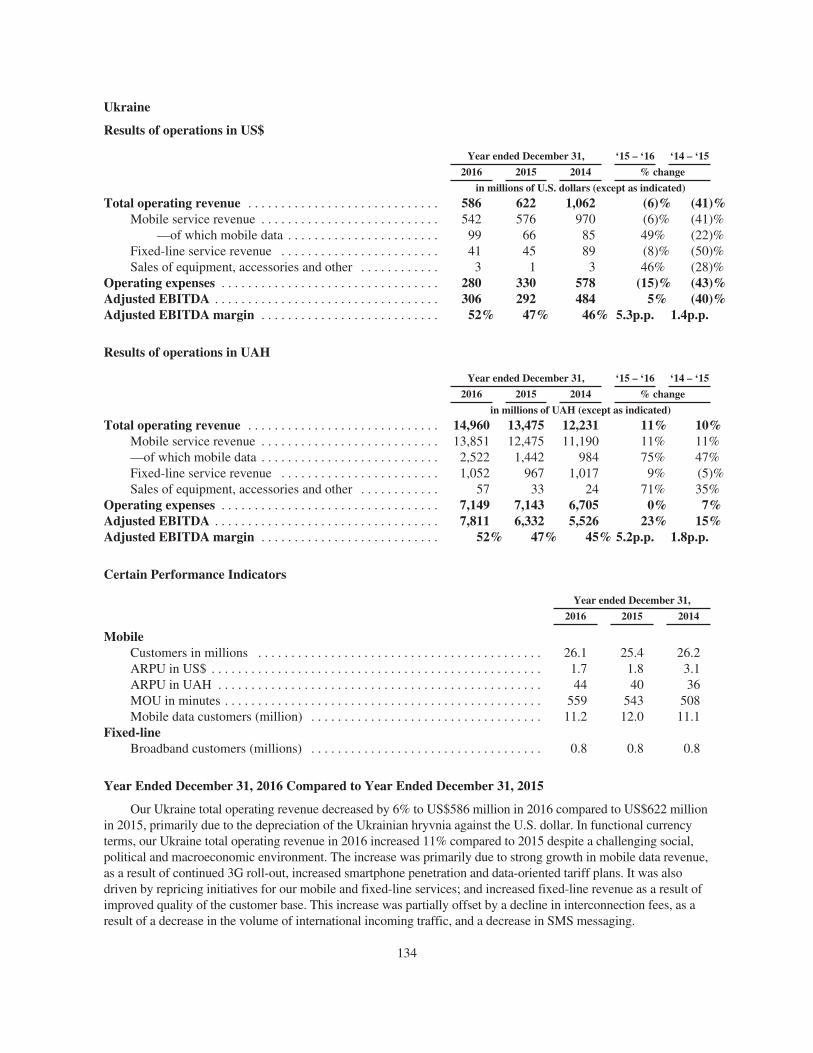
Ukraine
Results of operations in US$
Year ended December 31, ‘15 – ‘16 ‘14 – ‘15
2016 2015 2014 % change
in millions of U.S. dollars (except as indicated)
Total operating revenue . . . . . . . . . . . . . . . . . . . . . . . . . . . . . 586 622 1,062 (6)% (41)%Mobile service revenue . . . . . . . . . . . . . . . . . . . . . . . . . . . 542 576 970 (6)% (41)%
—of which mobile data . . . . . . . . . . . . . . . . . . . . . . . 99 66 85 49% (22)%Fixed-line service revenue . . . . . . . . . . . . . . . . . . . . . . . . 41 45 89 (8)% (50)%Sales of equipment, accessories and other . . . . . . . . . . . . 3 1 3 46% (28)%
Operating expenses . . . . . . . . . . . . . . . . . . . . . . . . . . . . . . . . . 280 330 578 (15)% (43)%Adjusted EBITDA . . . . . . . . . . . . . . . . . . . . . . . . . . . . . . . . . . 306 292 484 5% (40)%Adjusted EBITDA margin . . . . . . . . . . . . . . . . . . . . . . . . . . . 52% 47% 46% 5.3p.p. 1.4p.p.
Results of operations in UAH
Year ended December 31, ‘15 – ‘16 ‘14 – ‘15
2016 2015 2014 % change
in millions of UAH (except as indicated)
Total operating revenue . . . . . . . . . . . . . . . . . . . . . . . . . . . . . 14,960 13,475 12,231 11% 10%Mobile service revenue . . . . . . . . . . . . . . . . . . . . . . . . . . . 13,851 12,475 11,190 11% 11%—of which mobile data . . . . . . . . . . . . . . . . . . . . . . . . . . . 2,522 1,442 984 75% 47%Fixed-line service revenue . . . . . . . . . . . . . . . . . . . . . . . . 1,052 967 1,017 9% (5)%Sales of equipment, accessories and other . . . . . . . . . . . . 57 33 24 71% 35%
Operating expenses . . . . . . . . . . . . . . . . . . . . . . . . . . . . . . . . . 7,149 7,143 6,705 0% 7%Adjusted EBITDA . . . . . . . . . . . . . . . . . . . . . . . . . . . . . . . . . . 7,811 6,332 5,526 23% 15%Adjusted EBITDA margin . . . . . . . . . . . . . . . . . . . . . . . . . . . 52% 47% 45% 5.2p.p. 1.8p.p.
Certain Performance Indicators
Year ended December 31,
2016 2015 2014
MobileCustomers in millions . . . . . . . . . . . . . . . . . . . . . . . . . . . . . . . . . . . . . . . . . . . 26.1 25.4 26.2ARPU in US$ . . . . . . . . . . . . . . . . . . . . . . . . . . . . . . . . . . . . . . . . . . . . . . . . . . 1.7 1.8 3.1ARPU in UAH . . . . . . . . . . . . . . . . . . . . . . . . . . . . . . . . . . . . . . . . . . . . . . . . . 44 40 36MOU in minutes . . . . . . . . . . . . . . . . . . . . . . . . . . . . . . . . . . . . . . . . . . . . . . . . 559 543 508Mobile data customers (million) . . . . . . . . . . . . . . . . . . . . . . . . . . . . . . . . . . . 11.2 12.0 11.1
Fixed-lineBroadband customers (millions) . . . . . . . . . . . . . . . . . . . . . . . . . . . . . . . . . . . 0.8 0.8 0.8
Year Ended December 31, 2016 Compared to Year Ended December 31, 2015
Our Ukraine total operating revenue decreased by 6% to US$586 million in 2016 compared to US$622 millionin 2015, primarily due to the depreciation of the Ukrainian hryvnia against the U.S. dollar. In functional currencyterms, our Ukraine total operating revenue in 2016 increased 11% compared to 2015 despite a challenging social,political and macroeconomic environment. The increase was primarily due to strong growth in mobile data revenue,as a result of continued 3G roll-out, increased smartphone penetration and data-oriented tariff plans. It was alsodriven by repricing initiatives for our mobile and fixed-line services; and increased fixed-line revenue as a result ofimproved quality of the customer base. This increase was partially offset by a decline in interconnection fees, as aresult of a decrease in the volume of international incoming traffic, and a decrease in SMS messaging.
134
Adjusted EBITDA
Our Ukraine Adjusted EBITDA increased by 5% to US$306 million in 2016 compared to US$292 million in2015. In functional currency terms, our Ukraine Adjusted EBITDA increased by 23% in 2016 compared to theprevious year primarily due to higher revenues, as discussed above, and lower interconnect and technologicalmaintenance costs, which were partially offset by an increase in frequency fees, roaming costs, inflation on rentand utilities and the negative effect of the depreciation of the hryvnia on our operating expenses, caused byhigher roaming costs, denominated in U.S. dollars. Please see “Explanatory Note—Non-IFRS FinancialMeasures” for more information on how we calculate Adjusted EBITDA.
Certain Performance Indicators
As of December 31, 2016, we had approximately 26.1 million mobile customers in Ukraine compared to25.4 million mobile customers as of December 31, 2015, representing an increase of 3%, as a result of successfulsales activities and improved churn following enhanced customer based management initiatives.
In 2016, our mobile ARPU in Ukraine decreased by 6% to US$1.7 compared to US$1.8 in 2015, primarilydue to devaluation of the hryvnia. In functional currency terms, mobile ARPU in Ukraine increased in 2016 by11% compared to 2015 mainly due to repricing initiatives and newly introduced tariffs.
In 2016, our mobile MOU in Ukraine increased by 3% to 559 from 543 in 2015, mainly due to higher on-nettraffic.
As of December 31, 2016, we had approximately 0.8 million fixed-line broadband customers in Ukraine,which was broadly stable compared to December 31, 2015.
Year Ended December 31, 2015 Compared to Year Ended December 31, 2014
Our Ukraine total operating revenue decreased by 41.4% to US$622 million in 2015 compared toUS$1,062 million in 2014, primarily due to the depreciation of the Ukrainian hryvnia against the U.S. dollar. Infunctional currency terms, our Ukraine total operating revenue in 2015 was 10.2% higher compared to 2014,primarily due to increased international incoming call revenue and strong growth in mobile data revenue as aresult of the launch of 3G, despite ongoing social unrest and the shutdown of networks in the ATO zone. OurUkraine total operating revenue consists of revenue from providing mobile services as well as fixed-line services.
Mobile Revenue
In 2015, our revenue from mobile services in our Ukraine segment decreased by 40.6% to US$578 millioncompared to US$972 million during 2014, primarily due to the devaluation of the hryvnia by 52.2%.
In 2015, we generated US$290 million of our Ukraine segment service revenue from mobile voice services(i.e. airtime charges from mobile postpaid and prepaid customers, including monthly contract fees and roaming fees,and roaming fees received from other mobile services operators for providing roaming services to their customers),or 50.2% of the total mobile operating revenue in our Ukraine segment, compared to US$539 million, or 55.5% ofthe total mobile operating revenue in 2014. In U.S. dollar terms, service revenue from airtime charges decreased by46.3%, while in functional currency terms, it increased by 1.2%. The decrease in U.S. dollar terms was primarilydue to weakening of the hryvnia. The increase in functional currency was due to the re-pricing of tariffs and 3Glaunch along with new tariff portfolio, and positive effect of currency devaluation on guest roaming revenues.
In 2015, we generated US$139 million of our Ukraine segment service revenue from VAS including datarevenue, or 24.1% of the total mobile operating revenue in our Ukraine segment, compared to US$211 million, or21.7% of the total mobile operating revenue, in 2014. The 33.8% decrease in U.S. dollar terms in our servicerevenue from VAS including data revenue was primarily due to depreciation of the functional currency. In
135
functional currency terms, our Ukraine segment service revenue from VAS including data revenue increased by25.3% mainly due to strong growth in mobile data revenue as a result of 3G roll-out, active promotions ofsmartphones and data-oriented tariff plans.
In 2015, we generated US$147 million of our Ukraine segment service revenue from interconnect fees, or25.4% of the total mobile operating revenue in our Ukraine segment, compared to US$218 million, or 22.4% ofthe total mobile operating revenue in our Ukraine segment, in 2014. In U.S. dollar terms, our Ukraine segmentservice revenue from interconnect fees decreased by 32.8% primarily due to weakening of the hryvnia. Infunctional currency terms, our Ukraine segment service revenue from interconnect revenue increased by 24.2%due to positive currency devaluation effect on revenue from traffic from international operators.
In 2015, we generated US$0.1 million of other service revenue, or 0.0% of the total mobile operatingrevenue in our Ukraine segment in 2015, compared to US$2 million generated in 2014, or 0.2% of the totalmobile operating revenue in 2014. In U.S. dollar terms, our other service revenue decreased by 93.6%, while infunctional currency terms it decreased by 87.9%.
Our Ukraine total mobile operating revenue also included revenue from sales of equipment and accessoriesand other revenue. During 2015, revenue from sales of equipment and accessories and other revenue comprisedUS$2 million, or 0.3% of the total mobile operating revenue in our Ukraine segment, compared to US$2 million,or 0.2% of the total mobile operating revenue in our Ukraine segment, in 2014. In functional currency terms, ourUkraine segment revenue from sales of equipment and accessories and other revenue increased by 53.2% mainlydue to higher revenue from sub-rent of premises driven by increase of floor spaces and rent rates.
Fixed-line Revenue
Our revenue from fixed-line services in Ukraine decreased by 50.1% to US$45 million in 2015 compared toUS$89 million in 2014, primarily due to depreciation of national currency. In functional currency terms, ourrevenue from fixed-line services in Ukraine decreased by 5.2% mainly as a result of reduction in wholesalerevenue.
Our revenue from fixed-line services in Ukraine in 2015 consisted of US$17 million generated frombusiness operations, US$3 million generated from wholesale operations and US$24 million generated fromresidential and FTTB operations. Revenue from business operations decreased by 49.3% compared toUS$34 million in 2014, revenue from wholesale operations decreased by 82.0% compared to US$16 million in2014, and revenue from residential and FTTB operations decreased by 37.8% compared to US$39 million in2014. In U.S. dollar terms the decrease was primarily due to national currency devaluation. In terms of functionalcurrency, our revenue from business operations decreased by 4.1% driven by lower subscribers base. Revenuefrom wholesale operations decreased by 65.3% in terms of functional currency, primarily due to plannedreduction in low margin transit traffic. Residential and FTTB performance increased by 17.7% in terms offunctional currency, primarily due to a favorable FTTB re-pricing.
Adjusted EBITDA
Our Ukraine adjusted EBITDA decreased by 39.6% to US$292 million in 2015 compared to US$484 millionin 2014. In functional currency terms, our Ukraine adjusted EBITDA increased by 14.6% in 2015 primarily due tohigher revenues, mainly data and interconnect revenues, and lower interconnect costs, which was partially offset byan increase in frequency fees due to the 3G license, higher utility and rental costs, and a negative currencydevaluation effect. In functional currency terms, adjusted EBITDA margin in our Ukraine segment in 2015 was47.0%, which is 1.8 percentage points higher than in 2014. Please see “Explanatory Note—Non-IFRS FinancialMeasures” for more information on how we calculate Adjusted EBITDA.
136
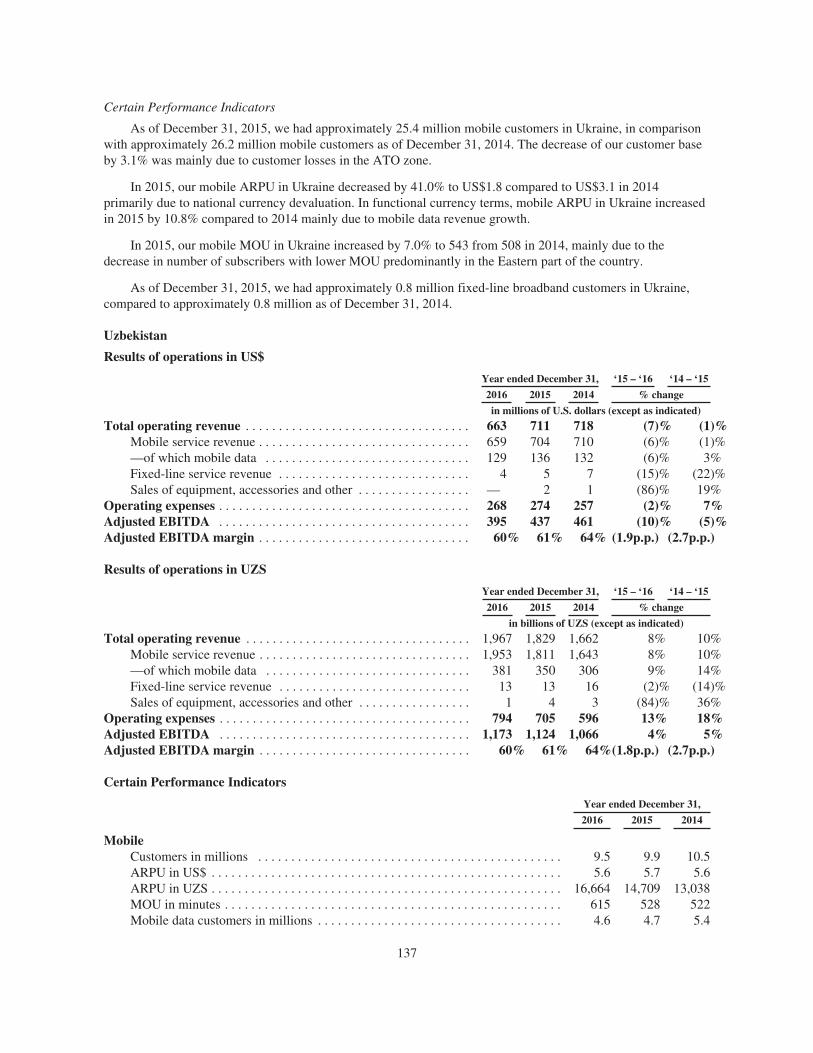
Certain Performance Indicators
As of December 31, 2015, we had approximately 25.4 million mobile customers in Ukraine, in comparisonwith approximately 26.2 million mobile customers as of December 31, 2014. The decrease of our customer baseby 3.1% was mainly due to customer losses in the ATO zone.
In 2015, our mobile ARPU in Ukraine decreased by 41.0% to US$1.8 compared to US$3.1 in 2014primarily due to national currency devaluation. In functional currency terms, mobile ARPU in Ukraine increasedin 2015 by 10.8% compared to 2014 mainly due to mobile data revenue growth.
In 2015, our mobile MOU in Ukraine increased by 7.0% to 543 from 508 in 2014, mainly due to thedecrease in number of subscribers with lower MOU predominantly in the Eastern part of the country.
As of December 31, 2015, we had approximately 0.8 million fixed-line broadband customers in Ukraine,compared to approximately 0.8 million as of December 31, 2014.
Uzbekistan
Results of operations in US$
Year ended December 31, ‘15 – ‘16 ‘14 – ‘15
2016 2015 2014 % change
in millions of U.S. dollars (except as indicated)
Total operating revenue . . . . . . . . . . . . . . . . . . . . . . . . . . . . . . . . . . 663 711 718 (7)% (1)%Mobile service revenue . . . . . . . . . . . . . . . . . . . . . . . . . . . . . . . . 659 704 710 (6)% (1)%—of which mobile data . . . . . . . . . . . . . . . . . . . . . . . . . . . . . . . 129 136 132 (6)% 3%Fixed-line service revenue . . . . . . . . . . . . . . . . . . . . . . . . . . . . . 4 5 7 (15)% (22)%Sales of equipment, accessories and other . . . . . . . . . . . . . . . . . — 2 1 (86)% 19%
Operating expenses . . . . . . . . . . . . . . . . . . . . . . . . . . . . . . . . . . . . . . 268 274 257 (2)% 7%Adjusted EBITDA . . . . . . . . . . . . . . . . . . . . . . . . . . . . . . . . . . . . . . 395 437 461 (10)% (5)%Adjusted EBITDA margin . . . . . . . . . . . . . . . . . . . . . . . . . . . . . . . . 60% 61% 64% (1.9p.p.) (2.7p.p.)
Results of operations in UZS
Year ended December 31, ‘15 – ‘16 ‘14 – ‘15
2016 2015 2014 % change
in billions of UZS (except as indicated)
Total operating revenue . . . . . . . . . . . . . . . . . . . . . . . . . . . . . . . . . . 1,967 1,829 1,662 8% 10%Mobile service revenue . . . . . . . . . . . . . . . . . . . . . . . . . . . . . . . . 1,953 1,811 1,643 8% 10%—of which mobile data . . . . . . . . . . . . . . . . . . . . . . . . . . . . . . . 381 350 306 9% 14%Fixed-line service revenue . . . . . . . . . . . . . . . . . . . . . . . . . . . . . 13 13 16 (2)% (14)%Sales of equipment, accessories and other . . . . . . . . . . . . . . . . . 1 4 3 (84)% 36%
Operating expenses . . . . . . . . . . . . . . . . . . . . . . . . . . . . . . . . . . . . . . 794 705 596 13% 18%Adjusted EBITDA . . . . . . . . . . . . . . . . . . . . . . . . . . . . . . . . . . . . . . 1,173 1,124 1,066 4% 5%Adjusted EBITDA margin . . . . . . . . . . . . . . . . . . . . . . . . . . . . . . . . 60% 61% 64%(1.8p.p.) (2.7p.p.)
Certain Performance Indicators
Year ended December 31,
2016 2015 2014
MobileCustomers in millions . . . . . . . . . . . . . . . . . . . . . . . . . . . . . . . . . . . . . . . . . . . . . . 9.5 9.9 10.5ARPU in US$ . . . . . . . . . . . . . . . . . . . . . . . . . . . . . . . . . . . . . . . . . . . . . . . . . . . . . 5.6 5.7 5.6ARPU in UZS . . . . . . . . . . . . . . . . . . . . . . . . . . . . . . . . . . . . . . . . . . . . . . . . . . . . . 16,664 14,709 13,038MOU in minutes . . . . . . . . . . . . . . . . . . . . . . . . . . . . . . . . . . . . . . . . . . . . . . . . . . . 615 528 522Mobile data customers in millions . . . . . . . . . . . . . . . . . . . . . . . . . . . . . . . . . . . . . 4.6 4.7 5.4
137
Year Ended December 31, 2016 Compared to Year Ended December 31, 2015
Our 2016, our Uzbekistan total operating revenue decreased by 7% to US$663 million compared toUS$711 million in 2015. In Uzbekistan, all of our tariff plans are denominated in U.S. dollars. In functionalcurrency terms, our Uzbekistan total operating revenue increased by 8%, due to the depreciation of the Uzbeksom. The decrease on a U.S. dollar basis, was primarily driven by a revamp of tariff plans by Unitel in orderimprove competitiveness in the new environment following the reentry of MTS to the market and the entry of anew operator, UzMobile. This was partially offset by increased fees derived from termination of calls from otheroperators’ networks and increased smartphone penetration and promotions.
Adjusted EBITDA
In 2016, our Uzbekistan Adjusted EBITDA decreased by 10% to US$395 million compared toUS$437 million in 2015, primarily due to the decrease in revenue, as discussed above, and increased structuraloperating expenses. Structural operating expenses were affected by increased customer-based taxes, whichdoubled in 2016, and higher business costs. In functional currency terms, our Uzbekistan Adjusted EBITDAincreased by 4% in 2016 compared to 2015 because of the devaluation of the Uzbek som. Please see“Explanatory Note—Non-IFRS Financial Measures” for more information on how we calculate AdjustedEBITDA.
Certain Performance Indicators
As of December 31, 2016, we had approximately 9.5 million mobile customers in our Uzbekistan segment,representing a decrease of 4% compared to approximately 9.9 million mobile customers as of December 31,2015. The decrease in our customer base in Uzbekistan was primarily due to the reentry of MTS to the marketand the entry of a new operator, UzMobile.
In 2016, our mobile ARPU in Uzbekistan decreased by 1% to US$5.6 compared to US$5.7 in 2015. Infunctional currency terms, mobile ARPU in Uzbekistan increased by 13% to UZS16,664 in 2016 compared toUZS 14,709 in 2015 mainly because Beeline Uzbekistan price plans are denominated in U.S. dollars and theUzbek som depreciated. We also had growth of data ARPU, driven by a higher data usage driven by increasedsmartphone penetration and promotions.
In 2016, our mobile MOU in Uzbekistan increased by 17% to 615 from 528 in 2015.
As of December 31, 2016, we had approximately 4.6 million mobile data customers in Uzbekistancompared to approximately 4.7 million mobile data customers as of December 31, 2015, representing a decreaseof 2% mainly due to the reentry of MTS to the market and the entry of, UzMobile.
Year Ended December 31, 2015 Compared to Year Ended December 31, 2014
Our Uzbekistan total operating revenue decreased by 1.0% to US$711 million in 2015 from US$718 millionin 2014. In functional currency terms, our Uzbekistan total operating revenue increased by 10.0%. OurUzbekistan total operating revenue consists of revenue from providing mobile services as well as fixed-lineservices.
Mobile Revenue
In our Uzbekistan segment, revenue from mobile services decreased by 0.8% to US$704 million in 2015from US$710 million in 2014, due to the reentry of MTS to the market and the entry of a new operatorUzMobile. In functional currency terms, our revenue from mobile services for the Uzbekistan segment increasedby 9.3% due to Beeline Uzbekistan price plans denominated in U.S. dollars.
In 2015, we generated US$515 million of our service revenue from airtime charges in the Uzbekistansegment from mobile contract and prepaid customers, including monthly contract fees and roaming fees, and
138
roaming fees received from other mobile service operators for providing roaming services to their customers, or73.0% of the total mobile operating revenue in our Uzbekistan segment, compared to US$535 million, or 75.2%of the total mobile operating revenue, in 2014. The 3.8% decrease in U.S. dollar terms during 2015 compared to2014 was attributable to the reentry of MTS to the market and the entry of a new operator UzMobile. While 6.9%increase in functional currency terms due to Beeline Uzbekistan price plans denominated in U.S. dollars.
In 2015, we generated US$33 million of our mobile service revenue from interconnect fees in ourUzbekistan segment, or 4.6% of the total mobile operating revenue in our Uzbekistan segment, compared toUS$25 million, or 3.6% of the total mobile operating revenue in our Uzbekistan segment, in 2014. The 32%increase in U.S. dollar terms in 2015 compared to 2014 was due to the entry of one new mobile operator and there-entry of another. Additionally, 30.2% increase in functional currency terms also due to Beeline Uzbekistanprice plans denominated in U.S. dollars.
In 2015, we generated US$156 million of our mobile service revenue in our Uzbekistan segment from VAS,including data revenue, or 22.1% of the total mobile operating revenue in our Uzbekistan segment, compared toUS$149 million, or 21% of the total mobile operating revenue in the Uzbekistan segment, in 2014. In 2015compared to 2014, this increased by 4.6% in U.S. dollar terms primarily due to focusing on increasing thenumber of regular smartphone data users. Additionally, 16.1% increase in functional currency terms also due toBeeline Uzbekistan price plans denominated in U.S. dollars.
Our Uzbekistan total mobile operating revenue also included revenue from sales of equipment andaccessories and other revenue. In 2015, revenue from sales of equipment and accessories and other revenue inour Uzbekistan segment increased to US$1.3 million from US$1.1 million during 2014. The 26.8% increase inU.S. dollar terms and 45.4% increase in functional currency terms was mainly due to the promotion ofsmartphones sales.
Fixed-line Revenue
Our Uzbekistan total operating revenue from fixed-line services decreased by 22.2% to US$5.3 million in2015 from US$6.8 million in 2014. The decrease was primarily due to price competition from the main operatorUzbekTelecom, resulting in decreased fixed-line customers for Beeline.
Adjusted EBITDA
Our Uzbekistan adjusted EBITDA decreased by 5.1% to US$437 million in 2015 compared toUS$461 million in 2014. In functional currency terms, our Uzbekistan adjusted EBITDA increased by 5.4% in2015 primarily due to an increase of revenue, which was attributable to the fact that Beeline Uzbekistan priceplans were denominated in U.S. dollars. In functional currency terms, our Uzbekistan adjusted EBITDA marginwas 61.5% in 2015, which was 2.7 percentage points lower than in 2014 primarily due to increase in tax percustomer and legal costs. Please see “Explanatory Note—Non-IFRS Financial Measures” for more informationon how we calculate Adjusted EBITDA.
Certain Performance Indicators
As of December 31, 2015, we had approximately 9.9 million mobile customers in our Uzbekistan segment,representing a decrease of 5.5% from approximately 10.6 million mobile customers as of December 31, 2014.The decrease in our customer base in Uzbekistan was a result of the entry of one new mobile operator and there-entry of another.
In 2015, our mobile ARPU in Uzbekistan increased by 1.5% to US$5.7 compared to 2014, while infunctional currency terms, mobile ARPU in Uzbekistan increased in 2015 by 12.8% compared to 2014 mainlydue to growth of data ARPU driven by a higher usage of data.
139
In 2015, our mobile MOU in Uzbekistan increased by 1.1% to 528 from 522 in 2014 primarily due to thelaunch of offers with free traffic in exchange for top-up commitment.
As of December 31, 2015, we had approximately 4.7 million data customers in Uzbekistan, consisting ofapproximately 4.7 million mobile data customers and an insignificant number of fixed-line data customers,compared to approximately 5.4 million mobile broadband customers and an insignificant number of fixed-linedata customers as of December 31, 2014. The decrease was mainly due to the entry of one new mobile operatorand the re-entry of another.
HQ
For historical periods prior to the year ended December 31, 2016, we reported an “HQ and Others” segment,comprised of our current “HQ” segment and the results of our current “Others” category. As of December 31,2016, “Others” is no longer a reportable segment in our financial statements. Therefore, we have restated ourresults and analysis for the years ended December 31, 2015 and 2014 to reflect our new HQ segment.
Year Ended December 31, 2016 Compared to Year Ended December 31, 2015
Our HQ Adjusted EBITDA increased by US$870 million for the year ended December 31, 2016 comparedto 2015 to negative US$421 million, from negative US$1,291 million, primarily due to the US$900 millionprovision with respect to agreements with the SEC, DOJ and OM, included in operating expenses for the yearended December 31, 2015, that was not included in our consolidated total operating expenses for 2016. Pleasesee “Explanatory Note—Non-IFRS Financial Measures” for more information on how we calculate AdjustedEBITDA.
Year Ended December 31, 2015 Compared to Year Ended December 31, 2014
Our HQ Adjusted EBITDA decreased by US$1,058 million for the year ended December 31, 2015compared to the year ended December 31, 2014 to negative US$1,291 million in 2015, from negativeUS$233 million, primarily due to the US$900 million Uzbekistan provision with respect to agreements with theSEC, DOJ and OM, included in operating expenses for the year ended December 31, 2015, that was not includedin our consolidated total operating expenses for 2014. Please see “Explanatory Note—Non-IFRS FinancialMeasures” for more information on how we calculate Adjusted EBITDA.
Italy
Accounting Treatment
On November 5, 2016, we completed a transaction to form a joint venture holding company with Hutchison,through which we jointly own and operate our historical WIND and Hutchison’s historical 3 Italiatelecommunications businesses in Italy. Italy is no longer a reportable segment. We account for the Italy JointVenture using the equity method. However, financial and operational information for Italy is included in thisAnnual Report on Form 20-F because completion of the Italy Joint Venture occurred ten months into the 2016financial year, and because the Italy Joint Venture is a significant part of our business.
All information related to the Italy Joint Venture is the sole responsibility of the Italy Joint Venture’smanagement, and no information contained herein, including, but not limited to, the Italy Joint Venture’sfinancial and industry data, market projections and strategy, has been prepared by or on behalf of, or approvedby, our management. VEON Ltd. is not making, and has not made, any written or oral representation or warranty,express or implied, of any nature whatsoever, with respect to any Italy Joint Venture information included in thisAnnual Report on Form 20-F, other than the financial information that is derived directly from our financialstatements.
140
From January 1, 2016 to November 5, 2016, we classified our Italian business unit as an asset held for saleand discontinued operation in our consolidated financial statements. In connection with this classification, VEONLtd. no longer accounted for depreciation and amortization expenses of the Italian assets. The financial data for2015 and 2014 reflects the classification of Italy as an asset held for sale and a discontinued operation. Theintercompany positions were disclosed as related party transactions and balances. Under the transaction, VEONLtd. contributed its entire shareholding in the operations in Italy, in exchange for a 50% interest in the newlyformed Italy Joint Venture. As a result, the company does not control the Italy Joint Venture’s operations in Italy.Please refer to Notes 6, 13 and 26 to our audited consolidated financial statements included elsewhere in thisAnnual Report on Form 20-F for further information.
Included below is a comparison of the 10 months ended October 31, 2016 and 2015 and a comparison of theyears ended December 31, 2015 and 2014, each accounting for WIND as a discontinued operation. For the effectof the two months ended December 31, 2016, for which we accounted the Italy Joint Venture as an equityinvestment, please see “—Consolidated results—Year Ended December 31, 2016 Compared to Year EndedDecember 31, 2015—Non-operating Profits and Losses—Shares of Loss/(Profit) of Associates and JointVentures Accounted for Using the Equity Method.” For more information, please see “—Key Developments andTrends—Italy Joint Venture” and Note 6 to our audited consolidated financial statements included elsewhere inthis Annual Report on Form 20-F.
The Italy Joint Venture does not have any impact on VEON Ltd.’s current liquidity, as liquidity available atthe level of the Italy Joint Venture is not available to VEON Ltd. due to covenants in debt agreements applicableto our historical WIND business, and now applicable to the Italy Joint Venture. The Italy Joint Venture results ina reduction of our net debt to Adjusted EBITDA, as neither the earnings nor the net debt of the Italy JointVenture are included in the calculations or the determination of the covenant ratios.
Inflation
The inflation rates in Italy for the years ended December 31, 2016, 2015 and 2014, were 0.4%, 0.0% and(0.1)%, respectively.
Foreign Currency Translation
The functional currency of the Italy Joint Venture is the euro. As of December 31, 2016, 2015 and 2014, theeuro-U.S. dollar exchange rates used by VEON Ltd. to translate our historic WIND results were 0.95, 0.92 and0.83 euro per U.S. dollar respectively, as provided by Bloomberg Finance L.P. During 2016, the average euro toU.S. dollar exchange rate was 0.3% higher than the average euro to U.S. dollar exchange rate during 2015.During 2015, the average euro-U.S. dollar exchange rate was 19.5% higher than the average Euro-U.S. dollarexchange rate during 2014.
From November 5, 2016, the Italy Joint Venture has been deconsolidated and may use different exchangerates to report its results than those used by VEON Ltd.
Contractual Restrictions
The Italy Joint Venture is restricted from making dividend distributions and certain other payments toVEON Ltd. by existing covenants in the financing documents governing WIND’s secured debt, whichrestrictions now apply to the successor entity, the Italy Joint Venture.
141
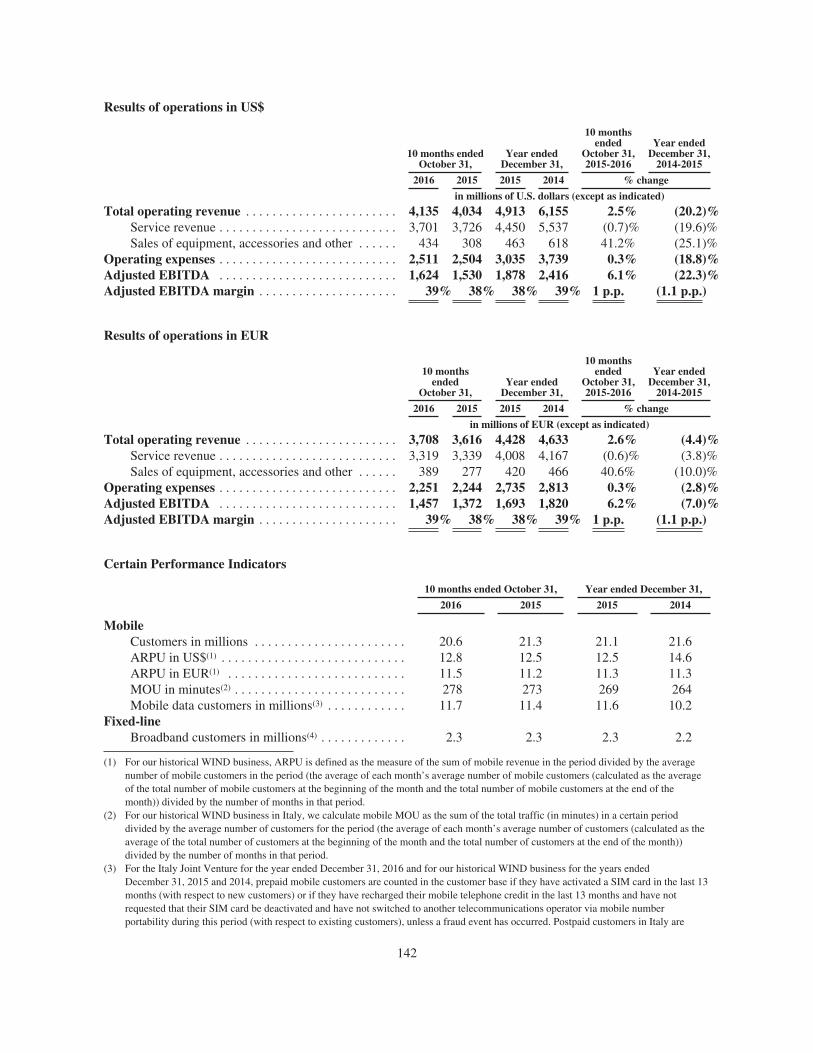
Results of operations in US$
10 months endedOctober 31,
Year endedDecember 31,
10 monthsended
October 31,2015-2016
Year endedDecember 31,
2014-2015
2016 2015 2015 2014 % change
in millions of U.S. dollars (except as indicated)
Total operating revenue . . . . . . . . . . . . . . . . . . . . . . . 4,135 4,034 4,913 6,155 2.5% (20.2)%Service revenue . . . . . . . . . . . . . . . . . . . . . . . . . . . 3,701 3,726 4,450 5,537 (0.7)% (19.6)%Sales of equipment, accessories and other . . . . . . 434 308 463 618 41.2% (25.1)%
Operating expenses . . . . . . . . . . . . . . . . . . . . . . . . . . . 2,511 2,504 3,035 3,739 0.3% (18.8)%Adjusted EBITDA . . . . . . . . . . . . . . . . . . . . . . . . . . . 1,624 1,530 1,878 2,416 6.1% (22.3)%Adjusted EBITDA margin . . . . . . . . . . . . . . . . . . . . . 39% 38% 38% 39% 1 p.p. (1.1 p.p.)
Results of operations in EUR
10 monthsended
October 31,Year ended
December 31,
10 monthsended
October 31,2015-2016
Year endedDecember 31,
2014-2015
2016 2015 2015 2014 % change
in millions of EUR (except as indicated)
Total operating revenue . . . . . . . . . . . . . . . . . . . . . . . 3,708 3,616 4,428 4,633 2.6% (4.4)%Service revenue . . . . . . . . . . . . . . . . . . . . . . . . . . . 3,319 3,339 4,008 4,167 (0.6)% (3.8)%Sales of equipment, accessories and other . . . . . . 389 277 420 466 40.6% (10.0)%
Operating expenses . . . . . . . . . . . . . . . . . . . . . . . . . . . 2,251 2,244 2,735 2,813 0.3% (2.8)%Adjusted EBITDA . . . . . . . . . . . . . . . . . . . . . . . . . . . 1,457 1,372 1,693 1,820 6.2% (7.0)%Adjusted EBITDA margin . . . . . . . . . . . . . . . . . . . . . 39% 38% 38% 39% 1 p.p. (1.1 p.p.)
Certain Performance Indicators
10 months ended October 31, Year ended December 31,
2016 2015 2015 2014
MobileCustomers in millions . . . . . . . . . . . . . . . . . . . . . . . 20.6 21.3 21.1 21.6ARPU in US$(1) . . . . . . . . . . . . . . . . . . . . . . . . . . . . 12.8 12.5 12.5 14.6ARPU in EUR(1) . . . . . . . . . . . . . . . . . . . . . . . . . . . 11.5 11.2 11.3 11.3MOU in minutes(2) . . . . . . . . . . . . . . . . . . . . . . . . . . 278 273 269 264Mobile data customers in millions(3) . . . . . . . . . . . . 11.7 11.4 11.6 10.2
Fixed-lineBroadband customers in millions(4) . . . . . . . . . . . . . 2.3 2.3 2.3 2.2
(1) For our historical WIND business, ARPU is defined as the measure of the sum of mobile revenue in the period divided by the averagenumber of mobile customers in the period (the average of each month’s average number of mobile customers (calculated as the averageof the total number of mobile customers at the beginning of the month and the total number of mobile customers at the end of themonth)) divided by the number of months in that period.
(2) For our historical WIND business in Italy, we calculate mobile MOU as the sum of the total traffic (in minutes) in a certain perioddivided by the average number of customers for the period (the average of each month’s average number of customers (calculated as theaverage of the total number of customers at the beginning of the month and the total number of customers at the end of the month))divided by the number of months in that period.
(3) For the Italy Joint Venture for the year ended December 31, 2016 and for our historical WIND business for the years endedDecember 31, 2015 and 2014, prepaid mobile customers are counted in the customer base if they have activated a SIM card in the last 13months (with respect to new customers) or if they have recharged their mobile telephone credit in the last 13 months and have notrequested that their SIM card be deactivated and have not switched to another telecommunications operator via mobile numberportability during this period (with respect to existing customers), unless a fraud event has occurred. Postpaid customers in Italy are
142

counted in the customer base if they have an active contract unless a fraud event has occurred or the subscription is deactivated due topayment default or because they have requested and obtained through mobile number portability a switch to another telecommunicationsoperator.
(4) In Italy, we measure fixed-line broadband customers for our historical WIND business based on the number of active contracts signed.
Ten Months Ended October 31, 2016 Compared to 10 Months ended October 31, 2015 for our HistoricalWIND Business
WIND’s total operating revenue in Italy increased by 2.5% to US$4,135 million in the ten months endedOctober 31, 2016 compared to US$4,034 million in the ten months ended October 31, 2015 (in functionalcurrency terms, the increase was 2.6%), mainly due to the increase in the sale of mobile telephone handsets ofhigh-range terminals and increased interconnection traffic revenue mainly due to the increase in the incomingvolume of mobile termination traffic, only partially offset by the general reduction of volume and unit tariffs ofSMS and MMS based on market trends.
WIND’s total operating revenue from services was US$3,701 million in the ten months ended October 31,2016, representing a decrease of 1% compared to US$3,726 million in the ten months ended October 31, 2015 (infunctional currency terms, the decrease was 1%). The decrease was mainly due to the difficult macroeconomicsituation and the contraction of the market, which was partially offset by WIND’s ability to maintain a stablemobile customer base and revenue from the development of new offers dedicated to internet navigation onmobile phones.
Adjusted EBITDA
WIND’s Adjusted EBITDA increased by 6.1% to US$1,624 million in the ten months ended October 31,2016 compared to US$1,530 million in the ten months ended October 31, 2015 (in functional currency terms, theincrease was 6.2%). In addition to the effects described on total operating revenues, the increase is the result ofthe solid performance in mobile coupled with cost control activities during the period, including savingsinitiatives in relation to commercial and human resources costs.
Certain Performance Indicators
As of October 31, 2016, we had approximately 20.6 million mobile customers in Italy in our historicalWIND business, representing a decrease of 3.0% from approximately 21.3 million mobile customers as ofOctober 31, 2015. The customer base decrease was in line with the overall market contraction and mainly due toa more rational approach to promotions offered in the period by the main three operators.
In the ten months ended October 31, 2016, WIND’s mobile ARPU in Italy increased by 3% in U.S. dollarterms as well as in functional currency terms.
In the ten months ended October 31, 2016, WIND’s mobile MOU in Italy increased by 1.8% to 278 minutesfrom 273 minutes in the ten months ended October 31, 2015, primarily as a result of the increased diffusion inthe market of bundles including free minutes for a fixed fee.
As of October 31, 2016, WIND had approximately 11.7 million mobile data customers, representing anincrease of 2.7% from approximately 11.4 million mobile data customers as of October 31, 2015. The increasewas mainly due to the increased demand for data in mobility coupled with a higher diffusion of smartphones inthe market.
The fixed-line broadband customers for WIND as of October 31, 2016, were approximately 2.3 million inItaly, which was stable as compared to October 31, 2015. The increase was primarily due to the increaseddemand in Italy for broadband connections.
143
Year Ended December 31, 2015 Compared to Year Ended December 31, 2014 for our Historical WINDBusiness
WIND’s Italy total operating revenue was US$4,913 million during 2015, representing a decrease of 20.2%compared to US$6,155 million in 2014. In functional currency terms, the total operating revenue decreased by4.4%.
WIND’s total operating revenue from services was US$4,450 million in 2015, representing a decrease of19.6% compared to US$5,537 million in 2014 (in functional currency terms, decreased by 3.8%). The decrease inservice revenue was mainly due to a decrease in voice services as a result of the difficult macroeconomicsituation and the contraction of the market.
In 2015, we generated US$3,847 million of our service revenue from mobile and fixed-linetelecommunication services, including revenue from, among others, traffic, roaming revenue from our customerstravelling abroad, fees and contributions from our mobile and fixed-line (including internet) businesses, or 86.5%of our service revenue, which decreased by 20.5% from US$4,837 million of revenue in 2014, or 87.4% of ourservice revenue, in 2014 (in functional currency terms, decreased by 4.8%). The decrease was mainly due to thedifficult macroeconomic situation and the contraction of the market, which was partially offset by WIND’sability to maintain a stable mobile customer base and revenue from the development of new offers dedicated tointernet navigation on mobile phones.
In 2015, we generated US$422 million of our service revenue from interconnection traffic, relating toincoming calls from other operators’ networks to our mobile and fixed-line networks, or 9.5% of our servicerevenue, representing a decrease of 16.7% compared to US$506 million of revenue in 2014, or 9.1% of the totaloperating revenue from services in 2014 (in functional currency terms, decreased by 0.3%). The decrease wasdue to the effect of the reduction of unit tariffs only partially offset by an increase in mobile traffic volume andby an increase in interconnection traffic from VAS.
In 2015, we generated US$138 million of our service revenue from other types of services, which mainlyrelate to leased lines and access fees charged to telecommunications operators and penalties charged to mobileand fixed-line customers, or 3.1% of our service revenue, representing a decrease of 4.7% compared toUS$145 million in 2014, or 2.6% of our service revenue. The decrease compared to 2014 is mainly due to theexchange rate impact.
In functional currency terms, service revenue from other types of services increased by 15.7% over 2014mainly due to services provided to MVNOs.
WIND’s total operating revenue also included revenue from sales of equipment, mainly relating to the saleof SIM cards, mobile and fixed-line phones and related accessories. In 2015, revenue from sales of equipmentwas US$327 million, representing an increase of 8.9% from US$301 million in 2014, which was primarily due tothe increase in the sale of high-range terminals. In functional currency terms, revenue from sales of equipmentincreased by 30.4%.
In 2015, WIND generated US$136 million from the settlement of commercial disputes and penaltiescharged to suppliers, representing a decrease of 57.3% from US$318 million in 2014. In functional currencyterms, the decrease of 48.2% was mainly due to higher proceeds from a settlement recognized in 2014.
Adjusted EBITDA
WIND’s adjusted EBITDA decreased by 22.3% to US$1,878 million in 2015 from US$2,416 million in2014 (in functional currency terms, the decrease was 7.0%); in addition to the effects described on total operatingrevenues, the decrease was due to higher costs 2015 related to the tower services agreement with Galata
144
(following the sale by WIND of 90% of the shares of Galata in 2015 and to certain restructuring costs related toorganizational streamlining and optimization). In functional currency terms, adjusted EBITDA margin in 2015was 37.9%, which is 1.1 percentage points lower than the adjusted EBITDA margin in 2014.
Certain Performance Indicators
As of December 31, 2015, WIND had approximately 21.1 million mobile customers in Italy representing adecrease of 2.2% from approximately 21.6 million customers as of December 31, 2014. Our mobile customerbase decrease in 2015 was in line with overall market contraction and mainly due to lower gross additions in themarket coming from the more rational approach to promotions offered in 2015 by the main three operators.
In 2015, mobile ARPU in Italy decreased to US$12.5 from US$14.6. The decrease was mainly a result ofthe depreciation of functional currency against US$. In functional currency terms ARPU was stable at EUR11.3.
In 2015, mobile MOU in Italy increased by 1.9% to 269 from 264 in 2014, primarily due to the increaseddiffusion in the market of bundles including free minutes for a fixed fee.
As of December 31, 2015, WIND had approximately 11.6 million mobile data customers in Italy,representing an increase of approximately 14.3% over the approximately 10.2 million mobile data customers asof December 31, 2014. The increase was mainly driven by the increased demand for data in mobility coupledwith a higher diffusion of smartphones in the market.
As of December 31, 2015, WIND had approximately 2.3 million fixed-line broadband customers in Italy,representing an increase of approximately 3.1% over the approximately 2.2 million mobile broadband customersas of December 31, 2014. The increase was mainly driven by the increased demand in Italy for broadbandconnections.
Liquidity and Capital Resources
The data for 2015 and 2014 reflects the classification of WIND as a discontinued operation. The data for2016 reflects 10 months of WIND classified as a discontinued operation and two months of WIND classified asan equity investment. For more information, please see “Explanatory Note—Accounting Treatment of ourHistorical WIND Business and the new Italy Joint Venture” and Note 6 to our audited consolidated financialstatements included elsewhere in this Annual Report on Form 20-F.
The Italy Joint Venture does not have any impact on VEON Ltd.’s current liquidity, as liquidity available atthe level of the Italy Joint Venture is not available to VEON Ltd. due to covenants in debt agreements. The ItalyJoint Venture results in a reduction of our net debt to Adjusted EBITDA ratio, as neither the earnings nor the netdebt of the Italy Joint Venture are included in the calculations or the determination of the covenant ratios.
Working Capital
As of December 31, 2016, we had negative working capital of US$2,007 million, compared to negativeworking capital of US$156 million as of December 31, 2015. Working capital is defined as current assets lesscurrent liabilities. The change in our working capital as of December 31, 2016 compared to December 31, 2015was primarily due to increased current financial liabilities, mainly as a result of GTH Finance B.V.’s newly-issued senior notes; increased other liabilities, mainly due to the Pakistan Merger; decreased current financialassets, mainly due to maturing term deposits in banks; decreased cash and cash equivalents, mainly due toinvestments in property and equipment, and utilization of income tax advances against current income taxliabilities. This was partially offset by the decreased provision with the respect to the agreements with the SEC,DOJ and OM, increased trade and other receivables and an increase in other assets, mainly due to the Waridconsolidation.
145
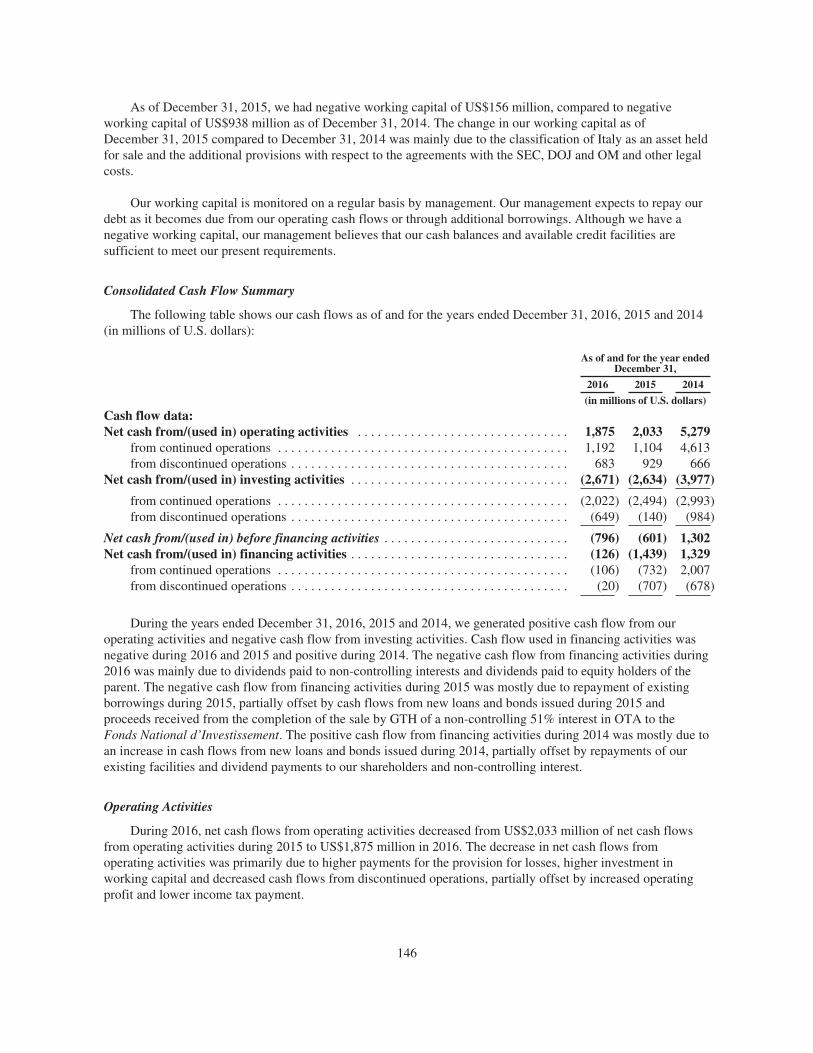
As of December 31, 2015, we had negative working capital of US$156 million, compared to negativeworking capital of US$938 million as of December 31, 2014. The change in our working capital as ofDecember 31, 2015 compared to December 31, 2014 was mainly due to the classification of Italy as an asset heldfor sale and the additional provisions with respect to the agreements with the SEC, DOJ and OM and other legalcosts.
Our working capital is monitored on a regular basis by management. Our management expects to repay ourdebt as it becomes due from our operating cash flows or through additional borrowings. Although we have anegative working capital, our management believes that our cash balances and available credit facilities aresufficient to meet our present requirements.
Consolidated Cash Flow Summary
The following table shows our cash flows as of and for the years ended December 31, 2016, 2015 and 2014(in millions of U.S. dollars):
As of and for the year endedDecember 31,
2016 2015 2014
(in millions of U.S. dollars)
Cash flow data:Net cash from/(used in) operating activities . . . . . . . . . . . . . . . . . . . . . . . . . . . . . . . . 1,875 2,033 5,279
from continued operations . . . . . . . . . . . . . . . . . . . . . . . . . . . . . . . . . . . . . . . . . . . . 1,192 1,104 4,613from discontinued operations . . . . . . . . . . . . . . . . . . . . . . . . . . . . . . . . . . . . . . . . . . 683 929 666
Net cash from/(used in) investing activities . . . . . . . . . . . . . . . . . . . . . . . . . . . . . . . . . (2,671) (2,634) (3,977)
from continued operations . . . . . . . . . . . . . . . . . . . . . . . . . . . . . . . . . . . . . . . . . . . . (2,022) (2,494) (2,993)from discontinued operations . . . . . . . . . . . . . . . . . . . . . . . . . . . . . . . . . . . . . . . . . . (649) (140) (984)
Net cash from/(used in) before financing activities . . . . . . . . . . . . . . . . . . . . . . . . . . . . (796) (601) 1,302Net cash from/(used in) financing activities . . . . . . . . . . . . . . . . . . . . . . . . . . . . . . . . . (126) (1,439) 1,329
from continued operations . . . . . . . . . . . . . . . . . . . . . . . . . . . . . . . . . . . . . . . . . . . . (106) (732) 2,007from discontinued operations . . . . . . . . . . . . . . . . . . . . . . . . . . . . . . . . . . . . . . . . . . (20) (707) (678)
During the years ended December 31, 2016, 2015 and 2014, we generated positive cash flow from ouroperating activities and negative cash flow from investing activities. Cash flow used in financing activities wasnegative during 2016 and 2015 and positive during 2014. The negative cash flow from financing activities during2016 was mainly due to dividends paid to non-controlling interests and dividends paid to equity holders of theparent. The negative cash flow from financing activities during 2015 was mostly due to repayment of existingborrowings during 2015, partially offset by cash flows from new loans and bonds issued during 2015 andproceeds received from the completion of the sale by GTH of a non-controlling 51% interest in OTA to theFonds National d’Investissement. The positive cash flow from financing activities during 2014 was mostly due toan increase in cash flows from new loans and bonds issued during 2014, partially offset by repayments of ourexisting facilities and dividend payments to our shareholders and non-controlling interest.
Operating Activities
During 2016, net cash flows from operating activities decreased from US$2,033 million of net cash flowsfrom operating activities during 2015 to US$1,875 million in 2016. The decrease in net cash flows fromoperating activities was primarily due to higher payments for the provision for losses, higher investment inworking capital and decreased cash flows from discontinued operations, partially offset by increased operatingprofit and lower income tax payment.
146
The cash flow from our operating activities in 2016 was impacted primarily by the payment ofUS$795 million of fines and disgorgements in relation to agreements with the SEC, DOJ and OM, related legalcosts of US$24 million as of December 31, 2016, and US$255 million cash outflow related to the performancetransformation program.
During 2015, net cash flows from operating activities were US$2,033 million, a 61% decrease from theUS$5,279 million of net cash flows from operating activities during 2014. The decrease in net cash flows fromoperating activities was primarily due to lower cash generated by our operations impacted by local currenciesdevaluation partially offset by lower interest paid during 2015. The cash flow from our operating activities in2015 was impacted by the completion of the sale by GTH of a non-controlling 51% interest in OTA to the FondsNational d’Investissement, resulting in payments to the bank of Algeria of US$1.1 billion, payments to Cevital ofUS$50 million, and withholding tax of US$243 million related to the pre-closing dividend.
Investing Activities
Our investing activities included payments related to the purchase of equipment, frequency permissions andlicenses, capitalized customer acquisition costs, software and other assets as a part of the ongoing development ofour mobile networks and fixed-line business.
During 2016, our total payments for purchases of property and equipment, intangible assets, software andother assets were approximately US$1,651 million compared to US$2,207 million during 2015. The decreasewas primarily due to decreased capital expenditures in Russia, functional currency depreciation against the U.S.dollar in Ukraine and decreased capital expenditures in Pakistan due to network modernization completed in2015. This decrease was partially offset by prepayments for inventory made in Uzbekistan. In addition, werecorded a decrease from the disposal of discontinued operations of US$325 million, we received US$19 millionfrom bank deposit accounts, paid US$87 million for purchased financial assets and recorded US$649 million ofcash outflows from discontinued operations during 2016.
The cash flow from our investing activities in 2015 was impacted primarily by cash capital expendituresdriven network investments, increased bank deposit accounts and cash receipts from investments in financialassets. During 2015, the cash flow from investing activities in the discontinued operations was positive due to netproceeds from the sale of towers in Italy.
During 2015, our total payments for purchases of property and equipment, intangible assets, software andother assets were approximately US$2,207 million compared to US$3,501 million during 2014. The decreasewas primarily due to the local currencies’ devaluations against the U.S. dollar as the majority of the purchases areperformed in local currencies. In addition, we have placed on deposit with financial institutions US$361 millionand recorded US$140 million of cash outflows from discontinued operations during 2015. See also “—Acquisitions and Dispositions” below.
Acquisitions and Dispositions
For information regarding our acquisitions and dispositions, see Note 6 to our audited consolidated financialstatements included elsewhere in this Annual Report on Form 20-F.
Financing Activities
During 2016, we repaid approximately US$1,816 million of indebtedness and raised approximatelyUS$1,882 million, which amounts exclude the financing activities in relation to our historical WIND operationsin Italy. As of December 31, 2016, the principal amounts of our external indebtedness for bank loans, bonds,equipment financing and loans from others amounted to approximately US$10.5 billion, compared toUS$9.5 billion as of December 31, 2015. The increase in the principal amounts of our external indebtedness ismainly the result of the issuance of US$1.2 billion of bonds by GTH Finance B.V.
147
During 2015, we repaid approximately US$4,840 million of indebtedness and raised approximatelyUS$2,052 million, which amounts exclude the financing activities in relation to our historical WIND operationsin Italy, following the classification of WIND as a discontinued operation in connection with the Italy JointVenture. As of December 31, 2015, the principal amounts of our external indebtedness for bank loans, bonds,equipment financing, and loans from others amounted to approximately US$9.5 billion, compared toUS$26.4 billion as of December 31, 2014. The decrease of the principal amounts of our external indebtedness ismainly the result of classifying our Italian operations as discontinued operations, the net repayment ofindebtedness and foreign exchange revaluations.
During 2014, we repaid approximately US$3,765 million of indebtedness and raised approximatelyUS$5,859 million, which amounts exclude the financing activities in relation to our historical WIND operationsin Italy following the classification of WIND as a discontinued operation in connection with the Italy JointVenture.
Information about our indebtedness is presented below. Many of the agreements relating to thisindebtedness contain various covenants, including financial covenants relating to our financial performance orfinancial condition, as well as negative pledges, compliance with laws requirements, and restrictions on mergers,acquisitions and certain asset disposals, subject to agreed exceptions. In addition, certain of these agreementssubject certain of our subsidiaries to restrictions on their ability to pay dividends, make loans or repay debts tous. Our financing agreements have various customary events of default which can be triggered by eventsincluding non-payment, breach of applicable covenants, loss of certain mobile licenses, non-payment cross-default, cross-acceleration, certain judgment defaults, certain material adverse events and certain insolvencyevents. Some of our financing agreements also contain “change of control” provisions that may allow the lendersto cancel the facility and/or to require us to make a prepayment if a person or group of persons (with limitedexclusions) acquire beneficial or legal ownership of, or control over more than 50.0% of, the voting share capital,or in certain cases of VEON Ltd., ceases to control more than 50.0% of the borrower’s voting share capital.
On February 16, 2017, we entered into a new multi-currency term loan and revolving facilities agreementfor up to US$2.25 billion for VimpelCom Holdings B.V., see “Item 5—Key Developments and Trends—Multi-Currency Term Loan And Revolving Facilities Agreement and Exhibit 2.6 to this Annual Report onForm 20-F.” For additional information on our outstanding indebtedness, please refer to the notes to our auditedconsolidated financial statements included elsewhere in this Annual Report on Form 20-F. For informationrelating to our financing activities in 2016, and the period subsequent to December 31, 2016, see Note 18 andNote 28, respectively, to our audited consolidated financial statements included elsewhere in this Annual Reporton Form 20-F. For a description of some of the risks associated with certain of our indebtedness, please refer tothe sections of this Annual Report on Form 20-F entitled “Item 3—Key Information—D. Risk Factors—RisksRelated to Our Business—Substantial amounts of indebtedness and debt service obligations could materiallydecrease our cash flow, adversely affect our business and financial condition and prevent us from raisingadditional capital,” “Item 3—Key Information—D. Risk Factors—Risks Related to Our Business—We may notbe able to raise additional capital,” and “Item 3—Key Information—D. Risk Factors—Risks Related to OurBusiness—A disposition by one or both of our largest shareholders of their respective stakes in VEON Ltd. or achange in control of VEON Ltd. could harm our business.”
148
The following table provides a summary of our outstanding indebtedness with an outstanding principalbalance exceeding US$30.0 million as of December 31, 2016, excluding indebtedness of the Italy Joint Venture.
BorrowerType ofdebt/original
lender Interest rate
Outstandingdebt
(in millions) Maturity date Guarantor Security
VimpelComHoldings B.V.
Notes 6.2546% US$349 March 1, 2017 PJSC VimpelCom None
VimpelComHoldings B.V.
Notes 7.5043% US$1,280 March 1, 2022 PJSC VimpelCom None
VimpelComHoldings B.V.
Notes 9.00% US$198(RUB 12,000)
February 13,2018
PJSC VimpelCom None
VimpelComHoldings B.V.
Notes 5.20% US$571 February 13,2019
PJSC VimpelCom None
VimpelComHoldings B.V.
Notes 5.95% US$983 February 13,2023
PJSC VimpelCom None
GTH Finance B.V. Notes 6.25% US$500 April 26, 2020 VimpelComHoldings
None
GTH Finance B.V. Notes 7.25% US$700 April 26, 2023 VimpelComHoldings
None
VimpelComAmsterdam B.V.
Loan from ChinaDevelopment BankCorp.
6 month LIBOR plus3.30%
US$332 December 21,2020
PJSC VimpelCom None
VimpelComAmsterdam B.V.
Loan from HSBC Bankplc
1.72% US$191 July 31, 2022 EKN, PJSCVimpelCom
None
VimpelComAmsterdam B.V.(1)
Loan from AO “Alfa-Bank”
1 month LIBORplus 3.25%
US$500 April 17, 2017 VimpelComHoldings
None
VimpelComAmsterdam B.V.(2)
Loan from AO “Alfa-Bank”
1 month LIBORplus 3.25%
US$500 May 3, 2017 VimpelComHoldings
None
VimpelComAmsterdam B.V.
Loan from ING BankN.V.
6 month LIBORplus 1.08%
US$78 October 16,2023
EKN, VimpelComHoldings
None
PJSC VimpelCom Loan from VIPFinance IrelandLimited (funded by theissuance of loanparticipation notes byVIP Finance Ireland)
9.125% US$499 April 30, 2018 None None
PJSC VimpelCom Loan from VIPFinance Ireland(funded by the issuanceof loan participationnotes by VIP FinanceIreland)
7.748% US$651 February 2, 2021 None None
PJSC VimpelCom RUB denominatedbonds
10.00% US$248(RUB 15,052)
March 8, 2022(3) None None
PJSC VimpelCom RUB denominatedbonds
11.90% US$412(RUB 25,000)
October 3,2025(4)
None None
PJSC VimpelCom Loan from Sberbank 12.75%(5) US$435(RUB 26,357)
April 11, 2018 None None
PJSC VimpelCom Loan from Sberbank 12.75%(6) US$92(RUB 5,556)
May 29, 2017 None None
PJSC VimpelCom Loan from Sberbank 11.55% US$495(RUB 30,000)
June 29, 2018 None None
PJSC VimpelCom Loan from HSBC Bankplc, Nordea Bank AB(publ)
3 month MosPRIMEplus 1.00%
US$38(RUB2,278)
April 30, 2019 EKN None
PMCL Syndicated loan viaMCB Bank Limited
6 month KIBOR plus1.25%
US$48(PKR5,000)
May 16, 2019 None Certain assetsof PMCL(7)
149
BorrowerType ofdebt/original
lender Interest rate
Outstandingdebt
(in millions) Maturity date Guarantor Security
PMCL Loan from Habib BankLimited
6 month KIBOR plus1.15%
US$36(PKR3,750)
May 16, 2019 None Certain assetsof PMCL(7)
PMCL Loan from UnitedBank Limited
6 month KIBOR plus1.10%
US$34(PKR3,600)
May 16, 2021 None Certain assetsof PMCL(7)
PMCL Sukuk Certificates 3 month KIBOR plus0.88%
US$66(PKR6,900)
December 22, 2019 None Certain assetsof PMCL(7)
PMCL Loan from MCB BankLimited
6 month KIBOR plus0.80%
US$48(PKR5,000)
December 23, 2020 None Certain assetsof PMCL(7)
PMCL Loan from ING BankN.V.
6 month LIBOR plus1.90%
US$231 December 31, 2020 EKN Certain assetsof PMCL(7)
PMCL Syndicated mark-upagreement via HabibBank Limited
6.00% US$60(PKR6,268)
December 31, 2023 None Certain assetsof PMCL(7)
PMCL Syndicated mark-upagreement via HabibBank Limited
6.00% US$40(PKR4,154)
December 31, 2023 None Certain assetsof PMCL(7)
BDCL Senior Notes 8.625% US$300 May 6, 2019 None None
OTA Syndicated LoanFacility
Bank of AlgeriaRe-Discount Rate plus
2.00%
US$340(DZD37,500)
September 30,2019
None Dividendassignment
Other loans,equipmentfinancing andcapital leaseobligations
— — US$234 — — —
(1) On March 29, 2017, we entered into an agreement to amend and extend this facility until October 17, 2017. Pursuant to this agreement,VimpelCom Holdings B.V. has replaced VimpelCom Amsterdam B.V. as the borrower and the guarantee from VimpelCom HoldingsB.V. was terminated. In addition, VimpelCom Holdings B.V. granted AO “Alfa-Bank” the right to novate some of the principal amountof the facility to other lenders. On March 29, 2017, VimpelCom Holdings B.V. received confirmation that US$350 of the extendedfacility had been novated by AO “Alfa-Bank” to Sberbank.
(2) We anticipate that we will enter into an agreement to amend and extend this facility prior to the maturity date.(3) These bonds were subject to an investor put option at March 17, 2017 which was exercised. For further information, see Note 28 to our
audited consolidated financial statements included elsewhere in this Annual Report on Form 20-F.(4) These bonds are subject to an investor put option at October 13, 2017.(5) The fixed interest rate applicable to these loans ranges from 9.0% to 14.0% depending on certain conditions set out in the agreements.(6) The fixed interest rate applicable to these loans ranges from 10.75% to 14.0% depending on certain conditions set out in the agreements.(7) Charges over moveable fixed assets, receivables, cash balances, investments, cash collections and book debts.
Cash and deposits subject to currency and contractual restrictions
As of December 31, 2016, the cash and deposit balances of VEON Group were equal to US$3,327 million.US$1,715 million (52% of total group cash and deposits) were denominated in U.S. dollars and approximately80% of the U.S. dollar denominated cash is held in VEON Group headquarter entities.
As of December 31, 2016, the cash and deposits balances in Uzbekistan of US$727 million and Ukraine ofUS$3 million were restricted from repatriation due to local government or central bank regulations. As part of theclosing of the transaction and settlement with the Algerian Government on January 30, 2015, the foreignexchange and import restrictions put in place by the Bank of Algeria against OTA on April 15, 2010 prohibitingthe repatriation of cash balances in Algeria were lifted. Algerian foreign exchange regulations continue, however,to require strict regulatory approval before a company can engage in certain foreign exchange transactions.Bangladesh has similar requirements. For more information about the currency restrictions in our countries ofoperation, see “—Certain Ongoing Factors Affecting Our Financial Position and Results of Operations—Foreign
150
Currency Controls and Currency Restrictions,” “Item 3—Key Information—D. Risk Factors—Risks Related toOur Business—We are exposed to foreign currency exchange loss and currency fluctuation and convertibilityrisks,” “Item 3—Key Information—D. Risk Factors—Risks Related to Our Business—As a holding company,VEON Ltd. depends on the ability of its subsidiaries to pay dividends and therefore on the performance of itssubsidiaries, and is affected by changes in exchange controls and currency restrictions in the countries in whichits subsidiaries operate” and “Item 3—Key Information—D. Risk Factors—Risks Related to Our Markets—Thebanking systems in many countries in which we operate remain underdeveloped, there are a limited number ofcreditworthy banks in these countries with which we can conduct business and currency control requirementsrestrict activities in certain markets in which we have operations,” as well as Notes 21 and 26 to our auditedconsolidated financial statements included elsewhere in this Annual Report on Form 20-F.
Certain of the agreements relating to our indebtedness subject our subsidiaries to restrictions on their abilityto pay dividends, make loans or repay debts to us. For additional information on our indebtedness, please see“—Financing Activities” and the notes to our audited consolidated financial statements included elsewhere inthis Annual Report on Form 20-F. For a description of some of the risks associated with certain of ourindebtedness, please see “Item 3—Key Information—D. Risk Factors—Risks Related to OurBusiness—Substantial amounts of indebtedness and debt service obligations could materially decrease our cashflow, adversely affect our business and financial condition and prevent us from raising additional capital,” and“Item 3—Key Information—D. Risk Factors—Risks Related to Our Business—We may not be able to raiseadditional capital.”
Earnings subject to indefinite investment
During 2016, we recorded a deferred tax liability of US$73 million relating to the tax effect of ourundistributed profits that will be distributed in the foreseeable future, primarily in relation to our Russian,Algerian and Pakistani operations. The undistributed earnings of our foreign subsidiaries (outside theNetherlands) which are indefinitely invested and will not be distributed in the foreseeable future, amounted toapproximately US$8,495 million as of December 31, 2016. For more information, please see Note 11 to ouraudited consolidated financial statements included elsewhere in this Annual Report on Form 20-F.
Future Liquidity and Capital Requirements
Telecommunications service providers require significant amounts of capital to construct networks andattract customers. In the foreseeable future, our further expansion will require significant investment activity,including the purchase of equipment and possibly the acquisition of other companies.
Our capital expenditures include purchases of new licenses, equipment, new construction, upgrades,software, other long-lived assets and related reasonable costs incurred prior to intended use of the noncurrentassets, accounted at the earliest event of advance payment or delivery. Long-lived assets acquired in businesscombinations are not included in capital expenditures.
During 2016, our capital expenditures were approximately US$1,741 million compared to approximatelyUS$2,034 million in 2015, in each case, excluding capital expenditures in Italy. The decrease in capitalexpenditures was primarily due to functional currency depreciation against the U.S. dollar and efficienciesreached by the performance transformation program.
During 2015, our capital expenditures were approximately US$2,034 million compared to approximatelyUS$3,229 million during 2014, excluding capital expenditures in Italy. The decrease in capital expenditures in2015 compared to 2014 was primarily due to depreciation of functional currency against U.S. dollar.
151
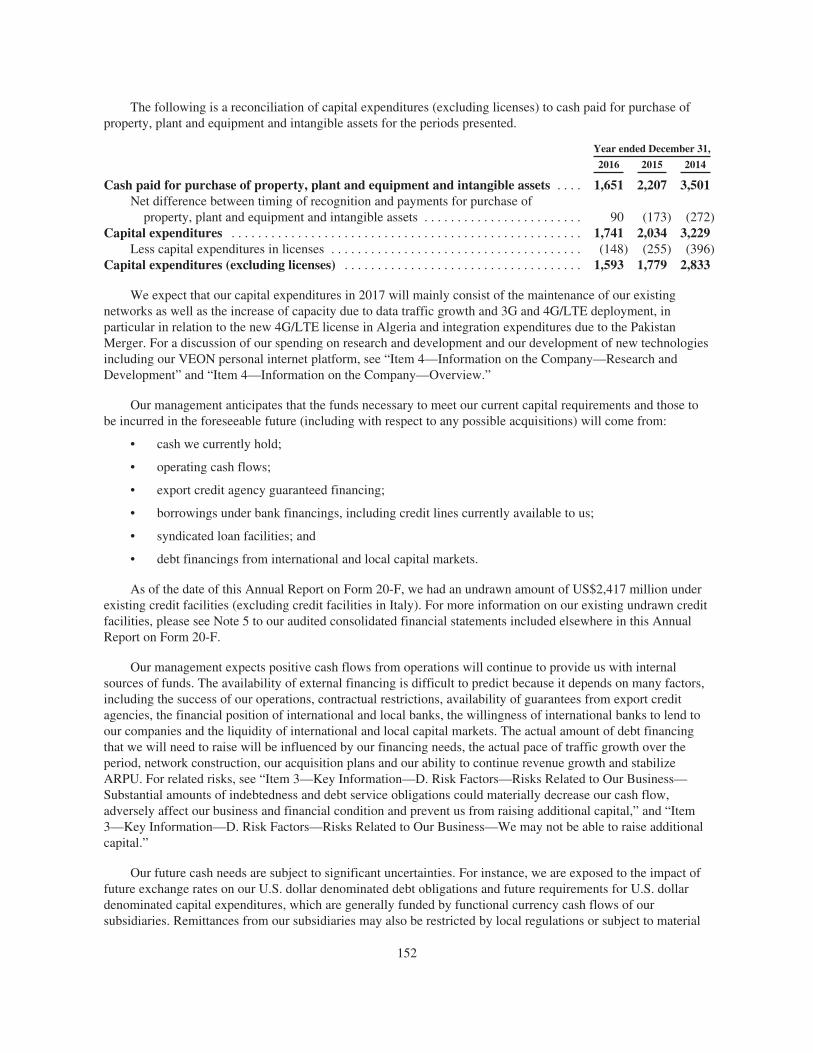
The following is a reconciliation of capital expenditures (excluding licenses) to cash paid for purchase ofproperty, plant and equipment and intangible assets for the periods presented.
Year ended December 31,
2016 2015 2014
Cash paid for purchase of property, plant and equipment and intangible assets . . . . 1,651 2,207 3,501Net difference between timing of recognition and payments for purchase of
property, plant and equipment and intangible assets . . . . . . . . . . . . . . . . . . . . . . . . 90 (173) (272)Capital expenditures . . . . . . . . . . . . . . . . . . . . . . . . . . . . . . . . . . . . . . . . . . . . . . . . . . . . . 1,741 2,034 3,229
Less capital expenditures in licenses . . . . . . . . . . . . . . . . . . . . . . . . . . . . . . . . . . . . . . (148) (255) (396)Capital expenditures (excluding licenses) . . . . . . . . . . . . . . . . . . . . . . . . . . . . . . . . . . . . 1,593 1,779 2,833
We expect that our capital expenditures in 2017 will mainly consist of the maintenance of our existingnetworks as well as the increase of capacity due to data traffic growth and 3G and 4G/LTE deployment, inparticular in relation to the new 4G/LTE license in Algeria and integration expenditures due to the PakistanMerger. For a discussion of our spending on research and development and our development of new technologiesincluding our VEON personal internet platform, see “Item 4—Information on the Company—Research andDevelopment” and “Item 4—Information on the Company—Overview.”
Our management anticipates that the funds necessary to meet our current capital requirements and those tobe incurred in the foreseeable future (including with respect to any possible acquisitions) will come from:
• cash we currently hold;
• operating cash flows;
• export credit agency guaranteed financing;
• borrowings under bank financings, including credit lines currently available to us;
• syndicated loan facilities; and
• debt financings from international and local capital markets.
As of the date of this Annual Report on Form 20-F, we had an undrawn amount of US$2,417 million underexisting credit facilities (excluding credit facilities in Italy). For more information on our existing undrawn creditfacilities, please see Note 5 to our audited consolidated financial statements included elsewhere in this AnnualReport on Form 20-F.
Our management expects positive cash flows from operations will continue to provide us with internalsources of funds. The availability of external financing is difficult to predict because it depends on many factors,including the success of our operations, contractual restrictions, availability of guarantees from export creditagencies, the financial position of international and local banks, the willingness of international banks to lend toour companies and the liquidity of international and local capital markets. The actual amount of debt financingthat we will need to raise will be influenced by our financing needs, the actual pace of traffic growth over theperiod, network construction, our acquisition plans and our ability to continue revenue growth and stabilizeARPU. For related risks, see “Item 3—Key Information—D. Risk Factors—Risks Related to Our Business—Substantial amounts of indebtedness and debt service obligations could materially decrease our cash flow,adversely affect our business and financial condition and prevent us from raising additional capital,” and “Item3—Key Information—D. Risk Factors—Risks Related to Our Business—We may not be able to raise additionalcapital.”
Our future cash needs are subject to significant uncertainties. For instance, we are exposed to the impact offuture exchange rates on our U.S. dollar denominated debt obligations and future requirements for U.S. dollardenominated capital expenditures, which are generally funded by functional currency cash flows of oursubsidiaries. Remittances from our subsidiaries may also be restricted by local regulations or subject to material
152
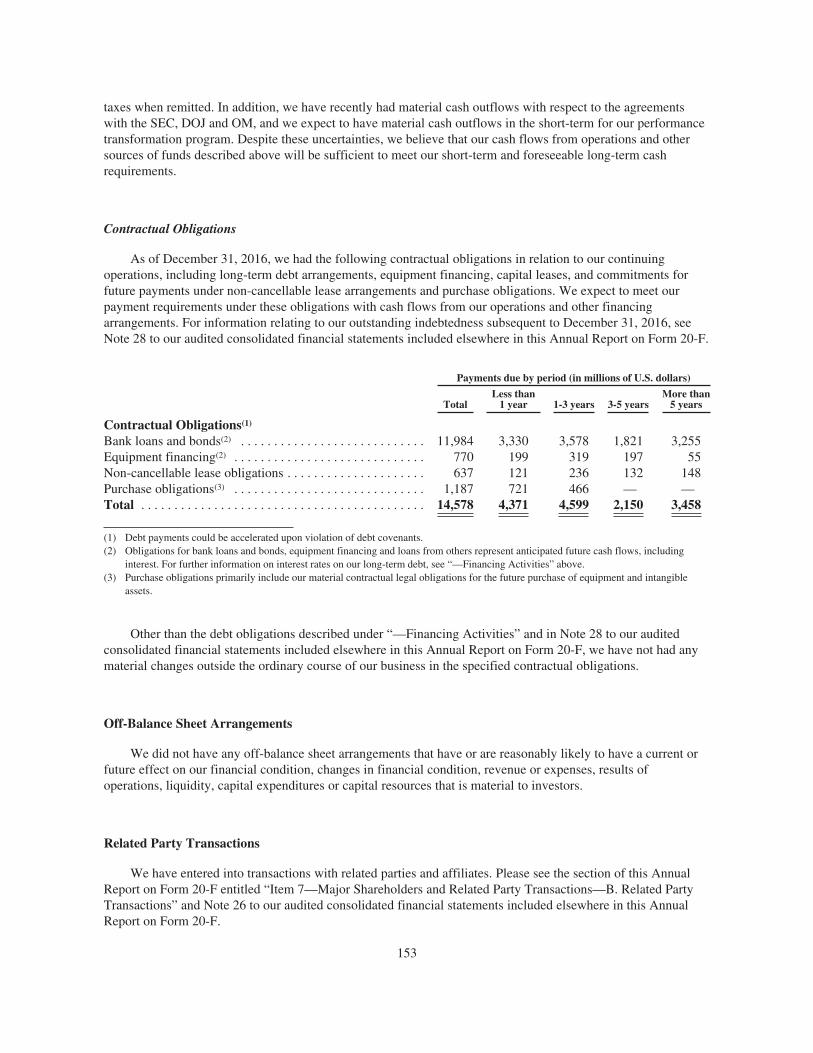
taxes when remitted. In addition, we have recently had material cash outflows with respect to the agreementswith the SEC, DOJ and OM, and we expect to have material cash outflows in the short-term for our performancetransformation program. Despite these uncertainties, we believe that our cash flows from operations and othersources of funds described above will be sufficient to meet our short-term and foreseeable long-term cashrequirements.
Contractual Obligations
As of December 31, 2016, we had the following contractual obligations in relation to our continuingoperations, including long-term debt arrangements, equipment financing, capital leases, and commitments forfuture payments under non-cancellable lease arrangements and purchase obligations. We expect to meet ourpayment requirements under these obligations with cash flows from our operations and other financingarrangements. For information relating to our outstanding indebtedness subsequent to December 31, 2016, seeNote 28 to our audited consolidated financial statements included elsewhere in this Annual Report on Form 20-F.
Payments due by period (in millions of U.S. dollars)
TotalLess than
1 year 1-3 years 3-5 yearsMore than
5 years
Contractual Obligations(1)
Bank loans and bonds(2) . . . . . . . . . . . . . . . . . . . . . . . . . . . . 11,984 3,330 3,578 1,821 3,255Equipment financing(2) . . . . . . . . . . . . . . . . . . . . . . . . . . . . . 770 199 319 197 55Non-cancellable lease obligations . . . . . . . . . . . . . . . . . . . . . 637 121 236 132 148Purchase obligations(3) . . . . . . . . . . . . . . . . . . . . . . . . . . . . . 1,187 721 466 — —Total . . . . . . . . . . . . . . . . . . . . . . . . . . . . . . . . . . . . . . . . . . . 14,578 4,371 4,599 2,150 3,458
(1) Debt payments could be accelerated upon violation of debt covenants.(2) Obligations for bank loans and bonds, equipment financing and loans from others represent anticipated future cash flows, including
interest. For further information on interest rates on our long-term debt, see “—Financing Activities” above.(3) Purchase obligations primarily include our material contractual legal obligations for the future purchase of equipment and intangible
assets.
Other than the debt obligations described under “—Financing Activities” and in Note 28 to our auditedconsolidated financial statements included elsewhere in this Annual Report on Form 20-F, we have not had anymaterial changes outside the ordinary course of our business in the specified contractual obligations.
Off-Balance Sheet Arrangements
We did not have any off-balance sheet arrangements that have or are reasonably likely to have a current orfuture effect on our financial condition, changes in financial condition, revenue or expenses, results ofoperations, liquidity, capital expenditures or capital resources that is material to investors.
Related Party Transactions
We have entered into transactions with related parties and affiliates. Please see the section of this AnnualReport on Form 20-F entitled “Item 7—Major Shareholders and Related Party Transactions—B. Related PartyTransactions” and Note 26 to our audited consolidated financial statements included elsewhere in this AnnualReport on Form 20-F.
153
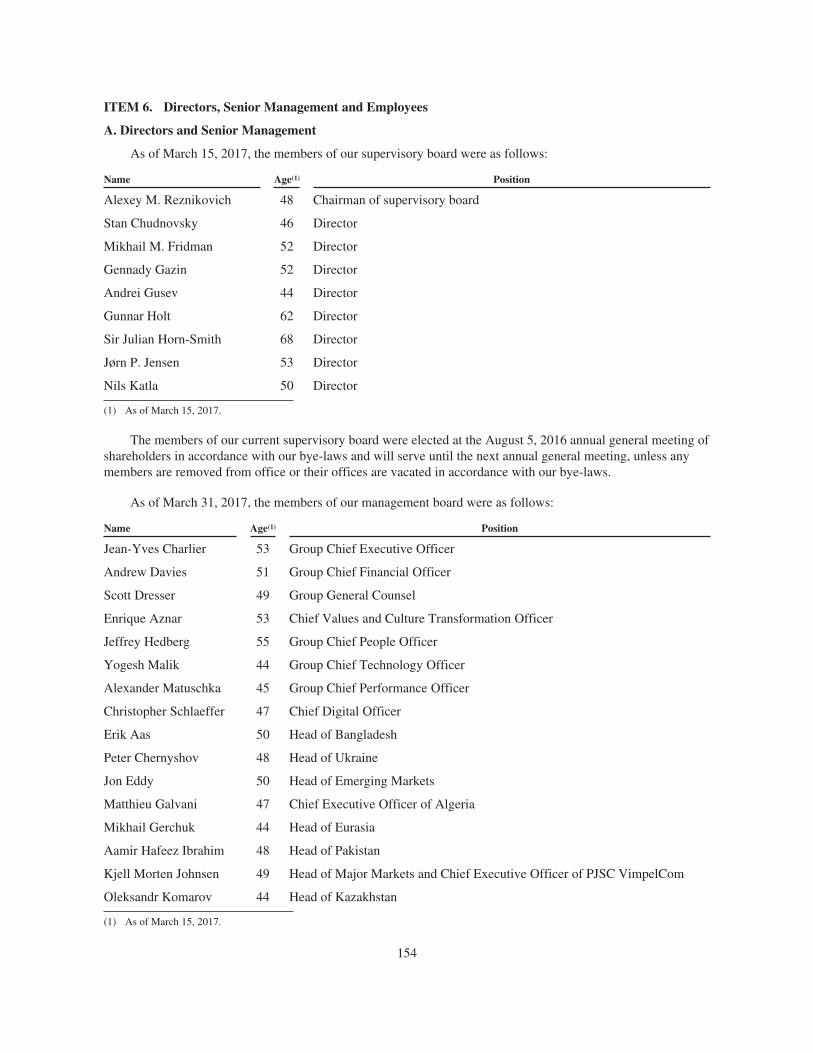
ITEM 6. Directors, Senior Management and Employees
A. Directors and Senior Management
As of March 15, 2017, the members of our supervisory board were as follows:
Name Age(1) Position
Alexey M. Reznikovich 48 Chairman of supervisory board
Stan Chudnovsky 46 Director
Mikhail M. Fridman 52 Director
Gennady Gazin 52 Director
Andrei Gusev 44 Director
Gunnar Holt 62 Director
Sir Julian Horn-Smith 68 Director
Jørn P. Jensen 53 Director
Nils Katla 50 Director
(1) As of March 15, 2017.
The members of our current supervisory board were elected at the August 5, 2016 annual general meeting ofshareholders in accordance with our bye-laws and will serve until the next annual general meeting, unless anymembers are removed from office or their offices are vacated in accordance with our bye-laws.
As of March 31, 2017, the members of our management board were as follows:
Name Age(1) Position
Jean-Yves Charlier 53 Group Chief Executive Officer
Andrew Davies 51 Group Chief Financial Officer
Scott Dresser 49 Group General Counsel
Enrique Aznar 53 Chief Values and Culture Transformation Officer
Jeffrey Hedberg 55 Group Chief People Officer
Yogesh Malik 44 Group Chief Technology Officer
Alexander Matuschka 45 Group Chief Performance Officer
Christopher Schlaeffer 47 Chief Digital Officer
Erik Aas 50 Head of Bangladesh
Peter Chernyshov 48 Head of Ukraine
Jon Eddy 50 Head of Emerging Markets
Matthieu Galvani 47 Chief Executive Officer of Algeria
Mikhail Gerchuk 44 Head of Eurasia
Aamir Hafeez Ibrahim 48 Head of Pakistan
Kjell Morten Johnsen 49 Head of Major Markets and Chief Executive Officer of PJSC VimpelCom
Oleksandr Komarov 44 Head of Kazakhstan
(1) As of March 15, 2017.
154
Supervisory Board
Alexey M. Reznikovich has been Chairman of the VEON Ltd. supervisory board since December 2012 anda director of VEON Ltd. since April 2010. He also serves as chairman of VEON Ltd.’s compensation committee.Mr. Reznikovich was a member of the board of directors of PJSC VimpelCom from May 2002 until April 2010.Mr. Reznikovich has served as Managing Partner of LetterOne Telecom since June 2014. Prior to joiningLetterOne Telecom, he was Chief Executive Officer of LLC Altimo from April 2005 to May 2014 and ChiefExecutive Officer of Altimo Holdings & Investments Ltd. from June 2006 to May 2014. He has been a memberof the supervisory board of the Alfa Group Consortium since 2002, with overall responsibility for businessdevelopment and management supervision of the group’s assets. Mr. Reznikovich was a director of GoldenTelecom from May 2007 until February 2008. In 2001, Mr. Reznikovich founded EMAX, a new business ventureto develop internet centers in Russia and has been a director of EMAX and of CAFEMAX, an internet café chain,since February 2001. From December 1998 to 2000, Mr. Reznikovich was a partner at McKinsey & Co. Prior tohis time at McKinsey, Mr. Reznikovich worked at Procter & Gamble in Italy and Transworld in the UnitedStates. He graduated from the Economics Faculty of the Moscow State University and received an M.B.A. fromGeorgetown University in the United States and from INSEAD in France.
Stan Chudnovsky has been a director of VEON Ltd. since August 2016. Mr. Chudnovsky is Head ofProduct for Messaging at Facebook. Before joining Facebook, Mr. Chudnovsky was Vice President of Growth,Global Strategy and Special Operations at PayPal after a company he co-founded, IronPearl, was acquired. Priorto this, Mr. Chudnovsky was involved in the establishment of Tickle Inc., one of the first social mediacompanies, and grew it to become one of the largest websites in the world by 2003. Mr. Chudnovsky has a strongbackground as an entrepreneur, having co-founded several other successful internet companies including Jiff,NFX, Ooga Labs, and Wonderhill. He has served on a number of corporate boards, including Goodreads andZinch. Originally from Moscow, Mr. Chudnovsky earned engineering degrees in Russia.
Mikhail M. Fridman has been a director of VEON Ltd. since April 2010. Mr. Fridman was a member of theboard of directors of PJSC VimpelCom from July 2001 until April 2010. He currently serves as a member of theboard of directors of OJSC Alfa-Bank, as well as Chairman of the supervisory boards of the Alfa GroupConsortium and LetterOne Holdings S.A. Mr. Fridman also serves as a member of the supervisory board of X5Retail Group N.V. He is a member of the Public Chamber of the Russian Federation. Since 1989, Mr. Fridmanhas taken an active role in managing the Alfa Group, which includes Alfa Finance Holdings S.A. (Alfa Bank,Alfa Capital Holdings Limited and Medpoint Limited), Altimo and X5 Retail Group N.V. In 1988, Mr. Fridmanco-founded the Alfa-Foto cooperative. From 1986 until 1988, Mr. Fridman served as an engineer at ElektrostalMetallurgical Works. Mr. Fridman graduated with honors from the Faculty of Non-Ferrous Metals of theMoscow Institute of Steel and Alloys in 1986.
Gennady Gazin has been an alternate director of VEON Ltd. since October 2014 and a director of VEONLtd. since June 2015. Mr. Gazin is serving as a chairman of VEON Ltd.’s nominating and corporate governancecommittee and as a member of its finance and strategy committee and audit committee. He served as chairman ofits special committee overseeing the internal investigation and the company’s response to the inquiries by variousauthorities until its dissolution on August 3, 2016. Mr. Gazin currently serves as Director at Interpipe, a producerof pipes and railroad wheels; Director at GeoAlliance, an oil and gas production company; and Chairman of theBoard at Genesis Philanthropy Group. From 2007 to 2012, Mr. Gazin served as CEO of EastOne, an internationalinvestment advisory group. Prior to EastOne, Mr. Gazin worked at McKinsey & Company’s New York andMoscow offices for 14 years, during which time he was an active member of the Telecommunications practiceand also served as the Senior Partner responsible for McKinsey’s CIS practice. Mr. Gazin started his professionalcareer as a systems and telecommunications engineer at Bell Communications Research/Tellcordia and GeneralDynamics in the USA. Mr. Gazin received a bachelor’s degree in Electrical Engineering from Cornell Universityin 1987, a master’s degree in Electrical Engineering from Stanford University in 1988 and an M.B.A. from theWharton School of Business at the University of Pennsylvania in 1993.
155
Andrei Gusev has been a director of VEON Ltd. since April 2014. Mr. Gusev is serving as a chairman ofVEON Ltd.’s finance and strategy committee and as a member of its nominating and corporate governancecommittee and compensation committee. Mr. Gusev is a senior partner at LetterOne Telecom (UK) LLP, joiningin 2014, and was a managing director at Altimo from 2013 to 2014. Mr. Gusev was Chief Executive Officer ofX5 Retail Group N.V. from 2011 to 2012 and prior to that, from 2006 to 2010, served as its Director of BusinessDevelopment and M&A. From 2001 to 2005, Mr. Gusev served as Managing Director of the Alfa Group withoverall responsibility for investment planning. Prior to that, Mr. Gusev worked at Bain & Company and DeloitteConsulting. Mr. Gusev received an M.B.A. from the Wharton School at the University of Pennsylvania in 2000and a diploma with honors from the Department of Applied Mathematics and Computer Science at LomonosovMoscow State University in 1994.
Gunnar Holt has been a director of VEON Ltd. since June 2015. Mr. Holt is serving as a member ofVEON Ltd.’s finance and strategy committee and audit committee. Mr. Holt has been a Senior Advisor atTelenor ASA since 2006 and previously served as a Group Finance Director. From 1995 to 1999, he worked atAker ASA and Aker RGI ASA, serving as Executive Vice President and CFO. From 1986 to 1995, he heldvarious leadership positions in the Aker Group, including Deputy President of Norwegian Contractors AS,Executive Vice President and Chief Financial Officer of Aker Oil and Gas Technology AS, President of AkerEiendom AS, and Finance and Accounting Director of Aker Norcem AS. From 1978 to 1986, he served asExecutive Officer and Special Advisor in the Norwegian Ministry of Petroleum and Energy. Mr. Holt holds aDoctor of Business Administration degree and Advanced Postgraduate Diploma in Management Consultancyfrom Henley Management Collage, Brunel University, in the United Kingdom; an MBA from the University ofQueensland in Australia, and an M.B.A. in finance from the University of Wisconsin. He also received aDiplomøkonom from The Norwegian School of Management. Mr. Holt has served on a number of corporateboards.
Sir Julian Horn-Smith has been a director of VEON Ltd. since July 2014. Sir Julian served as a member ofVEON Ltd.’s special committee overseeing the internal investigation and the company’s response to the inquiriesby various authorities until its dissolution on August 3, 2016. Sir Julian is active in the globaltelecommunications sector as a Senior Advisor to UBS Investment Bank, in London and Senior Advisor to CVC(Telecoms and Media). He also serves as an advisor to LetterOne. Sir Julian previously served as Senior Advisorto the Etisalat Group board from 2011 to 2014. Sir Julian was a member of the founding management team ofVodafone Group Plc. He retired from Vodafone in July 2006, where he held a number of senior positions,including Deputy Chief Executive Officer and member of the board. He currently serves as a member of theboard of Digicel, a Caribbean and Pacific operator. Sir Julian is also Chairman of eBuilder, based in Sweden. Heis a Pro Chancellor at Bath University and chairs the University’s School of Management Advisory Board. He isthe Founder and Co-Chair of The TATLIDiL Conference (British and Turkish Conference). During his career ininternational telecommunications, Sir Julian has served as Chair of both the Mannesmann Supervisory andManagement boards, as well as a Director on a number of company boards, including Lloyds Banking Group plc,Smiths Group, China Mobile, eAccess in Japan, De la Rue plc, Verizon Wireless and SFR in France. Sir Julianearned a Bachelor of Science in economics from University of London in 1970 and a Master of Science fromUniversity of Bath in the United Kingdom in 1979.
Jørn P. Jensen has been a director of VEON Ltd. since August 2016. Mr. Jensen has been a Director ofDanske Bank A/S since March 2012 and has previously held senior roles, including Deputy Chief ExecutiveOfficer and Group Chief Financial Officer, at Carlsberg between 2000 and 2015. Mr. Jensen has served as aMember of the Committee on Corporate Governance in Denmark since 2012, and has previously served on anumber of corporate boards, including DONG Energy A/S (2010 to 2015), Brightpoint Inc., Lauritzen Fonden/Vesterhavet A/S, and Royal Scandinavia A/S. Mr. Jensen received a Bachelor of Science in Economics fromCopenhagen Business School in 1986, and a Master of Science in Economics and Business Administration fromCopenhagen Business School in 1988.
156
Nils Katla has been a director of VEON Ltd. since June 2015. Mr. Katla is a member of VEON Ltd.’snominating and corporate governance committee and compensation committee. Mr. Katla is a member of theBoard of Directors for Telenor Hungary. Mr. Katla joined the Telenor Group in 2001 and has been responsiblefor growing Telenor’s Nordic and European positions, resulting in a number of acquisitions. He is currentlyserving as the Senior Vice President of Mergers & Acquisitions for Telenor ASA. From 2004 to 2007, he was amember of the Management Board of Telenor Norway. He has served on a number of Boards of Directors forTelenor Group companies. Before joining Telenor, Mr. Katla served as the Executive Vice President of theConsumer Division at Enitel from 2000 to 2001. He also headed the consumer division of TeliaSonera as theSenior Vice President from 1997 to 1999. He has also worked for McKinsey & Company from 1995 to 1997 andArthur Andersen & Company (later Accenture) from 1990 to 1993. Mr. Katla holds a Master of Science degreein Computer Science and Telematics from the Norwegian Institute of Technology and an M.B.A. from INSEAD.
Management Board
Jean-Yves Charlier was appointed as Chief Executive Officer of VEON Ltd. by the VEON Ltd. supervisoryboard in April 2015. Prior to his appointment as Chief Executive Officer of VEON Ltd., he was the Chairmanand Chief Executive Officer of SFR in France from 2012 until 2014. While at SFR he completed the demerger ofSFR from Vivendi in a transaction with cable operator Numericable. From 2007 until 2012, Mr. Charlier was theChief Executive Officer for Promethean, an interactive learning company, and, from 2004 until 2007,Mr. Charlier was the Chief Executive Officer of Colt, an alternative carrier. He started his career with Wang inFrance and also held senior executive positions with Equant and BT Global Services. Mr. Charlier has been onthe board of several other listed companies including Activision Blizzard and Vivendi. He holds an M.B.A. fromthe Wharton Business School and a Bachelor of Arts in international business administration from the AmericanCollege in Paris, France.
Andrew Davies joined VEON Ltd. in November 2013 as Chief Financial Officer. From November 2010 toOctober 2013, Mr. Davies was the Chief Financial Officer at Verizon Wireless. Prior to his appointment atVerizon Wireless, Mr. Davies held a number of senior financial roles within Vodafone Group, most recently asChief Financial Officer of Vodafone India and Vodafone Turkey as well as positions in Vodafone UK andVodafone Japan, from 2003 until 2010. Prior to joining Vodafone in 2003, Mr. Davies was Chief FinancialOfficer of Singlepoint (4U) from 2001, which was acquired by Vodafone in 2003, and also held positions withHoneywell Inc. and General Electric after starting his career with KPMG in 1987. Mr. Davies serves as amember of the board of various subsidiaries of VEON Ltd. Mr. Davies earned a Bachelor of Science degree inmathematics from Imperial College in London in 1987, is an Associate of the Royal College of Science and is aFellow of the Institute of Chartered Accountants in England and Wales.
Scott Dresser was appointed as Group General Counsel, with effect from September 1, 2014. Mr. Dresserwas also appointed a member of the Group Executive Board and the Group Management Board. Mr. Dresser wasmost recently Vice President of Global Strategic Initiatives at BirdLife International, a global conservationorganization. Between 2006 and 2012, Mr. Dresser was with Virgin Media in the UK, including service asGeneral Counsel, where he led its legal department and acted as principal liaison with VEON Ltd.’s Board ofDirectors, as well as being a member of its Executive Management Team. He also previously held positions inthe United States at White Mountains RE Group (which is the operating company of White Mountains InsuranceGroup Ltd), in the role of Senior Vice President and Associate General Counsel from 2005-2006; as SeniorAdvisor for Legal and Financial Affairs for the International Global Conservation Fund (an internationalenvironmental conservation organization) from 2002-2005; and positions at Morgan, Lewis & Bockius LLP andat Lord Day & Lord, Barrett Smith. Mr. Dresser studied at the Vanderbilt University School of Law andUniversity of New Hampshire, and was admitted to the Bar, in New York and Connecticut, in 1993. Mr. Dresseris on the advisory boards of BirdLife International and the Caucasus Nature Fund.
157

Enrique Aznar has been our Chief Values and Culture Transformation Officer since July 2016, prior towhich he was our Group Chief Compliance Officer since August 2013, and he was appointed to the ManagementBoard in October 2014. Prior to joining our company, Mr. Aznar was Head of Corporate Governance &Compliance—Chief Integrity Officer at Millicom International Cellular S.A., based in Luxembourg from 2011until 2013; Chief Ethics & Compliance Officer at Nokia Siemens Networks, based in Helsinki from 2009 until2011; Deputy General Counsel & Chief Compliance Officer for Europe, Middle East, and Africa for TycoInternational from 2005 until 2009 and held different legal roles with Dell, Inc from 2000 to 2005, Freshfieldsfrom 1997 to 2000, Price Waterhouse from 1994 to 1997 and Arthur Andersen from 1989 to 1992. Enrique is aqualified lawyer in Spain, England and Wales. Mr. Aznar attended a Leadership Program at Stanford Universityin the United States in 2012. He earned a Business Management Program certificate (PDD Guildhall University(currently London Metropolitan University)) at IESE Business School in 2003, a Master of Arts in International& Comparative Business Law from London in 1993 and a Licenciatura en Derecho (Law Degree) from theUniversity of Barcelona in 1988.
Jeffrey Hedberg has been Group Chief People Officer since November 2016 and Chief Executive Officer ofPakistan Mobile Communications Limited in Pakistan since July 2014. Previously, Mr. Hedberg worked atBoston Consulting Group from March 2013, where he was a Senior Advisor in the firm’s South Africa office andits Munich-based Technology, Media and Telecommunications Practice area. Mr. Hedberg served as a PrivateEquity Advisor from 2013 until 2014 and the Chief Operating Officer of Altech from 2011 to 2012. Mr. Hedbergserved as CEO of Telekom South Africa from 2010 to 2011 and as CEO of Telkom’s Nigerian subsidiary, Multi-Links Nigeria in 2010. From 2006 to 2009, Mr. Hedberg was CEO of Cell C in South Africa. Mr. Hedberg wasappointed CEO and Chairman of Deutsche Telekom USA in 2002 and from 1999 to 2002, he was Executive VicePresident and Member of the Board of Management of Deutsche Telekom AG where he developed the strategyfor the International Division. Prior to that, Mr. Hedberg served as Executive Vice President of SwisscomInternational from 1997 to 1998 and as Deputy Director from 1996 to 1997. Mr. Hedberg currently serves as amember of the board of directors of various subsidiaries of VEON Ltd., including Business & CommunicationSystems (Pvt) Ltd., LinkDotNet Telecom Limited, LinkdotNET Pakistan (Pvt) Ltd. and Waseela MicrofinanceBank Limited. Mr. Hedberg received a Master’s degree in International Management from the University ofDenver in 1992 and a Bachelor of Business Administration Degree from Northeastern University in 1985.
Yogesh Malik has served as Group Chief Technology Officer of VEON Ltd. since March 2014. Mr. Malikserved as Chief Executive Officer of Uninor, an Indian mobile network operator majority owned by the TelenorGroup, from May 2013 through November 2013 and prior to that, served in a variety of senior positions atUninor from 2010, including COO covering the areas of Technology, Regulatory and Customer Care. Mr. Malikhas also served as Head of Technology & Sourcing at Telenor Group headquarters in Norway, CTO of“Kyivstar” JSC in Ukraine and CTO of Grameenphone in Bangladesh. Prior to joining the Telenor Group,Mr. Malik worked for TIW, Tata/AT&T and Ericsson in various senior positions in a variety of countries.Mr. Malik has acted as the official spokesperson for the VEON Group and helped implement innovativetechnology to overhaul the group’s IT systems. Mr. Malik received an Engineering Degree in Electronics fromMSU University, Baroda, India in 1993, and an Executive M.B.A. from IMD, Lausanne, Switzerland in 2008.
Alexander Matuschka has served as Group Chief Performance Officer since July 2015. Mr. Matuschkacame to VEON from Nokia Networks, where he was Chief Transformation Officer from 2014 to 2015 and,previously, Chief Restructuring Officer from 2011 until 2014. Prior to joining Nokia, Mr. Matuschka gainedextensive experience in in the automotive and machining industries with P&L responsibility in multiple areas,including restructuring, re-organization, procurement, logistics, supply chain management and leanmanufacturing/assembly, including serving as the Interim Chief Operations Officer for ATU GmbH from 2010until 2011 and Chief Executive Officer of EUROPART Holding GmbH from 2007 to 2009. Mr. Matuschka holdsa business degree (Diplom-Kaufmann) in International Business Economy from International Business SchoolLippstadt in Germany and West Virginia University, USA.
Christopher Schlaeffer has served as Chief Digital Officer since January 2016, with responsibility for thedevelopment of new digital services and telecommunications propositions and for leading the Group’s global
158
commercial functions. Mr. Schlaeffer joined VEON from his role as Founder and Chief Executive Officer of twotech startups in Berlin and London which he served from 2010 until 2015. Prior to that, Mr. Schlaeffer was withDeutsche Telekom for 12 years as the group’s Chief Product and Innovation Officer, Corporate DevelopmentOfficer (with responsibility for Technology, IT, Innovation, R&D, and Venture Capital), Chief Strategy Officerand Chief Marketing Officer of the mobile division for T-Mobile International. He also served as a Member ofthe Executive Operating Board and played a key role in Deutsche Telekom’s transformation. Mr. Schlaefferholds a Master’s degree from the Vienna University of Economics and is recognized as a “Young Global Leader”by the World Economic Forum.
Erik Aas has been Head of Bangladesh since December 2015. Mr. Aas previously served as the ChiefExecutive Officer of Pt AXIS Telekom from 2007 until 2014. From 1997 to 2007, Mr. Aas served in varioussenior executive roles for the Telenor Group, including as the Chief Executive Officer and Director of the Boardof Grameenphone. Mr. Aas is the Chairman and Managing Director of Lakeview Invest AS and LakeviewTrading AS since September 2014. Mr. Aas attended the International Directors Programme from INSEAD from2012 to 2013. Mr. Aas received an Executive M.B.A. from IMD, Switzerland in 2001 and graduated with aMaster of Science degree for Civil Engineering from the Norwegian University of Science and Technology in1991.
Peter Chernyshov has been Head of Ukraine since June 2014. From 2006 to 2014, Mr. Chernyshov heldvarious leadership roles in Carlsberg Ukraine and Slavutich Brewery (part of the Carlsberg Group). From 1999 to2006, Mr. Chernyshov occupied several positions in the companies of BBH (Baltic Beverage Holding, now partof the Carlsberg Group), working at different times in three countries: from 1999 to 2000 as the Businesscontroller for Russian operations in the BBH HQ Stockholm, Sweden; from 2001 to 2002, as the CFO of BBH inKiev, Ukraine; from 2003 to April 2006, as the CEO of Vena Breweries, Saint Petersburg and Chelyabinsk,Russia; and from August 2005 to April 2006, as Vice President, Finance at Baltika, Saint Petersburg, Russia.Mr. Chernyshov has served as member of the board of the American Chamber of Commerce (ACC) in Ukraine.Mr. Chernyshov received a Master’s degree in mathematics from Ural State University in 1990 and an M.B.A.from Kingston University Business School in 2001.
Jon Eddy has been Head of Emerging Markets since January 2016. Mr. Eddy has extensive experience inleadership positions in the telecommunications industry in emerging markets, especially in Asia. He joinedVEON from dtac, Thailand’s second largest mobile operator, where he was Chief Executive Officer from 2011until 2014. Jon has previously been Chief Executive Officer of Telenor Pakistan from 2008 to 2011, ChiefOperating Officer at Maxis Mobile in Malaysia from 2007 until 2008, and Chief Technology Officer at DigiTelecom in Malaysia from 2002 until 2007. Mr. Eddy currently serves as chairman of the board of directors ofvarious subsidiaries of VEON Ltd. He holds a Bachelor of Science degree in Electrical Engineering fromMontana State University.
Matthieu Galvani has been Chief Executive Officer of VEON’s operations in Algeria, under the Djezzybrand since January 2016. Mr. Galvani has a deep knowledge of Algeria, with significant experience in seniorexecutive roles in the industry and in the Middle East and North Africa. He was previously Chief CommercialOfficer for VEON’s emerging markets, which serves 95 million customers in Algeria, Bangladesh and Pakistan.His previous roles include Chief Marketing & Communication Officer of KenCell in Kenya from 2000 to 2004;Chief Commercial Officer of OTA from 2005 to 2009; Chief Commercial Officer of Tunisie Telecom from 2009to 2014, and Chief Commercial Officer of Zain in Saudi Arabia from 2014 to 2016. Mr. Galvani, a Frenchnational, holds a Master’s degree in Econometrics, and a post graduate degree in economics and energy from theUniversity of Paris X.
Mikhail Gerchuk has been Head of Eurasia since October 2015. He served as Group Chief Commercial andStrategy Officer from July 2012 until October 2015, Acting Head of the former CIS Business Unit from February2014 to January 2015, and Group Chief Commercial Officer from October 2011 to July 2012. Previously,Mr. Gerchuk served as Vice President and Chief Commercial Officer of MTS from December 2008 until October2011, having joined MTS in August 2007 as the Group Marketing Director. At MTS, he also served on the
159
boards of directors of Comstar, MGTS, MTS Ukraine and several other MTS subsidiaries. Prior to joining MTS,Mr. Gerchuk was Chief Commercial Officer at Vodafone Malta from 2006 to 2007. He held senior marketingpositions at Vodafone Group, UK between 2002 and 2006, including Head of Voice Propositions between 2004and 2006 and Senior Global Marketing Manager between 2002 and 2004. Mr. Gerchuk also worked as anAssociate at Booz Allen Hamilton in London from 1999 to 2002 and, before that, as Category MarketingManager at PepsiCo and Marketing Manager at Mars, Inc. Mr. Gerchuk has been recognized as a leadingcommercial director and a leading young figure in telecommunications. Mr. Gerchuk received an M.B.A. fromINSEAD in 1999 and an M.A. in Economic Geography and English from Moscow State University in 1994.
Aamir Hafeez Ibrahim has been the Chief Executive Officer of our operations in Pakistan since July 2016.Prior to his position as CEO, Mr. Ibrahim was Mobilink’s Deputy CEO and Chief Commercial Officer.Mr. Ibrahim has over two decades of international experience as a senior executive across multiple industries andcontinents. Prior to joining Mobilink, he was the Senior Vice President for Telenor Group, where he leddistribution initiatives across Asia. Mr. Ibrahim has also held senior leadership positions at Ford MotorCompany, Jaguar & Land Rover. Mr. Ibrahim has extensive experience specifically in strategic marketing, salesand distribution, analytics, product development, government and regulatory management, business planning,M&A, public relations and crisis management. Mr. Ibrahim is a Pakistani native, with an undergraduate degree inAccounting from the University of Texas and an MBA from IMD in Switzerland. In 2012, he received anAdvanced Management Program diploma from Harvard Business School. Mr. Ibrahim has lived and workedacross multiple cultures and countries including Thailand, Pakistan, the UK, the United Arab Emirates,Switzerland and the United States.
Kjell Morten Johnsen has been VEON’s Head of Major Markets and Chief Executive Officer of VEONRussia (PJSC VimpelCom), with responsibility for the Group’s business in Russia and the Italy Joint Venturesince August 2016. Mr. Johnsen joined VEON from Telenor, where he was head of Telenor Europe withprevious roles as CEO of Telenor Serbia, as well as Senior Vice President and Head of Telenor Russia, TelenorCentral & Eastern Europe. He was also a member of VEON Ltd.’s supervisory board from 2010 until 2015 andPJSC’s Board of Directors from 2007 to 2013. Prior to entering the telecommunications industry in 2000,Mr. Johnsen worked for Norsk Hydro in France and Ukraine, and Scandsea International in Norway and Russia.Mr. Johnsen, has an MBA from the Norwegian School of Economics and Business Administration, and hasattended the University of Oslo, Norwegian School of Management, and Nord University Business School.
Oleksandr Komarov has been Head of Kazakhstan since January 2016. Mr. Komarov served as the ChiefCommercial Officer at Beeline Kazakhstan from July 2013 until 2016. Previously, Mr. Komarov served as theChief Executive Officer of GroupM from 2007 to 2013, Acting Chief Executive Officer of MediaCom from 2009to 2010, the Chief Executive Officer of Video International Advertising Group Kiev from 2006 to 2007 and theChief Executive Officer of Adell Saatchi & Saatchi from 2004 to 2006. Mr. Komarov received an ExecutiveM.B.A. from the Stockholm School of Economics in 2006 as well as a Postgraduate Diploma in Marketing fromthe Chartered Institute of Marketing in 2001. Mr. Komarov received a degree in electronic devices engineeringfrom the National Technical University of Ukraine ‘Kyiv Polytechnic Institute’ in 1995.
B. Compensation
We paid our directors and senior managers an aggregate amount of approximately US$75 million forservices provided during 2016, including approximately US$37 million for short-term employee benefits andapproximately US$34 million for long-term employee benefits.
For more information regarding our director and senior management compensation, including a descriptionof applicable stock based and cash based plans, see Note 26 to our audited consolidated financial statementsincluded elsewhere in this Annual Report on Form 20-F.
160
Pursuant to our bye-laws, we indemnify and hold harmless our directors and senior managers from andagainst all actions, costs, charges, liabilities, losses, damages and expenses in connection with any act done,concurred in or omitted in the execution of our business, or their duty, or supposed duty, or in their respectiveoffices or trusts, to the extent authorized by law. We may also advance moneys to our directors and officers forcosts, charges and expenses incurred by any of them in defending any civil or criminal proceedings. Theforegoing indemnity will not apply (and any funds advanced will be required to be repaid) with respect to adirector or officer if any allegation of fraud or dishonesty is proved against such director or officer. We have alsoentered into separate indemnification agreements with our directors and senior managers pursuant to which wehave agreed to indemnify each of them within substantially the same scope as provided in the bye-laws.
We have obtained insurance on behalf of our senior managers and directors for liability arising out of theiractions in their capacity as a senior manager or director.
We do not have any pension, retirement or similar benefit plans available to our directors or seniormanagers.
C. Board Practices
VEON Ltd. is governed by our supervisory board currently consisting of nine directors. Our bye-lawsprovide that our supervisory board consists of at least seven and no more than thirteen directors, as determinedby the supervisory board and subject to approval by a majority of the shareholders voting in person or by proxyat a general meeting.
The supervisory board generally delegates management of our company to the management board whichsub-delegates management to the CEO, subject to certain material business decisions that are reserved to thesupervisory board. The management board consists of the CEO and other senior executives. The CEO hasexclusive authority to identify and recommend our senior executives to the supervisory board for the supervisoryboard’s approval.
We have not entered into any service contracts with any of our current directors providing for benefits upontermination of service.
The committees of our supervisory board consist of: an audit committee, a compensation committee, anominating and corporate governance committee and a finance and strategy committee.
Our bye-laws provide that each member of the audit committee is required to satisfy the requirements ofRule 10A-3 under the Exchange Act and the rules and regulations thereunder as in effect from time to time. Theaudit committee is primarily responsible for the appointment, compensation, retention and oversight of theauditors, establishing procedures for addressing complaints related to accounting or audit matters and engagingnecessary advisors. The audit committee also supervises activities related to the DPA, the SEC Judgment and theDutch Settlement Agreement. The current members of our audit committee, Jørn Jensen (chairman), GennadyGazin, Gunnar Holt, are expected to serve until our next annual general meeting.
Our compensation committee is responsible for approving the compensation of the directors, officers andemployees of VEON Ltd. and its subsidiaries, our employee benefit plans, any equity compensation plans ofVEON Ltd. and its subsidiaries, and any contract relating to a director, officer or shareholder of VEON Ltd. orany of our subsidiaries or their respective family members or affiliates. The current members of ourcompensation committee, Alexey Reznikovich (chairman), Andrei Gusev, Nils Katla, are expected to serve untilour next annual general meeting.
Our nominating and corporate governance committee is responsible for coordinating the selection processfor candidates to become directors and recommending such candidates to the supervisory board. The currentmembers of our nominating and corporate governance committee, Gennady Gazin (chairman), Andrei Gusev,Nils Katla, are expected to serve until our next annual general meeting.
161
Our finance and strategy committee is responsible for reviewing financial transactions, policies, strategiesand the capital structure of VEON Ltd. and its subsidiaries. The current members of our finance and strategycommittee, Andrei Gusev (chairman), Gennady Gazin, Gunnar Holt, are expected to serve until our next annualgeneral meeting.
Following notice of the investigations by the SEC, DOJ and OM, we established a special committee inMarch 2014 to oversee the internal investigation being conducted by VEON Ltd.’s external counsel and ourresponse to the inquiries by various authorities. The special committee was dissolved on August 3, 2016, when itwas determined by the supervisory board that the ongoing efforts of VEON Ltd. in relation to the DPA could beproperly reviewed by the audit committee. The members of our special committee, Gennady Gazin (chairman)and Sir Julian Horn-Smith, served until the special committee was dissolved on August 3, 2016. For detailsrelated to the agreements related to the investigations by the SEC, the DOJ and the OM, please also see “Item3—Key Information—D. Risk Factors—Risks Related to Our Business—We have incurred and are continuing toincur costs and related management oversight obligations in connection with our obligations under the DPA, theSEC Judgment and the Dutch Settlement Agreement, which may be significant,” “Item 3—Key Information—D.Risk Factors—Risks Related to Our Business—We could be subject to criminal prosecution or civil sanction ifwe breach the DPA with the DOJ, the SEC Judgment or the Dutch Settlement Agreement, and we may face otherpotentially negative consequences relating to the investigations by, and agreements with, the DOJ, SEC and OM,including additional investigations and litigation” and Note 25 to our audited consolidated financial statementsincluded elsewhere in this Annual Report on Form 20-F.
D. Employees
The following chart sets forth the number of our employees as of December 31, 2016, 2015 and 2014,respectively:
As of December 31,
2016 2015 2014
Russia . . . . . . . . . . . . . . . . . . . . . . . . . . . . . . . . . . . . . . . . . . . . . . . . . . . . . . . . . . . . . . . 23,622 29,255 27,935Pakistan . . . . . . . . . . . . . . . . . . . . . . . . . . . . . . . . . . . . . . . . . . . . . . . . . . . . . . . . . . . . . 4,589 6,361 8,959Algeria . . . . . . . . . . . . . . . . . . . . . . . . . . . . . . . . . . . . . . . . . . . . . . . . . . . . . . . . . . . . . . 2,815 3,669 3,732Bangladesh . . . . . . . . . . . . . . . . . . . . . . . . . . . . . . . . . . . . . . . . . . . . . . . . . . . . . . . . . . . 1,319 2,194 2,428Ukraine . . . . . . . . . . . . . . . . . . . . . . . . . . . . . . . . . . . . . . . . . . . . . . . . . . . . . . . . . . . . . . 2,484 2,945 4,116Uzbekistan . . . . . . . . . . . . . . . . . . . . . . . . . . . . . . . . . . . . . . . . . . . . . . . . . . . . . . . . . . . 1,234 1,241 1,388HQ . . . . . . . . . . . . . . . . . . . . . . . . . . . . . . . . . . . . . . . . . . . . . . . . . . . . . . . . . . . . . . . . . 709 345 149Others(1) . . . . . . . . . . . . . . . . . . . . . . . . . . . . . . . . . . . . . . . . . . . . . . . . . . . . . . . . . . . . . 5,222 6,311 6,500
Total(2) . . . . . . . . . . . . . . . . . . . . . . . . . . . . . . . . . . . . . . . . . . . . . . . . . . . . . . . . . . . . . . 41,994 52,321 55,207
(1) The total employee numbers for 2015 and 2014 have been restated in Others because Kazakhstan is no longer a separate reportablesegment and therefore it is included in Others for the years ended December 31, 2015 and 2014, which is consistent with its classificationin Others for the year ended December 31, 2016.
(2) The total employee numbers for 2016, 2015 and 2014 have been adjusted to remove employees in operations that have been sold andexclude (i) the employees in our historical WIND business as of December 31, 2015 and 2014 and (ii) the employees from the new ItalyJoint Venture as of December 31, 2016.
From time to time, we also employ external staff, who fulfill a position at the company for a temporaryperiod of less than twelve months. We do not consider these employees to constitute a significant percentage ofour employee totals and have not included them above.
162
The following chart sets forth the number of our employees as of December 31, 2016, according togeographic location and our estimates of main categories of activities:
As of December 31, 2016
Category of activity(1) Russia Pakistan Algeria Bangladesh Ukraine Uzbekistan
Executive and senior management . . . . . . . . . . . . . . 10 10 8 9 11 11Engineering, construction and information
technology . . . . . . . . . . . . . . . . . . . . . . . . . . . . . . 4,529 948 789 498 1,001 300Sales, marketing and other commercial
operations . . . . . . . . . . . . . . . . . . . . . . . . . . . . . . . 10,172 1,551 955 516 733 295Finance, administration and legal . . . . . . . . . . . . . . 979 205 166 61 283 62Customer service . . . . . . . . . . . . . . . . . . . . . . . . . . . 5,658 812 465 115 138 291Procurement and logistics . . . . . . . . . . . . . . . . . . . . 588 95 110 29 102 31Other support functions . . . . . . . . . . . . . . . . . . . . . . 1,686 968 322 91 216 244
Total . . . . . . . . . . . . . . . . . . . . . . . . . . . . . . . . . . . . 23,622 4,589 2,815 1,319 2,484 1,234
(1) A breakdown of employees by category of activity is not available for our HQ segment and Others category.
Our employees are represented by Unions or operate collective bargaining arrangements in Armenia,Algeria, Kyrgyzstan, Ukraine, as are the Italy Joint Venture’s employees. We consider relations with ouremployees to be generally good. In February 2016, BDCL experienced labor disruptions in connection with theimplementation of our announced performance transformation program. Such disruptions have not had asignificant impact on our operations. An application for the registration of a union within BDCL was rejected bythe government authorities. A consequent notification has been made by UNI Global Union to the Dutch NCPand a process is ongoing. Please see “Item 3—Key Information—D. Risk Factors—Risks Related to OurBusiness—We may be adversely impacted by work stoppages and other labor matters.”
E. Share Ownership
To our knowledge, as of March 15, 2016, other than Mikhail Fridman, none of our directors or seniormanagers beneficially owned more than 1.0% of any class of our capital stock. To our knowledge, Mr. Fridmanhas an indirect economic benefit in our shares held for the account of L1T VIP Holdings S.a r.l. (“L1T VIPHoldings”) and, thus, may be considered under the definition of “beneficial owner” for purposes of SEC Form20-F only, as a beneficial owner of the shares held for the account of L1T VIP Holdings. See the section of thisAnnual Report on Form 20-F entitled “Item 7—Major Shareholders and Related Party Transactions—A. MajorShareholders.”
To our knowledge, as of March 15, 2017, Jean-Yves Charlier owned 497,756 of the Company’s ADSs, JonEddy owned 620,000 of the Company’s ADSs and Erik Aas owned 100,000 of the Company’s ADSs.
To our knowledge, as of March 15, 2017, none of the other supervisory or management board members heldany Common Shares or ADSs. To our knowledge, as of March 15, 2017, none of our directors or seniormanagers held any options on the Company’s common shares.
For more information regarding share ownership, including a description of applicable stock based plansand options, see Note 26 to our audited consolidated financial statements included elsewhere in this AnnualReport on Form 20-F.
163
ITEM 7. Major Shareholders and Related Party Transactions
A. Major Shareholders
The following table sets forth information with respect to the beneficial ownership of VEON Ltd. as ofMarch 15, 2017 by each person who is known by us to beneficially own 5.0% or more of our issued andoutstanding shares. As of March 15, 2017, we had 1,756,731,135 issued and outstanding common shares andzero convertible preferred shares issued and outstanding. None of our shareholders has different voting rights.
ShareholderNumber of VEON Ltd.
Common SharesPercent of VEON Ltd. Issued
and Outstanding Shares
L1T VIP Holdings S.à r.l.(1) . . . . . . . . . . . . . . . . . . . . . . . 840,625,001 47.9%Telenor East Holding II AS(2) . . . . . . . . . . . . . . . . . . . . . 416,703,840 23.7%Stichting Administratiekantoor Mobile
Telecommunications Investor(3) . . . . . . . . . . . . . . . . . . 145,947,562 8.3%
(1) As reported on Schedule 13D, Amendment No. 19, filed on April 1, 2016, by L1T VIP Holdings S.à r.l. and LetterOne InvestmentHoldings S.A. with the SEC, L1T VIP Holdings S.à r.l. is the direct beneficial owner of 840,625,001 of VEON Ltd.’s common shares,representing approximately 47.9% of VEON Ltd.’s issued and outstanding shares. Each of L1T VIP Holdings S.à r.l. and LetterOneInvestment Holdings S.A may be deemed the beneficial owner of 840,625,001 of VEON Ltd.’s common shares, representingapproximately 47.9% of VEON Ltd.’s issued outstanding shares, held for the account of L1T VIP Holdings S.à r.l.
(2) As reported on Schedule 13D, Amendment No. 36, filed on September 27, 2016, by Telenor East Holdings II AS, Telenor MobileHolding AS and Telenor ASA (collectively, “Telenor”) with the SEC, Telenor is the direct beneficial owner of, and Telenor MobileHolding AS and Telenor ASA may be deemed to be the beneficial owners of 416,703,840 of VEON Ltd.’s common shares. The commonshares held by Telenor East represent approximately 23.7% of VEON Ltd.’s issued and outstanding shares.
(3) As reported on Schedule 13G, filed on April 1, 2016, by Stichting Administratiekantoor Mobile Telecommunications Investor(“Stichting”) with the SEC, Stichting is the direct beneficial owner of 145,947,562 of VEON Ltd.’s common shares. As the holder ofdepositary receipts issued by Stichting, L1T VIP Holdings S.à r.l. is entitled to the economic benefits (dividend payments, otherdistributions and sale proceeds) of such depositary receipts, and indirectly of the 145,947,562 common shares represented by thedepositary receipts. Stichting is a foundation incorporated under the laws of the Netherlands. The common shares held by Stichtingrepresent approximately 8.3% of VEON Ltd.’s issued and outstanding shares.
Please see the sections of this Annual Report on Form 20-F entitled “Item 3—Key Information—D. RiskFactors—Risks Related to Our Business—A disposition by one or both of our largest shareholders of theirrespective stakes in VEON Ltd. or a change in control of VEON Ltd. could harm our business” and “Item 3—Key Information—D. Risk Factors—Risks Related to Our Business—Litigation and disputes among our twolargest shareholders and us could materially affect our business.”
As reported on Schedule 13D, Amendment No. 12, filed on April 23, 2013 by Altimo Coöperatief U.A. withthe SEC, on April 16, 2013, Altimo Coöperatief U.A. paid to VEON Ltd. a conversion premium ofUS$1,392,644,220 (or US$10.835 per share), and Altimo Coöperatief U.A.’s 128,532,000 VEON Ltd.convertible preferred shares automatically converted into 128,532,000 VEON Ltd. common shares.
As reported on Schedule 13D, Amendment No. 14, filed on December 13, 2013 by Altimo Coöperatief U.A.with the SEC: Altimo Holdings & Investments Ltd. directly and indirectly owned 100% of the membershipinterests in Altimo Coöperatief U.A., Letterone Overseas Investments Limited directly owned a majority of theshares of Altimo Holdings & Investments Ltd., Letterone Holdings S.A. was the sole shareholder of LetteroneOverseas Investments Limited, Roniju Holdings Limited directly owned a majority of the shares of LetteroneHoldings S.A., Crown Finance Foundation was the sole shareholder of Roniju Holdings Limited and each suchentity, in such respective capacity, may have been deemed to be the beneficial owner of 986,572,563 VEON Ltd.common shares.
As reported on Schedule 13D, Amendment No. 15, filed on February 19, 2014 by Altimo Coöperatief U.A.with the SEC, Letterone Overseas Investments Limited completed an acquisition of all of the shares in AltimoHoldings & Investments Ltd. held by the other shareholders of Altimo Holdings & Investments Ltd.
164
As reported on Schedule 13D, Amendment No. 16, filed on December 18, 2014 by Altimo Coöperatief U.A.with the SEC, on December 16, 2014, Roniju Holdings Limited completed an internal reorganization, and as partof that reorganization, the shares in Letterone Holdings S.A. owned by Roniju Holdings Limited (whichconstituted a controlling interest in Letterone Overseas Investments Limited and the indirect ownership of the986,572,563 VEON Ltd. common shares) were transferred to three separate entities.
As reported on Schedule 13D, Amendment No. 17, filed on November 6, 2015 by Letterone InvestmentHoldings S.à r.l. with the SEC, Letterone Holdings S.A. and its affiliates engaged in an internal reorganization,and as part of that reorganization, 986,572,563 VEON Ltd. common shares were transferred by AltimoCoöperatief U.A. to L1T VIP Holdings on October 30, 2015.
As reported on Schedule 13D, Amendment No. 18, filed on November 12, 2015 by L1T VIP Holdings withthe SEC, Letterone Holdings S.A. and its affiliates engaged in an internal reorganization, and as part of thatreorganization, on November 11, 2015, all of the shares in Letterone Investment Holdings S.A. owned byLetterone Holdings S.A. (which constituted a controlling interest in L1T VIP Holdings and the indirectownership of the 986,572,563 VEON Ltd. common shares) were transferred to six separate entities.
As reported on Schedule 13D, Amendment No. 19, filed on April 1, 2016 by L1T VIP Holdings S.à r.l. andLetterone Investment Holdings S.A. with the SEC, L1T VIP Holdings S.à r.l. transferred 145,947,562 of ADSs,representing rights with respect to 145,947,562 of VEON Ltd.’s common stock, to Stichting.
As reported on Schedule 13D, Amendment 34, filed on September 21, 2016 by Telenor East Holding II AS,Telenor Mobile Holding AS and Telenor ASA with the SEC, Telenor East Holding II AS sold 142,500,000 ofADSs in VEON Ltd. pursuant to an underwritten offering.
As reported on Schedule 13D, Amendment 36, filed on September 27, 2016 by Telenor East Holding II AS,Telenor Mobile Holding AS and Telenor ASA with the SEC, Telenor East Holding II AS sold 21,375,000 ofADSs in VEON Ltd. pursuant to an underwritten offering.
Based on a review of our register of members maintained in Bermuda, as of March 15, 2017 100% of ourissued common shares were held of record by BNY (Nominees) Limited in the United Kingdom, as agent of TheBank of New York Mellon, for the purposes of our ADS program. As of March 15, 2017, 23 record holders ofVEON Ltd.’s ADRs, holding an aggregate of 353,454,732 common shares (20.12%), were listed as havingaddresses in the United States.
B. Related Party Transactions
In addition to the transactions described below, VEON Ltd. has also entered into transactions with relatedparties as part of the ordinary course of business. These mainly relate to ordinary course telecommunicationsoperations, such as interconnection, roaming, retail and management advisory services. Their terms varyaccording to the nature of the services provided thereunder. VEON Ltd. and certain of its subsidiaries may, fromtime to time, also enter into general services agreements relating to the conduct of business and financingtransactions within the VEON Group.
For more information on our related party transactions, see Note 26 to our audited consolidated financialstatements included elsewhere in this Annual Report on Form 20-F.
Related Party Transactions with Major Shareholders and their Affiliates
Related Party Transactions with Telenor East and its Affiliates
Offering of ADSs and Exchangeable Bond
In September 2016, Telenor East sold 163,875,000 of VEON Ltd.’s ADSs pursuant to an underwrittenoffering and further, announced its intention to divest the remainder of its stake in VEON Ltd. In addition,
165
in a transaction outside the United States to non-US persons pursuant to Regulation S under the Securities Act,Telenor East issued a US$1,000,000,000 0.25% bond due 2019 that is exchangeable under certain conditions forup to a total at issuance of 204,081,633 of VEON Ltd.’s ADSs (subject to adjustment) at an exchange pricerepresenting a premium of 40% to the public offering price of the ADSs at the issue date. See “Item 5—Operating and Financial Review and Prospects—Key Developments and Trends—Telenor Share Sale andExchangeable Bond Issuance.”
Redemption of Telenor East Convertible Preferred Shares
As at April 1, 2016, pursuant to the terms of our bye-laws, the 305,000,000 preferred shares previously heldby Telenor were compulsorily redeemed by VEON Ltd. at a redemption price of US$0.001 per share and are nolonger outstanding.
Service Agreements
VEON Ltd. is a party to a service agreement with Telenor East, dated as of March 8, 2011, under whichTelenor East renders to VEON Ltd. or its affiliates services related to telecommunication operations, includingmanagement advisory services, training, technical assistance and network maintenance, industry informationresearch and consulting, implementation support for special projects and other services as mutually agreed byTelenor East and VEON Ltd. VEON Ltd. pays Telenor East US$1.5 million annually for the services.
A number of our operating companies have roaming agreements with the following mobile operators thatare Telenor East affiliates: Grameenphone Limited (Bangladesh), Telenor Norge AS (Denmark), TelenorMagyarorszag Zrt. (Hungary), DiGi Telecommunications Sdn. Bhd. (Malaysia), Telenor (Montenegro), TelenorPakistan (Pvt) Ltd. (Pakistan), Telekom d.o.o. (Serbia), Telenor Sverige AB (Sweden) and Total AccessCommunication Public Company Limited (dtac) (Thailand).
Related Party Transactions with LetterOne and its Affiliates
Service Agreements
VEON Ltd. is a party to a General Services Agreement with L1HS Corporate Advisor Limited, datedDecember 1, 2010, under which L1HS Corporate Advisor Limited renders to VEON Ltd. and its affiliatesservices related to telecommunication operations, including management advisory services, training, technicalassistance and network maintenance, industry information research and consulting, implementation support forspecial projects and other services as mutually agreed by L1HS Corporate Advisor Limited and VEON Ltd.VEON Ltd. pays L1HS Corporate Advisor Limited annually US$1.5 million for the services. VEON is also partyto a Consultancy Deed with L1HS Corporate Advisor Limited, dated August 21, 2013, under which L1HSCorporate Advisor Limited provides additional consultancy services to VEON Ltd. for which VEON Ltd. paysannually US$3.5 million. The General Services Agreement and Consultancy Deed were originally entered intoby VEON Ltd. and Altimo Management Services Ltd., but the latter was replaced first by LetterOne CorporateAdvisor Limited pursuant to a Deed of Assignment and Novation dated June 3, 2014, and later by LIHSCorporate Advisor Limited pursuant to a Deed of Novation and Amendment dated January 14, 2016.
Related Party Transactions with Alfa Group and its Affiliates
Credit Facilities
Please see the section of this Annual Report on Form 20-F entitled “Item 5—Operating and FinancialReview and Prospects—Liquidity and Capital Resources—Financing Activities” for information regarding twocredit facilities between VimpelCom Amsterdam and Alfa-Bank.
166
Other Transactions
In the ordinary course of business, we maintain some of our bank accounts, and place time deposits with,Alfa-Bank, which is part of the Alfa Group and also a corporate client of PJSC VimpelCom. We also haveagreements in place with Alfa Strakhovaniye JSC, which is also part of the Alfa Group, for the provision ofinsurance coverage.
VEON Ltd. Registration Rights Agreements
The Registration Rights Agreement, as amended, between VEON Ltd., Telenor East and certain of itsaffiliates, Altimo Holdings & Investments Ltd. and Altimo Coöperatief U.A. requires us to use our best efforts toeffect a registration under the Securities Act, if requested by one of the shareholders party to the RegistrationRights Agreement, of our securities held by such party in order to facilitate the sale and distribution of suchsecurities. Pursuant to the Registration Rights Agreement, we have filed a registration statement on Form F-3with the SEC using a “shelf” registration process. Under this shelf registration process, a selling shareholder mayfrom time to time sell VEON Ltd. common shares, which may be represented by ADSs, in one or more offerings,upon the filing of one or more prospectus supplements or post effective amendments. As of the date of thisreport, we do not qualify as a well-known seasoned issuer (as such term is defined in Rule 405 under theSecurities Act) and, as a result, we and any selling shareholders are currently unable to use automatic shelfregistration for the resale of such securities.
In connection with a private offering by the Telenor East of US$1,000,000,000 in aggregate principalamount of 0.25 per cent bonds due 2019 (the “Bonds”) that are exchangeable under certain conditions for up to atotal at issuance of 204,081,633 of VEON Ltd.’s ADSs (subject to adjustment) to non-US persons pursuant toRegulation S under the Securities Act, VEON Ltd. entered into a registration rights agreement, datedSeptember 21, 2016 (the “New Registration Rights Agreement”) for the benefit of holders of the Bonds. Pursuantto the New Registration Rights Agreement, we filed a registration statement on Form F-3 with the SEC onSeptember 30, 2016 using a “shelf” registration process, which Form F-3 was declared effective on October 13,2016. The New Registration Rights Agreement requires us to use our commercially reasonable efforts to keep theshelf registration statement continuously effective under the Securities Act in order to permit the prospectusforming a part thereof to be usable by holders (subject to permitted suspension periods) for a period until theearliest of such time as all of the ADSs issuable or issued in exchange for or upon redemption of the Bonds have(i) been registered under the New Shelf Registration Statement and disposed of in accordance therewith,(ii) become eligible to be transferred without condition as contemplated by Rule 144 under the Securities Act, orany successor rule or regulation thereto that may be adopted by the SEC, or otherwise, no longer bear anyrestrictive legend and have become fungible with the VEON Ltd. ADSs issued under any VEON Ltd. ADSprogram or (iii) ceased to be outstanding.
Under these shelf registration processes, a selling shareholder may from time to time sell VEON Ltd.common shares, which may be represented by ADSs, in one or more offerings, upon the filing of one or moreprospectus supplements or post effective amendments. As of the date of this report, we do not qualify as a well-known seasoned issuer (as such term is defined in Rule 405 under the Securities Act) and, as a result, we and anyselling shareholders are currently unable to use automatic shelf registration for the resale of such securities.
Related Party Transactions with Joint Ventures and Associates
Euroset
PJSC VimpelCom has commercial contracts with Euroset, which became an associate in October 2008. In2016, PJSC VimpelCom recognized US$4.1 million of revenue from Euroset primarily for mobile and fixed-lineservices and from the sale of equipment and accessories. PJSC VimpelCom accrued to Euroset certain expensestotaling US$18.7 million in 2016, primarily dealer commissions and bonuses for services for acquisition of newcustomers, customer care and receipt of customers’ payments.
167
We are evaluating our options in relation to Euroset, and we are in discussions with our joint venturepartner, MegaFon, in this regard. There can be no assurance that any transaction will occur.
WIND
Following the classification of our operations in Italy as an asset held for sale and a discontinued operationfrom January 1, 2016 to November 5, 2016, the intercompany positions were disclosed as related partytransactions and balances. Consequently, the outstanding balances and transactions occurred were treated asrelated party transactions during that period, mainly representing regular business activities, i.e., roaming andinterconnect.
For a discussion of the contribution and framework agreement entered into to form the Italy Joint Ventureand the Shareholders’ Deed and FinCo Shareholders’ Deed setting out the terms through which the Italy JointVenture and its subsidiaries are owned, controlled, managed and financed, please see “Item 10—AdditionalInformation —Material Contacts.”
Related Party Transactions with supervisory board and management board members
Compensation paid to the supervisory board and management board members is disclosed in “Item 6—Directors, Senior Management and Employees—B. Compensation.” During 2016 and through the date of thisAnnual Report, none of our supervisory board and management board members have been involved in anyrelated party transactions with us.
ITEM 8. Financial Information
A. Consolidated Statements and Other Financial Information
See “Item 18—Financial Statements” and the financial statements referred to therein.
A.7. Legal Proceedings
For a discussion of legal or arbitration proceedings which may have, or have had in the recent past,significant effects on our financial position or profitability, see Notes 25 (Provisions) and 27 (Risks,commitments, contingencies and uncertainties) to our audited consolidated financial statements includedelsewhere in this Annual Report on Form 20-F. We cannot predict the outcome of the various claims and legalactions in which we are involved beyond the information included in our financial statements, including anyfines or penalties that may be imposed, and such fines or penalties could be significant.
For information about certain risks related to current and potential legal proceedings, see “Item 3—KeyInformation—D. Risk Factors—Legal and Regulatory Risks.” Please also see “Item 3—Key Information—D.Risk Factors—Risks Related to Our Business—We have incurred and are continuing to incur costs and relatedmanagement oversight obligations in connection with our obligations under the DPA, the SEC Judgment and theDutch Settlement Agreement, which may be significant” and “Item 3—Key Information—D. Risk Factors—Risks Related to Our Business—We could be subject to criminal prosecution or civil sanction if we breach theDPA with the DOJ, the SEC Judgment or Dutch Settlement Agreement, and we may face other potentiallynegative consequences relating to the investigations by, and agreements with, the DOJ, SEC and OM, includingadditional investigations and litigation.”
A.8. Policy on Dividend Distributions
In February 2017, our supervisory board approved a dividend policy pursuant to which for the financial yearending December 31, 2016, we intend to pay a dividend in the aggregate amount of US$23 cents per share,comprised of US$3.5 cents per share paid as an interim dividend in December 2016 and US$19.5 cents per share,with a record date of March 30, 2017 and which is intended to be paid on April 12, 2017. The record date for ourshareholders entitled to receive the final dividend payment has been set for March 30, 2017. We will makeappropriate tax withholdings of up to 15% when the dividend is paid to our share depositary, The Bank of NewYork Mellon. Thereafter, we are committed to paying a sustainable and progressive dividend based on theevolution of the our equity free cash flow. Equity free cash flow shall be defined as net cash flow from operatingactivities less net cash used in investing activities, as reported in our consolidated financial statements.
168
The precise amount and timing of dividends for a particular year is subject to the approval of oursupervisory board and compliance with the Companies Act and other applicable law.
Pursuant to Bermuda law, we are prohibited from declaring or paying a dividend if there are reasonablegrounds for believing that (a) we are, or would after the payment be, unable to pay our liabilities as they becomedue, or (b) the realizable value of our assets would, as a result of the dividend, be less than our liabilities. Thesupervisory board may, subject to our bye-laws and in accordance with the Companies Act, declare a dividend tobe paid to the shareholders holding shares entitled to receive dividends, in proportion to the number of sharesheld by them, and such dividend may be paid in cash or wholly or partly in shares or other assets, includingthrough the issuance of our shares or other securities, in which case the supervisory board may fix the value fordistribution in specie of any assets, shares or securities. We are not required to pay interest on any unpaiddividend. In accordance with our bye-laws, dividends may be declared and paid in proportion to the amount paidup on each share. The holders of common shares are entitled to dividends if the payment of dividends isapproved by the supervisory board. Convertible preferred shares, when and if issued, have no entitlement todividends.
We cannot assure you we will continue to pay dividends on our common shares and ADSs in the future andany decision by VEON Ltd. not to pay dividends or to reduce dividend payments in the future could adverselyaffect the value of our common shares or ADSs. For more information regarding certain risks involved inconnection with the recommendation and payment of dividends, please see “Item 10—Additional Information—B. Memorandum and Articles of Association—Dividends and Dividend Rights,” “Item 3—Key Information—D.Risk Factors—Risks Related to Our Business—As a holding company, VEON Ltd. depends on the ability of itssubsidiaries to pay dividends and therefore on the performance of its subsidiaries, and is affected by changes inexchange controls and currency restrictions in the countries in which its subsidiaries operate” and “Item 3—KeyInformation—D. Risk Factors—Risks Related to the Ownership of Our ADSs—Various factors may hinder thedeclaration and payment of dividends.”
B. Significant Changes
Other than as disclosed in this Annual Report on Form 20-F, there have not been any significant changessince the date of the audited consolidated financial statements included as part of this Annual Report on Form20-F.
169
ITEM 9. The Offer and Listing
A. Offer and Listing Details
A.4. Price History
The following table sets out, for the periods indicated, the reported high and low market quotations for ourADSs on the New York Stock Exchange for periods prior to September 10, 2013, when we switched the listingof our ADSs to the NASDAQ Global Select Market. Subsequent periods are based on NASDAQ Global SelectMarket quotations. Each of our ADSs represents one of our common shares.
High Low
MonthlySeptember 2016 . . . . . . . . . . . . . . . . . . . . . . . . . . . . . . . . . . . . . . . . . . . . . . . . . . . . . US$ 3.25 US$ 3.33October 2016 . . . . . . . . . . . . . . . . . . . . . . . . . . . . . . . . . . . . . . . . . . . . . . . . . . . . . . . US$ 3.51 US$ 3.14November 2016 . . . . . . . . . . . . . . . . . . . . . . . . . . . . . . . . . . . . . . . . . . . . . . . . . . . . . US$ 3.47 US$ 3.23December 2016 . . . . . . . . . . . . . . . . . . . . . . . . . . . . . . . . . . . . . . . . . . . . . . . . . . . . . US$ 3.98 US$ 3.39January 2017 . . . . . . . . . . . . . . . . . . . . . . . . . . . . . . . . . . . . . . . . . . . . . . . . . . . . . . . US$ 4.28 US$ 3.93February 2017 . . . . . . . . . . . . . . . . . . . . . . . . . . . . . . . . . . . . . . . . . . . . . . . . . . . . . . US$ 4.39 US$ 3.98
QuarterlyFirst Quarter 2015 . . . . . . . . . . . . . . . . . . . . . . . . . . . . . . . . . . . . . . . . . . . . . . . . . . . US$ 5.61 US$ 3.43Second Quarter 2015 . . . . . . . . . . . . . . . . . . . . . . . . . . . . . . . . . . . . . . . . . . . . . . . . . US$ 6.37 US$ 4.95Third Quarter 2015 . . . . . . . . . . . . . . . . . . . . . . . . . . . . . . . . . . . . . . . . . . . . . . . . . . US$ 5.97 US$ 4.09Fourth Quarter 2015 . . . . . . . . . . . . . . . . . . . . . . . . . . . . . . . . . . . . . . . . . . . . . . . . . US$ 4.30 US$ 3.01First Quarter 2016 . . . . . . . . . . . . . . . . . . . . . . . . . . . . . . . . . . . . . . . . . . . . . . . . . . . US$ 4.26 US$ 2.90Second Quarter 2016 . . . . . . . . . . . . . . . . . . . . . . . . . . . . . . . . . . . . . . . . . . . . . . . . . US$ 4.22 US$ 3.35Third Quarter 2016 . . . . . . . . . . . . . . . . . . . . . . . . . . . . . . . . . . . . . . . . . . . . . . . . . . US$ 4.48 US$ 3.33Fourth Quarter 2016 . . . . . . . . . . . . . . . . . . . . . . . . . . . . . . . . . . . . . . . . . . . . . . . . . US$ 3.98 US$ 3.14
Annually2012 . . . . . . . . . . . . . . . . . . . . . . . . . . . . . . . . . . . . . . . . . . . . . . . . . . . . . . . . . . . . . . US$ 12.50 US$ 7.232013 . . . . . . . . . . . . . . . . . . . . . . . . . . . . . . . . . . . . . . . . . . . . . . . . . . . . . . . . . . . . . . US$ 14.55 US$ 9.652014 . . . . . . . . . . . . . . . . . . . . . . . . . . . . . . . . . . . . . . . . . . . . . . . . . . . . . . . . . . . . . . US$ 12.80 US$ 3.292015 . . . . . . . . . . . . . . . . . . . . . . . . . . . . . . . . . . . . . . . . . . . . . . . . . . . . . . . . . . . . . . US$ 6.37 US$ 3.012016 . . . . . . . . . . . . . . . . . . . . . . . . . . . . . . . . . . . . . . . . . . . . . . . . . . . . . . . . . . . . . . US$ 4.48 US$ 2.90
B. Plan of Distribution
Not required.
C. Markets
Our ADSs are listed and traded on NASDAQ Global Select Market under the symbol “VEON.” NASDAQGlobal Select Market is the principal trading market for the ADSs.
D. Selling Shareholders
Not required.
E. Dilution
Not required.
F. Expenses of the Issue
Not required.
170
ITEM 10. Additional Information
A. Share Capital
Not required.
B. Memorandum and Articles of Association
We describe below the material provisions of our memorandum of association and bye-laws, certainprovisions of Bermuda law relating to our organization and operation, and some of the terms of our share rightsbased on provisions of our memorandum of association, our current bye-laws, applicable Bermuda law andcertain agreements relating to our shares. Although we believe that we have summarized the material terms ofour memorandum of association and bye-laws, Bermuda legal requirements and our share capital, this summaryis not complete and is qualified in its entirety by reference to our memorandum of association, our bye-laws andapplicable Bermuda law. All references to our bye-laws herein, unless otherwise noted, are to Section B of ourbye-laws, which were originally approved on April 20, 2010 by our shareholders and which were amended andagain approved by our shareholders on September 25, 2013, and on March 30, 2017.
The affirmative vote of at least 75.0% of the shares voted at a shareholders meeting is required to approveamendments to our bye-laws.
General
VEON Ltd. is an exempted company limited by shares registered under the Companies Act on June 5, 2009,and our registered office is located at Victoria Place, 31 Victoria Street, Hamilton HM 10, Bermuda. Ourregistration number with the Registrar of Companies in Bermuda is 43271. As set forth in paragraph 6 of ourmemorandum of association, VEON Ltd. was formed with unrestricted business objects. We are registered withthe Dutch Trade Register (registration number 34374835) as a company formally registered abroad (formeelbuitenlandse kapitaalvennootschap), as this term is referred to in the Dutch Companies Formally RegisteredAbroad Act (Wet op de formeel buitenlandse vennootschappen), which means that we are deemed a Dutchresident company for tax purposes in accordance with applicable Dutch tax regulations.
Our bye-laws are split into two distinct sub-sets: Section A and Section B. Section A of our bye-laws werein effect until the October 4, 2009 shareholders agreement among VEON Ltd., Altimo Coöperatief U.A. andTelenor East Holding II AS in relation to VEON Ltd. (the “VEON Shareholders Agreement”) terminated onDecember 10, 2011. Termination of the VEON Shareholders Agreement caused Section B of our bye-laws toautomatically come into force to the exclusion of Section A of our bye-laws. References to our bye-laws in thefollowing sections of this Item 10 are to Section B of our bye-laws.
Issued Share Capital
As at December 31, 2016, the authorized share capital was divided into 2,759,171,830 common shares, parvalue US$0.001, and 305,000,000 convertible preferred shares, par value US$0.001, of which 1,756,731,135common shares were issued and outstanding and zero convertible preferred shares were issued and outstanding.All issued and outstanding shares are fully paid.
Subject to our bye-laws and to any shareholders’ resolution to the contrary, and without prejudice to anyspecial rights previously conferred on the holders of any existing shares or class of shares, our supervisory boardhas the power to issue any authorized but unissued shares on such terms and conditions as it may determine.
We may increase, divide, consolidate, change the currency or denomination of or reduce our share capitalwith the approval of our shareholders.
171
We may purchase our own shares for cancellation or acquire them as treasury shares in accordance withBermuda law on such terms as the supervisory board may determine.
We may, under our bye-laws, at any time request any person we have cause to believe is interested in ourshares to confirm details of our shares in which that person holds an interest.
Common Shares
The holders of common shares are, subject to our bye-laws and Bermuda law, generally entitled to enjoy allthe rights attaching to common shares.
Except for treasury shares, each fully paid common share entitles its holder to:
• participate in shareholder meetings;
• have one vote on all issues voted upon at a shareholder meeting, except for the purposes of cumulativevoting for the election of the supervisory board, in which case each common share shall have the samenumber of votes as the total number of members to be elected to the supervisory board and all suchvotes may be cast for a single candidate or may be distributed between or among two or morecandidates;
• receive dividends approved by the supervisory board (any dividend or other moneys payable in respectof a share which has remained unclaimed for seven years from the date when it became due forpayment shall, if the supervisory board so resolves, be forfeited and cease to remain owing by VEONLtd.);
• in the event of our liquidation, receive a pro rata share of our surplus assets; and
• exercise any other rights of a common shareholder set forth in our bye-laws and Bermuda law.
Convertible Preferred Shares
Except for treasury shares, each fully paid convertible preferred share, when and if issued, entitles its holderto:
• participate in shareholder meetings;
• have one vote on all issues voted upon at a shareholder meeting, except for the purposes of cumulativevoting for the election of the supervisory board, in which case each preferred share shall have the samenumber of votes as the total number of members to be elected to the board of directors and all suchvotes may be cast for a single candidate or may be distributed between or among two or morecandidates;
• exercise any other rights of a preferred shareholder set forth in our bye-laws and Bermuda law.
As of the date of this Annual Report on Form 20-F, we have zero convertible preferred shares issued andoutstanding. There are no sinking fund provisions attached to any of our shares. Holders of fully paid shares haveno further liability to VEON Ltd. for capital calls.
All rights of any share of any class held in treasury are suspended and may not be exercised while the shareis held by VEON Ltd. in treasury.
Shareholders’ Meetings
Shareholders’ meetings are convened and held in accordance with our bye-laws and Bermuda law.Registered holders of shares as of the record date for the shareholder meeting may attend and vote.
172
Annual General Meeting
Our bye-laws and Bermuda law provide that our annual general meeting must be held each year at such timeand place as the CEO or the supervisory board may determine.
Convening the annual general meeting requires that 30 clear days’ prior notice be given to each shareholderentitled to attend and vote at such annual general meeting. The notice must state the date, place and time at whichthe meeting is to be held, that the election of directors will take place and, as far as practicable, any otherbusiness to be conducted at the meeting.
Under Bermuda law, shareholders may, at their own expense (unless the company otherwise resolves),require a company to: (a) give notice to all shareholders entitled to receive notice of the annual general meetingof any resolution that the shareholders may properly move at the next annual general meeting; and (b) circulate toall shareholders entitled to receive notice of any general meeting a statement in respect of any matter referred toin the proposed resolution or any business to be conducted at such general meeting. The number of shareholdersnecessary for such a requisition is either: (1) any number of shareholders representing not less than 5.0% of thetotal voting rights of all shareholders entitled to vote at the meeting to which the requisition relates; or (2) notless than 100 registered shareholders.
Special General Meeting
The CEO or the supervisory board may convene a special general meeting whenever in their judgment sucha meeting is necessary. The supervisory board must, on the requisition in writing of shareholders holding not lessthan 10.0% of our paid up voting share capital, convene a special general meeting. Each special general meetingmay be held at such time and place as the CEO or the supervisory board may appoint.
Convening a special general meeting requires that 30 clear days’ notice be given to each shareholder entitledto attend and vote at such meeting. The notice must state the date, place and time at which the meeting is to beheld and as far as possible any other business to be conducted at the meeting.
Our bye-laws state that notice for all shareholders’ meetings may be given by:
• delivering such notice to the shareholder in person;
• sending such notice by letter or courier to the shareholder’s address as stated in the register ofshareholders;
• transmitting such notice by electronic means in accordance with directions given by the shareholder; or
• accessing such notice on our website.
Shorter Notice for General Meetings
A shorter notice period will not invalidate a general meeting if it is approved by either: (a) in the case of anannual general meeting, all shareholders entitled to attend and vote at the meeting, or (b) in the case of a specialgeneral meeting, a majority of shareholders having the right to attend and vote at the meeting and togetherholding not less than 95.0% in nominal value of the shares giving a right to attend and vote at the meeting. Theaccidental omission to give notice of a general meeting to, or the non-receipt of notice of a general meeting by,any shareholder entitled to receive notice shall not invalidate the proceedings at that meeting.
Postponement or Cancellation of General Meeting
The supervisory board may postpone or cancel any general meeting called in accordance with the bye-laws(other than a meeting requisitioned by shareholders) provided that notice of postponement or cancellation isgiven to each shareholder before the time for such meeting.
173
Quorum
Subject to the Companies Act and our bye-laws, at any general meeting, two or more persons present inperson at the start of the meeting and having the right to attend and vote at the meeting and holding orrepresenting in person or by proxy at least 50.0% plus one share of our total issued and outstanding shares at therelevant time will form a quorum for the transaction of business.
If within half an hour from the time appointed for the meeting a quorum is not present, then, in the case of ameeting convened on a requisition, the meeting shall be deemed canceled and, in any other case, the meetingshall stand adjourned to the same day one week later, at the same time and place, or to such other day, time orplace as the CEO may determine.
Voting Rights
Under Bermuda law, the voting rights of our shareholders are regulated by our bye-laws and, in certaincircumstances, the Companies Act.
Subject to Bermuda law and our bye-laws, a resolution may only be put to a vote at a general meeting of anyclass of shareholders if:
• it is proposed by or at the direction of the supervisory board;
• it is proposed at the direction of a court;
• it is proposed on the requisition in writing of such number of shareholders as is prescribed by, and ismade in accordance with, the relevant provisions of the Companies Act or our bye-laws; or
• the chairman of the meeting in his absolute discretion decides that the resolution may properly beregarded as within the scope of the meeting.
In addition to those matters required by Bermuda law or by the NASDAQ rules to be approved by a simplemajority of shareholders at any general meeting, the following actions require the approval of a simple majorityof the votes cast at any general meeting:
• any sale of all or substantially all of our assets;
• the appointment of an auditor; and
• removal of directors.
Any question proposed for the consideration of the shareholders at any general meeting may be decided bythe affirmative votes of a simple majority of the votes cast, except for:
• whitewash procedure for mandatory offers, which requires the affirmative vote of a majority of theshareholders voting in person or by proxy at a general meeting, excluding the vote of the shareholder orshareholders in question and their affiliates;
• voting for directors, which requires directors to be elected by cumulative voting at each annual generalmeeting;
• changes to our bye-laws, which require a resolution to be passed by shareholders representing not lessthan 75.0% of the total voting rights of the shareholders who vote in person or by proxy on theresolution;
• any merger, consolidation, amalgamation, conversion, reorganization, scheme of arrangement,dissolution or liquidation, which requires a resolution to be passed by shareholders representing notless than 75.0% of the total voting rights of the shareholders who vote in person or by proxy on theresolution;
174
• loans to any director, which require a resolution to be passed by shareholders representing not less than90.0% of the total voting rights of the shareholders who vote in person or by proxy on the resolution;and
• the discontinuation of VEON Ltd. to a jurisdiction outside Bermuda, which requires a resolution to bepassed by shareholders representing not less than 75.0% of the total voting rights of the shareholderswho vote in person or by proxy on the resolution.
Our bye-laws require voting on any resolution at any meeting of the shareholders to be conducted by way ofa poll vote. Except where cumulative voting is required, each person present and entitled to vote at a meeting ofthe shareholders shall have one vote for each share of which such person is the holder or for which such personholds a proxy and such vote shall be counted by ballot or, in the case of a general meeting at which one or moreshareholders are present by electronic means, in such manner as the chairman of the meeting may direct. Aperson entitled to more than one vote need not use all his votes or cast all the votes he uses in the same way.
Voting Rights of Common Shares
The holders of common shares, subject to the provisions of our bye-laws, are entitled to one vote percommon share, except where cumulative voting applies when electing directors.
Voting Rights of Convertible Preferred Shares
The provisions of our bye-laws entitle the holders of convertible preferred shares (if and when issued) to onevote per convertible preferred share, voting together with the common shares as a single class, except wherecumulative voting applies when electing directors.
Transfer Restrictions
For such time as all of our shares are fully paid and listed on NASDAQ (or another appointed exchange, asdetermined from time to time by the Bermuda Monetary Authority), there are no Bermuda law transferrestrictions applicable to the shares. Were any of our shares to not be fully paid, our bye-laws permit thesupervisory board to decline to register a transfer. At such time as our shares cease to be listed on NASDAQ (oranother appointed exchange, as determined from time to time by the Bermuda Monetary Authority), the BermudaExchange Control Act 1972 and associated regulations require that the prior consent of the Bermuda MonetaryAuthority be obtained for any transfers of shares.
Foreign Shareholders
Our bye-laws have no requirements or restrictions with respect to foreign ownership of our shares.
Supervisory Board and Management Board
VEON Ltd. is governed by our supervisory board currently consisting of nine directors.
The supervisory board generally delegates day-to-day management of our company to the managementboard which sub-delegates management to the CEO, subject to certain material business decisions that arereserved to the supervisory board. The management board consists of the CEO and other senior executives. TheCEO has exclusive authority to identify and recommend our senior executives to the supervisory board for thesupervisory board’s ratification.
All directors are elected by our shareholders through cumulative voting. Each voting share confers on itsholder a number of votes equal to the number of directors to be elected. The holder may cast those votes forcandidates in any proportion, including casting all votes for one candidate.
175
Under our bye-laws, the amount of any fees or other remuneration payable to directors is determined by thesupervisory board upon the recommendation of the compensation committee. We may repay to any director suchreasonable costs and expenses as he may incur in the performance of his duties.
The supervisory board has the power to borrow on VEON Ltd.’s behalf and delegates that authority to themanagement board, subject to the restrictions set forth in our bye-laws, which require that financing transactions,incurrence of indebtedness, guarantee or provision of security in excess of US$300 million still require theapproval of the supervisory board.
There is no requirement for the members of our supervisory board to own shares. A director who is not ashareholder will nevertheless be entitled to attend and speak at general meetings and at any separate meeting ofthe holders of any class of shares.
Neither Bermuda law nor our bye-laws establish any mandatory retirement age for our directors or executiveofficers.
Dividends and Dividend Rights
Pursuant to Bermuda law, we are prohibited from declaring or paying a dividend if there are reasonablegrounds for believing that (a) we are, or would after the payment be, unable to pay our liabilities as they becomedue, or (b) the realizable value of our assets would, as a result of the dividend, be less than the aggregate of ourliabilities.
The supervisory board may, subject to our bye-laws and in accordance with the Companies Act, declare adividend to be paid to the shareholders holding shares entitled to receive dividends, in proportion to the numberof shares held by them, and such dividend may be paid in cash or wholly or partly in shares or other assets,including through the issuance of our shares or other securities, in which case the supervisory board may fix thevalue for distribution in specie of any assets, shares or securities. We are not required to pay interest on anyunpaid dividend.
In accordance with our bye-laws, dividends may be declared and paid in proportion to the amount paid upon each share. The holders of common shares are entitled to dividends if the payment of dividends is approvedby the supervisory board. Convertible preferred shares (if and when issued) have no entitlement to dividends.
Dividends unclaimed for a period of seven years from the date of payment may be forfeited.
Our bye-laws and Bermuda law do not provide for pre-emptive rights of shareholders in respect of newshares issued by us.
There is no statutory regulation of the conduct of takeover offers and transactions under Bermuda law.However, our bye-laws provide that any person who, individually or together with any of its affiliates or anyother members of a group, acquires beneficial ownership of any shares which, taken together with shares alreadybeneficially owned by it or any of its affiliates or its group, in any manner, carry 50.0% or more of the votingrights of our issued and outstanding shares, must, within 30 days of acquiring such shares, make a general offerto all holders of shares to purchase their shares.
Interested Party Transactions
The supervisory board and the management board have the right to approve transactions with interestedparties, subject to compliance with Bermuda law. Prior to approval by the supervisory board or the managementboard, as the case may be, on such transaction, all interests must be fully disclosed. An interested director mayparticipate in the discussion and vote on such a transaction, unless otherwise restricted by applicable law or inaccordance with our bye-laws.
176
Liquidation Rights
If VEON Ltd. is wound up, the liquidator may, with the sanction of a resolution of the shareholders, divideamong the shareholders in specie or in kind the whole or any part of our assets (whether they shall consist ofproperty of the same kind or not) and may, for such purpose, set such value as he deems fair upon any property tobe divided as aforesaid and may determine how such division shall be carried out as between the shareholders ordifferent classes of shareholders.
The liquidator may, with the same sanction, vest the whole or any part of such assets in trustees upon suchtrusts for the benefit of the shareholders as the liquidator thinks fit, but so that no shareholder may be compelledto accept any shares or other securities or assets on which there is any liability.
The holders of common shares, in the event of our winding-up or dissolution, are entitled to our surplusassets in respect of their holdings of common shares, pari passu and pro rata to the number of common sharesheld by each of them. Convertible preferred shares (if and when issued) do not entitle the holders thereof to anypayment or distribution of surplus assets in the event of our winding-up or dissolution.
Share Registration, Transfers and Settlement
All of our issued shares are registered. The register of members of a company is generally open toinspection by shareholders and by members of the general public without charge. The register of members isrequired to be open for inspection for not less than two hours in any business day (subject to the ability of acompany to close the register of members for not more than 30 days in a year). A company is required tomaintain its share register in Bermuda but may, subject to the provisions of the Companies Act, establish abranch register outside of Bermuda. A company is required to keep at its registered office a register of directorsand officers that is open for inspection for not less than two hours in any business day by members of the publicwithout charge. Bermuda law does not, however, provide a general right for shareholders to inspect or obtaincopies of any other corporate records.
C. Material Contracts
The Contribution and Framework Agreement, dated as of August 6, 2015, as amended, by and amongVEON Ltd., VimpelCom Amsterdam B.V., Hutchison, Hutchison Europe Telecommunications S.à r.l. andHutchison 3G Italy Investments S.à r.l., sets out the terms on which the parties will form the equal joint ventureholding company to own and operate their telecommunication businesses in Italy. A copy of this agreement isincluded as Exhibit 4.4, to this Annual Report on Form 20-F.
The Shareholders’ Deed, dated as of August 6, 2015, as amended, by and among Hutchison 3G ItalyInvestments S.à r.l., VimpelCom Luxembourg Holdings S.à r.l., Hutchison Europe Telecommunications S.à r.l.,VEON Ltd. and Hutchison, sets out the terms on which Hutchison 3G Italy Investments S.à r.l. and itssubsidiaries are owned, controlled, managed and financed following the completion of the Italy Joint Venture. Acopy of this agreement is included as Exhibit 4.5, to this Annual Report on Form 20-F. For more informationregarding these agreements and the Italy Joint Venture, see “Item 5—Operating and Financial Review andProspects—Key Developments and Trends—Italy Joint Venture.”
The FinCo Shareholders’ Deed, dated as of November 5, 2016, by and among VIP-CKH Ireland Limited,VimpelCom Luxembourg Holdings S.à r.l., Hutchison Europe Telecommunications S.à r.l., VEON Ltd. andHutchison, sets out the terms on which VIP-CKH Ireland Limited is owned, controlled, managed and financedfollowing the completion of the Italy Joint Venture. A copy of this agreement is included as Exhibit 4.6 to thisAnnual Report on Form 20-F. For more information regarding the Italy Joint Venture, see “Item 5—Operatingand Financial Review and Prospects—Key Developments and Trends—Italy Joint Venture.”
177
D. Exchange Controls
We have been designated by the Bermuda Monetary Authority as non-resident of Bermuda for Bermudaexchange control purposes. This designation allows us to engage in transactions in currencies other than theBermuda dollar, and there are no restrictions on our ability to transfer funds (other than funds denominated inBermuda dollars) in and out of Bermuda or to pay dividends to United States or other non-Bermuda residentswho are holders of our common shares.
For the purposes of Bermuda exchange control regulations, for such time as our ADSs remain listed on anappointed stock exchange (which includes the NASDAQ Global Select Market), there are no limitations on theissue and free transferability of our common shares or our ADSs representing common shares to and betweennon-residents of Bermuda for exchange control purposes. Certain issues and transfers of shares involving personsdeemed resident in Bermuda for exchange control purposes may require the specific prior consent of theBermuda Monetary Authority.
E. Taxation
United States Federal Income Tax Considerations
The following summary describes certain material U.S. federal income tax consequences to U.S. Holders(defined below) under present law of an investment in our ADSs or common shares. This summary applies onlyto U.S. Holders that hold the ADSs or common shares as capital assets within the meaning of Section 1221 of theCode (as defined below) and that have the U.S. dollar as their functional currency.
This summary is based on the Internal Revenue Code of 1986, as amended (the “Code”), existing and, insome cases, proposed U.S. Treasury regulations, as well as judicial and administrative interpretations thereof, allas of the date of this Annual Report. All of the foregoing authorities are subject to change or differinginterpretation, which change or differing interpretation could apply retroactively and could affect the taxconsequences described below. The statements in this Annual Report are not binding on the U.S. InternalRevenue Service (the “IRS”) or any court, and thus we can provide no assurance that the U.S. federal income taxconsequences discussed below will not be challenged by the IRS or will be sustained by a court if challenged bythe IRS. Furthermore, this summary does not address any estate or gift tax consequences, any state, local ornon-U.S. tax consequences or any other tax consequences other than U.S. federal income tax consequences.
The following discussion does not describe all the tax consequences that may be relevant to any particularinvestor or to persons in special tax situations such as:
• banks and certain other financial institutions;
• regulated investment companies;
• real estate investment trusts;
• insurance companies;
• broker-dealers;
• traders that elect to mark to market;
• tax-exempt entities;
• persons liable for alternative minimum tax or the Medicare contribution tax on net investment income;
• certain U.S. expatriates;
• persons holding our ADSs or common shares as part of a straddle, hedging, constructive sale,conversion or integrated transaction;
• persons that actually or constructively own, or are treated as owning, 10% or more of our voting stock;
178
• persons that are resident or ordinarily resident in or have a permanent establishment in a jurisdictionoutside the United States;
• persons who acquired ADSs or common shares pursuant to the exercise of any employee share optionor otherwise as compensation; or
• persons holding ADSs or common shares through partnerships or other pass-through entities
U.S. Holders of our ADSs or common shares are urged to consult their tax advisors about theapplication of the U.S. federal tax rules to their particular circumstances as well as the state, local andnon-U.S. tax consequences to them of the purchase, ownership and disposition of our ADSs or commonshares.
As used herein, the term “U.S. Holder” means a beneficial owner of our ADSs or common shares that, forU.S. federal income tax purposes, is or is treated as:
• an individual who is a citizen or resident of the United States;
• a corporation (or other entity taxable as a corporation) created or organized in or under the laws of theUnited States, any state thereof or the District of Columbia;
• an estate whose income is subject to U.S. federal income taxation regardless of its source; or
• a trust that (1) is subject to the supervision of a court within the United States and the control of one ormore U.S. persons or (2) has a valid election in effect under applicable U.S. Treasury regulations to betreated as a U.S. person.
The tax treatment of a partner (or other owner) in an entity treated as a partnership for U.S. federal incometax purposes that holds our ADSs or common shares generally will depend on such partner’s (or other owner’s)status and the activities of the partnership. A U.S. Holder that is a partner (or other owner) in such a partnershipshould consult its tax advisor.
The discussion below assumes that the representations contained in the deposit agreement are true and thatthe obligations in the deposit agreement and any related agreement will be complied with in accordance withtheir terms. Generally, a holder of an ADS should be treated for U.S. federal income tax purposes as holding thecommon shares represented by the ADS. As a result, no gain or loss will generally be recognized upon anexchange of ADSs for common shares. The U.S. Treasury has expressed concerns that intermediaries in the chainof ownership between the holder of an ADS and the issuer of the security underlying the ADS may be takingactions that are inconsistent with the claiming of foreign tax credits for U.S. Holders of ADSs. Accordingly, thecreditabilities of foreign taxes, if any, as described below, could be affected by actions taken by intermediaries inthe chain of ownership between the holder of an ADS and us if as a result of such actions the holder of an ADS isnot properly treated as the beneficial owner of underlying common shares.
Dividends and Other Distributions
Subject to the passive foreign investment company rules discussed below, the gross amount of distributionsmade by us with respect to the ADSs or common shares (including the amount of non-U.S. taxes withheldtherefrom, if any) generally will be includible as dividend income in a U.S. Holder’s gross income in the yearreceived (or deemed received), but only to the extent such distributions are paid out of our current oraccumulated earnings and profits as determined under U.S. federal income tax principles. Because we do notmaintain calculations of our earnings and profits under U.S. federal income tax principles, a U.S. Holder shouldexpect all cash distributions will be reported as dividends for U.S. federal income tax purposes. Such dividendswill not be eligible for the dividends-received deduction allowed to U.S. corporations with respect to dividendsreceived from other U.S. corporations.
179
Dividends received by certain non-corporate U.S. Holders (including individuals) may be “qualifieddividend income,” which is taxed at the lower applicable capital gains rate, provided that (1) the ADSs orcommon shares, as applicable, are readily tradable on an established securities market in the United States,(2) we are neither a passive foreign investment company (as discussed below) nor treated as such with respect tothe U.S. Holder for the taxable year in which the dividend is paid and the preceding taxable year, (3) the U.S.Holder satisfies certain holding period requirements and (4) the U.S. Holder is not under an obligation to makerelated payments with respect to positions in substantially similar or related property. Under IRS authority,common shares, or ADSs representing such shares, generally are considered for purposes of clause (1) above tobe readily tradable on an established securities market in the United States if they are listed on the NASDAQGlobal Select Market, as our ADSs are. However, based on existing guidance, it is not entirely clear whether anydividends you receive with respect to the common shares will be taxed as qualified dividend income, because thecommon shares are not themselves listed on a U.S. exchange for trading purposes. U.S. Holders should consulttheir own tax advisors regarding the availability of the lower rate for dividends paid with respect to the ADSs orcommon shares.
The amount of any distribution paid in foreign currency will be equal to the U.S. dollar value of suchcurrency, translated at the spot rate of exchange on the date such distribution is received by the depositary, in thecase of ADSs, or by you, in the case of common shares, regardless of whether the payment is in fact convertedinto U.S. dollars at that time. Any further gain or loss on a subsequent conversion or other disposition of thecurrency for a different U.S. dollar amount will be U.S. source ordinary income or loss.
The dividends will generally be foreign source and considered “passive category” income, and non-U.S.taxes withheld therefrom, if any, may be creditable against the U.S. Holder’s U.S. federal income tax liability,subject to applicable limitations. If the dividends constitute qualified dividend income as discussed above, theamount of the dividend taken into account for purposes of calculating the foreign tax credit limitation willgenerally be limited to the gross amount of the dividend, multiplied by the reduced rate applicable to thequalified dividend income, divided by the highest rate of tax normally applicable to dividends. The limitation onforeign taxes eligible for credit is calculated separately with respect to specific classes of income. The rulesrelating to the determination of the U.S. foreign tax credit are complex, and U.S. Holders should consult their taxadvisors regarding the availability of a foreign tax credit in their particular circumstances and the possibility ofclaiming an itemized deduction (in lieu of the foreign tax credit) for any foreign taxes paid or withheld.
Sale or Other Taxable Disposition of the ADSs or Common Shares
Subject to the passive foreign investment company rules discussed below, upon a sale or other taxabledisposition of the ADSs or common shares, a U.S. Holder generally will recognize capital gain or loss for U.S.federal income tax purposes in an amount equal to the difference between the amount realized and the U.S.Holder’s adjusted tax basis in such ADSs or common shares. Any such gain or loss generally will be treated aslong-term capital gain or loss if the U.S. Holder’s holding period in the ADSs or common shares exceeds oneyear. Non-corporate U.S. Holders (including individuals) generally will be subject to U.S. federal income tax onlong-term capital gain at preferential rates. The deductibility of capital losses is subject to significant limitations.Gain or loss, if any, realized by a U.S. Holder on the sale or other disposition of the ADSs or common sharesgenerally will be treated as U.S. source gain or loss for U.S. foreign tax credit limitation purposes.
If the consideration received upon the sale or other disposition of the ADSs or common shares is paid inforeign currency, the amount realized will be the U.S. dollar value of the payment received, translated at the spotrate of exchange on the date of the sale or other disposition. A U.S. Holder may realize additional gain or lossupon the subsequent sale or disposition of such currency, which will generally be treated as U.S. source ordinaryincome or loss. If the ADSs or common shares, as applicable, are treated as traded on an established securitiesmarket and the relevant U.S. Holder is either a cash basis taxpayer or an accrual basis taxpayer who has made aspecial election (which must be applied consistently from year to year and cannot be changed without the consentof the IRS), such holder will determine the U.S. dollar value of the amount realized in foreign currency by
180
translating the amount received at the spot rate of exchange on the settlement date of the sale. If the ADSs orcommon shares, as applicable, are not treated as traded on an established securities market, or the relevant U.S.Holder is an accrual basis taxpayer that does not elect to determine the amount realized using the spot rate on thesettlement date, such U.S. Holder will recognize foreign currency gain or loss to the extent of any differencebetween the U.S. dollar amount realized on the date of sale or disposition (as determined above) and the U.S.dollar value of the currency received translated at the spot rate on the settlement date.
A U.S. Holder’s initial tax basis in the ADSs or common shares generally will equal the cost of such ADSsor common shares, as applicable. If a U.S. Holder used foreign currency to purchase the ADSs or commonshares, the cost of the ADSs or common shares will be the U.S. dollar value of the foreign currency purchaseprice on the date of purchase, translated at the spot rate of exchange on that date. If the ADSs or common shares,as applicable, are treated as traded on an established securities market and the relevant U.S. Holder is either acash basis taxpayer or an accrual basis taxpayer who has made the special election described above, the U.S.Holder will determine the U.S. dollar value of the cost of such ADSs or common shares by translating theamount paid at the spot rate of exchange on the settlement date of the purchase.
Passive Foreign Investment Company Rules
We will be classified as a passive foreign investment company (a “PFIC”) for any taxable year if either:(1) at least 75% of our gross income is “passive income” for purposes of the PFIC rules or (2) at least 50% of thevalue of our assets (determined on the basis of a quarterly average) is attributable to assets that produce or areheld for the production of passive income. For this purpose, we will be treated as owning our proportionate shareof the assets and earning our proportionate share of the income of any other corporation in which we own,directly or indirectly, 25% or more (by value) of the stock. Under the PFIC rules, if we were considered a PFICat any time that a U.S. Holder holds our ADSs or common shares, we would continue to be treated as a PFICwith respect to such investment unless (1) we cease to be a PFIC and (2) the U.S. Holder has made a “deemedsale” election under the PFIC rules.
Based on our financial statements and relevant market and shareholder data, we believe that we should notbe treated as a PFIC with respect to our most recently closed taxable year. This is a factual determination,however, that must be made annually after the close of each taxable year and is subject to uncertainty in severalrespects. Therefore, there can be no assurance that we will not be classified as a PFIC for the current taxable yearor for any future taxable year.
If we are considered a PFIC at any time that a U.S. Holder holds our ADSs or common shares, any gainrecognized by the U.S. Holder on a sale or other disposition of our ADSs or common shares, as well as theamount of any “excess distribution” (defined below) received by the U.S. Holder, would be allocated ratably overthe U.S. Holder’s holding period for our ADSs or common shares. The amounts allocated to the taxable year ofthe sale or other disposition (or the taxable year of receipt, in the case of an excess distribution) and to any yearbefore we became a PFIC would be taxed as ordinary income. The amount allocated to each other taxable yearwould be subject to tax at the highest rate in effect for individuals or corporations, as appropriate, for that taxableyear, and an interest charge would be imposed. For the purposes of these rules, an excess distribution is theamount by which any distribution received by a U.S. Holder on its ADSs or common shares exceeds 125% of theaverage of the annual distributions on our ADSs or common shares received during the preceding three years orthe U.S. Holder’s holding period, whichever is shorter. Certain elections may be available that would result inalternative treatments (such as mark-to-market treatment) of our ADSs or common shares if VEON Ltd. isconsidered a PFIC.
If VEON Ltd. is considered a PFIC, a U.S. Holder will also be subject to annual information reportingrequirements. U.S. Holders should consult their tax advisors about the potential application of the PFIC rules toan investment in our ADSs or common shares.
181
U.S. Information Reporting and Backup Withholding
Dividend payments with respect to our ADSs or common shares and proceeds from the sale, exchange orredemption of our ADSs or common shares may be subject to information reporting to the IRS and possible U.S.backup withholding. A U.S. Holder may be eligible for an exemption from backup withholding if the U.S.Holder furnishes a correct U.S. federal taxpayer identification number and makes any other required certificationor is otherwise exempt from backup withholding. U.S. Holders who are required to establish their exempt statusmay be required to provide such certification on IRS Form W-9. U.S. Holders should consult their tax advisorsregarding the application of the U.S. information reporting and backup withholding rules.
Backup withholding is not an additional tax. Amounts withheld as backup withholding may be creditedagainst a U.S. Holder’s U.S. federal income tax liability, and such U.S. Holder may obtain a refund of any excessamounts withheld under the backup withholding rules by timely filing an appropriate claim for refund with theIRS and furnishing any required information.
Additional Information Reporting Requirements
Certain U.S. Holders who are individuals and certain entities may be required to file IRS Form 8938(Statement of Specified Foreign Financial Assets) or otherwise report information relating to an interest in ADSsor common shares, subject to certain exceptions (including an exception for ADSs or common shares held inaccounts maintained by certain financial institutions). Penalties can apply if U.S. Holders fail to satisfy suchreporting requirements. U.S. Holders should consult their tax advisors regarding the applicability of theserequirements to their acquisition and ownership of our ADSs or common shares.
THE DISCUSSION ABOVE IS A GENERAL SUMMARY. IT DOES NOT COVER ALL TAXMATTERS THAT MAY BE IMPORTANT TO YOU. EACH PROSPECTIVE PURCHASER SHOULDCONSULT ITS OWN TAX ADVISOR ABOUT THE TAX CONSEQUENCES OF AN INVESTMENT INOUR ADSS OR COMMON SHARES UNDER THE INVESTOR’S OWN CIRCUMSTANCES.
Material Bermuda Tax Considerations
Under current Bermuda law, we are not subject to tax in Bermuda on our income or capital gains.
Furthermore, we have obtained from the Minister of Finance of Bermuda, under the Exempted UndertakingsTax Protection Act 1966, an undertaking that, in the event that Bermuda enacts any legislation imposing taxcomputed on any income or gains, that tax will not be applicable to us until March 31, 2035. This undertakingdoes not, however, prevent the imposition of any tax or duty on persons ordinarily resident in Bermuda or anyproperty tax on property interests we may have in Bermuda. We pay an annual government fee in Bermuda basedon our authorized share capital and share premium. The annual government fee applicable to us is currentlyUS$8,360.
Under current Bermuda law, no income, withholding or other taxes or stamp or other duties are imposed inBermuda upon the issue, transfer or sale of our common shares or on any payments in respect of our commonshares (except, in certain circumstances, to persons ordinarily resident in Bermuda).
Dutch Tax Considerations
This summary solely addresses the principal Dutch tax consequences of the acquisition, ownership anddisposal of our ADSs or our common shares and does not purport to describe every aspect of taxation that maybe relevant to a particular holder. Tax matters are complex, and the tax consequences of the acquisition,ownership and disposal to a particular holder of ADSs or common shares will depend in part on such holder’scircumstances. Accordingly, you are urged to consult your own tax advisor for a full understanding of the taxconsequences of the acquisition, ownership and disposal to you, including the applicability and effect of Dutchtax laws.
182
Where in this summary English terms and expressions are used to refer to Dutch concepts, the meaning tobe attributed to such terms and expressions shall be the meaning to be attributed to the equivalent Dutch conceptsunder Dutch tax law. Where in this summary the terms “the Netherlands” and “Dutch” are used, these refersolely to the European part of the Kingdom of the Netherlands. This summary assumes that VEON Ltd. isorganized, and that its business will be conducted, in the manner outlined in this Annual Report and Form 20-F.A change to such organizational structure or to the manner in which VEON Ltd. conducts its business mayinvalidate the contents of this summary, which will not be updated to reflect any such change.
This summary is based on the tax law of the Netherlands (unpublished case law not included) as it stands atthe date of this Annual Report and Form 20-F. The tax law upon which this summary is based, is subject tochanges, possibly with retroactive effect. Any such change may invalidate the contents of this summary, whichwill not be updated to reflect such change.
The summary in this Dutch tax considerations paragraph does not address your Dutch tax consequences ifyou are a holder of ADSs or common shares who:
(i) may be deemed an owner of ADSs or common shares for Dutch tax purposes pursuant to specificstatutory attribution rules in Dutch tax law;
(ii) is, although in principle subject to Dutch corporation tax, in whole or in part, specifically exempt fromthat tax in connection with income from ADSs or common shares;
(iii) is an investment institution as defined in the Dutch Corporation Tax Act 1969;
(iv) owns ADSs or common shares in connection with a membership of a management board or asupervisory board, an employment relationship, a deemed employment relationship or managementrole; or
(v) has a substantial interest in VEON Ltd. or a deemed substantial interest in VEON Ltd. for Dutch taxpurposes. Generally, you hold a substantial interest if (a) you – either alone or, in the case of anindividual, together with your partner or any of your relatives by blood or by marriage in the direct line(including foster-children) or of those of your partner for Dutch tax purposes – own or are deemed toown, directly or indirectly, ADSs or common shares representing 5.0% or more of the shares or of anyclass of shares of VEON Ltd., or rights to acquire, directly or indirectly, ADSs or common sharesrepresenting such an interest in the shares of VEON Ltd. or profit participating certificates relating to5.0% or more of the annual profits or to 5.0% or more of the liquidation proceeds of VEON Ltd., or(b) your ADSs or common shares, rights to acquire ADSs or common shares or profit participatingcertificates in VEON Ltd. are held by you following the application of a non-recognition provision.
Taxes on income and capital gains
Non-resident individuals
If you are an individual who is neither resident nor deemed to be resident in the Netherlands for purposes ofDutch income tax, you will not be subject to Dutch income tax in respect of any benefits derived or deemed to bederived from or in connection with your ADSs or common shares, except if:
(i) you derive profits from an enterprise, whether as an entrepreneur or pursuant to a co-entitlement to thenet value of such enterprise, other than as a shareholder, and such enterprise is carried on, in whole orin part, through a permanent establishment or a permanent representative in the Netherlands, and yourADSs or common shares are attributable to such permanent establishment or permanent representative;or
(ii) you derive benefits or are deemed to derive benefits from or in connection with ADSs or commonshares that are taxable as benefits from miscellaneous activities performed in the Netherlands.
183
Non-resident corporate entities
If you are a corporate entity, or an entity including an association, a partnership and a mutual fund, taxable as acorporate entity, which is neither resident, nor deemed to be resident in the Netherlands for purposes of Dutchcorporation tax, you will not be subject to Dutch corporation tax in respect of any benefits derived or deemed tobe derived from or in connection with ADSs, except if:
(i) you derive profits from an enterprise directly which is carried on, in whole or in part, through apermanent establishment or a permanent representative which is taxable in the Netherlands, and towhich permanent establishment or permanent representative your ADSs are attributable; or
(ii) you derive profits pursuant to a co-entitlement to the net value of an enterprise which is managed in theNetherlands, other than as a holder of securities, and to which enterprise your ADSs are attributable.
General
If you are neither resident nor deemed to be resident in the Netherlands, you will for Dutch tax purposes notcarry on or be deemed to carry on an enterprise, in whole or in part, through a permanent establishment or apermanent representative in the Netherlands by reason only of the execution and/or enforcement of thedocuments relating to the issue of ADSs or the performance by VEON Ltd. of its obligations under suchdocuments or under the ADSs.
Dividend withholding tax
General
VEON Ltd. is generally required to withhold Dutch dividend withholding tax at a rate of 15.0% fromdividends distributed by VEON Ltd., subject to possible relief under Dutch domestic law, the Treaty on theFunctioning of the European Union or an applicable Dutch income tax treaty depending on a particular holder ofADSs’ or common shares individual circumstances.
The concept “dividends distributed by VEON Ltd.” as used in this Dutch tax considerations paragraphincludes, but is not limited to, the following:
• distributions in cash or in kind, deemed and constructive distributions and repayments of capital notrecognized as paid-in for Dutch dividend withholding tax purposes;
• liquidation proceeds and proceeds of repurchase or redemption of ADSs or common shares in excess ofthe average capital recognized as paid-in for Dutch dividend withholding tax purposes;
• the par value of ADSs or common shares issued by VEON Ltd.to a holder of its ADSs or commonshares or an increase of the par value of ADSs or common shares, as the case may be, to the extent thatit does not appear that a contribution, recognized for Dutch dividend withholding tax purposes, hasbeen made or will be made; and
• partial repayment of capital, recognized as paid-in for Dutch dividend withholding tax purposes, if andto the extent that there are net profits, unless (a) VEON Ltd.’s shareholders have resolved in advance tomake such repayment and (b) the par value of the ADSs or common shares concerned has been reducedby an equal amount by way of an amendment to its memorandum of association.
Gift and inheritance taxes
No Dutch gift tax or Dutch inheritance tax will arise with respect to an acquisition or deemed acquisition ofADSs or common shares by way of gift by, or upon the death of, a holder of ADSs or common shares who isneither resident nor deemed to be resident in the Netherlands for purposes of Dutch gift tax or Dutch inheritance
184
tax except if, in the event of a gift whilst not being a resident nor being a deemed resident in the Netherlands forpurposes of Dutch gift tax or Dutch inheritance tax, the holder of ADSs or common shares becomes a resident ora deemed resident in the Netherlands and dies within 180 days after the date of the gift.
For purposes of Dutch gift tax and Dutch inheritance tax, a gift of ADSs or common shares made under acondition precedent is deemed to be made at the time the condition precedent is satisfied.
F. Dividends and Paying Agents
Not required.
G. Statement by Experts
Not required.
H. Documents on Display
We file and submit reports and other information with the SEC. Any documents that we file and submit withthe SEC may be read and copied at the SEC’s public reference room at 100 F Street, NE, Washington, D.C.20549. We file our annual reports on Form 20-F and submit our quarterly results and other current reports onForm 6-K.
I. Subsidiary Information
Not required.
ITEM 11. Quantitative and Qualitative Disclosures About Market Risk
We are exposed to market risk from adverse movements in foreign currency exchange rates and changes ininterest rates on our obligations.
As of December 31, 2016 and 2015, the largest currency exposure risks for the group were in relation to theRussian ruble, the euro, the Pakistani rupee, the Algerian dinar, the Bangladeshi taka, the Ukrainian hryvnia, theKazakh tenge and the Uzbek som, because the majority of our cash flows from operating activities in Russia,Pakistan, Algeria, Bangladesh, Ukraine and Uzbekistan and the Italy Joint Venture’s cash flows from operatingactivities are denominated in these functional currencies, respectively, while our debt, if not incurred in orhedged to the aforementioned currencies, is primarily denominated in U.S. dollars.
We hold approximately 52% of our readily available cash (in U.S. dollars) at the group level in order tohedge against the risk of functional currency devaluation. We also hold part of our debt in Russian rubles andother currencies to manage part of this risk. Nonetheless, if the U.S. dollar value of the Russian ruble, euro,Algerian dinar, Pakistani rupee, Bangladeshi taka, Ukrainian hryvnia, Kazakh tenge or Uzbek som were todramatically decline, it could negatively impact our ability to repay or refinance our U.S. dollar denominatedindebtedness. Fluctuations in the value of the Russian ruble, euro, Algerian dinar, Pakistani rupee, Bangladeshitaka, Ukrainian hryvnia, Kazakh tenge or Uzbek som against the U.S. dollar could adversely affect VEON Ltd.’sfinancial condition and results of operations due to potential revaluation of U.S. dollar denominated indebtednessaffecting net income through foreign exchange gain/loss.
Our treasury function has developed risk management policies that establish guidelines for limiting foreigncurrency exchange rate risk. For more information on risks associated with currency exchange rates, see thesection of this Annual Report on Form 20-F entitled “Item 3—Key Information—D. Risk Factors—RisksRelated to Our Business—We are exposed to foreign currency exchange loss and currency fluctuation andconvertibility risks.”
185
The following table summarizes information, as of December 31, 2016, about the maturity of our financialinstruments that are sensitive to foreign currency exchange rates, primarily represented by foreign currencydenominated debt obligations:
Aggregate nominal amount of totaldebt denominated in foreign currency
outstanding as of December 31, Morethan
5 years
FairValueas of
December 31,20162017 2018 2019 2020 2021
Total debt:Fixed Rate (US$) . . . . . . . . . . . . . . . . . . . . . . . . . . . . . . 1,639 1,090 726 652 1 — 1,830Average interest rate . . . . . . . . . . . . . . . . . . . . . . . . . . . 7.8% 7.4% 7.3% 7.7% 0.0% —Fixed Rate (RUB) . . . . . . . . . . . . . . . . . . . . . . . . . . . . . 198 — — — — — 196Average interest rate . . . . . . . . . . . . . . . . . . . . . . . . . . . 9.0% — — — — —Fixed Rate (other currencies) . . . . . . . . . . . . . . . . . . . . . 27 27 19 11 — — 21Average interest rate . . . . . . . . . . . . . . . . . . . . . . . . . . . 5.7% 5.7% 5.7% 5.7% — —Variable Rate (US$) . . . . . . . . . . . . . . . . . . . . . . . . . . . — — — — — —Average interest rate . . . . . . . . . . . . . . . . . . . . . . . . . . . — — — — — —Variable Rate (other currencies) . . . . . . . . . . . . . . . . . . — — — — — —Average interest rate . . . . . . . . . . . . . . . . . . . . . . . . . . . — — — — — —
1,864 1,116 745 663 1 — 2,047
In accordance with our policies, we do not enter into any treasury management transactions of a speculativenature.
As of December 31, 2016, the variable interest rate risk on the financing of our group was limited as 81% ofthe group’s total debt was fixed rate debt.
For more information on our market risks and financial risk management for derivatives and other financialinstruments, see Notes 5 and 18 to our audited consolidated financial statements included elsewhere in thisAnnual Report on Form 20-F.
ITEM 12. Description of Securities other than Equity Securities
A. Debt Securities
Not required.
B. Warrants and Rights
Not required.
C. Other Securities
Not required.
186
D. American Depositary Shares
D.3. Fees paid by our ADS holders
The Bank of New York Mellon is the depositary for our ADSs. Our depositary collects its fees for deliveryand surrender of ADSs directly from investors (or their intermediaries) depositing shares or surrendering ADSsfor the purpose of withdrawal. The depositary collects fees for making distributions to investors by deductingthose fees from the amounts distributed or by selling a portion of distributable property to pay the fees. Thedepositary may collect its annual fee for depositary services by deductions from cash distributions or by billinginvestors or by charging the book-entry system accounts of participants acting for them. According to our depositagreement with our depositary, dated March 26, 2010 (the “Deposit Agreement”), holders of our ADSs may haveto pay our depositary, either directly or indirectly, fees or charges up to the amounts set forth in the table below.
For:Persons depositing or withdrawing shares or ADS holdersmust pay to the depositary:
Issuance of ADRs, including issuances resulting from adistribution of our shares or rights or other property
US$5.00 (or less) per 100 ADSs (or portion of 100ADSs)
Cancellation of ADSs for the purpose of withdrawal,including if the deposit agreement terminates
US$5.00 (or less) per 100 ADSs (or portion of 100ADSs)
Any cash distribution to ADS holders US$0.02 (or less) per ADS
Depositary service US$0.02 (or less) per ADS per calendar year
Distribution of securities distributed to holders ofdeposited securities that are distributed to ADS holders
A fee equivalent to the fee that would be payable ifsecurities distributed had been shares and the shareshad been deposited for ADS issuance
Transfer and registration of shares on our share registerto or from the name of the depositary or its agent when ashareholder deposits or withdraws shares
Registration or transfer fees
Cable, telex and facsimile transmissions (whenexpressly provided in the deposit agreement)
Expenses of the depositary
Converting foreign currency to U.S. dollars Expenses of the depositary
Taxes and other governmental charges the depositary orthe custodian have to pay on any ADS or shareunderlying an ADS, for example, stock transfer taxes,stamp duty or withholding taxes
As necessary
Any charges incurred by the ADS depositary or itsagents for servicing the deposited securities
As necessary
D.4. Fees Payable by the Depositary to Us
Our depositary has agreed to reimburse us or pay us for:
• certain maintenance costs for the ADS program, including expenses of postage and envelopes formailing annual and interim financial reports, printing and distributing dividend checks, electronic filingof U.S. Federal tax information, mailing required tax forms, stationery, postage, facsimile andtelephone calls; and
• certain investor relationship programs or special investor relations promotional activities.
In certain instances, our depositary has agreed to provide additional payments to us based on changes incertain conditions relating to the ADS facility and to waive certain fees and expenses.
187
From January 1, 2016 to December 31, 2016, the depositary reimbursed us or paid on our behalfapproximately US$2.51 million for investor relationship programs or special investor relations promotionalactivities.
PART II
ITEM 13. Defaults, Dividend Arrearages and Delinquencies
None.
ITEM 14. Material Modifications to the Rights of Security Holders and Use of Proceeds
None.
ITEM 15. Controls and Procedures
(a) Disclosure Controls and Procedures
An evaluation was carried out under the supervision of and with the participation of our management,including our Chief Executive Officer, or “CEO,” and Chief Financial Officer, or “CFO,” of the effectiveness ofthe design and operation of our disclosure controls and procedures as of the end of the period covered by thisAnnual Report on Form 20-F. These disclosure controls and procedures include our Disclosure ReviewCommittee’s review of the preparation of our Exchange Act reports. The Disclosure Review Committee alsoprovides an additional verification of our disclosure controls and procedures. There are inherent limitations to theeffectiveness of any system of disclosure controls and procedures, including the possibility of human error andthe circumvention or overriding of the controls and procedures. Accordingly, even effective disclosure controlsand procedures can only provide reasonable assurance of achieving their control objectives. Based upon theevaluation, our CEO and CFO have concluded that as of December 31, 2016, our disclosure controls andprocedures were effective in providing reasonable assurance that information required to be disclosed by us inour reports filed under the Exchange Act is recorded, processed, summarized and reported within the timeperiods specified in the SEC’s rules and forms, and that such information is accumulated and communicated toour management, including our CEO and CFO, as appropriate, to allow timely decisions regarding requireddisclosure.
(b) Management’s Annual Report on Internal Control Over Financial Reporting
Our management is responsible for establishing and maintaining adequate internal control over financialreporting as defined in Rules 13a-15(f) and 15d-15(f) under the Exchange Act. Our internal control system wasdesigned to provide reasonable assurance regarding the reliability of financial reporting and the preparation andfair presentation of VEON Ltd.’s published consolidated financial statements under generally acceptedaccounting principles.
There are inherent limitations to the effectiveness of any system of controls and procedures, including thepossibility of human error and the circumvention or overriding of the controls and procedures. Because of itsinherent limitations, internal control over financial reporting may not prevent or detect misstatements. Also,projections of any evaluation of effectiveness to future periods are subject to risk that controls may becomeinadequate because of changes in conditions, or that the degree of compliance with the company’s policies andprocedures may deteriorate.
Our management has assessed the effectiveness of our company’s internal control over financial reportingas of December 31, 2016. In making its assessment, our management has utilized the criteria set forth in theInternal Control – Integrated Framework (2013) issued by the Committee of Sponsoring Organizations of the
188
Treadway Commission and the Securities and Exchange Commission’s Guidance Regarding Management’sReport on Internal Control Over Financial Reporting Under Section 13(a) or 15(d) of the Exchange Act.
As a result of management’s assessment of our internal control over financial reporting as of December 31,2016, management concluded that our internal control over financial reporting was effective.
(c) Attestation report Independent Registered Public Accounting Firm
PricewaterhouseCoopers Accountants N.V. (“PwC”), VEON Ltd.’s independent registered publicaccounting firm, has audited and issued an attestation report on the effectiveness of VEON Ltd.’s internalcontrols over financial reporting as of December 31, 2016, a copy of which appears in Item 18.
(d) Changes in Internal Control Over Financial Reporting
There have been no changes in our internal control over financial reporting identified in connection with anevaluation thereof that occurred during the period covered by this Annual Report on Form 20-F that havematerially affected, or are reasonably likely to materially affect, our internal control over financial reporting.
ITEM 15T. Controls and Procedures
Not required.
ITEM 16. [Reserved]
ITEM 16A. Audit Committee Financial Expert
The supervisory board has determined that Jørn P. Jensen, a member of our audit committee, is a “financialexpert,” as defined in Item 16A of Form 20-F. Mr. Jensen is “independent,” as defined in Rule 10A-3 under theExchange Act. For a description of Mr. Jensen’s experience, please see “Item 6—Directors, Senior Managementand Employees—A. Directors and Senior Management—Supervisory Board—Jørn P. Jensen.”
ITEM 16B. Code of Ethics
Our group-wide Code of Conduct applies to all of VEON’s employees, officers and directors, including itsprincipal executive officer, principal financial officer, and principal accounting officer. The Code of Conductincludes a code of ethics, as defined in Item 16B of Form 20-F under the Exchange Act, that provides group-widestandards designed primarily to deter wrongdoing and promote honest and ethical conduct, compliance withapplicable governmental laws, rules and regulations, prompt internal reporting of violations and accountabilityfor adherence to the code. Our Code of Conduct is available on our website at http://www.veon.com (informationappearing on the website is not incorporated by reference into this annual report). We will disclose anyamendment to the provisions of such code of ethics or any waiver, including any implicit waiver that oursupervisory board may grant on our website at the same address.
189
ITEM 16C. Principal Accountant Fees and Services
PricewaterhouseCoopers Accountants N.V. have served as our independent public accountants for the fiscalyears ended December 31, 2016 and December 31, 2015, for which audited financial statements appear in thisAnnual Report on Form 20-F. The following table presents the aggregate fees for professional services and otherservices rendered by PricewaterhouseCoopers Accountants N.V. and their member firms in 2016 and 2015.
Year ended December 31,
2016 2015
(in millions of U.S. dollars)
Audit Fees . . . . . . . . . . . . . . . . . . . . . . . . . . . . . . . . 10.3 9.7Audit-Related Fees . . . . . . . . . . . . . . . . . . . . . . . . . 0.7 1.0Tax Fees . . . . . . . . . . . . . . . . . . . . . . . . . . . . . . . . . 0.3 0.2All Other Fees . . . . . . . . . . . . . . . . . . . . . . . . . . . . . 0.2 0.1
Total . . . . . . . . . . . . . . . . . . . . . . . . . . . . . . . . . . . . 11.5 11.0
Audit Fees
Audit Fees mainly consisted of fees for the audit of the consolidated financial statements as of and for theyears ended December 31, 2016 and 2015, the review of quarterly consolidated financial statements and servicesprovided in connection with regulatory and statutory filings, including comfort letters, consents and Sarbanes-Oxley Section 404 attestation services.
Audit-Related Fees
Audit-Related Fees are fees for assurance and related services which are reasonably related to theperformance of audit or review and generally include audit and assurance services related to transactionalofferings and reporting procedures and other agreed-upon services related to accounting and billing records.
Tax Fees
Tax Fees consisted of fees for permissible review of tax compliance, services for preparation of corporateand personal income tax returns for statutory tax purposes and tax-related surveys.
All Other Fees
All Other Fees include fees for permissible strategy advisory, consulting and survey services as well asagreed-upon procedures not related to accounting and billing records.
Audit Committee Pre-Approval Policies and Procedures
The Sarbanes-Oxley Act of 2002 required VEON Ltd. to implement a pre-approval process for allengagements with its independent public accountants. In compliance with Sarbanes-Oxley requirementspertaining to auditor independence, VEON Ltd.’s audit committee pre-approves the engagement terms and feesof VEON Ltd.’s independent public accountant for audit and non-audit services, including tax services.VEON Ltd.’s audit committee pre-approved the engagement terms and fees of PricewaterhouseCoopersAccountants N.V. and its affiliates for all services performed for the fiscal year ended December 31, 2016.
ITEM 16D. Exemptions from the Listing Standards for Audit Committees
None.
ITEM 16E. Purchases of Equity Securities by the Issuer and Affiliated Purchasers
None.
190
ITEM 16F. Change in Registrant’s Certifying Accountant
None.
ITEM 16G. Corporate Governance
We comply with the corporate governance rules applicable to foreign private issuers listed on the NASDAQGlobal Select Market.
We are permitted to follow “home country practice” in Bermuda in lieu of the provisions of NASDAQ’scorporate governance rules, except that we are required to: (1) have a qualifying audit committee underNASDAQ listing rule 5605(c)(3); (2) ensure that our audit committee’s members meet the independencerequirement under NASDAQ listing rule 5605(c)(2)(A)(ii); and (3) comply with the voting rights requirementsunder NASDAQ listing rule 5640.
In accordance with NASDAQ listing rule 5615(a)(3)(B), the following is a summary of the “home countrypractices” in Bermuda that we follow in lieu of the relevant NASDAQ listing rules.
Disclosure of Third Party Director and Nominee Compensation
NASDAQ listing rule 5250(b)(3) provides that each U.S. company listed on NASDAQ must disclose thematerial terms of all agreements and arrangements between any director or nominee for director, and any personor entity other than the company, relating to compensation or other payment in connection with such person’scandidacy or service as a director of the company. As a foreign private issuer, we are exempt from complyingwith this NASDAQ requirement, and some of our directors have agreements with persons or entities other thanthe company.
Director Independence
NASDAQ listing rule 5605(b)(1) provides that each U.S. company listed on NASDAQ must have a majorityof independent directors, as defined in the NASDAQ rules. Bermuda law does not require that we have amajority of independent directors. As a foreign private issuer, we are exempt from complying with thisNASDAQ requirement, and we do not currently have a majority of independent directors, as defined in theNASDAQ rules.
Executive Sessions
NASDAQ listing rule 5605(b)(2) requires that the independent directors, as defined in the NASDAQ rules,of a U.S. company listed on the NASDAQ Global Select Market meet at regularly scheduled executive sessionsat which only such independent directors are present. Bermuda law does not impose any such requirement onVEON Ltd. As a foreign private issuer, we are exempt from complying with this NASDAQ requirement and ourinternal corporate governance rules and procedures do not currently require independent directors to meet atregularly scheduled executive sessions.
Our board does not, however, include any members of our management, and, from time to time, the boardhas requested that management not be present for portions of board meetings in order to allow the board to serveas a more effective check on management.
Independent Director Oversight of Director Nominations
NASDAQ rule 5605(e)(1) requires that director nominees of U.S. listed companies are selected, orrecommended for the board’s selection, either by (1) a majority of the board’s independent directors, as definedin the NASDAQ rules, in a vote in which only such independent directors participate or (2) a nominations
191
committee composed solely of independent directors, as defined in the NASDAQ rules. Bermuda law does notimpose any such requirement on VEON Ltd. As a foreign private issuer, we are exempt from complying with theNASDAQ requirement regarding independent director oversight of director nominations. Our nominating andcorporate governance committee is responsible for identifying and selecting candidates to serve as directors, butit is not composed solely of independent directors, as defined in the NASDAQ rules.
Compensation Committee
NASDAQ rule 5605(d)(2) requires that U.S. listed companies have a compensation committee with at leasttwo members and composed entirely of independent directors, as defined in the NASDAQ rules. In addition, theNASDAQ rules require a U.S. listed company’s compensation committee to have a charter that meets therequirements of rule 5605(d)(1) and the responsibilities and authorities listed in rule 5605(d)(3). Bermuda lawdoes not impose any such requirements on VEON Ltd. As a foreign private issuer, we are exempt fromcomplying with the NASDAQ requirements described in this paragraph. However, our supervisory board hasestablished a compensation committee, which currently comprises three directors and acts in an advisorycapacity to our supervisory board with respect to compensation issues. The compensation committee isresponsible for approving the compensation of the directors, officers and employees of VEON Ltd. and itssubsidiaries, our employee benefit plans, any equity compensation plans of VEON Ltd. and its subsidiaries, andany contract relating to a director, officer or shareholder of VEON Ltd or any of our subsidiaries or theirrespective family members or affiliates.
We do not have a compensation committee composed solely of independent directors (as defined under theNASDAQ listing rules) because our internal corporate governance rules do not require us to have independentdirectors (as defined under NASDAQ rules). We believe the structure and responsibilities of our compensationcommittee are adequate to ensure that appropriate incentives are in place for our officers and employees, and thecurrent members of our compensation committee are not officers or employees of VEON Ltd.
Audit Committee
NASDAQ rule 5605(c)(2)(A) requires that U.S. listed companies have an audit committee composed of atleast three members, each of whom is an independent director, as defined in the NASDAQ rules. Bermuda lawdoes not impose any such requirement on VEON Ltd. As a foreign private issuer, we are exempt from complyingwith the NASDAQ requirement to have an audit committee with at least three members. However, our auditcommittee currently comprises three directors, all of whom meet the criteria for independence set forth in Rule10A-3 under the Exchange Act. The audit committee is primarily responsible for the appointment, compensation,retention and oversight of the auditors, establishing procedures for addressing complaints related to accounting oraudit matters and engaging necessary advisors.
Equity Compensation Plans
NASDAQ rule 5635(c) requires that U.S. listed companies give shareholders an opportunity to vote on allstock option or other equity compensation plans and material amendments thereto (with specific exceptions).Bermuda law does not impose any such requirement on VEON Ltd. As a foreign private issuer, we are exemptfrom complying with this NASDAQ requirement, and no equity compensation plans have been submitted forapproval by our shareholders.
ITEM 16H Mine Safety Disclosure
Not required.
192
PART III
ITEM 17. Financial Statements
We have responded to Item 18 in lieu of this Item.
ITEM 18. Financial Statements
INDEX TO FINANCIAL STATEMENTS OF VEON LTD.
Report of Independent Registered Public Accounting Firm . . . . . . . . . . . . . . . . . . . . . . . . . . . . . . . . . . . . . . F-2Consolidated income statements . . . . . . . . . . . . . . . . . . . . . . . . . . . . . . . . . . . . . . . . . . . . . . . . . . . . . . . . . . . F-4Consolidated statement of comprehensive income . . . . . . . . . . . . . . . . . . . . . . . . . . . . . . . . . . . . . . . . . . . . . F-5Consolidated statement of financial position . . . . . . . . . . . . . . . . . . . . . . . . . . . . . . . . . . . . . . . . . . . . . . . . . . F-6Consolidated statement of changes in equity . . . . . . . . . . . . . . . . . . . . . . . . . . . . . . . . . . . . . . . . . . . . . . . . . F-7Consolidated statement of cash flows . . . . . . . . . . . . . . . . . . . . . . . . . . . . . . . . . . . . . . . . . . . . . . . . . . . . . . . F-9Notes to consolidated financial statements . . . . . . . . . . . . . . . . . . . . . . . . . . . . . . . . . . . . . . . . . . . . . . . . . . . F-10
193
ITEM 19. Exhibits
List of Exhibits.
Incorporated by Reference
Number Description of Exhibit Form File No. Exhibit DateFiled
Herewith
1.1 Bye-laws of VEON Ltd. adopted on April 20,2010 and Amended and Restated on March 30,2017
*
1.2 Certificate of Incorporation, as amended, andMemorandum of Association
*
2.1 Form of Deposit Agreement (common shares)between VimpelCom Ltd. and The Bank ofNew York Mellon, as depositary
F-4 333-164770 4.1 2/8/2010
2.2 Registration Rights Agreement, dated asOctober 4, 2009, between and amongVimpelCom Ltd., Eco Telecom Limited,Altimo Holdings & Investments Ltd., AltimoCoöperatief U.A., Telenor MobileCommunications AS and Telenor East InvestAS
F-4 333-164770 2.3 2/8/2010
2.3 Assignment, Assumption and AmendmentAgreement to the Registration RightsAgreement, dated as of November 27, 2013, byand among VimpelCom Ltd., AltimoHoldings & Investments Ltd., AltimoCoöperatief U.A., Telenor MobileCommunications AS, Telenor East Invest ASand Telenor East Holding II AS
13D 005-85442 99.1 12/5/2013
2.4 Assignment, Assumption and SecondAmendment Agreement to the RegistrationRights Agreement, dated as of September 21,2016, by and among VimpelCom Ltd., AltimoHoldings & Investments Ltd., AltimoCoöperatief U.A., Letterone InvestmentHoldings S.A., L1T VIP Holdings S.à r.l.,Telenor Mobile Communications AS andTelenor East Holding II AS
6-K 001-34694 4.1 26/9/2016
2.5 Registration Rights Agreement, dated as ofSeptember 21, 2016, by and amongVimpelCom Ltd., Telenor East Holding andMorgan Stanley & Co. International plc, J.P.Morgan Securities plc, Citigroup GlobalMarkets Limited and Credit Suisse Securities(Europe) Limited
6-K 001-34694 4.1 22/9/2016
194
Incorporated by Reference
Number Description of Exhibit Form File No. Exhibit DateFiled
Herewith
2.6 Multicurrency Term and Revolving FacilitiesAgreement, dated as of February 16, 2017, byand among, inter alios, VimpelCom HoldingsB.V. and Citibank Europe plc, UK Branch
*
4.1 Form of Indemnification Agreement 20-F 001-34694 4.5 6/30/2011
4.2 Executive Investment Plan S-8 333-180368 4.3 3/27/2012
4.3 Director Investment Plan S-8 333-183294 4.3 8/14/2012
4.4 Amendment and Restatement Deed relating tothe Contribution and Framework Agreement,dated as of November 4, 2016, by and amongVimpelCom Amsterdam B.V., VimpelComLtd., Hutchison Europe TelecommunicationsS.à r.l., CK Hutchison Holdings Limited andHutchison 3G Italy Investments S.à r.l.(1)
*
4.5 Amendment and Restatement Deed relating toShareholders’ Deed, dated as of November 4,2016, by and among Hutchison 3G ItalyInvestments S.à r.l., VimpelCom LuxembourgHoldings S.à r.l., Hutchison EuropeTelecommunications S.à r.l., VimpelCom Ltd.and CK Hutchison Holdings Limited
*
4.6 FINCO Shareholders’ Deed, dated as ofNovember 5, 2016, by and among VIP-CKHIreland Limited, VimpelCom LuxembourgHoldings S.à r.l, Hutchison EuropeTelecommunications S.à r.l, VimpelCom Ltdand CK Hutchison Holdings Limited
*
8 List of Subsidiaries *
12.1 Certification of CEO pursuant to Section 302 ofthe Sarbanes-Oxley Act of 2002, 15 U.S.C.Section 7241
*
12.2 Certification of CFO pursuant to Section 302 ofthe Sarbanes-Oxley Act of 2002, 15 U.S.C.Section 7241
*
13.1 Certification of CEO and CFO pursuant toSection 906 of the Sarbanes-Oxley Act of2002, 18 U.S.C. Section 1350
*
15.1 Consent of PricewaterhouseCoopersAccountants N.V.
*
99.1 Glossary of Telecommunications Terms *
99.2 Regulation of Telecommunications *
(1) Confidential treatment has been granted for certain confidential portions of this exhibit pursuant to Rule 24b-2 under the SecuritiesExchange Act of 1934, as amended. In accordance with Rule 24b-2, these confidential portions have been omitted from this exhibit andfurnished separately to the Securities and Exchange Commission.
195

VEON Ltd. has not filed as exhibits instruments relating to long-term debt, under which the total amount ofsecurities authorized does not exceed 10% of the total assets of VEON Ltd. and its subsidiaries on a consolidatedbasis. VEON Ltd. agrees to furnish a copy of any such instrument to the Securities and Exchange Commissionupon request.
196
SIGNATURE
The registrant hereby certifies that it meets all of the requirements for filing on Form 20-F and that it hasduly caused and authorized the undersigned to sign this Annual Report on Form 20-F on its behalf.
VEON LTD.
By: /s/ Jean-Yves Charlier
Name: Jean-Yves CharlierTitle: Chief Executive Officer
Date: April 3, 2017
197

Consolidated financial statements
VEON Ltd.(formerly VimpelCom Ltd.)
As at December 31, 2016 and 2015 andFor the three years ended
December 31, 2016
Report of Independent Registered Public Accounting Firm
To: the Supervisory Board and Shareholders of VEON Ltd. (formerly VimpelCom Ltd.) (“the Company”)
In our opinion, the accompanying consolidated statements of financial position and the related consolidatedstatements of income, comprehensive income, changes in equity and cash flows present fairly, in all materialrespects, the financial position of VEON Ltd. and its subsidiaries at 31 December 2016 and 31 December 2015,and the result of their operations and their cash flows for each of the three years in the period ended 31 December2016 in conformity with International Financial Reporting Standards as issued by the International AccountingStandards Board. Also in our opinion, the Company maintained, in all material respects, effective internal controlover financial reporting as of 31 December 2016, based on criteria established in Internal Control – IntegratedFramework 2013 issued by the Committee of Sponsoring Organizations of the Treadway Commission (COSO).The Company’s management is responsible for these financial statements, for maintaining effective internalcontrol over financial reporting and for its assessment of the effectiveness of internal control over financialreporting, included in Management’s Annual Report on Internal Control Over Financial Reporting appearingunder Item 15(b). Our responsibility is to express opinions on these financial statements and on the Company’sinternal control over financial reporting based on our integrated audits. We conducted our audits in accordancewith the standards of the Public Company Accounting Oversight Board (United Stated). Those standards requirethat we plan and perform the audits to obtain reasonable assurance about whether the financial statements arefree of material misstatement and whether effective internal control over financial reporting was maintained in allmaterial respects. Our audits of the financial statements included examining, on a test basis, evidence supportingthe amounts an disclosures in the financial statements, assessing the accounting principles used and significantestimates made by management, and evaluating the overall financial statement presentation. Our audit of internalcontrol over financial reporting included obtaining an understanding of internal control over financial reporting,assessing the risk that a material weakness exists, and testing and evaluating the design and operatingeffectiveness of internal control based on the assessed risk. Our audit also included performing such otherprocedures as we considered necessary in the circumstances. We believe that our audits provide a reasonablebasis for our opinions.
A company’s internal control over financial reporting is a process designed to provide reasonable assuranceregarding the reliability of financial reporting and the preparation of financial statement for external purposes inaccordance with International Financial Reporting Standards as issued by the International Accounting StandardsBoard. A company’s internal control over financial reporting includes those policies and procedures that(i) pertain to the maintenance of records that, in reasonable detail, accurately and fairly reflect the transactions andispositions of the assets of the company; (ii) provide reasonable assurance that transactions are recorded asnecessary to permit preparation of financial statements in accordance with generally accepted accountingprinciples, and that receipts and expenditures of the company are being made only in accordance with theauthorizations of management and directors of the company; and (iii) provide reasonable assurance regardingprevention or timely detection of unauthorized acquisition, use, or disposition of the company’s assets that couldhave a material effect on the financial statements.
Because of its inherent limitation, internal control over financial reporting may not prevent or detectmisstatements. Also, projections of any evaluation of effectiveness to future periods are subject to the risk thatcontrols may become inadequate because of changes in conditions, or that the degree of compliance with thepolicies or procedures may deteriorate.
Amsterdam, 3 April 2017PricewaterhouseCoopers Accountants N.V.
/s/ F.P. Izeboud RA, CPA
F.P. Izeboud RA, CPA
F-2
Table of contents
CONSOLIDATED INCOME STATEMENT . . . . . . . . . . . . . . . . . . . . . . . . . . . . . . . . . . . . . . . . . . . . . . . . . F-4CONSOLIDATED STATEMENT OF COMPREHENSIVE INCOME . . . . . . . . . . . . . . . . . . . . . . . . . . . . F-5CONSOLIDATED STATEMENT OF FINANCIAL POSITION . . . . . . . . . . . . . . . . . . . . . . . . . . . . . . . . . F-6CONSOLIDATED STATEMENT OF CHANGES IN EQUITY . . . . . . . . . . . . . . . . . . . . . . . . . . . . . . . . . F-7CONSOLIDATED STATEMENT OF CASH FLOWS . . . . . . . . . . . . . . . . . . . . . . . . . . . . . . . . . . . . . . . . . F-91 GENERAL INFORMATION . . . . . . . . . . . . . . . . . . . . . . . . . . . . . . . . . . . . . . . . . . . . . . . . . . . . . . . . F-102 BASIS OF PREPARATION OF THE CONSOLIDATED FINANCIAL STATEMENTS . . . . . . . . F-113 SIGNIFICANT ACCOUNTING POLICIES THAT RELATE TO THE FINANCIAL
STATEMENTS AS A WHOLE . . . . . . . . . . . . . . . . . . . . . . . . . . . . . . . . . . . . . . . . . . . . . . . . . . . . F-124 SIGNIFICANT ACCOUNTING JUDGMENTS, ESTIMATES AND ASSUMPTIONS . . . . . . . . . . F-135 FINANCIAL RISK MANAGEMENT . . . . . . . . . . . . . . . . . . . . . . . . . . . . . . . . . . . . . . . . . . . . . . . . . F-166 SIGNIFICANT TRANSACTIONS . . . . . . . . . . . . . . . . . . . . . . . . . . . . . . . . . . . . . . . . . . . . . . . . . . . F-227 SEGMENT INFORMATION . . . . . . . . . . . . . . . . . . . . . . . . . . . . . . . . . . . . . . . . . . . . . . . . . . . . . . . . F-288 REVENUE . . . . . . . . . . . . . . . . . . . . . . . . . . . . . . . . . . . . . . . . . . . . . . . . . . . . . . . . . . . . . . . . . . . . . . F-309 SELLING, GENERAL AND ADMINISTRATIVE EXPENSES . . . . . . . . . . . . . . . . . . . . . . . . . . . . F-3210 IMPAIRMENT . . . . . . . . . . . . . . . . . . . . . . . . . . . . . . . . . . . . . . . . . . . . . . . . . . . . . . . . . . . . . . . . . . . F-3311 INCOME TAXES . . . . . . . . . . . . . . . . . . . . . . . . . . . . . . . . . . . . . . . . . . . . . . . . . . . . . . . . . . . . . . . . . F-3912 INVESTMENTS IN SUBSIDIARIES . . . . . . . . . . . . . . . . . . . . . . . . . . . . . . . . . . . . . . . . . . . . . . . . . F-4613 INVESTMENTS IN ASSOCIATES AND JOINT VENTURES . . . . . . . . . . . . . . . . . . . . . . . . . . . . . F-5014 OTHER NON-OPERATING LOSSES / (GAINS) . . . . . . . . . . . . . . . . . . . . . . . . . . . . . . . . . . . . . . . F-5215 EARNINGS PER SHARE . . . . . . . . . . . . . . . . . . . . . . . . . . . . . . . . . . . . . . . . . . . . . . . . . . . . . . . . . . F-5216 PROPERTY AND EQUIPMENT . . . . . . . . . . . . . . . . . . . . . . . . . . . . . . . . . . . . . . . . . . . . . . . . . . . . F-5417 INTANGIBLE ASSETS . . . . . . . . . . . . . . . . . . . . . . . . . . . . . . . . . . . . . . . . . . . . . . . . . . . . . . . . . . . . F-5618 FINANCIAL ASSETS AND LIABILITIES . . . . . . . . . . . . . . . . . . . . . . . . . . . . . . . . . . . . . . . . . . . . F-5719 OTHER ASSETS AND LIABILITIES . . . . . . . . . . . . . . . . . . . . . . . . . . . . . . . . . . . . . . . . . . . . . . . . F-6820 INVENTORIES . . . . . . . . . . . . . . . . . . . . . . . . . . . . . . . . . . . . . . . . . . . . . . . . . . . . . . . . . . . . . . . . . . F-6921 TRADE AND OTHER RECEIVABLES . . . . . . . . . . . . . . . . . . . . . . . . . . . . . . . . . . . . . . . . . . . . . . . F-6922 CASH AND CASH EQUIVALENTS . . . . . . . . . . . . . . . . . . . . . . . . . . . . . . . . . . . . . . . . . . . . . . . . . F-7023 ISSUED CAPITAL AND RESERVES . . . . . . . . . . . . . . . . . . . . . . . . . . . . . . . . . . . . . . . . . . . . . . . . F-7124 DIVIDENDS PAID AND PROPOSED . . . . . . . . . . . . . . . . . . . . . . . . . . . . . . . . . . . . . . . . . . . . . . . . F-7225 PROVISIONS . . . . . . . . . . . . . . . . . . . . . . . . . . . . . . . . . . . . . . . . . . . . . . . . . . . . . . . . . . . . . . . . . . . . F-7326 RELATED PARTIES . . . . . . . . . . . . . . . . . . . . . . . . . . . . . . . . . . . . . . . . . . . . . . . . . . . . . . . . . . . . . . F-7527 RISKS, COMMITMENTS, CONTINGENCIES AND UNCERTAINTIES . . . . . . . . . . . . . . . . . . . . F-8128 EVENTS AFTER THE REPORTING PERIOD . . . . . . . . . . . . . . . . . . . . . . . . . . . . . . . . . . . . . . . . . F-8729 CONDENSED SEPARATE FINANCIAL INFORMATION OF VEON LTD. . . . . . . . . . . . . . . . . . F-88
F-3
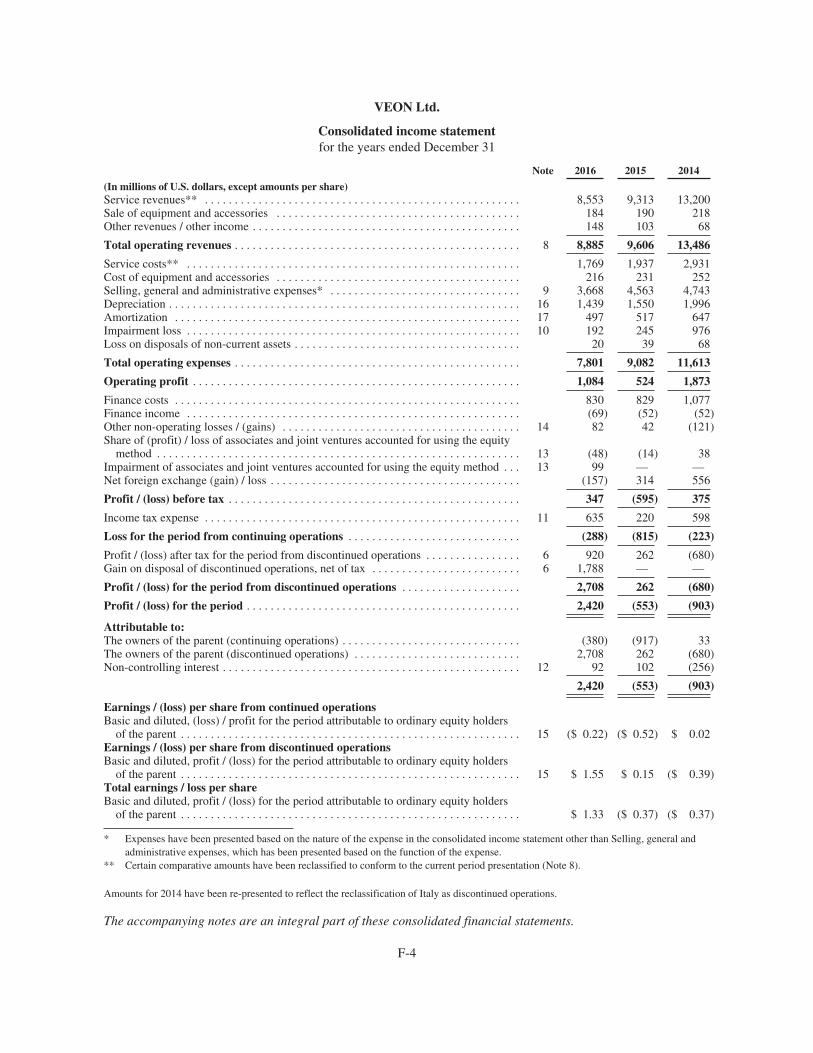
VEON Ltd.
Consolidated income statementfor the years ended December 31
Note 2016 2015 2014
(In millions of U.S. dollars, except amounts per share)Service revenues** . . . . . . . . . . . . . . . . . . . . . . . . . . . . . . . . . . . . . . . . . . . . . . . . . . . . . 8,553 9,313 13,200Sale of equipment and accessories . . . . . . . . . . . . . . . . . . . . . . . . . . . . . . . . . . . . . . . . . 184 190 218Other revenues / other income . . . . . . . . . . . . . . . . . . . . . . . . . . . . . . . . . . . . . . . . . . . . . 148 103 68
Total operating revenues . . . . . . . . . . . . . . . . . . . . . . . . . . . . . . . . . . . . . . . . . . . . . . . . 8 8,885 9,606 13,486
Service costs** . . . . . . . . . . . . . . . . . . . . . . . . . . . . . . . . . . . . . . . . . . . . . . . . . . . . . . . . 1,769 1,937 2,931Cost of equipment and accessories . . . . . . . . . . . . . . . . . . . . . . . . . . . . . . . . . . . . . . . . . 216 231 252Selling, general and administrative expenses* . . . . . . . . . . . . . . . . . . . . . . . . . . . . . . . . 9 3,668 4,563 4,743Depreciation . . . . . . . . . . . . . . . . . . . . . . . . . . . . . . . . . . . . . . . . . . . . . . . . . . . . . . . . . . . 16 1,439 1,550 1,996Amortization . . . . . . . . . . . . . . . . . . . . . . . . . . . . . . . . . . . . . . . . . . . . . . . . . . . . . . . . . . 17 497 517 647Impairment loss . . . . . . . . . . . . . . . . . . . . . . . . . . . . . . . . . . . . . . . . . . . . . . . . . . . . . . . . 10 192 245 976Loss on disposals of non-current assets . . . . . . . . . . . . . . . . . . . . . . . . . . . . . . . . . . . . . . 20 39 68
Total operating expenses . . . . . . . . . . . . . . . . . . . . . . . . . . . . . . . . . . . . . . . . . . . . . . . . 7,801 9,082 11,613
Operating profit . . . . . . . . . . . . . . . . . . . . . . . . . . . . . . . . . . . . . . . . . . . . . . . . . . . . . . . 1,084 524 1,873
Finance costs . . . . . . . . . . . . . . . . . . . . . . . . . . . . . . . . . . . . . . . . . . . . . . . . . . . . . . . . . . 830 829 1,077Finance income . . . . . . . . . . . . . . . . . . . . . . . . . . . . . . . . . . . . . . . . . . . . . . . . . . . . . . . . (69) (52) (52)Other non-operating losses / (gains) . . . . . . . . . . . . . . . . . . . . . . . . . . . . . . . . . . . . . . . . 14 82 42 (121)Share of (profit) / loss of associates and joint ventures accounted for using the equity
method . . . . . . . . . . . . . . . . . . . . . . . . . . . . . . . . . . . . . . . . . . . . . . . . . . . . . . . . . . . . . 13 (48) (14) 38Impairment of associates and joint ventures accounted for using the equity method . . . 13 99 — —Net foreign exchange (gain) / loss . . . . . . . . . . . . . . . . . . . . . . . . . . . . . . . . . . . . . . . . . . (157) 314 556
Profit / (loss) before tax . . . . . . . . . . . . . . . . . . . . . . . . . . . . . . . . . . . . . . . . . . . . . . . . . 347 (595) 375
Income tax expense . . . . . . . . . . . . . . . . . . . . . . . . . . . . . . . . . . . . . . . . . . . . . . . . . . . . . 11 635 220 598
Loss for the period from continuing operations . . . . . . . . . . . . . . . . . . . . . . . . . . . . . (288) (815) (223)
Profit / (loss) after tax for the period from discontinued operations . . . . . . . . . . . . . . . . 6 920 262 (680)Gain on disposal of discontinued operations, net of tax . . . . . . . . . . . . . . . . . . . . . . . . . 6 1,788 — —
Profit / (loss) for the period from discontinued operations . . . . . . . . . . . . . . . . . . . . 2,708 262 (680)
Profit / (loss) for the period . . . . . . . . . . . . . . . . . . . . . . . . . . . . . . . . . . . . . . . . . . . . . . 2,420 (553) (903)
Attributable to:The owners of the parent (continuing operations) . . . . . . . . . . . . . . . . . . . . . . . . . . . . . . (380) (917) 33The owners of the parent (discontinued operations) . . . . . . . . . . . . . . . . . . . . . . . . . . . . 2,708 262 (680)Non-controlling interest . . . . . . . . . . . . . . . . . . . . . . . . . . . . . . . . . . . . . . . . . . . . . . . . . . 12 92 102 (256)
2,420 (553) (903)
Earnings / (loss) per share from continued operationsBasic and diluted, (loss) / profit for the period attributable to ordinary equity holders
of the parent . . . . . . . . . . . . . . . . . . . . . . . . . . . . . . . . . . . . . . . . . . . . . . . . . . . . . . . . . 15 ($ 0.22) ($ 0.52) $ 0.02Earnings / (loss) per share from discontinued operationsBasic and diluted, profit / (loss) for the period attributable to ordinary equity holders
of the parent . . . . . . . . . . . . . . . . . . . . . . . . . . . . . . . . . . . . . . . . . . . . . . . . . . . . . . . . . 15 $ 1.55 $ 0.15 ($ 0.39)Total earnings / loss per shareBasic and diluted, profit / (loss) for the period attributable to ordinary equity holders
of the parent . . . . . . . . . . . . . . . . . . . . . . . . . . . . . . . . . . . . . . . . . . . . . . . . . . . . . . . . . $ 1.33 ($ 0.37) ($ 0.37)
* Expenses have been presented based on the nature of the expense in the consolidated income statement other than Selling, general andadministrative expenses, which has been presented based on the function of the expense.
** Certain comparative amounts have been reclassified to conform to the current period presentation (Note 8).
Amounts for 2014 have been re-presented to reflect the reclassification of Italy as discontinued operations.
The accompanying notes are an integral part of these consolidated financial statements.
F-4
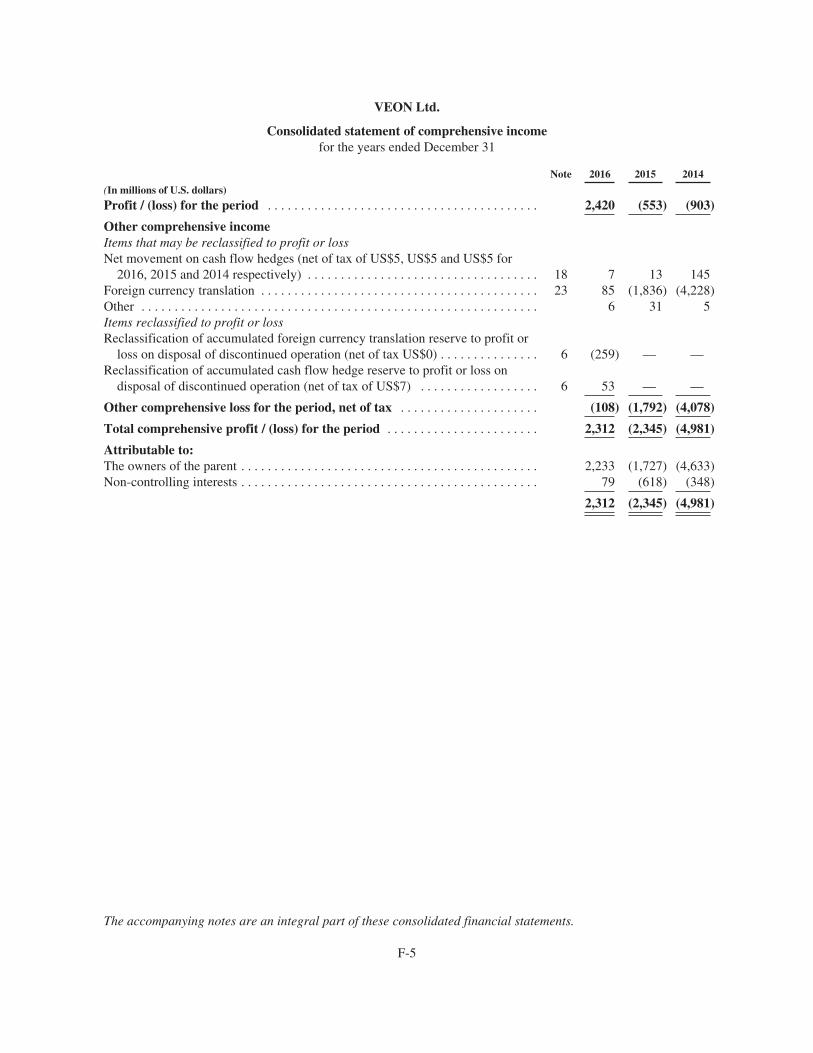
VEON Ltd.
Consolidated statement of comprehensive incomefor the years ended December 31
Note 2016 2015 2014
(In millions of U.S. dollars)
Profit / (loss) for the period . . . . . . . . . . . . . . . . . . . . . . . . . . . . . . . . . . . . . . . . . 2,420 (553) (903)
Other comprehensive incomeItems that may be reclassified to profit or lossNet movement on cash flow hedges (net of tax of US$5, US$5 and US$5 for
2016, 2015 and 2014 respectively) . . . . . . . . . . . . . . . . . . . . . . . . . . . . . . . . . . . 18 7 13 145Foreign currency translation . . . . . . . . . . . . . . . . . . . . . . . . . . . . . . . . . . . . . . . . . . 23 85 (1,836) (4,228)Other . . . . . . . . . . . . . . . . . . . . . . . . . . . . . . . . . . . . . . . . . . . . . . . . . . . . . . . . . . . . 6 31 5Items reclassified to profit or lossReclassification of accumulated foreign currency translation reserve to profit or
loss on disposal of discontinued operation (net of tax US$0) . . . . . . . . . . . . . . . 6 (259) — —Reclassification of accumulated cash flow hedge reserve to profit or loss on
disposal of discontinued operation (net of tax of US$7) . . . . . . . . . . . . . . . . . . 6 53 — —
Other comprehensive loss for the period, net of tax . . . . . . . . . . . . . . . . . . . . . (108) (1,792) (4,078)
Total comprehensive profit / (loss) for the period . . . . . . . . . . . . . . . . . . . . . . . 2,312 (2,345) (4,981)
Attributable to:The owners of the parent . . . . . . . . . . . . . . . . . . . . . . . . . . . . . . . . . . . . . . . . . . . . . 2,233 (1,727) (4,633)Non-controlling interests . . . . . . . . . . . . . . . . . . . . . . . . . . . . . . . . . . . . . . . . . . . . . 79 (618) (348)
2,312 (2,345) (4,981)
The accompanying notes are an integral part of these consolidated financial statements.
F-5
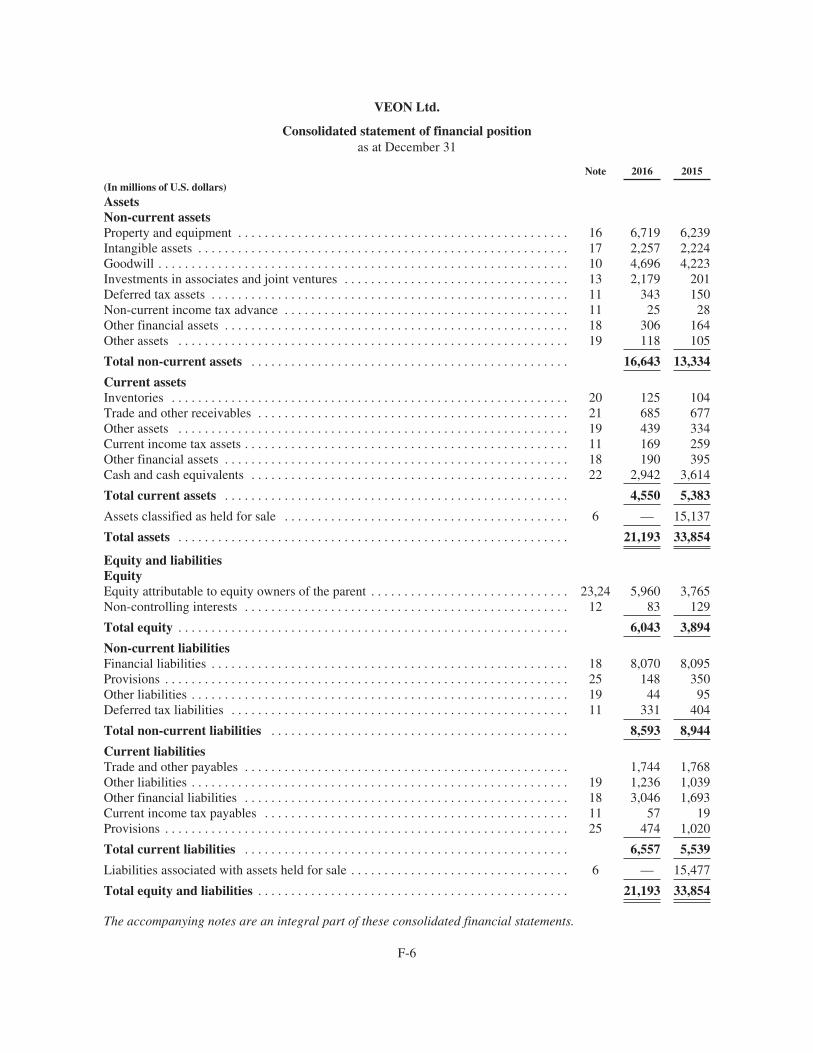
VEON Ltd.
Consolidated statement of financial positionas at December 31
Note 2016 2015
(In millions of U.S. dollars)
AssetsNon-current assetsProperty and equipment . . . . . . . . . . . . . . . . . . . . . . . . . . . . . . . . . . . . . . . . . . . . . . . . . . 16 6,719 6,239Intangible assets . . . . . . . . . . . . . . . . . . . . . . . . . . . . . . . . . . . . . . . . . . . . . . . . . . . . . . . . 17 2,257 2,224Goodwill . . . . . . . . . . . . . . . . . . . . . . . . . . . . . . . . . . . . . . . . . . . . . . . . . . . . . . . . . . . . . . 10 4,696 4,223Investments in associates and joint ventures . . . . . . . . . . . . . . . . . . . . . . . . . . . . . . . . . . 13 2,179 201Deferred tax assets . . . . . . . . . . . . . . . . . . . . . . . . . . . . . . . . . . . . . . . . . . . . . . . . . . . . . . 11 343 150Non-current income tax advance . . . . . . . . . . . . . . . . . . . . . . . . . . . . . . . . . . . . . . . . . . . 11 25 28Other financial assets . . . . . . . . . . . . . . . . . . . . . . . . . . . . . . . . . . . . . . . . . . . . . . . . . . . . 18 306 164Other assets . . . . . . . . . . . . . . . . . . . . . . . . . . . . . . . . . . . . . . . . . . . . . . . . . . . . . . . . . . . 19 118 105
Total non-current assets . . . . . . . . . . . . . . . . . . . . . . . . . . . . . . . . . . . . . . . . . . . . . . . . 16,643 13,334
Current assetsInventories . . . . . . . . . . . . . . . . . . . . . . . . . . . . . . . . . . . . . . . . . . . . . . . . . . . . . . . . . . . . 20 125 104Trade and other receivables . . . . . . . . . . . . . . . . . . . . . . . . . . . . . . . . . . . . . . . . . . . . . . . 21 685 677Other assets . . . . . . . . . . . . . . . . . . . . . . . . . . . . . . . . . . . . . . . . . . . . . . . . . . . . . . . . . . . 19 439 334Current income tax assets . . . . . . . . . . . . . . . . . . . . . . . . . . . . . . . . . . . . . . . . . . . . . . . . . 11 169 259Other financial assets . . . . . . . . . . . . . . . . . . . . . . . . . . . . . . . . . . . . . . . . . . . . . . . . . . . . 18 190 395Cash and cash equivalents . . . . . . . . . . . . . . . . . . . . . . . . . . . . . . . . . . . . . . . . . . . . . . . . 22 2,942 3,614
Total current assets . . . . . . . . . . . . . . . . . . . . . . . . . . . . . . . . . . . . . . . . . . . . . . . . . . . . 4,550 5,383
Assets classified as held for sale . . . . . . . . . . . . . . . . . . . . . . . . . . . . . . . . . . . . . . . . . . . 6 — 15,137
Total assets . . . . . . . . . . . . . . . . . . . . . . . . . . . . . . . . . . . . . . . . . . . . . . . . . . . . . . . . . . . 21,193 33,854
Equity and liabilitiesEquityEquity attributable to equity owners of the parent . . . . . . . . . . . . . . . . . . . . . . . . . . . . . . 23,24 5,960 3,765Non-controlling interests . . . . . . . . . . . . . . . . . . . . . . . . . . . . . . . . . . . . . . . . . . . . . . . . . 12 83 129
Total equity . . . . . . . . . . . . . . . . . . . . . . . . . . . . . . . . . . . . . . . . . . . . . . . . . . . . . . . . . . . 6,043 3,894
Non-current liabilitiesFinancial liabilities . . . . . . . . . . . . . . . . . . . . . . . . . . . . . . . . . . . . . . . . . . . . . . . . . . . . . . 18 8,070 8,095Provisions . . . . . . . . . . . . . . . . . . . . . . . . . . . . . . . . . . . . . . . . . . . . . . . . . . . . . . . . . . . . . 25 148 350Other liabilities . . . . . . . . . . . . . . . . . . . . . . . . . . . . . . . . . . . . . . . . . . . . . . . . . . . . . . . . . 19 44 95Deferred tax liabilities . . . . . . . . . . . . . . . . . . . . . . . . . . . . . . . . . . . . . . . . . . . . . . . . . . . 11 331 404
Total non-current liabilities . . . . . . . . . . . . . . . . . . . . . . . . . . . . . . . . . . . . . . . . . . . . . 8,593 8,944
Current liabilitiesTrade and other payables . . . . . . . . . . . . . . . . . . . . . . . . . . . . . . . . . . . . . . . . . . . . . . . . . 1,744 1,768Other liabilities . . . . . . . . . . . . . . . . . . . . . . . . . . . . . . . . . . . . . . . . . . . . . . . . . . . . . . . . . 19 1,236 1,039Other financial liabilities . . . . . . . . . . . . . . . . . . . . . . . . . . . . . . . . . . . . . . . . . . . . . . . . . 18 3,046 1,693Current income tax payables . . . . . . . . . . . . . . . . . . . . . . . . . . . . . . . . . . . . . . . . . . . . . . 11 57 19Provisions . . . . . . . . . . . . . . . . . . . . . . . . . . . . . . . . . . . . . . . . . . . . . . . . . . . . . . . . . . . . . 25 474 1,020
Total current liabilities . . . . . . . . . . . . . . . . . . . . . . . . . . . . . . . . . . . . . . . . . . . . . . . . . 6,557 5,539
Liabilities associated with assets held for sale . . . . . . . . . . . . . . . . . . . . . . . . . . . . . . . . . 6 — 15,477
Total equity and liabilities . . . . . . . . . . . . . . . . . . . . . . . . . . . . . . . . . . . . . . . . . . . . . . . 21,193 33,854
The accompanying notes are an integral part of these consolidated financial statements.
F-6
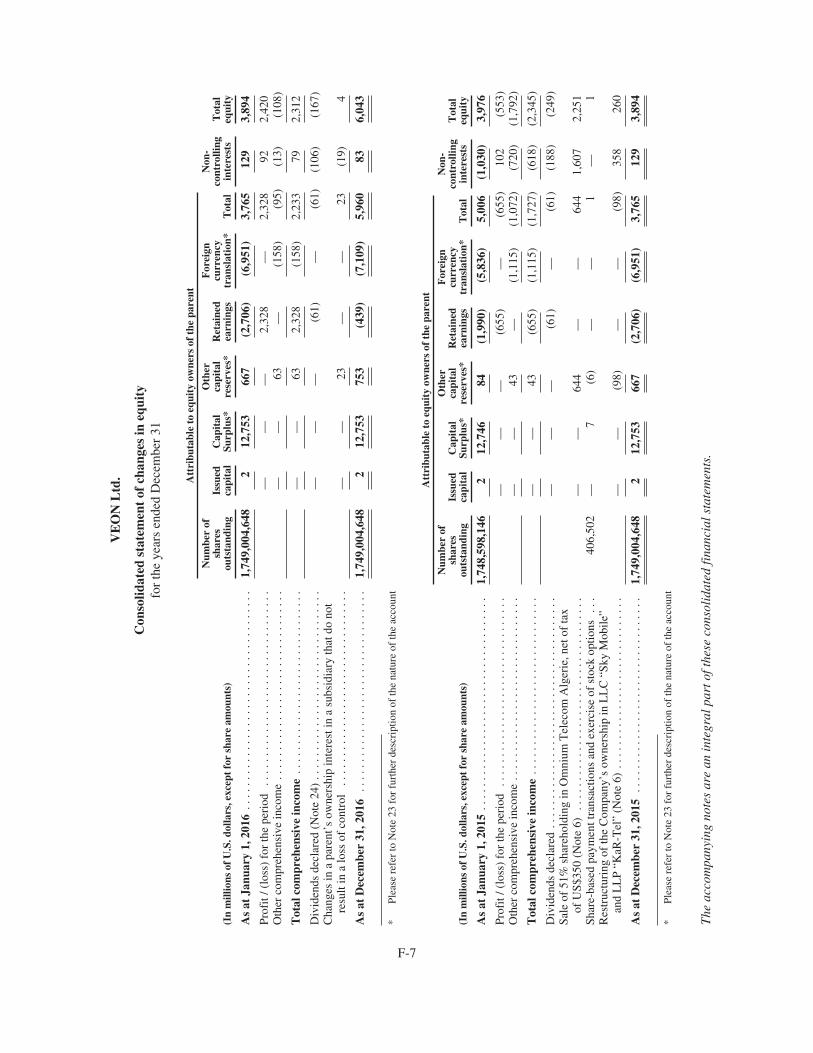
VE
ON
Ltd
.
Con
solid
ated
stat
emen
tof
chan
ges
ineq
uity
for
the
year
sen
ded
Dec
embe
r31
Att
ribu
tabl
eto
equi
tyow
ners
ofth
epa
rent
(In
mill
ions
ofU
.S.d
olla
rs,e
xcep
tfo
rsh
are
amou
nts)
Num
ber
ofsh
ares
outs
tand
ing
Issu
edca
pita
lC
apit
alSu
rplu
s*
Oth
erca
pita
lre
serv
es*
Ret
aine
dea
rnin
gs
For
eign
curr
ency
tran
slat
ion*
Tot
al
Non
-co
ntro
lling
inte
rest
sT
otal
equi
ty
As
atJa
nuar
y1,
2016
....
....
....
....
....
....
....
....
....
.1,
749,
004,
648
212
,753
667
(2,7
06)
(6,9
51)
3,76
512
93,
894
Prof
it/(
loss
)fo
rth
epe
riod
....
....
....
....
....
....
....
....
.—
——
2,32
8—
2,32
892
2,42
0O
ther
com
preh
ensi
vein
com
e..
....
....
....
....
....
....
....
..—
—63
—(1
58)
(95)
(13)
(108
)
Tot
alco
mpr
ehen
sive
inco
me
....
....
....
....
....
....
....
...
——
632,
328
(158
)2,
233
792,
312
Div
iden
dsde
clar
ed(N
ote
24)
....
....
....
....
....
....
....
....
——
—(6
1)—
(61)
(106
)(1
67)
Cha
nges
ina
pare
nt’s
owne
rshi
pin
tere
stin
asu
bsid
iary
that
dono
tre
sult
ina
loss
ofco
ntro
l..
....
....
....
....
....
....
....
...
——
23—
—23
(19)
4
As
atD
ecem
ber
31,2
016
....
....
....
....
....
....
....
....
..1,
749,
004,
648
212
,753
753
(439
)(7
,109
)5,
960
836,
043
*Pl
ease
refe
rto
Not
e23
for
furt
her
desc
ript
ion
ofth
ena
ture
ofth
eac
coun
t
Att
ribu
tabl
eto
equi
tyow
ners
ofth
epa
rent
(In
mill
ions
ofU
.S.d
olla
rs,e
xcep
tfo
rsh
are
amou
nts)
Num
ber
ofsh
ares
outs
tand
ing
Issu
edca
pita
lC
apit
alSu
rplu
s*
Oth
erca
pita
lre
serv
es*
Ret
aine
dea
rnin
gs
For
eign
curr
ency
tran
slat
ion*
Tot
al
Non
-co
ntro
lling
inte
rest
sT
otal
equi
ty
As
atJa
nuar
y1,
2015
....
....
....
....
....
....
....
....
....
1,74
8,59
8,14
62
12,7
4684
(1,9
90)
(5,8
36)
5,00
6(1
,030
)3,
976
Prof
it/(
loss
)fo
rth
epe
riod
....
....
....
....
....
....
....
....
——
—(6
55)
—(6
55)
102
(553
)O
ther
com
preh
ensi
vein
com
e..
....
....
....
....
....
....
....
.—
—43
—(1
,115
)(1
,072
)(7
20)
(1,7
92)
Tot
alco
mpr
ehen
sive
inco
me
....
....
....
....
....
....
....
..—
—43
(655
)(1
,115
)(1
,727
)(6
18)
(2,3
45)
Div
iden
dsde
clar
ed..
....
....
....
....
....
....
....
....
....
.—
——
(61)
—(6
1)(1
88)
(249
)Sa
leof
51%
shar
ehol
ding
inO
mni
umT
elec
omA
lger
ie,n
etof
tax
ofU
S$35
0(N
ote
6)..
....
....
....
....
....
....
....
....
..—
—64
4—
—64
41,
607
2,25
1Sh
are-
base
dpa
ymen
ttra
nsac
tions
and
exer
cise
ofst
ock
optio
ns..
.40
6,50
2—
7(6
)—
—1
—1
Res
truc
turi
ngof
the
Com
pany
’sow
ners
hip
inL
LC
“Sky
Mob
ile”
and
LL
P“K
aR-T
el”
(Not
e6)
....
....
....
....
....
....
....
.—
—(9
8)—
—(9
8)35
826
0
As
atD
ecem
ber
31,2
015
....
....
....
....
....
....
....
....
.1,
749,
004,
648
212
,753
667
(2,7
06)
(6,9
51)
3,76
512
93,
894
*Pl
ease
refe
rto
Not
e23
for
furt
her
desc
ript
ion
ofth
ena
ture
ofth
eac
coun
t
The
acco
mpa
nyin
gno
tes
are
anin
tegr
alpa
rtof
thes
eco
nsol
idat
edfi
nanc
ials
tate
men
ts.
F-7
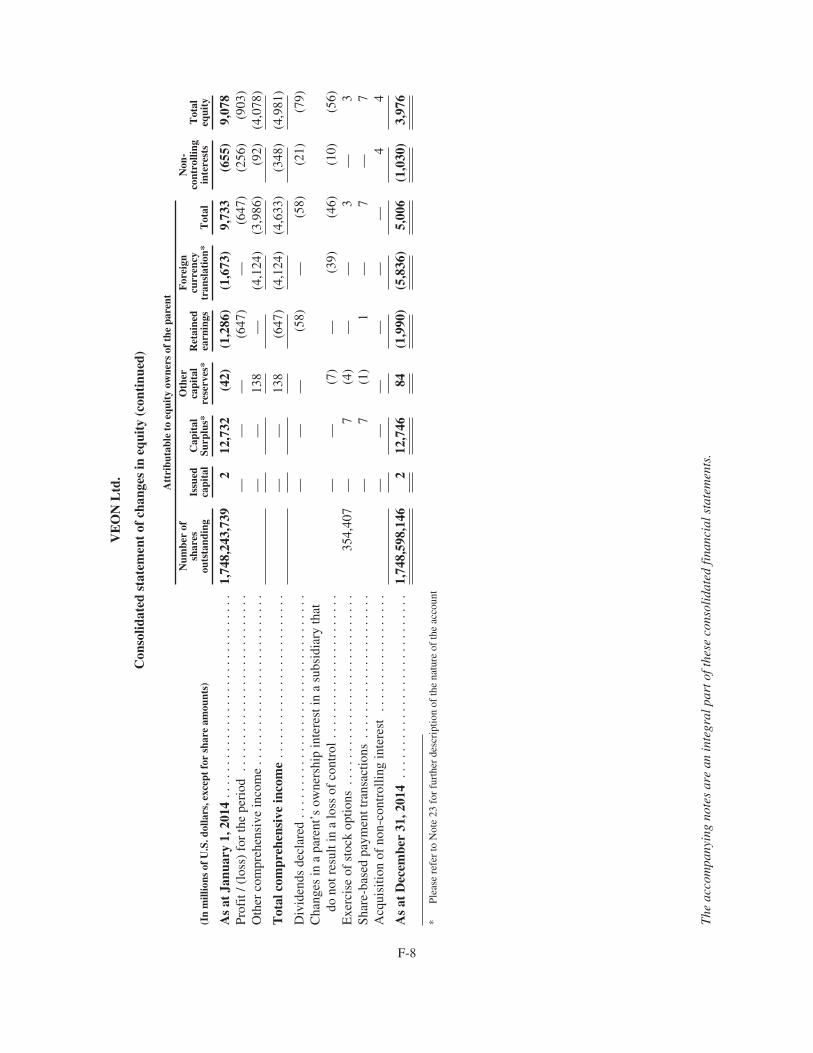
VE
ON
Ltd
.
Con
solid
ated
stat
emen
tof
chan
ges
ineq
uity
(con
tinu
ed)
Att
ribu
tabl
eto
equi
tyow
ners
ofth
epa
rent
(In
mill
ions
ofU
.S.d
olla
rs,e
xcep
tfo
rsh
are
amou
nts)
Num
ber
ofsh
ares
outs
tand
ing
Issu
edca
pita
lC
apit
alSu
rplu
s*
Oth
erca
pita
lre
serv
es*
Ret
aine
dea
rnin
gs
For
eign
curr
ency
tran
slat
ion*
Tot
al
Non
-co
ntro
lling
inte
rest
sT
otal
equi
ty
As
atJa
nuar
y1,
2014
....
....
....
....
....
....
....
...
1,74
8,24
3,73
92
12,7
32(4
2)(1
,286
)(1
,673
)9,
733
(655
)9,
078
Prof
it/(
loss
)fo
rth
epe
riod
....
....
....
....
....
....
...
——
—(6
47)
—(6
47)
(256
)(9
03)
Oth
erco
mpr
ehen
sive
inco
me
....
....
....
....
....
....
..—
—13
8—
(4,1
24)
(3,9
86)
(92)
(4,0
78)
Tot
alco
mpr
ehen
sive
inco
me
....
....
....
....
....
....
.—
—13
8(6
47)
(4,1
24)
(4,6
33)
(348
)(4
,981
)
Div
iden
dsde
clar
ed..
....
....
....
....
....
....
....
....
——
—(5
8)—
(58)
(21)
(79)
Cha
nges
ina
pare
nt’s
owne
rshi
pin
tere
stin
asu
bsid
iary
that
dono
tres
ulti
na
loss
ofco
ntro
l..
....
....
....
....
....
——
(7)
—(3
9)(4
6)(1
0)(5
6)E
xerc
ise
ofst
ock
optio
ns..
....
....
....
....
....
....
...
354,
407
—7
(4)
——
3—
3Sh
are-
base
dpa
ymen
ttra
nsac
tions
....
....
....
....
....
..—
7(1
)1
—7
—7
Acq
uisi
tion
ofno
n-co
ntro
lling
inte
rest
....
....
....
....
..—
——
——
—4
4
As
atD
ecem
ber
31,2
014
....
....
....
....
....
....
....
1,74
8,59
8,14
62
12,7
4684
(1,9
90)
(5,8
36)
5,00
6(1
,030
)3,
976
*Pl
ease
refe
rto
Not
e23
for
furt
her
desc
ript
ion
ofth
ena
ture
ofth
eac
coun
t
The
acco
mpa
nyin
gno
tes
are
anin
tegr
alpa
rtof
thes
eco
nsol
idat
edfi
nanc
ials
tate
men
ts.
F-8
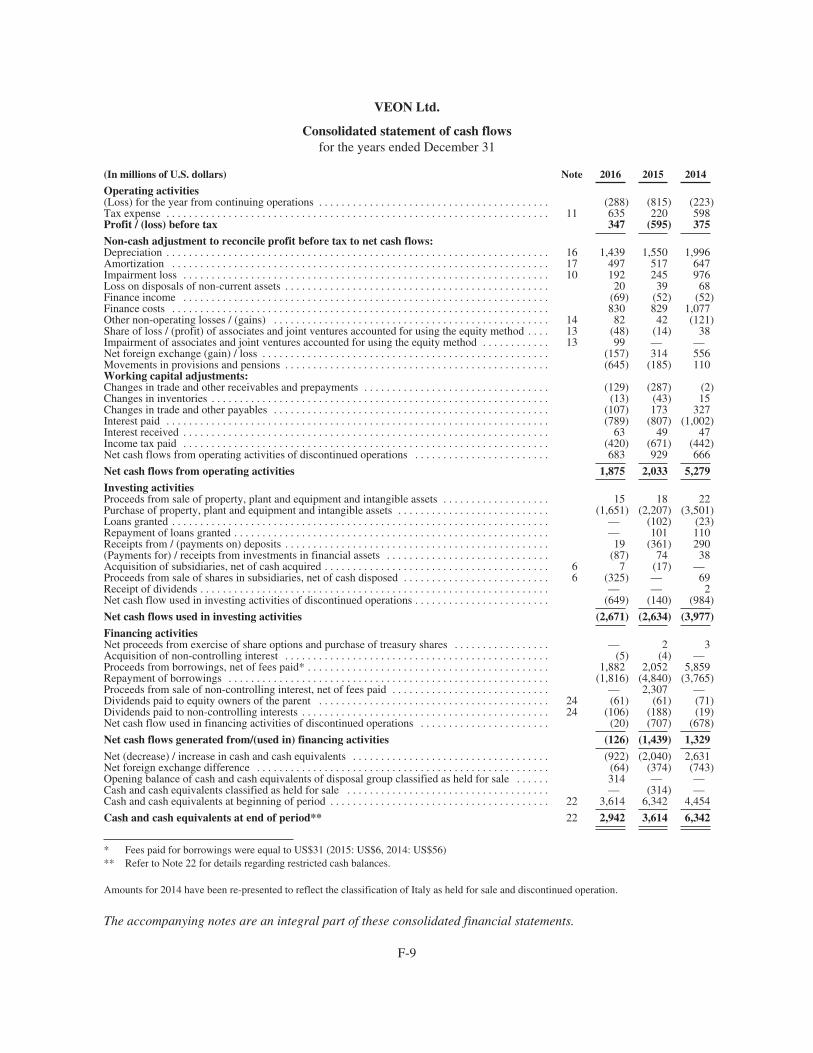
VEON Ltd.
Consolidated statement of cash flowsfor the years ended December 31
(In millions of U.S. dollars) Note 2016 2015 2014
Operating activities(Loss) for the year from continuing operations . . . . . . . . . . . . . . . . . . . . . . . . . . . . . . . . . . . . . . . . . (288) (815) (223)Tax expense . . . . . . . . . . . . . . . . . . . . . . . . . . . . . . . . . . . . . . . . . . . . . . . . . . . . . . . . . . . . . . . . . . . . 11 635 220 598Profit / (loss) before tax 347 (595) 375
Non-cash adjustment to reconcile profit before tax to net cash flows:Depreciation . . . . . . . . . . . . . . . . . . . . . . . . . . . . . . . . . . . . . . . . . . . . . . . . . . . . . . . . . . . . . . . . . . . . 16 1,439 1,550 1,996Amortization . . . . . . . . . . . . . . . . . . . . . . . . . . . . . . . . . . . . . . . . . . . . . . . . . . . . . . . . . . . . . . . . . . . 17 497 517 647Impairment loss . . . . . . . . . . . . . . . . . . . . . . . . . . . . . . . . . . . . . . . . . . . . . . . . . . . . . . . . . . . . . . . . . 10 192 245 976Loss on disposals of non-current assets . . . . . . . . . . . . . . . . . . . . . . . . . . . . . . . . . . . . . . . . . . . . . . . 20 39 68Finance income . . . . . . . . . . . . . . . . . . . . . . . . . . . . . . . . . . . . . . . . . . . . . . . . . . . . . . . . . . . . . . . . . (69) (52) (52)Finance costs . . . . . . . . . . . . . . . . . . . . . . . . . . . . . . . . . . . . . . . . . . . . . . . . . . . . . . . . . . . . . . . . . . . 830 829 1,077Other non-operating losses / (gains) . . . . . . . . . . . . . . . . . . . . . . . . . . . . . . . . . . . . . . . . . . . . . . . . . 14 82 42 (121)Share of loss / (profit) of associates and joint ventures accounted for using the equity method . . . . 13 (48) (14) 38Impairment of associates and joint ventures accounted for using the equity method . . . . . . . . . . . . 13 99 — —Net foreign exchange (gain) / loss . . . . . . . . . . . . . . . . . . . . . . . . . . . . . . . . . . . . . . . . . . . . . . . . . . . (157) 314 556Movements in provisions and pensions . . . . . . . . . . . . . . . . . . . . . . . . . . . . . . . . . . . . . . . . . . . . . . . (645) (185) 110Working capital adjustments:Changes in trade and other receivables and prepayments . . . . . . . . . . . . . . . . . . . . . . . . . . . . . . . . . (129) (287) (2)Changes in inventories . . . . . . . . . . . . . . . . . . . . . . . . . . . . . . . . . . . . . . . . . . . . . . . . . . . . . . . . . . . . (13) (43) 15Changes in trade and other payables . . . . . . . . . . . . . . . . . . . . . . . . . . . . . . . . . . . . . . . . . . . . . . . . . (107) 173 327Interest paid . . . . . . . . . . . . . . . . . . . . . . . . . . . . . . . . . . . . . . . . . . . . . . . . . . . . . . . . . . . . . . . . . . . . (789) (807) (1,002)Interest received . . . . . . . . . . . . . . . . . . . . . . . . . . . . . . . . . . . . . . . . . . . . . . . . . . . . . . . . . . . . . . . . . 63 49 47Income tax paid . . . . . . . . . . . . . . . . . . . . . . . . . . . . . . . . . . . . . . . . . . . . . . . . . . . . . . . . . . . . . . . . . (420) (671) (442)Net cash flows from operating activities of discontinued operations . . . . . . . . . . . . . . . . . . . . . . . . 683 929 666
Net cash flows from operating activities 1,875 2,033 5,279
Investing activitiesProceeds from sale of property, plant and equipment and intangible assets . . . . . . . . . . . . . . . . . . . 15 18 22Purchase of property, plant and equipment and intangible assets . . . . . . . . . . . . . . . . . . . . . . . . . . . (1,651) (2,207) (3,501)Loans granted . . . . . . . . . . . . . . . . . . . . . . . . . . . . . . . . . . . . . . . . . . . . . . . . . . . . . . . . . . . . . . . . . . . — (102) (23)Repayment of loans granted . . . . . . . . . . . . . . . . . . . . . . . . . . . . . . . . . . . . . . . . . . . . . . . . . . . . . . . . — 101 110Receipts from / (payments on) deposits . . . . . . . . . . . . . . . . . . . . . . . . . . . . . . . . . . . . . . . . . . . . . . . 19 (361) 290(Payments for) / receipts from investments in financial assets . . . . . . . . . . . . . . . . . . . . . . . . . . . . . (87) 74 38Acquisition of subsidiaries, net of cash acquired . . . . . . . . . . . . . . . . . . . . . . . . . . . . . . . . . . . . . . . . 6 7 (17) —Proceeds from sale of shares in subsidiaries, net of cash disposed . . . . . . . . . . . . . . . . . . . . . . . . . . 6 (325) — 69Receipt of dividends . . . . . . . . . . . . . . . . . . . . . . . . . . . . . . . . . . . . . . . . . . . . . . . . . . . . . . . . . . . . . . — — 2Net cash flow used in investing activities of discontinued operations . . . . . . . . . . . . . . . . . . . . . . . . (649) (140) (984)
Net cash flows used in investing activities (2,671) (2,634) (3,977)
Financing activitiesNet proceeds from exercise of share options and purchase of treasury shares . . . . . . . . . . . . . . . . . — 2 3Acquisition of non-controlling interest . . . . . . . . . . . . . . . . . . . . . . . . . . . . . . . . . . . . . . . . . . . . . . . (5) (4) —Proceeds from borrowings, net of fees paid* . . . . . . . . . . . . . . . . . . . . . . . . . . . . . . . . . . . . . . . . . . . 1,882 2,052 5,859Repayment of borrowings . . . . . . . . . . . . . . . . . . . . . . . . . . . . . . . . . . . . . . . . . . . . . . . . . . . . . . . . . (1,816) (4,840) (3,765)Proceeds from sale of non-controlling interest, net of fees paid . . . . . . . . . . . . . . . . . . . . . . . . . . . . — 2,307 —Dividends paid to equity owners of the parent . . . . . . . . . . . . . . . . . . . . . . . . . . . . . . . . . . . . . . . . . 24 (61) (61) (71)Dividends paid to non-controlling interests . . . . . . . . . . . . . . . . . . . . . . . . . . . . . . . . . . . . . . . . . . . . 24 (106) (188) (19)Net cash flow used in financing activities of discontinued operations . . . . . . . . . . . . . . . . . . . . . . . (20) (707) (678)
Net cash flows generated from/(used in) financing activities (126) (1,439) 1,329
Net (decrease) / increase in cash and cash equivalents . . . . . . . . . . . . . . . . . . . . . . . . . . . . . . . . . . . (922) (2,040) 2,631Net foreign exchange difference . . . . . . . . . . . . . . . . . . . . . . . . . . . . . . . . . . . . . . . . . . . . . . . . . . . . (64) (374) (743)Opening balance of cash and cash equivalents of disposal group classified as held for sale . . . . . . 314 — —Cash and cash equivalents classified as held for sale . . . . . . . . . . . . . . . . . . . . . . . . . . . . . . . . . . . . — (314) —Cash and cash equivalents at beginning of period . . . . . . . . . . . . . . . . . . . . . . . . . . . . . . . . . . . . . . . 22 3,614 6,342 4,454
Cash and cash equivalents at end of period** 22 2,942 3,614 6,342
* Fees paid for borrowings were equal to US$31 (2015: US$6, 2014: US$56)** Refer to Note 22 for details regarding restricted cash balances.
Amounts for 2014 have been re-presented to reflect the classification of Italy as held for sale and discontinued operation.
The accompanying notes are an integral part of these consolidated financial statements.
F-9
1 General information
VEON Ltd. (“VEON”, the “Company”, and together with its consolidated subsidiaries, the “Group” or“we”) was incorporated in Bermuda on June 5, 2009. The registered office of VEON is Victoria Place, 31Victoria Street, Hamilton HM 10, Bermuda. VEON’s headquarters and principal place of business is located atClaude Debussylaan 88, 1082 MD Amsterdam, the Netherlands.
The Company has changed its name from VimpelCom Ltd. to VEON Ltd., effective as of March 30, 2017.
The consolidated financial statements are presented in United States dollars (“U.S. dollar” or “US$”). Inthese notes, U.S. dollar amounts are presented in millions, except for share and per share (or AmericanDepository Share (“ADS”)) amounts and as otherwise indicated.
VEON’s ADSs are listed on the NASDAQ Global Select Market (“NASDAQ”).
Share information
As at December 31, 2016, the Company’s largest shareholders and the remaining free float are as follows:
Shareholder Common shares % of common and voting shares
L1T VIP Holdings S.à r.l. (“LetterOne”) . . . . . . . . . . . . . . . . . . . . 840,625,001 47.9%Telenor East Holding II AS (“Telenor”) . . . . . . . . . . . . . . . . . . . . . 416,703,840 23.7%Stichting Administratiekantoor Mobile Telecommunications
Investor (“Stichting”) . . . . . . . . . . . . . . . . . . . . . . . . . . . . . . . . . 145,947,562 8.3%Free Float . . . . . . . . . . . . . . . . . . . . . . . . . . . . . . . . . . . . . . . . . . . . . 353,454,732 20.1%
Total outstanding common shares . . . . . . . . . . . . . . . . . . . . . . . . 1,756,731,135 100%
Of which:Shares held by the Company or its subsidiaries (“Treasury
shares”) . . . . . . . . . . . . . . . . . . . . . . . . . . . . . . . . . . . . . . . . . . . . 7,726,487 0.4%
As at April 15, 2016, pursuant to the terms of the Company’s bye-laws, the 305,000,000 preferred sharesheld by Telenor had been redeemed by the Company at a redemption price of US$0.001 per share and are nolonger outstanding.
On September 21, 2016 and September 27, 2016, Telenor completed the sale of 142,500,000 and 21,375,000American Depositary Shares, respectively, in total representing approximately 9.3% of VEON’s total outstandingcommon shares. Further, on September 21, 2016, Telenor also issued a US$1 billion 0.25% 3-year bond that isguaranteed by the ultimate parent company of Telenor, Telenor ASA, and exchangeable under certaincircumstances for up to a total of 204,081,633 ADS of VEON.
On March 31, 2016, LetterOne announced the transfer of 145,947,562 VEON ADS (representingapproximately 8.3% of VEON’s total outstanding common shares) to Stichting Administratiekantoor MobileTelecommunications Investor. However, LetterOne is entitled to the economic benefits (dividend payments,other distributions and sale proceeds) of such common shares.
For more information related to shares of VEON please refer to Notes 23, 24 and 26.
Nature of operations and principal activities
VEON earns revenues by providing telecommunication services through a range of traditional andbroadband mobile and fixed-line technologies.
As at December 31, 2016, the Company operated telecommunications services in Russia, Pakistan, Algeria,Bangladesh, Ukraine, Uzbekistan, Kazakhstan, Armenia, Tajikistan, Georgia, Kyrgyzstan and Laos, and in Italyvia a 50/50 joint venture.
F-10
On November 5, 2016 VEON finalized the transaction of combining the operations in Italy into a new 50/50joint venture with 3 Italia S.p.A. (“3 Italia”). Please refer to Note 6 for further details in respect of thistransaction, as well as significant transactions affecting Pakistan and Zimbabwe.
During the year 2016, several local currencies demonstrated significant volatility against the U.S. dollar,which impacted the Group’s financial position and results of operations upon the translation of non-U.S. currencyamounts into U.S. dollars for consolidation purposes. In particular, in U.S. dollar terms, the devaluation of localcurrencies caused a 8% decrease in total revenue for the Group during 2016 as compared with 2015. Please referto Note 5 for further details regarding foreign currency sensitivities.
In addition, the foreign exchange rate used to translate the local currency in Uzbekistan into U.S. dollars forconsolidation purposes is an official rate published by the Central Bank of the Republic of Uzbekistan. However,this exchange rate is not achievable in expatriating funds out of the country due to restrictions imposed by thelocal government. The net assets of our business in Uzbekistan represented US$910 of the net assets in theCompany’s statement of financial position as at December 31, 2016 (US$891 as at December 31, 2015).However, if the Company applied the exchange rate implied by market transactions, rather than the exchange rateused to translate the local currency into U.S. dollars, the assets held in Uzbekistan would decrease significantly inU.S. dollar terms.
2 Basis of preparation of the consolidated financial statements
Basis of preparation
These consolidated financial statements have been prepared in accordance with International FinancialReporting Standards (“IFRS”) as issued by the International Accounting Standards Board (“IASB”), effective atthe time of preparing the consolidated financial statements and applied by VEON. The consolidated financialstatements have been prepared on a historical cost basis, unless disclosed otherwise.
The preparation of these consolidated financial statements has required management to apply accountingpolicies and methodologies based on complex and subjective judgments, estimates based on past experience andassumptions determined to be reasonable and realistic based on the related circumstances (Note 3 and Note 4).The use of these judgments, estimates and assumptions affects the amounts reported in the statement of financialposition, the income statement, statement of cash flows, statement of changes in equity, as well as the notes. Thefinal amounts for items for which estimates and assumptions were made in the consolidated financial statementsmay differ from those reported in these statements due to the uncertainties that characterize the assumptions andconditions on which the estimates are based.
Certain comparative amounts have been reclassified to conform to the current period presentation.
Basis of consolidation
The consolidated financial statements comprise the financial statements of the Company and its subsidiaries.Subsidiaries are all entities (including structured entities) over which the Company has control. Please refer toNote 12 for a list of significant subsidiaries.
Intercompany transactions, balances and unrealized gains or losses on transactions between Groupcompanies are eliminated. When necessary, amounts reported by subsidiaries have been adjusted to conform withthe Group’s accounting policies.
When the Group ceases to consolidate a subsidiary due to loss of control, the related subsidiary’s assets(including goodwill), liabilities, non-controlling interest and other components of equity are de-recognized. Thismay mean that amounts previously recognized in other comprehensive income are reclassified to profit or loss.
F-11
Any consideration received is recognized at fair value, and any investment retained is re-measured to its fairvalue and this fair value becomes the initial carrying amount for the purposes of subsequently accounting for theretained interest. Any resultant gain or loss is recognized in the income statement.
Foreign currency translation
The consolidated financial statements of the Group are presented in U.S. dollars. Each entity in the Groupdetermines its own functional currency and amounts included in the financial statements of each entity aremeasured using that functional currency.
Upon consolidation, the assets and liabilities measured in the functional currency are translated into U.S.dollars at exchange rates prevailing on the balance sheet date; whereas revenue, expenses, gains and losses aretranslated into U.S. dollars at historical exchange rates prevailing on the transaction dates. The income statementamounts are translated using the average exchange rates for the period. Translation adjustments resulting fromthe process of translating financial statements into U.S. dollars are reported in other comprehensive income, aseparate component of equity (i.e. cumulative translation adjustment).
3 Significant accounting policies that relate to the consolidated financial statements as a whole
Accounting policies are included in the relevant notes to these consolidated financial statements.
New accounting pronouncements not yet adopted by the Company
The following are significant and relevant new standards that are issued, but not yet effective, up to the dateof the issuance of the Group’s financial statements, and which have not been early adopted by the Company:
• IFRS 15, ‘Revenue from contracts with customers’ replaces IAS 18 ‘Revenue’ and IAS 11‘Construction contracts’ and related interpretations. The standard is effective for annual periodsbeginning on or after January 1, 2018. The primary impact on revenue reporting will be that when theGroup sells subsidized devices together with airtime service agreements to customers, revenueallocated to equipment and recognized when control of the device passes to the customer will increaseand revenue recognized as services are delivered will reduce. In addition, certain incremental costsincurred in acquiring a contract with a customer will be deferred in the consolidated statement offinancial position and amortized as revenue is recognized under the related contract; this will generallylead to the later recognition of charges for some commissions payable to third party dealers andemployees. The Group is continuing to assess the impact of IFRS 15, however, based on the analysisperformed so far, the Company does not expect any material impact on revenue recognition due tocurrently existing product offering (i.e. pre-paid service offering). However, the Company does expectpotential impact stemming from capitalization of costs incurred in acquiring a contract with acustomer.
• IFRS 9, ‘Financial instruments’ replaces the guidance in IAS 39 ‘Financial Instruments: Recognitionand Measurement’ regarding the classification and measurement of financial instruments. The standardis effective for accounting periods beginning on or after January 1, 2018. The Group has yet to assessthe impact of IFRS 9, which may be material impact to the consolidated income statement andconsolidated financial position upon adoption in 2018.
• IFRS 16, ‘Leases’ replaces the guidance in IAS 17 ‘Leases’ whereby the most material impact will bethe elimination of the distinction between “operating” and “finance” leases and the requirement toreport all leases within the statement of financial position. The standard is effective for accountingperiods beginning on or after January 1, 2019. The Group has yet to assess the impact of IFRS 16,which may be material to the consolidated income statement and consolidated financial position uponadoption in 2019.
F-12
4 Significant accounting judgments, estimates and assumptions
Revenue recognition
The Group’s revenue consists primarily of revenue from sale of telecommunications services and periodicsubscriptions. The Group offers customers, via multiple element agreements (‘bundles’) or otherwise, a numberof different services with different price plans, and provides discounts in various types and forms, often inconnection with different campaigns, over the contractual or average customer relationship period. Determiningthe fair value of each deliverable can require complex estimates due to the nature of the goods and servicesprovided. The Group also sells wholesale products to other operators and vendors in different countries andacross borders. Management has to make estimates related to revenue recognition, relying to some extent oninformation from other third party operators regarding values of services delivered. Management also makesestimates for the final outcome in instances where the other parties dispute the amounts charged. Furthermore,management has to estimate the average customer relationship for revenue that is initially recognized as deferredrevenue in the statement of financial position and thereafter recognized in the income statement over a futureperiod, for example, revenue from connection fees. Management also applies judgment in evaluating gross or netpresentation of revenue and associated fees. In this case, among others, the main factor is whether the Companyis considered as the primary obligor in the transactions, and the extent of latitude in establishing prices.
See Note 8 for further information regarding revenue recognized by the Company.
Impairment of non-current assets
The Group has significant investments in property and equipment, intangible assets, goodwill and otherinvestments.
Estimating recoverable amounts of assets and cash generating units (“CGUs”) must, in part, be based onmanagement’s evaluations, including the determination of the appropriate CGUs, the relevant discount rate,estimation of future performance, the revenue-generating capacity of assets, timing and amount of futurepurchases of property and equipment, assumptions of future market conditions and the long-term growth rate intoperpetuity (terminal value). In doing this, management needs to assume a market participant perspective.Changing the assumptions selected by management, in particular, the discount rate and growth rate assumptionsused to estimate the recoverable amounts of assets, could significantly impact the Group’s impairment evaluationand hence results.
A significant part of the Group’s operations is in countries with emerging markets. The political andeconomic situation in these countries may change rapidly and recession may potentially have a significant impacton these countries. On-going recessionary effects in the world economy and increased macroeconomic risksimpact our assessment of cash flow forecasts and the discount rates applied.
There are significant variations between different markets with respect to growth, mobile penetration,average revenue per user (“ARPU”), market share and similar parameters, resulting in differences in operatingmargins. The future development of operating margins is important in the Group’s impairment assessments, andthe long-term estimates of these margins are highly uncertain. In particular, this is the case for emerging marketsthat are still not in a mature phase.
See Note 10 for further information regarding the results of impairment testing for goodwill and othernon-current assets.
F-13
Investment in Italy Joint Venture
On August 6, 2015, VEON entered into an agreement with CK Hutchison Holdings to establish a jointventure under which they would jointly own and operate the 3 Italia and WIND businesses in Italy. Thecompletion of the transaction resulted in the Company contributing the entire Wind Acquisition Holding Finance(“WAHF”) Group into VIP-CKH Luxembourg S.à.r.l in exchange for:
• 50% of the issued share capital of VIP-CKH Luxembourg S.à.r.l and its subsidiaries (which hold thecombined businesses of WIND and 3 Italia and includes a EUR 5,114 million Shareholder Loanpayable); and
• a 50% investment in newly incorporated financing entity, VIP-CKH Ireland Limited (which includesthe EUR 5,114 million Shareholder Loan receivable).
(together, the “Italy Joint Venture”).
Both joint arrangements are classified as joint ventures in accordance with IFRS 11 ‘Joint Arrangements’,based on the following:
• The legal structure of the arrangement and the legal rights and obligations arise from the limitedliability company, which grant equal shareholdings and profit rights to the shareholders;
• The activities relevant for the purposes of determining control require unanimous consent from bothshareholders, and the decisions to be made by the Board are deemed to be operational in nature toensure smooth daily decisions.
In this context, it was also concluded that the investment in the two joint ventures shall be considered to beaccounted for in the aggregate, rather than as two separate joint ventures. A key consideration in thisdetermination was the shareholder agreement which stipulates that decisions about the activities of the jointventures (including dividend distributions and shareholder loan repayments) require unanimous consent fromboth shareholders. This conclusion required substantial judgment as to the application of accounting guidance.Refer Note 6 and Note 13 for more details regarding the Company’s investment in the Italy Joint Venture.
Control over subsidiaries
Subsidiaries, which are those entities over which the Company is deemed to have control, are consolidated.The Company controls an entity when the Company is exposed to, or has rights to, variable returns from itsinvolvement with the entity and has the ability to affect those returns through its power over the entity. In certaincircumstances, significant judgment is required to assess if the Company is deemed to have control over entitieswhere the Company’s ownership interest does not exceed 50%. See Note 12 for further information regarding theCompany’s subsidiaries.
Depreciation and amortization of non-current assets
Depreciation and amortization expenses are based on management estimates of useful life, residual valueand amortization method of property and equipment and intangible assets. Estimates may change due totechnological developments, competition, changes in market conditions and other factors and may result inchanges in the estimated useful life and in the amortization or depreciation charges. Technological developmentsare difficult to predict and our views on the trends and pace of development may change over time. Some of theassets and technologies, in which the Group invested several years ago, are still in use and provide the basis fornew technologies. Significant estimates in the evaluation of useful lives for intangible assets include, but are notlimited to, the estimated average customer relationship based on churn, the remaining license or concessionperiod and the expected developments in technology and markets.
The useful lives of property and equipment and intangible assets are reviewed at least annually, taking intoconsideration the factors mentioned above and all other relevant factors. Estimated useful lives for similar typesof assets may vary between different entities in the Group due to local factors such as growth rate, maturity of the
F-14
market, historical and expected replacements or transfer of assets and quality of components used. The actualeconomic lives of intangible assets may be different than estimated useful lives, thereby resulting in a differentcarrying value of intangible assets with finite lives. We continue to evaluate the amortization period forintangible assets with finite lives to determine whether events or circumstances warrant revised amortizationperiods. A change in estimated useful lives is a change in accounting estimate, and depreciation and amortizationcharges are adjusted prospectively.
See Note 16 and Note 17 for further information regarding property and equipment and intangible assetsrespectively.
Deferred tax assets and uncertain tax positions
Deferred tax assets are recognized to the extent that it is probable that the assets will be realized. Significantjudgment is required to determine the amount that can be recognized and depends foremost on the expectedtiming, level of taxable profits, tax planning strategies and the existence of taxable temporary differences.Estimates made relate primarily to losses carried forward in some of the Group’s foreign operations. When anentity has a history of recent losses, the deferred tax asset arising from unused tax losses is recognized only to theextent that there is convincing evidence that sufficient future taxable profit will be generated. Estimated futuretaxable profit is not considered such evidence unless that entity has demonstrated the ability by generatingsignificant taxable profit for the current year or there are certain other events providing sufficient evidence offuture taxable profit. New transactions and the introduction of new tax rules may also affect judgments due touncertainty concerning the interpretation of the rules and any transitional rules.
Uncertain tax positions are recognized when it is probable that a tax position will not be sustained and theamount can be reliably measured. The expected resolution of uncertain tax positions is based upon management’sjudgment of the likelihood of sustaining a position taken through tax audits, tax courts and/or arbitration, ifnecessary. Circumstances and interpretations of the amount or likelihood of sustaining a position may changethrough the settlement process. Furthermore, the resolution of uncertain tax positions is not always within thecontrol of the Group and it is often dependent on the efficiency of the legal processes in the relevant taxingjurisdictions in which the Group operates. Issues can, and often do, take many years to resolve.
See Note 11 and Note 27 for further information.
Fair value of financial instruments
Where the fair value of financial assets and financial liabilities recorded in the statement of financialposition cannot be derived from active markets, their fair value is determined using valuation techniques,including discounted cash flow models. The inputs to these models are taken from observable markets wherepossible, but when this is not feasible, a degree of judgment is required in establishing fair values. The judgmentsinclude considerations of inputs such as liquidity risk, credit risk and volatility. Changes in assumptions aboutthese factors could affect the reported fair value of financial instruments. See Note 18 for further informationregarding financial assets and liabilities.
Provisions
The Group is involved in various legal proceedings, disputes and claims, including regulatory discussionsrelated to the Group’s business, licenses, tax positions and investments, and the outcomes of these are subject tosignificant uncertainty. Management evaluates, among other factors, the degree of probability of an unfavorableoutcome and the ability to make a reasonable estimate of the amount of loss. Unanticipated events or changes inthese factors may require the Group to increase or decrease the amount recorded for a matter that has not beenpreviously recorded because it was not considered probable.
F-15
For certain operations in emerging markets, the Group is involved in various regulatory discussions.Management’s estimates relating to regulatory discussions in these countries involve a high level of uncertainty.See Note 25 and Note 27 for further information.
5 Financial risk management
The Group’s principal financial liabilities, other than derivatives, consist of loans and borrowings and tradeand other payables. The main purpose of these financial liabilities is to finance the Group’s operations. TheGroup has trade and other receivables, and cash and short-term deposits that are derived directly from itsoperations. The Company views derivative instruments as risk management tools and does not use them fortrading or speculative purposes.
The Group is exposed to market risk, credit risk and liquidity risk.
The Company’s Management Board oversees the management of these risks. The Company’s ManagementBoard is supported by the treasury department who advises on financial risks and the appropriate financial riskgovernance framework for the Company. The Finance and Strategy Committee provides assurance to theCompany’s Management Board that the Group’s financial risk management activities are governed byappropriate policies and procedures, and that financial risks are identified, measured and managed in accordancewith Group policies and the Group’s risk appetite. All derivative activities for risk management purposes arecarried out by specialist teams with appropriate skills, experience and supervision.
The Group Chief Executive Officer, the Group Chief Financial Officer (“CFO”) and other seniormanagement of the Company review and agree on policies for managing each of these risks, which aresummarized below.
Market risk
Market risk is the risk that the fair value or future cash flows of a financial instrument will fluctuate becauseof changes in market prices. Market risk comprises interest rate risk and foreign currency risk.
Interest rate risk
Interest rate risk is the risk that the fair value or future cash flows of a financial instrument will fluctuatebecause of changes in market interest rates. The Company’s exposure to the risk of changes in market interestrates relates primarily to the Company’s long-term debt obligations with floating interest rates. The Companymanages its interest rate risk exposure by having a balanced portfolio of fixed and variable rate loans andborrowings and through hedging activities.
At December 31, 2016, after taking into account the effect of interest rate swaps, approximately 81% of theCompany’s borrowings are at a fixed rate of interest (2015: 77%).
F-16
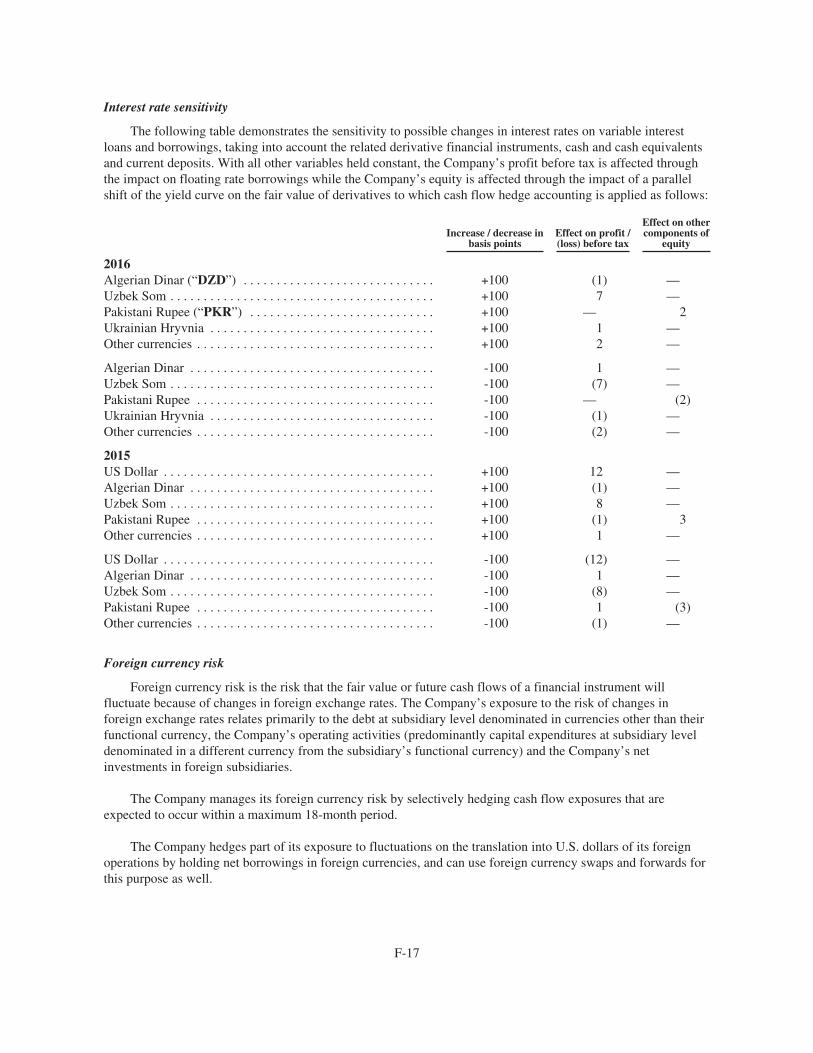
Interest rate sensitivity
The following table demonstrates the sensitivity to possible changes in interest rates on variable interestloans and borrowings, taking into account the related derivative financial instruments, cash and cash equivalentsand current deposits. With all other variables held constant, the Company’s profit before tax is affected throughthe impact on floating rate borrowings while the Company’s equity is affected through the impact of a parallelshift of the yield curve on the fair value of derivatives to which cash flow hedge accounting is applied as follows:
Increase / decrease inbasis points
Effect on profit /(loss) before tax
Effect on othercomponents of
equity
2016Algerian Dinar (“DZD”) . . . . . . . . . . . . . . . . . . . . . . . . . . . . . +100 (1) —Uzbek Som . . . . . . . . . . . . . . . . . . . . . . . . . . . . . . . . . . . . . . . . +100 7 —Pakistani Rupee (“PKR”) . . . . . . . . . . . . . . . . . . . . . . . . . . . . +100 — 2Ukrainian Hryvnia . . . . . . . . . . . . . . . . . . . . . . . . . . . . . . . . . . +100 1 —Other currencies . . . . . . . . . . . . . . . . . . . . . . . . . . . . . . . . . . . . +100 2 —
Algerian Dinar . . . . . . . . . . . . . . . . . . . . . . . . . . . . . . . . . . . . . -100 1 —Uzbek Som . . . . . . . . . . . . . . . . . . . . . . . . . . . . . . . . . . . . . . . . -100 (7) —Pakistani Rupee . . . . . . . . . . . . . . . . . . . . . . . . . . . . . . . . . . . . -100 — (2)Ukrainian Hryvnia . . . . . . . . . . . . . . . . . . . . . . . . . . . . . . . . . . -100 (1) —Other currencies . . . . . . . . . . . . . . . . . . . . . . . . . . . . . . . . . . . . -100 (2) —
2015US Dollar . . . . . . . . . . . . . . . . . . . . . . . . . . . . . . . . . . . . . . . . . +100 12 —Algerian Dinar . . . . . . . . . . . . . . . . . . . . . . . . . . . . . . . . . . . . . +100 (1) —Uzbek Som . . . . . . . . . . . . . . . . . . . . . . . . . . . . . . . . . . . . . . . . +100 8 —Pakistani Rupee . . . . . . . . . . . . . . . . . . . . . . . . . . . . . . . . . . . . +100 (1) 3Other currencies . . . . . . . . . . . . . . . . . . . . . . . . . . . . . . . . . . . . +100 1 —
US Dollar . . . . . . . . . . . . . . . . . . . . . . . . . . . . . . . . . . . . . . . . . -100 (12) —Algerian Dinar . . . . . . . . . . . . . . . . . . . . . . . . . . . . . . . . . . . . . -100 1 —Uzbek Som . . . . . . . . . . . . . . . . . . . . . . . . . . . . . . . . . . . . . . . . -100 (8) —Pakistani Rupee . . . . . . . . . . . . . . . . . . . . . . . . . . . . . . . . . . . . -100 1 (3)Other currencies . . . . . . . . . . . . . . . . . . . . . . . . . . . . . . . . . . . . -100 (1) —
Foreign currency risk
Foreign currency risk is the risk that the fair value or future cash flows of a financial instrument willfluctuate because of changes in foreign exchange rates. The Company’s exposure to the risk of changes inforeign exchange rates relates primarily to the debt at subsidiary level denominated in currencies other than theirfunctional currency, the Company’s operating activities (predominantly capital expenditures at subsidiary leveldenominated in a different currency from the subsidiary’s functional currency) and the Company’s netinvestments in foreign subsidiaries.
The Company manages its foreign currency risk by selectively hedging cash flow exposures that areexpected to occur within a maximum 18-month period.
The Company hedges part of its exposure to fluctuations on the translation into U.S. dollars of its foreignoperations by holding net borrowings in foreign currencies, and can use foreign currency swaps and forwards forthis purpose as well.
F-17
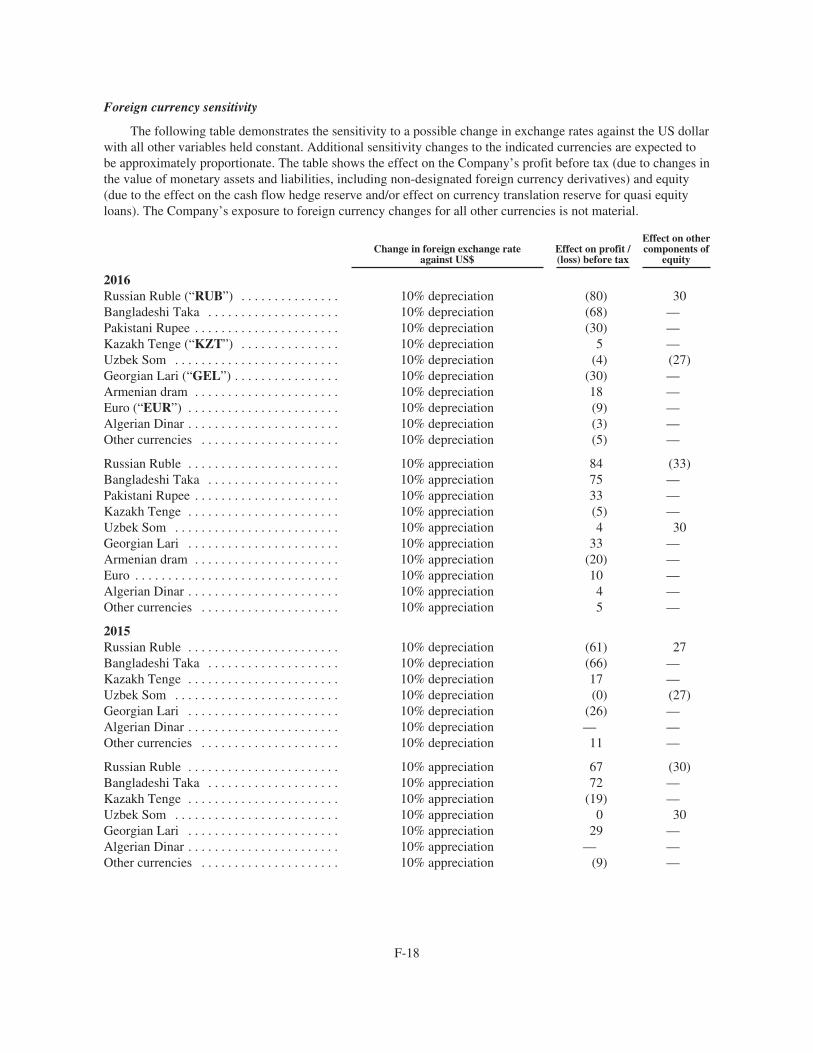
Foreign currency sensitivity
The following table demonstrates the sensitivity to a possible change in exchange rates against the US dollarwith all other variables held constant. Additional sensitivity changes to the indicated currencies are expected tobe approximately proportionate. The table shows the effect on the Company’s profit before tax (due to changes inthe value of monetary assets and liabilities, including non-designated foreign currency derivatives) and equity(due to the effect on the cash flow hedge reserve and/or effect on currency translation reserve for quasi equityloans). The Company’s exposure to foreign currency changes for all other currencies is not material.
Change in foreign exchange rateagainst US$
Effect on profit /(loss) before tax
Effect on othercomponents of
equity
2016Russian Ruble (“RUB”) . . . . . . . . . . . . . . . 10% depreciation (80) 30Bangladeshi Taka . . . . . . . . . . . . . . . . . . . . 10% depreciation (68) —Pakistani Rupee . . . . . . . . . . . . . . . . . . . . . . 10% depreciation (30) —Kazakh Tenge (“KZT”) . . . . . . . . . . . . . . . 10% depreciation 5 —Uzbek Som . . . . . . . . . . . . . . . . . . . . . . . . . 10% depreciation (4) (27)Georgian Lari (“GEL”) . . . . . . . . . . . . . . . . 10% depreciation (30) —Armenian dram . . . . . . . . . . . . . . . . . . . . . . 10% depreciation 18 —Euro (“EUR”) . . . . . . . . . . . . . . . . . . . . . . . 10% depreciation (9) —Algerian Dinar . . . . . . . . . . . . . . . . . . . . . . . 10% depreciation (3) —Other currencies . . . . . . . . . . . . . . . . . . . . . 10% depreciation (5) —
Russian Ruble . . . . . . . . . . . . . . . . . . . . . . . 10% appreciation 84 (33)Bangladeshi Taka . . . . . . . . . . . . . . . . . . . . 10% appreciation 75 —Pakistani Rupee . . . . . . . . . . . . . . . . . . . . . . 10% appreciation 33 —Kazakh Tenge . . . . . . . . . . . . . . . . . . . . . . . 10% appreciation (5) —Uzbek Som . . . . . . . . . . . . . . . . . . . . . . . . . 10% appreciation 4 30Georgian Lari . . . . . . . . . . . . . . . . . . . . . . . 10% appreciation 33 —Armenian dram . . . . . . . . . . . . . . . . . . . . . . 10% appreciation (20) —Euro . . . . . . . . . . . . . . . . . . . . . . . . . . . . . . . 10% appreciation 10 —Algerian Dinar . . . . . . . . . . . . . . . . . . . . . . . 10% appreciation 4 —Other currencies . . . . . . . . . . . . . . . . . . . . . 10% appreciation 5 —
2015Russian Ruble . . . . . . . . . . . . . . . . . . . . . . . 10% depreciation (61) 27Bangladeshi Taka . . . . . . . . . . . . . . . . . . . . 10% depreciation (66) —Kazakh Tenge . . . . . . . . . . . . . . . . . . . . . . . 10% depreciation 17 —Uzbek Som . . . . . . . . . . . . . . . . . . . . . . . . . 10% depreciation (0) (27)Georgian Lari . . . . . . . . . . . . . . . . . . . . . . . 10% depreciation (26) —Algerian Dinar . . . . . . . . . . . . . . . . . . . . . . . 10% depreciation — —Other currencies . . . . . . . . . . . . . . . . . . . . . 10% depreciation 11 —
Russian Ruble . . . . . . . . . . . . . . . . . . . . . . . 10% appreciation 67 (30)Bangladeshi Taka . . . . . . . . . . . . . . . . . . . . 10% appreciation 72 —Kazakh Tenge . . . . . . . . . . . . . . . . . . . . . . . 10% appreciation (19) —Uzbek Som . . . . . . . . . . . . . . . . . . . . . . . . . 10% appreciation 0 30Georgian Lari . . . . . . . . . . . . . . . . . . . . . . . 10% appreciation 29 —Algerian Dinar . . . . . . . . . . . . . . . . . . . . . . . 10% appreciation — —Other currencies . . . . . . . . . . . . . . . . . . . . . 10% appreciation (9) —
F-18
Credit risk
Credit risk is the risk that a counterparty will not meet its obligations under a financial instrument orcustomer contract, leading to a financial loss. The Company is exposed to credit risk from its operating activities(primarily from trade receivables), and from its treasury activities, including deposits with banks and financialinstitutions, derivative financial instruments and other financial instruments. See Note 22 for further informationon restrictions on cash balances.
Trade receivables consist of amounts due from customers for airtime usage and amounts due from dealersand customers for equipment sales. In certain circumstances, VEON requires deposits as collateral for airtimeusage. In addition, VEON has introduced a prepaid service and equipment sales are typically paid in advance ofdelivery, except for equipment sold to dealers on credit terms. VEON’s credit risk arising from the services thecompany provides to customers is mitigated to a large extent due to no less than 87.9% of its active customersbeing subscribed to a prepaid service as of December 31, 2016 (2015: 94%) and, accordingly, not giving rise tocredit risk.
VEON’s credit risk arising from its trade receivables from dealers is mitigated due to the risk being spreadacross a large number of dealers. Management periodically reviews the history of payments and credit worthinessof the dealers. The Company also has receivables from other local and international operators from interconnectand roaming services provided to their customers, as well as receivables from customers using fixed-lineservices, such as business services, wholesale services and services to residents. Receivables from otheroperators for roaming services are settled through clearing houses, which helps to mitigate credit risk in thisregard.
VEON holds available cash in bank accounts, as well as other financial assets with financial institutions incountries where it operates. To manage credit risk associated with such asset holdings, VEON allocates itsavailable cash to a variety of local banks and local affiliates of international banks within the limits set forth byits treasury policy. Management periodically reviews the credit worthiness of the banks with which it holdsassets. In respect of financial instruments used by the Company’s treasury function, the aggregate credit risk theGroup may have with one counterparty is limited by reference to, amongst others, the long-term credit ratingsassigned for that counterparty by Moody’s, Fitch Ratings and Standard & Poor’s and CDS spreads of thatcounterparty. Counterparty credit limits are reviewed and approved by the Company’s CFO. The limits are set tominimize the concentration of risks and therefore mitigate financial loss through potential counterparty’s failure.
Value Added Tax (“VAT”) is recoverable from tax authorities by offsetting it against VAT payable to thetax authorities on VEON’s revenue or direct cash receipts from the tax authorities. Management periodicallyreviews the recoverability of the balance of input value added tax and believes it is fully recoverable.
VEON issues advances to a variety of its vendors of property and equipment for its network development.The contractual arrangements with the most significant vendors provide for equipment financing in respect ofcertain deliveries of equipment. VEON periodically reviews the financial position of vendors and theircompliance with the contract terms.
The Company’s maximum exposure to credit risk for the components of the statement of financial positionat December 31, 2016 and 2015 is the carrying amount as illustrated in Note 18 and Note 21.
Liquidity risk
The Company monitors its risk to a shortage of funds using a recurring liquidity planning tool. TheCompany’s objective is to maintain a balance between continuity of funding and flexibility through the use ofbank overdrafts, bank loans, debentures, preference shares, financial and operating leases. The Company’s policyis that not more than 35% of borrowings should mature in a single year. As at December 31, 2016, 27% (2015:
F-19
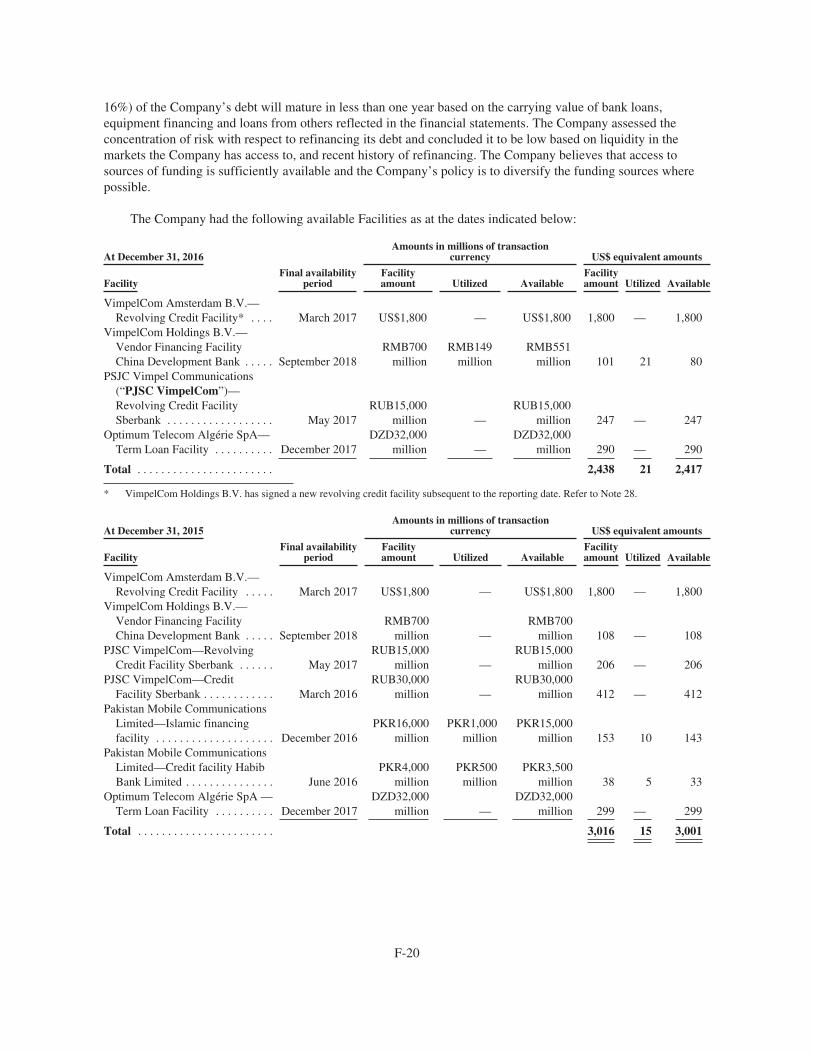
16%) of the Company’s debt will mature in less than one year based on the carrying value of bank loans,equipment financing and loans from others reflected in the financial statements. The Company assessed theconcentration of risk with respect to refinancing its debt and concluded it to be low based on liquidity in themarkets the Company has access to, and recent history of refinancing. The Company believes that access tosources of funding is sufficiently available and the Company’s policy is to diversify the funding sources wherepossible.
The Company had the following available Facilities as at the dates indicated below:
At December 31, 2016Amounts in millions of transaction
currency US$ equivalent amounts
FacilityFinal availability
periodFacilityamount Utilized Available
Facilityamount Utilized Available
VimpelCom Amsterdam B.V.—Revolving Credit Facility* . . . . March 2017 US$1,800 — US$1,800 1,800 — 1,800
VimpelCom Holdings B.V.—Vendor Financing FacilityChina Development Bank . . . . . September 2018
RMB700million
RMB149million
RMB551million 101 21 80
PSJC Vimpel Communications(“PJSC VimpelCom”)—Revolving Credit FacilitySberbank . . . . . . . . . . . . . . . . . . May 2017
RUB15,000million —
RUB15,000million 247 — 247
Optimum Telecom Algérie SpA—Term Loan Facility . . . . . . . . . . December 2017
DZD32,000million —
DZD32,000million 290 — 290
Total . . . . . . . . . . . . . . . . . . . . . . . 2,438 21 2,417
* VimpelCom Holdings B.V. has signed a new revolving credit facility subsequent to the reporting date. Refer to Note 28.
At December 31, 2015Amounts in millions of transaction
currency US$ equivalent amounts
FacilityFinal availability
periodFacilityamount Utilized Available
Facilityamount Utilized Available
VimpelCom Amsterdam B.V.—Revolving Credit Facility . . . . . March 2017 US$1,800 — US$1,800 1,800 — 1,800
VimpelCom Holdings B.V.—Vendor Financing FacilityChina Development Bank . . . . . September 2018
RMB700million —
RMB700million 108 — 108
PJSC VimpelCom—RevolvingCredit Facility Sberbank . . . . . . May 2017
RUB15,000million —
RUB15,000million 206 — 206
PJSC VimpelCom—CreditFacility Sberbank . . . . . . . . . . . . March 2016
RUB30,000million —
RUB30,000million 412 — 412
Pakistan Mobile CommunicationsLimited—Islamic financingfacility . . . . . . . . . . . . . . . . . . . . December 2016
PKR16,000million
PKR1,000million
PKR15,000million 153 10 143
Pakistan Mobile CommunicationsLimited—Credit facility HabibBank Limited . . . . . . . . . . . . . . . June 2016
PKR4,000million
PKR500million
PKR3,500million 38 5 33
Optimum Telecom Algérie SpA —Term Loan Facility . . . . . . . . . . December 2017
DZD32,000million —
DZD32,000million 299 — 299
Total . . . . . . . . . . . . . . . . . . . . . . . 3,016 15 3,001
F-20
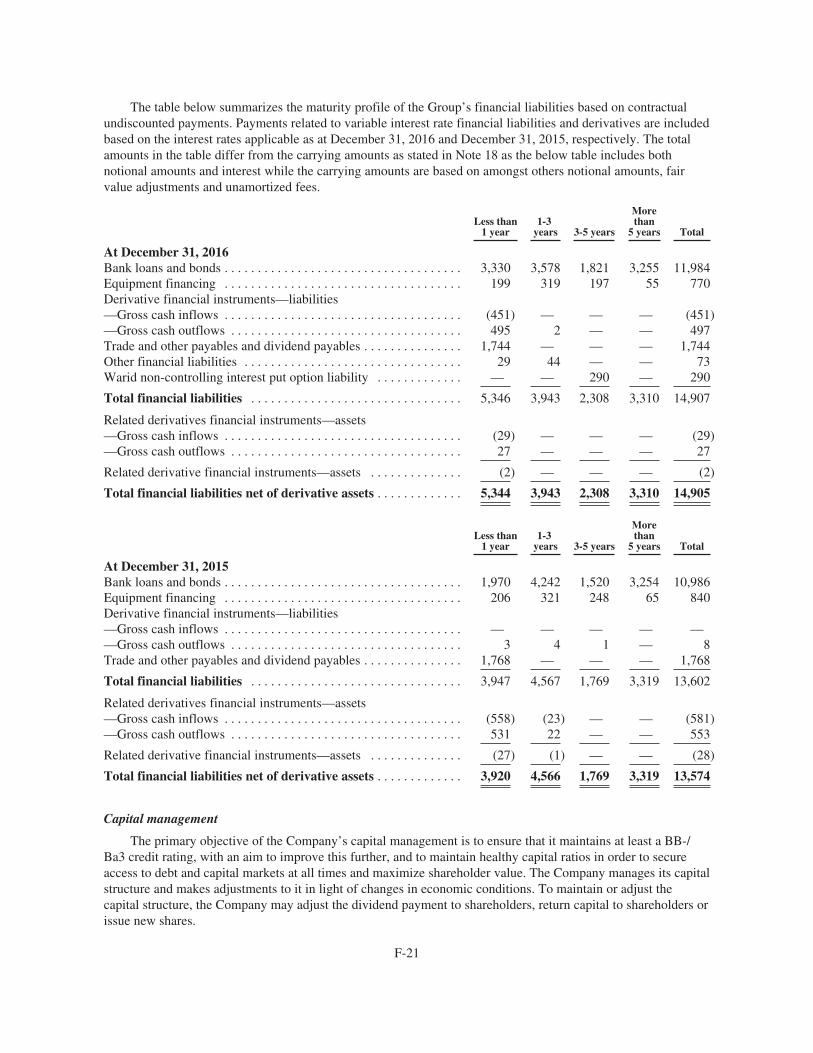
The table below summarizes the maturity profile of the Group’s financial liabilities based on contractualundiscounted payments. Payments related to variable interest rate financial liabilities and derivatives are includedbased on the interest rates applicable as at December 31, 2016 and December 31, 2015, respectively. The totalamounts in the table differ from the carrying amounts as stated in Note 18 as the below table includes bothnotional amounts and interest while the carrying amounts are based on amongst others notional amounts, fairvalue adjustments and unamortized fees.
Less than1 year
1-3years 3-5 years
Morethan
5 years Total
At December 31, 2016Bank loans and bonds . . . . . . . . . . . . . . . . . . . . . . . . . . . . . . . . . . . . 3,330 3,578 1,821 3,255 11,984Equipment financing . . . . . . . . . . . . . . . . . . . . . . . . . . . . . . . . . . . . 199 319 197 55 770Derivative financial instruments—liabilities—Gross cash inflows . . . . . . . . . . . . . . . . . . . . . . . . . . . . . . . . . . . . (451) — — — (451)—Gross cash outflows . . . . . . . . . . . . . . . . . . . . . . . . . . . . . . . . . . . 495 2 — — 497Trade and other payables and dividend payables . . . . . . . . . . . . . . . 1,744 — — — 1,744Other financial liabilities . . . . . . . . . . . . . . . . . . . . . . . . . . . . . . . . . 29 44 — — 73Warid non-controlling interest put option liability . . . . . . . . . . . . . — — 290 — 290
Total financial liabilities . . . . . . . . . . . . . . . . . . . . . . . . . . . . . . . . 5,346 3,943 2,308 3,310 14,907
Related derivatives financial instruments—assets—Gross cash inflows . . . . . . . . . . . . . . . . . . . . . . . . . . . . . . . . . . . . (29) — — — (29)—Gross cash outflows . . . . . . . . . . . . . . . . . . . . . . . . . . . . . . . . . . . 27 — — — 27
Related derivative financial instruments—assets . . . . . . . . . . . . . . (2) — — — (2)
Total financial liabilities net of derivative assets . . . . . . . . . . . . . 5,344 3,943 2,308 3,310 14,905
Less than1 year
1-3years 3-5 years
Morethan
5 years Total
At December 31, 2015Bank loans and bonds . . . . . . . . . . . . . . . . . . . . . . . . . . . . . . . . . . . . 1,970 4,242 1,520 3,254 10,986Equipment financing . . . . . . . . . . . . . . . . . . . . . . . . . . . . . . . . . . . . 206 321 248 65 840Derivative financial instruments—liabilities—Gross cash inflows . . . . . . . . . . . . . . . . . . . . . . . . . . . . . . . . . . . . — — — — ——Gross cash outflows . . . . . . . . . . . . . . . . . . . . . . . . . . . . . . . . . . . 3 4 1 — 8Trade and other payables and dividend payables . . . . . . . . . . . . . . . 1,768 — — — 1,768
Total financial liabilities . . . . . . . . . . . . . . . . . . . . . . . . . . . . . . . . 3,947 4,567 1,769 3,319 13,602
Related derivatives financial instruments—assets—Gross cash inflows . . . . . . . . . . . . . . . . . . . . . . . . . . . . . . . . . . . . (558) (23) — — (581)—Gross cash outflows . . . . . . . . . . . . . . . . . . . . . . . . . . . . . . . . . . . 531 22 — — 553
Related derivative financial instruments—assets . . . . . . . . . . . . . . (27) (1) — — (28)
Total financial liabilities net of derivative assets . . . . . . . . . . . . . 3,920 4,566 1,769 3,319 13,574
Capital management
The primary objective of the Company’s capital management is to ensure that it maintains at least a BB-/Ba3 credit rating, with an aim to improve this further, and to maintain healthy capital ratios in order to secureaccess to debt and capital markets at all times and maximize shareholder value. The Company manages its capitalstructure and makes adjustments to it in light of changes in economic conditions. To maintain or adjust thecapital structure, the Company may adjust the dividend payment to shareholders, return capital to shareholders orissue new shares.
F-21
No changes were made in the objectives, policies or processes for managing capital during the years endedDecember 31, 2016 and December 31, 2015. In February 2017, our Supervisory Board approved a dividendpolicy pursuant to which from 2016 the Company aims to pay a sustainable and progressive dividend based onthe evolution of the Company’s equity free cash flow, which is defined as net cash flow from operating activitiesless net cash used in investing activities, as reported in the consolidated financial statements.
The Net Debt to Adjusted EBITDA ratio is an important measure used by the Company to assess its capitalstructure in light of maintaining a strong credit rating. Further, this ratio is included as a financial covenant in thecredit facilities of VimpelCom Amsterdam B.V. and VimpelCom Holdings B.V.. Net Debt represents the amountof interest-bearing debt at amortized costs and guarantees given less cash and cash equivalents and current andnon-current bank deposits adjusted for derivatives designated as hedges. Adjusted EBITDA is defined asearnings before interest, tax, depreciation, amortization and impairment, loss on disposals of non-current assets,other non-operating losses and share of profit / (loss) of joint ventures. For reconciliation of Adjusted EBITDA toProfit before tax please refer to Note 7.
For most facilities entered into by VimpelCom Amsterdam B.V. and VimpelCom Holdings B.V., Net Debtwill be calculated as Total Debt of VEON Ltd., VimpelCom Amsterdam B.V. and VimpelCom Holdings B.V.and its consolidated subsidiaries minus Cash and Cash Equivalent Investments of VimpelCom Holdings B.V. ona consolidated basis.
Adjusted EBITDA will be calculated at the VimpelCom Holdings B.V. on a consolidated basis and“pro-forma” adjusted for acquisitions and divestments of any business bought or sold during the relevant period.The required Net Debt to Adjusted EBITDA ratio is 3.5x. As at December 31, 2016 and 2015 the Net Debt toAdjusted EBITDA ratio was 2.1x and 1.4x, respectively.
For a discussion on how the Net Debt to Adjusted EBITDA ratio is calculated under the new multi-currencyterm and revolving facilities of up to US$2,250, entered into subsequent to the reporting date, please refer toNote 28.
Certain of the credit facilities of VimpelCom Amsterdam B.V. and VimpelCom Holdings B.V. also containfinancial covenants with respect to the Net Debt to Adjusted EBITDA ratio relevant to the Company’s Russiansubsidiary PJSC VimpelCom, which holds and/or guarantees a major part of the debt of the Company. Therequired ratio for PJSC VimpelCom is <3.5x (2015: <3.5x) in the relevant financings of VimpelCom AmsterdamB.V. and VimpelCom Holdings B.V.. As at December 31, 2016 and 2015 the Net Debt to Adjusted EBITDAratio for PJSC VimpelCom was 3.1x and 2.6x, respectively. The ratio is calculated based on the consolidatedfinancial statements of PJSC VimpelCom prepared under IFRS in Russian rubles as translated into U.S. Dollars.
6 Significant transactions
Accounting policies
Business combinations
Business combinations are accounted for using the acquisition method. The cost of the acquisition ismeasured as the aggregate of the fair values at the date of exchange of assets given, liabilities incurred orassumed and equity instruments issued by the Group.
The acquiree’s identifiable assets and liabilities are recognized at their fair values at the acquisition date.Determining the fair value of assets acquired and liabilities assumed requires the use of significant estimates andassumptions, among other items, including assumptions with respect to future cash inflows and outflows,discount rates and other characteristics of the asset or liability that a market participant would take into accountwhen pricing the asset or liability at measurement date. The results of operations of acquired businesses areincluded in the consolidated financial statements from the date of acquisition.
F-22
For each business combination, VEON elects whether to measure the non-controlling interest in the acquireeat fair value or at the proportionate share in the recognized amounts of the acquiree’s identifiable net assets.Acquisition costs are expensed as incurred in the income statement.
Goodwill is measured as the excess of the sum of the consideration transferred, the amount of anynon-controlling interests in the acquiree and the fair value of the Group’s previously held equity interest in theacquiree, if any, over the net amounts of identifiable assets acquired and liabilities assumed at the acquisitiondate.
The Group may enter into business combinations which include options (call, put, or a combination of both)over the shares of the non-controlling interest. The Group considers such options to assess possible implicationson control, if any.
Transactions with non-controlling interests that do not result in loss of control
Transactions with non-controlling interests that do not result in loss of control are accounted for as equitytransactions—that is, as transactions with the owners in their capacity as owners. The difference between fairvalue of any consideration paid and the relevant share acquired of the carrying value of net assets of thesubsidiary is recorded in equity. Gains or losses on disposals to non-controlling interests are also recorded inequity.
Non-current assets (or disposal groups) held for sale and discontinued operations
Non-current assets (or disposal groups) are classified as held for sale if their carrying amount will berecovered principally through a sale transaction or loss of control rather than through continuing use, and a sale isconsidered highly probable. They are measured at the lower of their carrying amount and fair value less costs tosell.
Non-current assets (including those that are part of a disposal group) are not depreciated or amortized whilethey are classified as held for sale.
Assets and liabilities of a disposal group classified as held for sale are presented separately from the otherassets and liabilities in the statement of financial position.
A discontinued operation is a component that is classified as held for sale and that represents a separatemajor line of business or geographical area of operations.
Discontinued operations are excluded from the results of continuing operations and are presented as a singleamount in the income statement. All other notes to the financial statements include amounts for continuingoperations, unless otherwise mentioned.
Transactions during 2016
Joint venture in Italy
The Company signed an agreement with Hutchison Europe Telecommunications Sarl, a wholly-ownedsubsidiary of CK Hutchison Holdings Ltd (“HET”), which indirectly owns 100% of Italian mobile operator 3Italia, on August 6, 2015 to combine its operations in Italy with 3 Italia in a 50/50 joint venture. As a result of theexpected loss of control from the agreement, the Company classified its operations in Italy as an asset held forsale and discontinued operation in the consolidated financial statements.
The transaction was successfully completed on November 5, 2016 following satisfaction of the necessaryconditions precedent, which included receipt of approvals from the European Commission and the Italian
F-23
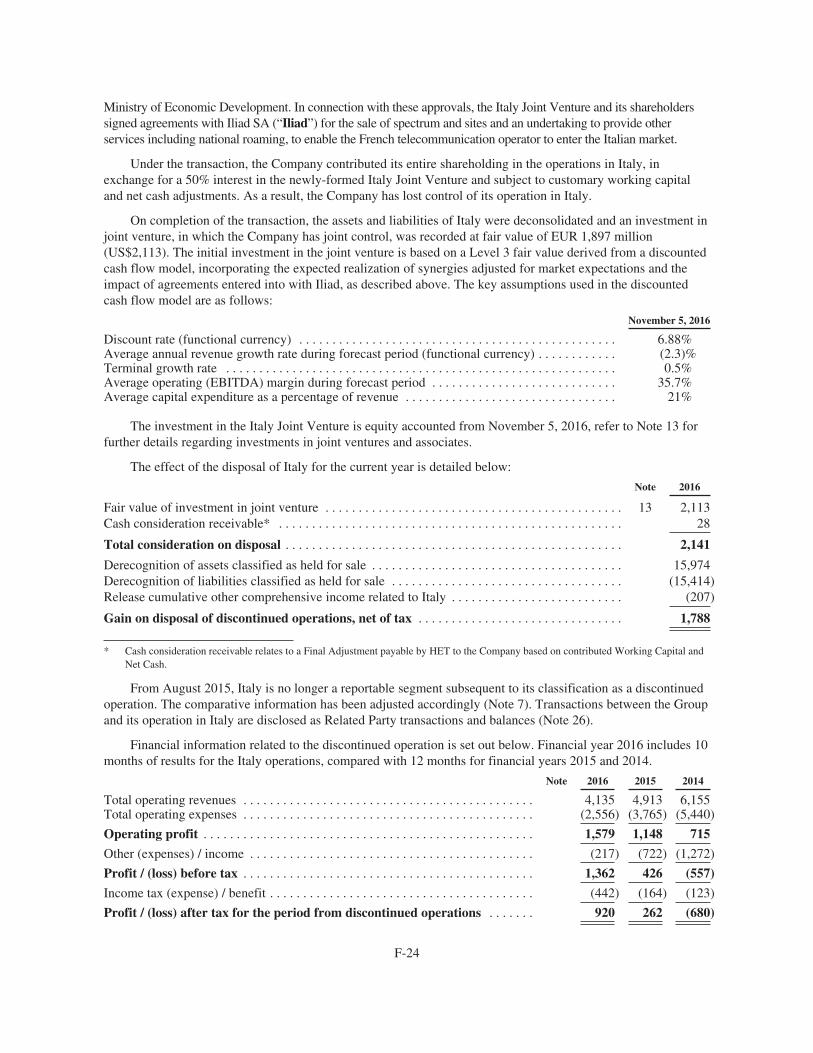
Ministry of Economic Development. In connection with these approvals, the Italy Joint Venture and its shareholderssigned agreements with Iliad SA (“Iliad”) for the sale of spectrum and sites and an undertaking to provide otherservices including national roaming, to enable the French telecommunication operator to enter the Italian market.
Under the transaction, the Company contributed its entire shareholding in the operations in Italy, inexchange for a 50% interest in the newly-formed Italy Joint Venture and subject to customary working capitaland net cash adjustments. As a result, the Company has lost control of its operation in Italy.
On completion of the transaction, the assets and liabilities of Italy were deconsolidated and an investment injoint venture, in which the Company has joint control, was recorded at fair value of EUR 1,897 million(US$2,113). The initial investment in the joint venture is based on a Level 3 fair value derived from a discountedcash flow model, incorporating the expected realization of synergies adjusted for market expectations and theimpact of agreements entered into with Iliad, as described above. The key assumptions used in the discountedcash flow model are as follows:
November 5, 2016
Discount rate (functional currency) . . . . . . . . . . . . . . . . . . . . . . . . . . . . . . . . . . . . . . . . . . . . . . . . 6.88%Average annual revenue growth rate during forecast period (functional currency) . . . . . . . . . . . . (2.3)%Terminal growth rate . . . . . . . . . . . . . . . . . . . . . . . . . . . . . . . . . . . . . . . . . . . . . . . . . . . . . . . . . . . 0.5%Average operating (EBITDA) margin during forecast period . . . . . . . . . . . . . . . . . . . . . . . . . . . . 35.7%Average capital expenditure as a percentage of revenue . . . . . . . . . . . . . . . . . . . . . . . . . . . . . . . . 21%
The investment in the Italy Joint Venture is equity accounted from November 5, 2016, refer to Note 13 forfurther details regarding investments in joint ventures and associates.
The effect of the disposal of Italy for the current year is detailed below:
Note 2016
Fair value of investment in joint venture . . . . . . . . . . . . . . . . . . . . . . . . . . . . . . . . . . . . . . . . . . . . . 13 2,113Cash consideration receivable* . . . . . . . . . . . . . . . . . . . . . . . . . . . . . . . . . . . . . . . . . . . . . . . . . . . . 28
Total consideration on disposal . . . . . . . . . . . . . . . . . . . . . . . . . . . . . . . . . . . . . . . . . . . . . . . . . . . 2,141
Derecognition of assets classified as held for sale . . . . . . . . . . . . . . . . . . . . . . . . . . . . . . . . . . . . . . 15,974Derecognition of liabilities classified as held for sale . . . . . . . . . . . . . . . . . . . . . . . . . . . . . . . . . . . (15,414)Release cumulative other comprehensive income related to Italy . . . . . . . . . . . . . . . . . . . . . . . . . . (207)
Gain on disposal of discontinued operations, net of tax . . . . . . . . . . . . . . . . . . . . . . . . . . . . . . . 1,788
* Cash consideration receivable relates to a Final Adjustment payable by HET to the Company based on contributed Working Capital andNet Cash.
From August 2015, Italy is no longer a reportable segment subsequent to its classification as a discontinuedoperation. The comparative information has been adjusted accordingly (Note 7). Transactions between the Groupand its operation in Italy are disclosed as Related Party transactions and balances (Note 26).
Financial information related to the discontinued operation is set out below. Financial year 2016 includes 10months of results for the Italy operations, compared with 12 months for financial years 2015 and 2014.
Note 2016 2015 2014
Total operating revenues . . . . . . . . . . . . . . . . . . . . . . . . . . . . . . . . . . . . . . . . . . . . 4,135 4,913 6,155Total operating expenses . . . . . . . . . . . . . . . . . . . . . . . . . . . . . . . . . . . . . . . . . . . . (2,556) (3,765) (5,440)
Operating profit . . . . . . . . . . . . . . . . . . . . . . . . . . . . . . . . . . . . . . . . . . . . . . . . . . 1,579 1,148 715
Other (expenses) / income . . . . . . . . . . . . . . . . . . . . . . . . . . . . . . . . . . . . . . . . . . . (217) (722) (1,272)
Profit / (loss) before tax . . . . . . . . . . . . . . . . . . . . . . . . . . . . . . . . . . . . . . . . . . . . 1,362 426 (557)
Income tax (expense) / benefit . . . . . . . . . . . . . . . . . . . . . . . . . . . . . . . . . . . . . . . . (442) (164) (123)
Profit / (loss) after tax for the period from discontinued operations . . . . . . . 920 262 (680)
F-24
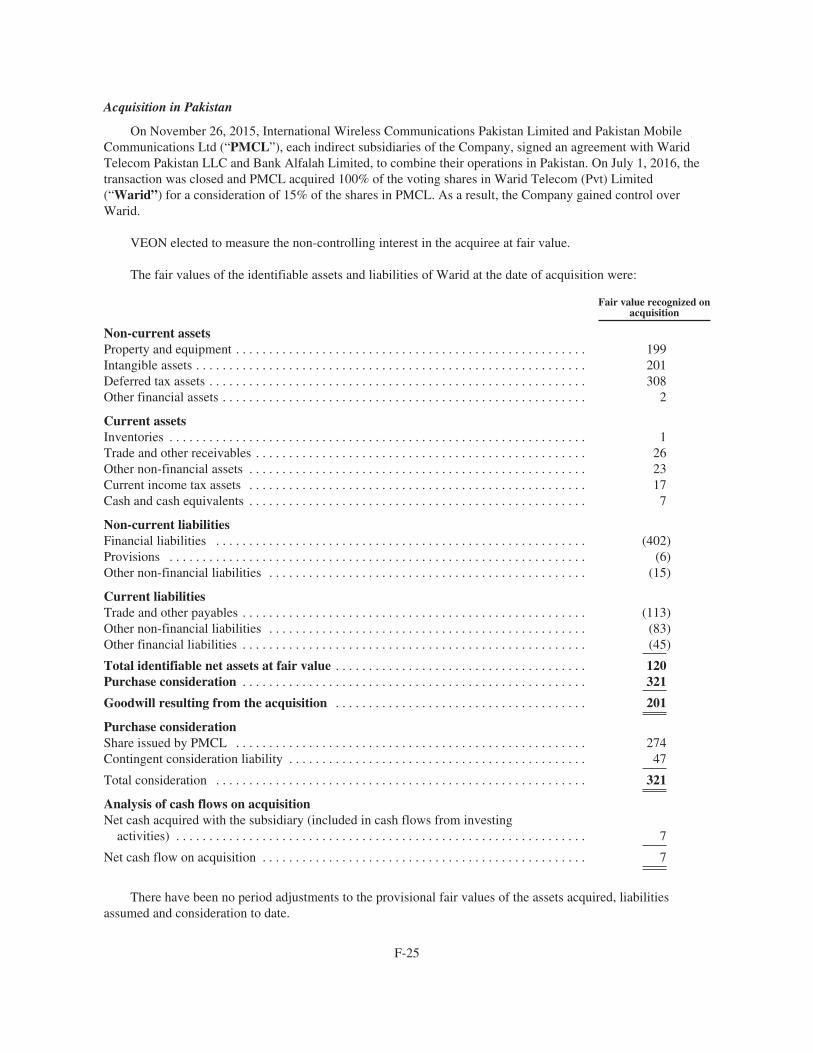
Acquisition in Pakistan
On November 26, 2015, International Wireless Communications Pakistan Limited and Pakistan MobileCommunications Ltd (“PMCL”), each indirect subsidiaries of the Company, signed an agreement with WaridTelecom Pakistan LLC and Bank Alfalah Limited, to combine their operations in Pakistan. On July 1, 2016, thetransaction was closed and PMCL acquired 100% of the voting shares in Warid Telecom (Pvt) Limited(“Warid”) for a consideration of 15% of the shares in PMCL. As a result, the Company gained control overWarid.
VEON elected to measure the non-controlling interest in the acquiree at fair value.
The fair values of the identifiable assets and liabilities of Warid at the date of acquisition were:
Fair value recognized onacquisition
Non-current assetsProperty and equipment . . . . . . . . . . . . . . . . . . . . . . . . . . . . . . . . . . . . . . . . . . . . . . . . . . . . . 199Intangible assets . . . . . . . . . . . . . . . . . . . . . . . . . . . . . . . . . . . . . . . . . . . . . . . . . . . . . . . . . . . 201Deferred tax assets . . . . . . . . . . . . . . . . . . . . . . . . . . . . . . . . . . . . . . . . . . . . . . . . . . . . . . . . . 308Other financial assets . . . . . . . . . . . . . . . . . . . . . . . . . . . . . . . . . . . . . . . . . . . . . . . . . . . . . . . 2
Current assetsInventories . . . . . . . . . . . . . . . . . . . . . . . . . . . . . . . . . . . . . . . . . . . . . . . . . . . . . . . . . . . . . . . 1Trade and other receivables . . . . . . . . . . . . . . . . . . . . . . . . . . . . . . . . . . . . . . . . . . . . . . . . . . 26Other non-financial assets . . . . . . . . . . . . . . . . . . . . . . . . . . . . . . . . . . . . . . . . . . . . . . . . . . . 23Current income tax assets . . . . . . . . . . . . . . . . . . . . . . . . . . . . . . . . . . . . . . . . . . . . . . . . . . . 17Cash and cash equivalents . . . . . . . . . . . . . . . . . . . . . . . . . . . . . . . . . . . . . . . . . . . . . . . . . . . 7
Non-current liabilitiesFinancial liabilities . . . . . . . . . . . . . . . . . . . . . . . . . . . . . . . . . . . . . . . . . . . . . . . . . . . . . . . . (402)Provisions . . . . . . . . . . . . . . . . . . . . . . . . . . . . . . . . . . . . . . . . . . . . . . . . . . . . . . . . . . . . . . . (6)Other non-financial liabilities . . . . . . . . . . . . . . . . . . . . . . . . . . . . . . . . . . . . . . . . . . . . . . . . (15)
Current liabilitiesTrade and other payables . . . . . . . . . . . . . . . . . . . . . . . . . . . . . . . . . . . . . . . . . . . . . . . . . . . . (113)Other non-financial liabilities . . . . . . . . . . . . . . . . . . . . . . . . . . . . . . . . . . . . . . . . . . . . . . . . (83)Other financial liabilities . . . . . . . . . . . . . . . . . . . . . . . . . . . . . . . . . . . . . . . . . . . . . . . . . . . . (45)
Total identifiable net assets at fair value . . . . . . . . . . . . . . . . . . . . . . . . . . . . . . . . . . . . . . 120Purchase consideration . . . . . . . . . . . . . . . . . . . . . . . . . . . . . . . . . . . . . . . . . . . . . . . . . . . . 321
Goodwill resulting from the acquisition . . . . . . . . . . . . . . . . . . . . . . . . . . . . . . . . . . . . . . 201
Purchase considerationShare issued by PMCL . . . . . . . . . . . . . . . . . . . . . . . . . . . . . . . . . . . . . . . . . . . . . . . . . . . . . 274Contingent consideration liability . . . . . . . . . . . . . . . . . . . . . . . . . . . . . . . . . . . . . . . . . . . . . 47
Total consideration . . . . . . . . . . . . . . . . . . . . . . . . . . . . . . . . . . . . . . . . . . . . . . . . . . . . . . . . 321
Analysis of cash flows on acquisitionNet cash acquired with the subsidiary (included in cash flows from investing
activities) . . . . . . . . . . . . . . . . . . . . . . . . . . . . . . . . . . . . . . . . . . . . . . . . . . . . . . . . . . . . . . 7
Net cash flow on acquisition . . . . . . . . . . . . . . . . . . . . . . . . . . . . . . . . . . . . . . . . . . . . . . . . . 7
There have been no period adjustments to the provisional fair values of the assets acquired, liabilitiesassumed and consideration to date.
F-25
The goodwill of US$201 comprises the value of expected synergies arising from the acquisition. Thegoodwill recognized is deductible for income tax purposes.
The fair value of the trade receivables amounts to US$26. The gross amount of trade receivables is US$33,of which US$7 is expected not to be collected.
From the date of acquisition, Warid contributed US$161 of revenue and a loss of US$6 to loss before taxfrom continuing operations of the Group. If the combination had taken place at the beginning of the year, thecontribution to revenue from continuing operations would have been US$313, and the contribution to the resultsbefore tax from continuing operations for the Group would have been a loss of US$37.
PMCL issued 679,604,049 ordinary shares as consideration for the 100% interest in Warid. The fair value ofthe shares is based on a Level 3 fair value derived from a discounted cash flow model, incorporating the expectedrealization of synergies adjusted for market expectations. The discount rate applied was 14.1% with a 4% percentterminal growth rate.
As part of the share purchase agreement, an earn-out payment has been agreed in the event that a towertransaction is effected by PMCL within four years from the acquisition date. The earn-out also applies if anothertelecommunications operator in Pakistan effects a tower transaction, provided the transaction meets certainparameters, in the same timeframe. The contingent consideration will be settled with a share transfer of PMCLshares. At the acquisition date, the fair value of the contingent consideration was estimated to be US$47 using adiscounted cash flow technique.
There were no changes to the fair value of the contingent consideration since the acquisition date, other thanthe unwinding of discount.
The fair value of the non-controlling interest in PMCL related to the Warid acquisition has been estimatedby applying a discounted cash flow technique.
As part of the acquisition agreement, the Company also agreed put-call options over the entirenon-controlling interest, whereby the Company has the ability to call, and the non-controlling interest has theability to put the entire non-controlling interest of PMCL. The options are exercisable four years from theacquisition date at the fair market value of the PMCL shares.
The put-call options over the non-controlling interest of PMCL are accounted for as a put-option redemptionliability which is classified as a financial liability in the Company’s consolidated financial statements (Note 18).The put-option redemption liability is measured at the discounted redemption amount with a value of US$274 atthe acquisition date. Interest over the put-option redemption liability will accrue until the options have beenexercised or are expired. As a result, no non-controlling interest will be recognized over the non-controllinginterest in PMCL in the Company’s consolidated financial statements.
Interest expense and foreign exchange loss over the option’s redemption liability amounted to US$21 andUS$1 respectively, for the period ended December 31, 2016. In addition, PMCL declared dividends of US$7attributable to the non-controlling interest of PMCL (Note 24), which has reduced the put-option redemptionliability. As at December 31, 2016 the resulting carrying value of put-option redemption liability was US$290(Note 18).
Following the acquisition of Warid, the legal merger of Mobilink and Warid occurred by way of a schemeof arrangement under Pakistani law as approved by a merger order of the Islamabad High Court datedDecember 15, 2016, whereby Warid merged into PMCL and (the former) ceased to exist. The court orderprovides for a merger effective date of July 1, 2016.
F-26
Acquisition of additional interest in 2Day Telecom LLP and KazEuroMobile LLP
On September 30, 2016 the Company acquired an additional interest of 16% in 2Day Telecom LLP,increasing its interest to 75%, for cash consideration of US$7. On the same date, the Company acquired anadditional 24% interest in KazEuroMobile LLP for KZT 1, increasing its interest to 75%. The purpose of thesetransactions is to streamline the ownership structure of the Group. The transactions were accounted for throughequity by increasing other capital reserves.
The transactions resulted in a decrease in equity attributable to the shareholders of the parent of US$9 andUS$1 respectively.
Sale of operations in Zimbabwe
On November 18, 2015, the Company, together with its subsidiary Global Telecom Holding S.A.E(“GTH”), entered into an agreement with ZARNet (Private) Limited to sell its stake in Telecel InternationalLimited for US$40. Telecel International Limited owns 60% of Telecel Zimbabwe (Pvt) Ltd. ZARNet is whollyowned by the Government of the Republic of Zimbabwe through the Ministry of Information & CommunicationTechnology, Postal and Courier Services.
Due to constraints in ZARNet’s ability to pay the full US$40 outside of Zimbabwe, it was agreed thatZARNet will satisfy the purchase price consideration with US$21 cash (of which US$10 was received in 2015and US$11 was received in 2016), and a US$19 Vendor Note payable in three years to Global TelecomNetherlands B.V., a subsidiary of GTH. Due to the currency restrictions in Zimbabwe, management have notincluded the Vendor Note in determining the result of the sale, as it is currently uncertain whether it will berecoverable.
The transaction closed on November 30, 2016, resulting in a gain of US$21.
Transactions of 2015
Sale of 51% shareholding in Omnium Telecom Algeria (OTA) and settlement of disputes with the AlgerianState
On January 30, 2015, the Company and its subsidiary GTH completed the sale of a non-controlling 51%interests in Omnium Telecom Algeria S.p.A. (formerly known as Orascom Telecom Algérie S.p.A.) (“OTA”) tothe Fonds National d’Investissement, the Algerian National Investment Fund (“FNI”), for a purchaseconsideration of US$2,643. The Company and the FNI have entered into a shareholders agreement whichgoverns their relationship as shareholders in OTA going forward. The Company will continue to exerciseoperational control over OTA and, as a result, will continue to fully consolidate OTA.
Immediately prior to the transaction, the Company owned 50.12% of OTA’s share and the carrying amountof the existing 49.88% non-controlling interest in OTA was US$1,010. As the Company will retain control ofOTA, the transaction was accounted for as an equity transaction and the non-controlling interest was adjusted byUS$1,607 to reflect the new ownership interest in OTA. Parent equity was adjusted for the difference betweenthe fair value of the consideration received and the adjustment to the non-controlling interest of US$644.
The capital gain tax payable amounted to US$428, of which US$350 was recorded directly in equity, andUS$78 was expensed in the income statement. The transaction costs totaled US$42. An existing tax credit ofUS$130 was utilized against the capital gain tax payable. Net proceeds received, after deducting capital gainstaxes and transaction costs were US$2,307.
At closing, GTH terminated its international arbitration against the Algerian State initiated on April 12,2012 and the parties to the arbitration settled the arbitration and all claims relating thereto. At the same time, the
F-27
foreign exchange and import restrictions put in place by the Bank of Algeria against OTA on April 15, 2010 werelifted, following the cash payment of the fine of DZD 99 billion (US$1,112) to the Algerian Treasury whichresulted in a decrease of provisions in the current liabilities from December 31, 2014 by the same amount.
Prior to closing, OTA paid a dividend to its shareholders in the amount of US$1,862. Shortly prior toclosing, OTA and its wholly-owned subsidiary Optimum Telecom Algerie S.p.A. established credit facilities witha syndicate of Algerian and international banks in an amount of DZD 82 billion (US$920), and immediately drewdown DZD 50 billion (US$561). In addition to this, on June 11, 2015 OTA fully drew down under two newcredit facilities with Credit Agricole Corporate and Investment Bank Algerie for an amount of DZD 2.2 billion(US$22) and with BNP Paribas El Djazair SPA and Natixis Algerie SPA for an amount of DZD 2.8 billion(US$29).
GTH and Cevital S.p.A. (“Cevital”), a non-controlling interest’s shareholder in OTA, amended theirpreviously disclosed Framework Agreement. Pursuant to the amended Framework Agreement, following closing,Cevital continued to be a shareholder in OTA holding 3.43% of the share capital of OTA. At closing, the existingOTA shareholder arrangements to which Cevital was a party were terminated and Cevital dismissed all pendinglitigation against OTA in settlement for a dinar payment by OTA equating to US$50 plus Cevital’s entitled shareof the US$1,862 pre-closing dividend paid by OTA to its shareholders.
Restructuring of the Company’s ownership in LLC “Sky Mobile” (Kyrgyzstan) and LLP “KaR-Tel”(Kazakhstan)
During Q2 2015 the Company completed the process of restructuring its ownership in LLC “Sky Mobile”(“Sky Mobile”) and LLP “KaR-Tel” (“KaR-Tel”). Key changes as a result of the restructuring included:
• moving the ownership from Cyprus to Swiss holding companies;
• increasing the Company’s ownership in KaR-Tel from 71.5% to 75% and decreasing the Company’sownership in Sky Mobile from 71.5% to 50.2%;
• termination of an existing put option liability of US$271, which was held by the non-controllinginterest holder and call option (value nil) held by the Company; and
No cash consideration was exchanged in connection with the above restructuring and the Companycontinues to control KaR-Tel and Sky Mobile subsequent to the transaction. The changes in ownership andtermination of the put option were treated as an equity transaction with a non-controlling interest holder sinceVEON did not lose control of the subsidiaries, and resulted in a net decrease to parent equity of US$98 andincrease to non-controlling interest of US$358. Following the completion of the restructuring, the portion of thedeferred tax liabilities amounting to US$75 was credited to the income tax expense for the period.
7 Segment information
Management analyzes the Company’s operating segments separately due to the different economicenvironments and stages of development in different geographical areas, requiring different investment andmarketing strategies. Management does not analyze assets or liabilities by operating segments.
Management evaluates the performance of the Company’s segments on a regular basis, primarily based onearnings before interest, tax, depreciation, amortization, impairment loss, loss on disposals of non-current assets,other non-operating losses and shares of profit / (loss) of associates and joint ventures (“Adjusted EBITDA”).
Subsequent to the transaction disclosed in Note 6, Italy is no longer a reportable segment. The comparativeinformation has been adjusted accordingly.
F-28
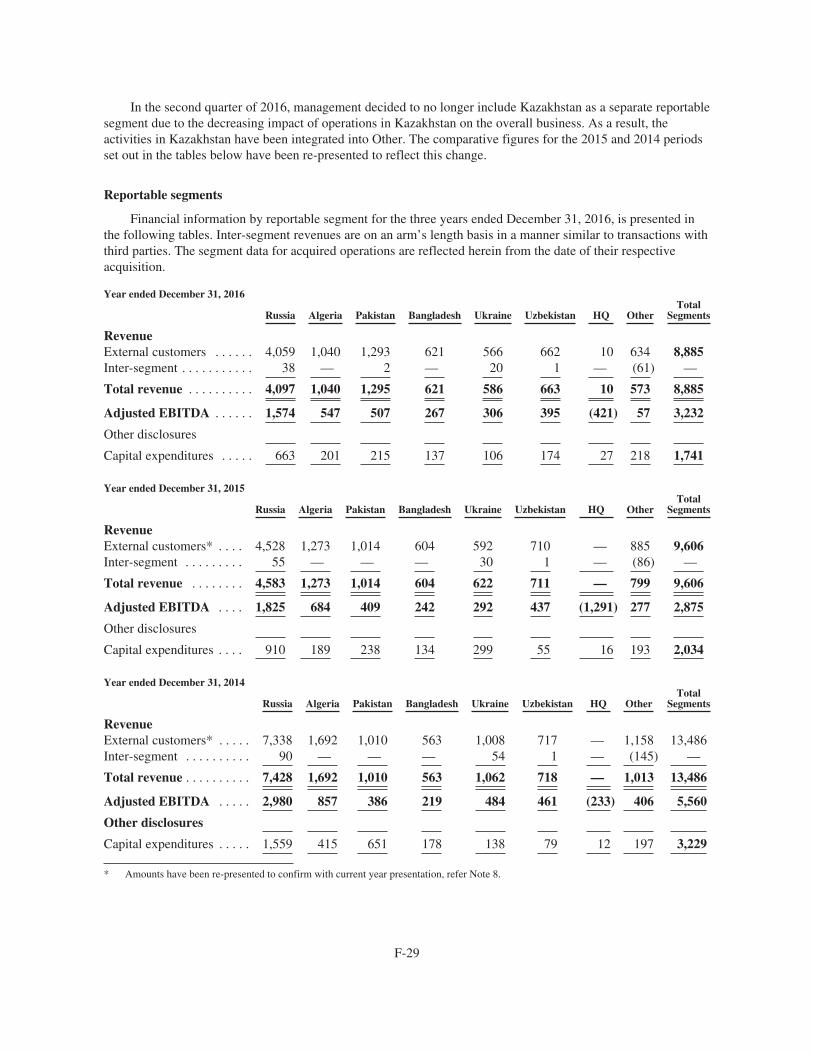
In the second quarter of 2016, management decided to no longer include Kazakhstan as a separate reportablesegment due to the decreasing impact of operations in Kazakhstan on the overall business. As a result, theactivities in Kazakhstan have been integrated into Other. The comparative figures for the 2015 and 2014 periodsset out in the tables below have been re-presented to reflect this change.
Reportable segments
Financial information by reportable segment for the three years ended December 31, 2016, is presented inthe following tables. Inter-segment revenues are on an arm’s length basis in a manner similar to transactions withthird parties. The segment data for acquired operations are reflected herein from the date of their respectiveacquisition.
Year ended December 31, 2016
Russia Algeria Pakistan Bangladesh Ukraine Uzbekistan HQ OtherTotal
Segments
RevenueExternal customers . . . . . . 4,059 1,040 1,293 621 566 662 10 634 8,885Inter-segment . . . . . . . . . . . 38 — 2 — 20 1 — (61) —
Total revenue . . . . . . . . . . 4,097 1,040 1,295 621 586 663 10 573 8,885
Adjusted EBITDA . . . . . . 1,574 547 507 267 306 395 (421) 57 3,232
Other disclosures
Capital expenditures . . . . . 663 201 215 137 106 174 27 218 1,741
Year ended December 31, 2015
Russia Algeria Pakistan Bangladesh Ukraine Uzbekistan HQ OtherTotal
Segments
RevenueExternal customers* . . . . 4,528 1,273 1,014 604 592 710 — 885 9,606Inter-segment . . . . . . . . . 55 — — — 30 1 — (86) —
Total revenue . . . . . . . . 4,583 1,273 1,014 604 622 711 — 799 9,606
Adjusted EBITDA . . . . 1,825 684 409 242 292 437 (1,291) 277 2,875
Other disclosures
Capital expenditures . . . . 910 189 238 134 299 55 16 193 2,034
Year ended December 31, 2014
Russia Algeria Pakistan Bangladesh Ukraine Uzbekistan HQ OtherTotal
Segments
RevenueExternal customers* . . . . . 7,338 1,692 1,010 563 1,008 717 — 1,158 13,486Inter-segment . . . . . . . . . . 90 — — — 54 1 — (145) —
Total revenue . . . . . . . . . . 7,428 1,692 1,010 563 1,062 718 — 1,013 13,486
Adjusted EBITDA . . . . . 2,980 857 386 219 484 461 (233) 406 5,560
Other disclosures
Capital expenditures . . . . . 1,559 415 651 178 138 79 12 197 3,229
* Amounts have been re-presented to confirm with current year presentation, refer Note 8.
F-29
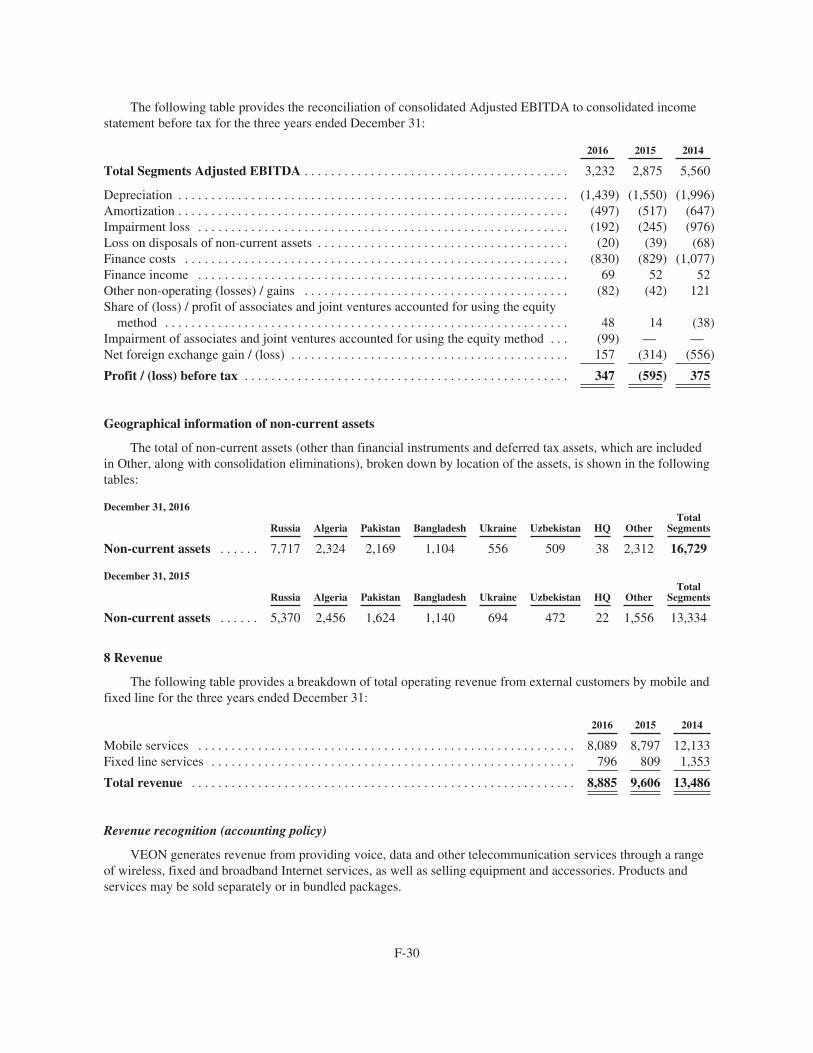
The following table provides the reconciliation of consolidated Adjusted EBITDA to consolidated incomestatement before tax for the three years ended December 31:
2016 2015 2014
Total Segments Adjusted EBITDA . . . . . . . . . . . . . . . . . . . . . . . . . . . . . . . . . . . . . . . . 3,232 2,875 5,560
Depreciation . . . . . . . . . . . . . . . . . . . . . . . . . . . . . . . . . . . . . . . . . . . . . . . . . . . . . . . . . . . (1,439) (1,550) (1,996)Amortization . . . . . . . . . . . . . . . . . . . . . . . . . . . . . . . . . . . . . . . . . . . . . . . . . . . . . . . . . . . (497) (517) (647)Impairment loss . . . . . . . . . . . . . . . . . . . . . . . . . . . . . . . . . . . . . . . . . . . . . . . . . . . . . . . . (192) (245) (976)Loss on disposals of non-current assets . . . . . . . . . . . . . . . . . . . . . . . . . . . . . . . . . . . . . . (20) (39) (68)Finance costs . . . . . . . . . . . . . . . . . . . . . . . . . . . . . . . . . . . . . . . . . . . . . . . . . . . . . . . . . . (830) (829) (1,077)Finance income . . . . . . . . . . . . . . . . . . . . . . . . . . . . . . . . . . . . . . . . . . . . . . . . . . . . . . . . 69 52 52Other non-operating (losses) / gains . . . . . . . . . . . . . . . . . . . . . . . . . . . . . . . . . . . . . . . . (82) (42) 121Share of (loss) / profit of associates and joint ventures accounted for using the equity
method . . . . . . . . . . . . . . . . . . . . . . . . . . . . . . . . . . . . . . . . . . . . . . . . . . . . . . . . . . . . . 48 14 (38)Impairment of associates and joint ventures accounted for using the equity method . . . (99) — —Net foreign exchange gain / (loss) . . . . . . . . . . . . . . . . . . . . . . . . . . . . . . . . . . . . . . . . . . 157 (314) (556)
Profit / (loss) before tax . . . . . . . . . . . . . . . . . . . . . . . . . . . . . . . . . . . . . . . . . . . . . . . . . 347 (595) 375
Geographical information of non-current assets
The total of non-current assets (other than financial instruments and deferred tax assets, which are includedin Other, along with consolidation eliminations), broken down by location of the assets, is shown in the followingtables:
December 31, 2016
Russia Algeria Pakistan Bangladesh Ukraine Uzbekistan HQ OtherTotal
Segments
Non-current assets . . . . . . 7,717 2,324 2,169 1,104 556 509 38 2,312 16,729
December 31, 2015
Russia Algeria Pakistan Bangladesh Ukraine Uzbekistan HQ OtherTotal
Segments
Non-current assets . . . . . . 5,370 2,456 1,624 1,140 694 472 22 1,556 13,334
8 Revenue
The following table provides a breakdown of total operating revenue from external customers by mobile andfixed line for the three years ended December 31:
2016 2015 2014
Mobile services . . . . . . . . . . . . . . . . . . . . . . . . . . . . . . . . . . . . . . . . . . . . . . . . . . . . . . . . . 8,089 8,797 12,133Fixed line services . . . . . . . . . . . . . . . . . . . . . . . . . . . . . . . . . . . . . . . . . . . . . . . . . . . . . . . 796 809 1,353
Total revenue . . . . . . . . . . . . . . . . . . . . . . . . . . . . . . . . . . . . . . . . . . . . . . . . . . . . . . . . . . 8,885 9,606 13,486
Revenue recognition (accounting policy)
VEON generates revenue from providing voice, data and other telecommunication services through a rangeof wireless, fixed and broadband Internet services, as well as selling equipment and accessories. Products andservices may be sold separately or in bundled packages.
F-30
Generally, revenue for products is recorded when the equipment is sold or upon transfer of the associatedrisks and rewards, and revenue for services is recorded when the services are rendered. Revenue for bundledpackages is recorded based on the relative fair value allocation of each component in the bundle.
Mobile services
Service revenue includes revenue from airtime charges from contract and prepaid customers, monthlycontract fees, interconnect revenue, roaming charges and charges for value added services (“VAS”). VASincludes short messages, multimedia messages, caller number identification, call waiting, data transmission,mobile internet, downloadable content, mobile finance services, machine-to-machine and other services. Thecontent revenue relating to VAS is presented net of related costs when the Company acts as an agent of thecontent providers and gross when the Company acts as the primary obligor of the transaction.
In 2016, the Group has aligned its practices for content revenue across the group, and re-presented thecomparative periods 2015 and 2014 reducing revenue and operating costs for the periods. The impact of thisrefinement in policy was not material for any periods presented, and reduced the revenue and the operating costsby US$20 in 2016, US$19 in 2015 and US$31 in 2014. The net results, financial position and operating cashflows for these periods remained unaffected. The Company concluded that net presentation of the contentrevenue better reflected the actual nature and substance of the arrangements with content providers.
More specifically, the accounting for revenue sharing agreements and delivery of content depends on theanalysis of the facts and circumstances surrounding these transactions, which will determine if the revenue isrecognized gross or net.
Service revenue is generally recognized when the services (including VAS and roaming revenue) arerendered. Sales of prepaid cards, used as a method of cash collection, is accounted for as customer advances forfuture services and the respective revenue is deferred until the customer uses the airtime. Prepaid cards might nothave expiration dates but are subject to statutory expiration periods, and unused prepaid balances are added toservice revenue based on an estimate of the expected balance that will expire unused. VEON charges customers afixed monthly fee for the use of certain services. Such fees are recognized as revenue in the respective monthwhen earned.
Some tariffs include bundle rollovers which effectively allow customers to rollover unused minutes fromone month to the following month. For these tariffs, the portion of the access fee representing the fair value of therolled over minutes is deferred until the service is delivered.
Fixed-line services
Revenue from traditional voice services and other service contracts is accounted for when the services areprovided. Revenue from Internet services is measured primarily by monthly fees and internet-traffic volumewhich has not been included in monthly fees. Payments from customers for fixed-line equipment are notrecognized as revenue until installation and testing of such equipment are completed and the equipment isaccepted by the customer. Domestic Long Distance/International Long Distance (“DLD/ILD”) and zonalrevenue are recorded gross or net depending on the contractual arrangements with the end-users.
Connection fees
VEON defers upfront telecommunications connection fees. The deferral of revenue is recognized over theestimated average customer life or the minimum contractual term, whichever is shorter. The Company alsodefers direct incremental costs related to connection fees for fixed line customers, in an amount not exceeding therevenue deferred.
F-31
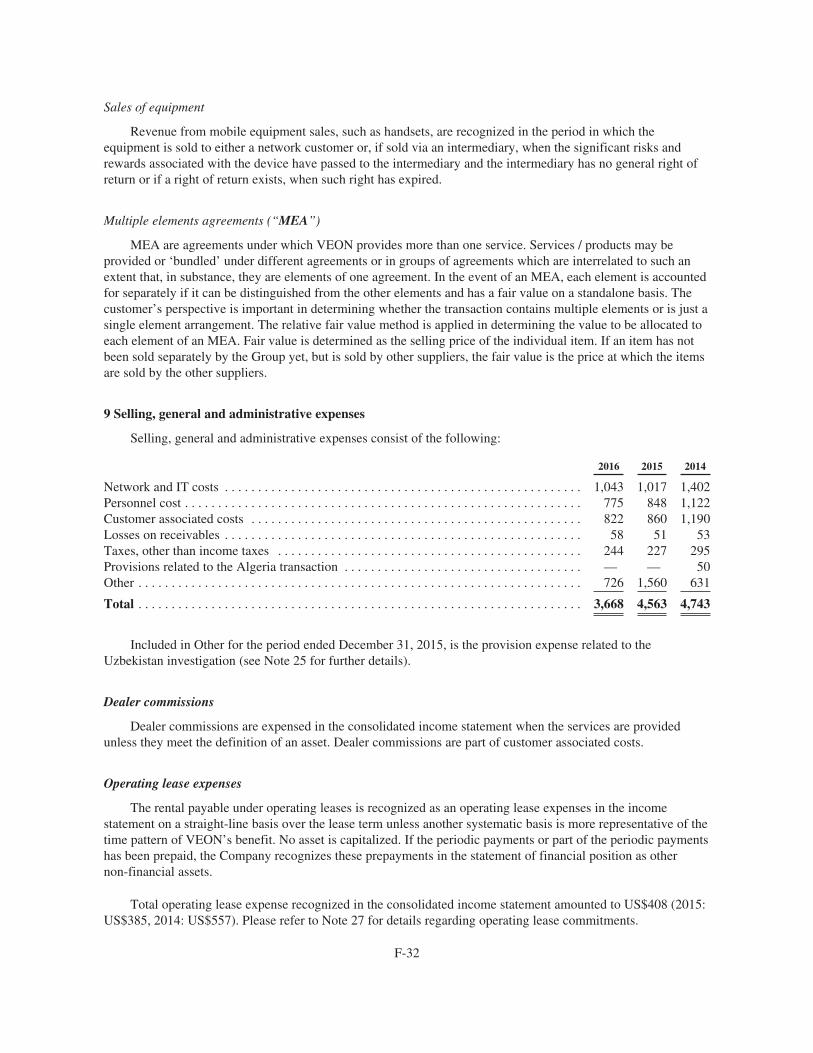
Sales of equipment
Revenue from mobile equipment sales, such as handsets, are recognized in the period in which theequipment is sold to either a network customer or, if sold via an intermediary, when the significant risks andrewards associated with the device have passed to the intermediary and the intermediary has no general right ofreturn or if a right of return exists, when such right has expired.
Multiple elements agreements (“MEA”)
MEA are agreements under which VEON provides more than one service. Services / products may beprovided or ‘bundled’ under different agreements or in groups of agreements which are interrelated to such anextent that, in substance, they are elements of one agreement. In the event of an MEA, each element is accountedfor separately if it can be distinguished from the other elements and has a fair value on a standalone basis. Thecustomer’s perspective is important in determining whether the transaction contains multiple elements or is just asingle element arrangement. The relative fair value method is applied in determining the value to be allocated toeach element of an MEA. Fair value is determined as the selling price of the individual item. If an item has notbeen sold separately by the Group yet, but is sold by other suppliers, the fair value is the price at which the itemsare sold by the other suppliers.
9 Selling, general and administrative expenses
Selling, general and administrative expenses consist of the following:
2016 2015 2014
Network and IT costs . . . . . . . . . . . . . . . . . . . . . . . . . . . . . . . . . . . . . . . . . . . . . . . . . . . . . . 1,043 1,017 1,402Personnel cost . . . . . . . . . . . . . . . . . . . . . . . . . . . . . . . . . . . . . . . . . . . . . . . . . . . . . . . . . . . . 775 848 1,122Customer associated costs . . . . . . . . . . . . . . . . . . . . . . . . . . . . . . . . . . . . . . . . . . . . . . . . . . 822 860 1,190Losses on receivables . . . . . . . . . . . . . . . . . . . . . . . . . . . . . . . . . . . . . . . . . . . . . . . . . . . . . . 58 51 53Taxes, other than income taxes . . . . . . . . . . . . . . . . . . . . . . . . . . . . . . . . . . . . . . . . . . . . . . 244 227 295Provisions related to the Algeria transaction . . . . . . . . . . . . . . . . . . . . . . . . . . . . . . . . . . . . — — 50Other . . . . . . . . . . . . . . . . . . . . . . . . . . . . . . . . . . . . . . . . . . . . . . . . . . . . . . . . . . . . . . . . . . . 726 1,560 631
Total . . . . . . . . . . . . . . . . . . . . . . . . . . . . . . . . . . . . . . . . . . . . . . . . . . . . . . . . . . . . . . . . . . . 3,668 4,563 4,743
Included in Other for the period ended December 31, 2015, is the provision expense related to theUzbekistan investigation (see Note 25 for further details).
Dealer commissions
Dealer commissions are expensed in the consolidated income statement when the services are providedunless they meet the definition of an asset. Dealer commissions are part of customer associated costs.
Operating lease expenses
The rental payable under operating leases is recognized as an operating lease expenses in the incomestatement on a straight-line basis over the lease term unless another systematic basis is more representative of thetime pattern of VEON’s benefit. No asset is capitalized. If the periodic payments or part of the periodic paymentshas been prepaid, the Company recognizes these prepayments in the statement of financial position as othernon-financial assets.
Total operating lease expense recognized in the consolidated income statement amounted to US$408 (2015:US$385, 2014: US$557). Please refer to Note 27 for details regarding operating lease commitments.
F-32
Accounting policies (leases)
Leases are classified as finance leases whenever the terms of the lease transfer substantially all the risks andrewards associated with ownership of the leased asset to VEON. All other leases are classified as operatingleases. The determination of whether an arrangement is, or contains, a lease is based on the substance of thearrangement at the inception date, or when the terms of the agreement are modified.
Finance leases
At the commencement of a finance lease term, VEON recognizes the assets and liabilities in its statement offinancial position at amounts equal to the fair value of the leased property or, if lower, the present value of theminimum lease payments as determined at the inception of the lease. The corresponding liability to the lessor isincluded in the statement of financial position as a finance lease obligation.
The discount rate used in calculating the present value of the minimum lease payments is the interest rateimplicit in the lease. If there is no interest rate in the lease, the Company’s incremental borrowing rate is used.Any initial direct costs of VEON related to the lease are added to the amount recognized as an asset.
Operating leases
The rental payable under operating leases is recognized as an operating lease expenses in the incomestatement on a straight-line basis over the lease term unless another systematic basis is more representative of thetime pattern of VEON’s benefit. No asset is capitalized. If the periodic payments or part of the periodic paymentshas been prepaid, the Company recognizes these prepayments in the statement of financial position as othernon-financial assets.
10 Impairment
Accounting policies
Goodwill
Goodwill is recognized for the future economic benefits arising from net assets acquired that are notindividually identified and separately recognized.
Goodwill is not amortized but is tested for impairment annually and as necessary when circumstancesindicate that the carrying value may be impaired.
The Company bases its impairment calculation on detailed budgets and forecast calculations which areprepared separately for each of the Company’s CGUs. These budgets and forecast calculations are prepared for aperiod of five years. For longer periods, a long-term growth rate is applied in order to project future cash flowsafter the fifth year.
Impairment of assets
Property and equipment, and intangible assets are tested for impairment. The Company assesses, at the endof each reporting period, whether there are any indicators that an asset may be impaired. If there are suchindicators (i.e. asset becoming idle, damaged or no longer in use), the Company estimates the recoverableamount of the asset.
Impairment losses of continuing operations are recognized in the income statement in a separate line item.
F-33

The impairment charge relates to the following:
Note 2016 2015 2014
Property and equipment . . . . . . . . . . . . . . . . . . . . . . . . . . . . . . . . . . . . . . . . . . . . . . . . . 10,16 100 150 —Intangible assets . . . . . . . . . . . . . . . . . . . . . . . . . . . . . . . . . . . . . . . . . . . . . . . . . . . . . . . 10,17 14 — —Goodwill . . . . . . . . . . . . . . . . . . . . . . . . . . . . . . . . . . . . . . . . . . . . . . . . . . . . . . . . . . . . . 10 78 95 976
192 245 976
Carrying amount of goodwill and cash-generating units
Goodwill acquired through business combinations has been allocated to CGUs for impairment testing asfollows:
Year ended December 31, 2016
CGU 2016 Impairment AcquisitionTranslationadjustment 2015
Russia . . . . . . . . . . . . . . . . . . . . . . . . . . . . . . . . . . . . . . . . . . 2,312 — — 388 1,924Algeria . . . . . . . . . . . . . . . . . . . . . . . . . . . . . . . . . . . . . . . . . . 1,393 — — (42) 1,435Pakistan . . . . . . . . . . . . . . . . . . . . . . . . . . . . . . . . . . . . . . . . . 497 — 201 1 295Kazakhstan . . . . . . . . . . . . . . . . . . . . . . . . . . . . . . . . . . . . . . 176 — — 3 173Kyrgyzstan . . . . . . . . . . . . . . . . . . . . . . . . . . . . . . . . . . . . . . 145 (49) — 17 177Uzbekistan . . . . . . . . . . . . . . . . . . . . . . . . . . . . . . . . . . . . . . . 114 — — (17) 131Armenia . . . . . . . . . . . . . . . . . . . . . . . . . . . . . . . . . . . . . . . . . 59 — — — 59Tajikistan . . . . . . . . . . . . . . . . . . . . . . . . . . . . . . . . . . . . . . . . — (21) — — 21Others . . . . . . . . . . . . . . . . . . . . . . . . . . . . . . . . . . . . . . . . . . — (8) — — 8
Total . . . . . . . . . . . . . . . . . . . . . . . . . . . . . . . . . . . . . . . . . . . 4,696 (78) 201 350 4,223
Year ended December 31, 2015
CGU 2015 Impairment AcquisitionTranslationadjustment
Classification asheld for sale 2014**
Italy* . . . . . . . . . . . . . . . . . . . . . . . . . . . . . — — — (452) (4,381) 4,833Russia . . . . . . . . . . . . . . . . . . . . . . . . . . . . 1,924 — 2 (568) — 2,490Ukraine . . . . . . . . . . . . . . . . . . . . . . . . . . . — (51) — (24) — 75Algeria . . . . . . . . . . . . . . . . . . . . . . . . . . . . 1,435 — — (321) — 1,756Pakistan . . . . . . . . . . . . . . . . . . . . . . . . . . . 295 — — (12) — 307Kazakhstan . . . . . . . . . . . . . . . . . . . . . . . . 173 — — (149) — 322Kyrgyzstan . . . . . . . . . . . . . . . . . . . . . . . . 177 — (51) — 228Uzbekistan . . . . . . . . . . . . . . . . . . . . . . . . . 131 — — (12) — 143Armenia . . . . . . . . . . . . . . . . . . . . . . . . . . . 59 (44) — (1) — 104Tajikistan . . . . . . . . . . . . . . . . . . . . . . . . . . 21 — — — — 21Others . . . . . . . . . . . . . . . . . . . . . . . . . . . . 8 — — 2 — 6
Total . . . . . . . . . . . . . . . . . . . . . . . . . . . . . 4,223 (95) 2 (1,588) (4,381) 10,285
* Italy has been classified as held for sale and discontinued operation as at August 2015 (Note 6)** The 2014 balances for Italy and Algeria were decreased and increased, respectively, by US$54 to correct for a misallocation between the
segments.
There were no changes to the methodology of goodwill allocation to CGUs.
The Company performed its annual goodwill impairment test as at October 1, 2016. The Company considersthe relationship between market capitalization and its book value, changes in country risk premiums and
F-34
significant decreases in the operating results of its CGUs versus budgeted amounts, among other factors, whenreviewing for indicators of impairment on a quarterly basis. As at the impairment test date, the marketcapitalization of the Group was not below the book value of its equity. The Company further performed anassessment for the period between October 1, and December 31, 2016 for any adverse developments that couldhave negatively impacted the valuations.
The recoverable amounts of CGUs have been determined based on fair value less costs of disposalcalculations, using cash flow projections from business plans approved in the first quarter of 2016 by the Group’ssenior management. These plans were updated for subsequent changes in the actual performances as well as anychanges in the existing networks, renewal of the telecom licenses, any restructurings and other businessinitiatives. To the extent the business initiatives would not be valued by the market due to their early stages, theywere not included in the cash flow projections. The business plans cover a period of five years. The keyassumptions and outcomes of the impairment test are discussed separately below.
Impairment losses
2016
During the 2016 annual impairment test, the Company concluded impairments for the CGUs Georgia andKyrgyzstan in amounts of US$29 and US$49, respectively. The impairments were concluded largely due tolower operating performances in those countries. The recoverable amounts of US$53 and US$219, respectively,were determined based on a fair value less costs of disposal calculation using the latest cash flow projections(Level 3 fair value). The Company applied a post-tax discount rate of 10.3% and 14.5%, respectively.
For Georgia CGU, the carrying amount of goodwill was already nil prior to the impairment test. As such,the total amount of the impairment loss was allocated to the carrying amounts of property and equipment andintangible assets based on relative carrying value before the impairment as follows:
Account Impairment loss
Property and equipment . . . . . . . . . . . . . . . . . . . . . . . . . . . . . . . . . . . . . . . . . . . . . . . . . . . . . . . . . . 16Intangible assets . . . . . . . . . . . . . . . . . . . . . . . . . . . . . . . . . . . . . . . . . . . . . . . . . . . . . . . . . . . . . . . . 13
Total . . . . . . . . . . . . . . . . . . . . . . . . . . . . . . . . . . . . . . . . . . . . . . . . . . . . . . . . . . . . . . . . . . . . . . . . . 29
In Q4 2016, the Company also concluded an impairment for CGU Tajikistan in an amount of US$88 due tonegative cash flow outlook primarily driven by excessive tax levies. The impairment was allocated to allnon-current and current assets, including goodwill:
Account Impairment loss
Property and equipment . . . . . . . . . . . . . . . . . . . . . . . . . . . . . . . . . . . . . . . . . . . . . . . . . . . . . . . . . . 54Intangible assets . . . . . . . . . . . . . . . . . . . . . . . . . . . . . . . . . . . . . . . . . . . . . . . . . . . . . . . . . . . . . . . . 1Goodwill . . . . . . . . . . . . . . . . . . . . . . . . . . . . . . . . . . . . . . . . . . . . . . . . . . . . . . . . . . . . . . . . . . . . . . 21Other assets* . . . . . . . . . . . . . . . . . . . . . . . . . . . . . . . . . . . . . . . . . . . . . . . . . . . . . . . . . . . . . . . . . . . 12
Total . . . . . . . . . . . . . . . . . . . . . . . . . . . . . . . . . . . . . . . . . . . . . . . . . . . . . . . . . . . . . . . . . . . . . . . . . 88
* Other assets includes trade and other receivables and deferred tax assets. The impairments on these assets have been recognized on theincome statement accounts relating to these assets, i.e. Selling, general and administrative expenses and Income tax expense.
Additionally, in connection with the rollout of the Company’s transformation strategy and commitment tonetwork modernization, the Company has re-evaluated the plans for its existing network, including equipmentpurchased but not installed, and consequently recorded an impairment loss of US$30.
F-35
2015
In Q1 2015, due to higher weighted average cost of capital for Ukraine by 1.0% as compared to October 1,2014, the Group recorded an impairment loss of US$51 in the Ukraine CGU. The recoverable amount wasdetermined based on a fair value less costs of disposal calculation using the latest cash flow projections (Level 3fair value). Due to the macroeconomic and geopolitical situation in the country, the Company applied higherpost-tax discount factors for the first two years in the explicit period of 27.1% in 2015 and 20.4% in 2016,followed by normalized post-tax discount rate of 17.8% as at March 31, 2015.
Also, due to higher weighted average costs of capital for the CGU Armenia, an impairment was reported inQ1 2015 for the amount of US$44. The recoverable amount was determined based on a fair value less costs ofdisposal calculation using the latest cash flow projections (Level 3 fair value). The Company applied post-taxdiscount rate of 12.1% as at March 31, 2015.
Based on the annual goodwill impairment test as at October 1, 2015, there were no other impairment lossesidentified for these and other CGUs.
Several countries exhibited very limited headroom, and these are discussed in more details later in this Note.
Additionally, in connection with the rollout of the Company’s transformation strategy and commitment tonetwork modernization, the Company has re-evaluated the plans for its existing network, including equipmentpurchased but not installed, and consequently recorded an impairment loss of US$150.
2014
Driven by continued volatile economic and political environment in Ukraine as well as deterioratedoperating performance in the country, the Company concluded an impairment of US$767. The recoverableamount was determined based on a fair value less costs of disposal calculation using the latest cash flowprojections including the awarded 3G license as well as cost optimization restructurings and necessity to renew2G licenses in the future (Level 3 fair value). Due to the macroeconomic and geopolitical situation in the country,the Company applied higher post-tax discount factors for the first two years in the explicit period of 26.1% in2015 and 19.4% 2016 followed by normalized post-tax discount rate of 16.8%.
The Company also concluded an impairment pertaining to its operations in Pakistan in an amount ofUS$163. The impairment was mainly driven by significantly higher capital expenditures to expand the 3Gtelecommunication network planned for 2015 in order to regain the market share in the country following itscontraction in 2014. The recoverable amount was determined based on a fair value less costs of disposalcalculation using the latest cash flow projections including the expected capital expenditures to expand thenetwork as well as necessity to renew 2G and 3G licenses in the future (Level 3 fair value). The post-tax discountrate applied was 16.6%.
Other impairment concluded related to goodwill in Laos of US$34. The recoverable amounts weredetermined based on the fair value less costs of disposal calculations using the latest cash flow projections and apost-tax discount rate of 16.2% for Laos and 13.1% for other CGUs (Level 3 fair value).
In addition, the Company recorded an impairment for other non-current assets for the total amount ofUS$110, which was offset by an impairment reversal pertaining to the sale by VEON and GTH of all of our debtand equity interest in the Globalive group of companies in Canada in 2014.
Key assumptions
The key assumptions and inputs used by the Company in determining the recoverable amount are:
• the discount rate,
• average revenue growth rate (excluding perpetuity period),
F-36
• terminal growth rate,
• average operating margin and
• average capital expenditure as a percentage of revenue.
The Company estimates operating margin calculated based on Adjusted EBITDA divided by TotalOperating Revenue for each CGU and each future year.
Capital expenditure is defined as purchases of property and equipment and intangible assets other thangoodwill.
The discount rates used in the impairment test were initially determined in US$ based on the risk free ratefor 20-year maturity bonds of the United States Treasury, adjusted for a risk premium to reflect both theincreased risk of investing in equities and the systematic risk of the specific CGU relative to the market as awhole.
The equity market risk premium used was 5.5% (2015: 5.5%, 2014: 5.5%). The systematic risk, beta,represents the median of the raw betas of the entities comparable in size and geographic footprint with the onesof the Company (“Peer Group”).
The debt risk premium is based on the median of Standard & Poor’s long-term credit rating of the PeerGroup.
The weighted average cost of capital is determined based on target debt-to-equity ratios representing themedian historical five-year capital structure for each entity from the Peer Group.
The discount rate in functional currency of a CGU is adjusted for the long-term inflation forecast of therespective country in which the business operates, as well as the applicable country risk premium. Due to thecurrent macroeconomic situation in Russia and Ukraine, the Company applied higher discount rates for the lastquarter of 2016 and the year 2017.
Discount rate (functional currency) 2016 2015 2014
Russia* . . . . . . . . . . . . . . . . . . . . . . . . . . . . . . . . . . . . . . . . . . . . . . . . . . . . . . . . . . . 9.7% 11.2% 11.2%Ukraine* . . . . . . . . . . . . . . . . . . . . . . . . . . . . . . . . . . . . . . . . . . . . . . . . . . . . . . . . . . 17.2% 18.2% 16.8%Algeria . . . . . . . . . . . . . . . . . . . . . . . . . . . . . . . . . . . . . . . . . . . . . . . . . . . . . . . . . . . 9.8% 11.4% 10.8%Pakistan . . . . . . . . . . . . . . . . . . . . . . . . . . . . . . . . . . . . . . . . . . . . . . . . . . . . . . . . . . . 14.3% 15.7% 16.6%Bangladesh . . . . . . . . . . . . . . . . . . . . . . . . . . . . . . . . . . . . . . . . . . . . . . . . . . . . . . . . 11.9% 13.4% 12.9%Kazakhstan . . . . . . . . . . . . . . . . . . . . . . . . . . . . . . . . . . . . . . . . . . . . . . . . . . . . . . . . 12.4% 12.3% 11.4%Kyrgyzstan . . . . . . . . . . . . . . . . . . . . . . . . . . . . . . . . . . . . . . . . . . . . . . . . . . . . . . . . 14.5% 14.2% 16.5%Uzbekistan . . . . . . . . . . . . . . . . . . . . . . . . . . . . . . . . . . . . . . . . . . . . . . . . . . . . . . . . 15.4% 18.4% 10.2%Armenia . . . . . . . . . . . . . . . . . . . . . . . . . . . . . . . . . . . . . . . . . . . . . . . . . . . . . . . . . . 12.0% 12.9% 11.7%Georgia . . . . . . . . . . . . . . . . . . . . . . . . . . . . . . . . . . . . . . . . . . . . . . . . . . . . . . . . . . . 10.3% 12.6% 13.1%Tajikistan . . . . . . . . . . . . . . . . . . . . . . . . . . . . . . . . . . . . . . . . . . . . . . . . . . . . . . . . . n.a. 13.5% 12.7%
* Due to the current macroeconomic situation in Russia and Ukraine, the Company applied higher discount rates for the last quarter of2016 and the year 2017 as follows:Russia: 12.7% (2016) and 10.7% (2017)Ukraine: 26.9% (2016) and 23.0% (2017)
F-37
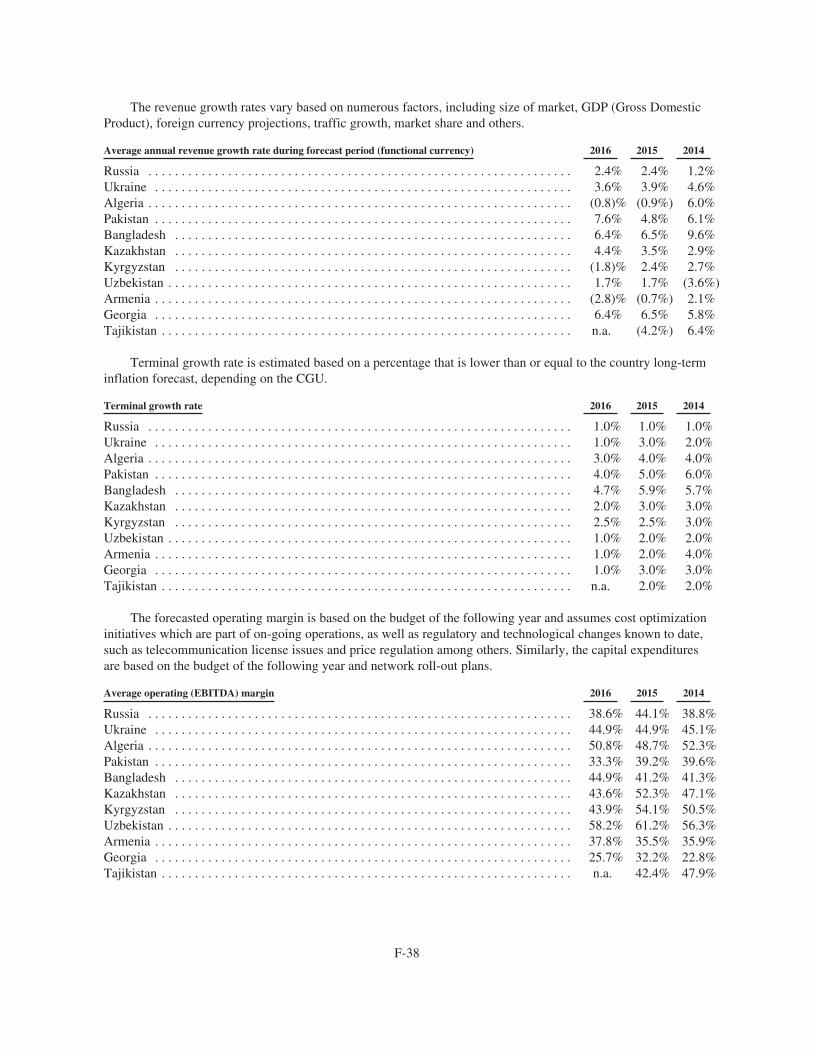
The revenue growth rates vary based on numerous factors, including size of market, GDP (Gross DomesticProduct), foreign currency projections, traffic growth, market share and others.
Average annual revenue growth rate during forecast period (functional currency) 2016 2015 2014
Russia . . . . . . . . . . . . . . . . . . . . . . . . . . . . . . . . . . . . . . . . . . . . . . . . . . . . . . . . . . . . . . . . 2.4% 2.4% 1.2%Ukraine . . . . . . . . . . . . . . . . . . . . . . . . . . . . . . . . . . . . . . . . . . . . . . . . . . . . . . . . . . . . . . . 3.6% 3.9% 4.6%Algeria . . . . . . . . . . . . . . . . . . . . . . . . . . . . . . . . . . . . . . . . . . . . . . . . . . . . . . . . . . . . . . . . (0.8)% (0.9%) 6.0%Pakistan . . . . . . . . . . . . . . . . . . . . . . . . . . . . . . . . . . . . . . . . . . . . . . . . . . . . . . . . . . . . . . . 7.6% 4.8% 6.1%Bangladesh . . . . . . . . . . . . . . . . . . . . . . . . . . . . . . . . . . . . . . . . . . . . . . . . . . . . . . . . . . . . 6.4% 6.5% 9.6%Kazakhstan . . . . . . . . . . . . . . . . . . . . . . . . . . . . . . . . . . . . . . . . . . . . . . . . . . . . . . . . . . . . 4.4% 3.5% 2.9%Kyrgyzstan . . . . . . . . . . . . . . . . . . . . . . . . . . . . . . . . . . . . . . . . . . . . . . . . . . . . . . . . . . . . (1.8)% 2.4% 2.7%Uzbekistan . . . . . . . . . . . . . . . . . . . . . . . . . . . . . . . . . . . . . . . . . . . . . . . . . . . . . . . . . . . . . 1.7% 1.7% (3.6%)Armenia . . . . . . . . . . . . . . . . . . . . . . . . . . . . . . . . . . . . . . . . . . . . . . . . . . . . . . . . . . . . . . . (2.8)% (0.7%) 2.1%Georgia . . . . . . . . . . . . . . . . . . . . . . . . . . . . . . . . . . . . . . . . . . . . . . . . . . . . . . . . . . . . . . . 6.4% 6.5% 5.8%Tajikistan . . . . . . . . . . . . . . . . . . . . . . . . . . . . . . . . . . . . . . . . . . . . . . . . . . . . . . . . . . . . . . n.a. (4.2%) 6.4%
Terminal growth rate is estimated based on a percentage that is lower than or equal to the country long-terminflation forecast, depending on the CGU.
Terminal growth rate 2016 2015 2014
Russia . . . . . . . . . . . . . . . . . . . . . . . . . . . . . . . . . . . . . . . . . . . . . . . . . . . . . . . . . . . . . . . . 1.0% 1.0% 1.0%Ukraine . . . . . . . . . . . . . . . . . . . . . . . . . . . . . . . . . . . . . . . . . . . . . . . . . . . . . . . . . . . . . . . 1.0% 3.0% 2.0%Algeria . . . . . . . . . . . . . . . . . . . . . . . . . . . . . . . . . . . . . . . . . . . . . . . . . . . . . . . . . . . . . . . . 3.0% 4.0% 4.0%Pakistan . . . . . . . . . . . . . . . . . . . . . . . . . . . . . . . . . . . . . . . . . . . . . . . . . . . . . . . . . . . . . . . 4.0% 5.0% 6.0%Bangladesh . . . . . . . . . . . . . . . . . . . . . . . . . . . . . . . . . . . . . . . . . . . . . . . . . . . . . . . . . . . . 4.7% 5.9% 5.7%Kazakhstan . . . . . . . . . . . . . . . . . . . . . . . . . . . . . . . . . . . . . . . . . . . . . . . . . . . . . . . . . . . . 2.0% 3.0% 3.0%Kyrgyzstan . . . . . . . . . . . . . . . . . . . . . . . . . . . . . . . . . . . . . . . . . . . . . . . . . . . . . . . . . . . . 2.5% 2.5% 3.0%Uzbekistan . . . . . . . . . . . . . . . . . . . . . . . . . . . . . . . . . . . . . . . . . . . . . . . . . . . . . . . . . . . . . 1.0% 2.0% 2.0%Armenia . . . . . . . . . . . . . . . . . . . . . . . . . . . . . . . . . . . . . . . . . . . . . . . . . . . . . . . . . . . . . . . 1.0% 2.0% 4.0%Georgia . . . . . . . . . . . . . . . . . . . . . . . . . . . . . . . . . . . . . . . . . . . . . . . . . . . . . . . . . . . . . . . 1.0% 3.0% 3.0%Tajikistan . . . . . . . . . . . . . . . . . . . . . . . . . . . . . . . . . . . . . . . . . . . . . . . . . . . . . . . . . . . . . . n.a. 2.0% 2.0%
The forecasted operating margin is based on the budget of the following year and assumes cost optimizationinitiatives which are part of on-going operations, as well as regulatory and technological changes known to date,such as telecommunication license issues and price regulation among others. Similarly, the capital expendituresare based on the budget of the following year and network roll-out plans.
Average operating (EBITDA) margin 2016 2015 2014
Russia . . . . . . . . . . . . . . . . . . . . . . . . . . . . . . . . . . . . . . . . . . . . . . . . . . . . . . . . . . . . . . . . 38.6% 44.1% 38.8%Ukraine . . . . . . . . . . . . . . . . . . . . . . . . . . . . . . . . . . . . . . . . . . . . . . . . . . . . . . . . . . . . . . . 44.9% 44.9% 45.1%Algeria . . . . . . . . . . . . . . . . . . . . . . . . . . . . . . . . . . . . . . . . . . . . . . . . . . . . . . . . . . . . . . . . 50.8% 48.7% 52.3%Pakistan . . . . . . . . . . . . . . . . . . . . . . . . . . . . . . . . . . . . . . . . . . . . . . . . . . . . . . . . . . . . . . . 33.3% 39.2% 39.6%Bangladesh . . . . . . . . . . . . . . . . . . . . . . . . . . . . . . . . . . . . . . . . . . . . . . . . . . . . . . . . . . . . 44.9% 41.2% 41.3%Kazakhstan . . . . . . . . . . . . . . . . . . . . . . . . . . . . . . . . . . . . . . . . . . . . . . . . . . . . . . . . . . . . 43.6% 52.3% 47.1%Kyrgyzstan . . . . . . . . . . . . . . . . . . . . . . . . . . . . . . . . . . . . . . . . . . . . . . . . . . . . . . . . . . . . 43.9% 54.1% 50.5%Uzbekistan . . . . . . . . . . . . . . . . . . . . . . . . . . . . . . . . . . . . . . . . . . . . . . . . . . . . . . . . . . . . . 58.2% 61.2% 56.3%Armenia . . . . . . . . . . . . . . . . . . . . . . . . . . . . . . . . . . . . . . . . . . . . . . . . . . . . . . . . . . . . . . . 37.8% 35.5% 35.9%Georgia . . . . . . . . . . . . . . . . . . . . . . . . . . . . . . . . . . . . . . . . . . . . . . . . . . . . . . . . . . . . . . . 25.7% 32.2% 22.8%Tajikistan . . . . . . . . . . . . . . . . . . . . . . . . . . . . . . . . . . . . . . . . . . . . . . . . . . . . . . . . . . . . . . n.a. 42.4% 47.9%
F-38
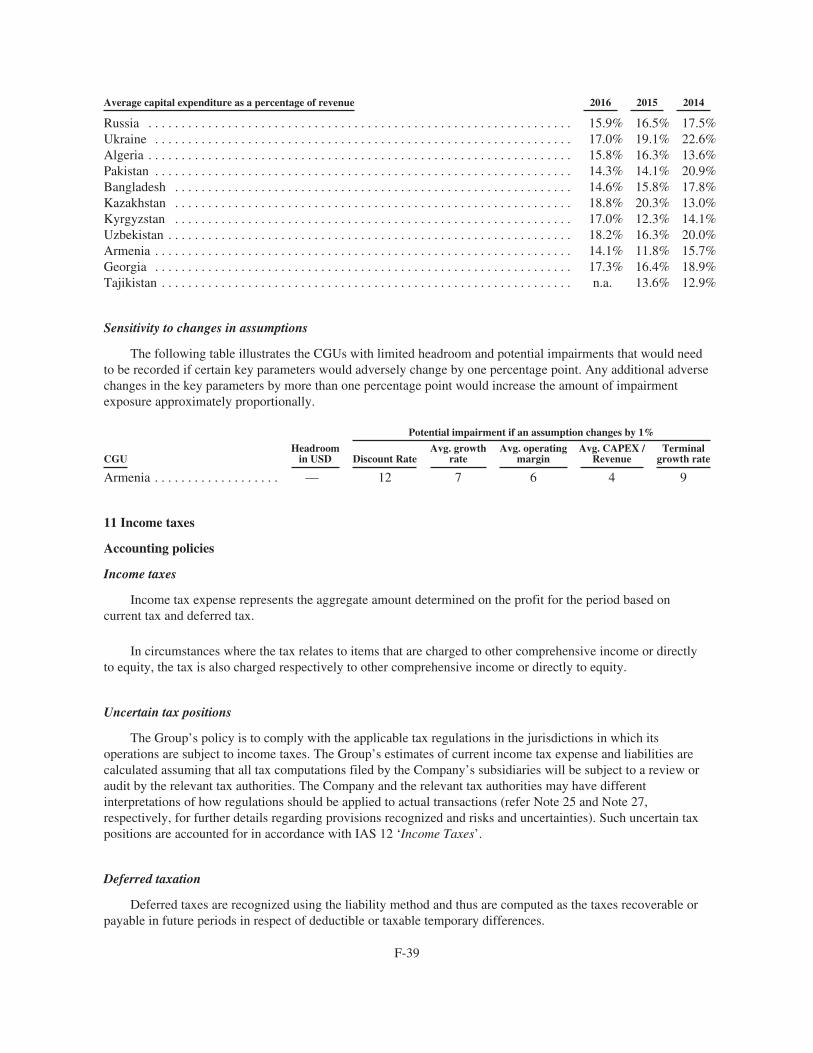
Average capital expenditure as a percentage of revenue 2016 2015 2014
Russia . . . . . . . . . . . . . . . . . . . . . . . . . . . . . . . . . . . . . . . . . . . . . . . . . . . . . . . . . . . . . . . . 15.9% 16.5% 17.5%Ukraine . . . . . . . . . . . . . . . . . . . . . . . . . . . . . . . . . . . . . . . . . . . . . . . . . . . . . . . . . . . . . . . 17.0% 19.1% 22.6%Algeria . . . . . . . . . . . . . . . . . . . . . . . . . . . . . . . . . . . . . . . . . . . . . . . . . . . . . . . . . . . . . . . . 15.8% 16.3% 13.6%Pakistan . . . . . . . . . . . . . . . . . . . . . . . . . . . . . . . . . . . . . . . . . . . . . . . . . . . . . . . . . . . . . . . 14.3% 14.1% 20.9%Bangladesh . . . . . . . . . . . . . . . . . . . . . . . . . . . . . . . . . . . . . . . . . . . . . . . . . . . . . . . . . . . . 14.6% 15.8% 17.8%Kazakhstan . . . . . . . . . . . . . . . . . . . . . . . . . . . . . . . . . . . . . . . . . . . . . . . . . . . . . . . . . . . . 18.8% 20.3% 13.0%Kyrgyzstan . . . . . . . . . . . . . . . . . . . . . . . . . . . . . . . . . . . . . . . . . . . . . . . . . . . . . . . . . . . . 17.0% 12.3% 14.1%Uzbekistan . . . . . . . . . . . . . . . . . . . . . . . . . . . . . . . . . . . . . . . . . . . . . . . . . . . . . . . . . . . . . 18.2% 16.3% 20.0%Armenia . . . . . . . . . . . . . . . . . . . . . . . . . . . . . . . . . . . . . . . . . . . . . . . . . . . . . . . . . . . . . . . 14.1% 11.8% 15.7%Georgia . . . . . . . . . . . . . . . . . . . . . . . . . . . . . . . . . . . . . . . . . . . . . . . . . . . . . . . . . . . . . . . 17.3% 16.4% 18.9%Tajikistan . . . . . . . . . . . . . . . . . . . . . . . . . . . . . . . . . . . . . . . . . . . . . . . . . . . . . . . . . . . . . . n.a. 13.6% 12.9%
Sensitivity to changes in assumptions
The following table illustrates the CGUs with limited headroom and potential impairments that would needto be recorded if certain key parameters would adversely change by one percentage point. Any additional adversechanges in the key parameters by more than one percentage point would increase the amount of impairmentexposure approximately proportionally.
Potential impairment if an assumption changes by 1%
CGUHeadroom
in USD Discount RateAvg. growth
rateAvg. operating
marginAvg. CAPEX /
RevenueTerminal
growth rate
Armenia . . . . . . . . . . . . . . . . . . . — 12 7 6 4 9
11 Income taxes
Accounting policies
Income taxes
Income tax expense represents the aggregate amount determined on the profit for the period based oncurrent tax and deferred tax.
In circumstances where the tax relates to items that are charged to other comprehensive income or directlyto equity, the tax is also charged respectively to other comprehensive income or directly to equity.
Uncertain tax positions
The Group’s policy is to comply with the applicable tax regulations in the jurisdictions in which itsoperations are subject to income taxes. The Group’s estimates of current income tax expense and liabilities arecalculated assuming that all tax computations filed by the Company’s subsidiaries will be subject to a review oraudit by the relevant tax authorities. The Company and the relevant tax authorities may have differentinterpretations of how regulations should be applied to actual transactions (refer Note 25 and Note 27,respectively, for further details regarding provisions recognized and risks and uncertainties). Such uncertain taxpositions are accounted for in accordance with IAS 12 ‘Income Taxes’.
Deferred taxation
Deferred taxes are recognized using the liability method and thus are computed as the taxes recoverable orpayable in future periods in respect of deductible or taxable temporary differences.
F-39
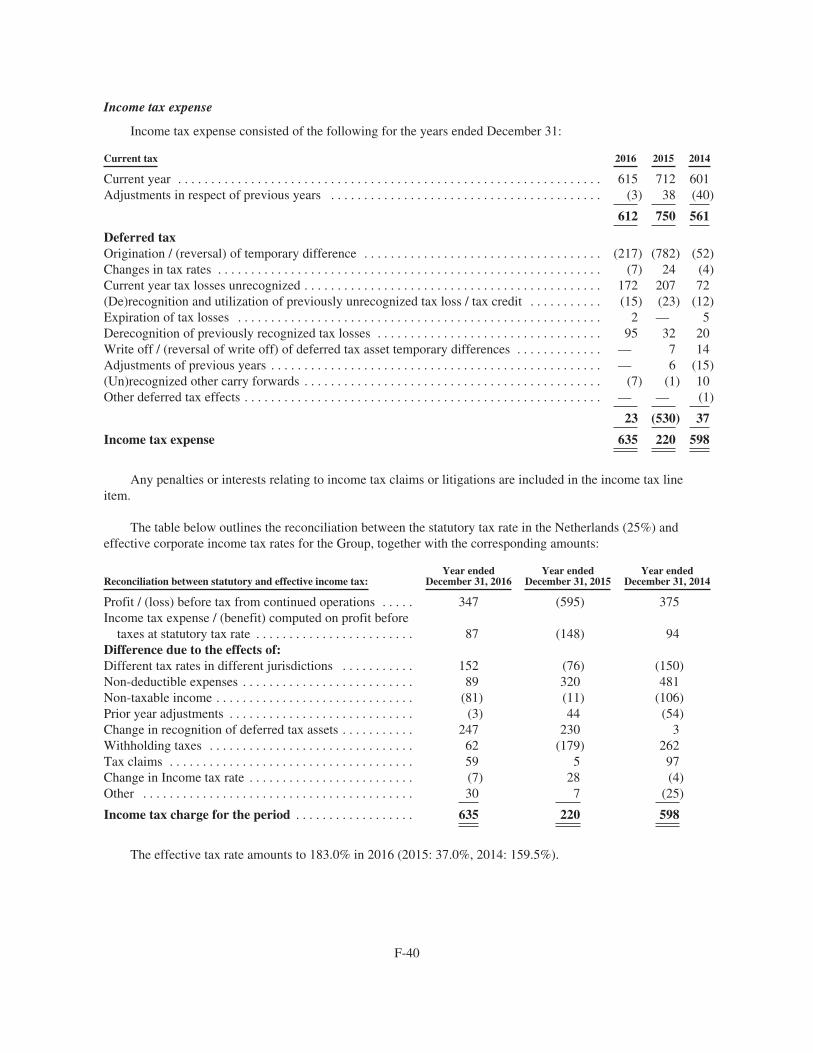
Income tax expense
Income tax expense consisted of the following for the years ended December 31:
Current tax 2016 2015 2014
Current year . . . . . . . . . . . . . . . . . . . . . . . . . . . . . . . . . . . . . . . . . . . . . . . . . . . . . . . . . . . . . . . . 615 712 601Adjustments in respect of previous years . . . . . . . . . . . . . . . . . . . . . . . . . . . . . . . . . . . . . . . . . (3) 38 (40)
612 750 561
Deferred taxOrigination / (reversal) of temporary difference . . . . . . . . . . . . . . . . . . . . . . . . . . . . . . . . . . . . (217) (782) (52)Changes in tax rates . . . . . . . . . . . . . . . . . . . . . . . . . . . . . . . . . . . . . . . . . . . . . . . . . . . . . . . . . . (7) 24 (4)Current year tax losses unrecognized . . . . . . . . . . . . . . . . . . . . . . . . . . . . . . . . . . . . . . . . . . . . . 172 207 72(De)recognition and utilization of previously unrecognized tax loss / tax credit . . . . . . . . . . . (15) (23) (12)Expiration of tax losses . . . . . . . . . . . . . . . . . . . . . . . . . . . . . . . . . . . . . . . . . . . . . . . . . . . . . . . 2 — 5Derecognition of previously recognized tax losses . . . . . . . . . . . . . . . . . . . . . . . . . . . . . . . . . . 95 32 20Write off / (reversal of write off) of deferred tax asset temporary differences . . . . . . . . . . . . . — 7 14Adjustments of previous years . . . . . . . . . . . . . . . . . . . . . . . . . . . . . . . . . . . . . . . . . . . . . . . . . . — 6 (15)(Un)recognized other carry forwards . . . . . . . . . . . . . . . . . . . . . . . . . . . . . . . . . . . . . . . . . . . . . (7) (1) 10Other deferred tax effects . . . . . . . . . . . . . . . . . . . . . . . . . . . . . . . . . . . . . . . . . . . . . . . . . . . . . . — — (1)
23 (530) 37
Income tax expense 635 220 598
Any penalties or interests relating to income tax claims or litigations are included in the income tax lineitem.
The table below outlines the reconciliation between the statutory tax rate in the Netherlands (25%) andeffective corporate income tax rates for the Group, together with the corresponding amounts:
Reconciliation between statutory and effective income tax:Year ended
December 31, 2016Year ended
December 31, 2015Year ended
December 31, 2014
Profit / (loss) before tax from continued operations . . . . . 347 (595) 375Income tax expense / (benefit) computed on profit before
taxes at statutory tax rate . . . . . . . . . . . . . . . . . . . . . . . . 87 (148) 94Difference due to the effects of:Different tax rates in different jurisdictions . . . . . . . . . . . 152 (76) (150)Non-deductible expenses . . . . . . . . . . . . . . . . . . . . . . . . . . 89 320 481Non-taxable income . . . . . . . . . . . . . . . . . . . . . . . . . . . . . . (81) (11) (106)Prior year adjustments . . . . . . . . . . . . . . . . . . . . . . . . . . . . (3) 44 (54)Change in recognition of deferred tax assets . . . . . . . . . . . 247 230 3Withholding taxes . . . . . . . . . . . . . . . . . . . . . . . . . . . . . . . 62 (179) 262Tax claims . . . . . . . . . . . . . . . . . . . . . . . . . . . . . . . . . . . . . 59 5 97Change in Income tax rate . . . . . . . . . . . . . . . . . . . . . . . . . (7) 28 (4)Other . . . . . . . . . . . . . . . . . . . . . . . . . . . . . . . . . . . . . . . . . 30 7 (25)
Income tax charge for the period . . . . . . . . . . . . . . . . . . 635 220 598
The effective tax rate amounts to 183.0% in 2016 (2015: 37.0%, 2014: 159.5%).
F-40
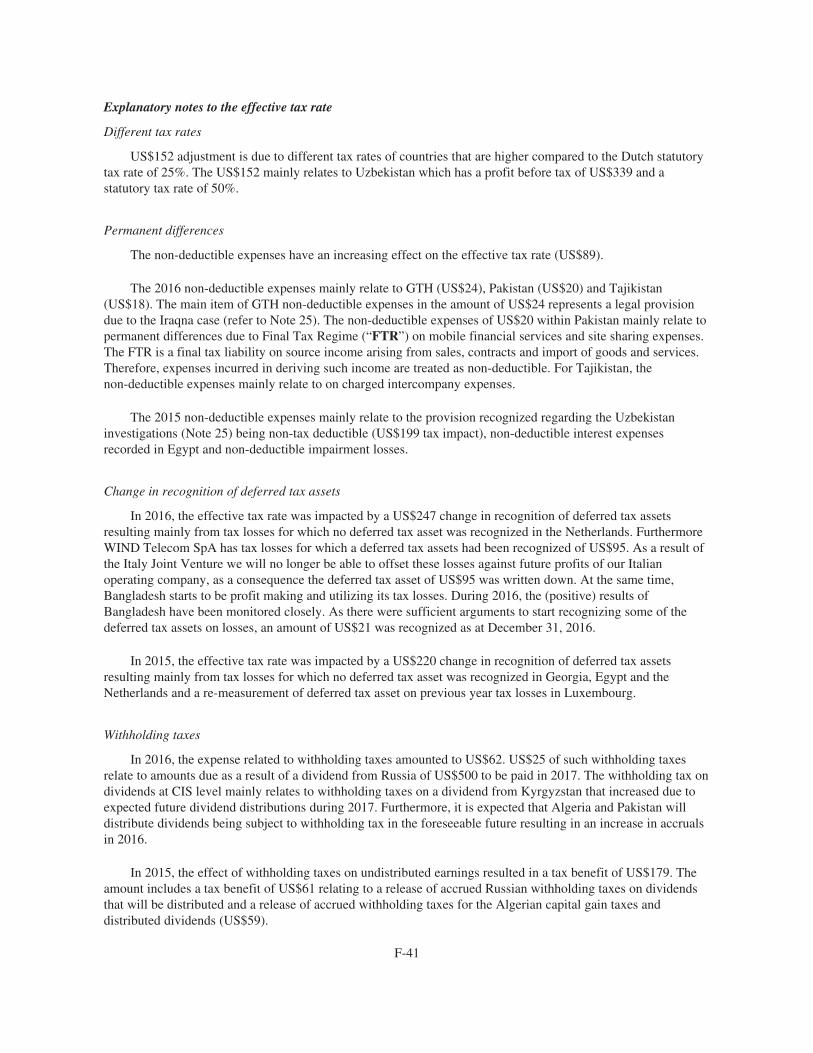
Explanatory notes to the effective tax rate
Different tax rates
US$152 adjustment is due to different tax rates of countries that are higher compared to the Dutch statutorytax rate of 25%. The US$152 mainly relates to Uzbekistan which has a profit before tax of US$339 and astatutory tax rate of 50%.
Permanent differences
The non-deductible expenses have an increasing effect on the effective tax rate (US$89).
The 2016 non-deductible expenses mainly relate to GTH (US$24), Pakistan (US$20) and Tajikistan(US$18). The main item of GTH non-deductible expenses in the amount of US$24 represents a legal provisiondue to the Iraqna case (refer to Note 25). The non-deductible expenses of US$20 within Pakistan mainly relate topermanent differences due to Final Tax Regime (“FTR”) on mobile financial services and site sharing expenses.The FTR is a final tax liability on source income arising from sales, contracts and import of goods and services.Therefore, expenses incurred in deriving such income are treated as non-deductible. For Tajikistan, thenon-deductible expenses mainly relate to on charged intercompany expenses.
The 2015 non-deductible expenses mainly relate to the provision recognized regarding the Uzbekistaninvestigations (Note 25) being non-tax deductible (US$199 tax impact), non-deductible interest expensesrecorded in Egypt and non-deductible impairment losses.
Change in recognition of deferred tax assets
In 2016, the effective tax rate was impacted by a US$247 change in recognition of deferred tax assetsresulting mainly from tax losses for which no deferred tax asset was recognized in the Netherlands. FurthermoreWIND Telecom SpA has tax losses for which a deferred tax assets had been recognized of US$95. As a result ofthe Italy Joint Venture we will no longer be able to offset these losses against future profits of our Italianoperating company, as a consequence the deferred tax asset of US$95 was written down. At the same time,Bangladesh starts to be profit making and utilizing its tax losses. During 2016, the (positive) results ofBangladesh have been monitored closely. As there were sufficient arguments to start recognizing some of thedeferred tax assets on losses, an amount of US$21 was recognized as at December 31, 2016.
In 2015, the effective tax rate was impacted by a US$220 change in recognition of deferred tax assetsresulting mainly from tax losses for which no deferred tax asset was recognized in Georgia, Egypt and theNetherlands and a re-measurement of deferred tax asset on previous year tax losses in Luxembourg.
Withholding taxes
In 2016, the expense related to withholding taxes amounted to US$62. US$25 of such withholding taxesrelate to amounts due as a result of a dividend from Russia of US$500 to be paid in 2017. The withholding tax ondividends at CIS level mainly relates to withholding taxes on a dividend from Kyrgyzstan that increased due toexpected future dividend distributions during 2017. Furthermore, it is expected that Algeria and Pakistan willdistribute dividends being subject to withholding tax in the foreseeable future resulting in an increase in accrualsin 2016.
In 2015, the effect of withholding taxes on undistributed earnings resulted in a tax benefit of US$179. Theamount includes a tax benefit of US$61 relating to a release of accrued Russian withholding taxes on dividendsthat will be distributed and a release of accrued withholding taxes for the Algerian capital gain taxes anddistributed dividends (US$59).
F-41
Furthermore, the Company released the accrued withholding taxes on distribution of dividends from theformer CIS region after the restructuring of Kar-tel and Sky-Mobile (US$75). The Company also accrued forwithholding taxes on future distributions resulting in a net impact of US$58.
Prior year adjustments
The effect of prior year adjustments of US$3 decreased the effective tax rate and mainly relate toLuxembourg for an amount of US$3 due to adjustment in carry forward losses arising due to filing to annual taxreturn.
Tax claims
The tax claims relate to provisions for uncertain income tax positions (see Note 25).
Changes in income tax rates
Changes in income tax rates of US$7 decreased the effective tax rate. The nominal tax rate decreased inPakistan (from 32% to 31% in 2016).
In 2015, the increase of the effective tax rate was mainly caused by the nominal tax rate increase inUzbekistan (from 7.5% to 53% as from 2016).
Minimum taxes and other
US$30 mainly relates to recorded alternative minimum taxes (US$11) and tax credits (US$14) for Pakistan.
Deferred taxes
As at December 31, 2016 and December 31, 2015, the Group reported the following deferred tax assets andliabilities in the statement of financial position:
December 31,2016
December 31,2015
Deferred tax assets . . . . . . . . . . . . . . . . . . . . . . . . . . . . . . . . . . . . . . . . . . . . . . . . . . . . . 343 150Deferred tax liabilities . . . . . . . . . . . . . . . . . . . . . . . . . . . . . . . . . . . . . . . . . . . . . . . . . . (331) (404)
Net deferred tax position . . . . . . . . . . . . . . . . . . . . . . . . . . . . . . . . . . . . . . . . . . . . . . . . 12 (254)
F-42
The following table shows the movements of the deferred tax assets and liabilities in 2016:
Movements in Deferred taxes
Openingbalance
Net incomestatementmovement
Changes incompositionof the group
Othercomprehensive
income &Other
Currencytranslation
Tax ratechanges
Endingbalance
Property, plant and equipment,net . . . . . . . . . . . . . . . . . . . . . . (499) 32 74 26 (54) 1 (420)
Intangible assets, net . . . . . . . . . (228) 32 (3) 37 (3) (1) (166)Trade accounts receivable . . . . . 21 13 — (1) (3) — 30Other assets . . . . . . . . . . . . . . . . (5) 3 — — (1) — (3)Provisions . . . . . . . . . . . . . . . . . . 23 3 3 (1) 1 — 29Long-term debt . . . . . . . . . . . . . . 9 9 — (1) 8 — 25Accounts payable . . . . . . . . . . . . 71 8 — 1 14 — 94Other liabilities . . . . . . . . . . . . . . 45 7 1 (2) 2 — 53Other movements and temporary
differences . . . . . . . . . . . . . . . 20 — — 1 1 — 23Deferred subnational income
taxes and other . . . . . . . . . . . . (2) 1 (2) 2 — — (1)Withholding tax on
undistributed earnings . . . . . . (45) (26) — — (2) — (73)
(590) 82 73 62 (37) — (409)Tax losses and other carry
forwards* . . . . . . . . . . . . . . . . 2,613 (89) 233 (14) (298) (174) 2,270Non recognized deferred tax
assets on losses andcredits* . . . . . . . . . . . . . . . . . . (2,263) — — (44) 311 174 (1,822)
Non recognized deferred taxassets on temporarydifferences . . . . . . . . . . . . . . . (14) (16) — 3 — (27)
Net deferred tax position . . . . . . (254) (23) 306 4 (21) — 12
* The deferred tax movements in other comprehensive income for the period ended December 31, 2016 relates to non-recognized deferredtax asset on losses of US$3 for Wind Telecom S.p.A.
The movement in net deferred tax position mainly relates to recognition of losses for Pakistan due to theacquisition of Warid Telecom.
As at December 31, 2016, the amount of deductible temporary differences for which no deferred tax asset isrecognized amounts to US$27 for Georgia.
F-43
The following table shows the movements of the deferred tax assets and liabilities in 2015:
Movements in Deferred taxes
Openingbalance
Net incomestatementmovement
Changes incompositionof the group
Othercomprehensive
income &Other
Currencytranslation
Tax ratechanges
Endingbalance
Property, plant and equipment,net . . . . . . . . . . . . . . . . . . . . . . (547) (9) (8) — 95 (30) (499)
Intangible assets, net . . . . . . . . . (774) 73 401 — 80 (8) (228)Trade accounts receivable . . . . . 74 25 (80) — (6) 8 21Other assets . . . . . . . . . . . . . . . . 303 (162) (131) — (13) (2) (5)Provisions . . . . . . . . . . . . . . . . . . 42 (5) (21) — (8) 1 9Long-term debt . . . . . . . . . . . . . . (19) 24 19 — (2) 1 23Accounts payable . . . . . . . . . . . . 69 37 (18) — (25) 8 71Other liabilities . . . . . . . . . . . . . . 84 (32) — — (12) 5 45Other movements and temporary
differences . . . . . . . . . . . . . . . 7 (3) — 18 (2) — 20Deferred subnational income
taxes and other . . . . . . . . . . . . (6) (10) 16 — (2) — (2)Withholding tax on
undistributed earnings . . . . . . (599) 540 — — 14 — (45)
(1,366) 478 178 18 119 (17) (590)Tax losses and other carry
forwards* . . . . . . . . . . . . . . . . 3,116 (72) (384) (20) (20) (7) 2,613Non recognized deferred tax
assets on losses andcredits* . . . . . . . . . . . . . . . . . . (2,646) — 384 — (1) — (2,263)
Non recognized deferred taxassets on temporarydifferences . . . . . . . . . . . . . . . (166) 153 — — (1) — (14)
Net deferred tax position . . . . . . (1,062) 559 178 (2) 97 (24) (254)
VEON recognizes a deferred tax asset for the carry forward of unused tax losses and other carry forwards tothe extent that it is probable that the deferred tax asset will be utilized. The amount and expiry date of deductibletemporary differences, unused tax losses and other carry forwards for which no deferred tax asset is recognizedare as follows as at December 31, 2016:
Tax losses year of expiration Recognized losses Recognized DTANon-recognized
losses Non-recognized DTA
0 - 5 years . . . . . . . . . . . . . . . . . . . . . (47) — (1,016) 2376 - 10 years . . . . . . . . . . . . . . . . . . . . — 9 (2,148) 537> 10 years . . . . . . . . . . . . . . . . . . . . . — — — —Indefinitely . . . . . . . . . . . . . . . . . . . . (1,223) 402 (5,137) 1,003
Total . . . . . . . . . . . . . . . . . . . . . . . . . (1,270) 411 (8,301) 1,777
Other carry forwards year of expiration Recognized credits Recognized DTANon-recognized
other carry forwards Non-recognized DTA
0 - 5 years . . . . . . . . . . . . . . . . . . . . . (37) 37 — —6 - 10 years . . . . . . . . . . . . . . . . . . . . — — — —> 10 years . . . . . . . . . . . . . . . . . . . . . — — — —Indefinitely . . . . . . . . . . . . . . . . . . . . — — (187) 45
Total . . . . . . . . . . . . . . . . . . . . . . . . . (37) 37 (187) 45
F-44
The losses mainly relate to Luxembourg (US$5,126) and Dutch holding entities (US$2,148) of whichUS$80 of losses is recognized.
The following tables show the recognized and not recognized deferred income tax assets as at December 31,2015 for comparison purposes:
Tax losses year of expiration Recognized losses Recognized DTANon-recognized
losses Non-recognized DTA
0 - 5 years . . . . . . . . . . . . . . . . . . . . . — — (2,217) 5486 - 10 years . . . . . . . . . . . . . . . . . . . . (32) 6 (1,290) 322> 10 years . . . . . . . . . . . . . . . . . . . . . — — — —Indefinitely . . . . . . . . . . . . . . . . . . . . (907) 308 (5,671) 1,340
Total . . . . . . . . . . . . . . . . . . . . . . . . . (939) 314 (9,178) 2,210
Other carry forwards year of expiration Recognized credits Recognized DTANon-recognized
other carry forwards Non-recognized DTA
0 - 5 years . . . . . . . . . . . . . . . . . . . . . (35) 35 — —6 - 10 years . . . . . . . . . . . . . . . . . . . . — — — —> 10 years . . . . . . . . . . . . . . . . . . . . . — — — —Indefinitely . . . . . . . . . . . . . . . . . . . . — — (193) 53
Total . . . . . . . . . . . . . . . . . . . . . . . . . (35) 35 (193) 53
VEON reports the tax effect of the existence of undistributed profits that will be distributed in theforeseeable future. The Company has a deferred tax liability of US$73 relating to the tax effect of theundistributed profits that will be distributed in the foreseeable future, primarily in relation to its Russian,Algerian and Pakistan operations.
At December 31, 2016, undistributed earnings of VEON’s foreign subsidiaries (outside the Netherlands)which are indefinitely invested and will not be distributed in the foreseeable future, amounted to US$8,495(2015: US$8,239). Accordingly, no deferred tax liability is recognized for this amount of undistributed profits.
Taxes recorded outside the income statement
In 2015, the amount of current and deferred taxes reported outside of the income statement amounts toUS$348 comprising of US$345 current tax charge and US$(3) deferred tax charge. The current tax charge mainlyrelates to the Algerian capital gain tax of US$428, out of which US$350 was recognized directly in equity(Note 6).
Non-current income tax assets
The Company reported both current and non-current income tax assets, totaling US$194. This mainly relatesto advanced tax payments in Pakistan, Bangladesh and Ukraine which can only be offset against income taxliabilities in fiscal periods subsequent to 2016.
F-45
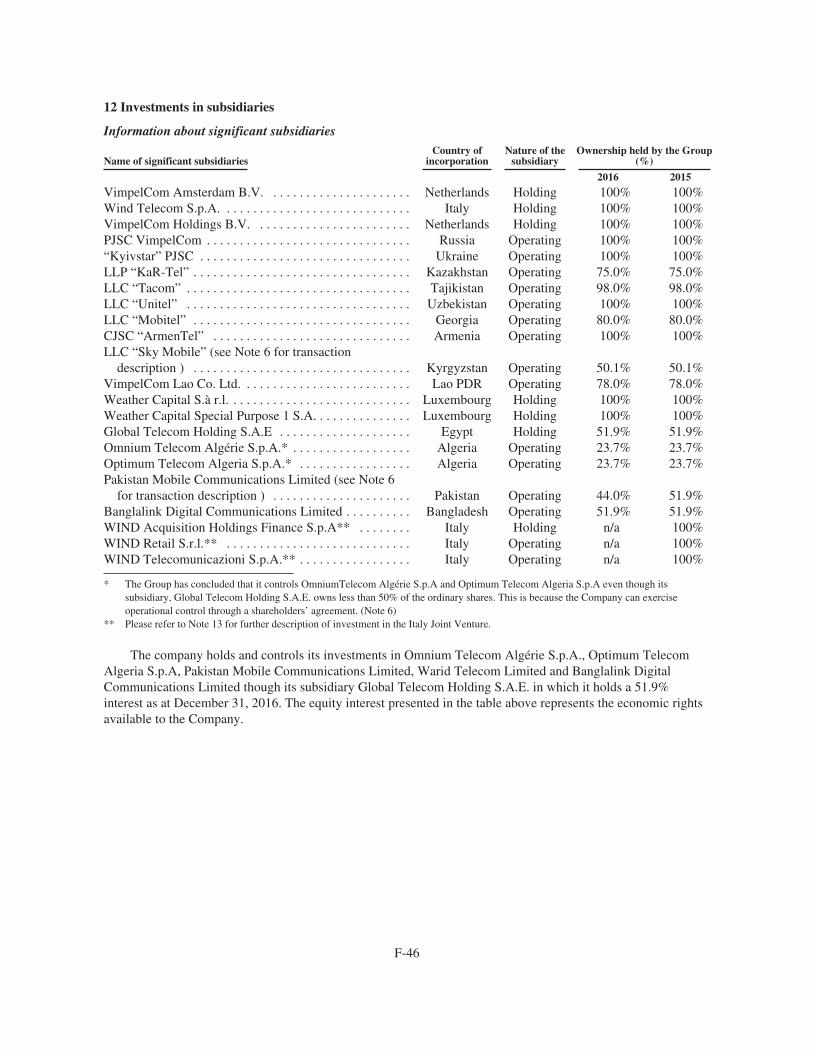
12 Investments in subsidiaries
Information about significant subsidiaries
Name of significant subsidiariesCountry of
incorporationNature of the
subsidiaryOwnership held by the Group
(%)
2016 2015
VimpelCom Amsterdam B.V. . . . . . . . . . . . . . . . . . . . . . Netherlands Holding 100% 100%Wind Telecom S.p.A. . . . . . . . . . . . . . . . . . . . . . . . . . . . . Italy Holding 100% 100%VimpelCom Holdings B.V. . . . . . . . . . . . . . . . . . . . . . . . Netherlands Holding 100% 100%PJSC VimpelCom . . . . . . . . . . . . . . . . . . . . . . . . . . . . . . . Russia Operating 100% 100%“Kyivstar” PJSC . . . . . . . . . . . . . . . . . . . . . . . . . . . . . . . . Ukraine Operating 100% 100%LLP “KaR-Tel” . . . . . . . . . . . . . . . . . . . . . . . . . . . . . . . . . Kazakhstan Operating 75.0% 75.0%LLC “Tacom” . . . . . . . . . . . . . . . . . . . . . . . . . . . . . . . . . . Tajikistan Operating 98.0% 98.0%LLC “Unitel” . . . . . . . . . . . . . . . . . . . . . . . . . . . . . . . . . . Uzbekistan Operating 100% 100%LLC “Mobitel” . . . . . . . . . . . . . . . . . . . . . . . . . . . . . . . . . Georgia Operating 80.0% 80.0%CJSC “ArmenTel” . . . . . . . . . . . . . . . . . . . . . . . . . . . . . . Armenia Operating 100% 100%LLC “Sky Mobile” (see Note 6 for transaction
description ) . . . . . . . . . . . . . . . . . . . . . . . . . . . . . . . . . Kyrgyzstan Operating 50.1% 50.1%VimpelCom Lao Co. Ltd. . . . . . . . . . . . . . . . . . . . . . . . . . Lao PDR Operating 78.0% 78.0%Weather Capital S.à r.l. . . . . . . . . . . . . . . . . . . . . . . . . . . . Luxembourg Holding 100% 100%Weather Capital Special Purpose 1 S.A. . . . . . . . . . . . . . . Luxembourg Holding 100% 100%Global Telecom Holding S.A.E . . . . . . . . . . . . . . . . . . . . Egypt Holding 51.9% 51.9%Omnium Telecom Algérie S.p.A.* . . . . . . . . . . . . . . . . . . Algeria Operating 23.7% 23.7%Optimum Telecom Algeria S.p.A.* . . . . . . . . . . . . . . . . . Algeria Operating 23.7% 23.7%Pakistan Mobile Communications Limited (see Note 6
for transaction description ) . . . . . . . . . . . . . . . . . . . . . Pakistan Operating 44.0% 51.9%Banglalink Digital Communications Limited . . . . . . . . . . Bangladesh Operating 51.9% 51.9%WIND Acquisition Holdings Finance S.p.A** . . . . . . . . Italy Holding n/a 100%WIND Retail S.r.l.** . . . . . . . . . . . . . . . . . . . . . . . . . . . . Italy Operating n/a 100%WIND Telecomunicazioni S.p.A.** . . . . . . . . . . . . . . . . . Italy Operating n/a 100%
* The Group has concluded that it controls OmniumTelecom Algérie S.p.A and Optimum Telecom Algeria S.p.A even though itssubsidiary, Global Telecom Holding S.A.E. owns less than 50% of the ordinary shares. This is because the Company can exerciseoperational control through a shareholders’ agreement. (Note 6)
** Please refer to Note 13 for further description of investment in the Italy Joint Venture.
The company holds and controls its investments in Omnium Telecom Algérie S.p.A., Optimum TelecomAlgeria S.p.A, Pakistan Mobile Communications Limited, Warid Telecom Limited and Banglalink DigitalCommunications Limited though its subsidiary Global Telecom Holding S.A.E. in which it holds a 51.9%interest as at December 31, 2016. The equity interest presented in the table above represents the economic rightsavailable to the Company.
F-46
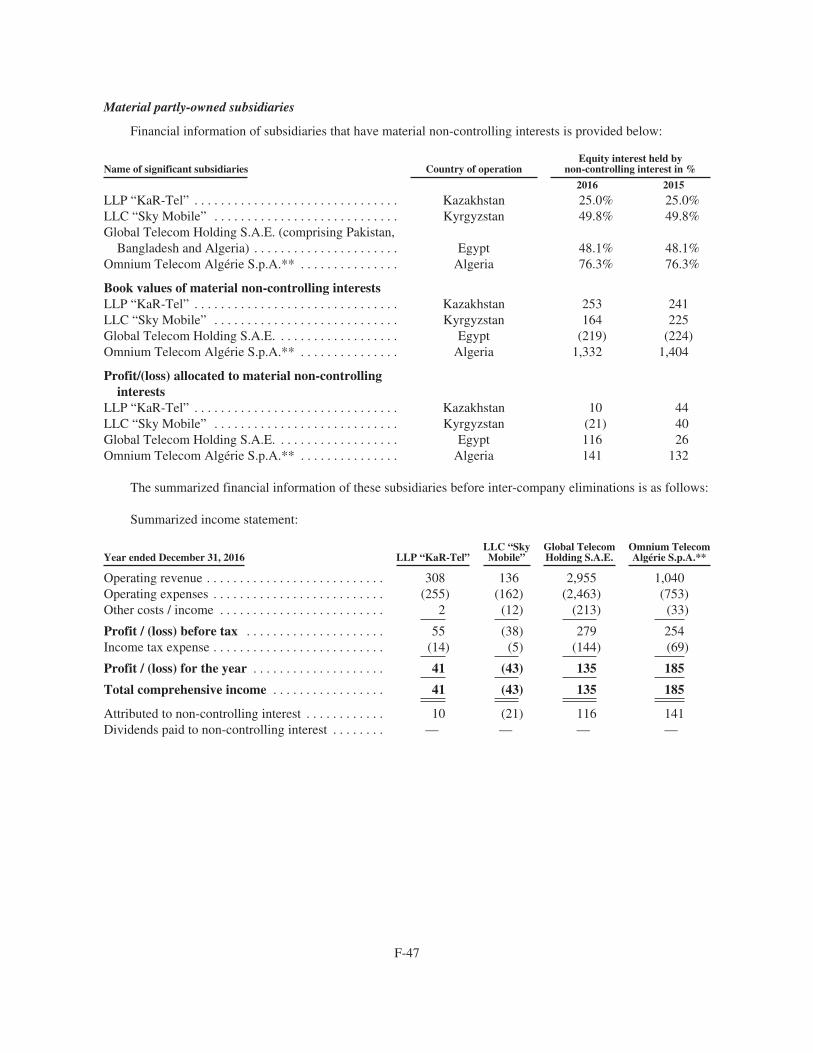
Material partly-owned subsidiaries
Financial information of subsidiaries that have material non-controlling interests is provided below:
Name of significant subsidiaries Country of operationEquity interest held by
non-controlling interest in %
2016 2015
LLP “KaR-Tel” . . . . . . . . . . . . . . . . . . . . . . . . . . . . . . . Kazakhstan 25.0% 25.0%LLC “Sky Mobile” . . . . . . . . . . . . . . . . . . . . . . . . . . . . Kyrgyzstan 49.8% 49.8%Global Telecom Holding S.A.E. (comprising Pakistan,
Bangladesh and Algeria) . . . . . . . . . . . . . . . . . . . . . . Egypt 48.1% 48.1%Omnium Telecom Algérie S.p.A.** . . . . . . . . . . . . . . . Algeria 76.3% 76.3%
Book values of material non-controlling interestsLLP “KaR-Tel” . . . . . . . . . . . . . . . . . . . . . . . . . . . . . . . Kazakhstan 253 241LLC “Sky Mobile” . . . . . . . . . . . . . . . . . . . . . . . . . . . . Kyrgyzstan 164 225Global Telecom Holding S.A.E. . . . . . . . . . . . . . . . . . . Egypt (219) (224)Omnium Telecom Algérie S.p.A.** . . . . . . . . . . . . . . . Algeria 1,332 1,404
Profit/(loss) allocated to material non-controllinginterests
LLP “KaR-Tel” . . . . . . . . . . . . . . . . . . . . . . . . . . . . . . . Kazakhstan 10 44LLC “Sky Mobile” . . . . . . . . . . . . . . . . . . . . . . . . . . . . Kyrgyzstan (21) 40Global Telecom Holding S.A.E. . . . . . . . . . . . . . . . . . . Egypt 116 26Omnium Telecom Algérie S.p.A.** . . . . . . . . . . . . . . . Algeria 141 132
The summarized financial information of these subsidiaries before inter-company eliminations is as follows:
Summarized income statement:
Year ended December 31, 2016 LLP “KaR-Tel”LLC “SkyMobile”
Global TelecomHolding S.A.E.
Omnium TelecomAlgérie S.p.A.**
Operating revenue . . . . . . . . . . . . . . . . . . . . . . . . . . . 308 136 2,955 1,040Operating expenses . . . . . . . . . . . . . . . . . . . . . . . . . . (255) (162) (2,463) (753)Other costs / income . . . . . . . . . . . . . . . . . . . . . . . . . 2 (12) (213) (33)
Profit / (loss) before tax . . . . . . . . . . . . . . . . . . . . . 55 (38) 279 254Income tax expense . . . . . . . . . . . . . . . . . . . . . . . . . . (14) (5) (144) (69)
Profit / (loss) for the year . . . . . . . . . . . . . . . . . . . . 41 (43) 135 185
Total comprehensive income . . . . . . . . . . . . . . . . . 41 (43) 135 185
Attributed to non-controlling interest . . . . . . . . . . . . 10 (21) 116 141Dividends paid to non-controlling interest . . . . . . . . — — — —
F-47
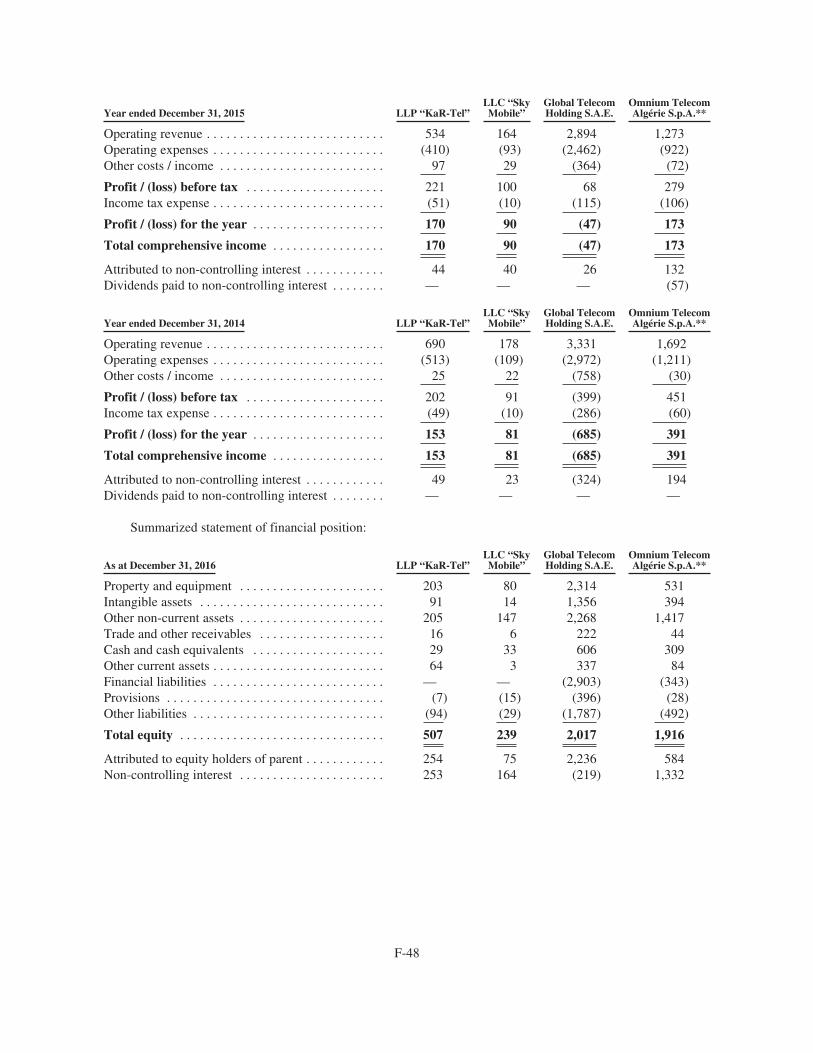
Year ended December 31, 2015 LLP “KaR-Tel”LLC “SkyMobile”
Global TelecomHolding S.A.E.
Omnium TelecomAlgérie S.p.A.**
Operating revenue . . . . . . . . . . . . . . . . . . . . . . . . . . . 534 164 2,894 1,273Operating expenses . . . . . . . . . . . . . . . . . . . . . . . . . . (410) (93) (2,462) (922)Other costs / income . . . . . . . . . . . . . . . . . . . . . . . . . 97 29 (364) (72)
Profit / (loss) before tax . . . . . . . . . . . . . . . . . . . . . 221 100 68 279Income tax expense . . . . . . . . . . . . . . . . . . . . . . . . . . (51) (10) (115) (106)
Profit / (loss) for the year . . . . . . . . . . . . . . . . . . . . 170 90 (47) 173
Total comprehensive income . . . . . . . . . . . . . . . . . 170 90 (47) 173
Attributed to non-controlling interest . . . . . . . . . . . . 44 40 26 132Dividends paid to non-controlling interest . . . . . . . . — — — (57)
Year ended December 31, 2014 LLP “KaR-Tel”LLC “SkyMobile”
Global TelecomHolding S.A.E.
Omnium TelecomAlgérie S.p.A.**
Operating revenue . . . . . . . . . . . . . . . . . . . . . . . . . . . 690 178 3,331 1,692Operating expenses . . . . . . . . . . . . . . . . . . . . . . . . . . (513) (109) (2,972) (1,211)Other costs / income . . . . . . . . . . . . . . . . . . . . . . . . . 25 22 (758) (30)
Profit / (loss) before tax . . . . . . . . . . . . . . . . . . . . . 202 91 (399) 451Income tax expense . . . . . . . . . . . . . . . . . . . . . . . . . . (49) (10) (286) (60)
Profit / (loss) for the year . . . . . . . . . . . . . . . . . . . . 153 81 (685) 391
Total comprehensive income . . . . . . . . . . . . . . . . . 153 81 (685) 391
Attributed to non-controlling interest . . . . . . . . . . . . 49 23 (324) 194Dividends paid to non-controlling interest . . . . . . . . — — — —
Summarized statement of financial position:
As at December 31, 2016 LLP “KaR-Tel”LLC “SkyMobile”
Global TelecomHolding S.A.E.
Omnium TelecomAlgérie S.p.A.**
Property and equipment . . . . . . . . . . . . . . . . . . . . . . 203 80 2,314 531Intangible assets . . . . . . . . . . . . . . . . . . . . . . . . . . . . 91 14 1,356 394Other non-current assets . . . . . . . . . . . . . . . . . . . . . . 205 147 2,268 1,417Trade and other receivables . . . . . . . . . . . . . . . . . . . 16 6 222 44Cash and cash equivalents . . . . . . . . . . . . . . . . . . . . 29 33 606 309Other current assets . . . . . . . . . . . . . . . . . . . . . . . . . . 64 3 337 84Financial liabilities . . . . . . . . . . . . . . . . . . . . . . . . . . — — (2,903) (343)Provisions . . . . . . . . . . . . . . . . . . . . . . . . . . . . . . . . . (7) (15) (396) (28)Other liabilities . . . . . . . . . . . . . . . . . . . . . . . . . . . . . (94) (29) (1,787) (492)
Total equity . . . . . . . . . . . . . . . . . . . . . . . . . . . . . . . 507 239 2,017 1,916
Attributed to equity holders of parent . . . . . . . . . . . . 254 75 2,236 584Non-controlling interest . . . . . . . . . . . . . . . . . . . . . . 253 164 (219) 1,332
F-48
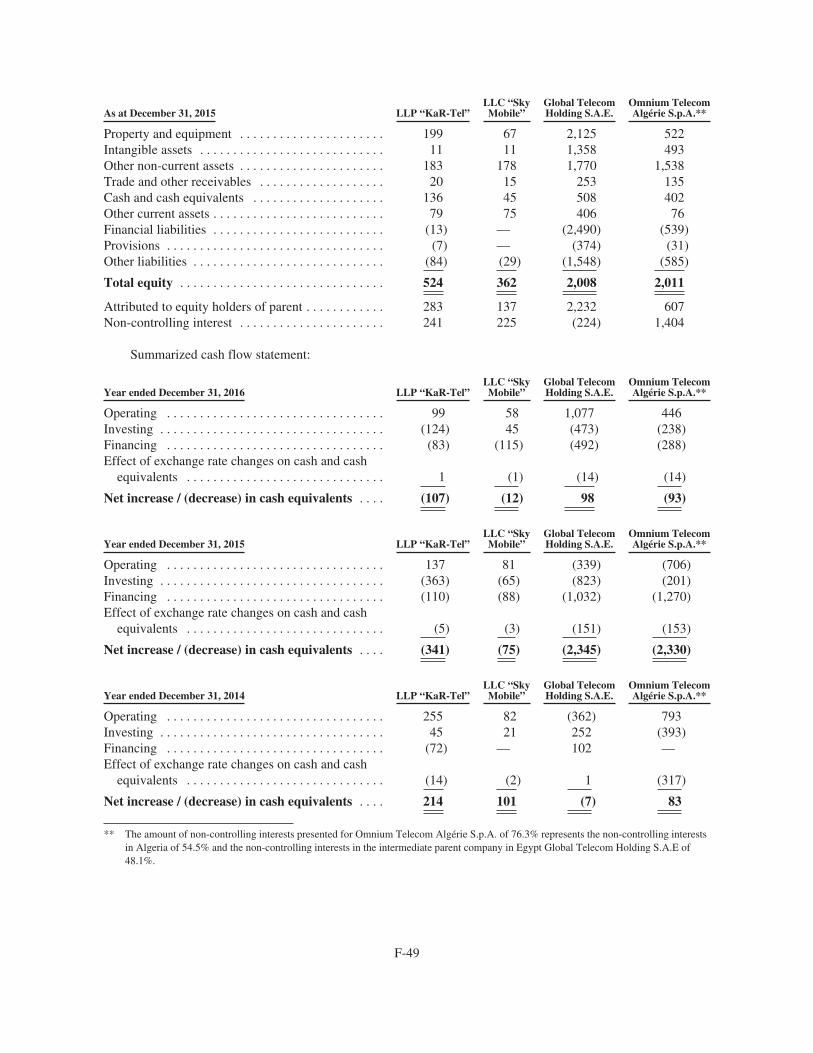
As at December 31, 2015 LLP “KaR-Tel”LLC “SkyMobile”
Global TelecomHolding S.A.E.
Omnium TelecomAlgérie S.p.A.**
Property and equipment . . . . . . . . . . . . . . . . . . . . . . 199 67 2,125 522Intangible assets . . . . . . . . . . . . . . . . . . . . . . . . . . . . 11 11 1,358 493Other non-current assets . . . . . . . . . . . . . . . . . . . . . . 183 178 1,770 1,538Trade and other receivables . . . . . . . . . . . . . . . . . . . 20 15 253 135Cash and cash equivalents . . . . . . . . . . . . . . . . . . . . 136 45 508 402Other current assets . . . . . . . . . . . . . . . . . . . . . . . . . . 79 75 406 76Financial liabilities . . . . . . . . . . . . . . . . . . . . . . . . . . (13) — (2,490) (539)Provisions . . . . . . . . . . . . . . . . . . . . . . . . . . . . . . . . . (7) — (374) (31)Other liabilities . . . . . . . . . . . . . . . . . . . . . . . . . . . . . (84) (29) (1,548) (585)
Total equity . . . . . . . . . . . . . . . . . . . . . . . . . . . . . . . 524 362 2,008 2,011
Attributed to equity holders of parent . . . . . . . . . . . . 283 137 2,232 607Non-controlling interest . . . . . . . . . . . . . . . . . . . . . . 241 225 (224) 1,404
Summarized cash flow statement:
Year ended December 31, 2016 LLP “KaR-Tel”LLC “SkyMobile”
Global TelecomHolding S.A.E.
Omnium TelecomAlgérie S.p.A.**
Operating . . . . . . . . . . . . . . . . . . . . . . . . . . . . . . . . . 99 58 1,077 446Investing . . . . . . . . . . . . . . . . . . . . . . . . . . . . . . . . . . (124) 45 (473) (238)Financing . . . . . . . . . . . . . . . . . . . . . . . . . . . . . . . . . (83) (115) (492) (288)Effect of exchange rate changes on cash and cash
equivalents . . . . . . . . . . . . . . . . . . . . . . . . . . . . . . 1 (1) (14) (14)
Net increase / (decrease) in cash equivalents . . . . (107) (12) 98 (93)
Year ended December 31, 2015 LLP “KaR-Tel”LLC “SkyMobile”
Global TelecomHolding S.A.E.
Omnium TelecomAlgérie S.p.A.**
Operating . . . . . . . . . . . . . . . . . . . . . . . . . . . . . . . . . 137 81 (339) (706)Investing . . . . . . . . . . . . . . . . . . . . . . . . . . . . . . . . . . (363) (65) (823) (201)Financing . . . . . . . . . . . . . . . . . . . . . . . . . . . . . . . . . (110) (88) (1,032) (1,270)Effect of exchange rate changes on cash and cash
equivalents . . . . . . . . . . . . . . . . . . . . . . . . . . . . . . (5) (3) (151) (153)
Net increase / (decrease) in cash equivalents . . . . (341) (75) (2,345) (2,330)
Year ended December 31, 2014 LLP “KaR-Tel”LLC “SkyMobile”
Global TelecomHolding S.A.E.
Omnium TelecomAlgérie S.p.A.**
Operating . . . . . . . . . . . . . . . . . . . . . . . . . . . . . . . . . 255 82 (362) 793Investing . . . . . . . . . . . . . . . . . . . . . . . . . . . . . . . . . . 45 21 252 (393)Financing . . . . . . . . . . . . . . . . . . . . . . . . . . . . . . . . . (72) — 102 —Effect of exchange rate changes on cash and cash
equivalents . . . . . . . . . . . . . . . . . . . . . . . . . . . . . . (14) (2) 1 (317)
Net increase / (decrease) in cash equivalents . . . . 214 101 (7) 83
** The amount of non-controlling interests presented for Omnium Telecom Algérie S.p.A. of 76.3% represents the non-controlling interestsin Algeria of 54.5% and the non-controlling interests in the intermediate parent company in Egypt Global Telecom Holding S.A.E of48.1%.
F-49
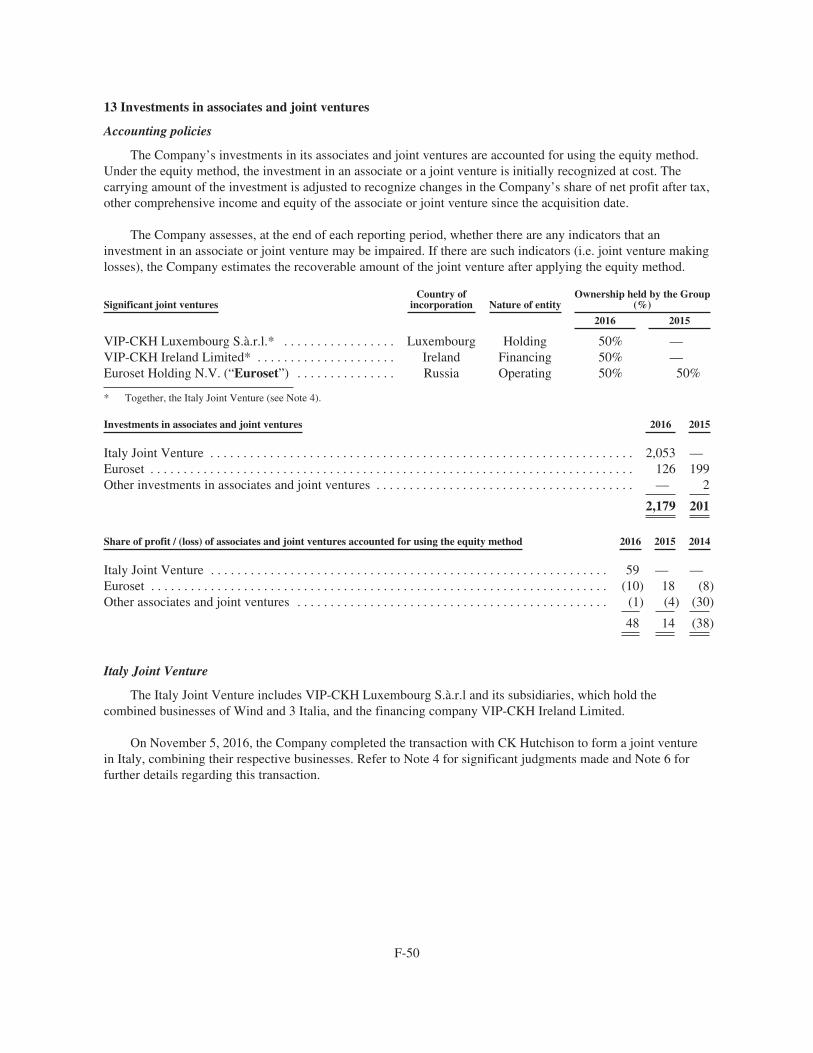
13 Investments in associates and joint ventures
Accounting policies
The Company’s investments in its associates and joint ventures are accounted for using the equity method.Under the equity method, the investment in an associate or a joint venture is initially recognized at cost. Thecarrying amount of the investment is adjusted to recognize changes in the Company’s share of net profit after tax,other comprehensive income and equity of the associate or joint venture since the acquisition date.
The Company assesses, at the end of each reporting period, whether there are any indicators that aninvestment in an associate or joint venture may be impaired. If there are such indicators (i.e. joint venture makinglosses), the Company estimates the recoverable amount of the joint venture after applying the equity method.
Significant joint venturesCountry of
incorporation Nature of entityOwnership held by the Group
(%)
2016 2015
VIP-CKH Luxembourg S.à.r.l.* . . . . . . . . . . . . . . . . . Luxembourg Holding 50% —VIP-CKH Ireland Limited* . . . . . . . . . . . . . . . . . . . . . Ireland Financing 50% —Euroset Holding N.V. (“Euroset”) . . . . . . . . . . . . . . . Russia Operating 50% 50%
* Together, the Italy Joint Venture (see Note 4).
Investments in associates and joint ventures 2016 2015
Italy Joint Venture . . . . . . . . . . . . . . . . . . . . . . . . . . . . . . . . . . . . . . . . . . . . . . . . . . . . . . . . . . . . . . . . 2,053 —Euroset . . . . . . . . . . . . . . . . . . . . . . . . . . . . . . . . . . . . . . . . . . . . . . . . . . . . . . . . . . . . . . . . . . . . . . . . . 126 199Other investments in associates and joint ventures . . . . . . . . . . . . . . . . . . . . . . . . . . . . . . . . . . . . . . . — 2
2,179 201
Share of profit / (loss) of associates and joint ventures accounted for using the equity method 2016 2015 2014
Italy Joint Venture . . . . . . . . . . . . . . . . . . . . . . . . . . . . . . . . . . . . . . . . . . . . . . . . . . . . . . . . . . . . 59 — —Euroset . . . . . . . . . . . . . . . . . . . . . . . . . . . . . . . . . . . . . . . . . . . . . . . . . . . . . . . . . . . . . . . . . . . . . (10) 18 (8)Other associates and joint ventures . . . . . . . . . . . . . . . . . . . . . . . . . . . . . . . . . . . . . . . . . . . . . . . (1) (4) (30)
48 14 (38)
Italy Joint Venture
The Italy Joint Venture includes VIP-CKH Luxembourg S.à.r.l and its subsidiaries, which hold thecombined businesses of Wind and 3 Italia, and the financing company VIP-CKH Ireland Limited.
On November 5, 2016, the Company completed the transaction with CK Hutchison to form a joint venturein Italy, combining their respective businesses. Refer to Note 4 for significant judgments made and Note 6 forfurther details regarding this transaction.
F-50
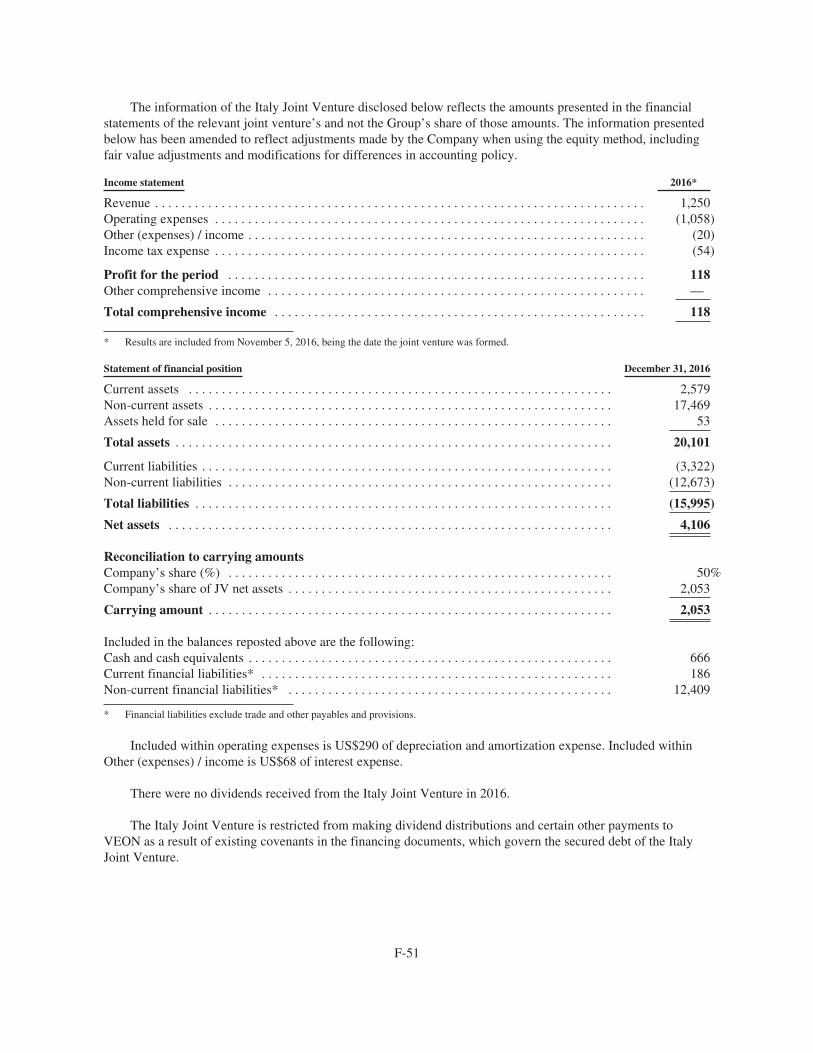
The information of the Italy Joint Venture disclosed below reflects the amounts presented in the financialstatements of the relevant joint venture’s and not the Group’s share of those amounts. The information presentedbelow has been amended to reflect adjustments made by the Company when using the equity method, includingfair value adjustments and modifications for differences in accounting policy.
Income statement 2016*
Revenue . . . . . . . . . . . . . . . . . . . . . . . . . . . . . . . . . . . . . . . . . . . . . . . . . . . . . . . . . . . . . . . . . . . . . . . . . . 1,250Operating expenses . . . . . . . . . . . . . . . . . . . . . . . . . . . . . . . . . . . . . . . . . . . . . . . . . . . . . . . . . . . . . . . . . (1,058)Other (expenses) / income . . . . . . . . . . . . . . . . . . . . . . . . . . . . . . . . . . . . . . . . . . . . . . . . . . . . . . . . . . . . (20)Income tax expense . . . . . . . . . . . . . . . . . . . . . . . . . . . . . . . . . . . . . . . . . . . . . . . . . . . . . . . . . . . . . . . . . (54)
Profit for the period . . . . . . . . . . . . . . . . . . . . . . . . . . . . . . . . . . . . . . . . . . . . . . . . . . . . . . . . . . . . . . . 118Other comprehensive income . . . . . . . . . . . . . . . . . . . . . . . . . . . . . . . . . . . . . . . . . . . . . . . . . . . . . . . . . —
Total comprehensive income . . . . . . . . . . . . . . . . . . . . . . . . . . . . . . . . . . . . . . . . . . . . . . . . . . . . . . . . 118
* Results are included from November 5, 2016, being the date the joint venture was formed.
Statement of financial position December 31, 2016
Current assets . . . . . . . . . . . . . . . . . . . . . . . . . . . . . . . . . . . . . . . . . . . . . . . . . . . . . . . . . . . . . . . . 2,579Non-current assets . . . . . . . . . . . . . . . . . . . . . . . . . . . . . . . . . . . . . . . . . . . . . . . . . . . . . . . . . . . . . 17,469Assets held for sale . . . . . . . . . . . . . . . . . . . . . . . . . . . . . . . . . . . . . . . . . . . . . . . . . . . . . . . . . . . . 53
Total assets . . . . . . . . . . . . . . . . . . . . . . . . . . . . . . . . . . . . . . . . . . . . . . . . . . . . . . . . . . . . . . . . . . 20,101
Current liabilities . . . . . . . . . . . . . . . . . . . . . . . . . . . . . . . . . . . . . . . . . . . . . . . . . . . . . . . . . . . . . . (3,322)Non-current liabilities . . . . . . . . . . . . . . . . . . . . . . . . . . . . . . . . . . . . . . . . . . . . . . . . . . . . . . . . . . (12,673)
Total liabilities . . . . . . . . . . . . . . . . . . . . . . . . . . . . . . . . . . . . . . . . . . . . . . . . . . . . . . . . . . . . . . . (15,995)
Net assets . . . . . . . . . . . . . . . . . . . . . . . . . . . . . . . . . . . . . . . . . . . . . . . . . . . . . . . . . . . . . . . . . . . 4,106
Reconciliation to carrying amountsCompany’s share (%) . . . . . . . . . . . . . . . . . . . . . . . . . . . . . . . . . . . . . . . . . . . . . . . . . . . . . . . . . . 50%Company’s share of JV net assets . . . . . . . . . . . . . . . . . . . . . . . . . . . . . . . . . . . . . . . . . . . . . . . . . 2,053
Carrying amount . . . . . . . . . . . . . . . . . . . . . . . . . . . . . . . . . . . . . . . . . . . . . . . . . . . . . . . . . . . . . 2,053
Included in the balances reposted above are the following:Cash and cash equivalents . . . . . . . . . . . . . . . . . . . . . . . . . . . . . . . . . . . . . . . . . . . . . . . . . . . . . . . 666Current financial liabilities* . . . . . . . . . . . . . . . . . . . . . . . . . . . . . . . . . . . . . . . . . . . . . . . . . . . . . 186Non-current financial liabilities* . . . . . . . . . . . . . . . . . . . . . . . . . . . . . . . . . . . . . . . . . . . . . . . . . 12,409
* Financial liabilities exclude trade and other payables and provisions.
Included within operating expenses is US$290 of depreciation and amortization expense. Included withinOther (expenses) / income is US$68 of interest expense.
There were no dividends received from the Italy Joint Venture in 2016.
The Italy Joint Venture is restricted from making dividend distributions and certain other payments toVEON as a result of existing covenants in the financing documents, which govern the secured debt of the ItalyJoint Venture.
F-51
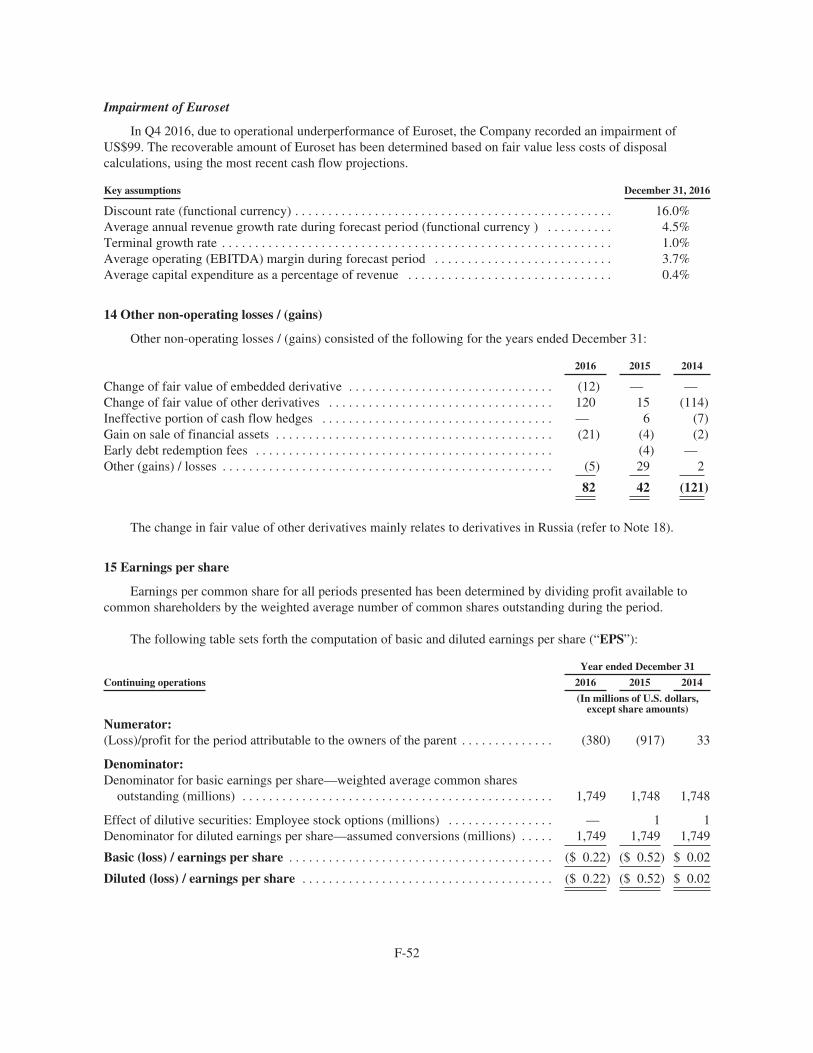
Impairment of Euroset
In Q4 2016, due to operational underperformance of Euroset, the Company recorded an impairment ofUS$99. The recoverable amount of Euroset has been determined based on fair value less costs of disposalcalculations, using the most recent cash flow projections.
Key assumptions December 31, 2016
Discount rate (functional currency) . . . . . . . . . . . . . . . . . . . . . . . . . . . . . . . . . . . . . . . . . . . . . . . . 16.0%Average annual revenue growth rate during forecast period (functional currency ) . . . . . . . . . . 4.5%Terminal growth rate . . . . . . . . . . . . . . . . . . . . . . . . . . . . . . . . . . . . . . . . . . . . . . . . . . . . . . . . . . . 1.0%Average operating (EBITDA) margin during forecast period . . . . . . . . . . . . . . . . . . . . . . . . . . . 3.7%Average capital expenditure as a percentage of revenue . . . . . . . . . . . . . . . . . . . . . . . . . . . . . . . 0.4%
14 Other non-operating losses / (gains)
Other non-operating losses / (gains) consisted of the following for the years ended December 31:
2016 2015 2014
Change of fair value of embedded derivative . . . . . . . . . . . . . . . . . . . . . . . . . . . . . . . (12) — —Change of fair value of other derivatives . . . . . . . . . . . . . . . . . . . . . . . . . . . . . . . . . . 120 15 (114)Ineffective portion of cash flow hedges . . . . . . . . . . . . . . . . . . . . . . . . . . . . . . . . . . . — 6 (7)Gain on sale of financial assets . . . . . . . . . . . . . . . . . . . . . . . . . . . . . . . . . . . . . . . . . . (21) (4) (2)Early debt redemption fees . . . . . . . . . . . . . . . . . . . . . . . . . . . . . . . . . . . . . . . . . . . . . (4) —Other (gains) / losses . . . . . . . . . . . . . . . . . . . . . . . . . . . . . . . . . . . . . . . . . . . . . . . . . . (5) 29 2
82 42 (121)
The change in fair value of other derivatives mainly relates to derivatives in Russia (refer to Note 18).
15 Earnings per share
Earnings per common share for all periods presented has been determined by dividing profit available tocommon shareholders by the weighted average number of common shares outstanding during the period.
The following table sets forth the computation of basic and diluted earnings per share (“EPS”):
Year ended December 31
Continuing operations 2016 2015 2014
(In millions of U.S. dollars,except share amounts)
Numerator:(Loss)/profit for the period attributable to the owners of the parent . . . . . . . . . . . . . . (380) (917) 33
Denominator:Denominator for basic earnings per share—weighted average common shares
outstanding (millions) . . . . . . . . . . . . . . . . . . . . . . . . . . . . . . . . . . . . . . . . . . . . . . . 1,749 1,748 1,748
Effect of dilutive securities: Employee stock options (millions) . . . . . . . . . . . . . . . . — 1 1Denominator for diluted earnings per share—assumed conversions (millions) . . . . . 1,749 1,749 1,749
Basic (loss) / earnings per share . . . . . . . . . . . . . . . . . . . . . . . . . . . . . . . . . . . . . . . . ($ 0.22) ($ 0.52) $ 0.02
Diluted (loss) / earnings per share . . . . . . . . . . . . . . . . . . . . . . . . . . . . . . . . . . . . . . ($ 0.22) ($ 0.52) $ 0.02
F-52
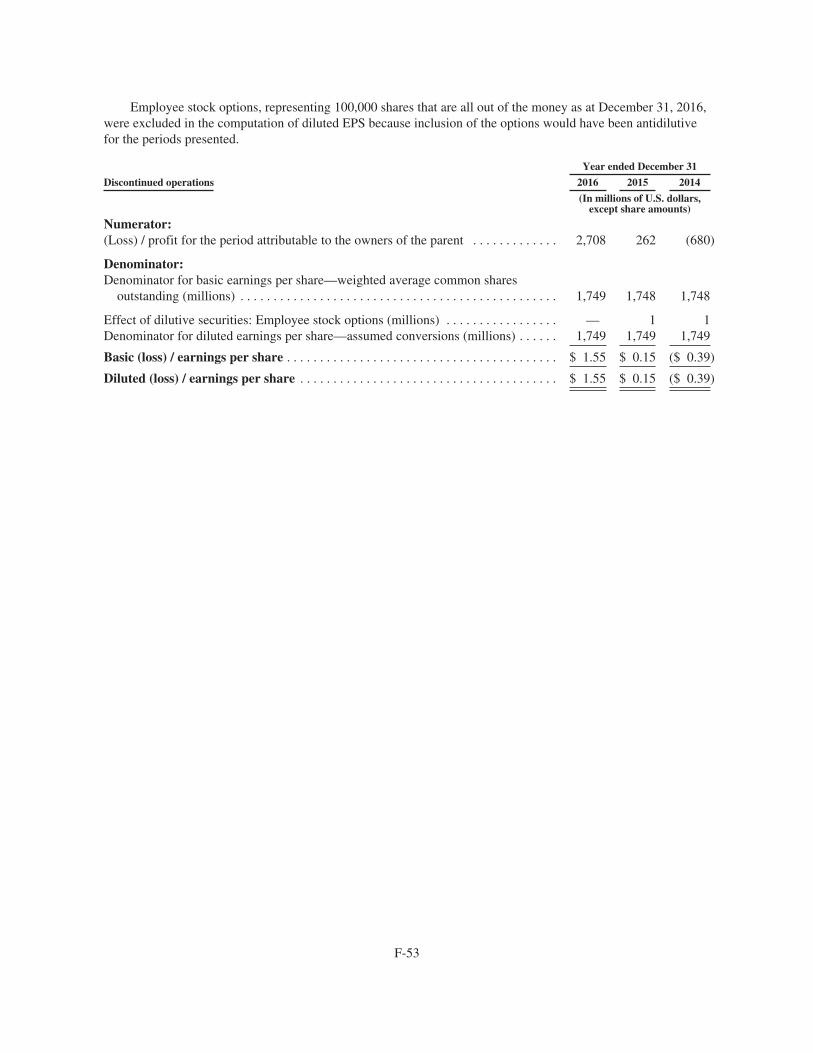
Employee stock options, representing 100,000 shares that are all out of the money as at December 31, 2016,were excluded in the computation of diluted EPS because inclusion of the options would have been antidilutivefor the periods presented.
Year ended December 31
Discontinued operations 2016 2015 2014
(In millions of U.S. dollars,except share amounts)
Numerator:(Loss) / profit for the period attributable to the owners of the parent . . . . . . . . . . . . . 2,708 262 (680)
Denominator:Denominator for basic earnings per share—weighted average common shares
outstanding (millions) . . . . . . . . . . . . . . . . . . . . . . . . . . . . . . . . . . . . . . . . . . . . . . . . 1,749 1,748 1,748
Effect of dilutive securities: Employee stock options (millions) . . . . . . . . . . . . . . . . . — 1 1Denominator for diluted earnings per share—assumed conversions (millions) . . . . . . 1,749 1,749 1,749
Basic (loss) / earnings per share . . . . . . . . . . . . . . . . . . . . . . . . . . . . . . . . . . . . . . . . . $ 1.55 $ 0.15 ($ 0.39)
Diluted (loss) / earnings per share . . . . . . . . . . . . . . . . . . . . . . . . . . . . . . . . . . . . . . . $ 1.55 $ 0.15 ($ 0.39)
F-53
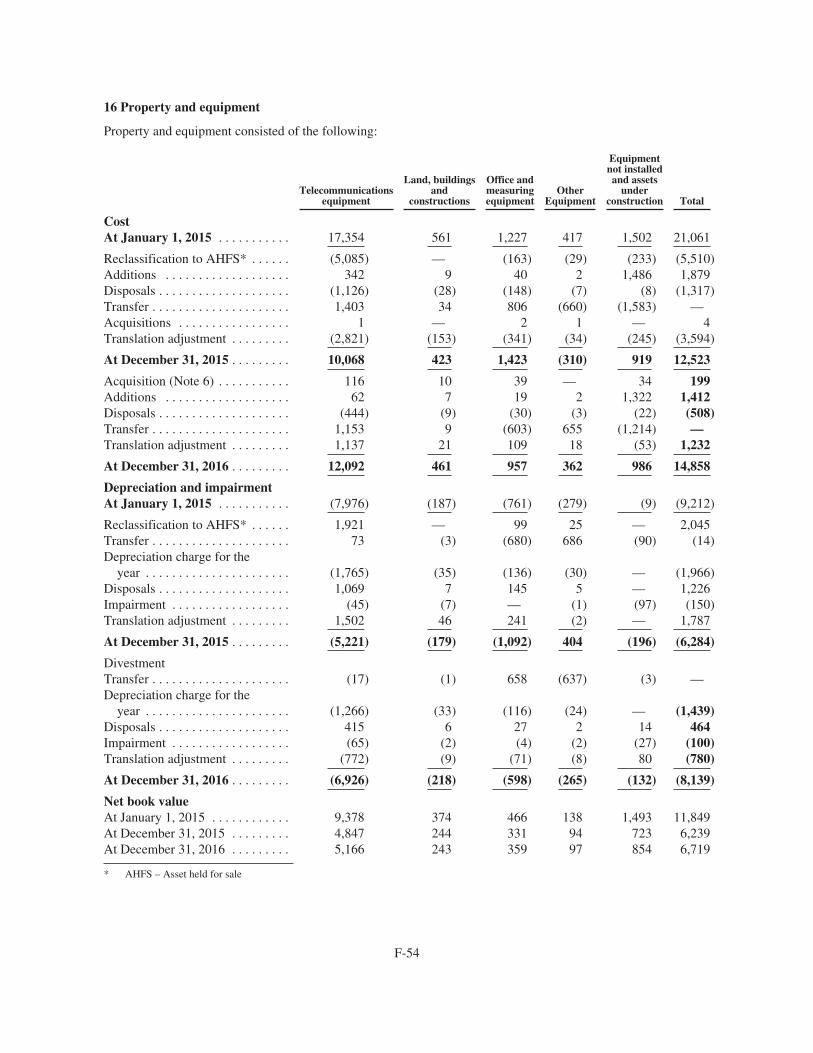
16 Property and equipment
Property and equipment consisted of the following:
Telecommunicationsequipment
Land, buildingsand
constructions
Office andmeasuringequipment
OtherEquipment
Equipmentnot installedand assets
underconstruction Total
CostAt January 1, 2015 . . . . . . . . . . . 17,354 561 1,227 417 1,502 21,061
Reclassification to AHFS* . . . . . . (5,085) — (163) (29) (233) (5,510)Additions . . . . . . . . . . . . . . . . . . . 342 9 40 2 1,486 1,879Disposals . . . . . . . . . . . . . . . . . . . . (1,126) (28) (148) (7) (8) (1,317)Transfer . . . . . . . . . . . . . . . . . . . . . 1,403 34 806 (660) (1,583) —Acquisitions . . . . . . . . . . . . . . . . . 1 — 2 1 — 4Translation adjustment . . . . . . . . . (2,821) (153) (341) (34) (245) (3,594)
At December 31, 2015 . . . . . . . . . 10,068 423 1,423 (310) 919 12,523
Acquisition (Note 6) . . . . . . . . . . . 116 10 39 — 34 199Additions . . . . . . . . . . . . . . . . . . . 62 7 19 2 1,322 1,412Disposals . . . . . . . . . . . . . . . . . . . . (444) (9) (30) (3) (22) (508)Transfer . . . . . . . . . . . . . . . . . . . . . 1,153 9 (603) 655 (1,214) —Translation adjustment . . . . . . . . . 1,137 21 109 18 (53) 1,232
At December 31, 2016 . . . . . . . . . 12,092 461 957 362 986 14,858
Depreciation and impairmentAt January 1, 2015 . . . . . . . . . . . (7,976) (187) (761) (279) (9) (9,212)
Reclassification to AHFS* . . . . . . 1,921 — 99 25 — 2,045Transfer . . . . . . . . . . . . . . . . . . . . . 73 (3) (680) 686 (90) (14)Depreciation charge for the
year . . . . . . . . . . . . . . . . . . . . . . (1,765) (35) (136) (30) — (1,966)Disposals . . . . . . . . . . . . . . . . . . . . 1,069 7 145 5 — 1,226Impairment . . . . . . . . . . . . . . . . . . (45) (7) — (1) (97) (150)Translation adjustment . . . . . . . . . 1,502 46 241 (2) — 1,787
At December 31, 2015 . . . . . . . . . (5,221) (179) (1,092) 404 (196) (6,284)
DivestmentTransfer . . . . . . . . . . . . . . . . . . . . . (17) (1) 658 (637) (3) —Depreciation charge for the
year . . . . . . . . . . . . . . . . . . . . . . (1,266) (33) (116) (24) — (1,439)Disposals . . . . . . . . . . . . . . . . . . . . 415 6 27 2 14 464Impairment . . . . . . . . . . . . . . . . . . (65) (2) (4) (2) (27) (100)Translation adjustment . . . . . . . . . (772) (9) (71) (8) 80 (780)
At December 31, 2016 . . . . . . . . . (6,926) (218) (598) (265) (132) (8,139)
Net book valueAt January 1, 2015 . . . . . . . . . . . . 9,378 374 466 138 1,493 11,849At December 31, 2015 . . . . . . . . . 4,847 244 331 94 723 6,239At December 31, 2016 . . . . . . . . . 5,166 243 359 97 854 6,719
* AHFS – Asset held for sale
F-54
Property and equipment pledged as security for bank borrowings amounts to US$1,029 as of December 31,2016 (US$955 as of December 31, 2015) and primarily relate to securities for borrowings of PMCL (please referto Note 18 for the details of borrowing).
Property and equipment is stated at cost, net of accumulated depreciation and accumulated impairmentlosses, if any.
Depreciation is calculated on a straight-line basis over the estimated useful lives of the assets as follows:
• Telecommunication equipment 3-20 years;
• Buildings and constructions 10-50 years;
• Office and measuring equipment 3-10 years; and
• Other equipment 3-10 years.
Each asset’s residual value, useful life and method of depreciation is reviewed at the end of each financialyear and adjusted prospectively, if necessary.
Depreciation charge from Italy for comparative periods
The depreciation charge for 2015 includes depreciation charges from the Italy segment of US$416 beforethe segment was classified as held for sale and discontinued operations.
Borrowing costs
Borrowing costs directly attributable to the acquisition, construction or production of a qualifying asset thatnecessarily takes a substantial period of time (longer than six months) to get ready for its intended use arecapitalized as part of the cost of the respective qualifying assets. All other borrowing costs are expensed in theperiod incurred.
During 2016, VEON capitalized interest in the cost of property and equipment in the amount of US$5(2015: US$9). In 2016, the capitalization rate was 10.3% (2015: 9.7%).
Change in estimate
During 2016 there were no other material change in estimates related to property and equipment other thanthe impairment described in Note 10 of US$100 (2015: US$150), and accelerated depreciation in Bangladesh,Pakistan and Ukraine pertaining to network modernization activities US$153 (2015: US$100 related to Pakistannetwork modernization activities).
Non-cash investing activities
In 2016, VEON acquired property and equipment in the amount of US$699 (2015: US$560), which was notpaid for as at respective year end.
F-55
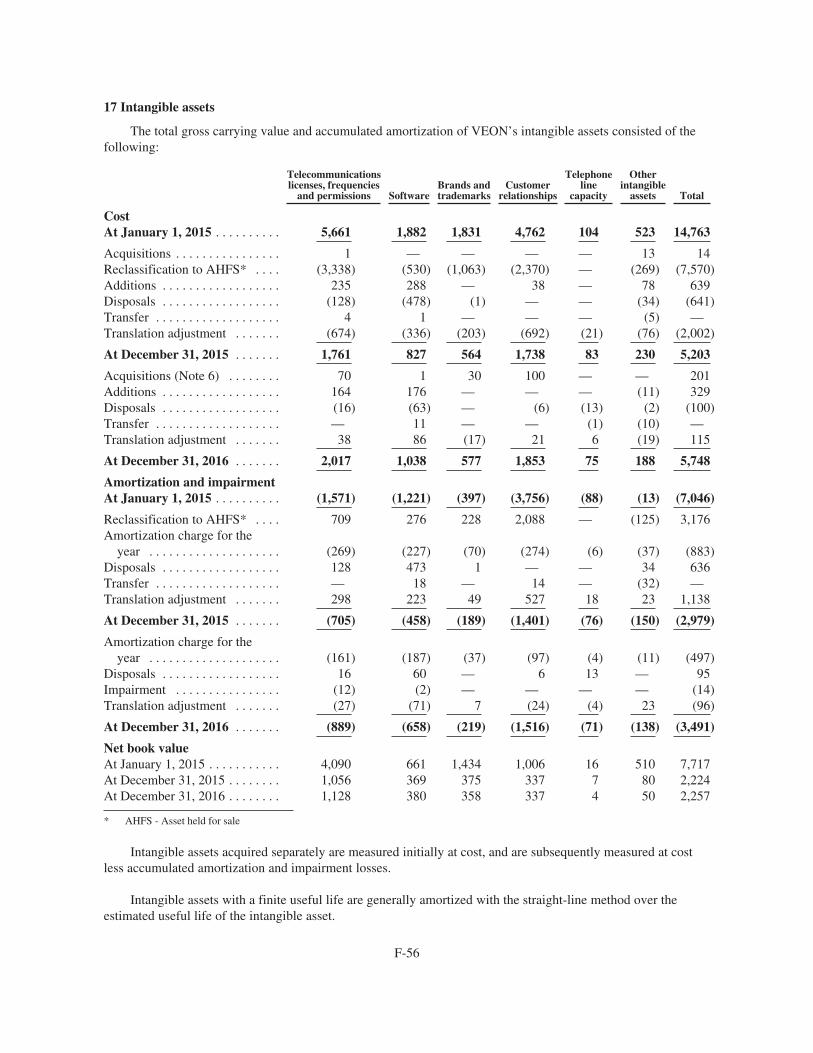
17 Intangible assets
The total gross carrying value and accumulated amortization of VEON’s intangible assets consisted of thefollowing:
Telecommunicationslicenses, frequencies
and permissions SoftwareBrands andtrademarks
Customerrelationships
Telephoneline
capacity
Otherintangible
assets Total
CostAt January 1, 2015 . . . . . . . . . . 5,661 1,882 1,831 4,762 104 523 14,763
Acquisitions . . . . . . . . . . . . . . . . 1 — — — — 13 14Reclassification to AHFS* . . . . (3,338) (530) (1,063) (2,370) — (269) (7,570)Additions . . . . . . . . . . . . . . . . . . 235 288 — 38 — 78 639Disposals . . . . . . . . . . . . . . . . . . (128) (478) (1) — — (34) (641)Transfer . . . . . . . . . . . . . . . . . . . 4 1 — — — (5) —Translation adjustment . . . . . . . (674) (336) (203) (692) (21) (76) (2,002)
At December 31, 2015 . . . . . . . 1,761 827 564 1,738 83 230 5,203
Acquisitions (Note 6) . . . . . . . . 70 1 30 100 — — 201Additions . . . . . . . . . . . . . . . . . . 164 176 — — — (11) 329Disposals . . . . . . . . . . . . . . . . . . (16) (63) — (6) (13) (2) (100)Transfer . . . . . . . . . . . . . . . . . . . — 11 — — (1) (10) —Translation adjustment . . . . . . . 38 86 (17) 21 6 (19) 115
At December 31, 2016 . . . . . . . 2,017 1,038 577 1,853 75 188 5,748
Amortization and impairmentAt January 1, 2015 . . . . . . . . . . (1,571) (1,221) (397) (3,756) (88) (13) (7,046)
Reclassification to AHFS* . . . . 709 276 228 2,088 — (125) 3,176Amortization charge for the
year . . . . . . . . . . . . . . . . . . . . (269) (227) (70) (274) (6) (37) (883)Disposals . . . . . . . . . . . . . . . . . . 128 473 1 — — 34 636Transfer . . . . . . . . . . . . . . . . . . . — 18 — 14 — (32) —Translation adjustment . . . . . . . 298 223 49 527 18 23 1,138
At December 31, 2015 . . . . . . . (705) (458) (189) (1,401) (76) (150) (2,979)
Amortization charge for theyear . . . . . . . . . . . . . . . . . . . . (161) (187) (37) (97) (4) (11) (497)
Disposals . . . . . . . . . . . . . . . . . . 16 60 — 6 13 — 95Impairment . . . . . . . . . . . . . . . . (12) (2) — — — — (14)Translation adjustment . . . . . . . (27) (71) 7 (24) (4) 23 (96)
At December 31, 2016 . . . . . . . (889) (658) (219) (1,516) (71) (138) (3,491)
Net book valueAt January 1, 2015 . . . . . . . . . . . 4,090 661 1,434 1,006 16 510 7,717At December 31, 2015 . . . . . . . . 1,056 369 375 337 7 80 2,224At December 31, 2016 . . . . . . . . 1,128 380 358 337 4 50 2,257
* AHFS - Asset held for sale
Intangible assets acquired separately are measured initially at cost, and are subsequently measured at costless accumulated amortization and impairment losses.
Intangible assets with a finite useful life are generally amortized with the straight-line method over theestimated useful life of the intangible asset.
F-56
The amortization period and the amortization method for intangible assets with finite useful lives arereviewed at least annually.
Additional information
As at December 31, 2016, no intangible assets were pledged as collateral and no assets have restrictions ontitle.
During 2016 and 2015, VEON did not capitalize any interest within the cost of intangible assets.
Non-cash investing activities
During 2016, VEON acquired intangible assets in the amount of US$194 (2015: US$105), which was notpaid for as at respective year end.
Amortization charge from Italy for comparative periods
The amortization charge for 2015 includes amortization charges from the Italy segment of US$365 beforethe segment was classified as held for sale and discontinued operations.
18 Financial assets and liabilities
Financial assets
The Company holds the following financial assets as at December 31:
2016 2015
Financial instruments at fair value through profit or lossDerivatives not designated as hedges
Cross-currency interest rate exchange contracts . . . . . . . . . . . . . . . . . . . . . . . . . . . . . . . . . . . . . . — 1Foreign exchange contracts . . . . . . . . . . . . . . . . . . . . . . . . . . . . . . . . . . . . . . . . . . . . . . . . . . . . . . 2 15Embedded derivatives in notes . . . . . . . . . . . . . . . . . . . . . . . . . . . . . . . . . . . . . . . . . . . . . . . . . . . . 12 —
Financial instruments at fair valueDerivatives designated as cash flow hedges
Foreign exchange contracts . . . . . . . . . . . . . . . . . . . . . . . . . . . . . . . . . . . . . . . . . . . . . . . . . . . . . . — 17Available for sale financial instruments . . . . . . . . . . . . . . . . . . . . . . . . . . . . . . . . . . . . . . . . . . . . . . . . . 71 45
Total financial instruments at fair value . . . . . . . . . . . . . . . . . . . . . . . . . . . . . . . . . . . . . . . . . . . . . . 85 78
Loans granted, deposits and other financial assets at amortized costBank deposits . . . . . . . . . . . . . . . . . . . . . . . . . . . . . . . . . . . . . . . . . . . . . . . . . . . . . . . . . . . . . . . . . . . . . 383 432Interest receivable . . . . . . . . . . . . . . . . . . . . . . . . . . . . . . . . . . . . . . . . . . . . . . . . . . . . . . . . . . . . . . . . . . 2 1Other investment . . . . . . . . . . . . . . . . . . . . . . . . . . . . . . . . . . . . . . . . . . . . . . . . . . . . . . . . . . . . . . . . . . 24 46Other loans granted . . . . . . . . . . . . . . . . . . . . . . . . . . . . . . . . . . . . . . . . . . . . . . . . . . . . . . . . . . . . . . . . . 2 2Total loans granted, deposits and other financial assets . . . . . . . . . . . . . . . . . . . . . . . . . . . . . . . . . . 411 481
Total other financial assets . . . . . . . . . . . . . . . . . . . . . . . . . . . . . . . . . . . . . . . . . . . . . . . . . . . . . . . . . 496 559
Total non-current . . . . . . . . . . . . . . . . . . . . . . . . . . . . . . . . . . . . . . . . . . . . . . . . . . . . . . . . . . . . . . . . . . 306 164Total current . . . . . . . . . . . . . . . . . . . . . . . . . . . . . . . . . . . . . . . . . . . . . . . . . . . . . . . . . . . . . . . . . . . . . . 190 395
F-57
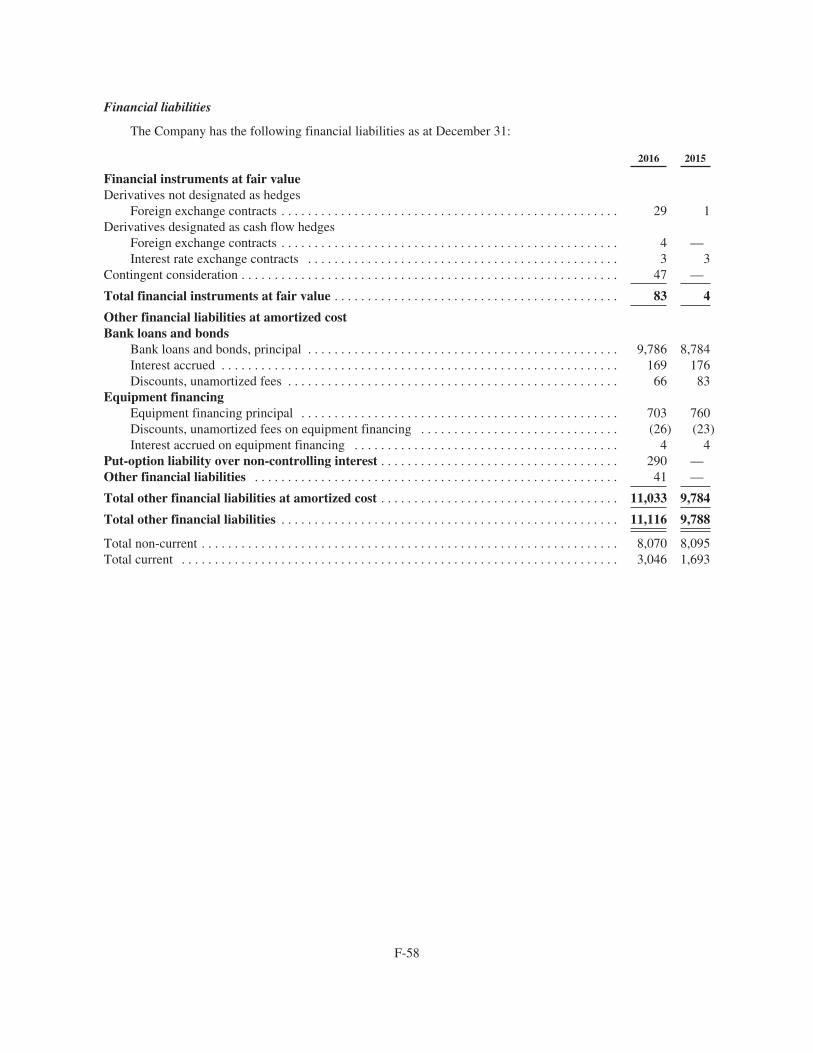
Financial liabilities
The Company has the following financial liabilities as at December 31:
2016 2015
Financial instruments at fair valueDerivatives not designated as hedges
Foreign exchange contracts . . . . . . . . . . . . . . . . . . . . . . . . . . . . . . . . . . . . . . . . . . . . . . . . . . . 29 1Derivatives designated as cash flow hedges
Foreign exchange contracts . . . . . . . . . . . . . . . . . . . . . . . . . . . . . . . . . . . . . . . . . . . . . . . . . . . 4 —Interest rate exchange contracts . . . . . . . . . . . . . . . . . . . . . . . . . . . . . . . . . . . . . . . . . . . . . . . 3 3
Contingent consideration . . . . . . . . . . . . . . . . . . . . . . . . . . . . . . . . . . . . . . . . . . . . . . . . . . . . . . . . . 47 —
Total financial instruments at fair value . . . . . . . . . . . . . . . . . . . . . . . . . . . . . . . . . . . . . . . . . . . 83 4
Other financial liabilities at amortized costBank loans and bonds
Bank loans and bonds, principal . . . . . . . . . . . . . . . . . . . . . . . . . . . . . . . . . . . . . . . . . . . . . . . 9,786 8,784Interest accrued . . . . . . . . . . . . . . . . . . . . . . . . . . . . . . . . . . . . . . . . . . . . . . . . . . . . . . . . . . . . 169 176Discounts, unamortized fees . . . . . . . . . . . . . . . . . . . . . . . . . . . . . . . . . . . . . . . . . . . . . . . . . . 66 83
Equipment financingEquipment financing principal . . . . . . . . . . . . . . . . . . . . . . . . . . . . . . . . . . . . . . . . . . . . . . . . 703 760Discounts, unamortized fees on equipment financing . . . . . . . . . . . . . . . . . . . . . . . . . . . . . . (26) (23)Interest accrued on equipment financing . . . . . . . . . . . . . . . . . . . . . . . . . . . . . . . . . . . . . . . . 4 4
Put-option liability over non-controlling interest . . . . . . . . . . . . . . . . . . . . . . . . . . . . . . . . . . . . 290 —Other financial liabilities . . . . . . . . . . . . . . . . . . . . . . . . . . . . . . . . . . . . . . . . . . . . . . . . . . . . . . . 41 —
Total other financial liabilities at amortized cost . . . . . . . . . . . . . . . . . . . . . . . . . . . . . . . . . . . . 11,033 9,784
Total other financial liabilities . . . . . . . . . . . . . . . . . . . . . . . . . . . . . . . . . . . . . . . . . . . . . . . . . . . 11,116 9,788
Total non-current . . . . . . . . . . . . . . . . . . . . . . . . . . . . . . . . . . . . . . . . . . . . . . . . . . . . . . . . . . . . . . . 8,070 8,095Total current . . . . . . . . . . . . . . . . . . . . . . . . . . . . . . . . . . . . . . . . . . . . . . . . . . . . . . . . . . . . . . . . . . 3,046 1,693
F-58
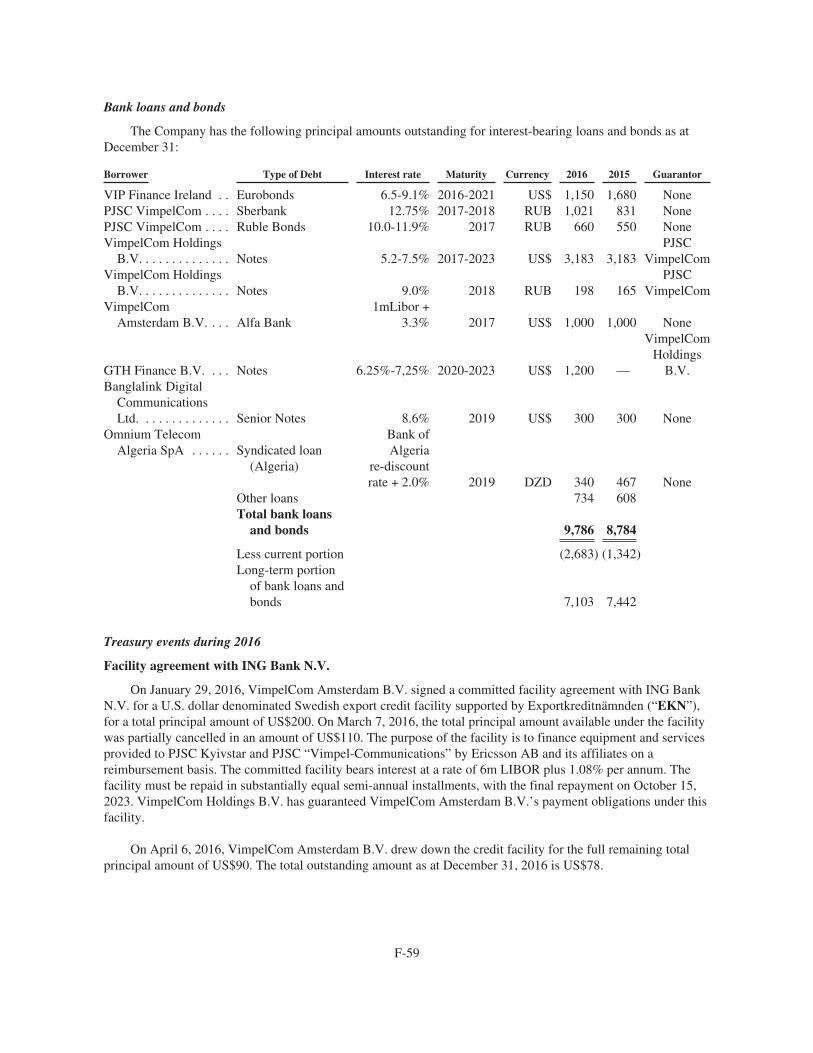
Bank loans and bonds
The Company has the following principal amounts outstanding for interest-bearing loans and bonds as atDecember 31:
Borrower Type of Debt Interest rate Maturity Currency 2016 2015 Guarantor
VIP Finance Ireland . . Eurobonds 6.5-9.1% 2016-2021 US$ 1,150 1,680 NonePJSC VimpelCom . . . . Sberbank 12.75% 2017-2018 RUB 1,021 831 NonePJSC VimpelCom . . . . Ruble Bonds 10.0-11.9% 2017 RUB 660 550 NoneVimpelCom Holdings
B.V. . . . . . . . . . . . . . Notes 5.2-7.5% 2017-2023 US$ 3,183 3,183PJSC
VimpelComVimpelCom Holdings
B.V. . . . . . . . . . . . . . Notes 9.0% 2018 RUB 198 165PJSC
VimpelComVimpelCom
Amsterdam B.V. . . . Alfa Bank1mLibor +
3.3% 2017 US$ 1,000 1,000 None
GTH Finance B.V. . . . Notes 6.25%-7,25% 2020-2023 US$ 1,200 —
VimpelComHoldings
B.V.Banglalink Digital
CommunicationsLtd. . . . . . . . . . . . . . Senior Notes 8.6% 2019 US$ 300 300 None
Omnium TelecomAlgeria SpA . . . . . . Syndicated loan
(Algeria)
Bank ofAlgeria
re-discountrate + 2.0% 2019 DZD 340 467 None
Other loans 734 608Total bank loans
and bonds 9,786 8,784
Less current portion (2,683) (1,342)Long-term portion
of bank loans andbonds 7,103 7,442
Treasury events during 2016
Facility agreement with ING Bank N.V.
On January 29, 2016, VimpelCom Amsterdam B.V. signed a committed facility agreement with ING BankN.V. for a U.S. dollar denominated Swedish export credit facility supported by Exportkreditnämnden (“EKN”),for a total principal amount of US$200. On March 7, 2016, the total principal amount available under the facilitywas partially cancelled in an amount of US$110. The purpose of the facility is to finance equipment and servicesprovided to PJSC Kyivstar and PJSC “Vimpel-Communications” by Ericsson AB and its affiliates on areimbursement basis. The committed facility bears interest at a rate of 6m LIBOR plus 1.08% per annum. Thefacility must be repaid in substantially equal semi-annual installments, with the final repayment on October 15,2023. VimpelCom Holdings B.V. has guaranteed VimpelCom Amsterdam B.V.’s payment obligations under thisfacility.
On April 6, 2016, VimpelCom Amsterdam B.V. drew down the credit facility for the full remaining totalprincipal amount of US$90. The total outstanding amount as at December 31, 2016 is US$78.
F-59
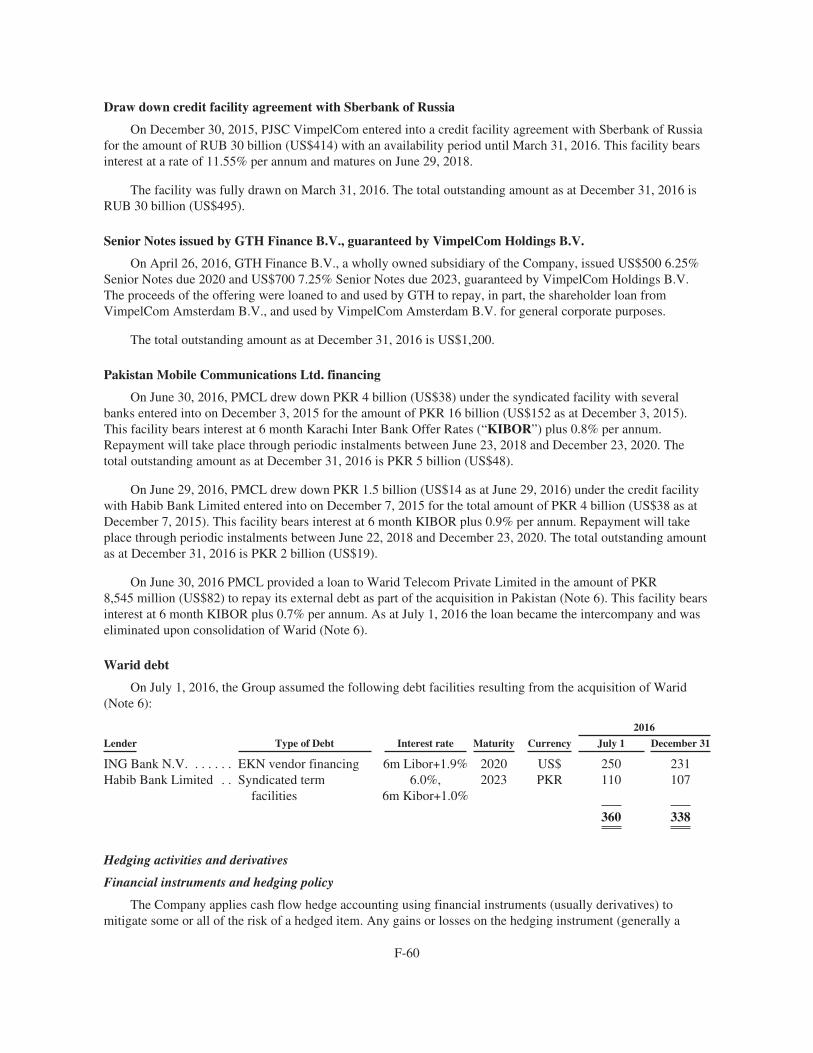
Draw down credit facility agreement with Sberbank of Russia
On December 30, 2015, PJSC VimpelCom entered into a credit facility agreement with Sberbank of Russiafor the amount of RUB 30 billion (US$414) with an availability period until March 31, 2016. This facility bearsinterest at a rate of 11.55% per annum and matures on June 29, 2018.
The facility was fully drawn on March 31, 2016. The total outstanding amount as at December 31, 2016 isRUB 30 billion (US$495).
Senior Notes issued by GTH Finance B.V., guaranteed by VimpelCom Holdings B.V.
On April 26, 2016, GTH Finance B.V., a wholly owned subsidiary of the Company, issued US$500 6.25%Senior Notes due 2020 and US$700 7.25% Senior Notes due 2023, guaranteed by VimpelCom Holdings B.V.The proceeds of the offering were loaned to and used by GTH to repay, in part, the shareholder loan fromVimpelCom Amsterdam B.V., and used by VimpelCom Amsterdam B.V. for general corporate purposes.
The total outstanding amount as at December 31, 2016 is US$1,200.
Pakistan Mobile Communications Ltd. financing
On June 30, 2016, PMCL drew down PKR 4 billion (US$38) under the syndicated facility with severalbanks entered into on December 3, 2015 for the amount of PKR 16 billion (US$152 as at December 3, 2015).This facility bears interest at 6 month Karachi Inter Bank Offer Rates (“KIBOR”) plus 0.8% per annum.Repayment will take place through periodic instalments between June 23, 2018 and December 23, 2020. Thetotal outstanding amount as at December 31, 2016 is PKR 5 billion (US$48).
On June 29, 2016, PMCL drew down PKR 1.5 billion (US$14 as at June 29, 2016) under the credit facilitywith Habib Bank Limited entered into on December 7, 2015 for the total amount of PKR 4 billion (US$38 as atDecember 7, 2015). This facility bears interest at 6 month KIBOR plus 0.9% per annum. Repayment will takeplace through periodic instalments between June 22, 2018 and December 23, 2020. The total outstanding amountas at December 31, 2016 is PKR 2 billion (US$19).
On June 30, 2016 PMCL provided a loan to Warid Telecom Private Limited in the amount of PKR8,545 million (US$82) to repay its external debt as part of the acquisition in Pakistan (Note 6). This facility bearsinterest at 6 month KIBOR plus 0.7% per annum. As at July 1, 2016 the loan became the intercompany and waseliminated upon consolidation of Warid (Note 6).
Warid debt
On July 1, 2016, the Group assumed the following debt facilities resulting from the acquisition of Warid(Note 6):
2016
Lender Type of Debt Interest rate Maturity Currency July 1 December 31
ING Bank N.V. . . . . . . EKN vendor financing 6m Libor+1.9% 2020 US$ 250 231Habib Bank Limited . . Syndicated term
facilities6.0%,
6m Kibor+1.0%2023 PKR 110 107
360 338
Hedging activities and derivatives
Financial instruments and hedging policy
The Company applies cash flow hedge accounting using financial instruments (usually derivatives) tomitigate some or all of the risk of a hedged item. Any gains or losses on the hedging instrument (generally a
F-60
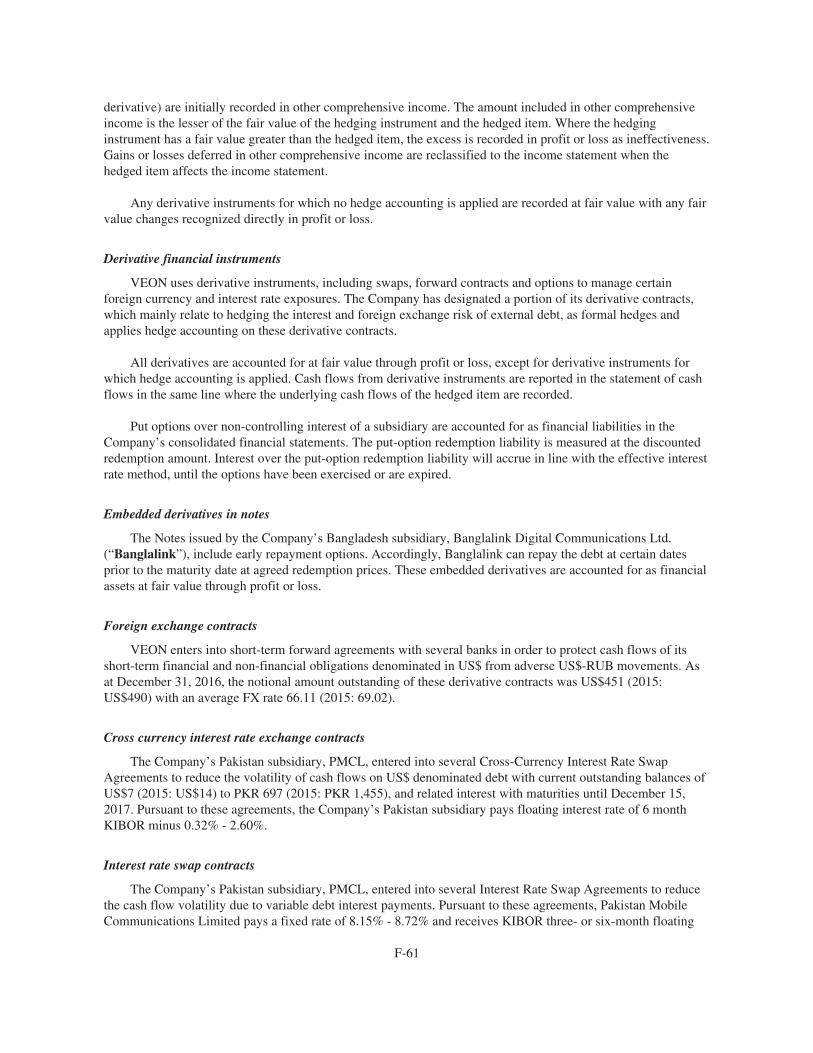
derivative) are initially recorded in other comprehensive income. The amount included in other comprehensiveincome is the lesser of the fair value of the hedging instrument and the hedged item. Where the hedginginstrument has a fair value greater than the hedged item, the excess is recorded in profit or loss as ineffectiveness.Gains or losses deferred in other comprehensive income are reclassified to the income statement when thehedged item affects the income statement.
Any derivative instruments for which no hedge accounting is applied are recorded at fair value with any fairvalue changes recognized directly in profit or loss.
Derivative financial instruments
VEON uses derivative instruments, including swaps, forward contracts and options to manage certainforeign currency and interest rate exposures. The Company has designated a portion of its derivative contracts,which mainly relate to hedging the interest and foreign exchange risk of external debt, as formal hedges andapplies hedge accounting on these derivative contracts.
All derivatives are accounted for at fair value through profit or loss, except for derivative instruments forwhich hedge accounting is applied. Cash flows from derivative instruments are reported in the statement of cashflows in the same line where the underlying cash flows of the hedged item are recorded.
Put options over non-controlling interest of a subsidiary are accounted for as financial liabilities in theCompany’s consolidated financial statements. The put-option redemption liability is measured at the discountedredemption amount. Interest over the put-option redemption liability will accrue in line with the effective interestrate method, until the options have been exercised or are expired.
Embedded derivatives in notes
The Notes issued by the Company’s Bangladesh subsidiary, Banglalink Digital Communications Ltd.(“Banglalink”), include early repayment options. Accordingly, Banglalink can repay the debt at certain datesprior to the maturity date at agreed redemption prices. These embedded derivatives are accounted for as financialassets at fair value through profit or loss.
Foreign exchange contracts
VEON enters into short-term forward agreements with several banks in order to protect cash flows of itsshort-term financial and non-financial obligations denominated in US$ from adverse US$-RUB movements. Asat December 31, 2016, the notional amount outstanding of these derivative contracts was US$451 (2015:US$490) with an average FX rate 66.11 (2015: 69.02).
Cross currency interest rate exchange contracts
The Company’s Pakistan subsidiary, PMCL, entered into several Cross-Currency Interest Rate SwapAgreements to reduce the volatility of cash flows on US$ denominated debt with current outstanding balances ofUS$7 (2015: US$14) to PKR 697 (2015: PKR 1,455), and related interest with maturities until December 15,2017. Pursuant to these agreements, the Company’s Pakistan subsidiary pays floating interest rate of 6 monthKIBOR minus 0.32% - 2.60%.
Interest rate swap contracts
The Company’s Pakistan subsidiary, PMCL, entered into several Interest Rate Swap Agreements to reducethe cash flow volatility due to variable debt interest payments. Pursuant to these agreements, Pakistan MobileCommunications Limited pays a fixed rate of 8.15% - 8.72% and receives KIBOR three- or six-month floating
F-61
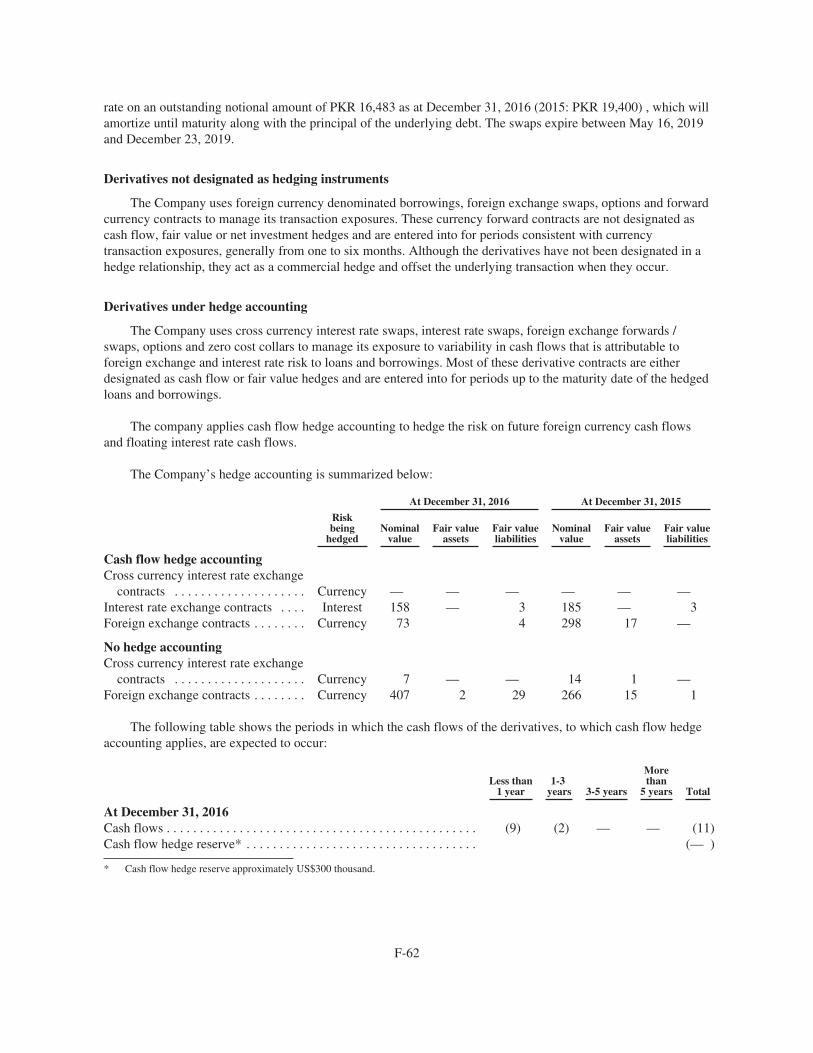
rate on an outstanding notional amount of PKR 16,483 as at December 31, 2016 (2015: PKR 19,400) , which willamortize until maturity along with the principal of the underlying debt. The swaps expire between May 16, 2019and December 23, 2019.
Derivatives not designated as hedging instruments
The Company uses foreign currency denominated borrowings, foreign exchange swaps, options and forwardcurrency contracts to manage its transaction exposures. These currency forward contracts are not designated ascash flow, fair value or net investment hedges and are entered into for periods consistent with currencytransaction exposures, generally from one to six months. Although the derivatives have not been designated in ahedge relationship, they act as a commercial hedge and offset the underlying transaction when they occur.
Derivatives under hedge accounting
The Company uses cross currency interest rate swaps, interest rate swaps, foreign exchange forwards /swaps, options and zero cost collars to manage its exposure to variability in cash flows that is attributable toforeign exchange and interest rate risk to loans and borrowings. Most of these derivative contracts are eitherdesignated as cash flow or fair value hedges and are entered into for periods up to the maturity date of the hedgedloans and borrowings.
The company applies cash flow hedge accounting to hedge the risk on future foreign currency cash flowsand floating interest rate cash flows.
The Company’s hedge accounting is summarized below:
At December 31, 2016 At December 31, 2015
Riskbeing
hedgedNominal
valueFair value
assetsFair valueliabilities
Nominalvalue
Fair valueassets
Fair valueliabilities
Cash flow hedge accountingCross currency interest rate exchange
contracts . . . . . . . . . . . . . . . . . . . . Currency — — — — — —Interest rate exchange contracts . . . . Interest 158 — 3 185 — 3Foreign exchange contracts . . . . . . . . Currency 73 4 298 17 —
No hedge accountingCross currency interest rate exchange
contracts . . . . . . . . . . . . . . . . . . . . Currency 7 — — 14 1 —Foreign exchange contracts . . . . . . . . Currency 407 2 29 266 15 1
The following table shows the periods in which the cash flows of the derivatives, to which cash flow hedgeaccounting applies, are expected to occur:
Less than1 year
1-3years 3-5 years
Morethan
5 years Total
At December 31, 2016Cash flows . . . . . . . . . . . . . . . . . . . . . . . . . . . . . . . . . . . . . . . . . . . . . . . (9) (2) — — (11)Cash flow hedge reserve* . . . . . . . . . . . . . . . . . . . . . . . . . . . . . . . . . . . (— )
* Cash flow hedge reserve approximately US$300 thousand.
F-62
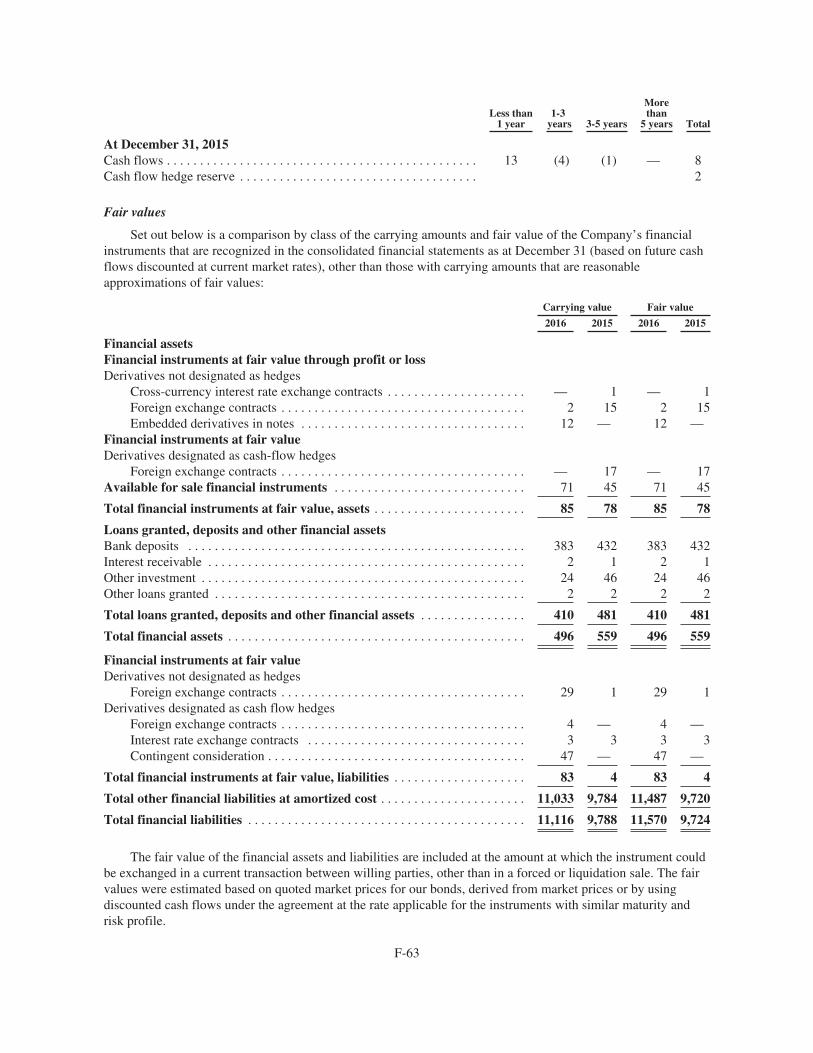
Less than1 year
1-3years 3-5 years
Morethan
5 years Total
At December 31, 2015Cash flows . . . . . . . . . . . . . . . . . . . . . . . . . . . . . . . . . . . . . . . . . . . . . . . 13 (4) (1) — 8Cash flow hedge reserve . . . . . . . . . . . . . . . . . . . . . . . . . . . . . . . . . . . . 2
Fair values
Set out below is a comparison by class of the carrying amounts and fair value of the Company’s financialinstruments that are recognized in the consolidated financial statements as at December 31 (based on future cashflows discounted at current market rates), other than those with carrying amounts that are reasonableapproximations of fair values:
Carrying value Fair value
2016 2015 2016 2015
Financial assetsFinancial instruments at fair value through profit or lossDerivatives not designated as hedges
Cross-currency interest rate exchange contracts . . . . . . . . . . . . . . . . . . . . . — 1 — 1Foreign exchange contracts . . . . . . . . . . . . . . . . . . . . . . . . . . . . . . . . . . . . . 2 15 2 15Embedded derivatives in notes . . . . . . . . . . . . . . . . . . . . . . . . . . . . . . . . . . 12 — 12 —
Financial instruments at fair valueDerivatives designated as cash-flow hedges
Foreign exchange contracts . . . . . . . . . . . . . . . . . . . . . . . . . . . . . . . . . . . . . — 17 — 17Available for sale financial instruments . . . . . . . . . . . . . . . . . . . . . . . . . . . . . 71 45 71 45
Total financial instruments at fair value, assets . . . . . . . . . . . . . . . . . . . . . . . 85 78 85 78
Loans granted, deposits and other financial assetsBank deposits . . . . . . . . . . . . . . . . . . . . . . . . . . . . . . . . . . . . . . . . . . . . . . . . . . . 383 432 383 432Interest receivable . . . . . . . . . . . . . . . . . . . . . . . . . . . . . . . . . . . . . . . . . . . . . . . . 2 1 2 1Other investment . . . . . . . . . . . . . . . . . . . . . . . . . . . . . . . . . . . . . . . . . . . . . . . . . 24 46 24 46Other loans granted . . . . . . . . . . . . . . . . . . . . . . . . . . . . . . . . . . . . . . . . . . . . . . . 2 2 2 2
Total loans granted, deposits and other financial assets . . . . . . . . . . . . . . . . 410 481 410 481
Total financial assets . . . . . . . . . . . . . . . . . . . . . . . . . . . . . . . . . . . . . . . . . . . . . 496 559 496 559
Financial instruments at fair valueDerivatives not designated as hedges
Foreign exchange contracts . . . . . . . . . . . . . . . . . . . . . . . . . . . . . . . . . . . . . 29 1 29 1Derivatives designated as cash flow hedges
Foreign exchange contracts . . . . . . . . . . . . . . . . . . . . . . . . . . . . . . . . . . . . . 4 — 4 —Interest rate exchange contracts . . . . . . . . . . . . . . . . . . . . . . . . . . . . . . . . . 3 3 3 3Contingent consideration . . . . . . . . . . . . . . . . . . . . . . . . . . . . . . . . . . . . . . . 47 — 47 —
Total financial instruments at fair value, liabilities . . . . . . . . . . . . . . . . . . . . 83 4 83 4
Total other financial liabilities at amortized cost . . . . . . . . . . . . . . . . . . . . . . 11,033 9,784 11,487 9,720
Total financial liabilities . . . . . . . . . . . . . . . . . . . . . . . . . . . . . . . . . . . . . . . . . . 11,116 9,788 11,570 9,724
The fair value of the financial assets and liabilities are included at the amount at which the instrument couldbe exchanged in a current transaction between willing parties, other than in a forced or liquidation sale. The fairvalues were estimated based on quoted market prices for our bonds, derived from market prices or by usingdiscounted cash flows under the agreement at the rate applicable for the instruments with similar maturity andrisk profile.
F-63
The carrying amount of cash and cash equivalents, trade and other receivables, and trade and other payablesapproximate their respective fair values.
The fair value of derivative financial instruments is determined using present value techniques such asdiscounted cash flow techniques, Monte Carlo simulation and/or the Black-Scholes model. These valuationtechniques are commonly used for valuation of derivative. Observable inputs (Level 2) used in the valuationtechniques includes LIBOR, EURIBOR, swap curves, basis swap spreads, foreign exchange rates and creditdefault spreads of both counterparties and our own entities.
The fair value of Available for Sale financial instruments are determined through comparison of variousmultiples and reference to market valuation of similar entities quoted in an active market. If information is notavailable, a discounted cash flow method is used.
Fair value measurements for financial liabilities at amortized cost are based on quoted market prices, whereavailable. If the quoted market price is not available, the fair value measurement is based on discounted expectedfuture cash flows using a market interest rate curve, credit spreads and maturities.
Fair value hierarchy
As at December 31, 2016 and 2015, the Company recognized financial instruments at fair value in thestatement of financial position.
The fair value hierarchy ranks fair value measurements based on the type of inputs used in the valuation; itdoes not depend on the type of valuation techniques used:
• Level 1: quoted (unadjusted) prices in active markets for identical assets or liabilities
• Level 2: inputs other than quoted prices included within Level 1 that are observable for the asset orliability, either directly or indirectly
• Level 3: inputs are unobservable inputs for the asset or liability
F-64
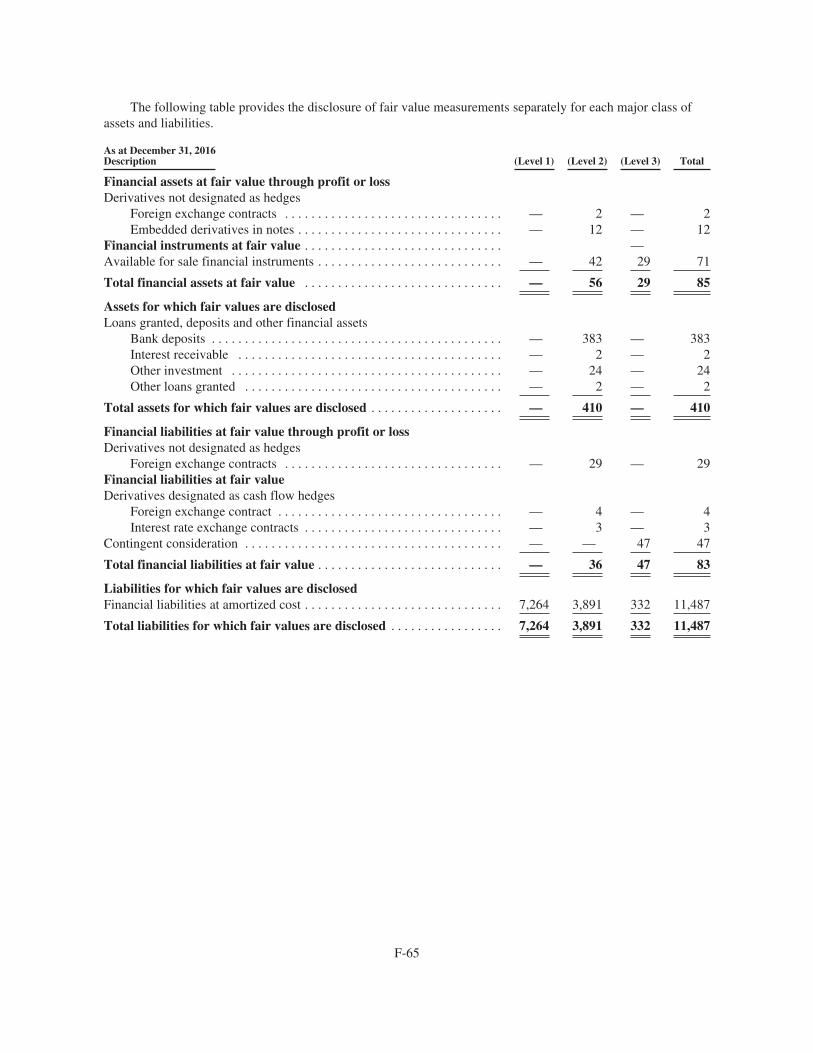
The following table provides the disclosure of fair value measurements separately for each major class ofassets and liabilities.
As at December 31, 2016Description (Level 1) (Level 2) (Level 3) Total
Financial assets at fair value through profit or lossDerivatives not designated as hedges
Foreign exchange contracts . . . . . . . . . . . . . . . . . . . . . . . . . . . . . . . . . — 2 — 2Embedded derivatives in notes . . . . . . . . . . . . . . . . . . . . . . . . . . . . . . . — 12 — 12
Financial instruments at fair value . . . . . . . . . . . . . . . . . . . . . . . . . . . . . . —Available for sale financial instruments . . . . . . . . . . . . . . . . . . . . . . . . . . . . — 42 29 71
Total financial assets at fair value . . . . . . . . . . . . . . . . . . . . . . . . . . . . . . — 56 29 85
Assets for which fair values are disclosedLoans granted, deposits and other financial assets
Bank deposits . . . . . . . . . . . . . . . . . . . . . . . . . . . . . . . . . . . . . . . . . . . . — 383 — 383Interest receivable . . . . . . . . . . . . . . . . . . . . . . . . . . . . . . . . . . . . . . . . — 2 — 2Other investment . . . . . . . . . . . . . . . . . . . . . . . . . . . . . . . . . . . . . . . . . — 24 — 24Other loans granted . . . . . . . . . . . . . . . . . . . . . . . . . . . . . . . . . . . . . . . — 2 — 2
Total assets for which fair values are disclosed . . . . . . . . . . . . . . . . . . . . — 410 — 410
Financial liabilities at fair value through profit or lossDerivatives not designated as hedges
Foreign exchange contracts . . . . . . . . . . . . . . . . . . . . . . . . . . . . . . . . . — 29 — 29Financial liabilities at fair valueDerivatives designated as cash flow hedges
Foreign exchange contract . . . . . . . . . . . . . . . . . . . . . . . . . . . . . . . . . . — 4 — 4Interest rate exchange contracts . . . . . . . . . . . . . . . . . . . . . . . . . . . . . . — 3 — 3
Contingent consideration . . . . . . . . . . . . . . . . . . . . . . . . . . . . . . . . . . . . . . . — — 47 47
Total financial liabilities at fair value . . . . . . . . . . . . . . . . . . . . . . . . . . . . — 36 47 83
Liabilities for which fair values are disclosedFinancial liabilities at amortized cost . . . . . . . . . . . . . . . . . . . . . . . . . . . . . . 7,264 3,891 332 11,487
Total liabilities for which fair values are disclosed . . . . . . . . . . . . . . . . . 7,264 3,891 332 11,487
F-65
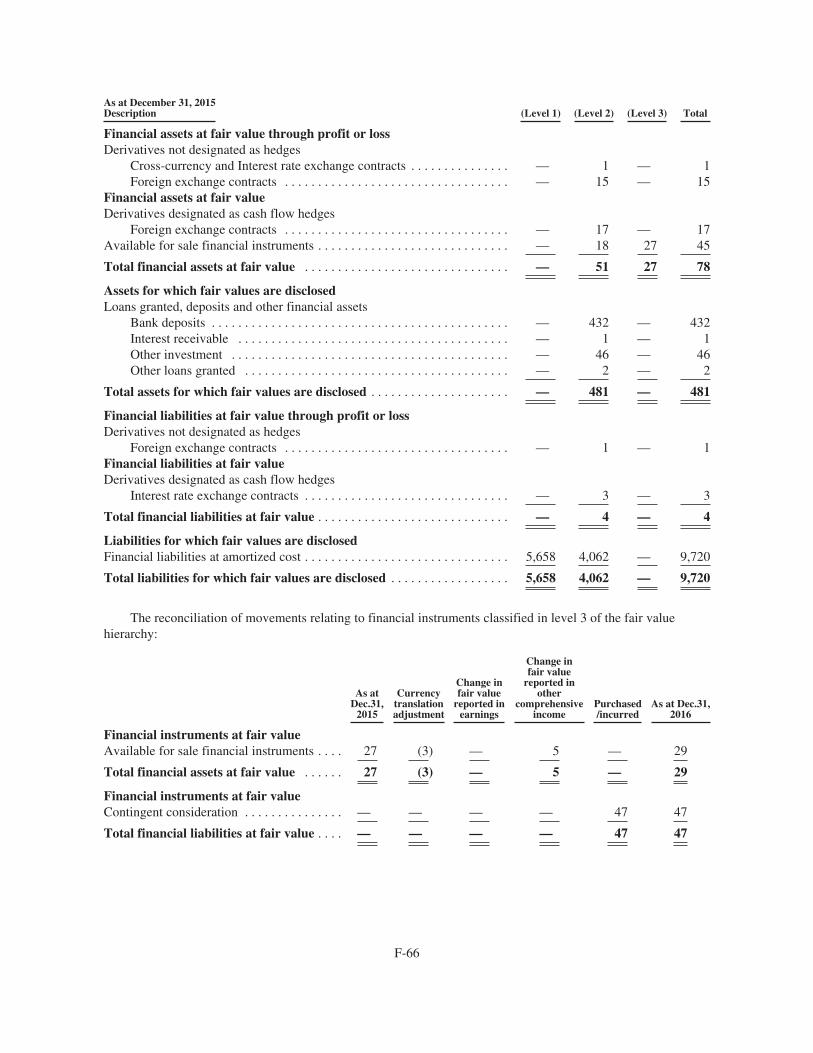
As at December 31, 2015Description (Level 1) (Level 2) (Level 3) Total
Financial assets at fair value through profit or lossDerivatives not designated as hedges
Cross-currency and Interest rate exchange contracts . . . . . . . . . . . . . . . — 1 — 1Foreign exchange contracts . . . . . . . . . . . . . . . . . . . . . . . . . . . . . . . . . . — 15 — 15
Financial assets at fair valueDerivatives designated as cash flow hedges
Foreign exchange contracts . . . . . . . . . . . . . . . . . . . . . . . . . . . . . . . . . . — 17 — 17Available for sale financial instruments . . . . . . . . . . . . . . . . . . . . . . . . . . . . . — 18 27 45
Total financial assets at fair value . . . . . . . . . . . . . . . . . . . . . . . . . . . . . . . — 51 27 78
Assets for which fair values are disclosedLoans granted, deposits and other financial assets
Bank deposits . . . . . . . . . . . . . . . . . . . . . . . . . . . . . . . . . . . . . . . . . . . . . — 432 — 432Interest receivable . . . . . . . . . . . . . . . . . . . . . . . . . . . . . . . . . . . . . . . . . — 1 — 1Other investment . . . . . . . . . . . . . . . . . . . . . . . . . . . . . . . . . . . . . . . . . . — 46 — 46Other loans granted . . . . . . . . . . . . . . . . . . . . . . . . . . . . . . . . . . . . . . . . — 2 — 2
Total assets for which fair values are disclosed . . . . . . . . . . . . . . . . . . . . . — 481 — 481
Financial liabilities at fair value through profit or lossDerivatives not designated as hedges
Foreign exchange contracts . . . . . . . . . . . . . . . . . . . . . . . . . . . . . . . . . . — 1 — 1Financial liabilities at fair valueDerivatives designated as cash flow hedges
Interest rate exchange contracts . . . . . . . . . . . . . . . . . . . . . . . . . . . . . . . — 3 — 3
Total financial liabilities at fair value . . . . . . . . . . . . . . . . . . . . . . . . . . . . . — 4 — 4
Liabilities for which fair values are disclosedFinancial liabilities at amortized cost . . . . . . . . . . . . . . . . . . . . . . . . . . . . . . . 5,658 4,062 — 9,720
Total liabilities for which fair values are disclosed . . . . . . . . . . . . . . . . . . 5,658 4,062 — 9,720
The reconciliation of movements relating to financial instruments classified in level 3 of the fair valuehierarchy:
As atDec.31,
2015
Currencytranslationadjustment
Change infair value
reported inearnings
Change infair value
reported inother
comprehensiveincome
Purchased/incurred
As at Dec.31,2016
Financial instruments at fair valueAvailable for sale financial instruments . . . . 27 (3) — 5 — 29
Total financial assets at fair value . . . . . . 27 (3) — 5 — 29
Financial instruments at fair valueContingent consideration . . . . . . . . . . . . . . . — — — — 47 47
Total financial liabilities at fair value . . . . — — — — 47 47
F-66
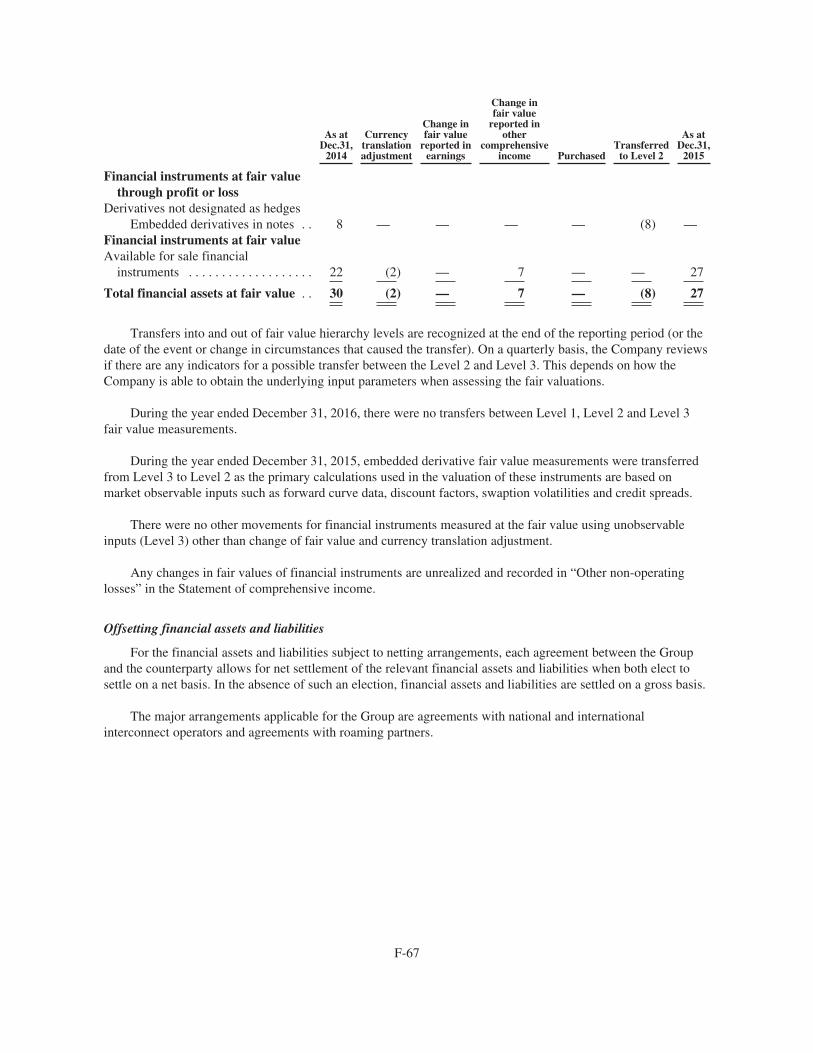
As atDec.31,
2014
Currencytranslationadjustment
Change infair value
reported inearnings
Change infair value
reported inother
comprehensiveincome Purchased
Transferredto Level 2
As atDec.31,
2015
Financial instruments at fair valuethrough profit or loss
Derivatives not designated as hedgesEmbedded derivatives in notes . . 8 — — — — (8) —
Financial instruments at fair valueAvailable for sale financial
instruments . . . . . . . . . . . . . . . . . . . 22 (2) — 7 — — 27
Total financial assets at fair value . . 30 (2) — 7 — (8) 27
Transfers into and out of fair value hierarchy levels are recognized at the end of the reporting period (or thedate of the event or change in circumstances that caused the transfer). On a quarterly basis, the Company reviewsif there are any indicators for a possible transfer between the Level 2 and Level 3. This depends on how theCompany is able to obtain the underlying input parameters when assessing the fair valuations.
During the year ended December 31, 2016, there were no transfers between Level 1, Level 2 and Level 3fair value measurements.
During the year ended December 31, 2015, embedded derivative fair value measurements were transferredfrom Level 3 to Level 2 as the primary calculations used in the valuation of these instruments are based onmarket observable inputs such as forward curve data, discount factors, swaption volatilities and credit spreads.
There were no other movements for financial instruments measured at the fair value using unobservableinputs (Level 3) other than change of fair value and currency translation adjustment.
Any changes in fair values of financial instruments are unrealized and recorded in “Other non-operatinglosses” in the Statement of comprehensive income.
Offsetting financial assets and liabilities
For the financial assets and liabilities subject to netting arrangements, each agreement between the Groupand the counterparty allows for net settlement of the relevant financial assets and liabilities when both elect tosettle on a net basis. In the absence of such an election, financial assets and liabilities are settled on a gross basis.
The major arrangements applicable for the Group are agreements with national and internationalinterconnect operators and agreements with roaming partners.
F-67
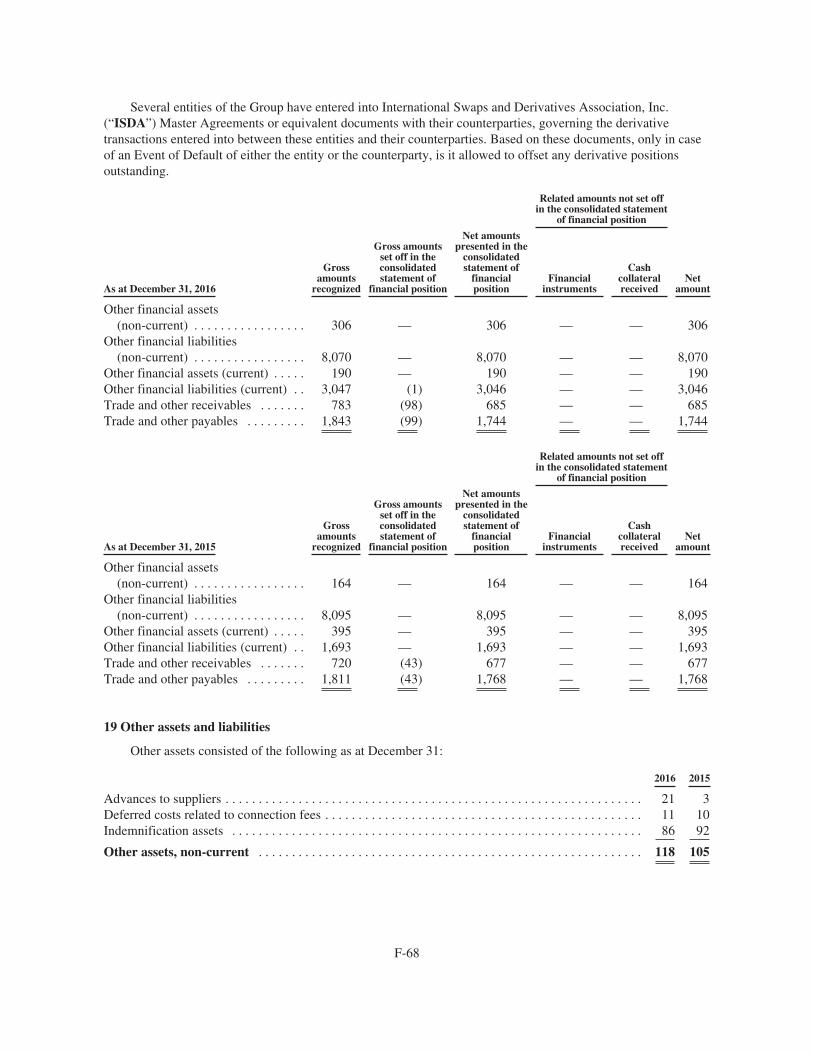
Several entities of the Group have entered into International Swaps and Derivatives Association, Inc.(“ISDA”) Master Agreements or equivalent documents with their counterparties, governing the derivativetransactions entered into between these entities and their counterparties. Based on these documents, only in caseof an Event of Default of either the entity or the counterparty, is it allowed to offset any derivative positionsoutstanding.
Related amounts not set offin the consolidated statement
of financial position
As at December 31, 2016
Grossamounts
recognized
Gross amountsset off in theconsolidatedstatement of
financial position
Net amountspresented in the
consolidatedstatement of
financialposition
Financialinstruments
Cashcollateralreceived
Netamount
Other financial assets(non-current) . . . . . . . . . . . . . . . . . 306 — 306 — — 306
Other financial liabilities(non-current) . . . . . . . . . . . . . . . . . 8,070 — 8,070 — — 8,070
Other financial assets (current) . . . . . 190 — 190 — — 190Other financial liabilities (current) . . 3,047 (1) 3,046 — — 3,046Trade and other receivables . . . . . . . 783 (98) 685 — — 685Trade and other payables . . . . . . . . . 1,843 (99) 1,744 — — 1,744
Related amounts not set offin the consolidated statement
of financial position
As at December 31, 2015
Grossamounts
recognized
Gross amountsset off in theconsolidatedstatement of
financial position
Net amountspresented in the
consolidatedstatement of
financialposition
Financialinstruments
Cashcollateralreceived
Netamount
Other financial assets(non-current) . . . . . . . . . . . . . . . . . 164 — 164 — — 164
Other financial liabilities(non-current) . . . . . . . . . . . . . . . . . 8,095 — 8,095 — — 8,095
Other financial assets (current) . . . . . 395 — 395 — — 395Other financial liabilities (current) . . 1,693 — 1,693 — — 1,693Trade and other receivables . . . . . . . 720 (43) 677 — — 677Trade and other payables . . . . . . . . . 1,811 (43) 1,768 — — 1,768
19 Other assets and liabilities
Other assets consisted of the following as at December 31:
2016 2015
Advances to suppliers . . . . . . . . . . . . . . . . . . . . . . . . . . . . . . . . . . . . . . . . . . . . . . . . . . . . . . . . . . . . . . . 21 3Deferred costs related to connection fees . . . . . . . . . . . . . . . . . . . . . . . . . . . . . . . . . . . . . . . . . . . . . . . . 11 10Indemnification assets . . . . . . . . . . . . . . . . . . . . . . . . . . . . . . . . . . . . . . . . . . . . . . . . . . . . . . . . . . . . . . 86 92
Other assets, non-current . . . . . . . . . . . . . . . . . . . . . . . . . . . . . . . . . . . . . . . . . . . . . . . . . . . . . . . . . . 118 105
F-68
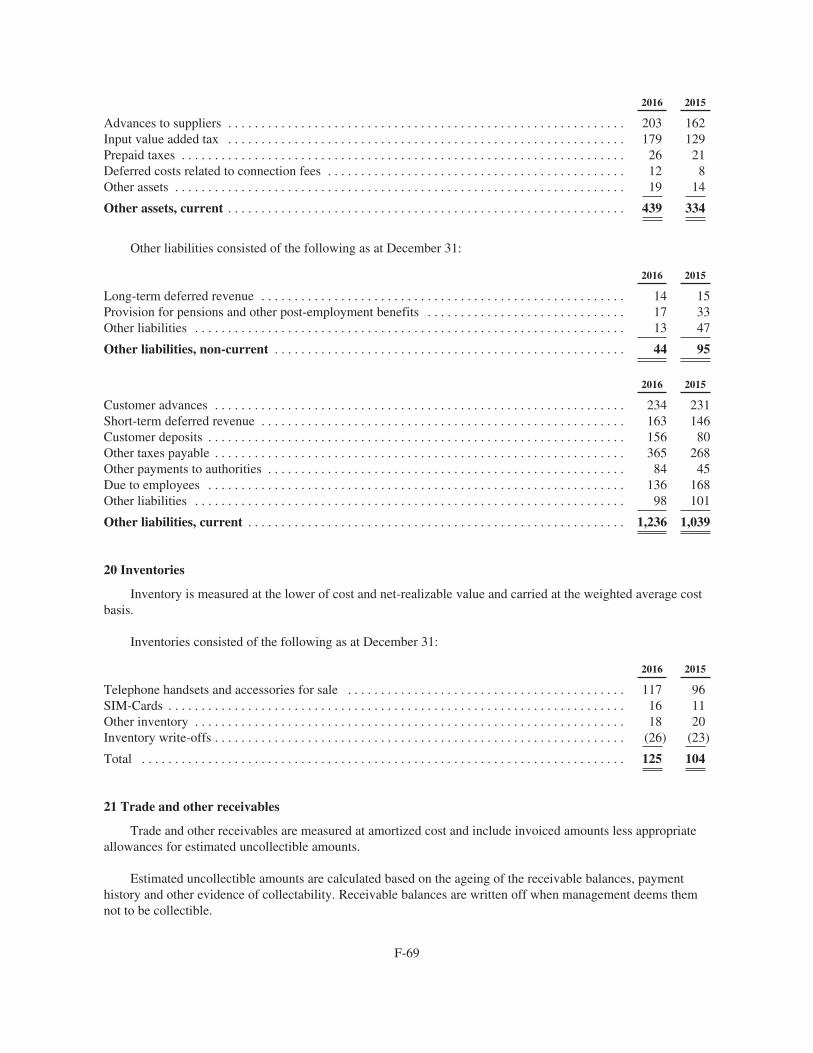
2016 2015
Advances to suppliers . . . . . . . . . . . . . . . . . . . . . . . . . . . . . . . . . . . . . . . . . . . . . . . . . . . . . . . . . . . . 203 162Input value added tax . . . . . . . . . . . . . . . . . . . . . . . . . . . . . . . . . . . . . . . . . . . . . . . . . . . . . . . . . . . . 179 129Prepaid taxes . . . . . . . . . . . . . . . . . . . . . . . . . . . . . . . . . . . . . . . . . . . . . . . . . . . . . . . . . . . . . . . . . . . 26 21Deferred costs related to connection fees . . . . . . . . . . . . . . . . . . . . . . . . . . . . . . . . . . . . . . . . . . . . . 12 8Other assets . . . . . . . . . . . . . . . . . . . . . . . . . . . . . . . . . . . . . . . . . . . . . . . . . . . . . . . . . . . . . . . . . . . . 19 14
Other assets, current . . . . . . . . . . . . . . . . . . . . . . . . . . . . . . . . . . . . . . . . . . . . . . . . . . . . . . . . . . . . 439 334
Other liabilities consisted of the following as at December 31:
2016 2015
Long-term deferred revenue . . . . . . . . . . . . . . . . . . . . . . . . . . . . . . . . . . . . . . . . . . . . . . . . . . . . . . . 14 15Provision for pensions and other post-employment benefits . . . . . . . . . . . . . . . . . . . . . . . . . . . . . . 17 33Other liabilities . . . . . . . . . . . . . . . . . . . . . . . . . . . . . . . . . . . . . . . . . . . . . . . . . . . . . . . . . . . . . . . . . 13 47
Other liabilities, non-current . . . . . . . . . . . . . . . . . . . . . . . . . . . . . . . . . . . . . . . . . . . . . . . . . . . . . 44 95
2016 2015
Customer advances . . . . . . . . . . . . . . . . . . . . . . . . . . . . . . . . . . . . . . . . . . . . . . . . . . . . . . . . . . . . . . 234 231Short-term deferred revenue . . . . . . . . . . . . . . . . . . . . . . . . . . . . . . . . . . . . . . . . . . . . . . . . . . . . . . . 163 146Customer deposits . . . . . . . . . . . . . . . . . . . . . . . . . . . . . . . . . . . . . . . . . . . . . . . . . . . . . . . . . . . . . . . 156 80Other taxes payable . . . . . . . . . . . . . . . . . . . . . . . . . . . . . . . . . . . . . . . . . . . . . . . . . . . . . . . . . . . . . . 365 268Other payments to authorities . . . . . . . . . . . . . . . . . . . . . . . . . . . . . . . . . . . . . . . . . . . . . . . . . . . . . . 84 45Due to employees . . . . . . . . . . . . . . . . . . . . . . . . . . . . . . . . . . . . . . . . . . . . . . . . . . . . . . . . . . . . . . . 136 168Other liabilities . . . . . . . . . . . . . . . . . . . . . . . . . . . . . . . . . . . . . . . . . . . . . . . . . . . . . . . . . . . . . . . . . 98 101
Other liabilities, current . . . . . . . . . . . . . . . . . . . . . . . . . . . . . . . . . . . . . . . . . . . . . . . . . . . . . . . . . 1,236 1,039
20 Inventories
Inventory is measured at the lower of cost and net-realizable value and carried at the weighted average costbasis.
Inventories consisted of the following as at December 31:
2016 2015
Telephone handsets and accessories for sale . . . . . . . . . . . . . . . . . . . . . . . . . . . . . . . . . . . . . . . . . . 117 96SIM-Cards . . . . . . . . . . . . . . . . . . . . . . . . . . . . . . . . . . . . . . . . . . . . . . . . . . . . . . . . . . . . . . . . . . . . . 16 11Other inventory . . . . . . . . . . . . . . . . . . . . . . . . . . . . . . . . . . . . . . . . . . . . . . . . . . . . . . . . . . . . . . . . . 18 20Inventory write-offs . . . . . . . . . . . . . . . . . . . . . . . . . . . . . . . . . . . . . . . . . . . . . . . . . . . . . . . . . . . . . . (26) (23)
Total . . . . . . . . . . . . . . . . . . . . . . . . . . . . . . . . . . . . . . . . . . . . . . . . . . . . . . . . . . . . . . . . . . . . . . . . . 125 104
21 Trade and other receivables
Trade and other receivables are measured at amortized cost and include invoiced amounts less appropriateallowances for estimated uncollectible amounts.
Estimated uncollectible amounts are calculated based on the ageing of the receivable balances, paymenthistory and other evidence of collectability. Receivable balances are written off when management deems themnot to be collectible.
F-69
Trade and other receivables consisted of the following as at December 31:
2016 2015
Trade accounts receivable, gross . . . . . . . . . . . . . . . . . . . . . . . . . . . . . . . . . . . . . . . . . . . . . . . . . . . . . 769 724Allowance for doubtful accounts . . . . . . . . . . . . . . . . . . . . . . . . . . . . . . . . . . . . . . . . . . . . . . . . . . . . . (160) (182)
Trade accounts receivable, net . . . . . . . . . . . . . . . . . . . . . . . . . . . . . . . . . . . . . . . . . . . . . . . . . . . . . . . 609 542Other receivables . . . . . . . . . . . . . . . . . . . . . . . . . . . . . . . . . . . . . . . . . . . . . . . . . . . . . . . . . . . . . . . . . 76 135
685 677
As at December 31, 2016, trade receivables with a value of US$160 (2015: US$182) were impaired and,thus, fully provided for. See below the movements in the allowance for the impairment of receivables:
2016 2015 2014
Balance as at January 1, . . . . . . . . . . . . . . . . . . . . . . . . . . . . . . . . . . . . . . . . . . . . . . . . . . . . . . . 182 582 795Acquisition of a subsidiary . . . . . . . . . . . . . . . . . . . . . . . . . . . . . . . . . . . . . . . . . . . . . . . . . . . . . 9 1 —Divestment of a subsidiary . . . . . . . . . . . . . . . . . . . . . . . . . . . . . . . . . . . . . . . . . . . . . . . . . . . . . (57) — —Classified as held for sale . . . . . . . . . . . . . . . . . . . . . . . . . . . . . . . . . . . . . . . . . . . . . . . . . . . . . . — (386) (4)Allowance for doubtful debts . . . . . . . . . . . . . . . . . . . . . . . . . . . . . . . . . . . . . . . . . . . . . . . . . . . 73 72 208Recoveries . . . . . . . . . . . . . . . . . . . . . . . . . . . . . . . . . . . . . . . . . . . . . . . . . . . . . . . . . . . . . . . . . (5) — (7)Accounts receivable written off . . . . . . . . . . . . . . . . . . . . . . . . . . . . . . . . . . . . . . . . . . . . . . . . . (44) (24) (292)Foreign currency translation adjustment . . . . . . . . . . . . . . . . . . . . . . . . . . . . . . . . . . . . . . . . . . 2 (63) (118)
Balance as at December 31, . . . . . . . . . . . . . . . . . . . . . . . . . . . . . . . . . . . . . . . . . . . . . . . . . . . . 160 182 582
As at December 31, 2016, the aging analysis of trade receivables is as follows:
TotalNeither past due
nor impaired
Past due but not impaired
< 30 days 30–120 days > 120 days
2016 . . . . . . . . . . . . . . . . . . . . . . . . . . . . . . . . . . . . . . . . 609 371 86 81 712015 . . . . . . . . . . . . . . . . . . . . . . . . . . . . . . . . . . . . . . . . 542 337 99 68 38
22 Cash and cash equivalents
Cash and cash equivalents are held for the purpose of meeting short-term cash commitments rather than forinvestment or other purposes. Cash and cash equivalents are comprised of cash at bank and on hand and highlyliquid investments that are readily convertible to known amounts of cash, are subject to only an insignificant riskof changes in value and have an original maturity of less than three months.
Cash and cash equivalents consisted of the following items as at December 31:
2016 2015
Cash at bank and on hand . . . . . . . . . . . . . . . . . . . . . . . . . . . . . . . . . . . . . . . . . . . . . . . . . . . . . . . . . 1,707 1,644Short-term deposits with original maturity of less than three months . . . . . . . . . . . . . . . . . . . . . . . 1,235 1,970
Total cash and cash equivalents . . . . . . . . . . . . . . . . . . . . . . . . . . . . . . . . . . . . . . . . . . . . . . . . . . . 2,942 3,614
Cash at bank earns interest at floating rates based on bank deposit rates. Short-term deposits are made forvarying periods of between one day and three months, depending on the immediate cash requirements of theCompany, and earn interest at the respective short-term deposit rates.
The cash balances as at December 31, 2016 in Uzbekistan of US$347 (2015: US$495) and in Ukraine ofUS$3 (2015: US$4) are restricted due to local government or central bank regulations and therefore cannotcurrently be repatriated. In addition, US$372 (2015: US$255) of short and long terms deposit at financialinstitutions in Uzbekistan are also subject to the same restrictions.
F-70
Cash balances as at December 31, 2016 include investments in money market funds of US$578 (2015:US$1,174).
23 Issued capital and reserves
The details of common shares of the Company are as follows, as at December 31:
2016 2015
Authorized common shares with a nominal value of US$0.001 per share . . . . . . 2,759,171,830 2,759,171,830Of which:Issued shares (Note 1) . . . . . . . . . . . . . . . . . . . . . . . . . . . . . . . . . . . . . . . . . . . . . . 1,756,731,135 1,756,731,135Treasury shares . . . . . . . . . . . . . . . . . . . . . . . . . . . . . . . . . . . . . . . . . . . . . . . . . . . (7,726,487) (7,726,487)
Outstanding shares . . . . . . . . . . . . . . . . . . . . . . . . . . . . . . . . . . . . . . . . . . . . . . . . 1,749,004,648 1,749,004,648
The holders of common shares are, subject to our by-laws and Bermuda law, generally entitled to enjoy allthe rights attaching to common shares.
Each fully paid common share entitles its holder to:
• participate in shareholder meetings;
• have one vote on all issues voted upon at a shareholder meeting, except for the purposes of cumulativevoting for the election of the Supervisory Board, in which case each common share shall have the samenumber of votes as the total number of members to be elected to the Supervisory Board and all suchvotes may be cast for a single candidate or may be distributed between or among two or morecandidates;
• receive dividends approved by the Supervisory Board;
• in the event of our liquidation, receive a pro rata share of our surplus assets; and
• exercise any other rights of a common shareholder set forth in our bye-laws and Bermuda law.
Share options exercised in each respective year have been settled using the Treasury shares of the Company.The reduction in the Treasury shares equity component is equal to the cost incurred to acquire the shares, on aweighted average basis. Any excess between the cash received from employees and reduction in Treasury sharesis recorded in capital surplus.
As at December 31, 2016, there were no (2015: 305,000,000) VEON convertible preferred shares authorizedand outstanding, with a nominal value of US$0.001 per share. The preference shares were convertible intoVEON common shares at the option of the shareholder (Telenor) any time between October 15, 2013 andApril 15, 2016 at a price based on the NASDAQ price of VEON ADSs. The redemption value of convertiblepreference shares were reflected in other financial liabilities in 2015. Each convertible preference share entitledits holder to one vote per convertible preferred share, voting together with the common shares as a single class,except where cumulative voting applied when electing directors. Convertible preferred shares did not havedividend rights. The holders of convertible preferred shares, in the event of our winding-up or dissolution, werenot entitled to any payment or distribution in respect of our surplus assets.
As at April 15, 2016, pursuant to the terms of the Company’s bye-laws, the 305,000,000 preferred sharesheld by Telenor had been redeemed by the Company at a redemption price of US$0.001 per share and are nolonger outstanding.
F-71
Nature and purpose of reserves
Other capital reserves
Other capital reserves are mainly used to recognize the value of equity-settled share-based paymenttransactions provided to employees, including key management personnel, as part of their remuneration(Note 26), to record the accumulated impact of derivatives designated as cash flow hedges (Note 18) andrecognize the results of transactions that do not result in a change of control with non-controlling interest(Note 6).
Foreign currency translation reserve
The foreign currency translation reserve is used to record exchange differences arising from the translationof the financial statements of foreign subsidiaries. The decrease in the foreign currency reserve relates mainly tothe strengthening of the US Dollar and the depreciation of emerging markets currencies in which VEONoperates.
24 Dividends paid and proposed
Pursuant to Bermuda law, VEON is restricted from declaring or paying a dividend if there are reasonablegrounds for believing that (a) VEON is, or would after the payment be, unable to pay its liabilities as theybecome due, or (b) the realizable value of VEON assets would, as a result of the dividend, be less than theaggregate of VEON liabilities.
On November 2, 2016, the Supervisory Board has approved and authorized the payment of an interim cashdividend relating to its 2016 results from its freely distributable reserves in the amount of US 3.5 cents percommon share, representing a total dividend payment of US$61. The dividend was paid on December 7, 2016.
Subsequent to year end, VEON announced that the VEON Supervisory Board has approved a new dividendpolicy, refer Note 28 for further details.
In addition to the dividend paid on December 7, 2016 the Supervisory Board, on February 27, 2017,authorized a proposed cash dividend relating to its 2016 results from its freely distributable reserves in theamount of US 19.5 cents per common share, representing a total dividend payment of US 23 cents per commonshare.
On November 6, 2015 the Company announced that the Supervisory Board authorized the payment of adividend of US 3.5 cents per ADS. The dividend was paid on December 7, 2015.
On November 11, 2014, the Supervisory Board authorized the payment of a dividend of US$3.5 cents perADS. The dividend was paid on December 8, 2014.
The Company made appropriate tax withholdings of up to 15% when the dividends is paid to theCompany’s ADS depositary, The Bank of New York Mellon.
Dividends declared to non-controlling interests
On June 22, 2016, Omnium Telecom Algeria S.p.A, a subsidiary of the Company, declared dividends to itsshareholders which were paid on September 1, on September 2 and on September 6, 2016. The portion ofdividends paid to the minority shareholders amounted to US$69.
On July 28, 2016, VimpelCom Kazakhstan Holding AG, a subsidiary of the Company, declared dividends toits shareholders which were paid on August 2, 2016. The portion of dividends paid to the minority shareholderamounted to US$18.
F-72
On September 1, 2016, TNS Plus LLP, a subsidiary of the Company, declared dividends to its shareholderswhich were paid on September 2, 2016. The portion of dividends paid to the minority shareholder amountedto US$18.
On November 18, 2016, PMCL, a subsidiary of the Company, declared divides to its shareholders. Theportion of dividends paid to the minority shareholder amounted to US$7. At December 31, 2016, the dividendspayable to minority interest is included in Trade and Other Payables.
On July 17, 2015 and August 17, 2015, VimpelCom Kazakhstan Holding AG and VimpelCom KyrgyzstanHolding AG paid dividends to its shareholders whereby the portions paid to the minority shareholder amountedto US$104 and US$23 respectfully.
25 Provisions
Provisions are recognized when the Group has a present obligation (legal or constructive) as a result of apast event, it is probable that an outflow of resources embodying economic benefits will be required to settle theobligation and a reliable estimate can be made of the amount of the obligation. Provisions are discounted using acurrent pre-tax rate if the time value of money is significant.
The following table summarizes the movement in provisions for the years ended December 31, 2016 and2015:
Incometaxes
provisions
Taxprovisions
otherthan for
income taxProvision for
decommissioningLegal
provisionsOther
provisionsTotal
provisions
At January 1, 2015 . . . . . . . . . . . . . . . 353 60 190 44 1,248 1,895Arising during the year . . . . . . . . . . . . . 92 31 15 945 37 1,120Utilized . . . . . . . . . . . . . . . . . . . . . . . . . (28) — (1) (4) (1,170) (1,203)Reclassification to HFS . . . . . . . . . . . . . (46) — (41) (27) (41) (155)Reclassification . . . . . . . . . . . . . . . . . . . 21 (9) 1 3 (16) —Unused amounts reversed . . . . . . . . . . . (67) (13) (55) (36) (16) (187)Discount rate adjustment and imputed
interest (change in estimates) . . . . . . — — 6 — — 6Translation adjustments and other . . . . (43) (4) (28) (6) (25) (106)At December 31, 2015 . . . . . . . . . . . . . 282 65 87 919 17 1,370Total non-current . . . . . . . . . . . . . . . . . 164 29 87 70 — 350Total current . . . . . . . . . . . . . . . . . . . . . 118 36 — 849 17 1,020
At January 1, 2016 . . . . . . . . . . . . . . . 282 65 87 919 17 1,370Acquisitions . . . . . . . . . . . . . . . . . . . . . — — 5 1 — 6Divestments . . . . . . . . . . . . . . . . . . . . . . — (3) — — (1) (4)Arising during the year . . . . . . . . . . . . . 67 63 1 75 45 251Utilized . . . . . . . . . . . . . . . . . . . . . . . . . (21) (24) — (821) (30) (896)Unused amounts reversed . . . . . . . . . . . (13) (5) (1) (16) 1 (34)Discount rate adjustment and imputed
interest (change in estimates) . . . . . . — — 1 — — 1Translation adjustments and other . . . . (71) — 5 (1) (5) (72)At December 31, 2016 . . . . . . . . . . . . . 244 96 98 157 27 622Total non-current . . . . . . . . . . . . . . . . . 3 — 98 45 2 148Total current . . . . . . . . . . . . . . . . . . . . . 241 96 — 112 25 474
F-73
At December 31, 2016, legal provisions include the provision of US$66 in connection with theinvestigations relating to our business in Uzbekistan, and US$66 relating to GTH—Iraqna Litigation, as furtherdiscussed below.
During 2016, the Company also recorded provisions for a number of tax disputes in Pakistan andBangladesh, including disputes relating to the supply of SIM cards.
The timing of payments in respect of non-current provisions is, with few exceptions, not contractually fixedand cannot be estimated with certainty. Key assumptions and sources of uncertainty are discussed in Note 4.
Significant tax and legal proceedings are discussed in Note 27. Given the uncertainties inherent in suchproceedings, there can be no guarantee that the ultimate outcome will be in line with VEON’s current view.
The Group has recognized a provision for decommissioning obligations associated with future dismantlingof its towers in various jurisdictions.
Investigations by SEC/DOJ/OM
During the first quarter of 2016, the Company reached resolutions through agreements with the U.S.Securities and Exchange Commission (“SEC”), the U.S. Department of Justice (“DOJ”), and the Dutch PublicProsecution Service (Openbaar Ministerie) (“OM”) relating to the previously disclosed investigations under theU.S. Foreign Corrupt Practices Act (the “FCPA”) and relevant Dutch laws, pertaining to the Company’s businessin Uzbekistan and prior dealings with Takilant Ltd. Pursuant to these agreements, the Company paid anaggregate amount of US$795 in fines and disgorgements to the SEC, the DOJ and the OM in the first quarter of2016.
On February 18, 2016, the United States District Court for the Southern District of New York (the “DistrictCourt”) approved the agreements with the DOJ relating to charges that the Company and its subsidiary violatedthe anti-bribery, books-and-records and internal controls provisions of the FCPA. These agreements consisted ofthe deferred prosecution agreement (the “DPA”), entered into by VEON and the DOJ and a guilty plea by UnitelLLC (“Unitel”), a subsidiary of VEON operating in Uzbekistan. Under the agreements with the DOJ, VEONagreed to pay a total criminal penalty of US$230 to the United States, including US$40 in forfeiture.
In connection with the investigation by the OM, VEON and Silkway Holding BV, a wholly ownedsubsidiary of VEON, entered into a settlement agreement (the “Dutch Settlement Agreement”) related to anti-bribery and false books-and-records provisions of Dutch law. Pursuant to the Dutch Settlement Agreement,VEON agreed to pay criminal fines of US$230 and to disgorge a total of US$375, which was satisfied by theforfeiture to the DOJ of US$40, a disgorgement to the SEC of US$167.5 and a further payment to the OM ofUS$167.5 beyond the criminal fines.
VEON also consented to the entry of a judgment and incorporated consent (the “SEC Judgment”), whichwas approved by the District Court on February 22, 2016, relating to the SEC’s complaint against VEON, whichcharged violations of the anti-bribery, books-and-records and internal controls provisions of the FCPA. Pursuantto the SEC Judgment, VEON agreed to a judgment ordering disgorgement of US$375, to be satisfied by theforfeiture to the DOJ of US$40, the disgorgement to the OM of US$167.5, and a payment to the SEC ofUS$167.5, and imposing a permanent injunction against future violations of the U.S. federal securities laws.
The DPA, the guilty plea, the Dutch Settlement Agreement and the SEC Judgment comprise the terms of theresolution of the Company’s potential liabilities in the previously disclosed DOJ, SEC and OM investigationsregarding VEON and Unitel.
F-74
All amounts to be paid under the DPA, the guilty plea, the Dutch Settlement Agreement and the SECJudgment were paid in the first quarter of 2016 and were deducted from the already existing provision ofUS$900 recorded in the third quarter of 2015 and disclosed in the 2015 annual consolidated financial statements.The remaining provision of US$105 related to future direct and incremental expected legal fees associated withthe resolutions. As of December 31, 2016, the Company had paid US$24 in legal fees utilizing this provision,and changed its estimate by reducing the provision by US$16 resulting in the remaining balance of the provisionof US$66. The Company cannot currently estimate the magnitude of future costs to be incurred to comply withthe DPA, the SEC Judgment and the Dutch Settlement Agreement, but these costs could be significant.
GTH—Iraqna Litigation
On November 19, 2012, Atheer Telecom Iraq Limited (“Atheer”, an affiliate of the Zain Group) initiatedEnglish High Court proceedings in London against Orascom Telecom Iraq Ltd. (“OTIL”) (a Maltese subsidiaryof GTH) and GTH in relation to a dispute arising out of the sale by OTIL of its Iraqi mobile subsidiary, Iraqna, in2007 to Atheer. Atheer’s claim is founded on the tax covenants in the underlying share purchase agreement(“Iraqna SPA”) between the parties. In particular, Atheer is seeking declarations from the Court that OTIL andGTH are liable to indemnify it in respect of three alleged tax liabilities: (i) a capital gains tax liability in the sumof Iraqi dinar (“IQD”) 219 billion (US$198), which Atheer claims is in respect of the transaction that formed thesubject-matter of the Iraqna SPA; (ii) an income tax liability in the sum of IQD 96 billion (US$87) in respect ofthe years 2004-2007; and (iii) a withholding tax liability in the sum of IQD 7 billion (US$6). OTIL and GTHdispute these claims and are vigorously defending them.
The dispute was listed for trial on July 20, 2015. As a result of delays by Atheer in providing disclosure,occasioning the parties to amend their respective statements of case, the trial was adjourned to the weekcommencing November 14, 2016. Atheer’s amendments included withdrawing its claim for unjust enrichment inthe amount of IQD 219 billion (US$198) and conceding that its contractual claims are capped at a total possiblerecovery of US$60.
The trial was heard November 14-18, 2016. On February 17, 2017, the court found GTH liable. Following ahearing on March 1, 2017, GTH and OTIL were ordered to pay Atheer the amounts of US$60, plusapproximately US$8 in accrued interest, and an interim payment of GBP 1.25 million (US$2) for legal costspending submission of a detailed schedule of costs by Atheer. The trial court judge denied GTH’s and OTIL’srequest for leave to appeal and did not stay enforcement pending appeal. An application for Leave to Appeal thetrial decision at the Court of Appeal was filed on March 22, 2017, and remains pending. The Company providedfor the Court’s judgment including the related legal fees.
26 Related parties
As at December 31, 2016, the Company is primarily owned by two major shareholders, being LetterOne andTelenor. The Company has no ultimate controlling shareholder. See also Note 1 for details regarding changes inthe ownership structure.
F-75
The following table provides the total amount of transactions that have been entered into with related partiesand balances of accounts with them for the relevant financial periods:
December 31, 2016 December 31, 2015
Revenue from LetterOne . . . . . . . . . . . . . . . . . . . . . . . . . . . . . . . . . . . . . . . . . — 2Revenue from Telenor . . . . . . . . . . . . . . . . . . . . . . . . . . . . . . . . . . . . . . . . . . . 60 51Revenue from discontinued operations . . . . . . . . . . . . . . . . . . . . . . . . . . . . . . 68 60Revenue from associates and joint ventures . . . . . . . . . . . . . . . . . . . . . . . . . . 19 6Revenue from other related parties . . . . . . . . . . . . . . . . . . . . . . . . . . . . . . . . . — 6Finance income from related parties . . . . . . . . . . . . . . . . . . . . . . . . . . . . . . . . — 1
148 126
Services from LetterOne . . . . . . . . . . . . . . . . . . . . . . . . . . . . . . . . . . . . . . . . . 8 8Services from Telenor . . . . . . . . . . . . . . . . . . . . . . . . . . . . . . . . . . . . . . . . . . . 64 44Services from discontinued operations . . . . . . . . . . . . . . . . . . . . . . . . . . . . . . 6 5Services from associates and joint ventures . . . . . . . . . . . . . . . . . . . . . . . . . . 19 20Services from other related parties . . . . . . . . . . . . . . . . . . . . . . . . . . . . . . . . . — 5Finance costs to other related parties . . . . . . . . . . . . . . . . . . . . . . . . . . . . . . . . — 1
97 83
December 31, 2016 December 31, 2015
Accounts receivable from Telenor . . . . . . . . . . . . . . . . . . . . . . . . . . . . . . . . . 13 10Accounts receivable from associates and joint ventures . . . . . . . . . . . . . . . . . 24 8Accounts receivable due from discontinued operations . . . . . . . . . . . . . . . . . — 84Other assets due from RP . . . . . . . . . . . . . . . . . . . . . . . . . . . . . . . . . . . . . . . . 3 1
40 103
Accounts payable to LetterOne . . . . . . . . . . . . . . . . . . . . . . . . . . . . . . . . . . . . 1 —Accounts payable to Telenor . . . . . . . . . . . . . . . . . . . . . . . . . . . . . . . . . . . . . . 9 8Accounts payable due to discontinued operations . . . . . . . . . . . . . . . . . . . . . . — 146Accounts payable due to associates and joint ventures . . . . . . . . . . . . . . . . . . 5 2
15 156
Related Party Transactions with Major Shareholders and their Affiliates
Related Party Transactions with Telenor and its Affiliates
Service Agreements
VEON is a party to a service agreement with Telenor, dated March 8, 2011, under which Telenor renders toVEON or its affiliates services related to telecommunication operations, including management advisoryservices, training, technical assistance and network maintenance, industry information research and consulting,implementation support for special projects and other services as mutually agreed by Telenor and VEON. VEONpays Telenor annually US$1.5 for the services.
A number of our operating companies have roaming agreements with the following mobile operators thatare Telenor affiliates: Grameenphone Limited (Bangladesh), Telenor Norge AS (Denmark), TelenorMagyarorszag Zrt. (Hungary), DiGi Telecommunications Sdn. Bhd. (Malaysia), Telenor (Montenegro), TelenorPakistan (Pvt) Ltd. (Pakistan), Telekom d.o.o. (Serbia), Telenor Sverige AB (Sweden) and Total AccessCommunication Public Company Limited (dtac) (Thailand).
F-76
Related Party Transactions with LetterOne and its Affiliates
Service Agreements
VEON is a party to a General Services Agreement with LetterOne Corporate Advisor Limited, datedDecember 1, 2010, under which LetterOne Corporate Advisor Limited renders to VEON and its affiliatesservices related to telecommunication operations, including management advisory services, training, technicalassistance and network maintenance, industry information research and consulting, implementation support forspecial projects and other services as mutually agreed by LetterOne Corporate Advisor Limited and VEON.VEON pays LetterOne Corporate Advisor Limited annually US$1.5 for the services. VEON is also party to aConsultancy Deed with LetterOne Corporate Advisor Limited, dated August 21, 2013, under which LetterOneCorporate Advisor Limited provides additional consultancy services to VEON for which VEON pays annuallyUS$3.5. The General Services Agreement and Consultancy Deed were originally entered into by VEON andAltimo Management Services Ltd., but the latter was replaced first by LetterOne Corporate Advisor Limitedpursuant to a Deed of Assignment and Novation dated June 3, 2014, and later by LIHS Corporate AdvisorLimited pursuant to a Deed of Novation and Amendment dated January 14, 2016.
Related Party Transactions with Joint Ventures
Italy Joint Venture
VEON has commercial contracts with the newly established joint venture in Italy, largely relating toroaming and interconnect which are transacted at arm’s length and presented in the table above.
Euroset
PJSC VimpelCom has commercial contracts with Euroset, which became an associate in October 2008. In2016 PJSC VimpelCom recognized US$4 (2015: US$5) of revenue from Euroset primarily for mobile and fixedline services and from the sale of equipment and accessories. PJSC VimpelCom accrued to Euroset certainexpenses totaling US$19 (2015: US$20) in 2016, primarily dealer commissions and bonuses for services foracquisition of new customers, customer care and receipt of customers’ payments.
Balances and transactions from discontinued operations (Note 6)
Following the reclassification of the operations in Italy as an asset held for sale and discontinued operation,the intercompany positions between the continued and discontinued portions of the Group were are treated asRelated Party mainly representing regular business activities, i.e. roaming and interconnect.
Prior to classification as held for sale and discontinued operations, on February 27, 2015, the Company’sfully owned subsidiary in Italy, WIND Telecomunicazioni S.p.A. (“WIND Italy”), entered into a definitiveagreement for the sale of 90% of the shares of WIND Italy’s fully owned subsidiary Galata S.p.A. to AbertisTelecom Terrestre SAU. Following the closing of this transaction in March 2015, Galata S.p.A. is treated in Italyas an Investment in Associate, and therefore it continues to be presented as a Related Party transactions in theCompany’s IFRS consolidated financial statements.
Compensation of key management personnel of the Company
Under the Company’s bye-laws, the Supervisory Board of the Company established the CompensationCommittee (the “Compensation Committee”), which has the overall responsibility for approving and evaluatingthe compensation and benefit plans, policies and programs of the Company’s directors, officers and employeesand for supervising the administration of the Company’s equity incentive plans and other compensation andincentive programs.
F-77
The Compensation Committee’s rules and competences are set forth in the Company’s CompensationCommittee Charter, which forms part of the Company’s bye-laws adopted on April 20, 2010, as amended andrestated on September 2, 2013.
The Compensation Committee adheres to the following objectives in setting out compensation policies forthe group:
1. To incentivize and reward individual and collective performance in a balanced and fair mannerthroughout the group;
2. To set and communicate clear targets based on the group’s strategic priorities; and
3. To unify and standardize the rules for incentives across the group’s headquarters in Amsterdam and itsoffices in London, Regional headquarters and Operational Companies (the “OpCos”).
The aim of the group’s compensation and benefit policies and incentive plans is to stimulate and rewardleadership efforts that result in sustainable success, improve our local and global performance, build increasedtrust and sponsorship and support long-term value creation. The group’s compensation includes base salary, aswell as short and long-term incentive schemes.
To ensure the overall competitiveness of the Company’s and the group’s pay levels, these levels arebenchmarked against a peer group which consists of companies that are comparable in terms of size and scope, aslisted on the NASDAQ stock exchange. The Compensation Committee regularly reviews the peer group toensure that its composition is still appropriate. The composition of the peer group might be adjusted as a result ofmergers or other corporate activities. The relative size of the Company and the group it belongs to is taken intoaccount when determining whether the pay levels within the group are in line with the market-median levels.
Each year, the Compensation Committee conducts a scenario analysis, which includes the calculation andcomposition of the remuneration under different scenarios. The Compensation Committee concluded that thecurrent policy has proven to function well in terms of a relationship between the strategic objectives and thechosen performance criteria and believes that the short and long-term incentive plans support this relationship.
The Company’s Short Term Incentive Scheme (the “STI Scheme”) provides cash pay-outs to participatingemployees based on the achievement of established Key Performance Indicators (“KPI”) over the period of onecalendar year. KPIs are set every year at the beginning of the year and evaluated in the first quarter of the nextyear. The KPIs are partially based on the performance of the Company (or the affiliated entity employing theemployee) and partially based on the performance of the individual. The target pay range is between 15% and100% of the participant’s annual gross base salary.
To stimulate and reward leadership efforts that result in sustainable success, the Value-Growth Cash BasedLong-Term Incentive Plan (the “LTI Plan”) has been designed for members of our recognized leadershipcommunity. The participants in the LTI Plan may receive cash payouts after the LTI Plan cycle, which iscurrently 42 months (e.g. January 1, 2014 to June 30, 2017 with a potential payout by Q4 of 2017 at the latest).The target pay aims at 50% to 100% of a participant’s annual gross base salary and since 2016 is based on theTotal Shareholder Return (“TSR”) of the Company compared to peer companies in the markets in which weoperate. The KPIs are based on the TSR evolution compared to peer companies in the markets in which weoperate. This pay structure enables the Company to attract, incentivize and retain highly skilled seniormanagement with highly valuable experience and backgrounds.
The Company furthermore considers from time to time new long term incentive plans, which may result inadditional payouts not described above.
F-78
Executives of the Company may also be invited to participate in the Company’s Executive Investment Plan(the “Executive Investment Plan”), which provides for payment of a matching investment subject to satisfactionof KPIs determined by the Committee. Currently, there are no such plans active and the last plan expired in 2016without matching investments being due.
Members of the Supervisory Board and Management Board of the Company are the key managementpersonnel. The following table sets forth the total compensation paid to key management personnel:
2016 2015 2014
Short-term employee benefits . . . . . . . . . . . . . . . . . . . . . . . . . . . . . . . . . . . . . . . . . . . . . . . . . . . 37 36 26Long-term employee benefits . . . . . . . . . . . . . . . . . . . . . . . . . . . . . . . . . . . . . . . . . . . . . . . . . . . 34 27 19Share-based payment transactions . . . . . . . . . . . . . . . . . . . . . . . . . . . . . . . . . . . . . . . . . . . . . . . . — 3 2Termination benefits . . . . . . . . . . . . . . . . . . . . . . . . . . . . . . . . . . . . . . . . . . . . . . . . . . . . . . . . . . 4 2 1
Total compensation paid to key management personnel . . . . . . . . . . . . . . . . . . . . . . . . . . . . 75 68 48
Each of our unaffiliated directors currently receives an annual retainer of EUR 150,000 (US$163 thousand).Each affiliated director receives an annual retainer of EUR 40,000 (US$43 thousand), and our current chairmanof the Supervisory Board receives an additional annual retainer of EUR 4,000 (US$4 thousand). In addition, eachunaffiliated director who serves on any official committees of our Supervisory Board receives additional annualcompensation of EUR 30,000 (US$33 thousand) per committee (for serving as the head of any such committee)or EUR 25,000 (US$27 thousand) committee (for serving as a member of any such committee). In 2016 thechairman of the Nominating and Corporate Governance Committee was awarded an additional one-offdiscretionary compensation of EUR 345,000 (US$372 thousand). All of our directors are reimbursed forexpenses incurred in connection with service as a member of our Supervisory Board. Currently, five of theCompany’s directors are considered “affiliated directors” (as defined in the Company’s bye-laws) because theyare affiliated with LetterOne or Telenor (or their affiliates). The remaining four directors are considered“unaffiliated directors”.
Members of our senior Management and Supervisory Board are eligible to participate in cash based longterm incentive plans discussed below.
The following table sets forth the total compensation paid to the key management board members in 2016(gross amounts in EUR and US$ equivalent):
Group CEOJean-Yves Charlier
Group CFOAndrew Davies
Group General CounselScott Dresser
EUR US$ EUR US$ EUR US$
Base salary (incl. holiday pay) . . . . . . 2,500,000 2,750,000 1,100,000 1,210,000 750,000 825,000Bonus 2015 (STI) . . . . . . . . . . . . . . . . 2,130,000 2,343,000 850,000 935,000 460,000 506,000Other . . . . . . . . . . . . . . . . . . . . . . . . . . 26,000 28,600 20,000 22,000
Total gross remuneration . . . . . . . . . 4,656,000 5,121,600 1,950,000 2,145,000 1,230,000 1,353,000
2013-2015 Cash-based Long Term Incentive Plan
In 2013, a cash based long term incentive plan (“LTI Plan 2013”) was adopted for members of ourrecognized leadership team. Under the LTI Plan 2013, the target amount that can be earned during the three yearperformance period (2013-2015) was determined at the time of the grant. The actual amount that can be earned issubject to the attainment of KPIs, which KPIs were set at the grant date for the duration of the three yearperformance period and looked at business and strategic objectives such as EBITDA market share and revenuemarket share. The award vested in three annual tranches (2013, 2014 and 2015), assuming a full timeparticipation in the plan as of January 1, 2013 up to and including 2015. All unvested tranches lapsed if theemployment was terminated before the end of the performance period.
F-79
In 2015, EUR 3.6 million (US$4) was banked / paid in relation to amounts vested under the 2014 tranche.The total of target bonus amounts for the 2015 tranches was US$ nil, as the 2013-2015 Cash Based Long TermIncentive Plan was discontinued from January 1, 2015 and replaced by the Value Growth Cash Based Long TermIncentive Plan discussed below.
2014 - 2016 and 2015 - 2017 Value Growth Cash Based Long Term Incentive Plan
The 2014 - 2016 LTI award
In January 2015, a new cash based long term incentive plan was adopted for senior management, replacingthe LTI Plan 2013. The first award that was launched under this new plan was the 2014 LTI award. Under thenew LTI Plan, the 2014 awards are granted annually, the vesting of which is subject to the attainment of KPIsover a three and a half year (42 months) performance period (January 1, 2014 to June 30, 2017). The maximumtarget amount that may be earned under an award is determined at the time of the grant. The vesting of an awardis subject to continued employment (except in limited “good leaver” circumstances) and to the Committee’sdetermination of the attainment of set KPIs after the relevant performance period (in the third quarter of 2017).The award was initially subject to the attainment of KPIs, generally with an equal or comparable weight, subjectto individual discrepancies, that were business and strategy related, such as EBITDA market share and revenuemarket share and the TSR evolution compared to peer companies in the markets in which we operate for ourOpCos. For our HQ, the amount of the award was based on TSR evolution compared to selected peer companies.In the course of 2016, the plan was modified in such way that also for our OpCos, the amount of the award alsoentirely depended on TSR. For participants joining after the start of a performance period and for participantsleaving during the first three years of the performance period (in the LTI Plan referred to as “QualifyingPeriod”), vested awards will be subject to pro-rata reduction in accordance with the actual period of employmentduring this Qualifying Period. Awards may vest early upon the occurrence of certain corporate events relating toVEON Ltd., subject to the Committee’s determination of the attainment of KPIs at the time of the relevant eventand a potential pro-rata reduction to reflect the early vesting.
The 2015 - 2017 LTI award
In January 2015, a new award was launched for senior management under the Value Growth Cash BasedLong Term Incentive Plan, the vesting of which is subject to the attainment of KPIs over a three and a half year(42 months) performance period (January 1, 2015 to June 30, 2018 for the first awards). The KPIs are principallybased on the TSR evolution compared to peer companies in the markets in which we operate. The Committeeregularly reviews the peer group to ensure that its composition is still appropriate. The same principles as for the2014-2016 LTI Plan apply. The pay-out is based on TSR evolution in the markets in which we operate.
As at December 31, 2016, the total target amount (all unvested) granted under the 2014 and 2015 awards ofthe 2014-2016 Cash Based Long Term Incentive Plan was US$22.
Director Cash Based Long Term Incentive Plan
In December 2014, our Supervisory Board approved a cash based Long Term Incentive Plan for ourunaffiliated directors (the “Director LTI Plan”). Under the Director LTI Plan, awards are granted annually,covering a three year performance period (January 1, 2014 to December 31, 2016 for the first awards, with anadditional performance measurement over the first six months of 2017 and, January 1, 2015 to June 30, 2018 forthe second awards). The actual amount that may be earned under an award is determined on the basis of theannual retainer of the unaffiliated director and the actual payout to headquarters participants in the correspondingtranches of the Cash Based Long Term Incentive Plan (discussed above). For participants leaving before the end,or joining after the start, of a performance period, vested awards will be subject to pro-rata reduction, providedthat the participant has served as an unaffiliated director for at least 12 months during the performance period.Awards may vest early upon the occurrence of certain corporate events relating to VEON Ltd., subject to thecompensation committee’s determination of the attainment of KPIs at the time of the relevant event and apotential pro-rata reduction to reflect the early vesting.
F-80
As at December 31, 2016, the total amount granted under the 2014 and 2015 awards of the Director LTIPlan was EUR 0.9 million (US$1).
Short Term Incentive Plan
The Compensation Committee has approved the following key objectives for the STI Plan in 2017:
1. To incentivize and reward individual and collective short-term performance in a balanced and fairmanner throughout the Group;
2. To set and communicate clear short-term targets based on the Group’s strategic priorities—inparticular, execution of the digital agenda, new operating model and cultural transformation; and
3. To unify and standardize the rules for short term incentives across the Group’s HQ (Amsterdam andLondon), Regional HQs and OpCos.
The Company’s Short Term Incentive Scheme (the “STI Scheme”) provides that the participatingemployees may receive cash payouts based on achievement of set KPIs over the period of one calendar year.KPIs are set every year at the beginning of the year and evaluated in the first quarter of the next year. The KPIsare partially based on the performance of the Company and partially based on the performance by the individualand look at business and strategic objectives of the Company. The KPIs relate to the financial and operationalresults of the Company (such as EBITDA and total operating revenue) as well as to individual targets that areagreed upon with the participant at the start of the performance period based on his or her specific role andactivities. The weight of each KPI is decided on an individual basis. The target pay ranges between 15% and100% of the annual gross base salary.
Pay-out of the STI award is scheduled in March of the year following the assessment year and is subject tocontinued active employment during the year of assessment (except in limited “good leaver” circumstances inwhich case there is a pro-rata reduction) and is also subject to a pro-rata reduction if the participant commencedemployment after the start of the year of assessment.
Executive Investment Plan
Executives of the Company may also be invited to participate in the Company’s Executive Investment Plan(the “Executive Investment Plan”), which provides for payment of a matching investment subject to satisfactionof KPIs determined by the Committee. Currently, there are no such plans active and the last plan expired in 2016without matching investments being due.
27 Risks, commitments, contingencies and uncertainties
Risks
Currency control risks
The imposition of currency exchange controls or other similar restrictions on currency convertibility in thecountries in which VEON operates, including Ukraine and Uzbekistan, could limit VEON’s ability to convertlocal currencies or repatriate local cash in a timely manner or at all, as well as remit dividends from therespective countries. Any such restrictions could have a material adverse effect on VEON’s business, financialcondition and results of operations. The continued success and stability of the economies of these countries willbe significantly impacted by their respective governments’ continued actions with regard to supervisory, legaland economic reforms. Refer to Note 22 for further information regarding restricted cash.
Domestic and global economy risks
The Company has significant operations in Russia and Ukraine, which represents 52% and 36% of theGroup’s revenues and assets excluding intercompany transactions and balances, respectively. Both countries are
F-81
currently experiencing a period of significant political and macroeconomic volatility, the outcome of whichcannot be predicted and could negatively affect the Company’s financial position, results of operations andbusiness prospects.
While management believes it is taking the appropriate measures to support the sustainability of VEON’sbusiness in the current circumstances, unexpected further deterioration in the areas could negatively affect theCompany’s results and financial position in a manner not currently determinable.
Change in law and compliance risks
In the ordinary course of business, VEON may be party to various legal and tax proceedings, including as itrelates to compliance with the rules of the telecom regulators in the countries in which VEON operates,competition law and anti-bribery and corruption laws, including the U.S. Foreign Corrupt Practices Act(“FCPA”). Non-compliance with such rules and laws may cause VEON to be subject to claims, some of whichmay relate to the developing markets and evolving fiscal and regulatory environments in which VEON operates.In the opinion of management, VEON’s liability, if any, in all pending litigation, other legal proceeding or othermatters, other than what is discussed in this Note, will not have a material effect upon the financial condition,results of operations or liquidity of VEON.
Tax risks
The tax legislation in the markets in which VEON operates is unpredictable and gives rise to significantuncertainties, which could complicate our tax planning and business decisions. Tax laws in many of the emergingmarkets in which we operate have been in force for a relatively short period of time as compared to tax laws inmore developed market economies. Tax authorities in our markets are often somewhat less advanced in theirinterpretation of tax laws, as well as in their enforcement and tax collection methods.
Any sudden and unforeseen amendments of tax laws or changes in the tax authorities’ interpretations of therespective tax laws and/or double tax treaties, could have a material adverse effect on our future results ofoperations, cash flows or the amounts of dividends available for distribution to shareholders in a particular period(e.g. introduction of transfer pricing rules, Controlled Foreign Operation (“CFC”) legislation and more strict taxresidency rules).
Management believes that VEON has paid or accrued all taxes that are applicable. Where uncertainty exists,VEON has accrued tax liabilities based on management’s best estimate. From time to time, we may also identifytax contingencies for which we have not recorded an accrual. Such unaccrued tax contingencies could materializeand require us to pay additional amounts of tax.
Commitments
Capital commitments for the future purchase of equipment and intangible assets are as follows as atDecember 31:
2016 2015 2014*
Property, plant and equipmentLess than 1 year . . . . . . . . . . . . . . . . . . . . . . . . . . . . . . . . . . . . . . . . . . . . . . . . . . . . . . . . . . 689 382 290Between 1 and 3 years . . . . . . . . . . . . . . . . . . . . . . . . . . . . . . . . . . . . . . . . . . . . . . . . . . . . . 448 463 448Between 3 and 5 years . . . . . . . . . . . . . . . . . . . . . . . . . . . . . . . . . . . . . . . . . . . . . . . . . . . . . — 224 448Intangible assetsLess than 1 year . . . . . . . . . . . . . . . . . . . . . . . . . . . . . . . . . . . . . . . . . . . . . . . . . . . . . . . . . . 32 1 9Between 1 and 3 years . . . . . . . . . . . . . . . . . . . . . . . . . . . . . . . . . . . . . . . . . . . . . . . . . . . . . 18 11 —
Total . . . . . . . . . . . . . . . . . . . . . . . . . . . . . . . . . . . . . . . . . . . . . . . . . . . . . . . . . . . . . . . . . . . 1,187 1,081 1,195
* Excluding capital commitments of the Group’s operations in Italy as at December 31, 2014 of US$396.
F-82
Telecom Licenses Capital Commitments
VEON’s ability to generate revenue in the countries it operates is dependent upon the operation of thewireless telecommunications networks authorized under its various licenses under GSM-900/1800 and “3G”(UMTS / WCDMA) mobile radiotelephony communications services and “4G” (LTE). Under the licenseagreements, operating companies are subject to certain commitments, such as territory or population coverage,level of capital expenditures, and number of base stations to be fulfilled within a certain timeframe. Afterexpiration of the license, our operating companies might be subject to additional payments for renewals, as wellas new license capital and other commitments.
In July 2012, PJSC VimpelCom was awarded a mobile license, a data transmission license, a voicetransmission license and a telematic license for the provision of LTE services in Russia. The roll-out of the LTEnetwork will occur through a phased approach based on a pre-defined schedule pursuant to the requirements ofthe license. The LTE services were launched in the middle of 2013 and offered in six regions in Russia by theend of the year. The services must be extended to a specific number of additional regions each year through toDecember 1, 2019 by when services must cover all of Russia. PJSC VimpelCom is required to comply with thefollowing conditions among others under the terms of the license: (i) invest at least RUB 15 billion (US$224) ineach calendar year, for which the Company continues to comply with to date in the construction of its federalLTE network until the network is completed, which must occur before December 1, 2019; (ii) provide certaindata transmission services in all secondary and higher educational institutions in specified areas with populationover 50 thousand; and (iii) provide interconnection capability to telecommunications operators that providemobile services using virtual networks in any five regions in Russia not later than July 25, 2016. The latterrequirement was fulfilled by PJSC VimpelCom within the required time.
Operating lease commitments
Operating lease commitments are as follows as at December 31:
2016 2015 2014
Less than 1 year . . . . . . . . . . . . . . . . . . . . . . . . . . . . . . . . . . . . . . . . . . . . . . . . . . . . . . . . . . . . . . 121 60 209Between 1 and 5 years . . . . . . . . . . . . . . . . . . . . . . . . . . . . . . . . . . . . . . . . . . . . . . . . . . . . . . . . . 368 153 365More than 5 years . . . . . . . . . . . . . . . . . . . . . . . . . . . . . . . . . . . . . . . . . . . . . . . . . . . . . . . . . . . . . 148 66 200
Total . . . . . . . . . . . . . . . . . . . . . . . . . . . . . . . . . . . . . . . . . . . . . . . . . . . . . . . . . . . . . . . . . . . . . . . 637 279 774
Operating lease commitments mainly relate to the lease of base station sites and office spaces. Operatingleases can be renewed but may be subject to renegotiations with lessors.
Contingencies
VEON—Securities Class Action
On November 4, 2015, a class action lawsuit was filed in the United States against VEON and certain of itscurrent and former officers by Charles Kux-Kardos, on behalf of himself and other investors in the Companyalleging certain violations of the United States federal securities laws in connection with the Company’s publicdisclosures relating to its operations in Uzbekistan. On December 4, 2015, a second complaint was filed byWestway Alliance Corp. that asserts essentially the same claims in connection with essentially the samedisclosures.
On April 27, 2016, the court consolidated the two actions and appointed Westway as lead plaintiff. OnMay 6, 2016, a motion for reconsideration was filed on the appointment of Westway as lead plaintiff and onSeptember 26, 2016, the court affirmed the selection of Westway as the lead plaintiff. An amended complaintwas filed on December 9, 2016. Briefing on VEON’s motion to dismiss the amended complaint will becompleted by May 2017. No date has been set for any hearing, and the timing of the court’s resolution of themotion is unknown.
F-83
GTH—Licence Fees Tax Litigation
The Egyptian Tax Authority (“ETA”) conducted a review of GTH’s tax filings for the years 2000-2004.Following the review, in May 2010, the Internal Committee of the ETA assessed additional tax liabilities in theamount of approximately Egyptian pound (“EGP”) 2 billion (US$256) against GTH for these years. The basisfor the assessment was that, according to the ETA, GTH’s investments in Algeria, Syria, Iraq, Tunisia andSub-Saharan Africa during these years were actually license fees paid to foreign governments for which Egyptianwithholding tax was due according to Egyptian tax laws.
GTH challenged the Internal Committee’s ETA’s assessment before the Appellate Committee of the ETA.On May 14, 2012, the Appellate Committee cancelled the Internal Committee’s assessment of EGP 2 billion(US$256) in part and reduced the assessed amount to EGP 323 million (US$41).
GTH agreed to pay the assessed amount of EGP 323 million (US$41) in instalments on a without prejudicebasis, which it has satisfied, and also appealed the Appellate Committee’s decision to the North Cairo Court ofFirst Instance. The ETA also challenged the Appellate Committee’s decision and is seeking to reinstitute itsoriginal assessment of EGP 2 billion (US$256) plus late payment interest. The proceedings remain ongoingbefore the court.
Separately, on January 18, 2016, GTH, through its tax advisors, received a demand from the ETA claimingan amount of EGP 429 million (US$55) in late payment interest on the Appellate Committee’s assessment ofEGP 323 million (US$41). The demand threatened administrative seizure of GTH’s assets in the event ofnon-payment. On February 17, 2016, GTH filed an appeal in the Administrative Court to challenge the demandand intends to vigorously defend itself. On February 24, 2016, GTH received an updated demand from the ETA,which GTH objected to on March 24, 2016. On May 3, 2016, the ETA resent the same demand, which GTHagain objected to on May 7, 2016.
GTH—Iraqi Profits and Dividends Tax Litigation
Tax year 2005
In March 2011, the ETA conducted an audit of GTH’s tax filings for the year 2005. Following its review,the ETA concluded that income derived by OTIL from Iraqna (“OTIL-Iraqna Income”) for that year should beincluded in GTH’s tax return and taxed at 20%, and accordingly claimed additional corporate income tax of EGP235 million (US$30).
GTH challenged the ETA’s claim before the Internal Committee of the ETA arguing that the OTIL-IraqnaIncome should be fully exempt from Egyptian corporate income tax pursuant to the Iraq-Egypt double taxationtreaty.
On October 2, 2011, the Internal Committee ruled that the OTIL-Iraqna Income should be taxed at 20% inthe amount of EGP 235 million (US$30) but that credit should be given for taxes paid by OTIL in Iraq. GTH’sappeal to the Appellate Committee of the ETA was dismissed on August 1, 2015.
On November 11, 2015, GTH appealed the Appellate Committee’s decision to the Administrative Courtwhere proceedings are ongoing.
Separately, on January 18, 2016, GTH, through its tax advisors, received a demand from the ETA claimingan amount of EGP 235 million (US$30) assessed by the Appellate Committee together with late payment interestof EGP 258 million (US$33). The demand threatened administrative seizure of GTH’s assets in the event ofnon-payment. On February 17, 2016, GTH filed an appeal in the Administrative Court to challenge the demandand intends to vigorously defend itself. On February 24, 2016, GTH received an updated demand from the ETAclaiming EGP 505 million (EGP 235 million principal plus EGP 270 million interest), which GTH objected to onMarch 24, 2016. On May 3, 2016, the ETA sent a new demand, which GTH objected to on May 7, 2016.
F-84
Tax year 2007
During the audit conducted by the ETA in 2011 in respect GTH’s tax filings for the year 2007, the ETAconcluded that GTH owed additional corporate income tax of EGP 282 million (US$36) in respect of dividendsdistributed by Iraqna to OTIL in 2007. After GTH disputed the claim on the basis of the Iraq-Egypt doubletaxation treaty, the ETA referred the dispute to the Internal Committee, who upheld the ETA’s position. GTHappealed the Internal Committee’s decision to the Appeal Committee, where proceedings are ongoing.
VAT on Replacement SIMs
On April 1, 2012, the National Board of Revenue (“NBR”) issued a demand to Banglalink for BDT7.74 billion (US$98 as of December 31, 2016) for unpaid SIM tax (VAT and supplementary duty). The NBRalleged that Banglalink evaded SIM tax on new SIM cards by issuing them as replacements. On the basis of5 random SIM card purchases made by the NBR, the NBR concluded that all SIM card replacements issued byBanglalink between June 2009 and December 2011 (7,021,834 in total) were new SIM connections and subject totax. Similar notices were sent to three other operators in Bangladesh. Banglalink and the other operators filedseparate petitions in the High Court, which stayed enforcement of the demands.
In an attempt to assist the NBR in resolving the dispute, the Government ordered the NBR to form a ReviewCommittee comprised of the NBR, the Commissioner of Taxes (“LTU”), Bangladesh TelecommunicationRegulatory Commission (“BTRC”), AMTOB and the operators (including Banglalink). The Review Committeeidentified a methodology to determine the amount of unpaid SIM tax and, after analyzing 1,200 randomlyselected SIM cards issued Banglalink, determined that only 4.83% were incorrectly registered as replacements.The Review Committee’s interim report was signed off by all the parties, however, the Convenor of the ReviewCommittee reneged on the interim report and unilaterally published a final report that was not based on theinterim report or the findings of the Review Committee. The operators objected to the final report.
The NBR Chairman and operators’ representative agreed that the BTRC would prepare further guidelinesfor verification of SIM users. Although the BTRC submitted its guidelines (under which Bangalink’s exposurewas determined to be 8.5% of the original demand), the Convenor of the Review Committee submitted asupplementary report which disregarded the BTRC’s guidelines and assessed Banglalink’s liability for SIM taxto be BDT 7.62 billion (US$97 as of December 31, 2016). The operators refused to sign the supplementaryreport.
On May 18, 2015, Banglalink received an updated demand from the LTU claiming Banglalink hadincorrectly issued 6,887,633 SIM cards as replacement SIM cards between June 2009 and December 2011 andrequired Banglalink to pay BDT 5.32 billion (US$67 as of December 31, 2016) in SIM tax. The demand alsostated that interest may be payable. Similar demands were sent to the other operators.
On June 25, 2015, Banglalink filed an application to the High Court to stay the updated demand, and a staywas granted. On August 13, 2015, Banglalink filed its appeal against the demand before the Appellate Tribunaland deposited 10% of the amount demanded in order to proceed. The other operators also appealed theirdemands. On April 26, 2016, Banglalink presented its legal arguments and on September 28, 2016, the appeals ofall the operators were heard together. The Appellate Tribunal has yet to make its decision, which decision can beappealed to the High Court. Banglalink and the operators continue to engage in discussions with the governmentin an attempt to resolve the dispute.
Catalyst Litigation
VEON Ltd. (the “Company”) is a defendant in an action brought in 2016 by The Catalyst Capital Group Inc.(“Catalyst”) for CAD$750 million alleging breach of contract in the Superior Court of Justice in Ontario, Canada(the “Court”). In 2014, Catalyst and the Company entered into an exclusivity agreement in connection withnegotiations for the sale of the Company’s WIND Mobile business. Catalyst alleges that the Company and itsfinancial advisor, UBS Securities Canada Inc., breached their exclusivity agreement obligations, which in turnenabled the sale of WIND Mobile to a consortium of other investors, who are also named co-defendants. The
F-85
Company and all co-defendants have filed motions to dismiss the claim, and those motions are scheduled to beheard in August 2017 and therefore remain pending with the Court. In addition, the Company has filed aStatement of Defence denying all allegations and intends to vigorously contest the matter.
KaR-Tel—Turkish Savings Deposit Insurance Fund Litigation
In 2005, the Savings Deposit Insurance Fund (the “SDIF”), a Turkish state agency responsible for collectingstate claims arising from bank insolvencies, issued a payment order against KaR-Tel for Turkish Lira(“TRY”) 7.55 billion (US$2,588). The Payment Order was based on the SDIF’s claim against the Turkish UzanGroup, which the SDIF alleged was a debtor of T. Imar Bankasi, an insolvent Turkish bank. Two entities in theUzan Group (the “Former Shareholders”) held a 60% equity interest in KaR-Tel until November 2003 whenKaR-Tel redeemed the Former Shareholders’ equity interest pursuant to a decision of the Almaty City Court ofJune 6, 2003, which was confirmed by the Kazakhstan Supreme Court on July 23, 2003 (the “KazakhJudgment”).
On October 20, 2009, KaR-Tel filed with the Sisli 3d Court of the First Instance in Istanbul an applicationfor the recognition of the Kazakh Judgment in Turkey. Following a number of hearings and appeals, onJanuary 30, 2013, the Supreme Court upheld earlier court decisions and confirmed the recognition of the KazakhJudgment in Turkey.
On October 20, 2009, KaR-Tel also filed with the 4th Administrative Court of Istanbul (the “4thAdministrative Court”) a petition asking the court to treat the recognition of the Kazakh Judgment as a courtprecedent and to suspend the enforcement proceedings in relation to the Order to Pay. On October 25, 2010, the4th Administrative Court ruled that the Order to Pay was illegal and annulled it. The Court’s decision wasappealed by the SDIF.
On March 22, 2012, the SDIF’s appeal of the decision of the 4th Administrative Court was reviewed by theProsecution Office of the Council of State and sent to the 13th Chamber of the Council of State (the “Chamber”)for review on the merits.
On April 10, 2015, the Chamber upheld the decision of the 4th Administrative Court and ruled in KaR-Tel’sfavor. The SDIF filed a claim for correction of the Chamber’s decision on June 8, 2015.
On April 26, 2016, the Chamber rejected the SDIF’s claim for correction and ruled in favor of KaR-Tel. Nofurther appellate rights are available so the case is now fully concluded.
Contingent tax liabilities
Multinational groups of the size of VEON are exposed to varying degrees of uncertainty related to taxplanning changes in tax law and periodic tax audits. VEON accounts for its income taxes on the basis of its owninternal analyses, supported by external advice. VEON continually monitors its global tax position, and wheneveruncertainties arise, VEON assesses the potential consequences and either accrues the liability or discloses acontingent liability in its financial statements, depending on the strength of the Company’s position and theresulting risk of loss.
Contingencies and uncertainties
In addition to the individual matters mentioned above, the Company is involved in other disputes, litigationand regulatory inquiries and investigations, both pending and threatened, in the ordinary course of its business.The total value of all other individual contingencies above US$5 other than disclosed above amounts to US$29.The Company does not expect any liability arising from these contingencies to have a material effect on theresults of operations, liquidity, capital resources or financial position of the Company. Furthermore, theCompany believes it has provided for all probable liabilities arising in the ordinary course of its business.
F-86
For the ongoing matters described above, where the Company has concluded that the potential loss arisingfrom a negative outcome in the matter cannot be estimated, the Company has not recorded an accrual for thepotential loss. However, in the event a loss is incurred, it may have an adverse effect on the results of operations,liquidity, capital resources, or financial position of the Company.
28 Events after the reporting period
GTH share buyback
GTH bought back 524,569,062 ordinary shares from its shareholders for EGP 4.1 billion (US$258), forwhich the transaction settled on February 21, 2017. VEON did not take part in the share buyback. As a result ofthe share buyback, the Company’s interest in GTH will increase from 51.92% to 57.69% following thecancellation of the shares purchased in the share buyback. The cancellation of the 524,569,062 ordinary shareswas approved at an extraordinary general meeting of GTH’s shareholders on March 19, 2017 and will take effectpending ratification by the Egyptian Financial Supervisory Authority of the minutes of the March 19, 2017extraordinary general meeting. The increase of the Company’s interest in GTH will be accounted for directly inequity in the Q1 2017 interim financial statements.
New GTH Loan facility
GTH entered into an unsecured short-term loan agreement with Citi and ING Bank for a principal amount ofUS$200, on February 5, 2017. The loan agreement has an initial term of six months (the “Initial Term”), whichis capable of being extended until December 15, 2017, and carries interest at a rate of LIBOR plus 4.00% perannum during the Initial Term (rising to LIBOR plus 5.00% per annum for the period from the expiry of theInitial Term to December 15, 2017 in the event the term of the loan agreement is extended), with two of theGTH’s fully owned subsidiaries (International Wireless Communications Pakistan Limited and TelecomVentures Limited) acting as guarantors. Subject to the terms of the loan agreement, the loan amount will be usedfor funding the share buyback of GTH.
New dividend policy approved by supervisory board; final 2016 dividend of US 19.5 cents per ADS
On February 28, 2017, VEON Supervisory Board approved a new dividend policy following the Company’scompletion of the Italy transaction, improvement of its cash flows and stabilization of the macro-economicenvironment in markets where the Company operates. For the financial year ending December 31, 2016, VEONintends to pay a dividend in the aggregate amount of US 23.0 cents per share comprised of US 3.5 cents per sharepaid as an interim dividend in December 2016 and US 19.5 cents per share as a final dividend. It is expected thatthe dividend will be paid on or about April 12, 2017. The Company will make appropriate tax withholdings of upto 15% when the dividend is paid to the Company’s ADS depositary, The Bank of New York Mellon.
New multi-currency term and revolving facilities up to US$2,250
VimpelCom Holdings B.V. entered into a new multi-currency term and revolving facilities agreement (the“TL/RCF”) of up to US$2,250 on February 16, 2017. The TL/RCF replaces the existing US$1,800 revolvingcredit facility signed in 2014. The term facility has a five-year tenor and the revolving credit facility has an initialtenor of three years, with VimpelCom Holdings B.V. having the right to request two one-year extensions to thetenor of the revolving credit facility, subject to lender consent. Several international banks have committed to theTL/RCF in an aggregate amount of US$2,108. The TL/RCF includes an option to increase the amount of thefacility up to the full amount US$2,250, which would consist of a term facility of US$562.5 and a revolvingcredit facility of US$1,687.5. VimpelCom Holdings B.V. will have the option to make each drawdown under thefacilities in either US Dollars or Euros. Under this facilities agreement, the Net Debt to Adjusted EBITDAcovenant ratio will be calculated on the basis of the consolidated financial statements of VEON Ltd. and“pro-forma” adjusted for acquisitions and divestments of any business bought or sold during the relevant period.
F-87
Dividends declared to non-controlling interests
On February 13, 2017, VimpelCom Kyrgyzstan Holding AG, a subsidiary of the Company, declareddividends to its shareholders which were paid on February 16, 2017. The portion of dividends paid to theminority shareholder amounted to US$55.
Volatility of local currencies
As at March 23, 2017 the main developments in currencies are depreciation of GEL, RUB and KZT againstUS$ of 7.8%, 4.4% and 5.3% respectively and depreciation of UZS against US$ of 8.3%.
Redemption of Ruble bonds
On March 2, 2017, PJSC VimpelCom announced the reset of the coupon rate on its 10% Ruble bonds with aprincipal amount of RUB 15,052 million (US$258) maturing on March 8, 2022. The new coupon rate of 7.00%per annum will be applicable for the next six coupon periods (i.e. next three years) and will reset on March 3,2020. Following the reset of the coupon rate, a number of bondholders exercised their put options with respect tothe Ruble bonds in aggregate principal amounts of RUB14,459 million (US$248) which was repaid on March 17,2017. Subsequent to the settlement, the total outstanding amount of 7% Ruble bonds was RUB 597 million(US$10).
Sberbank Drawdown
On March 16, 2017 PJSC VimpelCom drew down RUB 4,000 million under its revolving credit facility withSberbank. The drawdown matures on May 29, 2017.
Alfa-Bank credit facility amendment and extension
On March 29, 2017, VimpelCom Amsterdam B.V., as original borrower, and VimpelCom Holdings B.V., asnew borrower, entered into an amendment agreement with respect to a US$500 million facility agreement withAO “Alfa-Bank,” as the original lender and agent, dated April 2, 2014. Pursuant to the amendment agreement,the tenor of this facility has been extended until October 17, 2017. Further, VimpelCom Holdings B.V. hasreplaced VimpelCom Amsterdam B.V. as the borrower, and the guarantee from VimpelCom Holdings B.V. wasterminated. In addition, VimpelCom Holdings B.V. granted AO “Alfa-Bank” the right to novate some of theprincipal amount of the facility to other lenders. On March 29, 2017, VimpelCom Holdings B.V. receivedconfirmation that US$350 of the extended facility had been novated by AO “Alfa-Bank” to Sberbank.
29 Condensed separate financial information of VEON Ltd.
Certain of the consolidated entities by VEON Ltd are restricted from remitting funds in the form of cashdividends or loans by a variety of regulations, contractual or local statutory requirements. These restrictions arerelated to standard requirements to maintain debt service coverage ratios and currency control regulationsimposed by local governments in some countries where the Company operates.
The Company performed a test on the restricted net assets of consolidated subsidiaries in accordance withSecurities and Exchange Commission Regulation S-X Rule 4- 08 (e) (3) “General Notes to Financial Statements”and Rule 5-04 (c) “What schedules are to be filed” and concluded the restricted net assets exceed 25% of theconsolidated net assets of the Company as at December 31, 2015. Therefore, separate condensed financialstatements of VEON Ltd. are presented.
The Company follows the accounting policies as described in Note 2 to the consolidated financialstatements of VEON Ltd. and its subsidiaries with the exception of its investments in subsidiaries for which theCompany uses the equity method of accounting.
F-88
The separate financial statements should be read in conjunction with the Company’s consolidated financialstatements and the accompanying notes thereto.
At December 31, 2016, VEON Ltd. had restricted net assets of US$1,840 (2015: US$2,731), or 29% (2015:71%) of total net assets.
Condensed statement of financial position:
As at December 31
2016 2015 2014
Non-current assetsProperty and equipment . . . . . . . . . . . . . . . . . . . . . . . . . . . . . . . . . . . . . . . . . . . . . . . . . . 4 6 7Intangible assets . . . . . . . . . . . . . . . . . . . . . . . . . . . . . . . . . . . . . . . . . . . . . . . . . . . . . . . . 39 16 9Investments . . . . . . . . . . . . . . . . . . . . . . . . . . . . . . . . . . . . . . . . . . . . . . . . . . . . . . . . . . . . 6,499 5,270 5,575
Total non-current assets . . . . . . . . . . . . . . . . . . . . . . . . . . . . . . . . . . . . . . . . . . . . . . . . 6,542 5,292 5,591Total current assets . . . . . . . . . . . . . . . . . . . . . . . . . . . . . . . . . . . . . . . . . . . . . . . . . . . . 349 171 116
Total assets . . . . . . . . . . . . . . . . . . . . . . . . . . . . . . . . . . . . . . . . . . . . . . . . . . . . . . . . . . . . 6,891 5,463 5,707
Equity . . . . . . . . . . . . . . . . . . . . . . . . . . . . . . . . . . . . . . . . . . . . . . . . . . . . . . . . . . . . . . . 5,960 3,765 5,006Non-current liabilities . . . . . . . . . . . . . . . . . . . . . . . . . . . . . . . . . . . . . . . . . . . . . . . . . . 655 561 561Current liabilities . . . . . . . . . . . . . . . . . . . . . . . . . . . . . . . . . . . . . . . . . . . . . . . . . . . . . . 276 1,137 140
Total equity and liabilities . . . . . . . . . . . . . . . . . . . . . . . . . . . . . . . . . . . . . . . . . . . . . . . . 6,891 5,463 5,707
Condensed income statements:
for the years ended December 31
2016 2015 2014
Selling, general and administrative expenses . . . . . . . . . . . . . . . . . . . . . . . . . . . . . . . . . . (264) (1,251) (213)Depreciation and amortization . . . . . . . . . . . . . . . . . . . . . . . . . . . . . . . . . . . . . . . . . . . . . (7) (5) (4)
Total operating expenses . . . . . . . . . . . . . . . . . . . . . . . . . . . . . . . . . . . . . . . . . . . . . . . . (271) (1,256) (217)Finance income and (costs) . . . . . . . . . . . . . . . . . . . . . . . . . . . . . . . . . . . . . . . . . . . . . . . (47) 8 5Other non-operating income . . . . . . . . . . . . . . . . . . . . . . . . . . . . . . . . . . . . . . . . . . . . . . 83 18 2Share in result of subsidiaries after tax . . . . . . . . . . . . . . . . . . . . . . . . . . . . . . . . . . . . . . 2,563 575 (437)Total non-operating income and expenses . . . . . . . . . . . . . . . . . . . . . . . . . . . . . . . . . . 2,599 601 (430)
Loss for the year . . . . . . . . . . . . . . . . . . . . . . . . . . . . . . . . . . . . . . . . . . . . . . . . . . . . . . . 2,328 (655) (647)
Condensed statements of comprehensive income:
for the years ended December 31
2016 2015 2014
Total comprehensive loss for the year, net of tax . . . . . . . . . . . . . . . . . . . . . . . . . . . . 2,233 (1,727) (4,633)
F-89
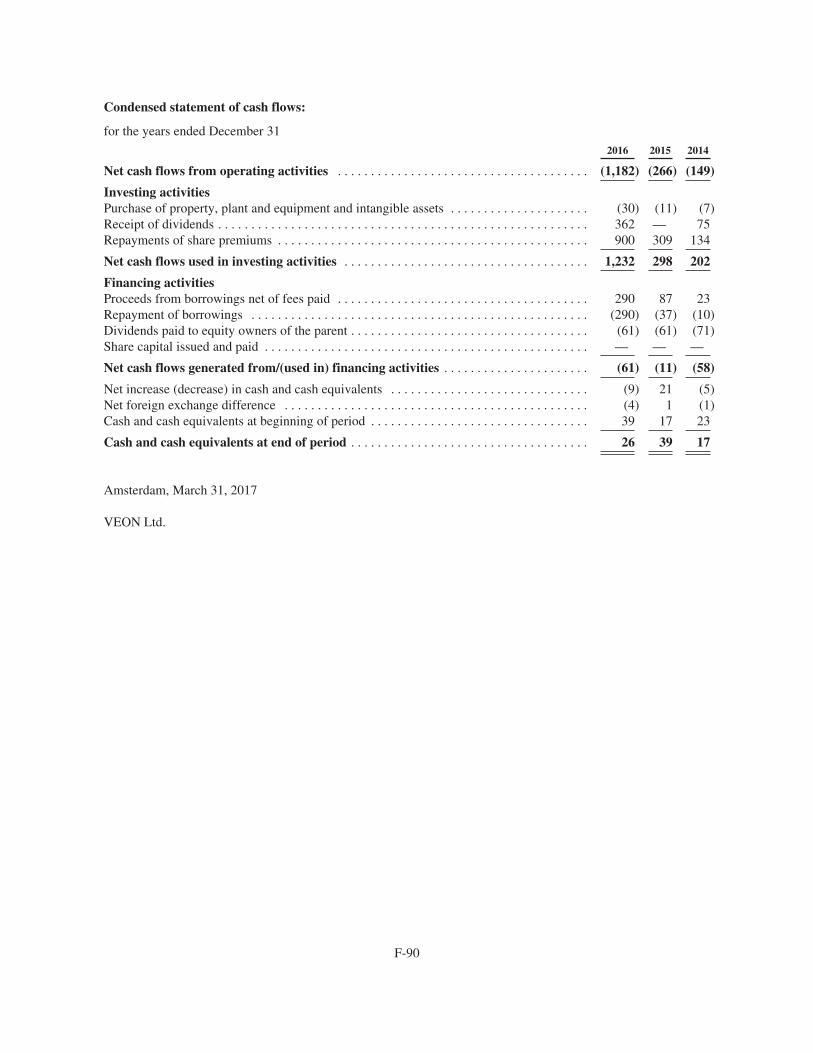
Condensed statement of cash flows:
for the years ended December 31
2016 2015 2014
Net cash flows from operating activities . . . . . . . . . . . . . . . . . . . . . . . . . . . . . . . . . . . . . . (1,182) (266) (149)
Investing activitiesPurchase of property, plant and equipment and intangible assets . . . . . . . . . . . . . . . . . . . . . (30) (11) (7)Receipt of dividends . . . . . . . . . . . . . . . . . . . . . . . . . . . . . . . . . . . . . . . . . . . . . . . . . . . . . . . . 362 — 75Repayments of share premiums . . . . . . . . . . . . . . . . . . . . . . . . . . . . . . . . . . . . . . . . . . . . . . . 900 309 134
Net cash flows used in investing activities . . . . . . . . . . . . . . . . . . . . . . . . . . . . . . . . . . . . . 1,232 298 202
Financing activitiesProceeds from borrowings net of fees paid . . . . . . . . . . . . . . . . . . . . . . . . . . . . . . . . . . . . . . 290 87 23Repayment of borrowings . . . . . . . . . . . . . . . . . . . . . . . . . . . . . . . . . . . . . . . . . . . . . . . . . . . (290) (37) (10)Dividends paid to equity owners of the parent . . . . . . . . . . . . . . . . . . . . . . . . . . . . . . . . . . . . (61) (61) (71)Share capital issued and paid . . . . . . . . . . . . . . . . . . . . . . . . . . . . . . . . . . . . . . . . . . . . . . . . . — — —
Net cash flows generated from/(used in) financing activities . . . . . . . . . . . . . . . . . . . . . . (61) (11) (58)
Net increase (decrease) in cash and cash equivalents . . . . . . . . . . . . . . . . . . . . . . . . . . . . . . (9) 21 (5)Net foreign exchange difference . . . . . . . . . . . . . . . . . . . . . . . . . . . . . . . . . . . . . . . . . . . . . . (4) 1 (1)Cash and cash equivalents at beginning of period . . . . . . . . . . . . . . . . . . . . . . . . . . . . . . . . . 39 17 23
Cash and cash equivalents at end of period . . . . . . . . . . . . . . . . . . . . . . . . . . . . . . . . . . . . 26 39 17
Amsterdam, March 31, 2017
VEON Ltd.
F-90