Embed Size (px)
Citation preview

5
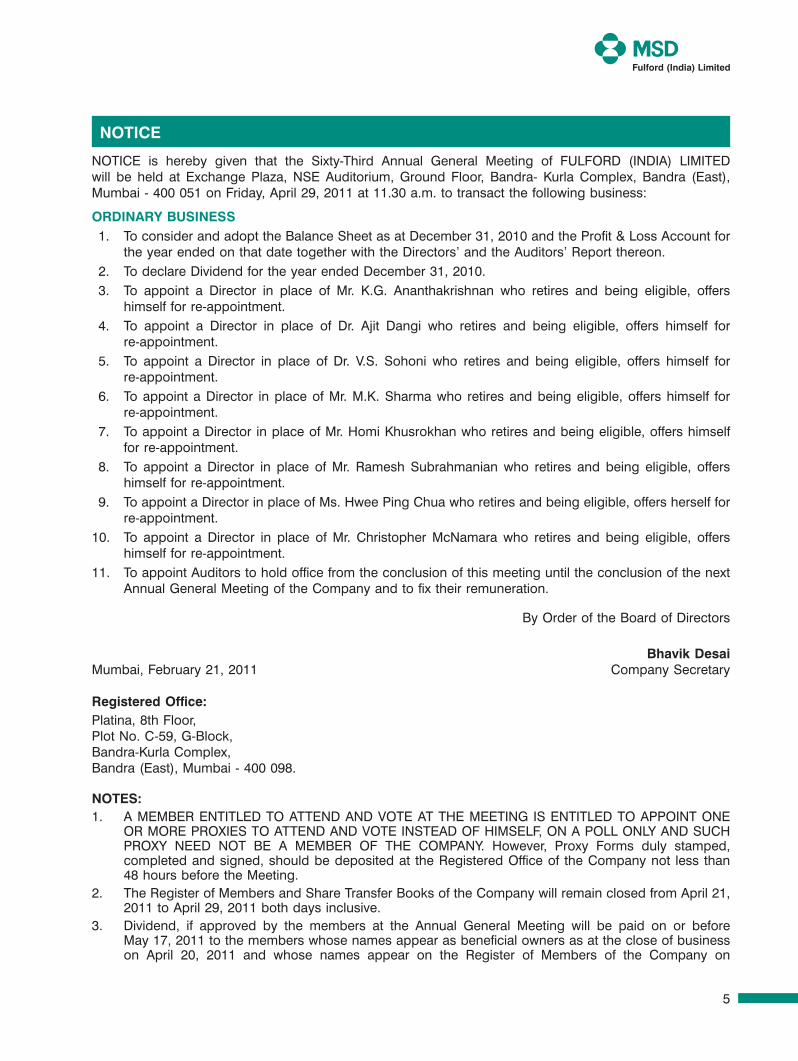
NOTICE is hereby given that the Sixty-Third Annual General Meeting of FULFORD (INDIA) LIMITED will be held at Exchange Plaza, NSE Auditorium, Ground Floor, Bandra- Kurla Complex, Bandra (East), Mumbai - 400 051 on Friday, April 29, 2011 at 11.30 a.m. to transact the following business:
ORDINARY BUSINESS 1. To consider and adopt the Balance Sheet as at December 31, 2010 and the Profit & Loss Account for
the year ended on that date together with the Directors’ and the Auditors’ Report thereon. 2. To declare Dividend for the year ended December 31, 2010. 3. To appoint a Director in place of Mr. K.G. Ananthakrishnan who retires and being eligible, offers
himself for re-appointment. 4. To appoint a Director in place of Dr. Ajit Dangi who retires and being eligible, offers himself for
re-appointment. 5. To appoint a Director in place of Dr. V.S. Sohoni who retires and being eligible, offers himself for
re-appointment. 6. To appoint a Director in place of Mr. M.K. Sharma who retires and being eligible, offers himself for
re-appointment. 7. To appoint a Director in place of Mr. Homi Khusrokhan who retires and being eligible, offers himself
for re-appointment. 8. To appoint a Director in place of Mr. Ramesh Subrahmanian who retires and being eligible, offers
himself for re-appointment. 9. To appoint a Director in place of Ms. Hwee Ping Chua who retires and being eligible, offers herself for
re-appointment.10. To appoint a Director in place of Mr. Christopher McNamara who retires and being eligible, offers
himself for re-appointment.11. To appoint Auditors to hold office from the conclusion of this meeting until the conclusion of the next
Annual General Meeting of the Company and to fix their remuneration.
By Order of the Board of Directors
Bhavik DesaiMumbai, February 21, 2011 Company Secretary
Registered Office:Platina, 8th Floor,Plot No. C-59, G-Block,Bandra-Kurla Complex,Bandra (East), Mumbai - 400 098.
NOTES:1. A MEMBER ENTITLED TO ATTEND AND VOTE AT THE MEETING IS ENTITLED TO APPOINT ONE
OR MORE PROXIES TO ATTEND AND VOTE INSTEAD OF HIMSELF, ON A POLL ONLY AND SUCH PROXY NEED NOT BE A MEMBER OF THE COMPANY. However, Proxy Forms duly stamped, completed and signed, should be deposited at the Registered Office of the Company not less than 48 hours before the Meeting.
2. The Register of Members and Share Transfer Books of the Company will remain closed from April 21, 2011 to April 29, 2011 both days inclusive.
3. Dividend, if approved by the members at the Annual General Meeting will be paid on or before May 17, 2011 to the members whose names appear as beneficial owners as at the close of business on April 20, 2011 and whose names appear on the Register of Members of the Company on
NOTIcE
Secretary.indd 5 3/29/2011 4:42:51 PM
6
Annual Report 2010
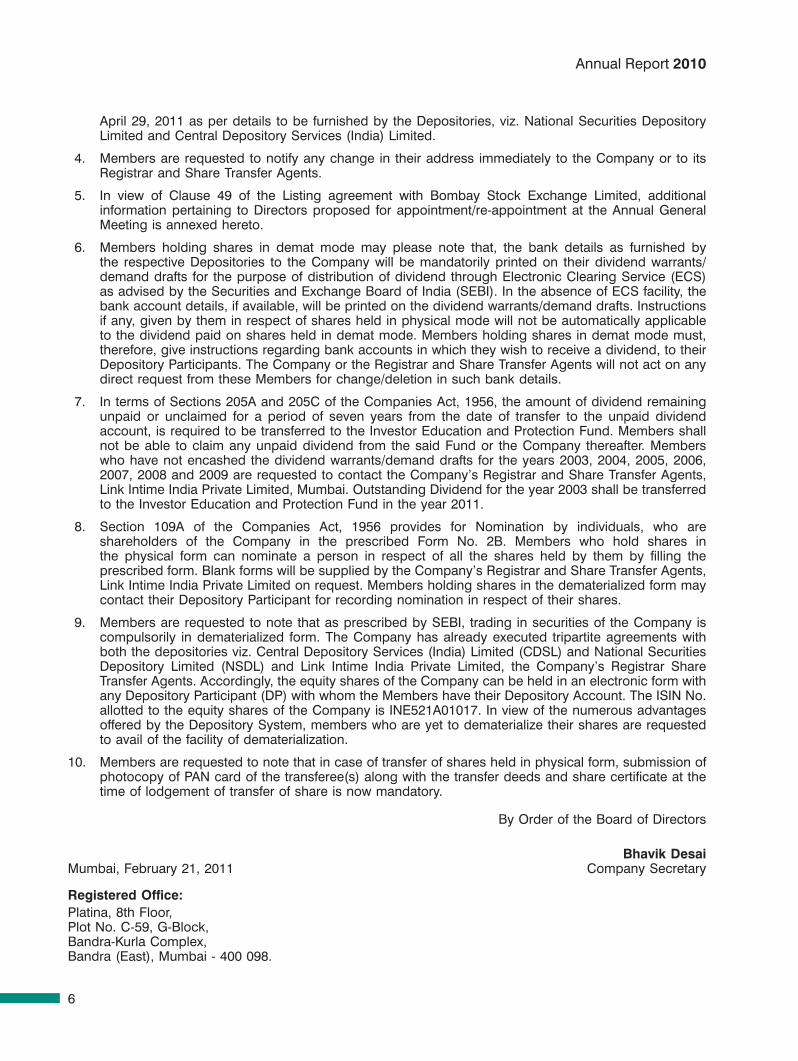
April 29, 2011 as per details to be furnished by the Depositories, viz. National Securities Depository Limited and Central Depository Services (India) Limited.
4. Members are requested to notify any change in their address immediately to the Company or to its Registrar and Share Transfer Agents.
5. In view of Clause 49 of the Listing agreement with Bombay Stock Exchange Limited, additional information pertaining to Directors proposed for appointment/re-appointment at the Annual General Meeting is annexed hereto.
6. Members holding shares in demat mode may please note that, the bank details as furnished by the respective Depositories to the Company will be mandatorily printed on their dividend warrants/demand drafts for the purpose of distribution of dividend through Electronic Clearing Service (ECS) as advised by the Securities and Exchange Board of India (SEBI). In the absence of ECS facility, the bank account details, if available, will be printed on the dividend warrants/demand drafts. Instructions if any, given by them in respect of shares held in physical mode will not be automatically applicable to the dividend paid on shares held in demat mode. Members holding shares in demat mode must, therefore, give instructions regarding bank accounts in which they wish to receive a dividend, to their Depository Participants. The Company or the Registrar and Share Transfer Agents will not act on any direct request from these Members for change/deletion in such bank details.
7. In terms of Sections 205A and 205C of the Companies Act, 1956, the amount of dividend remaining unpaid or unclaimed for a period of seven years from the date of transfer to the unpaid dividend account, is required to be transferred to the Investor Education and Protection Fund. Members shall not be able to claim any unpaid dividend from the said Fund or the Company thereafter. Members who have not encashed the dividend warrants/demand drafts for the years 2003, 2004, 2005, 2006, 2007, 2008 and 2009 are requested to contact the Company’s Registrar and Share Transfer Agents, Link Intime India Private Limited, Mumbai. Outstanding Dividend for the year 2003 shall be transferred to the Investor Education and Protection Fund in the year 2011.
8. Section 109A of the Companies Act, 1956 provides for Nomination by individuals, who are shareholders of the Company in the prescribed Form No. 2B. Members who hold shares in the physical form can nominate a person in respect of all the shares held by them by filling the prescribed form. Blank forms will be supplied by the Company’s Registrar and Share Transfer Agents, Link Intime India Private Limited on request. Members holding shares in the dematerialized form may contact their Depository Participant for recording nomination in respect of their shares.
9. Members are requested to note that as prescribed by SEBI, trading in securities of the Company is compulsorily in dematerialized form. The Company has already executed tripartite agreements with both the depositories viz. Central Depository Services (India) Limited (CDSL) and National Securities Depository Limited (NSDL) and Link Intime India Private Limited, the Company’s Registrar Share Transfer Agents. Accordingly, the equity shares of the Company can be held in an electronic form with any Depository Participant (DP) with whom the Members have their Depository Account. The ISIN No. allotted to the equity shares of the Company is INE521A01017. In view of the numerous advantages offered by the Depository System, members who are yet to dematerialize their shares are requested to avail of the facility of dematerialization.
10. Members are requested to note that in case of transfer of shares held in physical form, submission of photocopy of PAN card of the transferee(s) along with the transfer deeds and share certificate at the time of lodgement of transfer of share is now mandatory.
By Order of the Board of Directors
Bhavik DesaiMumbai, February 21, 2011 Company Secretary
Registered Office:Platina, 8th Floor,Plot No. C-59, G-Block,Bandra-Kurla Complex,Bandra (East), Mumbai - 400 098.
Secretary.indd 6 3/29/2011 4:42:51 PM
7
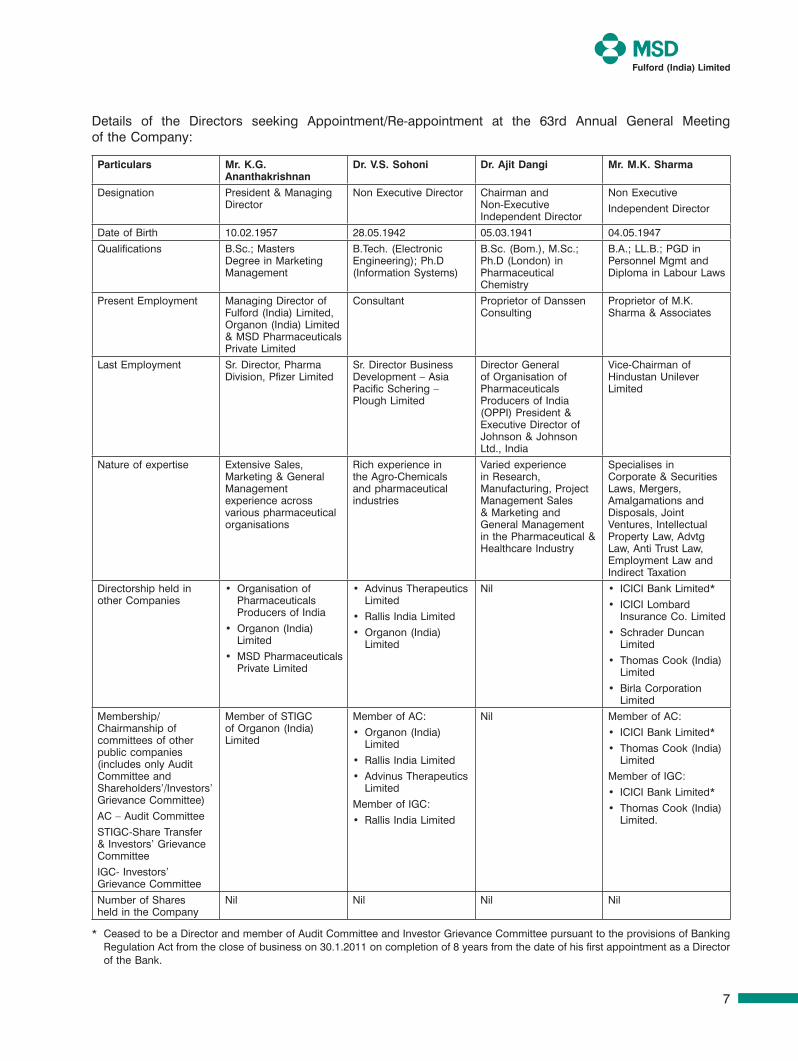
Particulars Mr. K.G. Ananthakrishnan
Dr. V.S. Sohoni Dr. Ajit Dangi Mr. M.K. Sharma
Designation President & Managing Director
Non Executive Director Chairman and Non-Executive Independent Director
Non Executive
Independent Director
Date of Birth 10.02.1957 28.05.1942 05.03.1941 04.05.1947
Qualifications B.Sc.; Masters Degree in Marketing Management
B.Tech. (Electronic Engineering); Ph.D (Information Systems)
B.Sc. (Bom.), M.Sc.; Ph.D (London) in Pharmaceutical Chemistry
B.A.; LL.B.; PGD in Personnel Mgmt and Diploma in Labour Laws
Present Employment Managing Director of Fulford (India) Limited, Organon (India) Limited & MSD Pharmaceuticals Private Limited
Consultant Proprietor of Danssen Consulting
Proprietor of M.K. Sharma & Associates
Last Employment Sr. Director, Pharma Division, Pfizer Limited
Sr. Director Business Development – Asia Pacific Schering – Plough Limited
Director General of Organisation of Pharmaceuticals Producers of India (OPPI) President & Executive Director of Johnson & Johnson Ltd., India
Vice-Chairman of Hindustan Unilever Limited
Nature of expertise Extensive Sales, Marketing & General Management experience across various pharmaceutical organisations
Rich experience in the Agro-Chemicals and pharmaceutical industries
Varied experience in Research, Manufacturing, Project Management Sales & Marketing and General Management in the Pharmaceutical & Healthcare Industry
Specialises in Corporate & Securities Laws, Mergers, Amalgamations and Disposals, Joint Ventures, Intellectual Property Law, Advtg Law, Anti Trust Law, Employment Law and Indirect Taxation
Directorship held in other Companies
• OrganisationofPharmaceuticals Producers of India
• Organon(India)Limited
• MSDPharmaceuticalsPrivate Limited
• AdvinusTherapeuticsLimited
• RallisIndiaLimited
• Organon(India)Limited
Nil • ICICIBankLimited*
• ICICILombardInsurance Co. Limited
• SchraderDuncanLimited
• ThomasCook(India)Limited
• BirlaCorporationLimited
Membership/Chairmanship of committees of other public companies (includes only Audit Committee and Shareholders’/Investors’ Grievance Committee)
AC – Audit Committee
STIGC-Share Transfer & Investors’ Grievance Committee
IGC- Investors’ Grievance Committee
Member of STIGC of Organon (India) Limited
Member of AC:
• Organon(India)Limited
• RallisIndiaLimited
• AdvinusTherapeuticsLimited
Member of IGC:
• RallisIndiaLimited
Nil Member of AC:
• ICICIBankLimited*
• ThomasCook(India)Limited
Member of IGC:
• ICICIBankLimited*
• ThomasCook(India)Limited.
Number of Shares held in the Company
Nil Nil Nil Nil
* CeasedtobeaDirectorandmemberofAuditCommitteeandInvestorGrievanceCommitteepursuanttotheprovisionsofBankingRegulation Act from the close of business on 30.1.2011 on completion of 8 years from the date of his first appointment as a Director of the Bank.
Details of the Directors seeking Appointment/Re-appointment at the 63rd Annual General Meeting of the Company:
Secretary.indd 7 3/29/2011 4:42:51 PM
8
Annual Report 2010
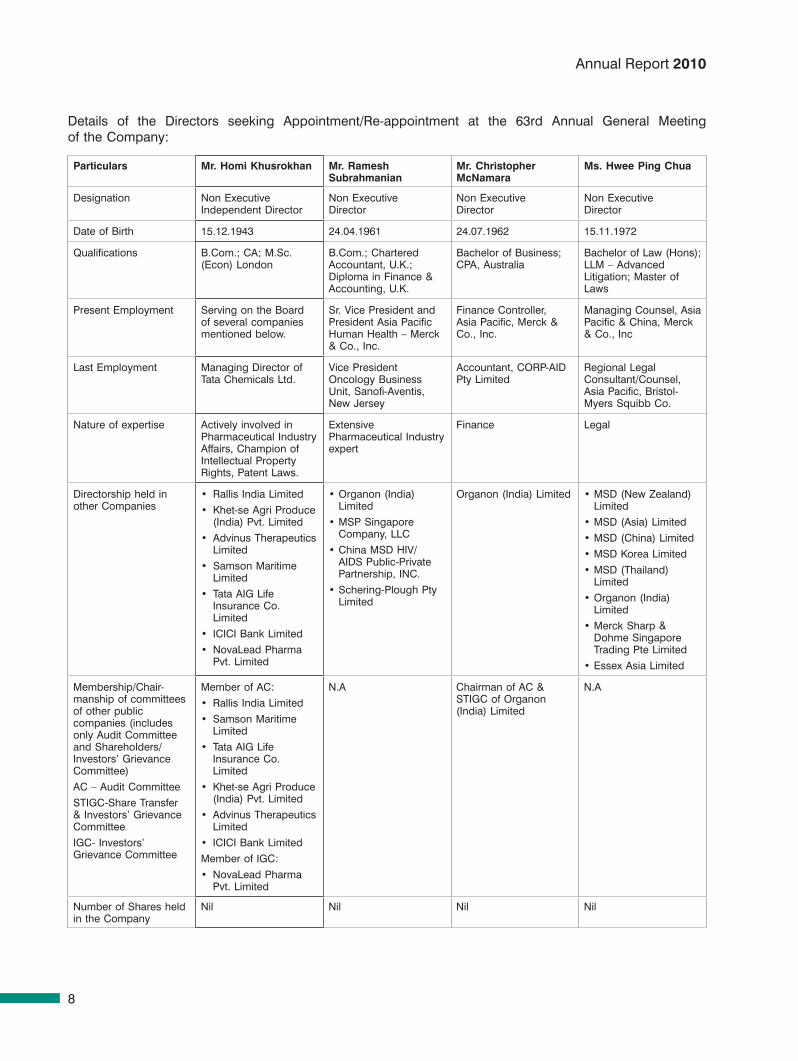
Particulars Mr. Homi Khusrokhan Mr. Ramesh Subrahmanian
Mr. christopher McNamara
Ms. Hwee Ping chua
Designation Non Executive Independent Director
Non Executive Director
Non Executive Director
Non Executive Director
Date of Birth 15.12.1943 24.04.1961 24.07.1962 15.11.1972
Qualifications B.Com.; CA; M.Sc.(Econ) London
B.Com.; Chartered Accountant, U.K.; Diploma in Finance & Accounting, U.K.
Bachelor of Business; CPA, Australia
Bachelor of Law (Hons); LLM – Advanced Litigation; Master of Laws
Present Employment Serving on the Board of several companies mentioned below.
Sr. Vice President and President Asia Pacific Human Health – Merck & Co., Inc.
Finance Controller, Asia Pacific, Merck & Co., Inc.
Managing Counsel, Asia Pacific & China, Merck & Co., Inc
Last Employment Managing Director of Tata Chemicals Ltd.
Vice President Oncology Business Unit, Sanofi-Aventis, New Jersey
Accountant, CORP-AID Pty Limited
Regional Legal Consultant/Counsel, Asia Pacific, Bristol-Myers Squibb Co.
Nature of expertise Actively involved in Pharmaceutical Industry Affairs, Champion of Intellectual Property Rights, Patent Laws.
Extensive Pharmaceutical Industry expert
Finance Legal
Directorship held in other Companies
• RallisIndiaLimited
• Khet-seAgriProduce(India) Pvt. Limited
• AdvinusTherapeuticsLimited
• SamsonMaritimeLimited
• TataAIGLifeInsurance Co. Limited
• ICICIBankLimited
• NovaLeadPharmaPvt. Limited
•Organon(India)Limited
•MSPSingaporeCompany, LLC
•ChinaMSDHIV/AIDS Public-Private Partnership, INC.
•Schering-PloughPtyLimited
Organon (India) Limited •MSD(NewZealand)Limited
•MSD(Asia)Limited
•MSD(China)Limited
•MSDKoreaLimited
•MSD(Thailand)Limited
•Organon(India)Limited
•MerckSharp&Dohme Singapore Trading Pte Limited
•EssexAsiaLimited
Membership/Chair- manship of committees of other public companies (includes only Audit Committee and Shareholders/Investors’ Grievance Committee)
AC – Audit Committee
STIGC-Share Transfer & Investors’ Grievance Committee
IGC- Investors’ Grievance Committee
Member of AC:
• RallisIndiaLimited
• SamsonMaritimeLimited
• TataAIGLifeInsurance Co. Limited
• Khet-seAgriProduce(India) Pvt. Limited
• AdvinusTherapeuticsLimited
• ICICIBankLimited
Member of IGC:
• NovaLeadPharmaPvt. Limited
N.A Chairman of AC & STIGC of Organon (India) Limited
N.A
Number of Shares held in the Company
Nil Nil Nil Nil
Details of the Directors seeking Appointment/Re-appointment at the 63rd Annual General Meeting of the Company:
Secretary.indd 8 3/29/2011 4:42:51 PM
9
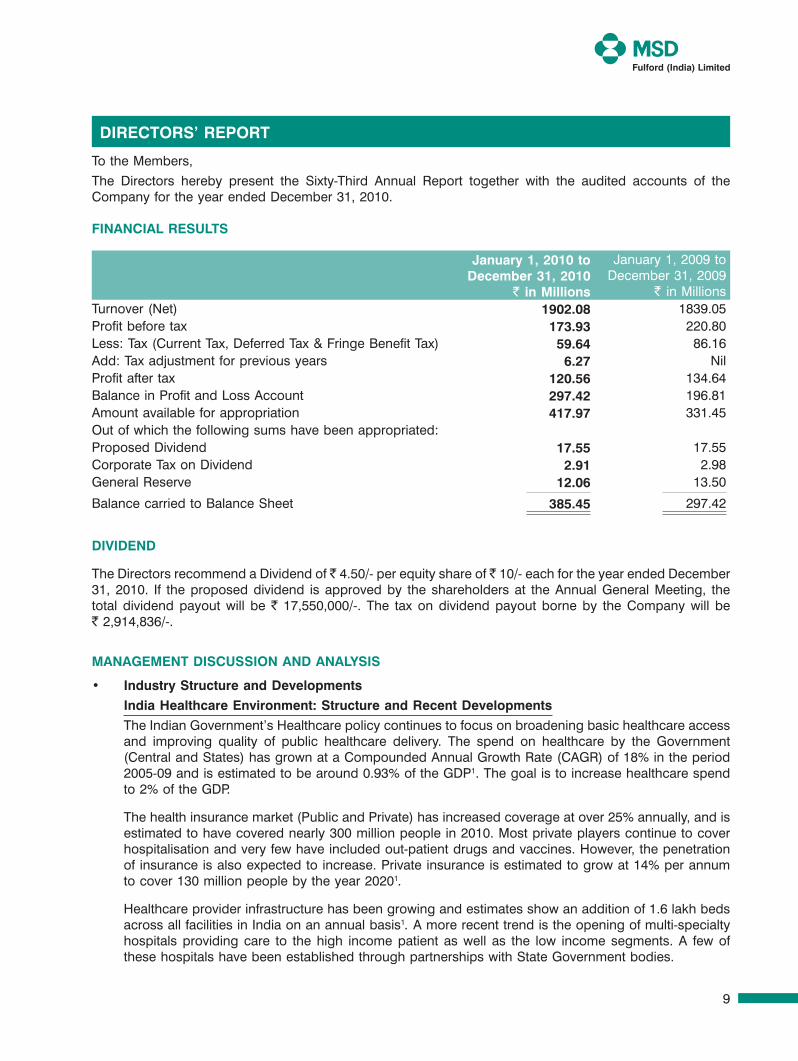
To the Members,
The Directors hereby present the Sixty-Third Annual Report together with the audited accounts of the Company for the year ended December 31, 2010.
FINANcIAL RESULTS
January 1, 2010 to December 31, 2010
` in Millions
January 1, 2009 to December 31, 2009
` in MillionsTurnover (Net) 1902.08 1839.05Profit before tax 173.93 220.80Less: Tax (Current Tax, Deferred Tax & Fringe Benefit Tax) 59.64 86.16Add: Tax adjustment for previous years 6.27 NilProfit after tax 120.56 134.64Balance in Profit and Loss Account 297.42 196.81Amount available for appropriation 417.97 331.45Out of which the following sums have been appropriated:Proposed Dividend 17.55 17.55Corporate Tax on Dividend 2.91 2.98General Reserve 12.06 13.50
Balance carried to Balance Sheet 385.45 297.42
DIVIDEND
The Directors recommend a Dividend of ` 4.50/- per equity share of ` 10/- each for the year ended December 31, 2010. If the proposed dividend is approved by the shareholders at the Annual General Meeting, the total dividend payout will be ` 17,550,000/-. The tax on dividend payout borne by the Company will be ` 2,914,836/-.
MANAGEMENT DIScUSSION AND ANALYSIS
• IndustryStructureandDevelopments India Healthcare Environment: Structure and Recent Developments The Indian Government’s Healthcare policy continues to focus on broadening basic healthcare access
and improving quality of public healthcare delivery. The spend on healthcare by the Government (Central and States) has grown at a Compounded Annual Growth Rate (CAGR) of 18% in the period 2005-09 and is estimated to be around 0.93% of the GDP1. The goal is to increase healthcare spend to 2% of the GDP.
The health insurance market (Public and Private) has increased coverage at over 25% annually, and is estimated to have covered nearly 300 million people in 2010. Most private players continue to cover hospitalisation and very few have included out-patient drugs and vaccines. However, the penetration of insurance is also expected to increase. Private insurance is estimated to grow at 14% per annum to cover 130 million people by the year 20201.
Healthcare provider infrastructure has been growing and estimates show an addition of 1.6 lakh beds across all facilities in India on an annual basis1. A more recent trend is the opening of multi-specialty hospitals providing care to the high income patient as well as the low income segments. A few of these hospitals have been established through partnerships with State Government bodies.
DIREcTORS’ REPORT
Secretary.indd 9 3/29/2011 4:42:52 PM
10
Annual Report 2010
Key Healthcare initiatives: Existing initiatives such as the National Rural Health Mission (NRHM), Reproductive and Child
Health (RCH) programme continued through the year and emerged as a strategic base for improving state-level health systems.
New notable initiatives announced by the Government which have been designed to broaden access to basic healthcare include Health Insurance Scheme for Below Poverty Line families (Rashtriya Swasthya Bima Yojana)2.
Key Healthcare concerns: Key concerns on public health include the lack of skilled healthcare providers as well as issues of
availability and lack of access to secondary and tertiary care facilities in the rural areas of India.
Another important area of concern in healthcare for the Government is the increasing prevalence of chronic diseases in India.
With the population growing at over 1.3% every year, the patient pool is expected to increase by nearly 20% by the year 2020. There is expected to be gradual growth in both chronic and acute ailments. However, chronic diseases such as Coronary Heart Disease and Diabetes are expected to witness over 40% and 30% increase, respectively in the number of patients from the year 2010 to the year 2020. Estimates indicate around 47 million Coronary Heart Disease patients and around 41 million Diabetes patients in 20101.
Indian Pharmaceutical Market: Key Trends The Indian Pharmaceutical Market witnessed a turnover of INR 51,604 crores in MAT December 2010,
which is a growth of 18% over the previous year.
The chronic therapy segment formed INR 13,725 crores MAT December 2010 and grew by 20% over the previous year.
The acute therapy segment formed INR 37,879 crores MAT December 2010 and grew by 17% over the previous year3.
The Indian Pharmaceutical Market is expected to grow with a CAGR of 14-15% by the year 2020.
The key drivers that are expected to drive this growth include: increase in income levels; rising prevalence of chronic diseases; growth in medical infrastructure; increase in health insurance coverage; aggressive market creation by players leveraging treatment discontinuities and increased Government focus.
New models of alliances and partnerships are emerging between pharmaceutical firms, healthcare organisations, Government Organisations and Non-Government Organisations (NGOs).
Multinational pharmaceutical companies are entering into partnerships with the Indian companies for co-marketing of their products. Several pharmaceutical firms are partnering with hospitals and/or NGOs to increase the outreach to patients and ensure better outcomes.
In an effort to ensure an ethical conduct in interactions between the pharmaceutical firms and medical professionals, the Medical Council of India (MCI) has defined guidelines for the promotion of pharmaceutical products to doctors. They have also defined clear guidelines for professional associations between pharmaceutical companies and allied health sector industry. A recent amendment to these guidelines also covers clinical trials sponsored by the Industry.
In 2010, the Government has continued to monitor and control formulation and bulk prices through the National Pharmaceutical Pricing Authority (NPPA).
Secretary.indd 10 3/29/2011 4:42:52 PM
11
• Opportunities,Threats,RisksandConcerns Opportunities With an estimated CAGR of 14% for the first half of the decade (2010-15), the Indian Pharmaceutical
Industry is poised for significant growth4. The main drivers are expected to be: increase in disposable income for the middle class; increase in prevalence of chronic disease; increase in healthcare related insurance penetration and increase in healthcare spend by the Government in tier-3 towns and beyond. The rural market is largely covered by public health initiatives of the Government and provides several opportunities for the private sector.
Focus on non-traditional models of growth in pharmaceutical such as integrated Disease Management Programmes, consumer healthcare, launch of patented products at India-specific pricing will enable global pharmaceutical companies to capture the opportunities in the Indian Pharmaceutical Market.
Threats, Risks and concerns: Counterfeiting poses a major problem for the Industry. In order to combat counterfeit, a multi-pronged
strategy has to be adopted with a sustained and concentrated action backed jointly by the Government, Pharmaceutical Industry and Consumer Action Groups.
Pharmaceutical companies are adopting various measures to combat counterfeiting. These include: training its customers, drug procurement agencies; use of anti-counterfeit measures like holographic products in a variety of forms such as full coverage labels, holographic foils on blisters, in-shrink sleeves and on primary cartons; usage of innovative packaging with attractive and unique color combinations and scrambled images printing.
As a part of its TRIPS obligations, India adopted the Product Patent Regime in 2005. However, there are some areas of concern to the innovation based Pharmaceutical Industry such as patents for incremental innovations, pre and post grant opposition mechanism, regulation on data protection, that still need to be addressed and pose a potential risk.
The National Pharmaceutical Pricing Authority (NPPA) has continued to monitor and revise prices in 2010. Changes to formulation and bulk drugs pricing could have an impact on the revenue expectations for both local and multinational companies.
The Government has commissioned a study to examine the effects of the current Foreign Direct Investment (FDI) policy that allows overseas companies to fully own Indian entities through the automatic approval route. This creates uncertain conditions that may impact investment sentiments amongst the Pharmaceutical Industry.
Your Company has a global standard of risk management programme in place that meets its specific needs of identification, assessment and monitoring of risks at different levels and ensures to mitigate the same in an appropriate manner so as to add value to its operations.
• Segment-wiseperformance The Company operates in the following major therapeutic areas: Dermatology, Hepatitis, Immunology,
Rheumatology and Anti-Histamine & Anti-Infectives. The Company’s product portfolio is balanced and provides therapies for both acute and chronic health conditions. The Company has recorded a modest growth rate vis-à-vis the Industry during the year of transition. Your Company continues to maintain leadership position in key market segments. The performance of few key brands was impacted due to supply constraints of Active Pharmaceutical Ingredient (API) and finished formulations from our globally approved sources.
In Dermatology, key brands such as Elocon grew by 7.3%, outperforming the Corticosteroid Plain market segment. Quadriderm and Dipsalic continue to maintain market leadership in their respective market segments, however, both the brands grew at a lower rate as compared to the market. Measures are being adopted to revitalise these brands and also arrest counterfeiting issues for Quadriderm. In the Specialty segments (Hepatitis, Rheumatology and Oncology), the Company's key brands such
Secretary.indd 11 3/29/2011 4:42:52 PM
12
Annual Report 2010
as Viraferonpeg, Remicade and Temodal continue to maintain market leadership in their respective segments. Post operational integration and restructuring of the sales organisation, all key brands are on high focus and are expected to maintain leadership position.
• Internalcontrolsystemanditsadequacy
Compliance with integrity is a core value of the Company. The Company has been following a comprehensive internal control system that includes both well-defined policies and appropriate monitoring procedures. The Company’s funds/monies are effectively regulated by Approval Authorisation Policy. An external agency conducts the Internal Audit Programme for the Company, covering all key areas on periodic basis in order to assess and ensure conformity to Applicable Laws, Accounting Standards, Company Policies and protection of the Company’s assets and interests. The Audit Committee appointed by the Board of Directors of the Company, reviews the findings and recommendations of internal auditors as well as auditors appointed by the Members. It also reviews the action plan to identify and address the areas of improvement, thereby focusing on strengthening the system continuously.
• Material development in Human Resources/Industrial Relations
Your Company has high growth aspirations and these can be achieved only if we work continuously to recruit the best and the brightest in the Industry, engage with our employees and work towards important employee development goals. Our people are the driving force behind developing and implementing on Company strategy. We are committed to talent development for employees and this is an area that we remain focused on. There are important activities that are underway for the same, which include: a robust and detailed Employee Development Programme to help, identify and address training and development needs for employees; opportunities to participate in key projects for learning & growth via cross functional exposure and nomination for regional and global programmes, amongs others. Keeping in mind the organisational goals, the compensation and benefits too have been made market competitive in order to attract and retain talent.
The web enabled Performance Management Programme (myPMP) ensures that we follow a globally consistent process for recognising and rewarding performance.
The Company has a strategic commitment to develop talent and executes multiple learning and development related initiatives. These initiatives include a structured induction programme for all new joinees based on the global curriculum, management development programmes, situational coaching programmes and Selling Skills programmes. There is a state of the art e–learning platform which covers a wide area of topics and ensures continued education and input to our colleagues. In addition to this, there were several Change Management related programmes conducted to ensure enhanced change readiness of employees at all levels.
The Company has open communication meetings at regular intervals in order to keep all colleagues informed about key developments and to enhance their participation in decision making and effective implementation.
The total number of employees as on December 31, 2010 was 494.
• OperationalPerformance The Company recorded sales of INR 1,902 millions in the year 2010, and grew by 3% over 2009.
Growth has been impacted due to: non-availability of few key products because of technical issues, restructuring of the distribution system and sales force restructuring because of operational integration.
Key focused products performed extremely well and delivered growth higher than market. Nasonex and Noxafil pre-launch activities were initiated in 2010.
Profit after Tax for the year at INR 121 million is lower by 12% compared to the previous year due to strategic investment for pre-launch activities for Nasonex and Noxafil, expansion of Field Force, differentiated formulation development activities for key products and annualised impact of rental cost
Secretary.indd 12 3/29/2011 4:42:52 PM
13
of the new premises. The above mentioned factors resulted in subdued profitability but are important for the long term growth of the organisation.
In the First Quarter of 2011, your Company has introduced the following two products in the different therapeutic areas:
Nasonex (mometasone furoate monohydrate) Nasal Spray in the therapeutic area of Allegric Rhinitis. Nasonex Nasal Spray Suspension is a metered-dose, manual pump spray unit containing a suspension of mometasone furoate.
Noxafil (posaconazole oral suspension) in the speciality segment of Hematology, Oncology and Intensive Care Unit (ICU) for the prophylaxis and treatment of serious fungal infections in patients with leukemia and patients who have undergone Bone Marrow Transplant.
The Company has further strengthened its customer focus by setting up dedicated Dermatology and Respiratory sales teams to intensify focus on the Company's two core therapeutic areas. A separate Primary Care team has also been set up in the year 2010 in order to drive growth of large mature brands like Quadriderm.
High quality scientific engagement continues to be the pivotal strategy for the Company. Several scientific exchange programmes and symposiums have been conducted in areas of Allergy, Hepatitis, Rheumatology and Oncology across the country.
A positive response to HEPBEAT Phase I – Disease Management Programme for Hepatitis (C/B) has encouraged the Company to launch an integrated Disease Management Programme for Rheumatology to support patients.
With a strategic intent to focus on growing institutional business, a dedicated institutional team was launched in 2009 and further strengthened in 2010. This team has made appreciable progress to collaborate with key hospitals across India to provide access to high quality and innovative products from the Company.
The Company has migrated to a new Sales Force Automation system in the year 2010 in order to drive robust Key Performance Indicators management (KPI management) and ensure higher sales force productivity.
During the year 2010, a comprehensive Compliance Training programme was rolled out in order to provide all employees with the right understanding and the tools to conduct business with the highest standards of ethics and integrity. All new employees are provided extensive compliance training during the induction programme.
• Outlook
Year 2011 is expected to be the year of accelerated growth through launch of new growth initiatives. With a positive Industry outlook and strong growth expected in the Indian Pharmaceutical Market, the Company shall prioritise investments in select initiatives in order to drive growth. Investment in talent development shall remain a key priority for the management.
DIREcTORSPursuant to Article 110 of the Articles of Association of the Company, Mr. K.G. Ananthakrishnan, Dr. V.S. Sohoni, Mr. M.K. Sharma, Dr. Ajit Dangi, Mr. Homi Khusrokhan, Mr. Ramesh Subrahmanian, Ms. Hwee Ping Chua and Mr. Christopher McNamara retire and being eligible, offer themselves for re-appointment at the ensuing Annual General Meeting of the Company.
A brief resume of the Directors proposed to be appointed/re-appointed as required under Clause 49 of the Listing Agreement are provided in the Notice of the Annual General Meeting forming part of this Annual Report.
FIXED DEPOSITSThe Company has not accepted any deposits during the year under review. Also, there are no fixed deposits outstanding as on December 31, 2010.
Secretary.indd 13 3/29/2011 4:42:52 PM
14
Annual Report 2010
RELATED PARTY TRANSAcTIONSRelated party transactions have been disclosed in the notes to the accounts.
INFORMATION PURSUANT TO SEcTION 217 OF THE cOMPANIES AcT, 1956 (“the Act”)Information required to be annexed to this report in accordance with clause (e) of sub–section (1) of Section 217 of the Act read with the Companies (Disclosure of Particulars in the Report of Board of Directors) Rules, 1988 is given as Annexure I.
Information in accordance with sub–section (2A) of Section 217 of the Act read with the Companies (Particulars of Employees) Rules, 1975 forms a part of the Directors’ Report for the year ended December 31, 2010. However, as per the provisions of Section 219 (1)(b)(iv) of the Companies Act, 1956, the Directors’ Report and Accounts are being sent to all the shareholders of the Company, excluding the statement of particulars of employees under Section 217 (2A) of the Act. Any shareholder interested in obtaining a copy of the Statement may write to the Company Secretary at the Registered Office of the Company.
In accordance with sub–section (2AA) of Section 217 of the Companies (Amendment) Act, 2000 concerning “Directors’ Responsibility Statement” and to the best of their knowledge and belief and according to the information and explanation obtained by them, your Directors confirm that:
(i) in the preparation of Annual accounts, the applicable accounting standards have been followed along with proper explanation relating to material departures;
(ii) they have selected such accounting policies and applied them consistently and made judgements and estimates that are reasonable and prudent so as to give a true and fair view of the state of affairs of the Company at the end of the financial year and of the profit of the Company for that period;
(iii) they have exercised proper and sufficient care for the maintenance of adequate accounting records in accordance with the provisions of the Act for safeguarding the assets of the Company and for preventing and detecting fraud and other irregularities; and
(iv) the annual accounts are prepared on a going concern basis.
AUDITORSM/s. Price Waterhouse, Chartered Accountants, retire as Auditors of the Company at the conclusion of the ensuing Annual General Meeting, and being eligible, offer themselves for re-appointment. The Company has received a Certificate from the auditors to the effect that their appointment, if made, would be in accordance with the limits specified under Section 224(1B) of the Companies Act, 1956. The Board recommends their re-appointment.
cOST AUDITThe Directors have, subject to the approval of the Central Government, appointed M/s. S.S. Mani & Co. as Cost Auditors to conduct the Cost Audit for the financial year ended December 31, 2011.
cORPORATE GOVERNANcEA report on the Corporate Governance Code along with a certificate from the auditors of the Company regarding compliance of the conditions of Corporate Governance as stipulated under Clause 49 of the Listing Agreement is annexed to this Report.
cOMPLIANcE WITH THE cODE OF cONDUcTThe Company has put in place a Code of Conduct effective February 9, 2005, for its Board members and senior management personnel. Declarations of compliance with the Code of Conduct have been received from all Board Members and senior management personnel. A certificate to this effect from Mr. K.G. Ananthakrishnan, President & Managing Director forms a part of this Report.
Secretary.indd 14 3/29/2011 4:42:52 PM
15
SUBSIDIARY cOMPANYPursuant to Section 212 of the Companies Act, 1956, the annual accounts for the year ended December 31, 2010 as also the Auditors’ and Directors’ Report in respect of Schering–Plough (India) Private Limited are attached to the accounts of the Company.
As per Clause 32 of the Listing Agreement with the Bombay Stock Exchange Limited, the consolidated financial statements of the Company with its subsidiary are also enclosed.
cORPORATE SOcIAL RESPONSIBILITYAs a part of our core business values, your Company is committed to doing good while doing well. An integral part of this approach is the very basis of our Corporate Social Responsibility (CSR) philosophy that drives us to engage in activities that help in expanding access to quality health care and making a positive and sustainable impact. An impactful CSR Programme addresses strategic priorities which help to build and strengthen relationships with regional and country-level stakeholders. We seek to focus on a few key areas where a targeted approach is aimed at making a greater difference, versus a strategy that is broad in scope and diffused. In India, we conduct several CSR activities through philanthropic approaches of our Parent Company. Some of the initiatives are for Eradicating Malnutrition in Madhya Pradesh Tribal Regions, Reduction of Mother Mortality Rates in Assam, Building Human Resources for Eye Care, Pilot Rabies Control Project and Health Literacy Project on Diabetes and Cervical Cancer. We support a number of Patient Support and Disease Management Programmes in several key therapeutic areas to build value for the patient.
AcKNOWLEDGEMENTThe Directors wish to place on record their appreciation of the contribution made by the employees at all levels and for their dedication and commitment to the Company throughout the year. The Directors would also like to record their thanks to Merck & Co., Inc., Whitehouse Station, N.J., U.S.A., the Company’s shareholders, bankers, medical professionals, hospitals, vendors, distributors, pharmacists and all customers for their valuable support and co–operation.
For and on behalf of the Board of Directors
Ajit Dangi Mumbai, February 21, 2011 Chairman
References:1. Mckinsey: India Pharma 20202. Ministry of Health and Family Welfare: First Annual Report on Health3. IMS Data4. Mckinsey: India Pharma 2015
certificate of compliance with the code of conductI, K.G. Ananthakrishnan, President & Managing Director of the Company, hereby declare that the Company has adopted a Code of Conduct for its Board members and senior management, at a meeting of the Board of Directors held on February 9, 2005 and the Board members and senior management have affirmed compliance with the Code of Conduct as applicable to them for the year ended December 31, 2010.
For Fulford (India) Limited
K.G. AnanthakrishnanMumbai, February 21, 2011 President & Managing Director
Secretary.indd 15 3/29/2011 4:42:52 PM
16
Annual Report 2010
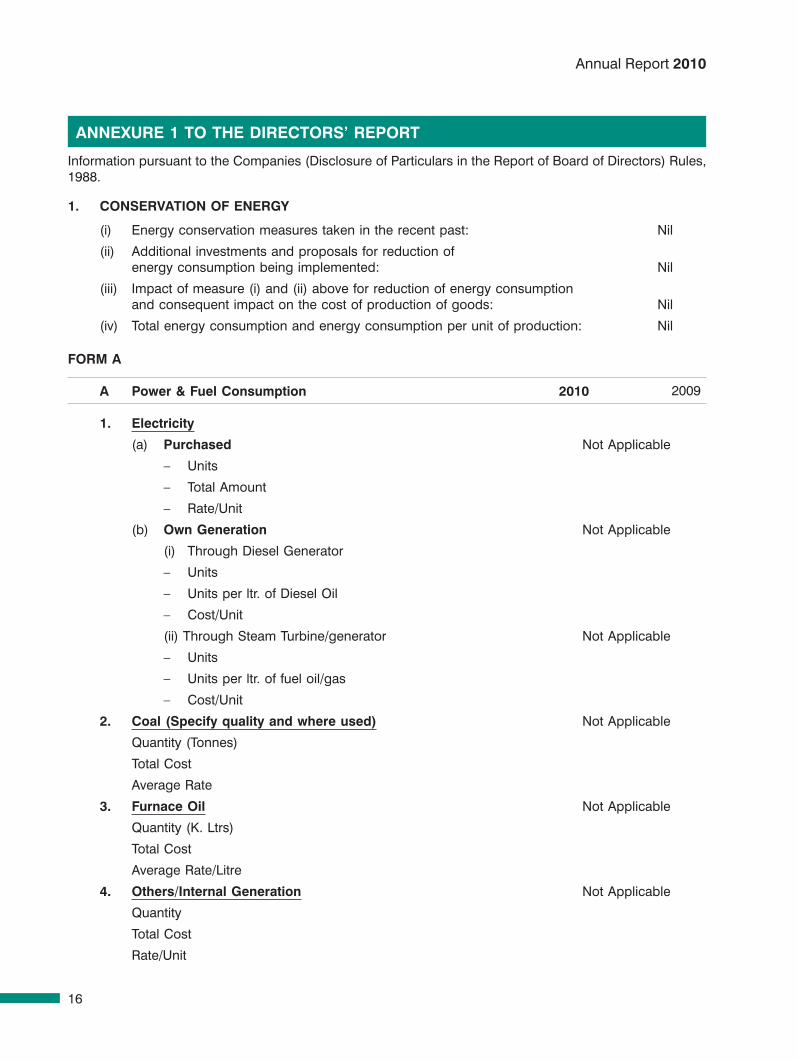
Information pursuant to the Companies (Disclosure of Particulars in the Report of Board of Directors) Rules, 1988.
1. cONSERVATION OF ENERGY
(i) Energy conservation measures taken in the recent past: Nil
(ii) Additional investments and proposals for reduction of energy consumption being implemented: Nil
(iii) Impact of measure (i) and (ii) above for reduction of energy consumption and consequent impact on the cost of production of goods: Nil
(iv) Total energy consumption and energy consumption per unit of production: Nil
FORM A
A Power & Fuel consumption 2010 2009
1. Electricity
(a) Purchased Not Applicable
– Units
– Total Amount
– Rate/Unit
(b) Own Generation Not Applicable
(i) Through Diesel Generator
– Units
– Units per ltr. of Diesel Oil
– Cost/Unit
(ii) Through Steam Turbine/generator Not Applicable
– Units
– Units per ltr. of fuel oil/gas
– Cost/Unit
2. Coal(Specifyqualityandwhereused) Not Applicable
Quantity (Tonnes)
Total Cost
Average Rate
3. Furnace Oil Not Applicable
Quantity (K. Ltrs)
Total Cost
Average Rate/Litre
4. Others/Internal Generation Not Applicable
Quantity
Total Cost
Rate/Unit
ANNEXURE 1 TO THE DIREcTORS’ REPORT
Secretary.indd 16 3/29/2011 4:42:52 PM
17
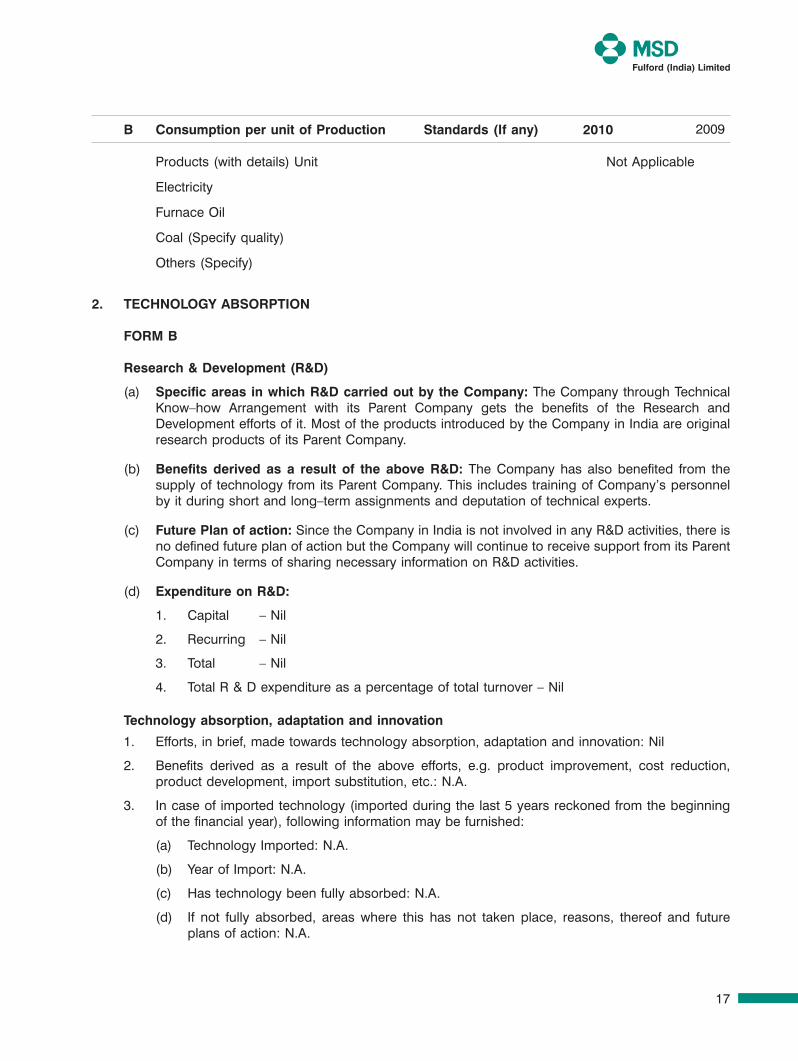
B consumption per unit of Production Standards (If any) 2010 2009
Products (with details) Unit Not Applicable
Electricity
Furnace Oil
Coal (Specify quality)
Others (Specify)
2. TEcHNOLOGY ABSORPTION
FORM B
Research & Development (R&D)
(a) Specific areas in which R&D carried out by the company: The Company through Technical Know–how Arrangement with its Parent Company gets the benefits of the Research and Development efforts of it. Most of the products introduced by the Company in India are original research products of its Parent Company.
(b) Benefits derived as a result of the above R&D: The Company has also benefited from the supply of technology from its Parent Company. This includes training of Company’s personnel by it during short and long–term assignments and deputation of technical experts.
(c) Future Plan of action: Since the Company in India is not involved in any R&D activities, there is no defined future plan of action but the Company will continue to receive support from its Parent Company in terms of sharing necessary information on R&D activities.
(d) Expenditure on R&D:
1. Capital – Nil
2. Recurring – Nil
3. Total – Nil
4. Total R & D expenditure as a percentage of total turnover – Nil
Technology absorption, adaptation and innovation
1. Efforts, in brief, made towards technology absorption, adaptation and innovation: Nil
2. Benefits derived as a result of the above efforts, e.g. product improvement, cost reduction, product development, import substitution, etc.: N.A.
3. In case of imported technology (imported during the last 5 years reckoned from the beginning of the financial year), following information may be furnished:
(a) Technology Imported: N.A.
(b) Year of Import: N.A.
(c) Has technology been fully absorbed: N.A.
(d) If not fully absorbed, areas where this has not taken place, reasons, thereof and future plans of action: N.A.
Secretary.indd 17 3/29/2011 4:42:52 PM
18
Annual Report 2010
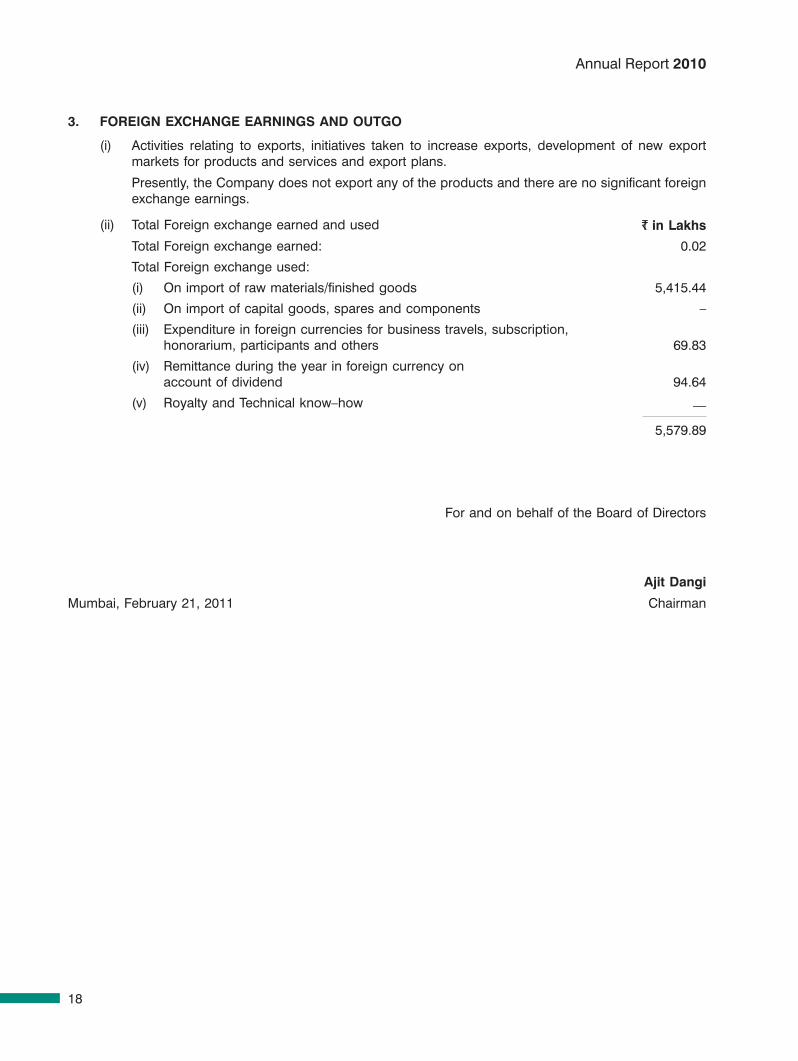
3. FOREIGN EXcHANGE EARNINGS AND OUTGO
(i) Activities relating to exports, initiatives taken to increase exports, development of new export markets for products and services and export plans.
Presently, the Company does not export any of the products and there are no significant foreign exchange earnings.
(ii) Total Foreign exchange earned and used ì in Lakhs
Total Foreign exchange earned: 0.02
Total Foreign exchange used:
(i) On import of raw materials/finished goods 5,415.44
(ii) On import of capital goods, spares and components –
(iii) Expenditure in foreign currencies for business travels, subscription, honorarium, participants and others 69.83
(iv) Remittance during the year in foreign currency on account of dividend 94.64
(v) Royalty and Technical know–how —
5,579.89
For and on behalf of the Board of Directors
Ajit Dangi
Mumbai, February 21, 2011 Chairman
Secretary.indd 18 3/29/2011 4:42:52 PM
19
1. Company’s Philosophy on Code of Governance: Corporate Governance for your Company signifies a set of processes or laws that affect the way it is
directed, administered and controlled. Corporate Governance is our internal system which encompasses policies, processes, people, and which makes sure the needs of shareholders and other stakeholders are met in full. The Corporate Governance framework encourages the efficient use of resources and accountability for the stewardship of those resources. It motivates your Company to create value through entrepreneurism, innovation, development, exploration and provide accountability and control systems commensurate with the risks involved.
In essence, we believe that good Corporate Governance consists of a system of structuring, operating and controlling a Company with integrity and to achieve the following:
• aculturebasedonafoundationofsoundbusiness ethics
• fulfillingthelong-termstrategicgoaloftheownerswhiletakingintoaccounttheexpectationsofallthe key stakeholders, and in particular:
consider and care for the interests of employees, past, present and future
work to maintain excellent relations with both customers and suppliers
take account of the needs of the environment and the local community
• maintaining proper compliance with all the applicable legal and regulatory requirements underwhich the Company is carrying out its activities.
2. Board of Directors: • CompositionoftheBoardofDirectors(Board):
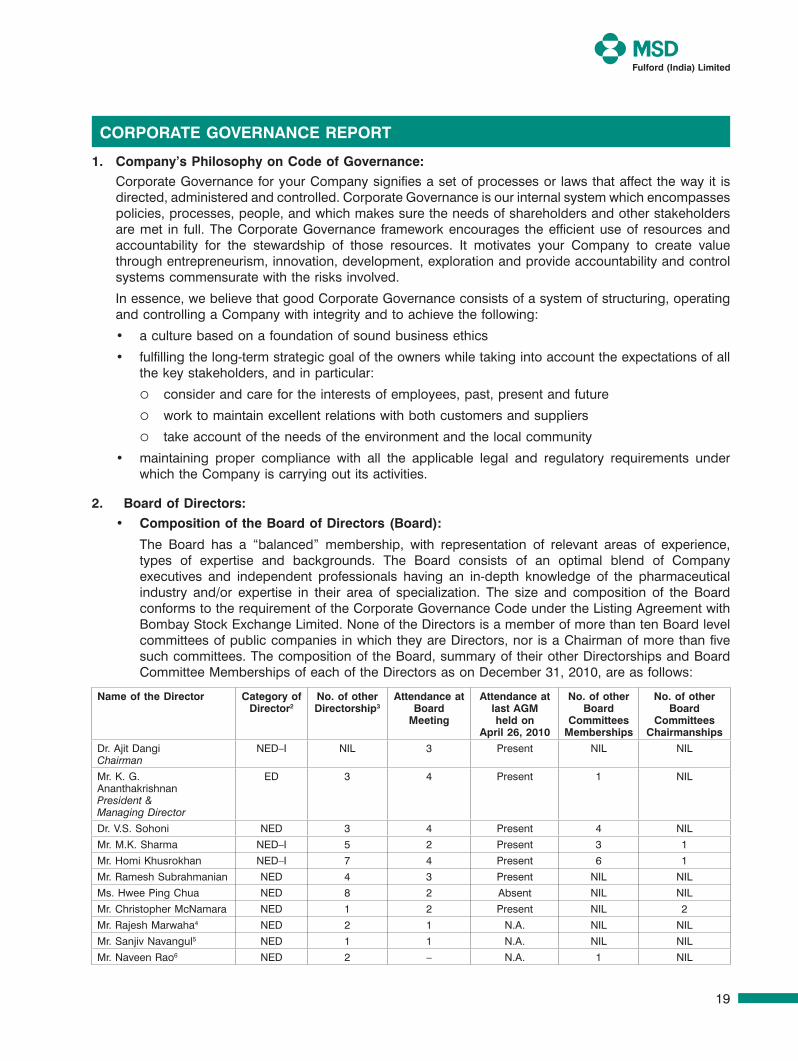
The Board has a “balanced” membership, with representation of relevant areas of experience, types of expertise and backgrounds. The Board consists of an optimal blend of Company executives and independent professionals having an in-depth knowledge of the pharmaceuticalindustry and/or expertise in their area of specialization. The size and composition of the Board conformstotherequirementoftheCorporateGovernanceCodeundertheListingAgreementwithBombayStockExchangeLimited.NoneoftheDirectorsisamemberofmorethantenBoardlevelcommitteesofpubliccompanies inwhichtheyareDirectors,nor isaChairmanofmorethanfivesuchcommittees.Thecompositionof theBoard,summaryof theirotherDirectorshipsandBoardCommitteeMembershipsofeachoftheDirectorsasonDecember31,2010,areasfollows:
Name of the Director Category ofDirector2
No. of otherDirectorship3
Attendance atBoard
Meeting
Attendance atlast AGMheld on
April 26, 2010
No. of otherBoard
Committees Memberships
No. of otherBoard
Committees Chairmanships
Dr.AjitDangiChairman
NED–I NIL 3 Present NIL NIL
Mr. K. G.AnanthakrishnanPresident &Managing Director
ED 3 4 Present 1 NIL
Dr.V.S.Sohoni NED 3 4 Present 4 NIL
Mr. M.K. Sharma NED–I 5 2 Present 3 1
Mr. Homi Khusrokhan NED–I 7 4 Present 6 1
Mr. Ramesh Subrahmanian NED 4 3 Present NIL NIL
Ms. Hwee Ping Chua NED 8 2 Absent NIL NIL
Mr.ChristopherMcNamara NED 1 2 Present NIL 2
Mr.RajeshMarwaha4 NED 2 1 N.A. NIL NIL
Mr.SanjivNavangul5 NED 1 1 N.A. NIL NIL
Mr.NaveenRao6 NED 2 – N.A. 1 NIL
CorPorAte GoverNANCe rePort
Secretary.indd 19 3/29/2011 9:28:37 AM
20
AnnualReport2010
Notes:1. AnIndependentDirectorisaDirectorwhosatisfiesthecriteriastipulatedasperClause49oftheListingAgreement.2. ED:ExecutiveDirector,NED:NonExecutiveDirector,NED–I:NonExecutiveDirector-Independent.3. Includes Alternate Directorships and Directorships in Private Companies. In case of Directors who are foreign nationals and
residing abroad, it also includes their directorships in foreign companies incorporated abroad.4. ActinginthecapacityofanAlternateDirectortoMr.ChristopherMcNamara.5. ActinginthecapacityofanAlternateDirectortoMr.RameshSubrahmanian.6. ActinginthecapacityofanAlternateDirectortoMs.HweePingChua.
• Appointment/re-appointment of Director: TheCompanyhasprovidedbriefresume(s)oftheDirectorsseekingappointmentorre-appointment
attheensuingAnnualGeneralMeeting,inthenoticeattachedwiththeAnnualReport.
• Board Meetings: TheBoardmeetsatregularintervalstoreviewtheperformanceoftheCompany.Adetailedagenda
is prepared in consultation with the President & Managing Director and Chairman. During the year2010,fourBoardMeetingswereheldon23/2/2010,26/4/2010,23/7/2010and22/10/2010.
3. Committees of Board:
a. Audit Committee:
TheBoardhasconstitutedanAuditCommitteeofqualifiedandcompetentmembers,incompliancewiththeListingAgreement,consistingofthefollowingDirectors:
(1) Mr. Homi Khusrokhan, Chairman* (2) Dr.AjitDangi (3) Mr.M.K.Sharma (4) Mr.ChristopherMcNamara * AppointedasChairmanoftheAuditCommitteew.e.f.February21,2011throughreconstitution
oftheAuditCommittee.TheBoardplacesonrecorditssincereappreciationandgratitudeforthevaluablecontributionmadebyMr.M.K.SharmaasChairmanoftheAuditCommittee.
TheCompanySecretaryistheSecretarytotheAuditCommittee. ThetermsofreferencestipulatedbytheBoardfortheAuditCommitteecontainedinClause49of
theListingAgreementareasfollows: (a) OverviewoftheCompany’sFinancialReportingprocessanddisclosureoffinancialinformation
to ensure that the financial statements are correct, sufficient and credible. (b) Reviewing with the Management, the quarterly, half yearly and annual financial statements
before submission to the Board for approval, with particular reference to: (i) MattersrequiredtobeincludedintheDirectors’ResponsibilityStatementtobeincludedin
theBoard’sreportintermsofClause(2AA)ofSection217oftheCompaniesAct,1956. (ii) Changes, if any, in accounting policies and practices and reasons for the same. (iii) Major accountingentries involvingestimatesbasedon theexerciseof judgementby the
Management. (iv) Significantadjustmentsmadeinthefinancialstatementsarisingoutofauditfindings. (v) Compliancewithlistingandotherlegalrequirementsrelatingtofinancialstatements. (vi) Disclosureofanyrelatedpartytransactions. (vii) Qualifications in the draft audit report. (c) ReviewingtheadequacyofInternalAuditfunction. (d) ReviewingwiththeManagement,performanceofStatutoryandInternalAuditors,theadequacy
of internal control systems and procedures. (e) DiscussingwiththeInternalAuditors,anysignificantfindingandfollow-uponsuchissue. (f) Reviewingthefindingsofany internal investigationsbythe InternalAuditors inmatterswhere
there is suspected fraud or irregularity or a failure of internal control systems of a material nature, and then reporting such matters to the Board.
Secretary.indd 20 3/29/2011 9:28:37 AM
21
(g) DiscussingwithStatutoryAuditorsbefore theAudit commenceson thenature and scopeofaudit,aswellashavingpost-auditdiscussiontoascertainanyareaofconcern.
(h) Reviewing/recommending the appointment, re-appointment and replacement or removal ofinternal and Statutory Auditors of theCompany, fixation of remuneration/audit fees and alsoapproval for payments for any other services rendered by them.
(i) Reviewing substantial defaults in the payment to the depositors and shareholders (in case of non-paymentofdeclareddividends)andcreditors.
(j) Reviewing the Management discussion and analysis of financial condition and results ofoperations.
(k) Reviewing the Statement of significant related party transactions submitted by the Management.
(l) Reviewing the risk assessment and minimization procedures to ensure that executive management controls risk through means of a properly defined framework.
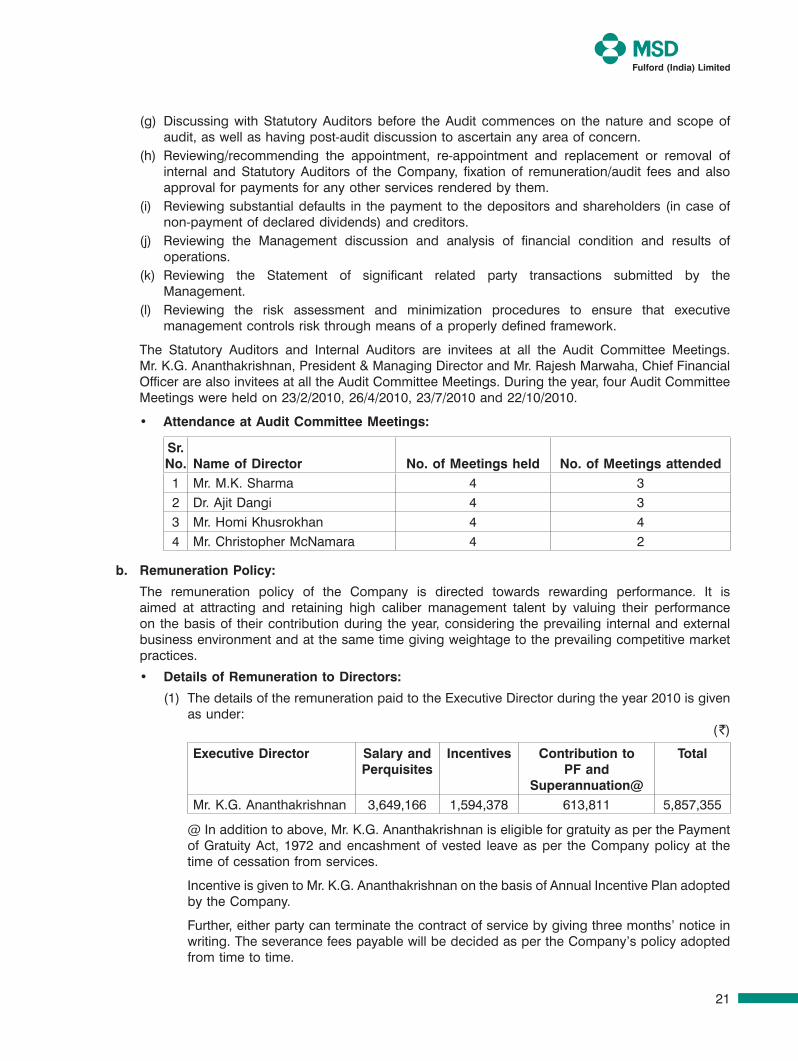
The Statutory Auditors and Internal Auditors are invitees at all the Audit Committee Meetings. Mr.K.G.Ananthakrishnan,President&ManagingDirectorandMr.RajeshMarwaha,ChiefFinancialOfficerarealsoinviteesatalltheAuditCommitteeMeetings.Duringtheyear,fourAuditCommitteeMeetingswereheldon23/2/2010,26/4/2010,23/7/2010and22/10/2010.
• Attendance at Audit Committee Meetings:
Sr. No. Name of Director No. of Meetings held No. of Meetings attended1 Mr. M.K. Sharma 4 32 Dr.AjitDangi 4 33 Mr. Homi Khusrokhan 4 44 Mr.ChristopherMcNamara 4 2
b. remuneration Policy:
The remuneration policy of the Company is directed towards rewarding performance. It is aimed at attracting and retaining high caliber management talent by valuing their performance on the basis of their contribution during the year, considering the prevailing internal and external business environment and at the same time giving weightage to the prevailing competitive market practices.
• Details of remuneration to Directors:
(1) ThedetailsoftheremunerationpaidtotheExecutiveDirectorduringtheyear2010isgivenas under:
( ̀ )
executive Director Salary and Perquisites
Incentives Contribution to PF and
Superannuation@
total
Mr.K.G.Ananthakrishnan 3,649,166 1,594,378 613,811 5,857,355
@Inadditiontoabove,Mr.K.G.AnanthakrishnaniseligibleforgratuityasperthePaymentofGratuityAct, 1972andencashmentof vested leaveasper theCompanypolicyat thetime of cessation from services.
IncentiveisgiventoMr.K.G.AnanthakrishnanonthebasisofAnnualIncentivePlanadoptedby the Company.
Further,eitherpartycanterminatethecontractofservicebygivingthreemonths’noticeinwriting. The severance fees payable will be decided as per the Company’s policy adopted from time to time.
Secretary.indd 21 3/29/2011 9:28:37 AM
22
AnnualReport2010
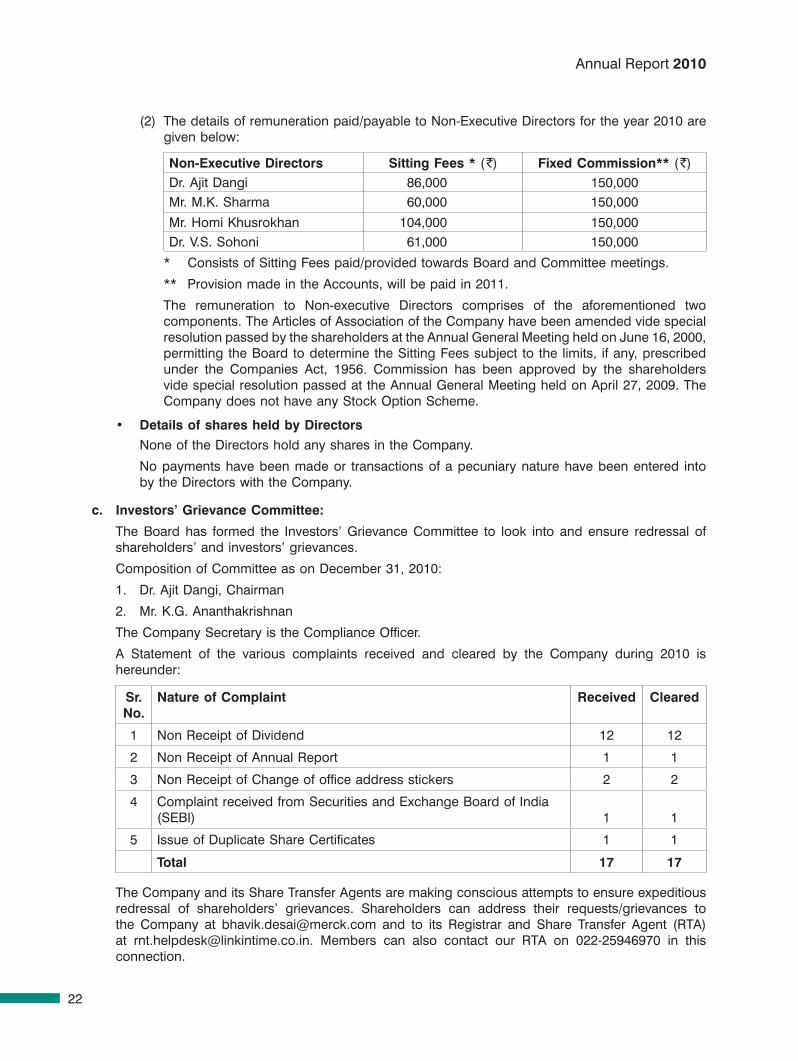
(2) Thedetailsofremunerationpaid/payabletoNon-ExecutiveDirectorsfortheyear2010aregiven below:
Non-executive Directors Sitting Fees * ( ̀ ) Fixed Commission** ( ̀ )Dr.AjitDangi 86,000 150,000Mr. M.K. Sharma 60,000 150,000
Mr. Homi Khusrokhan 104,000 150,000Dr.V.S.Sohoni 61,000 150,000
* ConsistsofSittingFeespaid/providedtowardsBoardandCommitteemeetings.
** ProvisionmadeintheAccounts,willbepaidin2011.
The remuneration to Non-executive Directors comprises of the aforementioned twocomponents.TheArticlesofAssociationoftheCompanyhavebeenamendedvidespecialresolutionpassedbytheshareholdersattheAnnualGeneralMeetingheldonJune16,2000,permitting theBoard todetermine theSittingFeessubject to the limits, ifany,prescribedunder the Companies Act, 1956. Commission has been approved by the shareholdersvidespecialresolutionpassedattheAnnualGeneralMeetingheldonApril27,2009.TheCompany does not have any Stock Option Scheme.
• Details of shares held by Directors NoneoftheDirectorsholdanysharesintheCompany.
Nopaymentshavebeenmadeor transactionsofapecuniarynaturehavebeenentered intobytheDirectorswiththeCompany.
c. Investors’ Grievance Committee:
The Board has formed the Investors’ Grievance Committee to look into and ensure redressal of shareholders’ and investors’ grievances.
CompositionofCommitteeasonDecember31,2010:
1. Dr.AjitDangi,Chairman
2. Mr.K.G.Ananthakrishnan
The Company Secretary is the Compliance Officer.
A Statement of the various complaints received and cleared by the Company during 2010 ishereunder:
Sr. No.
Nature of Complaint received Cleared
1 NonReceiptofDividend 12 12
2 NonReceiptofAnnualReport 1 1
3 NonReceiptofChangeofofficeaddressstickers 2 2
4 Complaint received from Securities and Exchange Board of India (SEBI) 1 1
5 IssueofDuplicateShareCertificates 1 1
total 17 17
TheCompanyanditsShareTransferAgentsaremakingconsciousattemptstoensureexpeditiousredressal of shareholders’ grievances. Shareholders can address their requests/grievances tothe Company at [email protected] and to its Registrar and Share Transfer Agent (RTA)at [email protected]. Members can also contact our RTA on 022-25946970 in thisconnection.
Secretary.indd 22 3/29/2011 9:28:38 AM
23
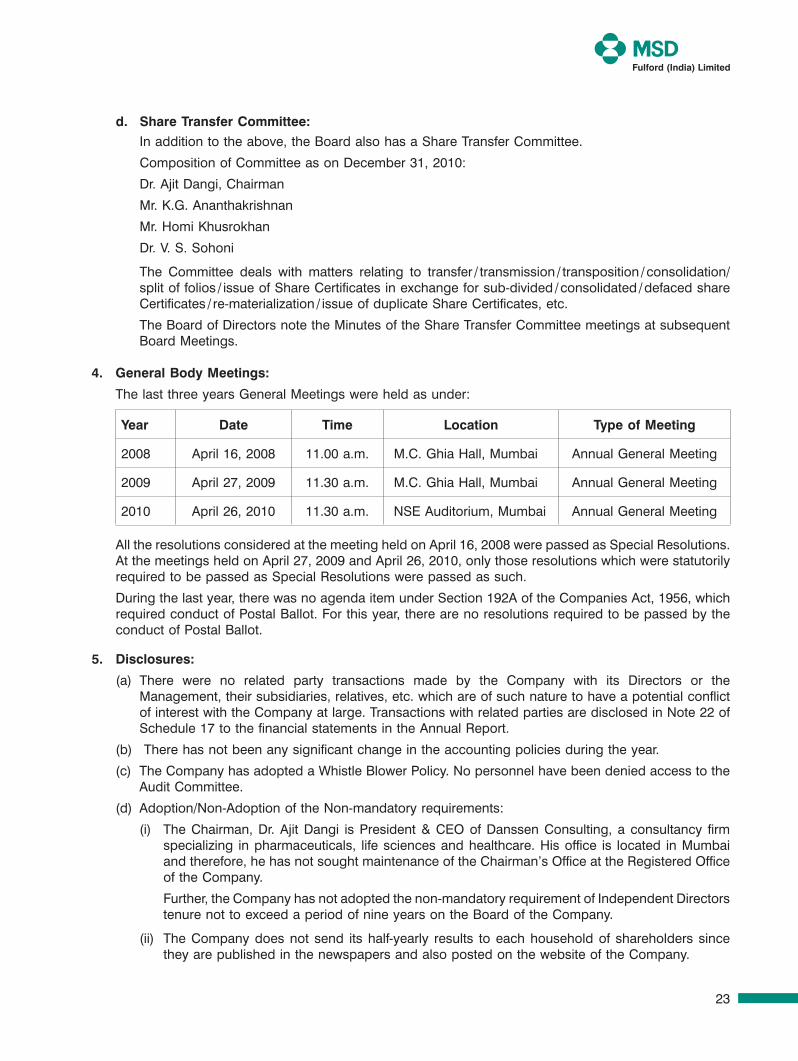
d. Share transfer Committee: In addition to the above, the Board also has a Share Transfer Committee.
CompositionofCommitteeasonDecember31,2010:
Dr.AjitDangi,Chairman
Mr.K.G.Ananthakrishnan
Mr. Homi Khusrokhan
Dr.V.S.Sohoni
The Committee deals with matters relating to transfer / transmission / transposition / consolidation/ splitoffolios/issueofShareCertificatesinexchangeforsub-divided/consolidated/defacedshareCertificates/re-materialization/issueofduplicateShareCertificates,etc.
TheBoardofDirectorsnotetheMinutesoftheShareTransferCommitteemeetingsatsubsequentBoard Meetings.
4. General Body Meetings:
The last three years General Meetings were held as under:
Year Date time Location type of Meeting
2008 April16,2008 11.00a.m. M.C. Ghia Hall, Mumbai AnnualGeneralMeeting
2009 April27,2009 11.30a.m. M.C. Ghia Hall, Mumbai AnnualGeneralMeeting
2010 April26,2010 11.30a.m. NSEAuditorium,Mumbai AnnualGeneralMeeting
AlltheresolutionsconsideredatthemeetingheldonApril16,2008werepassedasSpecialResolutions.AtthemeetingsheldonApril27,2009andApril26,2010,onlythoseresolutionswhichwerestatutorilyrequiredtobepassedasSpecialResolutionswerepassedassuch.
Duringthelastyear,therewasnoagendaitemunderSection192AoftheCompaniesAct,1956,whichrequiredconductofPostalBallot.Forthisyear,therearenoresolutionsrequiredtobepassedbytheconduct of Postal Ballot.
5. Disclosures:
(a) There were no related party transactions made by the Company with its Directors or the Management, their subsidiaries, relatives, etc. which are of such nature to have a potential conflict ofinterestwiththeCompanyatlarge.TransactionswithrelatedpartiesaredisclosedinNote22ofSchedule17tothefinancialstatementsintheAnnualReport.
(b) There has not been any significant change in the accounting policies during the year.
(c) TheCompanyhasadoptedaWhistleBlowerPolicy.NopersonnelhavebeendeniedaccesstotheAuditCommittee.
(d) Adoption/Non-AdoptionoftheNon-mandatoryrequirements:
(i) TheChairman,Dr. AjitDangi isPresident&CEOofDanssenConsulting, a consultancy firmspecializing in pharmaceuticals, life sciences and healthcare. His office is located in Mumbai and therefore, he has not sought maintenance of the Chairman’s Office at the Registered Office of the Company.
Further,theCompanyhasnotadoptedthenon-mandatoryrequirementofIndependentDirectorstenure not to exceed a period of nine years on the Board of the Company.
(ii) TheCompanydoesnot send its half-yearly results to eachhouseholdof shareholders sincethey are published in the newspapers and also posted on the website of the Company.
Secretary.indd 23 3/29/2011 9:28:38 AM
24
AnnualReport2010
(iii) TheAuditorshaveissuedanunqualifiedopinionfortheyearendedDecember31,2010.
(iv) TheBoardofDirectorsof theCompanyconsistsofanoptimalblendofCompanyExecutivesand Independentprofessionalshavingan in-depthknowledgeof thepharmaceutical industryand/or expertise in their area of specialization.
Presentations are made at the Board Meetings on various functional aspects of the Company aswellasonmajordevelopmentsandchangeswhichactasagoodtrainingtool.
(v) Atpresent,theCompanydoesnothaveamechanismforevaluatingitsNon-ExecutiveDirectorsby peer group.
(vi) The Company has not constituted the remuneration committee which is a non-mandatoryrequirement.
(e) Riskassessmentandminimizationproceduresareperiodically reviewedby theAuditCommitteeandtheBoardofDirectorsoftheCompany.
(f) The Company had raised ` 40.25 crores by issuing 700,000 Equity shares of ` 10/- each ata premium of ` 565/- per share, to its promoter Dashtag, U.K. The above amount is presentlyunutilizedand is invested infixeddepositswithbank.TheAuditCommitteereviewsquarterly, theuse/application of fund raised through preferential issue.
(g) In termsof the requirementofClause49(V)of theListingagreement, thePresident&ManagingDirectorand theChiefFinancialOfficerhavemadeacertification to theBoardofDirectors in theprescribedformatfortheyearunderreview,whichhasbeenreviewedbytheAuditCommitteeandtakenonrecordbytheBoardofDirectorsoftheCompany.
(h) Disclosureofnamesofpersonsconstituting ‘Group’pursuant toRegulation3(1)(e)(i)of theSEBI(SubstantialAcquisitionofShares&Takeovers)Regulations,1997:
(i) Merck&Co.,Inc.,WhitehouseStation,NJ,USA
(ii) Dashtag,U.K.
(iii) OrganonParticipationsBV,Netherlands
(iv)Organon(India)Limited,India
6. Communication:
Thequarterly, half yearly andentire year results arepublished in newspapers namely, TheFinancialExpress(English)andLoksatta(Marathi).
The Profile of the Company, Financial Results, Code of Conduct for Board Members and SeniorManagement of the Company as also the Shareholding Pattern are posted on the Company’s website addressed at www.fulfordindia.com.
ManagementDiscussionandAnalysisReportformspartoftheDirectors’Report.
7. General Shareholder Information:
The general shareholder information is provided separately in this annual report.
ForandonbehalfoftheBoardofDirectors
Ajit DangiMumbai,February21,2011 Chairman
Secretary.indd 24 3/29/2011 9:28:38 AM
25
Shareholder Information
AGM date, time and venue : April 29, 2011, 11.30 a.m. at the Exchange Plaza, NSEAuditorium,GroundFloor,Bandra-KurlaComplex,Bandra (East), Mumbai-400051
Financial Calendar : JanuarytoDecember
First Quarter results : On or before May 15
Second Quarter results : OnorbeforeAugust14
third Quarter results : OnorbeforeNovember14
Audited results for the year end : OnorbeforeFebruary28ofthesucceedingyear
Date of Book Closure : April21toApril29,2011(bothdaysinclusive)
Dividend Payment Date : OnorbeforeMay17,2011
Listing on Stock exchanges : The Company’s shares are listed and traded on Bombay Stock ExchangeLimited.
The Company’s shares are traded under the category “S” Group.
Stock Code : 506803
Demat : INE521A01017
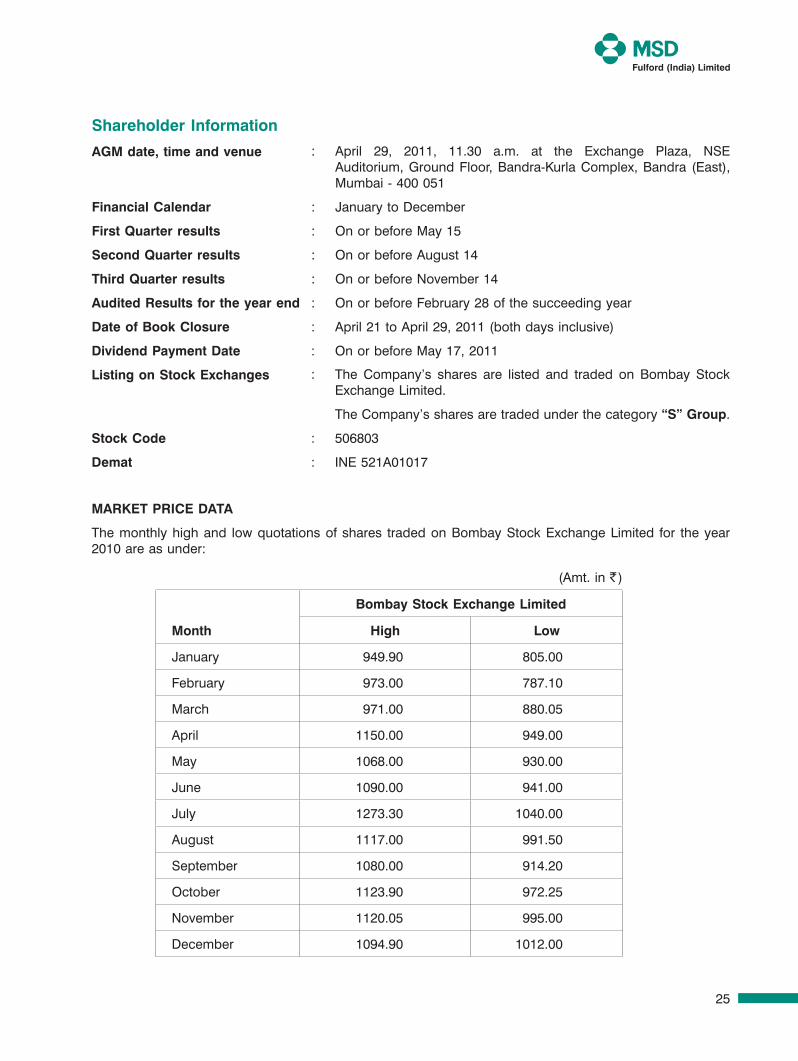
MArKet PrICe DAtA
Themonthlyhighand lowquotationsof shares tradedonBombayStockExchangeLimited for theyear2010areasunder:
(Amt.in` )
Bombay Stock exchange Limited
Month High Low
January 949.90 805.00
February 973.00 787.10
March 971.00 880.05
April 1150.00 949.00
May 1068.00 930.00
June 1090.00 941.00
July 1273.30 1040.00
August 1117.00 991.50
September 1080.00 914.20
October 1123.90 972.25
November 1120.05 995.00
December 1094.90 1012.00
Secretary.indd 25 3/29/2011 9:28:38 AM
26
Annual Report 2010
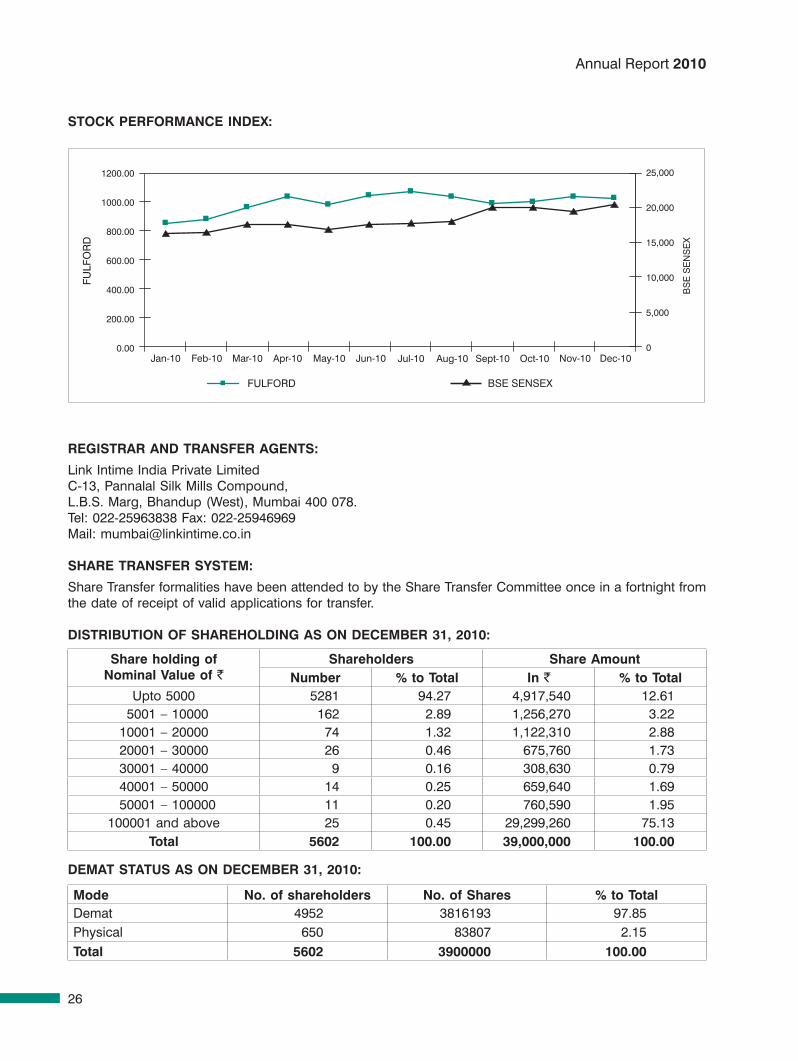
STOCK PERFORMANCE INDEX:
REGISTRAR AND TRANSFER AGENTS:
Link Intime India Private LimitedC-13, Pannalal Silk Mills Compound,L.B.S. Marg, Bhandup (West), Mumbai 400 078.Tel: 022-25963838 Fax: 022-25946969Mail: [email protected]
SHARE TRANSFER SYSTEM:
Share Transfer formalities have been attended to by the Share Transfer Committee once in a fortnight from the date of receipt of valid applications for transfer.
DISTRIBUTION OF SHAREHOLDING AS ON DECEMBER 31, 2010:
Share holding ofNominal Value of `
Shareholders Share AmountNumber % to Total In ` % to Total
Upto 5000 5281 94.27 4,917,540 12.61 5001 – 10000 162 2.89 1,256,270 3.22 10001 – 20000 74 1.32 1,122,310 2.88 20001 – 30000 26 0.46 675,760 1.73 30001 – 40000 9 0.16 308,630 0.79 40001 – 50000 14 0.25 659,640 1.69 50001 – 100000 11 0.20 760,590 1.95
100001 and above 25 0.45 29,299,260 75.13Total 5602 100.00 39,000,000 100.00
DEMAT STATUS AS ON DECEMBER 31, 2010:
Mode No. of shareholders No. of Shares % to TotalDemat 4952 3816193 97.85Physical 650 83807 2.15Total 5602 3900000 100.00
Secretary.indd 26 3/30/2011 12:04:33 PM
27
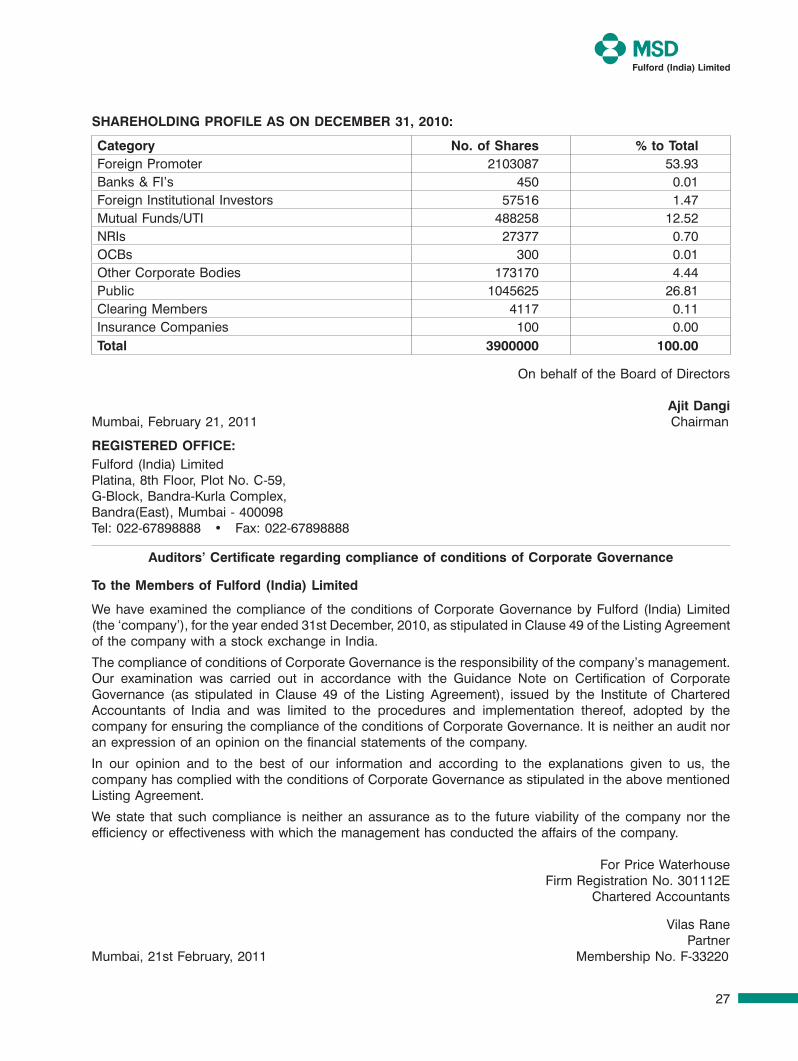
SHAreHoLDING ProFILe AS oN DeCeMBer 31, 2010:
Category No. of Shares % to totalForeignPromoter 2103087 53.93Banks&FI’s 450 0.01ForeignInstitutionalInvestors 57516 1.47MutualFunds/UTI 488258 12.52NRIs 27377 0.70OCBs 300 0.01Other Corporate Bodies 173170 4.44Public 1045625 26.81Clearing Members 4117 0.11Insurance Companies 100 0.00total 3900000 100.00
OnbehalfoftheBoardofDirectors
Ajit DangiMumbai,February21,2011 Chairman
reGIStereD oFFICe:Fulford(India)LimitedPlatina,8thFloor,PlotNo.C-59,G-Block,Bandra-KurlaComplex,Bandra(East),Mumbai-400098Tel:022-67898888 • Fax:022-67898888
Auditors’ Certificate regarding compliance of conditions of Corporate Governance
TotheMembersofFulford(India)Limited
Wehaveexamined thecomplianceof theconditionsofCorporateGovernancebyFulford (India)Limited (the‘company’),fortheyearended31stDecember,2010,asstipulatedinClause49oftheListingAgreementof the company with a stock exchange in India.
The compliance of conditions of Corporate Governance is the responsibility of the company’s management. Our examination was carried out in accordance with the Guidance Note on Certification of CorporateGovernance (as stipulated in Clause 49 of the Listing Agreement), issued by the Institute of CharteredAccountants of India and was limited to the procedures and implementation thereof, adopted by thecompany for ensuring the compliance of the conditions of Corporate Governance. It is neither an audit nor an expression of an opinion on the financial statements of the company.
In our opinion and to the best of our information and according to the explanations given to us, the company has complied with the conditions of Corporate Governance as stipulated in the above mentioned ListingAgreement.
We state that such compliance is neither an assurance as to the future viability of the company nor the efficiency or effectiveness with which the management has conducted the affairs of the company.
ForPriceWaterhouseFirmRegistrationNo.301112E
CharteredAccountants
VilasRanePartner
Mumbai,21stFebruary,2011 MembershipNo.F-33220
Secretary.indd 27 3/29/2011 9:28:39 AM
28
Annual Report 2010
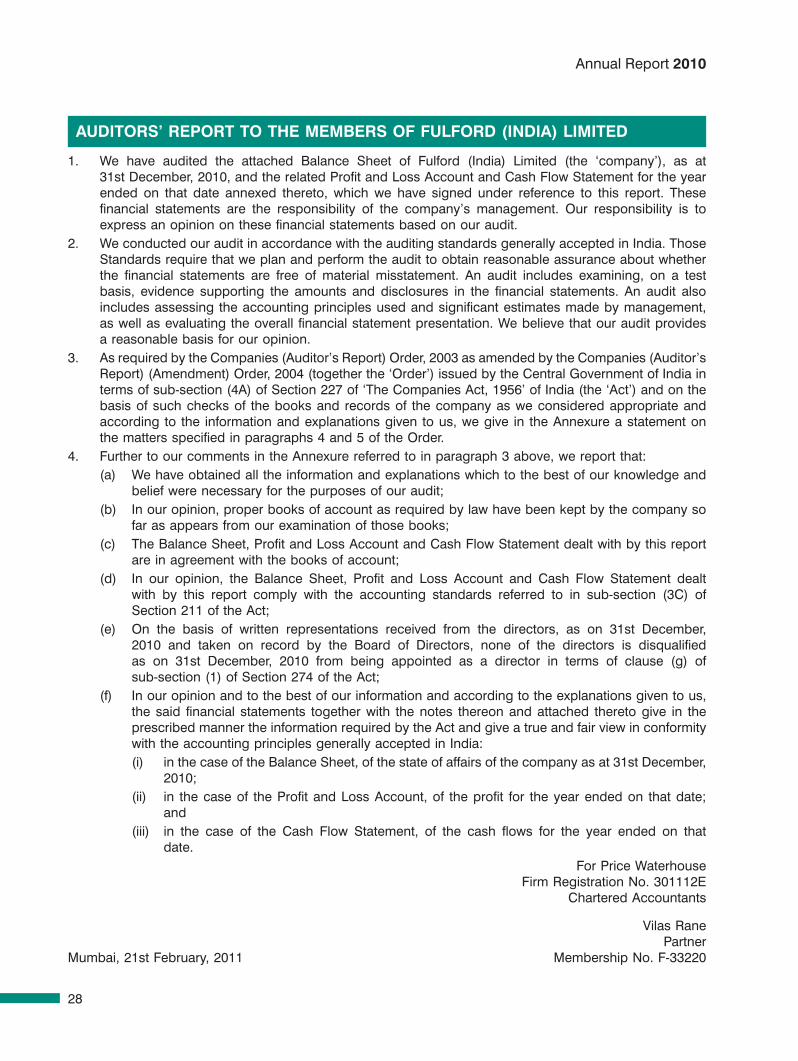
1. We have audited the attached Balance Sheet of Fulford (India) Limited (the ‘company’), as at 31st December, 2010, and the related Profit and Loss Account and Cash Flow Statement for the year ended on that date annexed thereto, which we have signed under reference to this report. These financial statements are the responsibility of the company’s management. Our responsibility is to express an opinion on these financial statements based on our audit.
2. We conducted our audit in accordance with the auditing standards generally accepted in India. Those Standards require that we plan and perform the audit to obtain reasonable assurance about whether the financial statements are free of material misstatement. An audit includes examining, on a test basis, evidence supporting the amounts and disclosures in the financial statements. An audit also includes assessing the accounting principles used and significant estimates made by management, as well as evaluating the overall financial statement presentation. We believe that our audit provides a reasonable basis for our opinion.
3. As required by the Companies (Auditor’s Report) Order, 2003 as amended by the Companies (Auditor’s Report) (Amendment) Order, 2004 (together the ‘Order’) issued by the Central Government of India in terms of sub-section (4A) of Section 227 of ‘The Companies Act, 1956’ of India (the ‘Act’) and on the basis of such checks of the books and records of the company as we considered appropriate and according to the information and explanations given to us, we give in the Annexure a statement on the matters specified in paragraphs 4 and 5 of the Order.
4. Further to our comments in the Annexure referred to in paragraph 3 above, we report that: (a) We have obtained all the information and explanations which to the best of our knowledge and
belief were necessary for the purposes of our audit; (b) In our opinion, proper books of account as required by law have been kept by the company so
far as appears from our examination of those books; (c) The Balance Sheet, Profit and Loss Account and Cash Flow Statement dealt with by this report
are in agreement with the books of account; (d) In our opinion, the Balance Sheet, Profit and Loss Account and Cash Flow Statement dealt
with by this report comply with the accounting standards referred to in sub-section (3C) of Section 211 of the Act;
(e) On the basis of written representations received from the directors, as on 31st December, 2010 and taken on record by the Board of Directors, none of the directors is disqualified as on 31st December, 2010 from being appointed as a director in terms of clause (g) of sub-section (1) of Section 274 of the Act;
(f) In our opinion and to the best of our information and according to the explanations given to us, the said financial statements together with the notes thereon and attached thereto give in the prescribed manner the information required by the Act and give a true and fair view in conformity with the accounting principles generally accepted in India:
(i) in the case of the Balance Sheet, of the state of affairs of the company as at 31st December, 2010;
(ii) in the case of the Profit and Loss Account, of the profit for the year ended on that date; and
(iii) in the case of the Cash Flow Statement, of the cash flows for the year ended on that date.
For Price WaterhouseFirm Registration No. 301112E
Chartered Accountants
Vilas Rane PartnerMumbai, 21st February, 2011 Membership No. F-33220
Auditors’ report to the MeMbers of fulford (indiA) liMited
Fulford Accounts & Auditors.indd 28 3/29/2011 9:34:16 AM
29
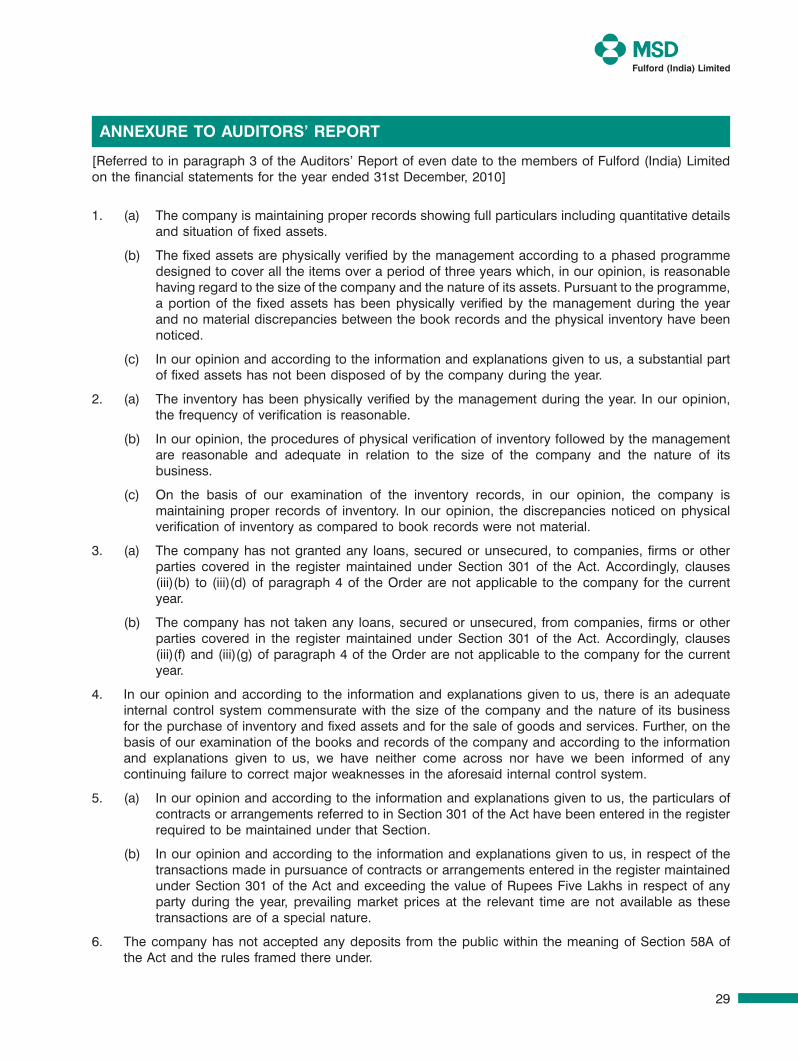
[Referred to in paragraph 3 of the Auditors’ Report of even date to the members of Fulford (India) Limited on the financial statements for the year ended 31st December, 2010]
1. (a) The company is maintaining proper records showing full particulars including quantitative details and situation of fixed assets.
(b) The fixed assets are physically verified by the management according to a phased programme designed to cover all the items over a period of three years which, in our opinion, is reasonable having regard to the size of the company and the nature of its assets. Pursuant to the programme, a portion of the fixed assets has been physically verified by the management during the year and no material discrepancies between the book records and the physical inventory have been noticed.
(c) In our opinion and according to the information and explanations given to us, a substantial part of fixed assets has not been disposed of by the company during the year.
2. (a) The inventory has been physically verified by the management during the year. In our opinion, the frequency of verification is reasonable.
(b) In our opinion, the procedures of physical verification of inventory followed by the management are reasonable and adequate in relation to the size of the company and the nature of its business.
(c) On the basis of our examination of the inventory records, in our opinion, the company is maintaining proper records of inventory. In our opinion, the discrepancies noticed on physical verification of inventory as compared to book records were not material.
3. (a) The company has not granted any loans, secured or unsecured, to companies, firms or other parties covered in the register maintained under Section 301 of the Act. Accordingly, clauses (iii)(b) to (iii)(d) of paragraph 4 of the Order are not applicable to the company for the current year.
(b) The company has not taken any loans, secured or unsecured, from companies, firms or other parties covered in the register maintained under Section 301 of the Act. Accordingly, clauses (iii)(f) and (iii)(g) of paragraph 4 of the Order are not applicable to the company for the current year.
4. In our opinion and according to the information and explanations given to us, there is an adequate internal control system commensurate with the size of the company and the nature of its business for the purchase of inventory and fixed assets and for the sale of goods and services. Further, on the basis of our examination of the books and records of the company and according to the information and explanations given to us, we have neither come across nor have we been informed of any continuing failure to correct major weaknesses in the aforesaid internal control system.
5. (a) In our opinion and according to the information and explanations given to us, the particulars of contracts or arrangements referred to in Section 301 of the Act have been entered in the register required to be maintained under that Section.
(b) In our opinion and according to the information and explanations given to us, in respect of the transactions made in pursuance of contracts or arrangements entered in the register maintained under Section 301 of the Act and exceeding the value of Rupees Five Lakhs in respect of any party during the year, prevailing market prices at the relevant time are not available as these transactions are of a special nature.
6. The company has not accepted any deposits from the public within the meaning of Section 58A of the Act and the rules framed there under.
Annexure to Auditors’ report
Fulford Accounts & Auditors.indd 29 3/29/2011 9:34:16 AM
30
Annual Report 2010
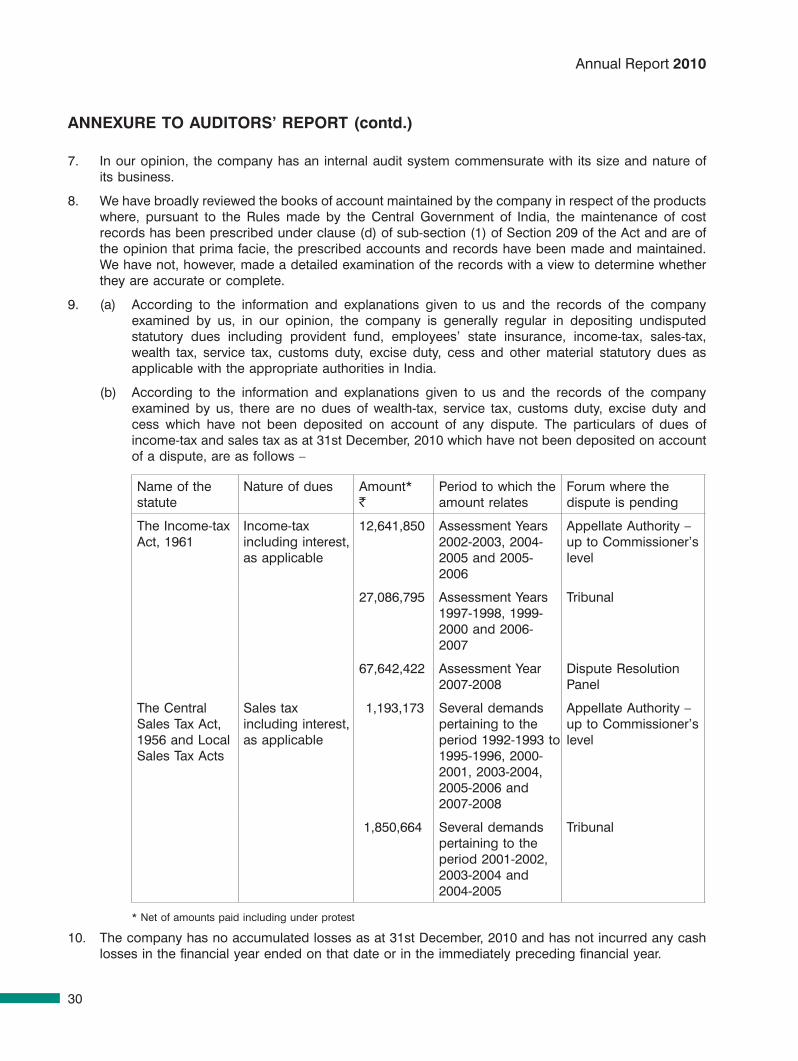
7. In our opinion, the company has an internal audit system commensurate with its size and nature of its business.
8. We have broadly reviewed the books of account maintained by the company in respect of the products where, pursuant to the Rules made by the Central Government of India, the maintenance of cost records has been prescribed under clause (d) of sub-section (1) of Section 209 of the Act and are of the opinion that prima facie, the prescribed accounts and records have been made and maintained. We have not, however, made a detailed examination of the records with a view to determine whether they are accurate or complete.
9. (a) According to the information and explanations given to us and the records of the company examined by us, in our opinion, the company is generally regular in depositing undisputed statutory dues including provident fund, employees’ state insurance, income-tax, sales-tax, wealth tax, service tax, customs duty, excise duty, cess and other material statutory dues as applicable with the appropriate authorities in India.
(b) According to the information and explanations given to us and the records of the company examined by us, there are no dues of wealth-tax, service tax, customs duty, excise duty and cess which have not been deposited on account of any dispute. The particulars of dues of income-tax and sales tax as at 31st December, 2010 which have not been deposited on account of a dispute, are as follows –
Name of the statute
Nature of dues Amount* `
Period to which the amount relates
Forum where the dispute is pending
The Income-tax Act, 1961
Income-tax including interest, as applicable
12,641,850 Assessment Years 2002-2003, 2004-2005 and 2005-2006
Appellate Authority – up to Commissioner’s level
27,086,795 Assessment Years 1997-1998, 1999-2000 and 2006-2007
Tribunal
67,642,422 Assessment Year 2007-2008
Dispute Resolution Panel
The Central Sales Tax Act, 1956 and Local Sales Tax Acts
Sales tax including interest, as applicable
1,193,173 Several demands pertaining to the period 1992-1993 to 1995-1996, 2000-2001, 2003-2004, 2005-2006 and 2007-2008
Appellate Authority – up to Commissioner’s level
1,850,664 Several demands pertaining to the period 2001-2002, 2003-2004 and 2004-2005
Tribunal
* Net of amounts paid including under protest
10. The company has no accumulated losses as at 31st December, 2010 and has not incurred any cash losses in the financial year ended on that date or in the immediately preceding financial year.
Annexure to Auditors’ report (contd.)
Fulford Accounts & Auditors.indd 30 3/29/2011 9:34:16 AM
31
11. According to the records of the company examined by us and the information and explanations given to us, the company has not defaulted in repayment of dues to any financial institution or bank or debenture holders.
12. The company has not granted any loans and advances on the basis of security by way of pledge of shares, debentures and other securities.
13. The provisions of any special statute applicable to chit fund/nidhi/mutual benefit fund/societies are not applicable to the company.
14. In our opinion, the company is not a dealer or trader in shares, securities, debentures and other investments.
15. According to the information and explanations given to us, the company has not given any guarantee for loans taken by others from banks or financial institutions during the year.
16. The company has not obtained any term loans.
17. On the basis of an overall examination of the Balance Sheet of the company, in our opinion and according to the information and explanations given to us, there are no funds raised on short-term basis which have been used for long-term investment.
18. The company has not made any preferential allotment of shares to parties and companies covered in the register maintained under Section 301 of the Act during the year.
19. The company has not issued any debentures.
20. The company has not raised any money by public issues during the year.
21. During the course of our examination of the books and records of the company, carried out in accordance with the generally accepted auditing practices in India and according to the information and explanations given to us, we have neither come across any instance of fraud on or by the company, noticed or reported during the year, nor have we been informed of such case by the management.
For Price WaterhouseFirm Registration No. 301112E
Chartered Accountants
Vilas Rane PartnerMumbai, 21st February, 2011 Membership No. F-33220
Annexure to Auditors’ report (contd.)
Fulford Accounts & Auditors.indd 31 3/29/2011 9:34:16 AM
32
Annual Report 2010
schedule As at
31st december, 2010As at
31st December, 2009 ` ` ` `
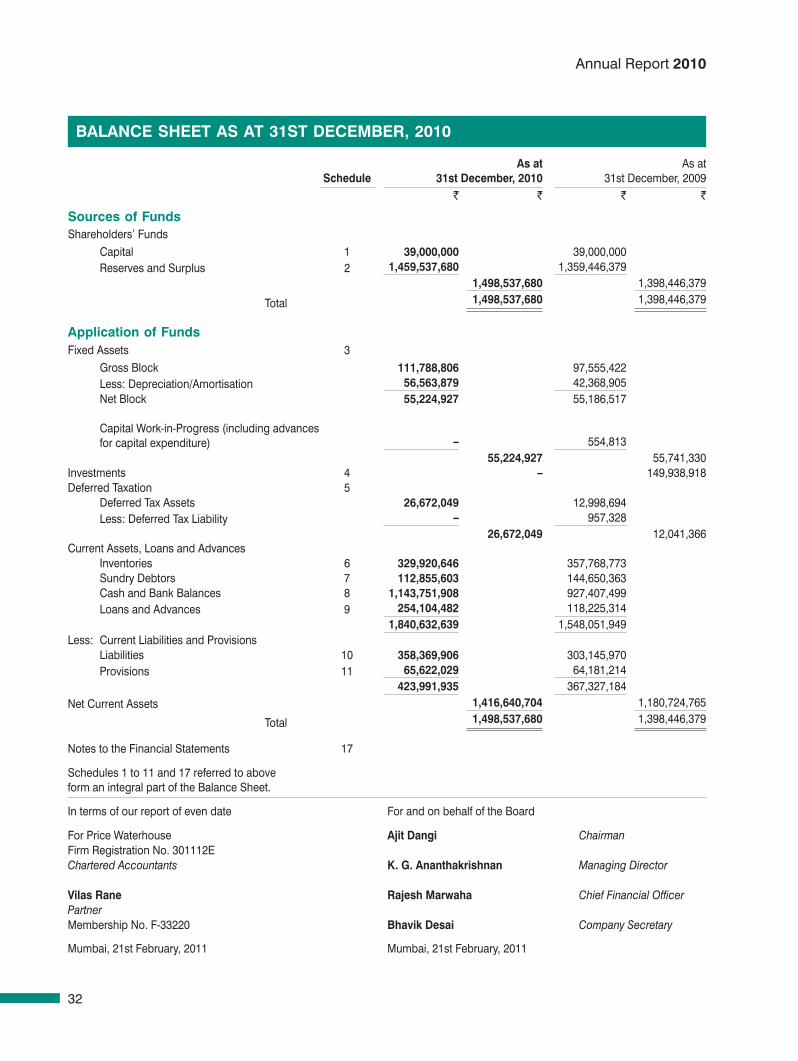
sources of fundsShareholders’ Funds Capital 1 39,000,000 39,000,000 Reserves and Surplus 2 1,459,537,680 1,359,446,379
1,498,537,680 1,398,446,379
Total 1,498,537,680 1,398,446,379
Application of fundsFixed Assets 3 Gross Block 111,788,806 97,555,422 Less: Depreciation/Amortisation 56,563,879 42,368,905 Net Block 55,224,927 55,186,517
Capital Work-in-Progress (including advances for capital expenditure) – 554,813
55,224,927 55,741,330 Investments 4 – 149,938,918 Deferred Taxation 5 Deferred Tax Assets 26,672,049 12,998,694 Less: Deferred Tax Liability – 957,328
26,672,049 12,041,366 Current Assets, Loans and Advances Inventories 6 329,920,646 357,768,773 Sundry Debtors 7 112,855,603 144,650,363 Cash and Bank Balances 8 1,143,751,908 927,407,499 Loans and Advances 9 254,104,482 118,225,314
1,840,632,639 1,548,051,949 Less: Current Liabilities and Provisions Liabilities 10 358,369,906 303,145,970 Provisions 11 65,622,029 64,181,214
423,991,935 367,327,184 Net Current Assets 1,416,640,704 1,180,724,765
Total 1,498,537,680 1,398,446,379
Notes to the Financial Statements 17
Schedules 1 to 11 and 17 referred to above form an integral part of the Balance Sheet.
In terms of our report of even date For and on behalf of the Board
For Price Waterhouse Ajit dangi ChairmanFirm Registration No. 301112EChartered Accountants K. G. Ananthakrishnan Managing Director
Vilas rane rajesh Marwaha Chief Financial OfficerPartnerMembership No. F-33220 bhavik desai Company Secretary
Mumbai, 21st February, 2011 Mumbai, 21st February, 2011
bAlAnce sheet As At 31st deceMber, 2010
Fulford Accounts & Auditors.indd 32 3/29/2011 9:34:16 AM
33
scheduleYear ended
31st december, 2010 Year ended
31st December, 2009 ` ` ` `
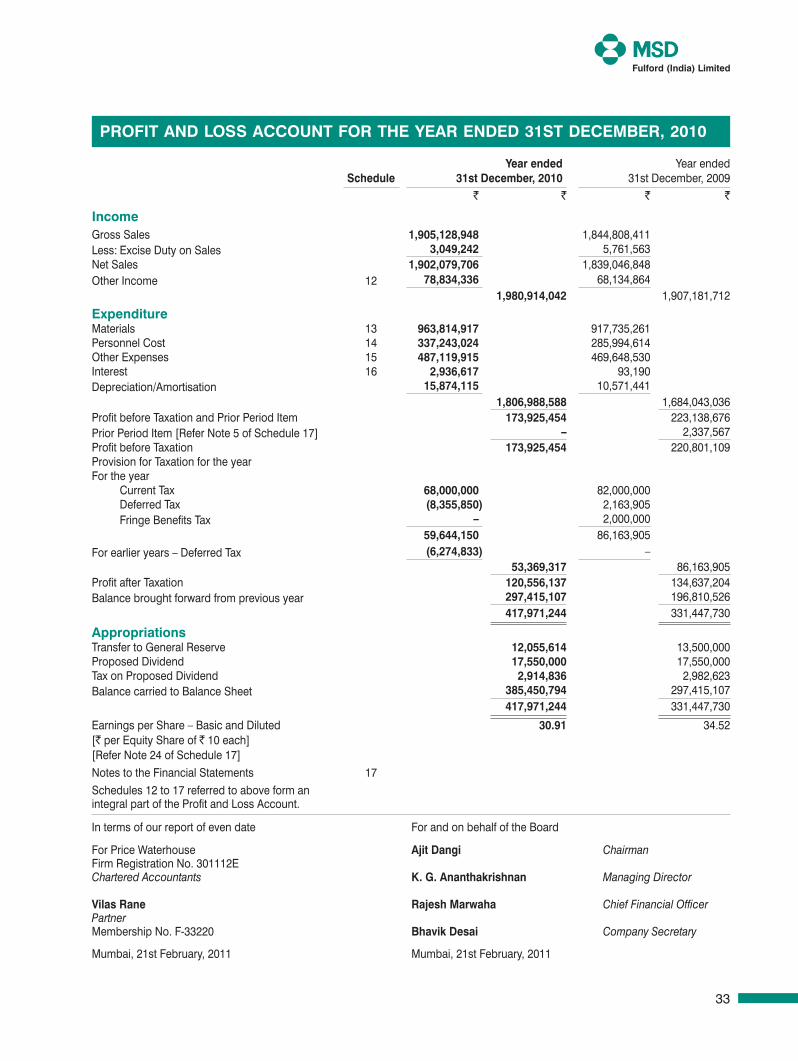
incomeGross Sales 1,905,128,948 1,844,808,411 Less: Excise Duty on Sales 3,049,242 5,761,563 Net Sales 1,902,079,706 1,839,046,848 Other Income 12 78,834,336 68,134,864
1,980,914,042 1,907,181,712
expenditureMaterials 13 963,814,917 917,735,261 Personnel Cost 14 337,243,024 285,994,614 Other Expenses 15 487,119,915 469,648,530 Interest 16 2,936,617 93,190 Depreciation/Amortisation 15,874,115 10,571,441
1,806,988,588 1,684,043,036 Profit before Taxation and Prior Period Item 173,925,454 223,138,676 Prior Period Item [Refer Note 5 of Schedule 17] – 2,337,567 Profit before Taxation 173,925,454 220,801,109 Provision for Taxation for the yearFor the year Current Tax 68,000,000 82,000,000 Deferred Tax (8,355,850) 2,163,905 Fringe Benefits Tax – 2,000,000
59,644,150 86,163,905 For earlier years – Deferred Tax (6,274,833) –
53,369,317 86,163,905 Profit after Taxation 120,556,137 134,637,204 Balance brought forward from previous year 297,415,107 196,810,526
417,971,244 331,447,730
AppropriationsTransfer to General Reserve 12,055,614 13,500,000 Proposed Dividend 17,550,000 17,550,000 Tax on Proposed Dividend 2,914,836 2,982,623 Balance carried to Balance Sheet 385,450,794 297,415,107
417,971,244 331,447,730
Earnings per Share – Basic and Diluted 30.91 34.52 [` per Equity Share of ` 10 each][Refer Note 24 of Schedule 17]Notes to the Financial Statements 17 Schedules 12 to 17 referred to above form anintegral part of the Profit and Loss Account.
In terms of our report of even date For and on behalf of the Board
For Price Waterhouse Ajit dangi ChairmanFirm Registration No. 301112EChartered Accountants K. G. Ananthakrishnan Managing Director
Vilas rane rajesh Marwaha Chief Financial OfficerPartnerMembership No. F-33220 bhavik desai Company Secretary
Mumbai, 21st February, 2011 Mumbai, 21st February, 2011
profit And loss Account for the YeAr ended 31st deceMber, 2010
Fulford Accounts & Auditors.indd 33 3/29/2011 9:34:16 AM
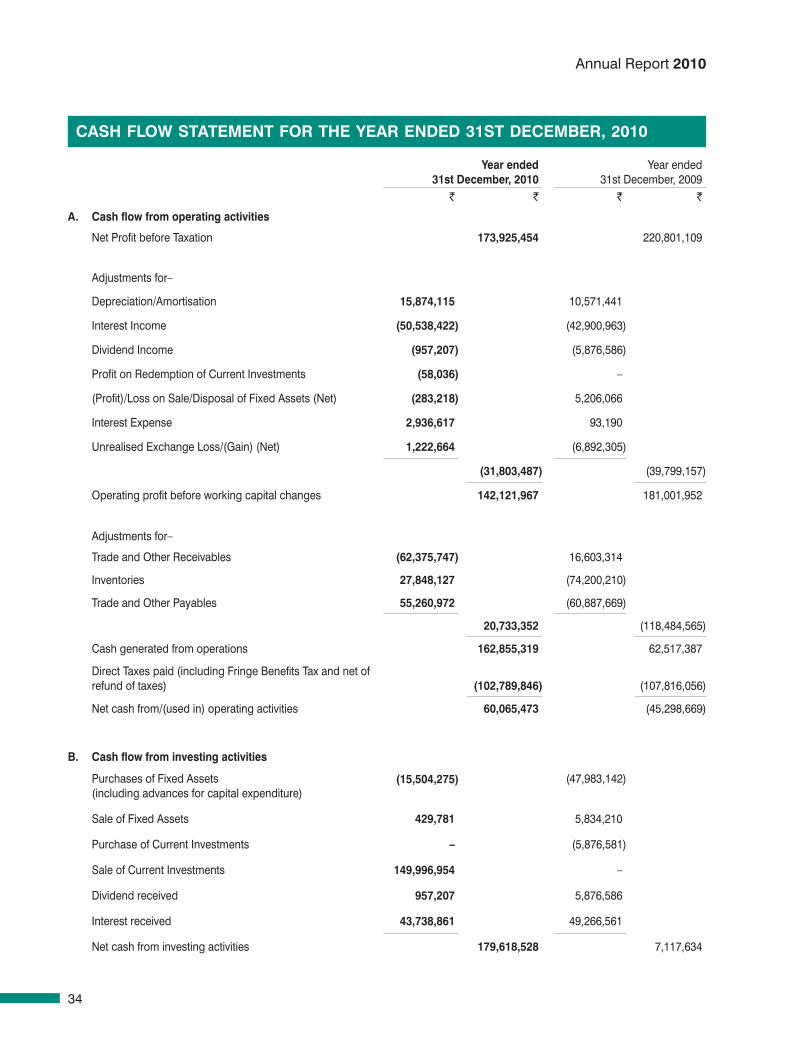
34
Annual Report 2010
Year ended 31st december, 2010
Year ended 31st December, 2009
` ` ` `
A. cash flow from operating activities
Net Profit before Taxation 173,925,454 220,801,109
Adjustments for–
Depreciation/Amortisation 15,874,115 10,571,441
Interest Income (50,538,422) (42,900,963)
Dividend Income (957,207) (5,876,586)
Profit on Redemption of Current Investments (58,036) –
(Profit)/Loss on Sale/Disposal of Fixed Assets (Net) (283,218) 5,206,066
Interest Expense 2,936,617 93,190
Unrealised Exchange Loss/(Gain) (Net) 1,222,664 (6,892,305)
(31,803,487) (39,799,157)
Operating profit before working capital changes 142,121,967 181,001,952
Adjustments for–
Trade and Other Receivables (62,375,747) 16,603,314
Inventories 27,848,127 (74,200,210)
Trade and Other Payables 55,260,972 (60,887,669)
20,733,352 (118,484,565)
Cash generated from operations 162,855,319 62,517,387
Direct Taxes paid (including Fringe Benefits Tax and net of refund of taxes) (102,789,846) (107,816,056)
Net cash from/(used in) operating activities 60,065,473 (45,298,669)
b. cash flow from investing activities
Purchases of Fixed Assets (including advances for capital expenditure)
(15,504,275) (47,983,142)
Sale of Fixed Assets 429,781 5,834,210
Purchase of Current Investments – (5,876,581)
Sale of Current Investments 149,996,954 –
Dividend received 957,207 5,876,586
Interest received 43,738,861 49,266,561
Net cash from investing activities 179,618,528 7,117,634
cAsh flow stAteMent for the YeAr ended 31st deceMber, 2010
cAsh flow stAteMent for the YeAr ended 31st deceMber, 2010
Fulford Accounts & Auditors.indd 34 3/29/2011 9:34:16 AM
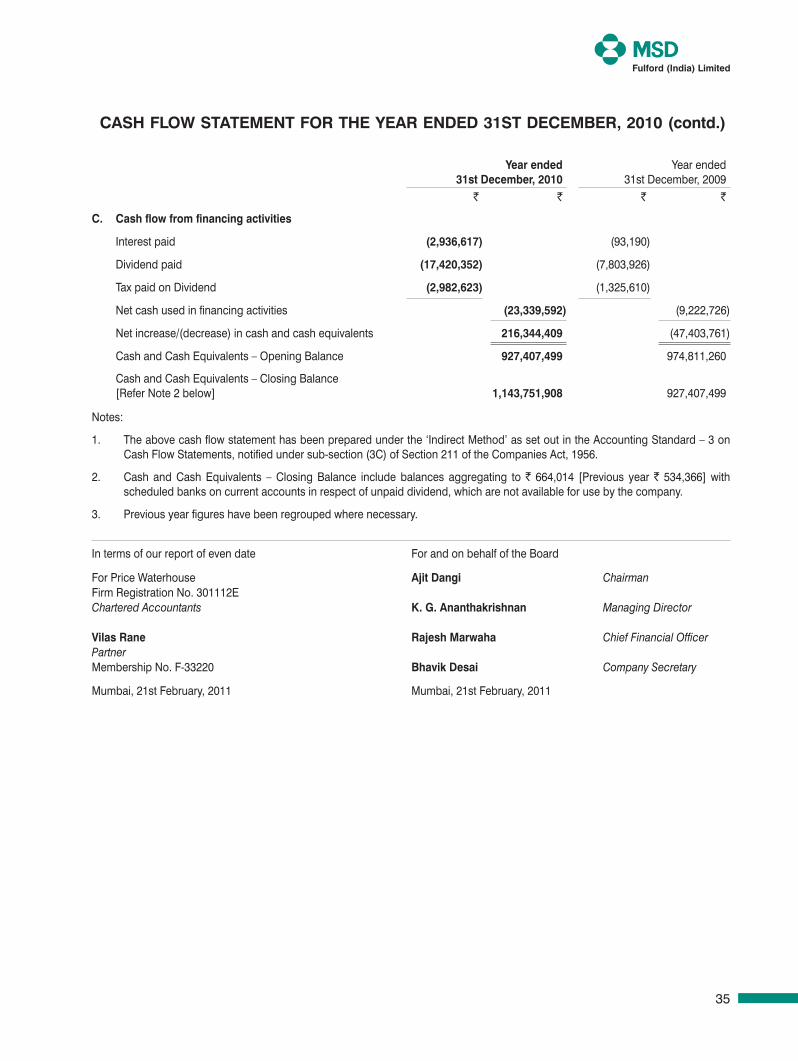
35
Year ended 31st december, 2010
Year ended 31st December, 2009
` ` ` `
c. cash flow from financing activities
Interest paid (2,936,617) (93,190)
Dividend paid (17,420,352) (7,803,926)
Tax paid on Dividend (2,982,623) (1,325,610)
Net cash used in financing activities (23,339,592) (9,222,726)
Net increase/(decrease) in cash and cash equivalents 216,344,409 (47,403,761)
Cash and Cash Equivalents – Opening Balance 927,407,499 974,811,260
Cash and Cash Equivalents – Closing Balance [Refer Note 2 below] 1,143,751,908 927,407,499
Notes:
1. The above cash flow statement has been prepared under the ‘Indirect Method’ as set out in the Accounting Standard – 3 on Cash Flow Statements, notified under sub-section (3C) of Section 211 of the Companies Act, 1956.
2. Cash and Cash Equivalents – Closing Balance include balances aggregating to ` 664,014 [Previous year ` 534,366] with scheduled banks on current accounts in respect of unpaid dividend, which are not available for use by the company.
3. Previous year figures have been regrouped where necessary.
In terms of our report of even date For and on behalf of the Board
For Price Waterhouse Ajit dangi ChairmanFirm Registration No. 301112EChartered Accountants K. G. Ananthakrishnan Managing Director
Vilas rane rajesh Marwaha Chief Financial OfficerPartnerMembership No. F-33220 bhavik desai Company Secretary
Mumbai, 21st February, 2011 Mumbai, 21st February, 2011
cAsh flow stAteMent for the YeAr ended 31st deceMber, 2010 (contd.)
Fulford Accounts & Auditors.indd 35 3/29/2011 9:34:16 AM
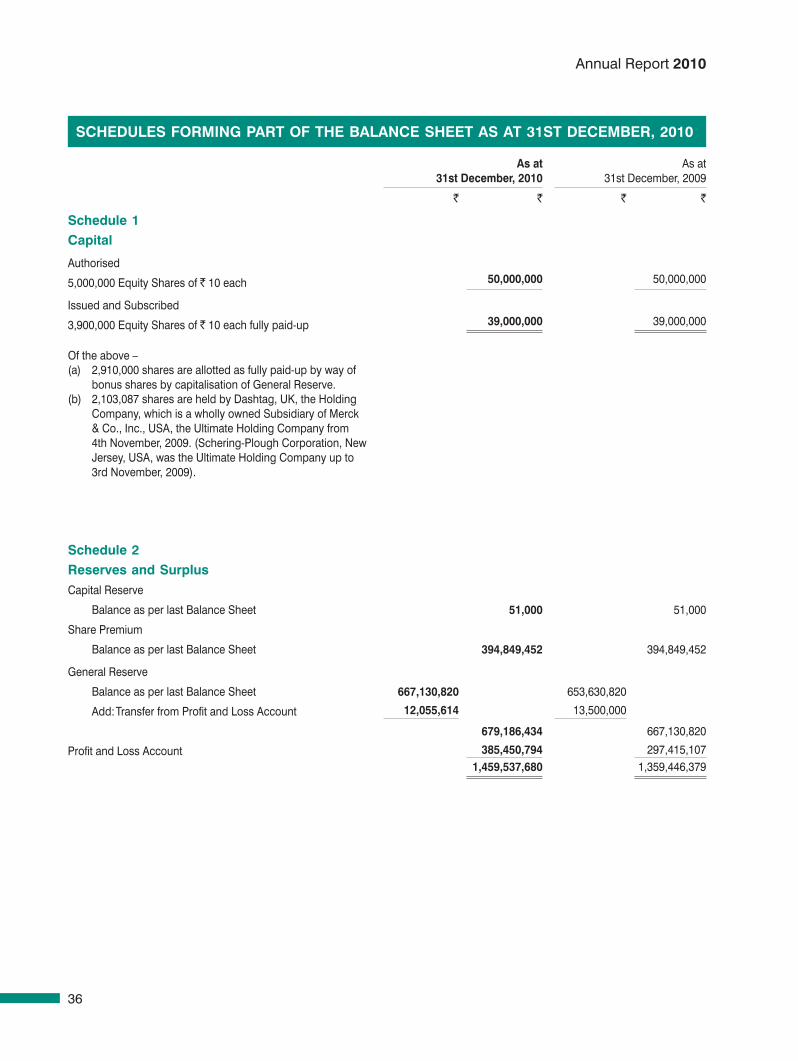
36
Annual Report 2010
As at 31st december, 2010
As at31st December, 2009
` ` ` `
schedule 1capital
Authorised
5,000,000 Equity Shares of ` 10 each 50,000,000 50,000,000
Issued and Subscribed
3,900,000 Equity Shares of ` 10 each fully paid-up 39,000,000 39,000,000
Of the above –(a) 2,910,000 shares are allotted as fully paid-up by way of
bonus shares by capitalisation of General Reserve.(b) 2,103,087 shares are held by Dashtag, UK, the Holding
Company, which is a wholly owned Subsidiary of Merck & Co., Inc., USA, the Ultimate Holding Company from 4th November, 2009. (Schering-Plough Corporation, New Jersey, USA, was the Ultimate Holding Company up to 3rd November, 2009).
schedule 2reserves and surplusCapital Reserve
Balance as per last Balance Sheet 51,000 51,000
Share Premium
Balance as per last Balance Sheet 394,849,452 394,849,452
General Reserve
Balance as per last Balance Sheet 667,130,820 653,630,820
Add: Transfer from Profit and Loss Account 12,055,614 13,500,000
679,186,434 667,130,820
Profit and Loss Account 385,450,794 297,415,107 1,459,537,680 1,359,446,379
schedules forMinG pArt of the bAlAnce sheet As At 31st deceMber, 2010
Fulford Accounts & Auditors.indd 36 3/29/2011 9:34:17 AM
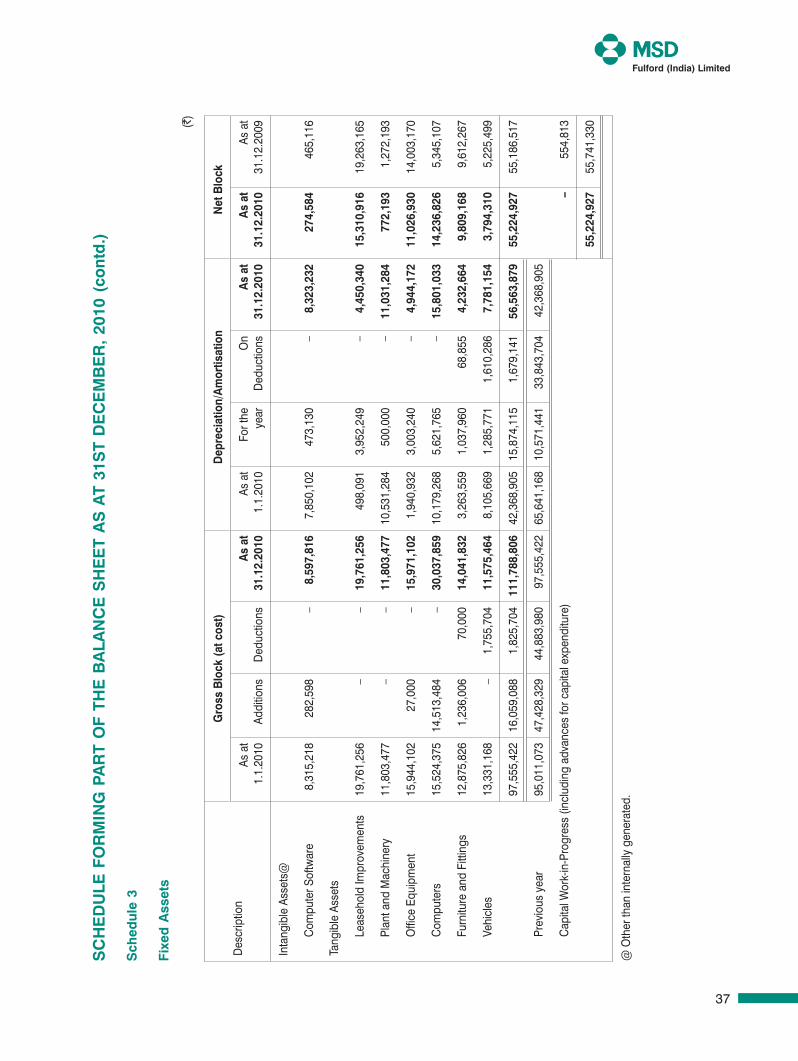
37
sc
he
du
le f
or
Min
G p
Ar
t o
f th
e b
AlA
nc
e s
he
et
As
At
31s
t d
ec
eM
be
r,
2010
(co
ntd
.)
sch
edul
e 3
fixe
d A
sset
s
(`)
Des
crip
tion
Gro
ss b
lock
(at c
ost)
dep
reci
atio
n/A
mor
tisat
ion
net
blo
ck
As a
t 1
.1.2
010
Addi
tions
Ded
uctio
nsA
s at
31.
12.2
010
As a
t 1
.1.2
010
For t
heye
arO
nD
educ
tions
As
at 3
1.12
.201
0A
s at
31.
12.2
010
As a
t 3
1.12
.200
9
Inta
ngib
le A
sset
s@
Com
pute
r Sof
twar
e8,
315,
218
282
,598
–
8
,597
,816
7,
850,
102
473
,130
–
8
,323
,232
27
4,58
4 46
5,11
6
Tang
ible
Ass
ets
Leas
ehol
d Im
prov
emen
ts19
,761
,256
–
–
1
9,76
1,25
6 49
8,09
1 3
,952
,249
–
4
,450
,340
15
,310
,916
19
,263
,165
Plan
t and
Mac
hine
ry11
,803
,477
–
–
1
1,80
3,47
7 1
0,53
1,28
4 5
00,0
00
–
11,
031,
284
772,
193
1,27
2,19
3
Offi
ce E
quip
men
t15
,944
,102
2
7,00
0 –
1
5,97
1,10
2 1
,940
,932
3
,003
,240
–
4
,944
,172
11
,026
,930
14
,003
,170
Com
pute
rs15
,524
,375
1
4,51
3,48
4 –
3
0,03
7,85
9 1
0,17
9,26
8 5
,621
,765
–
1
5,80
1,03
3 14
,236
,826
5,
345,
107
Furn
iture
and
Fitt
ings
12,8
75,8
26
1,2
36,0
06
70,
000
14,
041,
832
3,2
63,5
59
1,0
37,9
60
68,
855
4,2
32,6
64
9,80
9,16
8 9,
612,
267
Vehi
cles
13,3
31,1
68
–
1,7
55,7
04
11,
575,
464
8,1
05,6
69
1,2
85,7
71
1,6
10,2
86
7,7
81,1
54
3,79
4,31
0 5,
225,
499
97,5
55,4
22
16,0
59,0
88
1,8
25,7
04
111,
788,
806
42,3
68,9
05
15,
874,
115
1,67
9,14
1 56
,563
,879
55
,224
,927
55
,186
,517
Prev
ious
yea
r95
,011
,073
47
,428
,329
44
,883
,980
97
,555
,422
65
,641
,168
10
,571
,441
33
,843
,704
42
,368
,905
Cap
ital W
ork-
in-P
rogr
ess
(incl
udin
g ad
vanc
es fo
r cap
ital e
xpen
ditu
re)
–
554
,813
55,
224,
927
55,
741,
330
@ O
ther
than
inte
rnal
ly g
ener
ated
.
Fulford Accounts & Auditors.indd 37 3/29/2011 9:34:17 AM
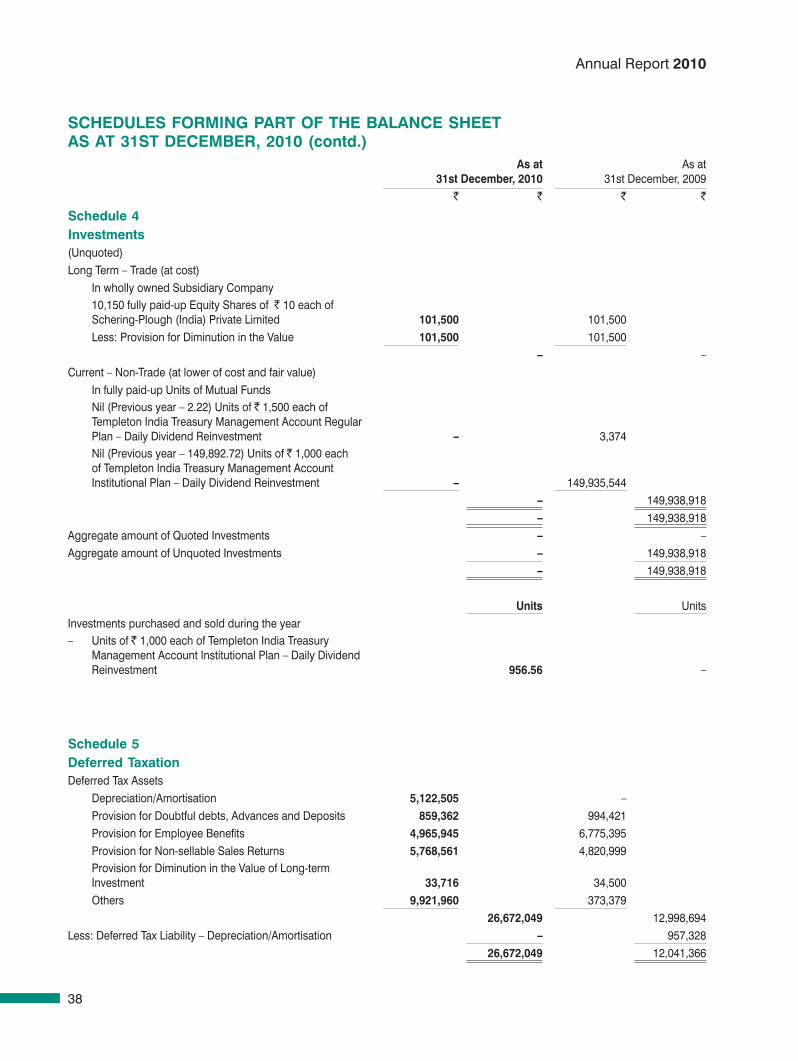
38
Annual Report 2010
As at 31st december, 2010
As at31st December, 2009
` ` ` `
schedule 4investments(Unquoted)Long Term – Trade (at cost)
In wholly owned Subsidiary Company10,150 fully paid-up Equity Shares of ` 10 each of Schering-Plough (India) Private Limited 101,500 101,500 Less: Provision for Diminution in the Value 101,500 101,500
– – Current – Non-Trade (at lower of cost and fair value)
In fully paid-up Units of Mutual FundsNil (Previous year – 2.22) Units of ` 1,500 each of Templeton India Treasury Management Account Regular Plan – Daily Dividend Reinvestment – 3,374 Nil (Previous year – 149,892.72) Units of ` 1,000 each of Templeton India Treasury Management Account Institutional Plan – Daily Dividend Reinvestment – 149,935,544
– 149,938,918 – 149,938,918
Aggregate amount of Quoted Investments – – Aggregate amount of Unquoted Investments – 149,938,918
– 149,938,918
units Units Investments purchased and sold during the year– Units of ` 1,000 each of Templeton India Treasury
Management Account Institutional Plan – Daily Dividend Reinvestment 956.56 –
schedule 5deferred taxationDeferred Tax Assets
Depreciation/Amortisation 5,122,505 – Provision for Doubtful debts, Advances and Deposits 859,362 994,421 Provision for Employee Benefits 4,965,945 6,775,395 Provision for Non-sellable Sales Returns 5,768,561 4,820,999 Provision for Diminution in the Value of Long-term Investment 33,716 34,500 Others 9,921,960 373,379
26,672,049 12,998,694 Less: Deferred Tax Liability – Depreciation/Amortisation – 957,328
26,672,049 12,041,366
schedules forMinG pArt of the bAlAnce sheet As At 31st deceMber, 2010 (contd.)
Fulford Accounts & Auditors.indd 38 3/29/2011 9:34:17 AM
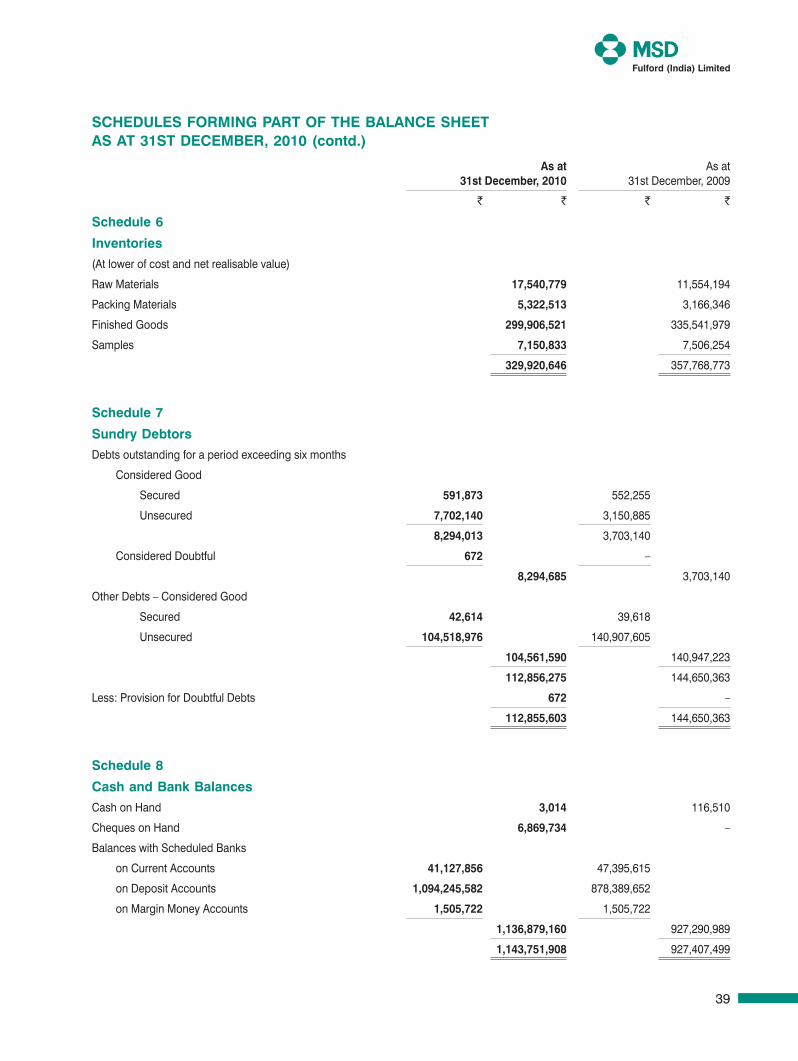
39
schedules forMinG pArt of the bAlAnce sheet As At 31st deceMber, 2010 (contd.)
As at 31st december, 2010
As at31st December, 2009
` ` ` `
schedule 6
inventories
(At lower of cost and net realisable value)
Raw Materials 17,540,779 11,554,194
Packing Materials 5,322,513 3,166,346
Finished Goods 299,906,521 335,541,979
Samples 7,150,833 7,506,254
329,920,646 357,768,773
schedule 7
sundry debtors
Debts outstanding for a period exceeding six months
Considered Good
Secured 591,873 552,255
Unsecured 7,702,140 3,150,885
8,294,013 3,703,140
Considered Doubtful 672 –
8,294,685 3,703,140
Other Debts – Considered Good
Secured 42,614 39,618
Unsecured 104,518,976 140,907,605
104,561,590 140,947,223
112,856,275 144,650,363
Less: Provision for Doubtful Debts 672 –
112,855,603 144,650,363
schedule 8
cash and bank balances
Cash on Hand 3,014 116,510
Cheques on Hand 6,869,734 –
Balances with Scheduled Banks
on Current Accounts 41,127,856 47,395,615
on Deposit Accounts 1,094,245,582 878,389,652
on Margin Money Accounts 1,505,722 1,505,722
1,136,879,160 927,290,989
1,143,751,908 927,407,499
Fulford Accounts & Auditors.indd 39 3/29/2011 9:34:17 AM
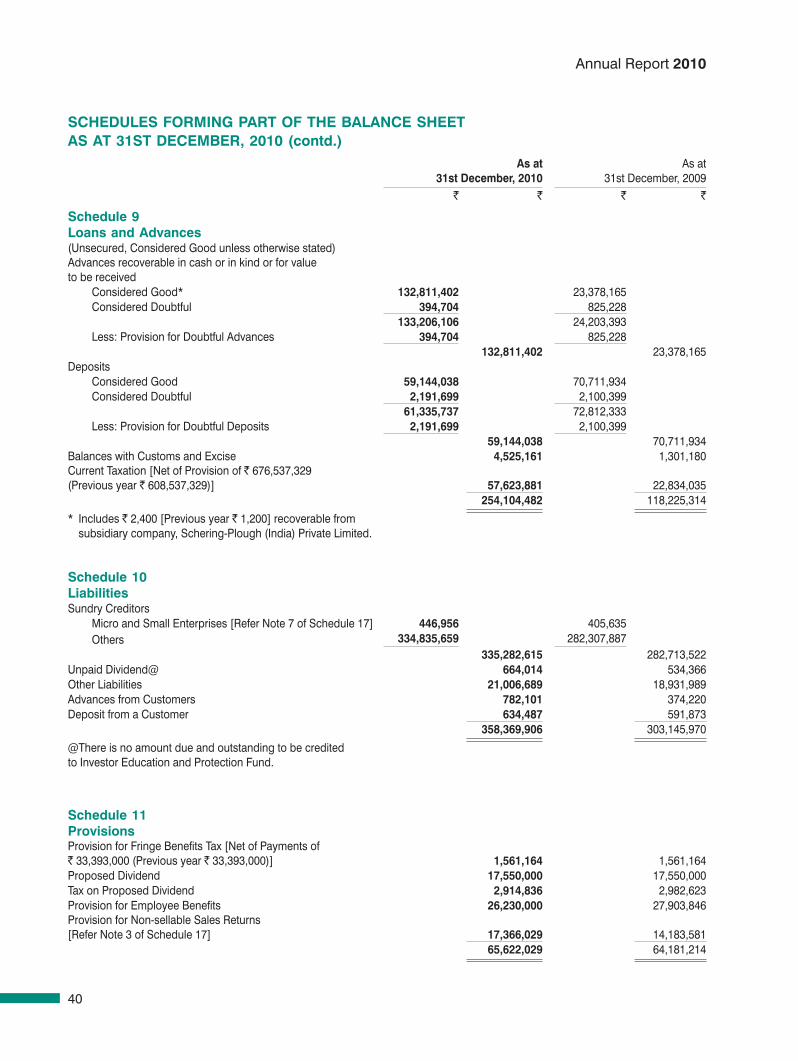
40
Annual Report 2010
As at 31st december, 2010
As at31st December, 2009
` ` ` `
schedule 9loans and Advances(Unsecured, Considered Good unless otherwise stated)Advances recoverable in cash or in kind or for value to be received
Considered Good* 132,811,402 23,378,165 Considered Doubtful 394,704 825,228
133,206,106 24,203,393 Less: Provision for Doubtful Advances 394,704 825,228
132,811,402 23,378,165 Deposits
Considered Good 59,144,038 70,711,934 Considered Doubtful 2,191,699 2,100,399
61,335,737 72,812,333 Less: Provision for Doubtful Deposits 2,191,699 2,100,399
59,144,038 70,711,934 Balances with Customs and Excise 4,525,161 1,301,180 Current Taxation [Net of Provision of ` 676,537,329 (Previous year ` 608,537,329)] 57,623,881 22,834,035
254,104,482 118,225,314
* Includes ` 2,400 [Previous year ` 1,200] recoverable from subsidiary company, Schering-Plough (India) Private Limited.
schedules forMinG pArt of the bAlAnce sheet As At 31st deceMber, 2010 (contd.)
schedule 10liabilitiesSundry Creditors
Micro and Small Enterprises [Refer Note 7 of Schedule 17] 446,956 405,635 Others 334,835,659 282,307,887
335,282,615 282,713,522 Unpaid Dividend@ 664,014 534,366 Other Liabilities 21,006,689 18,931,989 Advances from Customers 782,101 374,220 Deposit from a Customer 634,487 591,873
358,369,906 303,145,970
@There is no amount due and outstanding to be credited to Investor Education and Protection Fund.
schedule 11provisionsProvision for Fringe Benefits Tax [Net of Payments of ` 33,393,000 (Previous year ` 33,393,000)] 1,561,164 1,561,164 Proposed Dividend 17,550,000 17,550,000 Tax on Proposed Dividend 2,914,836 2,982,623 Provision for Employee Benefits 26,230,000 27,903,846 Provision for Non-sellable Sales Returns [Refer Note 3 of Schedule 17] 17,366,029 14,183,581
65,622,029 64,181,214
Fulford Accounts & Auditors.indd 40 3/29/2011 9:34:17 AM
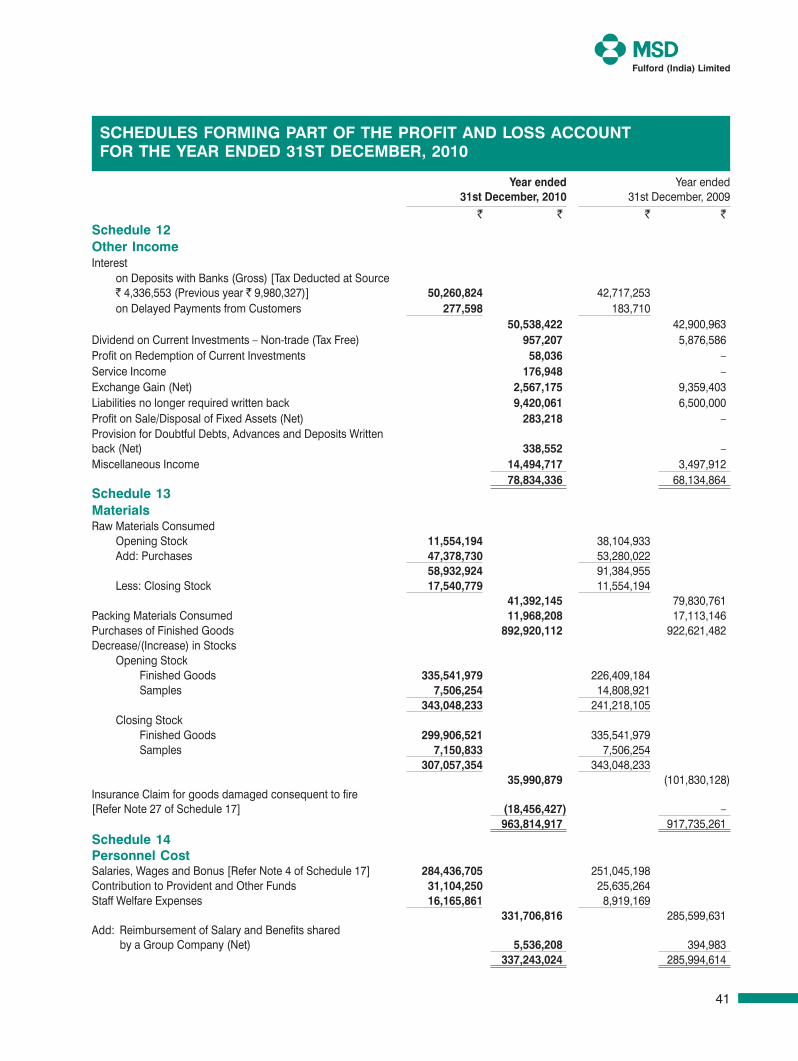
41
Year ended 31st december, 2010
Year ended31st December, 2009
` ` ` ` schedule 12other incomeInterest
on Deposits with Banks (Gross) [Tax Deducted at Source ` 4,336,553 (Previous year ` 9,980,327)] 50,260,824 42,717,253 on Delayed Payments from Customers 277,598 183,710
50,538,422 42,900,963 Dividend on Current Investments – Non-trade (Tax Free) 957,207 5,876,586 Profit on Redemption of Current Investments 58,036 – Service Income 176,948 – Exchange Gain (Net) 2,567,175 9,359,403 Liabilities no longer required written back 9,420,061 6,500,000 Profit on Sale/Disposal of Fixed Assets (Net) 283,218 – Provision for Doubtful Debts, Advances and Deposits Written back (Net) 338,552 – Miscellaneous Income 14,494,717 3,497,912
78,834,336 68,134,864 schedule 13MaterialsRaw Materials Consumed
Opening Stock 11,554,194 38,104,933 Add: Purchases 47,378,730 53,280,022
58,932,924 91,384,955 Less: Closing Stock 17,540,779 11,554,194
41,392,145 79,830,761 Packing Materials Consumed 11,968,208 17,113,146 Purchases of Finished Goods 892,920,112 922,621,482 Decrease/(Increase) in Stocks
Opening Stock Finished Goods 335,541,979 226,409,184 Samples 7,506,254 14,808,921
343,048,233 241,218,105 Closing Stock Finished Goods 299,906,521 335,541,979 Samples 7,150,833 7,506,254
307,057,354 343,048,233 35,990,879 (101,830,128)
Insurance Claim for goods damaged consequent to fire [Refer Note 27 of Schedule 17] (18,456,427) –
963,814,917 917,735,261 schedule 14personnel costSalaries, Wages and Bonus [Refer Note 4 of Schedule 17] 284,436,705 251,045,198Contribution to Provident and Other Funds 31,104,250 25,635,264 Staff Welfare Expenses 16,165,861 8,919,169
331,706,816 285,599,631 Add: Reimbursement of Salary and Benefits shared
by a Group Company (Net) 5,536,208 394,983 337,243,024 285,994,614
schedules forMinG pArt of the profit And loss Account for the YeAr ended 31st deceMber, 2010
Fulford Accounts & Auditors.indd 41 3/29/2011 9:34:17 AM
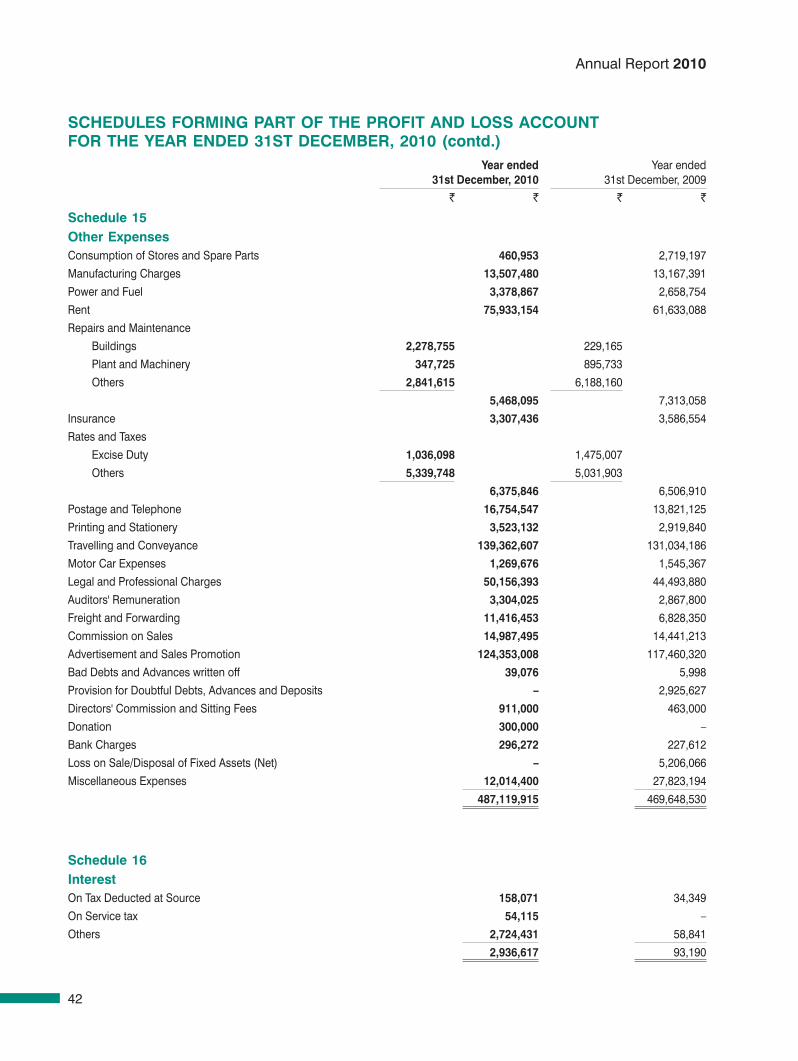
42
Annual Report 2010
schedules forMinG pArt of the profit And loss Account for the YeAr ended 31st deceMber, 2010 (contd.)
Year ended 31st december, 2010
Year ended31st December, 2009
` ` ` `
schedule 15other expensesConsumption of Stores and Spare Parts 460,953 2,719,197
Manufacturing Charges 13,507,480 13,167,391
Power and Fuel 3,378,867 2,658,754
Rent 75,933,154 61,633,088
Repairs and Maintenance
Buildings 2,278,755 229,165
Plant and Machinery 347,725 895,733
Others 2,841,615 6,188,160
5,468,095 7,313,058
Insurance 3,307,436 3,586,554
Rates and Taxes
Excise Duty 1,036,098 1,475,007
Others 5,339,748 5,031,903
6,375,846 6,506,910
Postage and Telephone 16,754,547 13,821,125
Printing and Stationery 3,523,132 2,919,840
Travelling and Conveyance 139,362,607 131,034,186
Motor Car Expenses 1,269,676 1,545,367
Legal and Professional Charges 50,156,393 44,493,880
Auditors' Remuneration 3,304,025 2,867,800
Freight and Forwarding 11,416,453 6,828,350
Commission on Sales 14,987,495 14,441,213
Advertisement and Sales Promotion 124,353,008 117,460,320
Bad Debts and Advances written off 39,076 5,998
Provision for Doubtful Debts, Advances and Deposits – 2,925,627
Directors' Commission and Sitting Fees 911,000 463,000
Donation 300,000 –
Bank Charges 296,272 227,612
Loss on Sale/Disposal of Fixed Assets (Net) – 5,206,066
Miscellaneous Expenses 12,014,400 27,823,194
487,119,915 469,648,530
schedule 16interestOn Tax Deducted at Source 158,071 34,349
On Service tax 54,115 –
Others 2,724,431 58,841
2,936,617 93,190
Fulford Accounts & Auditors.indd 42 3/29/2011 9:34:18 AM
43
schedule 17notes to the financial statements1. significant Accounting policies
The financial statements are prepared to comply in all material aspects with the applicable accounting principles in India, the accounting standards notified under sub-section (3C) of Section 211 of the Companies Act, 1956 (the ‘Act’) and the other relevant provisions of the Act. The significant accounting policies are as follows–
(a) Basis of Accounting
The financial statements are prepared in accordance with the historical cost convention.
(b) Fixed Assets
Fixed assets are stated at cost of acquisition, including any attributable cost for bringing the asset to its working condition for its intended use, less accumulated depreciation and impairment loss.
Depreciation is provided on Straight Line Method, pro-rata to the period of use, at the rates specified in Schedule XIV of the Act or the rates based on useful lives of the assets as estimated by the management, whichever are higher. The rates based on useful lives of the assets in the following categories are estimated to be higher than those specified in Schedule XIV of the Act:
Description %Leasehold Improvements 20Plant and Machinery 15Office Equipment 15 or 20Computers 20 or 33.33Furniture and Fittings 8.33 or 10Vehicles 20
Fixed assets costing ` 5,000 or less are fully depreciated in the year of acquisition. A nominal value of ` 1 is assigned to fully depreciated assets.
Intangible assets consisting of computer software are recorded at their cost of acquisition and are amortised over the useful life of three years, as estimated by the management.
Impairment loss is provided to the extent the carrying amount of assets exceed their recoverable amount. Recoverable amount is the higher of an asset’s net selling price and its value in use. Value in use is the present value of estimated future cash flows expected to arise from the continuing use of an asset and from its disposal at the end of its useful life. Net selling price is the amount obtainable from the sale of an asset in an arm’s length transaction between knowledgeable, willing parties, less the costs of disposal.
(c) Investments Long-term Investments are stated at cost. Provision is made to recognise a decline, other than temporary, in the value of
Long-term Investments. Current Investments are stated at lower of cost and fair value.
(d) Inventories Inventories are valued at lower of cost and net realisable value. Cost is determined on First In First Out basis. Cost of
work-in-progress and finished goods includes manufacturing overheads, where applicable.
(e) Foreign Currency Transactions
Foreign currency transactions are recorded at the exchange rates prevailing on the date of the transaction. Gains and losses arising out of subsequent fluctuations are accounted for on actual payment or realisation. Monetary items denominated in foreign currency as at the Balance Sheet date are converted at the exchange rates prevailing on that date. Exchange differences are recognised in the Profit and Loss Account.
(f) Revenue Recognition Sales are recognised when goods are supplied to customers and are recorded net of excise duty, sales tax, rebates and
trade discounts.
schedule forMinG pArt of the finAnciAl stAteMents for the YeAr ended 31st deceMber, 2010
Fulford Accounts & Auditors.indd 43 3/29/2011 9:34:18 AM
44
Annual Report 2010
Provision is made for the non-sellable returns of goods from the customers estimated on the basis of historical data of such returns. Such provision for non-sellable sales returns is reduced from sales for the year.
Dividend income is recognised when the right to receive dividend is established.
(g) Employee Benefits
(i) Long-term Employee Benefits
In case of Defined Contribution plans, the company's contributions to these plans are charged to the Profit and Loss Account as incurred. Liability for Defined Benefit plan is provided on the basis of valuation, as at the Balance Sheet date, carried out by an independent actuary. The actuarial valuation method used for measuring the liability is the Projected Unit Credit method. The obligations are measured as the present value of estimated future cash flows discounted at rates reflecting the prevailing market yields of Indian Government securities as at the Balance Sheet date for the estimated term of the obligations. The estimate of future salary increases considered takes into account the inflation, seniority, promotion and other relevant factors. The expected rate of return of plan assets is the company's expectation of the average long term rate of return expected on investments of the fund during the estimated term of the obligations.
Plan assets are measured at fair value as at the Balance Sheet date. The liability for leave encashment is provided on the basis of valuation, as at Balance Sheet date, carried out by an independent actuary. The actuarial valuation method used for measuring the liability is the Projected Unit Credit method.
(ii) Actuarial gains and losses comprise experience adjustments and the effects of changes in actuarial assumptions and are recognised immediately in the Profit and Loss Account as income or expense.
(h) Taxes on Income
Current tax is determined as the amount of tax payable in respect of estimated taxable income for the year.
Deferred tax is recognised, subject to the consideration of prudence in respect of deferred tax assets, on timing differences, being the difference between taxable income and accounting income that originate in one period and are capable of reversal in one or more subsequent periods.
As at31st december, 2010
As at31st December, 2009
` `2. Contingent Liabilities:
(a) Claims against the company not acknowledged as debtsIncome-tax Matters – Matters decided against the company in respect of which the company has preferred an appeal 150,844,649 81,691,351 Fringe Benefits Tax Matter 128,412 – Claim from a third party manufacturer in respect of Excise Matter – 6,282,782 Purchase Commitment Charges from a Supplier 42,029,000 42,029,000 Employee related Matters 4,946,648 4,017,512 Others 388,994 388,994
(b) Guarantees issued by Banks on behalf of the company 2,232,722 1,562,722
Notes:
(i) Future cash outflows in respect of (a) above are determinable only on receipt of judgements/decisions pending with various authorities/forums and/or final outcome of the matters.
(ii) Future cash outflows in respect of (b) above are dependant on the future performance of the obligations by the Company and/or other parties.
schedule forMinG pArt of the finAnciAl stAteMents for the YeAr ended 31st deceMber, 2010 (contd.)
Fulford Accounts & Auditors.indd 44 3/29/2011 9:34:18 AM

45
As at31st december, 2010
As at31st December, 2009
` `
3. Provision for Non-sellable Sales Returns
As at 1st January 14,183,581 6,956,935
Provision made during the year 21,277,500 23,888,600
Amounts used during the year 18,095,052 16,661,954
As at 31st December 17,366,029 14,183,581
4. Salaries, Wages and Bonus include ` 1,561,806 [Previous year ` 7,972,120] paid to employees as severance pay.
5. During the previous year, the company had received a show cause notice from the Regional Provident Fund Commissioner (Exemption) on completion of assessment, directing the company to deposit Employee Deposit Linked Insurance Charges pertaining to earlier years. The company had accrued for an estimated liability of ` 2,337,567 in respect of the same in the previous year which has been paid during the year.
6. Excise duty relating to difference between closing stock and opening stock and other adjustments is included in Schedule 15 – Other Expenses. Excise duty relating to sales is reduced from Gross Sales.
7. Disclosures as required by the Micro, Small and Medium Enterprises Development Act, 2006 are as under:
Year ended 31st december,
2010 2009
` `
(a) The principal amount and the interest due thereon remaining unpaid to suppliers
(i) Principal 386,881 354,794
(ii) Interest due thereon 60,075 50,841
446,956 405,635
(b) (i) The delayed payments of principal amount paid beyond the appointed date during the entire accounting year 1,670,436 1,827,669
(ii) Interest actually paid under Section 16 of the Micro, Small and Medium Enterprises Development Act, 2006 – –
(c) (i) Normal Interest accrued during the year, for all the delayed payments, as per the agreed terms – –
(ii) Normal Interest payable for the year of delay in making payment, as per the agreed terms – –
(d) (i) Total Interest accrued during the year 9,234 50,841
(ii) Total Interest accrued during the year and remaining unpaid 9,234 50,841
(e) Included in (d) above is – Nil (Previous year – Nil) being interest on amounts outstanding as at the beginning of the accounting year.
The above information and that given in Schedule 10 – Liabilities regarding Micro and Small Enterprises has been determined to the extent such parties have been identified on the basis of information available with the company. This has been relied upon by the auditors.
schedule forMinG pArt of the finAnciAl stAteMents for the YeAr ended 31st deceMber, 2010 (contd.)
Fulford Accounts & Auditors.indd 45 3/29/2011 9:34:18 AM
46
Annual Report 2010
unitYear ended
31st december, 2010Year ended
31st December, 2009Quantity ` Quantity `
8. Consumption of Raw MaterialsAntibiotics Kilo Grams 678 37,575,914 771 67,837,050 Steroids Kilo Grams 1 1,205,318 9,659 3,158,311 Emollients and Protectives Kilo Grams 380 440,341 2,279 2,407,402 Others – 2,170,572 6,427,998
41,392,145 79,830,761
% ` % `
Imported 94.71 39,201,208 91.08 72,706,872 Indigenous 5.29 2,190,937 8.92 7,123,889
100.00 41,392,145 100.00 79,830,761
Notes:
(a) Consumption of Raw Materials represents consumption by third parties under contract with the company and consumption in respect of samples.
(b) Components and spare parts referred to in paragraph 4D(c) of Part II of Schedule VI of the Act are assumed to be those forming part of the finished goods produced and not those used for maintenance of plant and machinery.
Year ended 31st December, Year ended 31st December,2010 2009 2010 2009
unit installed capacity Production@Quantity Quantity Quantity Quantity
9. Capacities and Production#Formulations
Injectables Litres – – 16,765 18,856 Tablets Million Nos. – – – 30 Liquids Litres – – 19,403 41,508
# Licensed Capacity is not applicable as industrial licensing has been abolished for all Bulk Drugs, Intermediates and their Formulations vide Press Note No. 4 (1994 Series) dated 25th October, 1994 issued by the Department of Industrial Development, Ministry of Industry, Government of India.
@ Represents quantities produced by third parties under contract with the Company and includes samples.
unitYear ended
31st december, 2010Year ended
31st December, 2009Quantity ` Quantity `
10. Sales*Formulations
Creams and Ointments Kilo Grams 228,554 746,904,934 240,759 751,956,509 Injectables Mg Vials 76,020 745,488,483 72,104 662,816,625
Litres 16,541 69,008,523 16,701 97,113,423 MIU 3,369 25,112,977 2,768 21,037,837
Tablets Million Nos. 111 137,101,445 118 147,179,764 Capsules Each 1,424,170 117,900,443 1,189,121 94,200,707 Liquids Litres 94,374 63,612,143 96,314 70,503,546
1,905,128,948 1,844,808,411 *Sales quantities include free issues.
schedule forMinG pArt of the finAnciAl stAteMents for the YeAr ended 31st deceMber, 2010 (contd.)
Fulford Accounts & Auditors.indd 46 3/29/2011 9:34:18 AM
47
unitYear ended
31st december, 2010Year ended
31st December, 2009Quantity ` Quantity `
11. Purchases of Finished GoodsFormulations
Creams and Ointments Kilo Grams 249,471 264,539,139 257,883 232,799,372 Injectables Mg Vials 70,851 423,837,416 88,420 512,397,322
MIU 3,739 27,525,811 3,191 26,877,431 Tablets Million Nos. 137 62,126,368 83 27,937,995 Capsules Each 1,110,891 66,626,960 1,358,377 84,488,121 Liquids Litres 121,901 48,264,418 96,133 38,121,241
892,920,112 922,621,482 12. Opening Stock
FormulationsCreams and Ointments Kilo Grams 43,858 37,606,224 41,460 38,917,703 Injectables Mg Vials 37,822 192,551,012 21,669 125,191,840
Litres 3,150 36,131,540 2,393 24,334,113 MIU 840 7,628,759 542 4,550,457
Tablets Million Nos. 15 13,427,275 25 27,219,139 Capsules Each 460,799 38,716,987 290,698 11,840,487 Liquids Litres 37,150 16,986,436 20,573 9,164,366
343,048,233 241,218,105 13. Closing Stock@
FormulationsCreams and Ointments Kilo Grams 52,726 51,160,906 43,858 37,606,224 Injectables Mg Vials 32,289 141,241,565 37,822 192,551,012
Litres 2,538 25,745,275 3,150 36,131,540 MIU 1,189 9,210,605 840 7,628,759
Tablets Million Nos. 31 28,119,829 15 13,427,275 Capsules Each 140,506 32,824,317 460,799 38,716,987 Liquids Litres 49,926 18,754,857 37,150 16,986,436
307,057,354 343,048,233
@ Net of date expired stocks, damages, in-transit breakages, etc.
Year ended31st december, 2010
Year ended31st December, 2009
` `14. Managerial Remuneration*@
Salary and Allowances 5,201,433 7,851,963
Contribution to Provident and Other Funds 613,811 919,335
Perquisites 42,111 323,986
Commission 600,000 300,000
Sitting Fees 311,000 163,000 6,768,355 9,558,284
* Excludes provision for gratuity and leave encashment as there are determined on an overall basis.
@ Net of amount recovered from MSD Pharmaceuticals Private Limited by way of cross charging arrangement.
schedule forMinG pArt of the finAnciAl stAteMents for the YeAr ended 31st deceMber, 2010 (contd.)
Fulford Accounts & Auditors.indd 47 3/29/2011 9:34:18 AM
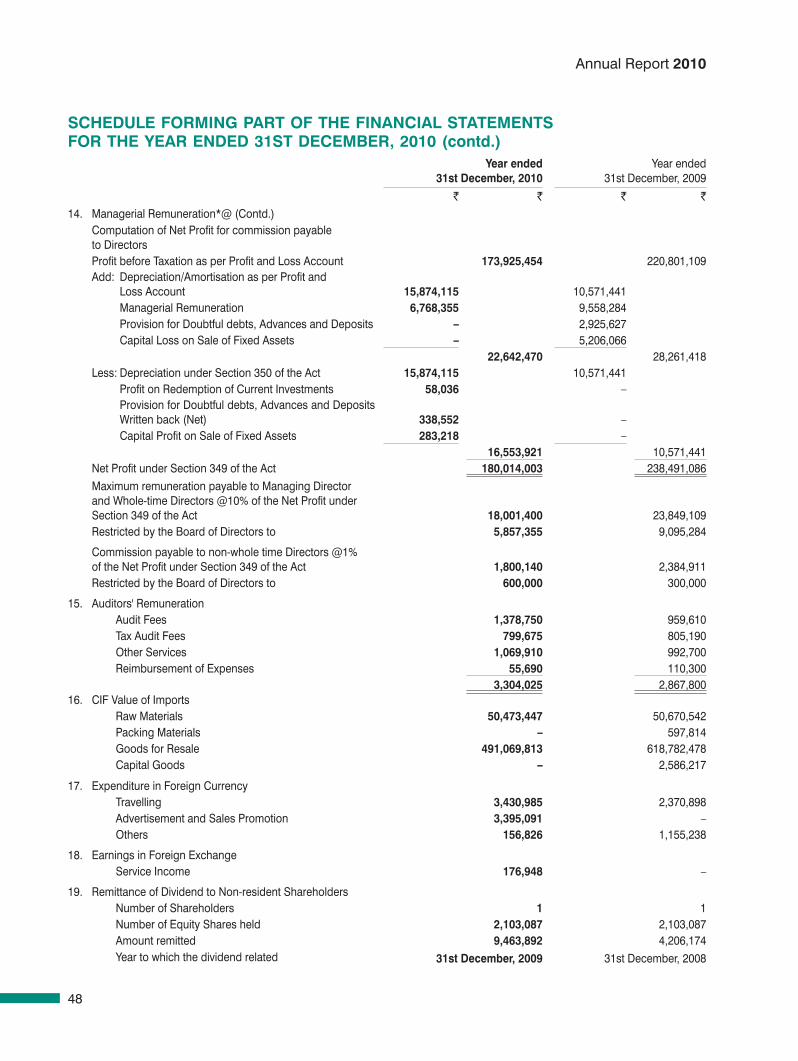
48
Annual Report 2010
Year ended31st december, 2010
Year ended31st December, 2009
` ` ` `14. Managerial Remuneration*@ (Contd.)
Computation of Net Profit for commission payable to DirectorsProfit before Taxation as per Profit and Loss Account 173,925,454 220,801,109 Add: Depreciation/Amortisation as per Profit and
Loss Account 15,874,115 10,571,441 Managerial Remuneration 6,768,355 9,558,284 Provision for Doubtful debts, Advances and Deposits – 2,925,627 Capital Loss on Sale of Fixed Assets – 5,206,066
22,642,470 28,261,418 Less: Depreciation under Section 350 of the Act 15,874,115 10,571,441 Profit on Redemption of Current Investments 58,036 – Provision for Doubtful debts, Advances and Deposits
Written back (Net) 338,552 – Capital Profit on Sale of Fixed Assets 283,218 –
16,553,921 10,571,441 Net Profit under Section 349 of the Act 180,014,003 238,491,086 Maximum remuneration payable to Managing Director and Whole-time Directors @10% of the Net Profit under Section 349 of the Act 18,001,400 23,849,109 Restricted by the Board of Directors to 5,857,355 9,095,284
Commission payable to non-whole time Directors @1% of the Net Profit under Section 349 of the Act 1,800,140 2,384,911 Restricted by the Board of Directors to 600,000 300,000
15. Auditors' RemunerationAudit Fees 1,378,750 959,610 Tax Audit Fees 799,675 805,190 Other Services 1,069,910 992,700 Reimbursement of Expenses 55,690 110,300
3,304,025 2,867,800 16. CIF Value of Imports
Raw Materials 50,473,447 50,670,542 Packing Materials – 597,814 Goods for Resale 491,069,813 618,782,478 Capital Goods – 2,586,217
17. Expenditure in Foreign CurrencyTravelling 3,430,985 2,370,898 Advertisement and Sales Promotion 3,395,091 – Others 156,826 1,155,238
18. Earnings in Foreign ExchangeService Income 176,948 –
19. Remittance of Dividend to Non-resident ShareholdersNumber of Shareholders 1 1 Number of Equity Shares held 2,103,087 2,103,087 Amount remitted 9,463,892 4,206,174 Year to which the dividend related 31st december, 2009 31st December, 2008
schedule forMinG pArt of the finAnciAl stAteMents for the YeAr ended 31st deceMber, 2010 (contd.)
Fulford Accounts & Auditors.indd 48 3/29/2011 9:34:18 AM
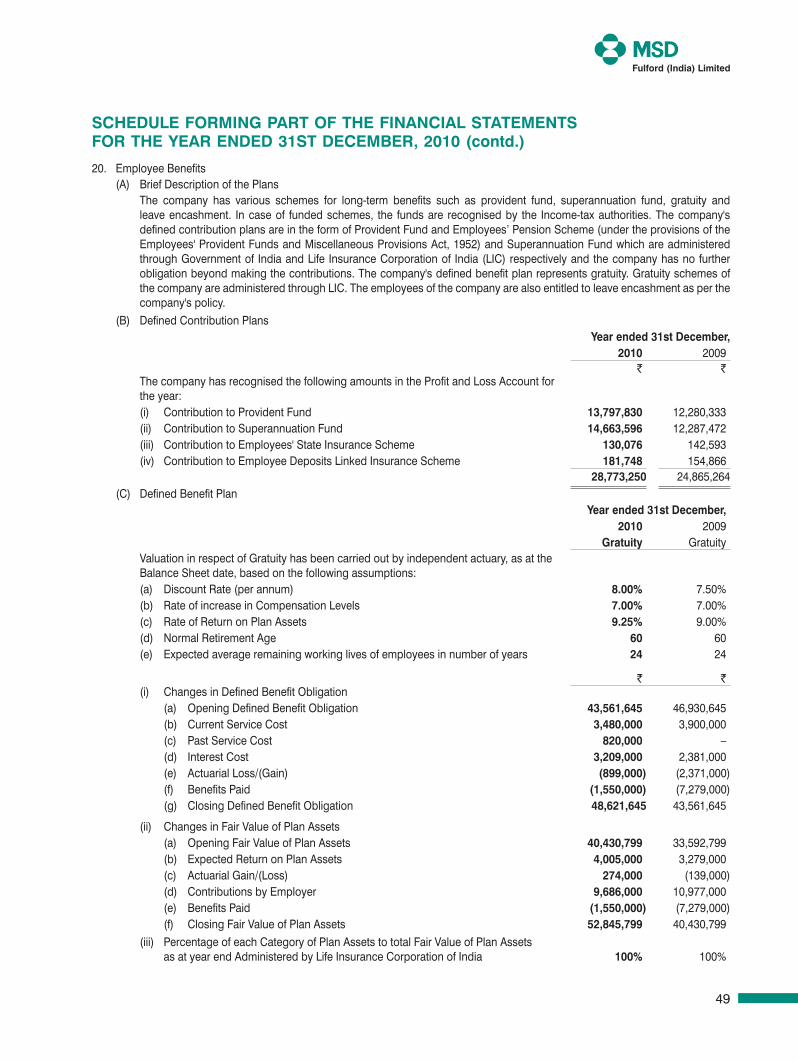
49
20. Employee Benefits (A) Brief Description of the Plans The company has various schemes for long-term benefits such as provident fund, superannuation fund, gratuity and
leave encashment. In case of funded schemes, the funds are recognised by the Income-tax authorities. The company's defined contribution plans are in the form of Provident Fund and Employees’ Pension Scheme (under the provisions of the Employees' Provident Funds and Miscellaneous Provisions Act, 1952) and Superannuation Fund which are administered through Government of India and Life Insurance Corporation of India (LIC) respectively and the company has no further obligation beyond making the contributions. The company's defined benefit plan represents gratuity. Gratuity schemes of the company are administered through LIC. The employees of the company are also entitled to leave encashment as per the company's policy.
(B) Defined Contribution PlansYear ended 31st december,
2010 2009` `
The company has recognised the following amounts in the Profit and Loss Account for the year:(i) Contribution to Provident Fund 13,797,830 12,280,333(ii) Contribution to Superannuation Fund 14,663,596 12,287,472 (iii) Contribution to Employees' State Insurance Scheme 130,076 142,593 (iv) Contribution to Employee Deposits Linked Insurance Scheme 181,748 154,866
28,773,250 24,865,264 (C) Defined Benefit Plan
Year ended 31st december,2010 2009
Gratuity GratuityValuation in respect of Gratuity has been carried out by independent actuary, as at the Balance Sheet date, based on the following assumptions:(a) Discount Rate (per annum) 8.00% 7.50%(b) Rate of increase in Compensation Levels 7.00% 7.00%(c) Rate of Return on Plan Assets 9.25% 9.00%(d) Normal Retirement Age 60 60 (e) Expected average remaining working lives of employees in number of years 24 24
` `(i) Changes in Defined Benefit Obligation
(a) Opening Defined Benefit Obligation 43,561,645 46,930,645 (b) Current Service Cost 3,480,000 3,900,000 (c) Past Service Cost 820,000 – (d) Interest Cost 3,209,000 2,381,000 (e) Actuarial Loss/(Gain) (899,000) (2,371,000)(f) Benefits Paid (1,550,000) (7,279,000)(g) Closing Defined Benefit Obligation 48,621,645 43,561,645
(ii) Changes in Fair Value of Plan Assets(a) Opening Fair Value of Plan Assets 40,430,799 33,592,799 (b) Expected Return on Plan Assets 4,005,000 3,279,000 (c) Actuarial Gain/(Loss) 274,000 (139,000)(d) Contributions by Employer 9,686,000 10,977,000 (e) Benefits Paid (1,550,000) (7,279,000)(f) Closing Fair Value of Plan Assets 52,845,799 40,430,799
(iii) Percentage of each Category of Plan Assets to total Fair Value of Plan Assets as at year end Administered by Life Insurance Corporation of India 100% 100%
schedule forMinG pArt of the finAnciAl stAteMents for the YeAr ended 31st deceMber, 2010 (contd.)
Fulford Accounts & Auditors.indd 49 3/29/2011 9:34:19 AM
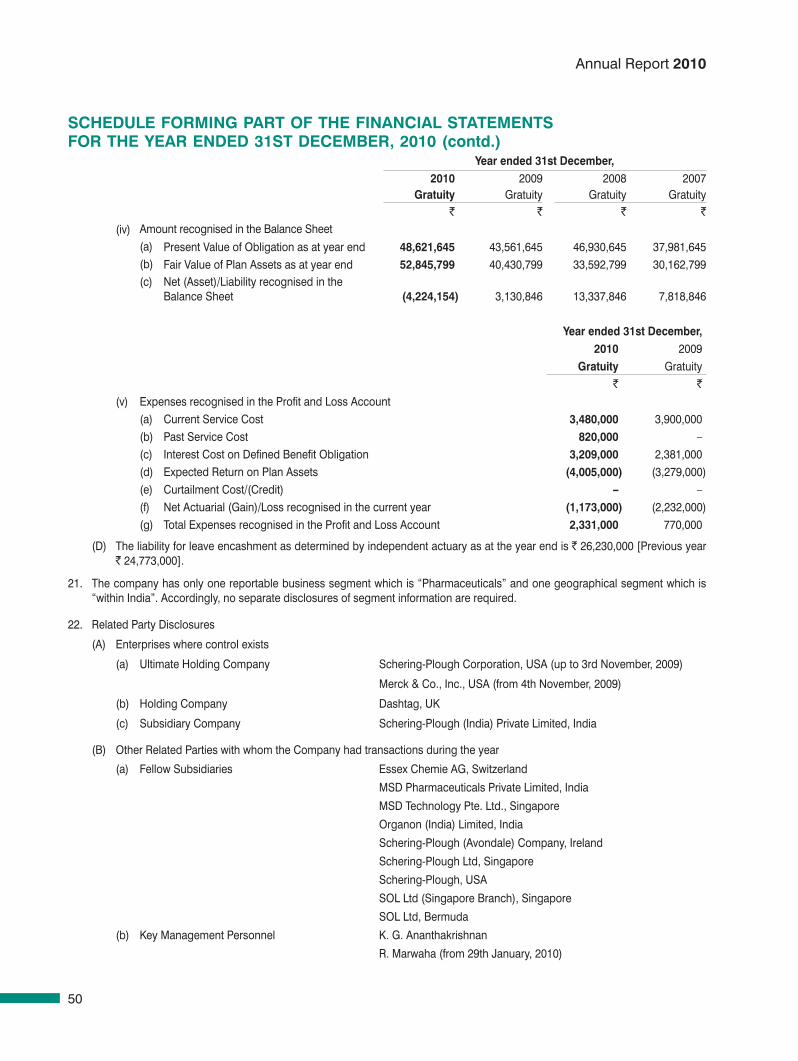
50
Annual Report 2010
Year ended 31st december,2010 2009 2008 2007
Gratuity Gratuity Gratuity Gratuity` ` ` `
(iv) Amount recognised in the Balance Sheet(a) Present Value of Obligation as at year end 48,621,645 43,561,645 46,930,645 37,981,645 (b) Fair Value of Plan Assets as at year end 52,845,799 40,430,799 33,592,799 30,162,799 (c) Net (Asset)/Liability recognised in the
Balance Sheet (4,224,154) 3,130,846 13,337,846 7,818,846
Year ended 31st december,2010 2009
Gratuity Gratuity ` `
(v) Expenses recognised in the Profit and Loss Account(a) Current Service Cost 3,480,000 3,900,000 (b) Past Service Cost 820,000 – (c) Interest Cost on Defined Benefit Obligation 3,209,000 2,381,000 (d) Expected Return on Plan Assets (4,005,000) (3,279,000)(e) Curtailment Cost/(Credit) – – (f) Net Actuarial (Gain)/Loss recognised in the current year (1,173,000) (2,232,000)(g) Total Expenses recognised in the Profit and Loss Account 2,331,000 770,000
(D) The liability for leave encashment as determined by independent actuary as at the year end is ` 26,230,000 [Previous year ` 24,773,000].
21. The company has only one reportable business segment which is “Pharmaceuticals” and one geographical segment which is “within India”. Accordingly, no separate disclosures of segment information are required.
22. Related Party Disclosures
(A) Enterprises where control exists
(a) Ultimate Holding Company Schering-Plough Corporation, USA (up to 3rd November, 2009)
Merck & Co., Inc., USA (from 4th November, 2009)
(b) Holding Company Dashtag, UK
(c) Subsidiary Company Schering-Plough (India) Private Limited, India
(B) Other Related Parties with whom the Company had transactions during the year
(a) Fellow Subsidiaries Essex Chemie AG, Switzerland
MSD Pharmaceuticals Private Limited, India
MSD Technology Pte. Ltd., Singapore
Organon (India) Limited, India
Schering-Plough (Avondale) Company, Ireland
Schering-Plough Ltd, Singapore
Schering-Plough, USA
SOL Ltd (Singapore Branch), Singapore
SOL Ltd, Bermuda
(b) Key Management Personnel K. G. Ananthakrishnan
R. Marwaha (from 29th January, 2010)
schedule forMinG pArt of the finAnciAl stAteMents for the YeAr ended 31st deceMber, 2010 (contd.)
Fulford Accounts & Auditors.indd 50 3/29/2011 9:34:19 AM
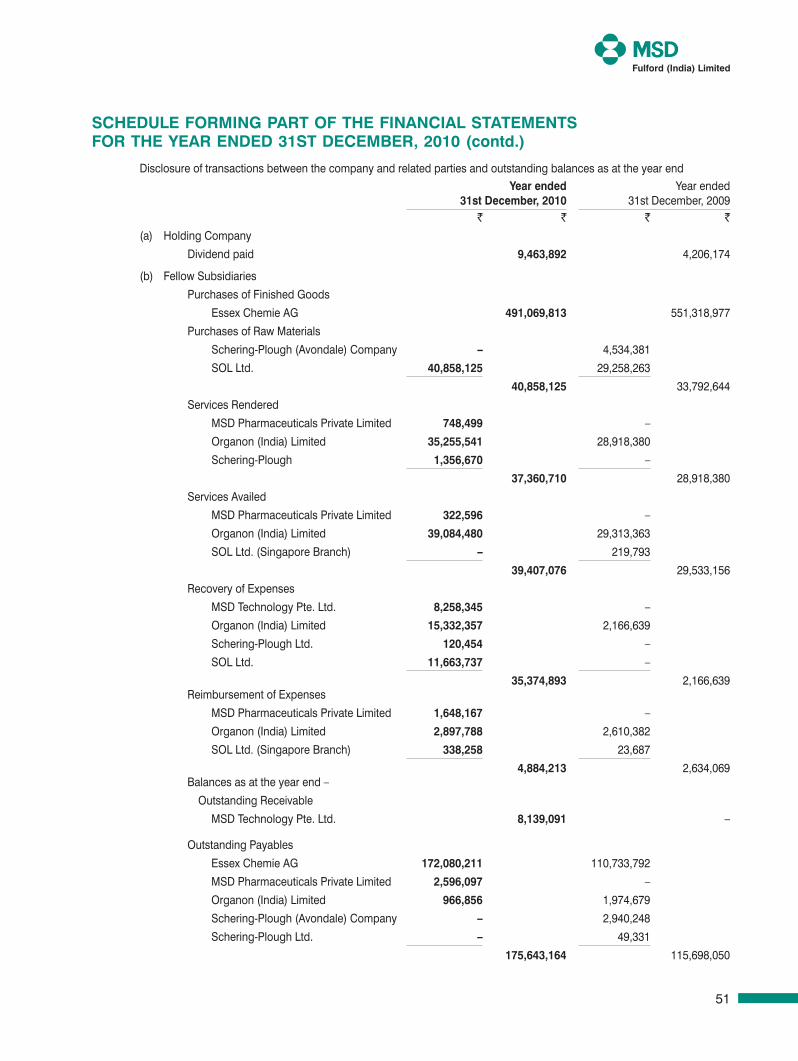
51
Disclosure of transactions between the company and related parties and outstanding balances as at the year endYear ended
31st december, 2010Year ended
31st December, 2009` ` ` `
(a) Holding Company
Dividend paid 9,463,892 4,206,174
(b) Fellow Subsidiaries
Purchases of Finished Goods
Essex Chemie AG 491,069,813 551,318,977
Purchases of Raw Materials
Schering-Plough (Avondale) Company – 4,534,381
SOL Ltd. 40,858,125 29,258,263
40,858,125 33,792,644
Services Rendered
MSD Pharmaceuticals Private Limited 748,499 –
Organon (India) Limited 35,255,541 28,918,380
Schering-Plough 1,356,670 –
37,360,710 28,918,380
Services Availed
MSD Pharmaceuticals Private Limited 322,596 –
Organon (India) Limited 39,084,480 29,313,363
SOL Ltd. (Singapore Branch) – 219,793
39,407,076 29,533,156
Recovery of Expenses
MSD Technology Pte. Ltd. 8,258,345 –
Organon (India) Limited 15,332,357 2,166,639
Schering-Plough Ltd. 120,454 –
SOL Ltd. 11,663,737 –
35,374,893 2,166,639 Reimbursement of Expenses
MSD Pharmaceuticals Private Limited 1,648,167 –
Organon (India) Limited 2,897,788 2,610,382
SOL Ltd. (Singapore Branch) 338,258 23,687
4,884,213 2,634,069 Balances as at the year end –
Outstanding Receivable
MSD Technology Pte. Ltd. 8,139,091 –
Outstanding Payables
Essex Chemie AG 172,080,211 110,733,792
MSD Pharmaceuticals Private Limited 2,596,097 –
Organon (India) Limited 966,856 1,974,679
Schering-Plough (Avondale) Company – 2,940,248
Schering-Plough Ltd. – 49,331
175,643,164 115,698,050
schedule forMinG pArt of the finAnciAl stAteMents for the YeAr ended 31st deceMber, 2010 (contd.)
Fulford Accounts & Auditors.indd 51 3/29/2011 9:34:19 AM
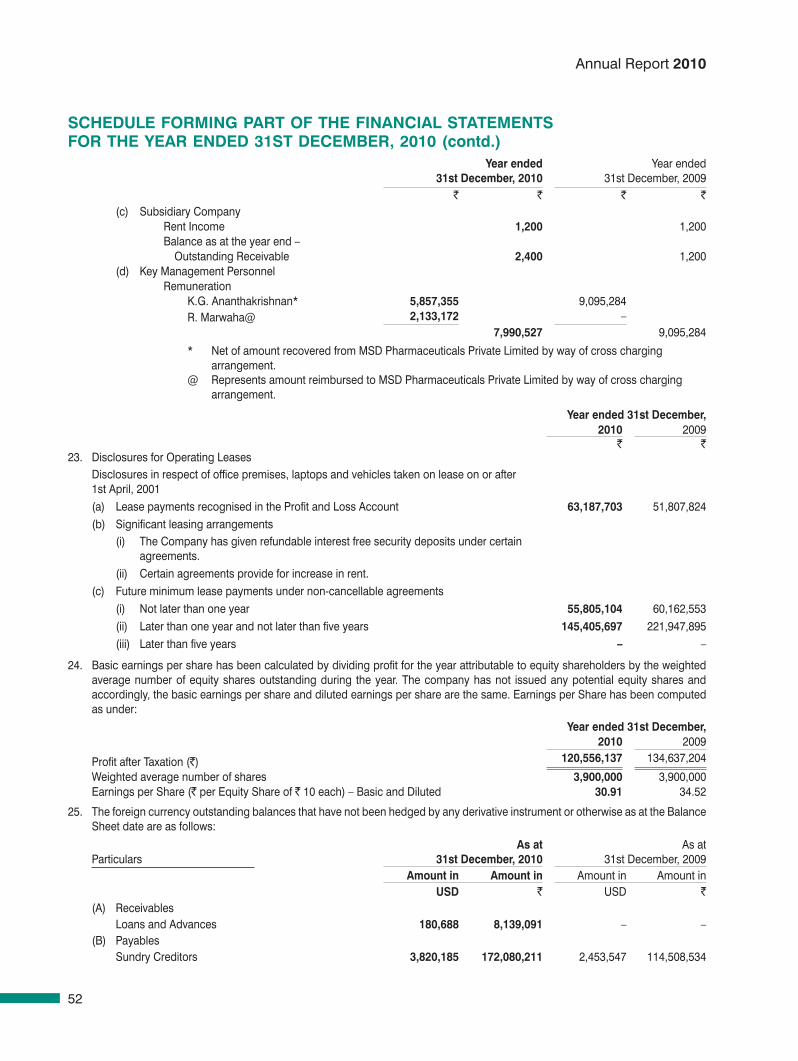
52
Annual Report 2010
Year ended31st december, 2010
Year ended31st December, 2009
` ` ` `(c) Subsidiary Company
Rent Income 1,200 1,200 Balance as at the year end – Outstanding Receivable 2,400 1,200
(d) Key Management PersonnelRemuneration
K.G. Ananthakrishnan* 5,857,355 9,095,284 R. Marwaha@ 2,133,172 –
7,990,527 9,095,284
* Net of amount recovered from MSD Pharmaceuticals Private Limited by way of cross charging arrangement.
@ Represents amount reimbursed to MSD Pharmaceuticals Private Limited by way of cross charging arrangement.
Year ended 31st december,2010 2009
` `23. Disclosures for Operating Leases
Disclosures in respect of office premises, laptops and vehicles taken on lease on or after 1st April, 2001(a) Lease payments recognised in the Profit and Loss Account 63,187,703 51,807,824 (b) Significant leasing arrangements
(i) The Company has given refundable interest free security deposits under certain agreements.
(ii) Certain agreements provide for increase in rent.(c) Future minimum lease payments under non-cancellable agreements
(i) Not later than one year 55,805,104 60,162,553 (ii) Later than one year and not later than five years 145,405,697 221,947,895 (iii) Later than five years – –
24. Basic earnings per share has been calculated by dividing profit for the year attributable to equity shareholders by the weighted average number of equity shares outstanding during the year. The company has not issued any potential equity shares and accordingly, the basic earnings per share and diluted earnings per share are the same. Earnings per Share has been computed as under:
Year ended 31st december, 2010 2009
Profit after Taxation (`) 120,556,137 134,637,204
Weighted average number of shares 3,900,000 3,900,000 Earnings per Share (` per Equity Share of ` 10 each) – Basic and Diluted 30.91 34.52
25. The foreign currency outstanding balances that have not been hedged by any derivative instrument or otherwise as at the Balance Sheet date are as follows:
Particulars As at
31st december, 2010 As at
31st December, 2009 Amount in Amount in Amount in Amount in
usd ` USD `(A) Receivables
Loans and Advances 180,688 8,139,091 – – (B) Payables
Sundry Creditors 3,820,185 172,080,211 2,453,547 114,508,534
schedule forMinG pArt of the finAnciAl stAteMents for the YeAr ended 31st deceMber, 2010 (contd.)
Fulford Accounts & Auditors.indd 52 3/29/2011 9:34:19 AM
53
26. In the year 2007, pursuant to the relevant provisions of the Securities and Exchange Board of India (Substantial Acquisition of Shares and Takeovers) Regulations, 1997, Dashtag, UK made an open offer to acquire 780,000 equity shares (representing 20% of the post-preferential issue capital) from the existing shareholders of the company. Pursuant to this open offer, Dashtag, UK acquired 123,087 shares constituting 3.16% of the post preferential capital of the company and the present holding of Dashtag, UK is 2,103,087 equity shares, constituting 53.93% of the paid-up share capital of the company. In a prior year, the company had raised ` 402,500,000 by issuing 700,000 equity shares of ` 10 each at a premium of ` 565 per share to its promoters, Dashtag, UK. The above amount is presently invested in fixed deposits with banks, pending utilisation of the same.
27. On 29th January, 2010, goods amounting to ` 18,456,427 were damaged consequent to fire at the company's warehouse at Bhiwandi, Maharashtra. Subsequently, the company has received full amount towards the insurance claim for the aforesaid damaged goods.
28. Previous year figures have been regrouped where necessary.
Signatures to Schedules 1 to 17
schedule forMinG pArt of the finAnciAl stAteMents for the YeAr ended 31st deceMber, 2010 (contd.)
In terms of our report of even date For and on behalf of the Board
For Price Waterhouse Ajit dangi ChairmanFirm Registration No. 301112EChartered Accountants K. G. Ananthakrishnan Managing Director
Vilas rane rajesh Marwaha Chief Financial OfficerPartnerMembership No. F-33220 bhavik desai Company Secretary
Mumbai, 21st February, 2011 Mumbai, 21st February, 2011
Fulford Accounts & Auditors.indd 53 3/29/2011 9:34:19 AM
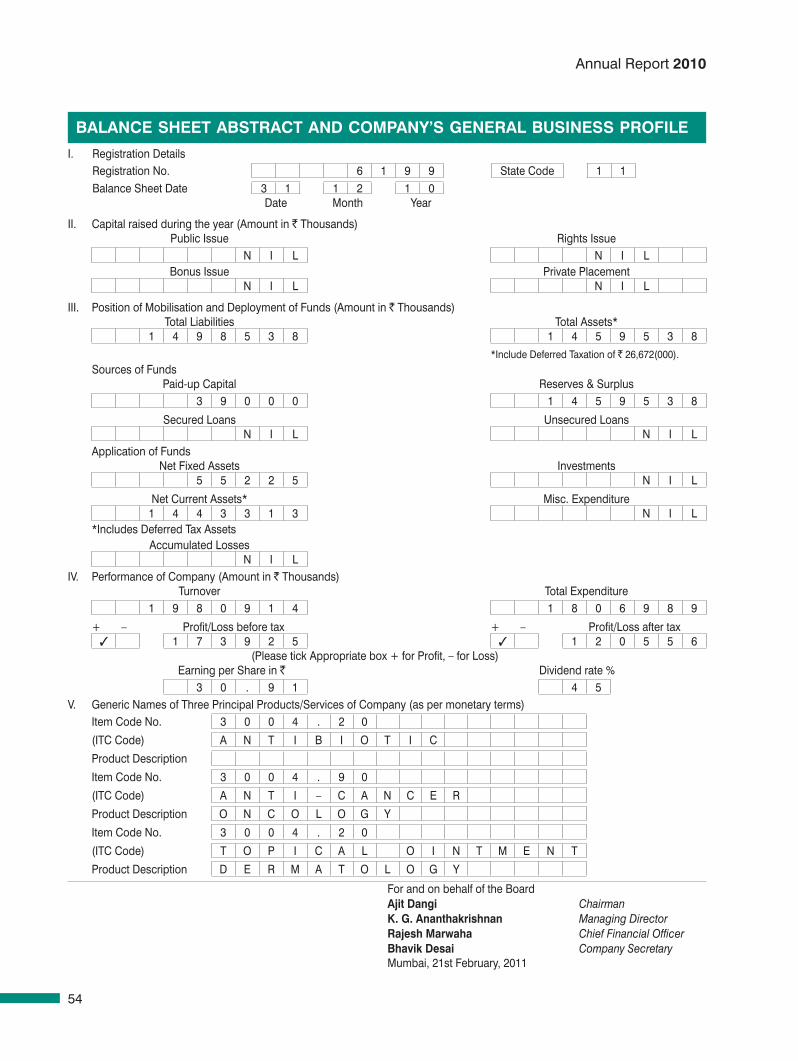
54
Annual Report 2010
I. Registration DetailsRegistration No. 6 1 9 9 State Code 1 1 Balance Sheet Date 3 1 1 2 1 0
Date Month Year
II. Capital raised during the year (Amount in ` Thousands)Public Issue Rights Issue
N I L N I LBonus Issue Private Placement
N I L N I L
III. Position of Mobilisation and Deployment of Funds (Amount in ` Thousands)Total Liabilities Total Assets*
1 4 9 8 5 3 8 1 4 5 9 5 3 8 *Include Deferred Taxation of ` 26,672(000).
Sources of FundsPaid-up Capital Reserves & Surplus
3 9 0 0 0 1 4 5 9 5 3 8
Secured Loans Unsecured LoansN I L N I L
Application of FundsNet Fixed Assets Investments
5 5 2 2 5 N I L
Net Current Assets* Misc. Expenditure1 4 4 3 3 1 3 N I L
*Includes Deferred Tax AssetsAccumulated Losses
N I LIV. Performance of Company (Amount in ` Thousands)
Turnover Total Expenditure1 9 8 0 9 1 4 1 8 0 6 9 8 9
+ – Profit/Loss before tax + – Profit/Loss after tax 1 7 3 9 2 5 1 2 0 5 5 6
(Please tick Appropriate box + for Profit, – for Loss) Earning per Share in ` Dividend rate %
3 0 . 9 1 4 5V. Generic Names of Three Principal Products/Services of Company (as per monetary terms)
Item Code No. 3 0 0 4 . 2 0
(ITC Code) A N T I B I O T I C
Product Description
Item Code No. 3 0 0 4 . 9 0
(ITC Code) A N T I – C A N C E R
Product Description O N C O L O G Y
Item Code No. 3 0 0 4 . 2 0
(ITC Code) T O P I C A L O I N T M E N T
Product Description D E R M A T O L O G Y
For and on behalf of the BoardAjit dangi ChairmanK. G. Ananthakrishnan Managing Directorrajesh Marwaha Chief Financial Officerbhavik desai Company SecretaryMumbai, 21st February, 2011
bAlAnce sheet AbstrAct And coMpAnY’s GenerAl business profile
Fulford Accounts & Auditors.indd 54 3/29/2011 9:34:19 AM
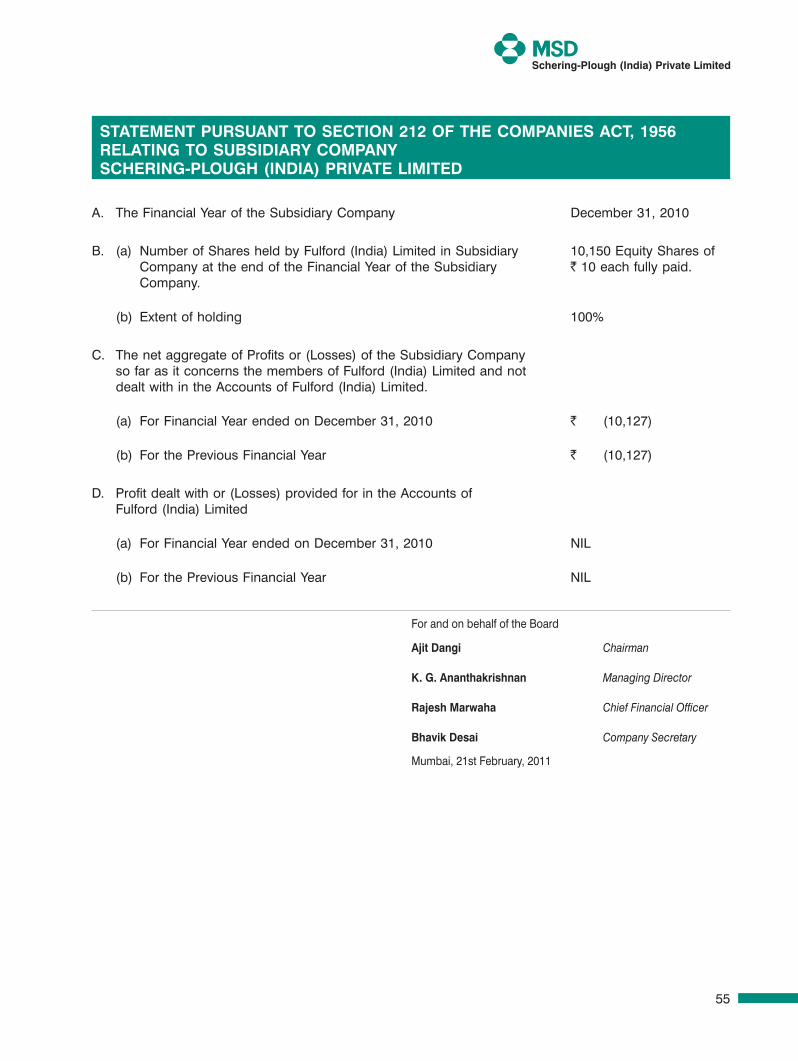
55
A. The Financial Year of the Subsidiary Company December 31, 2010
B. (a) Number of Shares held by Fulford (India) Limited in Subsidiary Company at the end of the Financial Year of the Subsidiary Company.
10,150 Equity Shares of ` 10 each fully paid.
(b) Extent of holding 100%
C. The net aggregate of Profits or (Losses) of the Subsidiary Company so far as it concerns the members of Fulford (India) Limited and not dealt with in the Accounts of Fulford (India) Limited.
(a) For Financial Year ended on December 31, 2010 ` (10,127)
(b) For the Previous Financial Year ` (10,127)
D. Profit dealt with or (Losses) provided for in the Accounts of Fulford (India) Limited
(a) For Financial Year ended on December 31, 2010 NIL
(b) For the Previous Financial Year NIL
For and on behalf of the Board
Ajit dangi Chairman
K. G. Ananthakrishnan Managing Director
rajesh Marwaha Chief Financial Officer
bhavik desai Company Secretary
Mumbai, 21st February, 2011
schering-plough (india) private limited
stAteMent pursuAnt to section 212 of the coMpAnies Act, 1956 relAtinG to subsidiArY coMpAnY scherinG-plouGh (indiA) priVAte liMited
Fulford Accounts & Auditors.indd 55 3/29/2011 9:34:20 AM
56
Annual Report 2010
Your Directors present the Twenty-Second Annual Report of the Company alongwith the audited Accounts for the year ended December 31, 2010:
FINANCIAL RESULTS
During the year, the Company incurred a Loss of ` 0.10 lakhs as against Loss of ` 0.10 lakhs in the previous year.
DIVIDEND
The Directors do not recommend any dividend for the year ended December 31, 2010.
CURRENT YEAR AND PROSPECTS
The Company would continue to explore business opportunities during 2011.
DIRECTORS
Mr. P. Suresh retires by rotation at the ensuing Annual General Meeting and being eligible, offers himself for re-appointment.
FIXED DEPOSIT
The Company has not accepted any Deposits from the public during the period under review.
AUDITORS
M/s. Dayal & Lohia, Chartered Accountants, retire as Auditors of the Company at the conclusion of the ensuing Annual General Meeting and according to a Certificate received from them under Section 224(1B) of the Companies Act, 1956, they are eligible for re-appointment.
PARTICULARS OF EMPLOYEES
There are no employees drawing remuneration in excess of the limits prescribed under Section 217(2A) of the Companies Act, 1956.
INFORMATION PURSUANT TO SECTION 217 OF THE COMPANIES ACT, 1956
Information required to be annexed to this report in accordance with Clause(e) of sub-section (1) of Section 217 of the Act read with the Companies (Disclosure of Particulars in the Report of Board of Directors) Rules, 1988 is given as Annexure 1.In accordance with sub-section (2AA) of Section 217 of the Companies (Amendment) Act, 2000 concerning “Directors’ Responsibility Statement” and to the best of their knowledge and belief and according to the information and explanation obtained by them, your Directors confirm that:i) in the preparation of Annual accounts, the applicable accounting standards have been followed along
with proper explanation relating to material departures;ii) they have selected such accounting policies and applied them consistently and made judgments and
estimates that are reasonable and prudent so as to give a true and fair view of the state of affairs of the Company at the end of the financial year and of the loss of the Company for that period;
iii) they have exercised proper and sufficient care for the maintenance of adequate accounting records in accordance with the provisions of the Act for safeguarding the assets of the Company and for preventing and detecting fraud and other irregularities; and
iv) the annual accounts are prepared on a going concern basis.
For and on behalf of the Board of Directors
P. SureshDelhi, February 5, 2011 Chairman
DIRECTORS’ REPORT
Fulford Subsidiary.indd 56 3/29/2011 9:51:29 AM
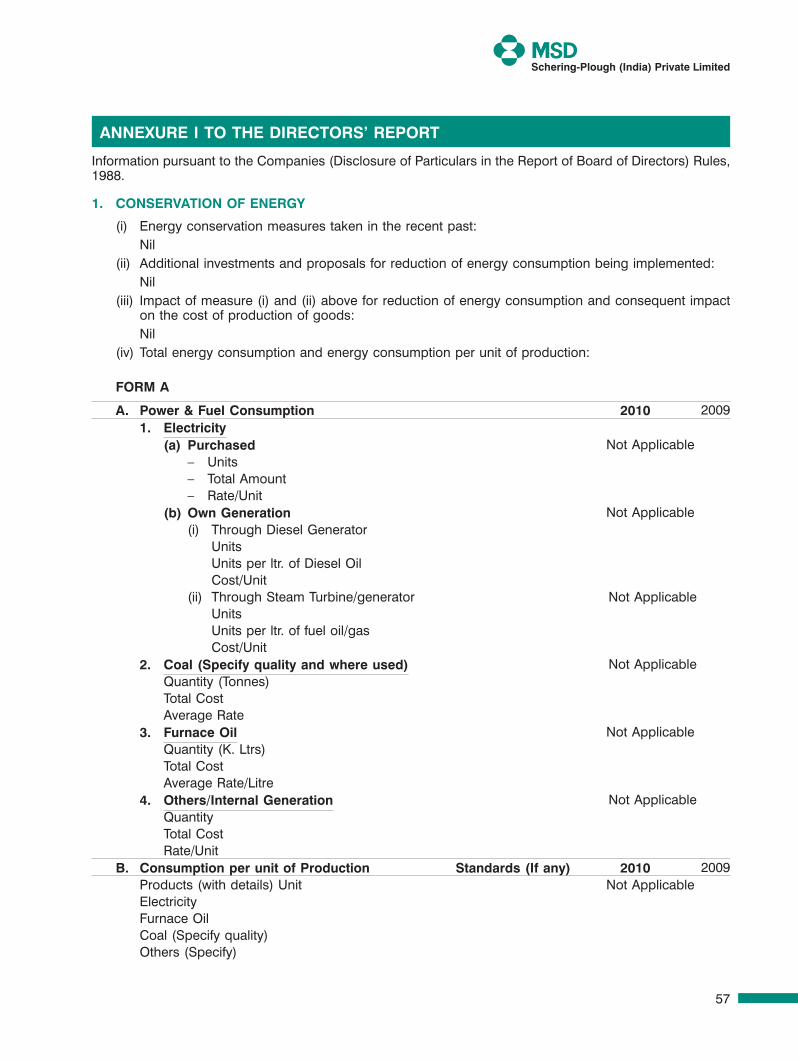
57
Schering-Plough (India) Private Limited
Information pursuant to the Companies (Disclosure of Particulars in the Report of Board of Directors) Rules, 1988.
1. CONSERVATION OF ENERGY
(i) Energy conservation measures taken in the recent past: Nil (ii) Additional investments and proposals for reduction of energy consumption being implemented: Nil (iii) Impact of measure (i) and (ii) above for reduction of energy consumption and consequent impact
on the cost of production of goods: Nil (iv) Total energy consumption and energy consumption per unit of production:
FORM A
A. Power & Fuel Consumption 2010 20091. Electricity
(a) Purchased Not Applicable– Units – Total Amount– Rate/Unit
(b) Own Generation Not Applicable(i) Through Diesel Generator
UnitsUnits per ltr. of Diesel OilCost/Unit
(ii) Through Steam Turbine/generator Not Applicable UnitsUnits per ltr. of fuel oil/gasCost/Unit
2. Coal (Specify quality and where used) Not Applicable Quantity (Tonnes)Total CostAverage Rate
3. Furnace Oil Not ApplicableQuantity (K. Ltrs)Total CostAverage Rate/Litre
4. Others/Internal Generation Not Applicable QuantityTotal CostRate/Unit
B. Consumption per unit of Production Standards (If any) 2010 2009 Products (with details) Unit Not ApplicableElectricityFurnace OilCoal (Specify quality)Others (Specify)
ANNEXURE I TO THE DIRECTORS’ REPORT
Fulford Subsidiary.indd 57 3/29/2011 9:51:29 AM
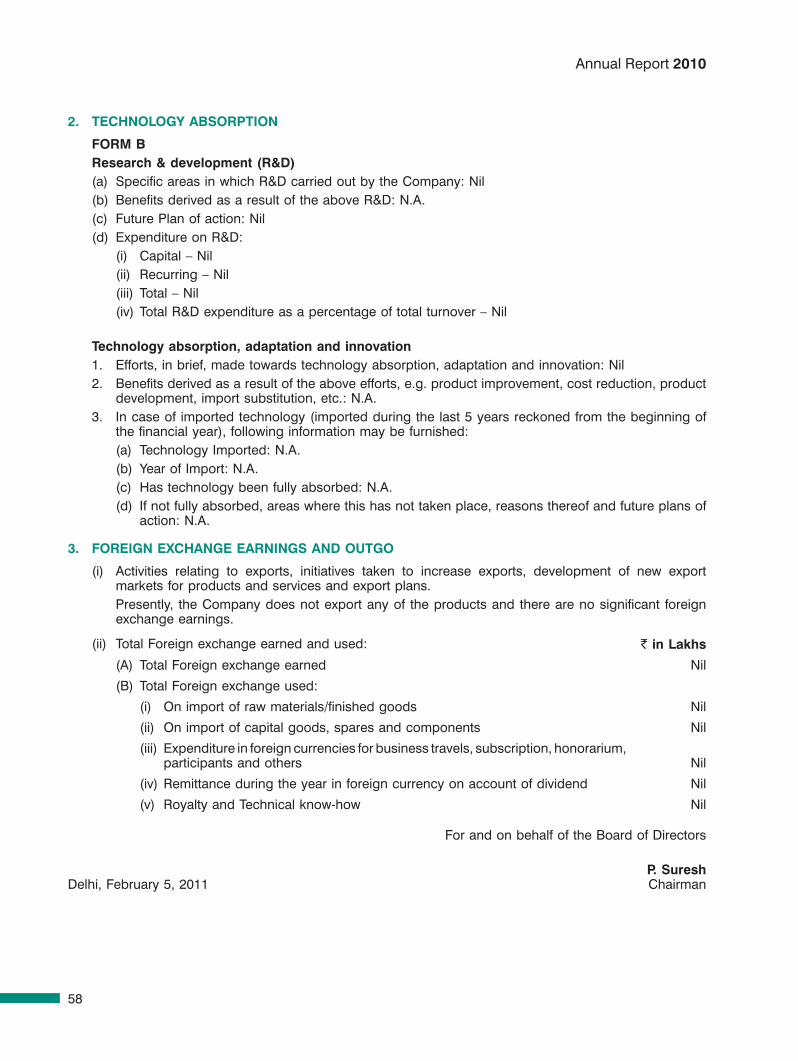
58
Annual Report 2010
2. TECHNOLOGY ABSORPTION
FORM B Research & development (R&D) (a) Specific areas in which R&D carried out by the Company: Nil (b) Benefits derived as a result of the above R&D: N.A. (c) Future Plan of action: Nil (d) Expenditure on R&D: (i) Capital – Nil (ii) Recurring – Nil (iii) Total – Nil (iv) Total R&D expenditure as a percentage of total turnover – Nil
Technology absorption, adaptation and innovation 1. Efforts, in brief, made towards technology absorption, adaptation and innovation: Nil 2. Benefits derived as a result of the above efforts, e.g. product improvement, cost reduction, product
development, import substitution, etc.: N.A. 3. In case of imported technology (imported during the last 5 years reckoned from the beginning of
the financial year), following information may be furnished: (a) Technology Imported: N.A. (b) Year of Import: N.A. (c) Has technology been fully absorbed: N.A. (d) If not fully absorbed, areas where this has not taken place, reasons thereof and future plans of
action: N.A.
3. FOREIGN EXCHANGE EARNINGS AND OUTGO
(i) Activities relating to exports, initiatives taken to increase exports, development of new export markets for products and services and export plans.
Presently, the Company does not export any of the products and there are no significant foreign exchange earnings.
(ii) Total Foreign exchange earned and used: ` in Lakhs
(A) Total Foreign exchange earned Nil
(B) Total Foreign exchange used:
(i) On import of raw materials/finished goods Nil
(ii) On import of capital goods, spares and components Nil
(iii) Expenditure in foreign currencies for business travels, subscription, honorarium, participants and others Nil
(iv) Remittance during the year in foreign currency on account of dividend Nil
(v) Royalty and Technical know-how Nil
For and on behalf of the Board of Directors
P. SureshDelhi, February 5, 2011 Chairman
Fulford Subsidiary.indd 58 3/29/2011 9:51:29 AM
59
Schering-Plough (India) Private Limited
1. We have audited the attached balance sheet of Schering-Plough (India) Private Limited as at December 31, 2010, the profit and loss account of the company and also cash flow statements for the year ended December 31, 2010 annexed thereto. These financial statements are the responsibility of the company’s management. Our responsibility is to express an opinion on these financial statements based on our audit.
2. We conducted our audit in accordance with the auditing standards generally accepted in India. Those Standards require that we plan and perform the audit to obtain reasonable assurance about whether the financial statements are free of material misstatement. An audit includes examining, on a test basis, evidence supporting the amounts and disclosures in the financial statements. An audit also includes assessing the accounting principles used and significant estimates made by management, as well as evaluating the overall financial statement presentation. We believe that our audit provides a reasonable basis for our opinion.
3. As required by the Companies (Auditors’ Report) Order, 2003 and Amendments made by the Companies (Auditors’ Report) (Amendment) Order, 2004 issued by the Central Government of India in terms of sub-section (4A) of Section 227 of the Companies Act, 1956, we enclose in the Annexure, a statement on the matters specified in paragraphs 4 and 5 of the said Order.
4. Further to our comments in the Annexure referred to above, we report that: (i) We have obtained all the information and explanations, which to the best of our knowledge and
belief were necessary for the purposes of our audit; (ii) In our opinion, proper books of account as required by law have been kept by the company so
far as appears from our examination of those books; (iii) The Balance sheet, Profit and Loss Account and Cash Flow Statement dealt with by this report
are in agreement with the books of account; (iv) In our opinion, the Balance Sheet, Profit and Loss Account and Cash Flow Statement dealt
with by this report comply with the accounting standards referred to in sub-section (3C) of Section 211 of the Companies Act, 1956;
(v) On the basis of written representations received from directors as on December 31, 2010 and taken on record by the Board of Directors, we report that none of the directors is disqualified as on December 31, 2010 from being appointed as a director in terms of clause (g) of sub-section (1) of Section 274 of the Companies Act, 1956;
(vi) In our opinion and to the best of our information and according to the explanations given to us, the said accounts read together with the notes thereon, give the information required by the Companies Act, 1956, in the manner so required and give a true and fair view in conformity with the accounting principles generally accepted in India:
(a) in the case of the Balance Sheet, of the state of affairs of the Company as at December 31, 2010; and
(b) in the case of the Profit and Loss Account, of the loss for the year ended on that date. (c) in the case of the Cash Flow Statement, of the cash flows for the year ended on that
date.
For Dayal and LohiaChartered Accountants
Firm Registration No.: 102200W
C. C. DayalPartner
Membership No.: 10623 Mumbai, 5th February, 2011
AUDITORS’ REPORT TO THE MEMBERS OF SCHERING-PLOUGH (INDIA) PRIVATE LIMITED
Fulford Subsidiary.indd 59 3/29/2011 9:51:29 AM
60
Annual Report 2010
(Referred to in Paragraph 3 of our Report of even date)1. In our opinion and according to the information and explanations given to us, the nature of the
company’s business/activities during the year are such that clauses ii, viii, xiii, xiv, xviii, xix, xx are not applicable to the company.
2. As the company does not have any fixed assets, the question regarding maintenance of proper records, physical verification and disposal of assets is not applicable.
3. According to the information and explanations given to us, the company has not granted or taken any loan secured or unsecured to/from companies, firms or other parties covered in the register maintained under Section 301 of the Companies Act, 1956.
4. There were no transactions in respect of purchase of inventory, fixed assets, sale of goods and services during the year. During the course of our audit, we have not observed any continuing failure to correct major weaknesses in internal controls.
5. To the best of our knowledge and belief and according to the information and explanations given to us, there were no particulars of contracts or arrangements referred to in Section 301 of the Companies Act, 1956, that were required to be entered in the register maintained in pursuance of Section 301 of the Companies Act, 1956.
6. In our opinion and according to the information and explanations given to us the company has not accepted any deposits within the meaning of Section 58A and 58AA or any other relevant provisions of the Companies Act, 1956 and the Companies (Acceptance of Deposits) Rules, 1975.
7. As the paid up capital and reserves of the company is less than Rs. 50 lakhs as at the commencement of the financial year and as the average annual turnover of the company is less than Rs. 5 Crores for a period of three consecutive financial years immediately preceding this financial year, the requirement of an internal audit system is not applicable to the company.
8. According to the information and explanations given to us in respect of statutory and other dues: (a) The company has been regular in depositing undisputed statutory dues, including Income Tax,
Cess and other statutory dues with the appropriate authorities during the year. There were no dues in respect of Provident Fund, Investor Education and Protection Fund, Employees’ State Insurance, Sales Tax, Wealth Tax, Custom Duty, Excise Duty and Service Tax during the year.
(b) There were no disputed dues in respect of income-tax, sales tax, customs duty, wealth tax, excise duty and service tax during the year.
9. The company’s accumulated losses exceeded its net worth as at the end of the financial year. The company has incurred cash losses during the current financial year and the immediately preceding financial year.
10. In our opinion and according to the information and explanations given to us, the company has not obtained any borrowings from any banks or financial institutions or by way of debentures.
11. In our opinion, the company has not granted loans and advances on the basis of security by way of pledge of shares, debentures and other securities.
12. In our opinion and according to the information and explanations given to us, the company has not given any guarantees for loans taken by others from banks and financial institutions.
13. The company has not obtained any term loans during the year.14. There are no funds raised on short term or long term basis.15. To the best of our knowledge and belief and according to the information and explanations given to
us, no fraud on or by the company was noticed or reported during the year.For Dayal and Lohia
Chartered AccountantsFirm Registration No.: 102200W
C. C. DayalPartner
Membership No.: 10623 Mumbai, 5th February, 2011
ANNEXURE TO THE AUDITORS’ REPORT
Fulford Subsidiary.indd 60 3/29/2011 9:51:29 AM
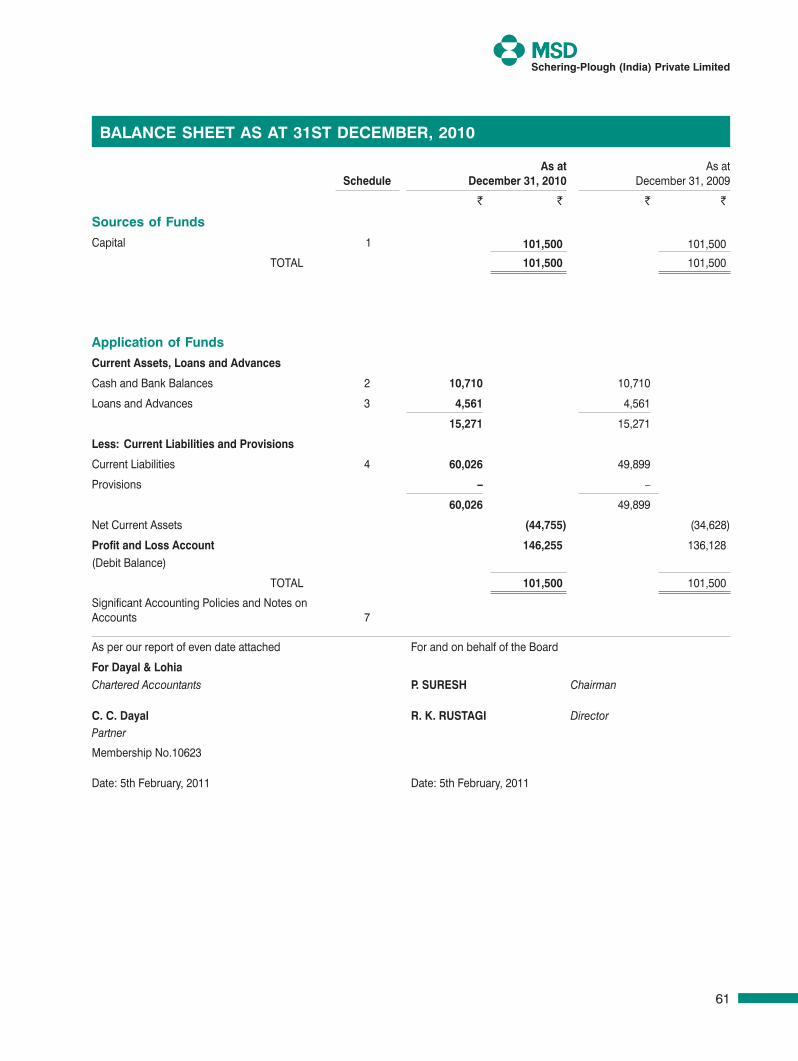
61
Schering-Plough (India) Private Limited
ScheduleAs at
December 31, 2010As at
December 31, 2009
` ` ` `
Sources of Funds
Capital 1 101,500 101,500
TOTAL 101,500 101,500
Application of Funds
Current Assets, Loans and Advances
Cash and Bank Balances 2 10,710 10,710
Loans and Advances 3 4,561 4,561
15,271 15,271
Less: Current Liabilities and Provisions
Current Liabilities 4 60,026 49,899
Provisions – –
60,026 49,899
Net Current Assets (44,755) (34,628)
Profit and Loss Account 146,255 136,128 (Debit Balance)
TOTAL 101,500 101,500
Significant Accounting Policies and Notes on Accounts 7
As per our report of even date attached For and on behalf of the Board
For Dayal & LohiaChartered Accountants P. SURESH Chairman
C. C. Dayal R. K. RUSTAGI DirectorPartner
Membership No.10623
Date: 5th February, 2011 Date: 5th February, 2011
BALANCE SHEET AS AT 31ST DECEMBER, 2010
Fulford Subsidiary.indd 61 3/29/2011 9:51:29 AM
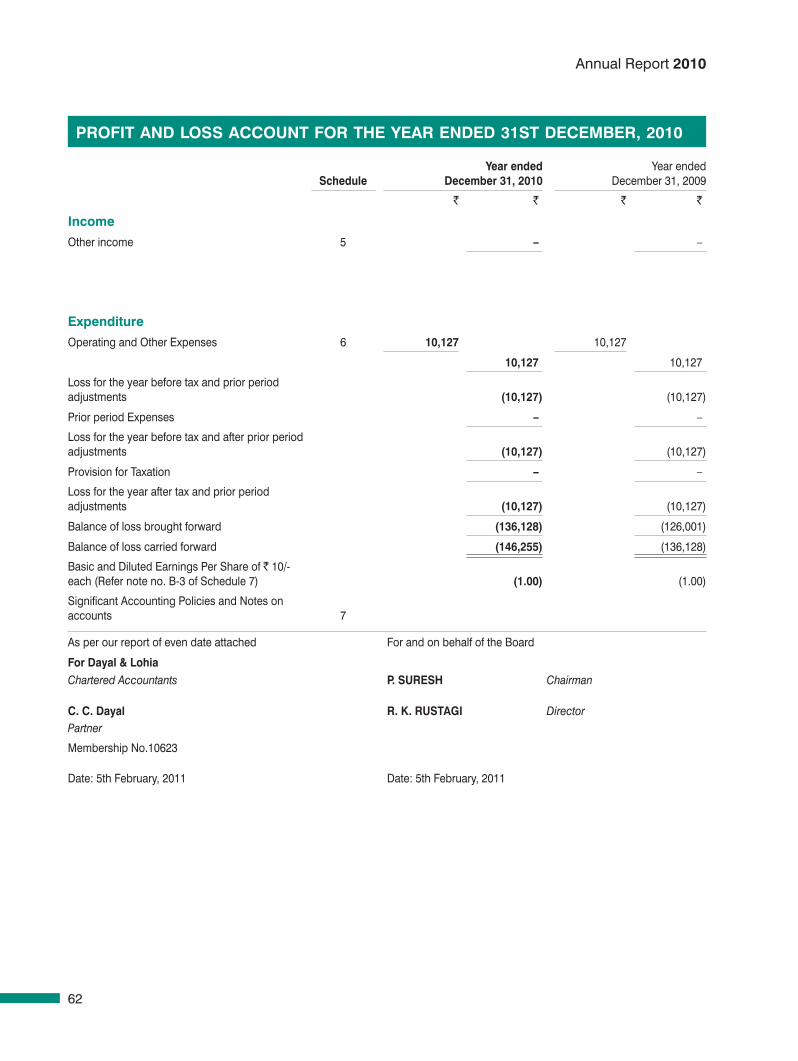
62
Annual Report 2010
ScheduleYear ended
December 31, 2010Year ended
December 31, 2009
` ` ` `
Income
Other income 5 – –
Expenditure
Operating and Other Expenses 6 10,127 10,127
10,127 10,127
Loss for the year before tax and prior period adjustments (10,127) (10,127)
Prior period Expenses – –
Loss for the year before tax and after prior period adjustments (10,127) (10,127)
Provision for Taxation – –
Loss for the year after tax and prior period adjustments (10,127) (10,127)
Balance of loss brought forward (136,128) (126,001)
Balance of loss carried forward (146,255) (136,128)
Basic and Diluted Earnings Per Share of ` 10/- each (Refer note no. B-3 of Schedule 7) (1.00) (1.00)
Significant Accounting Policies and Notes on accounts 7
As per our report of even date attached For and on behalf of the Board
For Dayal & LohiaChartered Accountants P. SURESH Chairman
C. C. Dayal R. K. RUSTAGI DirectorPartner
Membership No.10623
Date: 5th February, 2011 Date: 5th February, 2011
PROFIT AND LOSS ACCOUNT FOR THE YEAR ENDED 31ST DECEMBER, 2010
Fulford Subsidiary.indd 62 3/29/2011 9:51:29 AM
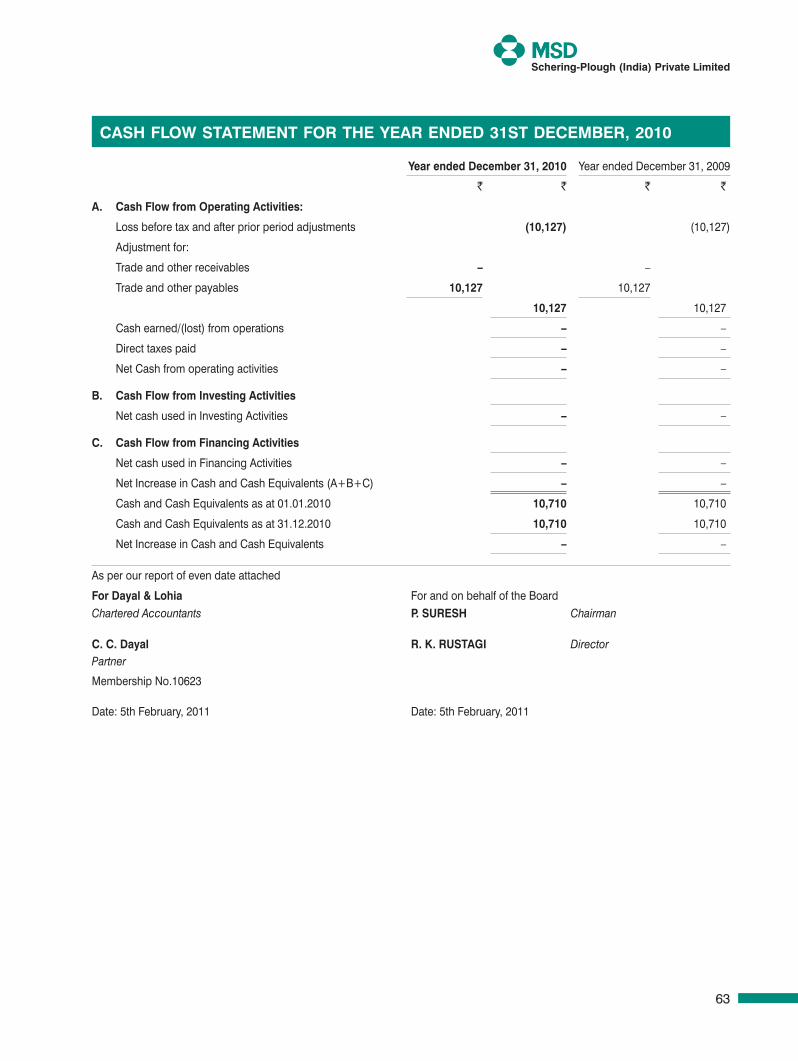
63
Schering-Plough (India) Private Limited
Year ended December 31, 2010 Year ended December 31, 2009
` ` ` `
A. Cash Flow from Operating Activities:
Loss before tax and after prior period adjustments (10,127) (10,127)
Adjustment for:
Trade and other receivables – –
Trade and other payables 10,127 10,127
10,127 10,127
Cash earned/(lost) from operations – –
Direct taxes paid – –
Net Cash from operating activities – –
B. Cash Flow from Investing Activities
Net cash used in Investing Activities – –
C. Cash Flow from Financing Activities
Net cash used in Financing Activities – –
Net Increase in Cash and Cash Equivalents (A+B+C) – –
Cash and Cash Equivalents as at 01.01.2010 10,710 10,710
Cash and Cash Equivalents as at 31.12.2010 10,710 10,710
Net Increase in Cash and Cash Equivalents – –
As per our report of even date attached
For Dayal & Lohia For and on behalf of the BoardChartered Accountants P. SURESH Chairman
C. C. Dayal R. K. RUSTAGI DirectorPartner
Membership No.10623
Date: 5th February, 2011 Date: 5th February, 2011
CASH FLOw STATEMENT FOR THE YEAR ENDED 31ST DECEMBER, 2010
Fulford Subsidiary.indd 63 3/29/2011 9:51:30 AM
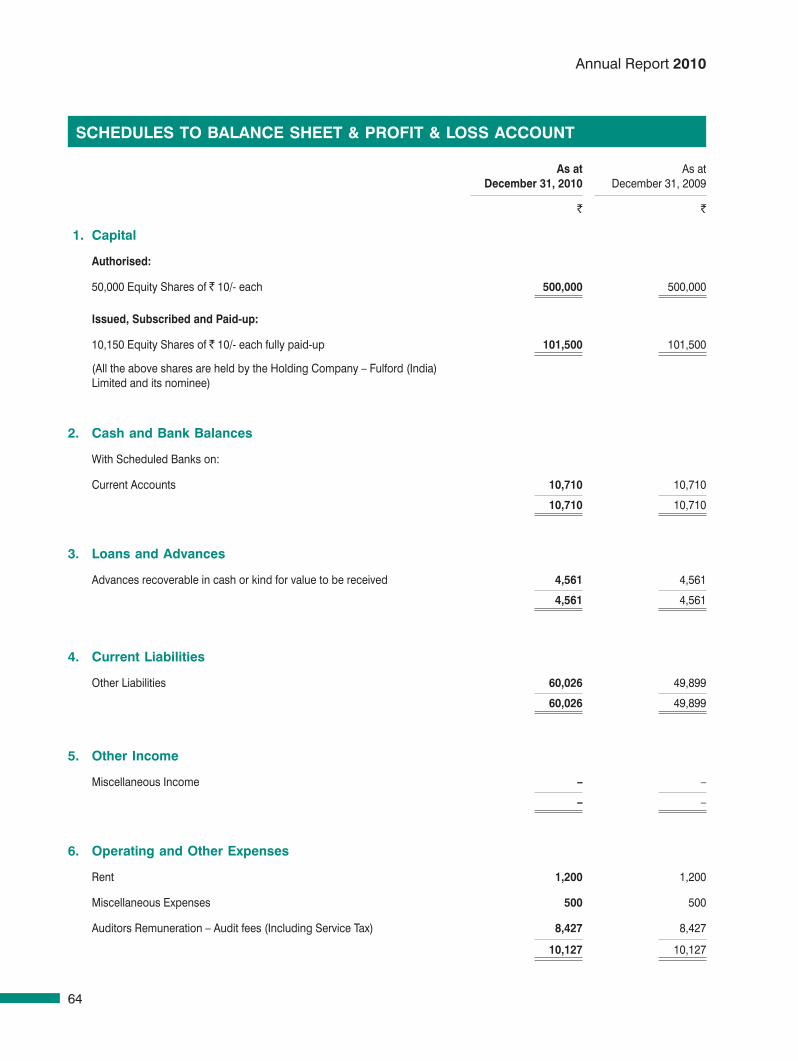
64
Annual Report 2010
As at December 31, 2010
As at December 31, 2009
` `
1. Capital
Authorised:
50,000 Equity Shares of ` 10/- each 500,000 500,000
Issued, Subscribed and Paid-up:
10,150 Equity Shares of ` 10/- each fully paid-up 101,500 101,500
(All the above shares are held by the Holding Company – Fulford (India) Limited and its nominee)
2. Cash and Bank Balances
With Scheduled Banks on:
Current Accounts 10,710 10,710
10,710 10,710
3. Loans and Advances
Advances recoverable in cash or kind for value to be received 4,561 4,561
4,561 4,561
4. Current Liabilities
Other Liabilities 60,026 49,899
60,026 49,899
5. Other Income
Miscellaneous Income – –
– –
6. Operating and Other Expenses
Rent 1,200 1,200
Miscellaneous Expenses 500 500
Auditors Remuneration – Audit fees (Including Service Tax) 8,427 8,427
10,127 10,127
SCHEDULES TO BALANCE SHEET & PROFIT & LOSS ACCOUNT
Fulford Subsidiary.indd 64 3/29/2011 9:51:30 AM
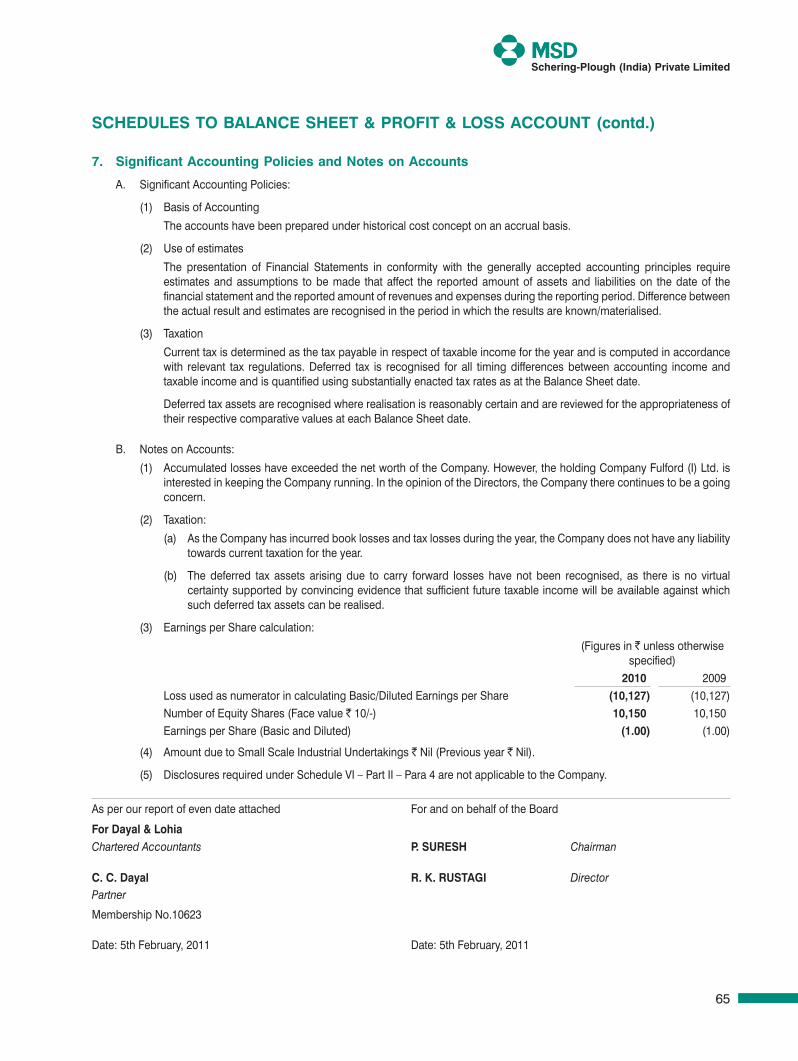
65
Schering-Plough (India) Private Limited
7. Significant Accounting Policies and Notes on Accounts
A. Significant Accounting Policies:
(1) Basis of Accounting
The accounts have been prepared under historical cost concept on an accrual basis.
(2) Use of estimates
The presentation of Financial Statements in conformity with the generally accepted accounting principles require estimates and assumptions to be made that affect the reported amount of assets and liabilities on the date of the financial statement and the reported amount of revenues and expenses during the reporting period. Difference between the actual result and estimates are recognised in the period in which the results are known/materialised.
(3) Taxation
Current tax is determined as the tax payable in respect of taxable income for the year and is computed in accordance with relevant tax regulations. Deferred tax is recognised for all timing differences between accounting income and taxable income and is quantified using substantially enacted tax rates as at the Balance Sheet date.
Deferred tax assets are recognised where realisation is reasonably certain and are reviewed for the appropriateness of their respective comparative values at each Balance Sheet date.
B. Notes on Accounts:
(1) Accumulated losses have exceeded the net worth of the Company. However, the holding Company Fulford (I) Ltd. is interested in keeping the Company running. In the opinion of the Directors, the Company there continues to be a going concern.
(2) Taxation:
(a) As the Company has incurred book losses and tax losses during the year, the Company does not have any liability towards current taxation for the year.
(b) The deferred tax assets arising due to carry forward losses have not been recognised, as there is no virtual certainty supported by convincing evidence that sufficient future taxable income will be available against which such deferred tax assets can be realised.
(3) Earnings per Share calculation:
(Figures in ` unless otherwise specified)
2010 2009Loss used as numerator in calculating Basic/Diluted Earnings per Share (10,127) (10,127)Number of Equity Shares (Face value ` 10/-) 10,150 10,150Earnings per Share (Basic and Diluted) (1.00) (1.00)
(4) Amount due to Small Scale Industrial Undertakings ` Nil (Previous year ` Nil).
(5) Disclosures required under Schedule VI – Part II – Para 4 are not applicable to the Company.
SCHEDULES TO BALANCE SHEET & PROFIT & LOSS ACCOUNT (contd.)
As per our report of even date attached For and on behalf of the Board
For Dayal & LohiaChartered Accountants P. SURESH Chairman
C. C. Dayal R. K. RUSTAGI DirectorPartner
Membership No.10623
Date: 5th February, 2011 Date: 5th February, 2011
Fulford Subsidiary.indd 65 3/29/2011 9:51:30 AM
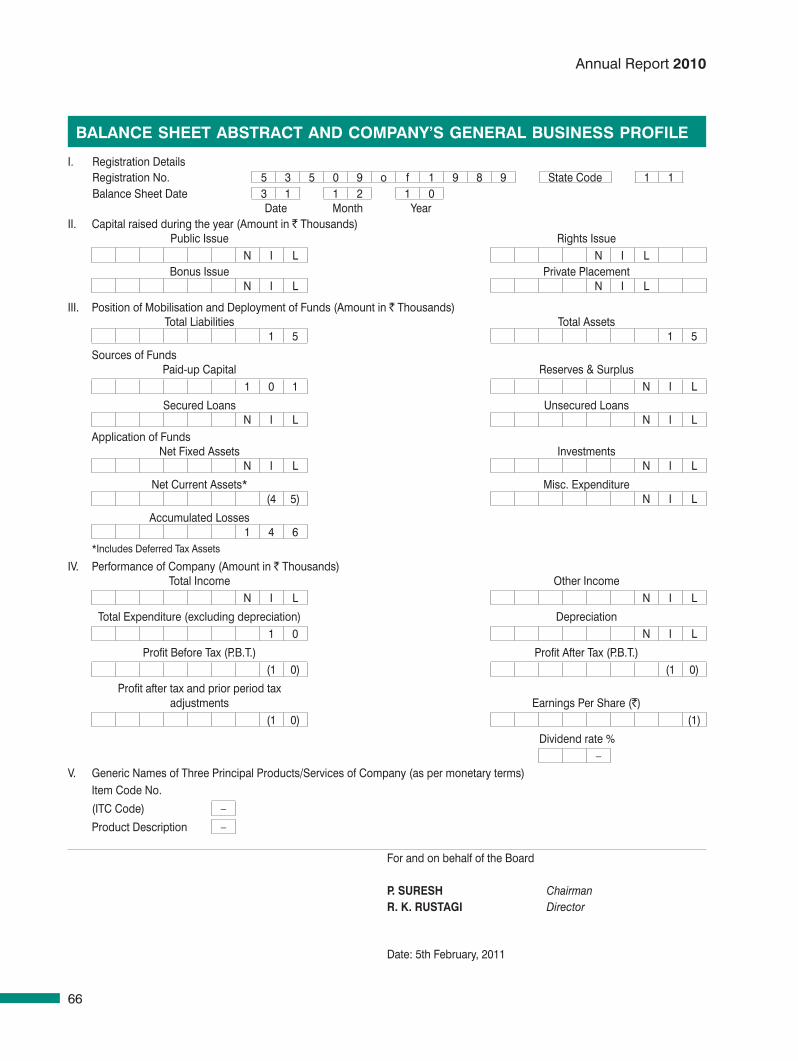
66
Annual Report 2010
I. Registration DetailsRegistration No. 5 3 5 0 9 o f 1 9 8 9 State Code 1 1 Balance Sheet Date 3 1 1 2 1 0
Date Month YearII. Capital raised during the year (Amount in ` Thousands)
Public Issue Rights IssueN I L N I L
Bonus Issue Private PlacementN I L N I L
III. Position of Mobilisation and Deployment of Funds (Amount in ` Thousands)Total Liabilities Total Assets
1 5 1 5
Sources of FundsPaid-up Capital Reserves & Surplus
1 0 1 N I L
Secured Loans Unsecured LoansN I L N I L
Application of FundsNet Fixed Assets Investments
N I L N I L
Net Current Assets* Misc. Expenditure (4 5) N I L
Accumulated Losses1 4 6
*Includes Deferred Tax Assets
IV. Performance of Company (Amount in ` Thousands)Total Income Other Income
N I L N I L
Total Expenditure (excluding depreciation) Depreciation1 0 N I L
Profit Before Tax (P.B.T.) Profit After Tax (P.B.T.)(1 0) (1 0)
Profit after tax and prior period tax adjustments Earnings Per Share (`)
(1 0) (1)
Dividend rate %–
V. Generic Names of Three Principal Products/Services of Company (as per monetary terms)Item Code No.
(ITC Code) –
Product Description –
For and on behalf of the Board
P. SURESH ChairmanR. K. RUSTAGI Director
Date: 5th February, 2011
BALANCE SHEET ABSTRACT AND COMPANY’S GENERAL BUSINESS PROFILE
Fulford Subsidiary.indd 66 3/29/2011 9:51:31 AM
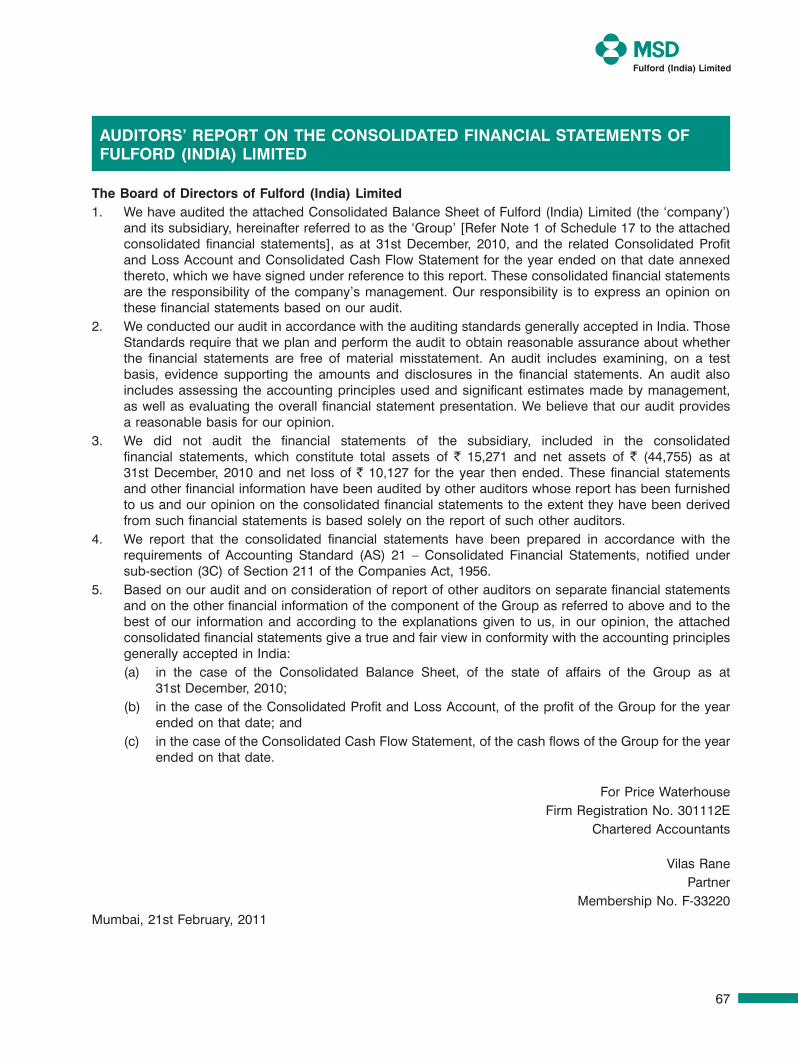
67
The Board of Directors of Fulford (India) Limited1. We have audited the attached Consolidated Balance Sheet of Fulford (India) Limited (the ‘company’)
and its subsidiary, hereinafter referred to as the ‘Group’ [Refer Note 1 of Schedule 17 to the attached consolidated financial statements], as at 31st December, 2010, and the related Consolidated Profit and Loss Account and Consolidated Cash Flow Statement for the year ended on that date annexed thereto, which we have signed under reference to this report. These consolidated financial statements are the responsibility of the company’s management. Our responsibility is to express an opinion on these financial statements based on our audit.
2. We conducted our audit in accordance with the auditing standards generally accepted in India. Those Standards require that we plan and perform the audit to obtain reasonable assurance about whether the financial statements are free of material misstatement. An audit includes examining, on a test basis, evidence supporting the amounts and disclosures in the financial statements. An audit also includes assessing the accounting principles used and significant estimates made by management, as well as evaluating the overall financial statement presentation. We believe that our audit provides a reasonable basis for our opinion.
3. We did not audit the financial statements of the subsidiary, included in the consolidated financial statements, which constitute total assets of ` 15,271 and net assets of ` (44,755) as at 31st December, 2010 and net loss of ` 10,127 for the year then ended. These financial statements and other financial information have been audited by other auditors whose report has been furnished to us and our opinion on the consolidated financial statements to the extent they have been derived from such financial statements is based solely on the report of such other auditors.
4. We report that the consolidated financial statements have been prepared in accordance with the requirements of Accounting Standard (AS) 21 – Consolidated Financial Statements, notified under sub-section (3C) of Section 211 of the Companies Act, 1956.
5. Based on our audit and on consideration of report of other auditors on separate financial statements and on the other financial information of the component of the Group as referred to above and to the best of our information and according to the explanations given to us, in our opinion, the attached consolidated financial statements give a true and fair view in conformity with the accounting principles generally accepted in India:
(a) in the case of the Consolidated Balance Sheet, of the state of affairs of the Group as at 31st December, 2010;
(b) in the case of the Consolidated Profit and Loss Account, of the profit of the Group for the year ended on that date; and
(c) in the case of the Consolidated Cash Flow Statement, of the cash flows of the Group for the year ended on that date.
For Price WaterhouseFirm Registration No. 301112E
Chartered Accountants
Vilas RanePartner
Membership No. F-33220Mumbai, 21st February, 2011
AuDITors’ reporT on The ConsoLIDATeD FInAnCIAL sTATemenTs oF FuLForD (InDIA) LImITeD
Consolidated.indd 67 3/29/2011 4:59:47 PM
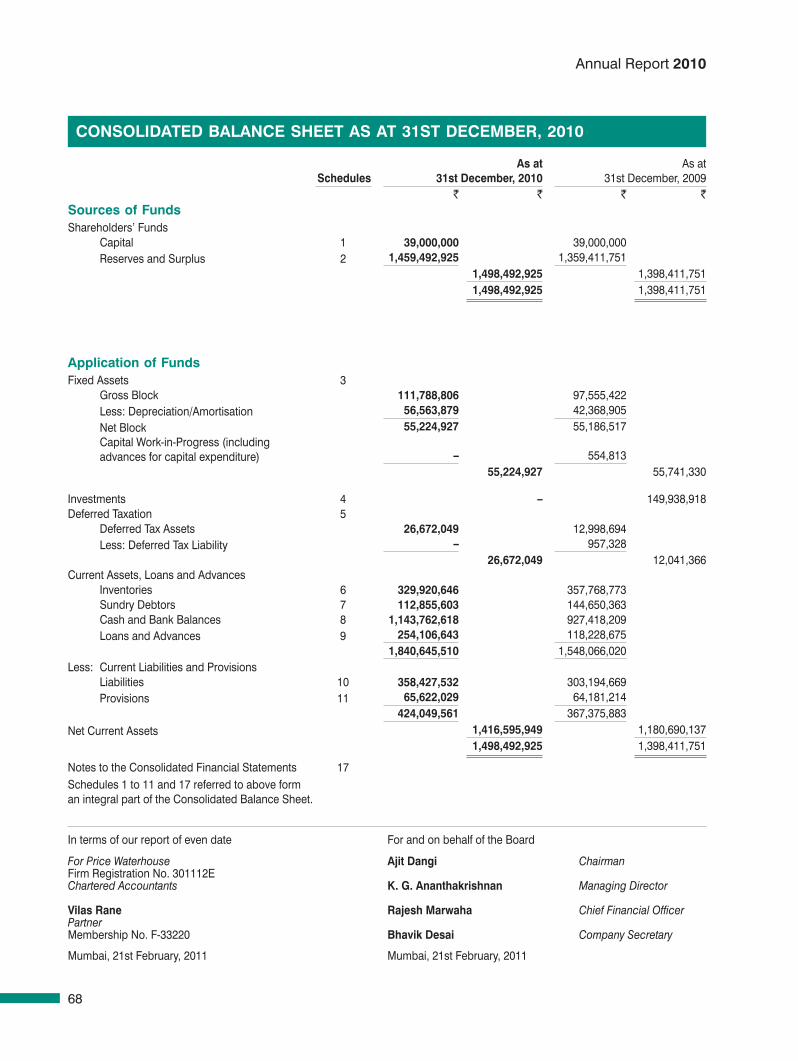
68
Annual Report 2010
schedules As at
31st December, 2010 As at
31st December, 2009 ` ` ` `
sources of FundsShareholders’ Funds Capital 1 39,000,000 39,000,000 Reserves and Surplus 2 1,459,492,925 1,359,411,751
1,498,492,925 1,398,411,751 1,498,492,925 1,398,411,751
Application of FundsFixed Assets 3 Gross Block 111,788,806 97,555,422 Less: Depreciation/Amortisation 56,563,879 42,368,905 Net Block 55,224,927 55,186,517 Capital Work-in-Progress (including
advances for capital expenditure) – 554,813 55,224,927 55,741,330
Investments 4 – 149,938,918 Deferred Taxation 5 Deferred Tax Assets 26,672,049 12,998,694 Less: Deferred Tax Liability – 957,328
26,672,049 12,041,366 Current Assets, Loans and Advances Inventories 6 329,920,646 357,768,773 Sundry Debtors 7 112,855,603 144,650,363 Cash and Bank Balances 8 1,143,762,618 927,418,209 Loans and Advances 9 254,106,643 118,228,675
1,840,645,510 1,548,066,020 Less: Current Liabilities and Provisions Liabilities 10 358,427,532 303,194,669 Provisions 11 65,622,029 64,181,214
424,049,561 367,375,883 Net Current Assets 1,416,595,949 1,180,690,137
1,498,492,925 1,398,411,751
Notes to the Consolidated Financial Statements 17Schedules 1 to 11 and 17 referred to above form an integral part of the Consolidated Balance Sheet.
In terms of our report of even date For and on behalf of the Board
For Price Waterhouse Ajit Dangi ChairmanFirm Registration No. 301112EChartered Accountants K. G. Ananthakrishnan Managing Director
Vilas rane rajesh marwaha Chief Financial OfficerPartnerMembership No. F-33220 Bhavik Desai Company Secretary
Mumbai, 21st February, 2011 Mumbai, 21st February, 2011
ConsoLIDATeD BALAnCe sheeT As AT 31sT DeCemBer, 2010
Consolidated.indd 68 3/29/2011 4:59:48 PM
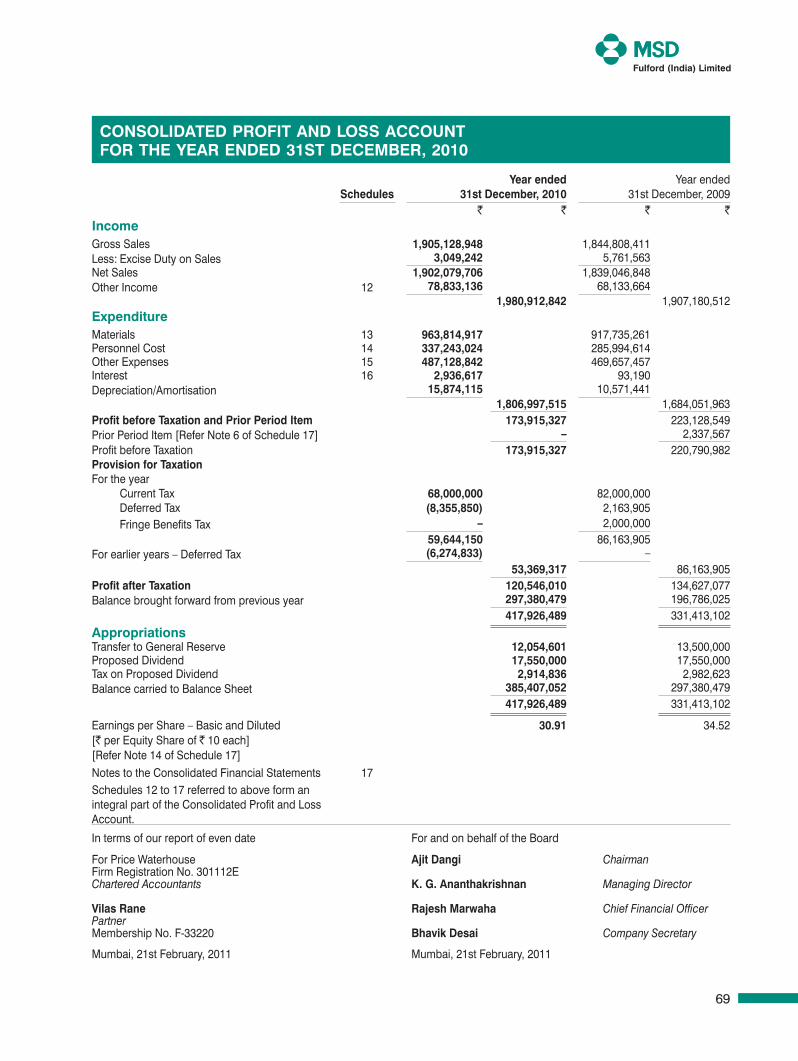
69
schedules Year ended
31st December, 2010 Year ended
31st December, 2009 ` ` ` `
IncomeGross Sales 1,905,128,948 1,844,808,411 Less: Excise Duty on Sales 3,049,242 5,761,563 Net Sales 1,902,079,706 1,839,046,848 Other Income 12 78,833,136 68,133,664
1,980,912,842 1,907,180,512 expenditureMaterials 13 963,814,917 917,735,261 Personnel Cost 14 337,243,024 285,994,614 Other Expenses 15 487,128,842 469,657,457 Interest 16 2,936,617 93,190 Depreciation/Amortisation 15,874,115 10,571,441
1,806,997,515 1,684,051,963 profit before Taxation and prior period Item 173,915,327 223,128,549 Prior Period Item [Refer Note 6 of Schedule 17] – 2,337,567 Profit before Taxation 173,915,327 220,790,982 provision for TaxationFor the year Current Tax 68,000,000 82,000,000 Deferred Tax (8,355,850) 2,163,905 Fringe Benefits Tax – 2,000,000
59,644,150 86,163,905 For earlier years – Deferred Tax (6,274,833) –
53,369,317 86,163,905 profit after Taxation 120,546,010 134,627,077 Balance brought forward from previous year 297,380,479 196,786,025
417,926,489 331,413,102 AppropriationsTransfer to General Reserve 12,054,601 13,500,000 Proposed Dividend 17,550,000 17,550,000 Tax on Proposed Dividend 2,914,836 2,982,623 Balance carried to Balance Sheet 385,407,052 297,380,479
417,926,489 331,413,102
Earnings per Share – Basic and Diluted 30.91 34.52 [` per Equity Share of ` 10 each][Refer Note 14 of Schedule 17]Notes to the Consolidated Financial Statements 17Schedules 12 to 17 referred to above form an integral part of the Consolidated Profit and Loss Account.
In terms of our report of even date For and on behalf of the Board
For Price Waterhouse Ajit Dangi ChairmanFirm Registration No. 301112EChartered Accountants K. G. Ananthakrishnan Managing Director
Vilas rane rajesh marwaha Chief Financial OfficerPartnerMembership No. F-33220 Bhavik Desai Company Secretary
Mumbai, 21st February, 2011 Mumbai, 21st February, 2011
ConsoLIDATeD proFIT AnD Loss ACCounT For The YeAr enDeD 31sT DeCemBer, 2010
Consolidated.indd 69 3/29/2011 4:59:49 PM
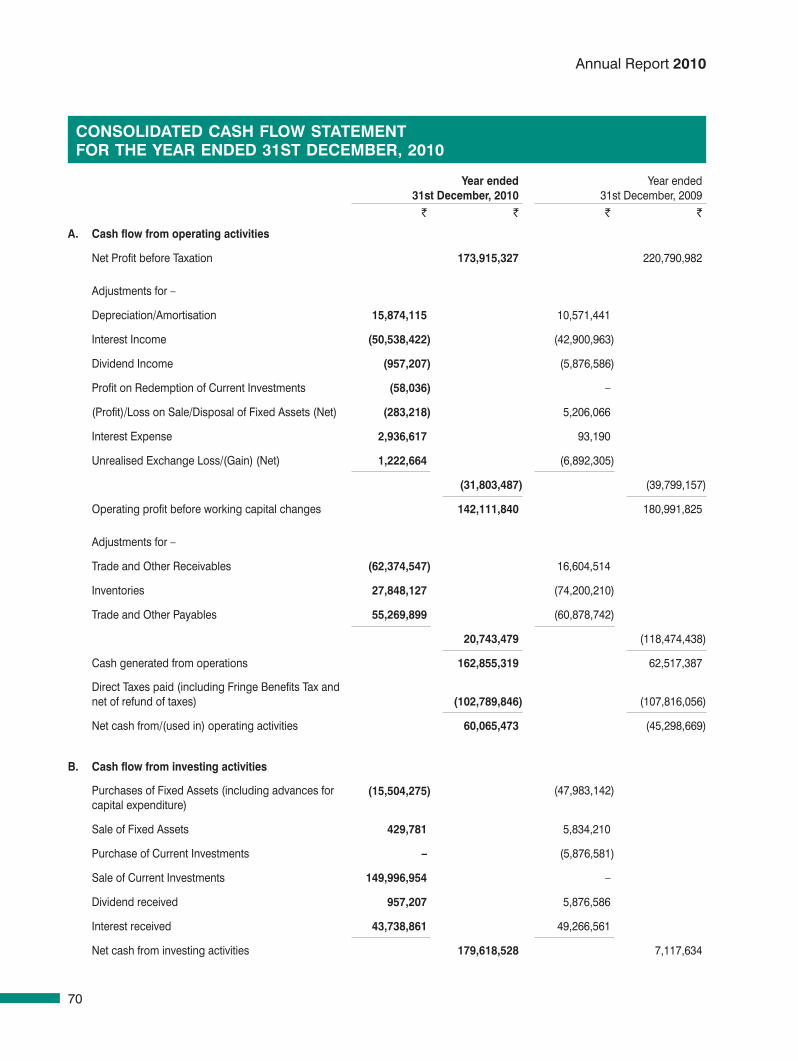
70
Annual Report 2010
Year ended 31st December, 2010
Year ended 31st December, 2009
` ` ` `
A. Cash flow from operating activities
Net Profit before Taxation 173,915,327 220,790,982
Adjustments for –
Depreciation/Amortisation 15,874,115 10,571,441
Interest Income (50,538,422) (42,900,963)
Dividend Income (957,207) (5,876,586)
Profit on Redemption of Current Investments (58,036) –
(Profit)/Loss on Sale/Disposal of Fixed Assets (Net) (283,218) 5,206,066
Interest Expense 2,936,617 93,190
Unrealised Exchange Loss/(Gain) (Net) 1,222,664 (6,892,305)
(31,803,487) (39,799,157)
Operating profit before working capital changes 142,111,840 180,991,825
Adjustments for –
Trade and Other Receivables (62,374,547) 16,604,514
Inventories 27,848,127 (74,200,210)
Trade and Other Payables 55,269,899 (60,878,742)
20,743,479 (118,474,438)
Cash generated from operations 162,855,319 62,517,387
Direct Taxes paid (including Fringe Benefits Tax and net of refund of taxes) (102,789,846) (107,816,056)
Net cash from/(used in) operating activities 60,065,473 (45,298,669)
B. Cash flow from investing activities
Purchases of Fixed Assets (including advances for capital expenditure)
(15,504,275) (47,983,142)
Sale of Fixed Assets 429,781 5,834,210
Purchase of Current Investments – (5,876,581)
Sale of Current Investments 149,996,954 –
Dividend received 957,207 5,876,586
Interest received 43,738,861 49,266,561
Net cash from investing activities 179,618,528 7,117,634
ConsoLIDATeD CAsh FLow sTATemenT For The YeAr enDeD 31sT DeCemBer, 2010
ConsoLIDATeD CAsh FLow sTATemenT For The YeAr enDeD 31sT DeCemBer, 2010
Consolidated.indd 70 3/29/2011 4:59:49 PM
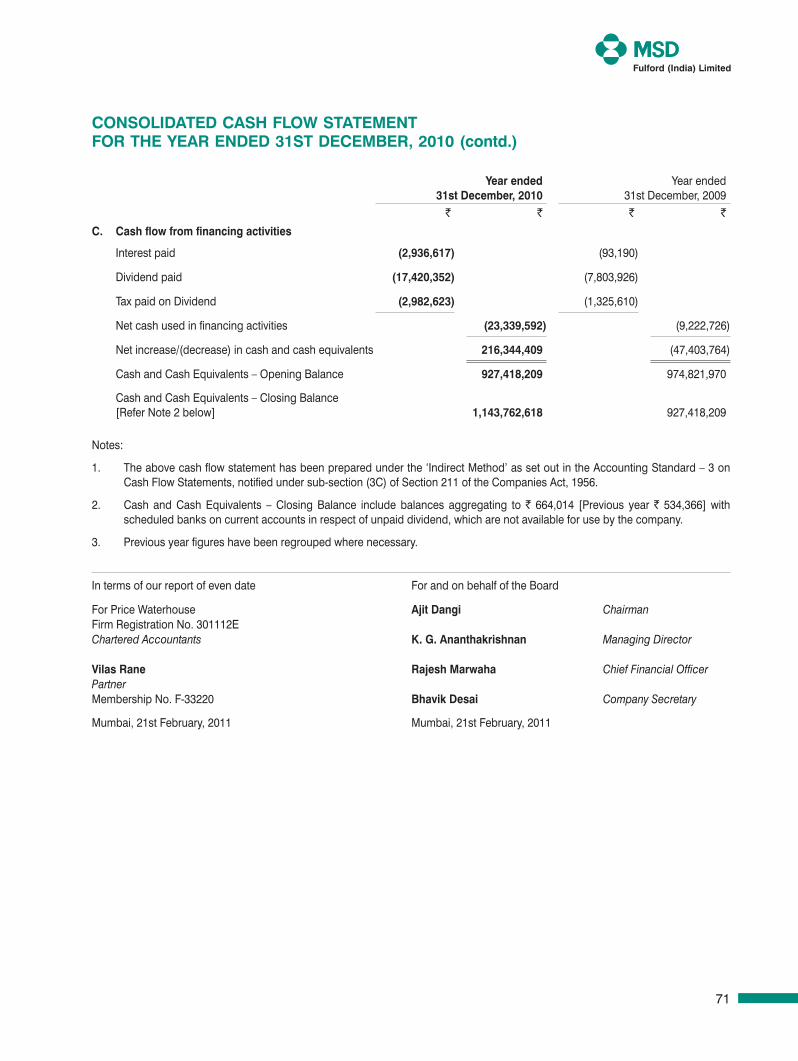
71
Year ended 31st December, 2010
Year ended 31st December, 2009
` ` ` `
C. Cash flow from financing activities
Interest paid (2,936,617) (93,190)
Dividend paid (17,420,352) (7,803,926)
Tax paid on Dividend (2,982,623) (1,325,610)
Net cash used in financing activities (23,339,592) (9,222,726)
Net increase/(decrease) in cash and cash equivalents 216,344,409 (47,403,764)
Cash and Cash Equivalents – Opening Balance 927,418,209 974,821,970
Cash and Cash Equivalents – Closing Balance [Refer Note 2 below] 1,143,762,618 927,418,209
Notes:
1. The above cash flow statement has been prepared under the ‘Indirect Method’ as set out in the Accounting Standard – 3 on Cash Flow Statements, notified under sub-section (3C) of Section 211 of the Companies Act, 1956.
2. Cash and Cash Equivalents – Closing Balance include balances aggregating to ` 664,014 [Previous year ` 534,366] with scheduled banks on current accounts in respect of unpaid dividend, which are not available for use by the company.
3. Previous year figures have been regrouped where necessary.
ConsoLIDATeD CAsh FLow sTATemenT For The YeAr enDeD 31sT DeCemBer, 2010 (contd.)
In terms of our report of even date For and on behalf of the Board
For Price Waterhouse Ajit Dangi ChairmanFirm Registration No. 301112EChartered Accountants K. G. Ananthakrishnan Managing Director
Vilas rane rajesh marwaha Chief Financial OfficerPartnerMembership No. F-33220 Bhavik Desai Company Secretary
Mumbai, 21st February, 2011 Mumbai, 21st February, 2011
Consolidated.indd 71 3/29/2011 4:59:49 PM
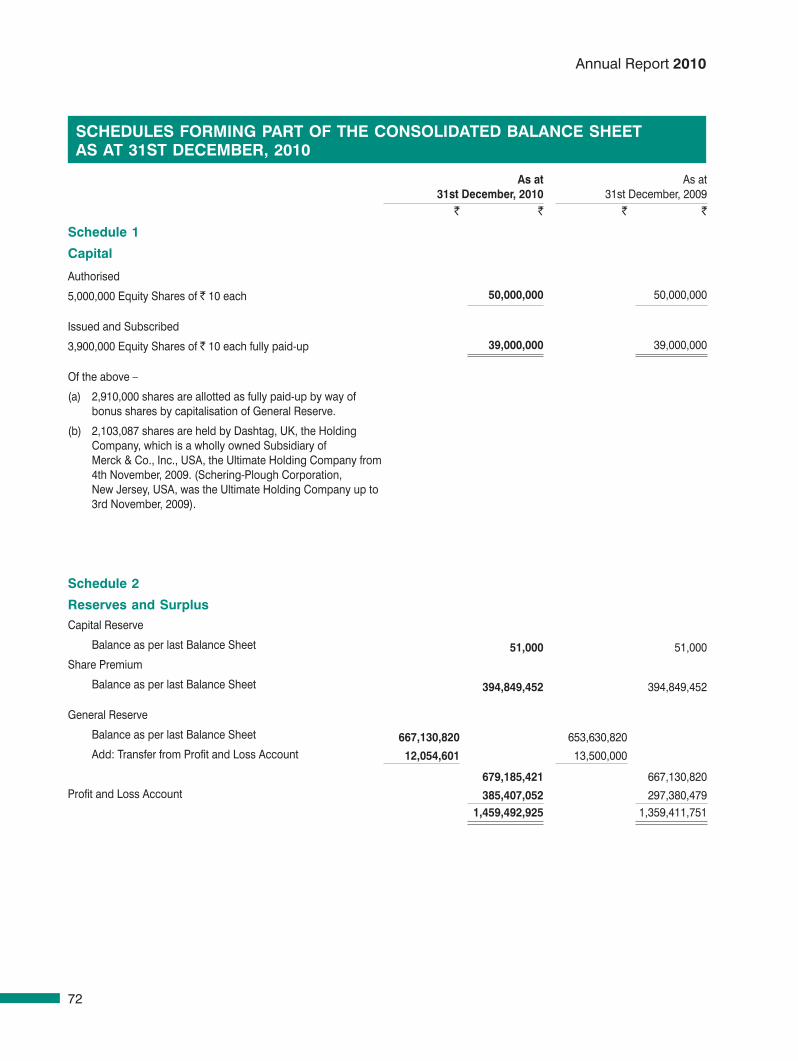
72
Annual Report 2010
As at 31st December, 2010
As at31st December, 2009
` ` ` `
schedule 1
Capital
Authorised
5,000,000 Equity Shares of ` 10 each 50,000,000 50,000,000
Issued and Subscribed
3,900,000 Equity Shares of ` 10 each fully paid-up 39,000,000 39,000,000
Of the above –
(a) 2,910,000 shares are allotted as fully paid-up by way of bonus shares by capitalisation of General Reserve.
(b) 2,103,087 shares are held by Dashtag, UK, the Holding Company, which is a wholly owned Subsidiary of Merck & Co., Inc., USA, the Ultimate Holding Company from 4th November, 2009. (Schering-Plough Corporation, New Jersey, USA, was the Ultimate Holding Company up to 3rd November, 2009).
schedule 2
reserves and surplusCapital Reserve
Balance as per last Balance Sheet 51,000 51,000 Share Premium
Balance as per last Balance Sheet 394,849,452 394,849,452
General Reserve
Balance as per last Balance Sheet 667,130,820 653,630,820 Add: Transfer from Profit and Loss Account 12,054,601 13,500,000
679,185,421 667,130,820 Profit and Loss Account 385,407,052 297,380,479
1,459,492,925 1,359,411,751
sCheDuLes FormInG pArT oF The ConsoLIDATeD BALAnCe sheeT As AT 31sT DeCemBer, 2010
Consolidated.indd 72 3/29/2011 4:59:50 PM
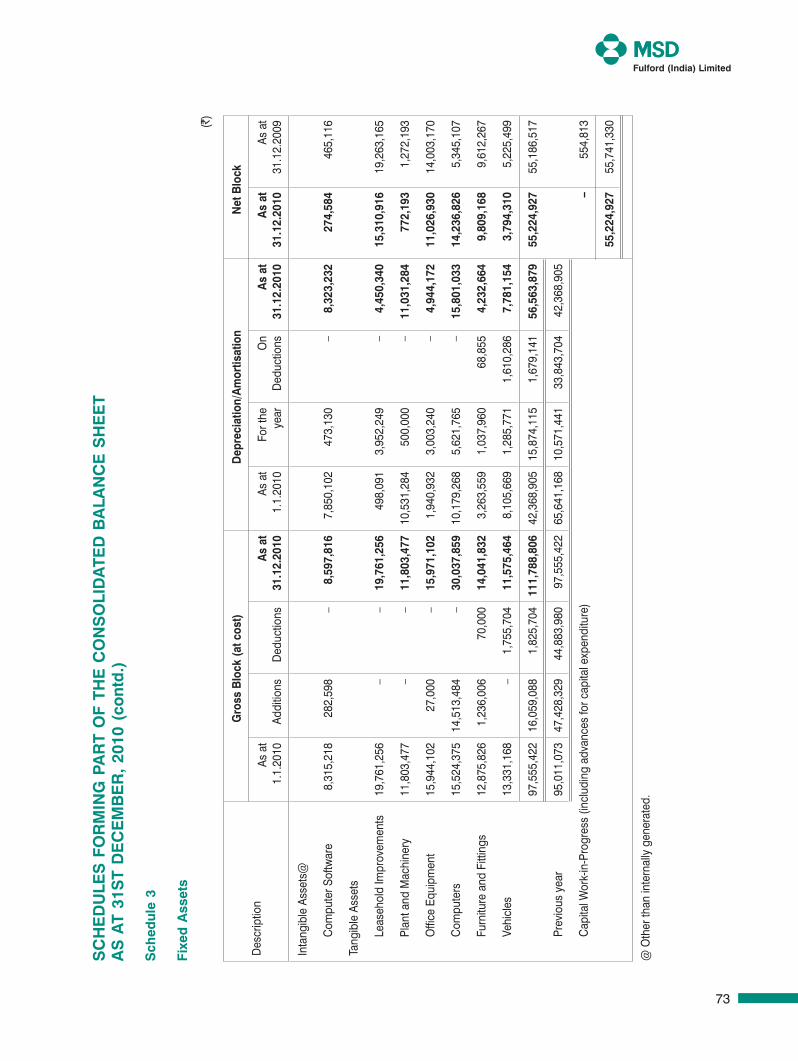
73
sC
he
Du
Les
Fo
rm
InG
pA
rT
oF
The
Co
ns
oLI
DA
TeD
BA
LAn
Ce
sh
ee
T A
s A
T 31
sT
De
Ce
mB
er
, 20
10 (
cont
d.)
sch
edul
e 3
Fixe
d A
sset
s
(`)
Des
crip
tion
Gro
ss B
lock
(at c
ost)
Dep
reci
atio
n/A
mor
tisat
ion
net
Blo
ck
As a
t 1
.1.2
010
Addi
tions
Ded
uctio
nsA
s at
31.
12.2
010
As a
t 1
.1.2
010
For t
heye
arO
nD
educ
tions
As
at 3
1.12
.201
0A
s at
31.
12.2
010
As a
t 3
1.12
.200
9
Inta
ngib
le A
sset
s@
Com
pute
r Sof
twar
e8,
315,
218
282
,598
–
8
,597
,816
7,
850,
102
473
,130
–
8
,323
,232
27
4,58
4 46
5,11
6
Tang
ible
Ass
ets
Leas
ehol
d Im
prov
emen
ts19
,761
,256
–
–
1
9,76
1,25
6 49
8,09
1 3
,952
,249
–
4
,450
,340
15
,310
,916
19
,263
,165
Plan
t and
Mac
hine
ry11
,803
,477
–
–
1
1,80
3,47
7 1
0,53
1,28
4 5
00,0
00
–
11,
031,
284
772,
193
1,27
2,19
3
Offi
ce E
quip
men
t15
,944
,102
2
7,00
0 –
1
5,97
1,10
2 1
,940
,932
3
,003
,240
–
4
,944
,172
11
,026
,930
14
,003
,170
Com
pute
rs15
,524
,375
1
4,51
3,48
4 –
3
0,03
7,85
9 1
0,17
9,26
8 5
,621
,765
–
1
5,80
1,03
3 14
,236
,826
5,
345,
107
Furn
iture
and
Fitt
ings
12,8
75,8
26
1,2
36,0
06
70,
000
14,
041,
832
3,2
63,5
59
1,0
37,9
60
68,
855
4,2
32,6
64
9,80
9,16
8 9,
612,
267
Vehi
cles
13,3
31,1
68
–
1,7
55,7
04
11,
575,
464
8,1
05,6
69
1,2
85,7
71
1,6
10,2
86
7,7
81,1
54
3,79
4,31
0 5,
225,
499
97,5
55,4
22
16,0
59,0
88
1,8
25,7
04
111,
788,
806
42,3
68,9
05
15,
874,
115
1,67
9,14
1 56
,563
,879
55
,224
,927
55
,186
,517
Prev
ious
yea
r95
,011
,073
47
,428
,329
44
,883
,980
97
,555
,422
65
,641
,168
10
,571
,441
33
,843
,704
42
,368
,905
Cap
ital W
ork-
in-P
rogr
ess
(incl
udin
g ad
vanc
es fo
r cap
ital e
xpen
ditu
re)
–
554
,813
55,
224,
927
55,
741,
330
@ O
ther
than
inte
rnal
ly g
ener
ated
.
Consolidated.indd 73 3/29/2011 4:59:50 PM
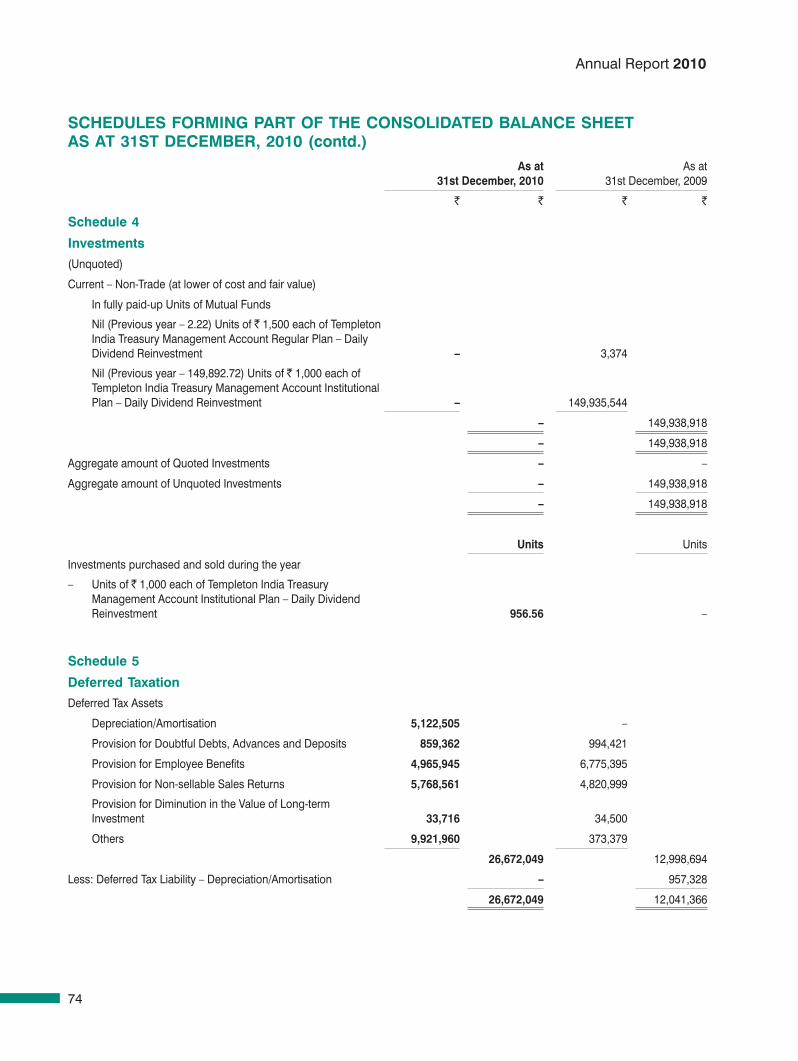
74
Annual Report 2010
As at 31st December, 2010
As at31st December, 2009
` ` ` `
schedule 4
Investments
(Unquoted)
Current – Non-Trade (at lower of cost and fair value)
In fully paid-up Units of Mutual Funds
Nil (Previous year – 2.22) Units of ` 1,500 each of Templeton India Treasury Management Account Regular Plan – Daily Dividend Reinvestment – 3,374
Nil (Previous year – 149,892.72) Units of ` 1,000 each of Templeton India Treasury Management Account Institutional Plan – Daily Dividend Reinvestment – 149,935,544
– 149,938,918
– 149,938,918
Aggregate amount of Quoted Investments – –
Aggregate amount of Unquoted Investments – 149,938,918
– 149,938,918
units Units
Investments purchased and sold during the year
– Units of ` 1,000 each of Templeton India Treasury Management Account Institutional Plan – Daily Dividend Reinvestment 956.56 –
schedule 5
Deferred Taxation
Deferred Tax Assets
Depreciation/Amortisation 5,122,505 –
Provision for Doubtful Debts, Advances and Deposits 859,362 994,421
Provision for Employee Benefits 4,965,945 6,775,395
Provision for Non-sellable Sales Returns 5,768,561 4,820,999
Provision for Diminution in the Value of Long-term Investment 33,716 34,500
Others 9,921,960 373,379
26,672,049 12,998,694
Less: Deferred Tax Liability – Depreciation/Amortisation – 957,328
26,672,049 12,041,366
sCheDuLes FormInG pArT oF The ConsoLIDATeD BALAnCe sheeT As AT 31sT DeCemBer, 2010 (contd.)
Consolidated.indd 74 3/29/2011 4:59:50 PM

75
sCheDuLes FormInG pArT oF The ConsoLIDATeD BALAnCe sheeT As AT 31sT DeCemBer, 2010 (contd.)
As at 31st December, 2010
As at31st December, 2009
` ` ` `
schedule 6
Inventories(At lower of cost and net realisable value)
Raw Materials 17,540,779 11,554,194
Packing Materials 5,322,513 3,166,346
Finished Goods 299,906,521 335,541,979
Samples 7,150,833 7,506,254
329,920,646 357,768,773
schedule 7
sundry DebtorsDebts outstanding for a period exceeding six months
Considered Good
Secured 591,873 552,255
Unsecured 7,702,140 3,150,885
8,294,013 3,703,140
Considered Doubtful 672 –
8,294,685 3,703,140
Other Debts – Considered Good
Secured 42,614 39,618
Unsecured 104,518,976 140,907,605
104,561,590 140,947,223
112,856,275 144,650,363
Less: Provision for Doubtful Debts 672 –
112,855,603 144,650,363
schedule 8
Cash and Bank BalancesCash on Hand 3,014 116,510
Cheques on Hand 6,869,734 –
Balances with Scheduled Banks
on Current Accounts 41,138,556 47,406,325
on Deposit Accounts 1,094,245,582 878,389,652
on Margin Money Accounts 1,505,722 1,505,722
1,136,889,870 927,301,699
1,143,762,618 927,418,209
Consolidated.indd 75 3/29/2011 4:59:50 PM
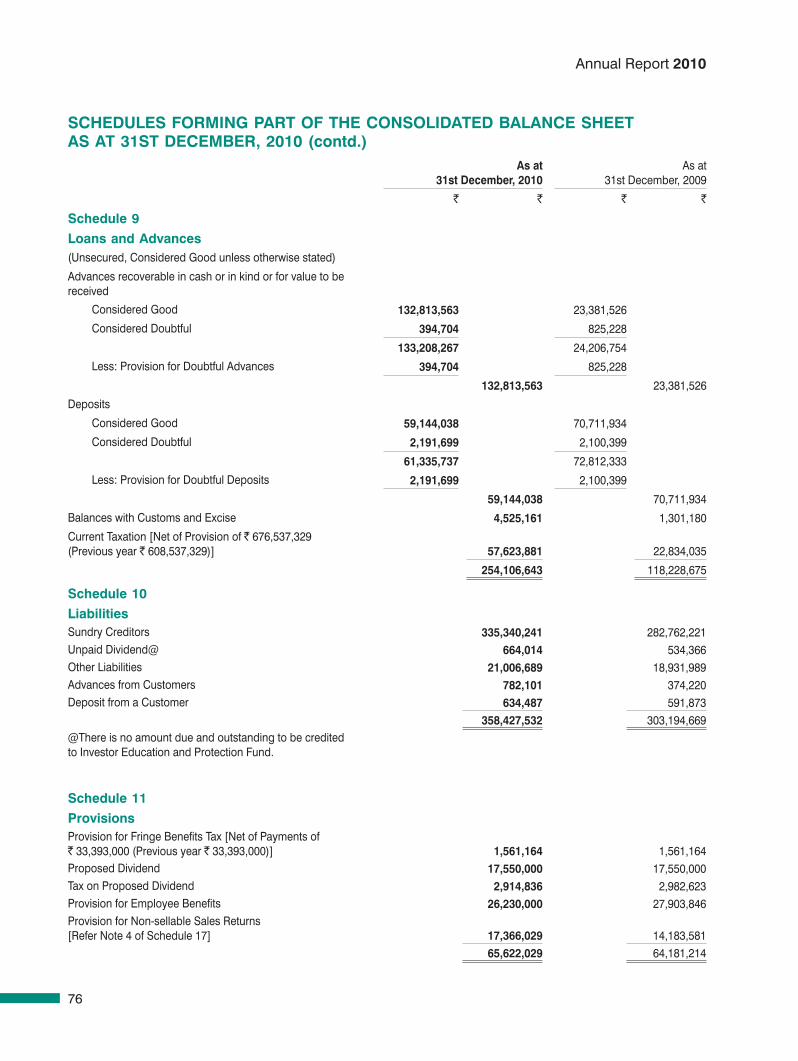
76
Annual Report 2010
As at 31st December, 2010
As at31st December, 2009
` ` ` `
schedule 9Loans and Advances(Unsecured, Considered Good unless otherwise stated)
Advances recoverable in cash or in kind or for value to be received
Considered Good 132,813,563 23,381,526
Considered Doubtful 394,704 825,228
133,208,267 24,206,754
Less: Provision for Doubtful Advances 394,704 825,228
132,813,563 23,381,526
Deposits
Considered Good 59,144,038 70,711,934
Considered Doubtful 2,191,699 2,100,399
61,335,737 72,812,333
Less: Provision for Doubtful Deposits 2,191,699 2,100,399
59,144,038 70,711,934
Balances with Customs and Excise 4,525,161 1,301,180
Current Taxation [Net of Provision of ` 676,537,329 (Previous year ` 608,537,329)] 57,623,881 22,834,035
254,106,643 118,228,675
sCheDuLes FormInG pArT oF The ConsoLIDATeD BALAnCe sheeT As AT 31sT DeCemBer, 2010 (contd.)
schedule 10LiabilitiesSundry Creditors 335,340,241 282,762,221Unpaid Dividend@ 664,014 534,366 Other Liabilities 21,006,689 18,931,989 Advances from Customers 782,101 374,220 Deposit from a Customer 634,487 591,873
358,427,532 303,194,669 @There is no amount due and outstanding to be credited to Investor Education and Protection Fund.
schedule 11provisionsProvision for Fringe Benefits Tax [Net of Payments of ` 33,393,000 (Previous year ` 33,393,000)] 1,561,164 1,561,164 Proposed Dividend 17,550,000 17,550,000 Tax on Proposed Dividend 2,914,836 2,982,623 Provision for Employee Benefits 26,230,000 27,903,846 Provision for Non-sellable Sales Returns [Refer Note 4 of Schedule 17] 17,366,029 14,183,581
65,622,029 64,181,214
Consolidated.indd 76 3/29/2011 4:59:51 PM
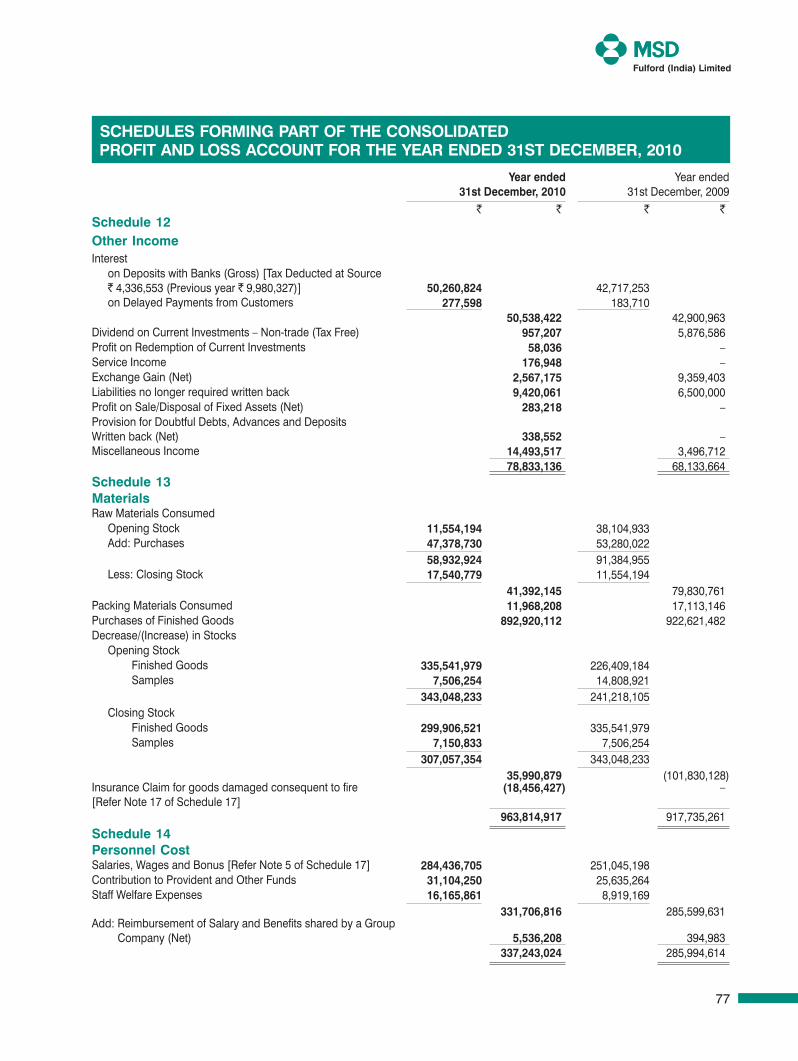
77
Year ended 31st December, 2010
Year ended31st December, 2009
` ` ` ` schedule 12other IncomeInterest
on Deposits with Banks (Gross) [Tax Deducted at Source ` 4,336,553 (Previous year ` 9,980,327)] 50,260,824 42,717,253 on Delayed Payments from Customers 277,598 183,710
50,538,422 42,900,963 Dividend on Current Investments – Non-trade (Tax Free) 957,207 5,876,586 Profit on Redemption of Current Investments 58,036 – Service Income 176,948 – Exchange Gain (Net) 2,567,175 9,359,403 Liabilities no longer required written back 9,420,061 6,500,000 Profit on Sale/Disposal of Fixed Assets (Net) 283,218 – Provision for Doubtful Debts, Advances and Deposits Written back (Net) 338,552 – Miscellaneous Income 14,493,517 3,496,712
78,833,136 68,133,664 schedule 13materialsRaw Materials Consumed
Opening Stock 11,554,194 38,104,933 Add: Purchases 47,378,730 53,280,022
58,932,924 91,384,955 Less: Closing Stock 17,540,779 11,554,194
41,392,145 79,830,761 Packing Materials Consumed 11,968,208 17,113,146 Purchases of Finished Goods 892,920,112 922,621,482 Decrease/(Increase) in Stocks
Opening Stock Finished Goods 335,541,979 226,409,184 Samples 7,506,254 14,808,921
343,048,233 241,218,105 Closing Stock Finished Goods 299,906,521 335,541,979 Samples 7,150,833 7,506,254
307,057,354 343,048,233 35,990,879 (101,830,128)
Insurance Claim for goods damaged consequent to fire [Refer Note 17 of Schedule 17]
(18,456,427) –
963,814,917 917,735,261 schedule 14personnel CostSalaries, Wages and Bonus [Refer Note 5 of Schedule 17] 284,436,705 251,045,198Contribution to Provident and Other Funds 31,104,250 25,635,264 Staff Welfare Expenses 16,165,861 8,919,169
331,706,816 285,599,631 Add: Reimbursement of Salary and Benefits shared by a Group
Company (Net) 5,536,208 394,983 337,243,024 285,994,614
sCheDuLes FormInG pArT oF The ConsoLIDATeD proFIT AnD Loss ACCounT For The YeAr enDeD 31sT DeCemBer, 2010
Consolidated.indd 77 3/29/2011 4:59:51 PM
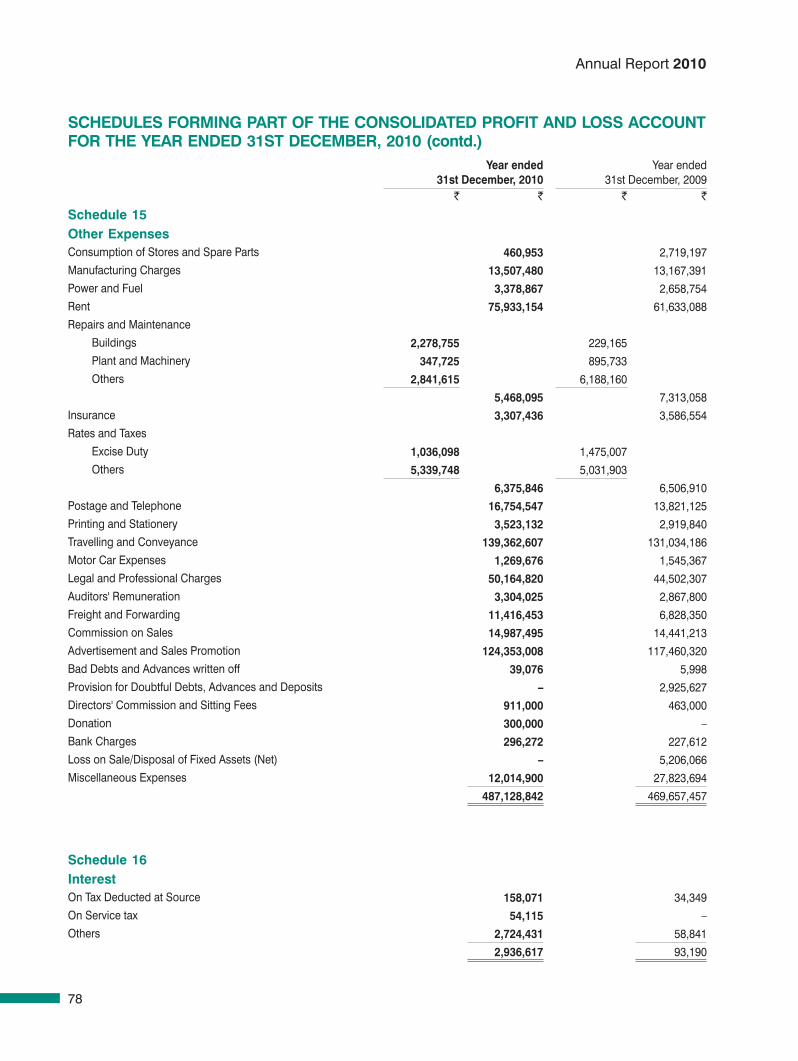
78
Annual Report 2010
sCheDuLes FormInG pArT oF The ConsoLIDATeD proFIT AnD Loss ACCounT For The YeAr enDeD 31sT DeCemBer, 2010 (contd.)
Year ended 31st December, 2010
Year ended31st December, 2009
` ` ` `
schedule 15other expensesConsumption of Stores and Spare Parts 460,953 2,719,197 Manufacturing Charges 13,507,480 13,167,391 Power and Fuel 3,378,867 2,658,754 Rent 75,933,154 61,633,088 Repairs and Maintenance
Buildings 2,278,755 229,165 Plant and Machinery 347,725 895,733 Others 2,841,615 6,188,160
5,468,095 7,313,058 Insurance 3,307,436 3,586,554 Rates and Taxes
Excise Duty 1,036,098 1,475,007 Others 5,339,748 5,031,903
6,375,846 6,506,910 Postage and Telephone 16,754,547 13,821,125 Printing and Stationery 3,523,132 2,919,840 Travelling and Conveyance 139,362,607 131,034,186 Motor Car Expenses 1,269,676 1,545,367 Legal and Professional Charges 50,164,820 44,502,307 Auditors' Remuneration 3,304,025 2,867,800 Freight and Forwarding 11,416,453 6,828,350 Commission on Sales 14,987,495 14,441,213 Advertisement and Sales Promotion 124,353,008 117,460,320 Bad Debts and Advances written off 39,076 5,998 Provision for Doubtful Debts, Advances and Deposits – 2,925,627 Directors' Commission and Sitting Fees 911,000 463,000 Donation 300,000 – Bank Charges 296,272 227,612 Loss on Sale/Disposal of Fixed Assets (Net) – 5,206,066 Miscellaneous Expenses 12,014,900 27,823,694
487,128,842 469,657,457
schedule 16InterestOn Tax Deducted at Source 158,071 34,349 On Service tax 54,115 – Others 2,724,431 58,841
2,936,617 93,190
Consolidated.indd 78 3/29/2011 4:59:52 PM
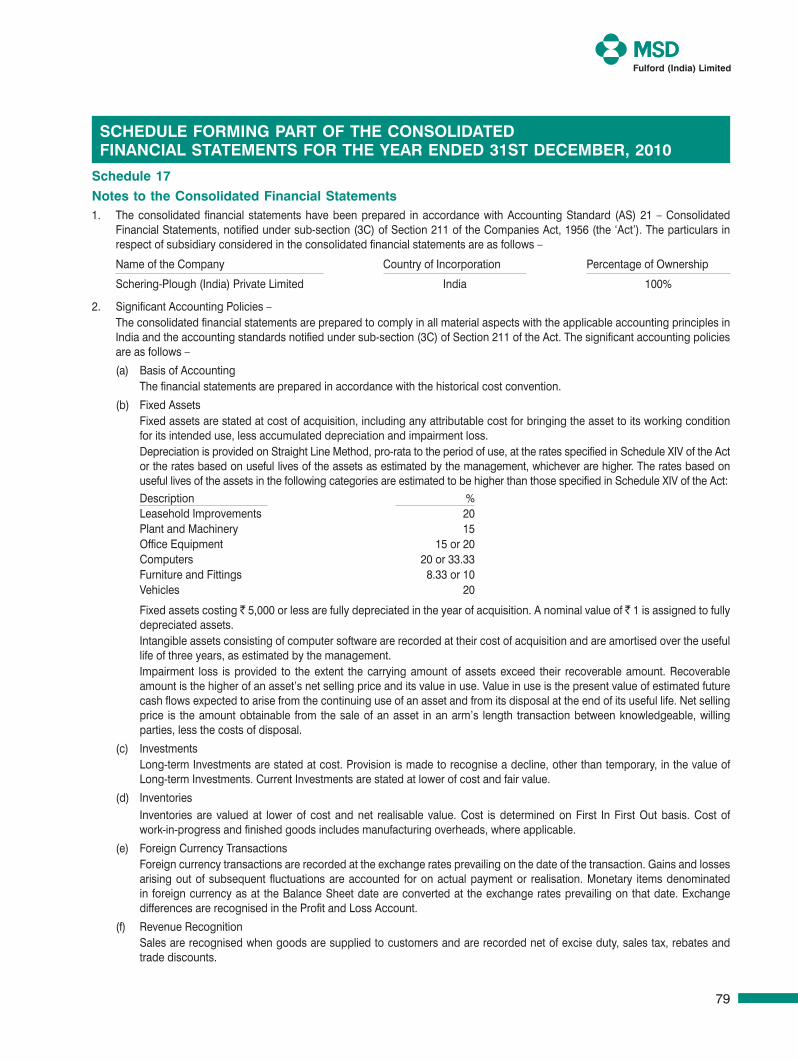
79
schedule 17notes to the Consolidated Financial statements1. The consolidated financial statements have been prepared in accordance with Accounting Standard (AS) 21 – Consolidated
Financial Statements, notified under sub-section (3C) of Section 211 of the Companies Act, 1956 (the ‘Act’). The particulars in respect of subsidiary considered in the consolidated financial statements are as follows –
Name of the Company Country of Incorporation Percentage of Ownership
Schering-Plough (India) Private Limited India 100%
2. Significant Accounting Policies – The consolidated financial statements are prepared to comply in all material aspects with the applicable accounting principles in
India and the accounting standards notified under sub-section (3C) of Section 211 of the Act. The significant accounting policies are as follows –
(a) Basis of Accounting The financial statements are prepared in accordance with the historical cost convention.
(b) Fixed Assets Fixed assets are stated at cost of acquisition, including any attributable cost for bringing the asset to its working condition
for its intended use, less accumulated depreciation and impairment loss. Depreciation is provided on Straight Line Method, pro-rata to the period of use, at the rates specified in Schedule XIV of the Act
or the rates based on useful lives of the assets as estimated by the management, whichever are higher. The rates based on useful lives of the assets in the following categories are estimated to be higher than those specified in Schedule XIV of the Act:Description %Leasehold Improvements 20Plant and Machinery 15Office Equipment 15 or 20Computers 20 or 33.33Furniture and Fittings 8.33 or 10Vehicles 20
Fixed assets costing ` 5,000 or less are fully depreciated in the year of acquisition. A nominal value of ` 1 is assigned to fully depreciated assets.
Intangible assets consisting of computer software are recorded at their cost of acquisition and are amortised over the useful life of three years, as estimated by the management.
Impairment loss is provided to the extent the carrying amount of assets exceed their recoverable amount. Recoverable amount is the higher of an asset’s net selling price and its value in use. Value in use is the present value of estimated future cash flows expected to arise from the continuing use of an asset and from its disposal at the end of its useful life. Net selling price is the amount obtainable from the sale of an asset in an arm’s length transaction between knowledgeable, willing parties, less the costs of disposal.
(c) Investments Long-term Investments are stated at cost. Provision is made to recognise a decline, other than temporary, in the value of
Long-term Investments. Current Investments are stated at lower of cost and fair value.
(d) Inventories Inventories are valued at lower of cost and net realisable value. Cost is determined on First In First Out basis. Cost of
work-in-progress and finished goods includes manufacturing overheads, where applicable.
(e) Foreign Currency Transactions Foreign currency transactions are recorded at the exchange rates prevailing on the date of the transaction. Gains and losses
arising out of subsequent fluctuations are accounted for on actual payment or realisation. Monetary items denominated in foreign currency as at the Balance Sheet date are converted at the exchange rates prevailing on that date. Exchange differences are recognised in the Profit and Loss Account.
(f) Revenue Recognition Sales are recognised when goods are supplied to customers and are recorded net of excise duty, sales tax, rebates and
trade discounts.
sCheDuLe FormInG pArT oF The ConsoLIDATeD FInAnCIAL sTATemenTs For The YeAr enDeD 31sT DeCemBer, 2010
Consolidated.indd 79 3/29/2011 4:59:52 PM
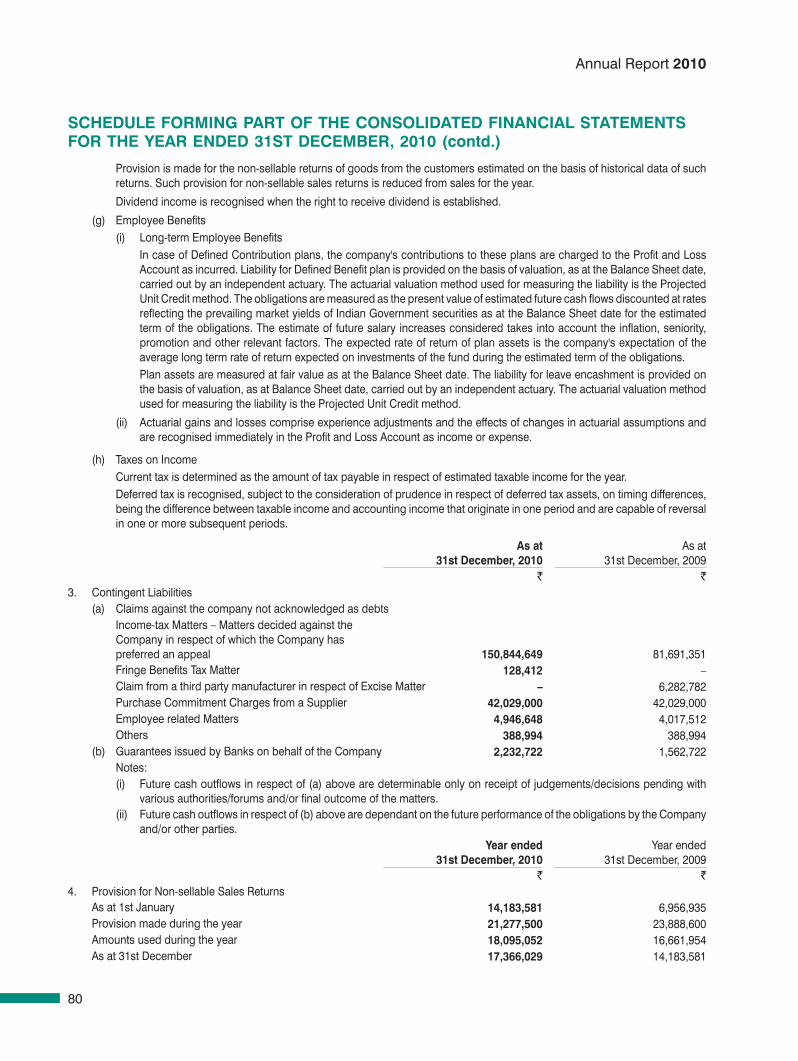
80
Annual Report 2010
Provision is made for the non-sellable returns of goods from the customers estimated on the basis of historical data of such returns. Such provision for non-sellable sales returns is reduced from sales for the year.
Dividend income is recognised when the right to receive dividend is established.
(g) Employee Benefits (i) Long-term Employee Benefits In case of Defined Contribution plans, the company's contributions to these plans are charged to the Profit and Loss
Account as incurred. Liability for Defined Benefit plan is provided on the basis of valuation, as at the Balance Sheet date, carried out by an independent actuary. The actuarial valuation method used for measuring the liability is the Projected Unit Credit method. The obligations are measured as the present value of estimated future cash flows discounted at rates reflecting the prevailing market yields of Indian Government securities as at the Balance Sheet date for the estimated term of the obligations. The estimate of future salary increases considered takes into account the inflation, seniority, promotion and other relevant factors. The expected rate of return of plan assets is the company's expectation of the average long term rate of return expected on investments of the fund during the estimated term of the obligations.
Plan assets are measured at fair value as at the Balance Sheet date. The liability for leave encashment is provided on the basis of valuation, as at Balance Sheet date, carried out by an independent actuary. The actuarial valuation method used for measuring the liability is the Projected Unit Credit method.
(ii) Actuarial gains and losses comprise experience adjustments and the effects of changes in actuarial assumptions and are recognised immediately in the Profit and Loss Account as income or expense.
(h) Taxes on Income Current tax is determined as the amount of tax payable in respect of estimated taxable income for the year. Deferred tax is recognised, subject to the consideration of prudence in respect of deferred tax assets, on timing differences,
being the difference between taxable income and accounting income that originate in one period and are capable of reversal in one or more subsequent periods.
As at31st December, 2010
As at31st December, 2009
` `3. Contingent Liabilities
(a) Claims against the company not acknowledged as debtsIncome-tax Matters – Matters decided against the Company in respect of which the Company has preferred an appeal 150,844,649 81,691,351 Fringe Benefits Tax Matter 128,412 –Claim from a third party manufacturer in respect of Excise Matter – 6,282,782 Purchase Commitment Charges from a Supplier 42,029,000 42,029,000 Employee related Matters 4,946,648 4,017,512 Others 388,994 388,994
(b) Guarantees issued by Banks on behalf of the Company 2,232,722 1,562,722 Notes:
(i) Future cash outflows in respect of (a) above are determinable only on receipt of judgements/decisions pending with various authorities/forums and/or final outcome of the matters.
(ii) Future cash outflows in respect of (b) above are dependant on the future performance of the obligations by the Company and/or other parties.
Year ended31st December, 2010
Year ended31st December, 2009
` `4. Provision for Non-sellable Sales Returns
As at 1st January 14,183,581 6,956,935 Provision made during the year 21,277,500 23,888,600 Amounts used during the year 18,095,052 16,661,954 As at 31st December 17,366,029 14,183,581
sCheDuLe FormInG pArT oF The ConsoLIDATeD FInAnCIAL sTATemenTs For The YeAr enDeD 31sT DeCemBer, 2010 (contd.)
Consolidated.indd 80 3/29/2011 4:59:52 PM
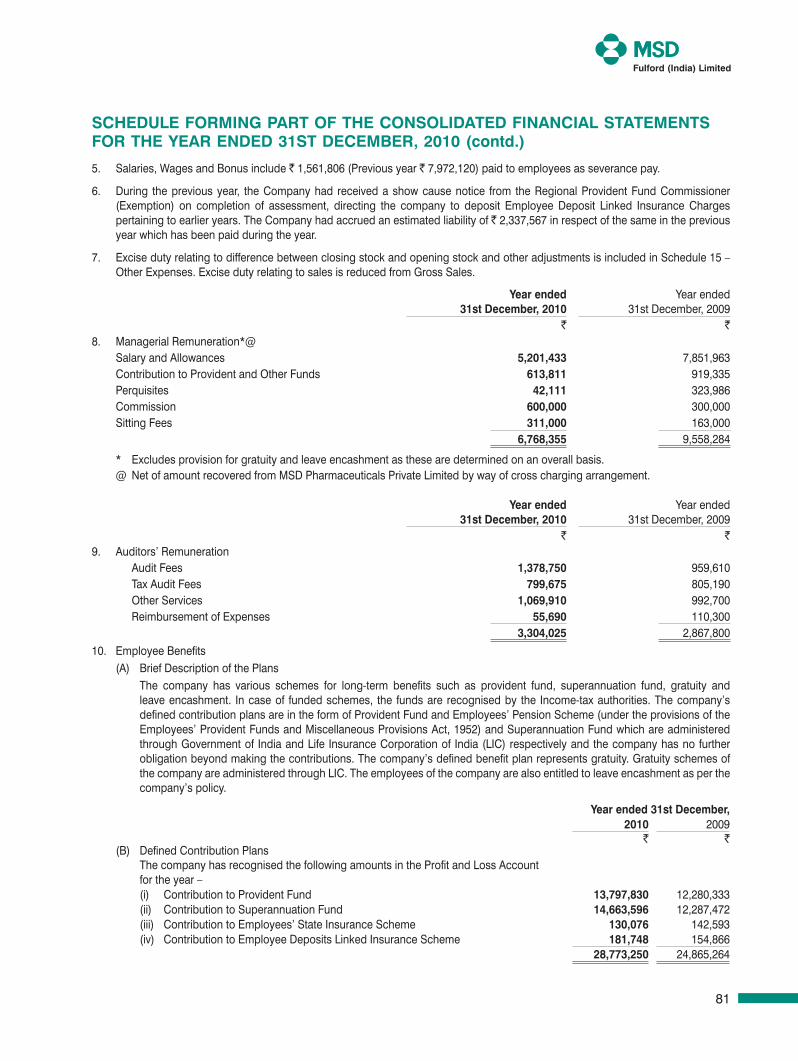
81
5. Salaries, Wages and Bonus include ` 1,561,806 (Previous year ` 7,972,120) paid to employees as severance pay.
6. During the previous year, the Company had received a show cause notice from the Regional Provident Fund Commissioner (Exemption) on completion of assessment, directing the company to deposit Employee Deposit Linked Insurance Charges pertaining to earlier years. The Company had accrued an estimated liability of ` 2,337,567 in respect of the same in the previous year which has been paid during the year.
7. Excise duty relating to difference between closing stock and opening stock and other adjustments is included in Schedule 15 – Other Expenses. Excise duty relating to sales is reduced from Gross Sales.
Year ended 31st December, 2010
Year ended 31st December, 2009
` `8. Managerial Remuneration*@
Salary and Allowances 5,201,433 7,851,963 Contribution to Provident and Other Funds 613,811 919,335 Perquisites 42,111 323,986 Commission 600,000 300,000 Sitting Fees 311,000 163,000
6,768,355 9,558,284
* Excludes provision for gratuity and leave encashment as these are determined on an overall basis.@ Net of amount recovered from MSD Pharmaceuticals Private Limited by way of cross charging arrangement.
Year ended 31st December, 2010
Year ended 31st December, 2009
` `9. Auditors’ Remuneration
Audit Fees 1,378,750 959,610 Tax Audit Fees 799,675 805,190 Other Services 1,069,910 992,700 Reimbursement of Expenses 55,690 110,300
3,304,025 2,867,800
10. Employee Benefits (A) Brief Description of the Plans The company has various schemes for long-term benefits such as provident fund, superannuation fund, gratuity and
leave encashment. In case of funded schemes, the funds are recognised by the Income-tax authorities. The company’s defined contribution plans are in the form of Provident Fund and Employees’ Pension Scheme (under the provisions of the Employees’ Provident Funds and Miscellaneous Provisions Act, 1952) and Superannuation Fund which are administered through Government of India and Life Insurance Corporation of India (LIC) respectively and the company has no further obligation beyond making the contributions. The company’s defined benefit plan represents gratuity. Gratuity schemes of the company are administered through LIC. The employees of the company are also entitled to leave encashment as per the company’s policy.
Year ended 31st December,2010 2009
` `(B) Defined Contribution Plans The company has recognised the following amounts in the Profit and Loss Account
for the year – (i) Contribution to Provident Fund 13,797,830 12,280,333 (ii) Contribution to Superannuation Fund 14,663,596 12,287,472 (iii) Contribution to Employees’ State Insurance Scheme 130,076 142,593 (iv) Contribution to Employee Deposits Linked Insurance Scheme 181,748 154,866
28,773,250 24,865,264
sCheDuLe FormInG pArT oF The ConsoLIDATeD FInAnCIAL sTATemenTs For The YeAr enDeD 31sT DeCemBer, 2010 (contd.)
Consolidated.indd 81 3/29/2011 4:59:52 PM
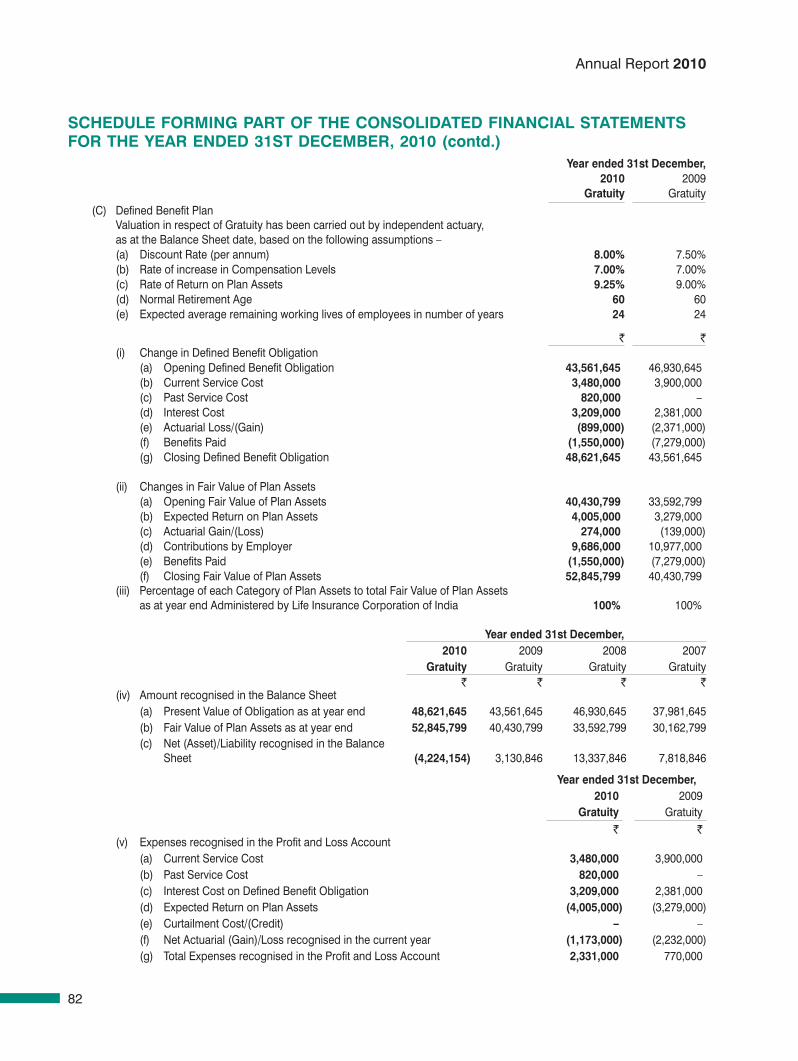
82
Annual Report 2010
Year ended 31st December,2010 2009
Gratuity Gratuity(C) Defined Benefit Plan Valuation in respect of Gratuity has been carried out by independent actuary,
as at the Balance Sheet date, based on the following assumptions – (a) Discount Rate (per annum) 8.00% 7.50% (b) Rate of increase in Compensation Levels 7.00% 7.00% (c) Rate of Return on Plan Assets 9.25% 9.00% (d) Normal Retirement Age 60 60 (e) Expected average remaining working lives of employees in number of years 24 24
` ` (i) Change in Defined Benefit Obligation (a) Opening Defined Benefit Obligation 43,561,645 46,930,645 (b) Current Service Cost 3,480,000 3,900,000 (c) Past Service Cost 820,000 – (d) Interest Cost 3,209,000 2,381,000 (e) Actuarial Loss/(Gain) (899,000) (2,371,000) (f) Benefits Paid (1,550,000) (7,279,000) (g) Closing Defined Benefit Obligation 48,621,645 43,561,645
(ii) Changes in Fair Value of Plan Assets (a) Opening Fair Value of Plan Assets 40,430,799 33,592,799 (b) Expected Return on Plan Assets 4,005,000 3,279,000 (c) Actuarial Gain/(Loss) 274,000 (139,000) (d) Contributions by Employer 9,686,000 10,977,000 (e) Benefits Paid (1,550,000) (7,279,000) (f) Closing Fair Value of Plan Assets 52,845,799 40,430,799 (iii) Percentage of each Category of Plan Assets to total Fair Value of Plan Assets
as at year end Administered by Life Insurance Corporation of India 100% 100%
Year ended 31st December,2010 2009 2008 2007
Gratuity Gratuity Gratuity Gratuity` ` ` `
(iv) Amount recognised in the Balance Sheet(a) Present Value of Obligation as at year end 48,621,645 43,561,645 46,930,645 37,981,645 (b) Fair Value of Plan Assets as at year end 52,845,799 40,430,799 33,592,799 30,162,799 (c) Net (Asset)/Liability recognised in the Balance
Sheet (4,224,154) 3,130,846 13,337,846 7,818,846
Year ended 31st December,2010 2009
Gratuity Gratuity ` `
(v) Expenses recognised in the Profit and Loss Account(a) Current Service Cost 3,480,000 3,900,000 (b) Past Service Cost 820,000 – (c) Interest Cost on Defined Benefit Obligation 3,209,000 2,381,000 (d) Expected Return on Plan Assets (4,005,000) (3,279,000)(e) Curtailment Cost/(Credit) – – (f) Net Actuarial (Gain)/Loss recognised in the current year (1,173,000) (2,232,000)(g) Total Expenses recognised in the Profit and Loss Account 2,331,000 770,000
sCheDuLe FormInG pArT oF The ConsoLIDATeD FInAnCIAL sTATemenTs For The YeAr enDeD 31sT DeCemBer, 2010 (contd.)
Consolidated.indd 82 3/29/2011 4:59:52 PM
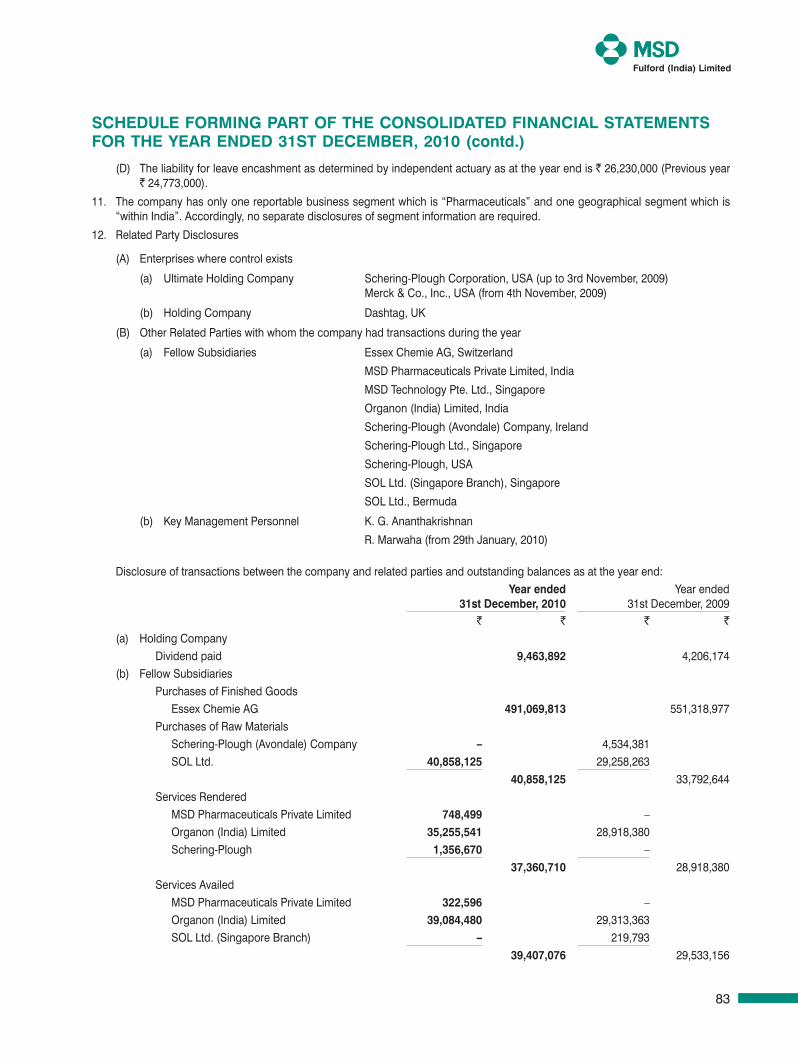
83
(D) The liability for leave encashment as determined by independent actuary as at the year end is ` 26,230,000 (Previous year ` 24,773,000).
11. The company has only one reportable business segment which is “Pharmaceuticals” and one geographical segment which is “within India”. Accordingly, no separate disclosures of segment information are required.
12. Related Party Disclosures
(A) Enterprises where control exists
(a) Ultimate Holding Company Schering-Plough Corporation, USA (up to 3rd November, 2009)Merck & Co., Inc., USA (from 4th November, 2009)
(b) Holding Company Dashtag, UK
(B) Other Related Parties with whom the company had transactions during the year
(a) Fellow Subsidiaries Essex Chemie AG, Switzerland
MSD Pharmaceuticals Private Limited, India
MSD Technology Pte. Ltd., Singapore
Organon (India) Limited, India
Schering-Plough (Avondale) Company, Ireland
Schering-Plough Ltd., Singapore
Schering-Plough, USA
SOL Ltd. (Singapore Branch), Singapore
SOL Ltd., Bermuda
(b) Key Management Personnel K. G. Ananthakrishnan
R. Marwaha (from 29th January, 2010)
Disclosure of transactions between the company and related parties and outstanding balances as at the year end: Year ended
31st December, 2010Year ended
31st December, 2009` ` ` `
(a) Holding Company Dividend paid 9,463,892 4,206,174
(b) Fellow Subsidiaries Purchases of Finished Goods Essex Chemie AG 491,069,813 551,318,977 Purchases of Raw Materials Schering-Plough (Avondale) Company – 4,534,381 SOL Ltd. 40,858,125 29,258,263
40,858,125 33,792,644 Services Rendered MSD Pharmaceuticals Private Limited 748,499 – Organon (India) Limited 35,255,541 28,918,380 Schering-Plough 1,356,670 –
37,360,710 28,918,380 Services Availed MSD Pharmaceuticals Private Limited 322,596 – Organon (India) Limited 39,084,480 29,313,363 SOL Ltd. (Singapore Branch) – 219,793
39,407,076 29,533,156
sCheDuLe FormInG pArT oF The ConsoLIDATeD FInAnCIAL sTATemenTs For The YeAr enDeD 31sT DeCemBer, 2010 (contd.)
Consolidated.indd 83 3/29/2011 4:59:53 PM
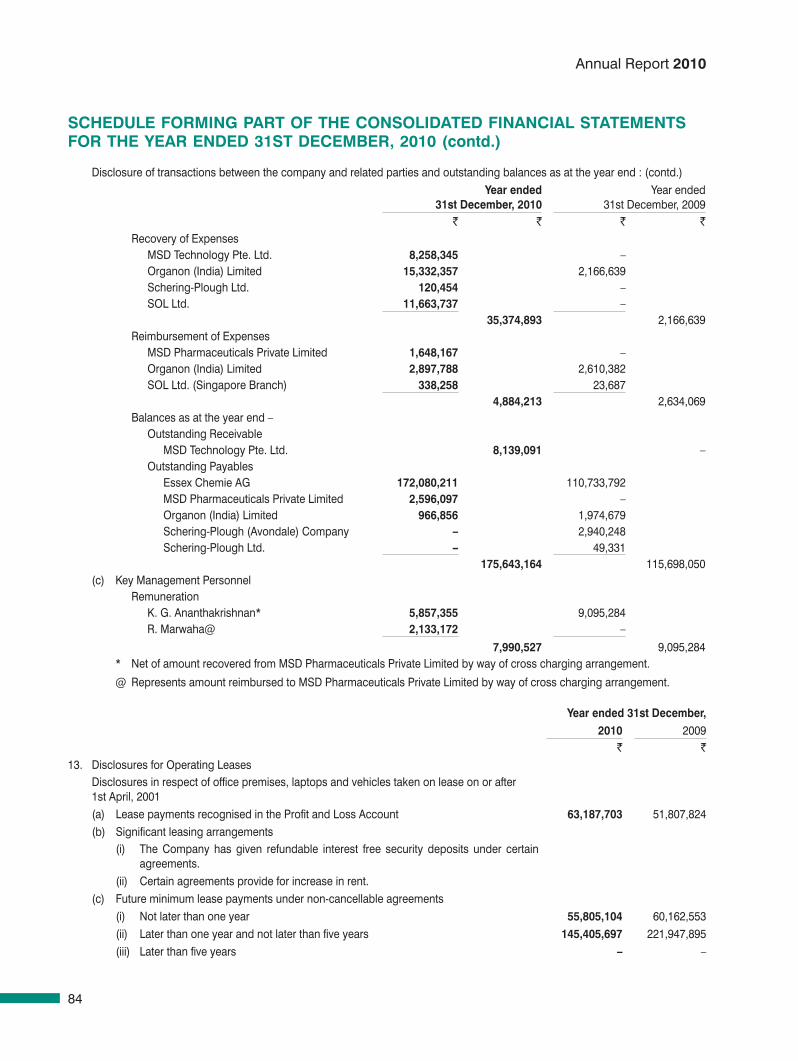
84
Annual Report 2010
Disclosure of transactions between the company and related parties and outstanding balances as at the year end : (contd.)Year ended
31st December, 2010Year ended
31st December, 2009` ` ` `
Recovery of Expenses MSD Technology Pte. Ltd. 8,258,345 – Organon (India) Limited 15,332,357 2,166,639 Schering-Plough Ltd. 120,454 – SOL Ltd. 11,663,737 –
35,374,893 2,166,639 Reimbursement of Expenses MSD Pharmaceuticals Private Limited 1,648,167 – Organon (India) Limited 2,897,788 2,610,382 SOL Ltd. (Singapore Branch) 338,258 23,687
4,884,213 2,634,069 Balances as at the year end – Outstanding Receivable MSD Technology Pte. Ltd. 8,139,091 – Outstanding Payables Essex Chemie AG 172,080,211 110,733,792 MSD Pharmaceuticals Private Limited 2,596,097 – Organon (India) Limited 966,856 1,974,679 Schering-Plough (Avondale) Company – 2,940,248 Schering-Plough Ltd. – 49,331
175,643,164 115,698,050 (c) Key Management Personnel
Remuneration K. G. Ananthakrishnan* 5,857,355 9,095,284 R. Marwaha@ 2,133,172 –
7,990,527 9,095,284* Net of amount recovered from MSD Pharmaceuticals Private Limited by way of cross charging arrangement.
@ Represents amount reimbursed to MSD Pharmaceuticals Private Limited by way of cross charging arrangement.
Year ended 31st December,2010 2009
` `13. Disclosures for Operating Leases
Disclosures in respect of office premises, laptops and vehicles taken on lease on or after 1st April, 2001(a) Lease payments recognised in the Profit and Loss Account 63,187,703 51,807,824 (b) Significant leasing arrangements
(i) The Company has given refundable interest free security deposits under certain agreements.
(ii) Certain agreements provide for increase in rent.(c) Future minimum lease payments under non-cancellable agreements
(i) Not later than one year 55,805,104 60,162,553 (ii) Later than one year and not later than five years 145,405,697 221,947,895 (iii) Later than five years – –
sCheDuLe FormInG pArT oF The ConsoLIDATeD FInAnCIAL sTATemenTs For The YeAr enDeD 31sT DeCemBer, 2010 (contd.)
Consolidated.indd 84 3/29/2011 4:59:53 PM
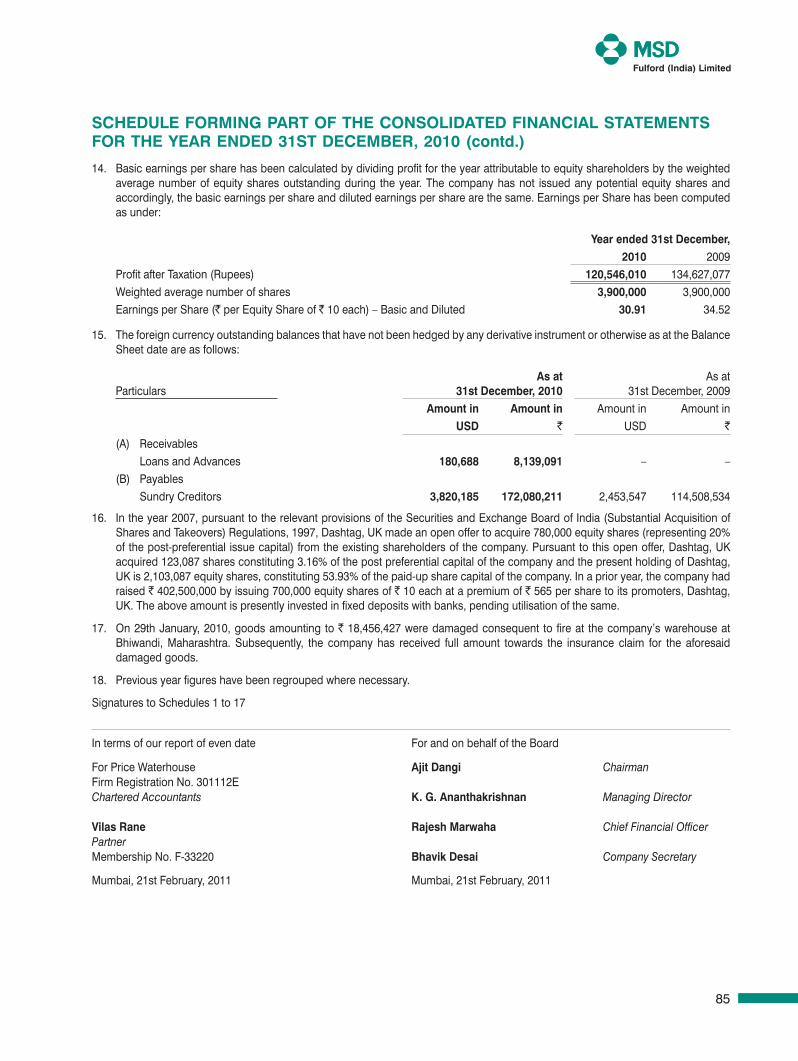
85
14. Basic earnings per share has been calculated by dividing profit for the year attributable to equity shareholders by the weighted average number of equity shares outstanding during the year. The company has not issued any potential equity shares and accordingly, the basic earnings per share and diluted earnings per share are the same. Earnings per Share has been computed as under:
Year ended 31st December, 2010 2009
Profit after Taxation (Rupees) 120,546,010 134,627,077 Weighted average number of shares 3,900,000 3,900,000 Earnings per Share (` per Equity Share of ` 10 each) – Basic and Diluted 30.91 34.52
15. The foreign currency outstanding balances that have not been hedged by any derivative instrument or otherwise as at the Balance Sheet date are as follows:
Particulars As at
31st December, 2010 As at
31st December, 2009 Amount in Amount in Amount in Amount in
usD ` USD `
(A) ReceivablesLoans and Advances 180,688 8,139,091 – –
(B) PayablesSundry Creditors 3,820,185 172,080,211 2,453,547 114,508,534
16. In the year 2007, pursuant to the relevant provisions of the Securities and Exchange Board of India (Substantial Acquisition of Shares and Takeovers) Regulations, 1997, Dashtag, UK made an open offer to acquire 780,000 equity shares (representing 20% of the post-preferential issue capital) from the existing shareholders of the company. Pursuant to this open offer, Dashtag, UK acquired 123,087 shares constituting 3.16% of the post preferential capital of the company and the present holding of Dashtag, UK is 2,103,087 equity shares, constituting 53.93% of the paid-up share capital of the company. In a prior year, the company had raised ` 402,500,000 by issuing 700,000 equity shares of ` 10 each at a premium of ` 565 per share to its promoters, Dashtag, UK. The above amount is presently invested in fixed deposits with banks, pending utilisation of the same.
17. On 29th January, 2010, goods amounting to ` 18,456,427 were damaged consequent to fire at the company’s warehouse at Bhiwandi, Maharashtra. Subsequently, the company has received full amount towards the insurance claim for the aforesaid damaged goods.
18. Previous year figures have been regrouped where necessary.
Signatures to Schedules 1 to 17
sCheDuLe FormInG pArT oF The ConsoLIDATeD FInAnCIAL sTATemenTs For The YeAr enDeD 31sT DeCemBer, 2010 (contd.)
In terms of our report of even date For and on behalf of the Board
For Price Waterhouse Ajit Dangi ChairmanFirm Registration No. 301112EChartered Accountants K. G. Ananthakrishnan Managing Director
Vilas rane rajesh marwaha Chief Financial OfficerPartnerMembership No. F-33220 Bhavik Desai Company Secretary
Mumbai, 21st February, 2011 Mumbai, 21st February, 2011
Consolidated.indd 85 3/29/2011 4:59:53 PM