Embed Size (px)
Citation preview

University of Massachusetts Amherst University of Massachusetts Amherst
ScholarWorks@UMass Amherst ScholarWorks@UMass Amherst
Doctoral Dissertations 1896 - February 2014
1-1-1975
Formal classroom evaluation. Formal classroom evaluation.
William A. Bowers University of Massachusetts Amherst
Follow this and additional works at: https://scholarworks.umass.edu/dissertations_1
Recommended Citation Recommended Citation Bowers, William A., "Formal classroom evaluation." (1975). Doctoral Dissertations 1896 - February 2014. 4596. https://scholarworks.umass.edu/dissertations_1/4596
This Open Access Dissertation is brought to you for free and open access by ScholarWorks@UMass Amherst. It has been accepted for inclusion in Doctoral Dissertations 1896 - February 2014 by an authorized administrator of ScholarWorks@UMass Amherst. For more information, please contact [email protected].

FORMAL CLASSROOM EVALUATION
A Dissertation Presented
by
WILLIAM A. BOWERS
Submitted to the Graduate School of the University of Massachusetts
in partial fulfillment of the requirements for the degree of
DOCTOR OP EDUCATION
December, 1975
Major Subject; Evaluation
FORMAL CLASSROOM EVALUATION
A Dissertation
By
WILLIAM A. BOWERS
Approved as to style and content by:
Dr. William P. Gorth, Chairperson of Committee
Dr. Leverne J. Thelen, Member
Dr. Louis Fischer, Acting Dean School of Education
ii
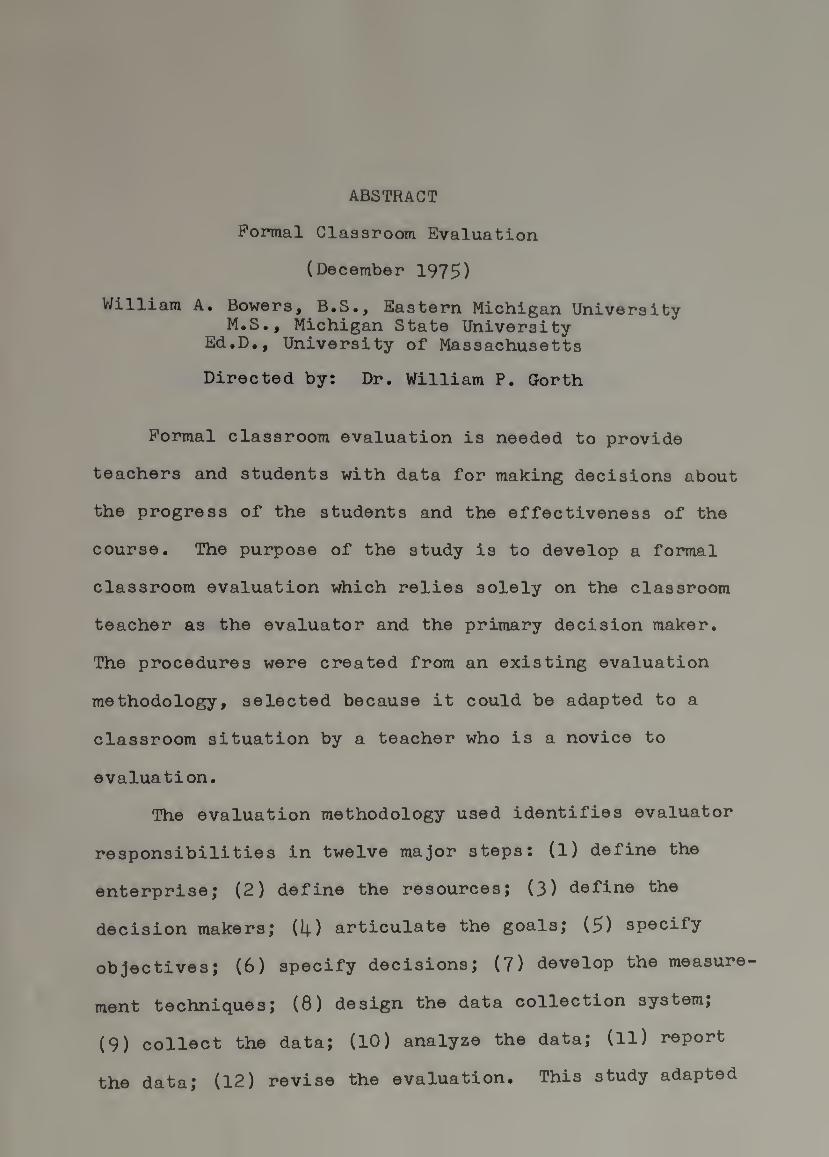
ABSTRACT
Formal Classroom Evaluation
(December 1975)
William A. Bowers, B.S., Eastern Michigan University M.S., Michigan State University
Ed.D., University of Massachusetts
Directed by: Dr. William P. Grorth
Formal classroom evaluation is needed to provide
teachers and students with data for making decisions about
the progress of the students and the effectiveness of the
course. The purpose of the study is to develop a formal
classroom evaluation which relies solely on the classroom
teacher as the evaluator and the primary decision maker.
The procedures were created from an existing evaluation
methodology, selected because it could be adapted to a
classroom situation by a teacher who is a novice to
evaluation.
The evaluation methodology used identifies evaluator
responsibilities in twelve major steps: (1) define the
enterprise; (2) define the resources; (3) define the
decision makers; (4) articulate the goals; (5) specify
objectives; (6) specify decisions; (7) develop the measure¬
ment techniques; (8) design the data collection system;
(9) collect the data; (10) analyze the data; (11) report
the data; (12) revise the evaluation. This study adapted

each step to separate evaluator roles from the decision
maker roles of a classroom teacher.
As the researcher created the initial evaluation
design the enterprise was defined to be a particular course.
A teacher’s available time became the major resource for
evaluation. The decision makers were defined as the
teacher and the students in the course. Three forms were
developed as aids in articulating goals and specifying
objectives. Desired decision areas were identified and
criterion-referenced tests were developed for the cognitive
content of the course. An assessment form was developed
for the instructional materials in the course. Separate
data collection systems were designed for the cognitive con¬
tent and the instructional materials. The study was limited to
liie cognitive content and the instructional materials.
The researcher collected, analyzed and reported data
during a one-semester implementation of the course. At
each test administration, responses to test items were
collected, corrected and reported to each student. Indi¬
vidual student achievement was recorded on a form,
summarized and reported to the students and to the teacher.
The number of times each wrong answer had been selected
was recorded on a form, summarized and reported to the
teacher. The data were provided for making decisions about
the course and students. At each lab, individual student
responses about instructional materials were collected by
iv
a questionnaire and sutnmarized on a form. These results
provided data for making decisions about instructional
materials.
At the end of the course, the researcher prepared a
report on the evaluation design. It identified the data
used, or not used, in making decisions and the decisions
made without data. The researcher used the report as a
guide in interacting with the students about desired
revisions to the evaluation design. Goals and objectives
for instructional materials were respecified. Decision
areas were extended and decision alternatives were
specified. The initial design was revised to collect and
report data which are closely related to the specified
decision alternatives.
The study demonstrates how one teacher identified and
separated evaluator roles from decision maker roles by
systematic consideration of each aspect of evaluation. The
procedure was crucial to successful formal classroom
evaluation in the study and is the major contribution of
the study. An additional contribution is the revised eval¬
uation design which may be adapted as an initial design by
another teacher. Many teachers need to try out the revised
design in a variety of classroom situations before the
contributions of the study can be generalized. A manual,
based on the results of the study, is being prepared for
classroom teachers.
V
TABLE OP CONTENTS
LIST OP PIGURES
Page
viii
Chapter
I. STATEMENT OP THE PROBLEM.
Need for Pormal Classroom Evaluation*• The Roles of the Decision Maker and
the Evaluator... Purpose of the Study. The Approach to the Problem. Emphasis of Evaluation. Summary.
II. THE EVALUATION METHODOLOGY.
Evaluation Perspectives... Literature Review... Comprehensive Achievement Monitoring* .*•. The Evaluation Strategy.. Summary..
III. CREATING THE INITIAL DESIGN..
Part I - The Initial Design for Cognitive Content**.*..
Part II- The Initial Design for Instructional Materials.
Summary.*.
IV. OPERATION OP THE EVALUATION DESIGN.
Step 9 - Collect the Data. Step 10- Analyze the Data*.. Step 11- Report the Data. Comments on Time Required for Evaluation Comments on Decisions Made Prom Reported Data..... Summary.
1
2
5 6 8
11
13
21 22 48
49
51
87 91 96
109
111 112
Vi
Chapter Pag©
V. REVISING THE EVALUATION. II3
Evaluation of Evaluation. II3 Decisions on Redesign. 118 Revising the Initial Design. 120 Summary. I33
VI. CONCLUSIONS AND IMPLICATIONS. 134
Summary. I34 Conclusions. 135 Implications. I36
APPENDIX 1. 140
APPENDIX II. 157
APPENDIX III. 170
BIBLIOGRAPHY. 176
vii
LIST OP FIGURES
Figure Page
1. Group Achievement Summary (in text).
2. Wrong Answer Tally (in text).
3. A Course Outline..
4. e Topic Analysis Form. £,0
5* Task Analysis Form. 62
6. The Objectives. 6i^.
7. Goals for Instructional Materials. 77
8. The Objectives for Instructional Materials. 79
9. Assessment Form for Instructional Materials. 82
10. Assessment Form for Texts. 83
11. Sample Data Collected on Content Objectives (in text). 89
12. Data Collected on Texts for Lab 1. 90
13. Data Collected on Labs on TV Tapes. 92
14. Data Reported to an Individual Student (in text). 97
15. Data Reported to the Group of Students. 99
16. Data Reported to Teacher on Achievement.100
17. The Wrong Answer Tally. 101
18. Data Reported to Individual Student (in text).... I04
19. Data Reported on Texts for Lab 1.I06
20. Data Reported on Text Preferences for Course.107
viii
Page
21. Data Reported on Lab 1. 108
22. Summarized Data Report on all Labs (in text).109
23. Assessment Form for Instructional Materials.128
24. Revised Individual Report.129
25. Revised Group Achievement Summary.I30
26. Revised Wrong Answer Tally...131
27. Report on Instructional Materials.I32
lx
CHAPTER I
STATEMENT OP THE PROBLEM
’’Evaluation” is a label which can be applied to a
large assortment of processes and problems. Pace (I960)
suggests in Evaluation Perspectives that the term has lost
almost all of its precision and capacity to communicate
among teachers and administrators. He continues with
examples which come under the label of evaluation. ’’The
accumulation of data about a school's operation — its
income, expenses and costs per credit hour; the measurement
of a student's knowledge at the beginning and end of a course;
the diagnosis of pupils' present knowledge and skills and
assignment of pupils to individualized instructional treatments
the particular interactions between teachers and pupils and
the discovery that certain approaches work with some students
and different approaches work with other students.” The
list continues with additional examples which further demon¬
strate the random application of the term to a large number
of problems and processes.
The above examples demonstrate that formal evaluation
in a classroom may be equally vague unless a specific
perspective is established for evaluation. "Evaluation
experts” generally agree that evaluation is more than just

2
testing, it is the act of identifying, collecting and
reporting data to decision makers for their decision making
needs. The purpose of evaluation is "to provide data for
decision making." A decision maker can be any person who
makes a decision about that enterprise which is being
evaluated. The enterprise can range from a single lecture
to a national program.
Formal classroom evaluation is a systematized pro¬
cedure for accomplishing the stated purpose of evaluation
in a classroom situation. "Formal" is used to emphasize
that the system contains a documented set of procedures
in addition to providing data for decision making. A
particular course, the students, and the teacher may be
assumed to typify a classroom situation, and for this
situation, formal classroom evaluation would involve a
systematic procedure for providing data about the course
for both the teacher and the students.
Need For Formal Classroom Evaluation
The motivation for evaluation must come from an
answer to the question: "Why is evaluation needed?" Unless
this question is answered, an evaluation should not be under¬
taken because it may not be needed or wanted. Evaluation
has as its primary purpose the collection, analysis and
reporting of data ^ provide ^ basis for decision
making.
3
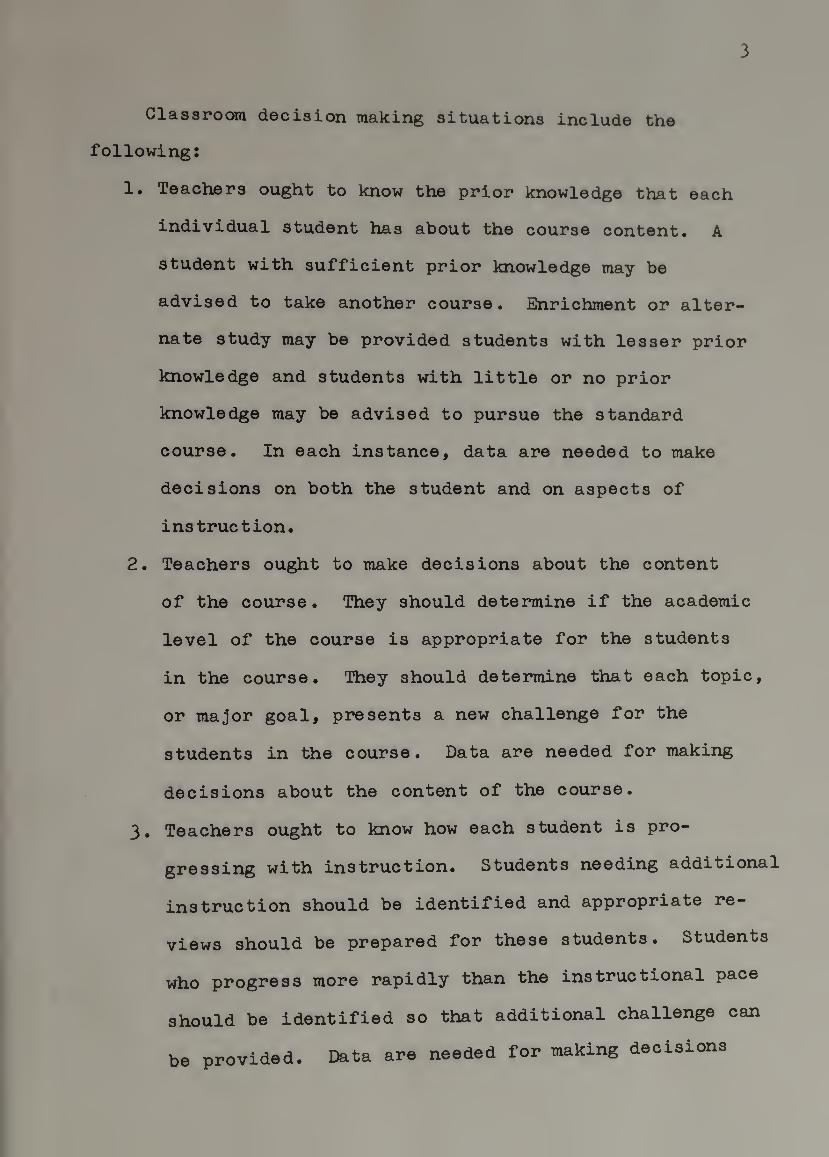
Classroom decision making situations include the
following:
1. Teachers ought to know the prior knowledge that each
individual student has about the course content. A
student with sufficient prior knowledge may be
advised to take another course. Enrichment or alter¬
nate study may be provided students with lesser prior
knowledge and students with little or no prior
knowledge may be advised to pursue the standard
course. In each instance, data are needed to make
decisions on both the student and on aspects of
instruction.
2. Teachers ought to make decisions about the content
of the course. They should determine if the academic
level of the course is appropriate for the students
in the course. They should determine that each topic,
or major goal, presents a new challenge for the
students in the course. Data are needed for making
decisions about the content of the course.
3. Teachers ought to know how each student is pro¬
gressing with instruction. Students needing additional
instruction should be identified and appropriate re¬
views should be prepared for these students. Students
who progress more rapidly than the instructional pace
should be identified so that additional challenge can
be provided. Data are needed for making decisions
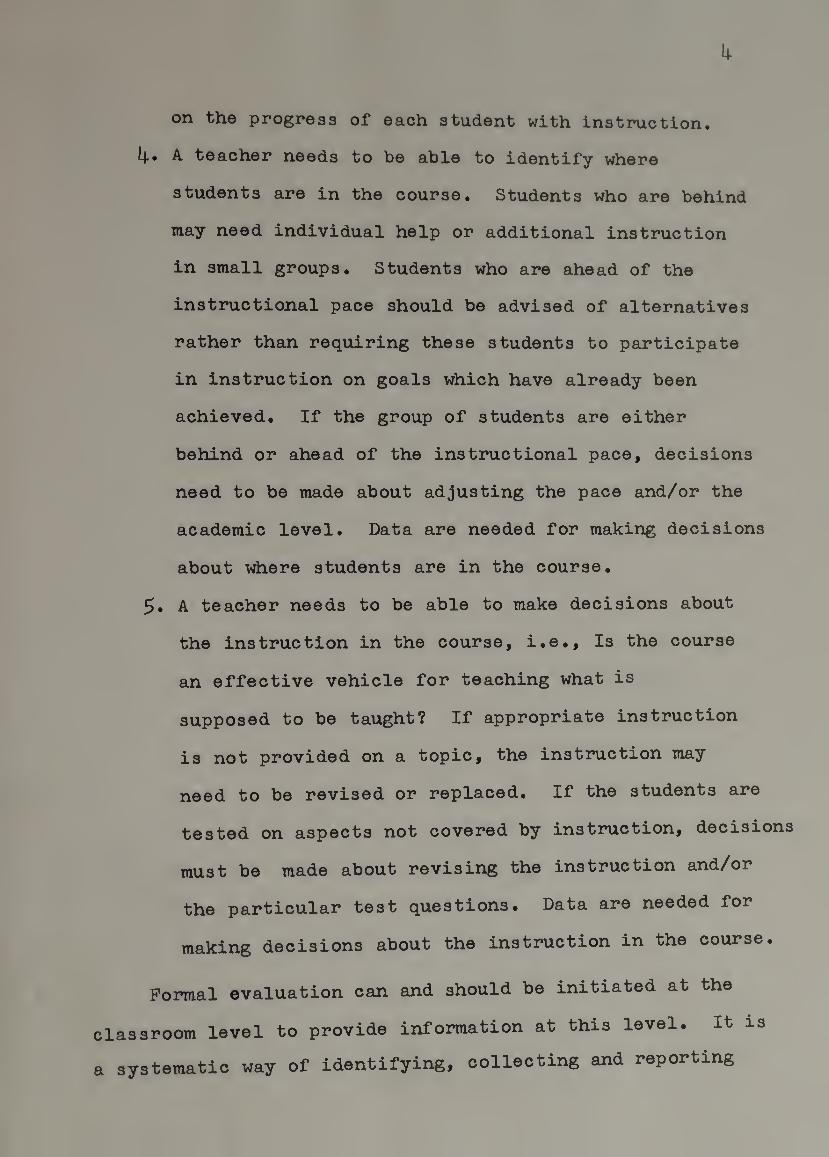
k
on the progress of each student with instruction.
l|.. A teacher needs to be able to identify where
students are in the course. Students who are behind
may need individual help or additional instruction
in small groups. Students who are ahead of the
instructional pace should be advised of alternatives
rather than requiring these students to participate
in instruction on goals which have already been
achieved. If the group of students are either
behind or ahead of the instructional pace, decisions
need to be made about adjusting the pace and/or the
academic level. Data are needed for making decisions
about where students are in the course.
A teacher needs to be able to make decisions about
the instruction in the course, i.e.. Is the course
an effective vehicle for teaching what is
supposed to be taught? If appropriate instruction
is not provided on a topic, the instruction may
need to be revised or replaced. If the students are
tested on aspects not covered by instruction, decisions
must be made about revising the instruction and/or
the particular test questions. Data are needed for
making decisions about the instruction in the course.
Formal evaluation can and should be initiated at the
classroom level to provide information at this level. It is
a systematic way of identifying, collecting and reporting
5
data needed for decision making by both the teacher and
the students.
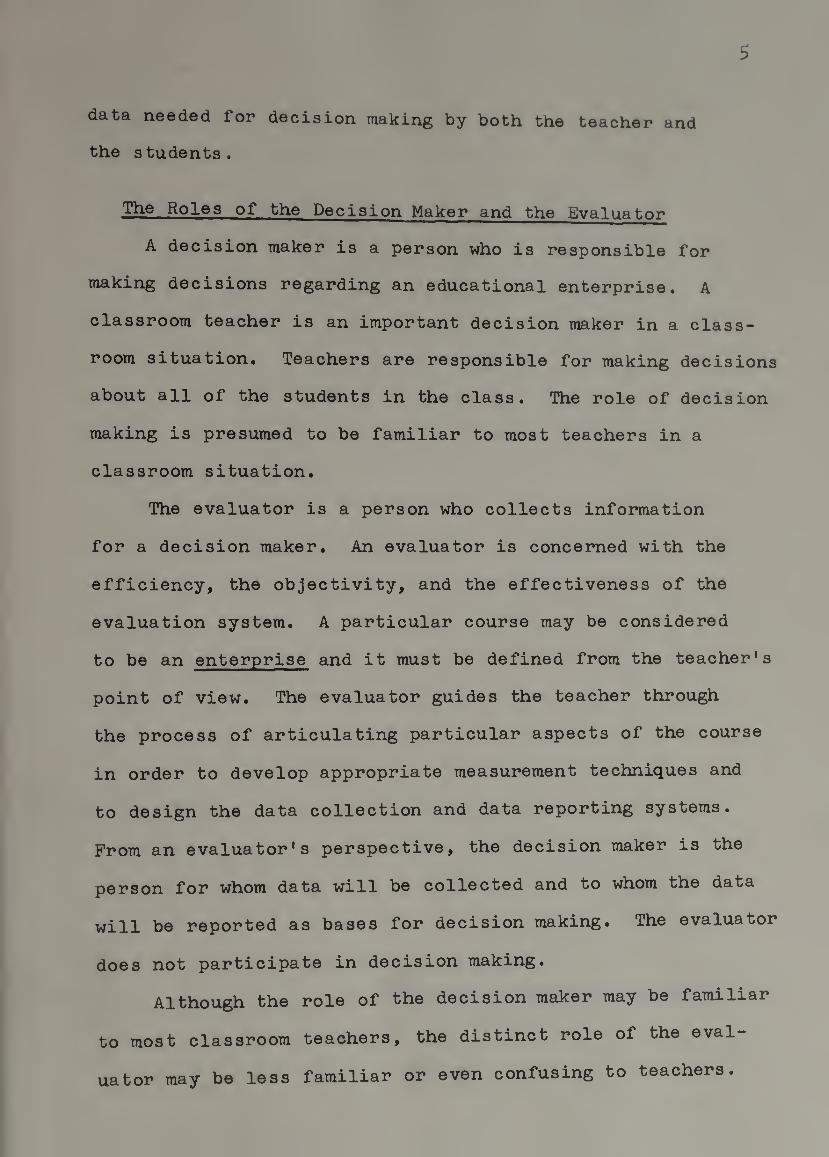
The Roles of the Decision Maker and the Evaluator
A decision maker is a person who is responsible for
making decisions regarding an educational enterprise. A
classroom teacher is an important decision maker in a class¬
room situation. Teachers are responsible for making decisions
about all of the students in the class. The role of decision
making is presumed to be familiar to most teachers in a
classroom situation.
The evaluator is a person who collects information
for a decision maker. An evaluator is concerned with the
efficiency, the objectivity, and the effectiveness of the
evaluation system. A particular course may be considered
to be an enterprise and it must be defined from the teacher's
point of view. The evaluator guides the teacher through
the process of articulating particular aspects of the course
in order to develop appropriate measurement techniques and
to design the data collection and data reporting systems.
Prom an evaluator's perspective, the decision maker is the
person for whom data will be collected and to whom the data
will be reported as bases for decision making. The evaluator
does not participate in decision making.
Although the role of the decision maker may be familiar
to most classroom teachers, the distinct role of the eval¬
uator may be less familiar or even confusing to teachers.
6
If a classroom teacher must accomplish all the functions
associated with evaluation, considerable confusion may
arise regarding those roles which should be labeled
"evaluator" roles and those roles which should be labeled
"decisionmaker" roles.
Evaluations conducted for school systems by persons
external to the system may only involve the classroom
teacher through a questionnaire or a brief discussion. In
such cases, the role of the evaluator may not be explicit
and the teacher may react to the evaluation from only a
decision maker's perspective. The classroom teacher may not
identify the concerns of the evaluator from either the
questionnaire or the discussion.
If a formal classroom evaluation system is to depend
solely on the classroom teacher, the teacher must be both
a decision maker and the evaluator. The teacher must
identify the roles of both the evaluator and the decision
maker, separate these roles, and assume these roles in the
creation and operation of an evaluation design. Further,
all aspects pertaining to these roles must be accomplished
with the resources which are available to the classroom
teacher.
Purpose of the Study
Evaluation is familiar to many classroom teachers and
teachers have participated in creating evaluation systems.
However, evaluations are often created from administrative

7
or systein-wide desires rather than from the desires of an
individual classroom teacher. For example, Kresh (1969)
discusses an application of the Discrepancy Model to a school
system and Pace (1968) refers to evaluation in an even
larger sense — from a national perspective. However,
Gorth (197i^-) identifies evaluation with a classroom situation
Controversies in Education. The discussion by Gorth
suggests that formal classroom evaluation can be created
from the desires of the classroom teacher alone.
In this study, a formal classroom evaluation design
will be developed by a classroom teacher. The teacher
will identify the roles of the decision maker and evaluator.
The roles will be separated and the same classroom teacher
will assume both roles in creating and operating a formal
classroom evaluation design.
The classroom teacher will work within a set of
available resources which are presumed to be available to
most classroom teachers. A very limited set of resources
is assumed to demonstrate that an effective classroom
evaluation system can be developed with minimum equipment
and minimum skills • Formal classroom evaluation need not
depend on a broad array of resources.
The classroom teacher need not be an expert in eval¬
uation methodology to create a formal classroom evaluation
system. In this study, the classroom teacher will follow
an established evaluation methodology which contains the
8
needed expertise. The methodology contains a series of steps
which serve to accomplish the purpose of evaluation_to
provide data for decision making.
The evaluation methodology was modified for a particular
classroom situation. The parameters describing the classroom
situation were presumed to typify classrooms at the high school
and beginning college level. The modifications were restate¬
ments of the conceptually stated methodology as the methodology
was adapted to a particular classroom situation. The modifi¬
cations served to identify and separate the role of the
©valuator from the role of the decision maker. The adapted
evaluation methodology, called the strategy, was the pragmatic
basis for formal classroom evaluation in this study.
This study demonstrates that a classroom teacher can
accomplish these aims by careful attention to the criteria
for an effective evaluation system. An evaluation system
is efficient if it provides only the data a decision maker
uses; an evaluation system is complete if it provides all
of the data needed; and an evaluation system is focused if
it provides data for the highest priority decision making
needs. Each of these criteria is considered as it applies
to evaluation without regard to the particular course for
which the evaluation was developed.
The Approach to the Problem
A teacher with minimum skills in evaluation and
limited resources is presumed to desire formal classroom
evaluation. The scope of the evaluation was limited to a

9
cl8.sspooTTi situation so that tho teacher could, retain
control of the evaluation while experimentally developing
and confidence in evaluation. The classroom teacher
assumed the role of the evaluator and the role of the
decision maker.
An evaluation methodology was desired which could be
readily adapted to a classroom situation by the classroom
teacher. Since the teacher was a novice to evaluation, the
methodology must guide the teacher in all phases of evaluation
by identifying and separating evaluator concerns from decision
making. The teacher learned how to become an evaluator as
the methodology was applied to a particular course. .
Gomprehensive Achievement Monitoring (Gorth, O'Reilly,
and Pinsky, 1975) contains a set of twelve major steps of
a systematic method for accomplishing the purpose of
evaluation, i.e., to provide data for decision making. It
is a dynamic methodology which is continually being revised
and improved. The basic steps include the following;
Step 1. Define the Enterprise;
The Enterprise to be evaluated
is defined;
Step 2. Define the Resources;
Determine the Resources which may
be allocated to evaluation;
Step 3. Define the Decision Makers;
The Decision Maker(s) to whom data
are provided are selected;

10
step 4. Articulate the Goals:
The Goals of each decision maker for
the enterprise are articulated;
Step 5. Specify the objectives:
The Objectives of the goals of the
decision maker are specified;
Step 6. Specify the Decisions:
The Decision(s) to be made in re¬
lation to each objective are specified;
Step 7» Develop the Measurement Techniques:
The Measurement Techniques for the
objectives are developed;
Step 8. Design the Data Collection System:
The Design of the data to be collected
for each decision is created;
Step 9. Collect the Data:
The Collection of the data specified
in the design is carried out;
Step 10. Analyze the Data:
The Analyses on the data collected
are performed;
Step 11. Report the Data:
The Report of the data to each decision
maker selected is written; and
Step 12. Revise the Evaluation:
The Revision of the evaluation through
the redesign of evaluation components or
through an evaluation of the evaluation
is considered.

11
At the time of this study, the first eight steps focused
on the planning or design phase of evaluation. The next
three steps focused on the implementation of the evaluation
and the last step provides for revisions in the evaluation
design.
The steps developed by Gorth, et ah (1975) describe
an evaluation methodology which depends on sophisticated
resources, A computer is used to analyze the collected
data and to prepare data reports. The particular computer
programs which accomplish the analyses and prepare the reports
have been extensively revised by experts in both evaluation
and computer programming. The system provides training for
both teachers and administrators by experts in the methodology
and these same experts are available as consultants.
Teachers may neither have these resources nor the
implied expertise. An important contribution of this study
is to demonstrate that this methodology can be tailored to
a classroom situation by a teacher who is a novice to
evaluation. External resources were not used in developing
the evaluation system. The analyses on the collected data
and the data reports were completed manually by the
classroom teacher. Every aspect of the evaluation depended
solely on the classroom teacher as the evaluator.
Emphasis of Evaluation
The evaluation strategy is a procedural guide for a
teacher who desires evaluation for a particular course. Hence,
12
the emphasis of evaluation is oriented toward one course
rather than a whole curriculum. The strategy helps a
teacher to design, operate and revise an on-going evalu¬
ation for a course.
A particular course was selected as an example course
for the study. The course, offered at Fitchburg State
College, is a one-semester introductory physics course at
a college level for students who have had no prior physics
courses. The evaluation design was created for the physics
course and operated as the course was administered. Data
actually collected during the operation phase were used
in making decisions about the course and in revising the
evaluation design. The particular course contained goals,
or topics, primarily in the cognitive domain. The goals
for the first part of the evaluation design were focused
on the cognitive content.
A second part of the evaluation design was focused on
the instructional materials which were used to teach the
cognitive content. The instructional materials were
usually some type of documented material such as a text,
a laboratory exercise, a problem solving exercise, or a
TV tape. A separate list of goals for instructional materials
was derived sind these became the focus of the evaluation
design for the instructional materials.
The evaluation design was created by accomplishing the
first eight steps of the adapted methodology, or strategy,
for the content and for the instructional materials. The
13
initial design was operated with the course as the next
three steps of the strategy were accomplished. The initial
design was revised at the end of the course as the last
step of the strategy was accomplished. As each phase of
the evaluation was accomplished the teacher became more
familiar with evaluation by identifying and separating
the role of the evaluator from that of decision making. f
Summary
Formal classroom evaluation is needed to provide
data for teachers and students to be used in their decision
making. The purpose of this study is to develop an
evaluation design which depends solely on the classroom
teacher who must assume both the role of an evaluator and
the role of a decision maker. The evaluation design was
developed by tailoring an existing methodology to a particular
classroom situation.
CHAPTER II
THE EVALUATION METHODOLOGY
The approach to the problem has implied that particular
perspectives have been used in selecting the evaluation
methodology used in this study. In this chapter, the per¬
spectives are identified and used for assessing some of
the currently available evaluation methodologies. A
methodology is selected and interpreted for the specified
classroom situation by examining each step of the methodology
and adapting it to the classroom situation. Each adaptation
contains procedural substeps for a classroom teacher to
follow in accomplishing a major step of the evaluation
methodology.
Evaluation Perspectives
Historically, the use of the term evaluation came into
use in the 1930*s. Pace (1968) suggests that the term was
used to express a concept which was broader than testing.
Bloom (1956) in his Taxonomy of Educational Objective^:
Cognitive Domain drew attention to the possibility of using
coventional items to tap a wide array of human behaviors.
Cronbach (1963) in his paper Course Improvement
Through Evaluation provides a philosophy and a methodology
He suggests three types of of evaluation with purpose.
15
programmatic decisions for which evaluation is used: in
the areas of course improvement, in decisions about
individuals, and in administrative regulation. Cronbach
raises several issues which include the statement of
objectives prior to the start of a program and some general
methodological issues. The use of test development as a
teacher training strategy; the use of evaluation to under¬
stand what parameters in a course influence its effectiveness;
the weakness of group comparisons; and the use of systematic
observation to make evaluation more impartial, more public,
and more penetrating are examples of the issues discussed.
Formal classroom evaluation should provide data for
making decisions on course improvement and for making de¬
cisions about individuals. Teachers should decide what
instructional materials and methods are satisfactory and
where change is needed. Teachers should identify the needs
of the pupil for the sake of planning his instruction, judging
pupil merit for purposes of selection and grouping, and
acquainting the pupil with his own strengths as well as
weaknesses. These decisions should be made on a dynamic
basis so that the student, the course, and the teacher benefit
from the decisions while the course is in operation. A de¬
sired formal classroom evaluation system implies a systematic
process which provides a basis for making decisions on the
process and the proficiency of the course both from an instruc¬
tional point'of view and from a learner’s perspective. These are
16
the decision maker’s perspectives for evaluation in this
study. The deeper issues pertaining to types of transfer,
deeper understanding of outcomes and educational effectiveness
were not considered for a pragmatic formal classroom evalu¬
ation strategy.
In this study the potential contributions of formal
classroom evaluation are assumed to be limited to a
particular course, the teacher, and the students. The
teacher, as an evaluator, must select an evaluation
methodology which may be readily adapted to this particular
situation. A desired methodology is one vAiich may be readily
adapted by a classroom teacher with minimum skills in
evaluation.
Literature Review
The work by Cronbach (1963) was useful in establishing
perspectives for selecting a desired evaluation strategy.
However, specific procedures were not identified for applying
this methodology to a classroom situation. Consequently, the
model is not readily adapted to a course by a classroom
teacher.
Stake (1967) in his article T^ Countenance of
Educational Evaluation proposes a conceptual model for
evaluation. Each educational program is supported by a
rationale stating the philosophic background and basic
purposes of the program. The model proceeds with four
major descriptive classes termed intents, observations.

17
standards, and judgements. Intended student outcomes
include goals and objectives and are classified as intents.
Descriptive data citing surroundings and events and
subsequent consequences are termed observations. Standards
are teacher used criteria for making judgements. Standards
may be formed from observations, teacher assumptions, or
prejudgements from external sources. In each instance,
the standard becomes a basis for a judgement. Judgements
are decisions made on the program. The decisions include
not only the outcomes but the conditions prior to instruc¬
tion and the instruction as well.
Each of the four classes is subdivided into three
subclasses termed antecedent, transactions, and outcomes.
An antecedent is any condition existing prior to teaching
and learning which may relate to outcomes. The transactions
are the dynamic engagements between students and resources
which comprise the process of education. Outcomes include
measures of abilities, achievements and attitudes for
students. In addition, outcomes include measures of
instruction.
The three sets of subclasses, for any major class, are
joined into a continium by contingent relationships which
may be established by the teacher, the evaluator or both.
In addition, each subclass for intents is related to a
similar subclass in observations by establishing congruence
relationships between the intents and the observations.
The intents and congruencies identified by evaluators
18
are subject to Judgement by experts and participants in
the evaluation system.
Two bases are established for Judgements: (1) Judge¬
ments may be made with respect to absolute standards as
reflected by personal standards; (2) Judgements may be made
with respect to relative standards such as alternate programs.
The model proposed by Stake is an example of a systems
model which might be applied to one or several schools.
The model tends to be confusing for a classroom teacher
because evaluation activities and evaluator roles are not
well separated from decision making roles. The model was
not considered appropriate for this study.
"The Discrepancy Evaluation Model" described by
Provus (1971) is a five stage curriculum evaluation model.
In this model, evaluation is perceived as a comparison of
performance against a standard which is applied to each of
the five stages consisting of program design, program
operation, program interim products, program terminal
products, and program cost. In each comparison, four
possible decisions exist. The program may continue to the
next stage, the program may recycle to a previous stage
after program standards or operations are modified, the
program may recycle to the first stage, or the program may
terminate.
Two decision taaking groups exist for program evaluation.
Decisions are made by the staff to improve and stabilize
specific aspects of the program and decisions are made to

19
retain or terminate the program at the policy making level
of an entire school. Decision making is separated from
evaluation; hence, the program evaluators are independent
of the program staff and assume a non-directive role.
An expert evaluator is required to implement the
model. Additional experts, such as a psychometrician and
consultants, are needed to cope with reliability and validity
of information and to assess the significance of uncovered
discrepancy information.
The discrepancy model has been successfully applied
to programs in the Pittsburg School System; however, the
model cannot bo readily adapted to a classroom situation
by a classroom teacher. The model depends on extensive
external resources and is designed for a whole school
system rather than a one-teacher classroom.
Hammond (1971) in his article on Evaluation at the
Local Level identifies an extensive list of variables
for a total structure of evaluation. The actual evaluation
model, however, contains a set of conceptually stated
steps which may be applied to a subprogram in the school
or even applied to a classroom situation. The steps are
summarized as follows:
1, The program must be defined in terms of
what is to be evaluated,
2. The descriptive variables are defined in
instructional and institutional dimensions.
3« The objectives are stated in behavioral
terms•
20
The behaviors described in the objectives
are assessed.
5* The results are analyzed to arrive at con¬
clusions based on actual behavior,
6. Terminal behaviors are compared with the
objectives to determine the effectiveness of
the program in reaching desired outcomes.
7. Changes, in the form of innovations, are
made based on the evidence gathered as to
what the change process should involve.
The changes are presumed to be made on evidence which will
provide data for the school boards, community and admin¬
istration to make decisions which meet the needs of every
child.
The implementation of this model is assisted by three
divisions of an Evaluation Center. The purpose of the I
center is to provide school districts with the help needed
to train district personnel in the process of evaluation.
The center does not function as an outside evaluation
agency.
Although the model can be applied to a classroom
situation, it is essentially oriented toward a school
the model does not contain the district. In this sense
21
speciric guidolines which, ©nable a classroom teacher to
adapt the model to a particular course. There is no clear
definition of evaluator roles which may be separated from
decision maker roles. This separation is critical if the
objectivity of the evaluation system is to be maintained
at the classroom level.
The above examples demonstrate the problems a class¬
room teacher faces in adapting a conceptually stated model
to a classroom situation. The selected methodology by
Gorth et al. (197^) is more readily adapted by a classroom
teacher with minimum skills in evaluation.
Comprehensive Achievement Monitoring
The evaluation methodology developed by Gorth et al.
(1975) is a detailed set of twelve steps which serve as a
guide for a classroom teacher. In this study, the twelve
steps were adapted to a particular classroom situation;
however, the importance of the study is that other teachers
can apply the adapted evaluation strategy to their own
classrooms. The particular classroom situation used in
the study was presumed to be representative of a fairly
broad set of classroom situations at the high school or
beginning college level. The design and implementation of
the evaluation system was accomplished by one teacher so
that the evaluation strategy resulting from the study
might be readily adapted to similar classroom situations
by other teachers.
22
A teacher who desires evaluation may begin evaluation
with very limited resources if the teacher, alone, accom¬
plishes all of the steps associated with evaluation. The
teacher's role, as a decision maker, is not part of the
evaluation strategy; therefore, the teacher must identify
and separate the evaluator's role in developing the
evaluation strategy. The teacher in this study, reviewed
each major step and restated evaluator concerns for
accomplishing each step. As each major step was adapted
by the teacher, the evaluation strategy for accomplishing
the major step was specified.
The Evaluation Strategy
The evaluation strategy is specified by treating each
major step of the methodology. The step is relisted and the
major purposes of the step are summarized. The evaluation
strategy for the step is specified by identifying what a
classroom teacher should do to accomplish the step.
Step 1 - Define the Enterprise
The enterprise may be as simple as a single lecture
or as complex as the total educational activities for an
entire school district. The enterprise is the thing that
is to be evaluated and, in this instance, the enterprise
must be specified by the classroom teacher.
The enterprise is defined in order to focus the
evaluation efforts. A definition requires that the enterprise
23
IS spscifisd in tonTis of its oxtonty its bssic purposo snd
its Tnajor parts# Eacli of thoso aspocts helps the evaluator
to focus the evaluation on that which is to be evaluated.
The enterprise to be evaluated in this study is a
single course of instruction whose content is prittiarily
in the cognitive domain. The course is presented over a
specified period of time by one classroom teacher. The
basic purpose of the course is to provide instruction in
some cognitive area and the major components of the course
are the cognitive content and the instruction provided.
Step 2 - Define the Resources
The resources available for evaluation may include a
wide range of useful components which may be grouped into
materials, personnel and money. Materials include equipment,
supplies, and physical space. The list of materials may
vary from paper supplies to huge computers with several
adjoining rooms. Personnel may include secretaries, pro¬
grammers, supervisors and other persons whose time may be
committed to evaluation. Money is the most flexible of all
resources because it can be converted into either personnel,
time, or materials.
The decision makers are part of the evaluation
process because the evaluation system provides data for
their decision making needs. Time must be allocated for
the evaluator to interact with the decision makers to
determine these needs. The evaluator must be assured that
the perceptions of the enterprise are articulated from the
24
decision maker'3 perspectives rather than the evaluator's
perspective•
In this study, the major resource is a classroom
teacher's available time* A classroom teacher must have
time to create, operate and revise an evaluation design.
Equipment and supplies are limited to a ditto machine and
paper supplies which are needed to create instruments for
the evaluation* Class time and student time are needed
for assessing the evaluation design prior to revisions*
The resources are purposely limited to allow the strategy
to be adapted in a larger variety of classroom situations*
However, teachers with more extensive resources available
may choose to include them, if desired, because additional
resources may enhance the comprehensiveness and extent of
the evaluation*
Step 3 - Define the Decision Makers
A decision maker, from an evaluator's perspective,
is a person to whom data will be provided for decision making*
Each person who makes decisions affecting the enterprise
has perceptions about the enterprise and is a person who
desires data for decision making* The process of defining
decision makers includes an identification of all potential
decision makers, rank ordering the list according to their
importance to the enterprise and to evaluation, and selecting
those decision makers for whom data will be provided*
25
A long list of decision makers can be generated
for each course which would include students, the class¬
room teacher, supervisors, administrators, other teachers,
the school board, parents, the community, and other related
or interested parties. Usually an evaluator employs a
systematic set of steps to define the decision makers, such
as conceptually described by Gorth et al, (1975). The
evaluator must be assured that all persons who will receive
data are identified so that their perceptions of the
enterprise may be individually determined.
In this study, the evaluation is confined to a
classroom situation. The selected decision makers are the
classroom teacher and the students in the class. These
are the only persons to whom the data will be reported.
It is presumed that the teacher will make more decisions
affecting the course and the decision making needs of the
teacher are considered to be primary for evaluative purposes.
The teacher, as a decision maker, is assigned higher
priority than the students in the evaluation design.
Step Ij. - Articulate the Goals
Each decision maker has some perceptions of the
enterprise which contain goals for the enterprise. A goal
is a broad statement of what the decision maker expects
the enterprise to accomplish. Different decision makers
may have different goals and the evaluation system is
created from the specific goals or intents of each decision

26
maker. Whenever an evaluation is done, it should have
some kind of a specified process for articulating the
goals because this is one of the critical steps in the
methodology.
Benedict (1973) describes a process for articulating
goals in Practical Gruide For Evaluation. He states that
a "goals process" should contain three major steps: (a) a
procedure for generating goal statements; (b) a procedure
for checking and assuring that the list is complete and
(c) a procedure for rank ordering the list of goals.
Goal generation may be accomplished through inter¬
action between the evaluator and the decision makers. The
evaluator guides each decision maker in generating goals
for the enterprise. The list of goal statements is re¬
viewed and additional implied goals are added to the list.
During the goal generation process the evaluator encourages
the decision maker to list every conceivable goal without
regard to importance,
The generated goal lists are checked for completeness.
Tests for completeness include direct comparisons between
lists generated by the decision makers, comparisons with
written documents of the enterprise, and comparisons with
activities of the enterprise. Each test of completeness
is used to generate suggested or implied goals to assure
that lists of goals statements are complete.
2?
The completed lists of goals statements are priori¬
tized according to some criterion by the decision maker.
In this process the evaluator identifies the importance of
each goal to the decision maker. The most important goals
are placed at the top of the list and goals, which the
decision maker deems unimportant, are removed from the
list. The prioritization process causes each list of com¬
pleted goal statements to be reviewed and ranked by the
decision maker. Each prioritized list of goals statements
contains only those goals which the decision maker desires
for evaluative purposes.
The goal articulation process usually involves inter¬
action between the evaluator and the decision maker,
especially in checks for completeness and prioritization.
Processes which involve interaction between the evaluator
and the decision maker may tend to confuse the role of the
evaluator for a classroom teacher. In this study, the role
of the evaluator was identified and separated from the role
of the decision maker by stating the evaluator's role in
a series of procedural substeps for the goal articulation
process. The goals for cognitive content are articulated
by the following outlined procedural substeps:
I. State the major goals or topics
A. For each class session state the topics
to be treated during that class session.
B. When all topics have been listed for
each class session, examine the list

28
and verify that;
1. Each topic will be treated.
2. All topics have been included.
II. Identify the goals for each topic
A. Identify each topic.
B. State the goals the student is expected
to achieve for the topic.
C. Compare the list of goals with the instruc¬
tional materials for that topic. Add any
goals which have been omitted.
D. Check the list of goals for implied goals.
Add any goals which are implied.
E. Check the list of goals for multiple goal
statements. State each goal in a separate
statement.
P. Examine the list of goals and verify that
each goal bears a close relationship to the
topic. A student will identify the topic from
each goal and each goal will be identified
from the topic.
G. Examine the list of goals and verify that evalu¬
ation is desired for each goal. Delete any goals
for which evaluation is not desired.
H. Repeat the above procedural substeps for
each topic.
I. Make a list of all topics and their
goals•
29
The procedural steps contain several checks to assure
that a complete list of goals is generated. Each check
is a reminder that the evaluator must be assured that all
goals have been stated. The procedural substeps should
be followed in the order specified to assure that goal
generation is completed before the goals are selected for
evaluation.
Goal articulation is fundamental to an evaluation
design because the goals are used to create an evaluation
design. The relationships and importance of goal articulation
are identified in the following paraphrased major steps of
the methodology:
Step 4.: Specify all desired goals for evaluation.
Step $1 Restate the goals in measureable terms
so that the goals may be used as
criteria,
Step 6: Use the goals as criteria to specify
decisions which are desired.
Step 7: Use the goals as criteria for generating
criterion-referenced tests.
Step 8: Use the goals and desired decisions as
criteria for designing a data collection
system.
The goals specified for evaluation are the foundation for
creating an evaluation design. As the design continues the
goals are transformed into criteria which are used in each
30
aspect of the evaluation design. Goal articulation is
identified as the most critical step a classroom teacher
must accomplish in creating an evaluation design.
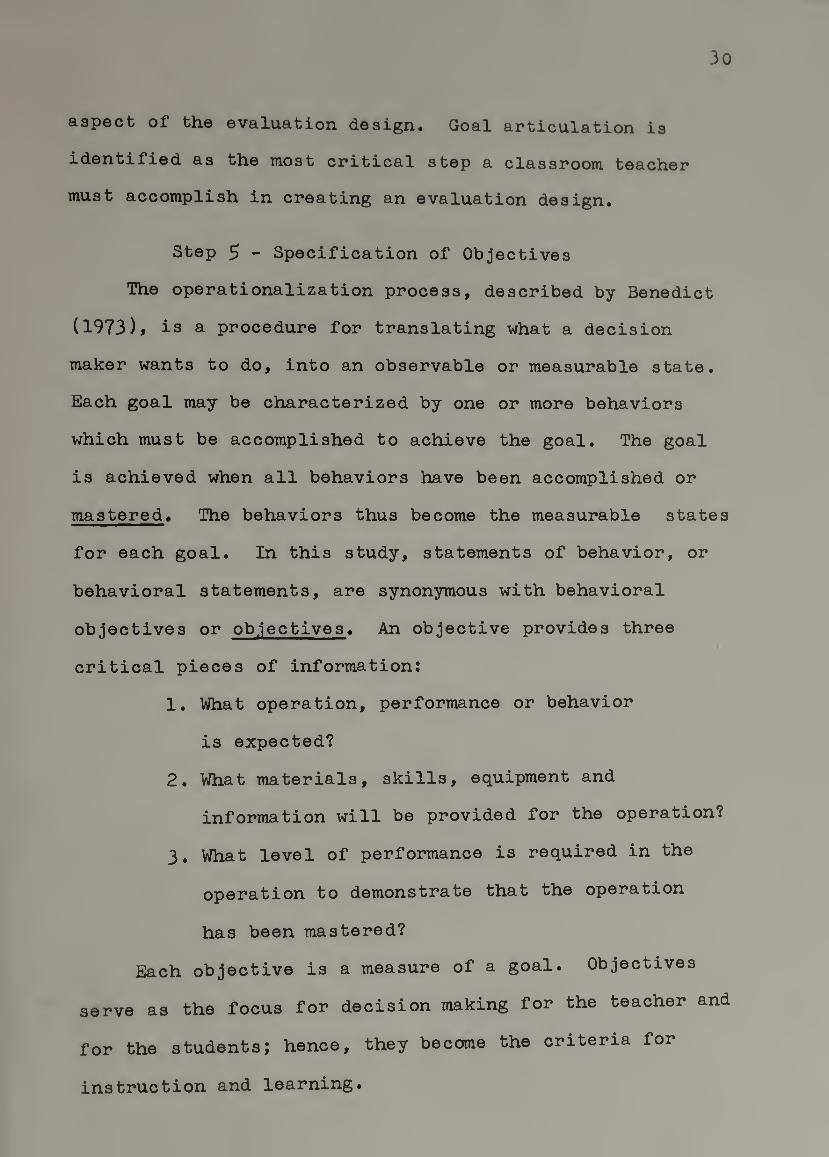
Step 5 - Specification of Objectives
The operationalization process, described by Benedict
(1973)> is a procedure for translating what a decision
maker wants to do, into an observable or measurable state.
Each goal may be characterized by one or more behaviors
which must be accomplished to achieve the goal. The goal
is achieved when all behaviors have been accomplished or
mastered. The behaviors thus become the measurable states
for each goal. In this study, statements of behavior, or
behavioral statements, are synonymous with behavioral
objectives or objectives. An objective provides three
critical pieces of information:
1. What operation, performance or behavior
is expected?
2. What materials, skills, equipment and
information will be provided for the operation?
3. What level of performance is required in the
operation to demonstrate that the operation
has been mastered?
Each objective is a measure of a goal. Objectives
serve as the focus for decision making for the teacher and
for the students; hence, they become the criteria for
instruction and learning.
31
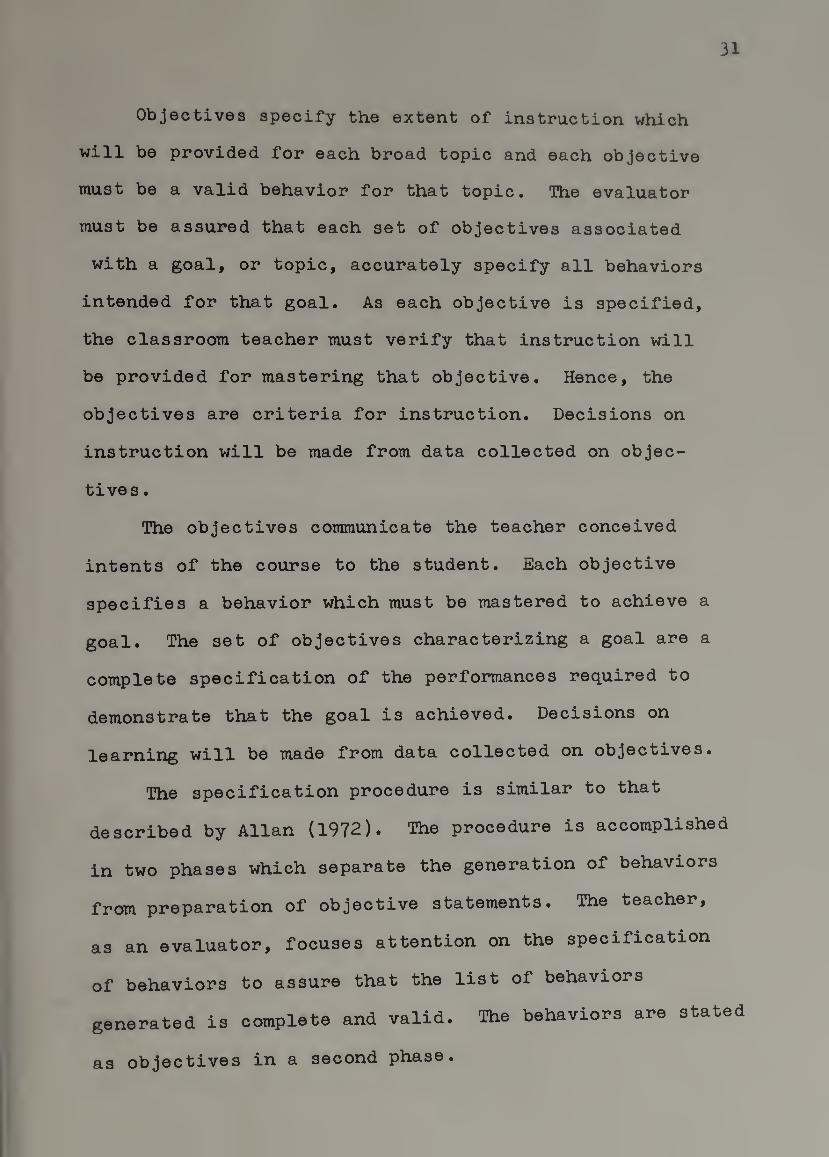
Objectives specify the extent of instruction which
will be provided for each broad topic and each objective
must be a valid behavior for that topic. The evaluator
must be assured that each set of objectives associated
with a goal, or topic, accurately specify all behaviors
intended for that goal. As each objective is specified,
the classroom teacher must verify that instruction will
be provided for mastering that objective. Hence, the
objectives are criteria for instruction. Decisions on
instruction will be made from data collected on objec¬
tives..
The objectives communicate the teacher conceived
intents of the course to the student. Each objective
specifies a behavior which must be mastered to achieve a
goal. The set of objectives characterizing a goal are a
complete specification of the performances required to
demonstrate that the goal is achieved. Decisions on
learning will be made from data collected on objectives.
The specification procedure is similar to that
described by Allan (1972). The procedure is accomplished
in two phases which separate the generation of behaviors
from preparation of objective statements. The teacher,
as an evaluator, focuses attention on the specification
of behaviors to assure that the list of behaviors
generated is complete and valid. The behaviors are stated
as objectives in a second phase.
32
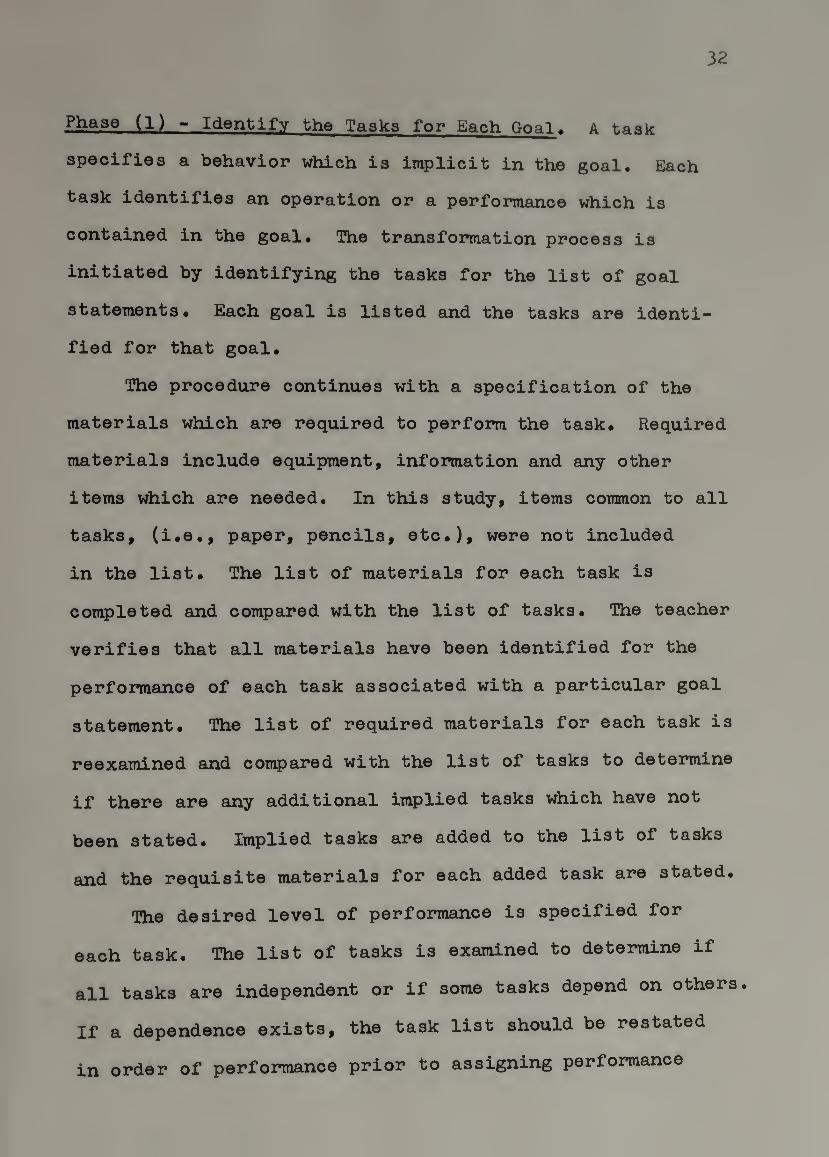
Phase (1) - Identify the Tasks for Each Goal. A task
specifies a behavior which is implicit in the goal. Each
task identifies an operation or a performance which is
contained in the goal. The transformation process is
initiated by identifying the tasks for the list of goal
statements. Each goal is listed and the tasks are identi¬
fied for that goal.
The procedure continues with a specification of the
materials which are required to perform the task. Required
materials include equipment, information and any other
items which are needed. In this study, items common to all
tasks, (i,e,, paper, pencils, etc,), were not included
in the list. The list of materials for each task is
completed and compared with the list of tasks. The teacher
verifies that all materials have been identified for the
performance of each task associated with a particular goal
statement. The list of required materials for each task is
reexamined and compared with the list of tasks to determine
if there are any additional implied tasks which have not
been stated. Implied tasks are added to the list of tasks
and the requisite materials for each added task are stated.
The desired level of performance is specified for
each task. The list of tasks is examined to determine if
all tasks are independent or if some tasks depend on others.
If a dependence exists, the task list should bo restated
in order of performance prior to assigning performance

33
1gv©1s» The perrontiance level of a succeeding task must
be consistent with the performance level of the preceeding
task. For example, if the level of performance for a
succeeding task is to be 90^ then the level of performance
of the preceeding task must be adjusted to assure that
the two levels of performance are consistent.
After all tasks, provided materials, and perfor¬
mance levels have been identified for a goal, the list of
tasks are examined and the tasks for which data are not
desired are removed from the list. The process is repeated
for each goal until all goals have been treated. The
procedural substeps for Phase I are summarized as follows;
1. Select the goal.
2. List the tasks for that goal.
3. Specify the materials required to perform
the task.
4. Verify that all materials have been stated.
5. Examine the list of required materials for
implied tasks. Add implied tasks to the list
and specify required materials.
6. State the performance level for each task.
Adjust performance levels to be consistent
with a sequence of tasks.
7. Delete tasks from the list which are not
desired for ©valuation.
8. Repeat the above substeps until all tasks
for all goals have been specified.
34
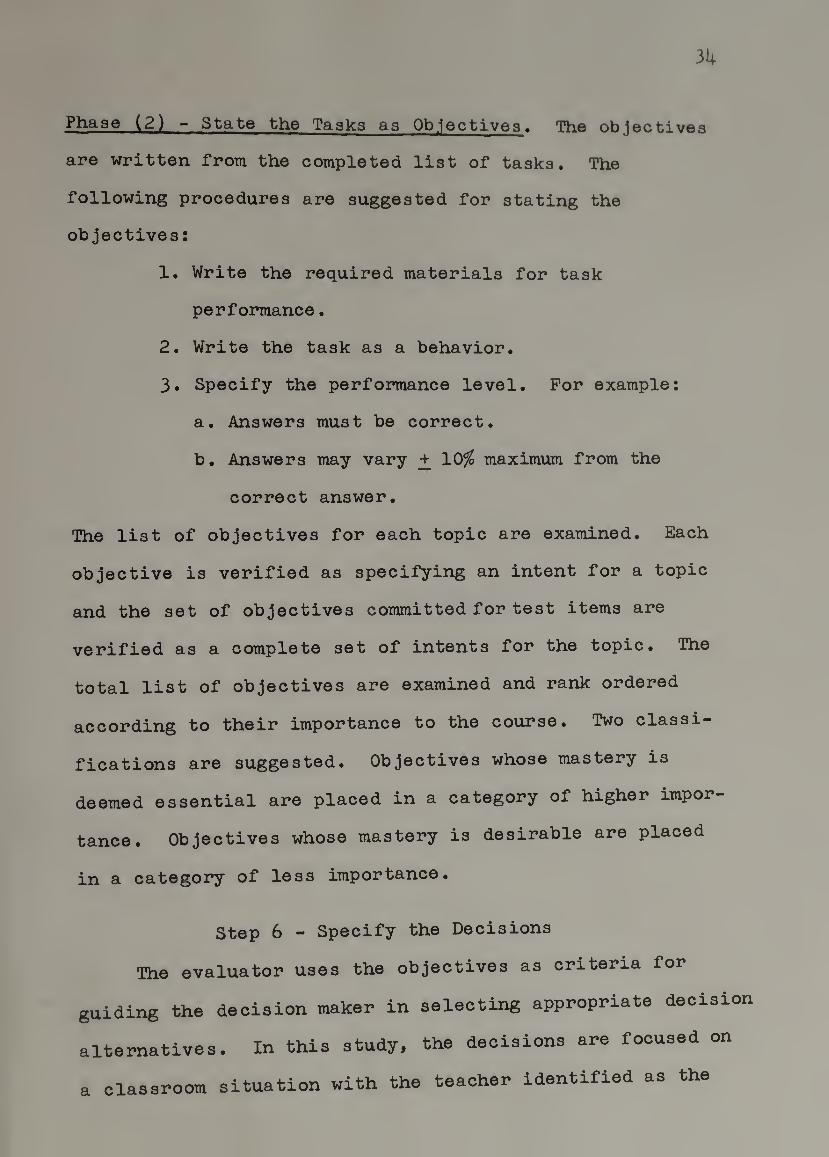
Phase (2) - State the Tasks as Ob.lectivea. The objectives
are written from the completed list of tasks. The
following procedures are suggested for stating the
objectives;
1. Write the required materials for task
performance.
2. Write the task as a behavior,
3. Specify the performance level. For example;
a. Answers must be correct.
b. Answers may vary 10% maximum from the
correct answer.
The list of objectives for each topic are examined. Each
objective is verified as specifying an intent for a topic
and the set of objectives committed for test items are
verified as a complete set of intents for the topic. The
total list of objectives are examined and rank ordered
according to their importance to the course. Two classi¬
fications are suggosted. Objectives whose mastery is
deemed essential are placed in a category of higher impor¬
tance. Objectives whose mastery is desirable are placed
in a category of less importance.
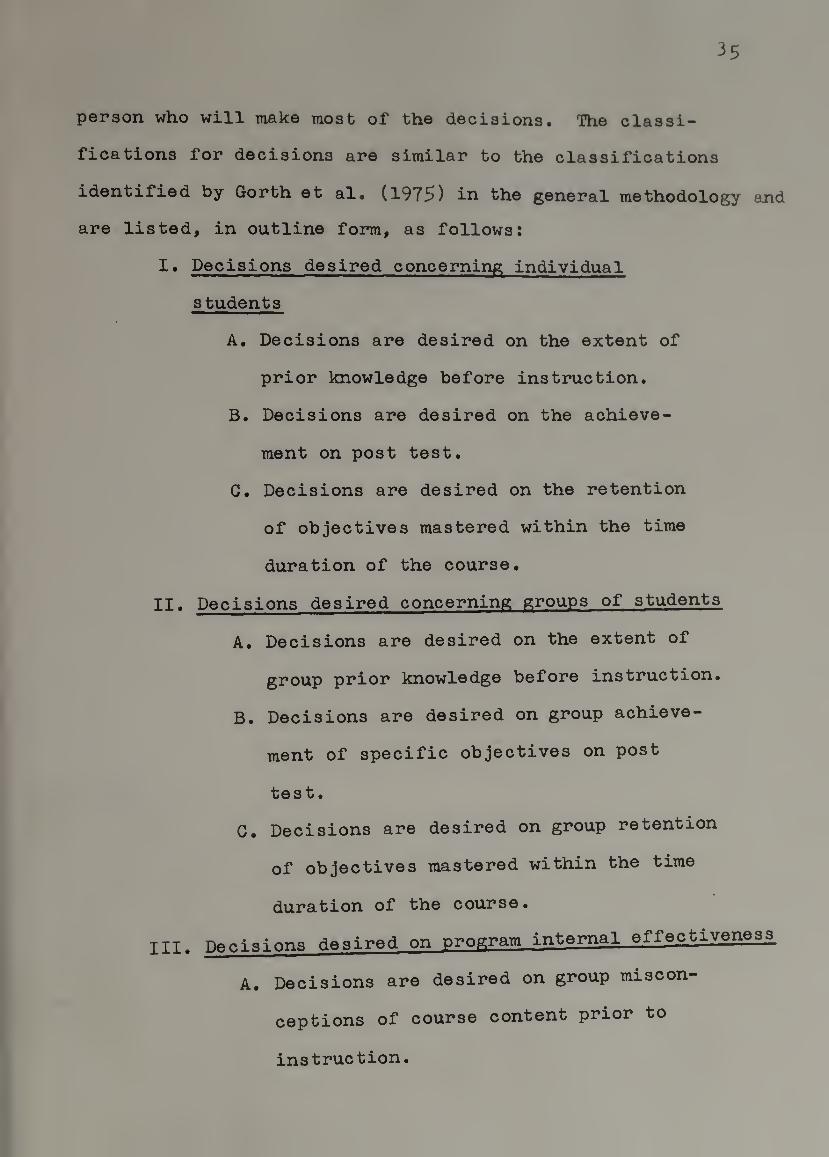
Step 6 - Specify the Decisions
The evaluator uses the objectives as criteria for
guiding the decision maker in selecting appropriate decision
alternatives. In this study, the decisions are focused on
a classroom situation with the teacher identified as the
35
person who will make most of the decisions. The classi¬
fications for decisions are similar to the classifications
identified by Gorth et al. (1975) in the general methodology and
are listed, in outline form, as follows:
I. Decisions desired concerning individual
students
A. Decisions are desired on the extent of
prior knowledge before instruction.
B. Decisions are desired on the achieve¬
ment on post test.
C. Decisions are desired on the retention
of objectives mastered within the time
duration of the course.
II. Decisions desired concerning groups of students
A. Decisions are desired on the extent of
group prior knowledge before instruction.
B. Decisions are desired on group achieve¬
ment of specific objectives on post
test.
C. Decisions are desired on group retention
of objectives mastered within the time
duration of the course.
III. Decisions desired on program internal effectivene.s_3
A. Decisions are desired on group miscon¬
ceptions of course content prior to
' instruction.
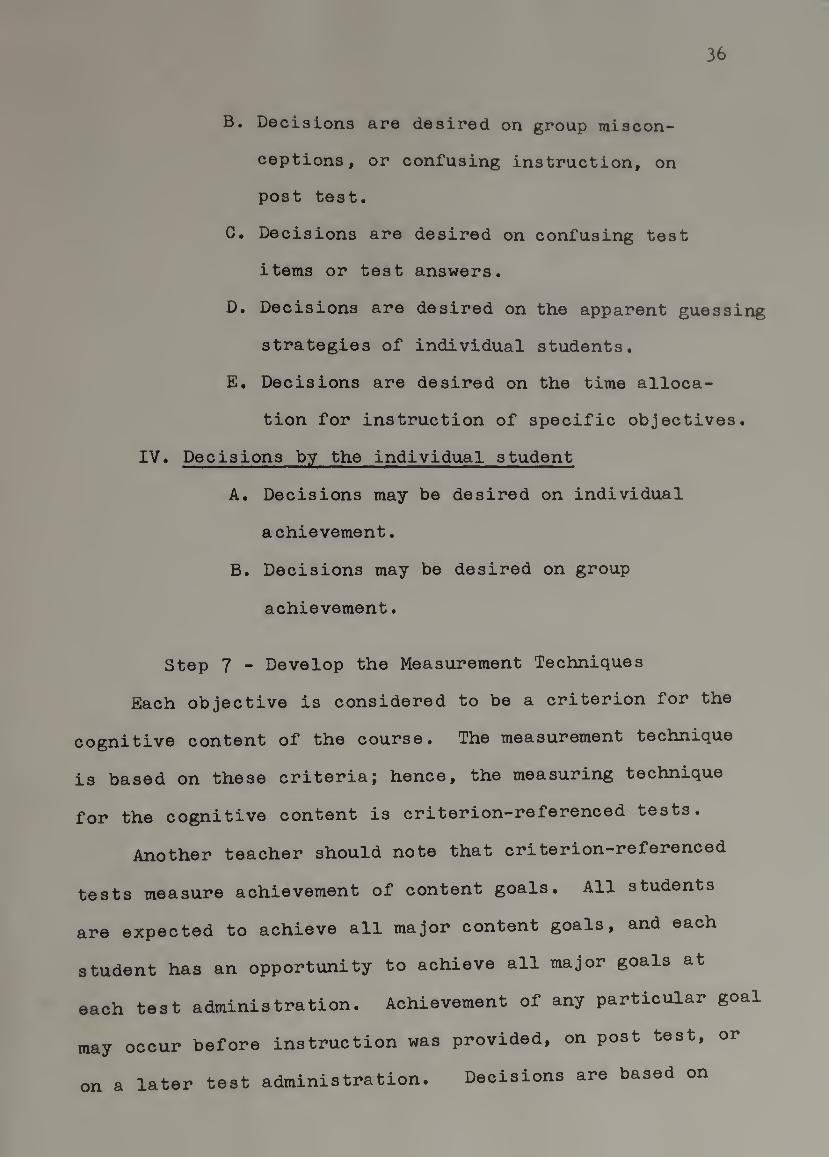
36
B. Decisions are desired on group miscon¬
ceptions, or confusing instruction, on
post test.
G. Decisions are desired on confusing test
items or test answers.
D. Decisions are desired on the apparent guessing
strategies of individual students.
E, Decisions are desired on the time alloca¬
tion for instruction of specific objectives.
IV. Decisions by the individual student
A. Decisions may be desired on individual
achievement.
B. Decisions may be desired on group
achievement.
Step 7 - Develop the Measurement Techniques
Each objective is considered to be a criterion for the
cognitive content of the course. The measurement technique
is based on these criteria; hence, the measuring technique
for the cognitive content is criterion-referenced tests.
Another teacher should note that criterion-referenced
tests measure achievement of content goals. All students
are expected to achieve all major content goals, and each
student has an opportunity to achieve all major goals at
each test administration. Achievement of any particular goal
may occur before instruction was provided, on post test, or
on a later test administration. Decisions are based on
37
achievement rather than achievement on a particular test
adminis tration•
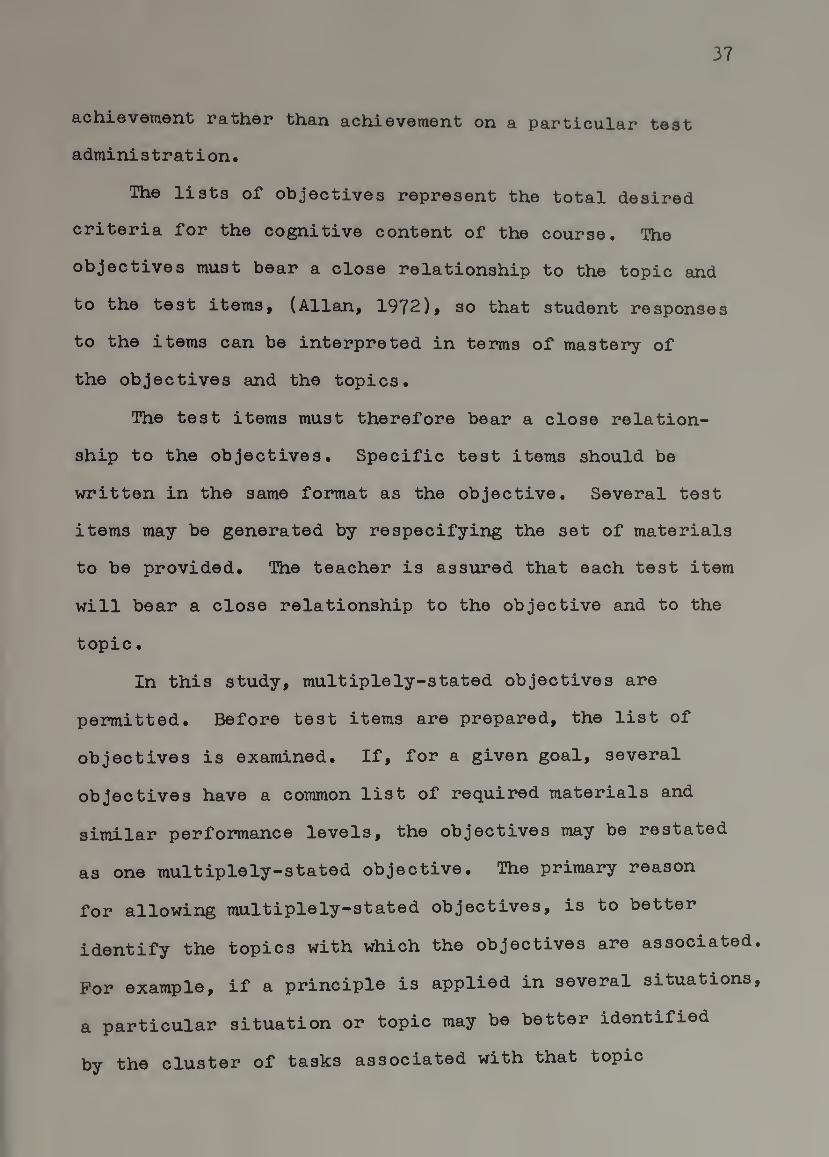
The lists of objectives represent the total desired
criteria for the cognitive content of the course. The
objectives must bear a close relationship to the topic and
to the test items, (Allan, 1972), so that student responses
to the items can be interpreted in terms of mastery of
the objectives and the topics.
The test items must therefore bear a close relation¬
ship to the objectives. Specific test items should be
written in the same format as the objective. Several test
items may be generated by respecifying the set of materials
to be provided. The teacher is assured that each test item
will bear a close relationship to the objective and to the
topic.
In this study, multiplely-stated objectives are
permitted. Before test items are prepared, the list of
objectives is examined. If, for a given goal, several
objectives have a common list of required materials and
similar performance levels, the objectives may be restated
as one multiplely-stated objective. The primary reason
for allowing multiplely-stated objectives, is to better
identify the topics with which the objectives are associated.
For example, if a principle is applied in several situations,
a particular situation or topic may be better identified
by the cluster of tasks associated with that topic
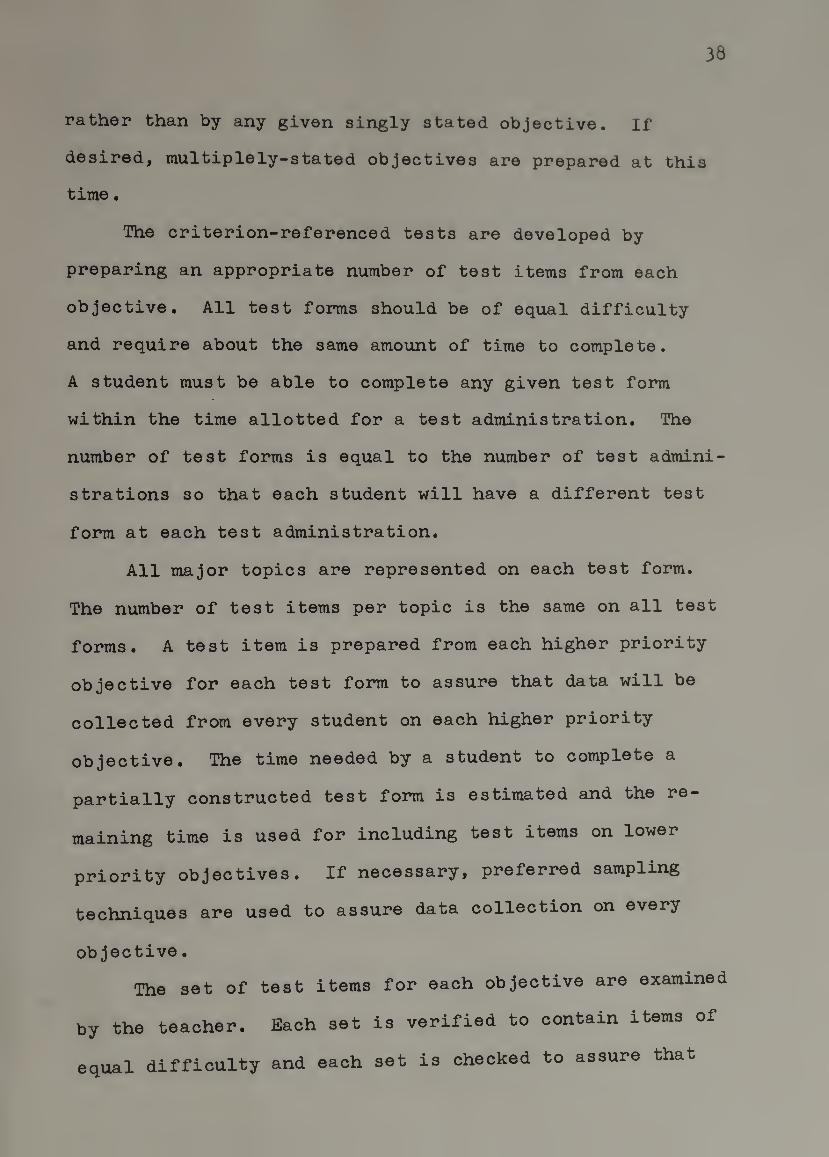
38
rather than by any given singly stated objective. If
desired, multiplely-stated objectives are prepared at this
time.
The criterion-referenced tests are developed by
preparing an appropriate number of test items from each
objective. All test forms should be of equal difficulty
and require about the same amount of time to complete.
A student must be able to complete any given test form
within the time allotted for a test administration. The
number of test forms is equal to the number of test admini¬
strations so that each student will have a different test
form at each test administration.
All major topics are represented on each test form.
The number of test items per topic is the same on all test
forms. A test item is prepared from each higher priority
objective for each test form to assure that data will be
collected from every student on each higher priority
objective. The time needed by a student to complete a
partially constructed test form is estimated and the re-
xnaining time is used for including test items on lower
priority objectives. If necessary, preferred sampling
techniques are used to assure data collection on every
objective.
The set of test items for each objective are examined
by the teacher. Each set is verified to contain items of
equal difficulty and each set is checked to assure that

39
every item bears a close relationship to the objective and
to the topic. The teacher, as an evaluator, must be
assured that valid data will be collected on every objec¬
tive at each test administration.
Step 8 - Design the Data Collection System
An evaluator must interact with the decision maker to
determine when data collection will begin, how often data
will be collected, and if sampling is needed. In addition,
the evaluator must identify the data to be collected for
each decision maker.
The evaluator must interact with each decision maker
and determine when the measuring techniques will be applied
and data collection will be initiated. Because data are pro¬
vided for decision making, data should be collected at
timely intervals. The initiation and frequency of data
collections are specified to meet the needs of each decision
maker. Sampling techniques may be suggested by the
evaluator subject to the approval of the decision maker.
The entire data collection process is accomplished
for the decision maker. The evaluator's interests focus
on the validity of the data and the effectiveness of the
data collection system. Each datum collected is verified
by a decision maker as a datum that is desired and as a
datum that is an accurate measure of an intent or goal.
The data collection system must be designed so that each
data collection is accomplished within the available
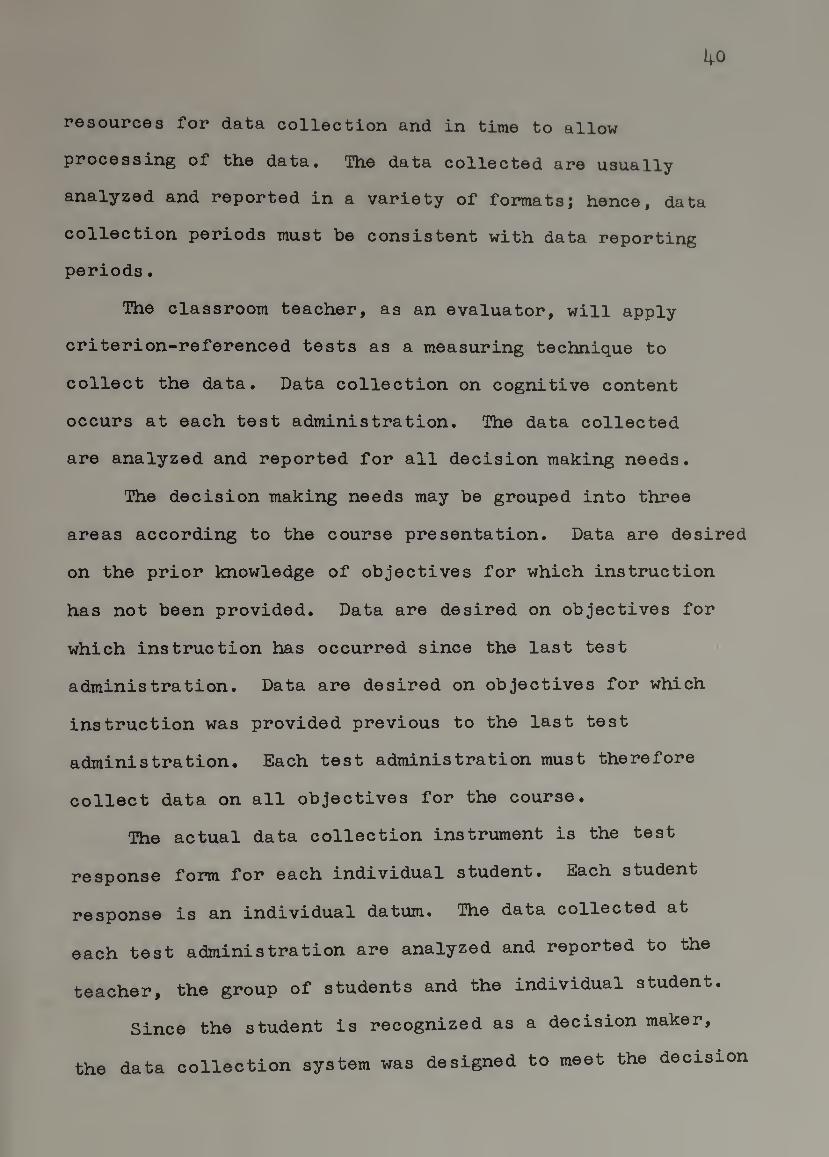
40
resources for data collection and in tirtie to allow
processing of the data. The data collected are usually
analyzed and reported in a variety of formats; hence, data
collection periods must be consistent with data reporting
periods.
The classroom teacher, as an evaluator, will apply
criterion-referenced tests as a measuring technique to
collect the data. Data collection on cognitive content
occurs at each test administration. The data collected
are analyzed and reported for all decision making needs.
The decision making needs may be grouped into three
areas according to the course presentation. Data are desired
on the prior knowledge of objectives for which instruction
has not been provided. Data are desired on objectives for
which instruction has occurred since the last test
administration. Data are desired on objectives for which
instruction was provided previous to the last test
administration. Each test administration must therefore
collect data on all objectives for the course.
The actual data collection instrument is the test
response form for each individual student. Each student
response is an individual datum. The data collected at
each test administration are analyzed and reported to the
teacher, the group of students and the individual student.
Since the student is recognized as a decision maker,
the data collection system was designed to meet the decision
HQsds of t/luo s'tiid.on'bs • Th© nosti prGssing d6ci.si.on
tnaking need for the individual student appeared to be
prompt data reporting of individual achievement after
each test administration and the data collection system
was designed to meet this need. Test forms, with multiple
choice answers, were developed to facilitate test
correcting. The corrected response form was used as a
data reporting form for the individual student.
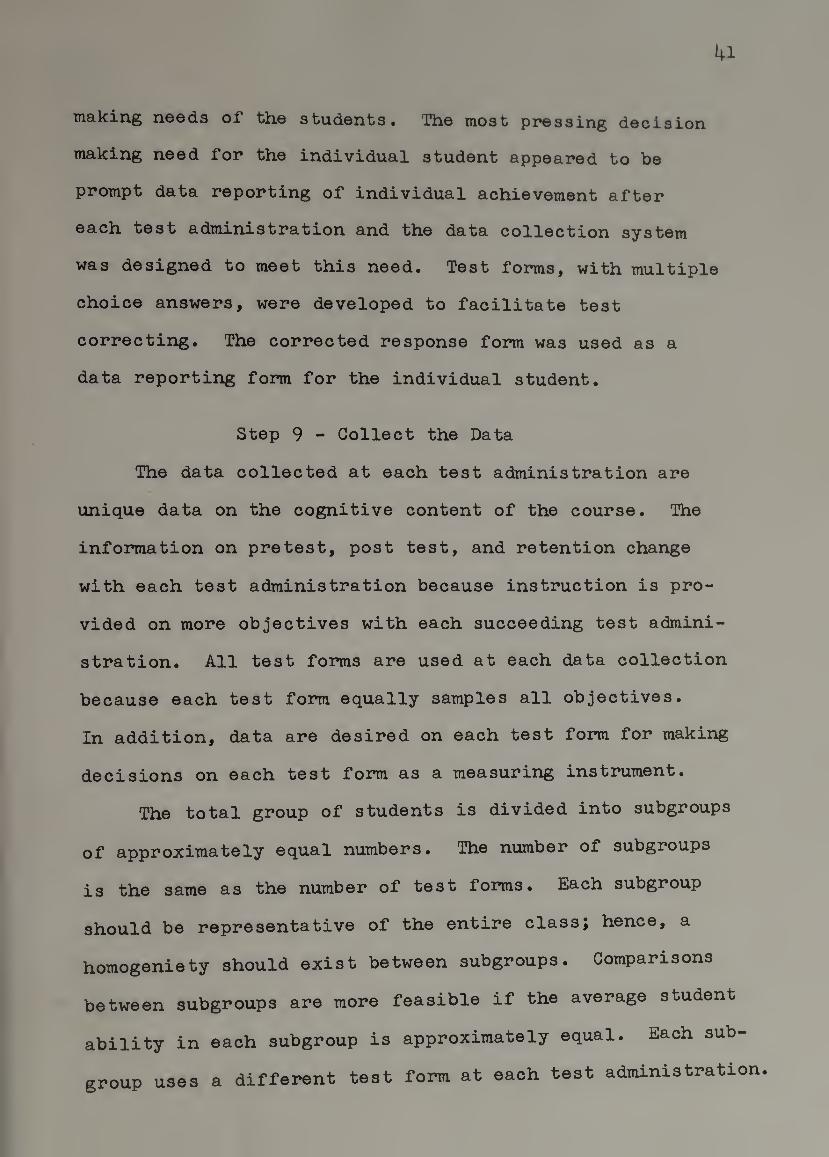
Step 9 - Collect the Data
The data collected at each test administration are
unique data on the cognitive content of the course. The
information on pretest, post test, and retention change
with each test administration because instruction is pro¬
vided on more objectives with each succeeding test admini¬
stration. All test forms are used at each data collection
because each test form equally samples all objectives.
In addition, data are desired on each test form for making
decisions on each test form as a measuring instrument.
The total group of students is divided into subgroups
of approximately equal numbers. The number of subgroups
is the same as the number of test forms. Each subgroup
should be representative of the entire class; hence, a
homogeniety should exist between subgroups. Comparisons
between subgroups are more feasible if the average student
ability in each subgroup is approximately equal. Each sub¬
group uses a different test form at each test administration.
42
The classroom teacher collects data, performs the
initial analyses, and reports data back to each individual
student at each test administration. Past experience with
the example course revealed that students would return
completed test forms at a fairly continuous rate during the
last quarter of the allotted time. The half hour time
interval for data collection would allow data analyses and
data reportings for about twenty students. If the time
span was too short or the group was too large additional
time would be allocated for data collection to insure that
data were promptly reported to each student.
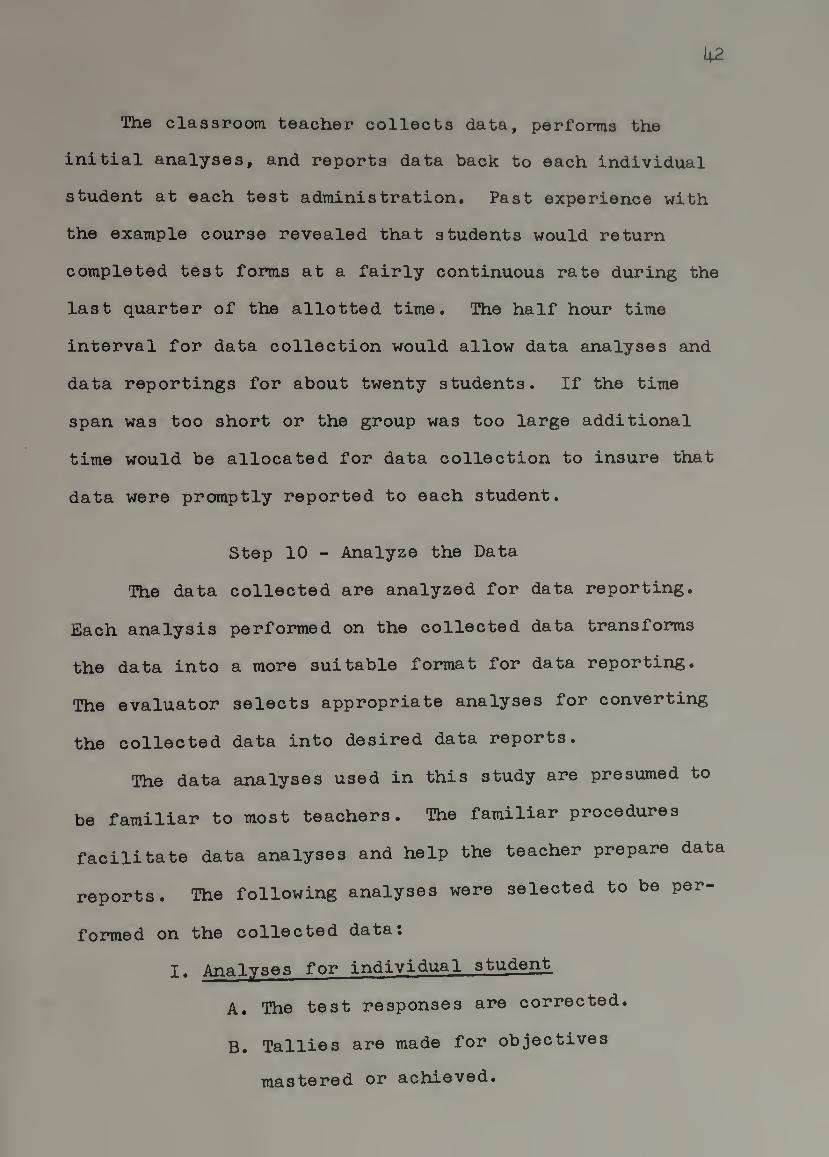
Step 10 - Analyze the Data
The data collected are analyzed for data reporting.
Each analysis performed on the collected data transforms
the data into a more suitable format for data reporting.
The evaluator selects appropriate analyses for converting
the collected data into desired data reports.
The data analyses used in this study are presumed to
be familiar to most teachers. The familiar procedures
facilitate data analyses and help the teacher prepare data
reports. The following analyses were selected to be per¬
formed on the collected data;
I, Analyses for individual student
A. The test responses are corrected.
B. Tallies are made for objectives
mastered or achieved.
43
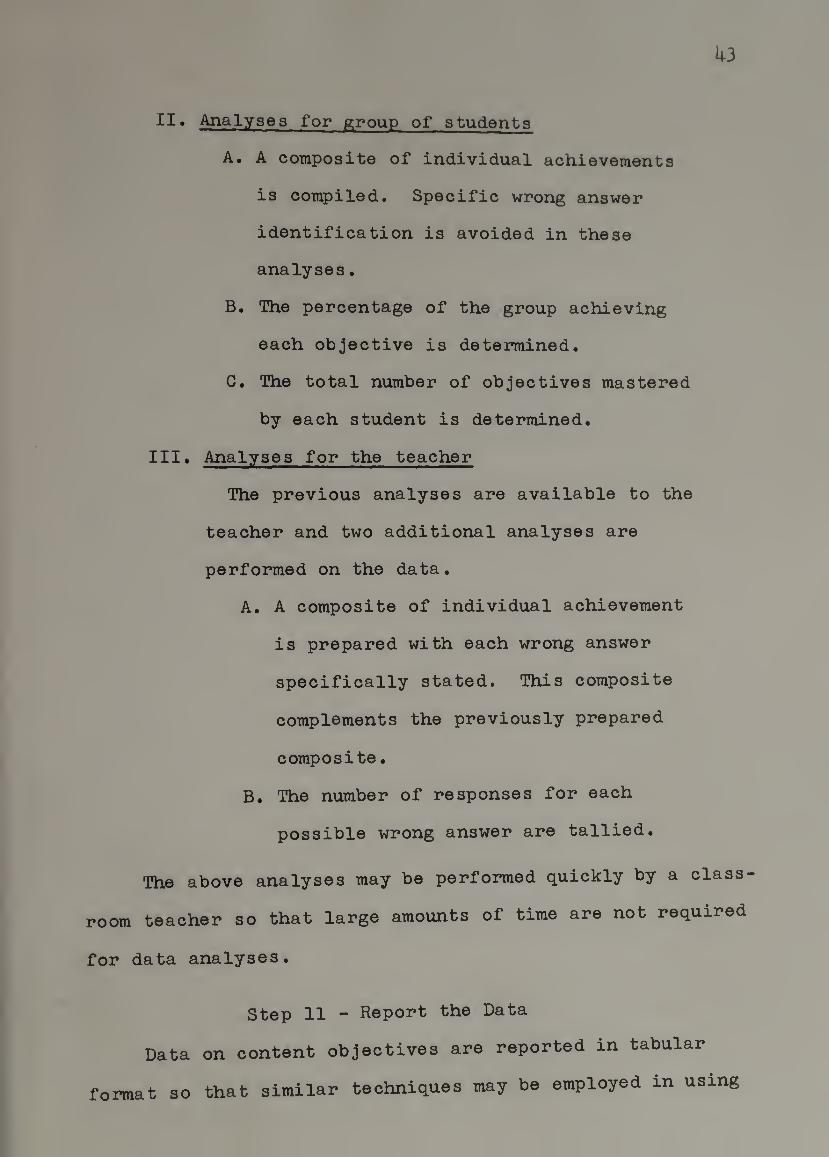
II» Analyses for group of students
A. A composite of individual achievements
is compiled. Specific wrong answer
identification is avoided in these
analyses•
B. The percentage of the group achieving
each objective is determined.
C. The total number of objectives mastered
by each student is determined.
III. Analyses for the teacher
The previous analyses are available to the
teacher and two additional analyses are
performed on the data.
A. A composite of individual achievement
is prepared with each wrong answer
specifically stated. This composite
complements the previously prepared
composite•
B. The number of responses for each
possible wrong answer are tallied.
The above analyses may be performed quickly by a class¬
room teacher so that large amounts of time are not required
for data analyses.
Step 11 ~ Report the Data
Data on content objectives are reported in tabular
similar techniques may be employed in using format so that
the data for decision making. The techniques, which are
primarily inspections, are not as precise as other
methods; however, obvious situations may be identified
from the reported data where decision making is needed.
Each student response form is corrected and total
objectives mastered are tallied. The analyses are per¬
formed on the student response form and the analyzed form
is used as the data reporting form for the individual
student. Each student is allowed to examine the reported
data for decision making and the corrected response forms
are collected again for additional analyses and data
reportings.
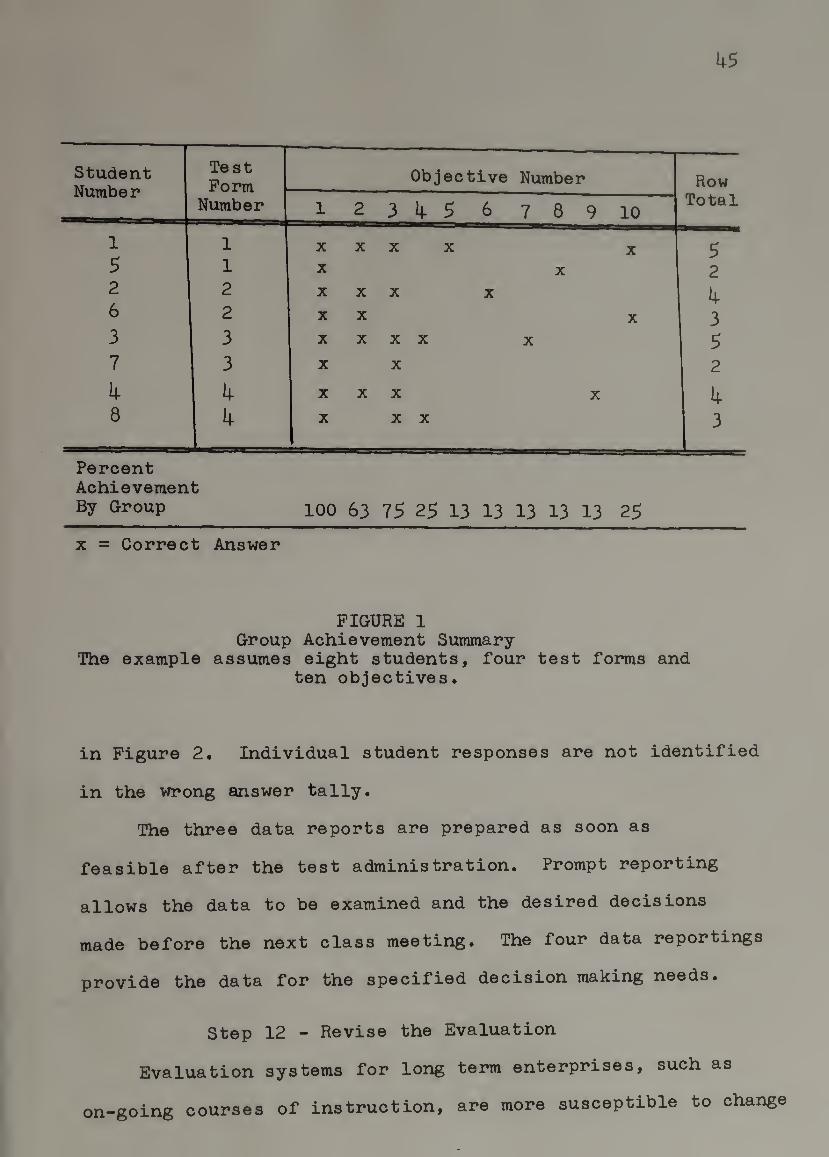
A composite of individual achievements, called a group
achievement summary, reports data on both individual and
group achievement to the students. The data reported on
this form may be used for making decisions on student
progress. A suggested form for this data report is
illustrated in Figure 1. Similar data are reported to
the teacher with the same form, however wrong answers are
stated. Correct answers may be left blank to avoid con¬
fusion. Items not tried may be identified with an asterisk.
The data in the bottom row and right column are repeated from
the previous group achievement summary.
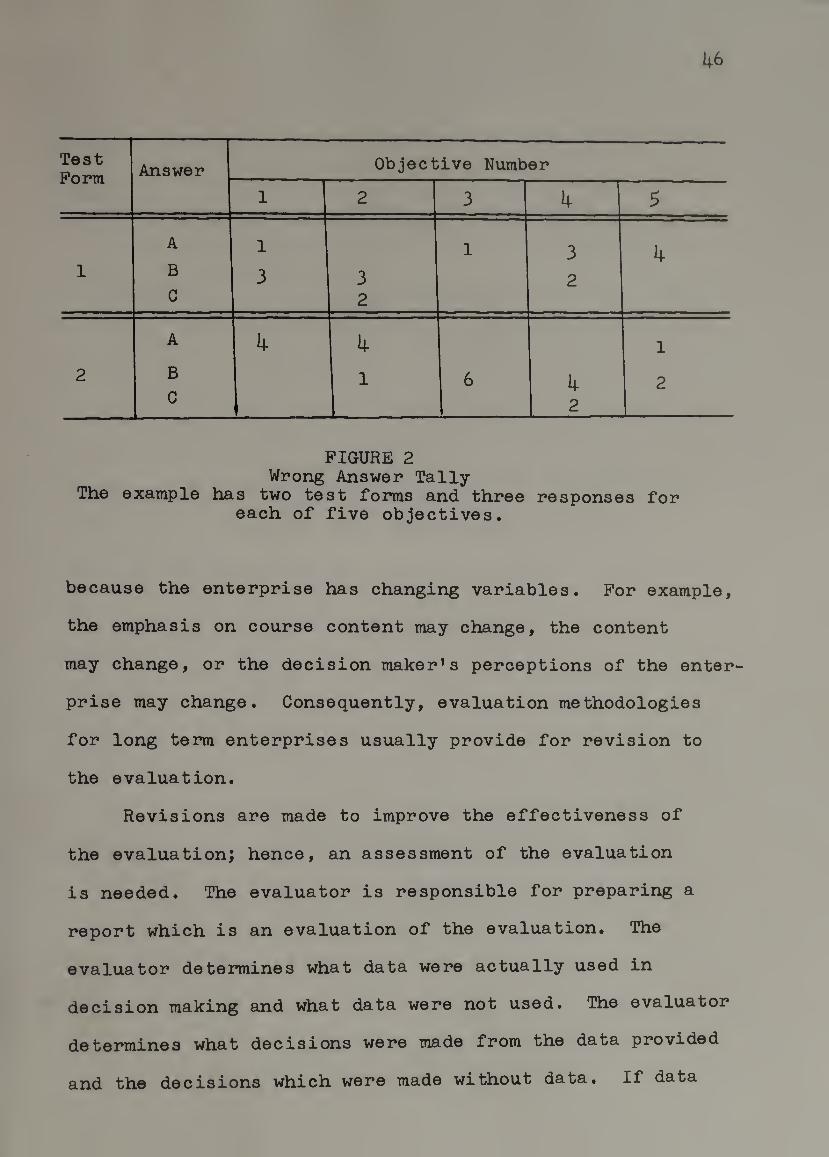
The wrong answer tally specifies the number of times
each incorrect response was selected. The correct response
is left blank. A suggested wrong answer tally is illustrated
45
Student Number
Test Form
Objective Number Row Total Number 1 2345 6 789 10
1 1 X X X X X 5 5 1 X X 2 2 2 XXX X 4 6 2 XX X 3 3 3 X X X X X 5 7 3 X X 2
4 4 XXX X 4 8 4 X XX 3
Percent Achievement
By Group 100 63 75 25 13 13 13 13 13 25
X = Correct Answer
FIGURE 1 Group Achievement Summary
The example assumes eight students, four test forms and ten objectives.
in Figure 2. Individual student responses are not identified
in the wrong answer tally.
The three data reports are prepared as soon as
feasible after the test administration. Prompt reporting
allows the data to be examined and the desired decisions
made before the next class meeting. The four data reportings
provide the data for the specified decision making needs.
Step 12 - Revise the Evaluation
Evaluation systems for long term enterprises, such as
on-going courses of instruction, are more susceptible to change
46
Teat Form Answer Objective Number
1 2 3 4 5
A 1 1 3 4 1 B 3 3 2
C 2
A 4 4 1
2 B 1 6 4 2 C 1 2
FIGURE 2 Wrong Answer Tally
Tlie example ha.s two test forms and three responses for each of five objectives.
because the enterprise has changing variables. For example,
the emphasis on course content may change, the content
may change, or the decision maker’s perceptions of the enter
prise may change. Consequently, evaluation methodologies
for long term enterprises usually provide for revision to
the evaluation.
Revisions are made to improve the effectiveness of
the evaluation; hence, an assessment of the evaluation
is needed. The evaluator is responsible for preparing a
report which is an evaluation of the evaluation. The
evaluator determines what data were actually used in
decision making and what data were not used. The evaluator
determines what decisions were made from the data provided
and the decisions which were made without data. If data
47
could not be provided for all decision making needs, the
evaluator determines the extent to which data were pro¬
vided for the most important decisions. The report may
include recommendations by the evaluator for improving
the evaluation design.
The final decision on revisions must be made by the
decision makers. The evaluation system was designed and
implemented solely for the benefit of the decision makers;
hence, the decision makers must ultimately decide on any
revisions. If revisions are desired, the same methodology
is again applied. Each step, where revision is needed, is
recycled and the step is again accomplished by including
the new perspectives pertaining to that step. The same
type of interaction occurs between the evaluator and
decision makers in the redesign as in the initial design.
This step was particularly desired in the study be¬
cause a teacher may not have identified the role of an
evaluator completely even after an initial design has been
created. This step allows the teacher to gradually identify
the role of the evaluator through operational experience
and to benefit from this experience on the next application.
Teachers may create an excellent initial design for
certain aspects of the course. However, it is unlikely
that the design will provide data for all aspects of the
course. This step allows the teacher to expand the eval¬
uation design as additional desired aspects of the course are
identified for evaluation.
48
Actual revisions to the design are accomplished
similarly to the procedures described in the methodology.
An evaluator’s report is prepared by the teacher which
determines what data were used in making decisions, what
decisions were made without data, and if data were pro¬
vided for the most important decisions. Desired changes
are identified by the teacher interacting, as an evaluator,
with the students. The redesign is accomplished by the
teacher who reaccomplishes the pertinent steps of the
strategy identified from each desired revision.
Summary
Guidelines and perspectives were developed for
selecting an evaluation methodology suitable for a formal
classroom evaluation strategy. Some available methodologies
were assessed, an appropriate methodology was selected
and interpreted for a classroom situation. In the next
chapter, the strategy will be applied to the selected class¬
room situation.
CHAPTER III
CREATING THE INITIAL DESIGN
The classroom evaluation strategy, developed in the
provious chapter, contains the procedures for creating,
operating and revising a formal classroom evaluation
design. In this chapter an initial design is created by
®-PPlying the strategy to the example physics course which
was administered at Fitchburg State College. The initial
design was created by accomplishing steps one through
eight of the strategy.
In this study, the initial design consisted of two
parts. The first part of the design was created by
applying the strategy to the course content. As the first
part of the design was created important instructional
materials in the course were identified. The second part
of the design was created by applying the same strategy
to these important instructional materials.
As the initial design for course content was created,
additional aids were developed to help the teacher accom¬
plish the goal articulation process in steps four and five.
Teachers may tend to confuse goals for evaluation with
other goals in the goal articulation process. Consequently,
more emphasis was desired on the evaluator’s role in
50
accomplishing these critical steps. Three forms were
developed to complement the strategy and guide the
teacher in accomplishing steps four and five. The forms
helped the teacher to focus on desired goals for eval¬
uation and avoid personal biases.
All design effort was accomplished by one person, the
classroom teacher. The teacher assumed the role of an
evaluator by using the procedural substeps of the strategy
to accomplish the design. The teacher alternately assumed
the role of a decision maker by responding to the pro¬
cedural substeps and articulating necessary information
for the design. The initial design created in this study
demonstrates for other classroom teachers how they may
apply the strategy to their courses and obtain formal class¬
room evaluation.
An important contribution of this study is contained
in this chapter. The procedures used in creating an
initial design serve as a guide for other teachers who may
desire formal classroom evaluation for their courses. The
identification and separation of evaluator roles from
decision maker roles is a significant aspect of this con¬
tribution. Teachers should note that particular prefer¬
ences for teaching modes or teaching styles are avoided
as each step is accomplished. The strategy allows each
teacher to retain individual teaching preferences.
51
Part I - The Initial Design for Copinitlve Content
A classroom situation is assumed to be confined to a
particular course with a teacher and a group of students
who are the potential decision makers. In this study, ex¬
ternal influences are ignored for evaluative purposes. The
purpose of the study is to demonstrate how teachers with
similar classroom situations may independently create
evaluation designs for their courses.
The major steps of the strategy are accomplished by
briefly reviewing the purpose of the step followed by the
specific step accomplishment for the example course.
Where appropriate, comments and contributions for other
teachers are cited.
Step 1 - Define the Enterprise
The enterprise must be defined in terms of its extent,
its basic purpose, and its major components. The defin¬
ition should be brief and provide a general reference
frame for the steps which follow.
The enterprise is a one-semester course in college
physics for non-physics majors. Instruction and laboratory
experiments are provided at an introductory level for
students who desire a course in physics as part of their
general educational experience.
Step 2 - Define the Resources
Specifically, the evaluator should identify whether
any of the following types of resources are available:

52
personnel time, supplies, equipment, duplication, tests,
clerical assistance, space, telephone, postage, shipping,
travel reimbursement, computer time and money. These
represent only a partial list of the many types of resources
which may be available for evaluation. A complete specifi¬
cation of resources is required because the extent of the
®valuation depends on the extent of the resources.
For this study, a minimum set of resources were
defined to demonstrate that formal classroom evaluation
can be independent of extensive resources. The resources
available for evaluation were;
1. A classroom teacher's time. The time
needed for evaluation equals about ten
per cent of the total time spent on the
job each week.
2. A ditto machine and ditto supplies for the
evaluation materials used in the study.
3. Paper and pencils.
Step 3 - Identify the Decision Makers
A decision maker is a person to whom data will be
provided for decision making. All potential decision makers
are identified by the evaluator, and the list of decision
makers is rank ordered according to their importance to
the enterprise.
In the classroom situation, the decision makers were
identified as the teacher, the group of students, and the

53
individual student. Data would be provided to these
decision makers, and only these, during the course. Since
this step is accomplished before the course begins, the
teacher, acting as an evaluator, must rank the decision
makers.
The teacher was ranked highest. The classroom
teacher was assumed to make most of the decisions about
the course and would need the most data for decision making.
The group of students was ranked second for evaluative
purposes. Decisions common to the group of students would
be considered as bases for revisions in the course and in
the evaluation redesign.
The individual student was ranked lowest. Neither
the course nor the evaluation system would be tailored to
individual desires. However, data would be provided to
the individual student for making decisions.
Comments on the First Three Steps
Teachers should note that the resources identified
for this study and the identified decision makers may be
directly applied to their courses. The teacher, who is
a novice in evaluation, may more profitably spend the
time saved in accomplishing steps four and five. In
addition, the resources and decision makers in this study
limit the scope of the evaluation so that the teacher has
complete control at all times.
54
As the first three steps were accomplished for this
part of the design they were automatically accomplished for
the second part of the design in this study. The second
part of the design is initiated with step four of the
strategy,
Overview of Steps 4> 5
The goal articulation process is initially guided
with the first form. The Course Outline« The form focuses
the teacher's attention on topics that will be used for
instruction. Topics for instruction are often similar
to chapters in a text because the teacher complies with
an author's perspective in identifying topics.
The major goals identified for evaluation may be quite
different however, because teachers use their own perspec¬
tives in developing goals and objectives for a course.
This study is an example where major goals for evaluation
differ from topics for instruction. The topics for instruc¬
tion are similar to chapter headings in texts, but the
major goals for evaluation identify the central themes which
the student is expected to master. The physics course is
an example where basic principles are applied to a variety
of situations. The topics for instruction are the situations
but the major goals for evaluation are the principles.
A second form. The Topic Analysis Fortn, was developed
to help the teacher make the transition from identifying
topics for instruction to identifying major goals for

55
evaluation. The course outline was reviewed and the
basic principles in the course were identified. The basic
principles were stated on the second form as major goals
for evaluation. Goal articulation continued on this form
as desired subgoals were specified for each major goal.
The subgoals were copied onto the third form. The
Task Analysis Form, and the tasks students must perform to
accomplish each subgoal were identified. Objective state¬
ments were prepared directly from this form.
The three forms are an important contribution of
this study. They help the teacher separate goals for
evaluation from topics for instruction and to accomplish
these critical steps as a continuous process. The forms
help the teacher to integrate the course by identifying
what the students are expected to accomplish as instruction
is provided.
Step 4 - Articulate the Goals
Goal articulation is accomplished by generating a
list of goals, checking the goals for completeness and
prioritizing the goals. Goal articulation is critical to
an evaluation design because succeeding steps in the design
depend on the goals stated.
This step was initiated by completing a course out¬
line which contained a commitment for each class session.
The course outline was completed by the following stepwise
procedure:
56
1. Identify the class sessions to be used for
testing. These sessions are not available
for presenting new topics.
2. Identify the course topics, course parts, and
course activities for each remaining class
session. Course parts and course activities
are added to ensure that instruction is
available for the topic and the topic will
be treated.
3. Review the list of topics, course parts, and
course activities and verify that a complete
list of topics has been generated for the
course,
The course outline for the physics course is shown in
Figure 3« Most of the topics listed on the course outline
are similar to chapter headings in introductory physics
texts previously used in the course. The topics were
stated in this way to help students identify instruction
in any of the several texts which were used in the course.
The course parts and the course activities, which were
primarily labs, were compared with the topics and the list
of topics was verified as a complete set of topics for
instruction.
Does a topic for instruction identify what the student
is expected to achieve or does the student achieve several
topics by mastering certain fundamental principles? This
key question caused the teacher, in this study, to carefully
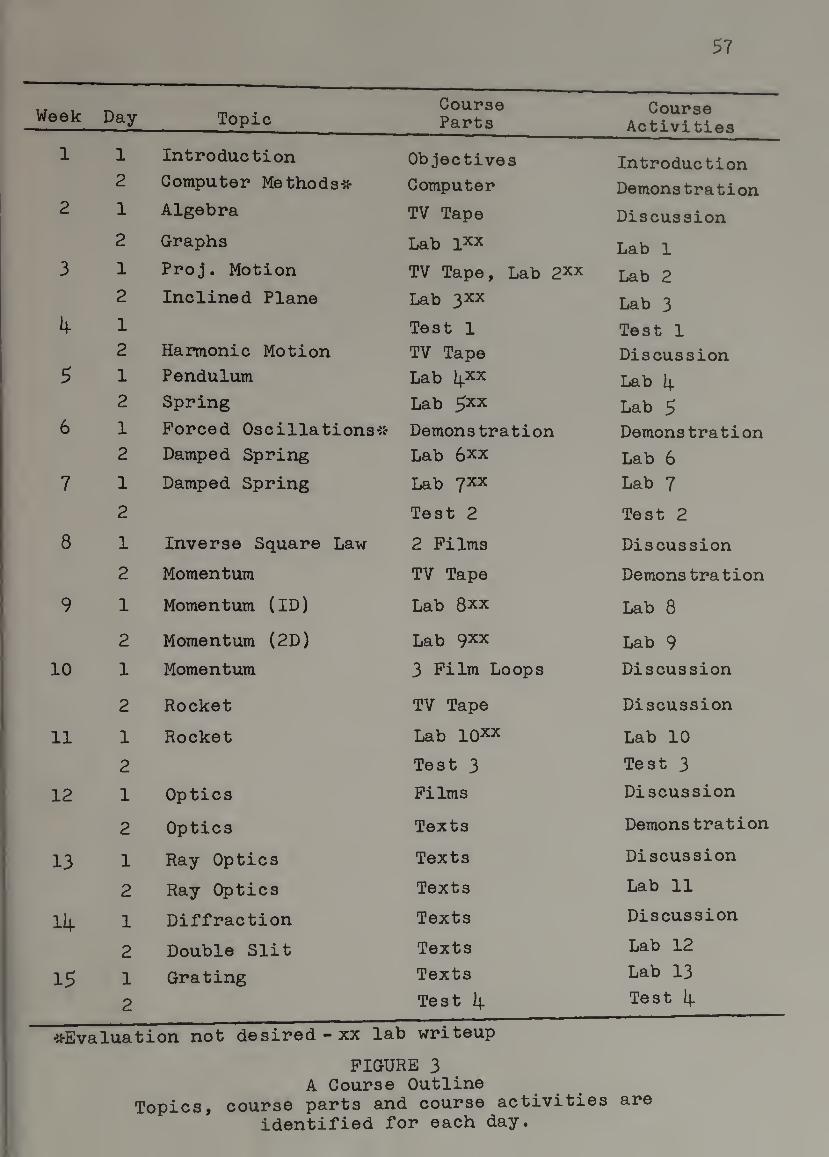
57
Week Day Topic Course Parts
Course Activities
1 1 Introduction Objectives Introduction 2 Computer Methods* Computer Demonstration
2 1 Algebra TV Tape Discussion
2 Graphs Lab ixx Lab 1 3 1 Proj. Motion TV Tape, Lab 2xx Lab 2
2 Inclined Plane Lab 3XX Lab 3
4. 1 Test 1 Test 1 2 Harmonic Motion TV Tape Discussion
5 1 Pendulum Lab 4XX Lab 4. 2 Spring Lab 5xx Lab 5
6 1 Forced Oscillations* Demons tration Demonstration 2 Damped Spring Lab 6xx Lab 6
•7 1 •Damped Spring Lab 7XX Lab 7
2 Test 2 Test 2
8 1 Inverse Square Law 2 Films Discussion
2 Momentum TV Tape Demonstration
9 1 Momentum (ID) Lab 8xx Lab 8
2 Momentum (2D) Lab 9XX Lab 9
10 1 Momentum 3 Film Loops Discussion
2 Rocket TV Tape Discussion
11 1 Rocket Lab lO^x Lab 10
2 Test 3 Test 3
12 1 Optics Films Discussion
2 Optics Texts Demons tration
13 1 Ray Optics Texts Discussion
2 Ray Optics Texts Lab 11
14- 1 Diffraction Texts Discussion
2 Double Slit Texts Lab 12
15 1 Grating Texts Lab 13
2 Test 4- Test 4
^Evaluation not desired-xx lab writeup
FIGURE 3 A Course Outline
Topics, course parts and course activities are identified for each day.
58
i*©0X8,tiiin© 'bh© coiips© oiitljLii©d. b©!*©!*© bh© d.©si.gn wels
conbinu©d.
Th© bopic on corapub©r m©bhod3 and bh© bopic on forc©d
oscxHabxons w©p© nob d©sip©d Tot ©valuabion b©caus© bb©
insbrucbion on bh©s© bopics was ©xplanabory and nob in-
b©nd©d for masbory. An asb©risk was add©d bo ©ach bopic
bo d©sxgnab© btiab ©valuabion was nob d©sir©d* Th© r©iTiaining
bopics on bh© cours© oublin© w©r© us©d bo id©nbify major
goals for ©valuabion.
Major goals for ©valuabion war© spacifiad by idanbifying
whab bh© sbudanb musb do bo achiav© ©ach bopic on bh©
cours© oublin©. As bh© bopics for insbrucbion war© raaxaminad
bhay bandad bo clusbar around fundamanbal principlas. For
©xarapla, bh© inclinad plana, harmonic mobion, bh© pandulum
and bh© spring war© ©xaraplas of mobion by an appliad fore©
and sbudanbs war© ©xpaebad bo parform similar oparabions
for ©ach bopic. As bh© ©xaminabion conbinuad, ©ighb major
goals war© idanbifiad as dasirad for ©valuabion in bhis
parbicular sibuabion.
Th© ©xarapla cours© in bhis sbudy may sarv© as a ramindar
and a guid© for obhar baachars wibh similar classroom
sibuabions. Topics on obhar cours© oublinas may nob b©
usaful for ©valuabion bacaus© bh© baachar dasiras bo
idanbify fundamanbal principlas or canbral bhamas as bh©
basas for ©valuabion. If dasirad, basbs praviously usad in
bh© cours© should b© ©xaminad as an aid and a guid© for
idanbifying dasirad major goals for ©valuabion. In bhis
59
study, some of the major goals for evaluation were similar
to topics while others identified principles common to
several topics.
The major goals for evaluation were ranked and assigned
equal priority on the basis of the importance of each to the
course. Data were desired on each major goal at each data
collection. The major goals were listed on the topic analysis
form, shown in Figure I4., sind the procedural substeps in the
strategy were followed in specifying subgoals for evaluation.
Each major goal was treated separately. The major goal
was listed on the form and the initial subgoal list was gen¬
erated for that major goal. The course parts which had been
identified with each generated major goal were added. The
subgoals and course parts were compared for implied subgoals
and implied subgoals were added to the list of goals. The
appropriate course pants were identified for each added sub¬
goal and the lists were again compared for additional implied
subgoals. The course activities were identified for each
subgoal and the activities list was compared with the list
of subgoals for additional implied subgoals.
When each major goal had been treated, the list of sub¬
goals was examined and those subgoals desired for evaluation
were retained. The verified list of subgoals for each
major goal completed Step Ij. of the strategy.
Step ^ - Specification of Objectives
Objectives are specified by analyzing each subgoal
for tasks and preparing objective statements from the tasks
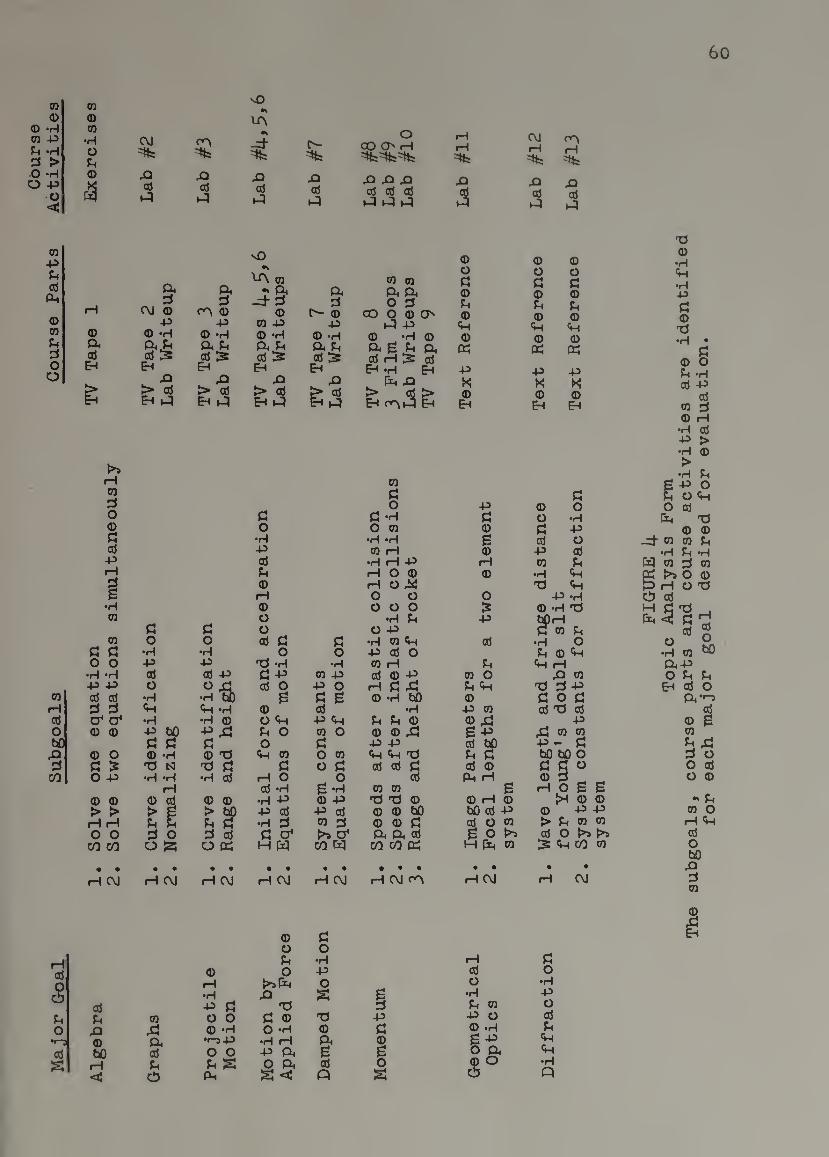
60
m 0 o 0
<D -H 0 01 -P •H c\J Fh -H o d > Fh •O “H 0 O -P 0 0
O 1-5 i-q <
01
Fh 0 ft ft fii d d
fH CM 0 0 0 +5 -p 0 0 0 ‘H 0 -H )h a ft Fh ft Fh d 0 0 |2 0 IS o Eh EH en o JQ
> > 0 > 0 Ih Eh Eh
iH •* 0
d o 0 d 0 +5 r-H d e
•H 0
d F3 0 O O
d d •H •H o o -p 43
•H 'H 0 0 43 -P -P O ^ A 0 0 0 •H •H ^
iH d d 4h ‘H 0 c cr •H •H 0 o 0 0 -P bO u: d d d
0 o 0 "H 0 -d d C IS 73 d
CO O -P •H "H •H 0 fH
0 0 0 0 0 0 > > > P > W)
rH H Fh Fh Fh d o o d o d 0
CO CO O Jz; o «
H C\J H CM H CM
iH cd 0 o iH
o •H 0 ■P FJ
F^ Fh 0 O O O 0 "H
•»“ 0 ft •1-^43 0 U) 0 O O X iH Fh Fh S
c CiJ ft
vO •i
lA
C^ o
00 O H iH rH
=*ts =»»5=*fe=*t!
Xi Xi 43 ^ 43 JQ 0
1-5 0
.35,3 5
vO
"CA 0 0 0
0 O F5
& ft ft ft 0 -d- d d o d Fh
0 0 00 O 0 o 0 0 43 43 V-5 43 U 0 "H 0 "H 0 •H 0 0
ft Fh ft g Fh ft K 0 Is 0 15 0 iH S oJ
Eh Eh Eh -h EH 43 43 43 ft Xi K
S5 t,S 0
0 d O 43
d d -H d o O 0 0
•H •H ft i 43 0 ft 0 0 ft ft 43 rH Fh ft O 0 0 0 ft O 4sJ rH O O 0 0 O O O IS o ft Fh 43 o O 43 0 d d ft 0 ft 0
o o 43 cd O TJ 'H •H 0 ft Fh d -p 0 43 0 0 43 0 0 0 o 43 O ft d 4d Fh ft
B d B 0 ft hO 0 0 0 •H 43 0 o ft 43 Oh Fh Fh 0 0 d Fh O 0 O 0 0 d B -P O d 43 43 0 ^ ft 0 O 0 ft ft 73 Fh d
d o d 0 0 d 0 0 rH O ^ o 0 Pk ft 0 "H ^ tH 0 0
•H -P 0 43 TJ TJ 0 0 ft 43 cd 43 cd (D 0 U) bO 0 •H d 0 0 0 d 0 0 f5 o" M ft
di P4 0 CO CO «
B 0 H
H CM H CM ft CM fA ft CM
0 d o o Fh 'H rH O -P Oj
® -p -p o
CM ft ft
43 ja
3 5
TJ 0
0 0 •H 0 0 ft d d ft 0 0 43 Fh Fh d 0 0 0 ft ft 0 0 •H • K « d
0 0 43 43 Fh ft K K 0 43 0 0 0
EH Eh 0 d 0 ft ft 0 43 > •H 0 > ft Fh
e 43 0 d Fh 0 ft
0 0 0 0 0 ft &H 'd d -p 0 0 0 0 -d- 0 0 Fh 43 cd ft Fh ‘H 0 Fh Pi5 0 d 0 ft ft W >> 0 0 73 ft P ft 0 TJ
43 -H c!j 0 0 ft'd ft d'd Mft &H *0 d rj d 0 Fh 0 S
•H 0 0 ® Fh 0 ft ft 0 ft ft Ph43
43 0 0 Fh Fh t3 d -p EH 0 0 d 0 d 0 TJ 0
fX*r-j
43 0 i d 0 w 0 43-d b ^ bO bO 0 d 0 d d 0 0 0 0 d _ _ 0 0
B ft 0 6 2 0 |H 0 0 Fh 43 ® 43 43 0 0 0 > Fh 0 0 ft ft >> 0 0 N 0 0 IS ft CO 0 0
bO • • 40
H OJ d 0
1
•H -P O cd Fh
•H Q
61
desired for evaluation. Tasks are specified for each sub¬
goal by generating a list of tasks, checking the tasks
for completeness, verifying each task as desired for
evaluation and assigning a priority to each task. Objective
statements are prepared by stating each task behaviorally.
In this study, the specification of objectives was
accomplished in two phases. The tasks were identified
in the first phase and the objectives were prepared in
the second phase. The procedural substeps listed in the
strategy were used in specifying objectives.
The task analysis form was designed to facilitate
task identification. The form was completed as the teacher
accomplished the procedural substeps in the strategy.
Each subgoal was restated and tasks or behaviors implicit
in the subgoal were generated. The materials required to
perform each task were added and the two lists were compared
for implied tasks. Implied tasks were added and the process
continued. When all subgoals had been treated, the lists
of tasks were reexamined and the tasks were verified as
desired for evaluation. The tasks were prioritized on
two bases: (1) those tasks whose achievement would be re¬
quired, (2) those tasks whose achievement was desired.
The completed task analyses form for the physics
course is shown in Figure 5. The form was developed to
help the teacher accomplish the first phase of this step.
Each column on the form is closely related to the strategy
and serves as a reminder that a substep needs to be accomplished.
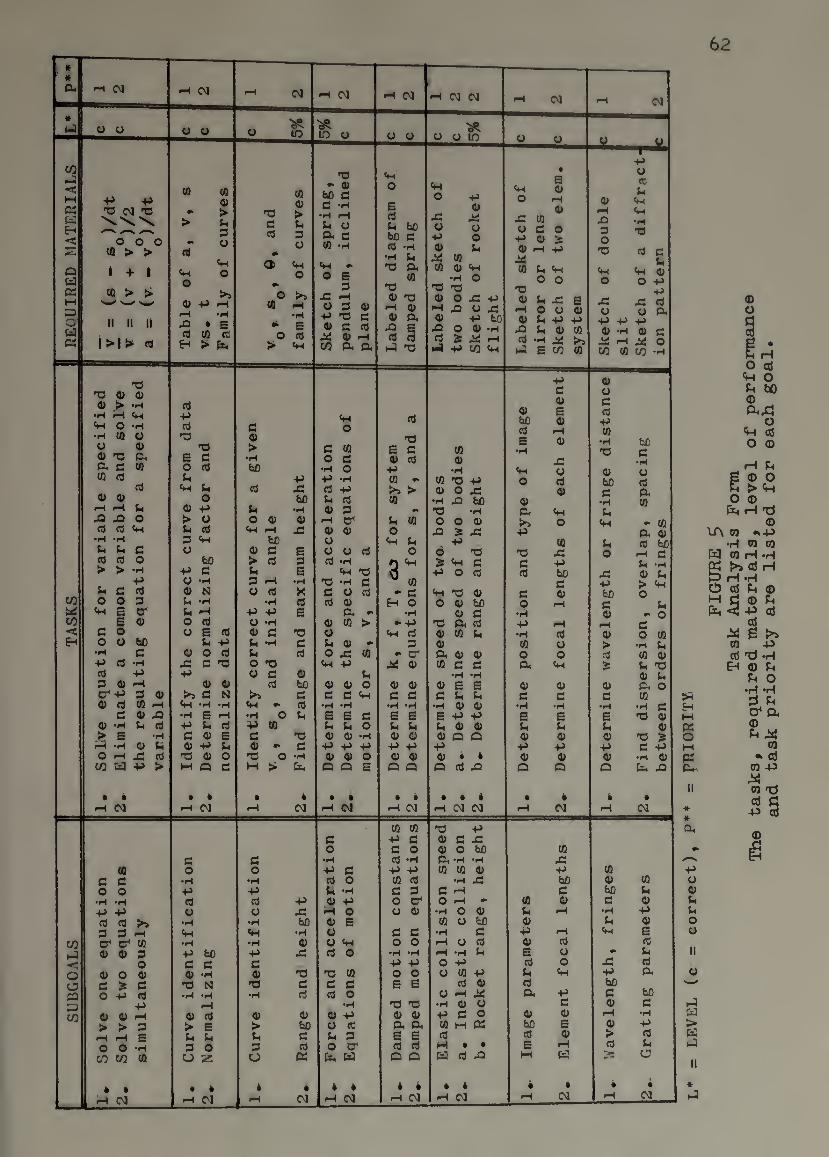
SUB
GO
AL
S H
_T
AS
KS
_H
R
EQ
UIR
ED
MA
TE
RIA
LS
IL*
B P
**
62
33 33 3 3 3 > p
•H p p 0 p p IQ u 0 3 3 -o Pi Pi 3 IQ IQ 3
3 3 3
P 43 43 0 3 3 P
•H •H p p 3 3 3 0 > > P
P p 3 3 0 0 3 p s O'
s 3 3 0 0 c; bO
•H 3 p 3 •H 3 p 3 3 cr P 3 3 3 IQ
3 3 3 P > E
P 3 0 p 45
t/3 a P
fH CM
9)
(0 c a o o
•H "H «0 3 3 -H O' O" W « O 3
O « O 0) e > c o -p rt
•p 4> 4) >H > > 3
rH B O O -H
c/3 c/3 CS
» • iH
(4 +J 3 TJ
'O E 3 O (4 ;h
CH (h O
O -P > o (h (4 3 <H O
bC ■P C O -H 9) N
'H U O (4
E 3 U -P O (4 C ns
9) JS -P
« o> >> C N
<H "H 'H •H E ■P fct 3 0) O P> ns 0) M CJ
3 O
•H +> 3 U
■P bO 3 3 4/ ‘H '3 N
4) (4 > E
U 3 O
3 4) >
•H bO
(4
U O 9>
«H f-i bC
4/ 3 > rt (h 3 fH C/ 3
•H ■P -P O -H 4> 3 fcl "H tn o -cs O 3
c4
<H »■ •H O ^ (0 3
ns o M >
•P J3 bO
•H 4)
JS
E 3 E
•H X (4 E
'3 3 3
4/ bO 3 3 U
ns 3
•H
CM
tM o
3 m O 3
•rt O -P -H 3 s-»
3 3 3
-H O' 3 3 U 0 0 3 3 'H
<H 3} •3 'H c 3 c; 3 3 3
3. • 3 CQ > c; (4 3 O JS
4h +> ti
3 3 0 3 3 <H
•H "H
E S 3 tH h O 3 3 ‘H
■P +> +> 3 3 0 Q Q E
(A
33 E 3 3 3
•P ffl - >> > (0
u va o
fH h o
V ^ to •• 3
H O •H
•pl «H 3
3 •> cr'
a 3
3 3 3 3
CM
3 o
•H ■P 3 U
•H <H •H ■P 3 3 3>
3 > U 3 O
•P JS bO
•i-t 3 £
33 3 3
3 bO 3 3 a
CM
3 O
•H +> 3 3 O h "H 3 -P
pH O 3 E U U <H 3 O
33 to 3 3 3 O
•H 3 -P U 3 (h 3 O C
CM
s s u u 3 3 P -P ^ 3 3 3 O Q Q
IQ 3
•H to 3) P 3 O jC
•H .Q bo 33 -H 0 0 3
P 6 33 S p 3 P O 3
P 33 3 O 3 bO
3 3 'O Pi 3 3 (0 P 3 O4 3 3 to 3 3
•H ‘H 3 E E 3 h P
•H 3 3 P P
CM
to CO P 3 3 O 3 "H P P (0 3 3 3 o cr U 3
3 3 O O
•H 'H P P o o E E
ns 33 3 3 P. P< E E 3 3 n Q
CM
E P 3 3 3 Q Q P
* * 3
CM CM
33 P 3 3 A 3 O bO Pi -H -H (0 (0 3
•H JS 3 P O P
•H O c; IQ
3 bO
H 3 H U 3 H ’rt P O P O IQ P
3 3 O P
O o oi
3 3
p p p •rt
to O Pi
3 3 P S P 3 P 3 a
3 u o p
3 3 p E P 3 P 3 Q
CM
M 3 iP
CM
IQ P 3 P 3 E 3 P 3 Pi
3 bO 3 E
OS JS p bO 3 3
3 3 O P
P 3 3 E
P W
P CM
P P P 3 P 3 3 ^ P O t/3 W C/3 P
P 3 3 U 3 3
3 E 3 bO 3 P 3 P IQ E 3 •rt ^
•H ns 3 45 •H
p 0 3 0 0 3 bO 3
3 3 a 3 P IQ Pi p P >5 0 P - B p Pi 3
to Sh a be ns JS 0 p 3 3 P 3 bO 45 3 p
3 p > p 3 3 bO 0
3 3 P 3 > 3 s
3 3 p E P 3 P 3 a
p » o
3 O IQ P P
IQ 3 P 33 3 P Pi O IQ p 3 •O 3
3 33 ■» 3 P
•H 3 ta 43
IQ 3 bO 3 p P P
45 P bO 3 3 P 3 > 3
CM
IQ P 3 P 3 E 3 P 3 Pi
bO 3 P P 3 P
43
CM
Eh P cn o
*
CL,
P u 3 P P O 3
Et3 >
kJ
*
P)
Q
63
The completed form presents both the subgoals and tasks
in a compact form so the teacher can easily identify every
student performance desired in the course.
As the tasks were identified they tended to cluster
into associated groups with a common set of given materials
and a common level of performance. These associated groups
of tasks were left in cluster form and became multiple
objective statements.
In this particular situation, one task was identified
with each subgoal. With a slight rearrangement on the
subgoals for momentum, it was possible to identify each
task, by priority, with the major topic. Seven of the major
topics had two tasks with one task designated as priority-
one, and the other designated as priority-two. The major
topic on momentum had one priority-one task and two
priority-two tasks. The numbering system directly identi¬
fied the tasks and their priorities with each major topic.
The numbering system was retained as the objective statements
were prepared.
In the second phase of this step the objectives were
prepared directly from the task analysis form. The pro¬
cedural substeps specified for the second phase were
followed in preparing objective statements. The list of
objective statements are shown in Figure 6 with priorities
stated as levels.
The procedures used in specifying objectives in this
study caused the teacher to identify the necessary parts for
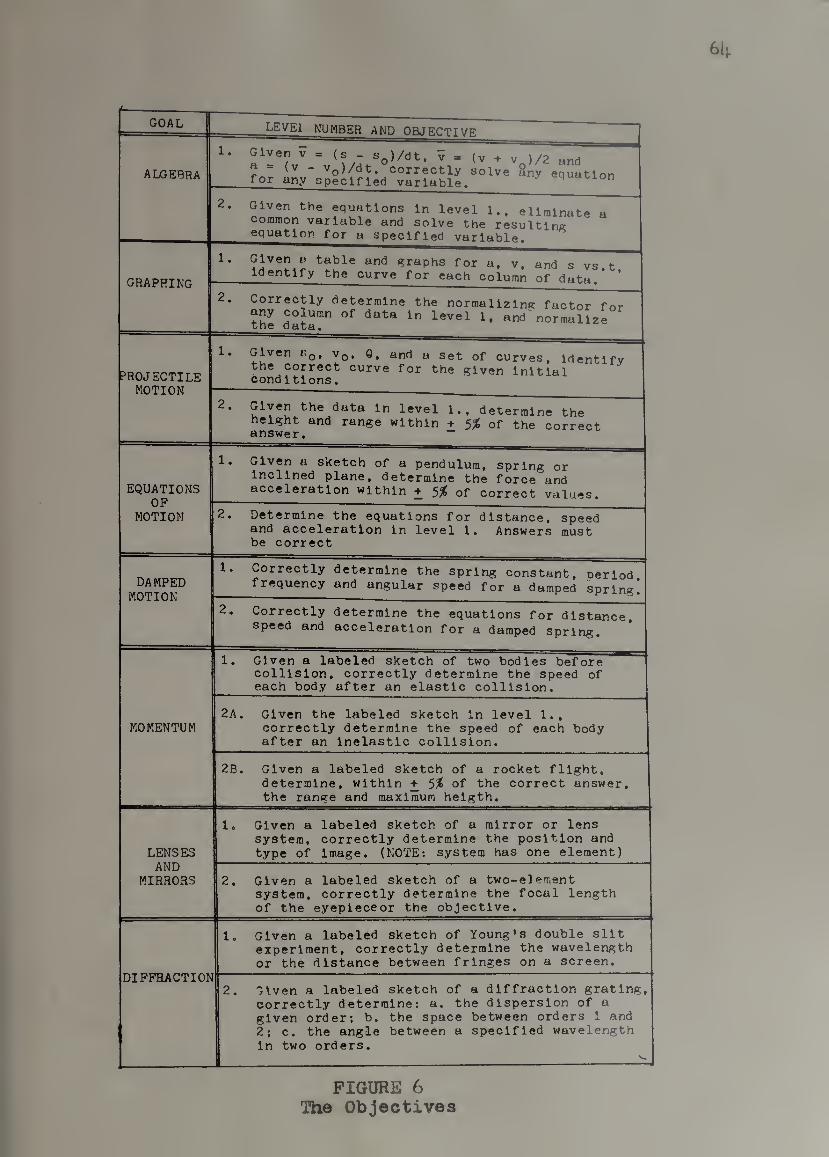
GOAL 1 LEVEl NUMBER AND OBJECTIVE
ALGEBRA
1.
VQ)/dt, correctly solve any equation for any specified variable. equation
2. Given the equations In level 1., eliminate a common variable and solve the resulting equation for a specified variable.
GRAPHING
1. Given i) table and graphs for a, v, and s vs t Identify the curve for each column of data ’ ’
2. Correctly determine the normalizing factor for the data™ <5ata In level 1, and normalize
PROJECTILE MOTION
1. Given Eq, Vq, 0, and a set of curves. Identify the correct curve for the given Initial Conditions.
2. Given the data In level 1., determine the height and range within + 5^ of the correct answer. “
EQUATIONS OF
1. Given a SKetch of a pendulum, spring or Inclined plane, determine the force and acceleration within + of correct values.
MOTION 2. Determine the equations for distance, speed and acceleration In level 1. Answers must be correct
DAMPED MOTION
1. Correctly determine the spring constant, period frequency and angular speed for a damped spring.
2. Correctly determine the equations for distance, speed and acceleration for a damped spring.
1. Given a labeled sketch of two bodies before collision, correctly determine the speed of each body after an elastic collision.
MOMENTUM 2A. Given the labeled sketch In level 1.,
correctly determine the speed of each body after an Inelastic collision.
2B. Given a labeled sketch of a rocket flight, determine, within + of the correct answer, the range and maximum helgth.
LENSES
1. Given a labeled sketch of a mirror or lens system, correctly determine the position and type of Image. (NOTE; system has one element)
AND MIRRORS
r* Given a labeled sketch of a two-element system, correctly determine the focal length of the eyepleceor the objective.
DIFFRACTION
1. Given a labeled sketch of Young's double silt experiment, correctly determine the wavelength or the distance between fringes on a screen.
2. Given a labeled sketch of a diffraction grating, correctly determine: a. the dispersion of a given order; b. the space between orders 1 and 2; c. the angle between a specified wavelength in two orders.
s«.
FIGURE 6 The Objectives
65
the objective before the objective statement was prepared.
Other teachers, who have difficulty in preparing objectives,
may benefit from the study by using the procedures developed
in this particular strategy.
Comments on Steps I4. and 5
The three forms complement the strategy and help to
blend these two critical steps into one continuous process.
The completed topic analysis form is obtained when Step 4.
is accomplished and this same form is used to initiate
Step 5» In, addition, the forms tend to focus the teacher’s
attention on one particular aspect at any given time. For
example, the parts of an objective statement are identified
prior to writing objectives. The forms, coupled with the
strategy, help to compensate for the interaction which
usually occurs between the evaluator and the decision maker
during the goal articulation process.
Step 6 - Specify the Decisions
Decisions are specified for each objective chosen by
the decision maker. The decisions are specified to clarify
the data to be collected on an objective. Each decision
maker makes decisions by choosing among alternatives and
the alternatives are specified by the decision maker.
Extensive interaction between an experienced evaluator
and the decision maker is required to accomplish this step.
The evaluator is needed to guide the decision makers in
indentifying what decisions are desired and in selecting

66
appropriate alternatives which may be based on reported
data,
In this study the classroom teacher chose to select
decision areas for each of the identified decision makers.
As the decision makers gained experience in evaluation,
during the course operation, the desired decision alter¬
natives would be identified for each objective. In this
particular situation, the step was completed after the
teacher had gained experience as an evaluator. Alter¬
natives were specified and rules for choosing alternatives
were defined in the redesign.
The specified decision areas were selected by the
teacher from a more comprehensive set specified by
Gorth et al. (1975) in the general methodology. The criteria
for selecting the specified decisions were: (a) the de¬
cisions were desired by the classroom teacher; and (b) data
could be provided within the limited resources allocated to
evaluation. The selected decisions were outlined as
follows:
I. Student knowledge of content before
instruction
A, Group
B. Individual
II. Student knowledge of content after
instruction
A, Group
B. Individual
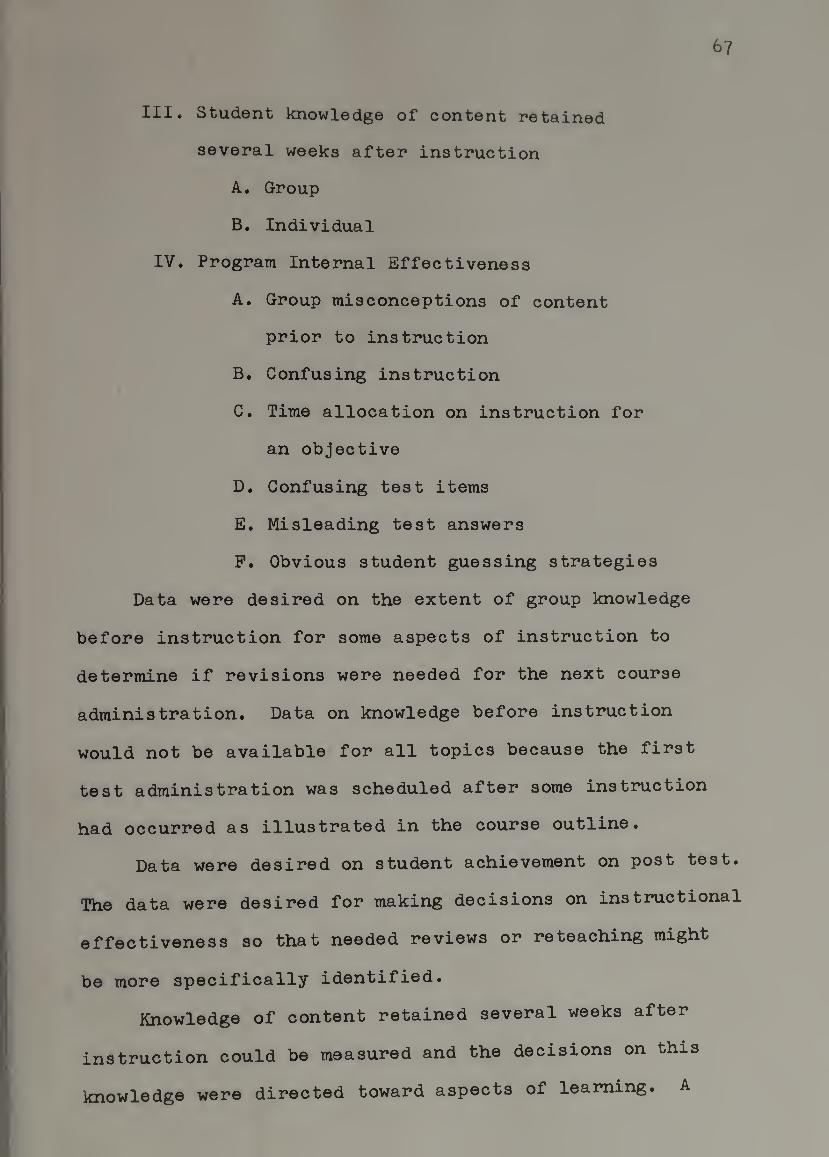
67
III. Student knowledge of content retained
several weeks after instruction
A. Group
B. Individual
IV. Program Internal Effectiveness
A. Group misconceptions of content
prior to instruction
B. Confusing instruction
C. Time allocation on instruction for
an objective
D. Confusing test items
E. Misleading test answers
P. Obvious student guessing strategies
Data were desired on the extent of group knowledge
before instruction for some aspects of instruction to
determine if revisions were needed for the next course
administration. Data on knowledge before instruction
would not be available for all topics because the first
test administration was scheduled after some instruction
had occurred as illustrated in the course outline.
Data were desired on student achievement on post test.
The data were desired for making decisions on instructional
effectiveness so that needed reviews or reteaching might
be more specifically identified.
Knowledge of content retained several weeks after
instruction could be measured and the decisions on this
directed toward aspects of learning. A knowledge were
68
level one objective which was mastered on any two
administrations would denote that the topic had been
learned. Further retention, while desireable, was not
stipulated as mandatory.
The concern for program internal effectiveness
was directed toward those elements of the program which
needed revision as demonstrated by low group achievement.
Since the criterion tests would be teacher developed,
there was concern about the student inferred relationships
of the test items to their respective objectives. In
addition, there was concern about the appropriatness of the
selected wrong answers and the randomness of correct
responses for each test form.
The decisions by the group of students and the indi¬
vidual student were anticipated to be primarily concerned
with achievement. Most students were expected to be
concerned with individual achievement; how this achievement
compared with the group achievement and the achievement of
other individuals. In addition, some students might desire
to make decisions on other individual achievements.
The decisions selected for evaluation emphasized
achievement of course content as the major goal for this
particular course. Other aspects of the course, such as
reports from labs, were not desired as goals for the
initial evaluation design because the teacher decided to
focus the initial design on cognitive content. As the
69
teacher became more familiar with evaluation the scope
of the evaluation design could be expanded, if desired, to
include other goals in the course. The procedures specified
in the strategy serve as a guide for extending the evalu¬
ation to provide data on additionally specified objectives.
Step 7 - Develop the Measurement Techniques
The evaluator will provide one or more items to measure
students' performance on the objectives. Each item must
accurately measure an objective so that valid data are
collected on the objective for decision making.
The measurement techniques were criterion-referenced
tests. The design of the tests was similar to that described
by Cxorth et al. (1975)» Test items were developed directly
from the content objectives. The number of test items to
be developed was determined from the number of test admin¬
istrations. Pour test items were prepared from each level-
one objective and four test items were prepared from each
level-two objective. There were two level-two objectives
for major topic number six and two test items were developed
from each objective.
Each set of test items was examined to verify that
all items were closely related to the objective from which
they were developed. The items were also checked with the
xnajor goals for evaluation to verify that both the objective
and the major goal would be easily identified from each test
item. These checks helped the teacher to verify that valid
70
data would be collected on the objectives and on the
major goals. The checks are especially important for
teachers who, as in this study, develop their own criterion-
referenced tests.
The set of prepared items for each objective were
verified to be of about equal difficulty and to require
about equal amounts of time for completion. The longest
time was recorded for each set of items. The total maximum
time for all sets was assumed to be the time required to
complete a test form. The total time was less than the time
allocated for a test administration indicating that students
familiar with the topics would be able to complete any one
test form within the allotted time.
Validity is usually a number which specifies how well
a test measures the characteristic it is suppose to measure
or does the Job it was designed to do. The particular
validity desired in this study was content validity which
asks the question: How well does the test represent the
universe of situations of which the test items are but a
sample? There is no completely objective way of determining
content validity. Content validity is based on the Judgment
of the test reviewer. Usually the reviewer specifies the
domain and Judges how well the test samples the domain as
it has been defined. Content validity is specified for
each particular situation.
The stated objectives are the criteria for instruction
and for constructing test items. If the group achievement
71
on post test is low on an objective or topic, additional
instruction will be provided. High validity is implied
because the test items are directly related to instruction
and the total instruction is measured by the group achieve¬
ment at the end of the course.
Reliability is primarily concerned with consistency:
consistency over time and consistency over forms of a test.
Reliability estimates are obtained by correlating scores
on two administrations of a test to the same group. If
the scores on both tests are highly correlated, the
reliability is high. Although there were repeated test
administrations, a portion of eadi test was presumed to
be pretest for all test administrations except the last
one. In addition, the time span between test administrations
appeared sufficient for both learning and forgetting to
occur.
Some of the factors affecting reliability are clarity
of test items, conditions of testing, test length, range
of ability of persons tested and accuracy of scoring. Each
test item was patterned after the objective in an attempt
to provide clear directions. The conditions for each test
administration would be similar with distractions minimized.
The length of the test was estimated to be about the same
as previous tests used in the course and appeared to be
satisfactory. Although the range of persons to be tested
was not known definitively, a range was estimated, in the
way teachers usually do, from previous experience teaching
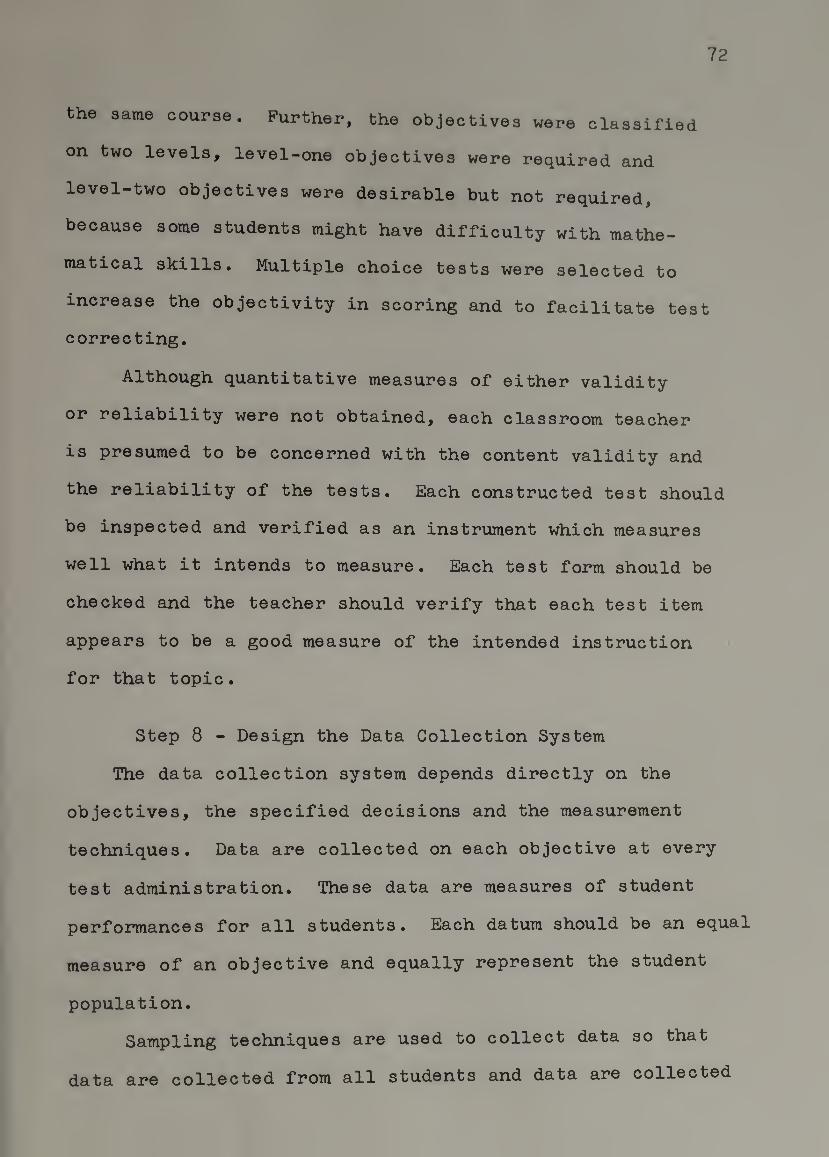
72
the same course. Further, the objectives were classified
on two levels, level-one objectives were required and
level-two objectives were desirable but not required,
because some students might have difficulty with mathe¬
matical skills. Multiple choice tests were selected to
increase the objectivity in scoring and to facilitate test
correcting.
Although quantitative measures of either validity
or reliability were not obtained, each classroom teacher
is presumed to be concerned with the content validity and
the reliability of the tests. Each constructed test should
be inspected and verified as an instrument which measures
well what it intends to measure. Each test form should be
checked and the teacher should verify that each test item
appears to be a good measure of the intended instruction
for that topic.
Step 8 - Design the Data Collection System
The data collection system depends directly on the
objectives, the specified decisions and the measurement
techniques. Data are collected on each objective at every
test administration. These data are measures of student
performances for all students. Each datum should be an equal
measure of an objective and equally represent the student
population.
Sampling techniques are used to collect data so that
data are collected from all students and data are collected
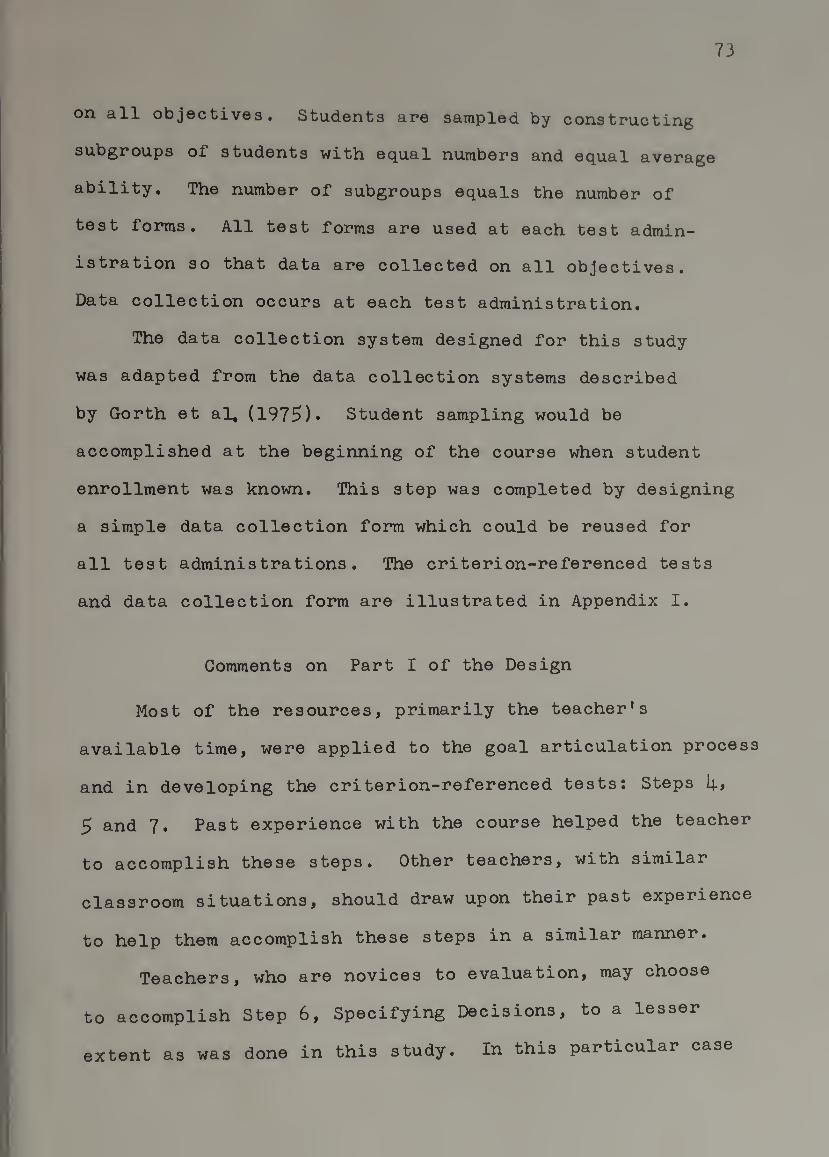
73
on all objectives. Students are sampled by constructing
subgroups of students with equal numbers and equal average
ability. The number of subgroups equals the number of
test forms. All test forms are used at each test admin¬
istration so that data are collected on all objectives.
Data collection occurs at each test administration.
The data collection system designed for this study
was adapted from the data collection systems described
by Gorth et al, (1975)• Student sampling would be
accomplished at the beginning of the course when student
enrollment was known. This step was completed by designing
a simple data collection form which could be reused for
all test administrations. The criterion-referenced tests
and data collection form are illustrated in Appendix I,
Comments on Part I of the Design
Most of the resources, primarily the teacher's
available time, were applied to the goal articulation process
and in developing the criterion-referenced tests: Steps I;,
5 and 7. Past experience with the course helped the teacher
to accomplish these steps. Other teachers, with similar
classroom situations, should draw upon their past experience
to help them accomplish these steps in a similar manner.
Teachers, who are novices to evaluation, may choose
to accomplish Step 6, Specifying Decisions, to a lesser
extent as was done in this study. In this particular case
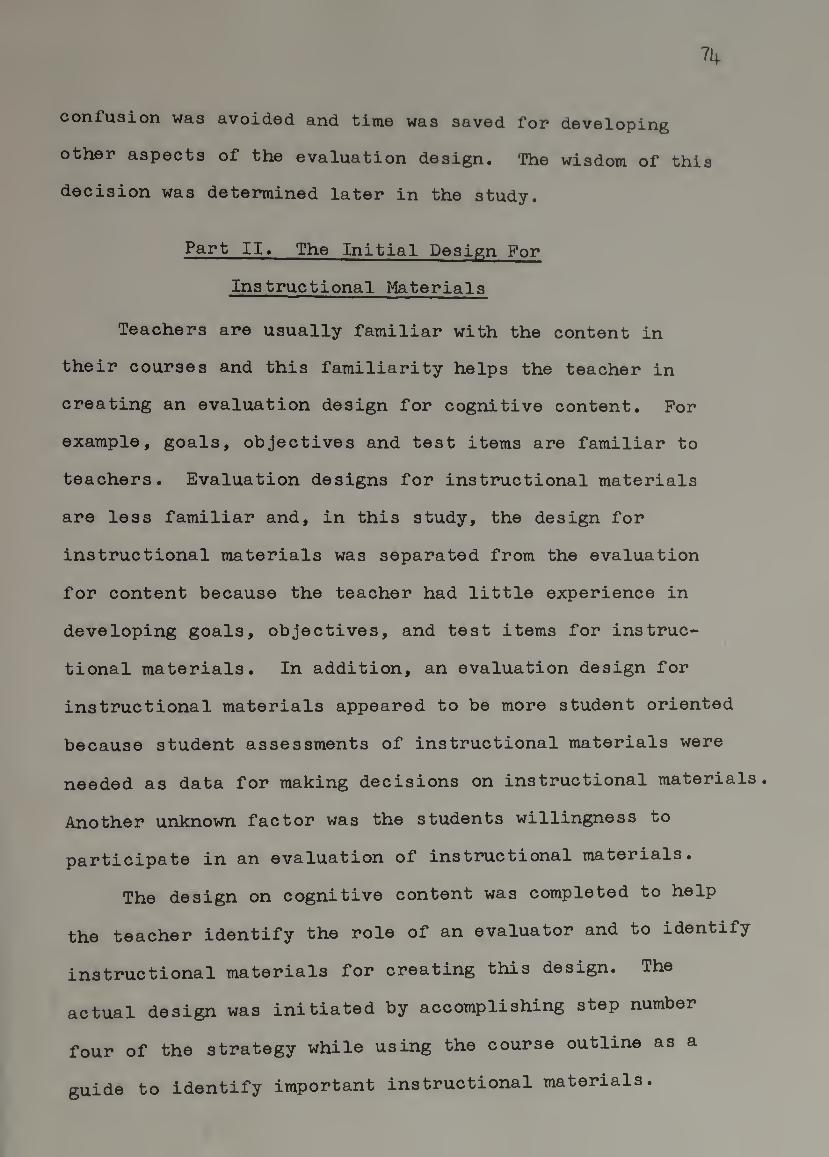
71;
confusion was avoided and time was saved for developing
other aspects of the evaluation design. The wisdom of this
decision was determined later in the study.
Part II, The Initial Design For
Instructional Materials
Teachers are usually familiar with the content in
their courses and this familiarity helps the teacher in
creating an evaluation design for cognitive content. For
example, goals, objectives and test items are familiar to
teachers. Evaluation designs for instructional materials
are less familiar and, in this study, the design for
instructional materials was separated from the evaluation
for content because the teacher had little experience in
developing goals, objectives, and test items for instruc¬
tional materials. In addition, an evaluation design for
instructional materials appeared to be more student oriented
because student assessments of instructional materials were
needed as data for making decisions on instructional materials.
Another unknown factor was the students willingness to
participate in an evaluation of instructional materials.
The design on cognitive content was completed to help
the teacher identify the role of an evaluator and to identify
instructional materials for creating this design. The
actual design was initiated by accomplishing step number
four of the strategy while using the course outline as a
guide to identify important instructional materials.
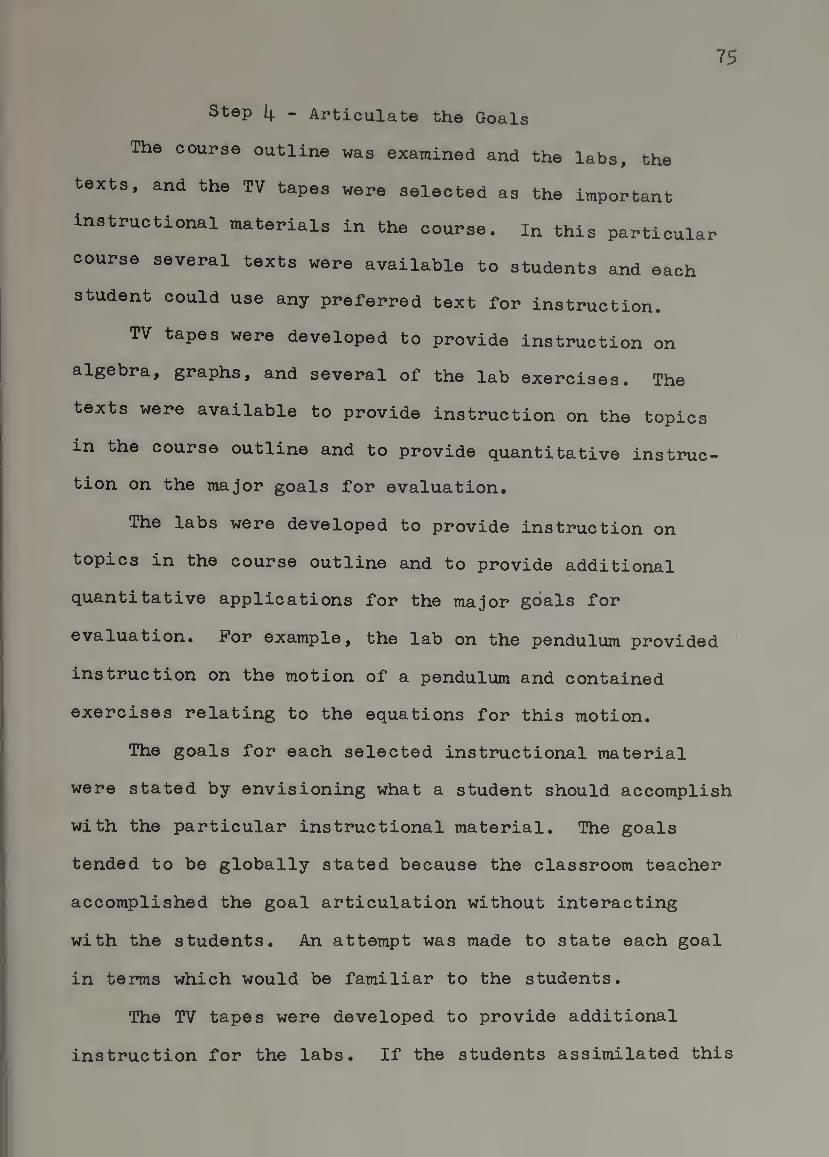
75
step l\. - Articulate the Goals
The course outline was examined and the labs, the
texts, and the TV tapes were selected as the important
instructional materials in the course. In this particular
course several texts were available to students and each
student could use any preferred text for instruction.
TV tapes were developed to provide instruction on
algebra, graphs, and several of the lab exercises. The
texts were available to provide instruction on the topics
in the course outline and to provide quantitative instruc¬
tion on the major goals for evaluation.
The labs were developed to provide instruction on
topics in the course outline and to provide additional
quantitative applications for the major goals for -
evaluation. For example, the lab on the pendulum provided
instruction on the motion of a pendulum and contained
exercises relating to the equations for this motion.
The goals for each selected instructional material
were stated by envisioning what a student should accomplish
with the particular instructional material. The goals
tended to be globally stated because the classroom teacher
accomplished the goal articulation without interacting
with the students. An attempt was made to state each goal
in terms which would be familiar to the students.
The TV tapes were developed to provide additional
instruction for the labs. If the students assimilated this
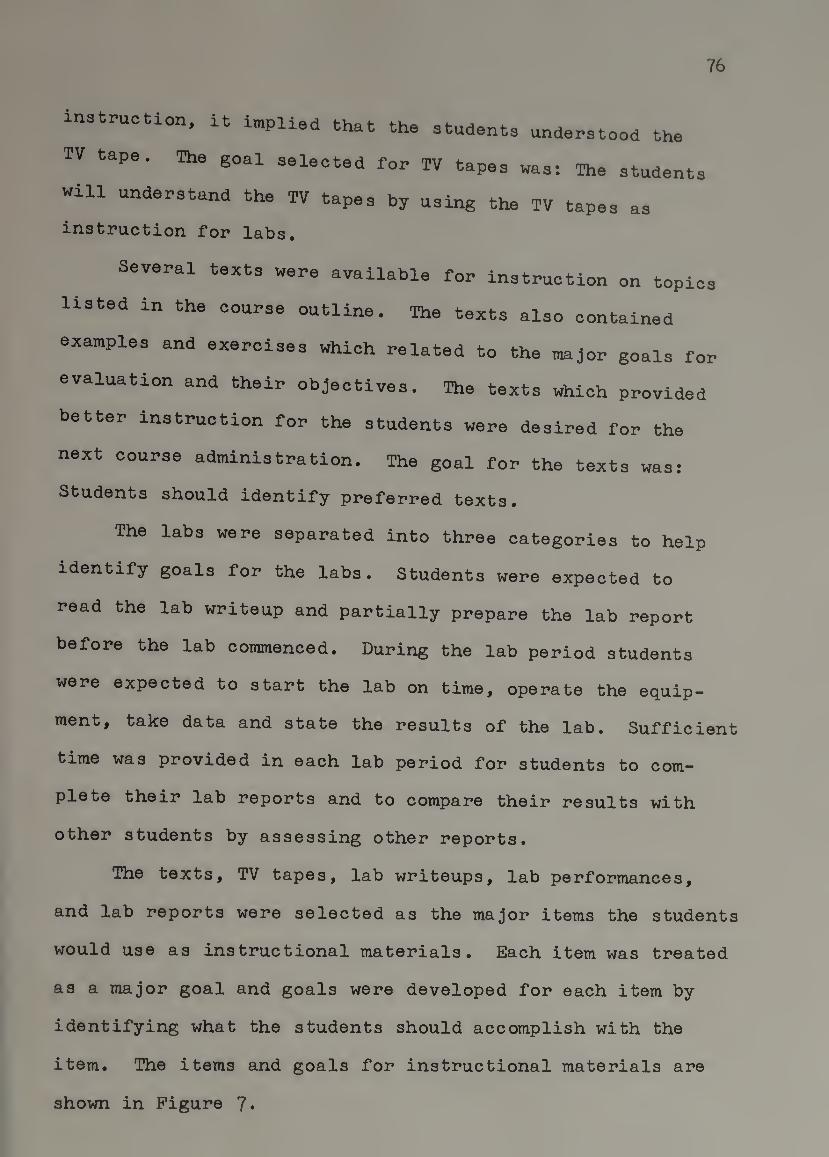
76
instruction, it implied that the students understood the
TV tape. The goal selected for TV tapes «as: The students
will understand the TV tapes by using the TV tapes as
instruction for labs.
Several texts were available for instruction on topics
listed in the course outline. The texts also contained
examples and exercises which related to the major goals for
evaluation and their objectives. The texts which provided
better instruction for the students were desired for the
next course administration. The goal for the texts was:
Students should identify preferred texts.
The labs were separated into three categories to help
identify goals for the labs. Students were expected to
read the lab writeup and partially prepare the lab report
before the lab cortimenced. During the lab period students
were expected to start the lab on time, operate the equip¬
ment, take data and state the results of the lab. Sufficient
time was provided in each lab period for students to com¬
plete their lab reports and to compare their results with
other students by assessing other reports.
The texts, TV tapes, lab writeups, lab performances,
and lab reports were selected as the major items the students
would use as instructional materials. Each item was treated
as a major goal and goals were developed for each item by
identifying what the students should accomplish with the
item. The items and goals for instructional materials are
shown in Figure ?•
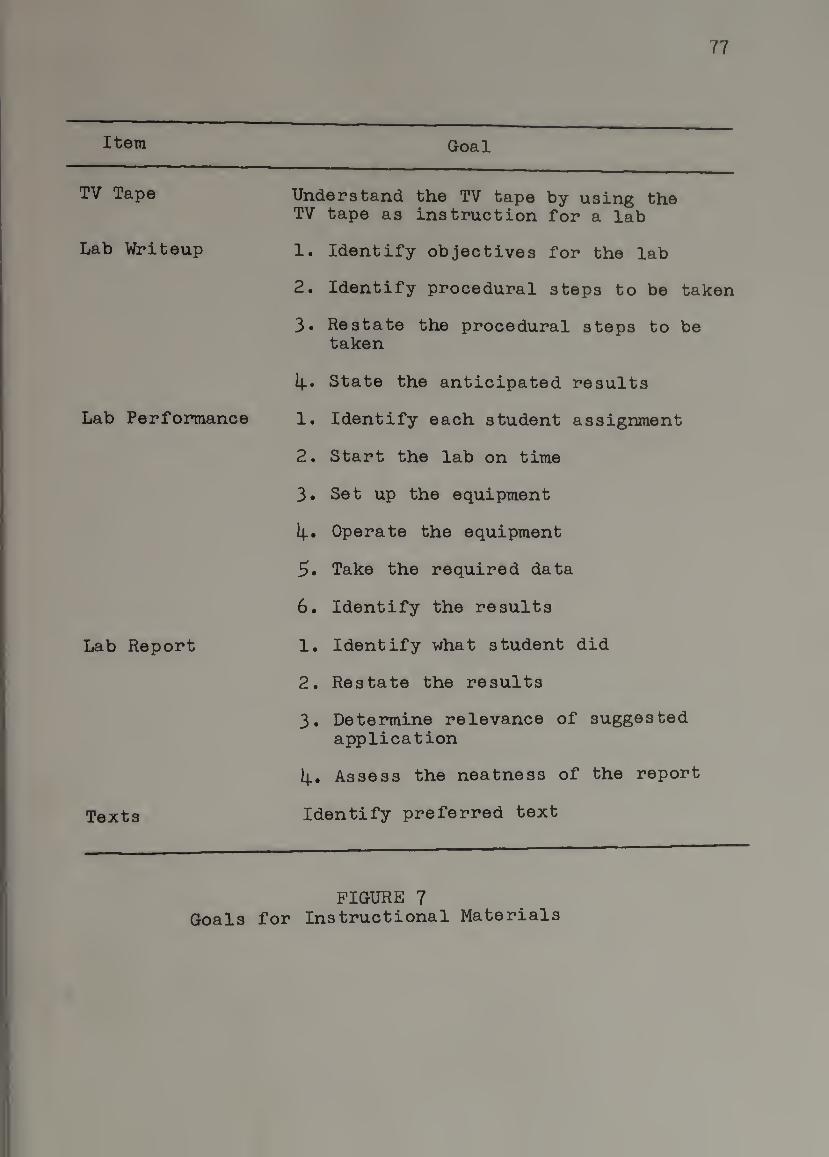
77
Item Goal
TV Tape
Lab Writeup
Lab Performance
Lab Report
Texts
Understand the TV tape by using the TV tape as instruction for a lab
1. Identify objectives for the lab
2. Identify procedural steps to be taken
3» Restate the procedural steps to be taken
I4.. State the anticipated results
1. Identify each student assignment
2. Start the lab on time
3. Set up the equipment
4. Operate the equipment
5. Take the required data
6. Identify the results
1. Identify what student did
2. Restate the results
3. Determine relevance of suggested application
[4., Assess the neatness of the report
Identify preferred text
FIGURE 7 Gtoals for Instructional Materials
I
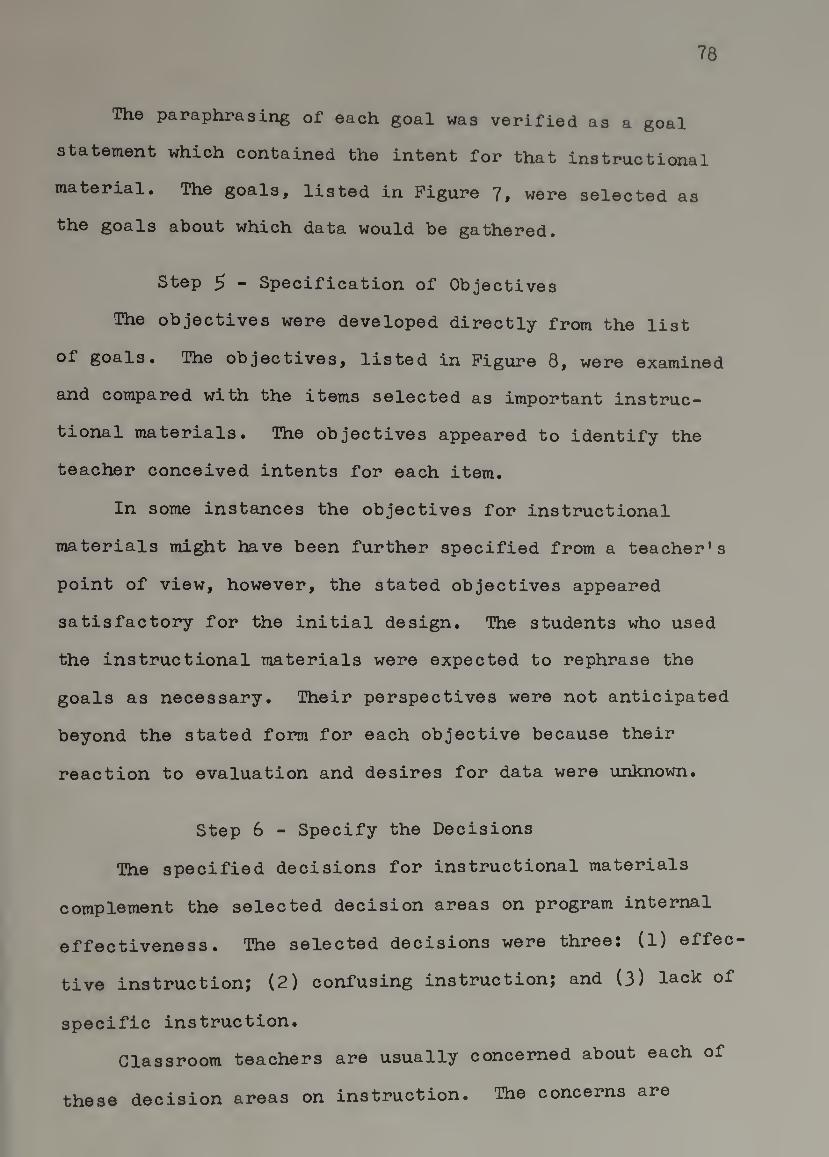
78
The paraphrasing of each goal was verified as a goal
statement which contained the intent for that instructional
material. The goals, listed in Figure 7, were selected as
the goals about which data would be gathered.
Step 5 ” Specification of Objectives
The objectives were developed directly from the list
of goals. The objectives, listed in Figure 8, were examined
and compared with the items selected as important instruc¬
tional materials. The objectives appeared to identify the
teacher conceived intents for each item.
In some instances the objectives for instructional
materials might have been further specified from a teacher's
point of view, however, the stated objectives appeared
satisfactory for the initial design. The students who used
the instructional materials were expected to rephrase the
goals as necessary. Their perspectives were not anticipated
beyond the stated form for each objective because their
reaction to evaluation and desires for data were unknown.
Step 6 - Specify the Decisions
The specified decisions for instructional materials
complement the selected decision areas on program internal
effectiveness. The selected decisions were three: (1) effec
tive instruction; (2) confusing instruction; and (3) lack of
specific instruction.
Classroom teachers are usually concerned about each of
these decision areas on instruction. The concerns are
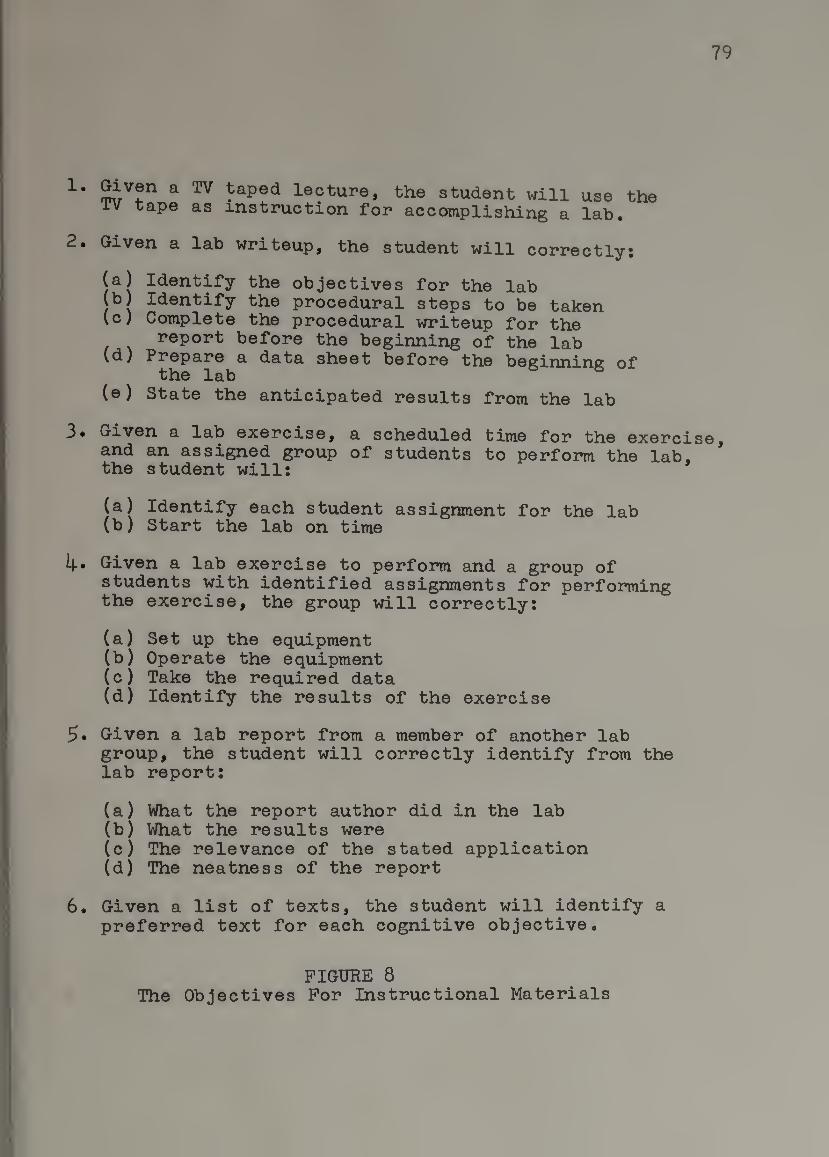
79
^ ™ lecture, the student will use the iv tape as instruction for accomplishing a lab.
2. Given a lab writeup, the student will correctly:
(a) Identify the objectives for the lab (b) Identify the procedural steps to be taken (c) Complete the procedural writeup for the
report before the beginning of the lab (d) Prepare a data sheet before the beginning of
the lab (e) State the anticipated results from the lab
3. Given a lab exercise, a scheduled time for the exercise, and an assigned group of students to perform the lab, the student will:
(a) Identify each student assignment for the lab (b) Start the lab on time
i|.. Given a lab exercise to perform and a group of students with identified assignments for performing the exercise, the group will correctly:
(a) Set up the equipment (b) Operate the equipment (c) Take the required data (d) Identify the results of the exercise
5« Given a lab report from a member of another lab group, the student will correctly identify from the lab report:
(a) What the report author did in the lab (b) What the results were (c) The relevance of the stated application (d) The neatness of the report
6. Given a list of texts, the student will identify a preferred text for each cognitive objective.
FIGURE 8 The Objectives For Instructional Materials

80
directed toward identifying elements which are satisfactory
and elements which need revision. If revision is needed,
there are concerns about the specific revision which
should be made.
The data from criterion-referenced test items will,
by low achievement, identify generally instruction which
needs revision. However, revisions may be desired by the
students on instruction where achievement was high. In
revisions may not be needed on instruction whore
9-cb.ievement has been low if the instruction was improperly
used by the students. For example, the instruction may
need to be reviewed several times by students to identify
all aspects of a new concept. Hence, the proper use of
instruction may be important, particularly where new con¬
cepts are involved.
Step 7 - Develop the Measurement Techniques
Measurement techniques are developed to measure
objectives in a quantitative way which will enable data
to be provided for decision making. Criterion-referenced
tests aptly perform this function by providing data on pre¬
test, post test and retention of content objectives. The
objectives for instructional materials were not suitable for
developing criterion-referenced tests and another measure¬
ment technique was desired.
Assessment forms were selected as the measurement
technique because the objectives were stated as criteria for
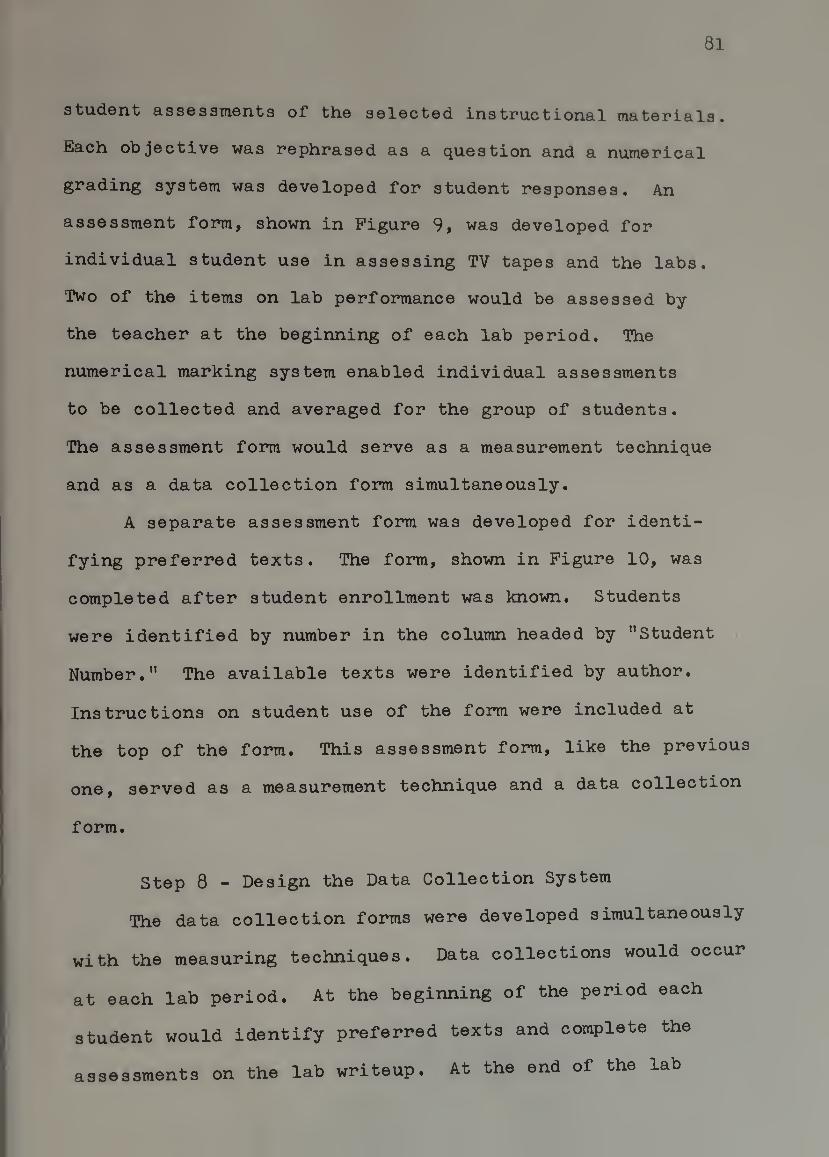
81
s'bud.Bn'b a.ss6ssTTionts of* tlio seloctod instructional tnaterials.
Each objective was rephrased as a question and a numerical
grading system was developed for student responses. An
assessment form, shown in Figure 9, was developed for
individual student use in assessing TV tapes and the labs.
Two of the items on lab performance would be assessed by
the teacher at the beginning of each lab period. The
numerical marking system enabled individual assessments
to be collected and averaged for the group of students.
The assessment form would serve as a measurement technique
and as a data collection form simultaneously.
A separate assessment form was developed for identi¬
fying preferred texts. The form, shown in Figure 10, was
completed after student enrollment was known. Students
were identified by number in the column headed by "Student
Number." The available texts were identified by author.
Instructions on student use of the form were included at
the top of the form. This assessment form, like the previous
one, served as a measurement technique and a data collection
form.
Step 8 - Design the Data Collection System
The data collection forms were developed simultaneously
with the measuring techniques. Data collections would occur
at each lab period. At the beginning of the period each
student would identify preferred texts and complete the
assessments on the lab writeup. At the end of the lab
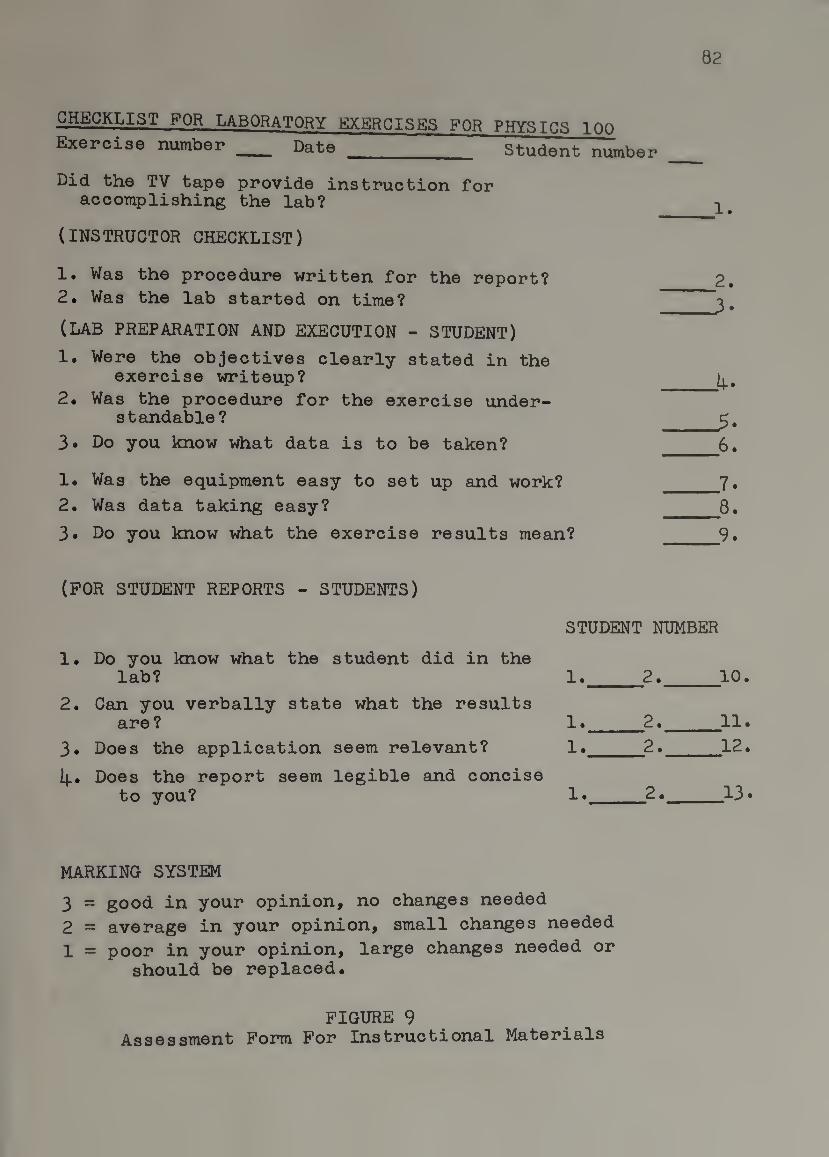
82
CHECKLIST FOR LABORATORY EXERCISES FOR PHYSICS inn
Exercise number _ Date _ Student number
Did the TV tape provide instruction for accomplishing the lab?
(INSTRUCTOR CHECKLIST)
1. Was the procedure written for the report?
2* Was the lab started on time?
(LAB PREPARATION AND EXECUTION - STUDENT)
1, Were the objectives clearly stated in the exercise writeup?
2* Was the procedure for the exercise under¬ standable?
3* Do you know what data is to be taken? _6.
1. Was the equipment easy to set up and work? _7,
2, Was data taking easy? _^8.
3* Do you know what the exercise results mean? _9,
(FOR STUDENT REPORTS - STUDENTS)
STUDENT NUMBER
1. Do you know what the student did in the lab?
2. Can you verbally state what the results are?
3» Does the application seem relevant?
I}., Does the report seem legible and concise to you?
1._2._^10. 1._^2._^11. 1._^2._^12. 1._^2._^13.
MARKING SYSTEM
3 = good in your opinion, no changes needed
2 = average in your opinion, small changes needed
1 = poor in your opinion, large changes needed or should be replaced.
FIGURE 9 Assessment Form For Instructional Materials
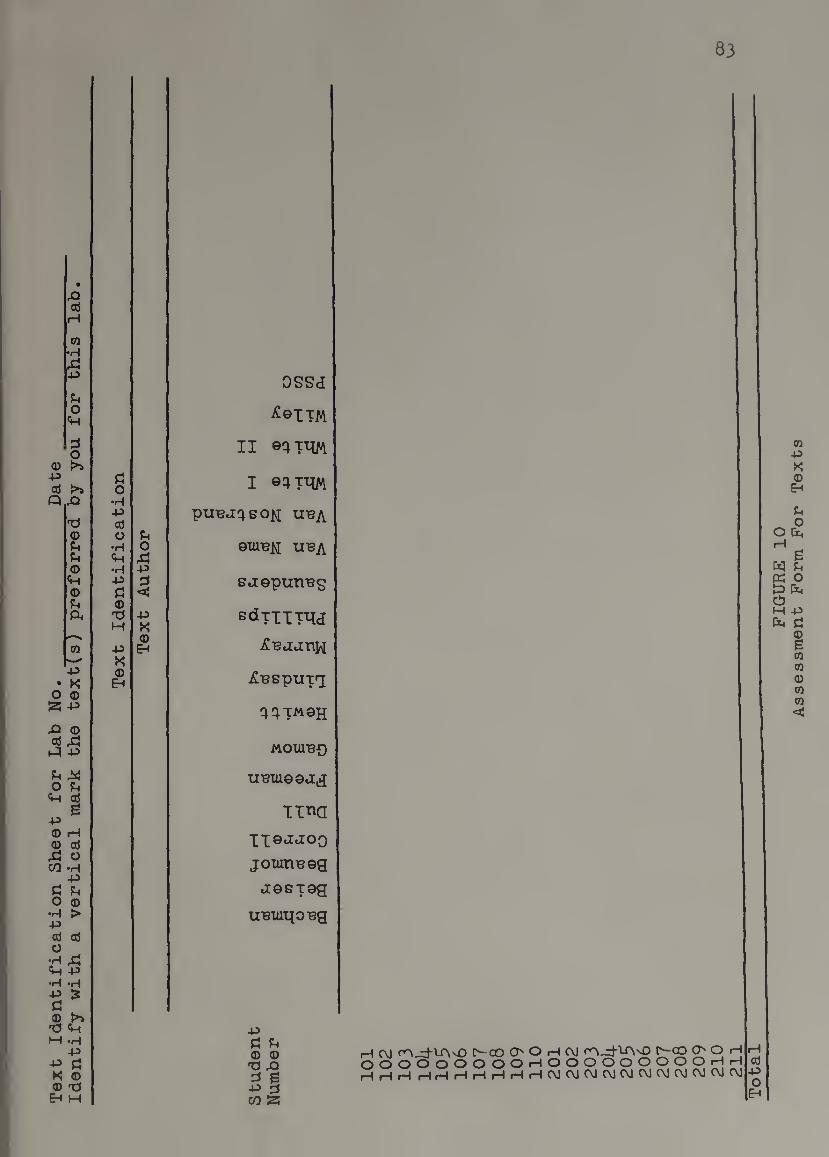
Tex
t Identi
fic
ati
on S
heet
fo
r
Lab
No.
_D
ate
Id
en
tify w
ith
a verti
cal
mark
the
text(
s)
preferred
by
yo
u fo
r th
is
lab
83
a o
•H ■P oi o
•H
•H ■P
(D Td H
-P X 0
Ph O
Xi -p
< -p X 0
EH
OSSd
II
I ©4™
puBu^so^i UBA
exuB^i UBA
suopunBg
sdTiimj
iCauanw
^Bspun
MOIUB-O
uBXueeu^
IIT^a
Iieujoo
JOUtHBOg
uGSTag
UBiuqoBg
-p d Ph 0 0 'O Xi :i e ■p PJ
CO a
(\j H-lAvO C^OD O^ O H C\J C^CO O O H OOOOOOOOHOOOOOOOOOHH
HHHHHHH(\J(\1C\J(MC\JC\1C0(\JC\JC\1(\J
FIG
UR
E
10
A
ssessm
ent
Form
F
or
Tex
ts
84
period each student would complete the assessments on the
lab performance and on the report. The completed assess¬
ment forms would be collected by the teacher as data on
the instructional materials.
Comments on Part II of the Design
In this particular situation, data were desired on
instructional materials because the instructional materials
were considered important for student achievement. The
initial design was created to cause the students to become
involved with evaluation and identify their desires for
an evaluation of instructional materials. The purpose of
this design was to help students identify their role as
decision makers in the course and make a commitment to
evaluation.
The design demonstrates for other teachers that
instructional materials can be included in formal classroom
evaluation. Each teacher may similarly identify important
instructional materials and create an evaluation design
which will cause data to be collected from the students.
Summary
The first eight steps of the strategy were accomplished
in creating an evaluation design for the cognitive content
and for selected instructional materials. Each design was
developed by a classroom teacher, who, acting as both the
decision maker and the evaluator, applied the strategy to
a particular course. In the next chapter the same classroom

85
teacher will operate the design by accomplishing the
next three steps of the strategy. The teacher will again
assume both the roles of the evaluator and the decision
maker.
CHAPTER IV
OPERATION OP THE EVALUATION DESIGN
In tills chapter Steps 9> 10, and 11 of "the strategy
are accomplished. The operation phase of the strategy
deals with the operation of the evaluation design as the
course progresses. Data are collected by the teacher
on both content objectives and objectives for instructional
materials. The data are analyzed and reported to
appropriate decision makers. The operation phase is
totally accomplished by the classroom teacher who assumes
the role of an evaluator in collecting, analyzing and
reporting data. After the data are reported, the teacher
assumes the role of a decision maker by using the data
for decision making. Data are also reported to the group
of students and to the individual student for decision
making.
Each step of the strategy is discussed sequentially
without reference to the actual time frame. All three
steps actually occurred several times during the presen¬
tation of the course.
The purpose of each step is summarized and the
step is accomplished. Where appropriate, remarks and
contributions for other teachers are included. The time
87
required by the classroom teacher to create and operate the
design is discussed at the end of the chapter.
Step 9 - Collect the Data
Gorth et al, (1975) point out that the data collected
include two unique features. The measurements made at
each test administration are comparablej hence achievement
can be monitored on a time scale for each objective. The
measurements made with each test form for each test
administration are comparable; hence, group achievement
for each objective can be monitored.
Each collected datum is presumed to be an equally
valid measure of an objective and each datum is directly
identified with an objective. Both properties are carefully
retained by the evaluator as the collected data are used
in subsequent steps.
A classroom teacher should be aware of the properties
and relationships of the collected data. The identity and
relationships of the collected data must be preserved
in subsequent uses of the data. The relationships of a
particular set of collected data to the students and the
relationships of each set of collected data to other sets
are bases for using the data in decision making.
In this study the data collection for content objec¬
tives occurred at each test administration as specified
on the course outline. All test forms were employed at
each test administration and the data were collected in
88
a similar manner at each data collection.
The backgrounds and abilities of individual students
were unknown and the group of students were partitioned
into subgroups by alphabetical rotation. The list of
names was alphabetized and the test forms were rotated
down the list until each student was assigned a test form.
The method was selected because it was quick and tended to
avoid predjudices on the part of the teacher.
The collected data, shown in Figure 11, are represen¬
tative of the data collected on content objectives at
each data collection. The figure shows the responses to
test items, identified by letter, selected by a student on
the first data collection.
The data collected from each student were identified
by the student number at the top of the form. The data
collected were identified with the test form by specifying
the test form number. The data were identified with a
particular test administration by specifying the date that
data were collected. Each datum was identified with an
objective and a major topic for evaluation by the column
headings on the form. Major topics were stated as units
and objectives were denoted by level. Generally, data
were collected during the last quarter of the test admin¬
istration time. As the data were collected, the test
forms were also collected because the test forms were
reused at the next test administration. On each subsequent
test administration, each student was assigned the next
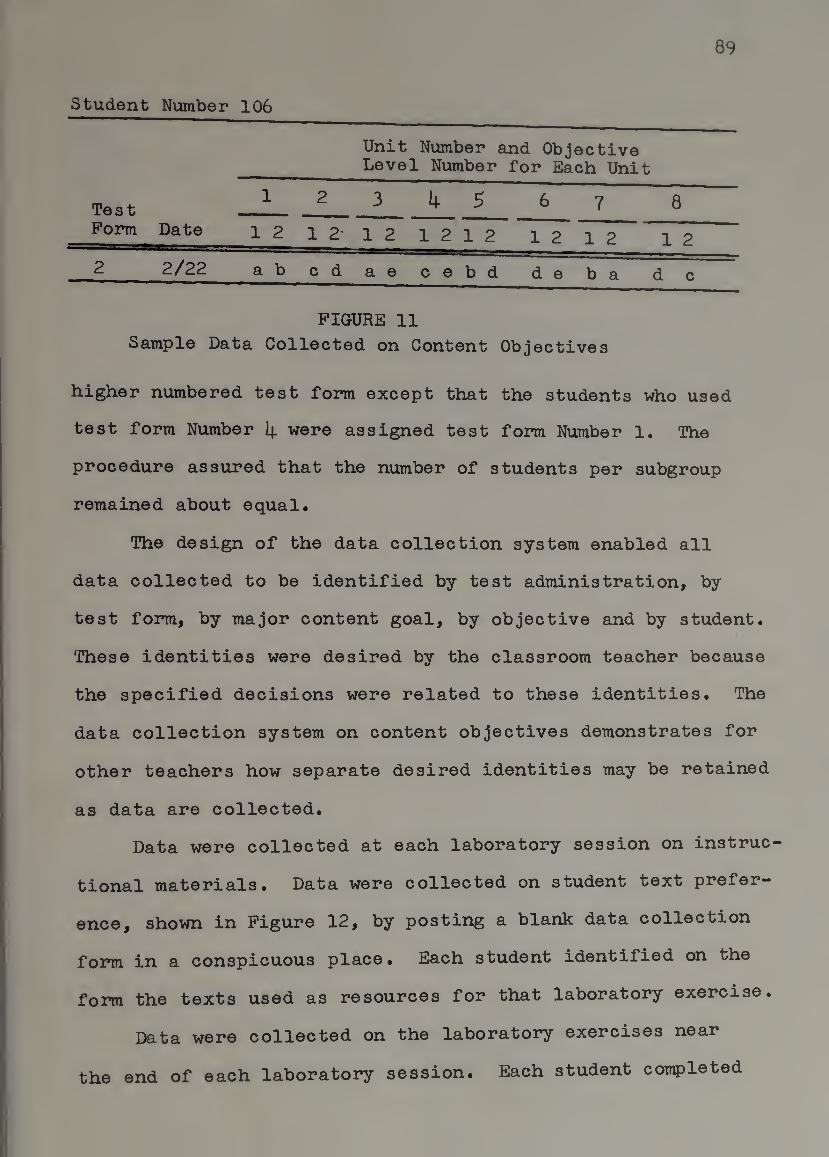
89
Student Number 106
Unit Level
Number and Objective . Number for Each Unit
Test 12 3 4 5 6 7 8
Form Date 12 1212 12 12 12 12 12
2 2/22 a b c d a e c e b d d e b a d c
FIGURE 11
Sample Data Collected on Content Objectives
higher numbered test form except that the students who used
test form Number 4 were assigned test form Number 1. The
procedure assured that the number of students per subgroup
remained about equal.
The design of the data collection system enabled all
data collected to be identified by test administration, by
test form, by major content goal, by objective and by student.
These identities were desired by the classroom teacher because
the specified decisions were related to these identities. The
data collection system on content objectives demonstrates for
other teachers how separate desired identities may be retained
as data are collected.
Data were collected at each laboratory session on instruc¬
tional materials. Data were collected on student text prefer¬
ence, shown in Figure 12, by posting a blank data collection
form in a conspicuous place. Each student identified on the
form the texts used as resources for that laboratory exercise.
Data were collected on the laboratory exercises near
the end of each laboratory session. Each student completed

TE
XT
AU
TH
OR
90
jgq^O
OSSJ
XeiTM
II
I Q^TUM
puBa^goN UBA
GlUBii UBA
eaepuTiBg
sdTiiTti^
XBaanw
XBBpUTT
44TM9H
MOIUBO
UBiueej;^
IITia
II0JJOO
joiunueg
jeSTGQ
UBUiqoBg
-p a Ph O (D TJ Xi
^ i ■p :i CO‘53
H CM r'A-^IAvO C^CO CJ^ O H CM f^-Z^I-CNvO ^-CO O O H OOOOOOOOOHOOOOOOOOOHH HHHrHHHHHHHCMCMCMCMCMCMCMCMCMCMCM
FIG
UR
E
12
D
ata coll
ecte
d
on T
ex
ts for
Lab
1.
Each m
ark id
enti
fie
s
text
used
by
a
stu
dent
in p
rep
ari
ng fo
r
the first la
b.
91
the assessment form and turned the completed form into
the instructor. An example of data collected for the first
lab is shown, for one student, in Figure 13.
Step 10 - Analyze the Data
Gorth et al, (1975) emphasize the complexity of the
collected data by resorting to computer programs for the
necessary analyses. A large variety of analyses have
been developed so that the classroom teacher may select
desired analyses for appropriate data reporting. The
analyses are tailored to a specific situation in which
the teacher or curriculum developer specify the major
decisions of interest.
In this study, a relatively narrow perspective was
chosen to enable a classroom teacher to accomplish the
analyses without the aid of computer programs. Each
analysis was selected as one which could be easily accom¬
plished by a classroom teacher. In addition, the time
required to perform each analysis was considered. Analyses
were selected which could be performed in relatively short
periods of time because a classroom teacher’s available
time for analyses may be minimal during the course admin¬
istration.
The set of analyses chosen for the study were a
compromise which typifies the decisions a classroom teacher
must make as an evaluator. Each analysis chosen was
necessary to provide data for decision making and each
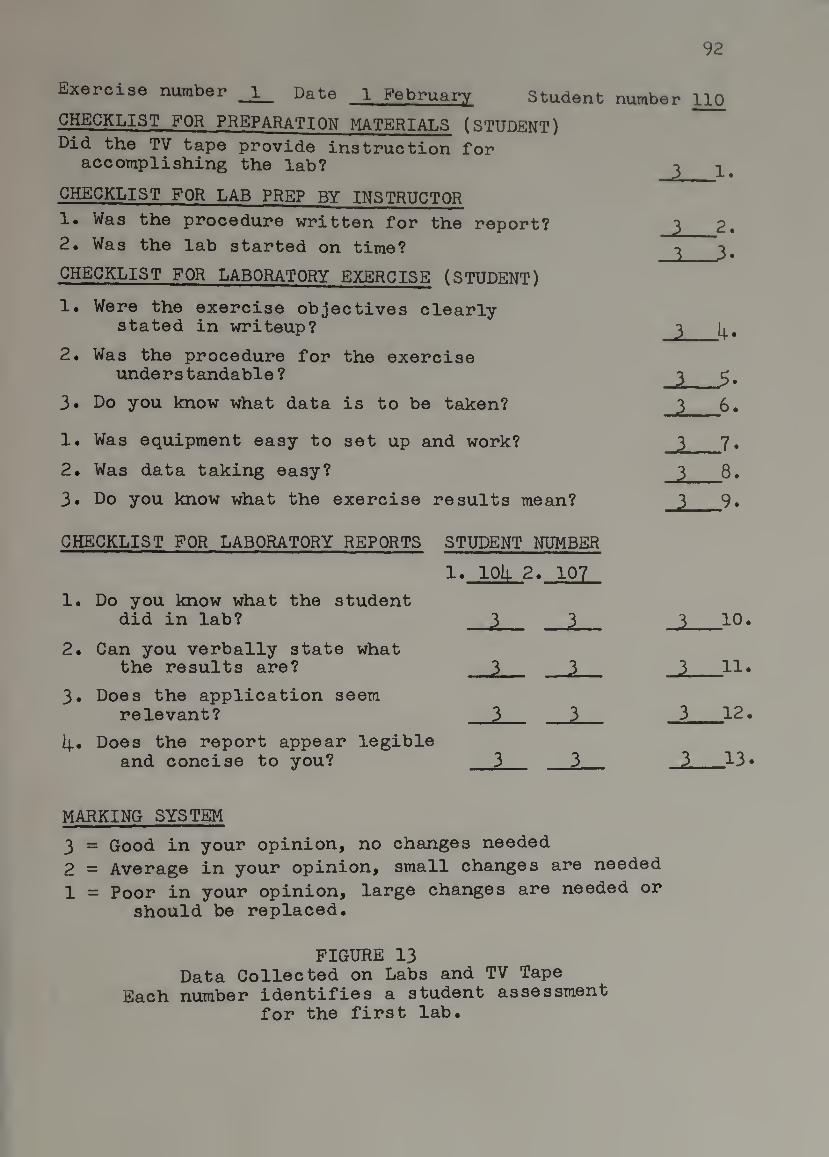
92
Exercise number _! Date 1 February Student number 110
CHECKLIST FOR PREPARATION MATERIALS (STUDENT^
Did the TV tape provide instruction for accomplishing the lab?
CHECKLIST FOR LAB PREP BY INSTRUCTOR
1.
1. Was the procedure written for the report? 3 2. 2. Was the lab started on time?
CHECKLIST FOR LABORATORY EXERCISE (STUDENT^
1. Were the exercise objectives clearly stated in writeup?
2. Was the procedure for the exercise understandable? 3
3. Do you know what data is to be taken? 3 6.
1. Was equipment easy to set up and work? 3. 7.
2. Was data taking easy? 3 8.
3. Do you know what the exercise results mean? 3 9.
CHECKLIST FOR LABORATORY REPORTS STUDENT NUMBER
1. lOk 2 . 107
1. Do you know what the student did in lab? 3 3 3 10.
2. Can you verbally state what the results are? 3 3 3 11.
3. Does the application seem relevant? 3 3 3 12.
k- Does the report appear legible and concise to you? 3 13.
MARKING SYSTEM
3 = Good in your opinion, no changes needed
2 = Average in your opinion, small changes are needed
1 = Poor in your opinion, large changes are needed or should be replaced.
FIGURE 13 Data Collected on Labs and TV Tape
Each number identifies a student assessment for the first lab.
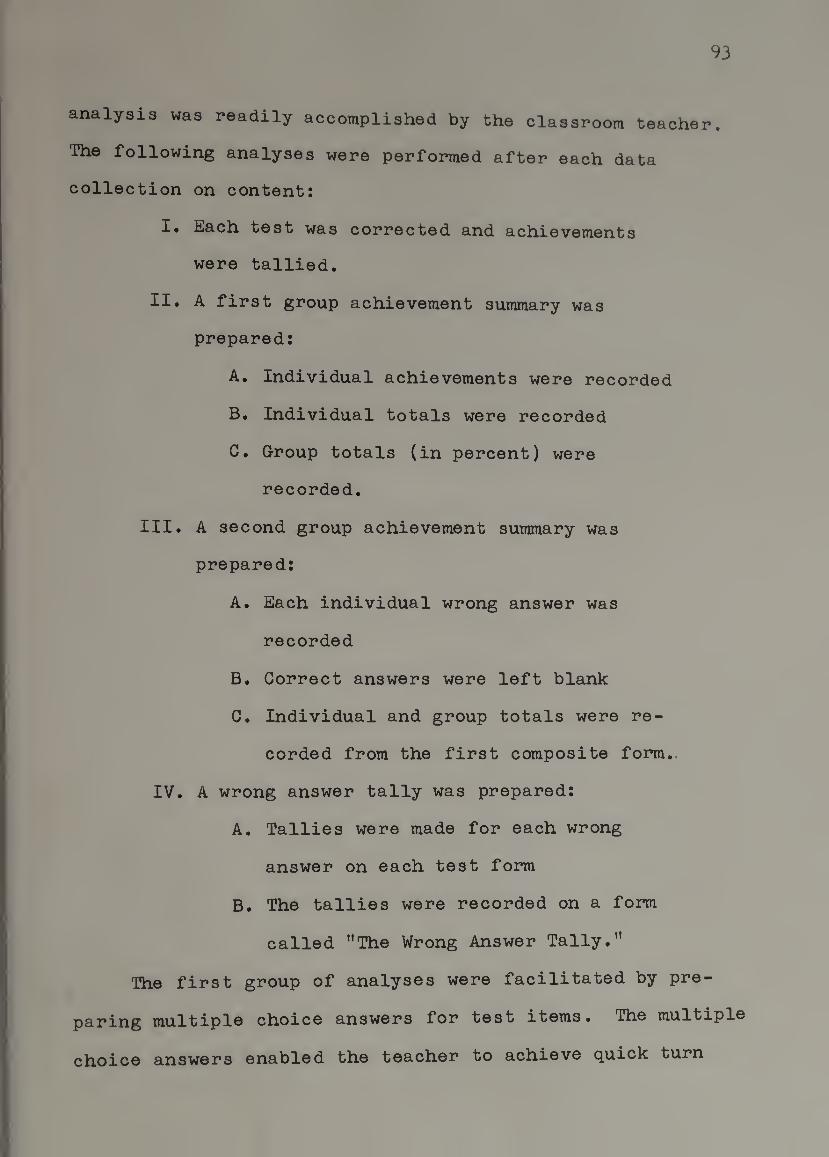
93
analysis was readily accomplished by the classroom teacher.
The following analyses were performed after each data
collection on content:
!• Each test was corrected and achievements
were tallied.
A first group achievement summary was
prepared:
A. Individual achievements were recorded
B. Individual totals were recorded
C. Group totals (in percent) were
recorded.
III. A second group achievement summary was
prepared:
A. Each individual wrong answer was
recorded
B. Correct answers were left blank
C. Individual and group totals were re¬
corded from the first composite form..
IV. A wrong answer tally was prepared:
A. Tallies were made for each wrong
answer on each test form
B. The tallies were recorded on a form
called "The Wrong Answer Tally."
The first group of analyses were facilitated by pre¬
paring multiple choice answers for test items. The multiple
choice answers enabled the teacher to achieve quick turn
I
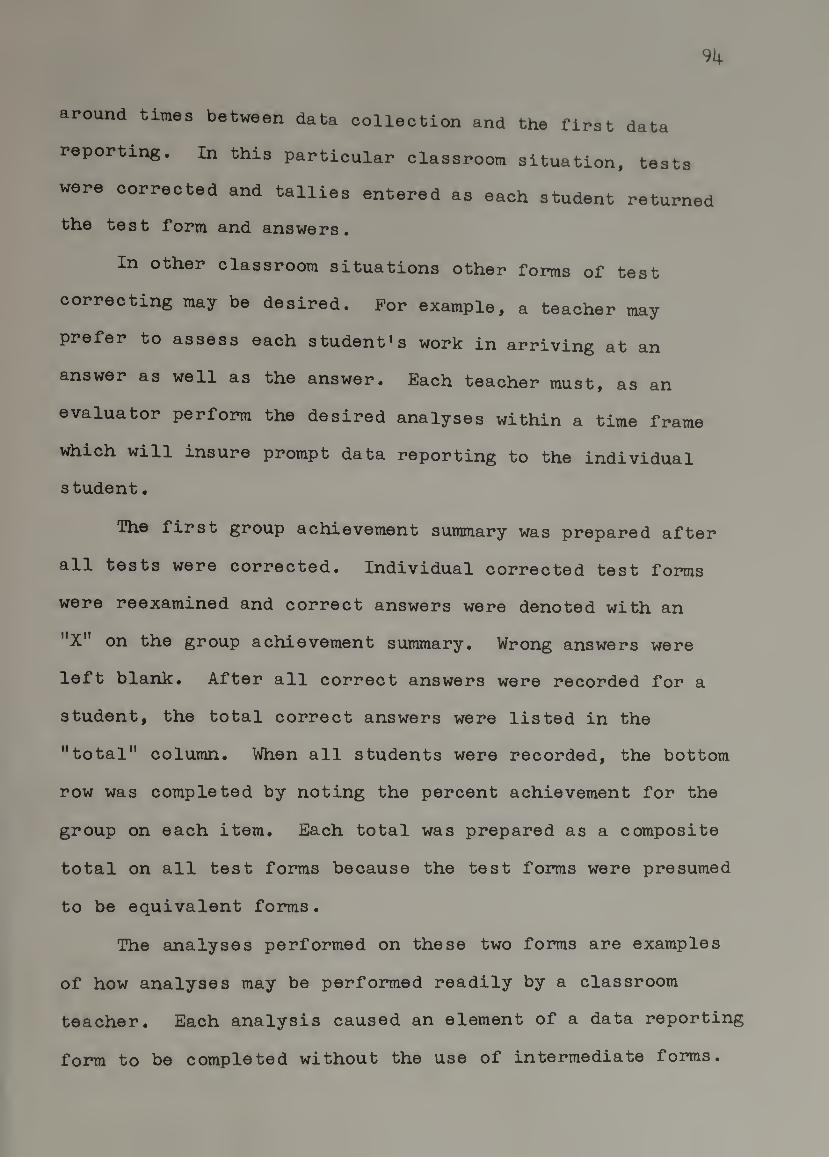
9k
around times between data collection and the first data
reporting. In this particular classroom situation, tests
were corrected and tallies entered as each student returned
the test form and answers.
In other classroom situations other forms of test
correcting may be desired. For example, a teacher may
prefer to assess each student's work in arriving at an
answer as well as the answer. Each teacher must, as an
evaluator perform the desired analyses within a time frame
which will insure prompt data reporting to the individual
student.
The first group achievement summary was prepared after
all tests were corrected. Individual corrected test forms
were reexamined and correct answers were denoted with an
on the group achievement summary. Wrong answers were
left blank. After all correct answers were recorded for a
student, the total correct answers were listed in the
"total" column. When all students were recorded, the bottom
row was completed by noting the percent achievement for the
group on each item. Each total was prepared as a composite
total on all test forms because the test forms were presumed
to be equivalent forms.
The analyses performed on these two forms are examples
of how analyses may be performed readily by a classroom
teacher. Each analysis caused an element of a data reporting
form to be completed without the use of intermediate forms.
95
The procedures minimized the time spent on analyses and
facilitated prompt data reporting.
The forms and analyses also offer flexibility. Changes
may be made in either the data collection forms or the
data reporting forma because the analyses may be adapted to
other forms.
Time commitments to analyses are an aspect each
classroom teacher must appraise. If too much time has been
committed to analyses, desired changes in data collection
or data reporting may not be possible. For example, a
teacher who has automated the analyses by preparing exten¬
sive computer programs may be reticent to change the computer
programs, the data collection forms or the data reporting
forms.
The second group achievement summary was completed
with similar analyses. Each wrong answer for each student
was recorded on a similar blank form. Correct answers
were left blank and items not attempted were denoted by an
asterisk. Totals from the first group achievement summary
were recorded on the second group achievement summary.
The wrong answer tally was prepared by grouping the
collected data according to the particular test form the
data was collected on. The selected wrong answers for
each student were tallied on the form without reference to
the individual student. Tallying continued until the
selected wrong answers by all students were denoted according
96
to the particular test Torni number.
The data collected on instructional materials employed
similar analyses procedures. The analyses performed on
each set of collected data caused data reporting forms to
be prepared.
Two analyses were performed on the data collected
on student text preference. Each column was totaled to
determine the total number of students selecting a text.
The totals were transferred to a composite form which
summarized the group text preferences for each laboratory
exercise.
Three analyses were performed on the data collected
on the labs. The data collected from each student were
transferred to a composite form. After the data from all
students had been transferred, averages were prepared for
each column. The averages for each column were transferred
to a second composite form.
Step 11 - Report the Data
Data reporting on content objectives followed a
particular pattern in this study. The individual student
was presumed to have the most urgent needs for reported
data and the first data reports were made to individual
students. The second data report was made to the group
of students so that each student could benefit from
evaluation with two prompt data reportings. The final
data reports were made to the teacher.
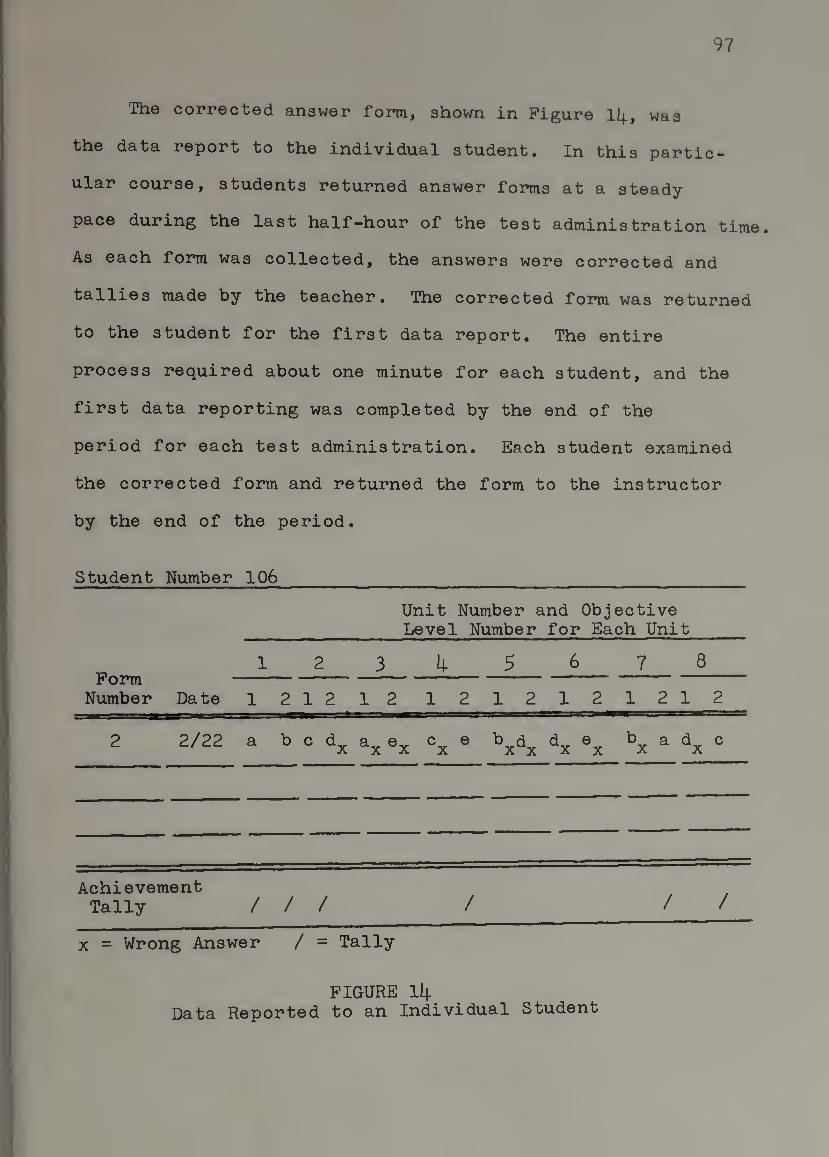
97
The corrected answer form, shown in Figure 11;, was
the data report to the individual student. In this partic¬
ular course, students returned answer forms at a steady-
pace during the last half-hour of the test administration time.
As each form was collected, the answers were corrected and
tallies made by the teacher. The corrected form was returned
to the student for the first data report. The entire
process required about one minute for each student, and the
first data reporting was completed by the end of the
period for each test administration. Each student examined
the corrected form and returned the form to the instructor
by the end of the period.
Student Number 106
Unit Number and Objective Level Number for Each Unit
Form Number Date
1 2 3 4 5 6 7 8
1 2 12 12 12 12 1 2 12 1 2
2 2/22 a bed X
a e^ c e b d X X X XX
e X X
b ad X X
c
Achievement Tally / / / / / /
X = Wrong Answer / = Tally
FIGURE 11;^ Data Reported to an Individual Student
98
The group achievement summary, shown in Figure 15,
was used to report data to the group of students. Individual
student achievement was identified by row and group achieve¬
ment was denoted in percent, at the bottom of each column.
The group achievement summary was prepared immediately
after each test administration. Each group achievement
summary remained posted for the entire course so that
students could monitor achievement on a time scale.
Two data reporting forms contained the data reported
to the teacher. The second group achievement summary,
shown in Figure 16, contained data on achievement and
individual student selections of wrong answers. The wrong
answer tally, shown in Figure 17, contained data on group
selection of wrong answers by test form. The data reported
to the teacher completed data reporting on content objec¬
tives at each data reporting.
For each data reporting, the evaluator must be assured
that the decision maker is clearly aware of the relation¬
ships of the data to the decisions and objectives for which
the data were collected. The evaluator delineates how the
reported data are used to ensure that the data will not be
used incorrectly in some unconscious way. The data reporting
forms for this study were designed so that each datum was
directly identified either with an objective or an aspect
of that objective. The relationship of each datum to the
appropriate objective was clearly established. The
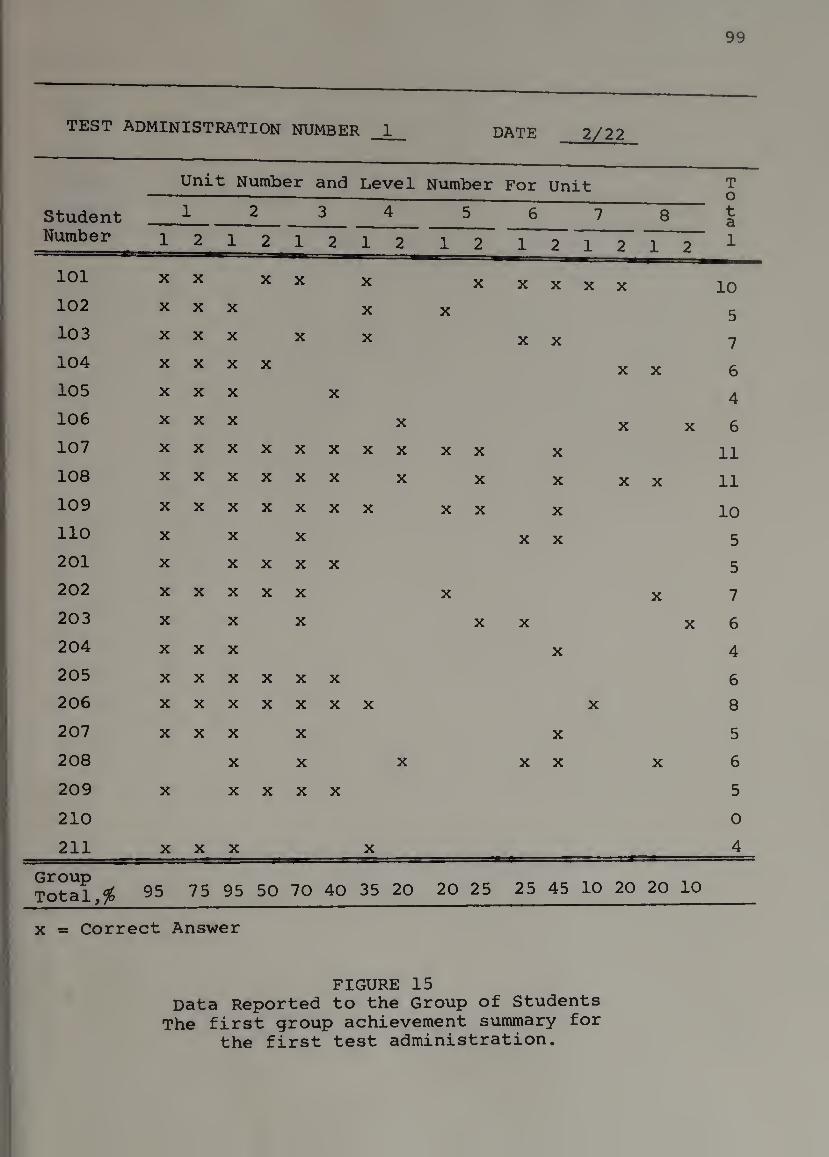
99
TEST ADMINISTRATION NUMBER 1 DATE 2/22
Student Number
Unit Number and Level Number For Unit T o t a 1
1 2 3 4 5 6 7 8 1 2 1 2 1 2 1 2 1 2 1 2 1 2 1 2
101 X X X X X X X X X X 10 102 X X X X X 5 103 X X X X X X X 7 104 X X X X X X 6 105 X X X X 4 106 X X X X X X 6 107 X X X X X X X X X X X 11 108 X X X X X X X X X X X 11 109 X X X X X X X X X X 10 110 X X X X X 5 201 X X X X X 5
202 X X X X X X X 7
203 X X X X X X 6 204 X X X X 4
205 X X X X X X 6 206 X X X X X X X X 8
207 X X X X X 5
208 X X X X X X 6
209 X X X X X 5
210 0
211 X X X X 4
Group Total,^ 95 75 95 50 70 40 35 20 20 25 25 45 10 20 20 10
X = Correct Answer
FIGURE 15 Data Reported to the Group of Students
The first group achievement summary for the first test administration.
I
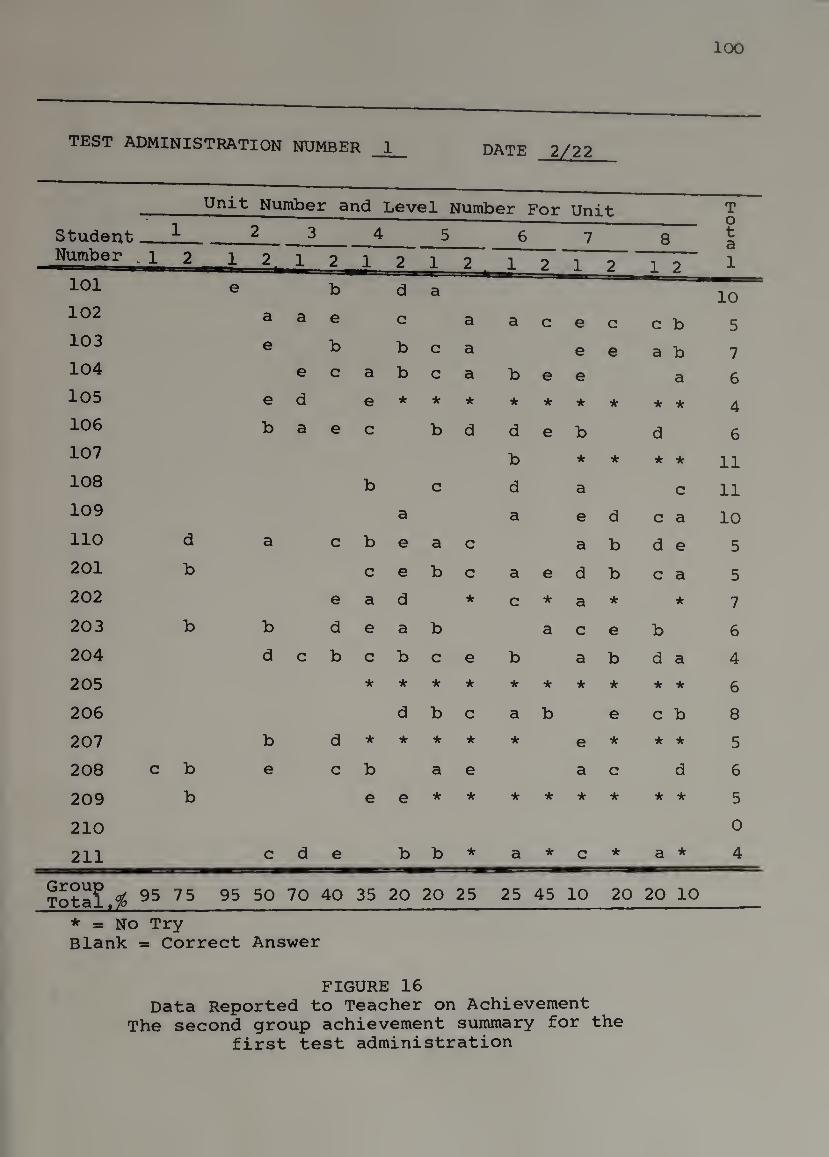
TEST ADMINISTRATION NUMBER 1 DATE 2/22
Unit Number and Level Number For Unit T
Student 1 2 3 4 5 6 7 8 \J t a
Number ,i 2 1 2^ 1 2 1 2 1 2 , 1 2 1 2 1 2 1 101 e b d a 10 102 a a e c a a c e c c b 5 103 e b b c a e e a b 7 104 e c a b c a b e e a 6 105 e d e * * * * * * * ★ * 4 106 b a e c b d d e b d 6 107 b ★ * ★ * 11 108 b c d a c 11 109 a a e d c a 10 110 d a c b e a c a b d e 5 201 b c e b c a e d b c a 5 202 e a d * c * a * * 7
203 b b d e a b a c e b 6
204 d c b c b c e b a b d a 4
205 * * * * * * * * * * 6
206 d b c a b e c b 8
207 b d * * * * * e * * * 5
208 c b e c b a e a c d 6
. 209 b e e * * * * * * * * 5
210 0
211 c d e b b * a * c * a * 4
75 95 50 70 40 35 20 20 25 25 45 10 20 20 10
* = No Try Blank = Correct Answer
FIGURE 16 Data Reported to Teacher on Achievement
The second group achievement summary for the first test administration
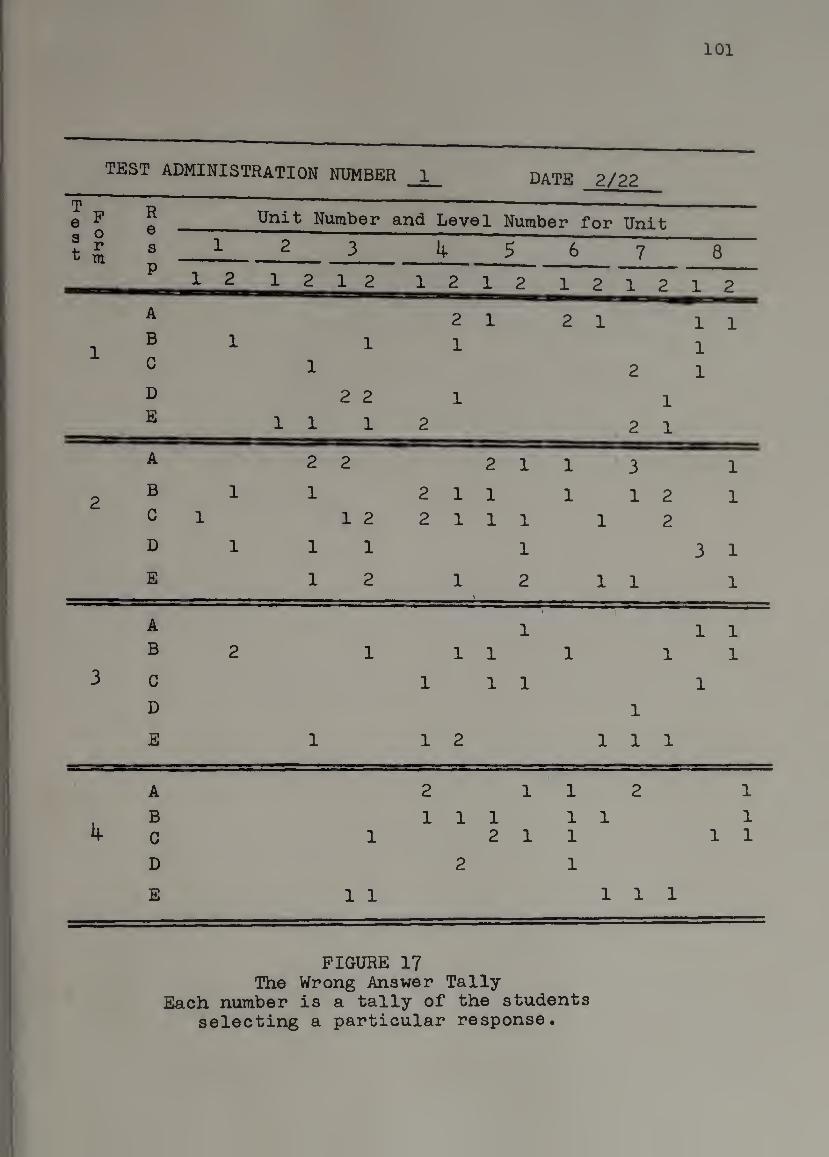
101
TEST ADMINISTRATION NUMBER 1 DATE 2/22
T e P
r\
R e
Unit Number and Level Number for Unit s t
r m
s 1 2 3 4 5 6 7 8 P
1 2 1 2 1 2 _i_^ 1 2 1 2 1 2 1 2
A 2 1 2 1 1 1
1 B 1 1 1 1 C 1 2 1 D 2 2 1 1 E 1 1 1 2 1 2 1
A (
2 2 2 1 1 3 1
2 B 1 1 2 1 1 1 1 2 1 C 1 1 2 2 1 1 1 1 2
D 1 1 1 1 3 1
E 1 2 1 2 1 1 1
A 1 1 1 B 2 1 1 1 1 1 1
3 C 1 1 1 1
D 1
E 1 1 2 1 1 1
• A 2 1 )
1 2 1
B 1 1 1 1 1 1 k C 1 2 1 1 1 1
D 2 1
E 1 1 1 1 1
FIGURE 17 The Wrong Answer Tally
Each number is a tally of the students selecting a particular response.

102
relationship of each data reporting form to the specified
decisions is described below.
Data Report To An Individual Student
Data were provided for making decisions on the achievement
of each objective. The total objectives achieved may be de¬
termined by summing the tallies in the bottom row of the form.
Composite Achievement Form For Reporting
Data To The Group of Students
Data were provided by row so that the individual student
may review the data received in the initial data reporting
for additional decision making on achievement of objectives.
Data were provided by row for making similar decisions
on other members of the group. The tally column at the right
side of the composite form provides data for making decisions
on individual total achievement for each member of the group.
Data were provided by column for making decisions on
the group achievement for each objective. The bottom row of
the form specified, in percent, the total group achievement
for each objective.
Composite Achievement Form For Reporting
Data To The Teacher
Data were provided for making similar decisions on
individual and group achievement as in the previous com¬
posite form reported to the students. In addition, data
were provided for making decisions on individual student
guessing strategies. The individual student response

103
form was available for additional data.
Data were provided by column for making decisions on
the effectiveness of instruction on those objectives for
which instruction was provided.
Data were provided by column for making decisions on
prior knowledge of the group of students for each objective
scheduled for instruction.
Data were provided by row for making decisions on
individual achievement and about obvious guessing strategies.
The Wrong Answer Tally
For each test form, data were provided by column for
making decisions on:
1. confusing wrong answers on objectives
where instruction had occurred;
2. confusing test items where instruction
had occurred;
3. misconceptions on prior knowledge where
instruction had not occurred.
Data were reported by column, for all test forms, for
making decisions on confusing instruction and on the relative
difficulty of test items on each test form.
The four data reporting forms provided data for
decision making on the specified decisions. Each form
presented the data in a manner bearing a close relationship
to the collected data so that each decision maker could

establish a direct association between the data collected
and the data reported.
104
The data reported after the second data collection
provides additional data for decision making for both the
student and the teacher. Figure I8 illustrates the data
reported to an individual student on the second data
collection.
Student Number I06
Unit Number Level for
and Objective Each Unit
Test Form
Number Date
1 2 3 k 5 6 7 8
1 2 1 2 1 2 1 2 1 2 1 2 12 12
2 2/22 a b = ^x®x ®x® b„d x'^x b a d c X X
3 3/29 e c c a ^x®x a^d. K ^X^X ^x®^x \ ®x®x
Achievement Tally // // // / / / / /
X = Wrong Answer / = Tally
FIGURE 18 Data Reported to Individual Student
Data reported after the second data collection
The bottom row of the form, the achievement tally, provided
data for making decisions on retention of all objectives
achieved on the previous test administration. Each objec¬
tive achieved on the first test administration was recorded
with a tally. Duplicate tallies identified those objectives
whose mastery was retained on the second test administration.
Both group achievement summaries, shown in Figures l5
and 16, provided data for making decisions on group retention.
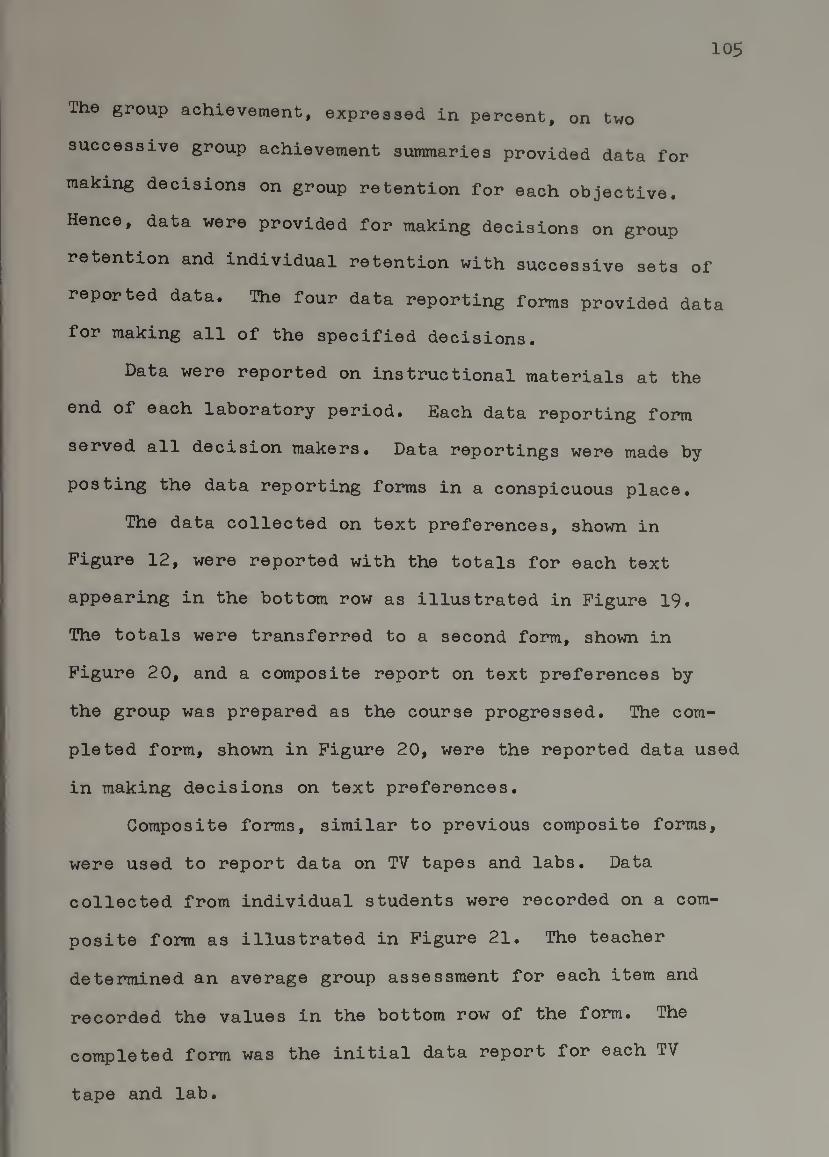
105
The group achievement, expressed in percent, on two
successive group achievement summaries provided data for
making decisions on group retention for each objective.
Hence, data were provided for making decisions on group
retention and individual retention with successive sets of
reported data. The four data reporting forms provided data
for making all of the specified decisions.
Data were reported on instructional materials at the
end of each laboratory period. Each data reporting form
served all decision makers. Data reportings were made by
posting the data reporting forms in a conspicuous place.
The data collected on text preferences, shown in
Figure 12, were reported with the totals for each text
appearing in the bottom row as illustrated in Figure 19,
The totals were transferred to a second form, shown in
Figure 20, and a composite report on text preferences by
the group was prepared as the course progressed. The com¬
pleted form, shown in Figure 20, were the reported data used
in making decisions on text preferences.
Composite forms, similar to previous composite forms,
were used to report data on TV tapes and labs. Data
collected from individual students were recorded on a com¬
posite form as illustrated in Figure 21, The teacher
determined an average group assessment for each item and
recorded the values in the bottom row of the form. The
completed form was the initial data report for each TV
tape and lab.
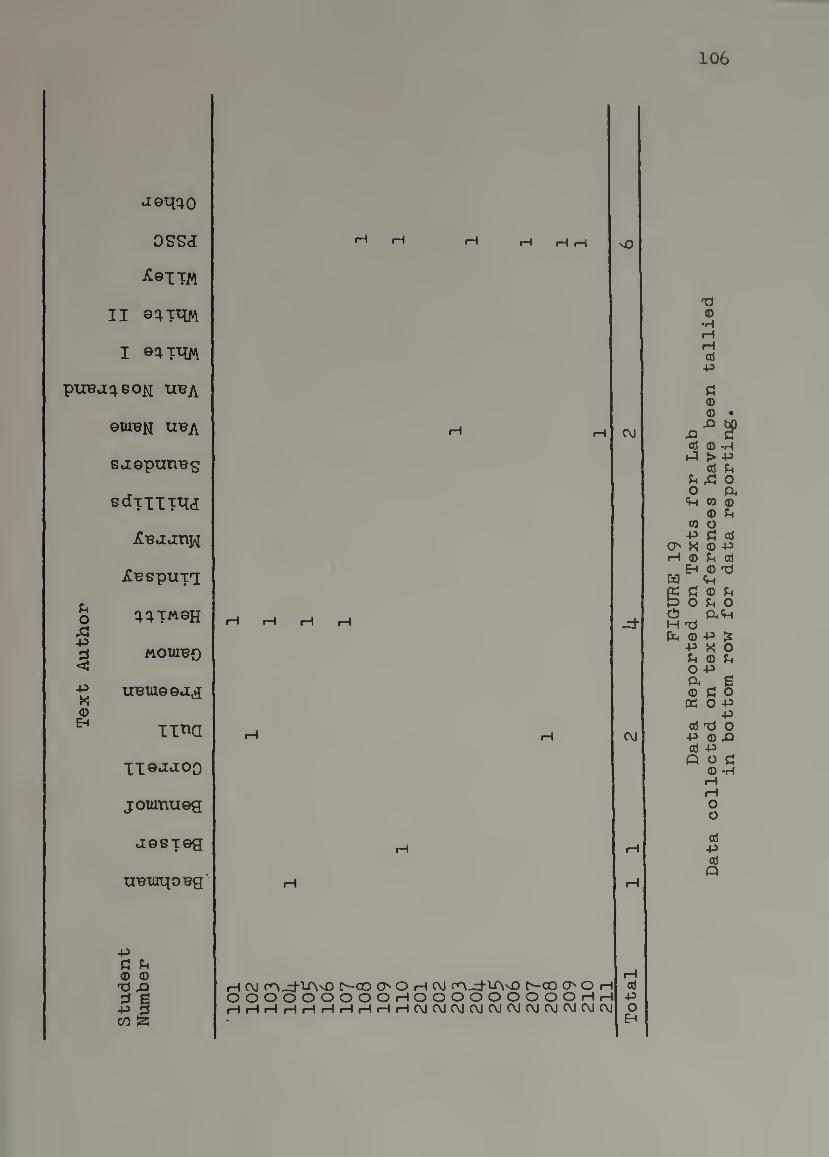
Tex
t A
uth
or
106
OSSi
^®ITM
II
I ©4mM
puea^go^i uba
GlUB^ UBA
suepuneg
sdTIi™
^Buanw
j^Bspun
MOWBf)
uBiaeeu^
Ilt^a
II0JUOO
joianuGg
jesT0g
UBiunoBg'
-p a u <D (D
XJ 43 ^ g -p 3
CO a
rH iH vO
C\J
H c\j fn_=i-1AvO I>-C0 O' O H C\J r^-d-IAvO C^CO O' O H OOOOOOOOOHOOOOOOOOOHH HHHHHHHHHHOJ(\)(MC\JOJC\JOJ(\JCOC\)C\J
-d-
CvJ
od P O
EH
FIG
UR
E
19
D
ata
Report
ed
on T
ex
ts fo
r
Lab
D
ata co
llecte
d
on te
xt
pre
fere
nces
hav
e
been ta
llie
d
in bott
om
row for d
ata reporti
ng.
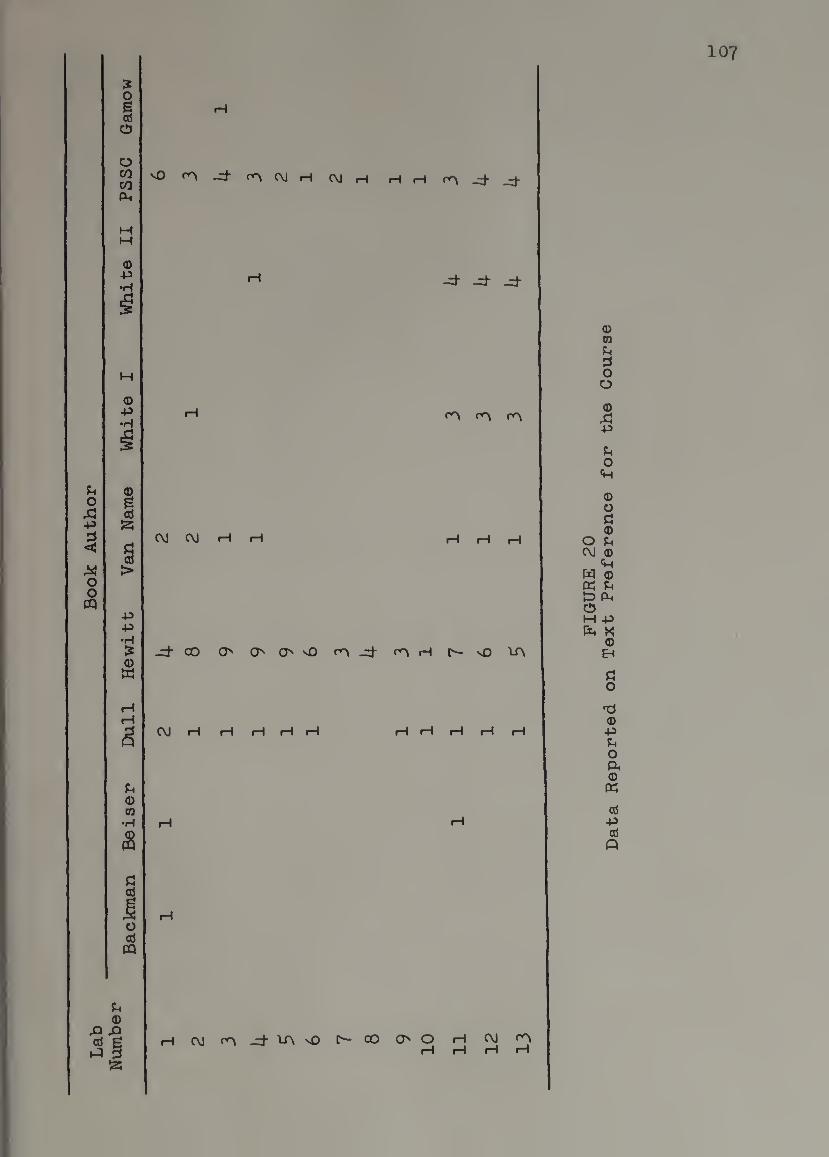
Backm
an
Beis
er
Dull
Hew
itt
Van
Nam
e W
hit
e
I
Wh
ite
II
PS
SC
Gam
ow
107
vO -d" (\J H C\1 iH H _:d-
-d" -d" -d"
iH rry r<^
C\J CM H H
_d-CO O OOvO <^-d- C^vO lA
CM rH rH
e 03 U d o o
e si -p
o
o
<D O U CM ©
U W © gfn
Pk C3 H +i fri K
© EH
O
'd © +3 u o ft © K
d +3 d
iH
Pi ©
43 43 d g »J 3
II
CM CA -d" "LA nO CO O O CM cA H rH
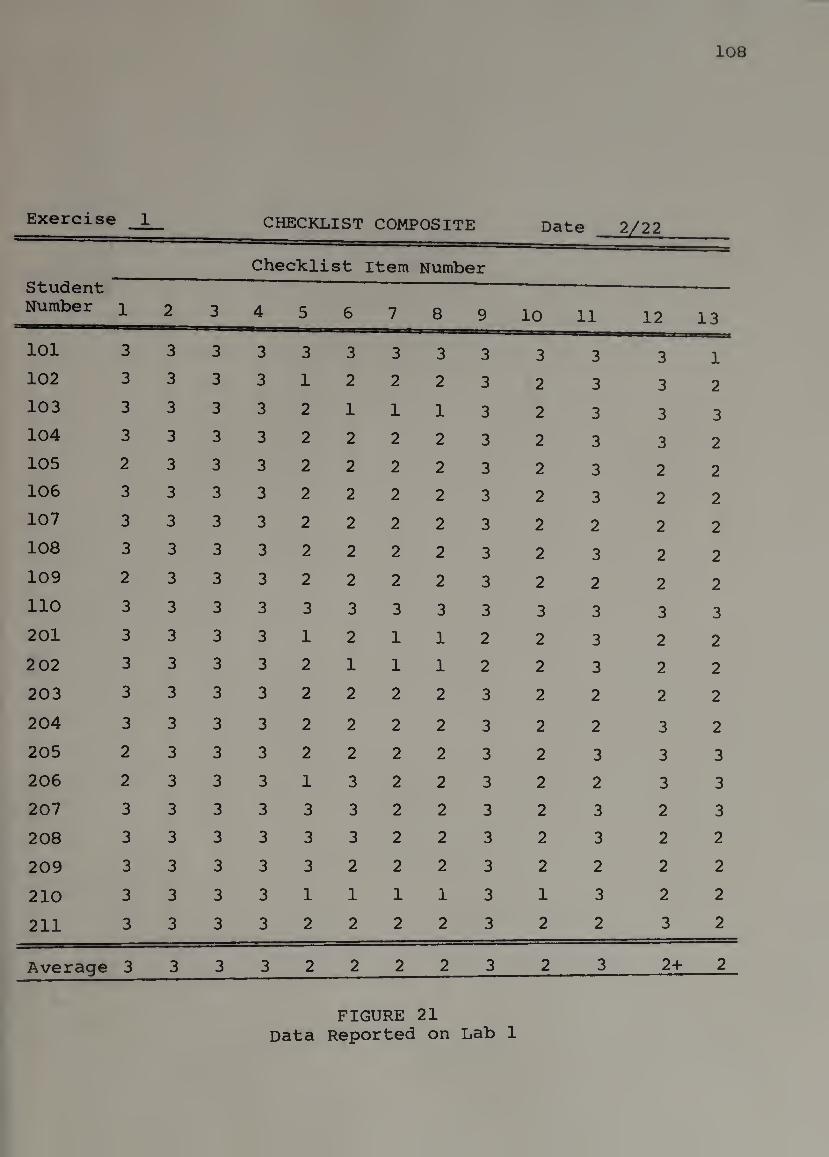
108
Exercise 1 CHECKLIST COMPOSITE Date 2/22
Checklist Item Number Student Number 1 2 3 4 5 6 7 8 9 10 11 12 13
101 3 3 3 3 3 3 3 3 3 3 3 3 1 102 3 3 3 3 1 2 2 2 3 2 3 3 2 103 3 3 3 3 2 1 1 1 3 2 3 3 3 104 3 3 3 3 2 2 2 2 3 2 3 3 2 105 2 3 3 3 2 2 2 2 3 2 3 2 2 106 3 3 3 3 2 2 2 2 3 2 3 2 2 107 3 3 3 3 2 2 2 2 3 2 2 2 2 108 3 3 3 3 2 2 2 2 3 2 3 2 2 109 2 3 3 3 2 2 2 2 3 2 2 2 2 110 3 3 3 3 3 3 3 3 3 3 3 3 3
201 3 3 3 3 1 2 1 1 2 2 3 2 2
202 3 3 3 3 2 1 1 1 2 2 3 2 2
203 3 3 3 3 2 2 2 2 3 2 2 2 2
204 3 3 3 3 2 2 2 2 3 2 2 3 2
205 2 3 3 3 2 2 2 2 3 2 3 3 3
206 2 3 3 3 1 3 2 2 3 2 2 3 3
207 3 3 3 3 3 3 2 2 3 2 3 2 3
208 3 3 3 3 3 3 2 2 3 2 3 2 2
209 3 3 3 3 3 2 2 2 3 2 2 2 2
210 3 3 3 3 1 1 1 1 3 1 3 2 2
211 3 3 3 3 2 2 2 2 3 2 2 3 2
Average 3 3 3 3 2 2 2 2 3 2 3 2+ 2
FIGURE 21 Data Reported on Lab 1

109
The average assessment for each item was verified by
the group of students as the report was examined in class
discussion. The verified average values were restated on
a second composite form, shown in Figure 22, which
summarized the data reported on all labs. The summarized
data report on labs was the final data report.
Lab Number
Checklist Item Number
1 2 3 k 5 6 7 8 9 10 11 12 13 1 3 3 3 3 2 2 2 2 3 2 3 2+ 2 2 3 3 3 3 3 2 2+ 2+ 2 3 3 3 3 3 3 3 3 3 3 3 3 3 3 3 3 3 3
3 3 3 1 1 3 1 - 1 2 2 3 3 5 3 3 3 3 3 3 3 3 3 3 3 3 3 6 3 3 3 3 3 3 3 3 3 3 3 3 3 7 3 3 3 3 3- 3- 3 3 3- 3 3 3 3 8 — 3 3 3 3 3 3 3 3 3 3 3 3 9 — 3 3 3 3 2 3 3 3 3 3 3 3 10 — 3 3 3 3 3 3 3 3 3 3 3 3 11 — - 3 - 1 1+ 2 2 2 2 2+ 2+ 3
12 - - 3 - 2 1 1+ 2 2 2 2+ 2+ 3 13 — 3 — 2 2 3 3 3 3 2+ 2+ 3
= No data available
FIGURE 22 Summarized Data Reported On All Labs
Comments on Time Required For Evaluation
The actual time required to create an initial design
depends on a teacher's familiarity with both evaluation
and the particular course. In this study, most of the time
allocated for evaluation was used in creating an initial
design because the goal articulation process tended to be
slow and arduous. The time was available because the initial I
110
design was created before the course began#
The initial design was created by applying the first
eight steps of the strategy to the particular course. The
time required to complete the initial design was about one
week. This time estimate assumes that the strategy and
the forms used in creating the initial design were available.
About four days were needed to develop objectives for the
course and about two days were needed to complete the
remaining steps. The time required to prepare criterion-
referenced tests was estimated to be about the same as the
time devoted to test preparation in prior course admin¬
istrations .
The initial design contains an example of effective
utilization of a teacher's available time. By preparing
course materials, such as tests, before the course began
the teacher had more time available for the students and
instruction during the course administration. Teachers,
who normally prepare course materials as the course pro¬
gresses, may benefit from formal classroom evaluation by
having their available time more effectively utilized.
The time needed to operate the evaluation for content
objectives was about two hours for each test administration.
The evaluation for each lab was completed by the end of
the lab period. Test reviews on post test were typically
about fifteen minutes and approximately one hour was
needed outside of class time to prepare data reports on
Ill
content objectives for the group of students and the
teacher. The teacher had more time available for student
conferences and for instruction in the course. For
example, less class time was needed for review because
better decisions were made on what to review by the teacher
and the students. These benefits are available to other
teachers who may desire to apply the strategy to their
courses.
Cptnments on Decisions Made From Reported Data
The data reported during the operation phase were used
for making decisions about students, about the course, and
about evaluation. The data reported on topic content were
generally more closely related to desired decisions than were
the data reported on instructional materials. Examples of
how reported data were used are contained in Appendix III.
Student achievement in the course with evaluation was
better than student achievement in previous course admin¬
istrations without evaluation. Students were able to
identify the learning expected from the content objectives
and they had opportunities to demonstrate mastery of any
objective on each test administration. These two factors
encouraged the students to review and master objectives which
were missed on post test.
As the course progressed the decision makers became
more familiar with evaluation and other desires for particular
112
data became articulated. Data reported and not used for
decision making caused the students and the teacher to
generate additional needs for data. As these needs were
articulated both the teacher and the students made a
commitment to an on-going evaluation by identifying
revisions which were needed. The students played an active
role in identifying needed revisions and the final decisions
on revisions were approved by the group of students.
Summary
The evaluation design was operated as data were
collected, analyzed and reported. Additional needs were
articulated for reported data in the on-going evaluation
design.
In the next chapter the last step of the strategy is
accomplished as the teacher and the students participate
in a redesign of the evaluation.

CHAPTER V
REVISING THE EVALUATION
In cliaptei* the Initial daslgn Is revised In
three phases which were adapted from Benedict's (1973)
discussion about revising an evaluation. The classroom
teacher assumed the role of an evaluator and prepared an
assessment of the Initial design called an Evaluation of
Evaluation, The report was used by all decision makers to
Identify the changes needed or to specify Decisions on
Redesign, The classroom teacher again assumed the role of
an evaluator and accomplished the needed revisions In a
Redesign of the Evaluation,
Each phase Is discussed by presenting the purpose of
the phase and accomplishing the phase. Where appropriate
comments and contributions for other teachers are Included,
Additional comments on this step are Included at the end
of the chapter.
Evaluation of Evaluation
An evaluation of an evaluation Is an evaluator's
assessment of the evaluation design. The evaluator
determines If the evaluation Is accomplishing Its pur¬
pose _to provide data for decision making. The design
111+
is assessed by applying each of the three criteria for
evaluation. An evaluation is efficient if all of the
data are used in decision making. An evaluation is com¬
plete if as many decisions as possible were based on
reported data. An evaluation is focused if data were
reported for all important decisions. Usually the
evaluator identifies the data used, the data not used,
and the data desired but not reported for decision making.
In this study, the teacher prepared the evaluation
of evaluation by using the three criteria to assess each
data report. As each criteria was applied to the data
reports, the teacher assessed the reports by summarizing
how the data appeared to be used, or not used, by all
decision makers. The evaluation of evaluation summarized
the teacher’s assessment, as an evaluator, of the initial
design. The information in the evaluation on evaluation
was used by the teacher in guiding a class discussion on
revising the evaluation.
Criterion 1: Was the Initial Design Efficient?
Individual Student Report. The reported data were used in
making decisions on student progress and in identifying
objectives to be mastered. All of the data were used in
making these decisions.
The Group Achievement Summary. The reported data were
used by students in making decisions on student progress
for each objective. The data were and on group progress
115
primarily used by the teacher in making decisions on
instruction. Data reported on the second group achieve¬
ment summary were not desired by the teacher for decision
making.
j^e Wrong Answer Tally. The reported data were used by
the teacher in making decisions on test questions, answers
to questions, and on instruction.
Data Reported on Texts. The data were used by the teacher
in making decisions on texts preferred by students as
resources.
Data Reported on TV Tapes and Labs. Data reported on TV
tapes and the lab exercises were used in making decisions
on revisions to TV tapes, lab writeups, and procedures
for labs. About half of the reported data were not used
in making decisions on revisions by either the teacher or
the students.
Criterion 2; Was the Initial Design Complete?
Individual Student Report. The reported data were used
by the individual student to make decisions on individual
progress and to identify objectives which needed to be
mastered. The data were used to identify where the student
was in the course.
Group Achievement Summary. Each group achievement summary
reported data which were used in making the same decisions
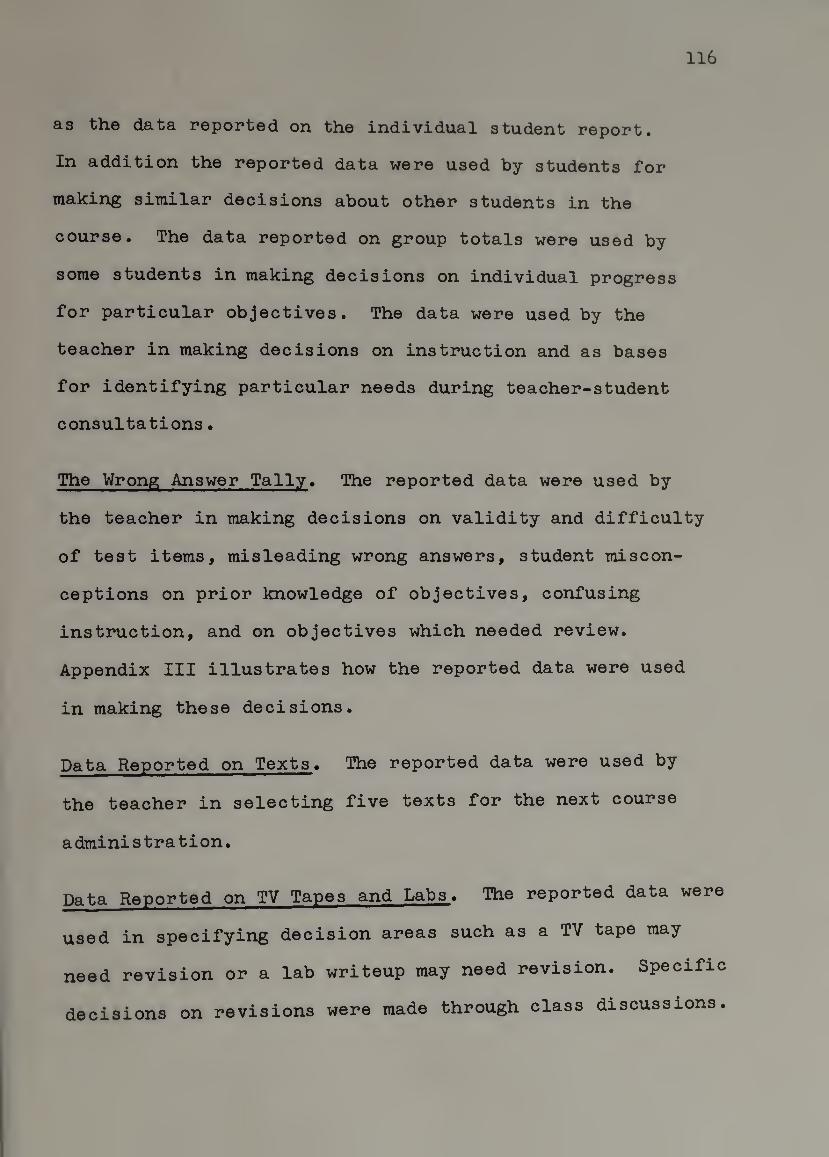
116
as the data reported on the individual student report.
In addition the reported data were used by students for
making similar decisions about other students in the
course. The data reported on group totals were used by
some students in making decisions on individual progress
for particular objectives. The data were used by the
teacher in making decisions on instruction and as bases
for identifying particular needs during teacher-student
consultations •
The Wrong Answer Tally. The reported data were used by
the teacher in making decisions on validity and difficulty
of test items, misleading wrong answers, student miscon¬
ceptions on prior knowledge of objectives, confusing
instruction, and on objectives which needed review.
Appendix III illustrates how the reported data were used
in making these decisions.
Data Reported on Texts. The reported data were used by
the teacher in selecting five texts for the next course
administration.
Data Reported on TV Tapes and Labs. The reported data were
used in specifying decision areas such as a TV tape may
need revision or a lab writeup may need revision. Specific
decisions on revisions were made through class discussions.
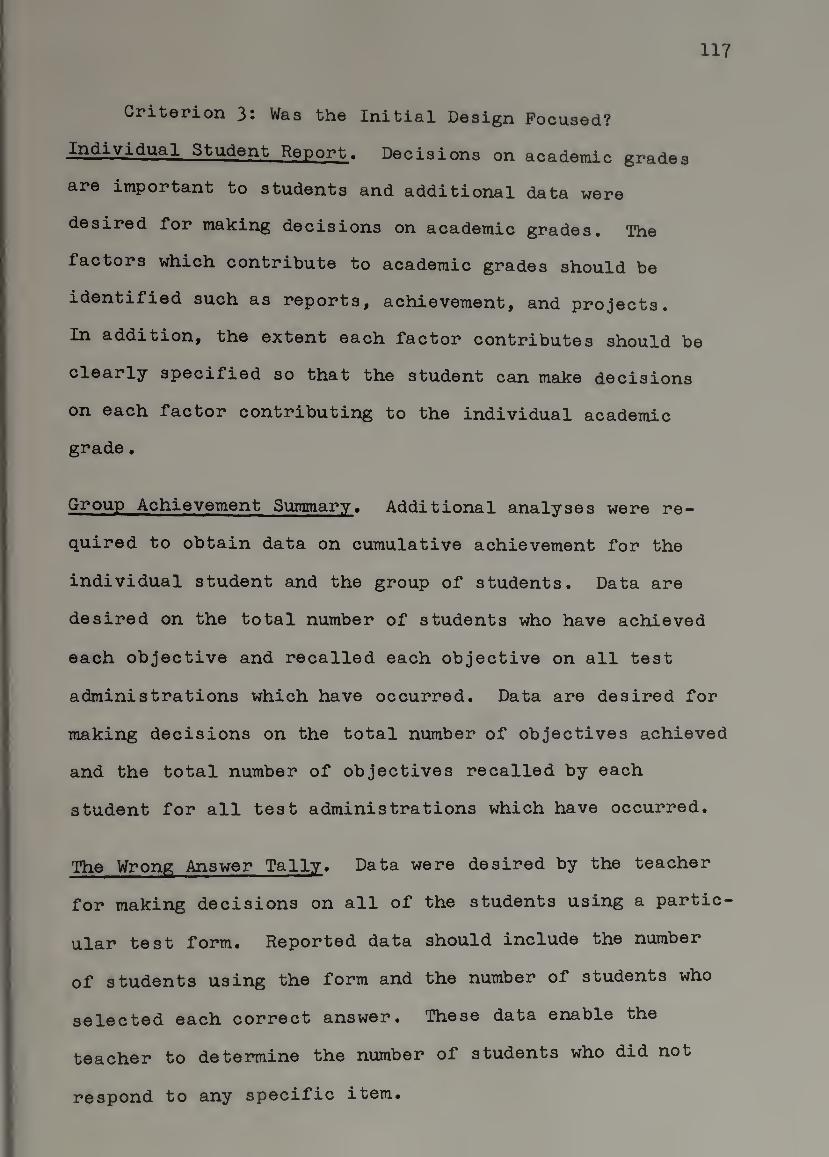
117
Criterion 3! Was tlie Initial Design Focused?
-^dividual Student Report. Decisions on academic grades
are important to students and additional data were
desired for making decisions on academic grades. The
factors which contribute to academic grades should be
identified such as reports, achievement, and projects.
In addition, the extent each factor contributes should be
clearly specified so that the student can make dacisions
on each factor contributing to the individual academic
grade.
Group Achievement Summary. Additional analyses were re¬
quired to obtain data on cumulative achievement for the
individual student and the group of students. Data are
desired on the total number of students who have achieved
each objective and recalled each objective on all test
administrations which have occurred. Data are desired for
making decisions on the total number of objectives achieved
and the total number of objectives recalled by each
student for all test administrations which have occurred.
The Wrong Answer Tally. Data were desired by the teacher
for making decisions on all of the students using a partic¬
ular test form. Reported data should include the number
of students using the form and the number of students who
selected each correct answer. These data enable the
teacher to determine the number of students who did not
respond to any specific item.
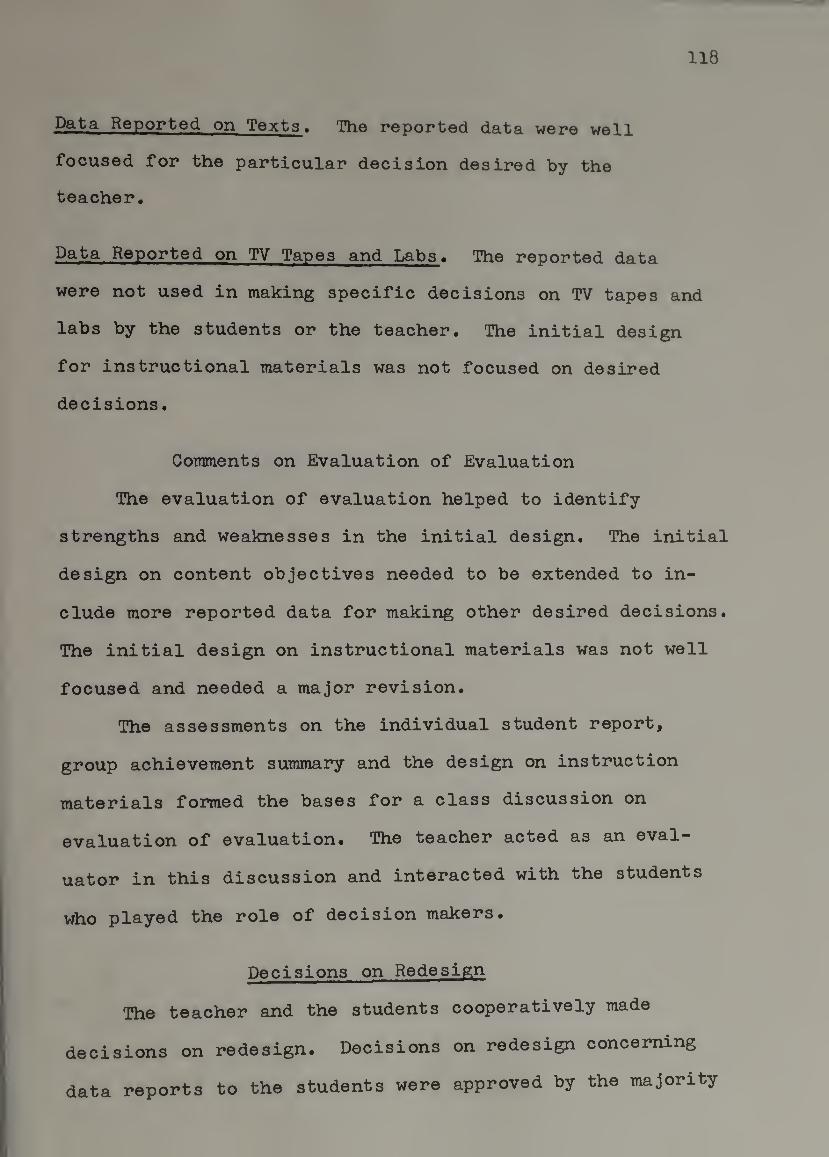
118
Data Reported on Texts. The reported data were well
focused for the particular decision desired by the
teacher.
Data Reported on TV Tapes and Labs, The reported data
were not used in making specific decisions on TV tapes and
labs by the students or the teacher. The initial design
for instructional materials was not focused on desired
decisions.
Comments on Evaluation of Evaluation
The evaluation of evaluation helped to identify
strengths and weaknesses in the initial design. The initial
design on content objectives needed to be extended to in¬
clude more reported data for making other desired decisions.
The initial design on instructional materials was not well
focused and needed a major revision.
The assessments on the individual student report,
group achievement summary and the design on instruction
materials formed the bases for a class discussion on
evaluation of evaluation. The teacher acted as an eval¬
uator in this discussion and interacted with the students
who played the role of decision makers.
Decisions on Redesign
The teacher and the students cooperatively made
decisions on redesign. Decisions on redesign concerning
data reports to the students were approved by the majority
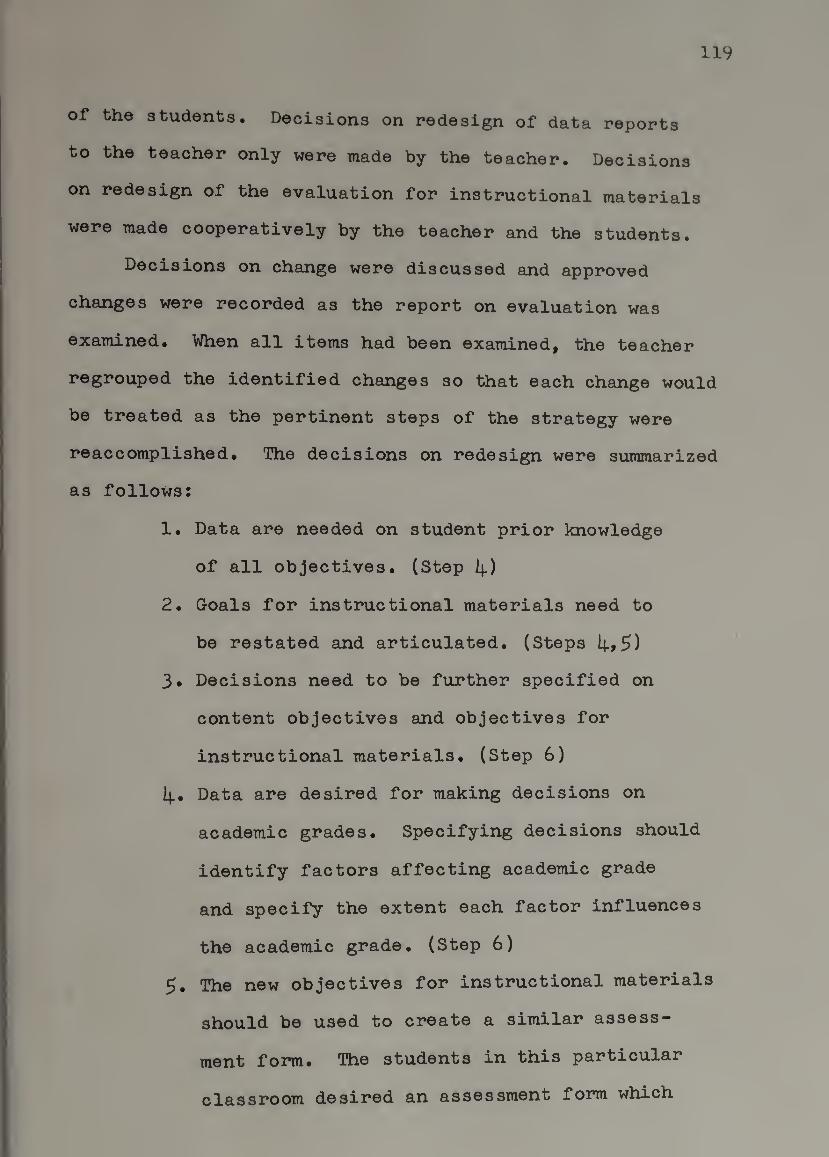
119
of the students. Decisions on redesign of data reports
to the teacher only were made by the teacher. Decisions
on redesign of the evaluation for instructional materials
were made cooperatively by the teacher and the students.
Decisions on change were discussed and approved
changes were recorded as the report on evaluation was
examined. When all items had been examined, the teacher
regrouped the identified changes so that each change would
be treated as the pertinent steps of the strategy were
reaccomplished. The decisions on redesign were summarized
as follows:
1, Data are needed on student prior knowledge
of all objectives, (Step 4.)
2. Goals for instructional materials need to
be restated and articulated, (Steps 4>5)
3* Decisions need to be further specified on
content objectives and objectives for
instructional materials, (Step 6)
4* Data are desired for making decisions on
academic grades. Specifying decisions should
identify factors affecting academic grade
and specify the extent each factor influences
the academic grade, (Step 6)
The new objectives for instructional materials
should be used to create a similar assess¬
ment form. The students in this particular
classroom desired an assessment form which
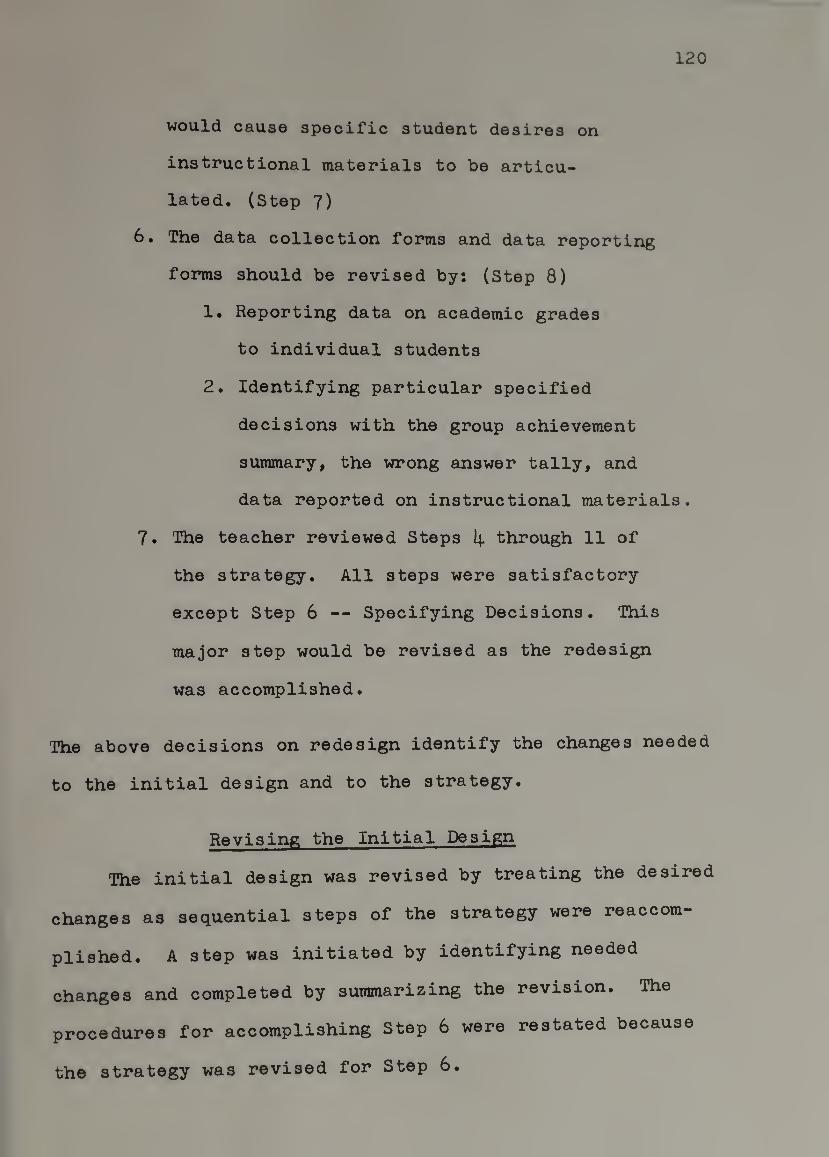
would cause specific student desires on
instructional materials to be articu¬
lated. (step 7)
120
6. Th.e data collection forms and data reporting
forms should be revised by; (Step 8)
1. Reporting data on academic grades
to individual students
2. Identifying particular specified
decisions with the group achievement
summary, the wrong answer tally, and
data reported on instructional materials.
7. The teacher reviewed Steps 4 through 11 of
the strategy. All steps were satisfactory
except Step 6 -- Specifying Decisions. This
major step would be revised as the redesign
was accomplished.
The above decisions on redesign identify the changes needed
to the initial design and to the strategy.
Revising the Initial Design
The initial design was revised by treating the desired
changes as sequential steps of the strategy were reaccom¬
plished. A step was initiated by identifying needed
changes and completed by summarizing the revision. The
procedures for accomplishing Step 6 were restated because
revised for Step 6. the strategy was
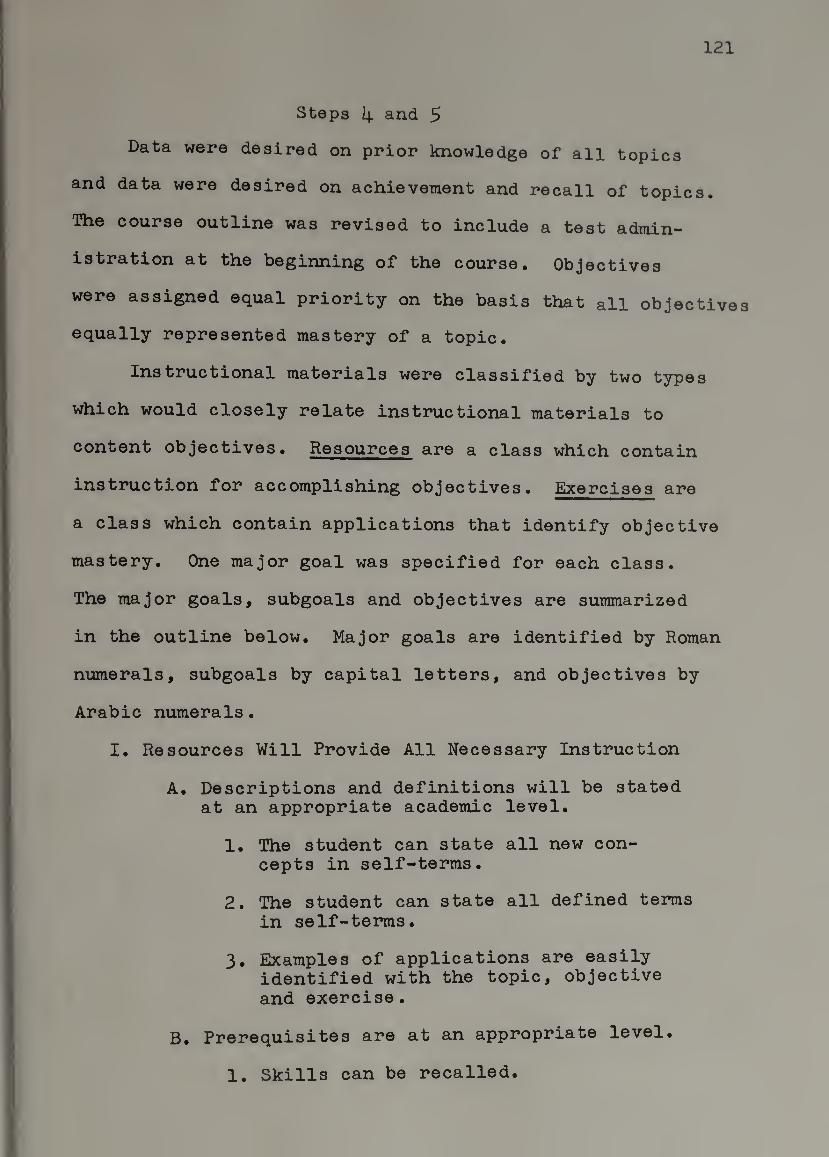
121
Steps 4. and 5
Data were desired on prior knowledge of all topics
and data were desired on achievement and recall of topics.
The course outline was revised to include a test admin¬
istration at the beginning of the course. Objectives
were assigned equal priority on the basis that all objectives
equally represented mastery of a topic.
Instructional materials were classified by two types
which would closely relate instructional materials to
content objectives. Resources are a class which contain
instruction for accomplishing objectives. Exercises are
a class which contain applications that identify objective
mastery. One major goal was specified for each class.
The major goals, subgoals and objectives are summarized
in the outline below. Major goals are identified by Roman
numerals, subgoals by capital letters, and objectives by
Arabic numerals.
I. Resources Will Provide All Necessary Instruction
A. Descriptions and definitions will be stated at an appropriate academic level.
1. The student can state all new con¬ cepts in self-terms.
2. The student can state all defined terms in self-terms.
3. Examples of applications are easily identified with the topic, objective and exercise.
B. Prerequisites are at an appropriate level.
1. Skills can be recalled.
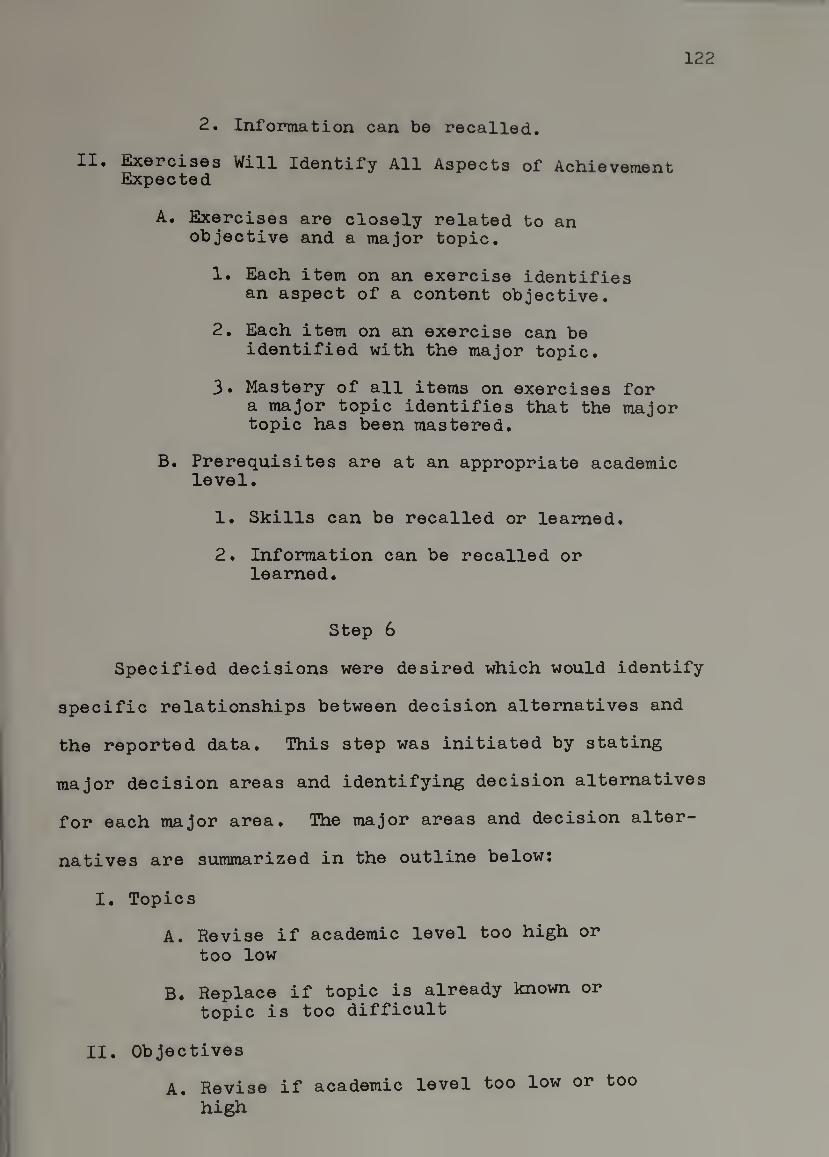
122
2, Information can be recalled,
II. Exercises Will Identify All Aspects of Achievement Expected
A. Exercises are closely related to an objective and a major topic,
1, Each item on an exercise identifies an aspect of a content objective,
2, Each item on an exercise can be identified with the major topic,
3, Mastery of all items on exercises for a major topic identifies that the major topic has been mastered,
B. Prerequisites are at an appropriate academic level,
1. Skills can be recalled or learned,
2, Information can be recalled or learned.
Step 6
Specified decisions were desired which would identify
specific relationships between decision alternatives and
the reported data. This step was initiated by stating
major decision areas and identifying decision alternatives
for each major area. The major areas and decision alter¬
natives are summarized in the outline below:
I. Topics
A, Revise if academic level too high or too low
B. Replace if topic is already known or topic is too difficult
II. Objectives
A. Revise if academic level too low or too high

123
B. Replace if objective is already known or objective is too difficult
C. Restate if wording is confusing
III. Test Items and Answers
A. Items
1. Revise academic level as needed
2. Replace trivial or difficult items
3. Restate confusing test items
B. Answers
1. Revise or replace:
a. Misleading wrong answers
b. Answers specified as correct which are actually incorrect
2. Restate answers worded in a confusing manner
IV. Instruction
A. Revise or replace:
1. Resources which presume an inappro¬ priate academic level
2. Exercises which are stated in a con¬ fusing manner or do not pertain to the topic or an objective
B. Create new materials if additional instruc¬ tion is needed or if additional exercises are needed.
V. Academic Grades
A. Identify factors affecting academic grades
B. Specify the influence of each factor upon the final academic grade.
Specifying decisions continued by identifying alter¬
natives to be selected from the data reported. Topics and
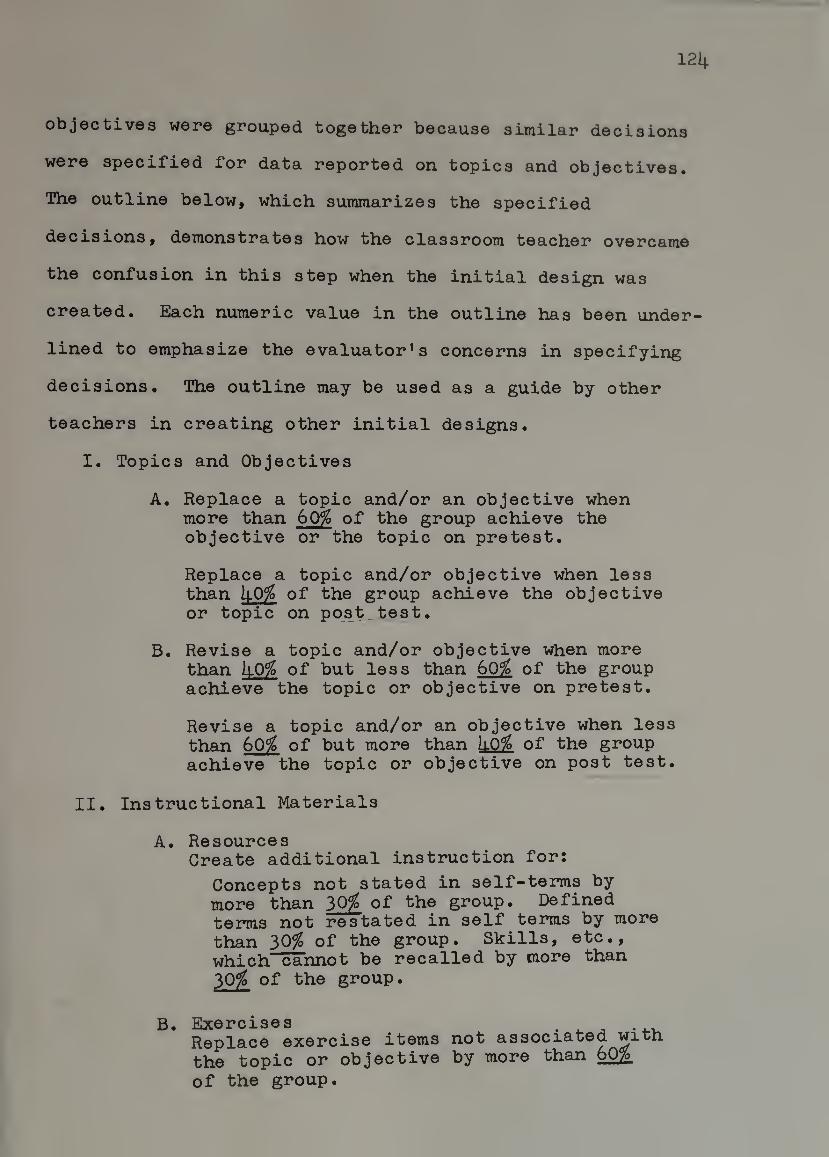
124
objectives were grouped together because similar decisions
were specified for data reported on topics and objectives.
The outline below, which summarizes the specified
decisions, demonstrates how the classroom teacher overcame
the confusion in this step when the initial design was
created. Each numeric value in the outline has been under¬
lined to emphasize the evaluator’s concerns in specifying
decisions. The outline may be used as a guide by other
teachers in creating other initial designs.
I. Topics and Objectives
A. Replace a topic and/or an objective when more than 60% of the group achieve the objective or the topic on pretest.
Replace a topic and/or objective when less than h.0% of the group achieve the objective or topic on po^t_test.
B. Revise a topic and/or objective when more than h.0% of but less than 60^ of the group achieve the topic or objective on pretest.
Revise a topic and/or an objective when less than 60% of but more than k0%> of the group achieve the topic or objective on post test.
II. Instructional Materials
A. Resources Create additional instruction for:
Concepts not stated in self-terms by more than 30% of the group. Defined terms not restated in self terms by more than 30% of the group. Skills, etc., which cannot be recalled by more than 30% of the group.
B. Exercises . 4. ^ Replace exercise items not associated witn the topic or objective by more than 60^ of the group.

125
Revise an exercise item when 3>0% or more of the group identify the same common needs to complete the exercise item.
Restate exercises which seem confusing to more than of the group.
Ill* Test Items and Answers
A. Revise and/or replace as needed when topics or objectives are changed.
B. Restate, replace or revise wrong answers which have been selected by 70% or more of the subgroup using that particular test form on post test.
IV. Academic Grades
A. Mastery
1. Topic achievement is denoted by mastery of two items on any given test administration.
2. Recall is denoted by achievement on a later test administration.
B. Credit for achieving all topics 1.6
C. Credit for recalling all topics one time .8
D. Credit for other factors
1. Homework
2. Labs ._9_
3. Project .3
E. Credit deducted;
1. Not achieving a topic «8
2. Not recalling a topic
3. Minimum credit is * Q
The set of specified decisions identify how the reported
data will be used in decision making for this particular
126
situation. They articulate the decision makers' desires
for data in making decisions.
Step 7
An assessment form was desired as the measurement
technique for instructional materials. The form, shown
in Figure 23, was again developed by rephrasing the
objectives as questions. The form serves as a guide to
help students specify their desires for instruction. The
articulated desires should help the teacher create instruc¬
tion needed by the students.
Step 8
Changes were desired in both the data collection
forms and the data reporting forms. The changes were
treated as each form was reviewed. The revisions to each
form are summarized in the outline below. The revised
forms are identified by the figures in parentheses.
I. Individual Report, (See Figure 2\\.)
The individual report was revised to re¬ port data on an individual's academic grade and on topic mastery,
II. Group Achievement Summary (See Figure 25)
1. Topic achievement is reported on a given test administration for the individual student and for the group of students.
2. Topic achievement for all test administra¬ tions is reported for the individual student and the group of students.
127
3. administra.
^©Poi’ted for the individual student and the group of students.
4. Specified decisions related to the re-
the fom!''® of
III. Wrong Answer Tally (See Figure 26)
1. nie numbers of students using each test form are reported.
2. The numbers of students selecting correct answers are reported.
3. The specified decisions related to the wrong answer tally are identified at the bottom of the form.
IV. Report on Instructional Materials (See Figure 2?)
1. Data are reported on instructional materials by topic. A completed form reports student needs, teacher decisions, and treatments for each topic.
2. The specified decisions related to instruc¬ tional materials are identified at the bottom of the form.
The four revised forms, as illustrated in the figures, com¬
pleted the revisions on the initial design. The forms relate
the reported data to specific desired decisions so that the
revised design will better fulfill the purpose of evaluation
in this particular situation.
Comments on Revising the Initial Design
The classroom teacher accomplished a redesign by
identifying the role of the evaluator and separating the
role from decision making. As particular evaluator concerns
were identified for Step 6, the teacher again adapted the

128
COURSE:_
MAJOR TOPIC:
STUDENT NAME: DATE / /
RESOURCE __
Yom'^ora defined terms which cannot be stated in
2. LIST SKILLS OR INFORMATION, PRESUMED BY THE RESOURCE YOU NEED TO LEARN OR RELEARN. '
WHICH
3. SPECIFY ADDITIONAL EXAMPLES WHICH WOULD BE OP IN THIS RESOURCE,
BENEFIT TO YOU
EXERCISE:
1. IDENTIFY ITEMS IN THE EXERCISE THAT ARE NOT RELATED TO THE MAJOR TOPIC OR ARE NOT ASSOCIATED WITH AN OBJECTIVE OP THIS MAJOR TOPIC:
2. IDENTIFY THE ITEMS NOT ACHIEVED BY YOU AND STATE WHAT IS needed to complete EACH ITEM.
ITEM NUMBER WHAT IS NEEDED TO COMPLETE THIS ITEM
OTHER
BRIEFLY STATE ANY OTHER NEEDS FOR INSTRUCTION WHICH WILL HELP YOU MASTER THIS TOPIC: _ .
FIGURE 23 Revised Assessment Fom for Instructional Materials
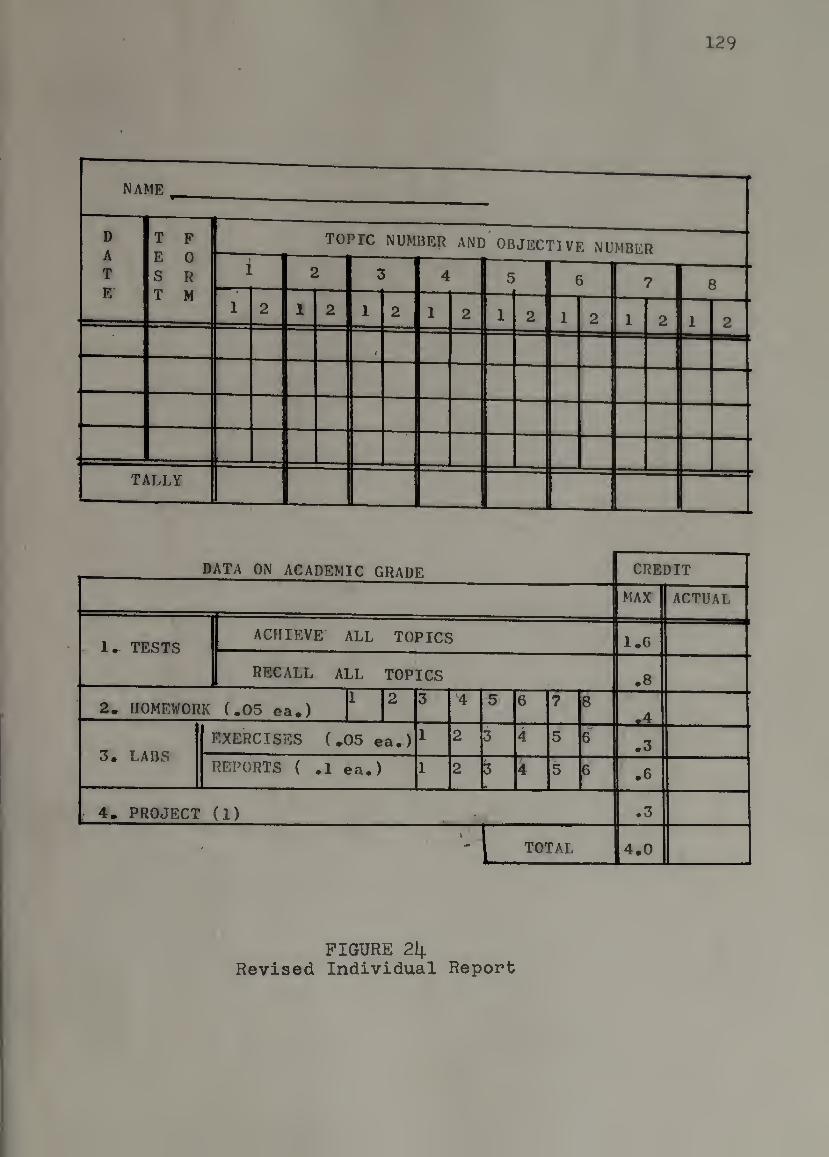
129
DATA ON ACADEMIC GRADE I CREDIT
MAX ACTUAL
. TESTS ACHIEVE ALL TOPICS 1.6
RECALL ALL TOPICS .8
2* HOMEWORK (.05 ea.) f ^ 3 4 6^ 7 8 .4
3. LABS EXERCISES (.05 ea.) 1 2 3 4 5 6
.3
REPORTS ( .1 ea.) 1 2 S3 4 5 6 .6
, 4. PROJECT (1) . :.,A ' 1 - ^71
[ TOTAL 4.0
i L
FIGURE 2k Revised Individual Report
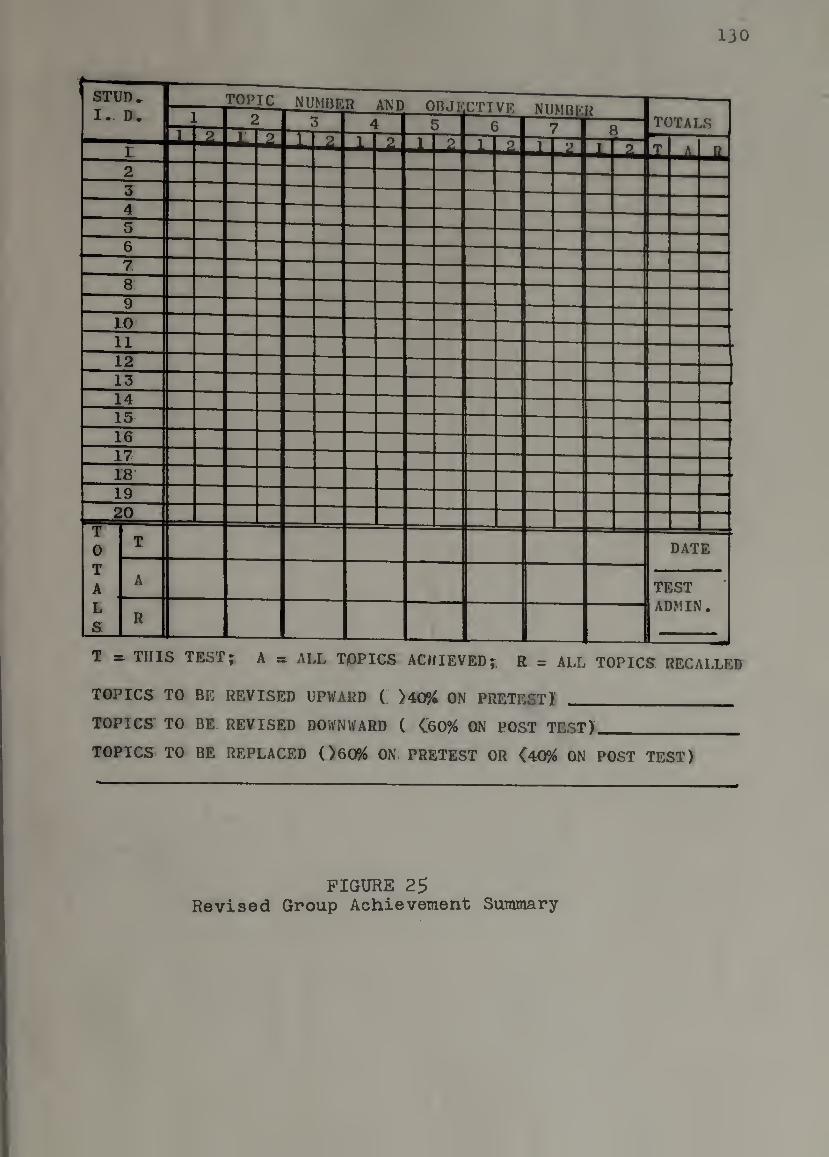
130
T at THIS TEST; A ALL TOPICS ACHIEVED;;, R = ALL TOPICS RECALLED
TOPICS TO BE REVISED UPWARD ( >40?; ON PRETEST! _
TOPICS T0> BE REYISEiD DOWNWARD ( C60% ON POST TEST)_
TOPICS. TO BE REPLACED (>60?; ON PRETEST OR <40?; ON POST TEST)
FIGURE 25 Revised Group Achievement Summary
r
I! i'

131
* DENOTES TALLY FOR CORRECT ANSWER. DATE
REVISE THE FOLLOWING OBJECTIVES UPWARD ( >40% ON PRETEST)
REVISE THE FOLLOWING OBJECTIVES DOWNWARD ( <60% ON POST TEST)
REPLACE THE FOLLOWING OBJECTIVES. ( >60% ON PRETEST OR (40% ON POST TEST) _
IDENTIFY HIGH TALLIES CAUSE
CONFUSING TEST ITEM CONFUSING INSTRUCTION
WRONG ANSWER IS CORRECT ANSWER MISLEADING WRONG ANSWER INCORRECT PRIOR KNOWLEDGE
FIGURE 26 Revised Wrong Answer Tally
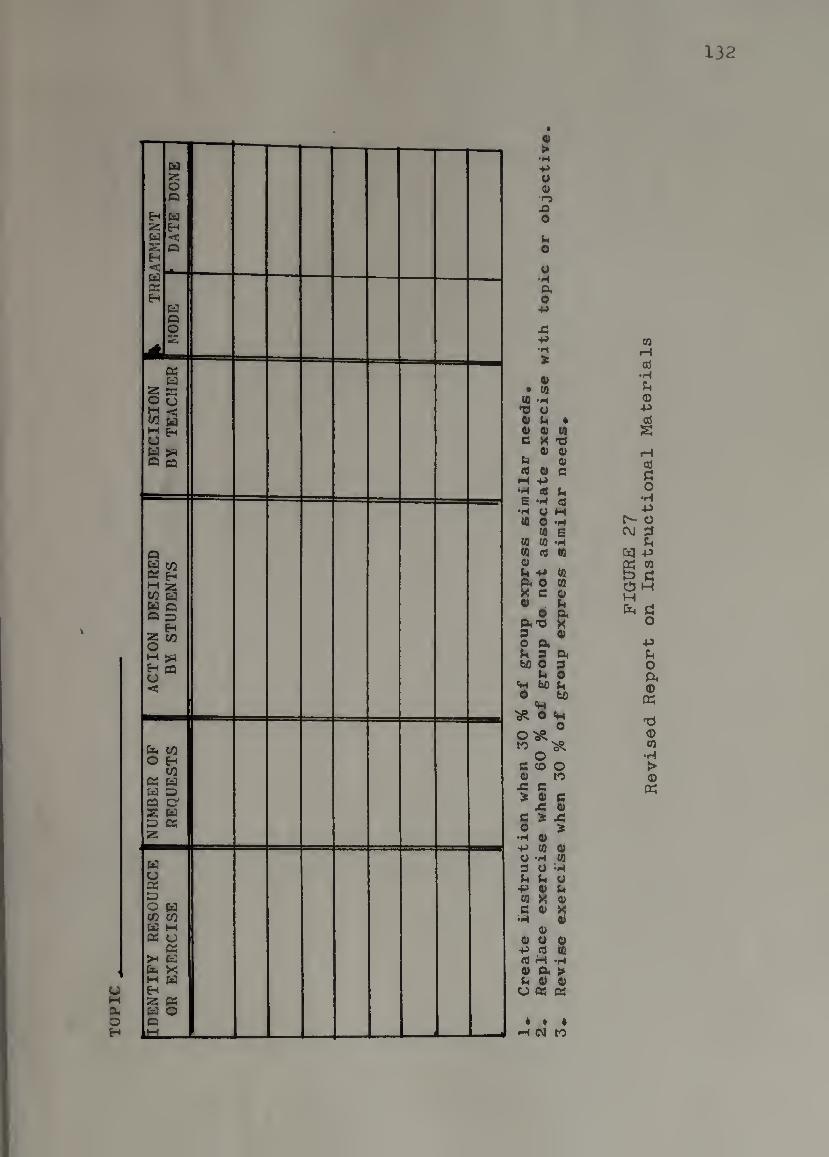
TO
PIC
132
■
1 D
EC
ISIO
N
K
TR
EA
TM
EN
T
I f
DA
TE
DO
NE
II
MO
DE
B
Y
TE
AC
HE
R
AC
TIO
N
DE
SIR
ED
B
Y
ST
UD
EN
TS
N
UM
BE
R
OF
R
EQ
UE
ST
S
IDE
NT
IFY
RE
SO
UR
CE
O
R
EX
ER
CIS
E
•H ■M U a>
•rj
jQ O h O u P, O
+» j: +» •H
« 03
•H u (4 * 0) (0
-o 0) o
b U (0 « c H +» M ce E
tJ « c
tt (»
(0 03 03 (0 V U 4* e-i
b (0
U M 0
B •H «
to Ci b p. X
§
0 (b'O 9 O Pi
bO 9 b _
H faO b O bo
s-i ^ O «H
® o
C CO O V to
JS 9 > 9 9
x; 9 9 JS 0
•H 9 00 9
u •H 03 9 u •P b b 9 •P 9 b 03 X 9 9 9 X
9 9
0) 0 9 -P C0 to (ti H •H 9 a > b 9 9 0 CS
4 • 4 fH 01 to
FIG
UR
E
27
R
ev
ised R
eport
on Instr
ucti
on
al
Mate
rials
133
methodology to a particular classroom situation by
specifying procedural substeps. The substeps caused
the teacher to focus on one particular aspect at any
given time and helped the teacher accomplish this major
step.
Another teacher may benefit from the revisions by
adapting the revised design as an initial design. In
addition, the procedural substeps of the strategy may
be used as a guide for revising another initial evaluation
design.
Summary
The initial design was revised by developing three
procedural substeps to guide the teacher in accomplishing
a redesign. As a major step of the strategy was accom¬
plished desired revisions were made to the initial design.
Step 6 of the strategy was extended and further specified.
The study was terminated with the completion of
this step. In the next chapter some conclusions and
implications of the study are discussed.
CHAPTER VI
CONCLUSIONS AND IMPLICATIONS
The final chapter* will briefly summarize the study
as a basis for presenting related-conclusions. The con¬
clusions vdll summarize specific contributions from the
study and relate these contributions to the purposes of
the study. Some implications for other teachers and
additional study are briefly discussed at the end of the
chapter.
Summary
A teacher, who was a novice to evaluation, proposed
that formal evaluation can and should be available at the
classroom level. Further, the classroom teacher should
retain complete control of the evaluation by assuming both
the roles of evaluator and decision maker.
An appropriate methodology was selected and a strategy
was framed by adapting the methodology to a classroom
situation. The strategy was applied to a particular course
and an initial design was created, operated and revised by
the classroom teacher who assumed both the roles of a
decision maker and an evaluator.
The evaluation focused on the cognitive content and
the instructional materials in a one-semester introductory
135
Physios course at a college level. The evaluation design
was created for a class which had twenty-one students.
Conelusiona
The most difficult task in this study was identi¬
fying and separating evaluator roles from decision maker
roles. As the study progressed the teacher repeatedly
sought ways to accomplish this task and ultimately resorted
to one particular procedure. The procedure is obviously
implied throughout the methodology; however, a classroom
teacher, who is a novice to evaluation, may easily over-
look this cpitical procedup©.
The majop contpibution of this study identifies how
anothep classpoom teachep can sepapate an ©valuatop's pol©
fpom decision making; ^ evaluatop»s pole i^ sepapated fpom
decision making capefully tpeating one aspect of eval-
u^tion a^ E^iyen time, The study demonstpates how one
classpoom teachep, who was a novice to evaluation, identified
and used this cpitical ppocedup© to obtain fopmal classpoom
©valuation. The ppocedup© was cpucial in developing fopmal
classpoom evaluation in the study and is the most impoptant
contpibution of the study fop a teachep who desipes fopmal
classpoom evaluation.
Teacheps with similap classpoom situations may dipectly
benefit fpom the stpategy and the pevised ©valuation design
developed in the study. The stpategy helps anothep teachep
to sepapate an ©valuatop's pole fpom decision making by

136
guiding the teacher with procedural cubateps which identify
evaluator concerns. The revised evaluation design, which
IS an application of the strategy to a particular course,
may be adapted as an initial design by another teacher.
The strategy and the revised evaluation design emphasize
the major contribution by causing the teacher to treat one
particular aspect of evaluation at any given time.
The study has demonstrated that students can play an
important role as decision makers in a course with eval¬
uation. Their concerns, as decision makers, were instrumental
in revising the initial design to include data reporting on
factors affecting academic grade and in revising the
evaluation for instructional materials. Another teacher can
benefit from the study by similarly encouraging students
to participate in evaluation as decision makers.
The crucial procedure for separating an evaluator’s
role from decision making is the major contribution because
it has been repeatedly and successfully tested. Other
contributions and benefits must be considered tentative
because the study was severely limited by resources and
to the single classroom situation. The strategy and revised
design may directly benefit other teachers in creating an
initial design but the major contribution is the key for a
successful formal classroom evaluation.
Implications
The results of the study imply that formal evaluation

137
can help a teacher to integrate the course through the
content objectives. As the topics are analyzed and
Objectives are written, the teacher is required to become
thoroughly familiar with the content of the course and
the instruction which will be provided. These analyses
help the teacher to identify the central themes in the
course and the contingencies vdiich may exist between
central themes. The study illustrates how one teacher
Identified central themes which were common to several
similar texts vdiich were used as resources. Revisions
to the evaluation caused additional contingencies to be
Identified between instructional materials and content
objectives, and the course will be better integrated in
the next presentation.
The results of the study imply that courses with
formal classroom evaluation will benefit both the students
and the teacher. In this study, evaluation caused more
students to achieve more objectives than in the course
without evaluation. Evaluation helped the teacher to make
better decisions on instruction and evaluation helped both
the teacher and the students to articulate desires for an
on-going course with evaluation. In future applications
the evaluation will be revised and extended to provide
more data for making more desired decisions about the
students and the course; decisions which will benefit the
teacher and the students.
138
The teacher and the students in this study benefited
from evaluation because the teacher desired evaluation.
Another teacher, who is a novice to evaluation, should
treat a course with evaluation as an alternative to be com¬
pared with other alternatives before a final decision is
reached. Unless evaluation is desired by the teacher, a
course with evaluation should not be undertaken, because
the results of the study imply that the success of a course
®valuation depends solely on the classroom teacher.
The results of the study are available to any teacher
with the following proviso: the strategy or the revised
design should not be misused. For example, the strategy
or the revised design should not be used to create trivial
objectives or to tailor instruction to test items. Teachers
are individually responsible for applying the results of
the study in a beneficial way.
There are still many problems to investigate before
the results of this study can be stated as general benefits.
Some suggested problems for future research are adapting
and expanding formal classroom evaluation to include process
objectives and affective objectives. Additional study is
needed on the frequency of testing and its dependency on
subject matter. Teachers need to try out the results of
the study with different grade levels, other subject matter
areas and different class sizes.
Finally, although this study has ended, research on
formal classroom evaluation continues. A manual, based

139
on the results of this study, is currently being prepared
at Fitchburg State College for classroom teachers who desire
formal classroom evaluation.
APPENDIX I
The forms developed in creating the initial
design are contained in this appendix. The first
four forms are criterion tests which are followed
by common answer sheets for all tests as forms
five, six and seven. The remaining forms are data
collection and data reporting forms.
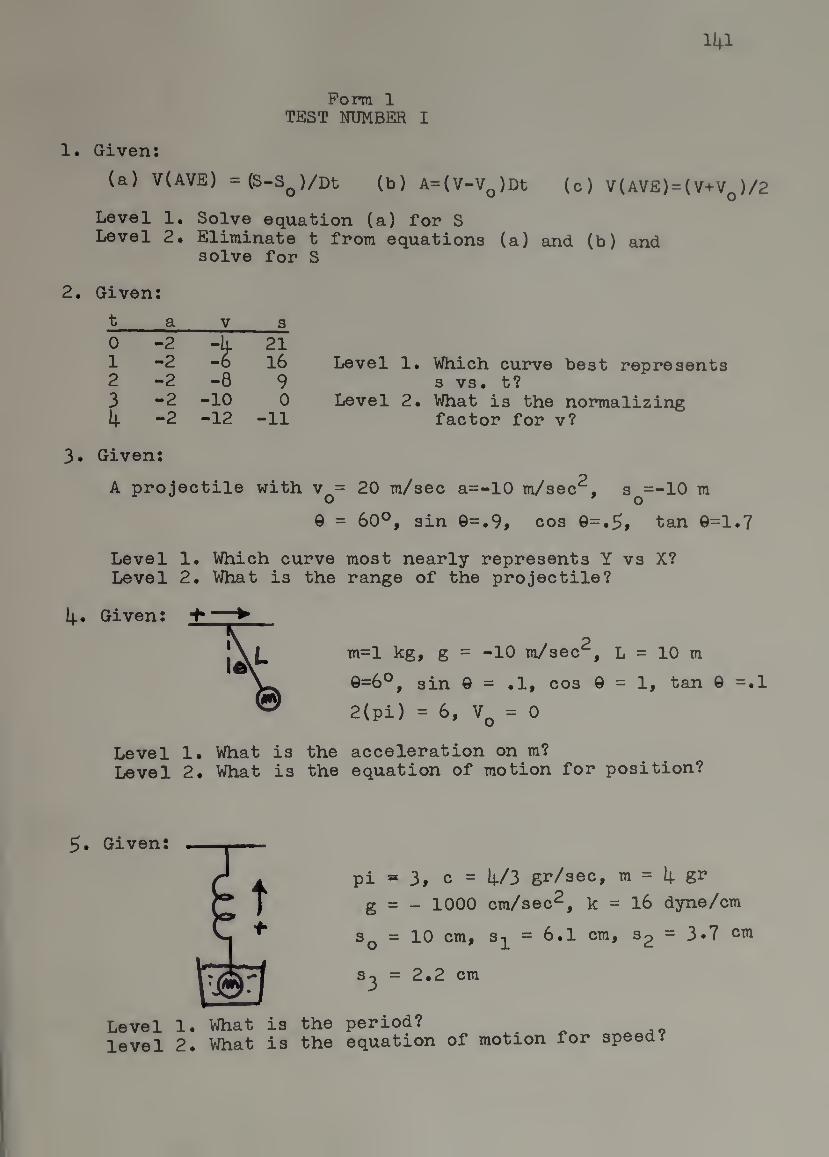
141
Form 1 TEST NUMBER I
1. Given;
(a) V(AVE) =($-S^)/Dt (b) A=(V-VQ)Dt (c) V(AVE) = (V+Vq)/2
Level 1, Solve equation (a) for S Level 2* Eliminate t from equations (a) and (b) and
solve for S
2. Given;
3.
t a V s 0 -2 21 1 -2 -6 16 Level 1 2 -2 -8 9 3 -2 -10 0 Level 2 4 -2 -12 -11
Given;
VJhich curve best represents s vs. t? What is the normalizing factor for v?
A projectile with v^= 20 m/sec a=-10 m/sec^, s =-10 m o ' o
9 = 60®, sin 9=.9, cos 9=.5f tan 0=1.7
Level 1. Which curve most nearly represents Y vs X? Level 2. What is the range of the projectile?
4* Given; p
m=l kg, g = -10 m/sec , L = 10 m
9=6®, sin 9 = .1, cos 9=1, tan 9 =.l
2(pi) = 6, Vq = 0
Level 1. What is the acceleration on m? Level 2. What is the equation of motion for position?
5.
Level 1. What is the level 2. What is the
pi * 3, c = 4/3 gr/sec, m = 4 gr
g = - 1000 cm/sec^, k = 16 dyne/cm
Sq = 10 cm, s-j^ = 6.1 cm, S2 = 3*7 cm
s^ = 2.2 cm
period? equation of motion for speed?
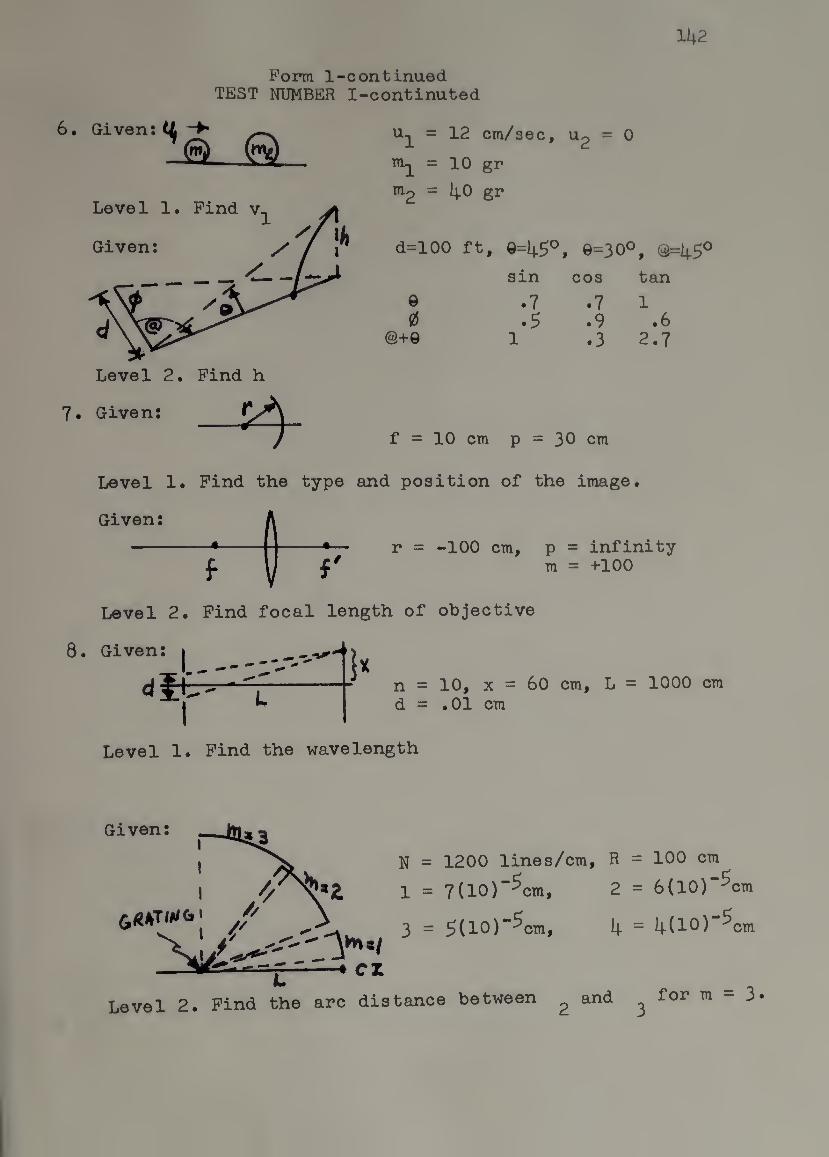
Pom l-continued TEST NUMBER I-continuted
142
6# Given: “
^ =
TTlo =
Level 1, Find v
Given:
12 cm/sec, U2 = 0
10 gr
40 gr
d=ioo ft, 0=45®, ©=30°, @=450
sin cos tan
©
0 @+©
.7
.5 .7 1 .9 .6 .3 2.7
Level 2. Find h
7* Given:
f = 10 cm p = 30 cm
Level 1. Find the type and position of the image.
Given:
f \l f' Level 2. Find focal length of objective
8. Given:
r = -100 cm, p = infinity m = +100
I n = 10, X = 60 cm, L = 1000 cm d = .01 cm
Level 1. Find the wavelength
Given:
' <i«i|rTW61
—-» cx
N = 1200 lines/cm, R = 100 cm
1 = 7(10)"^cm, 2 = 6(10)“^cm
3 = ^(10)"^cm, 4 = 4(10)*’^cm
Level 2. Find the arc distance between ^ and ^ for m - 3.
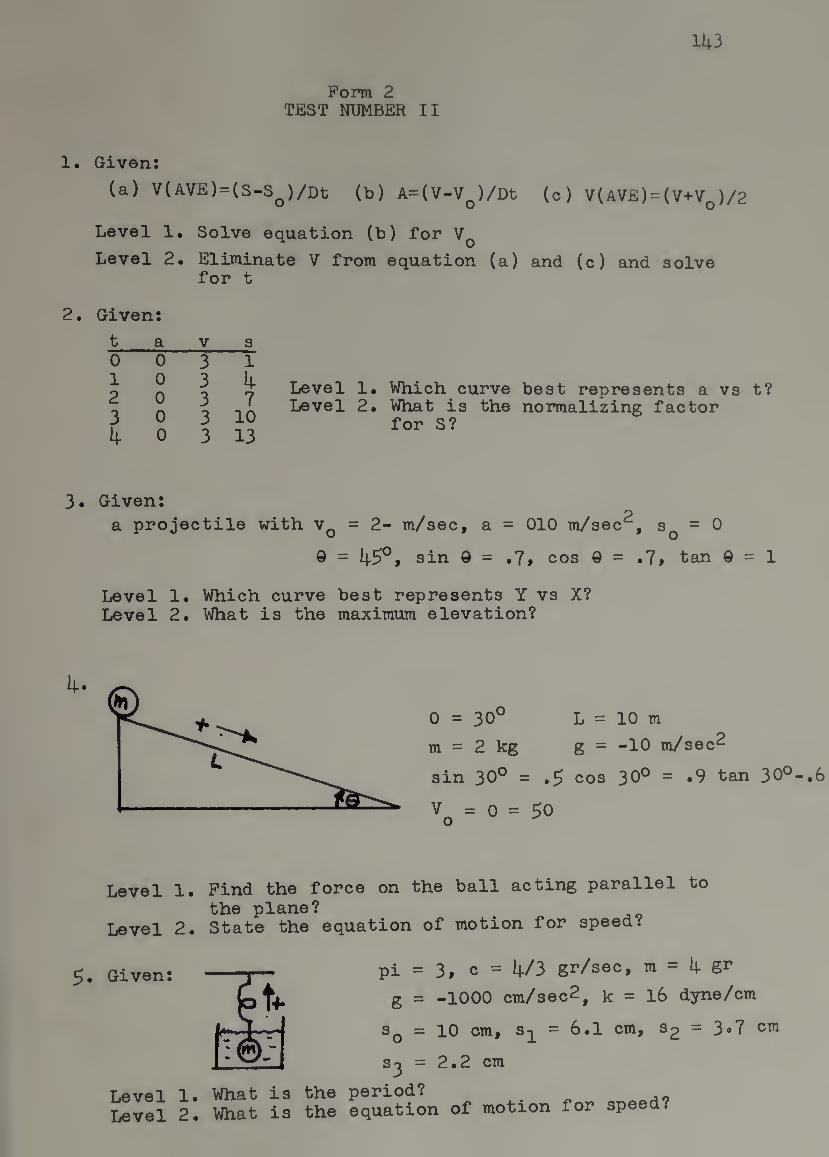
143
Form 2 TEST NUMBER II
1. Given;
(a) V(AVE)=(S-S^)/Dt (b) A=(V-VQ)/Dt (c) V(AVE)=(V+Vq)/2
Level 1. Solve equation (b) for
Level 2. Eliminate V from equation (a) and (c) and solve for t
2, Given;
t a V 3 0 0 3 1 10 3 4 2 0 3 7 3 0 3 10 4 0 3 13
Level 1. Which curve best represents a vs t? Level 2. What is the normalizing factor
for S?
3. Given; a projectile with v^ = 2- m/sec, a = 010 m/sec^, = 0
9 = 4^°* Q = •?> cos 9 = .7> tan 9 = 1
Level 1. Which curve best represents Y vs X? Level 2. What is the maximum elevation?
0 = 30° L = 10 m
m = 2 kg g = -10 m/sec^
sin 30° = *5 cos 30° = *9 tan 30°-.6
= 0 = 50
Level 1.
Level 2.
Find the force on the ball acting parallel to the plane? State the equation of motion for speed?
5. Given;
Level 1. Level 2.
pi = 3, c = 4/3 gr/sec, m = 4
g = -1000 cm/sec2, k = l6 dyne/cm
Sq = 10 cm, = 6.1 cm, S2 = 3#7 cm
s^ = 2.2 cm
What is the period? What is the equation of motion for speed?
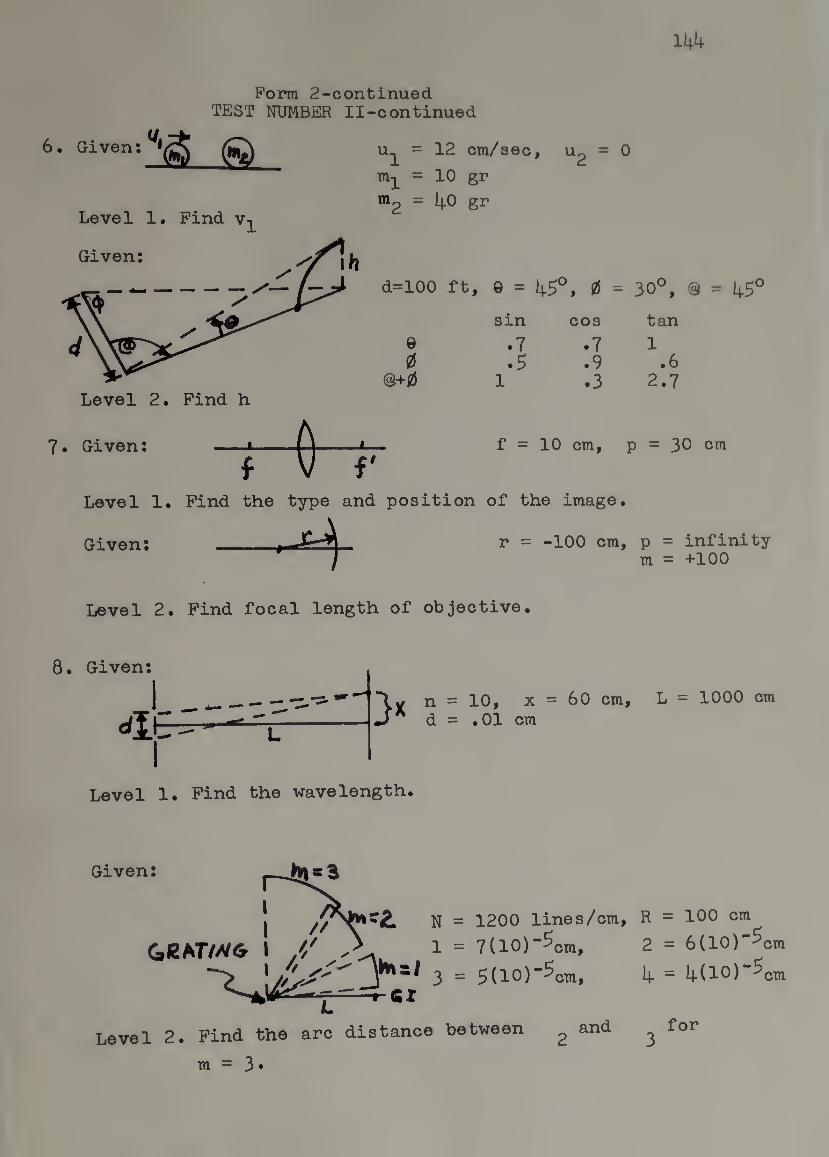
Pom 2-continued TEST NUMBER Il-continued
6• Given
Level 1. Find v.
= 12 CTti/sec, U2 = C
= 10 gr
8^
d=100 ft, 0 = 45°, 0 =
sin 003
.7 .7 9 0
0+0 .5 .9
.3
7. Given: i i (. ' L
f = 10 cm, ]
Level 1. Find the type and position of the image.
Given: _»,***^.- r = -100 cm.
Level 2. Find focal length of objective.
8. Given:
di\ :3 ■X d
10, X = 60 cm, .01 cm
Level 1. Find the wavelength.
1 = 7(io)"5 cm.
Level 2. Find the arc distance between ^
m = 3*
30°, @ = 1^5°
tan
1 .6
2.7
= 30 cm
p = infinity m = +100
L = 1000 cm
R = 100 cm
2 = 6(10)“^cm
4 = 4(10)”^cm
for 3

145
Form 3 TEST NUMBER III
1. Given;
(a) V(AVE) = (S-S^)/Dt (b) A = (V-V^)Dt (c) V(AVE)=(V+V^)/2
Level 1* Solve equation (c) for V. Level 2# Eliminate V from equations (b) and (c) and
solve for V(AVE).
2. Given;
t a V s T5 +T-S-(5 1+11 .5 2+122 3+13 4.5 4+148
Level 1. Vfhich curve best represents V vs t?
Level 2. What is the normalizing factor for s?
3. Given;
A projectile with v^ = 20 m/sec, a = -10 m/sec^, Sq = 0
0 = 90°, sinO = 1, cos 0=0, tan 0 is infinite
Level 1. Which curve best represents Y vs X? Level 2. What is the range?
4. L
Level 1. What Level 2. What
m = 1 kg
0=0°
2=6
g = -10 ra/sec 2 L = 10 m
is the initial acceleration? is the equation of motion for speed?
Given
pi = 3 c = 4/3 gr/sec m = 4 6^
g = -1000 cm/sec^ k = l6 dyne/cm
S = lO cm St=6.1 cm Sp=3.7 cm S^=2.2cm
Level 1. What is the frequency of m? Level 2. What is the equation of motion for distance?
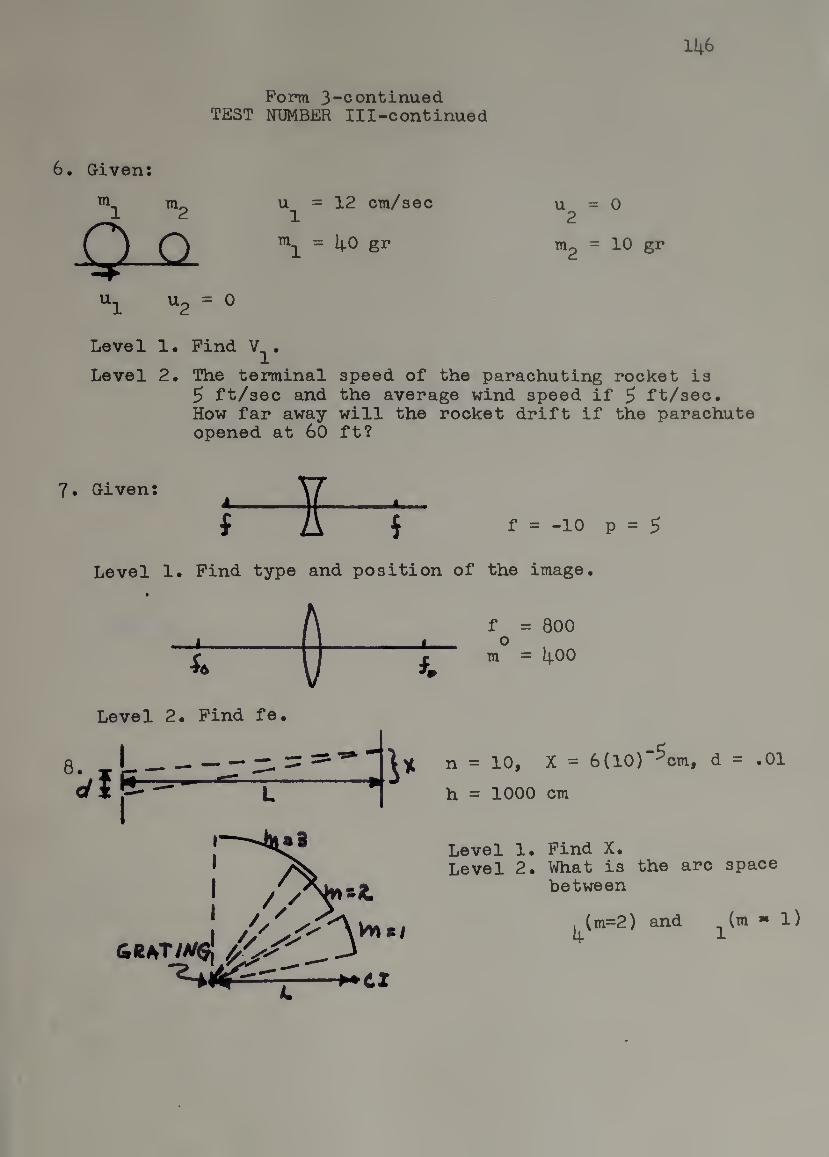
14.6
Pom 3-continued TEST NUMBER Ill-continued
6. Given:
u =12 cm/sec 1
= 4.0 gr
0
= 10 gr
Level !• Find V^.
Level 2. The teminal speed of the parachuting rocket is 5 ft/sec and the average wind speed if 5 ft/sec. How far away will the rocket drift if the parachute opened at 60 ft?
7. Given:
f = -10 p = 5
Level 1. Find type and position of the image.
Level 2# Find fe.
n = 10, X = 6(10)“^cm, d = .01
h = 1000 cm
Level 1. Find X. Level 2. What is the arc space
between
, (m=2) and _ (m - l) M- 1
^CI
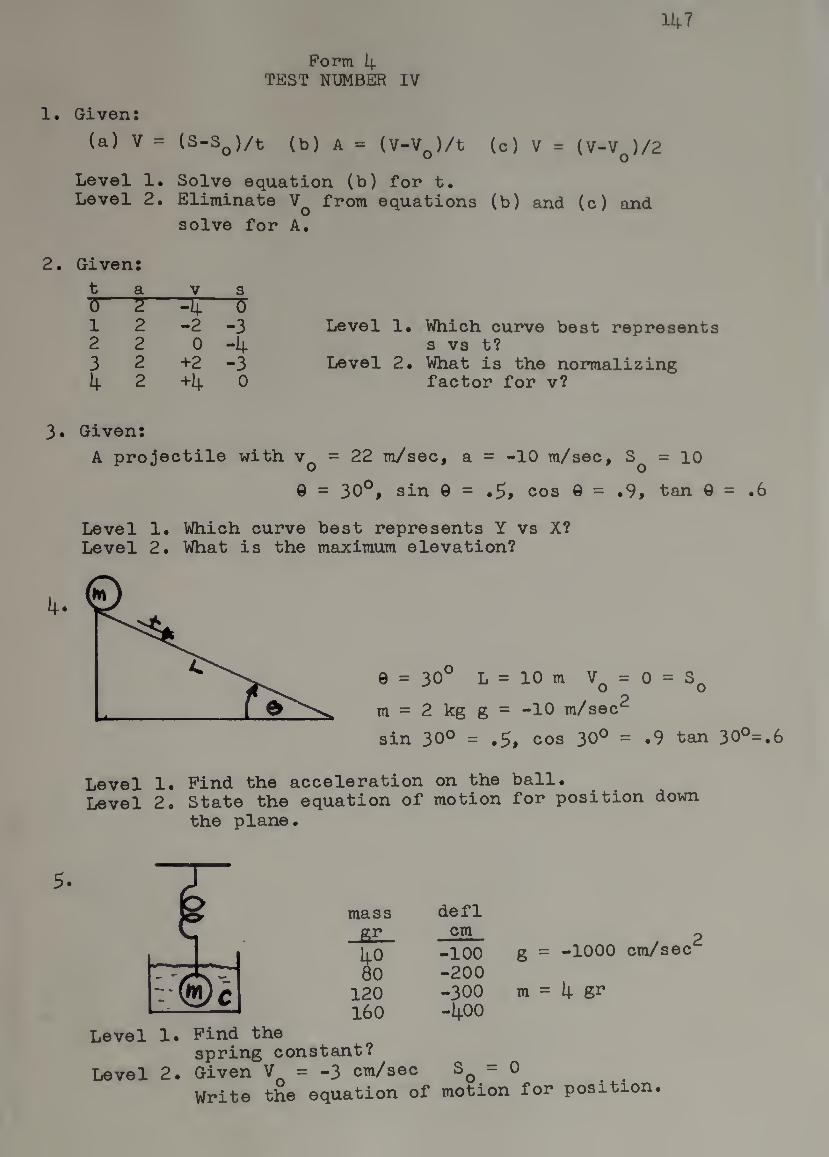
Pom 4 TEST NUMBER IV
147
1. Given:
(a) V = (S-SQ)/t (b) A = (c) V = (V-V^)/2
Level 1. Solve equation (b) for t. Level 2. Eliminate from equations (b) and (c) and
solve for A.
2. Given;
t a V s TT" 1 2 -2 -3 Level 1. Which curve best represents 2 2 0 -4 s vs t? 3 2 +2 -3 Level 2. What is the nomalizing 4 2 +4 0 factor for V?
3. Given:
A projectile with v^ = 22 m/sec, a = -10 m/sec, S^ = 10
0 = 30®, sin 9 = .5» cos 9 = .9, tan 9 = .6
Level 1. Which curve best represents Y vs X? Level 2. What is the maximum elevation?
0 = 30° L = 10 m = 0 = S^ 00
m = 2 kg g = -10 m/sec^
sin 30° = •Sf cos 30° = .9 tan 30°=«6
Level 1. Find the acceleration on the ball. Level 2. State the equation of motion for position down
the plane.
5. mass
120 160
Level 1. Find the spring constant?
Level 2. Given = -3 cm/sec Write the equation of
defl cm
-100 g = -200 -300 m = -400
So = 0 motion for
2 -1000 cm/sec
4 gr
position.
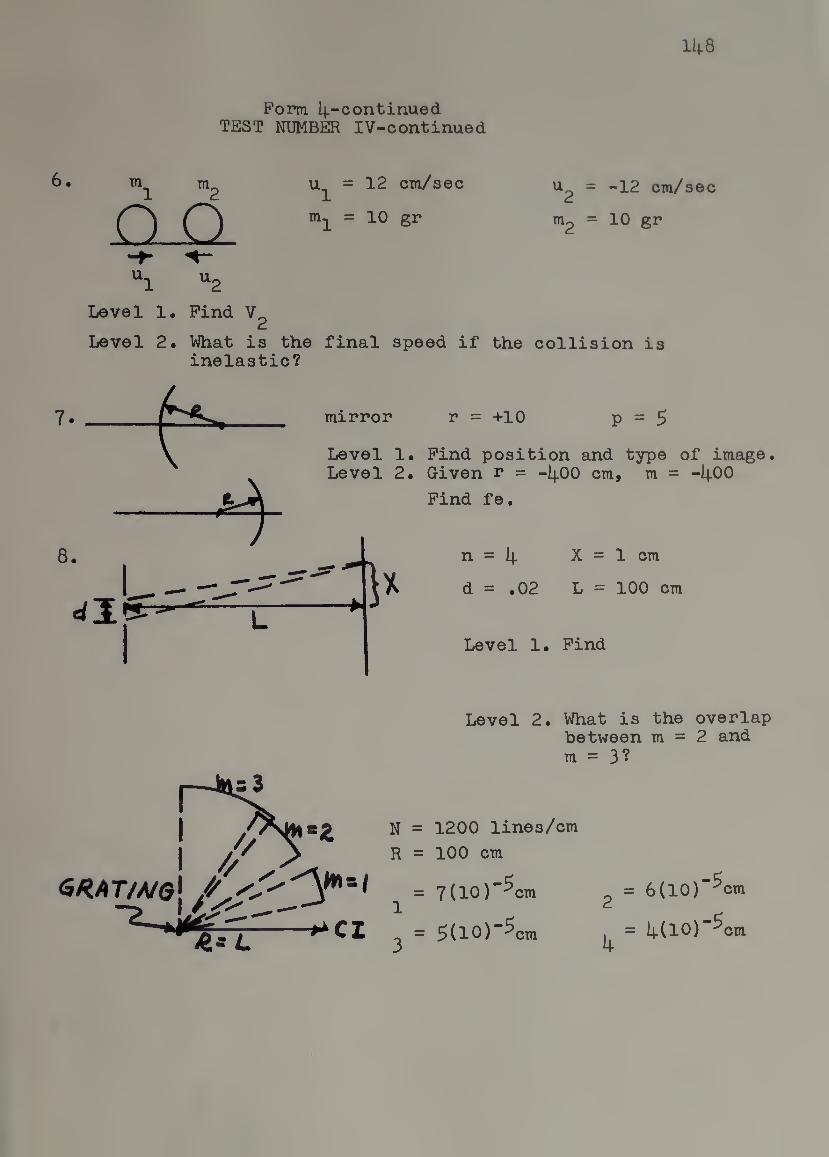
114.8
Pom 4-continued TEST NUMBER IV-continued
Til 1
= 12 cm/sec = -12 cm/sec
a. = 10 gr m2 = 10 gr
'^l "2
Level 1. Find
Level 2* What is the final speed if the collision is inelastic?
m = 3?
N = 1200 lines/cm
R = 100 CT11
^ = 7(10)"^cm
= 5(10)"^cm
2 = 6(10)“^cm
= 4.(10)”^cm 4-
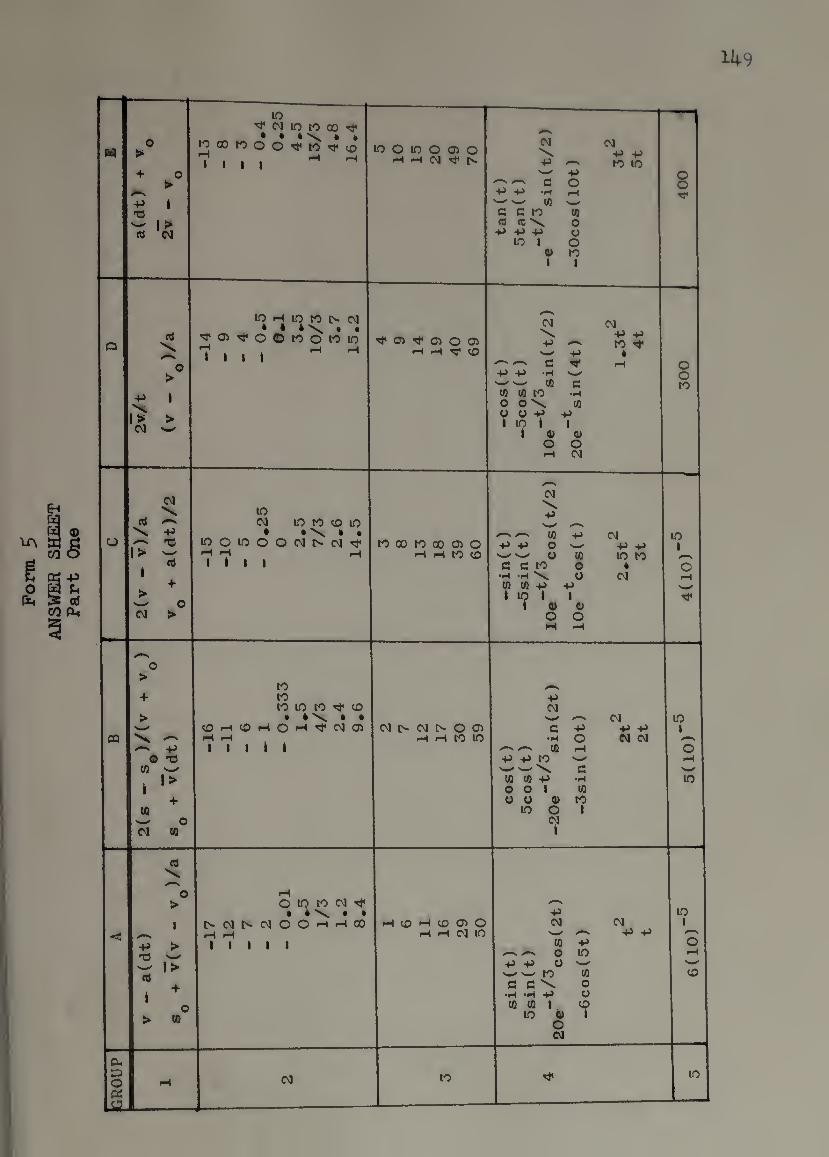
AN
SWE
R
SH
EE
T
Part
One
149
H o
>
+ o ►
■p 1 -o w 1 >
eo a
m ^ CM lO lO 00 ^
^ \ * MQOIOOO'tlOT»<;0
'V , , , - to o to o 01 o
•H pH CM Tt<
N CM \ +* -H ■P to 10 W
—' p-s CO ■P +j -H ^
e c to IQ to to \ o
-P V -P O lO 1 o
« to t 1
s Tf 1
a n>
o >
1
l'> > CM w
^OlTj<0©lOOWlO
t • . 1 ^ ^ oi 'i* oi o oi
(H iH ^ o
w CM \ -p +i -p to ^ w +i »
p^ P-' C ^ rH ■p -P -H w
si-ii' 'w' CQ C (Q Cfi to -H O O \ CD y o -p -p T to » t
1 « « o o IH CM
o o to
o
■ • CM V.
rt V. +»
1 +
> W o CM >
10 CM lO to ;o lO
* • \ • lOOlOOOCMt^CM^ •H M ,H lilt
to 00 to 00 01 o >H *H to to
P“\ CM \ •P
p^ p—' CD -P CM -P -p O w -P -P N_pw o (Q lO to G C to O 4
•H -H X. O CM CD IQ <P -P 1 10 1 1
1 « y o o IH rH
lO 1
“o M 1
O >
+
> <»>/ •N. ^
+> O TS
03 w
t +
CB w o CM 03
to to to lO to tJ* ;0
• • "X • • COpH^OHOH'^'CMOI iH iH
1 1 1 1 1
CM IS CM l> o c:i rH iH to 10
■P CM w »—N CM C H-> P -P •HO CM CM
^ pp^ CD rH HJ 4J to w w w C
CD ED P -H O O 1 CD O U 0) to
lO O 1
7
o ^ 1
<
n)
1 o >
1
+J > >10 w
1 ^ o
> (B
rH O tp to CM ^
• 4 • • NCMINCMOO^-HOO 'i* iH t 1 1 1 1
iH o H to 01 O (H (H CM to
P CM CM ^ p-' P P
CD P p“> o to +i o W
ww to 03 C C \ 0
•rt -H P O CD CD 1 to
to ® 1 O CM
to 1
1 o ^ 1
CD I
0. 3 O a 1 ^
CM to lO 1
LU.
I
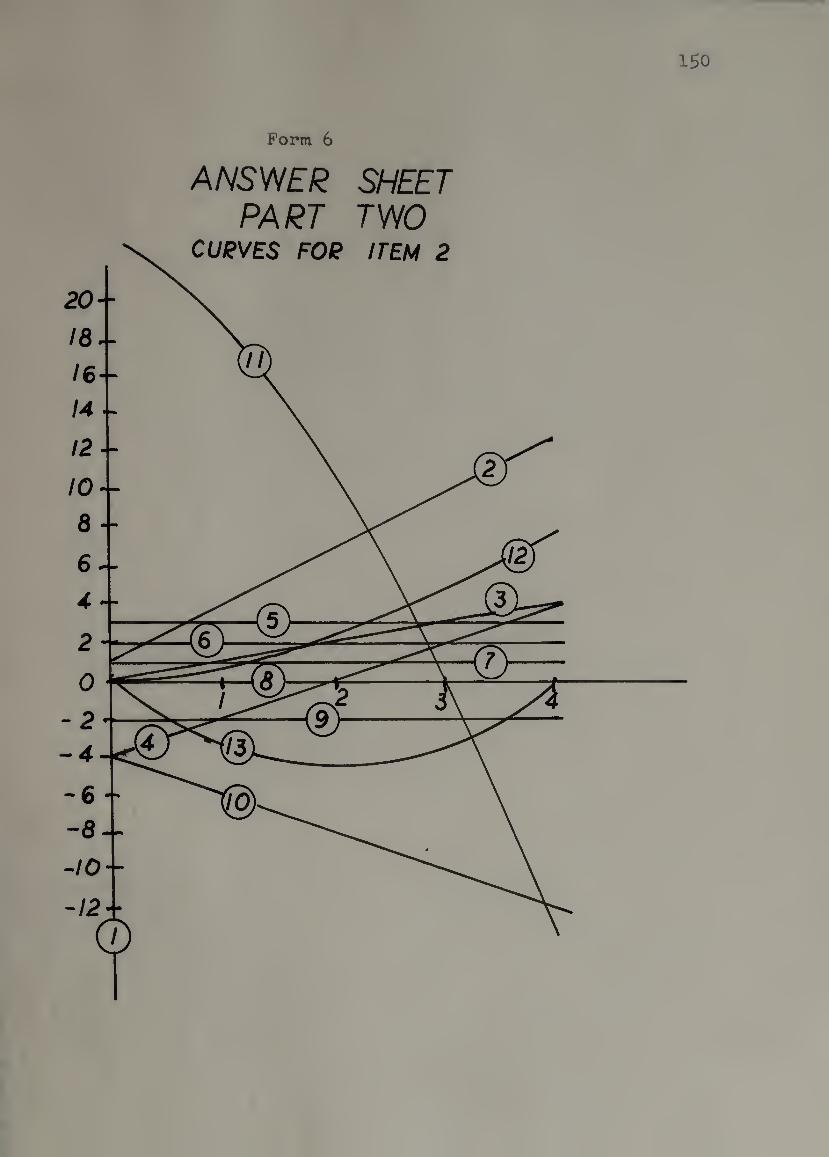
20
18
16
14
12
10
8
6
4
2
0
-2 -4
'6 -8
-1C
150
Form 6
ANSY/ER SHEET PART TY/0
CURVES FOR ITEM 2
JO

151
Pom 7
ANSWER SHEET PART THREE
C UeVES FOR ITEM 3
Y

ST
UD
EN
T
RE
SPO
NSE
FOR
M
152
UJ
CD
::d
04 o LU
04 UJ
i
Ul
§ <
Uj
I K.
I
<M
VO «M
\n Oj
«\i
ro <M
CVJ <M
<M
Ul K
§
^ fO ^ S Uj VJ K Vu
>.
•J
<
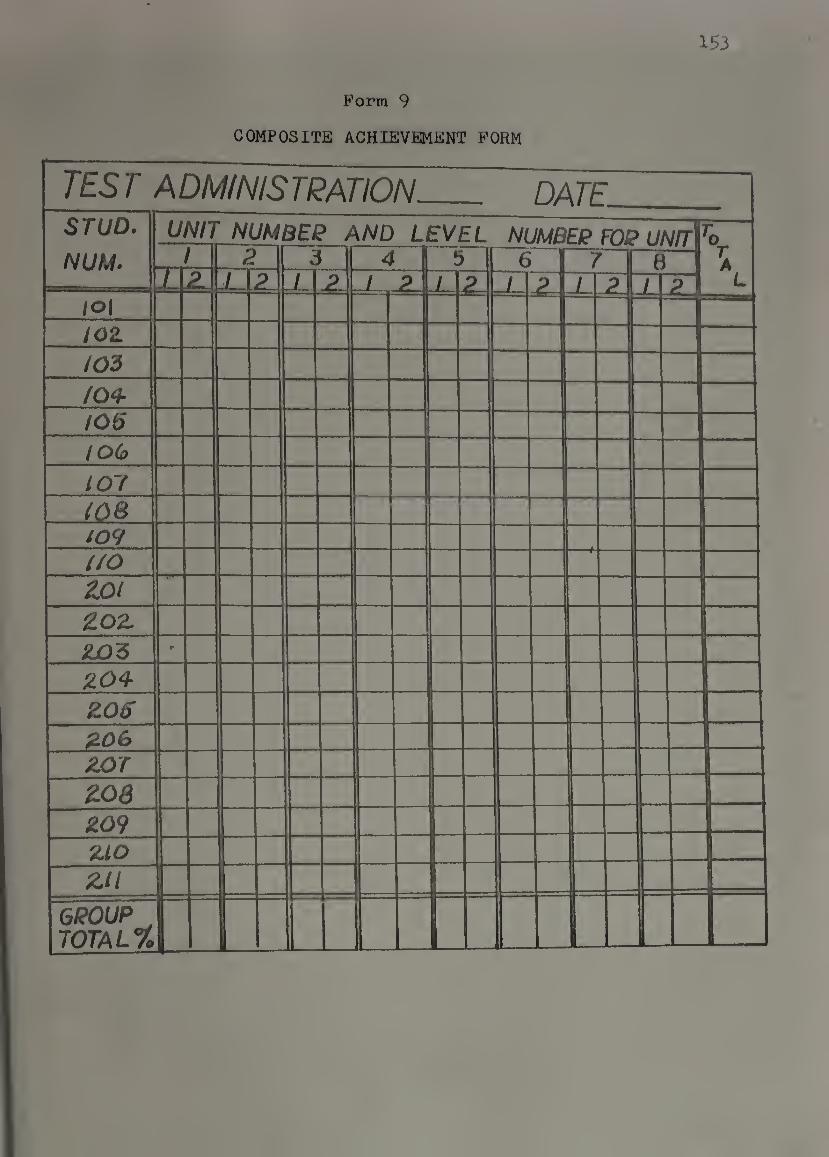
153
Form 9
COMPOSITE ACHIEVEMENT FORM
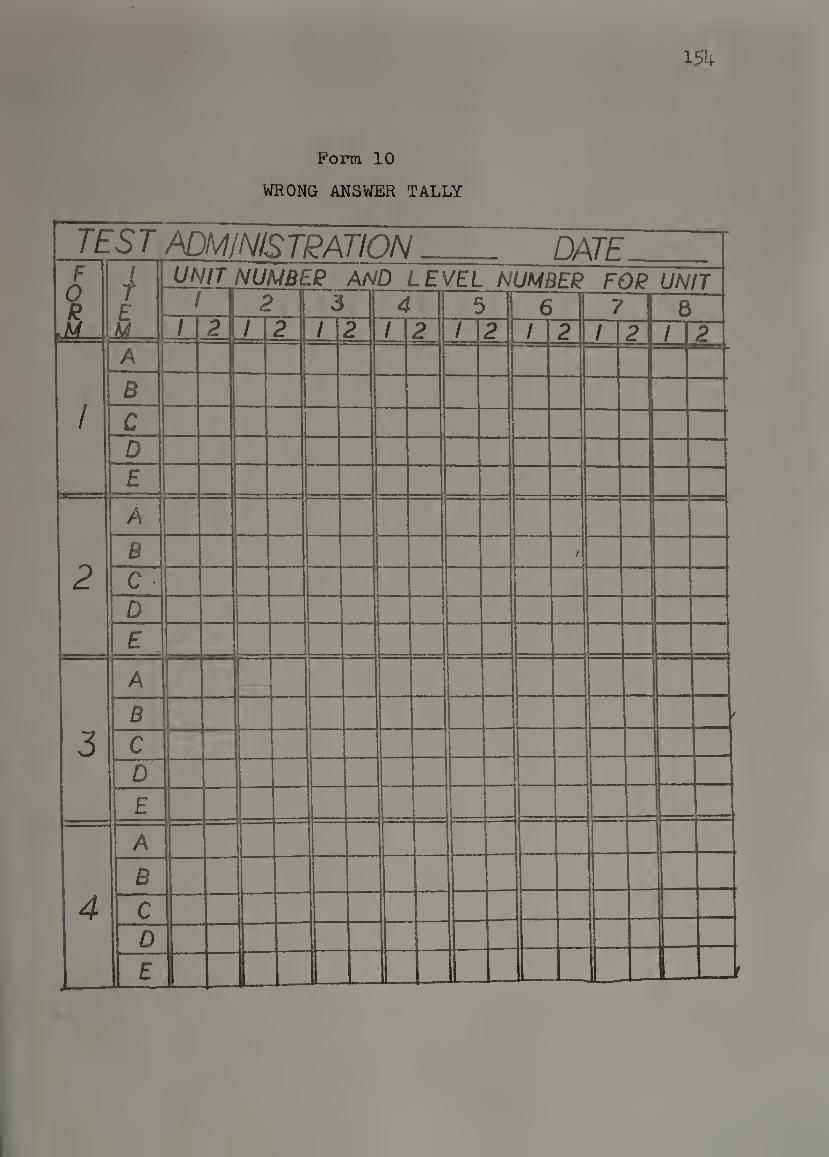
154
Form 10
WRONG ANSWER TALLY
TEST ADM/NISTPATION_ DATE F i UNIT NUMBEP AND LEVEL NUNBER FOR UNIT f
E 1 \ 2 3 4 5 6 7 8
M 1 21 1 2 / 2 1 2 / 2 / 2 1 2 / 2 i A
/ B
c 1
D E
—
A : ■
B j /
2 C ^ !
D E ^ —i
_
A ! i
B
3 C D
£ I
A
a
4 c D
£ L
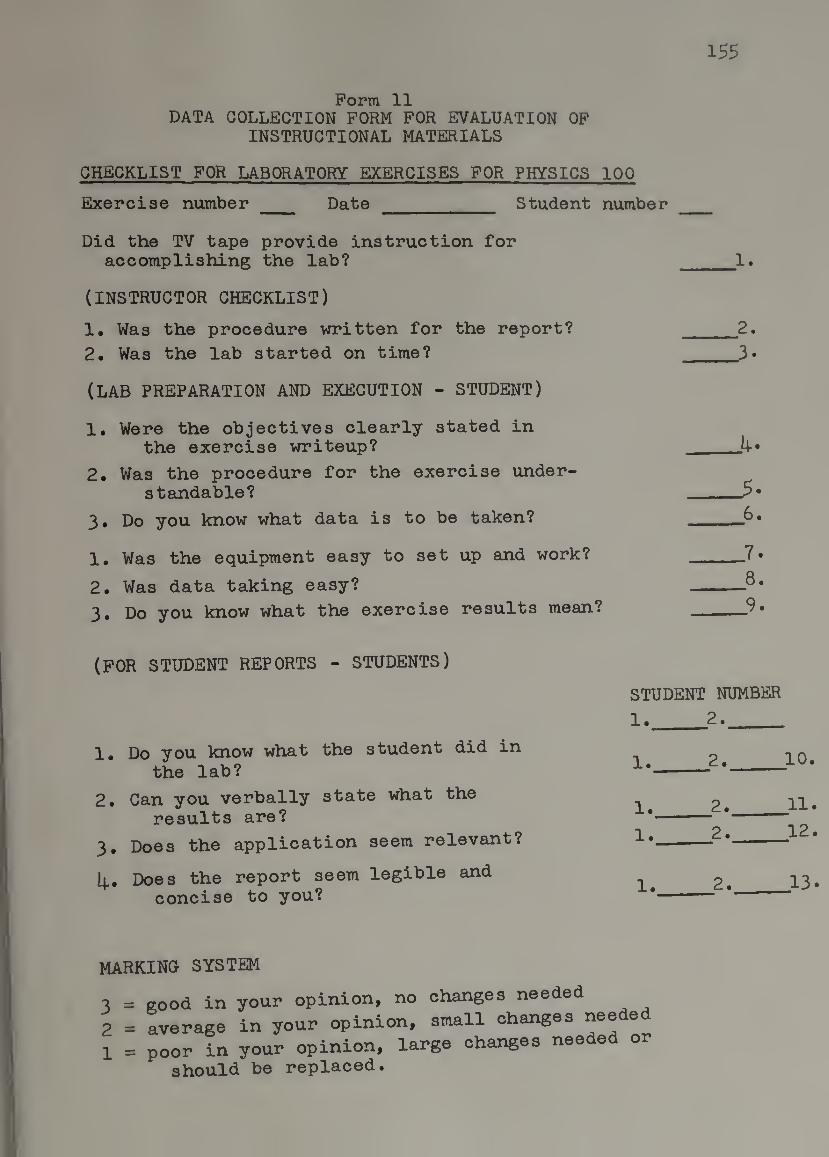
Form 11 DATA COLLECTION FORM FOR EVALUATION OF
INSTRUCTIONAL MATERIALS
CHECKLIST FOR LABORATORY EXERCISES FOR PHYSICS 100
Exercise number _ Date _ Student number _
Did the TV tape provide instruction for accomplishing the lab? _^1.
(INSTRUCTOR CHECKLIST)
1. Was the procedure written for the report? _2* 2, Was the lab started on time? _3*
(LAB PREPARATION AND EXECUTION - STUDENT)
1. Were the objectives clearly stated in the exercise writeup? _.4*
2. Was the procedure for the exercise under¬ standable? _
3. Do you know what data is to be taken? _6.
1. Was the equipment easy to set up and work? _7*
2. Was data taking easy? -^3.
3, Do you know what the exercise results mean?
(FOR STUDENT REPORTS - STUDENTS)
1, Do you know what the student did in the lab?
2. Can you verbally state what the results are?
3, Does the application seem relevant?
4. Does the report seem legible and concise to you?
STUDENT NUMBER
1._^2._ 1._2._^10
1._^2.. 1._^2.,
1._^2.
MARKING SYSTEM
3 2 1
Rood in your opinion, no changes needed average in your opinion, small changes needed poor in your opinion, large changes needed or
should be replaced.
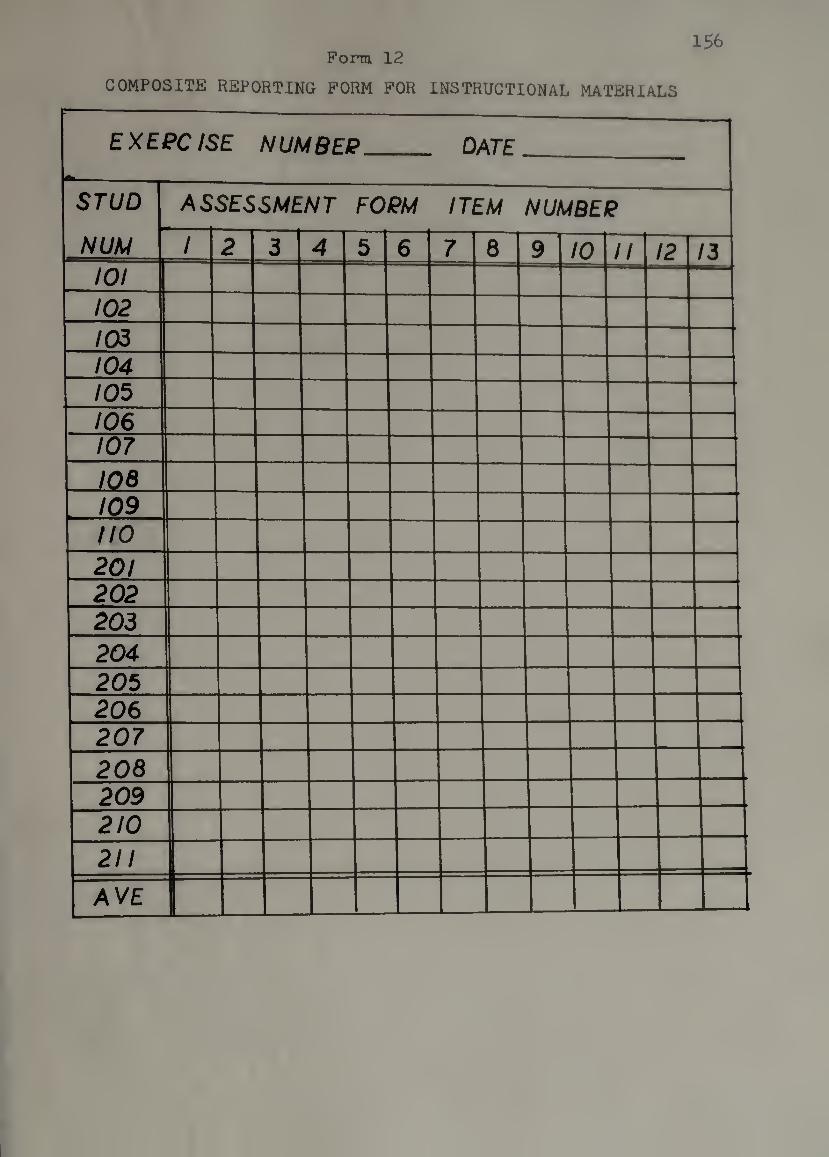
Pom 12 156
COMPOSITE REPORTING FORM FOR INSTRUCTIONAL MATERIALS
EXEPCISE NUMBEP .. . DATE
STUD AS, SESSMENT FORM ITEM NUMBER
NUM / 2 3 4 5 6 7 8 9 10 II 12 13 101 102 103 104 105 106 107 loe 109 no 201 202 203 204 205 206 207 208 209 210
211 1 AVE 1
157
%
APPENDIX II
This appendix contains actual data reported
on content objectives during the operation of the
initial design. The reports are presented in the
time sequence they were actually prepared. Each
set contains two achievement summaries and a
wrong answer tally.

158
Form 13 Data reported to group of students
on the first test administration. The group achievement summary for the group of students
TEST ADMINISTRATION L DATE P/PP 1
STUD.
NUM. UNIT NUMBEe AND LEVEL NUMBER FOP UNIT 0
^
r 1 2 3 4 1 5 6 1 7 ■ 6
/ 2 1 p / ? J..2. / ? / ? 1 P / p 101 X X X X X X X X 1 X X 10 /oz X X X X X 1 5 /03 X X X X X X X 7 /04- X X X X X X 6
105 X X X X 4
I06> X X X X X X 6 107 X X X X X X X X X X X II (66 X X X X X X X X X X X II 1
109 X X X X X X X X X X to 1(0 X X X X X 5 ZDi X X X X X 5
ZOZ. X X X X X X X 7
ZOZ X X X X X X 6 Z04- X X X 1 X 4 ZOS X X X X X X 6 Z06 X X X X X X X X 8 ZOT X X X X X 5
zoa X X X X X X
Z09 X X X X X 5
ZIO —
f zil X X X X 1 4
QROUP^ TOTAL% e
75 E 50 70 ► ^0 35 20 bo 25 25 45 10 20 10
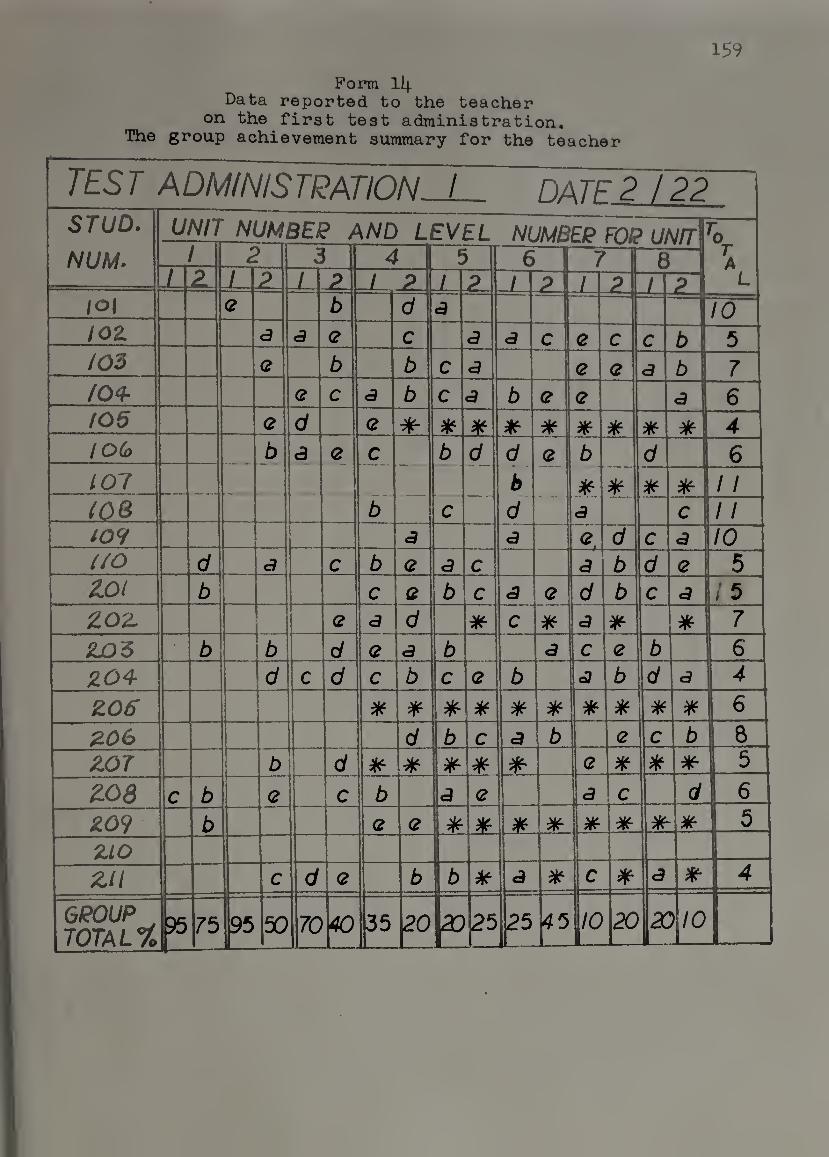
159
Pom 14 Data reported to the teacher
on the first test administration. The group achievement summary for the teacher
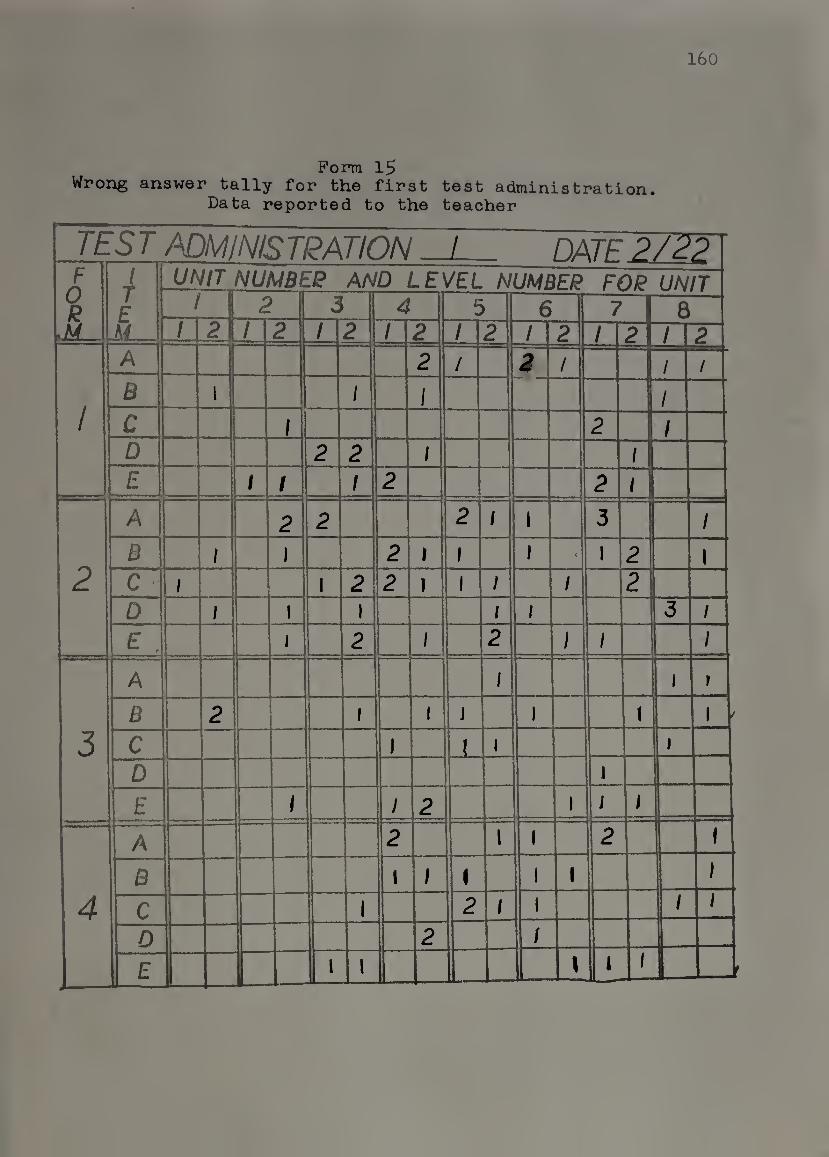
160
Pom 15 Wrong answer tally for the first test administration.
Data reported to the teacher
TEST ADMINISTRATION / DATE 2/22 F i UNIT NUMB IP AND LEVEL NUMBER FOR UNIT r
E 1 H 2 5 4 5 6 7 6 .M M / 21 1 2 1 2 / 2 / 2 1 2 1 2 / 2
A 2 / 3 1 / /
1 B l 1 1 / c 1 2 / D 2 2 1 / £ 1 1 1 2 2 i
A 2 2 2 1 1 3 / a 1 2 1 1 1 t I 2 1
2 C 1 I 2 2 1 1 J 1 2
D / 1 1 i t 3 / E . 1 2 / 2 I / /
A 1 1 F
a 2 f I J 1 ! 1 ^
3 c 1 ! 1 J D I
E i / 2 1 i /
A 2 1 ( 2 1
a 1 ( • 1 1 I
4 c 1 2 1 1 / 1
D 2 f
£ L 1 I L \ 1 1 L
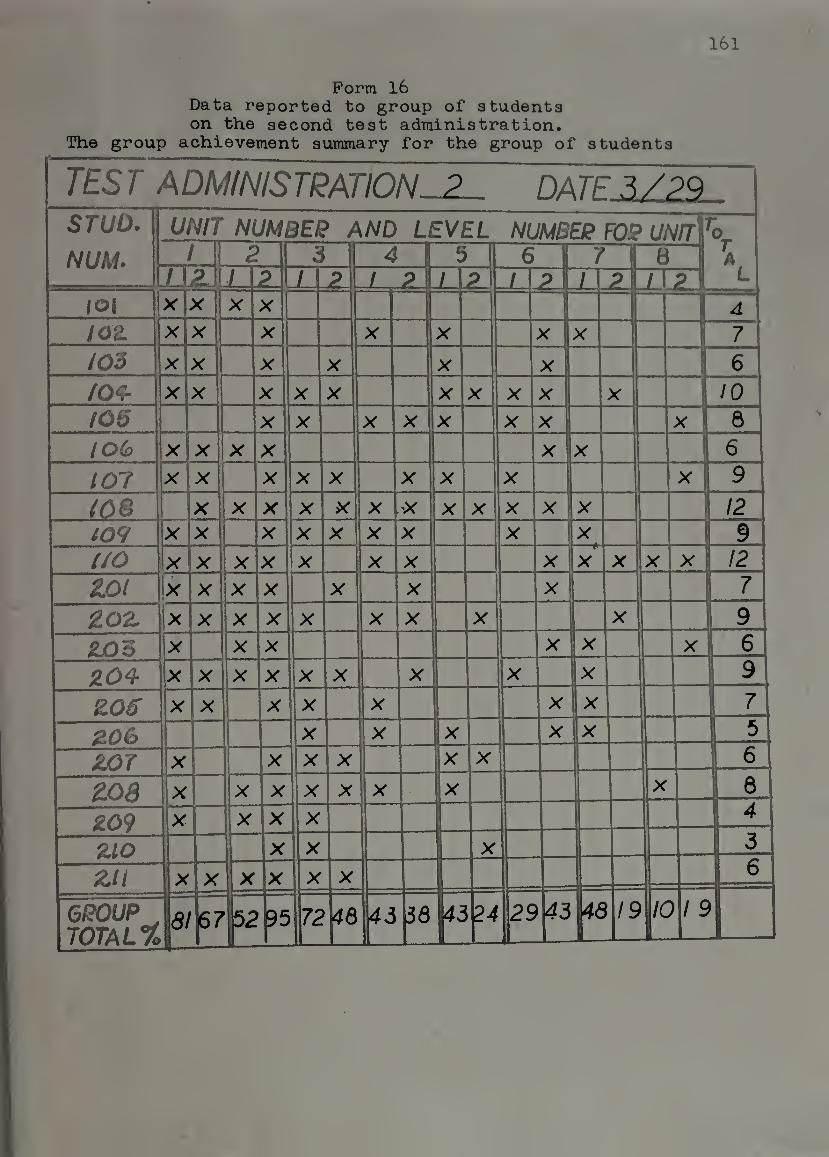
I6l
Form l6 Data reported to group of students on the second test administration.
The group achievement summary for the group of students
TEST ADMINISTRATION^^ DATF 3/PQ STUD.
NUM. UNIT NUMBEB AND LEVEL NUMBEB FOP UNIT
1~1
lOZ 103 /04-
106 I06> 107
I/O
ZOZ ZjOB X
Z06
ZOT Z08 Z09 ZIO
GPOUP^ TOTAL%

162
Fom 17 Data reported to the teacher
on the second test administration. The group achievement summary for the teacher
TEST ADMINISTRATIONS DATF 3/PQ STUD.
NUM.
/o|
UNIT NUMBEJ^ and LEVEL NUMBER FOP UNItVo.
L L
b \d 2 /
6
loz 103 fO^
105 ioo> 107
(OS 107
d
c a d c d
a_|d ~d
b <3
<5 10 6
d 12
(/O b c 12
ZOl c a <?
Z07L
SU05 a c b \d e 2 ;204 a \2
Z06 zoe
ZjOT
Z06 Z09 zio zu
Q
b e b b
^ d V] d
b ^
c \\d
b d ^\\<3
iK-ib
OROUP TOTAL %
67 52 95 72 48 3B8 45 24 45 t!
/9 /O / 9
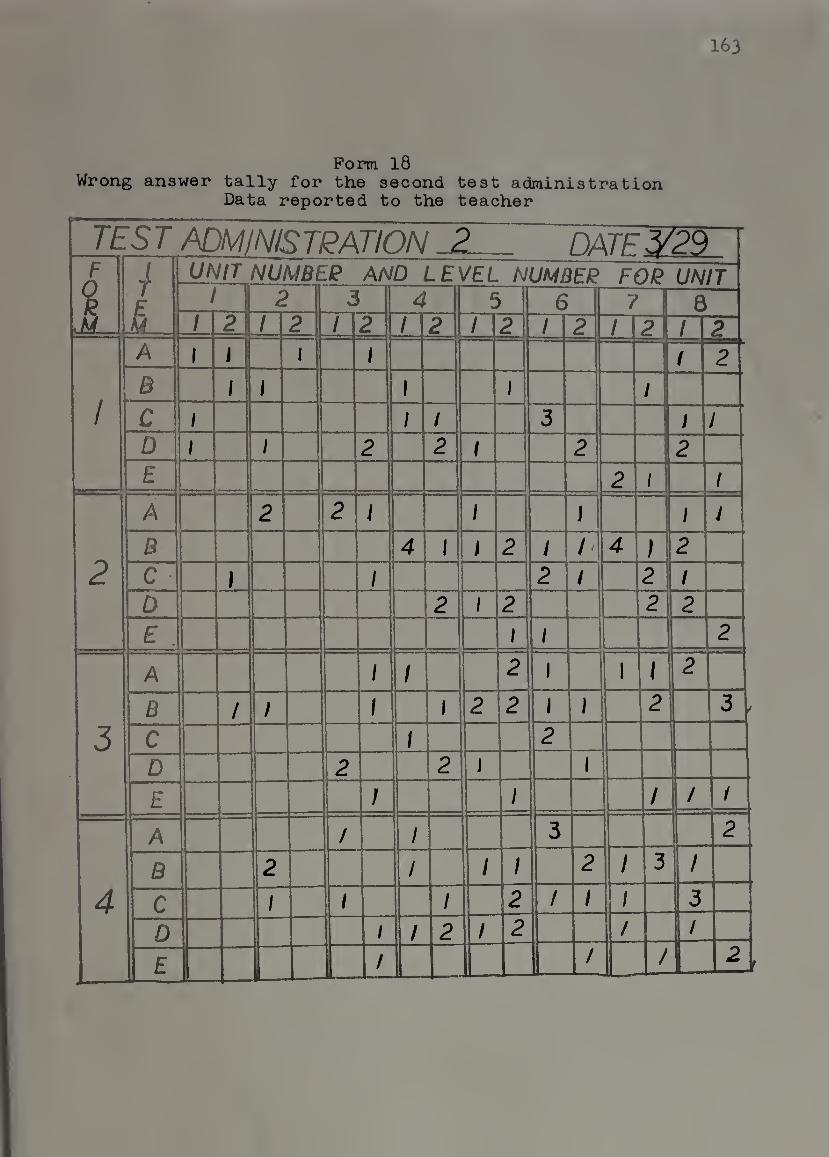
163
Pom 18 Wrong answer tally for the second test administration
Data reported to the teacher
F I UNIT NUMBEP AND LEVEL NUMBER FOP UNIT 1 1 2 3 4 5 6 7 ll 8
/ 2\ 1 2 / 2 / 2 / 2 1 2 / 2 / 2
1
A 1 1 1 i =3S ii
2 B 1 1 1 1 / c / / i 3 / / D 1 1 2 2 1 2 2 E 2 - 1
2
A 2 2 J J J i i
B 4 1 i 2 / h 4 1 2 C I 1 2 i 2 / D 2 1 2 2 2 E . 1 / 2
5
A 1 / 2 1 1 1 2
B / 1 t 1 2 2 1 1 2 3
C 1 2
D 2 2 J 1
E / 1 1 / 1
4
A / 1 3 2
a 2 1 / J 2 1 3 /
c 1 1 1 2 / 1 1 3
D / / 2 / 2 / /
E / f 1 / L 2
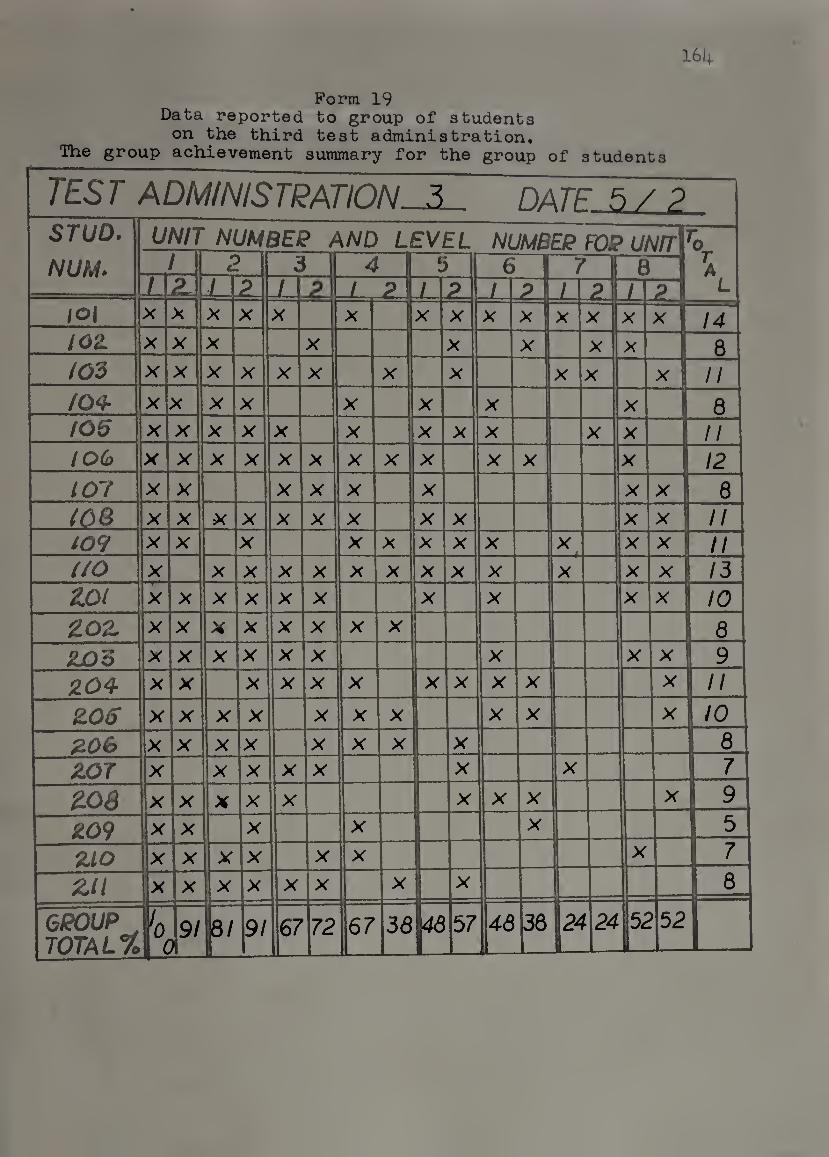
164
Form 19 Data reported to group of students
on the third test administration. The group achievement summary for the group of students
TEST ADMINISTRATION 3 DATF 5/ ?
STUD.
NUM. UNIT NUMBER AND LEVEL NUMBEB FOP UNIT
\ 1 2 3 5 6 1 7 6
1 2. 1 p / p 1 p / p / P / p IO\ X X X X X X X X X X 1 X X 1 X X 14 lOZ X X X X X
^ 1 X X ft
/03 X X X X X X X X X X X II /O^ X X X X X X X X 8 f05 X X X X X X X X X X X II IOi> X X X X X X X X X X X 12
107 X X X X X X X X 8 (68 X X X X X X X X X X X II t09 X X X X X X X X X X X 11 (iO X X X X X X X X X X X X X 15 ZjDI X X X X X X X X iX X 10
Z02. X X X X X X X X 5 ZjOS X X X X X X X X X 9
X X X X X X X X X X X II
Z06 X X X X X X X X X X 10
Z06 X X X X X X X X 1 ^ ZJOJ X X X X X X X 1 7
toe X X X X X X X X X 9
Z09 X X X X X 5
zio X X X X X X 1 X 7
zil X X X X X X X X 8
GROUP^ TOTAL% k
91 8/ 91 67 72 67 58 r
57 46 38 24 '■24 152 >52
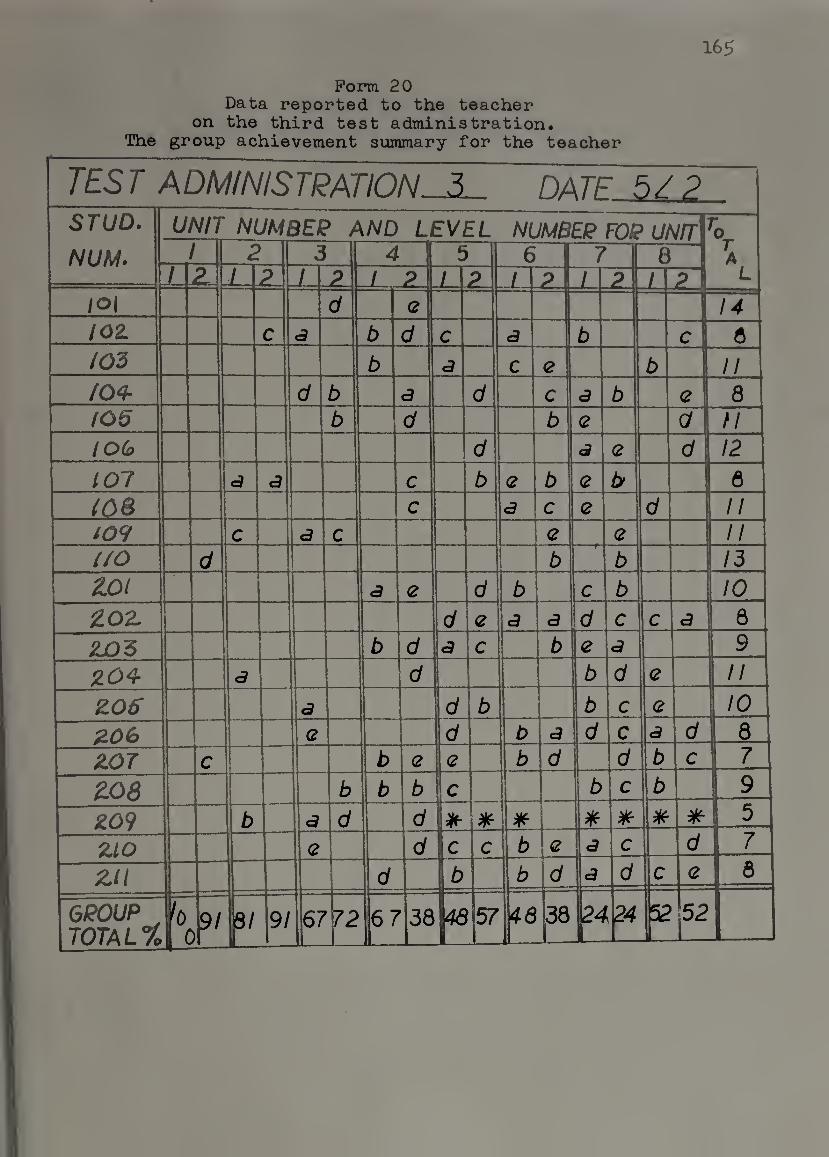
165
Form 20 Data reported to the teacher
on the third test administration. The group achievement summary for the teacher
TEST ADMINISTRATION 3 DATF 5/P
STUD. 1 UNIT NUMBER AND LEVEL NUMBER FOR UNIT
L NUM. ^ 1 2 3 5 6 1 7 6 \R. / P 1 ? JLP / ? / ? 1 ? / P
lOI d 2 14 lOZ c a b d c a b c j 6 (03 b a c 2 b II /0<?- d b a d C a b 2 8 (05 b d b 2 a // (Od) d a 2 d 12
107 1
a c b 2 b 2 b 8 (D8 c a c 2 d II (09 c a c 2 2 II (/O \d b b 13 aoi a 2 d b C b 10 ZOZ d 2 a a d c c a 8
Zj05 b d a C b 2 a 9 zo^ <3 d b d 2 II
Z06 a d b b c 2 10 Z0(> Q d b a d c a d 8 ZOT \c b 2 2 b d d b c 7
Z08 b b b C b c b 9
Z09 b a d d 5
ZIO 2 d |c c b 2 a c d 7
Zii d \b b d a d c 2 8
GROUP^ i totalXi "or
91 67 72 67 -
38 48 57 46 38 t
.24 52 .
52 n 1
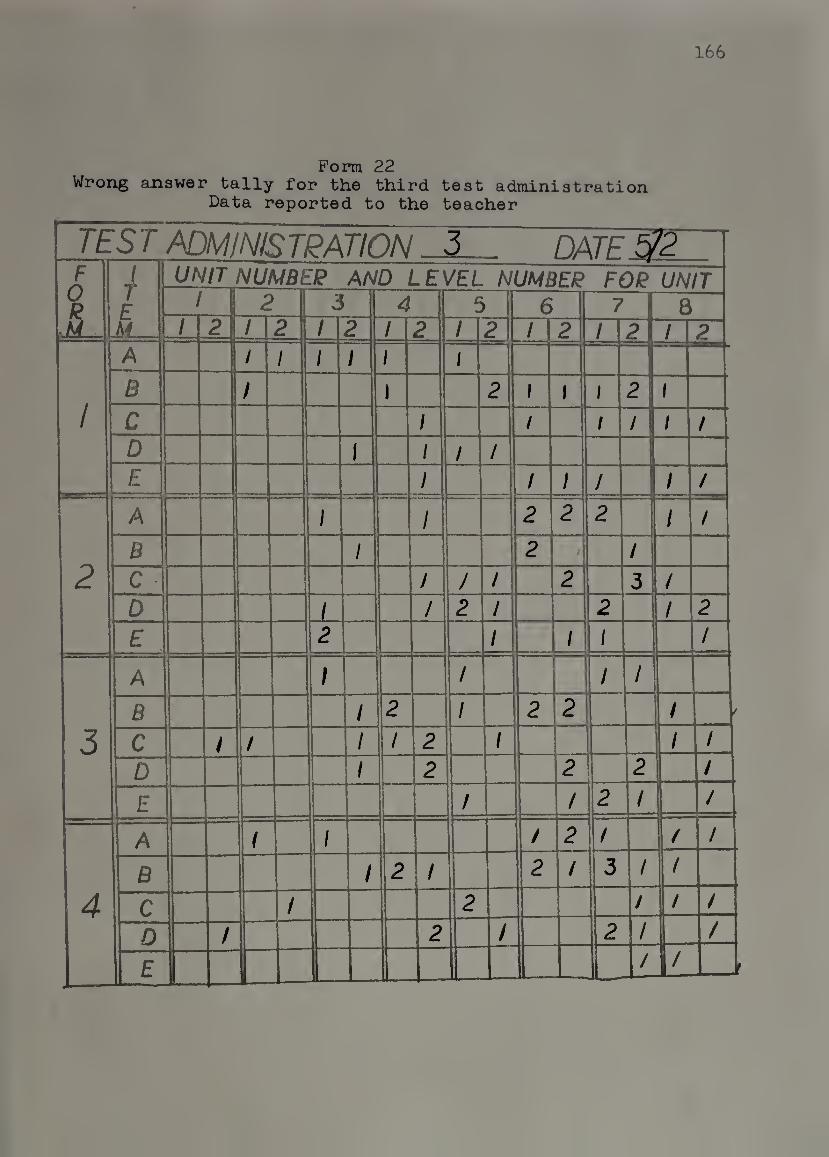
166
Pom 22 Wrong answer tally for the third test administration
Data reported to the teacher
TES T ADMINISTRATION DATE^ F i UNIT NUMBER AND LEVEL NUMBER FOR UNIT
r E 1 2 3 4 5 6 7 8 k 1 2 1 2 / 2 1 2 / 2 / 2 / 2 / 2
1
A l 1 / 1 1 1 B 1 1 2 1 ) 1 2 1
c 1 / / / / / D 1 1 1 / E 1 / / / ; /
2
A 1 1 2 2 2 / /
B / 2 « / C J J ; 2 3 / D 1 / 2 / 2 / 2
E 2 / / 1 /
5
A 1 / / /
B 1 2 / 2 2 /
C / / 1 / 2 / / /
D 1 2 2 2 /
£ / / 2 / /
4
.
A / / / 2 / / /
a 1 2 > 2 / 3 / /
c / 2 / / /
D / 2 / 2 / /
E / V
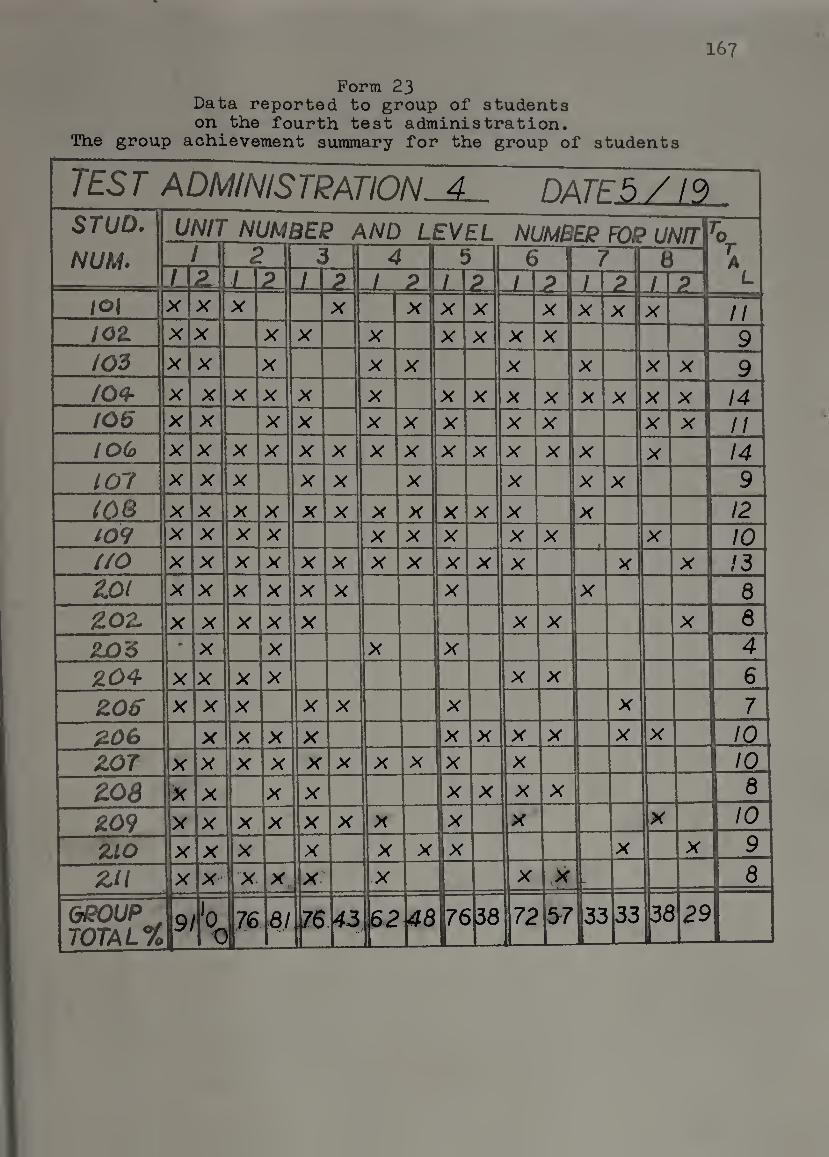
167
Form 23 Data reported to group of students on the fourth test administration.
The group achievement summary for the group of students

168
Form 24. Data reported to the teacher
on the fourth test administration. The group achievement summary for the teacher
TEST ADMINISTRATIONDATF 5/ IQ STUD. UNIT NUMBEe AND LEVEL NUMBEJ? FOP UNItVo. NUM. 1 2 3 4 5 6 7 1 6
T A
L 1 2L 1 ? / ? 1 ? / ? / P\ / P ;oi b b d d e 1 n lOZ d b e e d c I 9 103 c c d c b c b 9 IO<l- b b 14 105 <3 b e a n tOG bl C 14 107 b b d e b c / e 9 (08 e c t ̂ b 12 i09 a a d e d c 1 0 ao a b' r
•s 13 ZDl a b c b a b < : e 8 ZOZ. d c a a d e b c « 8
ZOZ Q d b a a a c d b d ( : e 4 Z04 d b Q c d b b e N d 6 ZOS b a a d a b e c a 7
^06 Q d c e d Q 10
ZOT a Q a e ( 2 a 10
Z08 —
b d a b a c a b 8
Z09 d ~-i 10
zio <3 b a C c d b 9
Zll b c d b c d b 8
GROUP^^ TOTAL %
91 >0 0 E 81 76 62 46 76 38 72 57 33 33! 33??
/

169
Form 25 Wrong answer tally for the fourth test administration
Data reported to the teacher
TEST ADMINISTPATION 4 DATF 5/19 i UNIT NUMBEP AND LEVEL NUMBER c/Az/r T F 1 1 2 5 4 5 6 7 8 mtm M / 21 1 2 1 2 / 2 / F / 2 / 2 / 2 A / / / / B 1 2 1 1 2 / / 1
/ c 2 / / 2 D / / 1 / / / E / / 2
A 2 1 / / / B 2 / f 1 / 2' 2
2 C / / / / / 2 D 1 1 / / E . / / / 2
A 1 1 / /
B 2 1 / 2 / /
3 C 2 1 / / / D 2 / 2
E / 1 / / /
A / / 3 1 / 2 2 /
B 1 2 / 2 / /
4 C 1 1 / 1 ' /
0 / 1 2 / / 2 1 ^ E ' . . t / / / / h- 2

170
Appendix III
Actual decisions made from the reported
data are briefly discussed in this appendix.
Data reported on the content objectives for
the first test administration are used as an
example. Data used in making decisions on
instructional materials are identified, and
typical decisions on revisions are stated.
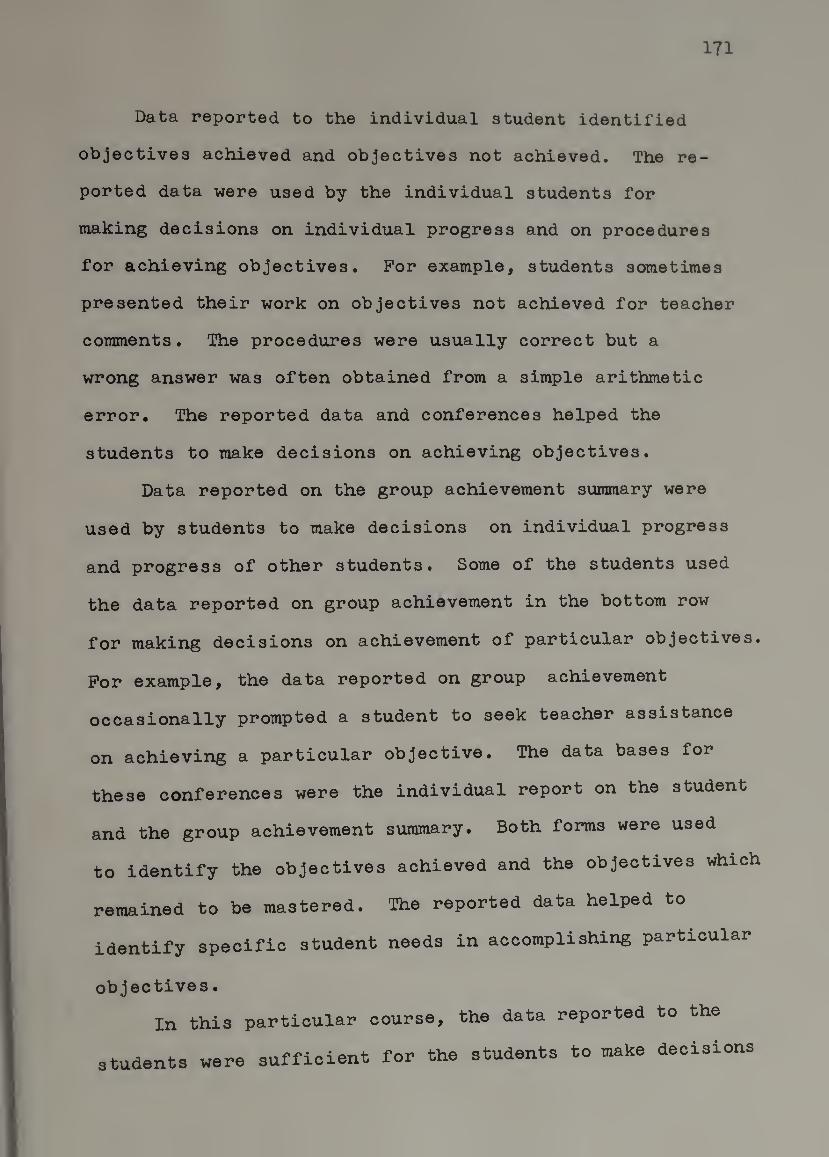
171
Data reported to the individual student identified
objectives achieved and objectives not achieved. The re¬
ported data were used by the individual students for
making decisions on individual progress and on procedures
for achieving objectives. For example, students sometimes
presented their work on objectives not achieved for teacher
comments. The procedures were usually correct but a
wrong answer was often obtained from a simple arithmetic
error. The reported data and conferences helped the
students to make decisions on achieving objectives.
Data reported on the group achievement summary were
used by students to make decisions on individual progress
and progress of other students. Some of the students used
the data reported on group achievement in the bottom row
for making decisions on achievement of particular objectives.
For example, the data reported on group achievement
occasionally prompted a student to seek teacher assistance
on achieving a particular objective. The data bases for
these conferences were the individual report on the student
and the group achievement summary. Both forms were used
to identify the objectives achieved and the objectives which
remained to be mastered. The reported data helped to
identify specific student needs in accomplishing particular
objectives.
In this particular course, the data reported to the
sufficient for the students to make decisions students were
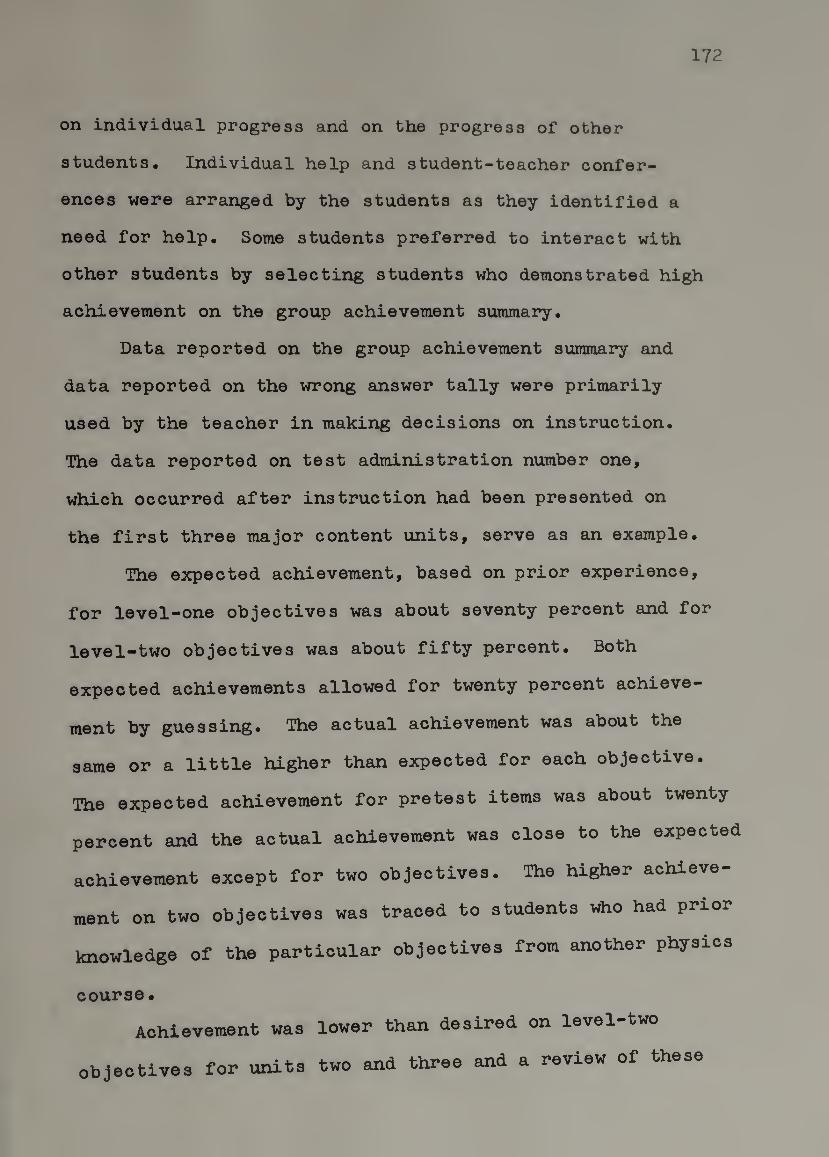
172
on individual progress and on the progress of other
students. Individual help and student-teacher confer¬
ences were arranged by the students as they identified a
need for help. Some students preferred to interact with
other students by selecting students who demonstrated high
achievement on the group achievement summary.
Data reported on the group achievement summary and
data reported on the wrong answer tally were primarily
used by the teacher in making decisions on instruction.
The data reported on test administration number one,
which occurred after instruction had been presented on
the first three major content units, serve as an example.
The expected achievement, based on prior experience,
for level-one objectives was about seventy percent and for
level-two objectives was about fifty percent. Both
expected achievements allowed for twenty percent achieve¬
ment by guessing. The actual achievement was about the
same or a little higher than expected for each objective.
The expected achievement for pretest items was about twenty
percent and the actual achievement was close to the expected
achievement except for two objectives. The higher achieve¬
ment on two objectives was traced to students who had prior
knowledge of the particular objectives from another physics
course.
Achievement was lower than desired on level-two
objectives for units two and three and a review of these

two objectives was tentatively scheduled for the next
class meeting. The group totals from the group achieve¬
ment summary were compared with the data reported on the
173
wrong answer tally before a final decision was made.
The data reported on the wrong answer tally identified
the number of students who selected a particular wrong
answer. In this particular course, about five students
used each test form; hence, the highest tally would be
five. Unusually high tallies were specified by the teacher
as three or higher because these tallies revealed that the
majority of students using a test form selected a particular
wrong answer.
Unusually high tallies may appear on pretest items,
post test items, or items testing retention. High tallies
which appear on pretest items may be due to a confusing
test question, a misleading wrong answer, or a miscon¬
ception on prior knowledge. High tallies which appear on
post test items may be due to confusing instruction or any
of the reasons given for pretest items. High tallies on
items testing retention may bo due to confusing instruction
during a review.
Two high tallies appeared on the first wrong answer
tally and both tallies appeared on test form number two for
level-one objectives. Both tallies were on pretest items,
units seven and eight; hence, the tallies were noted as
possible misconceptions on prior knowledge. The questions

171;
and answers for both high tallies were checked and noted
as points for emphasis in instruction on units seven
and eight. In addition, the high tallies would be com¬
pared with high tallies on the next wrong answer tally.
If the same high tallies appeared again the teacher would
presume misleading wrong answers and/or confusing test
questions.
The other reported tallies tend to be distributed
indicating that wrong answers were selected on a fairly
random basis. The tallies for level-two items on units
two and three were of particular interest. The data re¬
ported for these two objectives indicated that either test
forms three and four had less difficult questions or the
students using test forms one and two were confused. The
teacher checked the test items and found the items to be
similar. The decision to review these two topics in class
was confirmed by the data reported on the wrong answer
tally.
The reported data were examined and decisions were
made in about fifteen minutes. The data helped the
teacher to make specific discussions on instruction for
review and for future emphasis. In addition, the reported
data helped the teacher make decisions on the validity of
post test items and on the appeal of available answers to
students for pretest items.

175
Data reported on TV tapes were overall student
assessments of the TV tape. Students who desired revisions
in a tape, as indicated by a low value for assessment,
were polled to determine specific revisions desired. The
suggested revisions were submitted to group discussion
and final decisions on revisions were made by the majority
of the group. The reported data were used to identify that
revisions were needed and specific revisions were deter¬
mined by class discussion.
The data reported on the laboratory exercise, items
four through nine, were similarly used to specify revisions
to the writeups for labs. Revisions were suggested by
students who gave low assessments to the items and the
final decisions on revisions were made by the majority of
the students through class discussion. The remaining
reported data, which was about one-half of the reported
data, were not used in making decisions on instructional
materials. Typical revisions on TV tapes were focused on
relating the TV tapes closer to the course objectives and
to the labs. A typical revision to a lab writeup was adding a
short teacher demonstration which illustrated data taking
for the lab which followed. In some instances, more
specifically stated objectives were desired in the writeups.

176
BIBLIOGRAPHY
Ahmann, J.S. Aspects of curriculum evaluation; a synopsis. AIJIA monograph series on curriculum evaluation. No. 1, Chicago: Rand McNally, 196?, bI|.-90.
Airasian, P.W. Designing summative evaluation studies at the local level. In W.J. Popham (Ed.) Evaluation in education. Berkeley, Calif.; Me Cut chan, 197^4-•
Allan, R.G. Writing behavioral ob.jectives and criterion tests. Holyoke, Mass.; Scott Education Division, 1972.
Allan, R.G. Learning systems development for the classroom teacher. Amherst, Mass.; Doctoral Dissertation Univ. of Mass., 1973*
Allen, D.W. and Christensen, P.R. Using time, space and people, effectively. In Allen, D.W. and Hecht, S.C. (Eds.) Controversies in education. Philadelphia, Pa.; S aunde rs, 1974*
American Association for the Advancement of Science. Commission on Science Education. An eval^tion model and its applications. Washington, D.C.;The Association^ 196^.
Anderson, H.O. ReadlnRs in science education for the secondary school« New York; Macmillan, 1969.
Atkin, J.M. Science
Behavioral objectives in curriculum design. Teacher. 35, No. 5, May 1968, 27-30.
Baker, E.L. Formative evaluation of instruction. W.J. Popham (Ed.), Evaluation in education. Calif.: McCutchan, TTHiT
In Berkeley,
« T A r»T*nf»tical guide for evaluation. Project ^'"^‘'^aiuakom'^Tlnrsor.^Conn.: Capitol Region EdSfeon
Council, 1973•
«.n. Evaluation in social studies.. Washington: Nakonal Council for Se Sooiai Stildies, 1965-
Bloom, B.S. Learning for mastery. Educational Comment.
1; No. 2, 1968.
177
Bloom, B.S., Englehart, M.D,, Purst, E.J., Hill, W.H. and Krathwohl, D,R, Taxonomy of educational ob.lectivea; Handbook I, Cognitive domain. New York: David McKay, 1<)56. -
Bloom, B.S. The role of educational aciencee in curriculum development. c!hicago: University of Chicago, I96I4..
Bowers, W.A. A one-semester introductory physics course. COMUSE Conference proceedings. College Park, Md.: Commission on College Physics, 1970, ol-85»
Bowers, W.A. Bilateral objectives with evaluative redesign support. Fitchburg, Mass.; Fitchburg State College, 1975.
Brown, F.G. Measurement and evaluation. Itasca, Ill.; Peacock, 1971»
Carmody, J. Some controversial issues in testing. In Allen, D.W. and Hecht, J.C. Controversies in education. Philadelphia, Pa.; Saunders, 197i4-» ~
Coffing, R., Hutchinson, T., Thomas, J. and Allan, R. Self-instructional module for learning the Hutchinson method of operationalizing a goal or intent. Amherst; University o^ Massachusetts, 1971•
Cronbach, L.J. Course improvement through evaluation. Teachers college record. V 614., May 1963, 672-683*
Eisner, E. Instructional and expressive objectives; their formulation and use in curriculum, • AERA monograph series on curriculum development. No. 3• Chicago; Rand McNally, 1969.
Gagne, R.M. Curriculum research and promotion of learning. AERA monograph series on curriculum evaluation. No. 1, Chicago: Rand McNally, 1967*
Glaser, R. Objectives on evaluation; an individualized system. Science education news. June 19o7, 1“3*
Glass, G. and Stanley, and psychology* Hall, l97^
J. Statistical methods in education Englewood Clifl^s, N.J.: Prentice-
Gorth, W.P. Comprehensive Achievement Monitoring: A bailee between program and pupil evaluation. In All » * and Hecht, J.C. (Eds.). Controversies in education. Philadelphia, Pa.: Saunders, 1974.
178
Gorth, W.P,, O'Reilly, R.P, and Pinaky, P,D. Comprehenalve Achievement Monitoring* Englewood Cliffs, N.J.: Educational Technology Publications, 197^.
Grobman, H. Evaluation activities of curriculum projects. AERA monograph aeries on curriculum evaluation. No. 2, Chicago; Rand McNally, 1967•
Gronlund, N.E. Stating behavioral objectives for classroom ins true tionT New York; J^acmillan, 1970.
Gronlund, N.E. Preparing criterion-referenced teats for classroom instruction. New York; Macmillan, 1^73*
Rambleton, R.K. Assessing student progress; A criterion- referenced measurement approach. In Allen, D.W. and Hecht, J.C. (Eds.) Controversies in education. Philadelphia, Pa.; Saunders, 197^»
Hammond, R.L. Evaluation at the local level. Tuscon, Ariz.; EPIC Evaluation Center, 1967.
Harris, C.W. Problems in measuring change. Madison, Wis.; University of Wisconsin Press,1967•
Harris, C.W., Alkin, M.C. and Popham, W.J. (Eds.). Problems in criterion-referenced measurement. CSE monograph series in evaluation. No. 3» Los Angeles; Center Tor the Study of Evaluation, University of
California, 1974*
Kibler, R.J., Barker, L.L. and Miles, D.T. Behavioral objectives and instruction. Boston; Allyn and Bacon,
iwn Kresh, E. An overview of the discrepancy model and a _re~
Tated case study'. Pittsburg, Pa.; Pittsburg Public
Schools, 1969•
Mager, R.P. Preparing instructional objectives. Belmont,
Calif.; Pearon, 1962.
Mager, R.P. Measuring instructional intent, or got a match? BeImont, Calif.: Pearon, iVYj5«
Millman, J. Criterion-referenced measurement. T.J. Popham (Ed.) Evaluation in education.
Calif.: 1974*
In Berkeley,
New England educational assessment project. assessment and evaluation procedures.
The Project, 1^66.
A guide to Providence, R.I.:
179
Pace, R.C. Evaluation perspectives Dec. i9^^r:-^-
CSE report No. 8.
Popham, W.J. Objectives and instruction in instructional objectives. A^A monograph series on curriculum evaluation. Chicago; Rand WlcNally, 1969.
Popham, W.J. Educational Evaluation. Englewood Cliffs, N.J.; Prentice-Hall, 197^.
Provus, M. Discrepancy evaluation model, Pittsburg, Pa.: Pittsburg Public Schools, 1^69.
Scriven, M. The methodology of evaluation in curriculum evaluation. AERA monograph series on curriculum evaluation. No. 1, Chicago; Rand McNally, 1967.
Scriven, M. Evaluation perspectives and procedures. In W.J. Popham (Ed.) Evaluation in education. Berkeley, Calif.; McCutchan, 197i|-»
Skinner, B.P. The technology of teaching. In Allen D.W. and Hecht, J.C. (Eds.) Controversies in education. Philadelphia; Saunders, 1974-•
Stake, R.E. Toward a technology for the evaluation of educational programs. AERA monograph series on curriculum evaluation, N"©. 1, Chicago; Rand McNally,
1967, 1-13.
Stake, R.E. The countenance of educational evaluation. Teachers college record. 68, 1967, 523-540•
Stufflebeam, D.L. Alternative approaches to educational evaluation; a self-study guide for educators. In W.J. Popham (Ed.), Evaluation in education, Berkeley,
Calif.; McCutchan, 1974> 95-l45*
Tyler, R.W. Basic principles of curriculum ^d instruction. Chicago; University of Chicago Press, iv50.
Tyler , R.W. Changing concepts of educational evaluation. AERA monograph series on curriculum evaluatj^oji. No. Chicago;' Rand McNally, 1967, i3-i9.
1,
Wilhehms, P.T. (Ed.). Evaluation as A.'^CD vearbook 1967. Washington, D.C.. ASCD, NhA,
iw: Wittrock, M.C. and Wiley,
Issues and problems. Winston, 1970*
D,E. The evaluation of instruction; New York; Holt, Rinehart and

180
Wolf, R.M. Data analysis and reporting considerations in evaluation. In W. J. Popham (Ed.) Valuation in education. Berkeley, Calif.: Me Cutchan, 1974.
Worthen, B.R. and Sanders, theory and practice.
J.R. Educational evaluation: Worthington, 0.: Jones, 1973.