Embed Size (px)
Citation preview
Formation and circulation of dense water in the Persian/Arabian Gulf
Stephen A. Swift and Amy S. BowerWoods Hole Oceanographic Institution, Woods Hole, Massachusetts, USA
Received 25 February 2002; revised 8 July 2002; accepted 10 July 2002; published 4 January 2003.
[1] The nature and circulation of water masses in the Persian/Arabian Gulf (hereinafterreferred to as the Gulf ) is investigated by examination of a historic database ofhydrographic observations. The densest water forms in winter at the northern end of theGulf rather than along the warmer southern and western coasts. With the exception ofsmall amounts of water directly above the seafloor, most water flowing out of the Gulfmixes across a density front that separates Gulf Deep Water within the Gulf from theIndian Ocean Surface Water (IOSW). Contrary to previous inferences, the seasonallyvariable incursion of IOSW into the Gulf peaks in late spring. This timing may be dueto seasonal changes in sea surface slope driven by variations in evaporation rate. Inorder to explain mooring results published elsewhere that show relatively smallseasonal changes in the volume flux through the Strait of Hormuz (hereinafter referredto as the Strait), we suggest that this flux is driven by the difference between thedensity of Gulf Deep Water in the interior of the basin and water at comparable depthsoutside the Gulf. This density difference varies less than 15% during the year. Highrates of vertical mixing in the Strait extend about 200 km westward in response totopographic constriction of tidal flows by islands and shoals. INDEX TERMS: 4219
Oceanography: General: Continental shelf processes; 4223 Oceanography: General: Descriptive and
regional oceanography; 4243 Oceanography: General: Marginal and semienclosed seas; 4283
Oceanography: General: Water masses; KEYWORDS: Persian/Arabian Gulf, Strait of Hormuz, water mass
formation, density gradients, seasonal variability, vertical mixing
Citation: Swift, S. A., and A. S. Bower, Formation and circulation of dense water in the Persian/Arabian Gulf, J. Geophys. Res.,
108(C1), 3004, doi:10.1029/2002JC001360, 2003.
1. Introduction
[2] High-salinity water flows out of the Persian/ArabianGulf (hereafter called the Gulf) and spreads at 200–350 mdepth within the Gulf of Oman in the northeastern IndianOcean [Rochford, 1964; Wyrtki, 1971; Qasim, 1982; Pre-mchand et al., 1986; Bower et al., 2000; Prasad et al.,2001]. The injection of Gulf overflow water affects thestability of the Indian Ocean thermocline and introducesoxygen-rich water at a depth characterized farther east byextreme oxygen-depletion due to decay of surface layerprimary production [Wyrtki, 1973; Olson et al., 1993]. Thedensity and thus the depth of Gulf overflow water isdetermined by its source characteristics as it flows throughthe Strait of Hormuz and by subsequent mixing processeson the continental shelf and slope off Oman and Iran [Boweret al., 2000].[3] The nature of the overflow water and dynamics of the
exchange with the Indian Ocean depend on the contrastbetween processes affecting water properties in the shallow,land-locked Gulf basin and in the deeper, unconfined west-ern Gulf of Oman. The Gulf, with an average depth of �35m and maximum depths of 110–160 m in current scouredchannels near islands, is connected to the western Gulf of
Oman through the Strait of Hormuz (hereafter, the Strait;Figure 1). Tectonic-driven subsidence deepened the seafloorlocally in the Strait to 200–300 m and produced a 70–95 mdeep trough along the Iranian side of the southern half of theGulf (Figure 2) [Ross et al., 1986]. The Strait and the basintrough are separated by a broad sill at about 86 m near55�300E in the western approaches to the Strait. A south-ward widening channel leads from the Strait south across aseries of sills (water depth of �110 m) and shallow basins tothe shelf edge [Seibold and Ulrich, 1970]. Although wateris deeper in the channel than in the Gulf, the narrow Strait ofHormuz restricts water exchange and isolates the Gulf fromwell-mixed water masses in the northern Indian Ocean.[4] The climate in the Gulf region is arid, resulting in an
excess of evaporation over precipitation plus river runoff.Although estimates of fresh water flux are quite variable,the following published values give a sense of the balance:evaporation rate 1.4 m/yr [Privett, 1959], river runoff 0.15–0.46 m/yr [Hartmann et al., 1971; Chao et al., 1992;Reynolds, 1993], and precipitation 0.07–0.1 m/yr [Hart-mann et al., 1971; Reynolds, 1993]. The relatively highevaporation combined with restricted exchange with theopen ocean leads to formation of a saline, dense water mass(Gulf Deep Water) and a reverse estuary circulation throughthe Strait of Hormuz. Within the Strait, flow of dense waterout of the Gulf is mostly confined to the southern side of thechannel by geostrophy [Emery, 1956; Chao et al., 1992],
JOURNAL OF GEOPHYSICAL RESEARCH, VOL. 108, NO. C1, 3004, doi:10.1029/2002JC001360, 2003
Copyright 2003 by the American Geophysical Union.0148-0227/03/2002JC001360$09.00
4 - 1
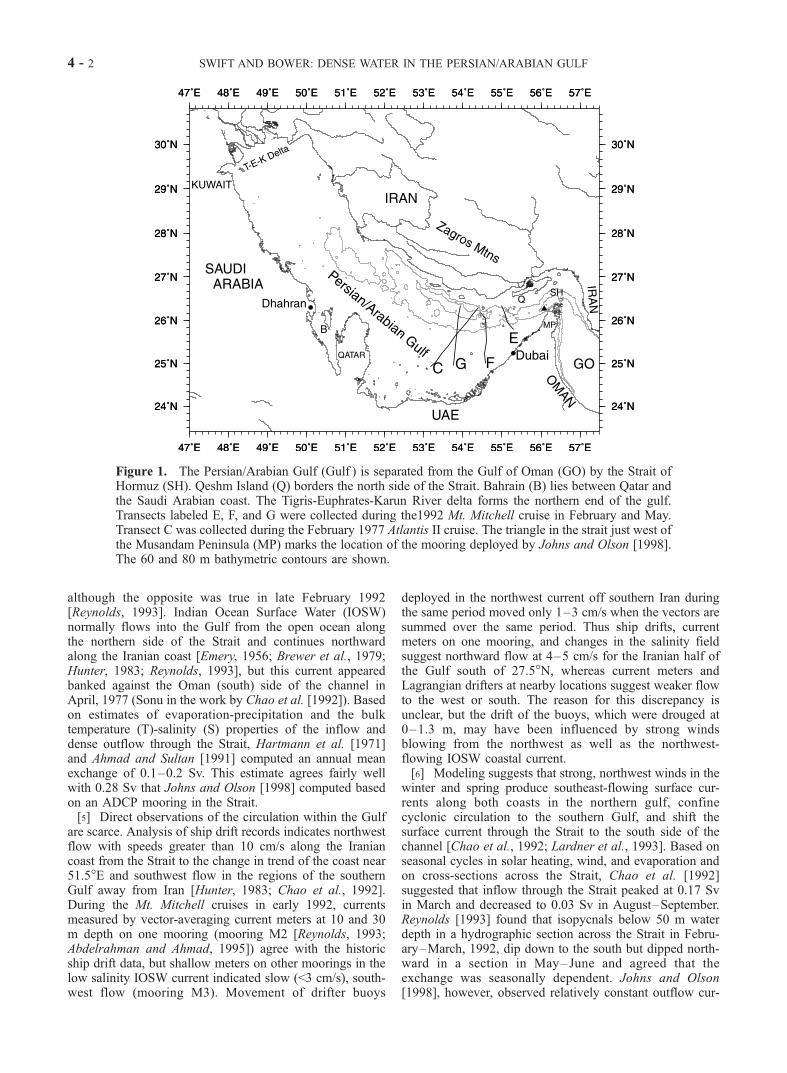
although the opposite was true in late February 1992[Reynolds, 1993]. Indian Ocean Surface Water (IOSW)normally flows into the Gulf from the open ocean alongthe northern side of the Strait and continues northwardalong the Iranian coast [Emery, 1956; Brewer et al., 1979;Hunter, 1983; Reynolds, 1993], but this current appearedbanked against the Oman (south) side of the channel inApril, 1977 (Sonu in the work by Chao et al. [1992]). Basedon estimates of evaporation-precipitation and the bulktemperature (T)-salinity (S) properties of the inflow anddense outflow through the Strait, Hartmann et al. [1971]and Ahmad and Sultan [1991] computed an annual meanexchange of 0.1–0.2 Sv. This estimate agrees fairly wellwith 0.28 Sv that Johns and Olson [1998] computed basedon an ADCP mooring in the Strait.[5] Direct observations of the circulation within the Gulf
are scarce. Analysis of ship drift records indicates northwestflow with speeds greater than 10 cm/s along the Iraniancoast from the Strait to the change in trend of the coast near51.5�E and southwest flow in the regions of the southernGulf away from Iran [Hunter, 1983; Chao et al., 1992].During the Mt. Mitchell cruises in early 1992, currentsmeasured by vector-averaging current meters at 10 and 30m depth on one mooring (mooring M2 [Reynolds, 1993;Abdelrahman and Ahmad, 1995]) agree with the historicship drift data, but shallow meters on other moorings in thelow salinity IOSW current indicated slow (<3 cm/s), south-west flow (mooring M3). Movement of drifter buoys
deployed in the northwest current off southern Iran duringthe same period moved only 1–3 cm/s when the vectors aresummed over the same period. Thus ship drifts, currentmeters on one mooring, and changes in the salinity fieldsuggest northward flow at 4–5 cm/s for the Iranian half ofthe Gulf south of 27.5�N, whereas current meters andLagrangian drifters at nearby locations suggest weaker flowto the west or south. The reason for this discrepancy isunclear, but the drift of the buoys, which were drouged at0–1.3 m, may have been influenced by strong windsblowing from the northwest as well as the northwest-flowing IOSW coastal current.[6] Modeling suggests that strong, northwest winds in the
winter and spring produce southeast-flowing surface cur-rents along both coasts in the northern gulf, confinecyclonic circulation to the southern Gulf, and shift thesurface current through the Strait to the south side of thechannel [Chao et al., 1992; Lardner et al., 1993]. Based onseasonal cycles in solar heating, wind, and evaporation andon cross-sections across the Strait, Chao et al. [1992]suggested that inflow through the Strait peaked at 0.17 Svin March and decreased to 0.03 Sv in August–September.Reynolds [1993] found that isopycnals below 50 m waterdepth in a hydrographic section across the Strait in Febru-ary–March, 1992, dip down to the south but dipped north-ward in a section in May–June and agreed that theexchange was seasonally dependent. Johns and Olson[1998], however, observed relatively constant outflow cur-
Figure 1. The Persian/Arabian Gulf (Gulf ) is separated from the Gulf of Oman (GO) by the Strait ofHormuz (SH). Qeshm Island (Q) borders the north side of the Strait. Bahrain (B) lies between Qatar andthe Saudi Arabian coast. The Tigris-Euphrates-Karun River delta forms the northern end of the gulf.Transects labeled E, F, and G were collected during the1992 Mt. Mitchell cruise in February and May.Transect C was collected during the February 1977 Atlantis II cruise. The triangle in the strait just west ofthe Musandam Peninsula (MP) marks the location of the mooring deployed by Johns and Olson [1998].The 60 and 80 m bathymetric contours are shown.
4 - 2 SWIFT AND BOWER: DENSE WATER IN THE PERSIAN/ARABIAN GULF
rent speed from an upward looking ADCP moored in thewestern channel (location shown in Figure 1). They alsoobserved a dramatic shift in the T-S properties of waterflowing through the Strait at most depths in July and a moregradual reversal in properties between November and Jan-uary. It appears that the picture of circulation in the Gulf andexchange with the Indian Ocean from the modeling and theisolated surveys is not complete.[7] A seasonally complete data set would help resolve
these inconsistencies. Comprehensive surveys of currentsand water properties throughout the year have not beenobtained in the Gulf. In this paper we examine a hydro-graphic database and resolve seasonal trends by averagingthe data from many cruises over many years. We identifythe source areas and season when dense water is formed inthe Gulf and use T-S characteristics to trace movements andtransformations of water masses within the Gulf and theexchange with the Indian Ocean. With this approach we areable to base our interpretations on both the fine-scale spatialand temporal resolution of existing synoptic surveys and onbimonthly averages for about two thirds of the year.
2. Data
[8] Temperature and salinity values as a function of waterdepth were obtained from a database maintained by the U.S.Naval Oceanographic Office (MOODS, Master Oceano-
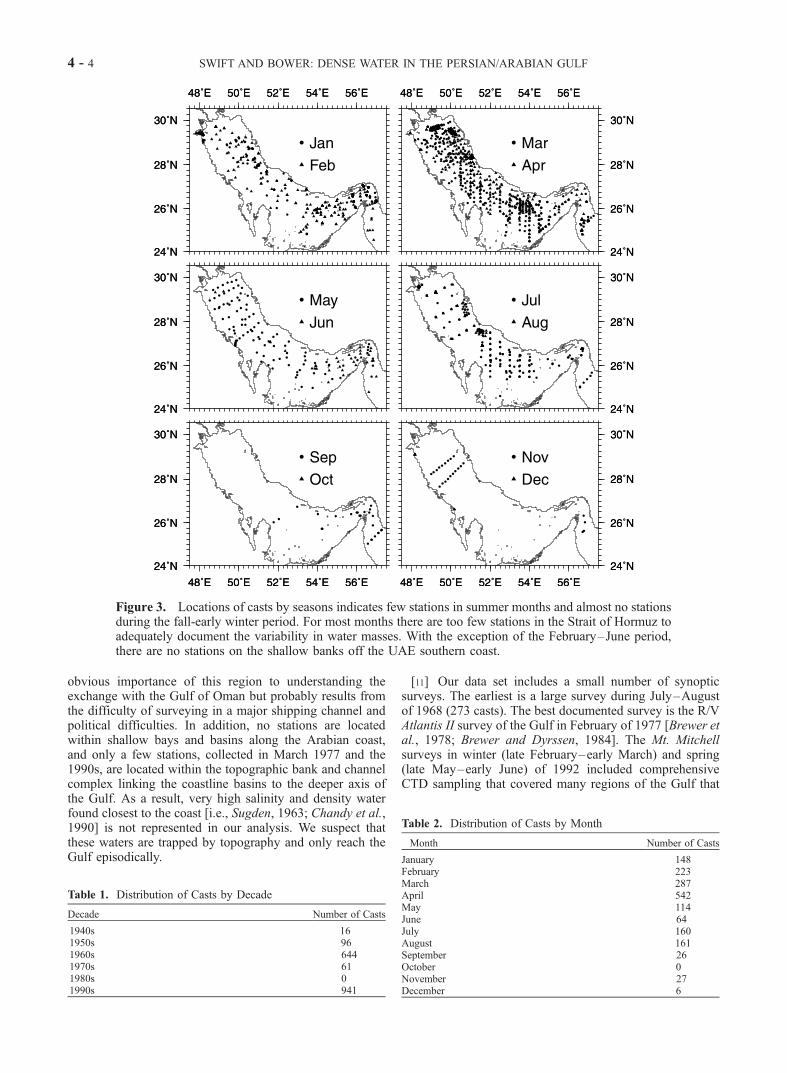
graphic Observations Data Set). Alessi et al. [1999] describegeneral features of the data and the quality control proce-dures applied to edit out aberrant stations. Data from bothbottle casts and CTDs at 1758 stations cover most areas ofthe Gulf west of 57�300E. Figure 3 shows the distribution ofstations as a function of month pairs. Eid and El-Gindy[1998] used a similar historical data set to study Gulfcirculation but confined their analysis to geostrophic com-putation of surface currents.[9] We chose MOODS as our primary data source rather
than the National Oceanographic Data Center (NODC)because NODC does not include data from the 1992 Mt.Mitchell cruise, the most extensive synoptic survey of theGulf [Reynolds, 1993]. The MOODS data include largetemporal gaps and a bias toward winter and spring months(Tables 1 and 2). To fill these gaps we searched publishedand digital databases, including NODC. We obtained addi-tional data collected prior to 1964 from Dubach [1964] anddata collected on the 1977–1978 R/V Lemuru cruises from[Simmonds and Lamboeuf, 1981]. Neither MOODS norNODC include data from the R/V Umitaka-Maru cruisesduring December and January of 1993 and 1994 [Otsuki etal., 1998]. However, these data do not fill a significant datagap and would be unlikely to change our results.[10] The data include spatial bias as well (Figure 3). The
axial channel through the Strait and its approaches has beenpoorly sampled. This is somewhat surprising given the
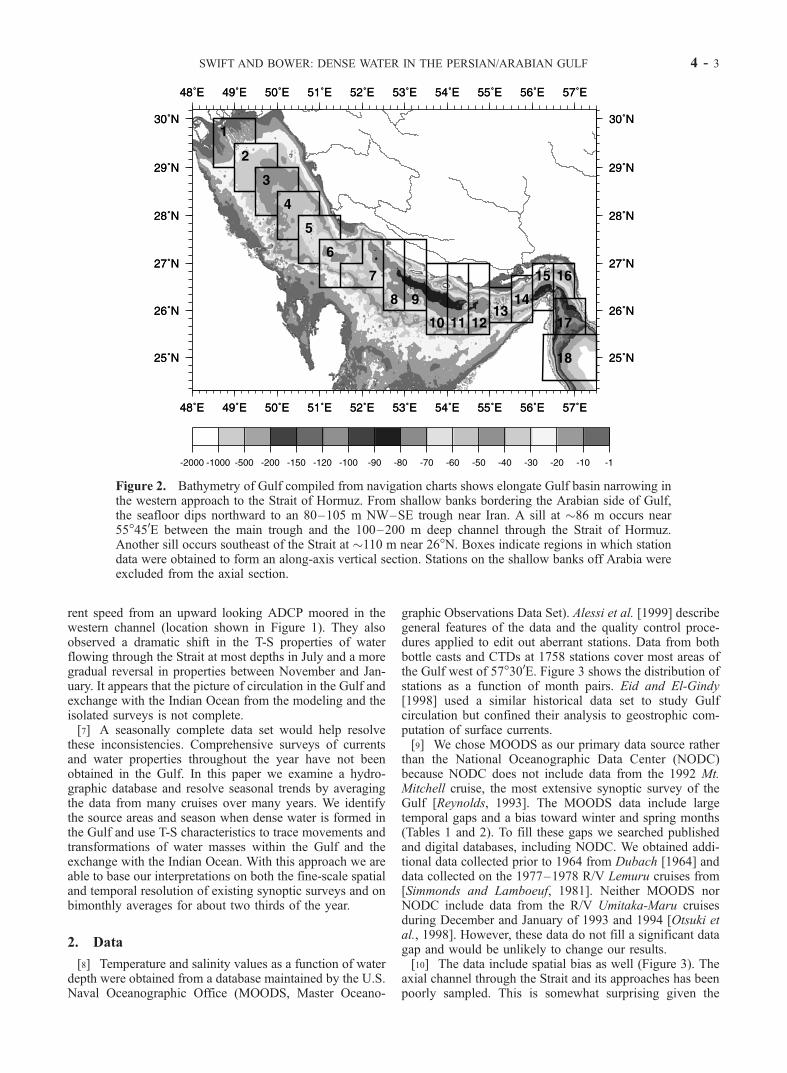
Figure 2. Bathymetry of Gulf compiled from navigation charts shows elongate Gulf basin narrowing inthe western approach to the Strait of Hormuz. From shallow banks bordering the Arabian side of Gulf,the seafloor dips northward to an 80–105 m NW–SE trough near Iran. A sill at �86 m occurs near55�450E between the main trough and the 100–200 m deep channel through the Strait of Hormuz.Another sill occurs southeast of the Strait at �110 m near 26�N. Boxes indicate regions in which stationdata were obtained to form an along-axis vertical section. Stations on the shallow banks off Arabia wereexcluded from the axial section.
SWIFT AND BOWER: DENSE WATER IN THE PERSIAN/ARABIAN GULF 4 - 3
obvious importance of this region to understanding theexchange with the Gulf of Oman but probably results fromthe difficulty of surveying in a major shipping channel andpolitical difficulties. In addition, no stations are locatedwithin shallow bays and basins along the Arabian coast,and only a few stations, collected in March 1977 and the1990s, are located within the topographic bank and channelcomplex linking the coastline basins to the deeper axis ofthe Gulf. As a result, very high salinity and density waterfound closest to the coast [i.e., Sugden, 1963; Chandy et al.,1990] is not represented in our analysis. We suspect thatthese waters are trapped by topography and only reach theGulf episodically.
[11] Our data set includes a small number of synopticsurveys. The earliest is a large survey during July–Augustof 1968 (273 casts). The best documented survey is the R/VAtlantis II survey of the Gulf in February of 1977 [Brewer etal., 1978; Brewer and Dyrssen, 1984]. The Mt. Mitchellsurveys in winter (late February–early March) and spring(late May–early June) of 1992 included comprehensiveCTD sampling that covered many regions of the Gulf that
Figure 3. Locations of casts by seasons indicates few stations in summer months and almost no stationsduring the fall-early winter period. For most months there are too few stations in the Strait of Hormuz toadequately document the variability in water masses. With the exception of the February–June period,there are no stations on the shallow banks off the UAE southern coast.
Table 1. Distribution of Casts by Decade
Decade Number of Casts
1940s 161950s 961960s 6441970s 611980s 01990s 941
Table 2. Distribution of Casts by Month
Month Number of Casts
January 148February 223March 287April 542May 114June 64July 160August 161September 26October 0November 27December 6
4 - 4 SWIFT AND BOWER: DENSE WATER IN THE PERSIAN/ARABIAN GULF
were poorly sampled by other expeditions, including theStrait of Hormuz and the shallow southern banks [Reynolds,1993; Sultan and Elghribi, 1996]. Follow-up CTD surveyswere done in April of 1994 and March–April of 1996, butthe area investigated by these cruises is not as wide as thatcovered by the Mt. Mitchell.
3. Results
3.1. Formation of Dense Gulf Bottom Water
[12] Formation of dense water in the Gulf is commonlyassociated with processes that increase salinity [Emery,1956; Chao et al., 1992]. This viewpoint follows from theunderstanding of the Gulf as a shallow reverse-estuarysystem in an arid, subtropical setting. It is reasonable topresume a direct link between the production of highsalinity water in particular regions and seasons with theformation of dense water that spills along the bottomthrough the Strait into the Indian Ocean. While a smallportion of the flux out through the Strait is indeed hyper-saline (>41 psu) water, we shall argue that most of the denseoutflow is water that has been diluted by mixing in severalsteps before exiting the Gulf.[13] The densest water in the main Gulf basin forms in
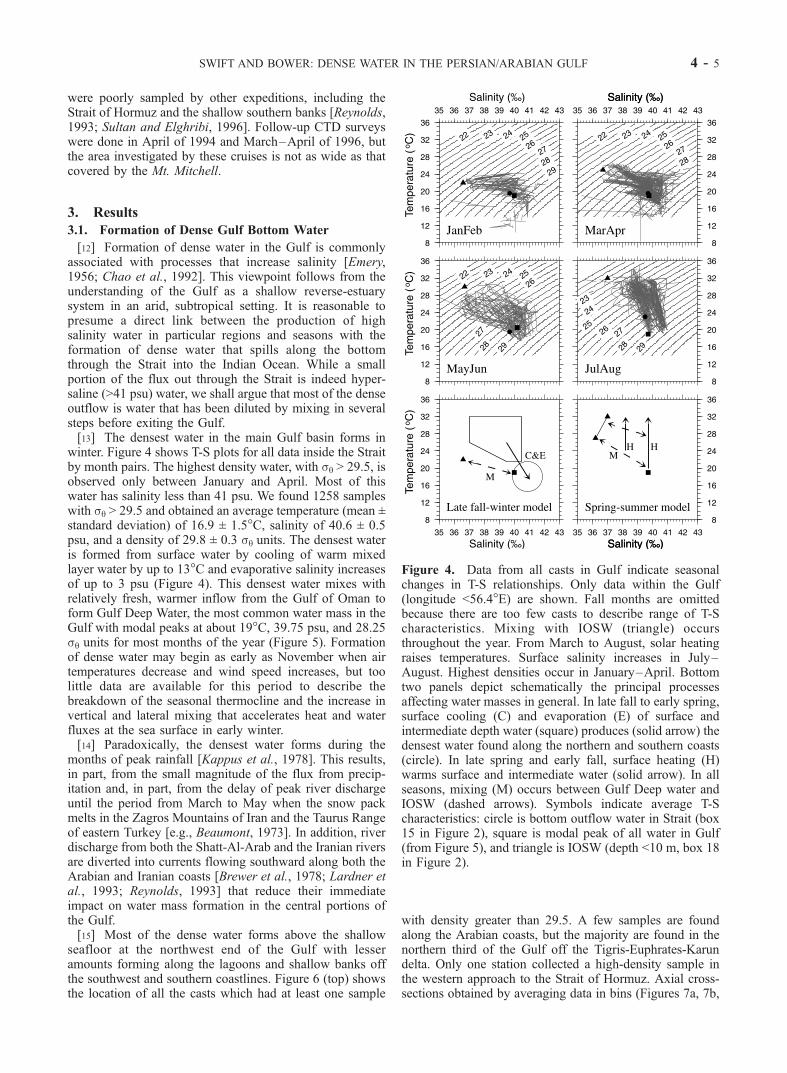
winter. Figure 4 shows T-S plots for all data inside the Straitby month pairs. The highest density water, with sq > 29.5, isobserved only between January and April. Most of thiswater has salinity less than 41 psu. We found 1258 sampleswith sq > 29.5 and obtained an average temperature (mean ±standard deviation) of 16.9 ± 1.5�C, salinity of 40.6 ± 0.5psu, and a density of 29.8 ± 0.3 sq units. The densest wateris formed from surface water by cooling of warm mixedlayer water by up to 13�C and evaporative salinity increasesof up to 3 psu (Figure 4). This densest water mixes withrelatively fresh, warmer inflow from the Gulf of Oman toform Gulf Deep Water, the most common water mass in theGulf with modal peaks at about 19�C, 39.75 psu, and 28.25sq units for most months of the year (Figure 5). Formationof dense water may begin as early as November when airtemperatures decrease and wind speed increases, but toolittle data are available for this period to describe thebreakdown of the seasonal thermocline and the increase invertical and lateral mixing that accelerates heat and waterfluxes at the sea surface in early winter.[14] Paradoxically, the densest water forms during the
months of peak rainfall [Kappus et al., 1978]. This results,in part, from the small magnitude of the flux from precip-itation and, in part, from the delay of peak river dischargeuntil the period from March to May when the snow packmelts in the Zagros Mountains of Iran and the Taurus Rangeof eastern Turkey [e.g., Beaumont, 1973]. In addition, riverdischarge from both the Shatt-Al-Arab and the Iranian riversare diverted into currents flowing southward along both theArabian and Iranian coasts [Brewer et al., 1978; Lardner etal., 1993; Reynolds, 1993] that reduce their immediateimpact on water mass formation in the central portions ofthe Gulf.[15] Most of the dense water forms above the shallow
seafloor at the northwest end of the Gulf with lesseramounts forming along the lagoons and shallow banks offthe southwest and southern coastlines. Figure 6 (top) showsthe location of all the casts which had at least one sample
with density greater than 29.5. A few samples are foundalong the Arabian coasts, but the majority are found in thenorthern third of the Gulf off the Tigris-Euphrates-Karundelta. Only one station collected a high-density sample inthe western approach to the Strait of Hormuz. Axial cross-sections obtained by averaging data in bins (Figures 7a, 7b,
Figure 4. Data from all casts in Gulf indicate seasonalchanges in T-S relationships. Only data within the Gulf(longitude <56.4�E) are shown. Fall months are omittedbecause there are too few casts to describe range of T-Scharacteristics. Mixing with IOSW (triangle) occursthroughout the year. From March to August, solar heatingraises temperatures. Surface salinity increases in July–August. Highest densities occur in January–April. Bottomtwo panels depict schematically the principal processesaffecting water masses in general. In late fall to early spring,surface cooling (C) and evaporation (E) of surface andintermediate depth water (square) produces (solid arrow) thedensest water found along the northern and southern coasts(circle). In late spring and early fall, surface heating (H)warms surface and intermediate water (solid arrow). In allseasons, mixing (M) occurs between Gulf Deep water andIOSW (dashed arrows). Symbols indicate average T-Scharacteristics: circle is bottom outflow water in Strait (box15 in Figure 2), square is modal peak of all water in Gulf(from Figure 5), and triangle is IOSW (depth <10 m, box 18in Figure 2).
SWIFT AND BOWER: DENSE WATER IN THE PERSIAN/ARABIAN GULF 4 - 5
7c, and 7d) clearly show that the densest isopycnals in theGulf outcrop at the surface in the northern end of the Gulffrom at least January to April, when northwest winds bringinterior continental air to cool the surface of the Gulf. Airtemperature over the Gulf is coldest in the north andincreases southward by heat exchange with the sea surface[Brower et al., 1992]. As a result, heat loss from the seasurface is greatest in the north, and the densest water formsthere. In winter, wind speeds are higher and humidity islower [Perrone, 1979; Brower et al., 1992], contributing tohigher evaporation rates than in summer. Although the coastis open and circulation is largely unrestricted, evaporation
rates are high enough to increase salinity to 40–41 psu(Figures 4, 7a, 7b, 7c, and 7d).[16] Dense water also forms along the Bahrain-Qatar
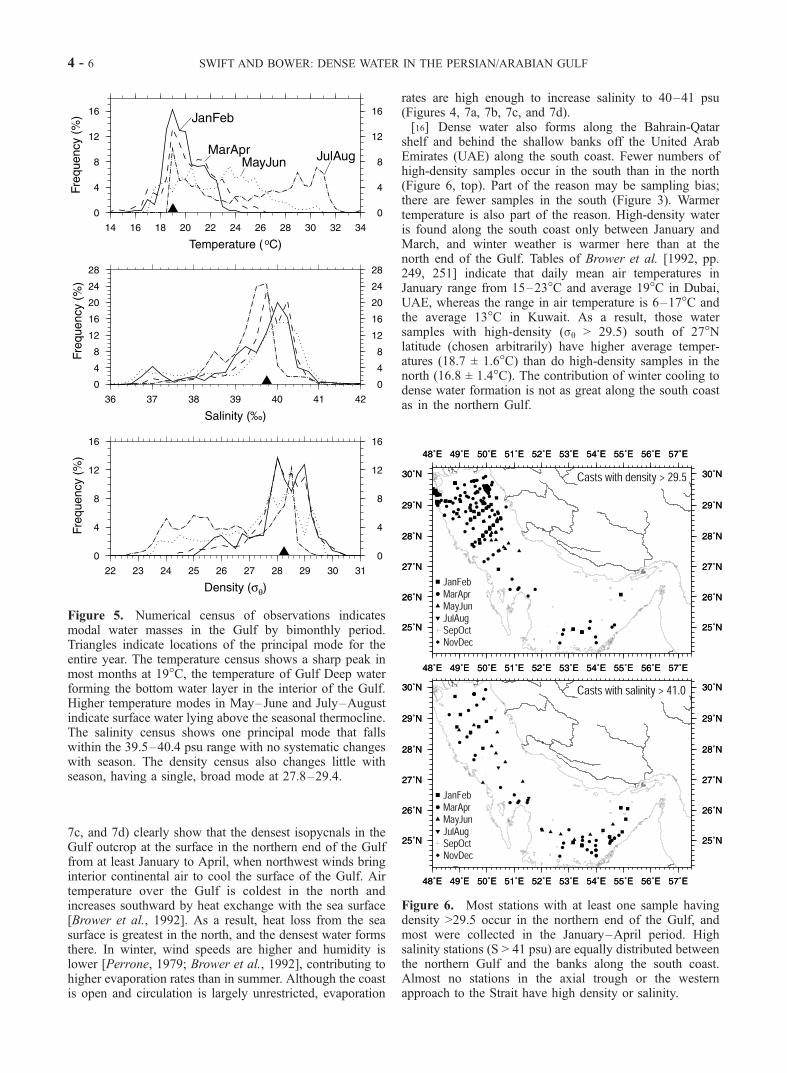
shelf and behind the shallow banks off the United ArabEmirates (UAE) along the south coast. Fewer numbers ofhigh-density samples occur in the south than in the north(Figure 6, top). Part of the reason may be sampling bias;there are fewer samples in the south (Figure 3). Warmertemperature is also part of the reason. High-density wateris found along the south coast only between January andMarch, and winter weather is warmer here than at thenorth end of the Gulf. Tables of Brower et al. [1992, pp.249, 251] indicate that daily mean air temperatures inJanuary range from 15–23�C and average 19�C in Dubai,UAE, whereas the range in air temperature is 6–17�C andthe average 13�C in Kuwait. As a result, those watersamples with high-density (sq > 29.5) south of 27�Nlatitude (chosen arbitrarily) have higher average temper-atures (18.7 ± 1.6�C) than do high-density samples in thenorth (16.8 ± 1.4�C). The contribution of winter cooling todense water formation is not as great along the south coastas in the northern Gulf.
Figure 6. Most stations with at least one sample havingdensity >29.5 occur in the northern end of the Gulf, andmost were collected in the January–April period. Highsalinity stations (S > 41 psu) are equally distributed betweenthe northern Gulf and the banks along the south coast.Almost no stations in the axial trough or the westernapproach to the Strait have high density or salinity.
Figure 5. Numerical census of observations indicatesmodal water masses in the Gulf by bimonthly period.Triangles indicate locations of the principal mode for theentire year. The temperature census shows a sharp peak inmost months at 19�C, the temperature of Gulf Deep waterforming the bottom water layer in the interior of the Gulf.Higher temperature modes in May–June and July–Augustindicate surface water lying above the seasonal thermocline.The salinity census shows one principal mode that fallswithin the 39.5–40.4 psu range with no systematic changeswith season. The density census also changes little withseason, having a single, broad mode at 27.8–29.4.
4 - 6 SWIFT AND BOWER: DENSE WATER IN THE PERSIAN/ARABIAN GULF
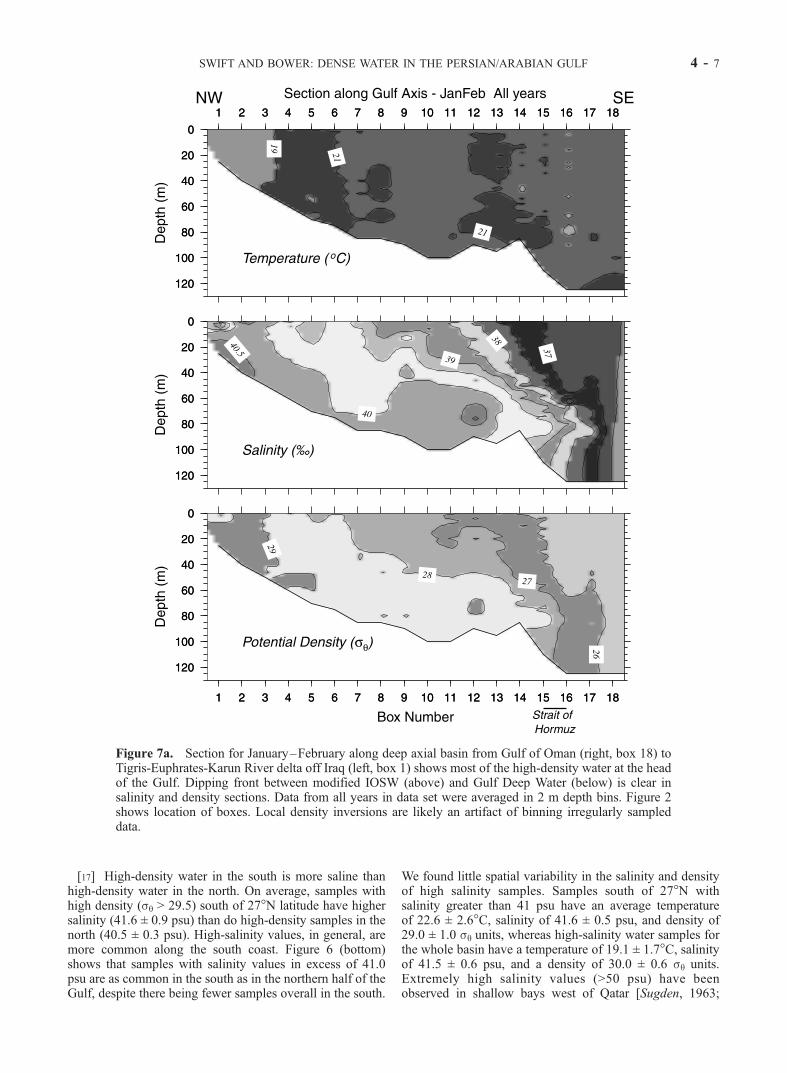
[17] High-density water in the south is more saline thanhigh-density water in the north. On average, samples withhigh density (sq > 29.5) south of 27�N latitude have highersalinity (41.6 ± 0.9 psu) than do high-density samples in thenorth (40.5 ± 0.3 psu). High-salinity values, in general, aremore common along the south coast. Figure 6 (bottom)shows that samples with salinity values in excess of 41.0psu are as common in the south as in the northern half of theGulf, despite there being fewer samples overall in the south.
We found little spatial variability in the salinity and densityof high salinity samples. Samples south of 27�N withsalinity greater than 41 psu have an average temperatureof 22.6 ± 2.6�C, salinity of 41.6 ± 0.5 psu, and density of29.0 ± 1.0 sq units, whereas high-salinity water samples forthe whole basin have a temperature of 19.1 ± 1.7�C, salinityof 41.5 ± 0.6 psu, and a density of 30.0 ± 0.6 sq units.Extremely high salinity values (>50 psu) have beenobserved in shallow bays west of Qatar [Sugden, 1963;
Figure 7a. Section for January–February along deep axial basin from Gulf of Oman (right, box 18) toTigris-Euphrates-Karun River delta off Iraq (left, box 1) shows most of the high-density water at the headof the Gulf. Dipping front between modified IOSW (above) and Gulf Deep Water (below) is clear insalinity and density sections. Data from all years in data set were averaged in 2 m depth bins. Figure 2shows location of boxes. Local density inversions are likely an artifact of binning irregularly sampleddata.
SWIFT AND BOWER: DENSE WATER IN THE PERSIAN/ARABIAN GULF 4 - 7
Chandy et al., 1990] and probably are common in lagoonselsewhere along the south coast. Such high-salinity valuesdo not appear in our data indicating considerable dilutionbefore reaching the shallow southern banks and the mainGulf basin where our samples were taken (Figure 3). Highsalinity water formed along the coast appears to be trappedthere by the same topographic and oceanographic restric-tions that allow salinity to increase to high levels.
3.2. Structure and Variability of Density Gradientsin the Gulf
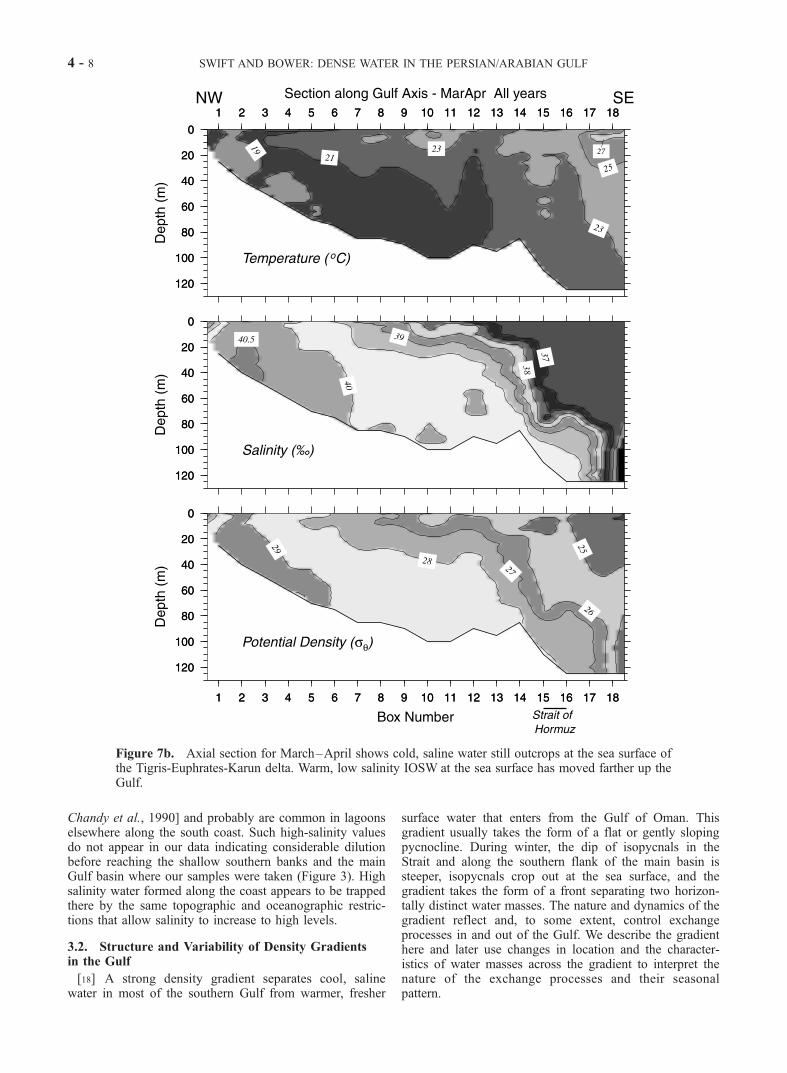
[18] A strong density gradient separates cool, salinewater in most of the southern Gulf from warmer, fresher
surface water that enters from the Gulf of Oman. Thisgradient usually takes the form of a flat or gently slopingpycnocline. During winter, the dip of isopycnals in theStrait and along the southern flank of the main basin issteeper, isopycnals crop out at the sea surface, and thegradient takes the form of a front separating two horizon-tally distinct water masses. The nature and dynamics of thegradient reflect and, to some extent, control exchangeprocesses in and out of the Gulf. We describe the gradienthere and later use changes in location and the character-istics of water masses across the gradient to interpret thenature of the exchange processes and their seasonalpattern.
Figure 7b. Axial section for March–April shows cold, saline water still outcrops at the sea surface ofthe Tigris-Euphrates-Karun delta. Warm, low salinity IOSW at the sea surface has moved farther up theGulf.
4 - 8 SWIFT AND BOWER: DENSE WATER IN THE PERSIAN/ARABIAN GULF
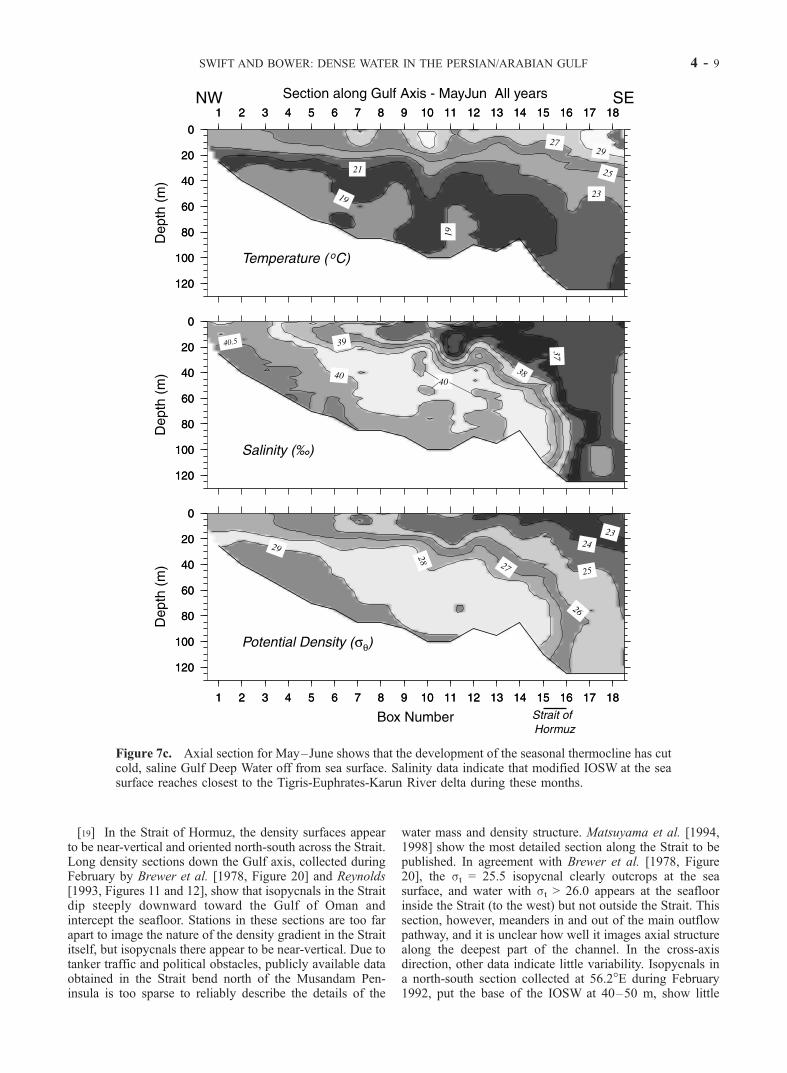
[19] In the Strait of Hormuz, the density surfaces appearto be near-vertical and oriented north-south across the Strait.Long density sections down the Gulf axis, collected duringFebruary by Brewer et al. [1978, Figure 20] and Reynolds[1993, Figures 11 and 12], show that isopycnals in the Straitdip steeply downward toward the Gulf of Oman andintercept the seafloor. Stations in these sections are too farapart to image the nature of the density gradient in the Straititself, but isopycnals there appear to be near-vertical. Due totanker traffic and political obstacles, publicly available dataobtained in the Strait bend north of the Musandam Pen-insula is too sparse to reliably describe the details of the
water mass and density structure. Matsuyama et al. [1994,1998] show the most detailed section along the Strait to bepublished. In agreement with Brewer et al. [1978, Figure20], the st = 25.5 isopycnal clearly outcrops at the seasurface, and water with st > 26.0 appears at the seafloorinside the Strait (to the west) but not outside the Strait. Thissection, however, meanders in and out of the main outflowpathway, and it is unclear how well it images axial structurealong the deepest part of the channel. In the cross-axisdirection, other data indicate little variability. Isopycnals ina north-south section collected at 56.2�E during February1992, put the base of the IOSW at 40–50 m, show little
Figure 7c. Axial section for May–June shows that the development of the seasonal thermocline has cutcold, saline Gulf Deep Water off from sea surface. Salinity data indicate that modified IOSW at the seasurface reaches closest to the Tigris-Euphrates-Karun River delta during these months.
SWIFT AND BOWER: DENSE WATER IN THE PERSIAN/ARABIAN GULF 4 - 9

change in depth across the Strait, and appear to interceptboth sides of the channel [Reynolds, 1993, Figure 14].Summarizing the limited data available, density surfacesin the Strait during winter appear to be planar features thatare near-vertical at the bend in the Strait north of the tip ofthe Musandam Peninsula. Within the Gulf, density surfacesdip down toward the Gulf of Oman. Isopycnals in sectionstaken across the channel axis slope more in spring than inwinter [Chao et al., 1992; Reynolds, 1993]. Unfortunately,axial sections with stations as closely spaced as that ofMatsuyama et al. [1994] have not been collected in the
spring, and no data from the Strait with such high densityand quality is yet available for summer months.[20] Within the southern half of the Gulf west of the
Strait, vertical sections down the axis of the main basincollected during February show isopycnals sloping from theseafloor upward to the west in a fan pattern [Brewer et al.,1978, Figure 20; Reynolds, 1993, Figure 11]. As a result,isopycnals are spaced farther apart at the sea surface than atthe seafloor. Isopycnals outcrop at the sea surface in theinterior of the basin, so maps of surface density and salinityshow horizontal gradients that mark the surface location of
Figure 7d. Axial section in July–August shows that the southeast end of the front separating modifiedIOSW from Gulf Deep Water has moved up the basin to at least box 12. Warm, low-salinity surface waterhas been stirred downward in the region to the west of the Strait (boxes 12–15). Solar heating haswarmed the complete water column lowering overall density compared to previous months.
4 - 10 SWIFT AND BOWER: DENSE WATER IN THE PERSIAN/ARABIAN GULF
the water mass boundary [Brewer et al., 1978, Figures 4 and6; Brewer and Dyrssen, 1984, Figure 3; Reynolds, 1993,Figure 9]. The gradient separates modified IOSW to thenortheast along the Iranian coast from cooler, more salineGulf water to the southwest. The southern end of the frontcan traced back to the UAE coast near 55�E where a sectionby Brewer et al. [1978] (their Transect B in their Figure 9)shows the cluster of isopycnals marking the front separatingfrom the southern wall of the channel and rising to the seasurface. The northern end of the gradient is less well-defined by data but probably does not extend north of 27�N.[21] The water mass boundary changes with the season.
In the spring, modified IOSW moves both farther up theIranian coastline and southwestward along the UAE coast.As a result, isohalines outcropping at the sea surface spreadnorthward up the Iranian coast and farther south closer tothe UAE coast [Reynolds, 1993, Figure 10]. In summer, thegradient does not reach the surface. A basin-wide seasonalthermocline forms with a warm, well-mixed surface layercomprised of a mixture of IOSW and saline Gulf water.[22] Two lines of evidence suggest that the downward
slope of isopycnals toward the east in the Strait represents aregion of mixing between water masses and not a boundarybetween flows moving in different directions. Axial densitysections collected in winter clearly show that isopycnalsintersecting the sea surface dip down toward the east intothe Strait and pinch out at the seafloor [Brewer et al., 1978,Figure 20; Matsuyama et al., 1994, Figure 5; Reynolds,1993, Figures 11 and 12]. In north-south sections across thewestern approach to the Strait, the density gradient at thebase of the modified IOSW is near the sea floor [Brewer etal., 1978, Figure 9; Reynolds, 1993, Figures 14 and 19]. Ifnear-bottom outflow were constrained to the region beneaththe pycnocline, the velocity of the outflow would have toincrease many fold eastward to conserve volume. Currentmeter records in the Strait show no evidence that theamplitude of the mean flow increases near the sea floor[Matsuyama et al., 1994, 1998; Johns and Zantopp, 1999],so it is likely that little Gulf water flows unmodified beneaththe IOSW. The along-strait density gradient is a manifes-tation of the water mass transformation that occurs as thedeep Gulf water passes through the Strait and mixes withthe overlying inflow water. This inference is supported bythe observation of Johns and Olson [1998] that outflow inthe western approach to the Strait remained relativelyconstant from the seafloor up to �40 m depth year-round,whereas the temperature and salinity profile at the mooringchanged significantly with seasons. If the gradient were aflow boundary, measured outflow should have changedwhen the density profile changed. We will argue later thatexchange through the Strait is driven by evaporative waterlosses at the sea surface in the Gulf and the densityimbalance between Gulf bottom water and water outsidethe Gulf.[23] The depth and location of density gradients give
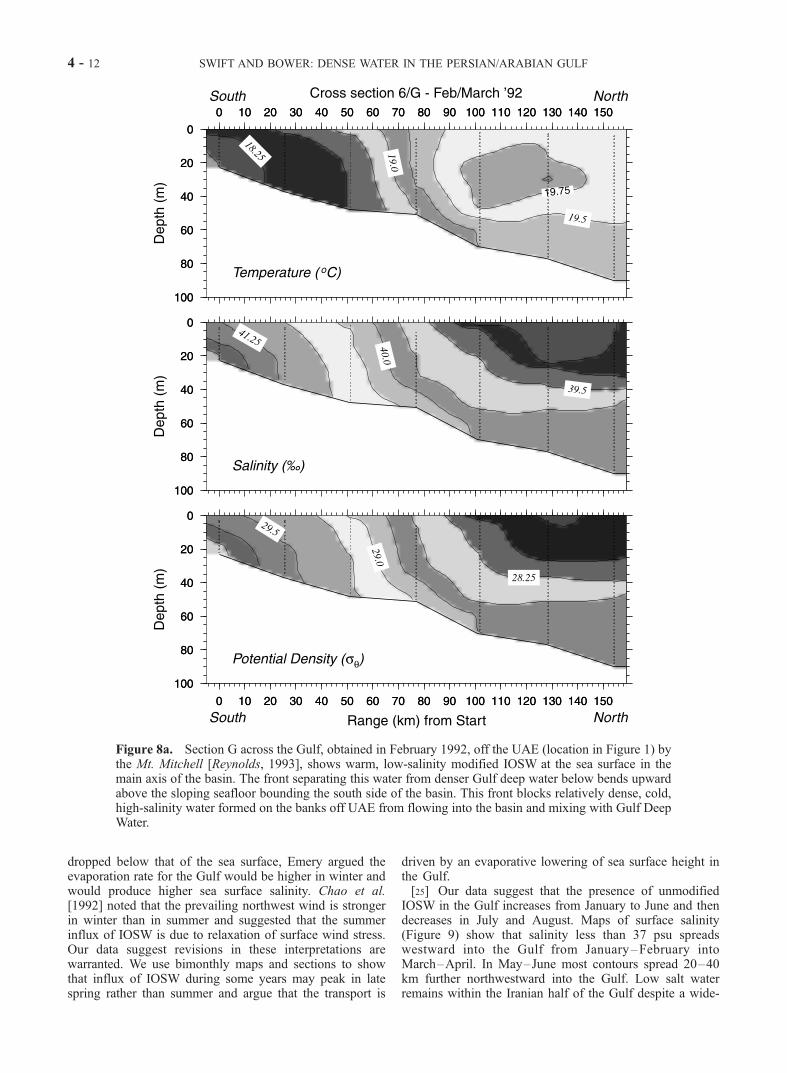
some evidence of how dense water over the shallow banksbordering the southern Gulf coast interacts with deep Gulfwater. Leakage of salty, dense water off the banks appearsto occur only during special oceanographic conditions andmay be limited spatially and temporally. Transects acrossthe Gulf in 1977, 1992, 1994, and 1996 indicate that theinterface between modified IOSW and dense Gulf water in
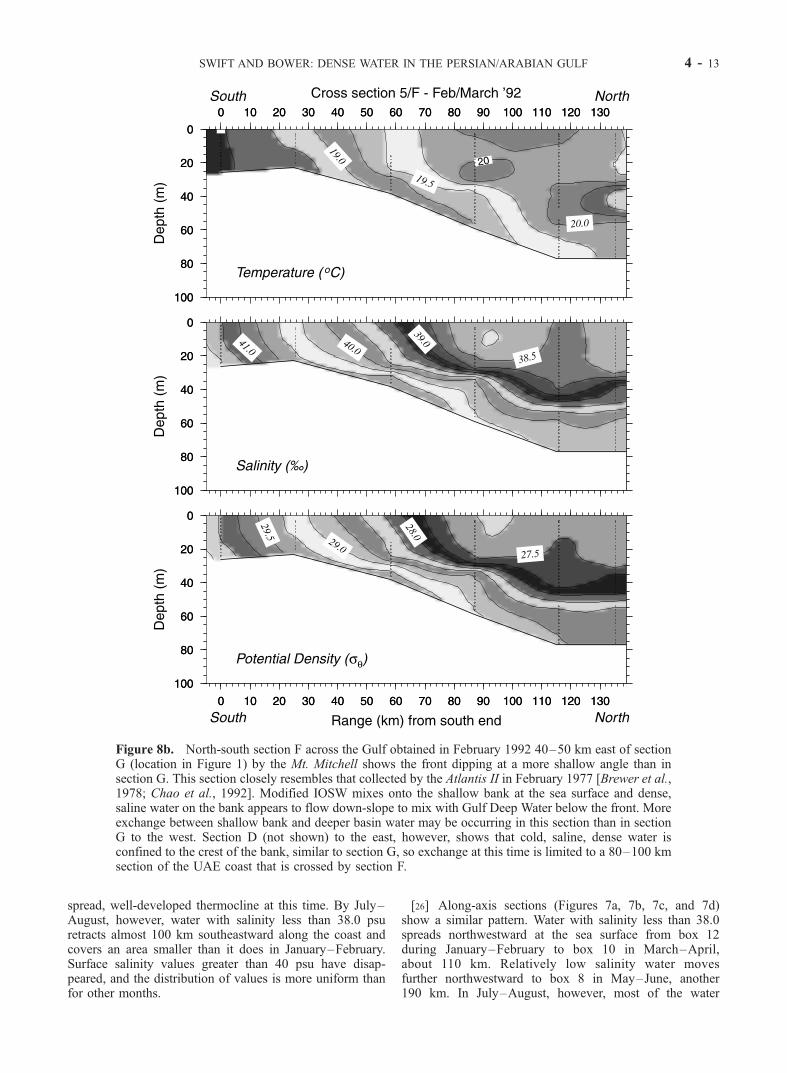
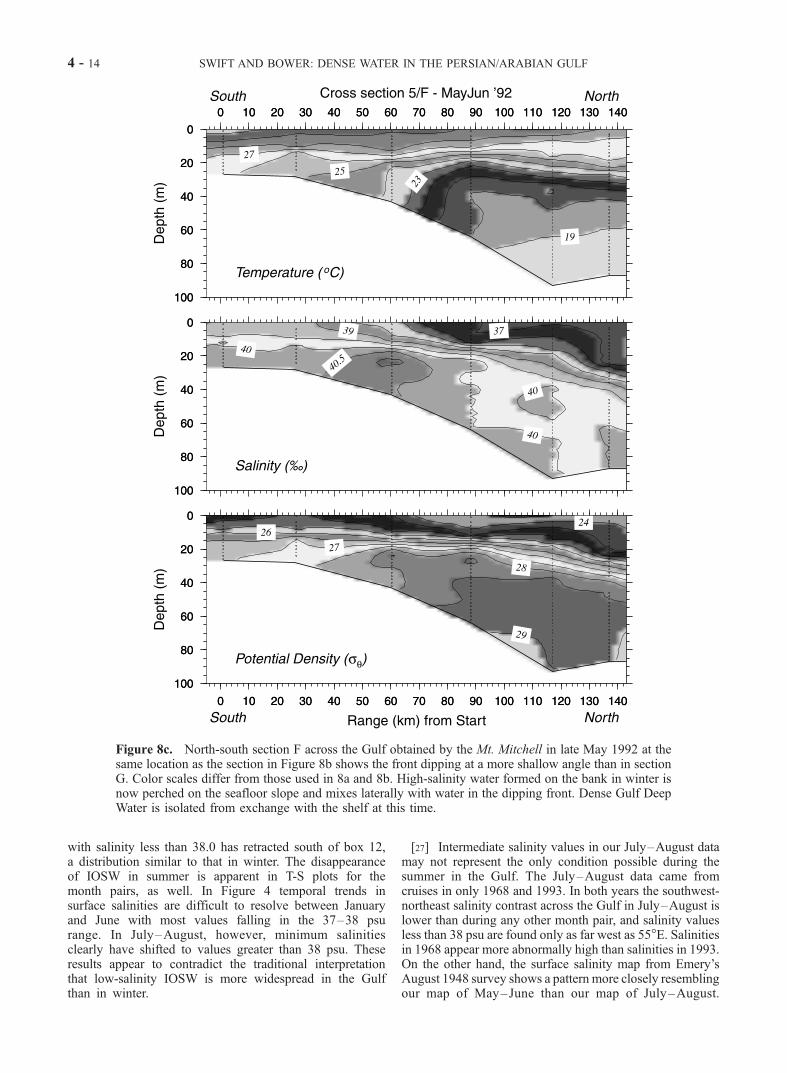
the deep basin is often nearly flat during late winter (Figure8a). To the south of the basin axis, the pycnocline intersectsthe seafloor near the 40–50 m isobaths and then bendsupward, forming a front that outcrops at the sea surface.Under these conditions the dense water on the banks isisolated from the deep basin. Under different conditions, thefront slopes upward from the basin axis to outcrop at thesea surface above the banks without intersecting the sea-floor. With the density front in a shallow position, there is adirect connection for the salty water to reach the axial basin.This condition occurred along transect F (�54�150E) of theMt. Mitchell survey in February of 1992 (Figure 8b) andalong Transect C, collected oblique to bathymetry (butperpendicular to the front) in February 1977 (location inFigure 1; sections shown in Figures 10 and 11 of Brewer etal. [1978] and Figures 5–6 of Brewer and Dyrssen [1984]).These sections show salty, dense water flowing alongisopycnals into the basin. The T-S plots for these sections(not shown) indicate lateral mixing between the densebottom water and modified IOSW above the pycnocline.In contrast, Mt. Mitchell transects E (not shown) and G(Figure 8a), taken across the UAE margin to the east andwest of Transect F, show dense shelf water trapped on thebank. It seems likely then that seepages of dense water offthe bank in winter (January–March) are localized toregions with along-shelf widths of less than 100 km. Thedata indicate that conditions for basinward flow and mixingare more frequent in spring. Isopycnals parallel to theseafloor are observed in all four north-south transects acrossthe UAE margin in April, 1994 (sections not shown). Atthis time, though, temperatures on the bank are much higher(22.5–25�C), and density is somewhat lower (0.5–1 unit).By the time of the Mt. Mitchell transects in late May 1992,most of the water on the banks is warm, modified IOSW,and salty water formed in winter and early spring hasslipped into a pool on the seafloor above the 30–50 misobaths (for example, Transect F in Figure 8c). The densityof water in this pool is too low to mix downslope with Gulfdeep water lying above the seafloor in the axis. This saltywater appears to evolve along at least two pathways. Asmall portion mixes laterally into the basin beneath theseasonal thermocline and may be the source of 5–10 mthick high salinity layers observed at 20–30 m depth insmall regions (40–80 km across) during the summer. Alarger portion appears to be transported eastward alongisobaths, appearing as a salty tongue of water at depths <45m along the south wall of the Strait in summer [Johns andZantopp, 1999] and as shallow, narrow veins of high T-Swater in the Gulf of Oman [Bower et al., 2000].
3.3. Spreading of IOSW
[24] Relatively fresh surface water from the Oman-Iranshelf flows into the Gulf (Table 3) to replace water lost toevaporation. As mentioned earlier, input from river dis-charge and precipitation is much lower than estimates ofevaporative flux [Hartmann et al., 1971; Reynolds, 1993].For a long time oceanographers inferred that the surfacewater of the Gulf, in general, is saltier in winter than insummer. Schott [1908] attributed the difference to chang-ing river fluxes, whereas Emery [1956] attributed thedifference to a change in evaporation rate. Assuming thatthe evaporation rate increases when the air temperature
SWIFT AND BOWER: DENSE WATER IN THE PERSIAN/ARABIAN GULF 4 - 11
dropped below that of the sea surface, Emery argued theevaporation rate for the Gulf would be higher in winter andwould produce higher sea surface salinity. Chao et al.[1992] noted that the prevailing northwest wind is strongerin winter than in summer and suggested that the summerinflux of IOSW is due to relaxation of surface wind stress.Our data suggest revisions in these interpretations arewarranted. We use bimonthly maps and sections to showthat influx of IOSW during some years may peak in latespring rather than summer and argue that the transport is
driven by an evaporative lowering of sea surface height inthe Gulf.[25] Our data suggest that the presence of unmodified
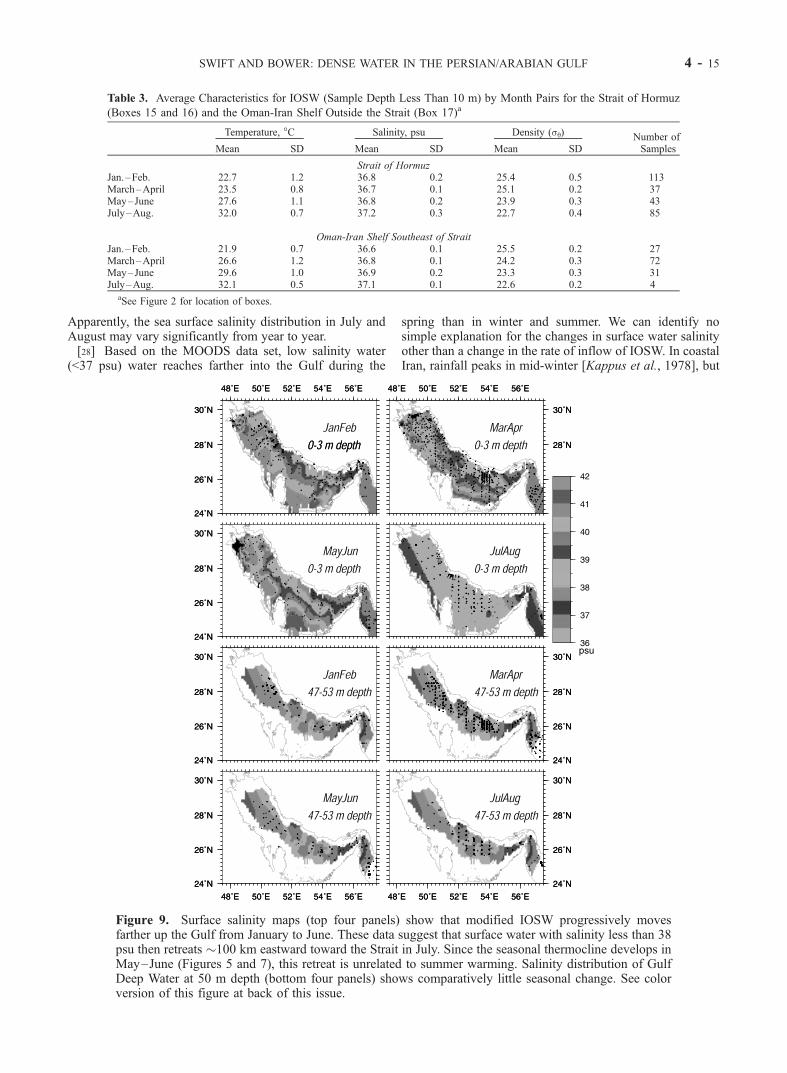
IOSW in the Gulf increases from January to June and thendecreases in July and August. Maps of surface salinity(Figure 9) show that salinity less than 37 psu spreadswestward into the Gulf from January–February intoMarch–April. In May–June most contours spread 20–40km further northwestward into the Gulf. Low salt waterremains within the Iranian half of the Gulf despite a wide-
Figure 8a. Section G across the Gulf, obtained in February 1992, off the UAE (location in Figure 1) bythe Mt. Mitchell [Reynolds, 1993], shows warm, low-salinity modified IOSW at the sea surface in themain axis of the basin. The front separating this water from denser Gulf deep water below bends upwardabove the sloping seafloor bounding the south side of the basin. This front blocks relatively dense, cold,high-salinity water formed on the banks off UAE from flowing into the basin and mixing with Gulf DeepWater.
4 - 12 SWIFT AND BOWER: DENSE WATER IN THE PERSIAN/ARABIAN GULF
spread, well-developed thermocline at this time. By July–August, however, water with salinity less than 38.0 psuretracts almost 100 km southeastward along the coast andcovers an area smaller than it does in January–February.Surface salinity values greater than 40 psu have disap-peared, and the distribution of values is more uniform thanfor other months.
[26] Along-axis sections (Figures 7a, 7b, 7c, and 7d)show a similar pattern. Water with salinity less than 38.0spreads northwestward at the sea surface from box 12during January–February to box 10 in March–April,about 110 km. Relatively low salinity water movesfurther northwestward to box 8 in May–June, another190 km. In July–August, however, most of the water
Figure 8b. North-south section F across the Gulf obtained in February 1992 40–50 km east of sectionG (location in Figure 1) by the Mt. Mitchell shows the front dipping at a more shallow angle than insection G. This section closely resembles that collected by the Atlantis II in February 1977 [Brewer et al.,1978; Chao et al., 1992]. Modified IOSW mixes onto the shallow bank at the sea surface and dense,saline water on the bank appears to flow down-slope to mix with Gulf Deep Water below the front. Moreexchange between shallow bank and deeper basin water may be occurring in this section than in sectionG to the west. Section D (not shown) to the east, however, shows that cold, saline, dense water isconfined to the crest of the bank, similar to section G, so exchange at this time is limited to a 80–100 kmsection of the UAE coast that is crossed by section F.
SWIFT AND BOWER: DENSE WATER IN THE PERSIAN/ARABIAN GULF 4 - 13
with salinity less than 38.0 has retracted south of box 12,a distribution similar to that in winter. The disappearanceof IOSW in summer is apparent in T-S plots for themonth pairs, as well. In Figure 4 temporal trends insurface salinities are difficult to resolve between Januaryand June with most values falling in the 37–38 psurange. In July–August, however, minimum salinitiesclearly have shifted to values greater than 38 psu. Theseresults appear to contradict the traditional interpretationthat low-salinity IOSW is more widespread in the Gulfthan in winter.
[27] Intermediate salinity values in our July–August datamay not represent the only condition possible during thesummer in the Gulf. The July–August data came fromcruises in only 1968 and 1993. In both years the southwest-northeast salinity contrast across the Gulf in July–August islower than during any other month pair, and salinity valuesless than 38 psu are found only as far west as 55�E. Salinitiesin 1968 appear more abnormally high than salinities in 1993.On the other hand, the surface salinity map from Emery’sAugust 1948 survey shows a pattern more closely resemblingour map of May–June than our map of July–August.
Figure 8c. North-south section F across the Gulf obtained by the Mt. Mitchell in late May 1992 at thesame location as the section in Figure 8b shows the front dipping at a more shallow angle than in sectionG. Color scales differ from those used in 8a and 8b. High-salinity water formed on the bank in winter isnow perched on the seafloor slope and mixes laterally with water in the dipping front. Dense Gulf DeepWater is isolated from exchange with the shelf at this time.
4 - 14 SWIFT AND BOWER: DENSE WATER IN THE PERSIAN/ARABIAN GULF
Apparently, the sea surface salinity distribution in July andAugust may vary significantly from year to year.[28] Based on the MOODS data set, low salinity water
(<37 psu) water reaches farther into the Gulf during the
spring than in winter and summer. We can identify nosimple explanation for the changes in surface water salinityother than a change in the rate of inflow of IOSW. In coastalIran, rainfall peaks in mid-winter [Kappus et al., 1978], but
Figure 9. Surface salinity maps (top four panels) show that modified IOSW progressively movesfarther up the Gulf from January to June. These data suggest that surface water with salinity less than 38psu then retreats �100 km eastward toward the Strait in July. Since the seasonal thermocline develops inMay–June (Figures 5 and 7), this retreat is unrelated to summer warming. Salinity distribution of GulfDeep Water at 50 m depth (bottom four panels) shows comparatively little seasonal change. See colorversion of this figure at back of this issue.
Table 3. Average Characteristics for IOSW (Sample Depth Less Than 10 m) by Month Pairs for the Strait of Hormuz
(Boxes 15 and 16) and the Oman-Iran Shelf Outside the Strait (Box 17)a
Temperature, �C Salinity, psu Density (sq) Number ofSamplesMean SD Mean SD Mean SD
Strait of HormuzJan.–Feb. 22.7 1.2 36.8 0.2 25.4 0.5 113March–April 23.5 0.8 36.7 0.1 25.1 0.2 37May–June 27.6 1.1 36.8 0.2 23.9 0.3 43July–Aug. 32.0 0.7 37.2 0.3 22.7 0.4 85
Oman-Iran Shelf Southeast of StraitJan.–Feb. 21.9 0.7 36.6 0.1 25.5 0.2 27March–April 26.6 1.2 36.8 0.1 24.2 0.3 72May–June 29.6 1.0 36.9 0.2 23.3 0.3 31July–Aug. 32.1 0.5 37.1 0.1 22.6 0.2 4
aSee Figure 2 for location of boxes.
SWIFT AND BOWER: DENSE WATER IN THE PERSIAN/ARABIAN GULF 4 - 15
river runoff from the Zagros Mountain peaks duringMarch–May when most of the snow melts [Beaumont,1973]. The section of Iranian coastline along which lowsalinities are observed, however, does not have significantriver discharge due to low annual precipitation in themountain watersheds [Beaumont, 1973], so the salinitychange is unlikely to arise from changes in fresh waterrunoff. In surface water samples (0–10 m depth) southeastof the Tigris-Euphrates-Karun coastline, we find no salinityvalues lower than that of IOSW on the Iran-Oman shelf atany time of the year, indicating that the discharge from otherIranian rivers has little affect on water properties beyond thecoastal zone. Monthly average and peak wind speedremains nearly constant from December through June withstrengths actually peaking in June at some stations [Per-rone, 1979; Brower et al., 1992; Chao et al., 1992]. Windspeed drops during the July–October period. Since theprevailing surface winds blow from the northwest againstinflow, the increase in low salinity surface water in the Gulfduring the spring can not result from a decrease in surfacewind stress, and the apparent recession of IOSW from theGulf in July does not correlate with an increase in windstress. We conclude that broader extension of low salinityvalues at the sea surface up the Iranian side of the Gulfindicates greater transport of IOSW through the Strait in latewinter and spring.[29] The apparent uniformity in surface salinity in July–
August (Figure 9) could result from mixing water fromhigh and low salinity sources, but a mechanism forincreasing the lateral mixing rate between June and Julyis unclear. The uniformity could also result from loweroffshore flow of high-salinity water along the southerncoast as peak winds decrease and the number of severenorthwest Shamal wind events decreases in July and fromslower spreading of IOSW through the Strait. The availabledata are insufficient to reliably interpret summer surfaceconditions, and additional studies would be necessary totest these hypotheses.[30] At least two mechanisms based on conservation of
volume could explain the observed changes in IOSW trans-port. Sultan et al. [1995] argue that the annual change in sealevel recorded by tide gauges in the Gulf (26 cm higher insummer) can be accounted for by changes in atmosphericpressure and surface water density (thermal effect, princi-pally). Thus changes in the volume of the Gulf from othersources must remain minor, and fluxes through the Strait ona seasonal basis must balance. The seasonal changes insurface transport could be compensated by a seasonalchange in outflow. The limited data available for deepoutflow, however, suggest otherwise. Johns and Olson[1998] found a ‘‘relatively steady deep outflow’’ that variedlittle on a seasonal timescale. Even if this interpretation is inerror by 10–20% due to changes in flow outside thechannel axis, the magnitude of the changes in flux allowedare insufficient to account for the seasonal changes involume of IOSW within the Gulf that we observe. Thereis a timing problem as well. The flux of IOSW appears topeak in late spring, whereas outflow of dense water wouldbe expected to peak in winter when Gulf Deep wateroutcrops at the sea surface in the northern third of the Gulf(Figure 5) and the densest water (sq > 29.5) is mostcommon (Figure 6).
[31] Alternatively, the surface influx could be driven byloss of water volume through evaporation. In this hypoth-esis, seasonal changes in water loss through the sea surfaceare compensated by changes in the flux of IOSW throughthe Strait. This is difficult to confirm because seasonalchanges in evaporation rates in the Gulf are uncertain.Privett [1959] computed evaporation rate from shipboardmeteorological observations, and found a peak duringOctober–January and a minimum in May. This pattern isconsistent with Emery’s suggestion that the rate depends onthe relative temperature of air and seawater. Ahmad andSultan [1991] obtained a different seasonal pattern. Theycomputed surface heat fluxes from meteorological observa-tions at Dhahran, Saudi Arabia, and coastal sea surfacetemperature at stations farther up the coast. Their expressionfor latent heat flux is just the product of a constant and theevaporation rate. Their estimate of evaporation peaksbetween June and August, essentially the opposite resultof Privett. The timing of this peak is within two months ofthe late spring intrusion of IOSW. This timing differencecould be due to bias introduced by either the use of datafrom a single station to represent the whole Gulf or the useof onshore meteorological data to represent conditions justabove the sea surface. Peaks in wind speed and minimumsin relative humidity occur in May and June for many coastalmonitoring stations [Perrone, 1979; Brower et al., 1992],consistent with higher evaporation in these months. Clearly,a new survey of evaporation rate and its seasonal and spatialvariability needs to be done to resolve uncertainties inpublished interpretations.
3.4. Deep Water Outflow
[32] As discussed briefly above, Johns and Olson [1998]found relatively little seasonal change in the current speedand thickness of the outflow along the channel axis throughthe Strait of Hormuz. Speeds averaged 20–30 cm/s fromabout 45 m depth to the bottom boundary layer [Johns andZantopp, 1999]. While flow elsewhere in the Strait mayvary seasonally, it seems reasonable to assume that the totalflux also remains relatively constant. This apparent lack ofchange contrasts with the large percentage changes knownto occur in air and sea surface temperature, wind speed, andhumidity that would be expected to produce a excess ofdense, saline water in either winter or summer depending onthe data used to compute evaporation rate (respectively,Privett [1959] and Ahmad and Sultan [1991]). Whereassurface conditions clearly change with season, our dataindicates that neither the salinity nor the density of waterbelow 30–35 m depth in most of the Gulf changes signifi-cantly from January to August. So, we suggest that outflowis driven by a density contrast between this deep water andwater at comparable depths outside the Strait that varies lessthan 10–15%.[33] Salinity of water below the surface layer in parts of
the Gulf changes little during the year. Figures 7a, 7b, 7c,and 7d shows that the cross-section area of salinity values of39.5–41 psu remains nearly the same from January toAugust in the northwest half of the Gulf (boxes 1–8,longitude west of 53�E). Salinity in boxes 9–13 (e.g.,longitude 53�E to 55.5�E) decreases from 40–41 psu inJanuary–February to 39.5–40.5 psu in March–June and to39–40 psu in July–August. Density of deep water, how-
4 - 16 SWIFT AND BOWER: DENSE WATER IN THE PERSIAN/ARABIAN GULF
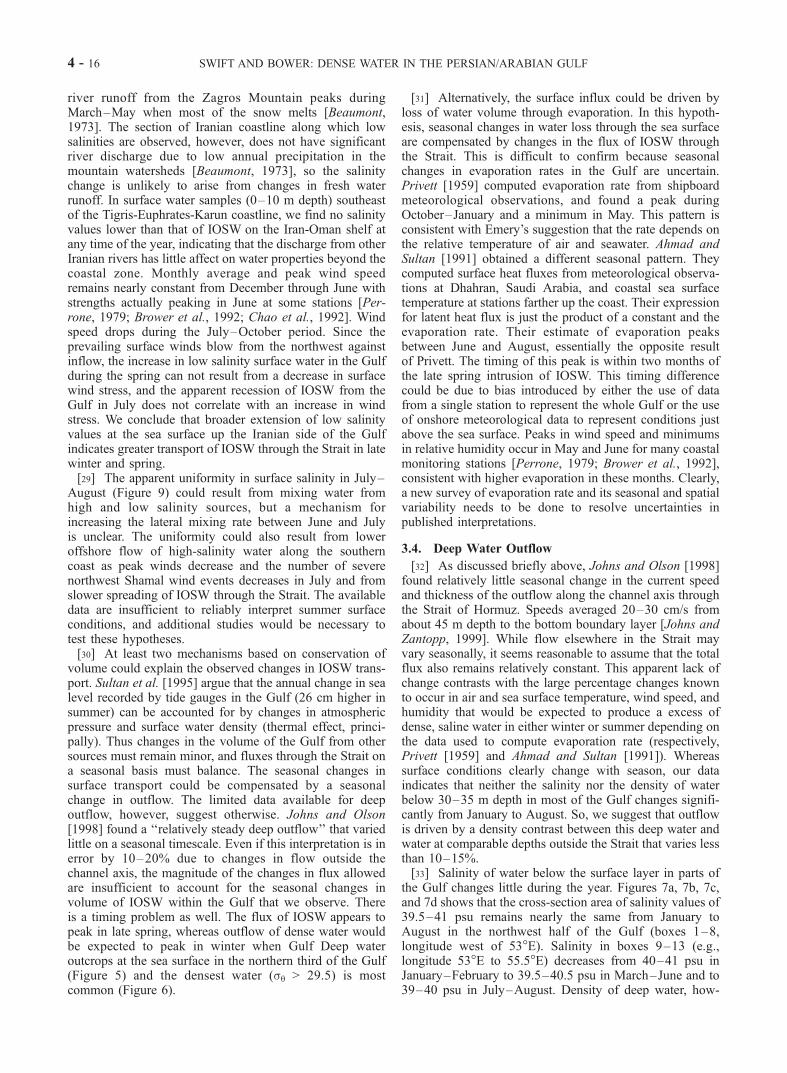
ever, changes significantly only from May–June to July–August, and this change is due to a warming of �2�C ofdeep water, in the Gulf west of 54.5�E (boxes 1–11), and awarming of �4�C in the Strait and its western approaches(boxes 12–16; longitude 54.5�E–57�E). The maps ofsalinity at 50 m depth (Figure 9) indicate only minorchanges during the year.[34] Seasonal changes in the contrast in density between
the interior of the Gulf and the Gulf of Oman are too smallto produce changes in outflow through the Strait. Figure 10summarizes the seasonal trends along the Gulf axis at 50 m.Temporal and spatial patterns for deeper depth intervals aresimilar. In Figure 10 the along-axis salinity distributionremains nearly constant during the year. The temperaturedistribution remains constant from January to June butwarms in July–August. This temperature increase is great-est close to the Strait (boxes 12–16), and, as a result, thedensity distribution flattens. Thus the density gradient fromthe western approaches through the Strait weakens signifi-cantly in summer. Since Johns and Olson [1998] observedthat deep flow through the Strait is relatively constantthroughout the year, deep flow through the Strait is unlikely
to be driven by the local east-west density gradient near theStrait. There is, however, only a small change in the densitydifference between the central Gulf and the Gulf of Omanthrough the year. Density at 50 m remains sq = �25 in theGulf of Oman (boxes 17–18), whereas the density at theother end of the Gulf remains sq = 29–29.5 from January toJune and decreases to sq = 28.5–29 in July–August. Thisdecrease amounts to a change of only 11–12.5%. A changeof comparable magnitude in discharge out of the Gulf maynot be resolved in the Johns and Olson mooring databecause it could be accommodated by small changes inthe thickness of the outflow or by changes in speed or cross-sectional area outside the channel axis. Thus deep flow outof the Gulf is likely driven by the density differencebetween deep water at the head of the gulf and near-bottomwater on the Oman-Iranian shelf.
3.5. Vertical Mixing in the Western Approachto the Strait of Hormuz
[35] Unusually warm water temperatures throughout thewater column characterize the western approach to theStrait of Hormuz in summer (July–August). In the axial
Figure 10. Axial sections at 50 m water depth (see Figure 2 for location of boxes) show little changefrom January to June. In July–August, deep water throughout Gulf warms and its density decreases. Inthe western approach to the Strait (boxes 12–15) this warming is much more dramatic and decreases theslope of the axial gradient in density. We attribute warming in this region to higher year-round rates ofvertical mixing and a warming of sea surface water. The Strait is located at the boundary between boxes15 and 16.
SWIFT AND BOWER: DENSE WATER IN THE PERSIAN/ARABIAN GULF 4 - 17
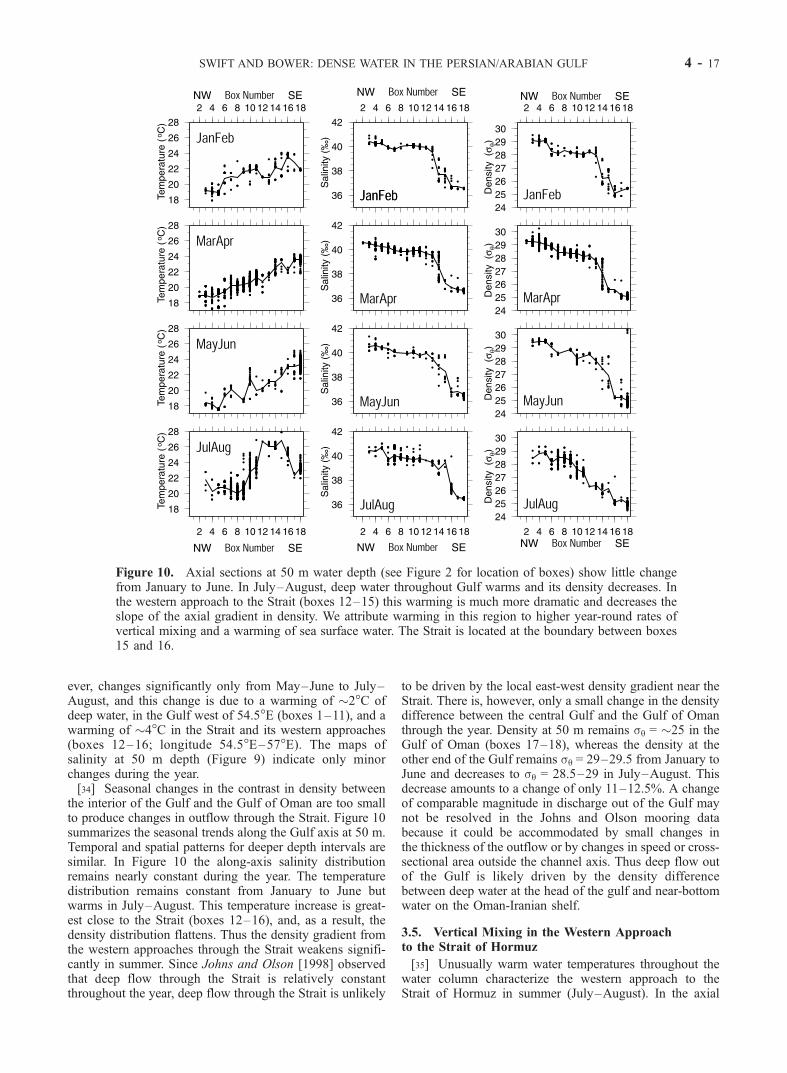
cross-sections through the western approach to the Strait(boxes 12–15, longitude 54.5�–56.5�E, Figure 2 showsbox locations), warmer temperatures and lower densitiesreach closer to the seafloor in July–August than in May–June (Figures 7a, 7b, 7c, and 7d). Warmer than normaltemperatures also appear in plots of properties at 50 mdepth (Figure 10). Between June and July, the temperatureof water at 50 m depth within the Strait and just to the west(boxes 12–16) changes from 0.5–2.5�C less than Gulf ofOman water (box 18) to 1.5–3.0�C warmer than Gulf of
Oman water. Although salinity in boxes 12–16 appears tochange little between June and July in Figure 10, densityclearly decreases. Plots of property versus depth for thewestern approach (bottom two panels in Figure 11) showsimilar temporal changes in temperature and density atmost depths and a decrease in salinity at water depthsbelow 50 m.[36] The unusual conditions are spatially restricted to the
region extending westward from box 16 at the tip of theMusandam Peninsula to about box 12, bounded on the west
Figure 11. Casts made during the transition from spring to summer in boxes 8–9 (lines in top sixpanels) northwest of the high vertical mixing rate region are compared to casts in boxes 13–14 (lines inbottom six panels) inside the western approach to the Strait and to all casts in the Gulf (shaded dots). Inboth regions sea surface temperature and salinity increase between May–June and July–Augustreflecting solar warming and retreat of IOSW. Casts in boxes 8–9 differ little from mean Gulf profiles inboth seasons, showing distinct surface mixed layers and steep seasonal thermoclines. In contrast, thewarm surface temperature and low surface salinity in boxes 13–14 are mixed much deeper reaching tothe seafloor in July–August. As a result, the density increase with depth is uniform without thecharacteristic summer layering elsewhere in the Gulf.
4 - 18 SWIFT AND BOWER: DENSE WATER IN THE PERSIAN/ARABIAN GULF

by 54.5�E longitude. To the east of this region, little changeoccurs at 50 m depth in either temperature or salinitybetween June and July on the continental shelf betweenOman-Iran (box 17) or in the Gulf of Oman (box 18; Figure10). To the west of this region, water temperature at 50 mdepth increases between June and July in box 11 (Figure 10),but salinity and density do not change significantly. Profilesof properties in boxes 8 and 9 show few similarities withprofiles in the western approach (Figure 11). The westernedge defined by water properties appears to occur near threeislands aligned north-south along 54.5�E (Figure 1).[37] Other investigators have found collaborative results.
Emery’s [1956, Figure 5] plot of August temperature showshigh temperatures extending to 45–55 m deeper waterdepths in this region than the central Gulf. Johns and Olson[1998] found that the vertical temperature profile observedat their mooring in the channel west of the Strait becomesmuch warmer in summer. These results suggest that ourobservations are not an artifact of the averaging done in ouranalysis.
[38] The appearance of unusually warm temperaturesthroughout the water column in the western approach tothe Strait coincides with rapid warming of the sea surface.Warming of the sea surface affects the Gulf as a wholethroughout the spring and summer. Figure 11 shows awarming at the sea surface between May–June and July–August of at least 3�C in axial boxes 13 and 14 and at least4�C in boxes 8 and 9 in the central Gulf. Sea surfacetemperature increases of 3–6�C occur throughout the Gulfbetween month pairs during the spring (Figure 11). ByJuly–August the sea surface in the Gulf has a nearlyuniform temperature of 30–32�C, which is identical to thatof the sea surface in the Gulf of Oman (Figure 12). Since thewarming appears so uniform across the Gulf throughout thespring and summer and coincides with the development of asteep seasonal thermocline [Reynolds, 1993], we attributethe temperature increase to solar heating rather than toinflux of warm surface water from the Gulf of Oman.[39] We suggest that warm water temperatures observed at
50m depth in the western approaches to the Strait (Figure 10)
Figure 12. Axial sections at the sea surface (0 m water depth; see Figure 2 for location of boxes) showdramatic warming, especially in the late spring and summer. In July–August, sea surface temperature inthe Gulf becomes nearly uniform with little difference across the Strait (boxes 15–16). In contrast,salinity changes little from January to June. In July–August, surface salinity decreases at the head of theGulf (boxes 1–4) but increases elsewhere as low salinity IOSW retreats to the Strait. Throughout theyear, density decreases toward the Strait reflecting the gradients in salinity and temperature. The gradientdecreases only slightly in the summer. In winter, high density water (sq > 29.5) reaches the sea surface atthe head of the Gulf.
SWIFT AND BOWER: DENSE WATER IN THE PERSIAN/ARABIAN GULF 4 - 19
are due to higher rates of vertical mixing there than else-where. As the surface water warms during the spring andsummer, the higher temperatures are mixed downward tonear-bottom depths. The difference in temperature betweenthe surface and 50 m depth is 5–6�C in both the May–Juneand July–August periods indicating that the mixing ratedoes not change significantly with time. Thus the spike intemperatures at 50 m depth during July–August in Figure 10is due to spatial variation in vertical mixing rather thantemporal variation. Large, irregular vertical variations intemperature and salinity, as well as density inversions, aremore common in the western approach to the Strait thanelsewhere (Figure 11). Although direct measurements ofvertical mixing have yet to be made, vertical mixing appearsto be more effective in the western approach to the Strait ofHormuz than in the central Gulf to the north and higher thanthe rate on the Oman-Iran continental shelf and Gulf ofOman outside the Strait.[40] The alternative hypothesis that there is a temporal
change in vertical mixing suffers for lack of a feasibleexplanation. There are no changes in meteorological forc-ing, of which we are aware, that would cause verticalmixing of warm surface water to deeper depths to increaseat the beginning of July. Although there is change inprevailing wind direction in the Strait itself between Juneand July, coincident with the strengthening of the summermonsoon, mean wind speed drops between the two months[Brower et al., 1992]. The incidence of storms in the Gulfdecreases at the beginning of July [Perrone, 1979]. Newdata in the future may reveal a source of forcing, but spatialvariability in mixing appears to explain more observationsat the present time.[41] Another alternative hypothesis is that the warm
temperatures at 50 m depth indicate the advection into theStrait of warm, salty water formed on the shallow banks to thesouth off the UAE. Unfortunately, there are no hydrographictransects across the southern edge of the Strait onto the UAEshelf in July–August (Figure 3), so direct data to confirm thisinterpretation is lacking. Indirectly, warm temperatures areconsistent with this notion, but the maps of salinity at 50 mdepth (Figure 9), however, indicate the salinity of most of thewater at 50 m depth does not change significantly betweenMay–June and July–August. Moreover, vertical profiles ofsalinity below 20 m depth (Figure 11) indicate that thesalinity of water in the western approach is lower than salinityelsewhere in the basin rather than higher. Introduction of anew summer water mass from off the coasts flanking theStrait is unlikely because the higher temperatures we findare typically accompanied by normal or lower salinity,whereas high salinities, as well as high temperatures, arecommon in bays and on shallow banks of the Gulf insummer [Sugden, 1963; Chandy et al., 1990]. New warmwater from the coast should produce a characteristicsalinity signal that we don’t observe. High rates of verticalmixing accompanied by surface heating is a more likelyexplanation.[42] We suggest that the reason for high rates of vertical
mixing in the western approach to the Strait is interaction oftidally forced flow with seafloor topography. Whereas theIran-Oman shelf to the east of the Strait is open and largelyfree of seafloor shallower than 50 m, the western approachto the Strait includes numerous islands, shoals, and irregular
changes in channel depth. The northern edge of theapproach is forced southward at least 18 km off the westerntip of Qeshm Island by a broad, shallow flat formed byriver-supplied sediment (Figure 1; see also Figures 1 and 14of Uchupi et al. [1996]). Islands in the approach are perchedon submarine pedestals 11–15 km across in a north-southdirection that further constrict currents (Figures 1 and 2).Tidal flows near these islands are likely to be as acceleratedby the topographic narrowing of the channel, as tides arearound the tip of the Musandam Peninsula. We suggest thatthese accelerations are accompanied by formation of eddiesand higher rates of vertical mixing that reach to the seafloor.There is geological evidence for this hypothesis. Seafloordepths reach 50–80 m deeper in channels that split to thenorth and south of some of these islands indicating thatseafloor sediment is eroded by turbulent boundary layercurrents. The only significant occurrence of gravel in theGulf occurs in these channels and those that bend aroundthe tip of the Musandam Peninsula [Emery, 1956; Hartmannet al., 1971], indicating that scour driven by turbulent eddiesis most effective there. West of the islands along 54.5�E,fewer topographic constrictions occur, so vertical mixingrates are lower.
4. Conclusions
[43] Seasonal and spatial variations in hydrographic datacollected in the Persian/Arabian Gulf indicate features ofwater mass formation and circulation that have not beenpreviously described.1. The densest water forms during winter in shallow
water at the northern end of the Gulf. The densestisopycnals outcrop there from January to April.2. High salinity water forms along the western and
southern Arabian coastlines, but the highest densities are notobserved there because winter temperatures are milder thanthose in the north and considerable dilution occurs beforehigh salinity water formed in shallow bays reaches the mainGulf basin.3. A prominent pycnocline separates modified IOSW at
the surface from Gulf Deep Water below. The densitygradient is continuous with a front that separates IOSWfrom higher-salinity shelf water along the southern coast.The deeper isopycnals in the pycnocline intersect theseafloor in the Strait and upper isopycnals outcrop at the seasurface in the interior of the basin. Evidence suggests thatthere is little shear associated with the density gradient, andthat Gulf Deep Water exiting the Gulf is modified by mixingacross the density gradient.4. The flow of modified IOSW into the Gulf, forming a
low-salinity surface layer, peaks in May–June. Seasonalchanges in the flux of IOSW may be driven by changes insea surface slope caused by varying rates of evaporation.5. We attribute the lack of significant seasonal variability
in the flux through the Strait reported by Johns and Olson[1998] to relatively small seasonal changes in the densitycontrast between Gulf Deep Water and water at comparabledepths on the Oman-Iran continental shelf outside the Strait.6. Compared to the Gulf as a whole and the continental
shelf outside the Gulf, the rate of vertical mixing is highestin the Strait of Hormuz channel around the MusandamPeninsula and in the 200 km long western approach to the
4 - 20 SWIFT AND BOWER: DENSE WATER IN THE PERSIAN/ARABIAN GULF

Strait. This distinction appears to be unrelated to meteor-ological forcing. We attribute the high rate to numeroustopographic features that constrict the channel, acceleratingtidal flows and generating large eddies capable of scouringthe seafloor.
[44] Acknowledgments. We are grateful to Carol Alessi and HeatherHunt Furey for organizing, editing, and maintaining the historical hydro-graphic database used here. We appreciate the discussions and reportsshared with us by W.E. Johns, RSMAS, Univ. Miami. E.J. Simmonds at theMarine Laboratory Aberdeen kindly provided a copy of the R/V Lemurudata. We thank P. Wessel and W. Smith for Generic Mapping Tools, used toprepare all figures. This work was supported by the U.S. Office of NavalResearch under grant N00014-00-1-0688. Woods Hole Oceanographiccontribution 10625.
ReferencesAbdelrahman, S. M., and F. Ahmad, A note on the residual currents in theArabian Gulf, Cont. Shelf Res., 15, 1015–1022, 1995.
Ahmad, A., and S. A. R. Sultan, Annual mean surface heat fluxes in theArabian Gulf and the net heat transport through the Strait of Hormuz,Atmos. Ocean, 29, 54–61, 1991.
Alessi, S. A., H. D. Hunt, and A. S. Bower, Hydrographic data from theU. S. Naval Oceanographic Office: Persian Gulf, southern Red Sea, andArabian Sea 1923–1996, Tech. Rep. WHOI-99-02, 70 pp., Woods HoleOceanogr. Inst., Woods Hole, Mass., 1999.
Beaumont, P., River regimes in Iran, Dep. of Geogr. Occas. Publ. (NewSer.) 1, 29 pp., Univ. of Durham, Durham, UK, 1973.
Bower, A. S., H. D. Hunt, and J. F. Price, Character and dynamics of theRed Sea and Persian Gulf outflows, J. Geophys. Res., 105, 6387–6414,2000.
Brewer, P. G., and D. Dyrssen, Chemical oceanography of the Persian Gulf,in Essays on Oceanography: A Tribute to John Swallow, edited byJ. Crease, W. J. Gould, and P. M. Saunders, Prog. Oceanogr., 14, 41–55, 1984.
Brewer, P. G., A. P. Fleer, D. K. Shafer, and C. L. Smith, Chemical oceano-graphic data from the Persian Gulf and Gulf of Oman, Tech. Rep. WHOI-78-37, 105 pp., Woods Hole Oceanogr. Inst., Woods Hole, Mass., 1978.
Brower, W. A., Jr., R. G. Baldwin, and P. L. Franks, U. S. Navy regionalclimatic study of the Persian Gulf and the northern Arabian Sea, 272 pp.,Natl. Clim. Data Cent., Ashville, N. C., 1992.
Chandy, J. V., S. L. Coles, and A. I. Abozed, Seasonal cycles of tempera-ture, salinity and water masses of the western Arabian Gulf, Oceanol.Acta, 13, 273–281, 1990.
Chao, S.-Y., T. W. Kao, and K. R. Al-Hajri, A numerical investigation ofcirculation in the Arabian Gulf, J. Geophys. Res., 97, 11,219–11,236,1992.
Dubach, H. W., A summary of temperature-salinity characteristics of thePersian Gulf, Gen. Ser. Publ. G-4, 223 pp., Natl. Oceanogr. Data Cent.,Ashville, N. C., 1964.
Eid, F. M., and A. A. El-Gindy, The seasonal changes of the circulationpattern in the Arabian Gulf deduced from the field of mass, Arab GulfJ. Sci. Res., 16, 45–63, 1998.
Emery, K. O., Sediments and water of the Persian Gulf, AAPG Bull., 40,2354–2383, 1956.
Hartmann, M., H. Lange, E. Seibold, and E. Walger, Oberflachensedimentein Persichen Golf and Golf von Oman, I, Geologisch-hydrologischerRahmen und erste sedimentologische Ergebnisse, Meteor Forschungser-geb., Reihe C, 4, 1–76, 1971.
Hunter, J. R., Aspects of the dynamics of the residual circulation of theArabian Gulf, in Coastal Oceanography, edited by H. G. Gade, A. Ed-wards, and H. Svendsen, pp. 31–42, Plenum, New York, 1983.
Johns, W. E., and D. B. Olson, Observations of seasonal exchange throughthe Strait of Hormuz, Oceanography, 11, 58, 1998.
Johns, W. E. and R. J. Zantopp, Data report for the Strait of HormuzExperiment, December 1996–March 1998, Tech. Rep. 99-001, Rosen-stiel Sch. of Mar. and Atmos. Sci., Univ. of Miami, Miami, Fla., 1999.
Kappus, U., J. M. Bleek, and S. H. Blair, Rainfall frequencies for thePersian Gulf coast of Iran, Hydrol. Sci. Bull., 23, 119–129, 1978.
Lardner, R. W., A. H. Al-Rabeh, N. Gunay, M. Hossain, R. M. Reynolds,and W. J. Lehr, Computation of the residual flow in the gulf using the Mt.Mitchell data and the KFUPM/RI hydrodynamical models, Mar. Pollut.Bull., 27, 61–70, 1993.
Matsuyama, M., T. Senjyu, T. Ishimaru, Y. Kitade, Y. Koike, A. Kitazawa,T. Miyazaki, and H. Hamada, Density front in the Strait of Hormuz,J. Tokyo Univ. Fish., 81, 85–92, 1994.
Matsuyama, M., Y. Kitade, T. Senjyu, Y. Koike, and T. Ishimaru, Verticalstructure of a current and density front in the Strait of Hormuz, in Off-shore Environment of the ROPME Sea Area After the War-Related OilSpill: Results of the 1993–94 Umitaka-Maru Cruises, edited by A. Ot-suki, M. Y. Abdulraheem, and R. M. Reynolds, pp. 23–34, Terra Sci.,Tokyo, 1998.
Olson, D. B., G. L. Hitchcock, R. A. Fine, and B. A. Warren, Maintenanceof the low-oxygen layer in the central Arabian Sea, Deep Sea Res., 40,673–685, 1993.
Otsuki, A., M. Y. Abdulraheem, and R. M. Reynolds (Ed.), Offshore En-vironment of the ROPME Sea Area After the War-Related Oil Spill:Results of the 1993–94 Umitaka-Maru Cruises, Terra Sci., Tokyo, 1998.
Perrone, T. J., Winter shamal in the Persian Gulf, Tech. Rep. 79-06, 180 pp.,Naval Environ. Predict. Res. Facil., Monterey, Calif., 1979.
Prasad, T. G., M. Ikeda, and S. P. Kumar, Seasonal spreading of the PersianGulf Water mass in the Arabian Sea, J. Geophys. Res., 106, 17,059–17,071, 2001.
Premchand, K., J. S. Sastry, and C. S. Murty, Watermass structure in thewestern Indian Ocean, part II, The spreading and transformation of thePersian Gulf Water, Mausam, 37, 179–186, 1986.
Privett, D. W., Monthly charts of evaporation from the North Indian Ocean,including the Red Sea and the Persian Gulf, Q. J. R. Meterol. Soc., 85,424–428, 1959.
Qasim, S. Z., Oceanography of the northern Arabian Sea, Deep Sea Res.,29, 1041–1068, 1982.
Reynolds, R. M., Physical oceanography of the Gulf, Strait of Hormuz, andthe Gulf of Oman—Results from the Mt. Mitchell expedition, Mar. Pol-lut. Bull., 27, 35–59, 1993.
Rochford, D. J., Salinity maxima in the upper 1000 metres of the northIndian Ocean, Aust. J. Mar. Freshwater Res., 15, 1–24, 1964.
Ross, D. A., E. Uchupi, and R. S. White, The geology of the Persian Gulf-Gulf of Oman Region, Rev. Geophys., 24, 537–556, 1986.
Schott, G., Der salzgehalt des Persischen Golfes und der angrenzendenGewasser, Ann. Hydrograph. Maritimen Meteorol., 36, 296–299, 1908.
Seibold, E., and J. Ulrich, Zur Bodengestalt des nordwestlichen Golfs vonOman, Meteor Forschungsergeb., Reihe C, 3, 1–14, 1970.
Simmonds, E. J. and M. Lamboeuf, Environmental conditions in the Gulfand Gulf of Oman (November 1976–January 1979), Environmental con-ditions in the Gulf and Gulf of Oman and their influence on the propaga-tion of sound, 62 pp., Reg. Fish. Surv. and Dev. Proj., Food and Agric.Organ., Rome, Italy, 1981.
Sugden, W., The hydrology of the Persian Gulf and its significance inrespect to evaporite deposition, Am. J. Sci., 261, 741–755, 1963.
Sultan, S. A. R., and N. M. Elghribi, Temperature inversion in the ArabianGulf and the Gulf of Oman, Cont. Shelf Res., 16, 1521–1544, 1996.
Sultan, S. A. R., F. Ahmad, N. M. Elghribi, and A. M. Al-Subhi, Ananalysis of Arabian Gulf monthly mean sea level, Cont. Shelf Res., 15,1471–1482, 1995.
Uchupi, E., S. A. Swift, and D. A. Ross, Gas venting and late Quaternarysedimentation in the Persian (Arabian ) Gulf, Mar. Geol., 129, 237–269,1996.
Wyrtki, K., Oceanographic Atlas of the International Indian Ocean Expe-dition, 531 pp., Natl. Sci. Found., Washington, D. C., 1971.
Wyrtki, K., Physical oceanography of the Indian Ocean, in The Biology ofthe Indian Ocean, edited by B. Zeitzschel, pp. 18–36, Springer-Verlag,New York, 1973.
�����������������������A. S. Bower and S. A. Swift, Woods Hole Oceanographic Institution, MS
24, Woods Hole, MA 02543, USA. ([email protected])
SWIFT AND BOWER: DENSE WATER IN THE PERSIAN/ARABIAN GULF 4 - 21
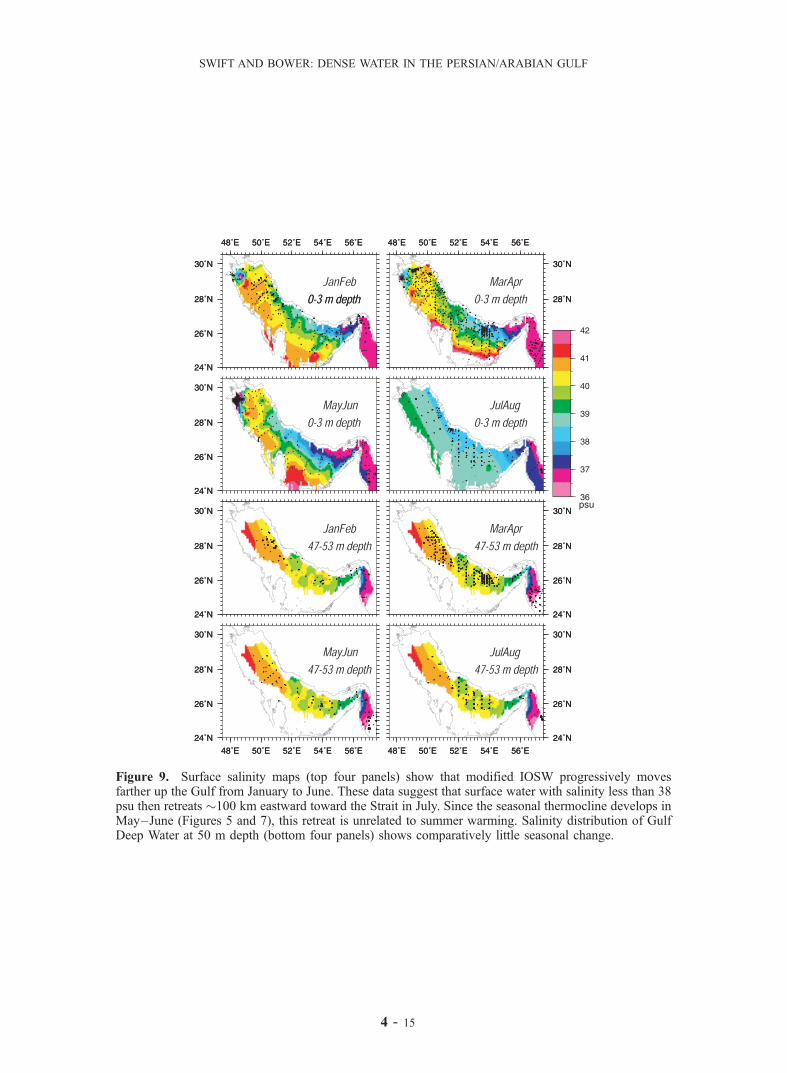
Figure 9. Surface salinity maps (top four panels) show that modified IOSW progressively movesfarther up the Gulf from January to June. These data suggest that surface water with salinity less than 38psu then retreats �100 km eastward toward the Strait in July. Since the seasonal thermocline develops inMay–June (Figures 5 and 7), this retreat is unrelated to summer warming. Salinity distribution of GulfDeep Water at 50 m depth (bottom four panels) shows comparatively little seasonal change.
4 - 15
SWIFT AND BOWER: DENSE WATER IN THE PERSIAN/ARABIAN GULF