Embed Size (px)
Citation preview
Water formation at the cathode and sodium recovery using Microbial fuel cells (MFCs)
Iwona Gajdaa, John Greenmana,b, Chris Melhuisha, Carlo Santoroc,d, Baikun Lic,d, Pierangela
Cristianie, Ioannis Ieropoulosa,b*
aBristol Robotics Laboratory, Block T , UWE, Bristol, Coldharbour Lane, Bristol BS16 1QYbSchool of Life Sciences, UWE, Bristol, Coldharbour Lane, Bristol BS16 1QY
cDepartment of Civil and Environmental Engineering, University of Connecticut, 261 Glenbrook rd, Storrs, CT 06269, USA dCenter for Clean Energy Engineering, University of Connecticut,44 Weaver rd, Storrs, CT 06269, USA
eRSE – Ricerca sul Sistema Energetico S.p.A., Environment and Sustainable Development Dept., Via Rubattino 54, 20134
Milan, Italy
Abstract
Microbial Fuel Cells (MFCs) utilise biodegradable carbon compounds in organic waste to
generate electric current. The aim of this work was to enhance MFC performance by using
low cost and catalyst (platinum)-free cathode materials. The results showed that the range of
Pt-free cathodes including activated carbon, plain carbon fibre veil with and without
microporous layer (MPL) in two-chamber MFC generated power with simultaneous catholyte
generation in the cathode chamber. This is the first time to report a clear catholyte formation
on the cathode half cell, which was directly related to MFC power performance. The
importance of this phenomenon may be attributed to the oxygen reduction reaction, water
diffusion and electroosmotic drag. The synthesised catholyte in situ on the open-to-air
cathode appeared to be sodium salts (9% concentration), which was recovered from the
anolyte feedstock containing sludge and sodium acetate. An overlooked benefit of catholyte
formation and accumulation contributes greatly to the overall wastewater treatment, water
recovery, bioremediation of salts and carbon capture.
Keywords: Microbial Fuel Cell (MFC), carbon veil cathodes, Microporous Layer (MPL),
electroosmotic drag, oxygen reduction reaction, wet scrubbing
1. Introduction
The world of the 21st century is facing shortages in fresh water as well as increased electricity
demand, which is inspiring the development of new, alternative technologies of wastewater
treatment and power generation. One of the most promising solutions, addressing both
challenges, is the Microbial Fuel Cell (MFC) technology, whose bio-catalytic activity of
1
2
3456789
10
11
12
13
14
15
16
17
18
19
20
21
22
23
24
25
26
27
28
29
30
31
32
microbes digesting organic matter allows the direct generation of electricity [1]. Biomass in
wastewater contains a significant amount of energy, and its utilisation as a power source may
have an important role in helping to secure a sustainable future. The most attractive aspect of
the process is that the generation of electricity from wastewater is resulting in cleaner waste.
The Microbial Fuel Cell (MFC) comprises an anode and a cathode chambers, separated by a
proton selective membrane. The electrons are generated by the metabolic pathways of the
microbes digesting biomass into CO2, electrons and protons. For each electron that is
produced, an equivalent proton must be transported to the cathode through the electrolyte,
which sustains the current flow. The oxygen reduction reaction (ORR) at the
membrane/cathode interface consumes oxygen and generates water or hydrogen peroxide.
According to Kinoshita [2], under alkaline conditions, the H2O2 is then transformed from both
electrochemical and chemical processes [2].
Peroxide pathway in alkaline solutions
O2 +H2O +2e- → HO2- +OH-
Followed by reduction of peroxide:
HO2- + H2O +2e- → 3 OH-
or decomposition :
2 HO2- - → 3 OH- + O2
Air cathode MFCs are the most promising configuration for practical applications including
wastewater treatment and power generation due to their improved electrical power output and
operational simplicity [3]. However, the ORR of a working MFC in comparison to chemical
fuel cells is limited due to the MFC neutral pH and ambient operating temperature. Overall,
the cathode is being usually the limiting factor for power generation, which hinders the
overall system performance. [4, 5]. The utilization of platinum as a cathode catalyst would
certainly enhance the overall performances but it would elevate the total MFC cost.
Unfortunately, the platinum would have also been poisoned by a non-sterile environment in a
relatively short amount of time [6]; therefore there is a critical need for low-cost catalysts for
future long-term MFC applications. Materials with high surface area and different surface
treatments have been used to increase the rate of ORR and improve the overall MFC
performance. For example, granular graphite, micro-porous layer and activated carbon, have
33
34
35
36
37
38
39
40
41
42
43
44
45
46
47
48
49
50
51
52
53
54
55
56
57
58
59
60
61
62
been reported to support cathodic oxygen reduction due to the very large specific surface area
[7-9] and high porosity that would also improve the water management.
In Proton Exchange Membrane Fuel Cells (PEMFCs) the water management is critical for
achieving high performance. The polymer exchange membrane requires to be sufficiently
hydrated to maintain high ionic conductivity. During fuel cell operation, water molecules
migrate through the membrane due to electro-osmotic drag and diffusion and water is also
being generated at the cathode/membrane interface due to the ORR. If the water generated is
not removed, cathode flooding may hinder the oxygen transport on the catalyst active sites
and severely penalize the output [10]. In PEMFCs, the liquid water transport mechanism is
one of the most dominant parameter influencing the performance of the cathode and current
density-based loss distribution [11]. Water is also essential for the operation of MFC,
providing an electrolyte bridge between anolyte, membrane and the cathode, however, there
are very few MFC works studying water production (via oxygen reduction), water transport
from the anode and its sufficiency for supporting cathode reaction [12]; thus, in the open to
air cathode design an external supply of water is necessary [13]. In addition, it has been found
that in MFCs cations, other than protons, are more likely to complete the circuit via
transportation from the anode to the cathode [14] allowing their recovery from wastewater.
With the ionic movement that will drag water molecules through electroosmosis, water also
can be recovered. Similar concept has been recently utilized for bioelectrochemical systems
with the purpose of desalinization of water [15]. Moreover it has also been recognised that
the flooding of the cathode is a negative factor in MFCs [16] attributing it to hindered oxygen
mass transfer by catalyst sites filled with water and pursuing a direction of development for
anti-flooding binders [17]. However, from the wastewater treatment point of view, the
formation and accumulation of catholyte might serve as a huge advantage to the MFC
technology if catholyte flooding is correctly managed. This can be achieved through the
cathode electrode design and its configuration within the reactor. The generated or
transported water from the anolyte to the cathode chamber in the MFC system plays an
important role in wastewater treatment as an additional waste cleanup method, synthesis and
bioremediation (recovery) of elements.
This work aims to: (i) explore the water transport phenomenon in the dual-chamber MFC
system in relation to power production in order to understand the mechanism of catholyte
flow on carbon porous electrodes as an opportunity for biosynthesis, remediation and
recovery of useful components from the wastewater. (ii) Present for the first time the
63
64
65
66
67
68
69
70
71
72
73
74
75
76
77
78
79
80
81
82
83
84
85
86
87
88
89
90
91
92
93
94
95
catholyte formation in situ on the range of carbon based cathode electrodes; and (iii) analyse
the produced catholyte in terms of its salt composition and other elements from the anodic
wastewater, and its potential for carbon capture in wet scrubbing open to air cathode MFCs.
2. Materials and Methods
2.1. MFC design and operation
Twelve tested MFC reactors comprised 25mL anode chambers and 25mL cathode chambers
as previously described [18] separated by a cation exchange membrane (CMI Membranes
International, USA). Already established and well matured anodes were used from previous
MFC experiments, which have been running for at least 6 months under pseudo steady-state
conditions. Anode electrodes were made from carbon fibre veil with a carbon loading of
20g/m2 (PRF Composite Materials, Poole, Dorset, UK) and had a total macro surface area of
270cm², folded into 3D rectangular cuboids (geometric surface area of 36cm2) in order to fit
into the chamber and be fully suspended in the anolyte fluid. The cathode electrodes were
used as shown in Table 1 and placed in transparent MFC chambers with 2 vents (0.3mm
diameter) at the top. The anolyte was recirculated using a 16-channel peristaltic pump (205U,
Watson Marlow, UK) with a flow rate of 47mL/h. The tubing was made of silicone, its length
was 40cm from the pump to the MFC, 40cm from the MFC to the 1L anolyte reservoir and
90cm from the reservoir back to the pump, periodically supplemented with fresh sludge
mixed with 20mM sodium acetate as a carbon-energy (C/E) source, in order to maintain C/E-
replete conditions and avoid having the anode as the limiting half-cell.
2.2. Cathode electrodes preparation
The same folded carbon veil electrode used for the anode was used as the control for the
cathode (CV) and was the only type of 3D cathode electrode used. Microporous layer on
carbon cloth and on carbon veil was prepared as previously described [19]. Activated carbon
(activated charcoal, BET area of 802 m2g-1, Calgon, Pittsburgh, PA) was prepared with a
loading of 60±2 mgAC cm-2 and PTFE (20%wt) were mixed using a blender and pressed on a
30% wt PTFE treated carbon cloth (Fuel Cell Earth) that was used as the current collector in
MFCs. The AC cathodes were prepared under pressure force (1400 psi) for 2 minutes and
then heated at 200°C for 1 hour [20].
96
97
98
99
100
101
102
103
104
105
106
107
108
109
110
111
112
113
114
115
116
117
118
119
120
121
122
123
124
125
The cathode chamber had the additional hollow space at the bottom and included a syringe to
allow the collection of the catholyte produced (see Fig.2). All 12 MFCs were divided in 4
experimental groups of identical triplicates (Table 1). No catalysts or buffers were used.
Table 1. Types of electrodes in the open to air cathode half cells.
Electrode Name Electrode Type Cathode type, size
CV Carbon veil (Control) folded 3Dimensional (folded), 270cm2
MPL Carbon cloth with Microporous layer 2D 10cm2
CV MPL Carbon veil with Microporous layer 2D 10cm
AC Activated carbon on carbon cloth 2D 10cm2
2.3. Measurement and Calculation
Voltage (V) was measured in millivolts (mV) and monitored using an ADC-24 Channel Data
Logger (Pico Technology Ltd., Cambridgeshire, U.K.), recorded data were processed using
GraphPad Prism® version 5.01 software package (GraphPad, California, U.S.A.). Current in
amperes (A) was determined using Ohm’s law, I=V/R, where (R) is the external resistor load
in ohms (Ω). Power in watts (W) was calculated using Joule’s law P=IV. Polarisation
experiments were performed by connecting a variable resistor, with a range between
30,000Ω-10Ω. Resistance was changed every 3 minutes, with data recorded every 30
seconds. Anodes were inoculated with anaerobic activated sludge provided by the Wessex
Water Scientific Laboratory (Saltford, UK). Sludge was mixed with 20mM acetate and used
as feedstock. Anodes were connected to the 16-channel peristaltic pump (205U, Watson
Marlow, Falmouth, UK) with the use of silicon tubing and 1L of anolyte bottle to maintain
anolyte recirculation at flow rate of 47 mL/h.
2.4. Analysis of the accumulated catholyte”water”
The pH was measured with Hanna 8424 pH meter (Hanna, UK) and the conductivity with
470 Jenway conductivity meter (Camlab, UK). Dry weight of precipitated salts was
determined by drying 0.5mL of catholyte over 48h and weighing the dry mass. Samples were
prepared for SEM microscopy by sputter coating in gold using an Emscope SC500 sputter
coating unit. Images were observed and captured using a Philips XL30 scanning electron
126
127
128
129
130
131
132
133
134
135
136
137
138
139
140
141
142
143
144
145
146
147
148
149
microscope (SEM). Energy dispersive x-ray (EDX) analysis was performed (Philips XL30
SEM) and it was used to determine elements present in precipitated cathodic salts. Detection
limits are typically 0.1-100%wt. The ICP-OES (Varian Inc. Vista-Pro ICP-OES using Axial
Plasma) was used for metal analysis of the catholyte samples. GC-MS was performed to
determine organic compounds in the collected catholyte by liquid extraction 1:1 with ethyl
acetate. XRD (X-ray Diffraction) analysis on precipitated salts from the catholyte was
determined using powder measurements, performed on a Bruker D8 Advance Diffractometer
with the results being analysed using EVA software package (Bruker, UK). For the single
crystal measurement, a unit cell check was performed on a Bruker Microstar Cu-anode 4-
circle diffractometer with the results being analysed with APEX II (Bruker, UK)
3. Results and Discussion
3.1. Polarisation experiments of cathode materials
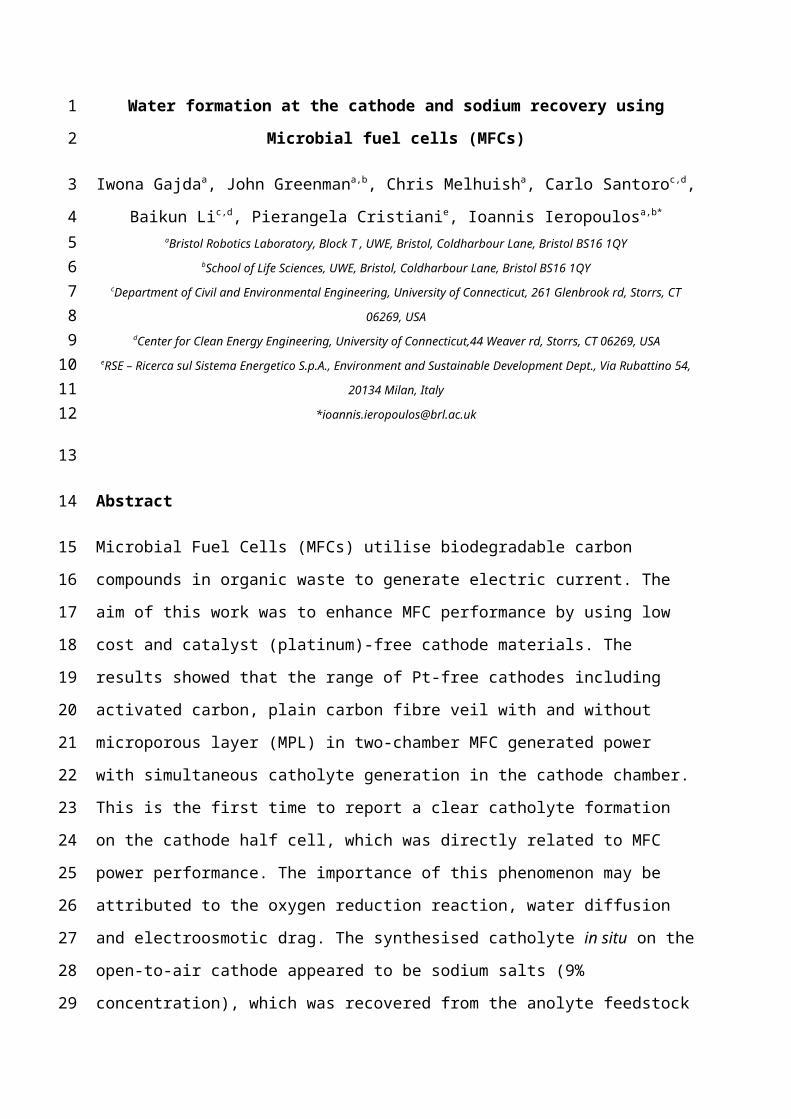
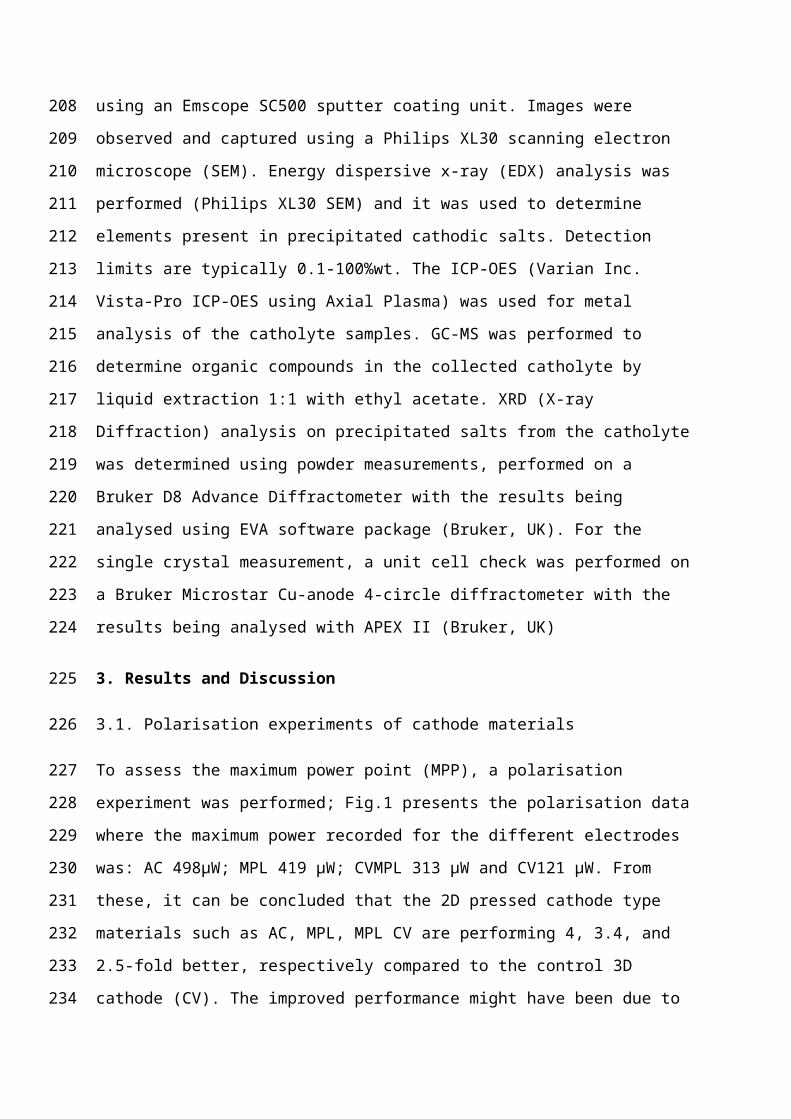
To assess the maximum power point (MPP), a polarisation experiment was performed; Fig.1
presents the polarisation data where the maximum power recorded for the different electrodes
was: AC 498μW; MPL 419 μW; CVMPL 313 μW and CV121 μW. From these, it can be
concluded that the 2D pressed cathode type materials such as AC, MPL, MPL CV are
performing 4, 3.4, and 2.5-fold better, respectively compared to the control 3D cathode (CV).
The improved performance might have been due to the higher specific surface area of the
activated carbon in AC and MPL and the better contact with the PEM, which might have
resulted in an improved ORR rate.
150
151
152
153
154
155
156
157
158
159
160
161
162
163
164
165
166
167
168
169
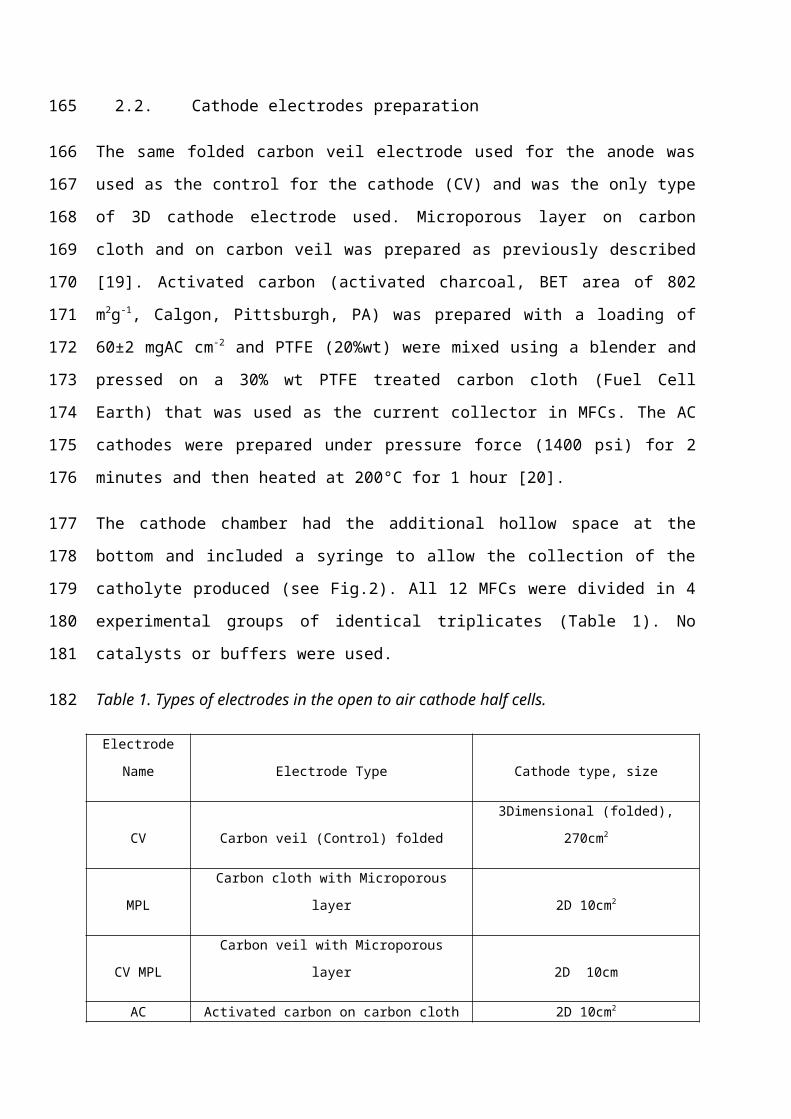
Figure 1. Polarisation data of all tested MFCs (mean value of tiplicate MFCs)
3.2. Catholyte accumulation
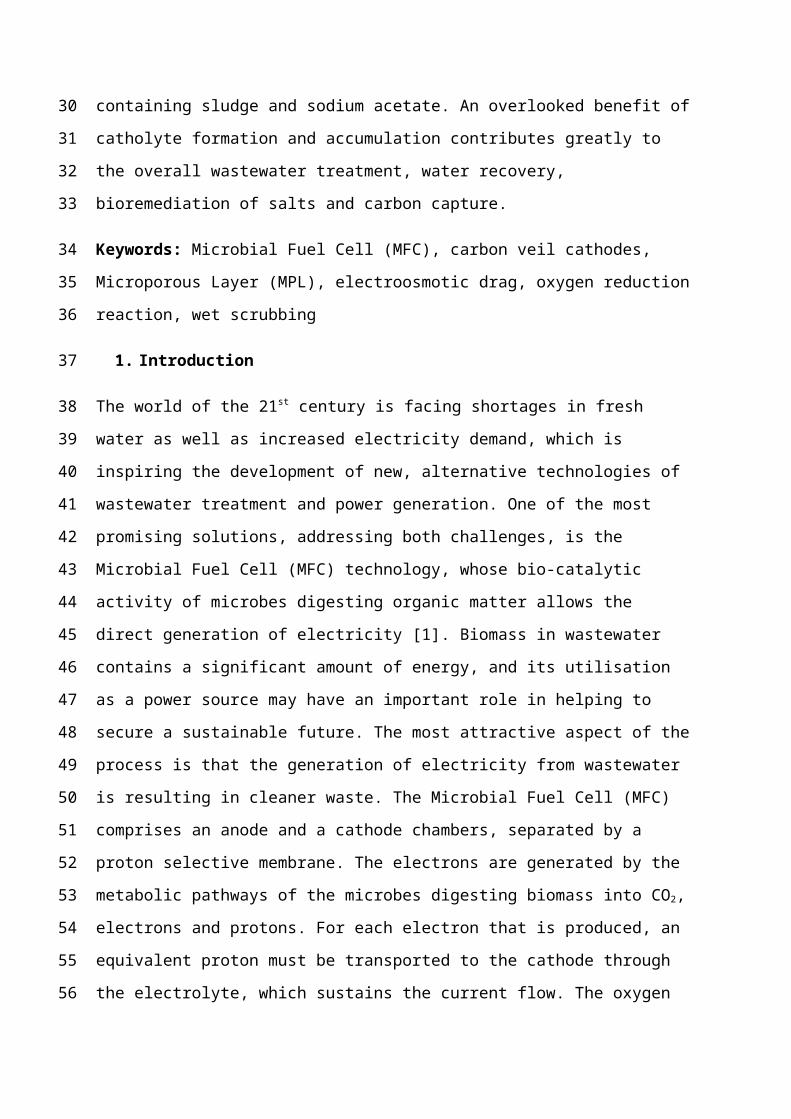
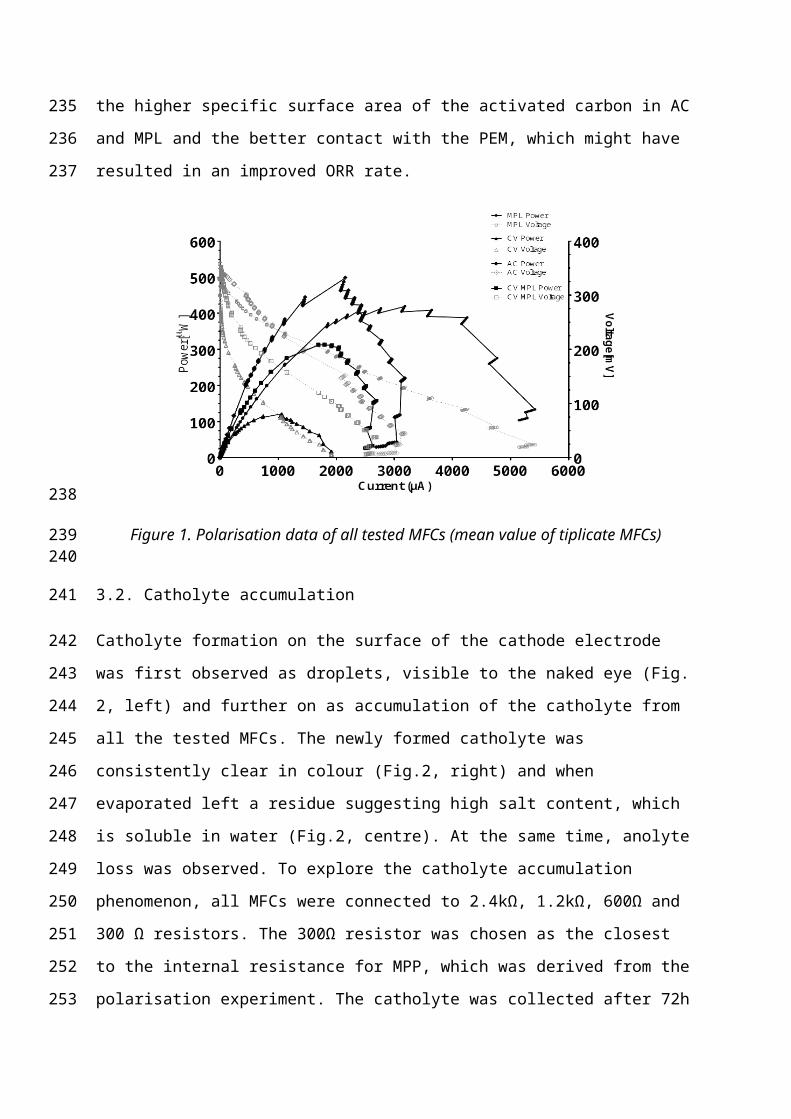
Catholyte formation on the surface of the cathode electrode was first observed as droplets,
visible to the naked eye (Fig. 2, left) and further on as accumulation of the catholyte from all
the tested MFCs. The newly formed catholyte was consistently clear in colour (Fig.2, right)
and when evaporated left a residue suggesting high salt content, which is soluble in water
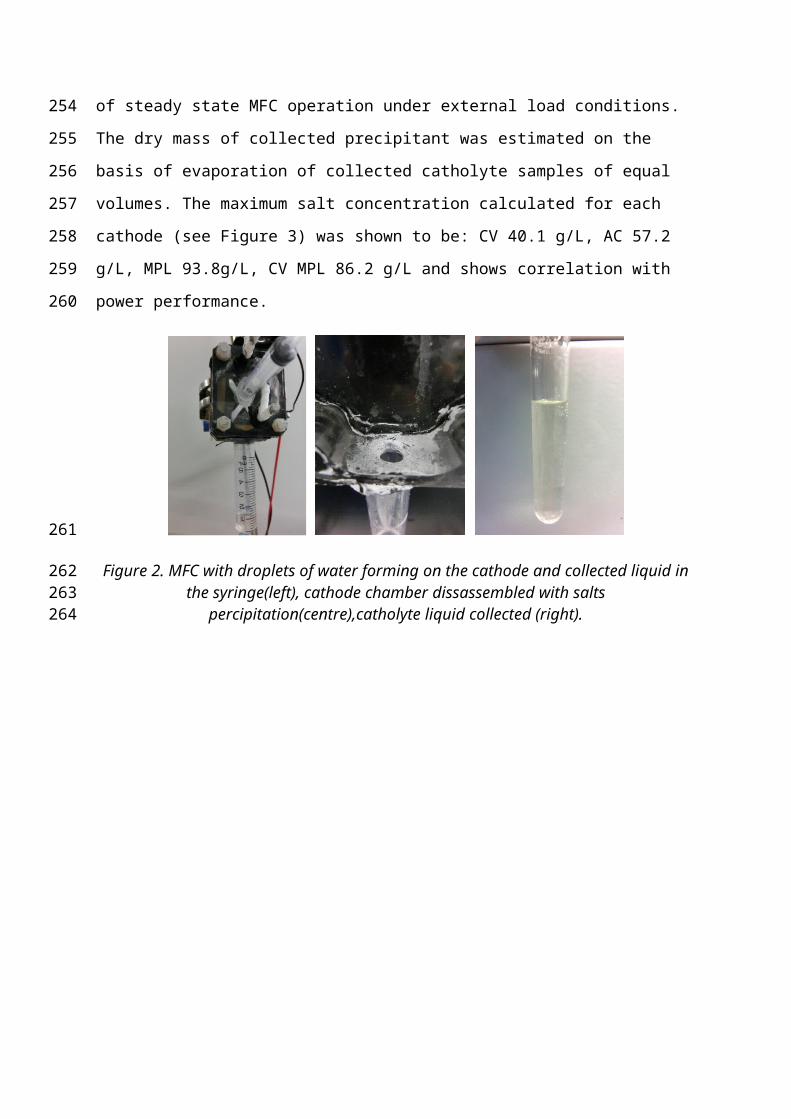
(Fig.2, centre). At the same time, anolyte loss was observed. To explore the catholyte
accumulation phenomenon, all MFCs were connected to 2.4kΩ, 1.2kΩ, 600Ω and 300 Ω
resistors. The 300Ω resistor was chosen as the closest to the internal resistance for MPP,
which was derived from the polarisation experiment. The catholyte was collected after 72h of
steady state MFC operation under external load conditions. The dry mass of collected
precipitant was estimated on the basis of evaporation of collected catholyte samples of equal
volumes. The maximum salt concentration calculated for each cathode (see Figure 3) was
shown to be: CV 40.1 g/L, AC 57.2 g/L, MPL 93.8g/L, CV MPL 86.2 g/L and shows
correlation with power performance.
170
171172
173
174
175
176
177
178
179
180
181
182
183
184
185
186
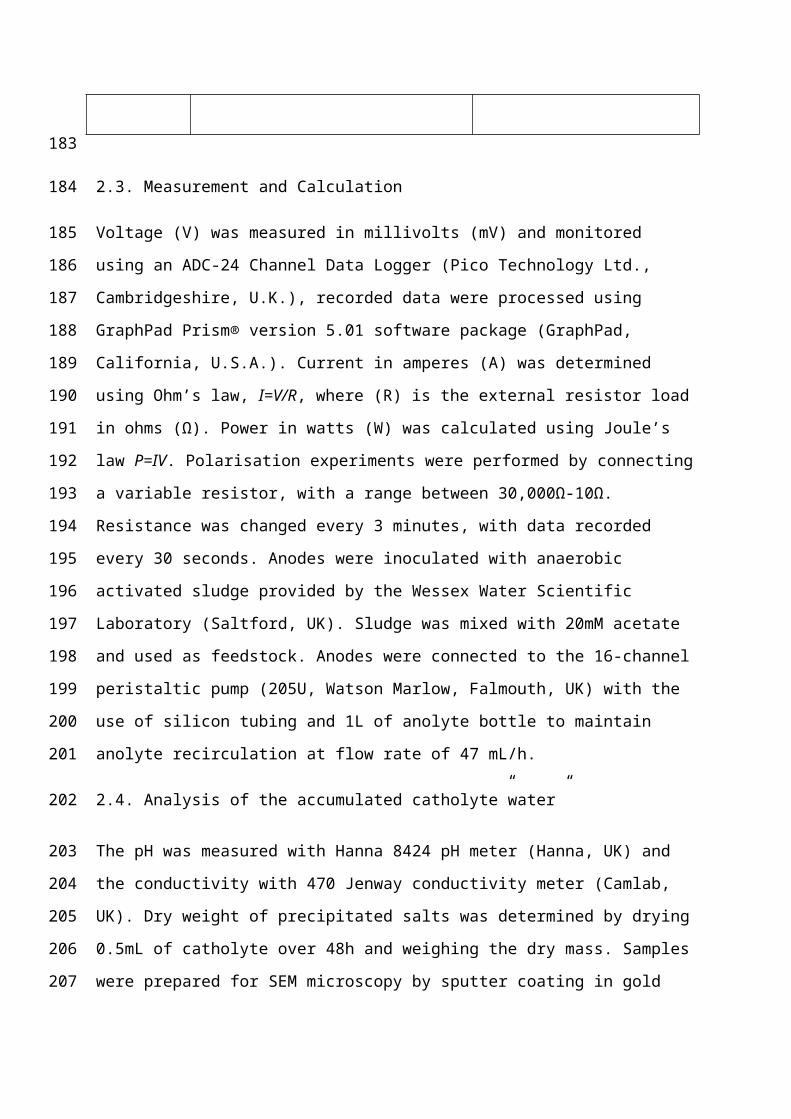
Figure 2. MFC with droplets of water forming on the cathode and collected liquid in the syringe(left), cathode chamber dissassembled with salts percipitation(centre),catholyte liquid
collected (right).
Figure 3. Salt concentration in produced catholyte calculated by dry mass of salts evaporated from the catholyte formed in all 4 experimental MFC groups under various load conditions.
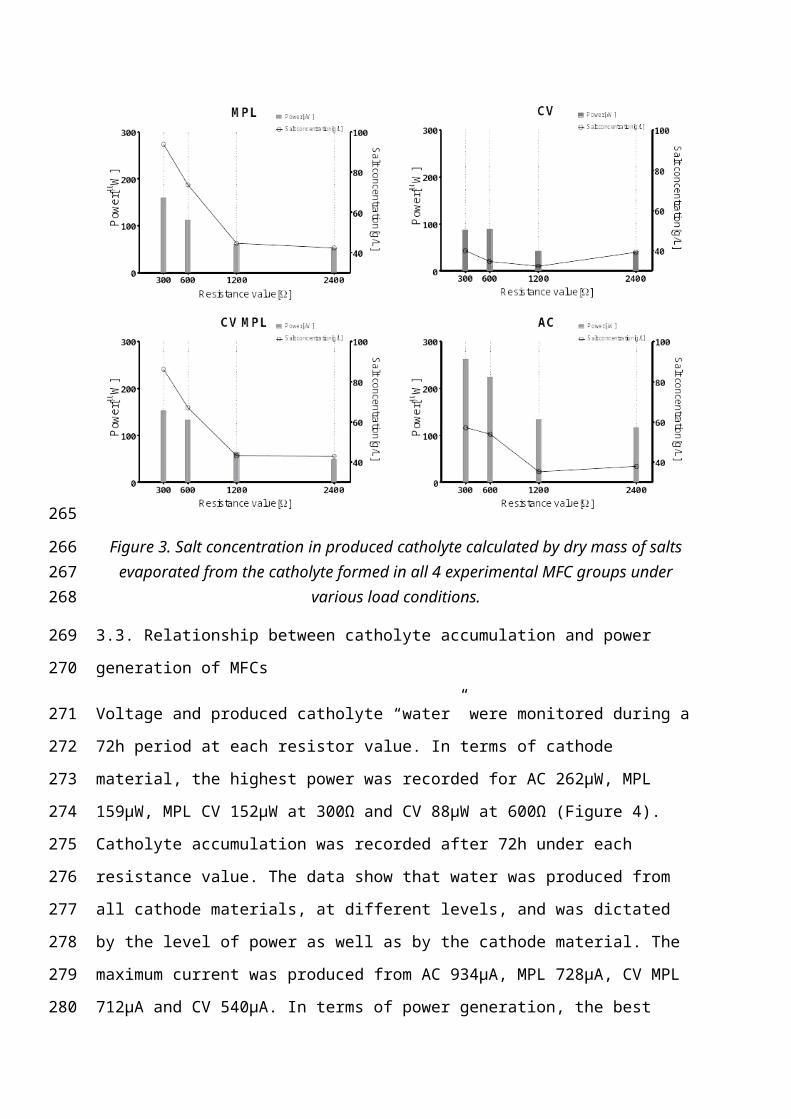
3.3. Relationship between catholyte accumulation and power generation of MFCs
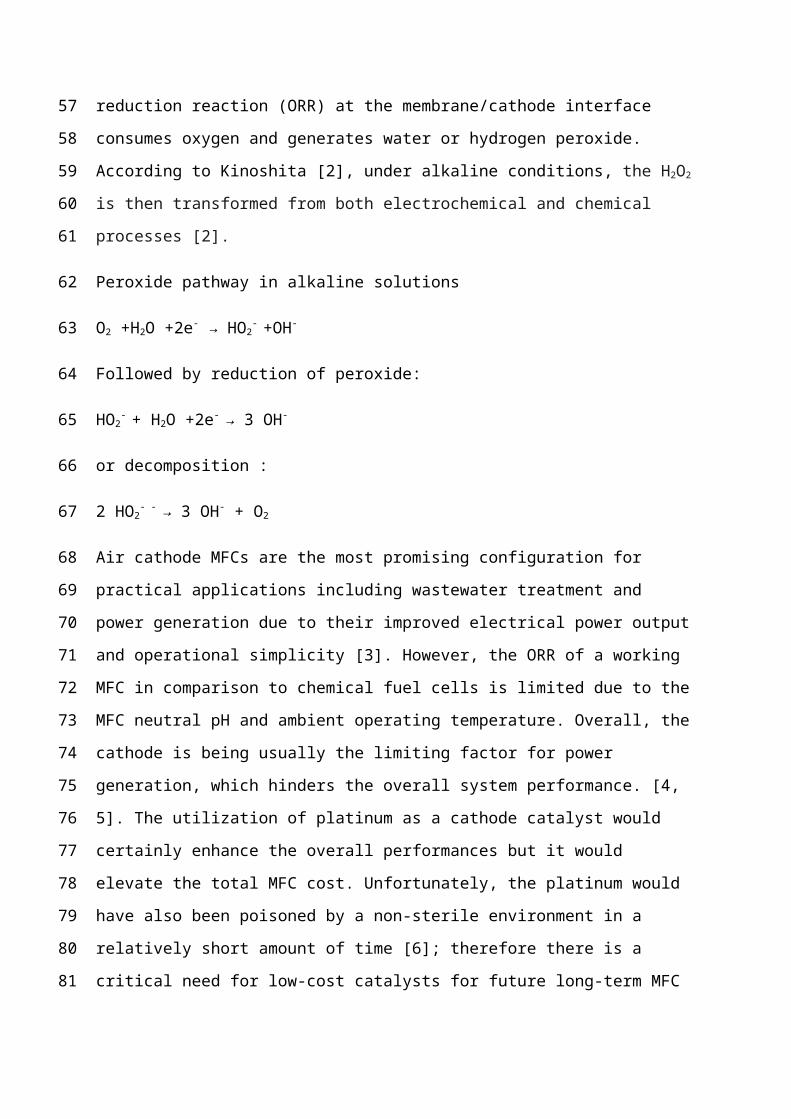
Voltage and produced catholyte “water” were monitored during a 72h period at each resistor
value. In terms of cathode material, the highest power was recorded for AC 262μW, MPL
159μW, MPL CV 152μW at 300Ω and CV 88μW at 600Ω (Figure 4). Catholyte
accumulation was recorded after 72h under each resistance value. The data show that water
187
188189190
191
192193
194
195
196
197
198
was produced from all cathode materials, at different levels, and was dictated by the level of
power as well as by the cathode material. The maximum current was produced from AC
934μA, MPL 728μA, CV MPL 712μA and CV 540μA. In terms of power generation, the best
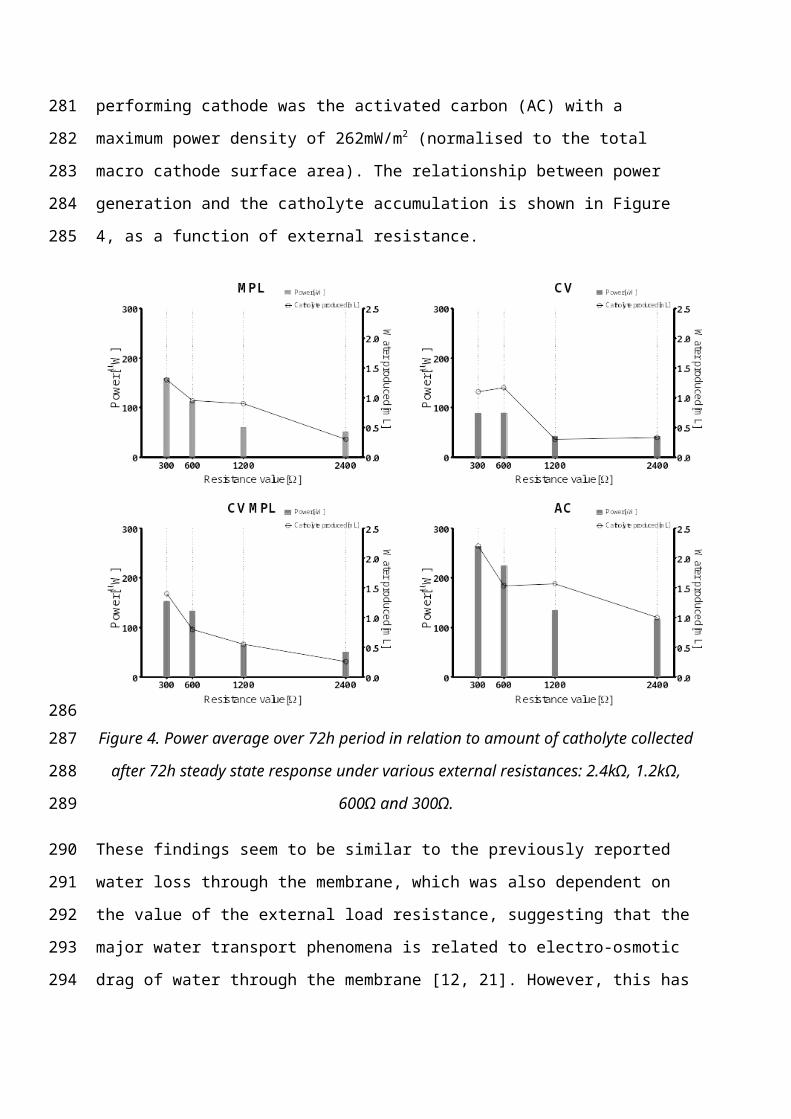
performing cathode was the activated carbon (AC) with a maximum power density of
262mW/m2 (normalised to the total macro cathode surface area). The relationship between
power generation and the catholyte accumulation is shown in Figure 4, as a function of
external resistance.
Figure 4. Power average over 72h period in relation to amount of catholyte collected after
72h steady state response under various external resistances: 2.4kΩ, 1.2kΩ, 600Ω and 300Ω.
These findings seem to be similar to the previously reported water loss through the
membrane, which was also dependent on the value of the external load resistance, suggesting
that the major water transport phenomena is related to electro-osmotic drag of water through
the membrane [12, 21]. However, this has only been reported as a loss of anolyte volume and
furthermore this is the first time that newly synthesised catholyte of such volumes, is actually
collected from MFCs. This has also been reported for chemical PEM fuel cells [22], which
traditionally employ water management techniques to avoid flooding and improve
199
200
201
202
203
204
205
206207
208
209
210
211
212
213
214
215
performance. This data shows that water formation actually improves power generation
which has an opposite effect to the conventional notion of cathode flooding and showing
cathode half cell architecture as flowing system.
3.4. Analysis of the accumulated catholyte
3.4.1. Conductivity and pH
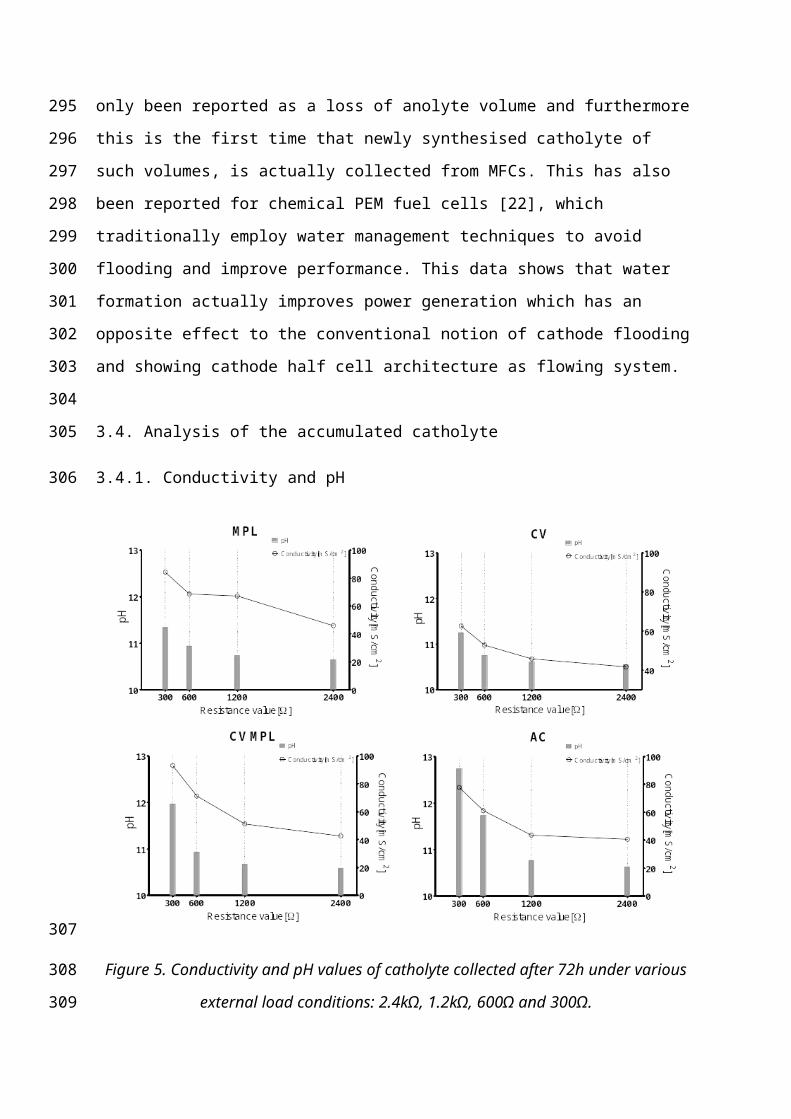
Figure 5. Conductivity and pH values of catholyte collected after 72h under various external
load conditions: 2.4kΩ, 1.2kΩ, 600Ω and 300Ω.
The conductivity and pH behaved in a similar manner, with the highest conductivity and pH
recorded for the highest power levels and water volumes. The pH of the collected samples in
the range of 10.6-12.7 suggests high caustic content; Figure 5 shows the measured pH and
conductivity values of the collected catholyte from MFCs under the different resistance loads.
The data suggest that improved power generation and subsequent higher ion exchange rate
between the anode and the cathode drives the OH- accumulation on the cathode surface,
therefore the more power produced by the MFC, the more caustic catholyte is collected. The
higher reaction rates at MPT (300Ω) would suggest that CO2 buffering (reacting with OH-)
216
217
218
219
220
221
222
223
224
225
226
227
228
229
230
231
232
would be suppressed compared with the lower power generation (i.e. slower reaction rates)
recorded under 2.4kΩ or 1.2kΩ. As previously reported, in the aqueous cathode half cells,
high pH of the catholyte is generating a large membrane pH gradient between the anolyte and
the catholyte, causing a significant potential loss [23], which could be compensated by the
increase in cathodic conductivity [24]. In the present study the excess of catholyte is
constantly removed from the cathode surface by gravity (Fig 2) preventing cathode flooding,
salt precipitation and high pH gradient build-up, therefore not affecting the MFC
performance.
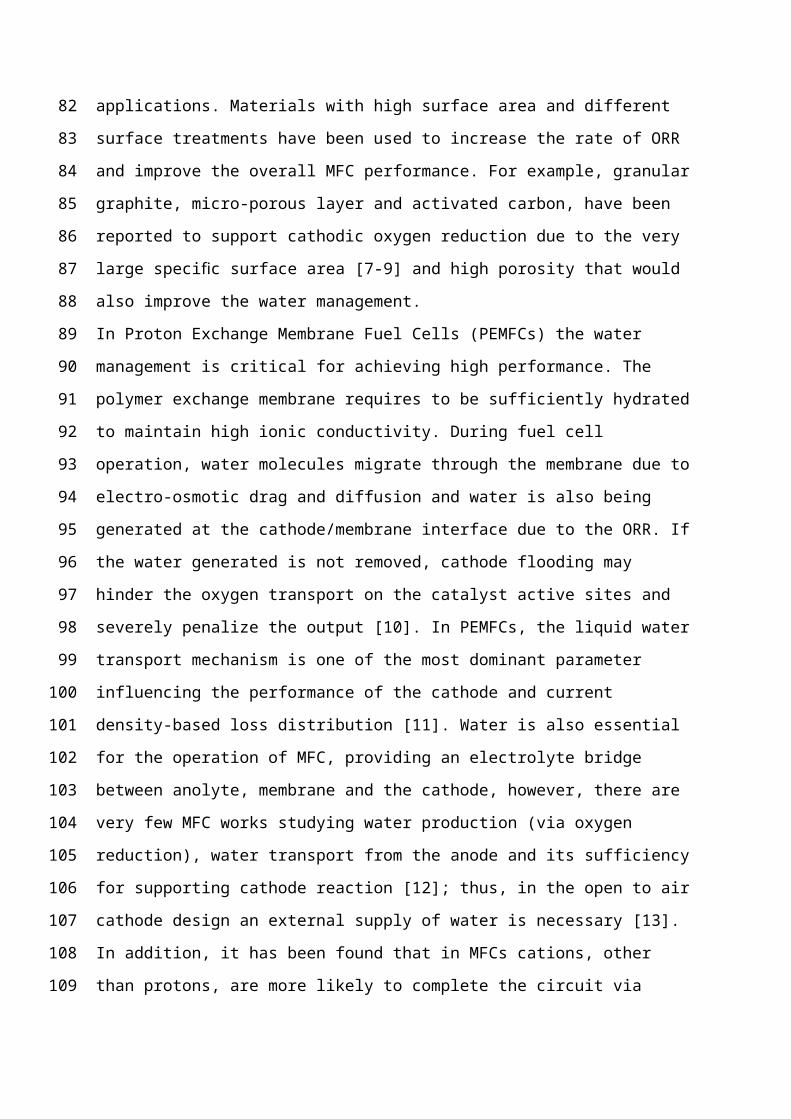
3.4.2 EDX and SEM analysis
Na Si S K Ca Al0
102030405060708090
100
Cathode sur-face
Catholyte precipitation
%
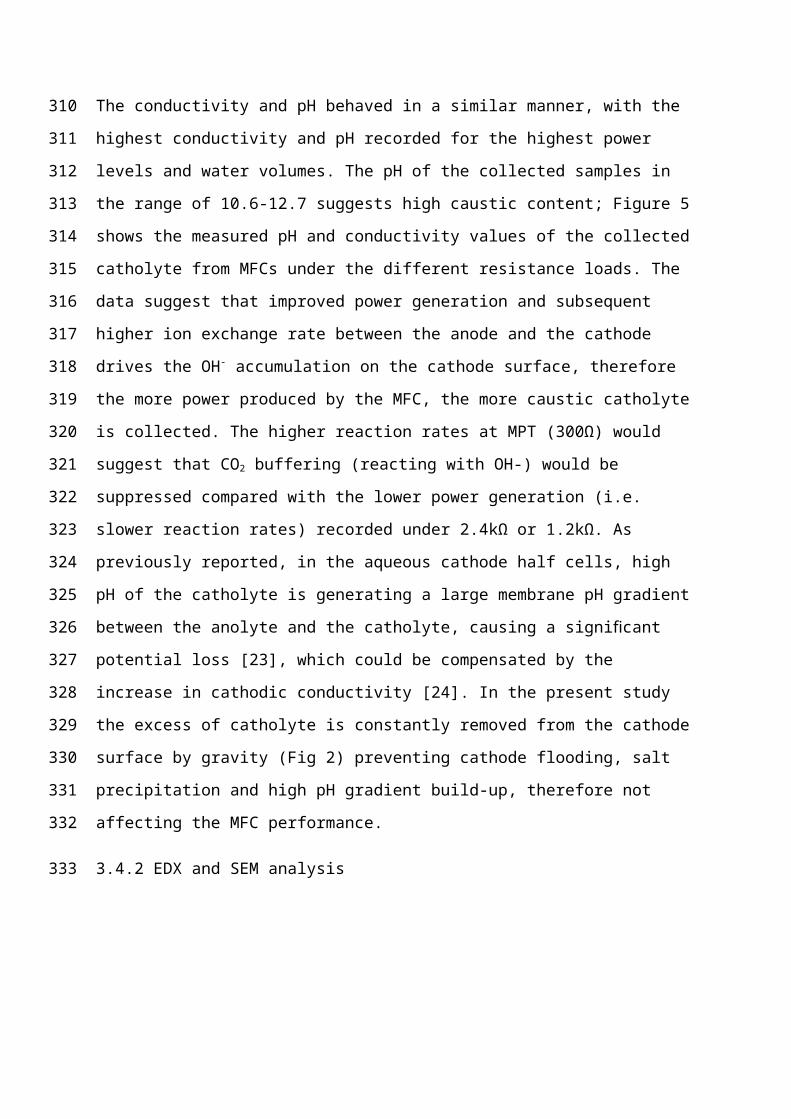
Figure 6. EDX profile representing % of detected elements in precipitated salts from the electrode surface and the evaporated liquid sample(left) and SEM image of the catholyte crystals(right).
Given that the anolyte contained 20mM sodium acetate, it would be expected to find sodium
in the precipitated salts. The precipitated salts were crystalline, transparent or white and
soluble in water (Fig 2 and Fig 6). The EDX analysis of the salts that precipitated on the
surface of the electrode and from the evaporated catholyte solution, show 96.7% and 93.6%
sodium content, respectively. This suggests that cations such as sodium (from sludge and
sodium acetate feedstock) are being recovered from the anode to the cathode.
3.4.3 GC MS and ICP OES analysis
The GC-MS analysis detected no organic content in the collected liquid. With the exception
of Na, which was off-scale for all the samples, and K which was off-scale for AC, the ICP
OES profile is shown in Figure 7. The analysis showed varying amounts of potassium,
magnesium and calcium primarily, depending on cathode material, and very small amounts of
aluminium and zinc. Although the data were not directly proportional with the level of power
233
234
235
236
237
238
239
240
241
242
243244245
246
247
248
249
250
251
252
253
254
255
256
257
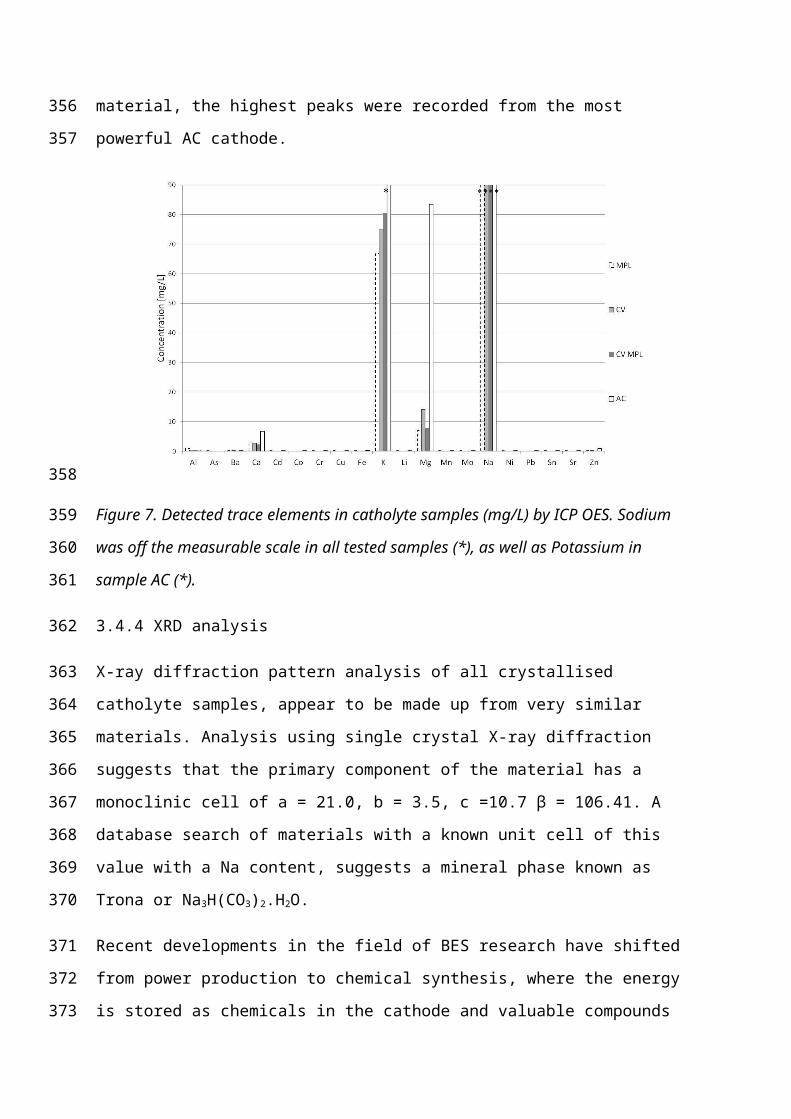
produced by each material, the highest peaks were recorded from the most powerful AC
cathode.
Figure 7. Detected trace elements in catholyte samples (mg/L) by ICP OES. Sodium was off
the measurable scale in all tested samples (*), as well as Potassium in sample AC (*).
3.4.4 XRD analysis
X-ray diffraction pattern analysis of all crystallised catholyte samples, appear to be made up
from very similar materials. Analysis using single crystal X-ray diffraction suggests that the
primary component of the material has a monoclinic cell of a = 21.0, b = 3.5, c =10.7 β =
106.41. A database search of materials with a known unit cell of this value with a Na content,
suggests a mineral phase known as Trona or Na3H(CO3)2.H2O.
Recent developments in the field of BES research have shifted from power production to
chemical synthesis, where the energy is stored as chemicals in the cathode and valuable
compounds are produced. Here, it is suggested that it may be possible to integrate both
energy generation and chemical synthesis as it appears that both processes are inherently
linked. The recovery of caustic soda from wastewater and acetate solution used as anolyte has
been previously reported [25], by using an energy-consuming MEC and a catholyte
containing NaCl. Here, as no catholyte solution was used, the electricity produced by the
MFCs is directly linked to the synthesis of caustic catholyte in situ. Similar carbonate salt
deposits were previously reported on the cathode electrode-membrane assembly, however
this accumulation was hindering the overall MFC performance [26]. Similarly, in cases of
258
259
260
261
262
263
264
265
266
267
268
269
270
271
272
273
274
275
276
277
278
single chamber membrane-less MFCs, the biocathode, free of platinum, seemed to be limited
by carbonate deposits other than pH higher than 10 [27, 28]. Here, it is suspected that the salt
accumulation is prevented due to the effective water transport and production, which removes
salts away from the membrane by hydrodynamic flow and is washing away potentially
accumulating salts off from the cathode surface. Therefore, the catholyte flow in the present
MFC may be also beneficial in keeping the cathode pores free of precipitants as well as it
could enhance the water management of the membrane.
3.5. Significance of catholyte accumulation to environmental cleanup
In principle, the catholyte production is mainly due to the water transport and thus the volume
of catholyte produced should equal the volume of anolyte lost (minus evaporative losses)
considering negligible the contribution of water produced through ORR due to low current
generation. Figure 5 shows that up to 2mL of catholyte can be produced over 3 days of
operation, from a 25mL sludge filled anode, which theoretically suggests that it would take
(for example) 16 days to produce 10.6mL of clear catholyte. If by the end of this period the
anolyte is completely depleted (which we expect to be the case), this would suggest a 40%
recovery rate with a 60% evaporation rate. This is only a prediction based on visual
inspection of anolyte evaporative losses, and further work is required to validate this
phenomenon. Apart from sodium which was added as sodium acetate in the feedstock, the
other detected elements through the ICP OES analysis included potassium, magnesium and
calcium (Fig. 7). It is therefore suspected that these cations must have come from the
wastewater through the PEM, and in effect this demonstrates a type of recovery. This would
be valuable in extracting useful elements from highly polluted/toxic waste streams.
3.6. Sodium recovery through bioproduction
It has already been hypothesised that a 25mL anolyte could produce 10.6mL of catholyte.
This would be the equivalent of 426L of catholyte recovered from 1m3 of anolyte. Taking
into account the concentration (5-9%) and composition (90% sodium) of salts in the obtained
catholyte, it may be suggested that in theory, 45-81g of sodium per L of catholyte can be
recovered, which would be the equivalent of 19.1-34.5kg of salts from 1m3 of anolyte, at
larger scale. The analysis of the salt deposits suggests the mineral trona Na3(CO3)
(HCO3)•2H2O or Na2CO3-NaHCO3:2H2O which is one of the natural forms of sodium
carbonate and it is a double salt of sodium carbonate and sodium bicarbonate. Its potential
279
280
281
282
283
284
285
286
287
288
289
290
291
292
293
294
295
296
297
298
299
300
301
302
303
304
305
306
307
308
309
310
311
could be quite high, due to the abundance and low price of sodium-precursors that are
normally used in the production of battery components [29].
3.7. Control of catholyte alkalinity
The typical pH of the collected catholyte throughout the experiment was 10.6-12.7. During
the experiment the cathode chamber was closed with only 2 open to air vents left at the top of
the reactor. As it was observed by obstructing the vents and preventing the ambient air to
flow through the chamber, the pH of the catholyte collected subsequently increased to >13.
This indicates that by limiting the air flow and consequently the CO2 flux and its buffering
properties, it is possible to affect the alkalinity of the catholyte. Moreover, elevating the
already high pH of the catholyte simply by limiting the air flow is suggesting the possible use
of the synthesised caustic solution as disinfectant and may prevent biofouling of the
membrane by limiting the growth of biofilm on the cathode side [30].
3.8. Carbon capture
Removal of gaseous components through contact with a liquid is known as “wet scrubbing”.
Carbon dioxide absorption from atmospheric air using alkaline solution has been explored in
the 1940s [31] and used at large/industrial scales [32]. In the air extraction process, alkaline
sodium solvent reacts chemically with the entrapped CO2. Therefore, it is suspected that in
the present MFC cathode, an air flow (and consequently its CO2 content) played an important
role in controlling the alkalinity of the caustic catholyte formed in the porous open to air
cathode, and the further formation of sodium salts such as: trona, carbonate and bicarbonate
of sodium. Furthermore, it has already been proposed that an addition of CO2 is an important
pre-condition for the formation of trona deposits [33]. Sodium carbonate is commonly
employed in the (i) glass and ceramic, (ii) petroleum, (iii) aluminium, (iv) paper, (v) soap,
(vi) detergent and (vii) caustic soda industries. With the proposed MFC set up, caustic
solution (and its carbonate content) may be directly synthesised on the MFC cathode to
capture atmospheric CO2 and allow sodium recovery from the anolyte. This would allow the
MFC to be a truly carbon negative technology.
Conclusions
It has been shown for the first time that Microbial Fuel Cells have the ability to synthesise
and extract useful elements on different catalyst-free carbon-based cathodes with the
important advantage of electricity generation during this process. The level of power
312
313
314
315
316
317
318
319
320
321
322
323
324
325
326
327
328
329
330
331
332
333
334
335
336
337
338
339
340
341
342
343
344
345
performance depends on the cathode material used however the in situ synthesis of catholyte
appears to be independent of the electrode material used and it shows a significant correlation
with its electrical performance. This is the first time that carbon-capture via chemical
synthesis of liquid catholyte containing valuable minerals, actually improved (and not
hindered) the power generation of MFCs, which strongly demonstrates the benevolent
potential of the MFC technology.
Acknowledgement
The work was funded by the Engineering and Physical Sciences Research Council EPSRC
CAF EP-I004653/1 and EP/L002132/1. Authors would like to thank Dr David Patton, Mr
Paul Bowdler from the University of the West of England and Dr Christopher H. Woodall
from the University of Bristol for the valuable expertise and analysis of the catholyte
samples.
References
[1] R.M. Allen, H.P. Bennetto, Microbial fuel-cells:Electricity production from carbohydrates, Appl. Biochem. Biotechnol. 39/40 (1993) 27-40.
[2] K. Kinoshita, Carbon: electrochemical and physicochemical properties, (1988).
[3] Park, D.H. and Zeikus, J.G. (2003) Improved fuel cell and electrode designs for producing electricity from microbial degradation. Biotechnology and Bioengineering [online]. 81 (3), pp.348-355.
[4] R. Holze, W. Vielstich, The Kinetics of Oxygen Reduction at Porous Teflon‐Bonded Fuel Cell Electrodes, J. Electrochem. Soc. 131 (1984) 2298-2303.
[5] H. Rismani-Yazdi, S.M. Carver, A.D. Christy, O.H. Tuovinen, Cathodic limitations in microbial fuel cells: An overview, J. Power Sources. 180 (2008) 683-694.
[6] C. Santoro, A. Stadlhofer, V. Hacker, G. Squadrito, U. Schröder, B. Li. Activated Carbon Nanofibers (ACNF) as cathode for Single Chamber Microbial fuel cells (SCMFCs). Journal of Power Sources, 243 (2013) 499-507
[7] S. Freguia, K. Rabaey, Z. Yuan, J. Keller, Non-catalyzed cathodic oxygen reduction at graphite granules in microbial fuel cells, Electrochim. Acta. 53 (2007) 598-603.
[8] C. Santoro, A. Agrios, U. Pasaogullari, B. Li, Effects of gas diffusion layer (GDL) and micro porous layer (MPL) on cathode performance in microbial fuel cells (MFCs), Int J Hydrogen Energy. 36 (2011) 13096-13104.
346
347
348
349
350
351
352
353
354
355
356
357
358
359360
361
362363364
365366
367368
369370371
372373
374375376
[9] H. Dong, H. Yu, X. Wang, Q. Zhou, J. Feng, J. A novel structure of scalable air-cathode without Nafion and Pt by rolling activated carbon and PTFE as catalyst layer in microbial fuel cells. Water Res. 46 (2012) 5777-5787.
[10] L. Yu, W. Chen, M. Qin, G. Ren, Experimental research on water management in proton exchange membrane fuel cells, J. Power Sources. 189 (2009) 882-887.
[11] D. Natarajan, T. Van Nguyen, Three-dimensional effects of liquid water flooding in the cathode of a PEM fuel cell, J. Power Sources. 115 (2003) 66-80.
[12] J.R. Kim, G.C. Premier, F.R. Hawkes, R.M. Dinsdale, A.J. Guwy, Development of a tubular microbial fuel cell (MFC) employing a membrane electrode assembly cathode, J. Power Sources. 187 (2009) 393-399.
[13] F. Zhang, K.S. Jacobson, P. Torres, Z. He, Effects of anolyte recirculation rates and catholytes on electricity generation in a litre-scale upflow microbial fuel cell, Energy & Environmental Science. 3 (2010) 1347-1352.
[14] R.A. Rozendal, H.V. Hamelers, C.J. Buisman, Effects of membrane cation transport on pH and microbial fuel cell performance, Environ. Sci. Technol. 40 (2006) 5206-5211.
[15] C. Forrestal, P. Xu, Z. Ren, Sustainable Desalination using a microbial capacitive desalination cell, Energy and Environmental Science 5, 2012, 7161-7167.
[16] Wilkinson, S. (2000) “Gastrobots”—Benefits and Challenges of Microbial Fuel Cells in FoodPowered Robot Applications. Autonomous Robots 9 (2), pp.99-111.
[17] F. Zhang, G. Chen, M.A. Hickner, B.E. Logan, Novel anti-flooding poly (dimethylsiloxane)(PDMS) catalyst binder for microbial fuel cell cathodes, J. Power Sources. (2012).
[18] I. Gajda, J. Greenman, C. Melhuish, I. Ieropoulos, Photosynthetic cathodes for Microbial Fuel Cells, Int J Hydrogen Energy. (2013).
[19] C. Santoro, Y. Lei, B. Li, P. Cristiani, Power generation from wastewater using single chamber microbial fuel cells (MFCs) with platinum-free cathodes and pre-colonized anodes, Biochem. Eng. J. 62 (2012) 8-16.
[20] C. Santoro, K. Artyushkova, S. Babanova, I. Ieropoulos, M. Grattieri, P. Cristiani, S. Trasatti, B. Li, P. Atanassov. Parameters Characterization and Optimization of Activated Carbon (AC) Cathodes for Microbial Fuel Cell Application. Bioresource Technology, Under review
[21] L. Zhuang, S. Zhou, Y. Wang, C. Liu, S. Geng, Membrane-less cloth cathode assembly (CCA) for scalable microbial fuel cells, Biosensors and Bioelectronics. 24 (2009) 3652-3656.
[22] Y.H. Park, J.A. Caton, An experimental investigation of electro-osmotic drag coefficients in a polymer electrolyte membrane fuel cell, Int J Hydrogen Energy. 33 (2008) 7513-7520.
377378379
380381
382383
384385386
387388389
390391
392393
394395
396397398
399400
401402403
404405406407
408409
410411412
[23] R.A. Rozendal, H.V. Hamelers, K. Rabaey, J. Keller, C.J. Buisman, Towards practical implementation of bioelectrochemical wastewater treatment, Trends Biotechnol. 26 (2008) 450-459.
[24] R. Rozendal, T. Sleutels, H. Hamelers, C. Buisman, Effect of the type of ion exchange membrane on performance, ion transport, and pH in biocatalyzed electrolysis of wastewater, Water Science and Technology. 57 (2008) 1757-1762.
[25] K. Rabaey, S. Butzer, S. Brown, J. Keller, R.A. Rozendal, High current generation coupled to caustic production using a lamellar bioelectrochemical system, Environ. Sci. Technol. 44 (2010) 4315-4321.
[26]T.H Pham, J.K. Jang, H.S. Moon, I.S. Chang, B.H. Kim, Improved performance of microbial fuel cell using membrane-electrode assembly, Journal of microbiology and biotechnology. 15 (2005) 438-441.
[27] P. Cristiani, M. Carvalho, E. Guerrini, M. Daghio, C. Santoro, B. Li, Cathodic and anodic biofilms in single chamber microbial fuel cells, Bioelectrochemistry. 92 (2013) 6-13.
[28] C. Santoro, M. Cremins, U. Pasaogullari, M. Guilizzoni, A. Casalegno, A. Mackay, B. Li, Evaluation of Water Transport and Oxygen Presence in Single Chamber Microbial Fuel Cells with Carbon-Based Cathodes, J. Electrochem. Soc. 160 (2013) G3128-G3134.
[29] M.D. Slater, D. Kim, E. Lee, C.S. Johnson, Sodium‐Ion Batteries, Advanced Functional Materials. (2012).
[30] J. Xu, G. Sheng, H. Luo, W. Li, L. Wang, H. Yu, Fouling of proton exchange membrane (PEM) deteriorates the performance of microbial fuel cell, Water Res. 46 (2012) 1817-1824.
[31] N.A. Spector, B.F. Dodge, Removal of carbon dioxide from atmospheric air, Trans. Am. Inst. Chem. Eng. 42 (1946) 827-848.
[32] K.S. Lackner, P. Grimes, H. Ziock, Capturing carbon dioxide from air, (2001) In: 24th Annual Technical Conference on Coal Utilization, Clearwater, FL.
[33] S. Earman, F.M. Phillips, B.J. McPherson, The role of “excess” CO2 in the formation of
trona deposits, Appl. Geochem. 20 (2005) 2217-2232.
413414415
416417418
419420421
422423424
425426
427428429
430431
432433
434435
436437
438
439