Embed Size (px)
Citation preview

1
Formation of Gold Nanorods by A Stochastic
‘Popcorn’ Mechanism
Jonathan A. Edgar, Andrew M. McDonagh, and Michael B. Cortie*
Institute for Nanoscale Technology, University of Technology Sydney, PO Box 123,
Broadway, NSW 2007, Australia
Table of Contents synopsis and graphic
The formation of gold nanorods by the seeded wet-chemical process proceeds by a stochastic,
‘popcorn’-like mechanism, in which individual seeds lie quiescent for some time before
suddenly and rapidly growing into rods. This is quite different from the steady, concurrent
growth of nanorods that has been previously generally assumed.

2
Formation of Gold Nanorods by A Stochastic
‘Popcorn’ Mechanism
Jonathan A. Edgar, Andrew M. McDonagh, and Michael B. Cortie*
Institute for Nanoscale Technology, University of Technology Sydney, PO Box 123,
Broadway, NSW 2007, Australia
RECEIVED DATE
TITLE RUNNING HEAD Nucleation of gold nanorods.
CORRESPONDING AUTHOR FOOTNOTE Prof. M Cortie, email:
Phone: (+61)-2-9514-2208

3
ABSTRACT Gold nanorods have significant technological potential and are of broad interest
to the nanotechnology community. The discovery of the seeded, wet-chemical synthetic
process to produce them may be regarded as a landmark in the control of metal nanoparticle
shape. However, the mechanism by which the initial spherical gold seeds acquire anisotropy
is a critical, yet poorly understood, factor. Here we examine the very early stages of rod
growth using a combination of techniques including cryogenic transmission electron
microscopy, optical spectroscopy and computational modeling. Reconciliation of the
available experimental observations can only be achieved by invoking a stochastic,
‘popcorn’-like mechanism of growth, in which individual seeds lie quiescent for some time
before suddenly and rapidly growing into rods. This is quite different from the steady,
concurrent growth of nanorods that has been previously generally assumed. Furthermore we
propose that the shape is controlled by the ratio of surface energy of rod sides to rod ends,
with values of this quantity in the range of 0.3 to 0.8 indicated for typical growth solutions.
KEYWORDS gold nanorods, shape, kinetics, mechanism, cryo-TEM, modeling

4
old nanorods have strongly anisotropic optical properties, which suggest diverse
technological applications.1-5
The rods exhibit optical absorption peaks arising
from surface plasmon resonances in the longitudinal as well as transverse directions. The
resonances can be tuned to absorb light with wavelengths ranging from 520 to more than
1600 nm by control of the aspect ratio (the length / diameter ratio) of the rods.6-8
Although
gold nanoshells possess similar tunability and absorption efficiencies,9-11
gold nanorods
arguably offer a more convenient platform12-13
because they are more readily synthesized.
The ‘seeded process’14
(Equ. 1) to grow nanorods is now widely adopted:
2HAuCl4 + 3C6H8O6 2Au0(nanorod) + 3C6H6O6 + 8HCl (1)
where C6H8O6 is ascorbic acid and C6H6O6 is dehydroascorbic acid (DHA), the oxidized
form of ascorbic acid. Silver nitrate is usually added to provide shape control
([C16TA][AgBr] has also been used15
(where C16TA = cetyltrimethylammonium)). Related
routes requiring neither pre-synthesized seed15-17
or Ag18-19
have also been demonstrated.
In the ‘seeded’ process, gold nanorods are formed by the addition of small gold
nanoparticle seeds (usually ~1 to 3 nm in diameter) to an aqueous ‘growth solution’
consisting of a mixture of surfactant (C16TABr), ionic gold (usually AuCl4-), weak reductant
(ascorbic acid) and ionic silver. The resultant nanorods are usually 10 – 20 nm in diameter
and 30 – 60 nm in length, and the dimensions are typically determined by the amount of seed
and/or by the ionic silver concentration. If the concentration of C16TABr is at least tenfold
greater than that of AuCl4-, then the gold complex is solubilized within the surfactant
micelles.7 C16TABr has an aggregation number of around 100 – 200 (depending on other
solution components),20
and a size of about 2.5 by 4 nm,21
so that, in the range of
concentrations employed in most nanorod syntheses, there may on average be only one or
G
C16TABr
Ag+
Au
0(nanosphere)

5
two gold-containing ions associated with a micelle. Although chloride ions may poison rod-
growth reactions,19, 22-23
the concentration arising from those released from AuCl4- has an
insignificant effect in this case.
There is still difficulty in explaining how the initially isotropic seed particle switches to an
anisotropic nanorod geometry, particularly in the case of silver-assisted synthesis which
produces nanorods that are single crystals.24
To start with, these particles possess six
equivalent growth directions. Somehow, only two of these, at 180° to one another, are
selected in the transition from seed to rod. In syntheses performed without silver ions, the
resulting nanorods are pentagonally twinned and it has been suggested that the anisotropic
factor that seeds rod growth may be twinning in the seed.7 Alternately, it has been proposed
for syntheses with or without silver ions that electrostatic considerations were responsible,
with rod growth favored at sites of greater surface curvature.19
However, this still leaves the
question of how an anisotropic particle with a region of greater curvature was established in
the first place.
Attempts have been made to resolve this puzzle by determining the particle geometry at
various stages in the growth process.25-27
For example, arresting the nanorod growth at
various times by additions of sulfide ions has been investigated,26
but there is no guarantee
that chemical and subsequent centrifugation treatments do not affect the particle geometry in
this case. Another method to determine the dimensions of nanorods is to match the kinetically
monitored longitudinal peak position to a range of simulated optical spectra.28-29
This method
requires detailed knowledge of the actual geometry of the nanorods because particles with
equal aspect ratios but varied geometries e.g. ellipsoids or sphero-cylinders, will display
different spectra; additionally, simply changing the end-cap geometry can cause a significant
peak shift.30-31
Henkel et al. and Morita et al. used SAXS to estimate the in situ particle
6
dimensions of growing nanorods,32-33
and then invoked the optical determination of Brioude
et al.34
to validate their results in terms of the aspect ratio.
In general, however, detailed characterization of the very earliest stages of growth, in
which the equiaxed seeds begin to grow anisotropically, has eluded investigators. This is the
topic that we address here.
The directed growth of gold nanorods is generally attributed to the preferential passivation
of the sides of a growing rod by the formation of a C16TABr bilayer,35-36
leaving the ends of
the rod free to grow, however, there has also been a suggestion that the mechanism involves
soft templating by C16TABr micelles.16, 36
If Ag is present, it has been determined to be on the
sides of the nanorods in the form of a sparingly soluble Ag-containing complex with the
formula C19H42-NAgBr2.15, 37
The sides of the rods generally present relatively loosely packed
crystallographic planes to the environment, e.g. {110}24
or higher index (e.g. {250}38
) planes,
and it has also been suggested that underpotential deposition (UPD) of Ag0 on such loosely
packed Au facets is responsible for their passivation.24
However, due to the high
concentration of bromide ions in the growth solution, it might be expected that the silver
metal will return to the complex form. A mechanism where AgBr (rather than Ag0) shields
the sides of the nanorod to promote elongation has also been mooted.14-15, 36, 39
The net effect
of any of these processes is to retard inwards mass transfer of Au onto the sides of the
nanorods, thus encouraging anisotropic growth at the ends. It is now well known that
C16TABr is considerably superior to any of the other single chain cationic surfactants in
regard to growth of gold nanorods.19, 22
The reasons appear to be that (1) the C16 tail has the
optimum steric properties and aqueous solubility to form a stable bilayer19, 22
and (2) of
several known counter-ions for the C16TA+, Br
- provides a salt with the strongest adherence
to an Au surface.40

7
From previous studies examining the growth rates of nanorods,17, 29, 32-33
it was reported
that the radial and longitudinal growth rates are initially comparatively rapid, and then
decline asymptotically to zero. A coupled pair of empirical growth models for Au nanorods
has been proposed.32
These can certainly be used to empirically reproduce the appearance and
observed shifts of the longitudinal plasmon peak (see Supporting Information). However, a
critical assumption in this approach and in most previous studies, is that all seed particles
grow to rods simultaneously. Nevertheless, it may be deduced from the details of the multi-
step rod growth protocol of Busbee et al., for example, that growth times of 3 to 5 seconds
are already sufficient to convert at least some seeds to rods.18
Here we show that the
assumption of parallel growth is generally false, even in the single-stage technique of rod
growth. The transition of seed particles to rods actually takes place by a stochastic process so
that there is a period in which significant proportions of seed nuclei and growing rods of
various shapes and sizes co-exist. This is a very different situation from that usually assumed
for nucleation and growth of colloidal nanoparticles.
RESULTS
In this section, we first discuss the chemistry involved in the formation of gold nanorods
followed by our investigations into their anisotropic growth. The important chemical
reactions involved in the synthesis of gold nanorods are summarized in Scheme 1. Upon
addition of [AuIII
Cl4]- to a C16TABr solution, we (see Section 3 of Supporting Information)
and others41-43
have identified the Au species present in micellar C16TABr solution as AuBr4-,
with the bromide ions originating from the partially dissociated C16TABr.44-45
Once dispersed
in the micellar C16TABr solution, AuIII
Br4- is reduced in a two-electron process to Au
IBr2
- by
the addition of ascorbic acid (reportedly via an inner-sphere process involving a AuIII
-
ascorbate complex).46
The ascorbic acid is itself oxidized to dehydroascorbic acid (also a

8
two-electron process). It is possible for the oxidation products of ascorbic acid,
dehydroascorbic and 2,3 – diketo – gulonic acids, to reduce gold ions47
but elevated
temperatures (approaching 100°C) are typically required before this reduction is evident on a
short time scale.
2e- (from ascorbic acid)
[AuIIICl4]-(aq)
C16TABr 2e- (from ascorbic acid)
Au0(nanosphere or rod)
Ag+
AuIII + Au0(nanorod) [AuIIIBr4]-
(micelle) [AuIBr2]-
Scheme 1: Reactions involved in the surfactant-mediated growth of gold nanorods.
Ascorbic acid in C16TABr solution dissociates to a greater extent than in water alone
indicating an interaction with the surfactant monomers or micelles48
and the oxidation
potential of ascorbic acid is lower in micellar environments46
than in pure aqueous solutions.
Importantly however, at this stage we find that AuI ions in the growth solution are not
reduced to Au0
at any appreciable rate even when an excess of up to five molar equivalents of
ascorbic acid is present. AuI ions in the growth solution are reduced to Au
0 only upon
addition of the Au nanoparticle seeds.
Figure 1 presents data obtained from UV-visible spectroscopy experiments that show the
amount of Au0 after nanorod growth has completed, as a function of the amount of added
ascorbic acid (see Section 4 of Supporting Information for complete data). No Au0 is
produced at stoichiometries of less than 1:1 ascorbic acid : AuIII
. In this range, the additions
of ascorbic acid reduce AuIII
to AuI only. However, after an equimolar amount of ascorbic
acid has been added, Au0 is produced in an approximately 2:1 proportion to the further
additions of ascorbic acid within the growth solution. This is in agreement with the results
predicted by stoichiometry.

9
Figure 1. Graph showing the amount of Au0 formed as a function of added ascorbic acid in a
mixture comprised of growth solution and seed. The initial gold content for all experiments is
5 moles of AuIII
.
A key feature of the disproportionation of AuI via 3Au
I → 2Au
0 + Au
III that helps to
establish its role during the formation of nanorods is that the disproportionation reaction is
(1) catalyzed by metallic gold49-50
and is (2) therefore autocatalytic.14
As mentioned above,
we found that no reaction occurred in the absence of gold seed, even when the concentration
of ascorbic acid was increased to five times that required, but the reaction proceeded rapidly
when Au0 particles were added, thus verifying (1). Figure 2 shows the amount of Au
I that has
been reduced to the theoretical maximum amount of Au0 obtainable (with ascorbic acid the
limiting reactant) during the reaction with growth solution. The sigmoidal shape of the curve
indicates that the reaction is autocatalytic,17
thus verifying (2). For the reaction to proceed to
completion, any AuIII
formed by disproportionation must be rapidly reduced back to AuI by
excess ascorbic acid to avoid it re-oxidizing any Au0.19, 51
However, from a purely
stoichiometric perspective it does not matter whether the Au0 is produced by
disproportionation of AuI or by direct reduction of Au
I by ascorbic acid because both
processes still require one mole of ascorbic acid per two moles of Au0 produced from Au
I.

10
Based on our data, the sequence of reactions that we propose occurs on the surface of a
growing gold nanoparticle are shown schematically in Figure 3.
Figure 2. Graph showing the concentration of Au0 (as suspended nanoparticles) resulting
from the reaction of two different concentrations of ascorbic acid with AuI.
Figure 3. Disproportionation of AuBr2- according to the reaction 3Au
I → 2Au
0 + Au
III at the
surface of a 2 nm diameter gold nanoparticle leading to growth of the particle (approximately
to scale).
Figure 4 shows UV-visible spectra recorded during the growth of nanorods in solution, in
this case produced with a growth solution containing 0.50 mM HAuCl4, 0.1 M CTABr, 0.65
mM ascorbic acid and 70 M AgNO3. A longitudinal plasmon resonance at ~750 nm appears
in the very earliest stages of growth (t < 180 s). The peak red-shifts to ~800 nm over a period
of ~180 s and subsequently blue-shifts to ~660 nm, a trend also reported by others.25, 27, 31, 52-
55 These data confirm that rods can form quite early in the synthetic process and that the

11
shape then changes during the growth phase. However, the conventional interpretation of
such early spectra would be that they had been generated by an ensemble of tiny rods, each
well below the final rod size. Tantalizing evidence to the contrary is available from
experimental data provided in the prior literature but the significance was evidently not fully
recognized at the time. For example, TEM images provided by Sau and Murphy,25
and
Niidome et al.27
show that nanorods of nearly full size were present even at the earliest stages
of the synthesis process, at a time when the absorbance of the colloid was still low, while
Miranda et al. interpreted the blue shift of the longitudinal resonance as evidence that
nucleation and growth had operated in a parallel rather than sequential fashion within their
photochemically-activated growth solution.56
Figure 4. Representative spectra of the kinetics of gold nanorods in solution. Inset shows an
enlargement of the data recorded up to 600 seconds. The earliest trace shown in either panel
is for 2.5 minutes.
To further investigate the rapid growth phase, cryogenic transmission electron microscope
(‘cryo-TEM’) images of rapidly frozen solutions containing nanorods were obtained. Figure 5
shows images obtained after 2.5 minutes and up to 24 hours after the addition of seed
particles to growth solutions. Surprisingly, rods of nearly full size are evident after only 2.5
12
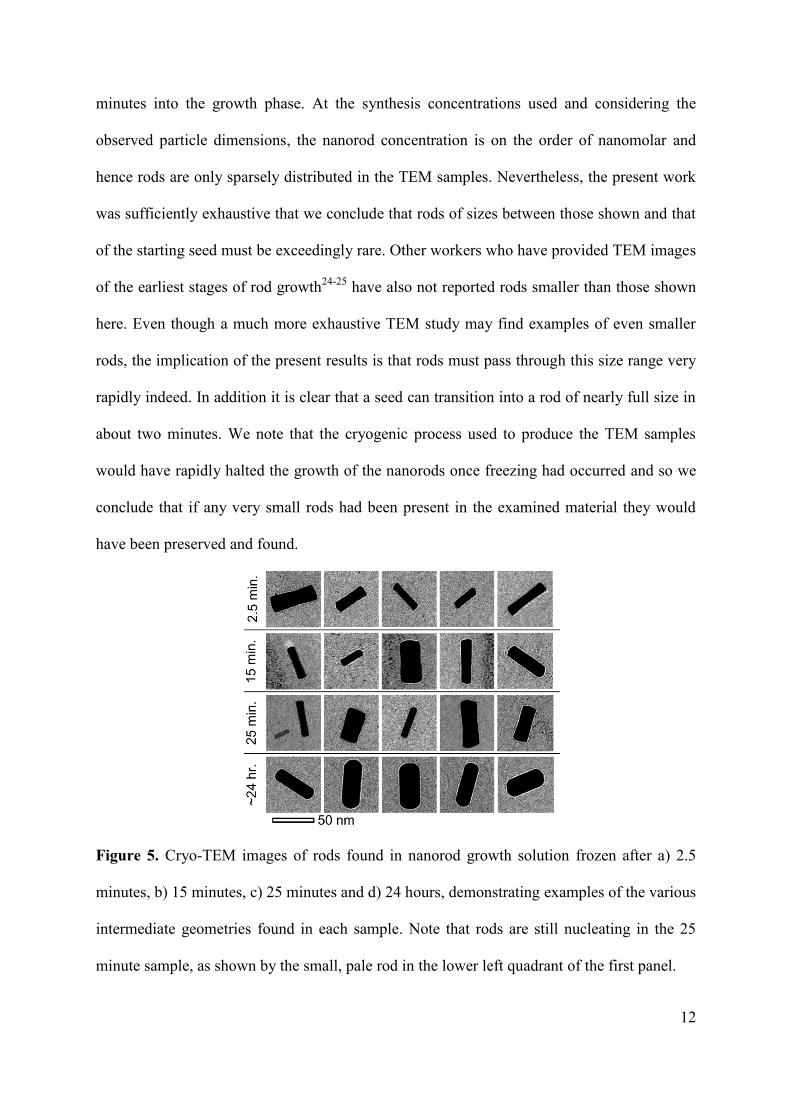
minutes into the growth phase. At the synthesis concentrations used and considering the
observed particle dimensions, the nanorod concentration is on the order of nanomolar and
hence rods are only sparsely distributed in the TEM samples. Nevertheless, the present work
was sufficiently exhaustive that we conclude that rods of sizes between those shown and that
of the starting seed must be exceedingly rare. Other workers who have provided TEM images
of the earliest stages of rod growth24-25
have also not reported rods smaller than those shown
here. Even though a much more exhaustive TEM study may find examples of even smaller
rods, the implication of the present results is that rods must pass through this size range very
rapidly indeed. In addition it is clear that a seed can transition into a rod of nearly full size in
about two minutes. We note that the cryogenic process used to produce the TEM samples
would have rapidly halted the growth of the nanorods once freezing had occurred and so we
conclude that if any very small rods had been present in the examined material they would
have been preserved and found.
Figure 5. Cryo-TEM images of rods found in nanorod growth solution frozen after a) 2.5
minutes, b) 15 minutes, c) 25 minutes and d) 24 hours, demonstrating examples of the various
intermediate geometries found in each sample. Note that rods are still nucleating in the 25
minute sample, as shown by the small, pale rod in the lower left quadrant of the first panel.

13
The end profiles of the imaged rods varied from flat-ended through conical to
hemispherical as time progressed but their sizes were surprisingly similar. Considering the
particle dimensions and geometry observed in the TEM in the context of the spectral data
which show steadily increasing optical density (Figure 4) it is clearly not possible for all
seeds to grow to nanorods in parallel from the point of seeding. That is, each seed particle
does not begin growing into a nanorod immediately. This is supported by fact that the volume
percent of metallic gold at 2.5 minutes (Figure 2) is only about 1% that of the final product
whereas the volumes of the largest nanoparticles observed at this time are already
approximately 50 – 60 % that of the final shape.
Previous kinetic models29, 32
for nanorod growth have assumed that the applicable geometry
is that of a hemispherically-capped right cylinder. Our cryo-TEM data suggest that this is not
strictly correct. Furthermore, the distributions of shapes of the nanorods in an ensemble is
also expected to exert an effect on its optical extinction.31
The presence of intermediate
particle geometries is also evident from optical absorption spectra collected towards the end
of the primary reaction prior to ageing (Figure 6). These spectra reveal that the average
geometry of the distribution is changing, and that the concentration of shapes with a red-
shifted longitudinal resonance is decreasing while that of shapes with a more blue-shifted
longitudinal resonance is increasing. Since the bulk of the shift in resonance wavelength is
associated with the longitudinal peak, and because the volume of Au0 has ceased to change
much at this point in the growth process, it can be deduced that the spectral changes are due
to the flared end-cap geometry morphing into the final, familiar, hemispherical-cap. This type
of shape change has been shown to be associated with a significant blue-shifting of the
longitudinal plasmon resonance, even if the aspect ratio itself does not change.31
This change
is driven by surface energy since the early flared end-cap morphology must have a relatively
smaller area of the low energy {111} facets than the well-aged rods at the end of the growth

14
process. A remaining issue is how the flared end-caps developed in the first place. We
suggest that this results from two factors; first the main growth is along a <100> direction
thus favoring flattened {100} rod ends during that initial time period when rapid growth is
dominant, and second, the limited lateral growth on the sides that does occur must proceed
somewhat faster on freshly-formed side surfaces than on the older ones. This difference in
reactivity of side surfaces with age might be the result of the surface passivating process
requiring some time to reach an optimum configuration. Such a situation would naturally
result initially in a slightly flared particle, followed later by its conversion later into the
familiar hemispherically-capped cylinder.
Figure 6. Absorbance spectra collected towards the end of growth sequence ( 0.5 < t < 1
hour) when a nearly constant volume of Au0 has been achieved. Arrows show change in
absorbance with time.
Some insights into the above phenomena may be gained from two simple mathematical
models. Using the first model we illustrate the effect of nanorod shape on the optical spectra,
while the second model demonstrates how surface energy considerations affect the aspect
ratio of rods during the growth process.

15
Intermediate nanoparticle geometries can be approximated from the TEM data (e.g. Figure
5) by assuming rotational symmetry about the longitudinal axis. Figure 7 illustrates
prototypical examples of these intermediate geometries and the designations that we have
given them.
Figure 7. Geometries observed during growth of gold nanorods, (a) bow-tie (BT), (b)
conically-capped bow-tie (CBT), (c) conically-capped cylinder (CC) and (d) the final
nanorod morphology, a hemispherically-capped cylinder (SC).
Optical extinction spectra, Figure 8, were calculated for ensembles of these prototypical
shapes using sizes that were observed in the TEM data. The shapes intermediate between the
prototypes were generated by assuming a linear progression of the particle dimensions. It was
assumed that the end product in the growth sequence is the familiar spherically capped
cylinder (SC). Besides the well-known strong red-shifting associated with an increase in
aspect ratio, an increase in volume also has a red-shifting effect on the main extinction peak,
while a change in the shape of the end-caps can cause blue- or red-shifts, depending on its
nature. The BT particle geometry was assigned as the most primitive (optically resolvable)
structure in the growth sequence and so the progression in morphology is BT CBT CC
SC (as indicated by the arrow in Figure 8). The sequence of simulations then shows that
the longitudinal peak initially blue-shifts, corresponding mainly to an increase in aspect ratio,

16
and then red shifts when the waist of the particle begins to develop and/or the rod decreases
in length and the end-caps change geometry from conical to hemispherical.
Figure 8. Normalized simulated nanoparticle spectra. Corresponding geometries are
indicated on the right with intermediate spectra generated by a linear interpolation of the
relevant geometries. The large arrow indicates the direction of development.
This illustrative model reproduces the behavior of the experimentally measured data,
Figure 9. However, the experimental data has a somewhat broader longitudinal plasmon
resonance peak than the simulated data, presumably due to it having a broader distribution of
particle sizes than the simulated data (our simulations aimed to correctly account for peak
position rather than for peak broadening). We therefore conclude that the evolution of the
experimental optical spectra, and also of the growing nanorods, may be ascribed to the
sequence of events shown in Figure 8.

17
Figure 9. (a) Measured absorbance spectrum of growing nanorod solution with 0.65 mM
ascorbic acid. (b) Distributions of calculated particle spectra progressing from BT – CBT –
CC – SC. Spectra normalized to experimental peak position and gold volume. (c)
Longitudinal peak positions of experimental and simulated data from (a) and (b) respectively.
The second mathematical model illustrates the effect of surface energy and kinetics on the
aspect ratio of the rod. It begins with the recognition that the development of rod-like shapes
in a single crystal of face-centered cubic gold can only result if growth proceeds more rapidly
along a particular pair of oppositely aligned <100> directions than any of the other possible
directions. While it has been generally argued that growth is restricted in the other directions
by a layer of surfactant and/or silver species that passivates the sides of the rod, here we will
show that a mechanism based on the interplay between volume and surface energy will also
provide rod-like shapes. This scheme does not impose any a priori restrictions for growth
rates along different crystallographic directions, and requires only that the surface energies of
18
different crystallographic faces differ. It is therefore fundamentally different in nature, for
example, to the recently published growth model of Seyed-Razavi et al. in which the growth
of gold nanorods was modeled by prohibiting growth on any face other than the {100}.57
To simplify the development of a model based on surface energies we considered only two
kinds of crystal facet, corresponding to either the sides or the end caps of the nanorods, with
surface energies of Sside and Scap respectively. In general, a number of studies have concluded
that Sside < Scap and that the difference may be attributed to factors such as the selective
binding of C16TABr22, 35-36
and/or Ag-containing compounds along the sides.15, 37
Of course,
the {100}, {110} or {250} facets found along the sides of the rod would have a higher
surface energy than the highly coordinated {111} facets observed at the ends of well-aged
rods in a vacuum environment. However, in the solutions used to make rods this original
difference in energy is evidently diminished or even reversed by the selective binding of
material derived from the surrounding solution onto the less highly coordinated side facets.
The important factor that influences the final shape of a nanorod is the ratio S = Sside/Scap
operating in the aqueous environment during growth. The mechanism by which Ag ions
control rod shape can then be readily explained since the presumed attachment of Ag ions or
complexes that occurs on the sides of the rod will change the surface energy there and thus
the Sside/Scap ratio. For simplicity, we depict a nanorod as a hemispherically-capped right
cylinder of total length, L, and diameter, D, with a volume, V, of gold. (Although the model
could be extended to the more complex shapes described above, this would not provide a
materially different result and greatly complicates the analytical expressions.)
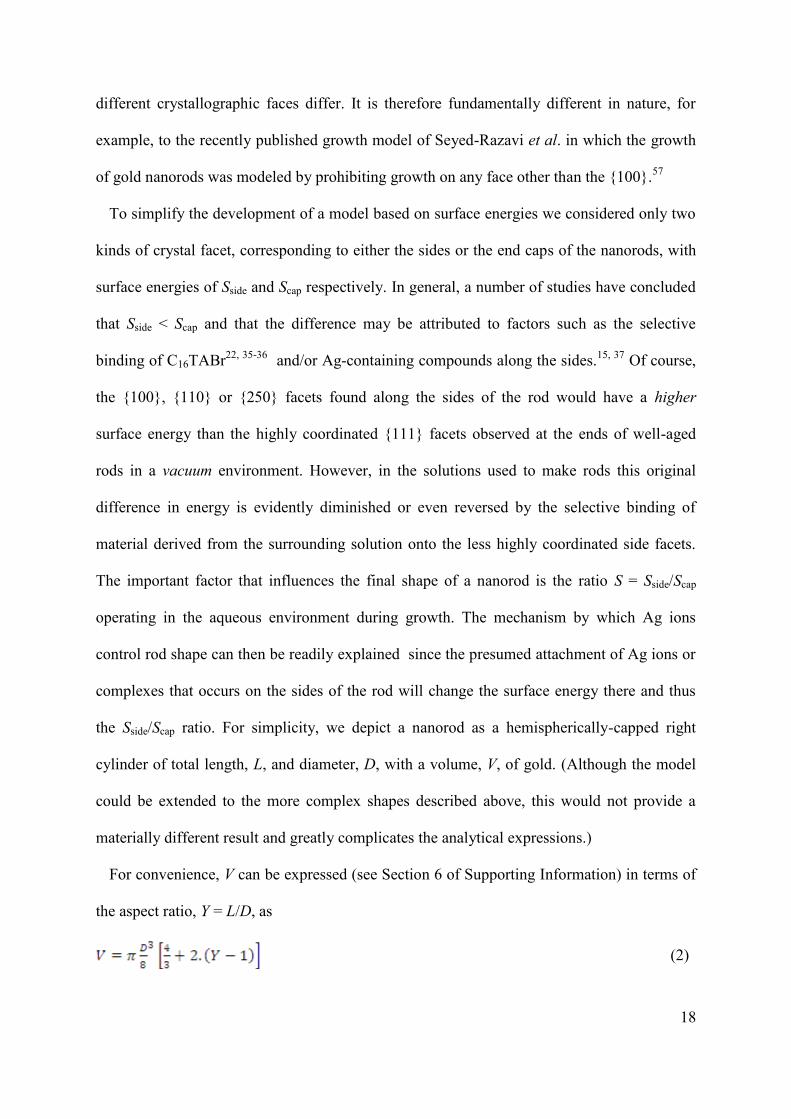
For convenience, V can be expressed (see Section 6 of Supporting Information) in terms of
the aspect ratio, Y = L/D, as
(2)

19
By analogy to standard homogenous nucleation and growth theory, the work done to create
a particular nanorod can be expressed as the difference between its total surface energy and
the chemical energy released when the volume V of gold was reduced to Au0 from Au
I.
Normalizing both the surface energy and the volume energy with respect to Scap, and
allowing the coefficient to contain the normalized volumetric energy of the nanorod per
nm3 (see Supporting Information), the net work done (ΔW) can be expressed as
(3)
was estimated from the observation that Au spheres of ~5 nm diameter represent a
threshold for longer term thermodynamic stability in growth solutions of the type used here,
so that when R=2.5 nm and S 0.5, for example, must be approximately 1.20 m-1
in order to
give (the threshold condition). The trajectory that can be followed by a
growing nanoparticle can be determined if (1) it is assumed that changes in shape occur in a
manner that lowers its energy, and (2) that a Monte Carlo-driven stochastic process of
incremental volume change applies.

20
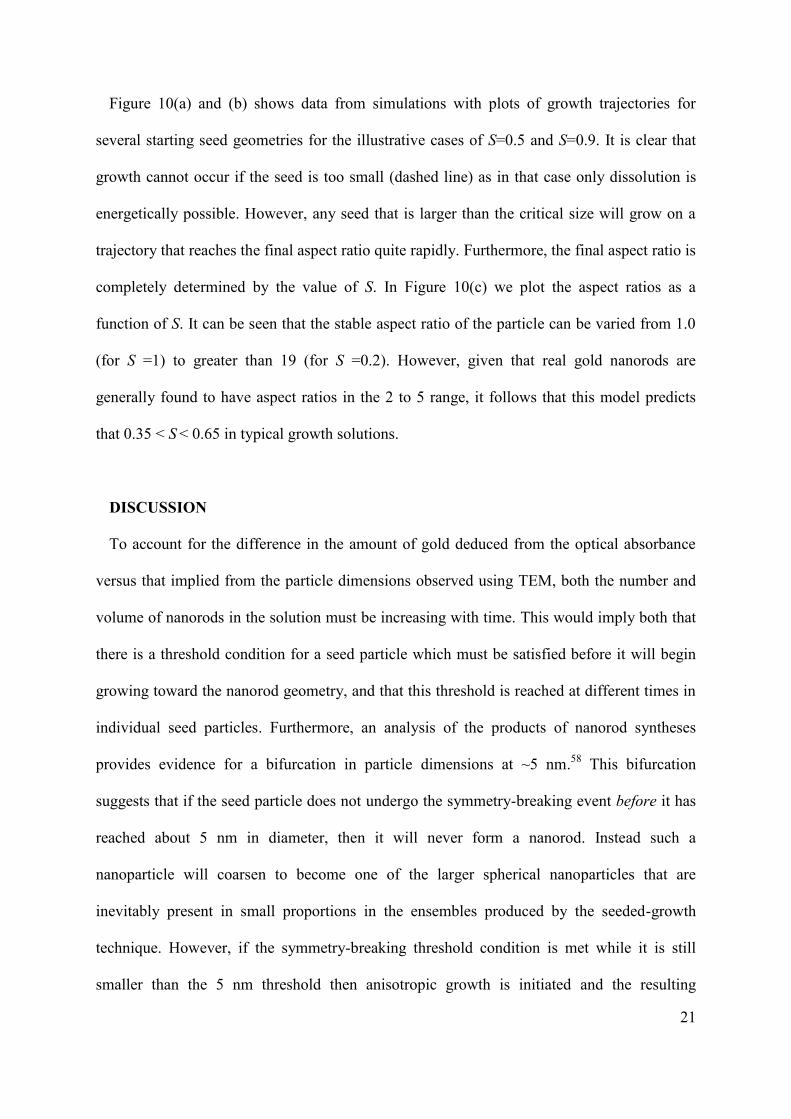
Figure 10. (a) Example of predicted growth trajectories for the case of Sside/Scap=0.5 for five
differently-sized seeds that grow stochastically in a way that reduces their overall energy.
Starting seed shown with symbol ‘*’. (b) Example of predicted growth trajectories for case of
Sside/Scap=0.9 for four differently-sized seeds that grow stochastically in a way that reduces
their overall energy. Spontaneous dissolution of the seed will occur in the region to the left of
the dashed line. (c) Effect of ratio Sside/Scap on the predicted aspect ratio of a hemispherically-
capped right cylindrical nanorod in terms of the simple model proposed.
21
Figure 10(a) and (b) shows data from simulations with plots of growth trajectories for
several starting seed geometries for the illustrative cases of S=0.5 and S=0.9. It is clear that
growth cannot occur if the seed is too small (dashed line) as in that case only dissolution is
energetically possible. However, any seed that is larger than the critical size will grow on a
trajectory that reaches the final aspect ratio quite rapidly. Furthermore, the final aspect ratio is
completely determined by the value of S. In Figure 10(c) we plot the aspect ratios as a
function of S. It can be seen that the stable aspect ratio of the particle can be varied from 1.0
(for S =1) to greater than 19 (for S =0.2). However, given that real gold nanorods are
generally found to have aspect ratios in the 2 to 5 range, it follows that this model predicts
that 0.35 < S < 0.65 in typical growth solutions.
DISCUSSION
To account for the difference in the amount of gold deduced from the optical absorbance
versus that implied from the particle dimensions observed using TEM, both the number and
volume of nanorods in the solution must be increasing with time. This would imply both that
there is a threshold condition for a seed particle which must be satisfied before it will begin
growing toward the nanorod geometry, and that this threshold is reached at different times in
individual seed particles. Furthermore, an analysis of the products of nanorod syntheses
provides evidence for a bifurcation in particle dimensions at ~5 nm.58
This bifurcation
suggests that if the seed particle does not undergo the symmetry-breaking event before it has
reached about 5 nm in diameter, then it will never form a nanorod. Instead such a
nanoparticle will coarsen to become one of the larger spherical nanoparticles that are
inevitably present in small proportions in the ensembles produced by the seeded-growth
technique. However, if the symmetry-breaking threshold condition is met while it is still
smaller than the 5 nm threshold then anisotropic growth is initiated and the resulting

22
nanorods achieve a reasonably tight dispersion of aspect ratios. Once the threshold condition
for rod-growth has been met the initial growth rate is very rapid. The initial mechanism is
analogous to a ‘popcorn-like’ event followed by a gradual further development of the
particle’s dimensions. A possible explanation for the failure of seeds larger than 5 nm to form
nanorods may be found in the ‘nanophase stability diagrams’ of Barnard et al.59
which show
that a gold nanoparticle at room temperature will be most stable when adopting the
icosohedral form for a diameter less than about 4 nm, and decahedral when the diameter is
above 4 nm but less than about 15 nm, Figure 11. The implication here for the growth of rods
is that only icosohedral particles can seed a nanorod so any spherical seed that coarsens past
the critical diameter of about 5 nm will not contribute to rod growth and will instead coarsen
to an equiaxed decahedral or fcc shape.
Figure 11. Calculated phase stability diagram for spherical gold nanoparticles. Reprinted
with permission from ref 59
. Copyright 2009 American Chemical Society.
While the threshold condition that initiates rod growth could be crystallographic, the idea
of electric field assisted growth19
could also provide an explanation. The origin of this
electric field would be the adsorption of ionic species at the surface of the seed particles

23
where fluctuations in the charge density or local concentration of Au ions could induce a
symmetry-breaking event. In either event, the random fluctuations in local environment that
trigger the symmetry-breaking threshold require some time to occur, hence the stochastic
delay in growth of the rod. This effect would be more significant for smaller particles leading
to another potential reason for the bifurcation in particle growth trajectories at about 5 nm
diameter. There is no reason why stochastic growth of this type should be restricted to gold
nanorods, and evidence of its occurrence in the growth of other anisotropic nanoparticles
should be sought.
CONCLUSION
Whereas previous work has assumed a gradual and parallel growth of seeds into nanorods,
here we have shown that intermediate geometries are formed by a comparatively early
growth event which is of a stochastic nature. These intermediate particle geometries have
been observed in cryo-TEM data and inferred from optical extinction data. The
transformation between these intermediate geometries has been simulated and the associated
optical properties calculated, and the results are consistent with the experimental data. The
important influence of the ratio of surface energies between side and cap of the nanorod was
identified. The reduction mechanism of gold species was also considered. The concentration
of gold in the nanorod product is closely related to the expected amount from the
disproportionation mechanism although the formation of an Au-ascorbate complex as
intermediate is not excluded. The blue-shifting of the longitudinal plasmon peak that occurs
at the end of the growth process is associated with a change in shape from ‘bow tie’ to
hemispherically-capped right-cylinder.

24
METHODS
The following chemicals were purchased commercially and used as received: C16TABr and
ascorbic acid (Alfa Aesar), HAuBr4, AgNO3 and KBH4 (Sigma Aldrich), and C16TACl (Nanjing
Robiot). Tetrachloroauric acid (HAuCl4) was synthesized according to published methods.60
Water
was purified by a MilliQ system (18.2 m ).
Gold nanorods were prepared using a variation of a reported method.14, 36
First, growth solutions
(each of 10 mL volume) with the following concentrations were prepared: 0.1 M C16TABr, 0.5 mM
tetrachloroauric acid (HAuCl4), x mM ascorbic acid (where x varied from 0.4 to 1.0) and 50, 70 or 100
µM silver nitrate (AgNO3). Separately, a seed solution was prepared by adding 0.5 mL of ice-cold
0.01 M potassium borohydride to 10 mL of a solution containing HAuCl4 (0.1 mM) and C16TABr (25
mM). The seed solution was aged for one hour at 30ºC. Growth was initiated by addition of 10 µL of
the seed solution to the a growth solution and the mixture was maintained at 30ºC for the duration of
the reaction.
UV-Vis-NIR spectra were recorded using an Agilent 8453E photodiode array spectrophotometer.
During the early stages of rod growth (up to 5 – 10 min., depending on the ascorbic acid
concentration), the optical density of the suspension was quite low and so a 10 cm path length quartz
cuvette (Starna) was utilized during this phase. For growth times longer than 10 min., a 1 cm quartz
cuvette was used. Kinetics data for the 0.65 mM ascorbic acid sample approached the detection limit
of the spectrophotometer towards the end of the reaction so it was diluted for the remainder of the
reaction. The gold concentration in the 0.65 mM sample follows the same curve shape as that of the
0.60 mM ascorbic acid sample and so diluting the sample does not appear to have affected this stage
of the reaction significantly.
The concentration of Au0 during the reactions was determined by monitoring the optical absorbance
of solutions at 390 nm. Metallic gold exhibits an optical response that is relatively independent of
shape in the wavelength range 350 to 450 nm, which lies within the region of interband transitions.61-
62 In this range the absorbance depends predominantly on the number and volume of Au
0
nanoparticles present and . Therefore, this has been used in the past to provide an estimate of Au0

25
concentration.25, 51, 63-64
In the present work, the method was calibrated using well-aged suspensions of
C16TABr-stabilized gold nanoparticles of known concentration that were well-aged . This was to
ensure such that all gold was reduced and that size effects did not contribute to the absorbance at 390
nm. Another verification of the technique could be found by correlating the published inductively
coupled plasma-mass spectrometry (ICP-MS) and optical measurements of Orendorff et al.65
for gold
nanorods (see Section 2 of Supporting Information). The optical method provides an estimate of Au0
that is within 20% of the ICP-MS result, a discrepancy that is much smaller than the 50% loss of Au
found by Orendorff et al. in their overall mass balance. The discrepancy in the original work may
have been due to some of the Au remaining in the oxidized state, or due to some of the Au0 not
reporting to the pellet that was analyzed, but the net result is that optical and ICP-MS analyses are
considerably more accurate than the overall level of uncertainty of the reacting system.
Cryo-TEM experiments were performed to probe the early stages of development of gold nanorods.
The rods were synthesized in the sample preparation room adjacent to the microscope. Our standard
technique, which was found in prior work to produce a colloid with a final absorption peak at about
680 nm was applied. However, the position of this peak was not re-verified during the sample
preparation as a suitable spectrometer was not available at the location of the TEM. Images were
taken using an FEI TECNAI F30 G2 TEM at 300keV using a sample stage cooled with liquid
nitrogen. For the sample preparation no chemical changes were made to the standard growth solution
and the concentrations and method were identical to those used in the kinetics studies. TEM samples
were prepared with the aid of an FEI Vitrobot system to ensure reproducible sample conditions. In
this step 2 to 3 µL of sample was taken and placed on a TEM grid held in a controlled environment at
30ºC and 100% relative humidity. A blotting time of 8 s was used to achieve an ice thickness of ~50 –
100 nm. After blotting, the TEM grid was plunged into a bath of liquid ethane to form a layer of
vitreous ice. Multiple grids were prepared and subsequently stored in liquid nitrogen. Any failure of
the specimen preparation process, as for example could hypothetically occur by reheating of the
sample, necessarily renders the TEM samples unusable. Therefore, the observed rod structures may be
confidently assumed to have grown prior to freezing

26
The optical extinction properties of gold nanorods of various shapes were calculated using the
DDSCAT code of Draine and Flatau.66-67
This method uses the discrete dipole approximation (DDA)
and has been found in previous work to be accurate provided that the dipole spacing is sufficiently
small.68
A dipole spacing of between 0.4 and 0.6 nm was used here, with the larger spacing used for
the larger rods. The target was sampled once in the longitudinal direction and twice in the transverse
direction to give an average optical extinction representative of a colloidal suspension.
Acknowledgment. This work was supported by the Australian Research Council and AGR Matthey
Limited. We also acknowledge the technical, scientific and financial assistance from the Australian
Microscopy & Microanalysis Research Facility (AMMRF) for funding cryoTEM studies at the
University of Queensland.
Supporting Information. Application of an empirical model for growth of nanorods using coupled
equations of Henkel et al. UV-visible spectra showing the identity of the soluble Au species.
Explanation of the calibration of content of metallic gold to optical extinction spectra. Optical
extinction spectra showing the effect of increasing concentration of ascorbic acid on the rod-forming
reaction. TEM image of frozen growth solution. Principles used to drive shape change in authors’
mathematical model of evolving geometry. Derivation of algebraic expression for net work done to
form a nanorod. This material is available free of charge via the Internet at http://pubs.acs.org.
REFERENCES
1. Edgar, J. A.; Cortie, M. B. Nanotechnological Applications of Gold. In Gold. Science
and Applications; Corti, C.; Holliday, R., Eds.; Taylor and Francis: London, 2009; 369-397.
2. Pérez-Juste, J.; Mulvaney, P.; Liz-Marzán, L. M., Patterning and Encryption Using
Gold Nanoparticles. Int. J. Nanotechnol. 2007, 4, 215 - 224.

27
3. Pissuwan, D.; Valenzuela, S. M.; Cortie, M. B., Prospects for Gold Nanorod Particles
in Diagnostic and Therapeutic Applications. Biotechnol. Genet. Eng. Rev. 2008, 25, 93-112.
4. Stokes, N. L.; Edgar, J. A.; McDonagh, A. M.; Cortie, M. B., Spectrally Selective
Coatings of Gold Nanorods on Architectural Glass. J. Nanopart. Res. 2010, 12, 2821 - 2830.
5. Zijlstra, P.; Chon, J. W. M.; Gu, M., Five-Dimensional Optical Recording Mediated
by Surface Plasmons in Gold Nanorods. Nature 2009, 459, 410-413.
6. Murphy, C. J.; Gole, A. M.; Hunyadi, S. E.; Orendorff, C. J., One-Dimensional
Colloidal Gold and Silver Nanostructures. Inorg. Chem. 2006, 45, 7544-7554.
7. Perez-Juste, J.; Pastoriza-Santos, I.; Liz-Marzan, L. M.; Mulvaney, P., Gold
Nanorods: Synthesis, Characterization and Applications. Coord. Chem. Rev. 2005, 249,
1870-1901.
8. Yu, Y.-Y.; Chang, S.-S.; Lee, C.-L.; Wang, C. R. C., Gold Nanorods: Electrochemical
Synthesis and Optical Properties. J. Phys. Chem. B 1997, 101, 6661-6664.
9. Hirsch, L. R.; Stafford, R. J.; Bankson, J. A.; Sershen, S. R.; Rivera, B.; Price, R. E.;
Hazle, J. D.; Halas, N. J.; West, J. L., Nanoshell-Mediated Near-Infrared Thermal Therapy of
Tumors under Magnetic Resonance Guidance. Proc. Natl. Acad. Sci. U. S. A. 2003, 100,
13549-13554.
10. Loo, C.; Lowery, A.; Halas, N.; West, J.; Drezek, R., Immunotargeted Nanoshells for
Integrated Cancer Imaging and Therapy. Nano Lett. 2005, 5, 709-711.
11. Oldenburg, S. J.; Averitt, R. D.; Westcott, S. L.; Halas, N. J., Nanoengineering of
Optical Resonances. Chem. Phys. Lett. 1998, 288, 243-247.

28
12. Harris, N.; Ford, M. J.; Mulvaney, P.; Cortie, M. B., Tunable Infrared Absorption by
Metal Nanoparticles: The Case for Gold Rods and Shells. Gold Bull. 2008, 41, 5-14.
13. Jain, P. K.; Lee, K. S.; El-Sayed, I. H.; El-Sayed, M. A., Calculated Absorption and
Scattering Properties of Gold Nanoparticles of Different Size, Shape, and Composition:
Applications in Biological Imaging and Biomedicine. J. Phys. Chem. B. 2006, 110, 7238-
7248.
14. Jana, N. R.; Gearheart, L.; Murphy, C. J., Seed-Mediated Growth Approach for Shape
Controlled Synthesis of Spheroidal and Rod-Like Gold Nanoparticles Using a Surfactant
Template. Adv. Mater. 2001, 13, 1389-1393.
15. Hubert, F.; Testard, F.; Spalla, O., Cetyltrimethylammonium Bromide Silver Bromide
Complex as the Capping Agent of Gold Nanorods. Langmuir 2008, 24, 9219-9222.
16. Jana, N. R., Gram-Scale Synthesis of Soluble, Near-Monodisperse Gold Nanorods
and Other Anisotropic Nanoparticles. Small 2005, 1, 875-882.
17. Zijlstra, P.; Bullen, C.; Chon, J. W. M.; Gu, M., High-Temperature Seedless Synthesis
of Gold Nanorods. J. Phys. Chem. B 2006, 110, 19315-19318.
18. Busbee, B. D.; Obare, S. O.; Murphy, C. J., An Improved Synthesis of High-Aspect-
Ratio Gold Nanorods. Adv. Mater. 2003, 15, 414-416.
19. Perez-Juste, J.; Liz-Marzan, L. M.; Carnie, S.; Y.C.Chan, D.; Mulvaney, P., Electric-
Field-Directed Growth of Gold Nanorods in Aqueous Surfactant Solutions. Adv. Funct.
Mater. 2004, 14, 571-579.

29
20. Tornblom, M.; Henriksson, U., Effect of Solubilization of Aliphatic Hydrocarbons on
Size and Shape of Rodlike C(16)TABr Micelles Studied by H-2 NMR Relaxation. J. Phys.
Chem. B 1997, 101, 6028-6035.
21. Aswal, V. K.; Goyal, P. S.; Amenitsch, H.; Bernstorff, S., Counterion Condensation
in Ionic Micelles as Studied by a Combined Use of SANS and SAXS. Pramana: J. Physics
2004, 63, 333-338.
22. Gao, J.; Bender, C. M.; Murphy, C. J., Dependence of the Gold Nanorod Aspect Ratio
on the Nature of the Directing Surfactant in Aqueous Solution. Langmuir 2003, 19, 9065-
9070.
23. Jana, N. R.; Gearheart, L. A.; Murphy, C. J., Evidence for Seed-Mediated Nucleation
in the Chemical Reduction of Gold Salts to Gold Nanoparticles. Chem. Mater. 2001, 13,
2313-2322.
24. Liu, M.; Guyot-Sionnest, P., Mechanism of Silver(I)-Assisted Growth of Gold
Nanorods and Bipyramids. Journal of Phys. Chem. B 2005, 109, 22192-22200.
25. Sau, T. K.; Murphy, C. J., Seeded High Yield Synthesis of Short Au Nanorods in
Aqueous Solution. Langmuir 2004, 20, 6414-6420.
26. Zweifel, D. A.; Wei, A., Sulfide-Arrested Growth of Gold Nanorods. Chem. Mater.
2005, 17, 4256-4261.
27. Niidome, Y.; Nishioka, K.; Kawasaki, H.; Yamada, S., Rapid Synthesis of Gold
Nanorods by the Combination of Chemical Reduction and Photoirradiation Processes;
Morphological Changes Depending on the Growing Processes. Chem. Comm. 2003, 18,
2376-2377.

30
28. Becker, J.; Schubert, O.; Sonnichsen, C., Gold Nanoparticle Growth Monitored in Situ
Using a Novel Fast Optical Single-Particle Spectroscopy Method. Nano Lett. 2007, 7, 1664-
1669.
29. Gulati, A.; Liao, H.; Hafner, J. H., Monitoring Gold Nanorod Synthesis by Localized
Surface Plasmon Resonance. J. Phys. Chem. B. 2006, 110, 22323 - 22327.
30. Prescott, S. W.; Mulvaney, P., Gold Nanorod Extinction Spectra. J. of Applied
Physics 2006, 99, 123504.
31. Xu, X.; Cortie, M. B., Shape Change and Color Gamut in Gold Nanorods, Dumbbells
and Dog-Bones. Adv. Funct. Mater. 2006, 16, 2170-2176.
32. Henkel, A.; Schubert, O.; Plech, A.; Sonnichsen, C., Growth Kinetic of a Rod-Shaped
Metal Nanocrystal. J. Phys. Chem. C 2009, 113, 10390-10394.
33. Morita, T.; Tanaka, E.; Inagaki, Y.; Hotta, H.; Shingai, R.; Hatakeyama, Y.;
Nishikawa, K.; Murai, H.; Nakano, H.; Hino, K., Aspect-Ratio Dependence on Formation
Process of Gold Nanorods Studied by Time-Resolved Distance Distribution Functions. J.
Phys. Chem. C 2010, 114, 3804-3810.
34. Brioude, A.; Jiang, X. C.; Pileni, M. P., Optical Properties of Gold Nanorods: DDA
Simulations Supported by Experiments. J. Phys. Chem. B 2005, 109, 13138-13142.
35. Nikoobakht, B.; El-Sayed, M. A., Evidence for Bilayer Assembly of Cationic
Surfactants on the Surface of Gold Nanorods. Langmuir 2001, 17, 6368-6374.
36. Nikoobakht, B.; El-Sayed, M. A., Preparation and Growth Mechanism of Gold
Nanorods (NRs) Using Seed-Mediated Growth Method. Chem. Mater. 2003, 15, 1957-1962.

31
37. Niidome, Y.; Nakamura, Y.; Honda, K.; Akiyama, Y.; Nishioka, K.; Kawasaki, H.;
Nakashima, N., Characterization of Silver Ions Adsorbed on Gold Nanorods: Surface
Analysis by Using Surface-Assisted Laser Desorption/ionization Time-of-flight Mass
Spectrometry. Chem. Comm. 2009, 1754-1756.
38. Carbó-Argibay, E.; Rodróguez-González, B.; Gómez-Graña, S.; Guerrero-Martínez,
A.; Pastoriza-Santos, I.; Pérez-Juste, J.; Liz-Marzán, L. M., The Crystalline Structure of Gold
Nanorods Revisited: Evidence for Higher-Index Lateral Facets. Angew. Chem. Int. Ed. 2010,
49, 9397-9400.
39. Murphy, C. J.; Sau, T. K.; Gole, A. M.; Orendorff, C. J.; Gao, J.; Gou, L.; Hunyadi, S.
E.; Li, T., Anisotropic Metal Nanoparticles: Synthesis, Assembly, and Optical Applications.
J. Phys. Chem. B 2005, 109, 13857-13870.
40. Kawasaki, H.; Nishimura, K.; Arakawa, R., Influence of the Counterions of
Cetyltrimetylammonium Salts on the Surfactant Adsorption onto Gold surfaces and the
Formation of Gold Nanoparticles. J. Phys. Chem. C 2007, 111, 2683-2690.
41. Miranda, O. R.; Ahmadi, T. S., Effects of Intensity and Energy of CW UV Light on
the Growth of Gold Nanorods. J. Phys. Chem. B 2005, 109, 15724–15734.
42. Placido, T.; Comparelli, R.; Giannici, F.; Cozzoli, P. D.; Capitani, G.; Striccoli, M.;
Agostiano, A.; Curri, M. L., Photochemical Synthesis of Water-Soluble Gold Nanorods: The
Role of Silver in Assisting Anisotropic Growth. Chem. Mater. 2009, 21, 4192-4202.
43. Abdelmoti, L. G.; Zamborini, F. P., Potential-Controlled Electrochemical Seed-
Mediated Growth of Gold Nanorods Directly on Electrode Surfaces. Langmuir 2010, 26,
13511-13521.

32
44. Sepúlveda, L.; Cortés, J., Ionization Degrees and Critical Micelle Concentrations of
Hexadecyltrimethylammonium and Tetradecyltrimethylammonium Micelles with Different
Counterions. J. Phys. Chem. 1985, 89, 5322 - 5324.
45. Attwood, D.; Florence, A. T., Surfactant Systems : Their Chemistry, Pharmacy and
Biology. Chapman and Hall: London, 1983; p 84,.
46. Zümreoglu-Karan, B., A Rationale on the Role of Intermediate Au(III)-Vitamin C
Complexation in the Production of Gold Nanoparticles. J. Nanopart. Res. 2009, 11, 1099-
1105.
47. Gou, L.; Murphy, C. J., Fine-Tuning the Shape of Gold Nanorods. Chem. Mater.
2005, 17, 3668-3672.
48. Jaiswal, P. V.; Ijeri, V. S.; Srivastava, A. K., Effect of Surfactants on the Dissociation
Constants of Ascorbic and Maleic Acids. Colloid. Surf. B 2005, 46, 45 - 51.
49. Evans, D. H.; Lingane, J. J., Standard Potentials of the Couples Involving AuBr4-
,AuBr2- and Au in Bromide Media. J. Electroanal. Chem. 1963, 6, 1 - 10.
50. Gammons, C. H.; Yu, Y.; Williams-Jones, A. E., The Disproportionation of Gold (I)
Chloride Complexes at 25 to 200°C. Geochim. Cosmochim. Ac. 1997, 61, 1971 - 1983.
51. Rodriguez-Fernandez, J.; Perez-Juste, J.; Mulvaney, P.; Liz-Marzan, L. M., Spatially-
Directed Oxidation of Gold Nanoparticles by Au(III)-CTAB Complexes. J. Phys. Chem. B.
2005, 109, 14257-14261.
52. Alekseeva, A. V.; Bogatyrev, V. A.; Dykman, L. A.; Khlebtsov, B. N.; Trachuk, L.
A.; Melnikov, A. G.; Khlebtsov, N. G., Preparation and Optical Scattering Characterization

33
of Gold Nanorods and Their Application to a Dot-Immunogold Assay. Applied Optics 2005,
44, 6285-6295.
53. Boleininger, J.; Kurz, A.; Reuss, V.; Sönnichsen, C., Microfluidic Continuous Flow
Synthesis of Rod-Shaped Gold and Silver Nanocrystals. Phys. Chem. Chem. Phys. 2006, 8,
3824-3827.
54. Keul, H. A.; Moller, M.; Bockstaller, M. R., Structural Evolution of Gold Nanorods
During Controlled Secondary Growth. Langmuir 2007, 23, 10307-10315.
55. Kou, X. S.; Zhang, S. Z.; Tsung, C. K.; Yeung, M. H.; Shi, Q. H.; Stucky, G. D.; Sun,
L. D.; Wang, J. F.; Yan, C. H., Growth of Gold Nanorods and Bipyramids Using CTEAB
Surfactant. J. Phys. Chem. B 2006, 110, 16377-16383.
56. Miranda, O. R.; Dollahon, N. R.; Ahmadi, T. S., Critical Concentrations and Role of
Ascorbic Acid (Vitamin C) in the Crystallization of Gold Nanorods Within
Hexadecyltrimethyl Ammonium Bromide (CTAB)/Tetraoctyl Ammonium Bromide (TOAB)
Micelles. Cryst. Growth Design 2006, 6, 2747-2753.
57. Seyed-Razavi, A.; Snook, I. K.; Barnard, A. S., Surface Area Limited Model for
Predicting Anisotropic Coarsening of Faceted Nanoparticles. Cryst. Growth Des. 2011, 11,
158–165.
58. Hubert, F.; Testard, F.; Rizza, G.; Spalla, O., Nanorods Versus Nanospheres: A
Bifurcation Mechanism Revealed by Principal Component TEM Analysis. Langmuir 2010,
26, 6887-6891.
59. Barnard, A. S.; Young, N. P.; Kirkland, A. I.; Huis, M. A. v.; Xu, H., Nanogold: A
Quantitative Phase Map. ACS Nano 2009, 3, 1431-1436.

34
60. Breitinger, D.; Herrmann, W., Synthetic Methods of Organometallic and Inorganic
Chemistry. George Thieme Verlag.: Stuttgart, 1999; Vol. 5.
61. Quinten, M., Optical Effects Associated with Aggregates of Clusters. J. Cluster Sci.
1999, 10, 321-358.
62. Ung, T.; Liz-Marzan, L. M.; Mulvaney, P., Gold Nanoparticle Thin Films. Colloids
Surf., A 2002, 202, 119-126.
63. Rao, P.; Doremus, R., Kinetics of Growth of Nanosized Gold Clusters in Glass. J.
Non-Cryst. Solids 1996, 203, 202 - 205.
64. Bohren, C. F.; Huffman, D. R., Absorption and Scattering of Light by Small Particles.
John Wiley and Sons: 1983; p 530.
65. Orendorff, C. J.; Murphy, C. J., Quantitation of Metal Content in the Silver-Assisted
Growth of Gold Nanorods. J. Phys. Chem. B. 2006, 110, 3990-3994.
66. Draine, B. T.; Flatau, P. J., Discrete-Dipole Approximation for Scattering
Calculations. J. Opt. Soc. Am. A 1994, 11, 1491-1499.
67. Draine, B. T.; Flatau, P. J. User Guide for the Discrete Dipole Approximation Code
DDSCAT 7.0 2008. http://arxiv.org/abs/0809.0337 (accessed September 2008).
68. Myroshnychenko, V.; Rodríguez-Fernández, J.; Pastoriza-Santos, I.; Funston, A. M.;
Novo, C.; Mulvaney, P.; Liz-Marzán, L. M.; Javier-García-de-Abajo, Modelling the Optical
Response of Gold Nanoparticles. Chem. Soc. Rev. 2008, 37, 1792 - 1805.