Embed Size (px)
Citation preview


Formation of the Final Report The Final Report is comprised of the following volumes:
Volume 1: Executive Summary Volume 2: Main Report 1 Volume 3: Main Report 2 Volume 4: Main Report 3 Volume 5: Supporting Report Volume 6: Data Book
Volume 1, Executive Summary, contains the background information of this MMEIRS study, brief information of earthquake damage scenario for Metropolitan Manila, and summary of the master plan for a safer Metropolitan Manila for earthquake impact. Volume 2, Main Report 1, contains the information of overall study and its results; that is the background information of this study, earthquake damage scenario, and master plan and action plans for safer Metropolitan Manila. Volume 3, Main Report 2, defines problem of the present condition of Metropolitan Manila, and represents damage estimation results together with its assumptions and methodologies. Volume 4, Main Report 3, contains supportive components related to master plan to help understanding the development of master plan. Volume 5, Supporting Report, contains information on GIS Development and Topographic Map Compilation. It also includes other important out puts of the study, such as city ordinance of earthquake disaster management, earthquake disaster mitigation handbook, and earthquake mitigation and response checklists. Those outputs will be utilized when implementing the master plan. Volume 6, Data Book, contains various data used for analysis in this Study. In addition, data related to earthquake hazard analysis and damage analysis are stored in CD-ROM.
The following foreign exchange rate is applied on this study report; US$1.00=P56.055 (February 2004)
Final Report
-i-
Final Report
Table of Contents Supporting Report <Part V GIS Development and Topographic Map Compilation> Chapter 1. Topographic Mapping ··························································································1-1
1.1 General・・・・・・・・・・・・・・・・・・・・・・・・・・・・・・・・・・・・・・・・・・・・・・・・・・・・・・・・・・・・・・・・・・・・・・・・・1-1 1.1.1 Introduction ・・・・・・・・・・・・・・・・・・・・・・・・・・・・・・・・・・・・・・・・・・・・・・・・・・・・・・・・・・・・・・・・・・・1-1 1.1.2 Objective of Topographic Mapping ・・・・・・・・・・・・・・・・・・・・・・・・・・・・・・・・・・・・・・・・・・・・・・・・・1-1 1.1.3 Topographic Mapping Area ・・・・・・・・・・・・・・・・・・・・・・・・・・・・・・・・・・・・・・・・・・・・・・・・・・・・・・・1-1
1.2 Collection and Review of Existing Data ・・・・・・・・・・・・・・・・・・・・・・・・・・・・・・・・・・・・・・・・・・・・・・・1-3 1.3 Compilation of Existing 1:10,000 Scale topographic Maps Data ・・・・・・・・・・・・・・・・・・・・・・・・・・・・1-6 1.4 Check Survey for Height of Existing Bench Marks・・・・・・・・・・・・・・・・・・・・・・・・・・・・・・・・・・・・・・・1-7 1.5 Preparation of Technical Specifications for 1:5,000 Scale Topographic Mapping Works ・・・・・・・・・・1-8 1.6 Production of 1:5,000 Scale Topographic Maps・・・・・・・・・・・・・・・・・・・・・・・・・・・・・・・・・・・・・・・・・・1-8
1.6.1 Aerial Photography ・・・・・・・・・・・・・・・・・・・・・・・・・・・・・・・・・・・・・・・・・・・・・・・・・・・・・・・・・・・・・1-9 1.6.2 GPS Survey ・・・・・・・・・・・・・・・・・・・・・・・・・・・・・・・・・・・・・・・・・・・・・・・・・・・・・・・・・・・・・・・・・・1-12 1.6.3 Leveling ・・・・・・・・・・・・・・・・・・・・・・・・・・・・・・・・・・・・・・・・・・・・・・・・・・・・・・・・・・・・・・・・・・・・・1-15 1.6.4 Field Verification ・・・・・・・・・・・・・・・・・・・・・・・・・・・・・・・・・・・・・・・・・・・・・・・・・・・・・・・・・・・・・・1-18 1.6.5 Aerial Triangulation・・・・・・・・・・・・・・・・・・・・・・・・・・・・・・・・・・・・・・・・・・・・・・・・・・・・・・・・・・・・1-19 1.6.6 1:5,000 Scale Digital Mapping and Compilation ・・・・・・・・・・・・・・・・・・・・・・・・・・・・・・・・・・・・・1-21 1.6.7 Preparation of 1:5,000 Scale Digital Orthophotos ・・・・・・・・・・・・・・・・・・・・・・・・・・・・・・・・・・・・1-26 1.6.8 Final Products ・・・・・・・・・・・・・・・・・・・・・・・・・・・・・・・・・・・・・・・・・・・・・・・・・・・・・・・・・・・・・・・・1-27
1.7 User’s Guide・・・・・・・・・・・・・・・・・・・・・・・・・・・・・・・・・・・・・・・・・・・・・・・・・・・・・・・・・・・・・・・・・・・・1-28
Chapter 2. GIS Database Development ·················································································2-1 2.1 Purpose of the Development of the Database・・・・・・・・・・・・・・・・・・・・・・・・・・・・・・・・・・・・・・・・・・・・2-1 2.2 Design of the Geographic Database ・・・・・・・・・・・・・・・・・・・・・・・・・・・・・・・・・・・・・・・・・・・・・・・・・・・2-1 2.3 Data Collection and Input ・・・・・・・・・・・・・・・・・・・・・・・・・・・・・・・・・・・・・・・・・・・・・・・・・・・・・・・・・・2-2 2.4 Census Data ・・・・・・・・・・・・・・・・・・・・・・・・・・・・・・・・・・・・・・・・・・・・・・・・・・・・・・・・・・・・・・・・・・・・・2-3 2.5 Major Facilities ・・・・・・・・・・・・・・・・・・・・・・・・・・・・・・・・・・・・・・・・・・・・・・・・・・・・・・・・・・・・・・・・・・2-4 2.6 General Characteristics of Existing Data ・・・・・・・・・・・・・・・・・・・・・・・・・・・・・・・・・・・・・・・・・・・・・・・2-6 2.7 Data Analysis Unit ・・・・・・・・・・・・・・・・・・・・・・・・・・・・・・・・・・・・・・・・・・・・・・・・・・・・・・・・・・・・・・・・2-7 2.8 Data Processing ・・・・・・・・・・・・・・・・・・・・・・・・・・・・・・・・・・・・・・・・・・・・・・・・・・・・・・・・・・・・・・・・・・2-8
<Part VI Appendices>
Outputs of the Study 1. City Ordinance on Disaster Management 2. Earthquake Disaster Mitigation Handbook 3. Earthquake Mitigation and Response Checklists – Local Planning Guide – 4. Guide for Managing Information Concerning Disasters 5. Community Activity Guidebook
Other Materials Records of Workshops and Seminars Sub contract outputs and other analysis (stored in CD-ROM)

Earthquake Impact Reduction Study for Metropolitan Manila in the Republic of the Philippines
-ii-
List of Tables Table 1.1 List of 1:10,000 Scale Topographic Maps ・・・・・・・・・・・・・・・・・・・・・・・・・・・・・・・・・ 1-4 Table 1.2 List of 1:50,000 Scale Topographic maps・・・・・・・・・・・・・・・・・・・・・・・・・・・・・・・・・・ 1-5 Table 1.3 Recommended Map Scale ・・・・・・・・・・・・・・・・・・・・・・・・・・・・・・・・・・・・・・・・・・・・・ 1-7 Table 1.4 Check Survey Results ・・・・・・・・・・・・・・・・・・・・・・・・・・・・・・・・・・・・・・・・・・・・・・・・ 1-8 Table 1.5 List of 1:10,000 Scale Aerial Photographs・・・・・・・・・・・・・・・・・・・・・・・・・・・・・・・・ 1-10 Table 1.6 List of GPS Station’s Coordinates ・・・・・・・・・・・・・・・・・・・・・・・・・・・・・・・・・・・・・・ 1-13 Table 1.7 Accuracy of GPS Network・・・・・・・・・・・・・・・・・・・・・・・・・・・・・・・・・・・・・・・・・・・・ 1-13 Table 1.8 List of GPS Station’s Height ・・・・・・・・・・・・・・・・・・・・・・・・・・・・・・・・・・・・・・・・・・ 1-15 Table 1.9 Accuracy of Leveling Loops ・・・・・・・・・・・・・・・・・・・・・・・・・・・・・・・・・・・・・・・・・・ 1-16 Table 1.10 Items of Field Verification ・・・・・・・・・・・・・・・・・・・・・・・・・・・・・・・・・・・・・・・・・・・・ 1-18 Table 1.11 Accuracy of Aerial Triamgulation・・・・・・・・・・・・・・・・・・・・・・・・・・・・・・・・・・・・・・・ 1-21 Table 1.12 Map Legend ・・・・・・・・・・・・・・・・・・・・・・・・・・・・・・・・・・・・・・・・・・・・・・・・・・・・・・・ 1-23 Table 1.13 Cartographic Layer ・・・・・・・・・・・・・・・・・・・・・・・・・・・・・・・・・・・・・・・・・・・・・・・・・・ 1-24 Table 1.14 List of 1:5,000 Scale Topographic Maps ・・・・・・・・・・・・・・・・・・・・・・・・・・・・・・・・・ 1-26 Table 1.15 List of Final Products ・・・・・・・・・・・・・・・・・・・・・・・・・・・・・・・・・・・・・・・・・・・・・・・・ 1-27 Table 2.1 List of Port Facilities・・・・・・・・・・・・・・・・・・・・・・・・・・・・・・・・・・・・・・・・・・・・・・・・・・ 2-6
List of Figures Figure 1.1 Mapping Area ・・・・・・・・・・・・・・・・・・・・・・・・・・・・・・・・・・・・・・・・・・・・・・・・・・・・・・・ 1-2 Figure 1.2 Barangay Boundary Index Map ・・・・・・・・・・・・・・・・・・・・・・・・・・・・・・・・・・・・・・・・・ 1-6 Figure 1.3 Aerial Photo Index Map (Photo Scale=1:10,000)・・・・・・・・・・・・・・・・・・・・・・・・・・・ 1-11 Figure 1.4 Diagram of GPS Network・・・・・・・・・・・・・・・・・・・・・・・・・・・・・・・・・・・・・・・・・・・・・ 1-14 Figure 1.5 Diagram of Leveling Network ・・・・・・・・・・・・・・・・・・・・・・・・・・・・・・・・・・・・・・・・・ 1-17 Figure 1.6 Aerial Triangulation Mark Index ・・・・・・・・・・・・・・・・・・・・・・・・・・・・・・・・・・・・・・・ 1-20 Figure 1.7 Map Index and Layout (Map Scale=1:5,000) ・・・・・・・・・・・・・・・・・・・・・・・・・・・・・・ 1-22
Supporting Report Part V GIS Development and
Topographic Map Compilation

Chapter 1. Topographic Mapping
Final Report
-1-1-
CHAPTER 1. TOPOGRAPHIC MAPPING
1.1 General
1.1.1 Introduction This report is prepared to describe activities relevant to the topographic mapping works covering the whole Metropolitan Manila, which has been carried out by the Study Team for Earthquake Impact Reduction Study for Metropolitan Manila in Republic of the Philippines (the Study), during the period of October, 2002 to March, 2003. Main topographic mapping works executed by the Study Team are summarized as follows. 1. Collection and review of existing data. 2. Compilation of existing 1:10,000 scale topographic maps data. 3. Check survey for height of existing bench marks. 4. Preparation of technical specifications for 1:5,000 scale topographic mapping works. 5. Production of 1:5,000 scale topographic mapping works. 6. Supervision for aerial photography, GPS survey, leveling and field verification works
executed by Contractor. 7. Preparation of User’s Guide.
1.1.2 Objective of Topographic Mapping Objective of the topographic mapping is to prepare 1:10,000 scale aerial photographs, 1:5,000 scale topographic maps and orthophotos and its digital data covering the whole Metropolitan Manila to be used for base map of GIS database construction for the Study.
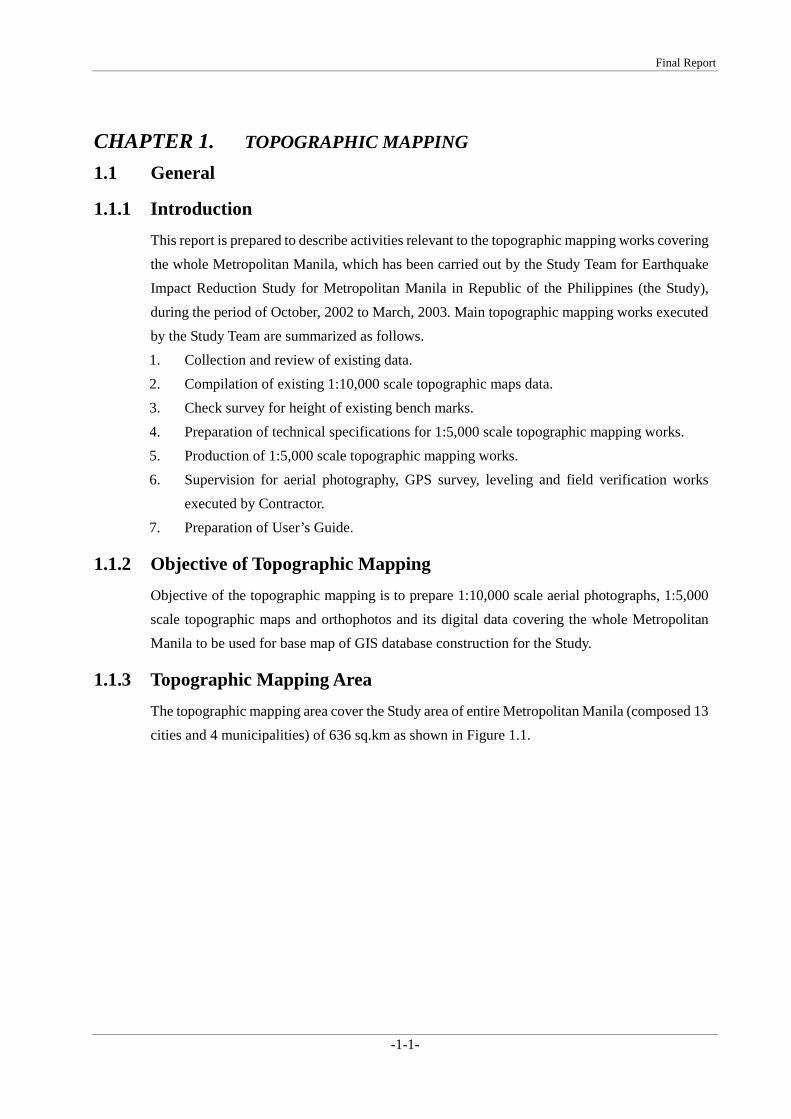
1.1.3 Topographic Mapping Area The topographic mapping area cover the Study area of entire Metropolitan Manila (composed 13 cities and 4 municipalities) of 636 sq.km as shown in Figure 1.1.
Earthquake Impact Reduction Study for Metropolitan Manila in the Republic of the Philippines
-1-2-
Figure 1.1 Mapping Area
Final Report
-1-3-
1.2 Collection and Review of Existing Data Prior to the commencement of the topographic mapping works, existing aerial photographs, topographic maps, digital map data and relevant mapping data were collected and reviewed. The following aerial photographs, topographic maps and digital topographic map data except barangay boundary map data were available at the beginning of the topographic survey and mapping plan of the study.
1) Existing Aerial Photographs
(1) 1:5,000 Scale Aerial Photographs (panchromatic, contact prints)
1:5,000 scale aerial photographs were taken by F. F. Cruz & Co. Inc on March to May 2002 covering the whole Makati city and Taguig. Total number of the aerial photographs is 336. Land use condition and structure location, such as roads, rivers, bridges, buildings/houses and other artificial structures on the aerial photographs were clearly identified.
The aerial photographs were to be able to use for the survey of building and infrastructure inventory of Makati city and Taguig.
(2) 1:8,000 Scale Aerial Photographs (panchromatic, contact prints)
1:8,000 scale aerial photographs were taken by F. F. Cruz & Co. Inc on February and March 2001 covering the whole Quezon city. Total number of the aerial photographs is 290. Land use condition and structure location such as roads, rivers, bridges, buildings/houses and other artificial structures on the aerial photographs were clearly identified.
The aerial photographs were to be able to use for the survey of building and infrastructure inventory of Quezon city.
(3) 1:10,000 Scale Aerial Photographs (panchromatic, contact prints)
1:10,000 scale aerial photographs were taken by Certeza Surveying & Aerophoto System, Inc. on January 2000 covering the along Marikina, Pasing and San Juan River area. Total number of the aerial photographs is 132. Land use condition and structure location such as roads, rivers, bridges, buildings/houses and other artificial structures on the aerial photographs were clearly identified.
The aerial photographs were to be able to use for the survey of building and infrastructure inventory of the along Marikina, Pasing and San Juan River area.
(4) 1:25,000 Scale Aerial Photographs (panchromatic, contact prints)
1:25,000 scale aerial photographs were taken by F. F. Cruz & Co. Inc/ National Mapping and Resources Information Authority (NAMRIA) in 1997 covering the whole Las Pinas and Muntinlupa, and the south part of Paranaque. Total number of the aerial photographs is 32. Land use condition and structure location such as roads, rivers, bridges, buildings/houses and other
Earthquake Impact Reduction Study for Metropolitan Manila in the Republic of the Philippines
-1-4-
artificial structures on the aerial photographs were clearly identified. However, the aerial photographs do not show present ground condition of the whole Las Pinas and Muntinlupa, and the south part of Paranaque due to residential development in recent years.
The aerial photographs could be used for the study of major land marks such as tool way, main highway, railway, hospitals, schools, government and municipal offices and other facilities and infrastructures.
2) Existing Topographic Maps
(1) 1:10,000 Scale Topographic Maps (color prints, contour intervals of 4 m)
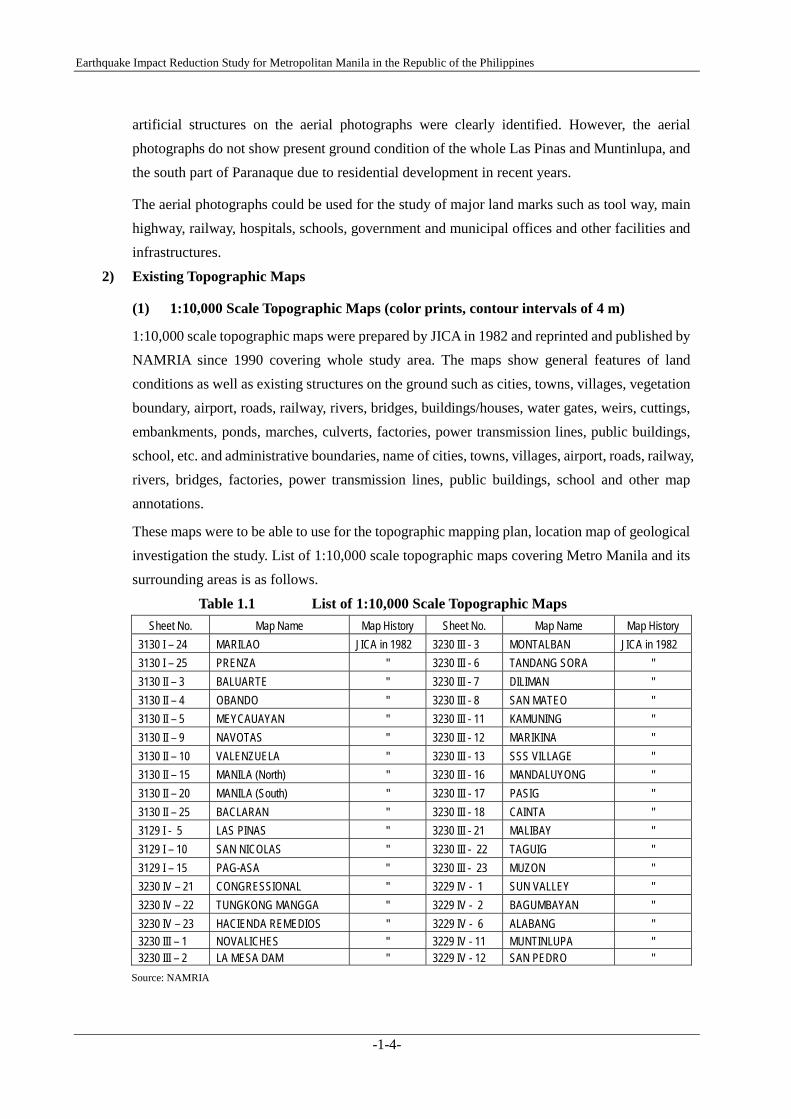
1:10,000 scale topographic maps were prepared by JICA in 1982 and reprinted and published by NAMRIA since 1990 covering whole study area. The maps show general features of land conditions as well as existing structures on the ground such as cities, towns, villages, vegetation boundary, airport, roads, railway, rivers, bridges, buildings/houses, water gates, weirs, cuttings, embankments, ponds, marches, culverts, factories, power transmission lines, public buildings, school, etc. and administrative boundaries, name of cities, towns, villages, airport, roads, railway, rivers, bridges, factories, power transmission lines, public buildings, school and other map annotations.
These maps were to be able to use for the topographic mapping plan, location map of geological investigation the study. List of 1:10,000 scale topographic maps covering Metro Manila and its surrounding areas is as follows.
Table 1.1 List of 1:10,000 Scale Topographic Maps Sheet No. Map Name Map History Sheet No. Map Name Map History
3130 I – 24 MARILAO JICA in 1982 3230 III - 3 MONTALBAN JICA in 1982 3130 I – 25 PRENZA " 3230 III - 6 TANDANG SORA " 3130 II – 3 BALUARTE " 3230 III - 7 DILIMAN " 3130 II – 4 OBANDO " 3230 III - 8 SAN MATEO " 3130 II – 5 MEYCAUAYAN " 3230 III - 11 KAMUNING " 3130 II – 9 NAVOTAS " 3230 III - 12 MARIKINA " 3130 II – 10 VALENZUELA " 3230 III - 13 SSS VILLAGE " 3130 II – 15 MANILA (North) " 3230 III - 16 MANDALUYONG " 3130 II – 20 MANILA (South) " 3230 III - 17 PASIG " 3130 II – 25 BACLARAN " 3230 III - 18 CAINTA " 3129 I - 5 LAS PINAS " 3230 III - 21 MALIBAY " 3129 I – 10 SAN NICOLAS " 3230 III - 22 TAGUIG " 3129 I – 15 PAG-ASA " 3230 III - 23 MUZON " 3230 IV – 21 CONGRESSIONAL " 3229 IV - 1 SUN VALLEY " 3230 IV – 22 TUNGKONG MANGGA " 3229 IV - 2 BAGUMBAYAN " 3230 IV – 23 HACIENDA REMEDIOS " 3229 IV - 6 ALABANG " 3230 III – 1 NOVALICHES " 3229 IV - 11 MUNTINLUPA " 3230 III – 2 LA MESA DAM " 3229 IV - 12 SAN PEDRO "
Source: NAMRIA
Final Report
-1-5-
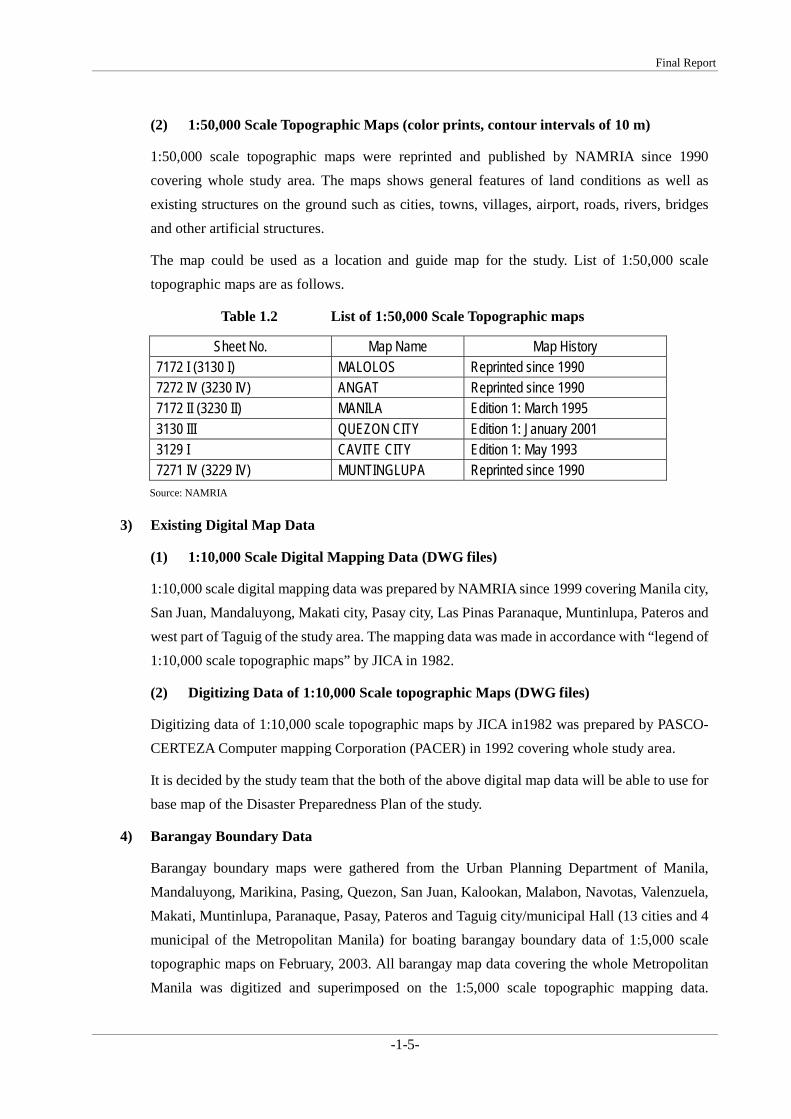
(2) 1:50,000 Scale Topographic Maps (color prints, contour intervals of 10 m)
1:50,000 scale topographic maps were reprinted and published by NAMRIA since 1990 covering whole study area. The maps shows general features of land conditions as well as existing structures on the ground such as cities, towns, villages, airport, roads, rivers, bridges and other artificial structures.
The map could be used as a location and guide map for the study. List of 1:50,000 scale topographic maps are as follows.
Table 1.2 List of 1:50,000 Scale Topographic maps
Sheet No. Map Name Map History 7172 I (3130 I) MALOLOS Reprinted since 1990 7272 IV (3230 IV) ANGAT Reprinted since 1990 7172 II (3230 II) MANILA Edition 1: March 1995 3130 III QUEZON CITY Edition 1: January 2001 3129 I CAVITE CITY Edition 1: May 1993 7271 IV (3229 IV) MUNTINGLUPA Reprinted since 1990
Source: NAMRIA
3) Existing Digital Map Data
(1) 1:10,000 Scale Digital Mapping Data (DWG files)
1:10,000 scale digital mapping data was prepared by NAMRIA since 1999 covering Manila city, San Juan, Mandaluyong, Makati city, Pasay city, Las Pinas Paranaque, Muntinlupa, Pateros and west part of Taguig of the study area. The mapping data was made in accordance with “legend of 1:10,000 scale topographic maps” by JICA in 1982.
(2) Digitizing Data of 1:10,000 Scale topographic Maps (DWG files)
Digitizing data of 1:10,000 scale topographic maps by JICA in1982 was prepared by PASCO- CERTEZA Computer mapping Corporation (PACER) in 1992 covering whole study area.
It is decided by the study team that the both of the above digital map data will be able to use for base map of the Disaster Preparedness Plan of the study.
4) Barangay Boundary Data
Barangay boundary maps were gathered from the Urban Planning Department of Manila, Mandaluyong, Marikina, Pasing, Quezon, San Juan, Kalookan, Malabon, Navotas, Valenzuela, Makati, Muntinlupa, Paranaque, Pasay, Pateros and Taguig city/municipal Hall (13 cities and 4 municipal of the Metropolitan Manila) for boating barangay boundary data of 1:5,000 scale topographic maps on February, 2003. All barangay map data covering the whole Metropolitan Manila was digitized and superimposed on the 1:5,000 scale topographic mapping data.
Earthquake Impact Reduction Study for Metropolitan Manila in the Republic of the Philippines
-1-6-
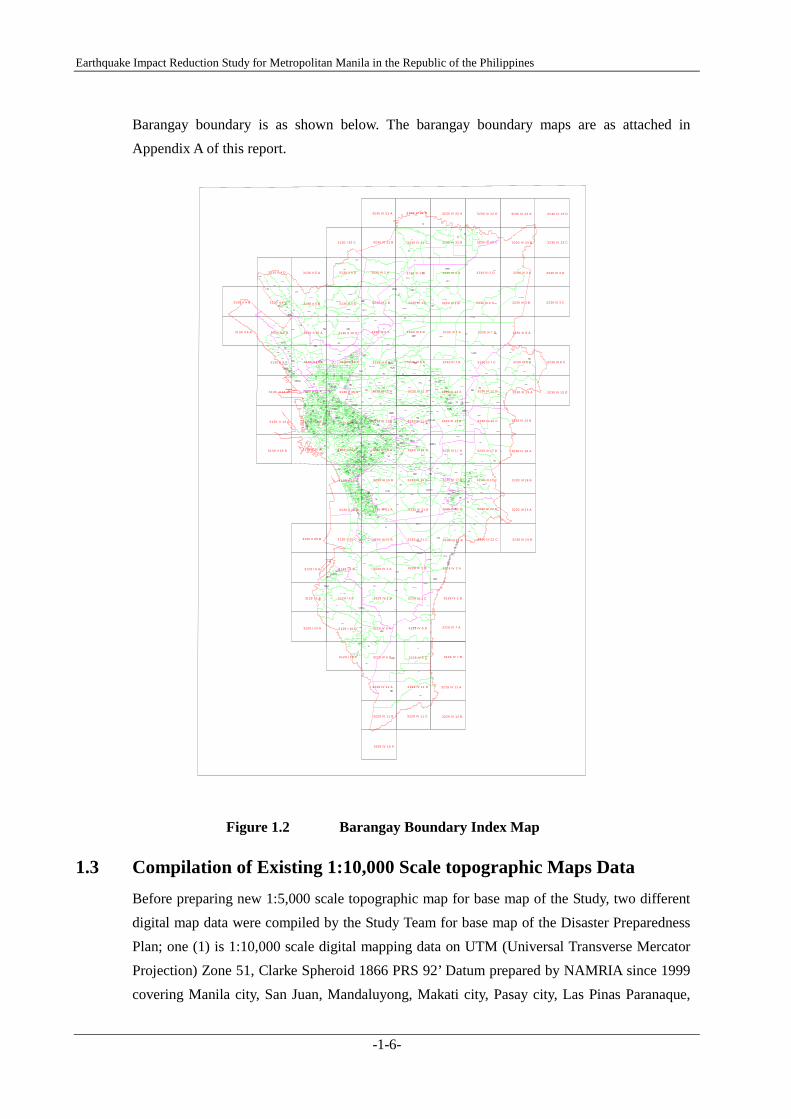
Barangay boundary is as shown below. The barangay boundary maps are as attached in Appendix A of this report.
323 0 II I 1 A 3 230 III 1 D
3 230 III 1 C32 30 II I 1 B
3 23 0 II I 2 D
3 230 III 2 C323 0 II I 2 B
3230 III 2 A 323 0 II I 3 A
323 0 III 3 B
3 2 30 I II 3 D
3 2 30 I II 3 C
3 230 III 6 A
3 230 III 6 B 3 2 30 II I 6 C
3 23 0 III 6 D 32 30 I II 7 A
323 0 II I 7 B 3 2 30 I II 7 C
3 230 III 7 D 32 30 III 8 A
323 0 II I 8 B 3 2 30 II I 8 C
32 30 II I 11 A
32 30 III 1 1 B
3 2 30 I II 11 D 323 0 III 12 A
323 0 III 12 B 3 2 30 I II 12 C
3 23 0 III 12 D 32 30 III 1 3 A
323 0 II I 13 B
3 2 30 III 13 D
32 30 II I 16 A
32 30 III 16 B 3 23 0 III 16 C
3 23 0 II I 16 D 3 230 III 1 7 A
3230 III 17 B 3 2 30 I II 17 C
3 230 III 17 D 32 30 I II 18 A
3 230 III 1 8 B
3 230 III 2 1 A
323 0 III 21 B 3 23 0 III 21 C
3 230 III 21 D 3 230 III 2 2 A
32 30 I II 22 B
3 230 III 22 D
3 2 30 I II 22 C
3 230 III 2 3 A
32 30 I II 23 B
32 29 IV 1 A
3229 IV 1 B 3 2 29 IV 1 C
3 2 29 IV 1 D 322 9 IV 2 A
32 29 IV 2 B
322 9 IV 6 A
322 9 IV 6 B 3 2 29 IV 6 C
3 22 9 IV 6 D 3 229 IV 7 A
32 29 IV 7 B
32 29 IV 11 A
32 29 IV 11 B 3 2 29 IV 11 C
3 22 9 IV 11 D
3229 IV 16 A
32 29 IV 12 A
32 29 IV 12 B
32 30 IV 2 1 A
32 30 IV 21 B 3 230 IV 21 C
3 23 0 IV 21 D 32 30 IV 22 A
32 30 IV 22 B 3 230 IV 22 C
3 230 IV 22 D 3230 IV 23 A
3 230 IV 23 B 3 2 30 IV 23 C
3 2 30 IV 23 D
3 130 I 25 C
3 13 0 II 4 D
3 130 II 4 C3 130 II 4 B
3 130 II 5 A
313 0 II 5 B 3 1 30 I I 5 C
3 1 30 I I 5 D
31 30 II 9 A
3 1 30 I I 9 C
3 13 0 II 9 D 31 30 II 10 A
3 130 II 1 0 B 3 1 30 I I 10 C
3 1 30 II 10 D
3 130 II 15 A 3 130 II 15 D
3 1 30 II 15 C31 30 I I 15 B
3 130 II 1 4 D
3 1 30 I I 14 C
3 1 30 I I 19 D 313 0 II 20 A 3 130 II 20 D
3 13 0 II 2 0 C
3 1 30 I I 25 D
3 130 II 25 C3130 II 2 5 B
312 9 I 5 A 3 129 I 5 D
3 12 9 I 5 C3129 I 5 B
312 9 I 1 0 A 3 129 I 10 D
3 12 9 I 10 C
3 23 0 III 11 C
Figure 1.2 Barangay Boundary Index Map
1.3 Compilation of Existing 1:10,000 Scale topographic Maps Data Before preparing new 1:5,000 scale topographic map for base map of the Study, two different digital map data were compiled by the Study Team for base map of the Disaster Preparedness Plan; one (1) is 1:10,000 scale digital mapping data on UTM (Universal Transverse Mercator Projection) Zone 51, Clarke Spheroid 1866 PRS 92’ Datum prepared by NAMRIA since 1999 covering Manila city, San Juan, Mandaluyong, Makati city, Pasay city, Las Pinas Paranaque,
Final Report
-1-7-
Muntinlupa, Pateros and west part of Taguig and other is digitizing data of 1:10,000 scale topographic maps on UTM( Universal Transverse Mercator Projection) Zone 51, Clarke Spheroid 1866 Luzon Datum prepared by PACER in 1992 covering whole study area.
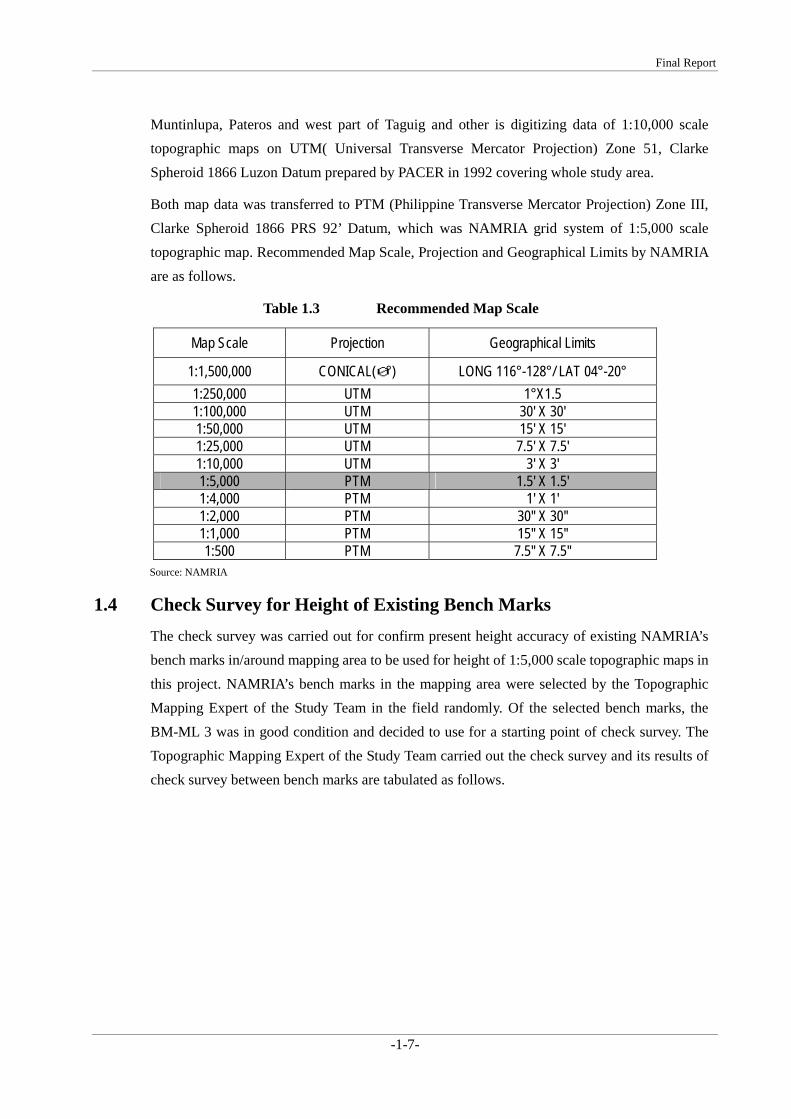
Both map data was transferred to PTM (Philippine Transverse Mercator Projection) Zone III, Clarke Spheroid 1866 PRS 92’ Datum, which was NAMRIA grid system of 1:5,000 scale topographic map. Recommended Map Scale, Projection and Geographical Limits by NAMRIA are as follows.
Table 1.3 Recommended Map Scale
Map Scale Projection Geographical Limits
1:1,500,000 CONICAL(0°) LONG 116°-128°/ LAT 04°-20° 1:250,000 UTM 1°X1.5 1:100,000 UTM 30' X 30' 1:50,000 UTM 15' X 15' 1:25,000 UTM 7.5' X 7.5' 1:10,000 UTM 3' X 3' 1:5,000 PTM 1.5' X 1.5' 1:4,000 PTM 1' X 1' 1:2,000 PTM 30'' X 30'' 1:1,000 PTM 15'' X 15'' 1:500 PTM 7.5'' X 7.5''
Source: NAMRIA
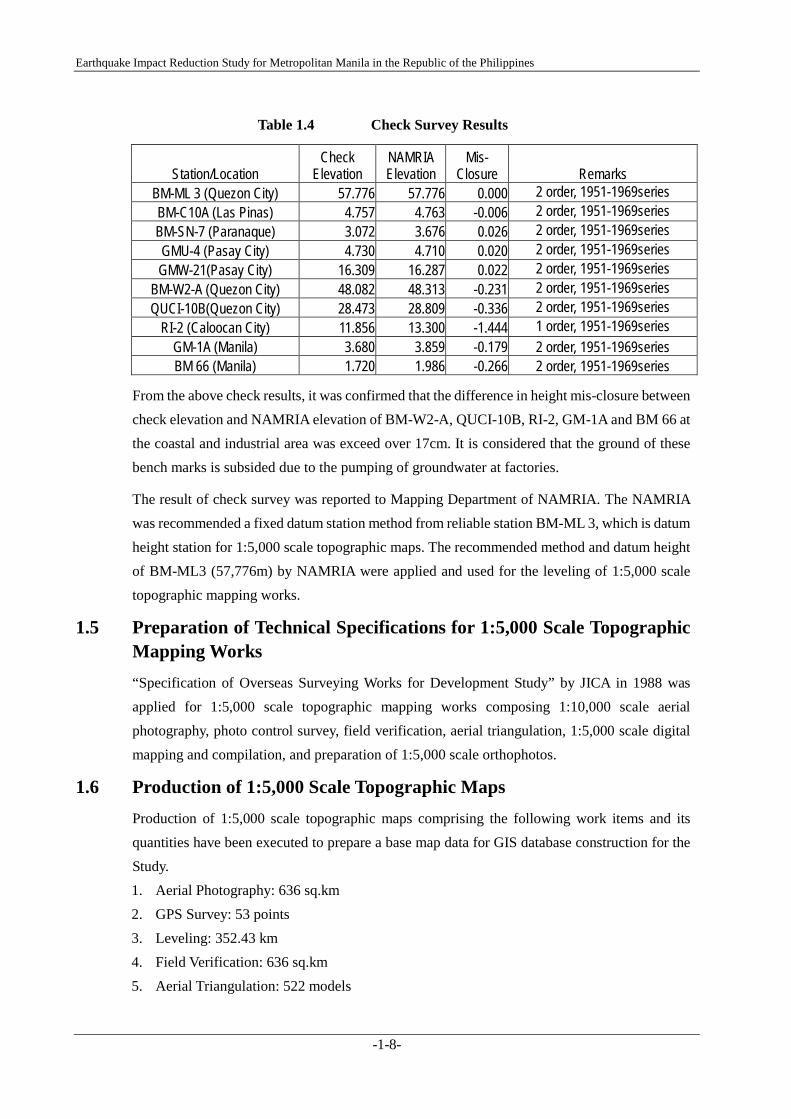
1.4 Check Survey for Height of Existing Bench Marks The check survey was carried out for confirm present height accuracy of existing NAMRIA’s bench marks in/around mapping area to be used for height of 1:5,000 scale topographic maps in this project. NAMRIA’s bench marks in the mapping area were selected by the Topographic Mapping Expert of the Study Team in the field randomly. Of the selected bench marks, the BM-ML 3 was in good condition and decided to use for a starting point of check survey. The Topographic Mapping Expert of the Study Team carried out the check survey and its results of check survey between bench marks are tabulated as follows.
Earthquake Impact Reduction Study for Metropolitan Manila in the Republic of the Philippines
-1-8-
Table 1.4 Check Survey Results
Station/Location Check
Elevation NAMRIA Elevation
Mis- Closure Remarks
BM-ML 3 (Quezon City) 57.776 57.776 0.000 2 order, 1951-1969series BM-C10A (Las Pinas) 4.757 4.763 -0.006 2 order, 1951-1969series BM-SN-7 (Paranaque) 3.072 3.676 0.026 2 order, 1951-1969series GMU-4 (Pasay City) 4.730 4.710 0.020 2 order, 1951-1969series GMW-21(Pasay City) 16.309 16.287 0.022 2 order, 1951-1969series
BM-W2-A (Quezon City) 48.082 48.313 -0.231 2 order, 1951-1969series QUCI-10B(Quezon City) 28.473 28.809 -0.336 2 order, 1951-1969series
RI-2 (Caloocan City) 11.856 13.300 -1.444 1 order, 1951-1969series GM-1A (Manila) 3.680 3.859 -0.179 2 order, 1951-1969series BM 66 (Manila) 1.720 1.986 -0.266 2 order, 1951-1969series
From the above check results, it was confirmed that the difference in height mis-closure between check elevation and NAMRIA elevation of BM-W2-A, QUCI-10B, RI-2, GM-1A and BM 66 at the coastal and industrial area was exceed over 17cm. It is considered that the ground of these bench marks is subsided due to the pumping of groundwater at factories.
The result of check survey was reported to Mapping Department of NAMRIA. The NAMRIA was recommended a fixed datum station method from reliable station BM-ML 3, which is datum height station for 1:5,000 scale topographic maps. The recommended method and datum height of BM-ML3 (57,776m) by NAMRIA were applied and used for the leveling of 1:5,000 scale topographic mapping works.
1.5 Preparation of Technical Specifications for 1:5,000 Scale Topographic Mapping Works “Specification of Overseas Surveying Works for Development Study” by JICA in 1988 was applied for 1:5,000 scale topographic mapping works composing 1:10,000 scale aerial photography, photo control survey, field verification, aerial triangulation, 1:5,000 scale digital mapping and compilation, and preparation of 1:5,000 scale orthophotos.
1.6 Production of 1:5,000 Scale Topographic Maps
Production of 1:5,000 scale topographic maps comprising the following work items and its quantities have been executed to prepare a base map data for GIS database construction for the Study. 1. Aerial Photography: 636 sq.km 2. GPS Survey: 53 points 3. Leveling: 352.43 km 4. Field Verification: 636 sq.km 5. Aerial Triangulation: 522 models
Final Report
-1-9-
6. 1:5,000 Scale Digital Mapping and Compilation: 636 sq.km 7. Preparation of 1:5,000 Scale Digital Orthophotos: 636 sq.km
Of the above works, aerial photography, GPS survey, leveling and field verification were carried out by the Contractor; Certeza Surveying & Aerophoto System, Inc. in accordance with the terms, conditions, requirements of the Contract and Technical Specifications for aerial photography and photo control survey under the supervision of the Topographic Mapping Expert of the Study Team during the period of October, 2002 to January, 2003. The aerial triangulation, 1:5,000 scale digital mapping and compilation, and preparation of 1:5,000 scale digital orthophotos were executed by the Study Team in Japan during the period of December, 2002 to March, 2003.
1.6.1 Aerial Photography 1:10,000 scale aerial photographs covering the whole Metropolitan Manila for 1:5,000 scale topographic mapping were taken and produced by the Contractor during the period from end of October, 2002 to end of January, 2003. Principal data and information of the new aerial photography are as follows.
(1) Equipment Used in Aerial Photography (a) Aircraft : Cessna, Aero commander 500U, RP-C621 (b) Aerial Camera : Wild, RC-10, No.2613 (Lens No. UAg I 6055) (c) Firm Processor : Zeiss, FEIZO (d) Contact Printer : Zeiss, KG30 Contact Printers
(2) Data of Aerial Photography
(a) Scale of aerial photographs : Approx.1/10,000 (b) Area covered by aerial photos : Approx.636 sq.km (c) Focal length of aerial camera : F=152 mm (d) Over lapping : Approx.60%±5% (e) Side lapping : Approx.30%±5% (f) Flight altitude : Approx. 1,500 m±5% (g) Flight direction : South – North (h) Aerial film : Kodak Double X (i) Photo print : Kodak RC paper (j) Number of photos : 533 flames (accepted photos)
(3) Annotation of Aerial Photographs (Film Labeling)
The following title and information were labeled on the outside of each flame of the negative film at the beginning and end.
(a) MMEIRS (b) Date of aerial photographs (c) Scale of aerial photographs (d) Photo number (e) JICA/MMDA
Earthquake Impact Reduction Study for Metropolitan Manila in the Republic of the Philippines
-1-10-
(4) Photo Scanning
All accepted aerial photographs at scale of 1:10,000 were scanned by a photogrammetric scanner for aerial triangulation. The scanning data and information are as follows.
(a) Scanner : Zeiss, Intergraph Photo Scan TD (b) No. of photo : 551 flames (c) Pixel size : 25µm (d) Gray scale (level) : 8 bits per pixel (e) Data Format : TIFF file
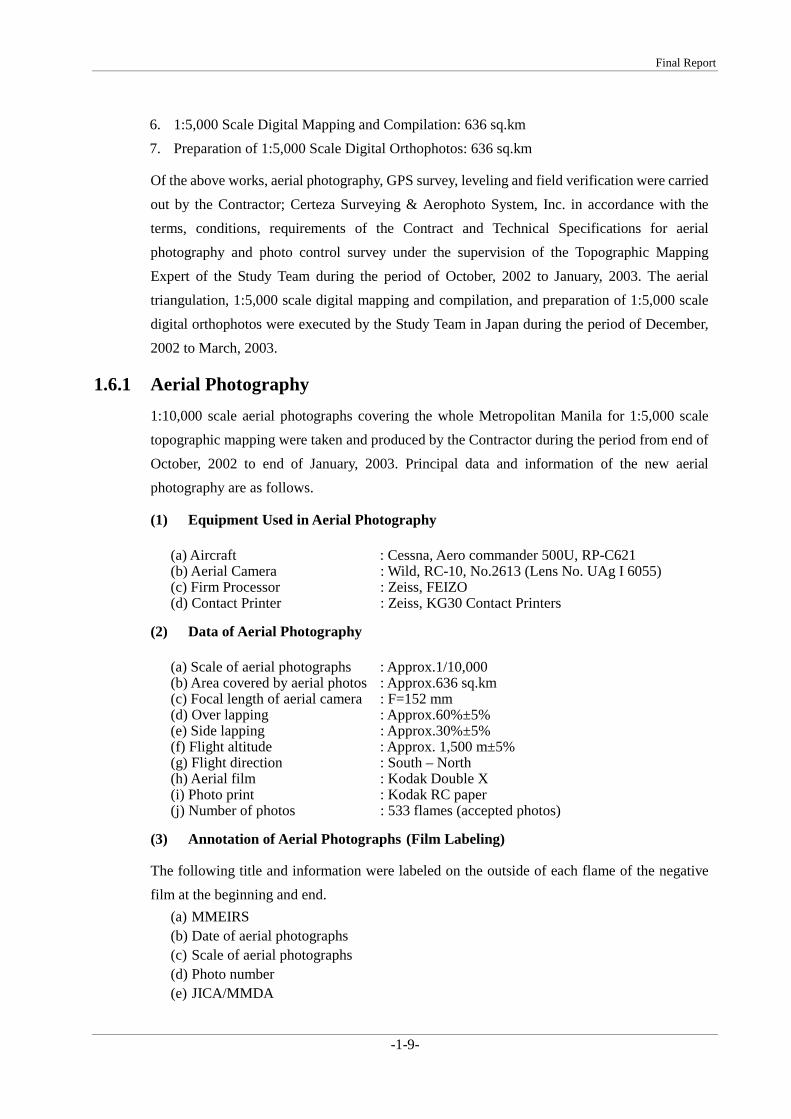
(5) List of New Aerial Photographs
The list of 1:10,000 scale aerial photographs is as blow.
Table 1.5 List of 1:10,000 Scale Aerial Photographs
Original Flight Reflight Acceptable Photos (S=1:1,000)
Flight Line Photo No. No. of Photos Photo No.
No. of Photos Flight Line Photo No. No. of Photos
1 7073-7077 5 1 7073-7077 5 2 7067-7072 6 2 7067-7072 6 3 7046-7066 21 3 7046-7059 14 4 7021-7045 25 4 7024-7045 22
5 6982-7020 39 7009-7020 12 5 6982-7003 7012-7020 31
6 6910-6950 41 6 6910-6950 41 7 6863-6909 47 7 6863-6909 47 8 6754-6807 54 7597-7606 10 8 6754-6807 54 9 6808-6862 55 7587-7596 10 9 6808-6862 55
10 7085-7138 54 7433-7461 7129-7138
29 10 10
7085-7099 7461-7433 7129-7138 54
11 7139-7185 47 7219-7256 7245-7254
38 10 11
7139-7165 7219-7226 7245-7254 52
12 7256-7291 36 7557-7572 16 12 7256-7291 36 13 7292-7323 32 7542-7556 15 13 7292-7323 32 14 7324-7352 29 7513-7541 29 14 7324-7352 29 15 7367-7391 25 15 7367-7391 25 16 7392-7411 20 16 7392-7411 20 17 7412-7421 10 17 7412-7421 10
Total= 600 179 Total= 533
(6) Aerial Photo Index Map
The aerial photo index map as shown in Figure 3 was prepared after completion of the photography.

Final Report
-1-11-
L-1 L-2
L-3 L-4
L-5
L-6
L-7L-8
L-9
L-10
L-11L-12
L-13
L-61
L-14
L-15L-17
L-16
L-1
L-2
L-3
L-4
L-5
L-6
L-5
L-5
L-7
L-8
L-9
L-10
L-11
L-12 L-13
L-14
L-15
L-16
L-17
Figure 1.3 Aerial Photo Index Map (Photo Scale=1:10,000)
Earthquake Impact Reduction Study for Metropolitan Manila in the Republic of the Philippines
-1-12-
(7) Inspection of Aerial Photographs
Qualities of all above aerial photographs of original flight and reflight were inspected by the Topographic Mapping Expert of the Study Team referring to the following accuracy and requirement as specified in the Technical Specifications of the Contract.
(a) Over lapping : within 60%±5% (b) Side lapping : within 30%±5% (c) Flight altitude : within 1,500 m±5% (d) Shifting error value : less than 10degrees (e) Tip & tilt error value : less than 10 degrees (f) Crab error value : less than 5 degrees (g) Cloud cover : less than 3%
It was judged that the inspection results of final 533 photos covering whole were acceptable for preparing the1: 5,000 scale topographic map.
1.6.2 GPS Survey GPS survey was executed to determine the N and E plan coordinates of 53 photo control points (GPS stations) to be used for aerial triangulation of the 1:5,000 scale topographic mapping. GPS network was planned to enclose the mapping area. The survey was carried out by the Contractor and completed on December, 2002. GPS survey data and information is summarized as follows.
(1) Datum Coordinates
Geographic WGS-84, Geographic PRS’92 and Philippine Transverse Mercator (PTM) grid coordinates of NAMRIA’s BLN 1, CVT 1, MMA 0 and MMA 1 GPS stations in/around mapping area were used for GPS survey. Certification of the used NAMRIA Stations is as attached in Appendix B of this report.
(2) Equipment Used for GPS Survey (a) GPS Receiver : Trimble, 4000SSE (6 sets) (b) Software : Trimble, GP Survey
(3) Transformation Parameters
Used transformation parameters from WGS-84 coordinates of GPS to PTM coordinates of Zone III (121) on the PRS’92 Datum is as follows.
- Transformation parameters: Latitude of Origin = 0 N Central Meridian = 121 E False Northing = 0.0 meter False Easting = 500,000 meters False Height = 0.0 meter Scale Factor = 0.99995 Spheroid =Clark Spheroid of 1866
Final Report
-1-13-
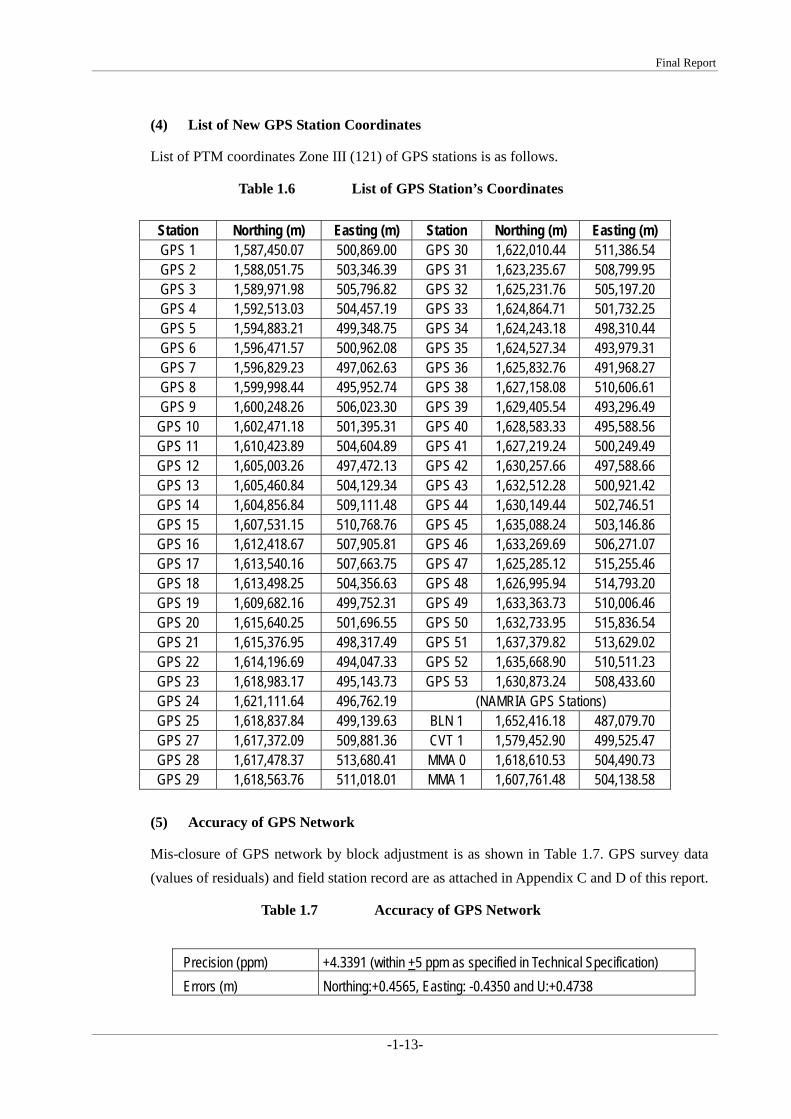
(4) List of New GPS Station Coordinates
List of PTM coordinates Zone III (121) of GPS stations is as follows.
Table 1.6 List of GPS Station’s Coordinates
(5) Accuracy of GPS Network
Mis-closure of GPS network by block adjustment is as shown in Table 1.7. GPS survey data (values of residuals) and field station record are as attached in Appendix C and D of this report.
Table 1.7 Accuracy of GPS Network
Precision (ppm) +4.3391 (within +5 ppm as specified in Technical Specification) Errors (m) Northing:+0.4565, Easting: -0.4350 and U:+0.4738
Station Northing (m) Easting (m) Station Northing (m) Easting (m) GPS 1 1,587,450.07 500,869.00 GPS 30 1,622,010.44 511,386.54 GPS 2 1,588,051.75 503,346.39 GPS 31 1,623,235.67 508,799.95 GPS 3 1,589,971.98 505,796.82 GPS 32 1,625,231.76 505,197.20 GPS 4 1,592,513.03 504,457.19 GPS 33 1,624,864.71 501,732.25 GPS 5 1,594,883.21 499,348.75 GPS 34 1,624,243.18 498,310.44 GPS 6 1,596,471.57 500,962.08 GPS 35 1,624,527.34 493,979.31 GPS 7 1,596,829.23 497,062.63 GPS 36 1,625,832.76 491,968.27 GPS 8 1,599,998.44 495,952.74 GPS 38 1,627,158.08 510,606.61 GPS 9 1,600,248.26 506,023.30 GPS 39 1,629,405.54 493,296.49
GPS 10 1,602,471.18 501,395.31 GPS 40 1,628,583.33 495,588.56 GPS 11 1,610,423.89 504,604.89 GPS 41 1,627,219.24 500,249.49 GPS 12 1,605,003.26 497,472.13 GPS 42 1,630,257.66 497,588.66 GPS 13 1,605,460.84 504,129.34 GPS 43 1,632,512.28 500,921.42 GPS 14 1,604,856.84 509,111.48 GPS 44 1,630,149.44 502,746.51 GPS 15 1,607,531.15 510,768.76 GPS 45 1,635,088.24 503,146.86 GPS 16 1,612,418.67 507,905.81 GPS 46 1,633,269.69 506,271.07 GPS 17 1,613,540.16 507,663.75 GPS 47 1,625,285.12 515,255.46 GPS 18 1,613,498.25 504,356.63 GPS 48 1,626,995.94 514,793.20 GPS 19 1,609,682.16 499,752.31 GPS 49 1,633,363.73 510,006.46 GPS 20 1,615,640.25 501,696.55 GPS 50 1,632,733.95 515,836.54 GPS 21 1,615,376.95 498,317.49 GPS 51 1,637,379.82 513,629.02 GPS 22 1,614,196.69 494,047.33 GPS 52 1,635,668.90 510,511.23 GPS 23 1,618,983.17 495,143.73 GPS 53 1,630,873.24 508,433.60 GPS 24 1,621,111.64 496,762.19 (NAMRIA GPS Stations) GPS 25 1,618,837.84 499,139.63 BLN 1 1,652,416.18 487,079.70 GPS 27 1,617,372.09 509,881.36 CVT 1 1,579,452.90 499,525.47 GPS 28 1,617,478.37 513,680.41 MMA 0 1,618,610.53 504,490.73 GPS 29 1,618,563.76 511,018.01 MMA 1 1,607,761.48 504,138.58

Earthquake Impact Reduction Study for Metropolitan Manila in the Republic of the Philippines
-1-14-
Computation of GPS survey and its data were inspected by the Topographic Mapping Expert of the Study Team. Of the results of inspection, above the precision of the GPS network was not exceed tolerance of mis-closure +5ppm as specified in the Technical Specifications of the Contract. Accordingly it was judged that the coordinates of GPS stations have the enough accuracy for horizontal control of the1: 5,000 scale topographic mapping.
(6) Diagram of GPS Network
Diagram of GPS Network is as shown below.
Figure 1.4 Diagram of GPS Network

Final Report
-1-15-
1.6.3 Leveling Leveling was executed to obtain the height of GPS stations to be used for aerial triangulation of the 1:5,000 scale topographic mapping. Total distance of leveling network was 352.43 km. The survey was carried out by the Contractor and completed on December, 2002. Leveling data and information are summarized as follows.
(1) Datum Height
Mean Sea Level (MSL) elevation (57,776m) of NAMRIA’s BM-ML3 as explained in Section 4 of this report was used for datum height of the leveling. MSL of the NAMRIA’s GMW-21, GMW-1, GMU-4, BM-C10A and BM-SN-7 were also used for spot height points of aerial triangulation. Certification of the used NAMRIA Stations (Bench Marks) is as attached in Appendix B of this report.
(2) Equipment Used for Leveling (a) Level : Lica, NA 2000 Digital level (3sets) (b) Software : Yutokogyo, Leveling Network Adjustment (Reg.No.5.C-36 in Japan)
(3) List of GPS Station Height
List of height of GPS stations is as follows.
Table 1.8 List of GPS Station’s Height
Station Elevation (m) Station Elevation
(m) Station Elevation (m) Station Elevation
(m) GPS1 81.906 GPS14 2.436 GPS28 26.309 GPS42 4.592 GPS2 61.579 GPS15 2.751 GPS29 10.134 GPS43 36.573 GPS3 3.769 GPS16 5.299 GPS30 14.495 GPS44 59.537 GPS4 22.457 GPS17 11.833 GPS31 74.053 GPS45 39.516 GPS5 27.168 GPS18 20.319 GPS32 59.275 GPS46 73.762 GPS6 26.063 GPS19 3.109 GPS33 14.119 GPS47 47.297 GPS7 7.867 GPS20 4.41 GPS34 25.994 GPS48 21.077 GPS8 2.802 GPS21 2.092 GPS35 2.311 GPS50 48.59 GPS9 4.067 GPS22 2.533 GPS36 1.028 GPS51 233.993
GPS10 10.25 GPS23 2.26 GPS38 62.031 GPS52 126.896 GPS11 12.319 GPS24 6.459 GPS39 0.481 GPS53 101.433 GPS12 3.809 GPS25 13.01 GPS40 1.611 GPS13 16.97 GPS27 6.809 GPS41 24.359
(4) Accuracy of Leveling Network
Height mis-closure of each leveling loops in network is as show in Table 1.8 and Figure 1.5. Leveling data (leveling network computation and adjustment) is as attached in Appendix E of this report.
Earthquake Impact Reduction Study for Metropolitan Manila in the Republic of the Philippines
-1-16-
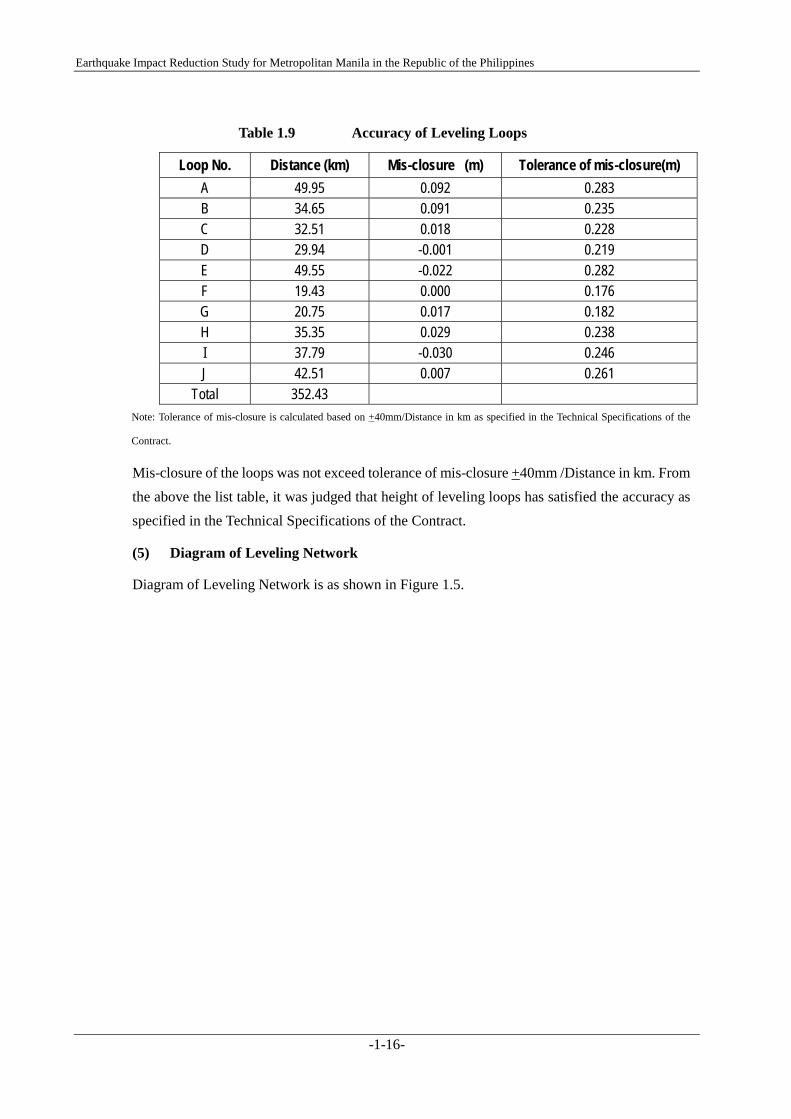
Table 1.9 Accuracy of Leveling Loops
Loop No. Distance (km) Mis-closure (m) Tolerance of mis-closure(m) A 49.95 0.092 0.283 B 34.65 0.091 0.235 C 32.51 0.018 0.228 D 29.94 -0.001 0.219 E 49.55 -0.022 0.282 F 19.43 0.000 0.176 G 20.75 0.017 0.182 H 35.35 0.029 0.238 I 37.79 -0.030 0.246 J 42.51 0.007 0.261
Total 352.43 Note: Tolerance of mis-closure is calculated based on +40mm/Distance in km as specified in the Technical Specifications of the
Contract.
Mis-closure of the loops was not exceed tolerance of mis-closure +40mm /Distance in km. From the above the list table, it was judged that height of leveling loops has satisfied the accuracy as specified in the Technical Specifications of the Contract.
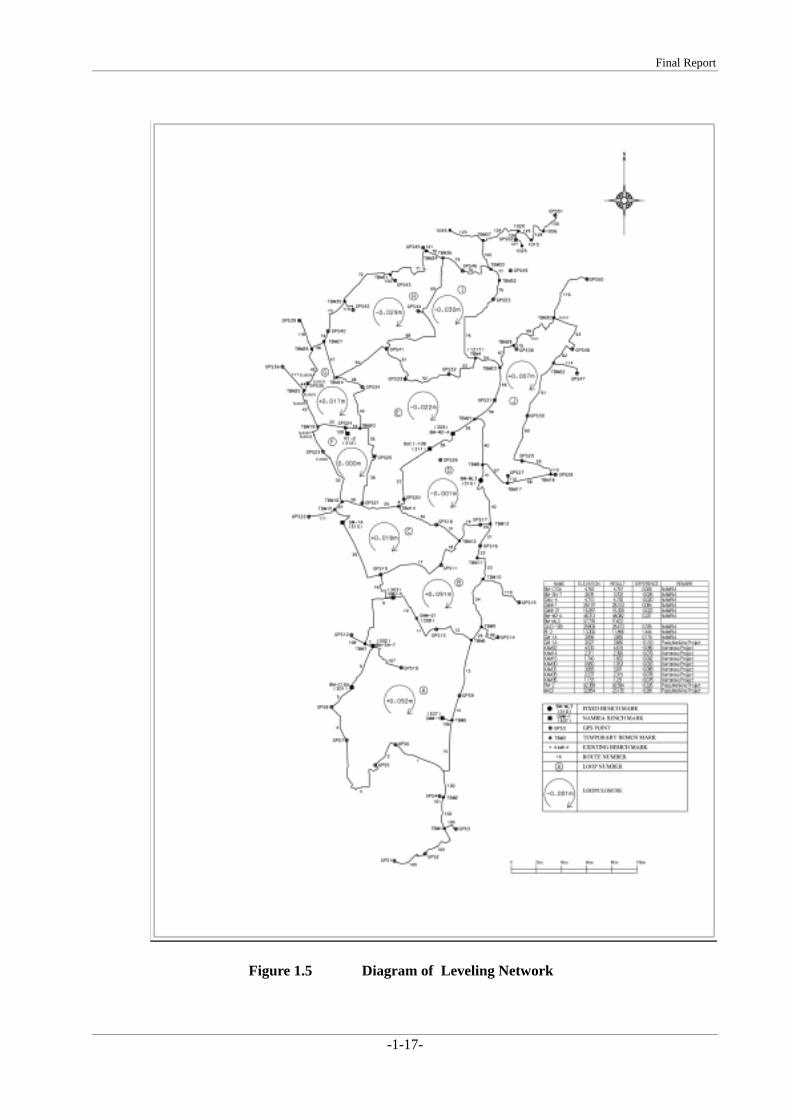
(5) Diagram of Leveling Network
Diagram of Leveling Network is as shown in Figure 1.5.
Final Report
-1-17-
Figure 1.5 Diagram of Leveling Network
Earthquake Impact Reduction Study for Metropolitan Manila in the Republic of the Philippines
-1-18-
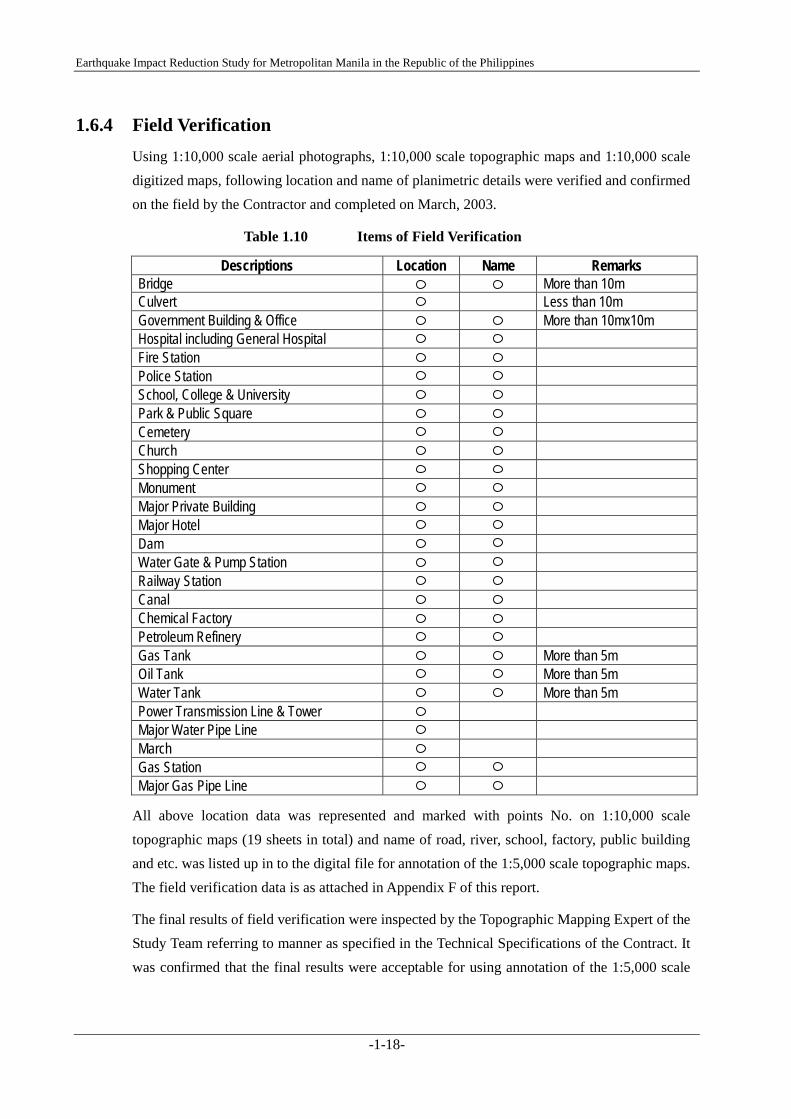
1.6.4 Field Verification Using 1:10,000 scale aerial photographs, 1:10,000 scale topographic maps and 1:10,000 scale digitized maps, following location and name of planimetric details were verified and confirmed on the field by the Contractor and completed on March, 2003.
Table 1.10 Items of Field Verification
Descriptions Location Name Remarks Bridge More than 10m Culvert Less than 10m Government Building & Office More than 10mx10m Hospital including General Hospital Fire Station Police Station School, College & University Park & Public Square Cemetery Church Shopping Center Monument Major Private Building Major Hotel Dam Water Gate & Pump Station Railway Station Canal Chemical Factory Petroleum Refinery Gas Tank More than 5m Oil Tank More than 5m Water Tank More than 5m Power Transmission Line & Tower Major Water Pipe Line March Gas Station Major Gas Pipe Line
All above location data was represented and marked with points No. on 1:10,000 scale topographic maps (19 sheets in total) and name of road, river, school, factory, public building and etc. was listed up in to the digital file for annotation of the 1:5,000 scale topographic maps. The field verification data is as attached in Appendix F of this report.
The final results of field verification were inspected by the Topographic Mapping Expert of the Study Team referring to manner as specified in the Technical Specifications of the Contract. It was confirmed that the final results were acceptable for using annotation of the 1:5,000 scale

Final Report
-1-19-
topographic maps. The annotations of 1:5,000 scale topographic maps were also checked by NAMRIA.
1.6.5 Aerial Triangulation
Aerial triangulation for 1:5,000 scale digital mapping was done analytically by the block adjustment method by means of independent models in accordance with the following manner and accuracy. The aerial triangulation works were completed on February 2003
(1) Selection, Observation, Measurement and Data Processing
The large-scale aerial triangulation block covering the mapping area was divided in to 2 separate blocks (North and South) for increasing efficiency of 1:5,000 scale digital mapping works.
Using scanning image of 1:10,000 scale photographs and results of GPS survey and leveling, locations of pass points were selected on the photo images by a manual. The pass points, established control points, leveled spot height points and fiducial marks on each photo image were stereoscopically observed and measured with a stereo image plotter. The photo coordinates obtained by a stereo image plotter measurement were processed by a digital data processing system for analytical aerial triangulation.
Total numbers of photo models and control points used for the computation of aerial triangulation on North and South blocks were as follows.
(a) Photo models (S=1/10,000) : 522 models (b) Horizontal control points : 53 points (c) Vertical control points : 975 points
(2) Equipment and Programme Used for Aerial Triangulations (a) Image plotter : DPW (Socket Set) (b) Computer : DELL, DIMENSION XPST850R (c) Programme : PAT-B
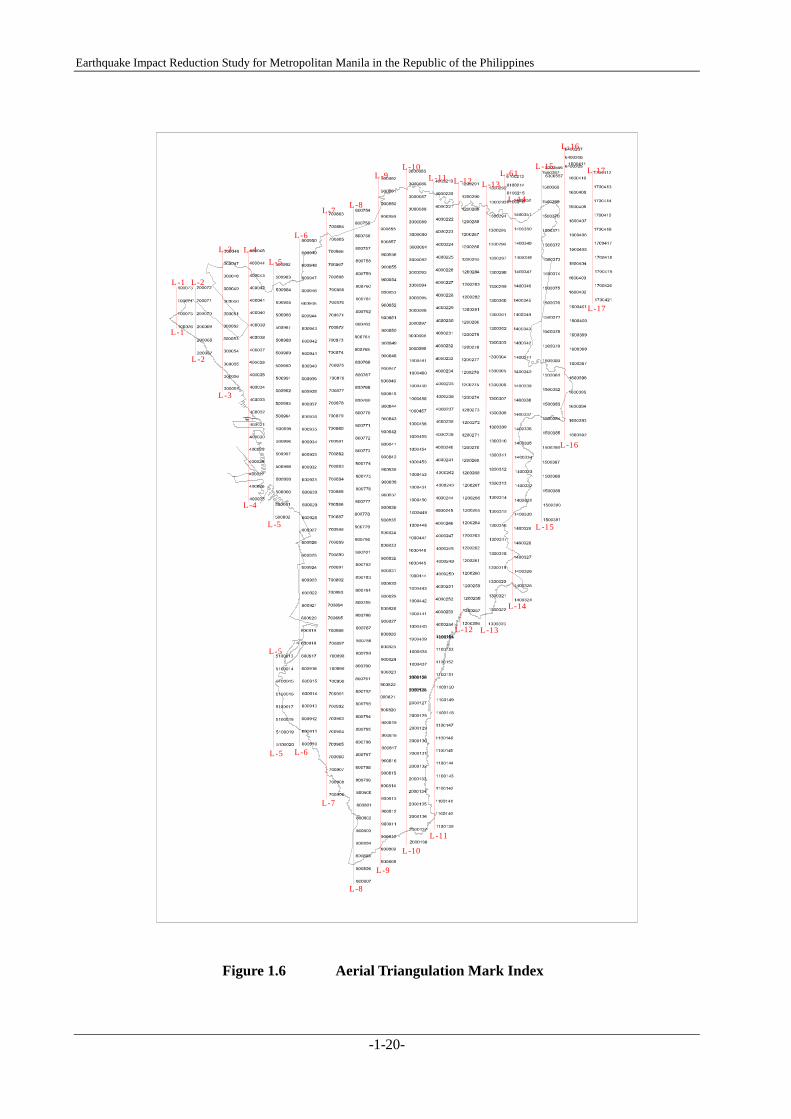
(3) Diagram of Aerial Triangulation Mark Index Aerial Triangulation Mark Index is as show in Figure 1.6.
Earthquake Impact Reduction Study for Metropolitan Manila in the Republic of the Philippines
-1-20-
L-1 L-2
L-3 L-4L-5
L-6
L-7L-8
L-9L-10
L-11 L-12 L-13L-61
L-14
L-15 L-17
L-16
L-1
L-2
L-3
L-4
L-5
L-6
L-5
L-5
L-7
L-8
L-9
L-10
L-11
L-12 L-13
L-14
L-15
L-16
L-17
Figure 1.6 Aerial Triangulation Mark Index
Final Report
-1-21-
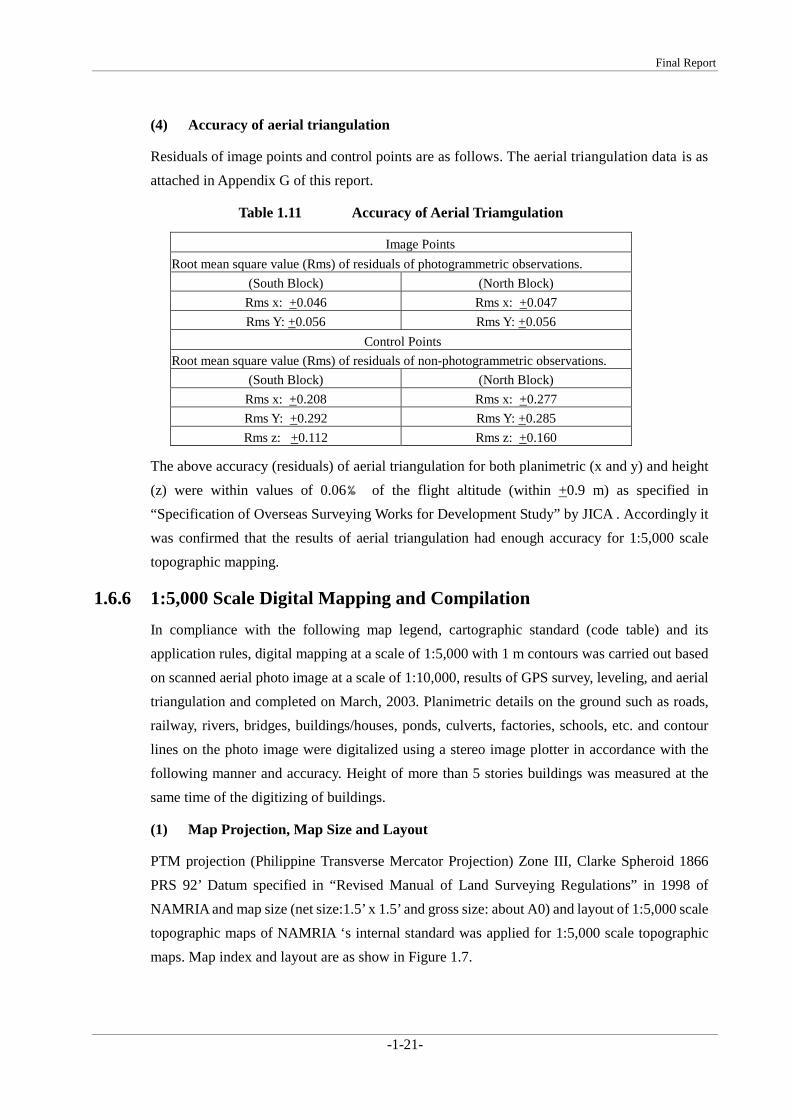
(4) Accuracy of aerial triangulation
Residuals of image points and control points are as follows. The aerial triangulation data is as attached in Appendix G of this report.
Table 1.11 Accuracy of Aerial Triamgulation
Image Points Root mean square value (Rms) of residuals of photogrammetric observations.
(South Block) (North Block) Rms x: +0.046 Rms x: +0.047 Rms Y: +0.056 Rms Y: +0.056
Control Points Root mean square value (Rms) of residuals of non-photogrammetric observations.
(South Block) (North Block) Rms x: +0.208 Rms x: +0.277 Rms Y: +0.292 Rms Y: +0.285 Rms z: +0.112 Rms z: +0.160
The above accuracy (residuals) of aerial triangulation for both planimetric (x and y) and height
(z) were within values of 0.06‰ of the flight altitude (within +0.9 m) as specified in “Specification of Overseas Surveying Works for Development Study” by JICA . Accordingly it was confirmed that the results of aerial triangulation had enough accuracy for 1:5,000 scale topographic mapping.
1.6.6 1:5,000 Scale Digital Mapping and Compilation In compliance with the following map legend, cartographic standard (code table) and its application rules, digital mapping at a scale of 1:5,000 with 1 m contours was carried out based on scanned aerial photo image at a scale of 1:10,000, results of GPS survey, leveling, and aerial triangulation and completed on March, 2003. Planimetric details on the ground such as roads, railway, rivers, bridges, buildings/houses, ponds, culverts, factories, schools, etc. and contour lines on the photo image were digitalized using a stereo image plotter in accordance with the following manner and accuracy. Height of more than 5 stories buildings was measured at the same time of the digitizing of buildings.
(1) Map Projection, Map Size and Layout
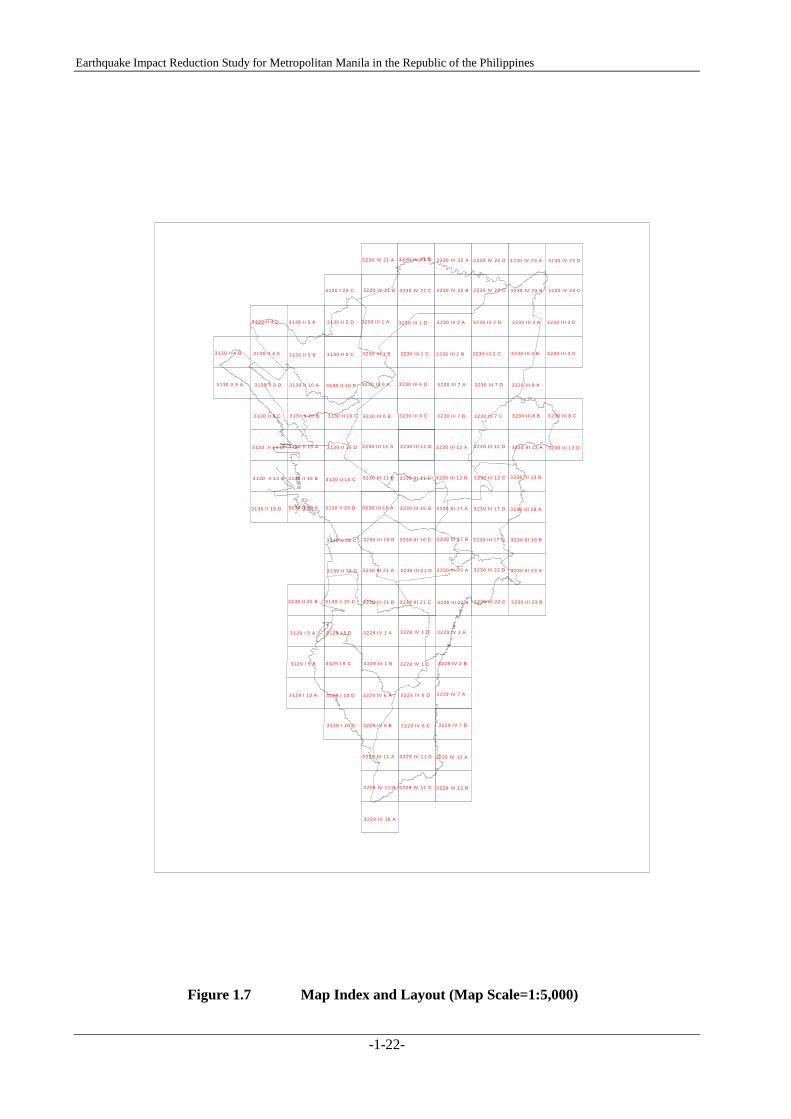
PTM projection (Philippine Transverse Mercator Projection) Zone III, Clarke Spheroid 1866 PRS 92’ Datum specified in “Revised Manual of Land Surveying Regulations” in 1998 of NAMRIA and map size (net size:1.5’ x 1.5’ and gross size: about A0) and layout of 1:5,000 scale topographic maps of NAMRIA ‘s internal standard was applied for 1:5,000 scale topographic maps. Map index and layout are as show in Figure 1.7.
Earthquake Impact Reduction Study for Metropolitan Manila in the Republic of the Philippines
-1-22-
3 230 I II 1 A 3 23 0 I II 1 D
3 2 30 I II 1 C3 230 I II 1 B
3 2 30 I II 2 D
3 23 0 I II 2 C3 230 I II 2 B
3 230 I II 2 A 3 230 I II 3 A
3 2 30 I II 3 B
3 230 I II 3 D
3 230 I II 3 C
3 230 I II 6 A
3 230 I II 6 B 3 2 30 I II 6 C
3 230 I II 6 D 3 230 I II 7 A
3 2 30 I II 7 B 3 230 I II 7 C
3 230 I II 7 D 3 230 I II 8 A
3 230 I II 8 B 3 230 I II 8 C
3 230 II I 11 A
3 230 II I 11 B
3 230 II I 11 D 3 230 II I 12 A
3 230 II I 12 B 3 230 II I 12 C
3 23 0 II I 12 D 3 230 II I 13 A
3 230 II I 13 B
3 2 30 II I 1 3 D
3 230 II I 16 A
3 2 30 II I 16 B 3 230 II I 16 C
3 23 0 II I 16 D 3 230 II I 17 A
3 230 II I 17 B 3 230 II I 17 C
3 23 0 II I 17 D 3 230 II I 18 A
3 230 II I 18 B
3 230 II I 21 A
3 230 II I 21 B 3 230 II I 21 C
3 2 30 II I 2 1 D 3 230 II I 22 A
3 230 II I 22 B
3 23 0 II I 22 D
3 230 II I 22 C
3 230 II I 23 A
3 230 II I 23 B
3 2 29 I V 1 A
3 229 IV 1 B 3 229 IV 1 C
3 229 IV 1 D 3 2 29 I V 2 A
3 229 IV 2 B
3 229 IV 6 A
3 2 29 I V 6 B 3 229 IV 6 C
3 229 IV 6 D 3 229 IV 7 A
3 2 29 I V 7 B
3 229 IV 11 A
3 229 IV 11 B 3 229 IV 11 C
3 229 IV 1 1 D
3 229 IV 16 A
3 229 IV 12 A
3 229 IV 12 B
3 230 IV 21 A
3 2 30 IV 21 B 3 230 IV 21 C
3 230 IV 21 D 3 230 IV 22 A
3 230 IV 22 B 3 230 IV 22 C
3 230 IV 22 D 3 230 IV 23 A
3 230 IV 23 B 3 2 30 IV 23 C
3 2 30 IV 23 D
3 130 I 25 C
3 130 I I 4 D
3 13 0 I I 4 C3 130 I I 4 B
3 130 I I 5 A
3 130 I I 5 B 3 130 I I 5 C
3 130 I I 5 D
3 130 I I 9 A
3 1 30 I I 9 C
3 130 I I 9 D 3 1 30 I I 10 A
3 130 I I 10 B 3 1 30 I I 10 C
3 130 I I 10 D
3 130 I I 15 A 3 130 I I 15 D
3 130 I I 15 C3 130 I I 15 B
3 13 0 I I 14 D
3 130 I I 14 C
3 1 30 I I 19 D 3 130 I I 20 A 3 130 I I 2 0 D
3 1 30 I I 20 C
3 130 I I 25 D
3 1 30 I I 25 C3 1 30 I I 25 B
3 129 I 5 A 3 129 I 5 D
3 129 I 5 C3 12 9 I 5 B
3 129 I 10 A 3 129 I 10 D
3 129 I 10 C
3 230 II I 11 C
Figure 1.7 Map Index and Layout (Map Scale=1:5,000)
Final Report
-1-23-
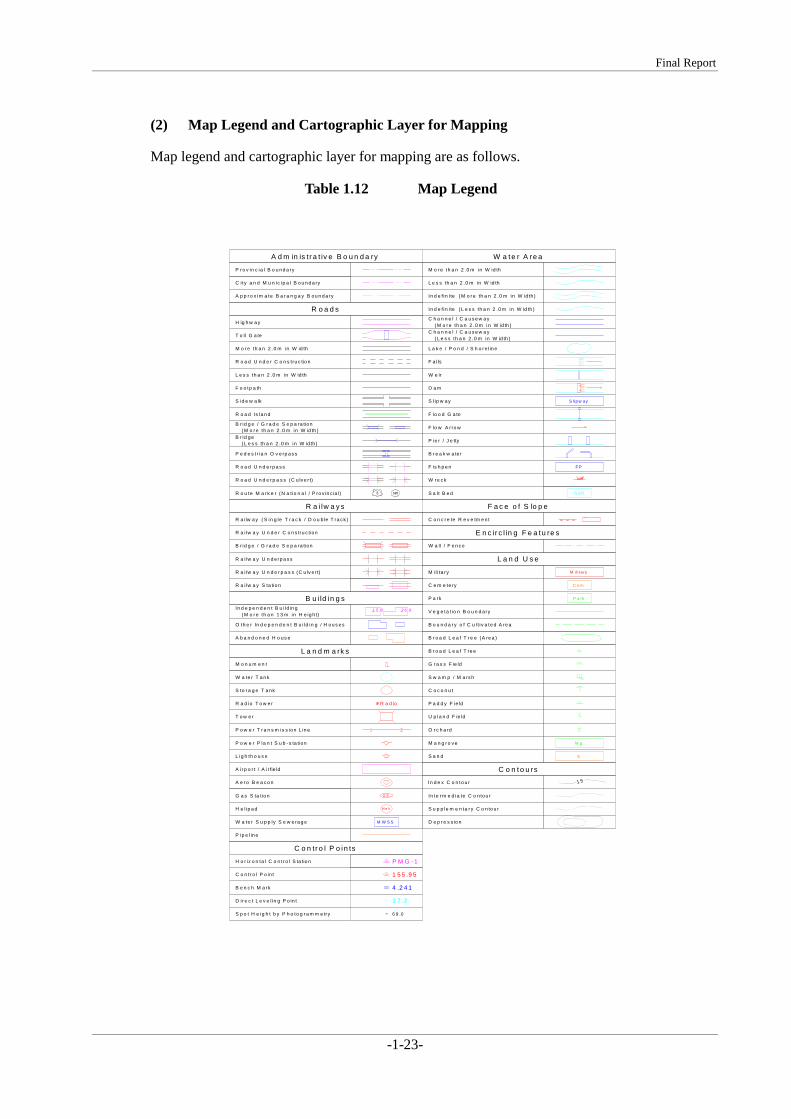
(2) Map Legend and Cartographic Layer for Mapping
Map legend and cartographic layer for mapping are as follows.
Table 1.12 Map Legend
R a d io
G S
H e li
P r o v in c ia l B o u nd a ry
S id e w a lk
C i ty a n d M u n ic ip a l B o u n d a ry
A p p r o x im a te B a r a n g a y B ou n d a ry
L e s s th a n 2 .0 m in W id th
M o r e th a n 2 .0 m in W id th
P e d e s t r ia n O v e rp a s s
T o l l G a te
H ig h w a y
F o o tp a th
R o a d Is la n d
B r id g e / G r a d e S e p a ra tion( M o r e th a n 2 .0 m in W id th )
( L e s s th a n 2 .0 m in W id th )B r id ge
R o u te M a r k e r ( N a tio n a l / P ro v in c ia l)
R a i lw a y
R o a d U n d e r C o n s t ru c tio n
R a i lw a y U n d e r C o n s tru c tion
R o a d U n d e rp a s s
R a i lw a y S ta tio n
R a i lw a y U n d erp a s s
In d e p e n d e n t B u i ld in g
O th e r In d e p e n d e n t B u i ld in g / H ou s es
( M o r e th a n 1 3 m in H e ig h t)
A b a n d o n e d H o us e
M o n u m e n t
M o r e th a n 2 .0 m in W id th
L e s s th a n 2 .0 m in W id th
( M o r e th a n 2 .0 m in W id th )
( L e s s th a n 2 .0 m in W id th )
In d e f in i te
In d e f in i te
C h a n n e l / C a u s e w a y( M o r e th a n 2 .0 m i n W id th )
( L e s s th a n 2 .0 m in W id th )C h a n n e l / C a u s e w a y
L a k e / P o n d / S h o r e lin e
F a l ls
W e ir
S l ip w ay
D a m
F lo o d G a te
F lo w A r ro w
B r e a k w a te r
P ie r / J e tty
S a l t B e d
W re c k
F is h p e n
W a l l / F e n c e
C o n c r e te R e v e tm e n t
P a rk
C e m e te ry
M i l i ta ry
V e g e ta tio n B o u n d ary
B o u n d a r y o f C u l t iv a te d A re a
B r o a d L e a f T re e
G r a s s F ie ld
C o c o n u t
P a d d y F ie ld
U p la n d F ie ld
S w a m p / M a rs h
O r c h a rd
M a n g r o v e
S a n d
D e p r e s s io n
In d e x C o n to u r
In te r m e d ia te C o n tou r
S u p p le m e n ta r y C o n to u r
S p o t H e ig h t b y P h o to g r a m m e try
H o r iz o n ta l C o n t r o l S ta tio n
D ir e c t L e v e l in g P o in t
B e n c h M a rk
C o n t r o l P o in t
1 5 .8 2 6 .9
S a lt
M i l i ta ry
C e m
P a rk
3 7 .2
6 9 .0
1 5 5 .9 5
4 .2 4 1
P M G -1
1 5
M g
S
B r id g e / G r a d e S e p a ra tion
( S in g le T r a c k / D o u b le T ra c k )
F P
S lip w a y
R o a d U n d e r p a s s (C u lv e r t)
R a i lw a y U n d e r p a s s (C u lv e r t)
A d m in is tr a t iv e B o u n d a ry
R o a d s
R a i lw a y s
B u i ld in g s
L a n d m a rk s
W a t e r A re a
F a c e o f S lo p e
E n c ir c l in g F e a tu re s
L a n d U s e
C o n t o u rs
C o n tr o l P o in ts
B r o a d L e a f T r e e (A re a )
P o w e r T r a n s m is s ion L in e
P o w e r P la n t S u b - s ta tion
W a te r T a n k
S to r a g e T a nk
R a d io T o w e r
L ig h th o u s e
A ir p o r t / A i r fie ld
A e r o B e a c o n
G a s S ta t io n
H e l ip a d
W a te r S u p p ly S e w e ra g e
P ip e l in e
T o w e r
M W S S
Earthquake Impact Reduction Study for Metropolitan Manila in the Republic of the Philippines
-1-24-
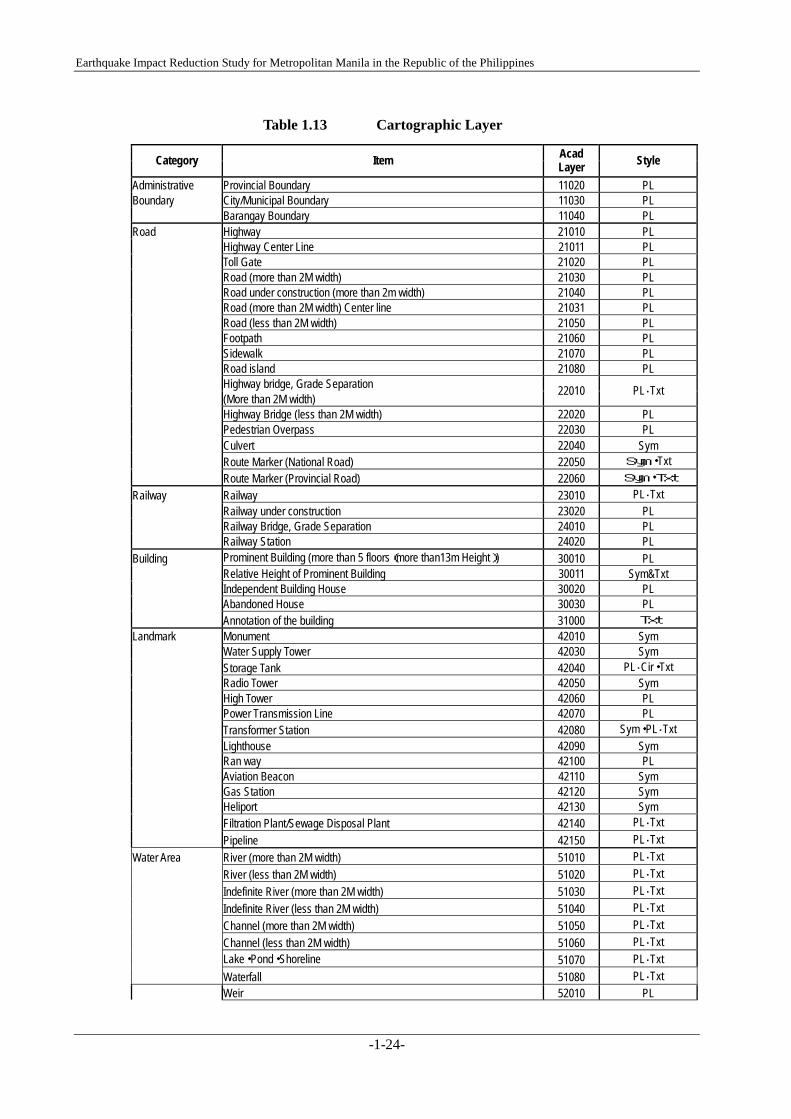
Table 1.13 Cartographic Layer
Category Item Acad Layer Style
Administrative Provincial Boundary 11020 PL Boundary City/Municipal Boundary 11030 PL Barangay Boundary 11040 PL Road Highway 21010 PL Highway Center Line 21011 PL Toll Gate 21020 PL Road (more than 2M width) 21030 PL Road under construction (more than 2m width) 21040 PL Road (more than 2M width) Center line 21031 PL Road (less than 2M width) 21050 PL Footpath 21060 PL Sidewalk 21070 PL Road island 21080 PL Highway bridge, Grade Separation (More than 2M width)
22010 PL・Txt
Highway Bridge (less than 2M width) 22020 PL Pedestrian Overpass 22030 PL Culvert 22040 Sym Route Marker (National Road) 22050 Sym・Txt Route Marker (Provincial Road) 22060 Sym・Txt Railway Railway 23010 PL・Txt Railway under construction 23020 PL Railway Bridge, Grade Separation 24010 PL Railway Station 24020 PL Building Prominent Building (more than 5 floors(more than13m Height)) 30010 PL Relative Height of Prominent Building 30011 Sym&Txt Independent Building House 30020 PL Abandoned House 30030 PL Annotation of the building 31000 Txt Landmark Monument 42010 Sym Water Supply Tower 42030 Sym Storage Tank 42040 PL・Cir・Txt Radio Tower 42050 Sym High Tower 42060 PL Power Transmission Line 42070 PL Transformer Station 42080 Sym・PL・Txt Lighthouse 42090 Sym Ran way 42100 PL Aviation Beacon 42110 Sym Gas Station 42120 Sym Heliport 42130 Sym Filtration Plant/Sewage Disposal Plant 42140 PL・Txt Pipeline 42150 PL・Txt Water Area River (more than 2M width) 51010 PL・Txt River (less than 2M width) 51020 PL・Txt Indefinite River (more than 2M width) 51030 PL・Txt Indefinite River (less than 2M width) 51040 PL・Txt Channel (more than 2M width) 51050 PL・Txt Channel (less than 2M width) 51060 PL・Txt Lake・Pond・Shoreline 51070 PL・Txt Waterfall 51080 PL・Txt Weir 52010 PL

Final Report
-1-25-
Dam 52020 PL・Txt Slipway 52030 PL Flood Gate 52040 PL・Txt Flow Arrow 52050 Sym Pier・Jetty 52060 PL Breakwater 52070 PL Fishpen 52080 PL Wreck 52090 Sym Salt Pan 52100 PL Face of Slope Revetment 61010 PL Encircling features Wall, Fence 61020 PL Land Use Military facilities 62010 PL・Txt Cemetery 62020 PL・Txt Park 62030 PL・Txt Vegetation Boundary 63010 PL Boundary of Cultivated Area 63020 PL Trees 63030 PL Grass 63040 Sym Swamp・Marsh 63050 Sym Parm Tree 63060 Sym Rice Field 63100 Sym Track Farm 63110 Sym Orchard 63120 Sym Mangrove 63130 Sym Sand 63140 Sym Topography Index Contour 71010 PL Intermediate Contour 71020 PL Supplementary Contour 71030 PL Index Contour for Depression 71040 PL Intermediate Contour for Depression 71050 PL Supplementary Contour for Depression 71060 PL Contour Value 71070 Txt Control Point Triangulation Point 73010 Sym・Txt Control Point 73020 Sym・Txt Bench Mark 73030 Sym・Txt Direct Leveling point 73040 Sym・Txt Spot Height 73050 Sym・Txt Annotation Annotation 81100 Txt Marginal Neat line 90000 PL Information Marginal Information・grid values 91000 PL
Note: PL: poly line, Sym: symbol, Cir: circle and Txt: text.
(3) Equipment and Programme Used for Digital Mapping. (a) Image plotter : DPW and SUMMIT EVOLUTION (b) Workstation : DELL, PRECISIOL420 (c) Programme : DPW and SUMMIT, photogrammetric mapping system (e) Data Format : DWG file
After the digital mapping, planimetric details, contour lines, barangay boundary and name of cities/municipalities, roads, rivers, bridges, government buildings, hospitals, fire stations, police stations, factories, school and other map annotations data on the 1:5,000 scale topographic maps were compiled by digital editing system of Auto CAD map. Total number of 1:5,000 scale topographic maps is 120. The list of 1:5,000 scale topographic maps is as below.

Earthquake Impact Reduction Study for Metropolitan Manila in the Republic of the Philippines
-1-26-
Table 1.14 List of 1:5,000 Scale Topographic Maps
Map No.
3129 I 05 A 3130 II 09 A 3130 II 20 C 3229 IV 07 A 3230 III 02 C 3230 III 08 B 3230 III 16 C 3230 III 22 D
3129 I 05 B 3130 II 09 C 3130 II 20 D 3229 IV 07 B 3230 III 02 D 3230 III 08 C 3230 III 16 D 3230 III 23 A
3129 I 05 C 3130 II 09 D 3130 II 25 B 3229 IV 11 A 3230 III 03 A 3230 III 11 A 3230 III 17 A 3230 III 23 B
3129 I 05 D 3130 II 10 A 3130 II 25 C 3229 IV 11 B 3230 III 03 B 3230 III 11 B 3230 III 17 B 3230 IV 21 A
3129 I 10 A 3130 II 10 B 3130 II 25 D 3229 IV 11 C 3230 III 03 C 3230 III 11 C 3230 III 17 C 3230 IV 21 B
3129 I 10 C 3130 II 10 C 3229 IV 01 A 3229 IV 11 D 3230 III 03 D 3230 III 11 D 3230 III 17 D 3230 IV 21 C
3129 I 10 D 3130 II 10 D 3229 IV 01 B 3229 IV 12 A 3230 III 06 A 3230 III 12 A 3230 III 18 A 3230 IV 21 D
3130 I 25 C 3130 II 14 C 3229 IV 01 C 3229 IV 12 B 3230 III 06 B 3230 III 12 B 3230 III 18 B 3230 IV 22 A
3130 II 04 B 3130 II 14 D 3229 IV 01 D 3229 IV 16 A 3230 III 06 C 3230 III 12 C 3230 III 21 A 3230 IV 22 B
3130 II 04 C 3130 II 15 A 3229 IV 02 A 3230 III 01 A 3230 III 06 D 3230 III 12 D 3230 III 21 B 3230 IV 22 C
3130 II 04 D 3130 II 15 B 3229 IV 02 B 3230 III 01 B 3230 III 07 A 3230 III 13 A 3230 III 21 C 3230 IV 22 D
3130 II 05 A 3130 II 15 C 3229 IV 06 A 3230 III 01 C 3230 III 07 B 3230 III 13 B 3230 III 21 D 3230 IV 23 A
3130 II 05 B 3130 II 15 D 3229 IV 06 B 3230 III 01 D 3230 III 07 C 3230 III 13 D 3230 III 22 A 3230 IV 23 B
3130 II 05 C 3130 II 19 D 3229 IV 06 C 3230 III 02 A 3230 III 07 D 3230 III 16 A 3230 III 22 B 3230 IV 23 C
(4) Accuracy of Digital Map
Digital maps have the following accuracy. (a) Accuracy of planimetric details: within +0.2 mm from true position on the maps. (b) Accuracy of contour lines: within one third between contours on the maps.
All above digital data of 1:5,000 scale topographic maps has been used for base map of GIS database for the Study.
1.6.7 Preparation of 1:5,000 Scale Digital Orthophotos
Using 1:10,000 scale photo scanning image and contours data of 1:5,000 scale digital mapping, 1:5,000 scale digital orthophotos were prepared. The mapping work consists of automatic DTM generation, orthophoto image generation and digital compilation. City /municipality boundaries with name and annotations on the orthophotos were compiled by image plotter in accordance with the following manner.
(1) Othophoto Projection, Size and Layout
Map projection and layout of 1:5,000 scale topographic maps were used for preparation of 1:5,000 scale orthophotos. Sheet net size is 1.5’x 1.5’ and gross size is about A1. The map layout is shown in Figure 1.7.

Final Report
-1-27-
(2) Equipment and Programme Used for Digital Orthophotos. (a) Image plotter : SUMMIT EVOLUTION (b) Workstation : DELL, PRECISIOL420 (c) Programme : SUMMIT, MATCH-AT (d) Data Format : TFW with TIFF file
(3) Sheet Number
Sheet number of 1:5,000 scale orthophotos is as same map number of the 1:5,000 scale topographic map, which is tabulated in Table 1.14.
1.6.8 Final Products
Final products of 1:5,000 scale topographic mapping works are listed up as follows.
Table 1.15 List of Final Products
Description Quantity 1. Aerial Photography (a) Negative films 4 rolls (b) Contact prints 2 sets (c) Aerial photo index and its data in CD (TIFF file) 1 set (d) Photo scanning data in HD 1 set (e) List of photos and its data in CD 1 set 2. GPS Survey (a) Diagram of GPS network 1 set (b) Computation Sheets 1 set (c) List of coordinates of GPS stations 1 set (d) Field station record 1 set 3. Leveling (a) Leveling network diagram 1 set (b) Computation Sheets 1 set (c) Diagram of Leveling network 1 set (d) List of height of GPS stations 1 set 4. Field Verification (a) List of annotations table 1 set (b) List of field verification data 1 set 5. Aerial Triangulation (a) Computation file data in HD 1 set (b) Aerial triangulation mark index 1 set 6. 1:5,000 Scale Digital Mapping (a) Map index 4 sets (b) 1:5,000 scale topographic maps 4 sets (c) Digital data of 1:5,000 scale topographic maps in CD 3 set 7. Preparation of 1:5,000 Scale Digital Orthophotos (a) 1:5,000 scale orthophoto maps 2 sets (b) Digital data of 1:5,000 scale orthophoto maps in CD 3 sets 8. Barangay boundary data 1 set 9. Topographic Mapping Report 2 sets
Earthquake Impact Reduction Study for Metropolitan Manila in the Republic of the Philippines
-1-28-
1.7 User’s Guide This user’s guide describes the contents of the 1:5,000 scale topographic maps and orthophotos, and its digital data covering the Metropolitan Manila. The map data show general features of land conditions as well as existing structures on the ground of the Metropolitan Manila in 2003. Type of data format use for the maps and orthophotos are as follows.
(1) Type of Data Format (a) 1:5,000 scale topographic map data: AutoCAD 2000 DWG file (b) 1:5,000 scale orthophoto data: 2000 AutoCAD DWG file consisting of DWG (net grid
line, sheet layout, marginal information and annotations), TIFF (orthophoto images) and TFW (orthophoto image coordinates).
In order to open and print the maps and orthophotos, the following computer specifications and software are recommended.
(2) Recommended Computer Specifications (a) OS: Windows 2000 or XP professional (b) CPU: Pentium III 700 megahertz or equivalent type (c) SDRAM: more than 256 mega byte (512 mega byte gives much better performance)
(3) Recommended software (a) Auto CAD 2000LT, AutoCAD Map 2000 or AutoCAD Map 5, Arc/View, Arc/info or Micro Station.
Final Report
-1-29-
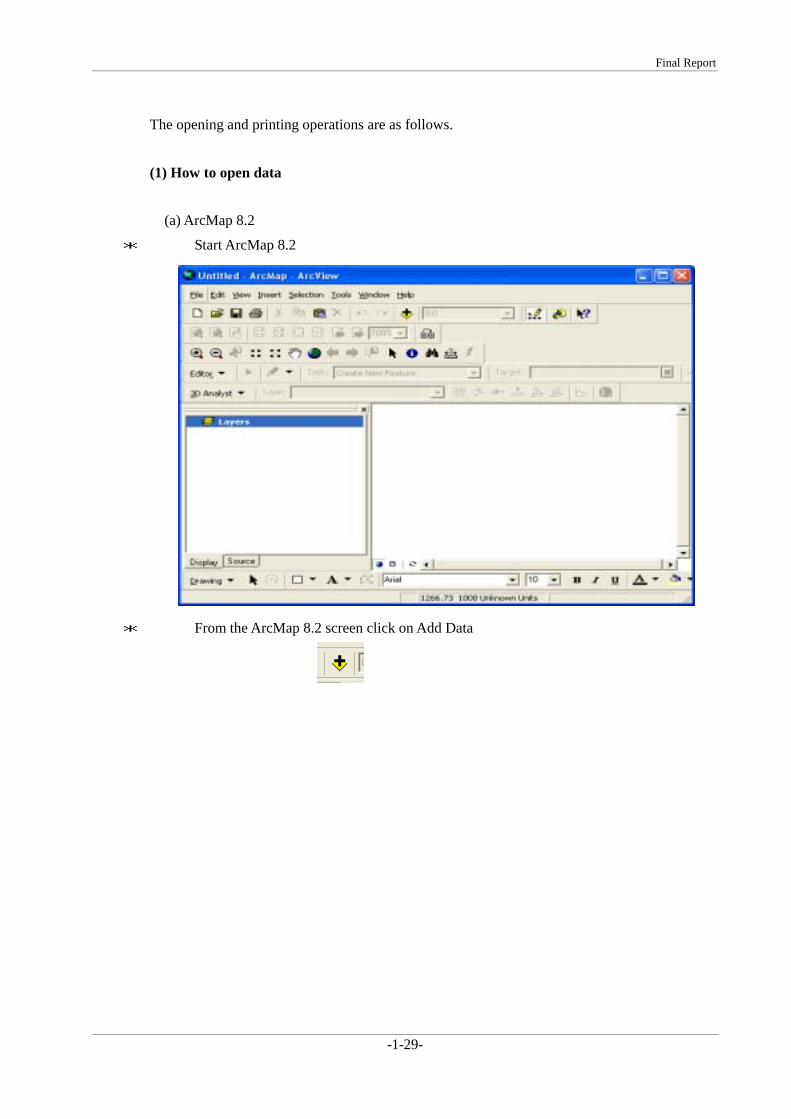
The opening and printing operations are as follows.
(1) How to open data (a) ArcMap 8.2
* Start ArcMap 8.2
* From the ArcMap 8.2 screen click on Add Data
Earthquake Impact Reduction Study for Metropolitan Manila in the Republic of the Philippines
-1-30-
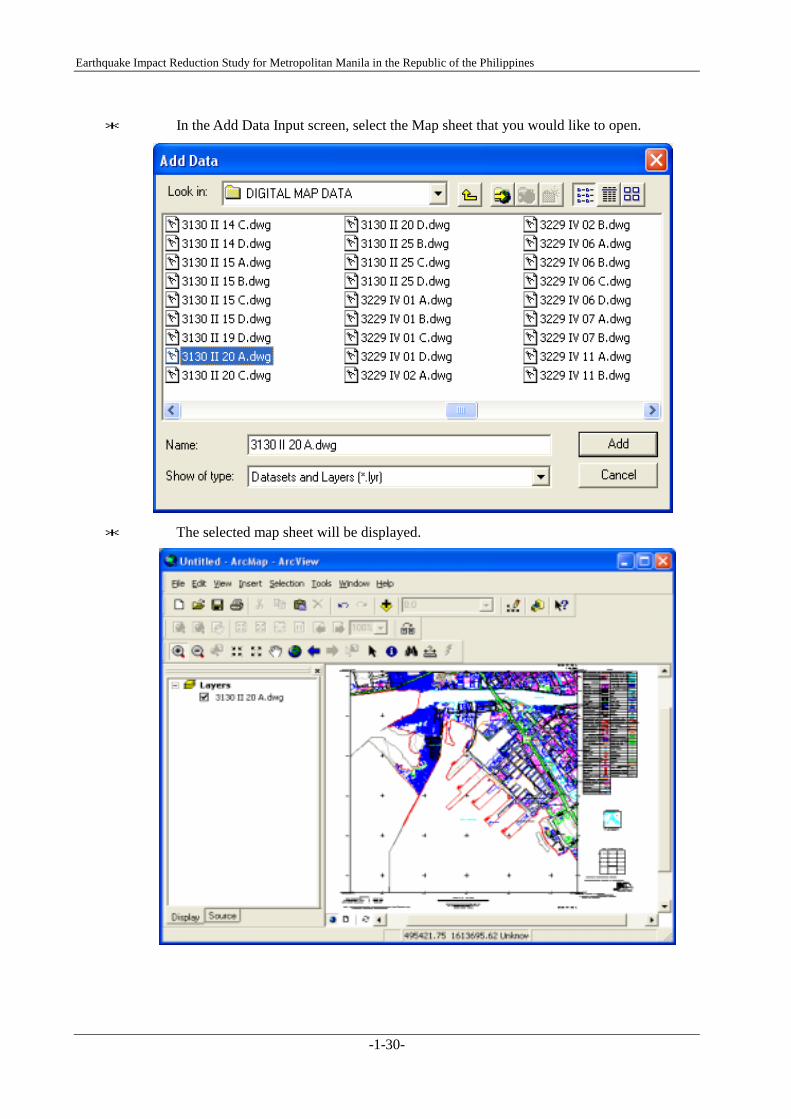
* In the Add Data Input screen, select the Map sheet that you would like to open.
* The selected map sheet will be displayed.
Final Report
-1-31-
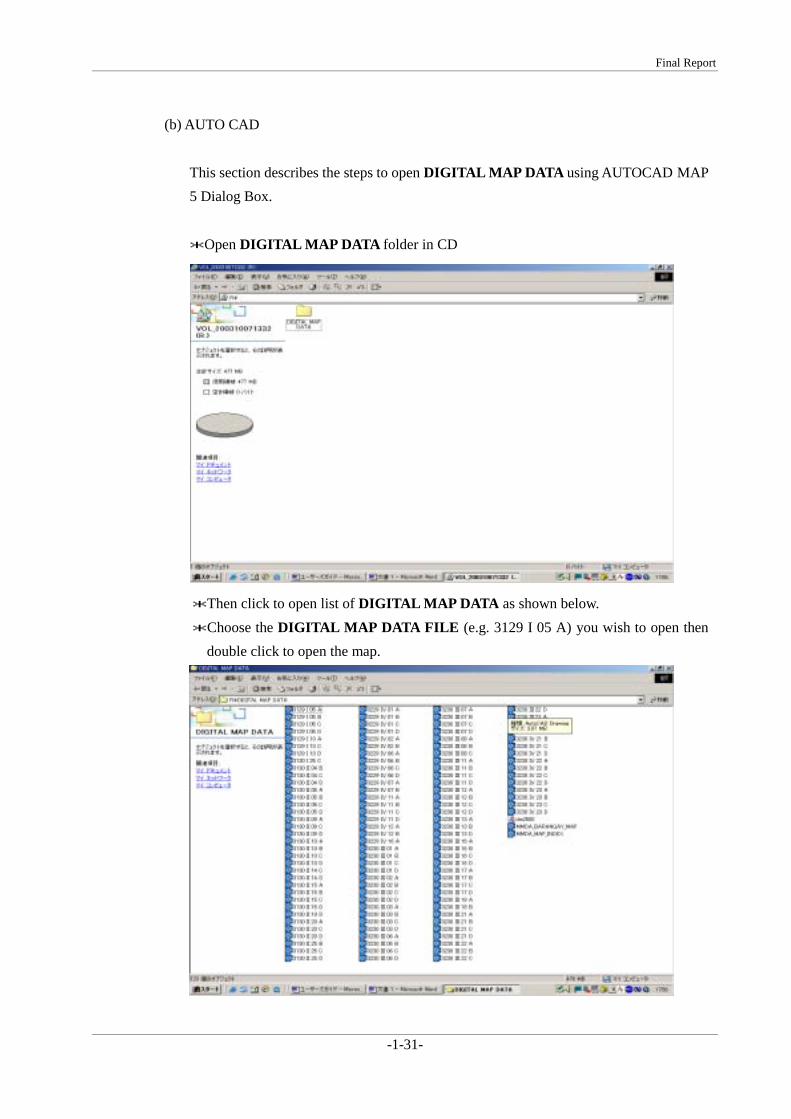
(b) AUTO CAD
This section describes the steps to open DIGITAL MAP DATA using AUTOCAD MAP 5 Dialog Box.
*Open DIGITAL MAP DATA folder in CD
*Then click to open list of DIGITAL MAP DATA as shown below. *Choose the DIGITAL MAP DATA FILE (e.g. 3129 I 05 A) you wish to open then
double click to open the map.
Earthquake Impact Reduction Study for Metropolitan Manila in the Republic of the Philippines
-1-32-
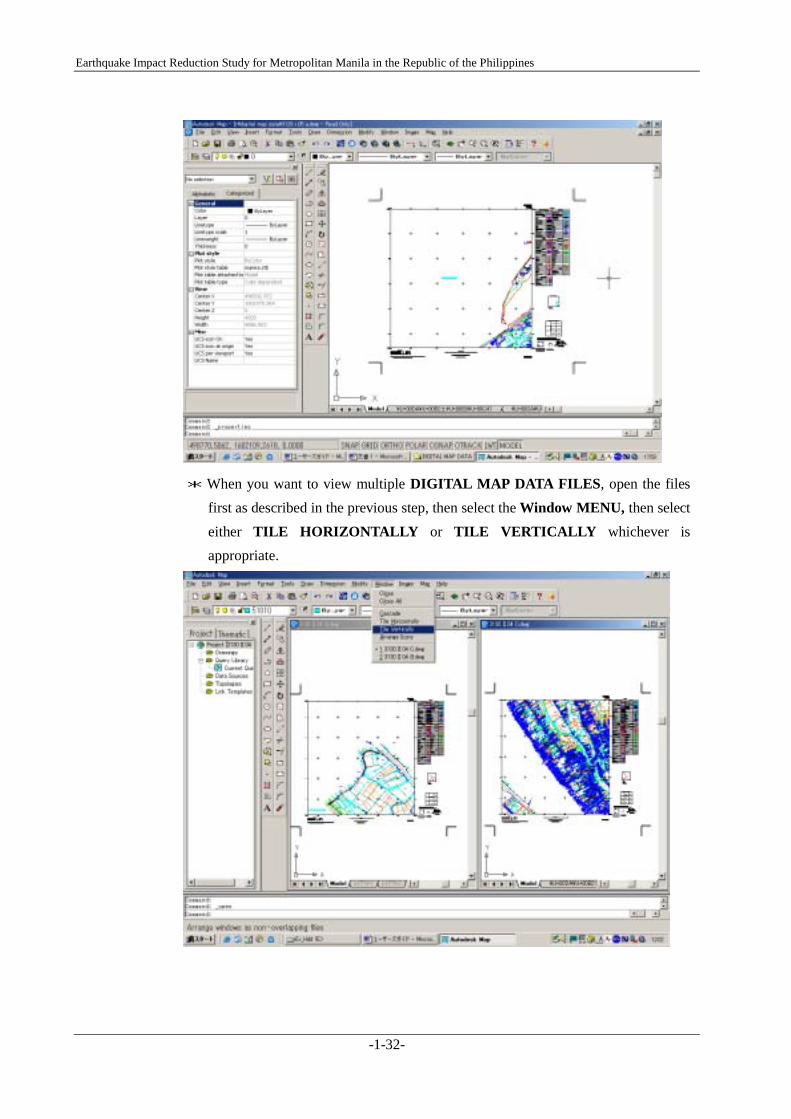
* When you want to view multiple DIGITAL MAP DATA FILES, open the files first as described in the previous step, then select the Window MENU, then select either TILE HORIZONTALLY or TILE VERTICALLY whichever is appropriate.
Final Report
-1-33-
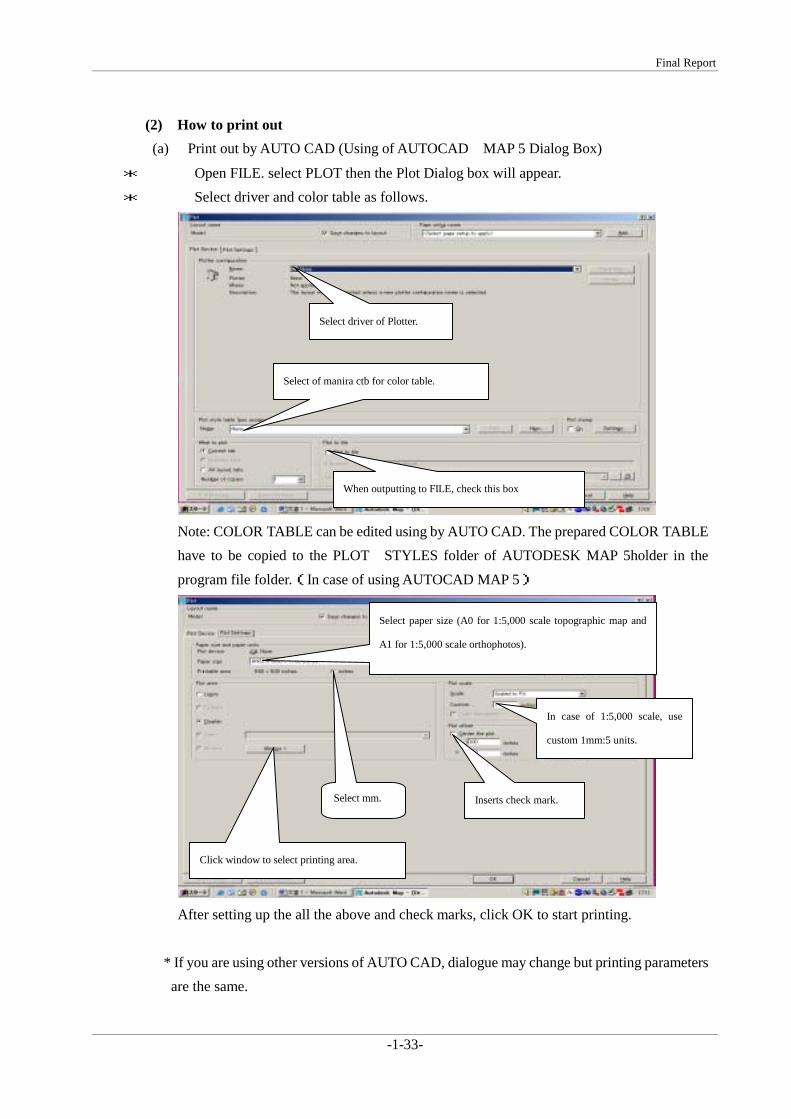
(2) How to print out (a) Print out by AUTO CAD (Using of AUTOCAD MAP 5 Dialog Box)
* Open FILE. select PLOT then the Plot Dialog box will appear. * Select driver and color table as follows.
Note: COLOR TABLE can be edited using by AUTO CAD. The prepared COLOR TABLE have to be copied to the PLOT STYLES folder of AUTODESK MAP 5holder in the
program file folder.(In case of using AUTOCAD MAP 5)
After setting up the all the above and check marks, click OK to start printing.
* If you are using other versions of AUTO CAD, dialogue may change but printing parameters
are the same.
In case of 1:5,000 scale, use
custom 1mm:5 units.
Inserts check mark. Select mm.
Click window to select printing area.
Select paper size (A0 for 1:5,000 scale topographic map and
A1 for 1:5,000 scale orthophotos).
Select driver of Plotter.
Select of manira ctb for color table.
When outputting to FILE, check this box
Earthquake Impact Reduction Study for Metropolitan Manila in the Republic of the Philippines
-1-34-
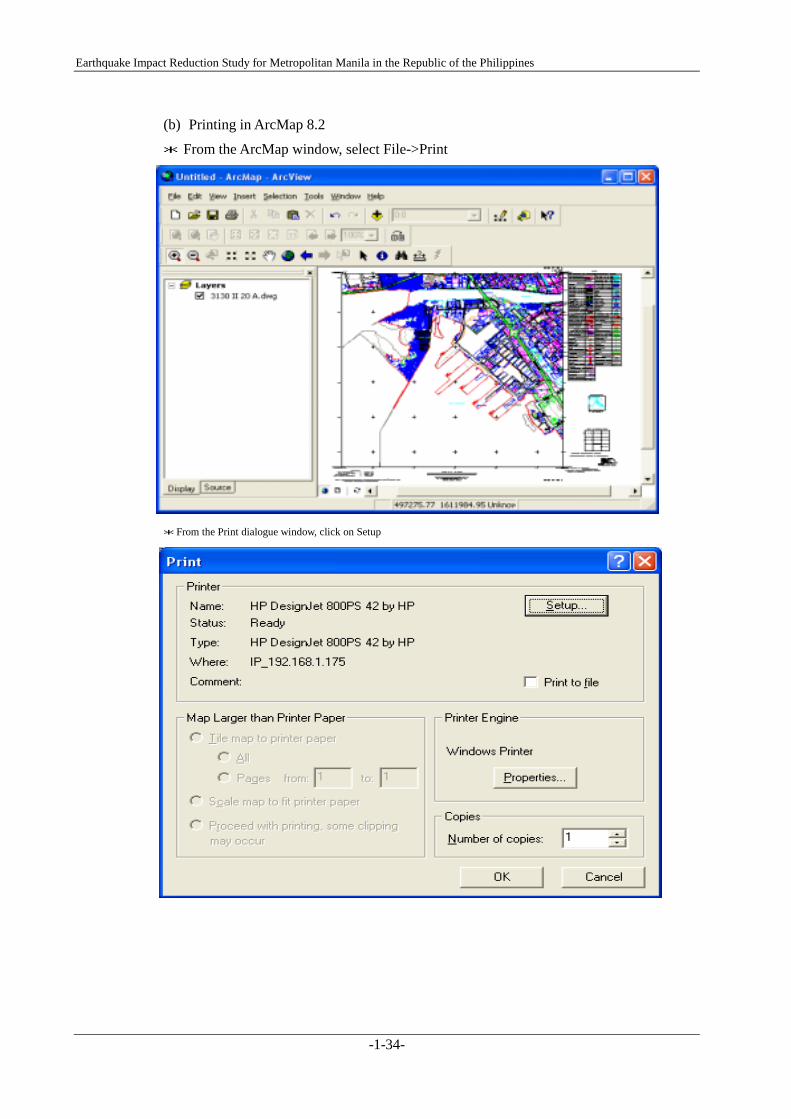
(b) Printing in ArcMap 8.2
* From the ArcMap window, select File->Print
* From the Print dialogue window, click on Setup
Final Report
-1-35-
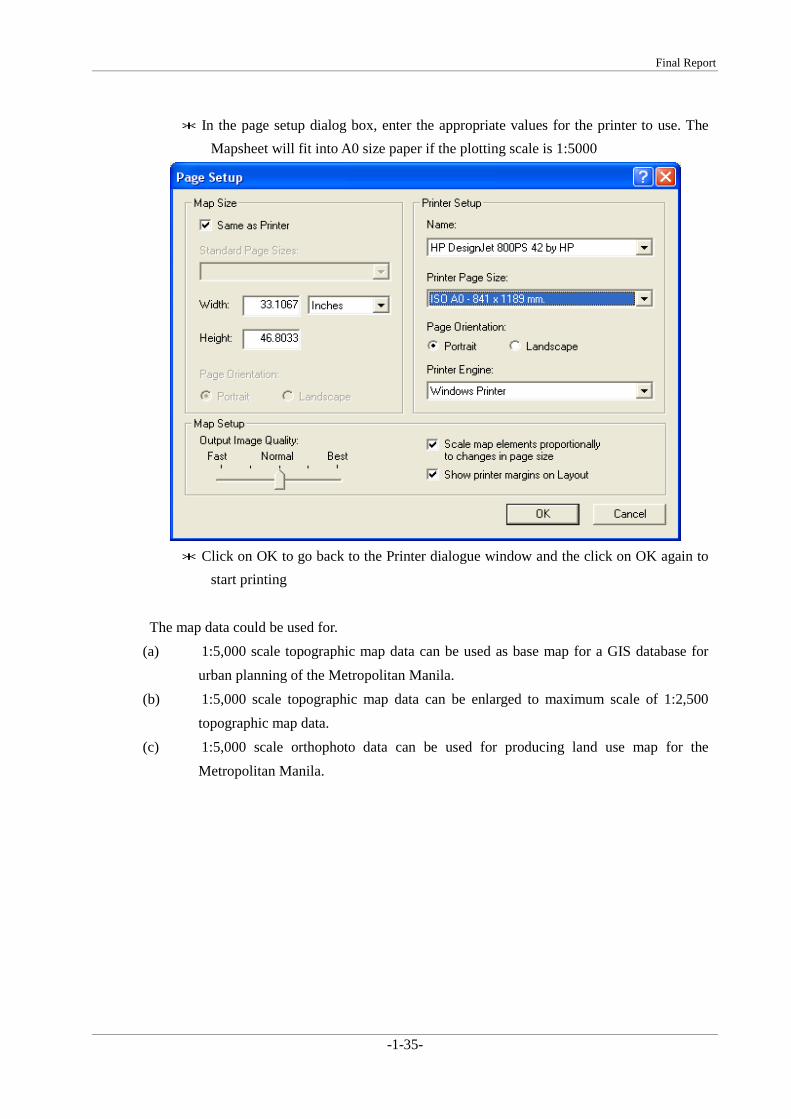
* In the page setup dialog box, enter the appropriate values for the printer to use. The Mapsheet will fit into A0 size paper if the plotting scale is 1:5000
* Click on OK to go back to the Printer dialogue window and the click on OK again to start printing
The map data could be used for.
(a) 1:5,000 scale topographic map data can be used as base map for a GIS database for urban planning of the Metropolitan Manila.
(b) 1:5,000 scale topographic map data can be enlarged to maximum scale of 1:2,500 topographic map data.
(c) 1:5,000 scale orthophoto data can be used for producing land use map for the Metropolitan Manila.


![Aall Star Formation Application Sheet[1]](https://img.pdfslide.net/doc/110x75/546ae6e8af795967298b4974/aall-star-formation-application-sheet1.jpg)


