Embed Size (px)
Citation preview

FORMATION OP PYRUVATE-LACTATE INDEX AND OP GLUCOSE LEVEL IN CONTROLLED ALCOHOLEMIA
Wladyslaw Nasilowski, Zofia Olszowy
Department of Forensic Medicine. Silesian Medical Academy Katowice - Poland
Assuming that the oxidation of alcohol runs parallelly with the other metabolic process in hepatic cells, further investigations of alcoholemia aimed at finding distemper exponents in NADH and NADPH coenzyme reoxidation, and secondarily in behaviour of hydrogen accepting substrates (1,2,3) should be undertaken. These products take part in coenzyme reoxidation as carriers retransporting H ions from cytosol to mitochondria, where again they are incorporated into the enzyme flavine respiratory chain. Pyruvates/lactates oxalates/ /svecinates and others belong to carries of so correlated pairs0.2,3).
It seems necassary to take into account additional ethyl alcohol oxidation in microsomal enzyme system (MEOS arrangement) or with the employment of kathalase shifting redox potential to NADH abundance and reducing oxidase cell potential with all the consequences like, among others, dimunition of hydrogen accepting substrates (pyruvates). Carbohydrate transformation (fructose), and in particular,glycolysis processes, which might be a source of hydrogen accepting substrates, are connected with an adequate pyroracemic and lactic acid supply (4,5,7).
Data from some reports may indicate (1,4,6,8) that vacillation of cell redox potential in longer lasting alcoholemia manifests in level variation of pyroracemic and lactic acids and in blood glucose.
Since the nature of this phenomenon in many-hour lasting alcoholemia has not been fully understood, we have decided on undertaking our own investigations, comprising several control variants.
1042

Material and Methods Examinations were performed on 4 groups, consisting of 12 persons,
aged from 19—25, generally healthy. Vodka load capacity amounted to 1,2 g per 1 kg body weight. Oral administration of 40° vodka, at the beginning of experiment, lasted 5-10 minutes. During our 8-hour experiment, blood from ulnar vein was taken 6 times, at 1,5 - 2,5 - -3,5 - 4j5 - 6,5 hours after administration.
The groups were divided in the following way:Group I -Alcohol load on empty stomach without giving a meal, only a glassful of little sweetened tea after third blood collection.Group II -Standard meal (a bun with cheese, tea), alcohol as above.Group III -
Control group, on empty stomach, without alcohol and meal.Group IV -Control group, without alcohol, after standard breakfast.
In each taken blood sample the level of alcohol, pyracemic and lactic acid, and of glucose was determined by means of enzymatic methods with spectophotometric survey. Obtained data were verified statistically with regard to standard deviation, standard error, statistically significant differences (t test at p 0,05), and. next presented grafically and tabulated. Formation of pyroracemic and lactic acid was presented by a coefficient (pyruvate/lactate index) the course of alcohol curves was formulated by means of least square calculus, establishing the coefficient values: CQr ^ .
Table I. Presents alcoholemia formation in the course of the first and second experiment (on empty stomach and after meal) in the range of c r coefficient.
Table II. Presents the concentration of alcohol during the experiment on empty stomach and after meal (group I and II).Fig. 1. (Presents graphically) the mean results of group I in relation
to alcohol, gluctose, pypyruvate and lactic acid.Fig. 2. (Presents graphically) the mean results of group II in
relation to alcohol, glucose, pypyruvate and lactic acid.Fig. 3. (Presents graphically) the mean results of group III in
relation to glucose, pyruvate and lactic acid.
1043

Pig. 4. (Presents graphically) the mean results of group III in relation to glucose, pyroracemic and lactic acid.
Fig. 5Fig. 5. (Presents graphically) the formation of pyruvate-lactic ratio
in all experiments.Table III. Contains the numerical confrontation of pyruvate-
-lactic ratio.Result s
The formation of alcohol levels of group I (on empty stomach) in comparison with group II was significantly different (Fig. 2,3). In group I the "alcohol curve" was increasinglyuickly, and markedly higher than in group II in which it showed a retarded apical concentration, connected with a reduction of other values.
Lactic acid in both alcohol experiments (i, II) showed a marked increase, and presented graphically, rain parallelly to alcohol level curves. The difference illustrating the increased level of lactic acid in comparison with threshold (zero collection) was statistically significant in experiments with alcohol.
For the IV collection in experiment I the lactic acid level was t^ = 2,407, in experiment II t̂ = 3,652 and III - t = 2,677»In experiments without alcohol (ill, IV) lactic acid levels showed certain variation, but were not statistically significant.
Pyroracemic acid in both experiments with alcohol (l, II) showed level lowering tendencies, being statistically significant. Since the same tendencies were observed in experiment IV (after meal, without alcohol), it may suggest the occurance of a compound nature, connected not only with a post-alcoholic anoxia but with duration course as well.
Statistically significant differences for pyroracemic acid in comparison to zero collection were as follows: experiment I - t^ = 3,333* t,. = 2,833* in experiment II marked decreases were also observed - t̂ = 3,125, t. = 4,896} experiment IV- t4 = 4,498, t5 = 4,126.
The formation of pyruvate-lactic ratio in experiments with alcohol revealed still more the course of hypoxia phenomenon and showed a marked decrease (group I, II) with values t̂ , tg, ty t^ t̂ = 2,850. A still more distinct drop was observed in experiment II
1044
(alcohol and meal factor) where all t 5, while in both control experiments, with zero collection no or only single statistically significant differences occured, which was caused by variation of lactate and pyruvate levels.
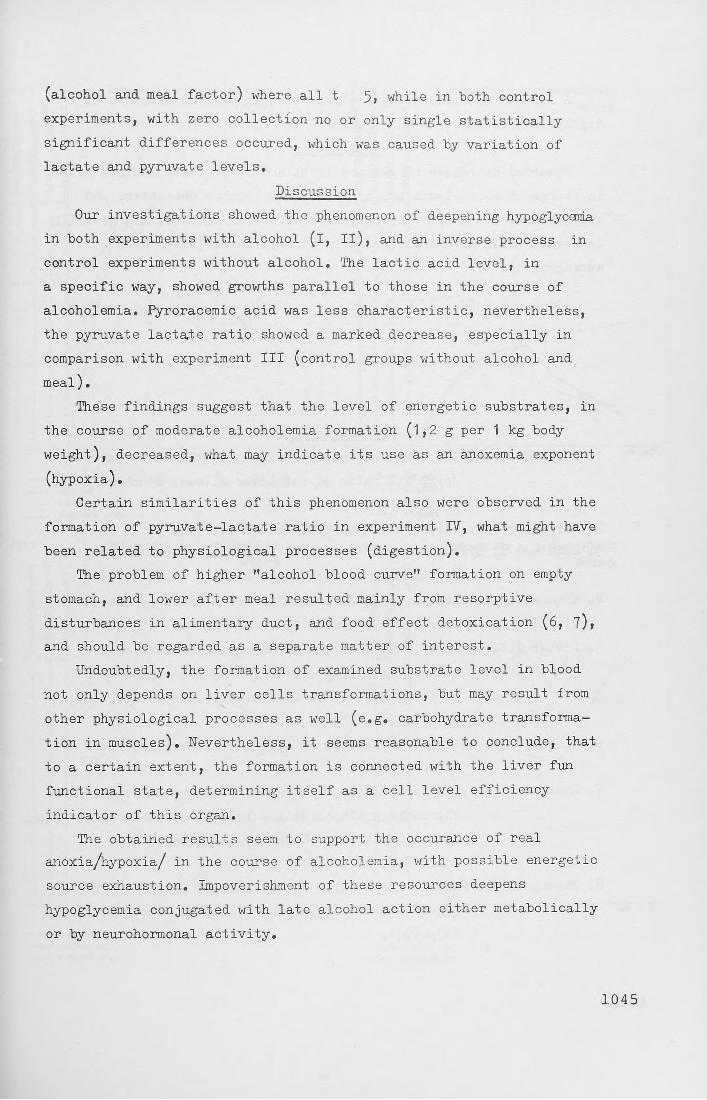
DiscussionOur investigations showed the phenomenon of deepening hypoglycemia
in both experiments with alcohol (i, II), and an inverse process in control experiments without alcohol. The lactic acid level, in a specific way, showed growths parallel to those in the course of alcoholemia. Pyroracemic acid was less characteristic, nevertheless, the pyruvate lactate ratio showed a marked decrease, especially in comparison with experiment III (control groups without alcohol and meal),
These findings suggest that the level of energetic substrates, in the course of moderate alcoholemia formation (1,2 g per 1 kg body weight), decreased, what may indicate its use as an anoxemia exponent (hypoxia).
Certain similarities of this phenomenon also were observed in the formation of pyruvate-lactate ratio in experiment IV, what might have been related to physiological processes (digestion).
The problem of higher "alcohol blood curve" formation on empty stomach, and lower after meal resulted mainly from resorptive disturbances in alimentary duct, and food effect detoxication (6, 7), and should be regarded as a separate matter of interest.
Undoubtedly, the formation of examined substrate level in blood not only depends on liver cells transformations, but may result from other physiological processes as well (e,g, carbohydrate transformation in muscles). Nevertheless, it seems reasonable to conclude, that to a certain extent, the formation is connected with the liver fun functional state, determining itself as a cell level efficiency indicator of this organ.
The obtained results seem to support the occurance of real anoxia/hypoxia/ in the course of alcoholemia, with possible energetic source exhaustion. Impoverishment of these resources deepens hypoglycemia conjugated with late alcohol action either metabolically or by neurohormonal activity.
1045
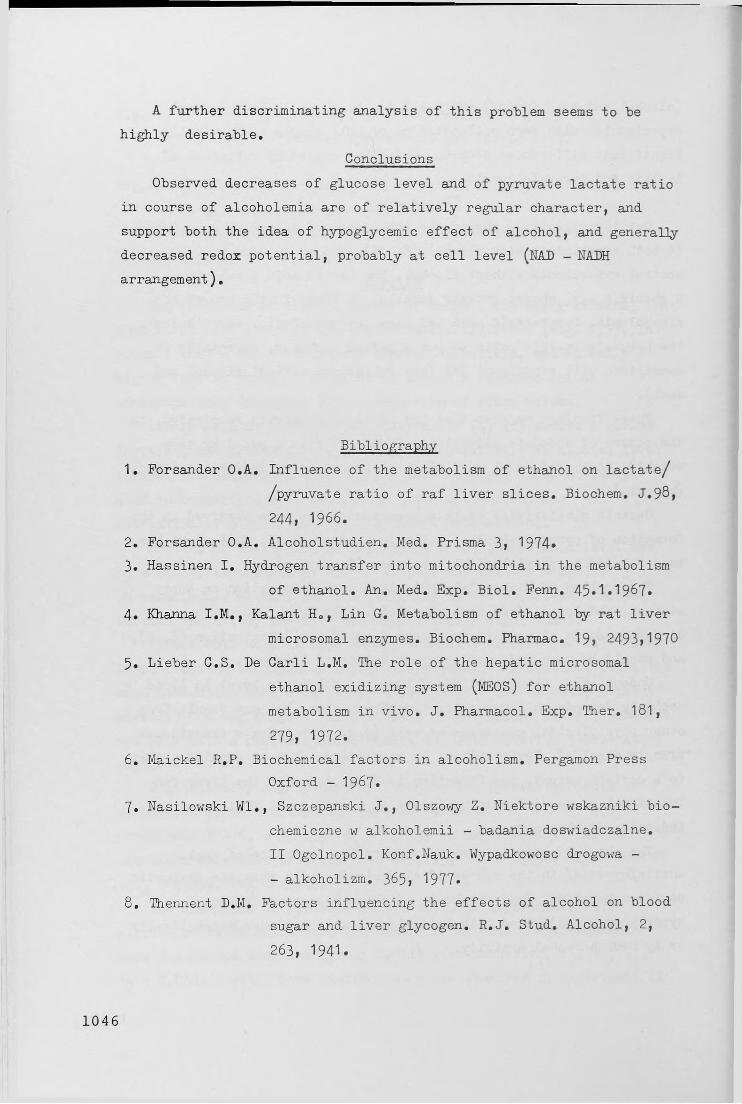
A further discriminating analysis of this problem seems to he highly desirable.
ConclusionsObserved decreases of glucose level and of pyruvate lactate ratio
in course of alcoholemia are of relatively regular character, and support both the idea of hypoglycemic effect of alcohol, and generally decreased redox potential, probably at cell level (NAD - MADH arrangement).
B ibliography1. Forsander O.A. Influence of the metabolism of ethanol on lactate/
/pyruvate ratio of raf liver slices. Biochem, J.98» 244, 1966.
2. Forsander O.A. Alcoholstudien. Med. Prisma 3, 1974*3. Hassinen I. Hydrogen transfer into mitochondria in the metabolism
of ethanol. An. Med. Exp. Biol. Fenn. 45*1*1967*4. Khanna I.M., Kalant Ho, Lin G. Metabolism of ethanol by rat liver
microsomal enzymes. Biochem. Fharmac. 19, 2493,19705. Lieber G.S. De Garli L.M. The role of the hepatic microsomal
ethanol exidizing system (MEOS) for ethanol metabolism in vivo. J. Pharmacol. Exp. Ther. 181, 279, 1972.
6. Maickel R.P. Biochemical factors in alcoholism. Pergamon PressOxford - 1967*
7. Nasilowski Wl., Szczepanski J., Olszowy Z. Niektore wskazniki bio-chemiczne w alkoholemii - badania doswiadczalne.II Ogolnopol. Konf.Nauk. Wypadkowosc drogowa -- alkoholizm. 365, 1977-
8. Thennent D.M. Factors influencing the effects of alcohol on bloodsugar and liver glycogen. R.J. Stud. Alcohol, 2,263, 1941.
1046
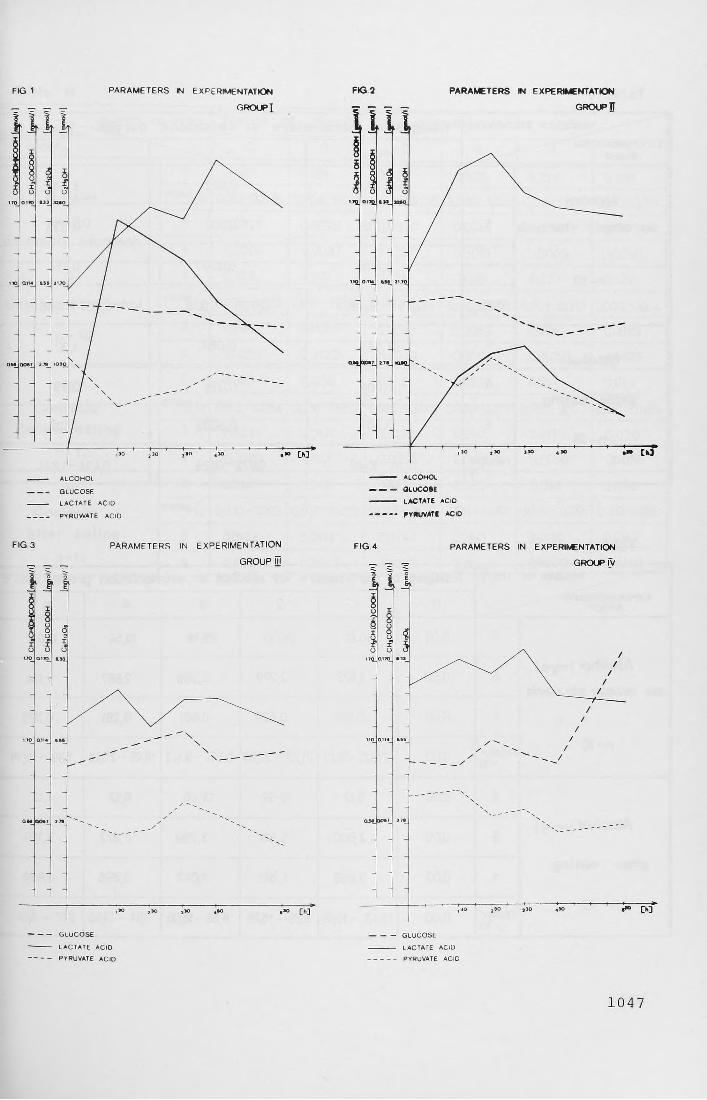
FIG 1 PARAMETERS IN EXPERIMENTATION
— ALCOHOL
------- -- ---GLUCOSE
------------- LACTATE ACID
______PYRUWATE ACID
FIG. 3 PARAMETERS IN EXPERIMENTATION
----------- GLUCOSE
-----------LACTATE ACID
-----------PYRUVATE ACID
FIG.2 PARAMETERS IN EXPERIMENTATION
■ ALCOHOL
------------ GLUCOSE
— — LACTATE ACID
-------------p y h u v a t i a c id
FIG 4 PARAMETERS IN EXPERIMENTATION
------------ GLUCOSE
------------- LACTArE ACID
------------ PYRUVATE ACID
1047

Tabl* I
^ — ^ R M M E S OF CALCULATES
EWCMMCNUTIONGROUP -st,___
Ranges of parameters of 'alcoholic curves- [m m o i/i ]
Co Iff n
Alcohol on empty stomach
n-10
I 36,47 0,032 3,56
8 2,735 0,002 0,538
s 0,868 0,0007 0,113
FRO M // to
32£9 - 4 2 ,5 5 0 ,0 2 8 -0 ,0 3 6 2,257-4,06
Alcohol
altar eating
n-13
X 14,54 0,083 1,32
6 2,084 0,015 0,391
s 0,566 0,0002 2,019
fr o m //TO 12,16 -16,49 0,072 -0,128 0,434-1,824
Tab to H
___ NUMBER OF TESTS Ranges of parameters for alcohol experimentation group 1 and 1EXrCW MENUnOtl— »*.
GROUP 0 1 2 3 4 5
X 0,00 30,61 28,00 25,18 19,54 12,80
Alcohol [mmoty] on empty stomach
5 0,00 1,823 2,279 2,366 2JB87 1,194
s 0,00 0,499 0,629 0,651 0,781 0,325
n-10fr o m /
/ to0,00 26,05 - 36 7̂ 21,27-33,65 23,44-33,43 18,45 -25,18 7,38 - 1715
X 0,00 9,12 12,59 13,46 9,12 4.12
AlCOhOl [mmoyi]5 0,00 2,800 5,861 3,299 2,822 3,169
after eatings 0,00 0,868 1,845 1,042 0,896 0,998
n -13r*°y/ 0,00 5,43 -10JB5 8,25— 16̂ 28 8,68—16t06 3,91 -13(68 2,17 - 564
1048

Table III
— -~-~-̂ _NUMBER OF TESTS 1XPERIMENTATION GROUP
Range of results for pyruvate — lactat index0 1 2 3 4 5
1Alcohol
n=20 on empty stomach
X 0.057 0,021 0,021 0.026 0,026 0,031FR(% 0P22-0.248 0,008-0,039 0,002-0,036 0,018-0,041 0,016-0,033 0.010-0,074S 0,0707 0,0070 0.0070 0,0044 0,0030 00173s 0,0204 0,0020 0.0020 0,0013 0,0009 0,0050
IIBreakfast alkohol
n = 13
X 0.059 0,024 0,031 0,026 0,023 0,022FROM̂ 0 0,026-0p88 0,010-0,039 0,018-0.054 0,014-Q040 0,008-0,039 0,009-0,0445 0,020 0,0083 0,0083 0,0063 0,0083 0,0083S 0,0055 0,0023 0,0023 0,0017 0,0023 0,0023
IIIControle
Before eating n=12
X 0,055 0,036 0,047 0,055 0,054 0,044FRC% 0,012- 0,084 0018-0057 0,022-0,078 0,030-0,089 0p20 -0,090 0010-0,0898 0,0244 0,0141 0,0173 0,0141 0,0173 0,020s 0,0070 0,041 0,0050 0,0041 0,0050 0,0058
IVControle
After eating n=11
X 0,049 0,046 0,043 0,035 0,030 0039FROM^ 0,030 - 0,093 0,031-0,072 0.023 - 0,109 0,014-0.065 Qp19- 0,054 0,012-0,059
6 00173 aoui 0,0244 0,0141 0,0100 0,0141s 0,0052 0.0042 0,0073 0.0042 0,0030 0,0042
1049