Embed Size (px)
Citation preview
Formative Research Project (FRP) for
School Sector Reform Program (SSRP)
in Nepal
LONGITUDINAL STUDY ON SYSTEM
INDICATORS
A Study Jointly Conducted by:
Department of Education
and
Research Centre for Educational Innovation and Development (CERID)
Tribhuvan University
Research Centre for Educational Innovation and Development (CERID)
Tribhuvan University Balkhu, Kathmandu
July, 2016
i
Advisory Committee
Prof. Dr. Krishna Chandra Sharma, Executive Director – CERID
Dr. Dilli Rimal, Director General – DoE
Ms. Dev Kumari Guragain, Director, Planning Division – DoE
Mr. Kewali Ram Adhikari, Deputy Director – DoE
Prof. Dr. Kishor Shrestha, Coordinator – CERID
Mr. Raju Manandhar, Researcher – CERID
Research Team
Prof. Dr. Krishna Chandra Sharma – Reviewer and Editor
Prof. Dr. Kishor Shrestha – Coordinator
Mr. Raju Manandhar – Researcher
Mr. Rom Prasad Bhattarai – Associate Researcher
Dr. Binod Luitel - Consultant
Data Management and Field Research
Mr. Purushottam Manandhar
Ms. Anjana Rajbhandari
Mr. Amul Raj Upreti
Administrative and Logistic Support
Ms. Rekha K.C.
Ms. Sabita Mishra
Mr. Hari Krishna Shrestha
Mr. Bhakta Bahadur Shrestha
ii
Acronyms and Abbreviations
CERID Research Centre for Educational Innovation and Development
DoE Department of Education
EFA Education for All
FRP Formative Research Project
GoN Government of Nepal
LongSIS Longitudinal Study on System Indicators
MoE Ministry of Education
MS Micro Soft
PTA Parent Teacher Association
SIP School Improvement Plan
SSRP School Sector Reform Plan/Program
iii
Executive Summary
Government of Nepal implemented School Sector Reform Program (SSRP) 2009-2015 in
Nepal through Ministry of Education/ Department of Education. Formative Research
Project (FRP) for School Sector Reform Program (SSRP) has been commenced jointly by
Department of Education (DoE) and Research Centre for Educational Innovation and
Development (CERID), Tribhuvan University. In this context, Longitudinal Study on
System Indicators (LongSIS) is a part of the project has been continued since the
inception of the porject.
The enrolment of students as new entrants in Grade I was in a decreasing trend for last
few years. It can be clearly seen that the flow of the students from Grade I to Grade II
appears to be the most difficult hurdle for all the cohorts as it shows the lowest flow.
The percentage of students reaching Grade V, Grade VIII and Grade X in subsequent
years without repeating any grades was found around twenty, eleven and eight percent
irrespective of the school leaving students. The percentage of girl students reaching to
these grades in the subsequent years was higher than boys.
The academic qualification of the majority of teachers was Bachelor and above.
Per student classroom space was in par with the government norms in the beginning years
of the study; however, decreasing trend of student enrolments has increased per student
classroom space in the sample schools.
iv
Acknowledgements
Longitudinal Study on System Indicators is the continuation of the studies that has been
conducted for Ministry of Education/Department of Education since the year 2002 under
Formative Research Project for School Sector Reform Program. The study has so far
conducted analysis on various indicators defined in close collaboration with the
MoE/DoE and the study team, since the commencement of the study in 2002. The
information provided by the study to MoE/DoE has been found to be very relevant in
order to facilitate its process of planning, implementing, monitoring and managing SSRP
programs.
I would like to take the privilege to thank and acknowledge on behalf of the study team of
CERID for the continuous collaboration and valuable support of all the head teachers and
teachers of the sample schools for the role they have played in collecting and ensuring the
quality of data.
My sincere thanks are due to Dr. Dilli Ram Rimal, Director General, Ms. Dev Kumari
Guragain, Director, Planning Division and Mr. Kewali Ram Adhikari, Deputy Director of
DoE for their support in successfully completing this study.
Last but not the least, I would like to appreciate and thank entire research team and
administrative staff of CERID for their unceasing support and commitments towards the
study.
Prof. Dr. Krishna Chandra Sharma
Executive Director
July, 2015
v
Table of Contents
Acronyms and Abbreviations ............................................................................................................ i
Executive Summary ........................................................................................................................ iii
Acknowledgements ......................................................................................................................... iv
Table of Contents ............................................................................................................................. v
List of Tables ................................................................................................................................... vi
List of Figures ................................................................................................................................. vi
Chapter I: Introduction .................................................................................................................. 1
Background .................................................................................................................................. 1
Objectives ..................................................................................................................................... 2
Chapter II: Methodology............................................................................................................. 3
Sample ...................................................................................................................................... 3
Tools ......................................................................................................................................... 3
Photographs of Students ............................................................................................................... 4
Orientation ................................................................................................................................ 4
Process of data collection ............................................................................................................. 5
Limitations.................................................................................................................................... 6
Chapter III: Students Flow from 2002 to 2014 ............................................................................ 7
New Entrants Student Enrolment Trend in Grade I ..................................................................... 7
Student Cohort Flow up to Grade V ............................................................................................. 8
Student Cohorts flow up to Grade V by Sex ................................................................................ 9
Student Cohort Flow up to Grade VIII ....................................................................................... 10
Student Cohorts flow up to Grade VIII by Sex .......................................................................... 11
Student Cohort Flow up to Grade X ........................................................................................... 12
Student Cohorts flow up to Grade X by Sex .............................................................................. 13
Chapter IV: Trend Analysis of some of the Indicators of SSRP ................................................ 14
Trend of Student Enrolment from 2002 to 2014 .................................................................... 14
Changes in per Student Classroom Space in sample schools ................................................. 15
Changes found on the status of Teachers Qualification ......................................................... 16
Chapter V: Findings and Recommendation .............................................................................. 17
Findings ...................................................................................................................................... 17
Recommendations ...................................................................................................................... 17
References ...................................................................................................................................... 19
Annex ............................................................................................................................................. 21
vi
List of Tables
Table 1: Number of Sample Schools by District and Stratum.......................................................... 3
Table 2: Data Collected till 2014 ...................................................................................................... 5
Table 3: Student Cohort Flow up to Grade V ................................................................................... 8
Table 4: Student Cohort Flow up to Grade VIII ............................................................................. 10
List of Figures
Figure 1: Trend of New Entrants in Grade I ..................................................................................... 7
Figure 2: Percentage of students reaching Grade V by Cohort year ................................................ 8
Figure 3: Percentage of students reaching Grade V by cohort and sex .......................................... 10
Figure 4: Percentage of students reaching Grade VIII by Cohort year .......................................... 11
Figure 5: Percentage of students reaching Grade VIII by cohort and sex ...................................... 12
Figure 6: Student Cohort Flow up to Grade X ............................................................................... 12
Figure 7: Percentage of students reaching Grade X by Cohort year .............................................. 13
Figure 8: Percentage of students reaching Grade X by cohort and sex .......................................... 13
Figure 9: Enrolment of students in primary grades ........................................................................ 14
Figure 10: Per student classroom space .......................................................................................... 15
Figure 11: Teacher Qualification .................................................................................................... 16
1
Chapter I: Introduction
Background
School Sector Reform Plan (SSRP) 2009-2015 document of the Ministry of Education,
Government of Nepal have stated that “The experiences gained from the Formative
Research conducted by CERID and other research institutions during EFA
implementation have provided a basis for the continuation and expansion of these types
of activities in the SSR program. Formative Research will be continued and used to
support the GoN/MoE in making informed policy decisions.” (p.51). The successful
implementation of Formative Research Project (FRP) and the support it has provided in
the successful implementation of EFA has further prompted the Government of Nepal to
continue FRP in the implementation of SSRP.
Longitudinal Study on System Indicators (LongSIS) is one of the major components of
FRP. The study started in the year 2002 with sixty two sample schools from sixteen
districts as sixteen stratums of Nepal representing three geographical and five
development regions. CERID has been conducting this study continuously since the year
2002. LongSIS as the only research component of FRP for SSRP that has been continued
by CERID jointly with DoE since 2011. In the year 2011-12, the study has been limited to
only three districts representing three geographical regions. However, in the year 2012-13
DoE increased the number of sample districts to five, representing five development
regions as well as three geographical regions of Nepal as suggested by CERID and
recognized the importance of the study findings. The number of sample districts has
remained the same till date.
The study although is limited to five districts it has revealed interesting and useful data
and information on various aspects and indicators of the SSRP as being implemented in
the country. It provided statistical data and a basis for trend analysis. The indicators
included are: brief student profile, listing name, sex, age, social group, enrolment,
promotion, and dropout. FRP has been conducting cohort analysis of students enrolled at
grade one in the year 2002 and the subsequent years using this data. LongSIS has also
been providing cross variable analyses relating to different indicators. The study has
provided quantitative database information to facilitate the smooth implementation of
SSRP by generating research based information for progress monitoring and critical
understanding of the issues for strategic policy revisions.
2
This study features software for keeping the record of information of students' enrolment,
retention, promotion, attendance and achievement, information on teachers' qualification,
training and experiences, and background of the parents since 2002. The collected data
are computerized and organised in MS Access program. The study has utilized these data
and information for trend and cohort analysis. The students are followed up by using
student tracking system and providing Student ID for each student in the sample schools.
The unique student ID will be generated by the software as the new student is entered in
the system to avoid the duplication of the students. The software can also incorporate the
photograph of each student and teacher in the database.
Objectives
The main objective of the LongSIS under FRP for SSRP is to generate research based
strategic information on selected SSRP indicators for the MoE/DoE to monitor the
progress.
The specific objectives are:
To collect information on basic indicators of SSRP from sample schools included
in 2014
To find out internal efficiency of school system by using Cohort Analysis of 2014.
To provide research-based updated information on basic indicators to MoE/DoE
for monitoring of the attainment regarding the set targets of SSRP.
To establish a model computerized database system for student tracking.
3
Chapter II: Methodology
Individual student tracking study is the first of its kind in Nepal. The study attempted to
do the cohort analysis by giving eleven digit unique students ID to each individual student
of sample schools. The data have been collected from 15 schools of the five districts.
Sample
The sample districts and schools included in the previous years will continue to be the
sources of the LongSIS data for this year as they constitute important grids that
strategically cover the geographical diversities in the country. The list of sample districts
and number of schools by development and geographical regions is given below.
Table 1: Number of Sample Schools by District and Stratum
SN District Development
Region
Geographical
Region
Number of sample
schools
1 Dhankuta Eastern Hill 2
2 Rasuwa Central Mountain 3
3 Syangja Western Hill 4
4 Banke Mid-Western Tarai 3
5 Dadeldhura Far-Western Hill 3
Total 15
Tools
The laptop computers were used in order to gather the information directly from the
schools. The information was directly computerized in the software installed in laptops of
the field researchers.
The information was collected in these four categories:
1. School Information Form: This form captures the general information of the
sample school. The location, address, type of school, number of students in all
grades, classroom size, etc. are included in this form.
2. Student Information Form: The student information form includes the basic
information of the students, their caste/ethnicity, information about their parents,
monthly attendance, final achievement scores obtained and the status in the final
school examination.
3. Teacher Information Form: This form contains basic information of the teacher
of the sample school. The information on the work experience, level, training,
attendance, etc. of the teachers was collected in this form.
4
4. School Finance and other Information Form: The information on library,
income and expenditure, SIP, PTA, VEC, and school visits by different personnel
was collected in this form.
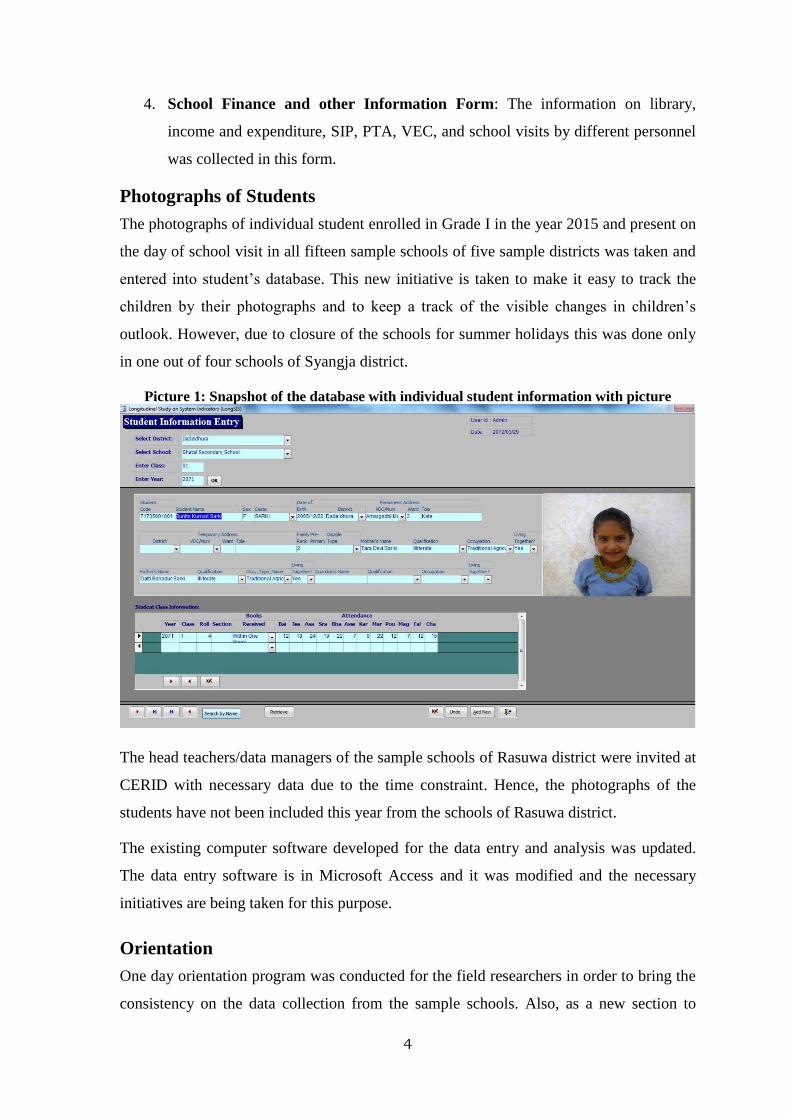
Photographs of Students
The photographs of individual student enrolled in Grade I in the year 2015 and present on
the day of school visit in all fifteen sample schools of five sample districts was taken and
entered into student’s database. This new initiative is taken to make it easy to track the
children by their photographs and to keep a track of the visible changes in children’s
outlook. However, due to closure of the schools for summer holidays this was done only
in one out of four schools of Syangja district.
Picture 1: Snapshot of the database with individual student information with picture
The head teachers/data managers of the sample schools of Rasuwa district were invited at
CERID with necessary data due to the time constraint. Hence, the photographs of the
students have not been included this year from the schools of Rasuwa district.
The existing computer software developed for the data entry and analysis was updated.
The data entry software is in Microsoft Access and it was modified and the necessary
initiatives are being taken for this purpose.
Orientation
One day orientation program was conducted for the field researchers in order to bring the
consistency on the data collection from the sample schools. Also, as a new section to
5
include the photographs of the students of Grade I in the database, the technique of taking
photographs was also oriented to the field researchers.
Process of data collection
In order to assure that the schools take the ownership of and control over the process and
the product of collecting and analyzing the data of individual students, the school
authorities were involved during data collection and data management activities at school
level.
The data was collected from the schools for the academic session of the year 2014, which
includes school information, student information, teacher information and financial as
well as other necessary information.
The head teachers/data managers from three sample schools of Rasuwa districts were
invited at CERID for the data collection. The field visit to this district was not possible
due to the time constraint, however, inviting the head teachers/data managers from the
sample schools of Rasuwa reminded the cluster level data collection workshops that were
used to be conducted in previous years.
The collected data was entered in the data entry software by the field researcher in the
field itself using their laptops in order to ensure the quality of the data.
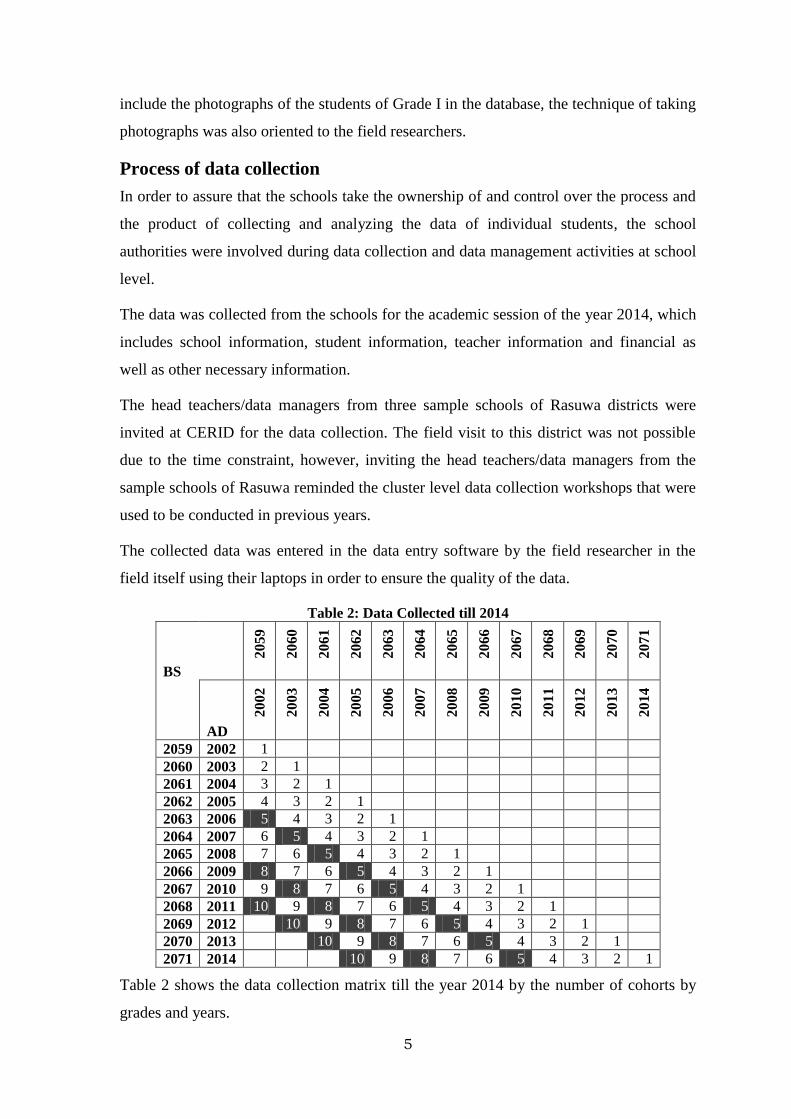
Table 2: Data Collected till 2014
BS
2059
2060
2061
2062
2063
2064
2065
2066
2067
2068
2069
2070
2071
AD
2002
2003
2004
2005
2006
2007
2008
2009
2010
2011
2012
2013
2014
2059 2002 1
2060 2003 2 1
2061 2004 3 2 1
2062 2005 4 3 2 1
2063 2006 5 4 3 2 1
2064 2007 6 5 4 3 2 1
2065 2008 7 6 5 4 3 2 1
2066 2009 8 7 6 5 4 3 2 1
2067 2010 9 8 7 6 5 4 3 2 1
2068 2011 10 9 8 7 6 5 4 3 2 1
2069 2012 10 9 8 7 6 5 4 3 2 1
2070 2013 10 9 8 7 6 5 4 3 2 1
2071 2014 10 9 8 7 6 5 4 3 2 1
Table 2 shows the data collection matrix till the year 2014 by the number of cohorts by
grades and years.
6
There are nine cohorts who have reached to Grade 5 and above, six cohorts reaching
Grade 8 and above and four cohorts reaching Grade 10 and above. The analysis of these
three categories of the cohorts is presented in this report.
Limitations
There are tremendous possibilities for looking into various characteristics of education of
Nepal by using huge amount of information gathered since the year 2002 till date in the
course of this study using other statistical analysis; however, this has not been explored in
this report. As the limitation of time and resources available for the study, comparison has
been made only using a few of the indicators.
7
Chapter III: Students Flow from 2002 to 2014
In the following section, the analysis of nine cohorts of students from 2002 to 2010 who
were enrolled in Grade I and reached Grade V without repeating any grades in five
consecutive years is presented.
Similarly, the analysis of six cohorts of students from the year 2002 to 2007 who were
enrolled in Grade I and reached Grade VIII without repeating any grades in eight
consecutive years is also presented.
And, four cohorts of students enrolled in Grade I in the year 2002 to 2005 and reached
Grade X in ten consecutive years without repeating any grades is presented in this
section.
Only the students who were enrolled in Grade I as fresh new entrants were included and
analysed in this student cohort flow.
The repeater students who were already in Grade I have been excluded from overall
student flow. The school leaving students are not included in the analysis.
New Entrant Student Enrolment Trend in Grade I
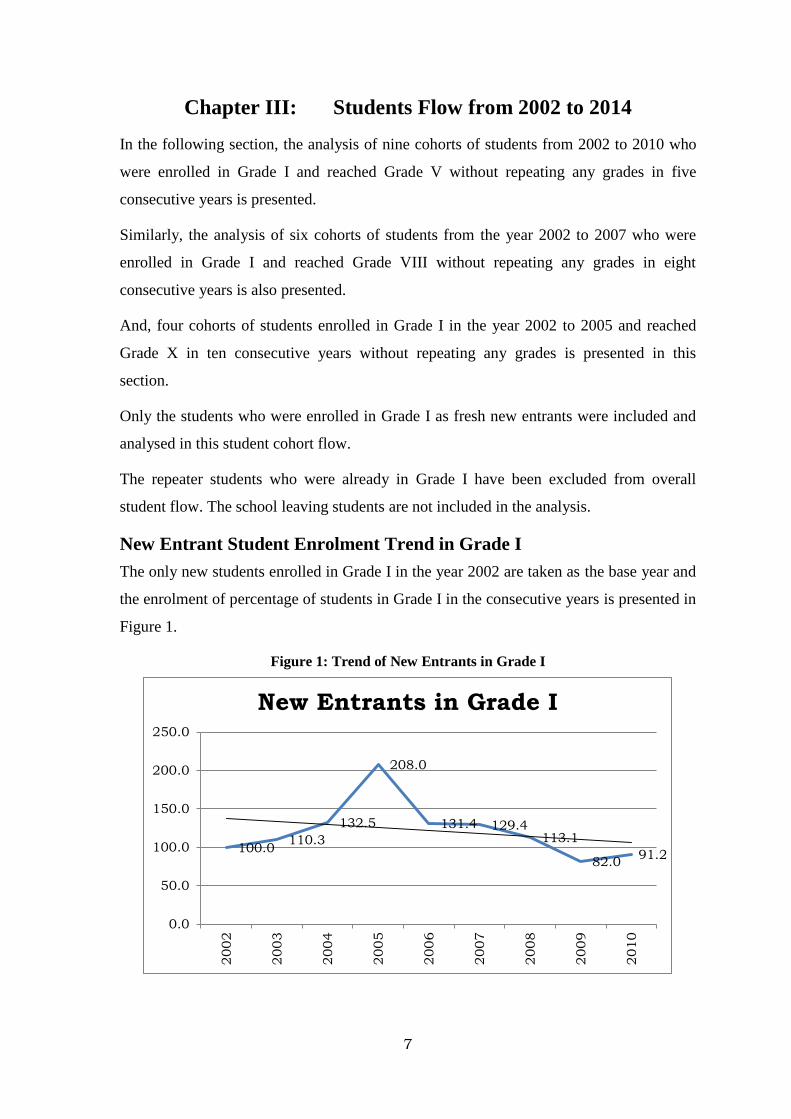
The only new students enrolled in Grade I in the year 2002 are taken as the base year and
the enrolment of percentage of students in Grade I in the consecutive years is presented in
Figure 1.
Figure 1: Trend of New Entrants in Grade I
100.0 110.3
132.5
208.0
131.4 129.4 113.1
82.0 91.2
0.0
50.0
100.0
150.0
200.0
250.0
2002
2003
2004
2005
2006
2007
2008
2009
2010
New Entrants in Grade I
8
Figure 1 shows that the enrolment of students started increasing up to the year 2005. In
this year the student enrolment was more than double of the base year; however the
student enrolment started decreasing since the year 2006.
The trend of new entrants in Grade I started decreasing and it dropped up to 82 percent
compared to base year in the year 2009. The student enrolment was found to be higher in
all the years compared to base year except in the year 2009 and 2010.
Student Cohort Flow up to Grade V
The overall flow of the nine student cohorts, enrolled in Grade I from the year 2002 to
2010 is presented here. All the fifteen school have been included for analysis, since all the
sample schools do have students up to Grade V.
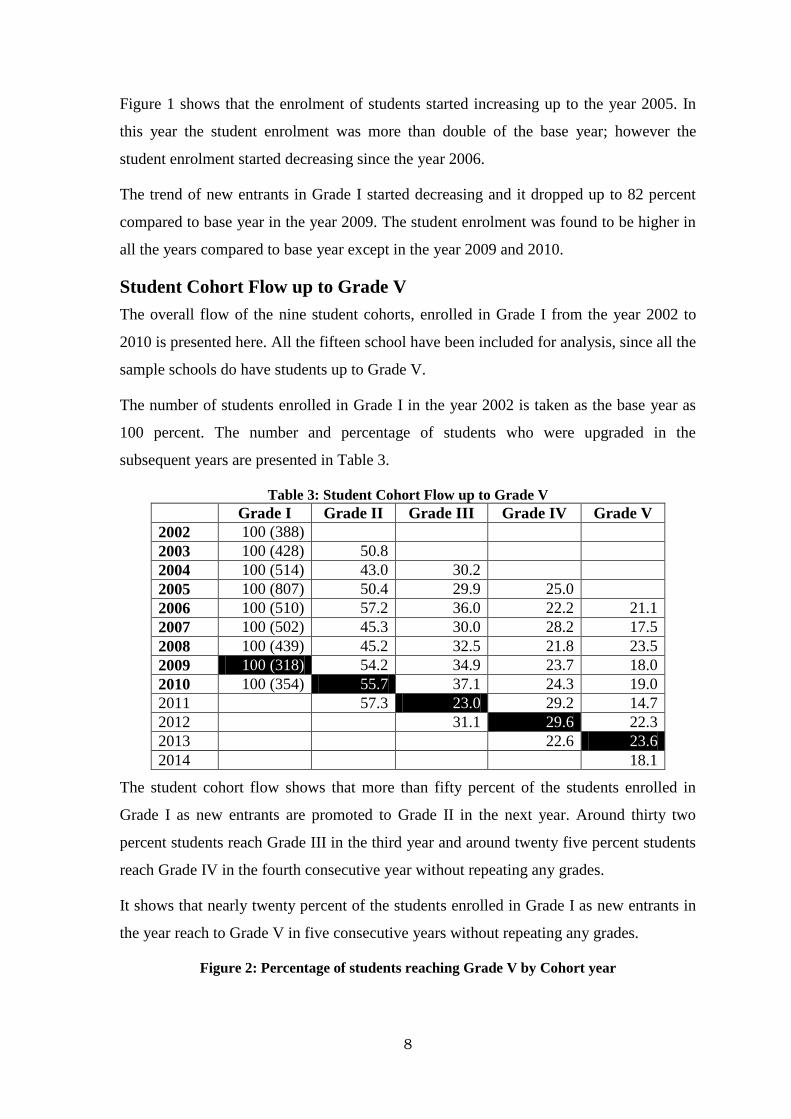
The number of students enrolled in Grade I in the year 2002 is taken as the base year as
100 percent. The number and percentage of students who were upgraded in the
subsequent years are presented in Table 3.
Table 3: Student Cohort Flow up to Grade V
Grade I Grade II Grade III Grade IV Grade V
2002 100 (388)
2003 100 (428) 50.8
2004 100 (514) 43.0 30.2
2005 100 (807) 50.4 29.9 25.0
2006 100 (510) 57.2 36.0 22.2 21.1
2007 100 (502) 45.3 30.0 28.2 17.5
2008 100 (439) 45.2 32.5 21.8 23.5
2009 100 (318) 54.2 34.9 23.7 18.0
2010 100 (354) 55.7 37.1 24.3 19.0
2011 57.3 23.0 29.2 14.7
2012 31.1 29.6 22.3
2013 22.6 23.6
2014 18.1
The student cohort flow shows that more than fifty percent of the students enrolled in
Grade I as new entrants are promoted to Grade II in the next year. Around thirty two
percent students reach Grade III in the third year and around twenty five percent students
reach Grade IV in the fourth consecutive year without repeating any grades.
It shows that nearly twenty percent of the students enrolled in Grade I as new entrants in
the year reach to Grade V in five consecutive years without repeating any grades.
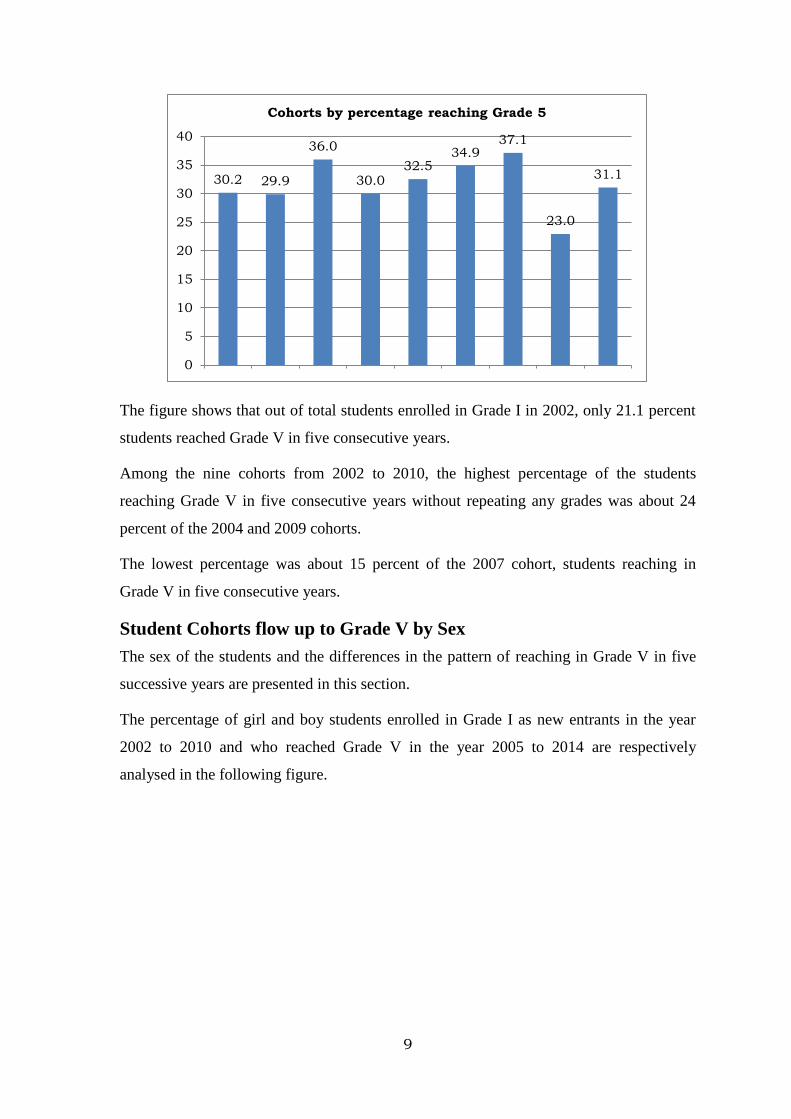
Figure 2: Percentage of students reaching Grade V by Cohort year
9
The figure shows that out of total students enrolled in Grade I in 2002, only 21.1 percent
students reached Grade V in five consecutive years.
Among the nine cohorts from 2002 to 2010, the highest percentage of the students
reaching Grade V in five consecutive years without repeating any grades was about 24
percent of the 2004 and 2009 cohorts.
The lowest percentage was about 15 percent of the 2007 cohort, students reaching in
Grade V in five consecutive years.
Student Cohorts flow up to Grade V by Sex
The sex of the students and the differences in the pattern of reaching in Grade V in five
successive years are presented in this section.
The percentage of girl and boy students enrolled in Grade I as new entrants in the year
2002 to 2010 and who reached Grade V in the year 2005 to 2014 are respectively
analysed in the following figure.
30.2 29.9
36.0
30.0 32.5
34.9 37.1
23.0
31.1
0
5
10
15
20
25
30
35
40
Cohorts by percentage reaching Grade 5
10
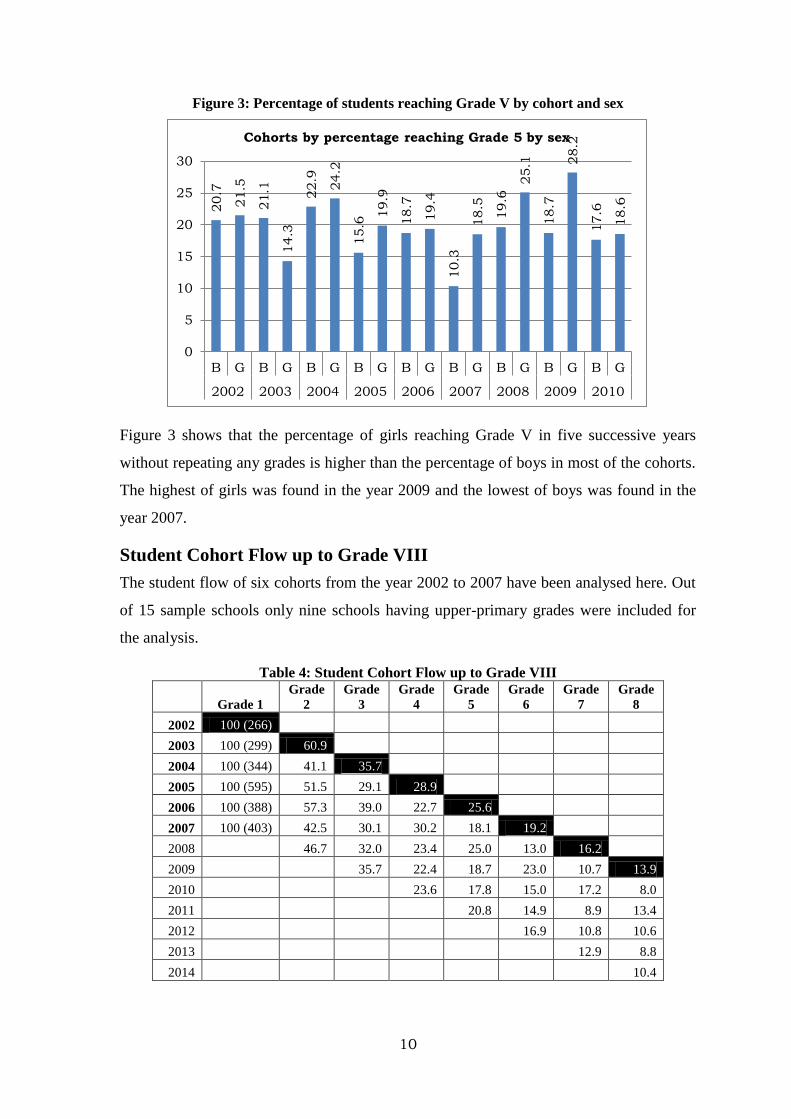
Figure 3: Percentage of students reaching Grade V by cohort and sex
Figure 3 shows that the percentage of girls reaching Grade V in five successive years
without repeating any grades is higher than the percentage of boys in most of the cohorts.
The highest of girls was found in the year 2009 and the lowest of boys was found in the
year 2007.
Student Cohort Flow up to Grade VIII
The student flow of six cohorts from the year 2002 to 2007 have been analysed here. Out
of 15 sample schools only nine schools having upper-primary grades were included for
the analysis.
Table 4: Student Cohort Flow up to Grade VIII
Grade 1
Grade
2
Grade
3
Grade
4
Grade
5
Grade
6
Grade
7
Grade
8
2002 100 (266)
2003 100 (299) 60.9
2004 100 (344) 41.1 35.7
2005 100 (595) 51.5 29.1 28.9
2006 100 (388) 57.3 39.0 22.7 25.6
2007 100 (403) 42.5 30.1 30.2 18.1 19.2
2008
46.7 32.0 23.4 25.0 13.0 16.2
2009
35.7 22.4 18.7 23.0 10.7 13.9
2010
23.6 17.8 15.0 17.2 8.0
2011
20.8 14.9 8.9 13.4
2012
16.9 10.8 10.6
2013
12.9 8.8
2014
10.4
20.7
21.5
21.1
14.3
22.9
24.2
15.6
19.9
18.7
19.4
10.3
18.5
19.6
25.1
18.7
28.2
17.6
18.6
0
5
10
15
20
25
30
B G B G B G B G B G B G B G B G B G
2002 2003 2004 2005 2006 2007 2008 2009 2010
Cohorts by percentage reaching Grade 5 by sex
11
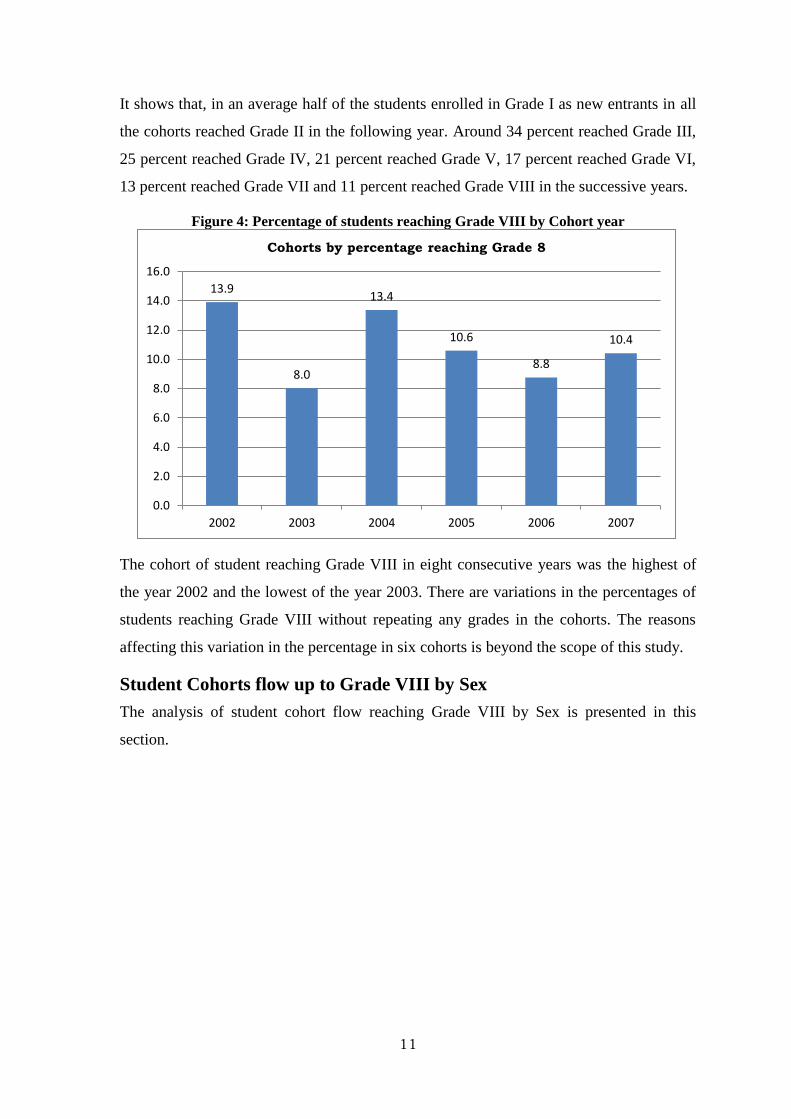
It shows that, in an average half of the students enrolled in Grade I as new entrants in all
the cohorts reached Grade II in the following year. Around 34 percent reached Grade III,
25 percent reached Grade IV, 21 percent reached Grade V, 17 percent reached Grade VI,
13 percent reached Grade VII and 11 percent reached Grade VIII in the successive years.
Figure 4: Percentage of students reaching Grade VIII by Cohort year
The cohort of student reaching Grade VIII in eight consecutive years was the highest of
the year 2002 and the lowest of the year 2003. There are variations in the percentages of
students reaching Grade VIII without repeating any grades in the cohorts. The reasons
affecting this variation in the percentage in six cohorts is beyond the scope of this study.
Student Cohorts flow up to Grade VIII by Sex
The analysis of student cohort flow reaching Grade VIII by Sex is presented in this
section.
13.9
8.0
13.4
10.6
8.8
10.4
0.0
2.0
4.0
6.0
8.0
10.0
12.0
14.0
16.0
2002 2003 2004 2005 2006 2007
Cohorts by percentage reaching Grade 8
12
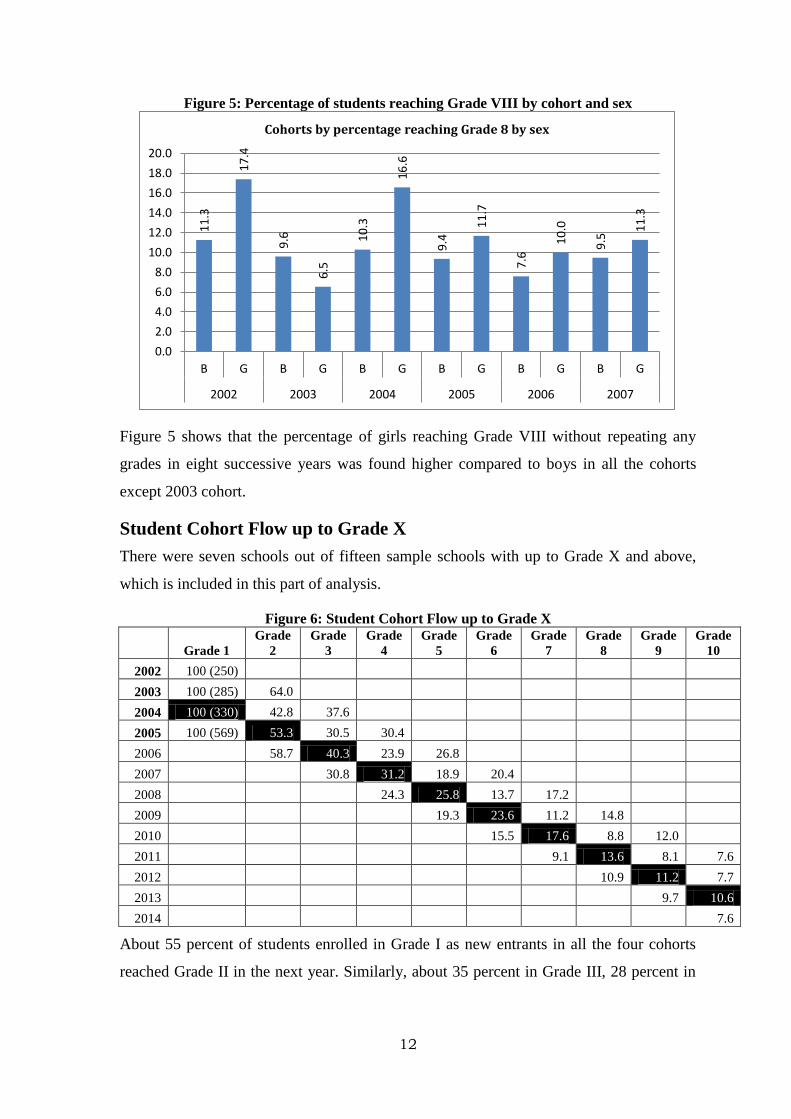
Figure 5: Percentage of students reaching Grade VIII by cohort and sex
Figure 5 shows that the percentage of girls reaching Grade VIII without repeating any
grades in eight successive years was found higher compared to boys in all the cohorts
except 2003 cohort.
Student Cohort Flow up to Grade X
There were seven schools out of fifteen sample schools with up to Grade X and above,
which is included in this part of analysis.
Figure 6: Student Cohort Flow up to Grade X
Grade 1
Grade
2
Grade
3
Grade
4
Grade
5
Grade
6
Grade
7
Grade
8
Grade
9
Grade
10
2002 100 (250)
2003 100 (285) 64.0
2004 100 (330) 42.8 37.6
2005 100 (569) 53.3 30.5 30.4
2006
58.7 40.3 23.9 26.8
2007
30.8 31.2 18.9 20.4
2008
24.3 25.8 13.7 17.2
2009
19.3 23.6 11.2 14.8
2010
15.5 17.6 8.8 12.0
2011
9.1 13.6 8.1 7.6
2012
10.9 11.2 7.7
2013
9.7 10.6
2014
7.6
About 55 percent of students enrolled in Grade I as new entrants in all the four cohorts
reached Grade II in the next year. Similarly, about 35 percent in Grade III, 28 percent in
11
.3
17
.4
9.6
6.5
10
.3
16
.6
9.4
11
.7
7.6
10
.0
9.5
11
.3
0.0
2.0
4.0
6.0
8.0
10.0
12.0
14.0
16.0
18.0
20.0
B G B G B G B G B G B G
2002 2003 2004 2005 2006 2007
Cohorts by percentage reaching Grade 8 by sex
13
Grade IV, 23 percent in Grade V, 18 percent in grade VI, 14 percent in Grade VII, 12
percent in Grade VIII, 10 percent in Grade IX and 8 percent in Grade X.
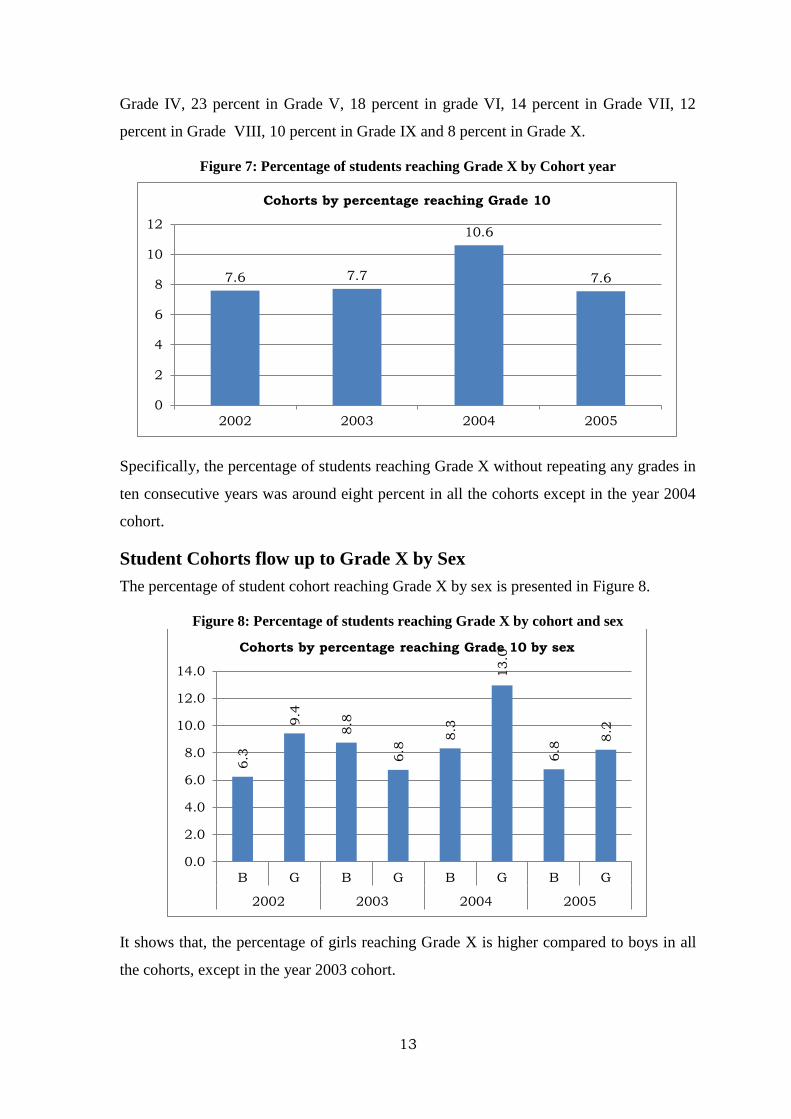
Figure 7: Percentage of students reaching Grade X by Cohort year
Specifically, the percentage of students reaching Grade X without repeating any grades in
ten consecutive years was around eight percent in all the cohorts except in the year 2004
cohort.
Student Cohorts flow up to Grade X by Sex
The percentage of student cohort reaching Grade X by sex is presented in Figure 8.
Figure 8: Percentage of students reaching Grade X by cohort and sex
It shows that, the percentage of girls reaching Grade X is higher compared to boys in all
the cohorts, except in the year 2003 cohort.
7.6 7.7
10.6
7.6
0
2
4
6
8
10
12
2002 2003 2004 2005
Cohorts by percentage reaching Grade 10
6.3
9.4
8.8
6.8
8.3
13.0
6.8
8.2
0.0
2.0
4.0
6.0
8.0
10.0
12.0
14.0
B G B G B G B G
2002 2003 2004 2005
Cohorts by percentage reaching Grade 10 by sex
14
Chapter IV: Trend Analysis of some of the Indicators of
SSRP
The Trend Analysis of some of the indicators of SSRP is presented in this chapter. The
study was initiated in the year 2002. In the given report the trend of the indicators is
presented from the year 2002 to 2014.
Trend of Student Enrolment from 2002 to 2014
The year 2002 is the base year for the trend analysis. It has been started by taking 100
percent in the base year and different percentages of other years are calculated
accordingly. In this section the trend analysis of some pertinent indicators has been done
over a period of time from 2002 to 2014.
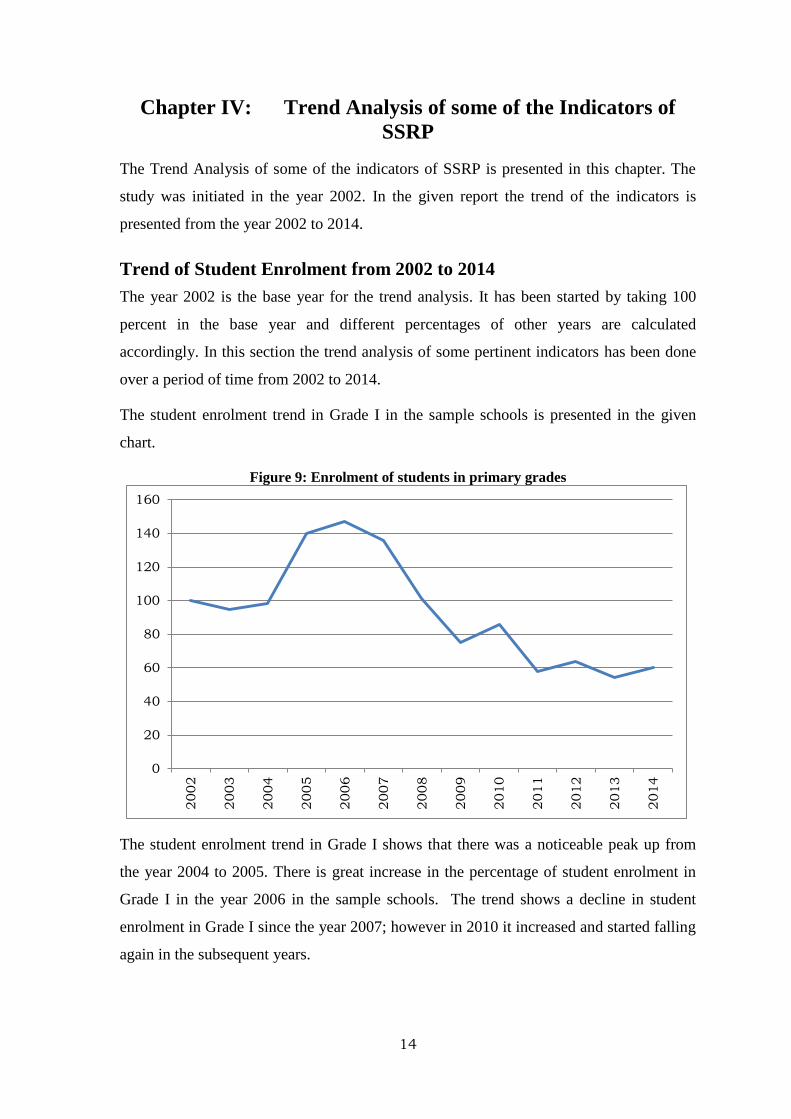
The student enrolment trend in Grade I in the sample schools is presented in the given
chart.
Figure 9: Enrolment of students in primary grades
The student enrolment trend in Grade I shows that there was a noticeable peak up from
the year 2004 to 2005. There is great increase in the percentage of student enrolment in
Grade I in the year 2006 in the sample schools. The trend shows a decline in student
enrolment in Grade I since the year 2007; however in 2010 it increased and started falling
again in the subsequent years.
0
20
40
60
80
100
120
140
160
2002
2003
2004
2005
2006
2007
2008
2009
2010
2011
2012
2013
2014
15
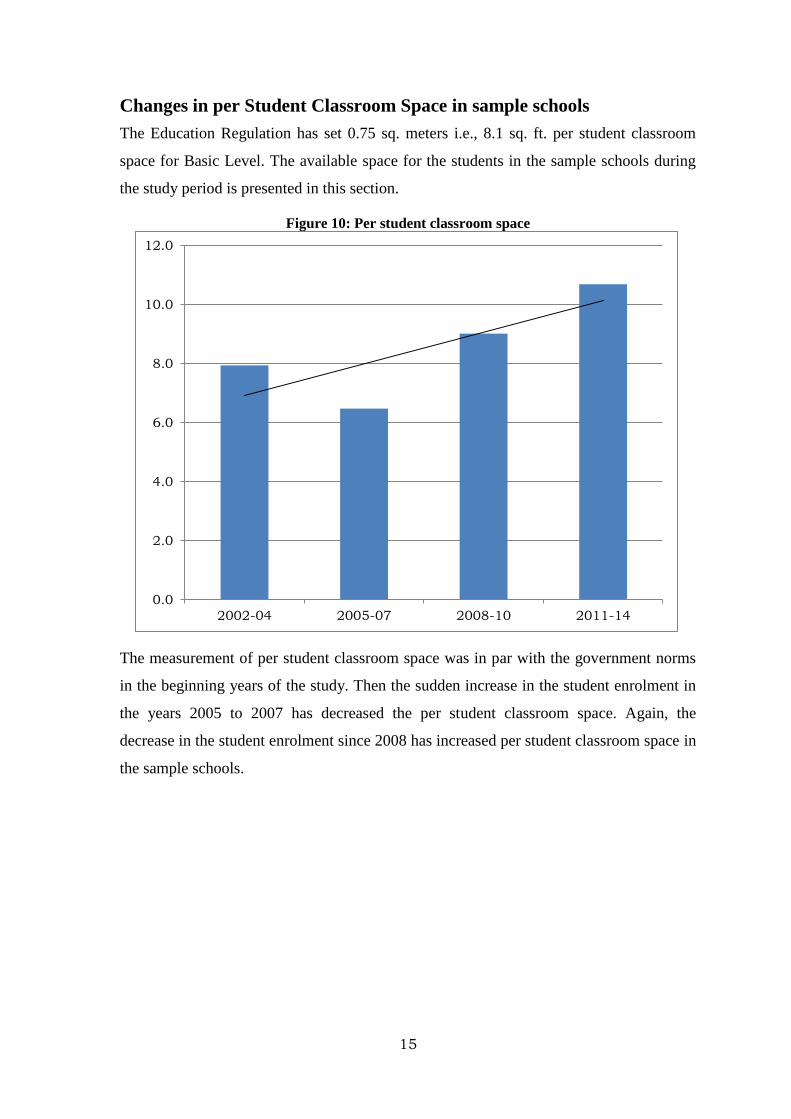
Changes in per Student Classroom Space in sample schools
The Education Regulation has set 0.75 sq. meters i.e., 8.1 sq. ft. per student classroom
space for Basic Level. The available space for the students in the sample schools during
the study period is presented in this section.
Figure 10: Per student classroom space
The measurement of per student classroom space was in par with the government norms
in the beginning years of the study. Then the sudden increase in the student enrolment in
the years 2005 to 2007 has decreased the per student classroom space. Again, the
decrease in the student enrolment since 2008 has increased per student classroom space in
the sample schools.
0.0
2.0
4.0
6.0
8.0
10.0
12.0
2002-04 2005-07 2008-10 2011-14
16
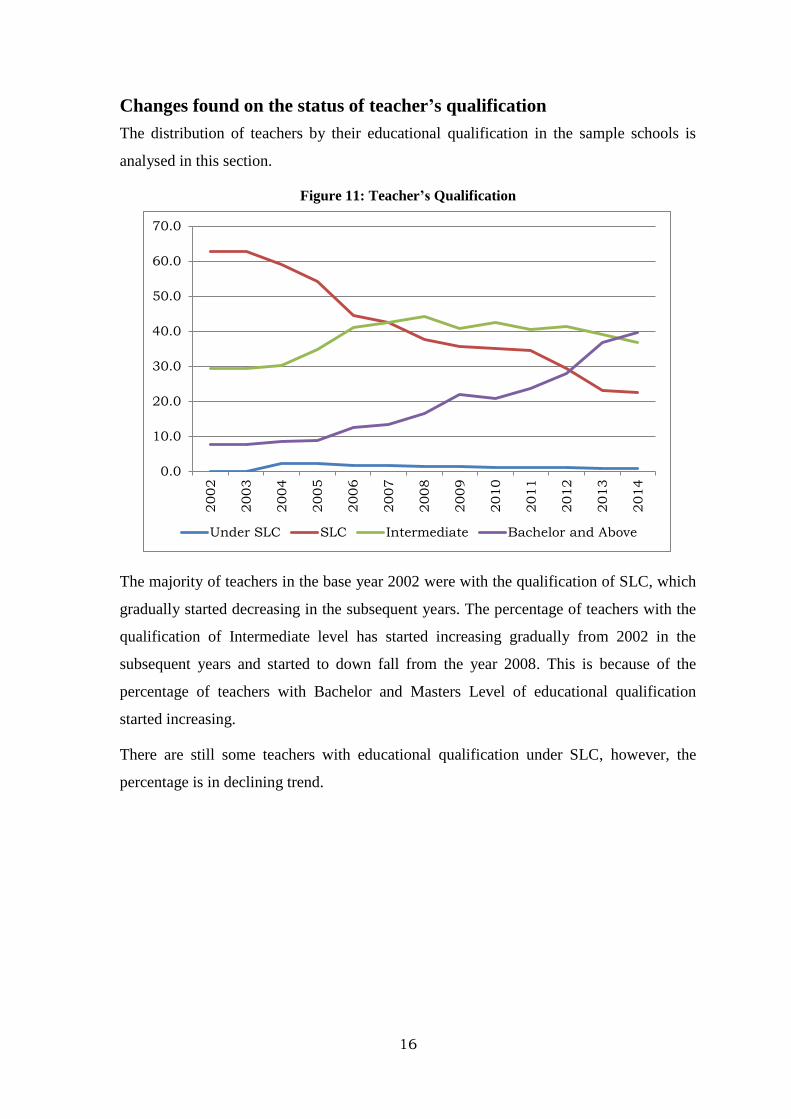
Changes found on the status of teacher’s qualification
The distribution of teachers by their educational qualification in the sample schools is
analysed in this section.
Figure 11: Teacher’s Qualification
The majority of teachers in the base year 2002 were with the qualification of SLC, which
gradually started decreasing in the subsequent years. The percentage of teachers with the
qualification of Intermediate level has started increasing gradually from 2002 in the
subsequent years and started to down fall from the year 2008. This is because of the
percentage of teachers with Bachelor and Masters Level of educational qualification
started increasing.
There are still some teachers with educational qualification under SLC, however, the
percentage is in declining trend.
0.0
10.0
20.0
30.0
40.0
50.0
60.0
70.0
2002
2003
2004
2005
2006
2007
2008
2009
2010
2011
2012
2013
2014
Under SLC SLC Intermediate Bachelor and Above
17
Chapter V: Findings and Recommendations
The conclusions based on the findings and recommendations of the study are presented in
this section. The overall recommendations based on the major findings from both cohort
and trend analysis is presented.
Findings
The student enrolment as new entrants in Grade I is in decreasing trend in comparison to
the previous years.
The flow of the students shows that Grade I to Grade II appears to be the most difficult
hurdle for all the cohorts, with the lowest flow.
The percentage of students reaching Grade V without repeating any grades in five
subsequent years was found around twenty percent irrespective of the school leaver
students.
Generally, the percentage of girl students reaching Grade V in five subsequent years was
higher than boys.
Among the students enrolled as new entrants, around eleven percent reached Grade VIII
in eight subsequent years and this percentage is higher of girls compared to boys.
It was found that around eight percent of students enrolled in Grade I as new entrants
reached Grade X in ten successive years without repeating any grades. The school leaver
students, who might have enrolled in other schools, were excluded in this analysis. The
percentage of girl student is higher compared to boy students.
The intake of students in Grade I shows a decreasing trend.
The academic qualification of the teachers was found more towards the Bachelor and
above.
Per student classroom space was in par with the government norms in the beginning years
of the study; however decreasing trend of student enrolments has increased per student
classroom space in the sample schools.
Recommendations
The stakeholders should take ownership of the data generated in the schools and use it for
planning. The school level data keeping and the data analysis need to be consistent in all
18
the schools. The school level data keeping system needs to be strengthened at the school
level for analysis, reporting and their use.
The characteristics of the schools and students such as physical facilities,
qualification/training of teachers, sex, attendance, achievement scores, student family
background, etc. need to be statistically analyzed in order to enhance the internal
efficiency of schools education. This will provide research based information to the
policy makers.
Further Issues
The study design was initiated in the 2002 and still the study is following the same
methodology, however the context has change in the present time. The indicators were
revised during the initial phase of EFA, therefore the 43 indicators needs to be reviewed
and revised.
The data has been collected from 13 cohorts by 2014 and each year data is collected for a
new cohort. Hence, there should be a clear vision on the limitation of the number of
cohorts.
Similarly, the students of the initial four cohorts have completed Grade X and data has
been collected. There are sample schools where the students of these cohorts are doing
their higher studies in higher secondary level; also some cohorts have passed out the
school level and perusing their higher studies in colleges. The cohort study demands the
tracer studies of those students; therefore there should be clarity on the limitation on the
study design.
As a part of this study, a set co computer, printer and UPS were provided to 62 sample
schools of 16 sample districts on Nepal in 2010 in order to make the schools capable in
record keeping system and use of data for the school itself. Therefore, there should be a
follow-up mechanism and further trainings.
19
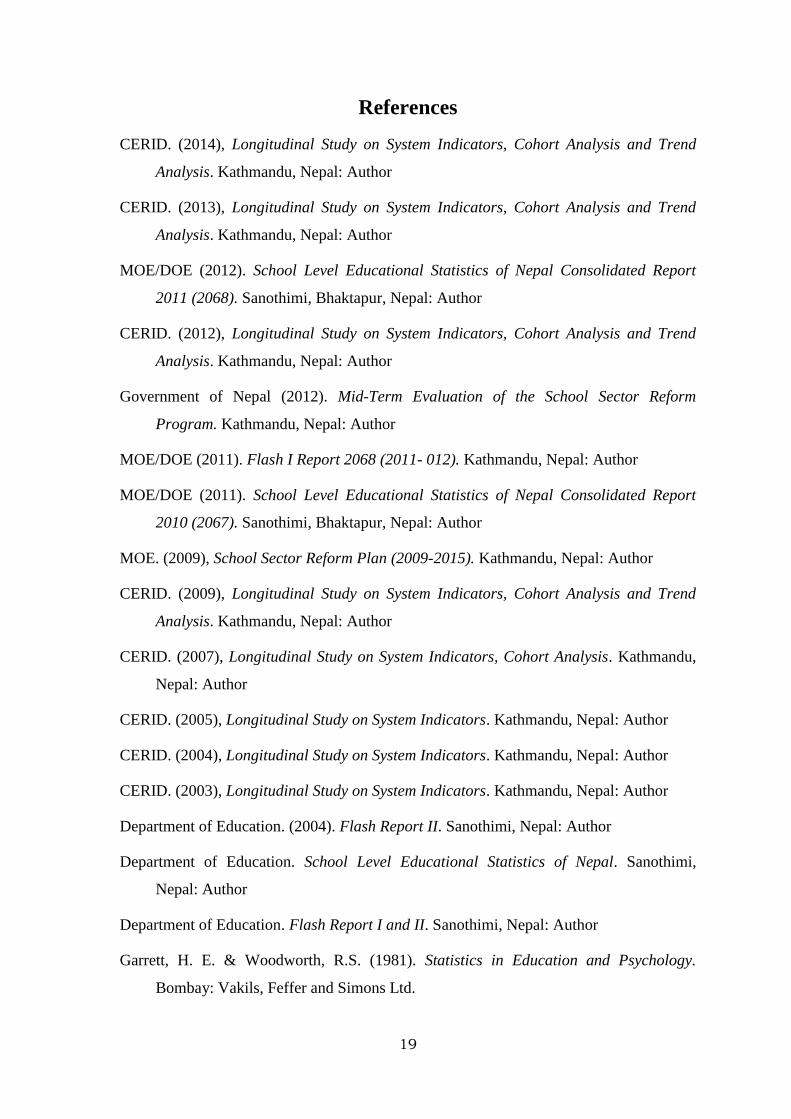
References
CERID. (2014), Longitudinal Study on System Indicators, Cohort Analysis and Trend
Analysis. Kathmandu, Nepal: Author
CERID. (2013), Longitudinal Study on System Indicators, Cohort Analysis and Trend
Analysis. Kathmandu, Nepal: Author
MOE/DOE (2012). School Level Educational Statistics of Nepal Consolidated Report
2011 (2068). Sanothimi, Bhaktapur, Nepal: Author
CERID. (2012), Longitudinal Study on System Indicators, Cohort Analysis and Trend
Analysis. Kathmandu, Nepal: Author
Government of Nepal (2012). Mid-Term Evaluation of the School Sector Reform
Program. Kathmandu, Nepal: Author
MOE/DOE (2011). Flash I Report 2068 (2011- 012). Kathmandu, Nepal: Author
MOE/DOE (2011). School Level Educational Statistics of Nepal Consolidated Report
2010 (2067). Sanothimi, Bhaktapur, Nepal: Author
MOE. (2009), School Sector Reform Plan (2009-2015). Kathmandu, Nepal: Author
CERID. (2009), Longitudinal Study on System Indicators, Cohort Analysis and Trend
Analysis. Kathmandu, Nepal: Author
CERID. (2007), Longitudinal Study on System Indicators, Cohort Analysis. Kathmandu,
Nepal: Author
CERID. (2005), Longitudinal Study on System Indicators. Kathmandu, Nepal: Author
CERID. (2004), Longitudinal Study on System Indicators. Kathmandu, Nepal: Author
CERID. (2003), Longitudinal Study on System Indicators. Kathmandu, Nepal: Author
Department of Education. (2004). Flash Report II. Sanothimi, Nepal: Author
Department of Education. School Level Educational Statistics of Nepal. Sanothimi,
Nepal: Author
Department of Education. Flash Report I and II. Sanothimi, Nepal: Author
Garrett, H. E. & Woodworth, R.S. (1981). Statistics in Education and Psychology.
Bombay: Vakils, Feffer and Simons Ltd.
20
http://www.uis.unesco.org/i_pages/indspec/cohorte.htm
21
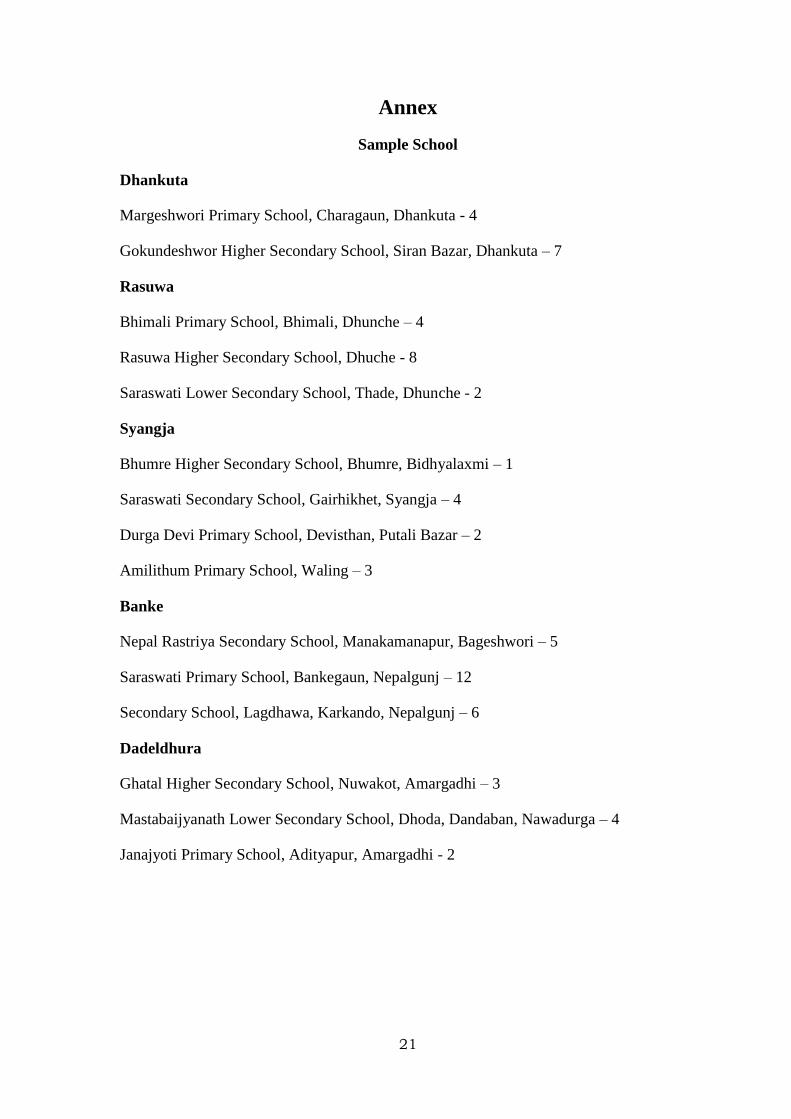
Annex
Sample School
Dhankuta
Margeshwori Primary School, Charagaun, Dhankuta - 4
Gokundeshwor Higher Secondary School, Siran Bazar, Dhankuta – 7
Rasuwa
Bhimali Primary School, Bhimali, Dhunche – 4
Rasuwa Higher Secondary School, Dhuche - 8
Saraswati Lower Secondary School, Thade, Dhunche - 2
Syangja
Bhumre Higher Secondary School, Bhumre, Bidhyalaxmi – 1
Saraswati Secondary School, Gairhikhet, Syangja – 4
Durga Devi Primary School, Devisthan, Putali Bazar – 2
Amilithum Primary School, Waling – 3
Banke
Nepal Rastriya Secondary School, Manakamanapur, Bageshwori – 5
Saraswati Primary School, Bankegaun, Nepalgunj – 12
Secondary School, Lagdhawa, Karkando, Nepalgunj – 6
Dadeldhura
Ghatal Higher Secondary School, Nuwakot, Amargadhi – 3
Mastabaijyanath Lower Secondary School, Dhoda, Dandaban, Nawadurga – 4
Janajyoti Primary School, Adityapur, Amargadhi - 2