Embed Size (px)
Citation preview

FORMULA OPTIMIZATION ON MATCHA BUTTER:
A RESPONSE SURFACE METHODOLOGY STUDY
By
YAP KAH SHING
A project report submitted to the Department of Agricultural and Food Science
Faculty of Science
University Tunku Abdul Rahman
In partial fulfilment of the requirements for the degree of
Bachelor of Science (Hons) Food Science
September 2017

ii
ABSTRACT
FORMULA OPTIMIZATION ON MATCHA BUTTER:
A RESPONSE SURFACE METHODOLOGY STUDY
Yap Kah Shing
Response surface methodology (RSM) combined with three variables (matcha
powder, salt, sugar) at three levels (-1, 0, +1) under Box-Behnken design was
used to optimize the matcha butter based on color matching and sensory
evaluation. Butter was churned from 36 % milk fat at 15.6 C to ensure its high
fat and low moisture level. The amount of matcha powder, salt and sugar were
added according to the design of Box Behnken model in order to produce 15
matcha butters. The color profile of each matcha butter (L*,a*,b*) was
determined using colorimeter, while the differences in lightness (∆L*) between
the lightness of matcha butters (L*) and lightness of premium matcha (Lstandard*)
were calculated. The lightness difference (∆L*) was set to minimum during
optimization to match the lightness profile of premium matcha powder. Sensory
evaluations (color, appearance, taste, mouthfeel, overall acceptability) of 15
matcha butters were done using 9 points hedonic scale on 25 untrained panelists.
JMP software was used in analysing the significance of responds. In addition,
determination of optimum matcha butter was done by maximizing sensory
scores and minimizing the difference in lightness (∆L*). Based on the
investigation, formula of optimized matcha butter was 10, 3.6 and 7 g respective
to matcha powder, salt and sugar. Besides, differences in lightness (∆L*), color

iii
and taste had significant impact on the color matching and sensory evaluation.
Therefore, three dimensional response surface graphs were created to study the
interactive effects between two variables simultaneously on differences in
lightness (∆L*), color, and taste. As for profiling purpose, optimized butter
contains 12.42 % ± 0.035 moisture and 78.12 ± 0.75 % fat. Temperature sweep
was done by heating the matcha butter from 5 to 40 C and then cooled to 5 C.
Storage and loss modules showed elastic behavior and indicated an overall
melting of matcha butter at 18 C.

iv
ACKNOWLEDGEMENTS
First and foremost, I would like to express my very great appreciation to my
project supervisor, Mr. Chung Kok Heung for giving me freedom to decide the
project title. His expertise in product optimization has helped me a lot throughout
the project. I am also grateful to Dr. Phuah Eng Tong, lecturer, in the Department
of Agriculture and Food Science. I am extremly thankful and indebted to him for
sharing expertise, and sincere and valuable guidance and encouragement
extended to me.
I place on record, my sincere thank you to Kang Kah How, for his helps and
continuous encouragement. This work would not have been possible without his
support. Also, I would like to take this opportunity to express gratitude to all of
the Department faculty members for their help and support.
Finally, I thank my parents and siblings for the unceasing encouragement,
support and attention. To them I say “No matter how old I get, I always want my
family when I don’t feel good. Thank you for being there when I need you the
most”.

v
DECLARATION
I hereby declare that the project report is based on my original work except for
quotations and citations which have been duly acknowledge. I also declare that
it has not been previously or concurrently submitted for any other degree at
UTAR or other institutions.
____________________
(YAP KAH SHING)

vi
APPROVAL SHEET
The project report entitled “FORMULA OPTIMIZATION ON MATCH
BUTTER: A RESPONSE SURFACE METHODOLOGY STUDY” was
prepared by YAP KAH SHING and submitted as partial fulfilment of the
requirements for the degree of Bachelor of Science (Hons) Food Science at
Universiti Tunku Abdul Rahman.
Approved by:
__________________
Date:
Mr. Chung Kok Heung
Supervisor
Department of Agricultural and Food Science
Faculty of Science
Universiti Tunku Abdul Rahman

vii
FACULTY OF SCIENCE
UNIVERSITI TUNKU ABDUL RAHMAN
Date: _____________
PERMISSION SHEET
It is hereby certified that YAP KAH SHING (ID No: 13ADB03520) has
completed this final year project entitled “FORMULA OPTIMIZATION ON
MATCH BUTTER: A RESPONSE SURFACE METHODOLOGY STUDY”
under the supervision of Mr. Chung Kok Heung from the Department of
Agricultural and Food Science, Faculty of Science.
I hereby give permission to the University to upload the softcopy of my final
year project in pdf format into the UTAR Institutional Repository, which may
be made accessible to the UTAR community and public.
Yours truly,
_________________
(YAP KAH SHING)

viii
TABLE OF CONTENTS
ABSTRACT ii
ACKNOWLEDGEMENTS iv
DECLARATION v
APPROVAL SHEET vi
PERMISSION SHEET vii
TABLE OF CONTENTS viii
LIST OF TABLES xii
LIST OF FIGURES xiii
LIST OF EQUATION xv
LIST OF ABBREVIATIONS xvi

ix
CHAPTER PAGE
1 INTRODUCTION 1
1.1 Background 1
1.2 Objectives 3
2 LITERATURE REVIEW 4
2.1 Butter 4
2.1.1 Definition of Butter 4
2.1.2 History of Butter 4
2.1.3 Milk Fat Globule Composition 5
2.1.4 Butter Making Theory 6
2.2 Rheological Properties of Butter 8
2.2.1 Fat Crystallization 9
2.2.2 Polymorphism 10
2.2.3 Crystal Network 11
2.3 Matcha Green Tea 12
2.3.1 Background of Matcha Green Tea 12
2.3.2 Health Benefits of Matcha Green Tea 14
2.3.2.1 Cancer Prevention 14
2.3.2.2 Promote Healthy Heart 15
2.3.2.3 Help in Weight Loss 16

x
2.4 Respond Surface Methodology (RSM) 16
3 MATERIAL AND METHODOLOGY 19
3.1 Box Behnken Design Setup 19
3.2 Experimental Design 21
3.3 Preparation of Matcha Butters 22
3.4 Analysis of Colour on Matcha Butter 23
3.5 Sensory Evaluation on Matcha Butter 24
3.6 Temperature Sweep on Matcha Butter 24
3.7 Determination of Moisture Content on Matcha Butter 25
3.8 Determination of fat content on Matcha Butter 25
4 RESULT 27
4.1 Formulation Optimization 27
4.2 Optimization of Matcha Butter 33
4.3 3D Response Surface Graph 34
4.3.1 3D Response Surface Graph on Colour’s Sensory Score 34
4.3.2 3D Response Surface Graph on Taste’s Sensory Score 37
4.3.3 3D Response Surface Graph on Different in Lightness ∆L 40
4.4 Determination of Moisture Content and Fat Content on
Optimized Matcha Butter 43
4.5 Temperature Sweep on Optimized Matcha Butter 44

xi
5 DISCUSSION 46
5.1 Formula Optimization 46
5.2 Single Factor Evaluation 47
5.2.1 Influence of the Added Amount of Matcha Powder 47
5.2.2 Influence of the Added Amount of Salt 47
5.2.3 Influence of the Added Amount of Sugar 48
5.3 Determination of Moisture Content on Optimized Matcha Butter 49
5.4 Determination of Fat Content on Optimized Matcha Butter 50
5.5 Temperature Sweep on Optimized Matcha Butter 51
5.6 Future Recommendation 53
6 CONCLUSION 54
REFERENCE 56
APPENDIXS 68

xii
LIST OF TABLES
TABLE PAGE
2.1 Box-Behnken Experimental Design of 15 Runs. 18
3.1 Variables in Box–Behnken Design to Produce Matcha Butters. 19
3.2 Randomized Box-Behnken Design. 20
4.1 Results of Lightness (L*), Redness (a*), Yellowness (b*), and Differences
in L* (∆L*) in 15 Samples. 28
4.2 Results of Response Variables in 15 Matcha Butter Samples. 29
4.3 Regression Output from JMP Software of the Response Variable. 32
4.4 Mositure Content and Fat Content of the Optimized Matcha Butter. 43
4.5 Means and Standard Deviation of Storage Modulus (G’), Loss Modulus
(G’’), and Their Logarithms of Optimized Matcha Butter at Different
Temperatures. 44
xiii
LIST OF FIGURES
FIGURE PAGE
2.1 Illustration Diagram of Milk Fat Globule. 6
3.1 The Experimental Design Throughout this Project. 21
4.1 3D Response Surface Graph of the Effect of Matcha Powder and
Salt on Colour Preference. 34
4.2 3D Response Surface Graph of the Effect of Matcha Powder and
Sugar on Colour. 35
4.3 3D Response Surface Graph of the Effect of Sugar and Salt on
Colour. 36
4.4 3D Response Surface Graph of the Effect of Matcha Powder and
Salt on Taste. 37
4.5 3D Response Surface Graph of the Effect of Matcha Powder and
Sugar on Taste. 38
4.6 3D Response Surface Graph of the Effect of Salt and Sugar on
Taste. 39
4.7 3D Response Surface Graph of the Effect of Matcha Powder and
Salt on Difference in Lightness, ∆L*. 40
4.8 3D Response Surface Graph of the Effect of Matcha Powder and
Sugar on Difference in Lightness, ∆ L*. 41

xiv
4.9 3D Response Surface Graphs of the Effect of Salt and Sugar on Difference
in Lightness, ∆L*. 42
4.10 Graph of Temperature Sweep of the Optimized Matcha Butter. 45

xv
LIST OF EQUATIONS
EQUATION PAGE
3.1 Percentage of Fat 26
4.1 Equation of Polynomial Regression Model Generated from the Design
for Equation of Differences in L* (ΔL*) 33
4.2 Equation of Polynomial Regression Model for Colour 33
4.3 Equation of Polynomial Regression Model for Taste 33

xvi
LIST OF ABBREVIATIONS
a* Redness
Å Angstroms
b* Yellowness
C Degree celsius
COMT Cytosolic catechol-O-methyltransferase
EGCG Epigallocatechin gallate
G’ Storage modulus
G’’ Loss modulus
L* Lightness
∆L* Difference in lightness
Lstandard* Lightness profile of premium matcha
OECD Organisation for economic cooperation and
development
ORAC Oxygen radical absorbing capacity
R2 Coefficient of determination
RSM Respond surface methodology
TAG Triacylglycerol
UV Ultraviolet
µm Micrometer

1
CHAPTER 1
INTRODUCTION
1.1 Background
As you stand at the diary department of any local supermarket, you may be
amazed by looking at the refrigerators where butters are kept. It is prodigious
that food as simple as butter can be diversified in so many variations. It is
common to see raw cream butter, salted butter, lightly salted butter, unsalted
butter, blended butter with vegetable oil, canola oil, olive oil and even butter
with omega-3 fatty acid that can reduce the risk of cardiovascular disease
(Helweg, 2010). Although, there are so many variety of butters in the market,
but flavoured butter rarely appear.
Statistical studies from OECD Agricultural Outlook (2017) showed that butter
consumptions in Malaysia were 9650 tons unit in year 2013 and it rocketed
significantly to 12500 tons unit in year 2014 with an increase of 29.5 %. The
trend will not stop until year 2017 as the expected consumption to be 13530 tons
unit. The amount of butter consumption is expected to increase deliberately until
the year of 2024 with the forecast consumption of 15870 tones unit butters
nationwide (OECD Agricultural Outlook, 2017).
Meanwhile, Global Food Forum reported flavored butter as one of the food and
beverage trends in the year 2017 (Global Food Forum, 2017). Besides, matcha

2
green tea was chosen as top 7 trendy foods based on the national food trend
survey (Global Food Forum, 2017). Matcha green tea is the super food that carry
numerous health effects on human body. It was honoured as “Health Elixir”
during the past due to its extraordinary antioxidant effect and health benefits
(Snyder, et al., 2015).
The matcha green tea trends had caused huge production of matcha-related
products in local and international food companies. There are few giant food
companies such as Nestle (Switzerland), Northern Tea Merchant (U.K.),
Unilever Group (U.K.) and Tetley (England) found involving themselves in the
matcha market (Market research future, 2016). As a result, there are many
Matcha flavored commercial products in the market, for example, Pocky green
tea flavored confectionery, Nestle green tea kit kat, BOH green tea latte, etc.
Besides, there are even restaurants, an example of Nana’s Green Tea serving
diversified matcha related drinks and dessert.
Currently, the matcha green tea trend is off global interest. Studies also showed
that matcha market is expanding rapidly in asia pacific region (Market research
future, 2016). Hence, incorporation of matcha green tea into butter is definitely
a worth trying idea to produce a new product: Matcha Butter. In this project, the
amount of matcha powder, salt and sugars are adjusted according to response
surface methodology (RSM) through Box-Behnken design and the optimization
of product are based on consumer preference and colour matching.

3
Besides, rheological properties are one of the important aspect in developing a
new product. Rheological properties of food emulsion in butter play an essential
role in understanding the food structural organization and can be related to
stability, melting point and spreadability of the final product. Hence, temperature
sweep will be carry out on the optimized product to examine the melting
behaviour.
1.2 Objectives
The objectives of this study were:
To develop an optimised Matcha butter using Respond Surface
Methodology (RSM) based on colour matching and sensory evaluation.
To determine the water and fat content of the optimized matcha butter.
To evaluate meltability of optimized matcha green tea butter.

4
CHAPTER 2
LITERATURE REVIEW
2.1 Butter
2.1.1 Definition of Butter
Butter can be defined as solid product derived exclusively from milk or cream,
or both, and shall be free from rancidity. According to FOOD ACT 1983 and
FOOD REGULATIONS 1985, Butter shall contain not less than 80 per cent of
milk fat; shall not contain more than 16 per cent of water; and may contain salt.
Besides, butter may contain permitted colouring substances of vegetable origin
and permitted antioxidant (Kementerian Kesihatan Malaysia, 2014).
2.1.2 History of Butter
Butter was present for more than 4000 years and it was cited in the Old
Testament (First part of Christian Bible): “She brought forth butter in lordly
dish". Besides, the word "butter" originated from Greek word bouturo, which
carried the meaning of "cow cheese". According to the literature, butter was first
discovered when warm milk was unintentionally churned in saddle bag as it was
being transported from place to place (Helweg, 2010).
During the past, butter was made by inflating goat skin with air and filled with
some milk before being sealed. Then, the skin was hung with ropes on a tripod

5
of sticks, and swung until the formation of butter. In late nineteenth centuries,
the mechanical cream separator was invented. Initially, churns were made from
woods. The cream was subjected to shear and mild aeration by spinning the
vessel. Buttermilk was drained when fats clumped into butter. However, this
process barely met the hygiene standard. Often, cream turns sour before turning
into butter. In addition, the wooden churn was very hard to keep clean. The
absence of refrigerator causes rapid growth of microorganism. Slowly, wooden
churns were replaced by aluminium and stainless steel. Eventually, the
technology was overtaken by the development of continuous butter making
processes (Deosakar, Khedkar and Kalyankar, 2016).
2.1.3 Milk Fat Globule Composition
Bovine milk fat is one of the popular choice as main ingredient of butter. When
look in to nanostructure, bovine milk fat is spherical globules in shape and have
the diameter between 2 and 8 um. It is surrounded by membrane that is made up
of lipids, proteins and phospholipid (Deosakar, Khedkar and Kalyankar, 2016).
The milk composition may differ among cow species, season and food fed
(Marrero, 2017). This membrane contains lecithin, that helps to prevent
enzymatic oxidation, lipolysis and keep the fat globule suspended in water phase
(Potter and Hotchikiss, 1998). Body of milk fat as illustrated as below, consist
of 98.3 % (w/w) triacylglycerol (TGA) and the remaining 1.7 % involves
phospholipid diacylglycerol, sterol, free fatty acid and monoacylglycerols in
descending order (Deosakar, Khedkar and Kalyankar, 2016).

6
(Prezi, 2017)
Figure 2.1 Illustration Diagram of Milk Fat Globule.
2.1.4 Butter Making Theory
Butter is made from milk fat, which can be found in cream or whole milk.
(Mahony, 1988). Cream is a raw material that is isolated from milk and contains
about 30-35% fats (Potter and Hotchikiss, 1998). It is an oil in water emulsion,
in which tiny globules of fats are suspended into water (Oklahoma, 2006). Butter
manufacturer will first pasteurize the cream before churning at slightly higher
temperature than milk pasteurization to kill off bacteria as high fat content of
cream tend to have protective effect on bacteria (Potter and Hotchikiss, 1998).
Churning process is a mechanical disturbance that reverses the natural emulsion
in cream. During churning, temperature control is critically important. The ideal
churning temperature is at 10-12 C in hot climate and at 14-17 C in cold climate
(Potter and Hotchikiss, 1998). If the cream is too cool, there will be an

7
interruption in butter formation and small gains produced is difficult to handle.
On the other way, if cream’s temperature is too high. Large proportion of fat will
remain in buttermilk, and butter produced will be in mushy and porous in texture
(Potter and Hotchikiss, 1998).
During churning, nucleation happened when large amount of air is incorporated
into the cream and then encourage the formation of crystal (Herrera and Hartel,
2000). After forming the crystals, agitation process breaks the formed crystals
into fragments and then spread them across the food system (Kloek, Vliet and
Walstra, 2005). Then, the crystal fragments served as nucleation sites to carry
out secondary nucleation. As result, larger amount of crystals is formed (Herrera
and Hartel, 2000). At the same time, agitation process also breaks the surface
membrane of milk fat globules, causing fat globules to collide with each other.
As the process continues, the cream becomes rougher due to clumping of fat
globules and crystals and form tiny butter granules (Mahony, 1988).
Eventually, the rough milk fats form semi-solid butter granules, which rapidly
clump together and grow in size. The by-product left is a milk-like liquid with
tiny butter grains floating in it which is “buttermilk” (Oklahoma, 2006). Then,
buttermilk is discarded and butter is washed few times with iced water before
salting. The state of emulsion now is inversed. Butterfat is the major and
continuous phase and about 15 % of buttermilk is the discontinuous phase which
suspended as fine droplet in the butter (Ronholt, et al., 2012).

8
2.2 Rheological Properties of Butter
Body and texture characteristic of a butter are very important for consumer
acceptability (Buldo, 2012). A good butter shall be smooth and firm. It should
have optimum resistance against cutting and can be spread smoothly. When
eaten, it should melt evenly in the mouth cavity without leaving an oily aftertaste
(Deosakar, Khedkar and Kalyankar, 2016). Texture of butter is closely related
to water content, fatty acid and chemical composition, distribution of milk fat
crystal network structure, polymorphism and processing steps (Buldo, 2012),
milk fat structure and composition (Deosakar, Khedkar and Kalyankar, 2016).
Milk fat compositions and the arrangement of fatty acid in triacylglycerol (TGA)
molecule of the cream can effect the crystallization behaviour and then affect the
microstructure, macrostructure and even texture of the butter (Deosakar,
Khedkar and Kalyankar, 2016). Hence, mastering the chemical and rheological
properties of food by different processing conditions is paramount importance
in developing a new product.
Knowledge of butter emulsion’s rheological properties enables a better
understanding of the structural organization of butter, processing, storage,
transportation, stability and mouth feel of the products (Emadzadeh, et al., 2013).
To make a clearer picture, fat crystallization; crystal network and polymorphism
are further discussed.

9
2.2.1 Fat Crystallization
Careful control fat crystallization during butter production can produce butter
with the pleasant structural properties. During crystallization, organized
molecules randomly come together and form 3-dimensional molecular structure,
known as crystal (Davey and Garside, 2000). The crystallization process is made
up of two steps: nucleation and crystal grow (Marrero, 2017).
In nucleation, a crystal nucleus is formed when energy is absorbed from the
system (Timms, 2007). Before the first crystal is formed, a specific amount of
energy is required to enter the cluster. As cluster grows, entropy of the system
will decrease (Wesdorp and Marangoni, 2013). According to Boskish (1998),
nucleus produced from nucleation is an intermediate stage of converting itself
from an unorganized nucleus to an organized crystallized structure. Yet, the
nucleuses were not stable and can be degraded anytime. Therefore, they must
reach the size between 0.1 and 1.0 µm in order to grow into crystal. Nucleus that
fail to grow into crystal will result in degradation.
Secondary nucleation may happen if part of the first crystal breaks. Then,
crystallization is favored as the crystals fragments started to grow. The rate of
crystal growth is proportionate to the degree of undercooling (Smith, 2008). As
crystallizes grow, they start to collide. As result, the growth rate of crystal is
slowed down (Buldo, 2012).

10
2.2.2 Polymorphism
Triacylglycerols in fat globules tend to crystallize in 3 different modifications
which are: α (alpha), β’ (beta prime) and β (beta) (Guarley and Marangoni, 2005).
α modification present in hexagonal form with the short spacing of 4.15 Å. It is
characterized by low melting point, low density, and low stability. The β’ form
has short spacing of 3.8 Å, 4.2 Å and it is structured in an orthorhombic subshell
with high melting point, high density and high stability (Marangoni, 2016).
However, the arrangement of β’form crystal lattice structure is less organized
and stable than β modification (Juriaanse and Heertje, 1988). Lastly, the β
polymorph is in triclinic structure and it has the highest melting point, density,
and stability among all the polymorphs (Marangoni, 2016). Although β
modification is the most stable crystals, it causes poor crystal network and it is
often perceived as sandiness (Juriaanse and Heertje, 1988). Among the 3
polymorphisms, β’ form is most desirable in butter due to its optimal crystal
morphology and crystal network that give the desired texture (Buldo, 2012).
Cooling rate is one of the processing conditions that can affect the crystallization
behaviour of milk fat by influencing the polymorphology and further alter the
microstructure and texture of butter (Buldo, 2012).
The cooling rate of milk fat can cause a difference in size and amount of crystal
formed. Slow cooling rate allows TAG to organize themselves in a more stable
form of crystal: β' (Wiking et al., 2009). As a rule, slow cooling rates enhances

11
large and stable crystals to form, whereas fast cooling rates produce plenty of
small and unstable crystals (Herrera and Hartel, 2000).
2.2.3 Crystal Network
Under the vision of confocal laser scanning microscope. Intact and partially
disrupted milk fat globules, fats crystals, aqueous and air droplets are embedded
in a 3-dimensional fat crystal network (Marrero, 2017). The crystals are
connected to each other by two types of bonds: primary and secondary bond to
form a complex crystal network (Juriaanse and Heertje, 1988). Primary bonds
are responsible for crystals grow; whereas secondary bonds are weak Van der
Walls force that hold crystals together (Deosakar, Khedkar and Kalyankar, 2016).
Therefore, properties of fat crystals and amount of water in the butter are
important for the strength of crystal network (Ronholt, et al., 2012).
Small crystals contribute more contact points for bonding and lead to a finer
crystal network. As result, a firmer butter is produced. Contrary, large crystals
provide lesser contact points for bonding and crystal network formed is more
vulnerable. As consequence, softer butter is produced. On the other hand,
unbroken fat globule will disrupt the crystal network, resulting in a weaker
structure and good spreadability (Deosakar, Khedkar and Kalyankar, 2016). This
explains the need of long churning time in order to disrupt intact milk fats in the
cream to produce a firmer butter.

12
Moreover, water droplets are dispersed in the butter, forming a network with the
other fat globules (Pedersen, et al., 2012). It was found that high moisture content
will greatly interfere the crystal network and resulted in soft and watery butter
( Ronholt, et al., 2012).
2.3 Matcha Green Tea
2.3.1 Background of Matcha Green Tea
Powdered tea is a processed tea whereby the leaves are broken into tiny pieces
and whisked swiftly together with hot water to produce tea. It was first
discovered during the Song Dynasty in China. This method of preparing tea was
introduced to few Japanese Zen monks before they bring it back to Japan and
implement the culture of consumption powdered tea by their own. Then Eisai, a
Japanese Zen priest successfully discovered matcha tea in the 11 century by
himself. Soon, the Matcha was popularized by the Samurais and elite groups of
the society (Snyder, et al., 2015). Since then, matcha became one of the must in
tea ceremonies and eventually became one of the Japanese culture.
Matcha was recorded to have oxygen radical absorbing capacity (ORAC) of
1573 per gram. It is the highest rated food rank ever recorded in the ORAC scale
(Snyder, et al., 2015). Matcha is derived from the green tea plant Camellia
sinensis (Auxter, 2015). Few weeks before harvesting, the tea plants are
deliberately covered in shade to avoid direct exposure of sun light. This retard
the growth of plant, and energy is converted into leaves by increasing the amino

13
acid and chlorophyll level (Smith, 2016). Increase of amino acid in the leaves
can bring up a sense of sweetness (Towler, 2010).
During harvesting, fresh and tender leaves are handpicked before they are
cleaned, steamed and air dried (Snyder, et al., 2015). Tencha is the name of tea
after air drying. Since the leaves can only be harvested 2 times a year. Most
tencha are kept refrigerated within 48 hours after harvesting for constant
production of matcha throughout the year (Smith, 2016). The remaining tencha
that are ready to be process are dehydrated to further reduce moisture content of
leaves by 3 %. In traditional method, tencha leaves are grind by stone in very
gentle and slow manner. Speeding up the grinding process could introduce
unnecessary heat and friction that cause the final product to be bulky (Smith,
2016).
Usually 30 g of matcha is produced by 1 hour of grinding (Towler, 2010). In
modern factory nowadays, more tencha can be grinded in large mechanical
grinder but the processing time is still long in order to retain the bright green and
unique flavour of tea (Smith, 2016).
14
2.3.2 Health Benefits of Matcha Green Tea
2.3.2.1 Cancer Prevention
Exposure to ultraviolet (UV) radiation by sunlight is one of the unavoidable
phenomena faced by most people especially in tropical regions. UV radiation
that managed to penetrate through atmosphere is made up of 5 % UVB and 95%
UVA. Both UVA and UVB are able to enter into dermis and epidermis of the
skin. Extensive exposure of UVA causes production of hydroxyl free radicals
and singlet oxygen in skin. They can injure the cellular macromolecules and
tringle skin sagging by photo oxidation. On the other hand, UVB is carcinogenic
and often cause skin diseases (Katiyar , 2011).
Matcha tea leaf is extremely high in antioxidant, polyphenols and
epigallocetechin gallate (EGCG). EGCG is a very powerful and nature
occurring antioxidant that can be also found in cocoa and blackberries. EGCG
in matcha can prevent DNA damage due to radicals and reactive oxygen species. ,
Beside, EGCG can activate detox emzymes like quinone that is capable to
prohibit development of tumor cell (Snyder, et al., 2015). In addition,
polyphenols in tea can inhibit damage done on skin by UV radiation (Cheadle
and Kilby, 2016) and can trigger apoptosis (Snyder, et al., 2015).

15
2.3.2.2 Promote Healthy Heart
Coronary heart diseases can be caused by many risk factors. While, diet high in
saturated fats can greatly lift the risk of heart disease and has causes 31 % of
total coronary heart disease cases worldwide (World Heart Federation, 2017).
Diet is always closely related to heart disease as it can alter all the other
cardiovascular risk factors. The intake of saturated and trans fats can potentially
increase cholesterol level and block the arteries. Heart disease can happen if no
corrective action is taken (World Heart Federation, 2017).
The EGCGs present in matcha can drive cardioprotective effect by supressing
oxidation, vascular inflammation and thrombogenesis. Besides, EGCGs was
found capable in lowering the absorption of total cholesterol by forming
insoluble cholesterol precipitates to disturb the biliary micelle system in the
lumen of the intestine. As result, more cholesterol is excreted as faeces and blood
lipid profiles is improved (Zheng, et al., 2011).
Studies also show that, people who drink matcha green tea are unlikey to develop
heart disease by 11 % than people who don’t (Snyder, et al., 2015). While, people
who drink 5 cups or more matcha green tea everyday are 26 % less likely to
engage with cardiovascular disease compare with those who take one cup a day
(Cheadle and Kilby, 2016).

16
2.3.2.3 Help in Weight Loss
Matcha green tea is recognized for being outstandingly rich in flavonoids and
catechins. Catechin can inhibit Cytosolic Catechol-O-Methyltransferase
(COMT), an enzyme that can breakdown norepinephrine. Norepinephrine is an
enzyme that work together with sympathetic nervous system to regulate
thermogenesis and fats metabolism. Due to the absent of COMT, norepinephrine
can works longer and inhibit prolonged thermogenesis and fats oxidation
(Dulloo, et al., 1999). As result, intake of matcha diary can increase
thermogenesis from 8 to 10%. Consuming matcha green tea before physical
activity can further increase fat burn by 25% (Snyder, et al., 2015).
2.4 Respond Surface Methodology (RSM)
Respond Surface Methodology (RSM) is a collection of statistical and
mathematical methods (Manohar, et al., 2013). It is commonly applied to achieve
the desired conditions whereby the desired outcomes are influenced by several
factors of interest (Bezerra, et al., 2008). RSM is often coupled with Box–
Behnken designs to acquire high accuracy of optimization by running lesser
experiment sets compared to traditional method (Qui, et al., 2014).
Box Behnken design was developed by Box and Behnken. In this design,
samples are reworked on parameters of different sets if they are aligned to the 2
level factorial design. The parameters which do not involve in the factorial

17
design are keep at the mean value (Cavazzuti, 2013). Box Behnken design model
is commonly used in industrial research, due to its convenience and cost saving
properties. In each design, only 3 levels on every factor namely -1, 0, +1 are
required (Khuri, and Mukhopadhyay, 2010).
Prior to the experiment, the levels of factors need to be identified and the internal
space between each level must be constant. Number of experiment is determined
by this formula: N = 2k (k − 1) + cp, where cp is the number of the central points
and k represent number of factors (Bezerra, et al., 2008). Since, number of
factors is 3. By applying formula N = 2n (n − 1) + cp, number of experiment is
15. After finding total number of experiments, combination of level of factors
should be defined.
Referring to Table 2.1. First, level in factor “C” is locked at centre level “0”.
Then, the other levels (-1, 1) are permutated in factor “A” and “B” until no other
combination can be made. After that, the levels of the factor “B” follow the
previous steps until all possible combinations are produced. It is then followed
by factor “A”. Lastly, the levels of factor in the remaining experiments are all
set to centre level “0” (Mustafa, et al., 2012).

18
Table 2.1. Box-Behnken Experimental Design of 15 Runs.
Rank Box Behnken Experimental Design
A B C
1 -1 -1 0
2 1 -1 0
3 -1 1 0
4 1 1 0
5 -1 0 -1
6 1 0 -1
7 -1 0 1
8 1 0 1
9 0 -1 -1
10 0 1 -1
11 0 -1 1
12 0 1 1
13 0 0 0
14 0 0 0
15 0 0 0
(As abstracted from Mustafa, et al., 2012)

19
CHAPTER 3
MATERIAL AND METHODOLOGY
3.1 Box Behnken Design Setup
Salt, sugar and matcha powder were believed to effectively affect the sensory
characteristic of matcha butter. Therefore, 3 level factors Box-Behnken design
of Response Surface Methodology was used. Table 3.1 showed the levels and
amount of each variables added to 200 g of freshly churned butter.
Table 3.1 Variables in Box–Behnken Design to Produce Matcha Butters.
Independent
Variables
Levels
-1 0 +1
Matcha Powder 4.0 g 7.0 g 10.0 g
Salt 2.0 g 2.8 g 3.6 g
Sugar 7 g 10 g 13 g

20
Table 3.2 Randomized Box-Behnken Design.
No.
Independent Variable
Matcha Powder (g) Salt (g) Sugar (g)
1 7.0 3.6 7.0
2 10.0 3.6 10.0
3 7.0 2.8 10.0
4 7.0 2.8 10.0
5 4.0 2.0 10.0
6 10.0 2.8 7.0
7 4.0 2.8 7.0
8 4.0 2.8 13.0
9 7.0 2.8 10.0
10 10.0 2.8 13.0
11 4.0 3.6 10.0
12 7.0 2.0 7.0
13 7.0 2.0 13.0
14 10.0 2.0 10.0
15 7.0 3.6 13.0
(Refer to 200g fresh butter)
Table 3.2 showed the randomized Box-Behnken design, and matcha butters were
produced based on randomized Box Behnken experiment design. The two
dependent variables were sensory scores and different in lightness (∆L*) from
standard matcha green tea. JMP software was used to analyse the significant of
each factor and produce optimum matcha butter by maximizing sensory scores
and minimizing difference in lightness (∆L*) from standard matcha’s lightness
profile.
21
3.2 Experimental Design
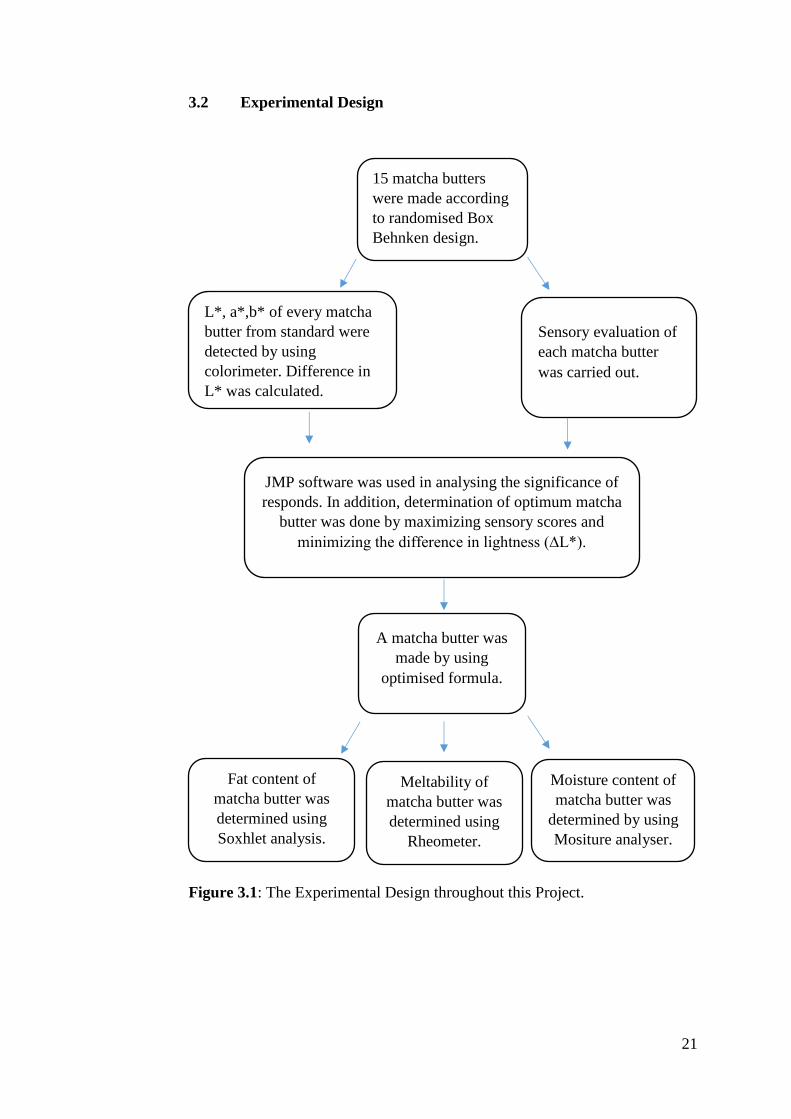
Figure 3.1: The Experimental Design throughout this Project.
15 matcha butters
were made according
to randomised Box
Behnken design.
Sensory evaluation of
each matcha butter
was carried out.
A matcha butter was
made by using
optimised formula.
L*, a*,b* of every matcha
butter from standard were
detected by using
colorimeter. Difference in
L* was calculated.
Moisture content of
matcha butter was
determined by using
Mositure analyser.
Fat content of
matcha butter was
determined using
Soxhlet analysis.
Meltability of
matcha butter was
determined using
Rheometer.
JMP software was used in analysing the significance of
responds. In addition, determination of optimum matcha
butter was done by maximizing sensory scores and
minimizing the difference in lightness (∆L*).

22
3.3 Preparation of Matcha Butter
Ingredients needed to produce matcha butter were whipping cream, fine sugar,
fine salt and matcha powder. Matcha powder used was from Tehmag food
cooperation, Taiwan. Whipping cream used was manufactured by Emborg,
Denmark. Fine sugar used was produced from MSM Pria Berhad, Pulau Pinang,
Malaysia. Fine salt was packed by Seng Hin Brother Enterprises SDN BHD,
Selangor. Whipping cream, sugar and salt were purchased from Tesco
supermarket in Kampar. While, matcha powder was purchased from Siti bakery
shop, Kampar. Apparatus used for butter preparation were Hobart mixer, food
grade thermometer, cheesecloth and spatula.
In the first stage, whipping cream was introduced into the mixing bowl. The
temperature of whipping cream was adjusted to 15.6 C. Temperature of
whipping cream was checked from time to time by using thermometer. When
temperature of whipping cream reached 15.6 ±0.6 C, the cream was agitated at
low speed (speed 1) for 8 minutes using Hobart mixer. Then, the agitation speed
was adjusted to high for another 12 minutes (speed 2) for phase separation. The
butter was allowed to sit for 5 minutes for better separation of buttermilk. Then,
butter milk was discarded. Butter was washed several times until wash water
turned clear before straining using cheesecloth (Helweg, 2010). The strained
butter was put back to mixing bowl together with sugar, salt and matcha powder
and mixed for 15 minutes. The amount of sugar, salt and matcha powder were
added by referring to Table 3.2. After mixing, matcha butter was wrapped using
cling wrap in rectangular container and stored in refrigerator.

23
3.4 Analysis of Colour on Matcha Butter
Analysis of colour was carried out with colorimeter namely CM-600d by Konica
Minolta, Japan. Hunter Lab colour space was used as the parameter to measure
colour. L* value indicated lightness and it ranged from 0 (black) to 100 (white).
a* value represented greeness * (-a) and redness (+a). b* indicated blueness (-b)
to yellowness (+b) (Sahin and Sumnu, 2006).
First, cell culture dishes were half filled with freshly made matcha butter. Matcha
butter was gently pressed with a spatula until the bottom was fully filled. Cell
culture dishes were capped and set aside. Then, colorimeter was turned on and
calibrated. Head of colorimeter was place vertically above the bottom surface of
cell culture dish to take measurement. All of the samples were run in triplicate.
L*, a*, b* readings were recorded.
The Hunter L*a*b* colour profile of premium matcha powder that marks the
desired and highest quality were: 60.39, –6.43, 18.71 respective to L*, a*, b*
(Ayhan, et al., 2014). The Lstandard is 60.39. Only the differences of lightness
(∆L*) of 15 matcha butters were obtained and used for optimization of matcha
butter.

24
3.5 Sensory Evaluation on Matcha Butter
Sensory evaluations were carried out at sensory lab, Faculty of Science,
University Tunku Abdul Rahman, Kampar, Malaysia. 9 point hedonic scale was
used in this sensory evaluation, detailed showed in Appendix. Sensory attributes
to be evaluated were: colour, appearance, taste, mouthfeel and overall
acceptability of matcha butter. The butter was spread on Massimo white
sandwich loafs as flavour carrier due to its affordable pricing and mild flavour
of loaf that will not take over the flavour of matcha butter. 25 untrained panellists
were recruited for every testing and only 3 types of matcha butters will be
provided to avoid confusion. In addition, samples presented were coded with
random 3 digit numbers to prevent bias (Lawless and Heymann, 1999).
3.6 Temperature Sweep of Matcha Butter
Rheometer model TA Discovery HR1 by TA INSTRUMENT coupling with
60mm cone plate were used in this test. Surface of peltier plate was cleaned with
few drops of alcohol. Zero calibration was carried out before spreading a thin
layer of matcha butter on peltier plate. Storage modulus and Loss modulus were
determined in this test by increasing temperature from 5 to 40 C and decrease
back to 5 C. The test was performed with 5 C interval and 1 % strain (Vithanage,
Grimson, and Smith, 2009). The measurements were taken in triplicate.

25
3.7 Determination of Moisture Content on Matcha Butter
Moisture analysis was carried out by using Mettler Toledo moisture analyzer
HB43-S Greifensee, Switzerland. Moisture analyser was turned on and
temperature was set to 40 C. A piece of fibre glass sheet was placed on the pan.
Then 1 g of matcha butter was weighted and spread evenly on the glass fiber
sheet. All of the samples were run in triplicate. The percentage of the moisture
content was recorded.
3.8 Determination of Fat Content on Matcha Butter
The lipid analysis carried out was Soxhlet method. The machinery involved in
the test was Gerhardt, SOXTHERM automatic extraction system produced from
Königswinter, Germany.
Prior to extraction, six clean and dry extraction beakers were prepared. 3 boiling
stones were added into every extraction beaker allowed to dry in 105 C for 1
hour. After that, the extraction beakers were cooled down in a desiccator for 1
hour. Dried and cooled extraction beaker was carefully removed from desiccator
one by one using a thong and weighted on a 4 decimal place digital weighing
balance. The weight of every extraction beaker was recorded as Mi.
Then, 3 g of matcha butter was weight and recorded as Mo. The sample was
wrapped in filter paper. This step was repeated for another 5 times to produce 6
26
samples. Samples together with filter papers were put into the respective thimble.
Then, cotton wools were added to cover the mouth of thimbles. After that,
thimbles were inserted into the bottom of extraction beaker and approximately
90ml of petroleum ether was added into each extraction beaker in the fume hood.
At the same time, water supply and pump of Soxtherm were turned on. The 6
extraction beakers were inserted to the Soxtherm apparatus using thong and
extraction process was run for around 2 hours.
After extraction, extraction beakers were removed from Soxtherm apparatus
with a thong. Thimbles were removed from extraction beakers and dried in oven
at 105C for 1hour. Dried extraction beakers were then cooled down in the
desiccator for 1 hour. Cooled and dried extraction beakers were weighted by 4
decimal place digital weighing balance. The weight of every extraction beaker
was recorded as M2. All of the samples were run in triplicate. The percentage of
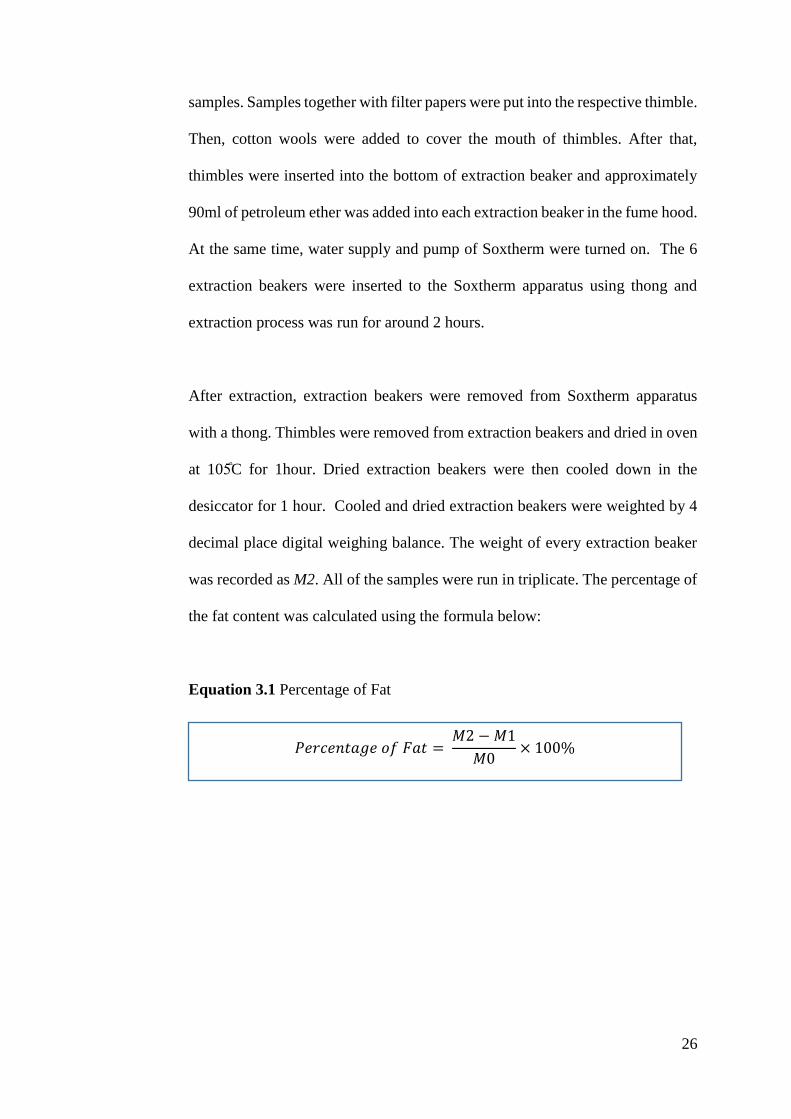
the fat content was calculated using the formula below:
Equation 3.1 Percentage of Fat
𝑃𝑒𝑟𝑐𝑒𝑛𝑡𝑎𝑔𝑒 𝑜𝑓 𝐹𝑎𝑡 = 𝑀2 − 𝑀1
𝑀0× 100%

27
CHAPTER 4
RESULT
4.1 Formulation Optimization
Box–Behnken design of three variables consists of 15 experiments. Readings of
L* lightness, a* redness, b* yellowness and ∆L* difference in lightness were
recorded in Table 4.1. Besides, score of each attribute (colour, appearance, taste,
mouthfeel and overall acceptability) and their means were tabulated in Table 4.2.
Based on Table 4.1, Hunter Lab colour scale ranged from 55.33 to 66.83, -14.05
to -11.23 and 31.06 to 38.25, respective to mean values of L* lightness, a*
redness, and b* yellowness. However, only ∆L* difference in lightness was
selected as the response variable for colour analysis and it was calculated by
dividing the Lstandard* 60.39. The range of difference in lightness was greatest at
8.44 and lowest at 0.14.
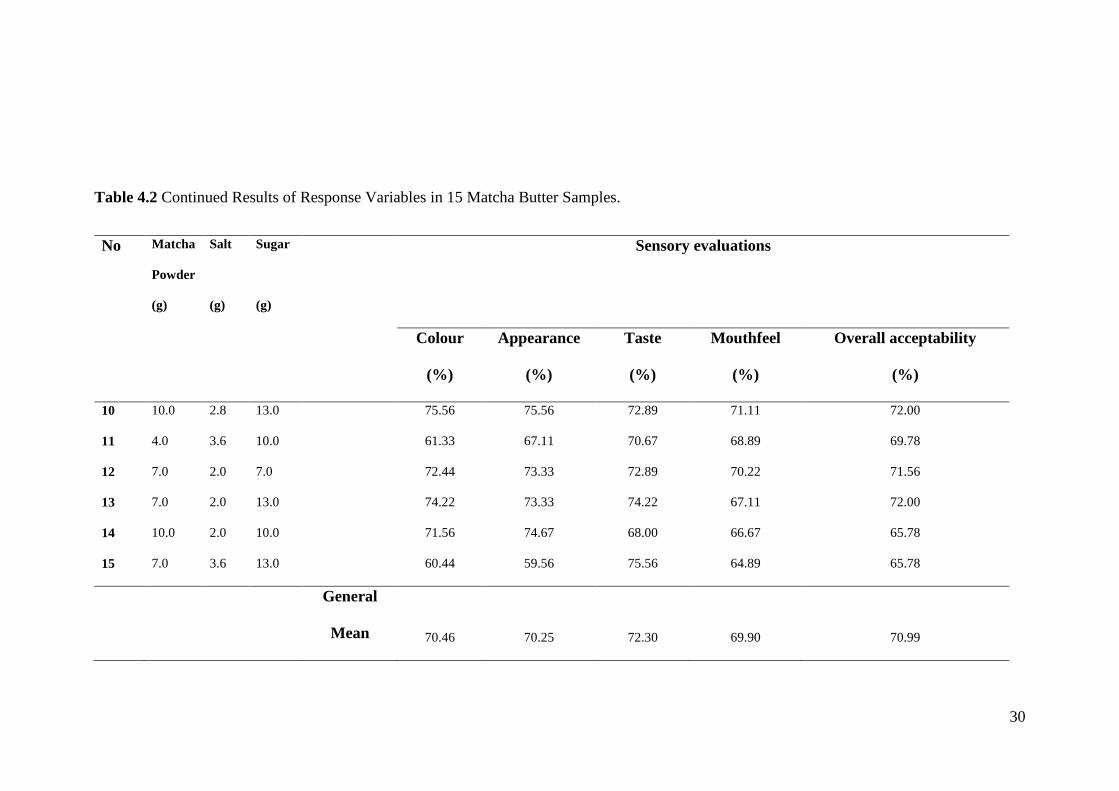
The general mean for the taste recorded the highest (72.30 %) followed by
overall acceptability (70.99 %), colour (70.46 %), appearance (70.25 %), while
the mouthfeel showed the lowest at 69.90 %.

28
Table 4.1 Results of Lightness (L*), Redness (a*), Yellowness (b*), and
Differences in L* (∆L*) in 15 Matcha Butter Samples.
No.
Matcha
Powder
(g)
Salt
(g)
Sugar
(g)
L* a* b* Difference
in L*
(∆L*)
1 7.0 3.6 7.0 62.00±0.48 -13.82±0.10 37.39±0.33 1.61
2 10.0 3.6 10.0 56.15±1.56 -14.00±0.39 38.11±0.67 4.24
3 7.0 2.8 10.0 63.70±0.21 -14.05±0.07 37.82±0.51 3.31
4 7.0 2.8 10.0 60.25±1.36 -13.31±0.30 36.80±1.01 0.14
5 4.0 2.0 10.0 66.10±0.63 -12.02±0.13 34.00±0.38 5.71
6 10.0 2.8 7.0 56.81±0.65 -13.56±0.17 38.08±0.17 3.58
7 4.0 2.8 7.0 66.65±0.46 -11.60±0.26 32.88±0.21 6.26
8 4.0 2.8 13.0 68.64±0.42 -11.34±0.10 31.79±0.04 8.25
9 7.0 2.8 10.0 62.58±0.47 -12.55±0.11 35.10±0.21 2.19
10 10.0 2.8 13.0 57.29±0.71 -14.02±0.27 38.25±0.89 3.10
11 4.0 3.6 10.0 68.83±0.29 -11.23±0.08 31.06±0.54 8.44
12 7.0 2.0 7.0 63.90±0.10 -12.67±0.12 34.45±0.29 3.51
13 7.0 2.0 13.0 63.44±0.42 -13.03±0.11 35.01±0.53 3.05
14 10.0 2.0 10.0 55.33±1.46 -13.13±0.28 35.33±0.82 5.09
15 7.0 3.6 13.0 64.96±0.39 -12.53±0.12 34.26±0.29 4.57
Remark: The difference in lightness (∆L*) was set against L* 60.39

29
Table 4.2 Results of Response Variables in 15 Matcha Butter Samples.
No Matcha
Powder
(g)
Salt
(g)
Sugar
(g)
Sensory evaluations
Colour
(%)
Appearance
(%)
Taste
(%)
Mouthfeel
(%)
Overall acceptability
(%)
1 7.0 3.6 7.0 74.67 71.56 79.56 73.78 75.56
2 10.0 3.6 10.0 70.22 68.89 75.11 68.89 69.78
3 7.0 2.8 10.0 76.00 73.33 72.44 73.33 72.89
4 7.0 2.8 10.0 70.67 69.78 73.33 69.78 70.67
5 4.0 2.0 10.0 65.33 67.11 67.56 72.89 72.44
6 10.0 2.8 7.0 69.78 67.11 68.89 69.33 67.11
7 4.0 2.8 7.0 72.00 70.67 70.22 72.00 75.56
8 4.0 2.8 13.0 71.56 71.11 68.44 74.67 77.33
9 7.0 2.8 10.0 71.11 70.67 74.67 64.89 66.67
30
Table 4.2 Continued Results of Response Variables in 15 Matcha Butter Samples.
No Matcha
Powder
(g)
Salt
(g)
Sugar
(g)
Sensory evaluations
Colour
(%)
Appearance
(%)
Taste
(%)
Mouthfeel
(%)
Overall acceptability
(%)
10 10.0 2.8 13.0 75.56 75.56 72.89 71.11 72.00
11 4.0 3.6 10.0 61.33 67.11 70.67 68.89 69.78
12 7.0 2.0 7.0 72.44 73.33 72.89 70.22 71.56
13 7.0 2.0 13.0 74.22 73.33 74.22 67.11 72.00
14 10.0 2.0 10.0 71.56 74.67 68.00 66.67 65.78
15 7.0 3.6 13.0 60.44 59.56 75.56 64.89 65.78
General
Mean 70.46 70.25 72.30 69.90 70.99

31
Results tabulated from Table 4.2 and Table 4.1 were analysed using ANOVA,
analysis of variance in order to select the relevant responses by comparing their
significances and tabulated in Table 4.3.
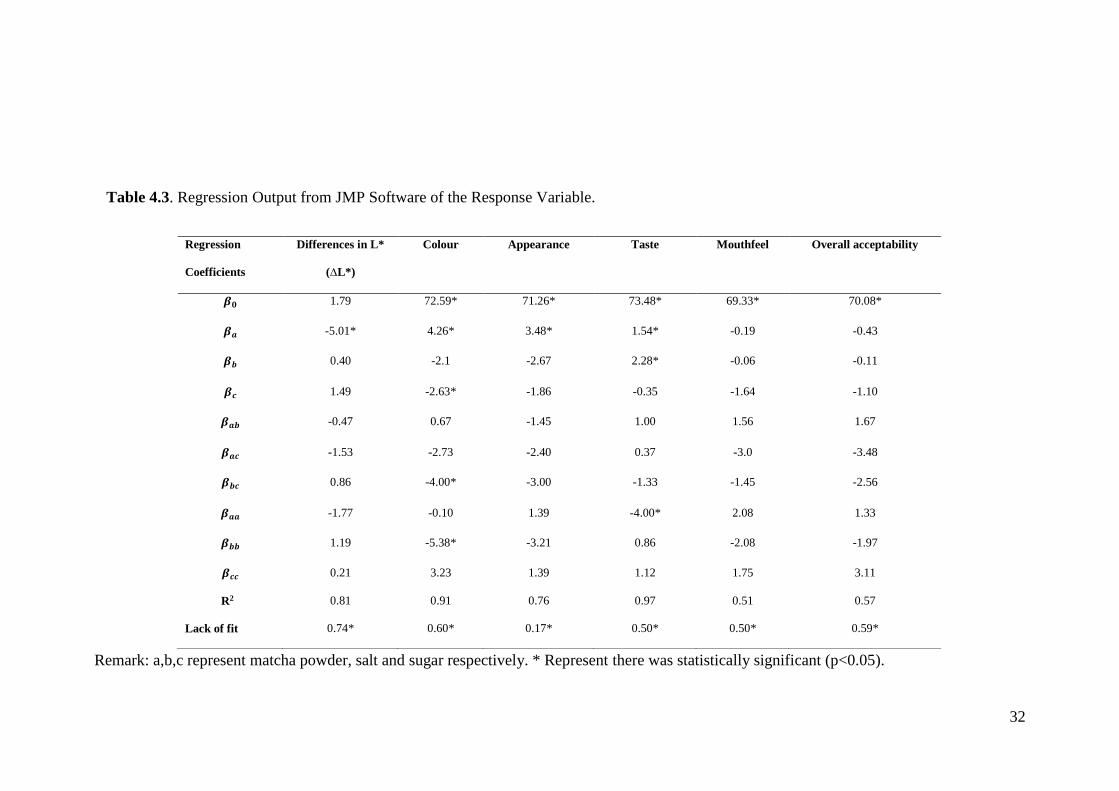
In Table 4.3, R2 can be denoted by the coefficient of determination and it
represented the properties of fit to the polynomial model equation. In this model,
the R2 was highest in “taste” by scoring 0.97. “Colour” with R2 of 0.91 was
ranked second and then followed by “differences in L*” with R2 of 0.81,
“appearance” with of 0.76, “overall acceptability” with R2 of 0.57 and lastly
“mouthfeel” with R2 of 0.51.
Besides, “differences in L*”, “colour” and “taste” were significantly different
(p<0.05) thus indicating significant and good fitness to the model. On contrast,
“appearance”, “mouthfeel” and “overall acceptability” were found not having
significantly different at 95 % (p<0.05). Moreover, the F-value in Lack of fit was
highest in differences in ∆L* (0.74), followed by colour (0.60), overall
acceptability (0.59), taste (0.50), mouthfeel (0.50) and lowest in appearance
(0.17).
Based on regression coefficients shown in Table 4.3, differences in L* from
colour analysis and colour (%), taste (%) from the sensory evaluation were
chosen as influencing factors to establish the full quadratic models due to P value
< 0.05, lack of fit > 0.5 and R2 > 0.80.
32
Table 4.3. Regression Output from JMP Software of the Response Variable.
Remark: a,b,c represent matcha powder, salt and sugar respectively. * Represent there was statistically significant (p<0.05).
Regression
Coefficients
Differences in L*
(∆L*)
Colour
Appearance
Taste
Mouthfeel
Overall acceptability
𝜷𝟎 1.79 72.59* 71.26* 73.48* 69.33* 70.08*
𝜷𝒂 -5.01* 4.26* 3.48* 1.54* -0.19 -0.43
𝜷𝒃 0.40 -2.1 -2.67 2.28* -0.06 -0.11
𝜷𝒄 1.49 -2.63* -1.86 -0.35 -1.64 -1.10
𝜷𝒂𝒃 -0.47 0.67 -1.45 1.00 1.56 1.67
𝜷𝒂𝒄 -1.53 -2.73 -2.40 0.37 -3.0 -3.48
𝜷𝒃𝒄 0.86 -4.00* -3.00 -1.33 -1.45 -2.56
𝜷𝒂𝒂 -1.77 -0.10 1.39 -4.00* 2.08 1.33
𝜷𝒃𝒃 1.19 -5.38* -3.21 0.86 -2.08 -1.97
𝜷𝒄𝒄 0.21 3.23 1.39 1.12 1.75 3.11
R2 0.81 0.91 0.76 0.97 0.51 0.57
Lack of fit 0.74* 0.60* 0.17* 0.50* 0.50* 0.59*

33
4.2 Optimization of Matcha Butter
Equation 4.1 Polynomial Regression Model Generated from the Design for
Equation of Differences in L* (∆L*)
𝑌 = 1.79 − 5.01a + 0.40b + 1.49c − 0.47ab − 1.53ac + 0.86bc − 1.77aa + 1.19bb + 0.21cc
Equation 4.2 Polynomial Regression Model for Colour
𝑌 = 72.59 + 4.26a − 2.10b − 2.63c − 0.67ab − 2.73ac − 4.00bc − 0.10aa − 5.38bb + 3.23cc
Equation 4.3 Polynomial Regression Model for Taste
𝑌 = 73.48 + 1.54a + 2.28b − 0.35c + 1.00ab + 0.37ac − 1.33bc − 4.00aa + 0.86bb + 1.12cc
The optimized results for maximizing sensory scores and minimizing lightness
difference were 10, 3.6 and 7 g respective to matcha powder, salt and sugar. The
interactive effects between the simultaneous variables were shown in next page.

34
4.3 3D Response Surface Graph
4.3.1 3d Response Surface Graph on Colour’s Sensory Score
Figure 4.1 3D Response Surface Graph of the Effect of Matcha Powder and
Salt on Colour Preference.
Based on Figure 4.1, orange region represented desirability. Sensory score of
colour increased by increasing amount of matcha powder. Addition of salt at
level 0 further increased the sensory score.

35
Figure 4.2 3D Response Surface Graph of the Effect of Matcha Powder and
Sugar on Colour.
Based on Figure 4.2, orange region represented desirability. Sensory score of
colour increased by increasing amount of matcha powder. Decreasing sugar
level further increased the sensory score.

36
Figure 4.3 3D Response Surface Graph of the Effect of Sugar and Salt on
Colour.
Based on Figure 4.3, orange region represented desirability. Sensory score of
colour increased by reducing sugar level. Increasing salt level also boosted the
sensory score. However, the sensory score dropped once the salt level exceeded
a point.

37
4.3.2 3D Response Surface Graph On Taste’s Sensory Score
Figure 4.4 3D Response Surface Graph of the Effect of Matcha Powder and Salt
on Taste.
Based on Figure 4.4, orange region represented desirability. Sensory score of
taste increased by increasing salt level. Increasing matcha powder also raised the
taste preference drastically. Yet, the taste preference dropped once matcha
powder exceed a limit.

38
Figure 4.5 3D Response Surface Graph of the Effect of Matcha Powder and
Sugar on Taste.
Based on Figure 4.5, orange region represented desirability. No matter how
much sugar was added, the taste score was found highest when the amount of
matcha powder added was in between level 0 to 0.5.

39
Figure 4.6 3D Response Surface Graph of the Effect of Salt and Sugar on Taste.
Based on Figure 4.6, orange region represented desirability. Sensory score of
taste increased by increasing salt level. Reducing sugar level also increased the
sensory score of taste.

40
4.3.3 3D Response Surface Graph on Different in Lightness ∆L
Figure 4.7 3D Response Surface Graph of the Effect of Matcha Powder and Salt
on Difference in Lightness, ∆L*.
Based on Figure 4.7, orange region represented desirability. The difference in
lightness, ∆L* decreased by reducing matcha powder. Addition of salt did not
cause much changes to the lightness of matcha butter.

41
Figure 4.8 3D Response Surface Graph of the Effect of Matcha Powder and
Sugar on Difference in Lightness, ∆ L*.
Based on the Figure, orange region represented desirability. The difference in
lightness, ∆L* decreased by reducing matcha powder. Increasing sugar level also
helps in reducing the difference in lightness, L*.

42
Figure 4.9 3D Response Surface Graphs of the Effect of Salt and Sugar on
Difference in Lightness, ∆L*.
Based on the figure, orange region represented desirability. The difference in
lightness, ∆L* decreased by increasing both sugar and salt levels.

43
4.4 Determination of Moisture Content and Fat Content on Optimized
Matcha Butter
Based on Table 4.4, the moisture content of optimized matcha butter was 12.42
± 0.035 %. Besides, the fat content of optimized matcha butter was 78.12 ±
0.75 %.
Table 4.4 Mositure Content and Fat Content of the Optimized Matcha Butter.
Moisture content (%) 12.42 ± 0.04
Fat content (%) 78.12 ± 0.75

44
4.5 Temperature Sweep on Optimized Matcha Butter
Table 4.5 Means of Storage Modulus Logarithms (G’), Loss Modulus
Logarithms (G’’) of Optimized Matcha Butter at Different Temperatures.
Temperature
(C)
Log G’
(Pa)
Log G’’
(Pa)
4.98 5.76 5.45
9.99 6.28 5.85
14.99 4.93 4.73
20.00 3.21 3.10
25.00 3.12 2.96
30.00 2.85 2.64
35.01 1.45 1.32
40.01 0.50 0.37
40.00 0.45 0.27
34.97 0.62 0.38
29.98 0.74 0.46
24.98 0.89 0.56
19.96 1.14 0.77
14.99 3.92 3.38
9.99 5.59 5.01
4.98 5.64 5.02

45
Figure 4.10 Graph of Temperature Sweep of the Optimized Matcha Butter
Based on Figure 4.10, log G’(storage modulus) and log G’’(loss modulus) were
plotted as temperatures changed from 5 to 40 C then back to 5 C. Throughout
the graph, the values of log G’ were always higher log G’’. Besides, both the G’
and G’’ were highest at 10 C and lowest at 40 C.
0
1
2
3
4
5
6
7
0 10 20 30 40 50
log
(P
a)
Temperature (C )
G'
G''

46
CHAPTER 5
DISCUSSION
5.1 Formula Optimization
Often, R2 with value more than 0.8 signified a good fit model (Lu, et al, 2017).
In this model, the R2 was highest in “taste” by scoring 0.97. This showed that
the model could not explain 3% of the total variation. Yet, it represents a good
fitness to the model. “Colour” with the R2 of 0.91, indicating 9 % of total
variation was not able to be explained by the model. Then it was followed by
“differences in L*” with R2 of 0.81 showing 19 % of total variation were not
explainable. R2 below 0.8 indicated unfit and will not be taken into consideration.
Besides, “differences in L*”, “colour” and “taste” were found significantly
different at 95 % (p<0.05) thus indicating significant and good fitness to the
model. On contrast, “appearance”, “mouthfeel” and “overall acceptability” were
found not having significantly different at 95 % (p<0.05).
Moreover, the F-value in lack of fit was highest in differences in L* (0.74),
followed by colour (0.60), overall acceptability (0.59), taste (0.50), mouthfeel
(0.50) and lowest in appearance (0.17). High F-value in lack of fit represented
insignificant to pure error. When the F value of lack of fit was 0.74, there was
no significant relation to pure error, as there was only 0.26 chance that the F-
value can be resulted due to noises (Lu, et al, 2017).

47
Based on Regression Coefficients shown in Table 4.3, differences in L* from
colour analysis and colour (%), taste (%) from the sensory evaluation were
chosen as influencing factors to establish the full quadratic models due to P value
< 0.05, lack of fit > 0.05 and R2>0.80.
5.2 Single Factor Evaluation
5.2.1 Influence of the Added Amount of Matcha Powder
The influences of matcha powder added into matcha butter were shown in Figure
4.1 to Figure 4.9. From sensory evaluation, sensory scores of colour were high
as the amount of matcha powder added increased. Next, the sensory scores of
taste increased as the amount of matcha powder added increased, until an extend.
Sensory score of taste were found to be highest when the matcha powder added
at level 0 to 0.5. Excess amount of matcha powder added resulted in lower
sensory score of taste. In addition, difference in lightness, ∆L* was optimized as
the amount of matcha powder added decreased. In conclusion, the optimum
amount for matcha powder added was 10 g (Level + 1) to freshly churned butter.
5.2.2 Influence of the Added Amount of Salt
The influences of salt added into matcha butter were shown in Figure 4.1 to
Figure 4.9. Sensory scores for colour was found highest when the salt was added
at level 0. According to Hoecker (1941) when salt was added, butter milk

48
remaining in milk fat globule attached itself to surface and resulted in lighter
colour. As result, ligher colour of matcha butter increased the sensory scores of
colour. Next, the sensory scores of taste increased by increasing amount of salt
added. In addition, difference in lightness, ∆L* was optimized as amount of salt
added increased, due to the explanation above. As result, the optimum amount
for salt added was 3.6 g (Level + 1) freshly churned butter.
5.2.3 Influence of the Added Amount of Sugar
The influences of sugar added into matcha butter were shown in Figure 4.1 to
Figure 4.9. Sensory scores of colour were high as the amount of sugar added
decreased. When sugar was added to matcha butter and mixed, the resulting
matcha butter posed lighter colour. This was a common practice by mixing butter
with sugar in many bakeries. However, there was no supporting evident to
explain this trend. Next, sensory scores of taste increased by increasing amount
of sugar added. In addition, difference in lightness, ∆L* was optimized when
large amount of sugar was added. Conclusively, the optimum amount for sugar
added was 7 g (Level - 1) to freshly churned butter.

49
5.3 Determination of Moisture Content on Optimized Matcha Butter
Moisture content can be closely associated with the quality of butter (Ronholt,
et al., 2012). Hence, test for moisture content is crucial during butter production
(Ranken, Kill and Baker, 1997). According to the Codex Alimentarius (2011),
butter shall contain no more than 16 % water. As result, most butter
manufacturers tend to increase the moisture content of butter near to 16 % in
order to maximize yield (Ranken, Kill and Baker, 1997).
The moisture content of butter must be well controlled. Since butter is a crystal
network of fat globules, water, and fat crystals. Increasing water content in the
butter changed the ratio of solid and liquid toward more liquid (Ronholt, et al.,
2012). Consequently, the number of contact points between fat crystals
decreased, fat crystal network is weakened (Pedersen et al, 2012). Hence, water
droplet stability and product firmness were greatly reduced (Ronholt, et al.,
2012).
By referring to Table 4.4, the moisture content of optimized matcha butter was
12.42 ± 0.035 %. The moisture content obtained was complied with General
Standard for the Use of Dairy Terms and the General Standard for the Labelling
of Pre-packaged Foods (Codex Alimentarius, 2011).

50
5.4 Determination of Fat Content on Optimized Matcha Butter
Based on Table 4.4, fat content of optimized matcha butter obtained was 78.12
± 0.75%. According to Codex Alimentarius (2011), a butter shall contain
minimum 80 % of milkfat. Since the fat content was lower than 80 %, it can be
categorized as light butter (Frede, 2002).
In commercial butter production, cream was pasteurized, aged and churned at
fixed temperature (Ranken, 1993). The processing temperatures cannot be well
defined as they were varied from every author. However, it was found that
inflation of cream’s temperature during churning resulted in lower fat content of
butter (Ranken, 1993). This evident explained the low fat content matcha butter
obtained. Referring Chapter 3.2, the cream was churned for total 20 minutes to
obtain butter. It was believed that, heat from surrounding and friction of the
agitator raised the temperature of cream during churning. As result, fat content
of butters produced were not up to 80 %.
In addition, commercial butter producers tend to insert proforated line into the
churning machine to assist churning process (Ranken, 1993). Lacking of the
machinery also contributed to the lower fat content in matcha butter.

51
5.5 Temperature Sweep on Optimized Matcha Butter
Temperature sweep is a common technique that used to study the melting ability
of butter and other fats spread (Kanna, 2003). Often, storage modulus (G’) and
loss modulus (G’’) were used to reflect the stress responds of an object. G’ can
be defined as the measurement of the capability of an object to store energy. On
contrast, G’’ is the measurement on the capability of a material to deplete
mechanical energy in the form of heat using molecular motion. (Mark and Borch,
2002). The reading of G’ and G’’ shown were present in the form of log to
emulate the format of another journal (Vithanage, Grimson and Smith, 2009).
By referring to Figure 4.10, all the G’ were greater than G’’, which signified a
gel behavior (Emadzadeh, et al., 2013). When the temperature was increased
from 5 C to 10 C, the storage and loss modulus increased slightly, signaling a
solid like behavior of matcha butter at that temperature (Vithanage, Grimson and
Smith, 2009). This phenomenon was also reported by Mortensen, Knudsen, and
Ronholt in 2013 where the hardness of butter increased when the temperature
was raised from 8 C to 15 C.
However, as temperature increased further, log G’ and log G’’ dropped sharply.
According to Ronholt and other (2012), rising of temperature can greatly reduce
the hardness of butter. Melting process started from the smaller fraction of fat
crystals then followed by larger fat crystals (Mortensen, Knudsen, and Ronholt,
2013). During melting, fats globules were degraded and water molecules

52
coalescence happened (Ronholt, et al., 2012). Thus, the microstructure was
changed and resulted in low G’ and G’’.
Thousand species of triacylglycerol can be easily found in milk fat. Every type
of triacylglycerol was characterized with different melting temperature.
Therefore, the melting temperature of milk fat was ranged between -40 to 40 C
(Wringht, et al., 2001). Based on the graph of temperature sweep, the optimized
matcha butter showed melting behavior in the whole system at 18 C.
Following that was a diatonic decrease of the log G’ and log G’’ values as
temperature raised to 40 C. At 40 C, matcha butter turned and behaved like
liquid form as the value of log G’ and log G’’ were near to 0 (Vithanage,
Grimson and Smith, 2009).
During cooling, the values of log G’ and log G’’ increased in monotonic pattern
until it reached 24 C. As cooling continued, log G’ and log G’’ dropped slightly
and followed by sharp raising when the sample was cooled to 10 C. When the
temperature dropped, crystallization happened as the remaining crystals on plate
absorbed the surrounding liquid fats. As the process continued, larger crystals
grew and resulted in interlink of the fat crystals. Consequently, storage and loss
modulus were restored due to the formation of primary bonds (Mortensen,
Knudsen, and Ronholt, 2013).
53
It was found that the reading of log G’ and log G’’ were slightly higher in the
heating process if compared to the cooling process. This data can be explained
by the different forms of microstructure subjected by the cooling rate (Mortensen,
Knudsen, and Ronholt, 2013). Fast cooling caused a fusion of different
triacylglycerols within the crystal structure and encouraged the formation of α
crystal (Campos, Narine and Marangoni, 2002). As result, soft and unstable
butter was produced, contributing to lower storage and loss modulus (Pedersen,
et al., 2012).
5.6 Future Recommendation
In this study, optimised matcha butter was made and tested for the moisture
content, fat content and meltability. In order to understand more about the
microstructure of matcha butter, freeze fracture microscopy imaging is
recommended to capture the fat crystals and the water in oil suspension network.
Besides, frequency oscillation test can be carried out to determine the
spreadability of butter. In addition, volatile compounds in the matcha butter can
be identified by using gas chromatography mass spectrometry. Next, shelf life
testing can be carried out to evaluate the shelf life of matcha butter.

54
CHAPTER 6
CONCLUSION
In order to make a matcha butter with maximum sensory scores, and minimum
lightness difference. All the data (sensory scores for each attributes and different
in lightness) were keyed in into the JMP software to examine their regression
coefficients. Different in lightness, taste and colour’s sensory scores were found
to have strong interaction by having statistical significant at (p<0.05), lack of fit >
0.5 and R2 > 0.80. Thus they were chosen to establish the full quadratic models.
As result, the optimized formula was obtained by adding 10 g matcha powder,
3.6 g salt and 7 g sugar to 200 g of freshly churned butter with 0.87 desirability.
The influences of matcha powder, salt and sugar to taste sensory scores, colour
sensory scores and different in lightness were studied using 3 dimensional
respond surface graphs.
For profiling purpose, moisture content and fat content test were on the
optimized matcha butter. As result, moisture content was 12.42 % ± 0.04 and
fat content was 78.12% ± 0.75. Moisture content level was found complying
with Malaysia Food Regulations 1985 by not exceeding 16 % moisture.
However, fat content was found not complying with Malaysia Food Regulations
1985 as the fat content was lower than the standard 80 %. Yet, it still can be
categorized as light butter.

55
When subjected to temperature sweep test, butter was heated from 5 C to 40 C
and cooled down to 5 C. Storage and loss modulus showed elastic behaviour and
indicated overall melting behaviour of optimized matcha butter at 18 C.

56
REFERENCE
Auxter, J., 2015. Concious Afternoon Tea. Bloomington: Balbao Press
Ayhan, T., Cüneyt, D., Mehmet, T., İsmail, T., ŞAHİN, N., Ayhan, H., Feramuz,
O., 2014. Turkish Journal of Agriculture and Forestry. Physicochemical
properties of Turkish green tea powder: effects of shooting period, shading, and
clone, 38(2), pp 233-241.
Bezerra, M.A., Santelli, R.E., Oliveira, E.P., Villar, L.S., Escaleira, L.S., 2008.
Response surface methodology (RSM) as a tool for optimization in analytical
chemistry. Tala nta, 76(5), pp. 965-977.
Boskisch, M., 1998. Fats and oil handbook. Hamburg: AOCS Press.
Buldo, P., 2012. Crystallization of fat in and outside milk fat globules -Effect of
processing and storage conditions. PhD. Aarhus University.
Campos, R., Narine, S.S., and Marangoni, A.G., 2002. Effect of cooling rate on
the structure and mechanical properties of milk fat and lard. Food research
international, 35(10), pp. 971-981.

57
Cavazzuti, M., 2013. Optimization Method: From Theory to Design. Modena:
Springer.
Cheadle, L. N., 2016. The Book of Matcha. London: Jacqui Small LLP.
Codex Alimentarius, 2011. Milk and Milk Products. [online] Available at :<
http://www.fao.org/docrep/015/i2085e/i2085e00.pdf> [Accessed 6th August
2017].
Davey, R.J. and Garside, J., 2000. From molecules to crystallizers: an
introduction to crystallization. 1st edition, Oxford: Univ. Press.
Deosakar, S.S., Khedkar, C.D., Kalyankar, S.S., 2016. The Encyclopedia of
Food and Health. [e-book] Oxford: Elsevier. Available through: Google Books:
<https://books.google.com.my/books?id=Ot9BAAAQBAJ&printsec=frontcove
r&dq=encyclopedia+of+food+and+health+2016&hl=en&sa=X&redir_esc=y#v
=onepage&q=encyclopedia%20of%20food%20and%20health%202016&f=fals
e> [Accessed 13th June 2017].

58
Dulloo, A.G., Duret, C., Rohere,D., Girardier, L., Mensi, N., Fathi, M., Chantre,
P., Vandermander, J., 1999. Efficacy of a green tea extract rich in catechin
polyphenols and caffeine in increasing 24-h energy expenditure and fat oxidation
in humans1,2,3. American Journal of Nutrition, 70(6), pp.1040-1045.
Emadzadeh, B., Razavi, S.M.A., Schleining, G., 2013. Dynamic Rheological
and Textural Characteristic Of Low-Calorie Pistachio Butter. International
Journal of Food Properties, 16(3), pp. 512-526.
Frede, R., 2002. Butter and Other Milk Fat Products | Properties and Analysis
Encyclopedia of Dairy Sciences (Second Edition), 1, pp. 227-236.
Global Food Forum, 2017. 2017 Food trend. [online] Available at:
<https://www.globalfoodforums.com/food-news-bites/2017-food-trends/>
[Accessed 13th June 2017].
Guarley, M. and Marangoni., 2005. Physical Properties of Lipid. New York:
Marcel Dekker.
59
Helweg, R., 2010. The Complete Guide To Making Cheese, Butter and Yugurt
At Home: Everything You Need to Know Explained Simply. [e-book] Florida:
Atlantic Publishing. Available through: Google Book <
https://books.google.com.my/books?id=FoeoctrDYC&printsec=frontcover&dq
=butter+make&hl=en&sa=X&redir_esc=y#v=onepage&q=butter%20make&f=
false > [Accessed 6th June 2017].
Herrera, M.L. and Hartel, R.W., 2000. Effect of processing conditions on
physical properties of a milk fat model system. Journal of the American Oil
Chemists' Society, 77(11), pp. 1177–1188.
Hoecker. W.H., 1941. Distribution of salt in butter and its effect on bacterial
action. PhD. Iowa State University.
Juriaanse, A.C. and Heertje, I., 1988. Microstructure of Shortening, Margarine
and Butter- A Review. Food Microstructure Journal, 7(2), pp.181-188.
Kanna, B.M.M., 2003. Texture in Food: Semi-Solid Food. [e-book] Cambridge:
Woodhead. Available through: Google Book :<https://books.google.
com.my/books?id=4xOkAgAAQBAJ&pg=PA54&dq=temperature+sweep+rhe
ology+butter&hl=en&sa=X&redir_esc=y#v=onepage&q=temperature%20swe
ep%20rheology%20butter&f=false>[Accessed 6th August 2017].

60
Katiyar, S.K., 2011. Green tea prevent non melanoma skin cancer by DNA repair.
PubMed, [e-journal] 508(2), pp. 152-158. Available through google website<
https://www.ncbi.nlm.nih.gov/pubmed/21094124 > [Accessed 22nd July 2017].
Kementerian Kesihatan Malaysia, 2014. LAWS OF MALAYSIA P.U.(A) 437 OF
1985 FOOD ACT 1983 FOOD REGULATIONS 1985. [online] Available at: <
http://fsq.moh.gov.my/v5/ms/103-butter/ > [Accessed 21st January 2017].
Khuri, A.I., Mukhopadhyay, S., 2010. Response surface methodology. WIREs
Comp Stat, 2(2), pp. 128-149.
Kloek, W., Vliet, T. and Walstra, P., 2005. Mechanical properties of fat
dispersions prepared in a mechanical crystallizer. Journal of Texture Studies,
36(5), pp. 544–568.
Konica Minolta, 2017. Identifying Color Differences Using L*a*b* or L*C*H*
Coordinates. [Online] Available at: < http://sensing.konicami nolta.us/2014/04/
identifying-color-dif ferences-using-l-a-b-or-l-c-h-coordinates/> [Accessed
23th July 2017]
Lawless, H.T., Heymann, H., 1999. Sensory evaluation of food. New York:
Springer.

61
Lu, H.S., Lv, C.L., Zhang, M.H., Liu, S.Y., Liu, J.T., Lian, F., 2017.
Optimization of hydrothermal pre-treatment for co-utilization C-5 and C-6
sugars of cassava alcohol residue. Energy Conversion and Management. 132, pp.
251-260.
Mahony, F.O., 1988. Rural Diary Technology. Ethiopia: Addis Ababa.
Manohar, M., Joseph, J., Selvaraj, T., Sivakumar, D., 2013. Application of Box
Behnken design to optimize the parameters for turning Inconel 718 using coated
carbide tools. International Journal of Scientific & Engineering Research, 4(4),
pp. 620- 639.
Marangoni, A., 2016. Structure and Mechanical Properties of Fat Crystal
Networks. [online] Available at: <http://www.oleosegorduras.org.br/site/asset
s/arquivo/0c3b7f4b8b4416828b12676e9a8537b7.pdf> [Accessed 21st January
2017].
62
Mark, R.E., Borch, J., 2002. Handbook of Physical Testing of Paper, Volume 1.
[e-book] New York: Marcel Dekker. Available through: Google Book :<
https://books.google.com.my/books?id=Wh_KqCXPn3gC&pg=PA86&dq=stor
age+modulus+and+loss+modulus&hl=en&sa=X&redir_esc=y#v=onepage&qst
orage%20modulus%20and%20loss%20modulus&f=false>[Accessed 6th
August 2017].
Market research future, 2016. Global Matcha Tea Market Information- by type
(caffeinated, decaffeinated), by form (powder, tea bags, loose leaf, and others),
by formulation (flavored and unflavored), by distribution channel (supermarket,
specialty stores, e-commerce, retail stores and others) and by Region Matcha
tea Forecast to 2022. [online] Available at<https:/www.marketresearchfuture.
com/reports/matcha-tea-market-2382> [Accessed 13th July 2017].
Marrero, R.M., 2017. Butter: Microstructure, Raw Material and Manufacturing.
[online]. Available at :< https://prezi.com/wjs6toixea0-/butter-microstructure-
raw-materials-and-manufacturing/> [Accessed 23th June 2017].
Mortensen, K., Knudsen, J.C., Ronholt, S., 2013. The Effective Factors on the
Structure of Butter and Other Milk Fat-Based Products. Comprehensive Reviews
in Food Science and Food Safety. [e-journal] 12(5), pp. 468–482. Available
through Google Website < http://onlinelibrary.wiley.com/d oi/10.1111/15414
337.12022/full>[Accessed 6th August 2017].

63
Mustafa, A.T., Hülya, B., Berrin, O., Yasemin, G., 2012. Box- Behnken
Experimental Design In Factorial Experiments: The Importance Of Bread For
Nutrition And Health. Turkish Journal of Field Crops, 17(2), pp. 115-123.
OECD Agricultural Outlook, 2017. OECD-FAO Agricultural Outlook 2016-
2025. [online] Available at: <http://stats.oecd.org/Index.aspx?datasetcode=H
IGH _AGLINK_2016# > [Accessed 21st January 2017].
Oklahoma. A., 2006. The Chemistry of Butter. [online]. Available at:<
http://www.clover.okstate.edu/fourh/aitc/lessons/butter.pdf> [[Accessed 21st
June 2017.
Pedersen, T.B., Ronholt, S., Kirkensgaard, J.J.K., Mortensen, K., Knudsen,J.C.
2012. Polymorphism, microstructure and rheology of butter. Effect of cream
heat treatment. Food Chemistry, 135(3), pp. 1730-1739.
Potter, N.N. and Hotchkiss, J.H., 1998. Food Science. 5th Edition. New York:
Springer.

64
Qiu, P.P., Cui, M.C., Kang, K.L., Park, B., Son, Y.Y., Khim, E.Y., Min, J., Khim,
J.H., 2014. Application of Box–Behnken design with response surface
methodology for modeling and optimizing ultrasonic oxidation of arsenite with
H2O2. Central European Journal of Chemistry, 12(2), pp. 164-172.
Ranken, M.D., 1993. Food Industry Manual. [e-book] New York: Springer.
Available through: Google Book :< https://books.goo
gle.com.my/books?id=Ca_SBwAAQBAJ&pg=PA81&dq=butter+with+low+fa
t+content&hl=en&sa=X&redir_esc=y#v=onepage&q=butter%20with%20low
%20fat%20content&f=false>[Accessed 6th August 2017].
Ranken, M.D., Kill, R.C., Baker, C.G.J., 1997. Food Industries Manual. [e-book]
Wantage: Blakie Academy. Available through: Google Book :<
https://books.google.com.my/books?id=VM3gBwAAQBAJ&pg=PA128&dq=
butter+moisture+content&hl=en&sa=X&redir_esc=y#v=onepage&q=butter%2
0moisture%20content&f=false> [Accessed 6th August 2017].
Ronholt, S., Kirkensgaard, J.J.K., Mortensen, K., Knudsen, J.C., 2012. Effect of
cream cooling rate and water content on butter microstructure during four weeks
of storage. Food Hydrocolloids, 34 pp. 169-176.
Sahin, S., Sumnu, S.G., 2006. Physical properties of food. United State: Springer.

65
Smith, K., 2016. World Atlas of Tea. London: Octopus Publishing.
Snyder, M., Clum.L., Zulaica, A.V, 2015. The Matcha MIRACLE Boost Energy,
Focus and Health with Green Tea Powder. [e-book] Berkeley: Ulysses Press.
Available through: Google Book < https://books.google.com.my/books?id=EO
ZpCgAAQBAJ&printsec=frontcover&dq=matcha+benefit&hl=en&sa=X&redi
r_esc=y#v=onepage&q=matcha%20benefit&f=false > [Accessed 21st January
2017].
Tetra, 2007. Crystallization Temperature. [online]. Available at <
http://solutionsguide.tetratec.com/index.asp?Page_ID=734&AQ_Magazine_Da
te=Current&AQ_Magazine_ID=2238> [Accessed 25th June 2017].
Timms,R.M., 2007. Fat Crystallisation: mechanism and methods for studying.
[online]. Available at < file:///C:/Users/User/Downloads/RalphTimms %20(5).
Pdf> [Accessed 25th June 2017].
Towler, S., 2010. Cha Dao: The Way of Tea, Tea as a Way of Life. London:
Singing Dragon.

66
Vithanage, C.R., Grimson, M., Smith, B., 2009. The effect of temperature on the
rheology of butter, a spreadable blend and spreads. Journal of Texture Studies,
[e-journal] 40(3), pp. 346-369. Available through Google Website
<https://researchspace.auckland.ac.nz/handle/2292/18376>[Accessed
6thAugust 2017].
Wesdorp, L.H., Marangoni, A.G., 2013. Structure and properties of fat crystal
network. Second edition. Boca Raton, FL: CRC Press/Taylor &
Francis.
Wiking, L., Graef, D.V., Rasmussen, M. and Dewettinck, K., 2009. Relations
between crystallisation mechanisms and microstructure of milk fat.
International Dairy Journal. 19(8), pp. 424-430.
World Heart Federation, 2017. Risk Factors. [online] Available at:<
https://www.world-heart-federation.org/resources/risk-factors/>[Accessed 12nd
July 2017].

67
Wringht, A.J., Marangoni, A.G., Hartel, R.W., Scanion, M.G., 2001.
Rheological Properties of Milkfat and Butter. Journal of Food Science. [e-
journal] 66(8), pp. 1056–1071. Available through Google Website <
http://onlinelibrary.wiley.com/doi/10.1111/j.13652621.2001.tb16082.x/abstract
>[Accessed 6th August 2017].
Zheng, X.X, Xu, T.L, Shao, H.L., Xu, X,L., Rutai, H., Xiao, H.H., 2011. Green
tea intake lower fasting serum total LDL cholesterol in adults: a meta-analysis
of 14 randomized controlled trials. American Journal of Nutrition. 94(2), pp.
601-610.

68
APPENDIX A
OUTPUT OF RESPDONS SURFACE METHODOLOGY
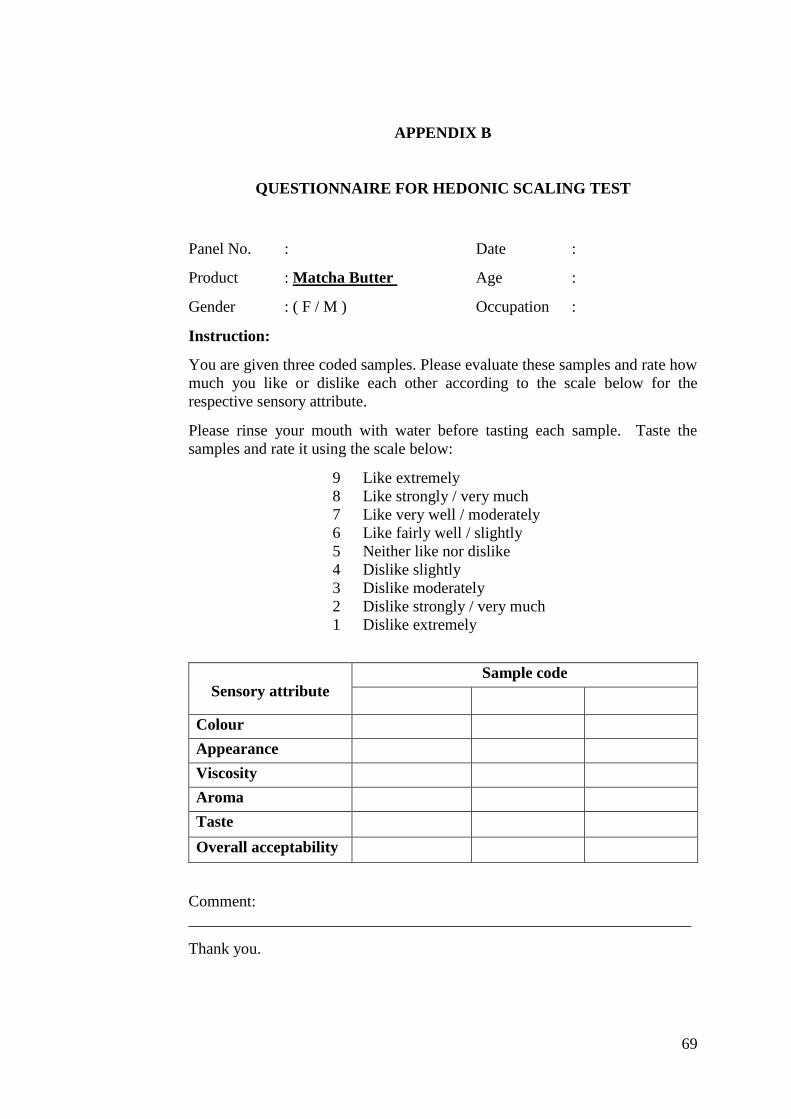
69
APPENDIX B
QUESTIONNAIRE FOR HEDONIC SCALING TEST
Panel No. : Date :
Product : Matcha Butter Age :
Gender : ( F / M ) Occupation :
Instruction:
You are given three coded samples. Please evaluate these samples and rate how
much you like or dislike each other according to the scale below for the
respective sensory attribute.
Please rinse your mouth with water before tasting each sample. Taste the
samples and rate it using the scale below:
9 Like extremely
8 Like strongly / very much
7 Like very well / moderately
6 Like fairly well / slightly
5 Neither like nor dislike
4 Dislike slightly
3 Dislike moderately
2 Dislike strongly / very much
1 Dislike extremely
Sensory attribute
Sample code
Colour
Appearance
Viscosity
Aroma
Taste
Overall acceptability
Comment:
_______________________________________________________________
Thank you.