Embed Size (px)
Citation preview
Fort Collins Terrestrial Greenhouse
Gas Inventory and Mitigation
Potential Detailed Methodology Report
August 2017
PREPARED FOR:
The City of Fort Collins
PROJECT TEAM:
Cascadia Consulting Group
ECOFOR LLC
Keys Consulting
TABLE OF CONTENTS Fort Collins Terrestrial Greenhouse Gas Inventory and Mitigation Potential
DETAILED METHODOLOGY REPORT | 2
Table of Contents
Acknowledgements ........................................................................................................................................................ 3
Introduction....................................................................................................................................................................... 4
Key Findings ...................................................................................................................................................................... 6
Project Scope ................................................................................................................................................................. 12
Approach ......................................................................................................................................................................... 17
Other Considerations .................................................................................................................................................. 19
Climate Change ........................................................................................................................................................ 19
Emerald Ash Borer ................................................................................................................................................... 19
Business-as-Usual Emissions and Mitigation from Lands............................................................................. 21
Trees ............................................................................................................................................................................. 23
Grasslands and Turf ................................................................................................................................................ 31
Impervious Surface ................................................................................................................................................. 38
Soil Practices .............................................................................................................................................................. 41
Mitigation Options ...................................................................................................................................................... 45
Recommendations ....................................................................................................................................................... 60
References....................................................................................................................................................................... 61
ACKNOWLEDGEMENTS Fort Collins Terrestrial Greenhouse Gas Inventory and Mitigation Potential
DETAILED METHODOLOGY REPORT | 3
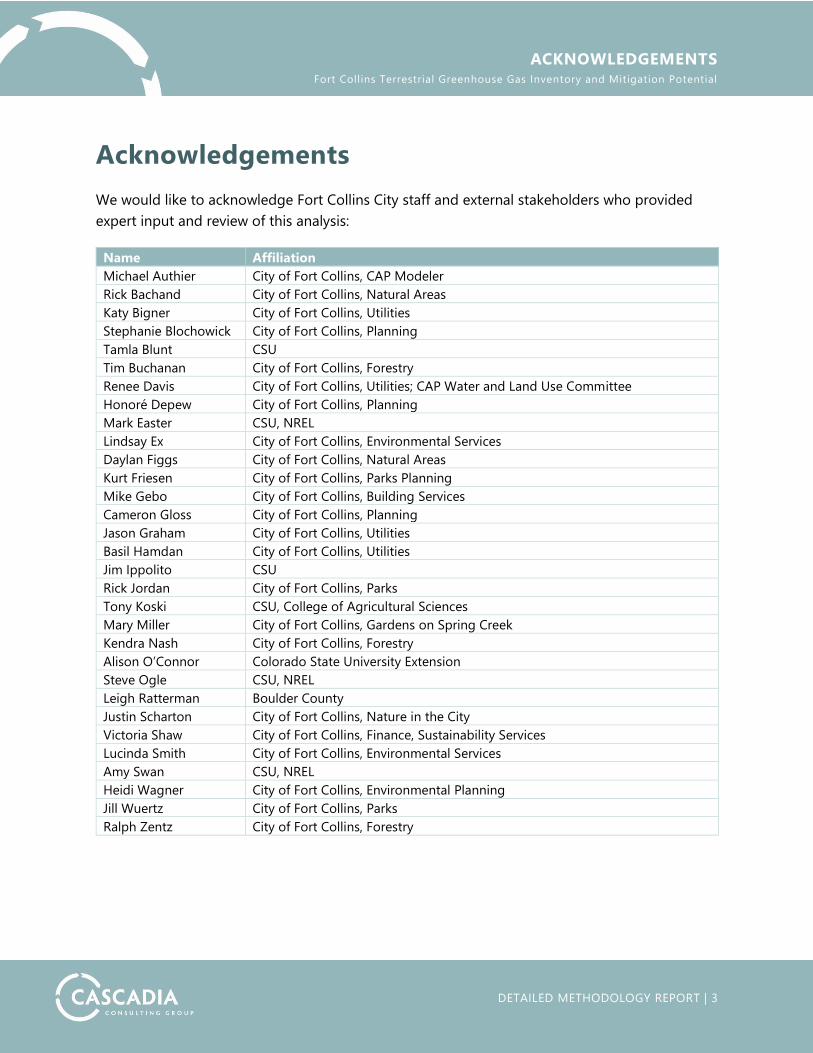
Acknowledgements
We would like to acknowledge Fort Collins City staff and external stakeholders who provided
expert input and review of this analysis:
Name Affiliation
Michael Authier City of Fort Collins, CAP Modeler
Rick Bachand City of Fort Collins, Natural Areas
Katy Bigner City of Fort Collins, Utilities
Stephanie Blochowick City of Fort Collins, Planning
Tamla Blunt CSU
Tim Buchanan City of Fort Collins, Forestry
Renee Davis City of Fort Collins, Utilities; CAP Water and Land Use Committee
Honoré Depew City of Fort Collins, Planning
Mark Easter CSU, NREL
Lindsay Ex City of Fort Collins, Environmental Services
Daylan Figgs City of Fort Collins, Natural Areas
Kurt Friesen City of Fort Collins, Parks Planning
Mike Gebo City of Fort Collins, Building Services
Cameron Gloss City of Fort Collins, Planning
Jason Graham City of Fort Collins, Utilities
Basil Hamdan City of Fort Collins, Utilities
Jim Ippolito CSU
Rick Jordan City of Fort Collins, Parks
Tony Koski CSU, College of Agricultural Sciences
Mary Miller City of Fort Collins, Gardens on Spring Creek
Kendra Nash City of Fort Collins, Forestry
Alison O’Connor Colorado State University Extension
Steve Ogle CSU, NREL
Leigh Ratterman Boulder County
Justin Scharton City of Fort Collins, Nature in the City
Victoria Shaw City of Fort Collins, Finance, Sustainability Services
Lucinda Smith City of Fort Collins, Environmental Services
Amy Swan CSU, NREL
Heidi Wagner City of Fort Collins, Environmental Planning
Jill Wuertz City of Fort Collins, Parks
Ralph Zentz City of Fort Collins, Forestry
INTRODUCTION Fort Collins Terrestrial Greenhouse Gas Inventory and Mitigation Potential
DETAILED METHODOLOGY REPORT | 4
Introduction
This report presents detailed methodologies, assumptions, and findings associated with an
analysis that inventoried the flux of greenhouse gases (GHG) from lands within the growth
management area (GMA) of Fort Collins and City-owned natural areas outside the GMA. The
analysis projects these terrestrial emissions and sinks through the year 2050 under current
policies and trends, and identifies policy actions for further reducing emissions or increasing
absorption of GHGs beyond the business-as-usual scenario. Outcomes for the analysis will
inform future management decisions by the City of Fort Collins to optimize carbon
sequestration in the context of other City plans, priorities, and considerations. Outcomes are
summarized in an accompanying final report document (“Advancing Fort Collins’ Climate Goals
Through Land Carbon Management”) and calculated in an accompanying Microsoft Excel model.
Ultimately, this analysis will serve to offer guidelines for strategic initiatives to help reach 2020
community carbon reduction goals and provide guidance for the 2030 and 2050 goals.
This analysis assessed fluxes associated with three greenhouse gases emitted or taken up by
lands: carbon dioxide (CO2), methane (CH4), and nitrous oxide (N2O). Land management affects
the emission and uptake of these substances. Plants take in CO2 and break the molecules into
carbon and oxygen, and some of the carbon is incorporated into plant tissues. Trees, by dry
weight, are approximately half carbon. If a tree dies and the wood rots or is burned, the carbon
in that tree is returned to the atmosphere as CO2. Plant and microbial activity can increase soil
organic matter. Soil organic matter is approximately 58% carbon, and this carbon generally
comes from the atmosphere via plant tissues and other products of photosynthesis. Methane
may be produced by wet soils under certain conditions, and generally dry soils absorb small
amounts of methane from the atmosphere. The bulk of N2O fluxes involving soil are emissions
following from application of nitrogen fertilizer.
INTRODUCTION Fort Collins Terrestrial Greenhouse Gas Inventory and Mitigation Potential
DETAILED METHODOLOGY REPORT | 5
A note on terminology and numbers in this report:
The word “sequestration” refers to soil and vegetation taking in CO2 from the air, and
keeping the carbon in organic material, thus absorbing the GHG from the atmosphere.
Sequestered carbon adds to the stock of carbon in woody biomass or soil organic matter.
The carbon stock is the sum of all past sequestration, minus emissions of stored carbon. An
example of an emission of carbon from the stock of stored carbon is a tree dying and the
wood decomposing, and the carbon in the wood being converted to CO2 and being emitted
to the atmosphere through decomposition. Some other documents use the word
“sequestration” to refer to either the flow of GHG out of the atmosphere, or the stock of
stored carbon that has been removed from the atmosphere. To reduce confusion, we use
the word “sequestration” to refer only to the flow (not the stock) and try to make this usage
clear from the context. In this report, the word “sink” is used as shorthand for the removal of
GHGs from the atmosphere and sequestration of carbon in woody biomass or soil.
Sometimes sinks are reported as negative emissions. Sequestration is GHG mitigation, by
removing GHGs from the atmosphere. Also, GHG mitigation can be achieved by reducing
emissions.
We round all numbers in the report to no more than two significant digits, because these
estimates have uncertainties of at least +/-1%, and reporting more digits would provide a
skewed estimate of accuracy. As a result, when large and small emissions and sinks are
summed, the small categories can disappear due to rounding. Totals reported in tables are
calculated before rounding, so totals may not exactly match the sum of the numbers
provided in the table.
INTRODUCTION Fort Collins Terrestrial Greenhouse Gas Inventory and Mitigation Potential
DETAILED METHODOLOGY REPORT | 6
Key Findings
The carbon sequestration potential analysis resulted in the following key findings, detailed
further in this report.
WHAT ARE THE CURRENT LAND GHG EMISSIONS AND SINKS IN FORT COLLINS?
Table 1 below summarizes the main sources and sinks of GHG emissions from land and land use
change on all lands within the Fort Collins GMA and on City-owned natural areas outside the
GMA.
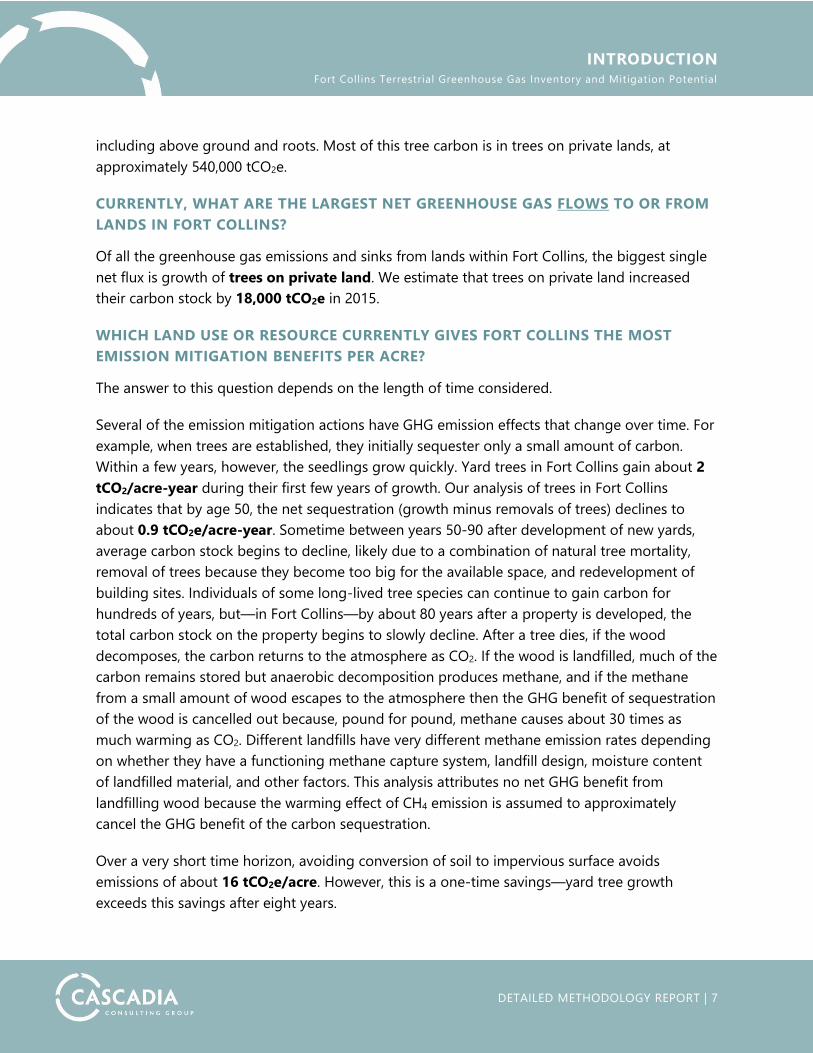
Table 1. Current land GHG emissions and sinks in Fort Collins (negative number is sink)
Source 2015 tCO2e
Private land within GMA -27,000
City land within GMA -2,900
Conversion to impervious surface from development 1,700
Natural areas outside GMA -3,600
Soil carbon sequestration from biosolids application -300
Fertilizer nitrous oxide, all lands within GMA 1,600
TOTAL YEAR 2015 -31,000
HOW MUCH LAND CARBON SEQUESTRATION CAN WE EXPECT OVER TIME IN FORT
COLLINS?
Table 2 below summarizes our estimated net tree and soil carbon sequestration on all lands
(public and private) within the Fort Collins GMA, under a business-as-usual scenario (net of soil
and fertilizer emissions):
Table 2. Anticipated land GHG emissions and sinks on all lands within the Fort Collins GMA (negative number
is sink)
Baseline Business-as-Usual
2015 2020 2030 2050 2016-2050
Sequestration( tCO2e ) -31,000 -24,000 -24,000 -16,000 -740,000
WHAT ARE THE CURRENT LARGEST STORES OF CARBON ON LANDS WITHIN FORT
COLLINS?
Soil is the largest terrestrial carbon stock in Fort Collins. In 2015, soil carbon in the top 20 cm of
soil is estimated to be 3,300,000 tCO2e all lands within the Growth Management Area, including
both public and private lands. The second largest carbon stock in Fort Collins is trees. In 2015,
we estimate that tree carbon on lands within the Fort Collins GMA totaled 620,000 tCO2e,
INTRODUCTION Fort Collins Terrestrial Greenhouse Gas Inventory and Mitigation Potential
DETAILED METHODOLOGY REPORT | 7
including above ground and roots. Most of this tree carbon is in trees on private lands, at
approximately 540,000 tCO2e.
CURRENTLY, WHAT ARE THE LARGEST NET GREENHOUSE GAS FLOWS TO OR FROM
LANDS IN FORT COLLINS?
Of all the greenhouse gas emissions and sinks from lands within Fort Collins, the biggest single
net flux is growth of trees on private land. We estimate that trees on private land increased
their carbon stock by 18,000 tCO2e in 2015.
WHICH LAND USE OR RESOURCE CURRENTLY GIVES FORT COLLINS THE MOST
EMISSION MITIGATION BENEFITS PER ACRE?
The answer to this question depends on the length of time considered.
Several of the emission mitigation actions have GHG emission effects that change over time. For
example, when trees are established, they initially sequester only a small amount of carbon.
Within a few years, however, the seedlings grow quickly. Yard trees in Fort Collins gain about 2
tCO2/acre-year during their first few years of growth. Our analysis of trees in Fort Collins
indicates that by age 50, the net sequestration (growth minus removals of trees) declines to
about 0.9 tCO2e/acre-year. Sometime between years 50-90 after development of new yards,
average carbon stock begins to decline, likely due to a combination of natural tree mortality,
removal of trees because they become too big for the available space, and redevelopment of
building sites. Individuals of some long-lived tree species can continue to gain carbon for
hundreds of years, but—in Fort Collins—by about 80 years after a property is developed, the
total carbon stock on the property begins to slowly decline. After a tree dies, if the wood
decomposes, the carbon returns to the atmosphere as CO2. If the wood is landfilled, much of the
carbon remains stored but anaerobic decomposition produces methane, and if the methane
from a small amount of wood escapes to the atmosphere then the GHG benefit of sequestration
of the wood is cancelled out because, pound for pound, methane causes about 30 times as
much warming as CO2. Different landfills have very different methane emission rates depending
on whether they have a functioning methane capture system, landfill design, moisture content
of landfilled material, and other factors. This analysis attributes no net GHG benefit from
landfilling wood because the warming effect of CH4 emission is assumed to approximately
cancel the GHG benefit of the carbon sequestration.
Over a very short time horizon, avoiding conversion of soil to impervious surface avoids
emissions of about 16 tCO2e/acre. However, this is a one-time savings—yard tree growth
exceeds this savings after eight years.
INTRODUCTION Fort Collins Terrestrial Greenhouse Gas Inventory and Mitigation Potential
DETAILED METHODOLOGY REPORT | 8
Applying compost or biosolids as a soil amendment can increase soil carbon substantially. Fort
Collins applies biosolids at a low rate of 2.8 tons/acre, so the sequestration is modest, and
estimated to be 0.37 tCO2e/acre-year. At this rate, biosolids could be applied at least 10 times
and still be sequestering substantial soil carbon (Sullivan et al., 2006), but at some point soil
carbon stocks stop rising because the soils reach their carbon retention limit. At current
application rates, soils could continue to gain carbon well beyond 2050.
Switching fertilizer type from synthetic nitrogen to compost can provide benefits for as long as
synthetic fertilizer is not used. Benefits vary by fertilizer application rate, soil wetness, and other
factors. For an average fertilizer application rate for lawns and grazing land in the Fort Collins
area, the emission reduction is approximately 0.57tCO2e/acre-year. In addition to this on-site
benefit, switching from synthetic nitrogen fertilizer to compost would also have an additional
reduction in emissions from manufacturing fertilizer of 0.22tCO2e/acre-year. This benefit is not
counted in this inventory because it occurs at fertilizer manufacturing plants outside the
boundary of the Fort Collins terrestrial GHG inventory.
WHAT ARE THE LARGEST OPPORTUNITIES FOR ADDITIONAL CARBON
SEQUESTRATION IN FORT COLLINS, BEYOND WHAT IS ALREADY HAPPENING
UNDER CURRENT POLICIES AND TRENDS?
Taking technical and political feasibility into account, we arrived at the following
recommendations for managing carbon sequestration on Fort Collins lands, described below:
Divert organic wastes currently landfilled to compost production and apply to
agricultural lands, natural areas, and grasslands.
Yard tree planting.
Replace synthetic nitrogen fertilizer with compost.
Restore riparian forests.
If it is economically feasible, diverting organic waste from landfill disposal to make compost
and apply the compost as a soil amendment could provide the largest emission mitigation of
any of the potential activities identified for Fort Collins. Assuming a program that—when fully
operational—diverts two thirds of organic waste from landfills to compost production, this
activity could be provide 550,000 tCO2e of net emission mitigation through 2050, with GHG
benefits continuing after 2050. Approximately 80% of this GHG benefit is from reducing landfill
methane emissions from food waste.1 Approximately 20% of the benefit is from soil carbon
1 Landfill emissions are currently estimated in the existing City GHG inventory. This analysis addresses terrestrial emissions and sinks not currently included in the Fort Collins GHG inventory. Therefore, landfill emissions are not included in the baseline in this analysis, although a reduction in landfill emissions would be a side effect of this mitigation activity.
INTRODUCTION Fort Collins Terrestrial Greenhouse Gas Inventory and Mitigation Potential
DETAILED METHODOLOGY REPORT | 9
sequestration from applying the compost to soil. These estimates include a reduction in carbon
sequestration in landfilled wood.
Currently, the largest single component of terrestrial carbon sequestration in Fort Collins is
growth of trees on private lands, especially yard trees. This baseline sequestration is
approximately 18,000 tCO2e/year. However, through 2050, it is not clear how much this
sequestration could be increased above the baseline amounts, due to the limited land supply
and competing uses for land. Despite these competing demands for space, Fort Collins staff
estimate that 15% of the physically suitable space could be planted into trees under a vigorous
promotion program, and this amount of tree planting could sequester a cumulative amount of
approximately 150,000 tCO2e through 2050, with additional sequestration beyond that year as
well.
A program to expand replacement of synthetic nitrogen fertilizer with compost could
reduce soil increase soil carbon storage by about 120,000 tCO2e through 2050, with benefits
continuing after 2050. This scenario assumes a different source of composted material other
than that which is currently landfilled (benefits from locally-produced compost are quantified in
the “diverting organic waste…” scenario). In addition to the soil carbon sequestration benefit,
this program could also reduce emissions from manufacturing fertilizer by an additional
estimated 48,000 tCO2e through 2050. This additional benefit is not counted in this inventory
because it is outside the traditional boundary of the Fort Collins GHG inventory.
Growing trees can sequester large amounts of carbon, but requires space to grow. The largest
publically-owned space identified for tree carbon sequestration in Fort Collins is riparian
natural areas along the Poudre River. The Fort Collins Natural Areas program has identified
priority restoration areas within its strategic plan. Because riparian restoration takes time, many
GHG benefits of this opportunity would occur after 2050. If the current riparian forest restoration
program is expanded, then by 2050, riparian restoration could sequester an additional
cumulative amount of 20,000 tCO2, beyond what is expected to be sequestered under the
existing riparian restoration program. Sequestration would continue after 2050 at a rate of more
than 1,000 tCO2e/year.
Wildfire has the potential to release massive amounts of CO2 through forest combustion and
inhibition of new tree growth. For this reason, management of forests outside the GMA
Watershed also presents a potentially large carbon sequestration opportunity. Regional climate
change and a history of fire exclusion is increasing the risk of very large, high severity wildfires
that not only consume swaths of forest, understory vegetation, and organic material on the
forest floor, but also inhibit post-fire forest regeneration. We have limited data on the forests in
City natural areas, but using general factors for dry Rocky Mountain forests, there is likely about
INTRODUCTION Fort Collins Terrestrial Greenhouse Gas Inventory and Mitigation Potential
DETAILED METHODOLOGY REPORT | 10
200,000 tCO2e in tree biomass in Fort Collins natural areas outside the GMA boundary. Most of
this biomass is in the natural areas west of town in the Foothills zone—especially Bobcat Ridge.
In addition, the watersheds that supply the City’s drinking water encompass 1,016 square miles
of land outside the City-owned natural areas and GMA, and 57% of this area is covered by forest
or brush and susceptible to impacts of wildfires. Although the City does not own these
watershed lands, it does have some influence over management of the lands through
cooperative agreements. These forests are adapted to regular occurrence of wildfires, and the
key to forest management efforts is to restore the forests to a more natural fire frequency, size
and intensity. Current forest restoration efforts aim to improve forest health and reduce the
scale and intensity of wildfires that do occur. Because it is impossible to make specific
predictions about intense fires years in the future, we could not quantify avoided emissions with
sufficient certainty to be included in this analysis.
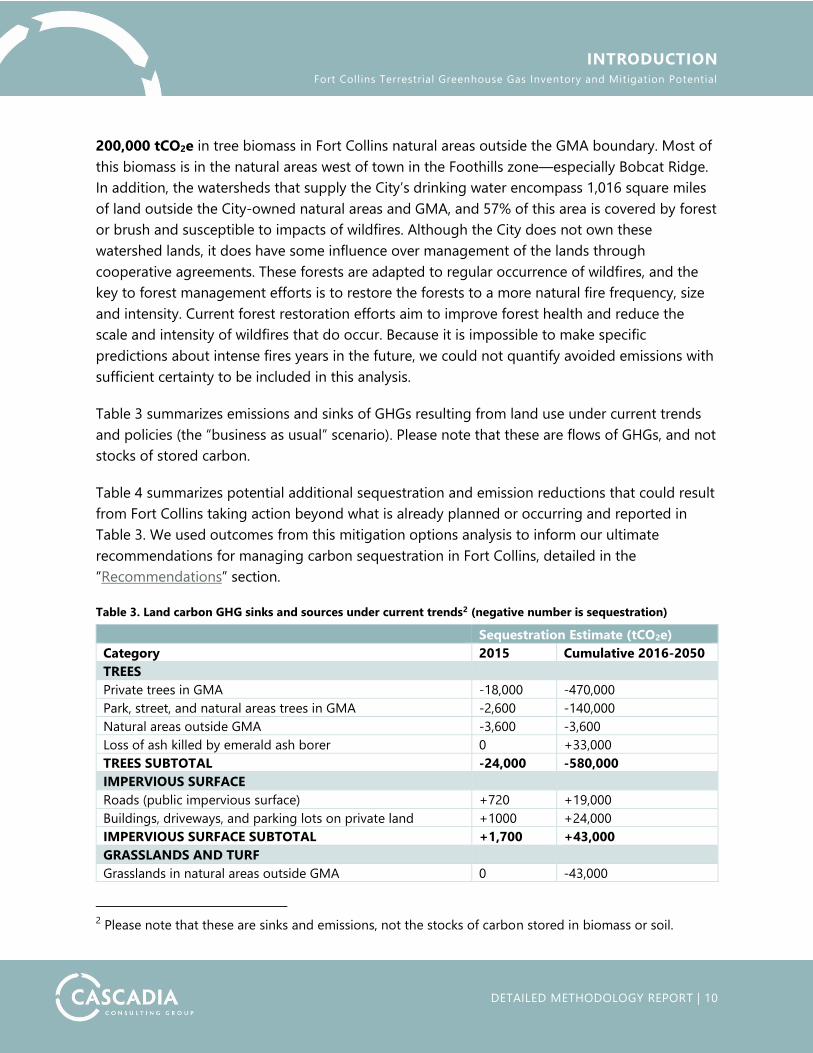
Table 3 summarizes emissions and sinks of GHGs resulting from land use under current trends
and policies (the “business as usual” scenario). Please note that these are flows of GHGs, and not
stocks of stored carbon.
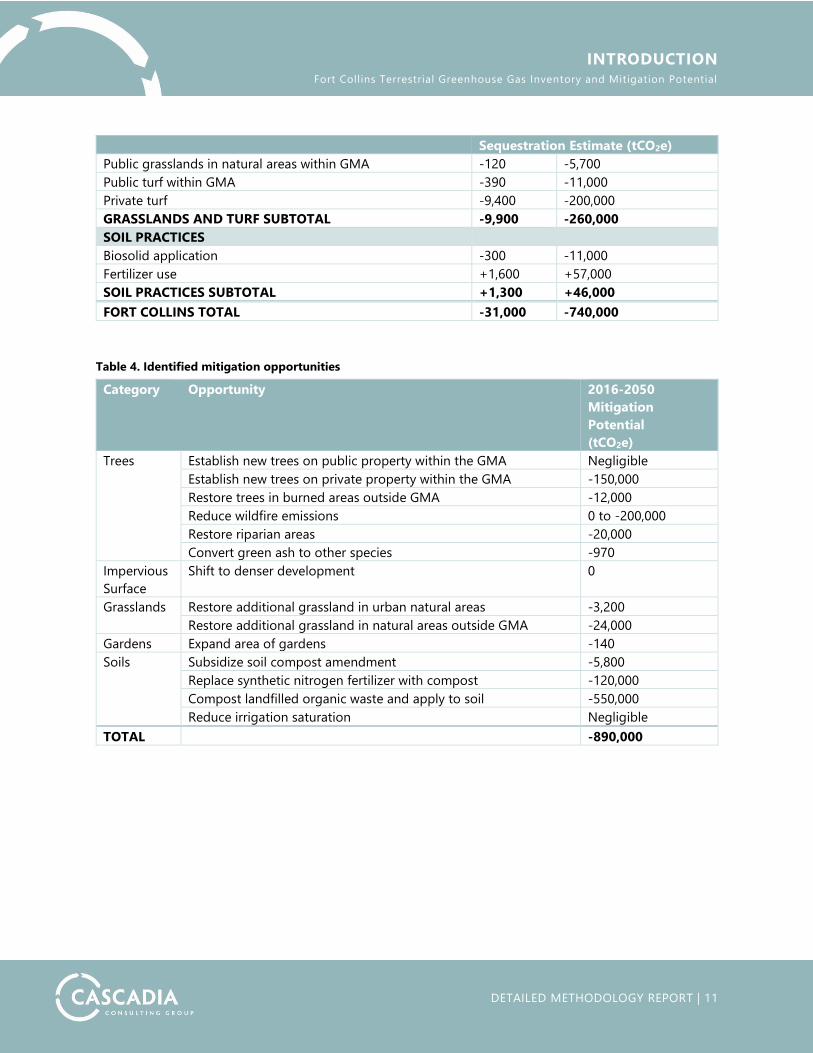
Table 4 summarizes potential additional sequestration and emission reductions that could result
from Fort Collins taking action beyond what is already planned or occurring and reported in
Table 3. We used outcomes from this mitigation options analysis to inform our ultimate
recommendations for managing carbon sequestration in Fort Collins, detailed in the
“Recommendations” section.
Table 3. Land carbon GHG sinks and sources under current trends2 (negative number is sequestration)
Sequestration Estimate (tCO2e)
Category 2015 Cumulative 2016-2050
TREES
Private trees in GMA -18,000 -470,000
Park, street, and natural areas trees in GMA -2,600 -140,000
Natural areas outside GMA -3,600 -3,600
Loss of ash killed by emerald ash borer 0 +33,000
TREES SUBTOTAL -24,000 -580,000
IMPERVIOUS SURFACE
Roads (public impervious surface) +720 +19,000
Buildings, driveways, and parking lots on private land +1000 +24,000
IMPERVIOUS SURFACE SUBTOTAL +1,700 +43,000
GRASSLANDS AND TURF
Grasslands in natural areas outside GMA 0 -43,000
2 Please note that these are sinks and emissions, not the stocks of carbon stored in biomass or soil.
INTRODUCTION Fort Collins Terrestrial Greenhouse Gas Inventory and Mitigation Potential
DETAILED METHODOLOGY REPORT | 11
Sequestration Estimate (tCO2e)
Public grasslands in natural areas within GMA -120 -5,700
Public turf within GMA -390 -11,000
Private turf -9,400 -200,000
GRASSLANDS AND TURF SUBTOTAL -9,900 -260,000
SOIL PRACTICES
Biosolid application -300 -11,000
Fertilizer use +1,600 +57,000
SOIL PRACTICES SUBTOTAL +1,300 +46,000
FORT COLLINS TOTAL -31,000 -740,000
Table 4. Identified mitigation opportunities
Category Opportunity 2016-2050
Mitigation
Potential
(tCO2e)
Trees Establish new trees on public property within the GMA Negligible
Establish new trees on private property within the GMA -150,000
Restore trees in burned areas outside GMA -12,000
Reduce wildfire emissions 0 to -200,000
Restore riparian areas -20,000
Convert green ash to other species -970
Impervious
Surface
Shift to denser development 0
Grasslands Restore additional grassland in urban natural areas -3,200
Restore additional grassland in natural areas outside GMA -24,000
Gardens Expand area of gardens -140
Soils Subsidize soil compost amendment -5,800
Replace synthetic nitrogen fertilizer with compost -120,000
Compost landfilled organic waste and apply to soil -550,000
Reduce irrigation saturation Negligible
TOTAL -890,000
INTRODUCTION Fort Collins Terrestrial Greenhouse Gas Inventory and Mitigation Potential
DETAILED METHODOLOGY REPORT | 12
Project Scope
The inventory included carbon sequestration quantification for the following scenarios,
described in more detail in the sections below:
A business-as-usual carbon sequestration scenario that models carbon stored and
sequestered on Fort Collins lands from 2015 to 2050.
Management or “mitigation” scenarios that model opportunities for the City to
further enhance carbon sequestration on Fort Collins lands.
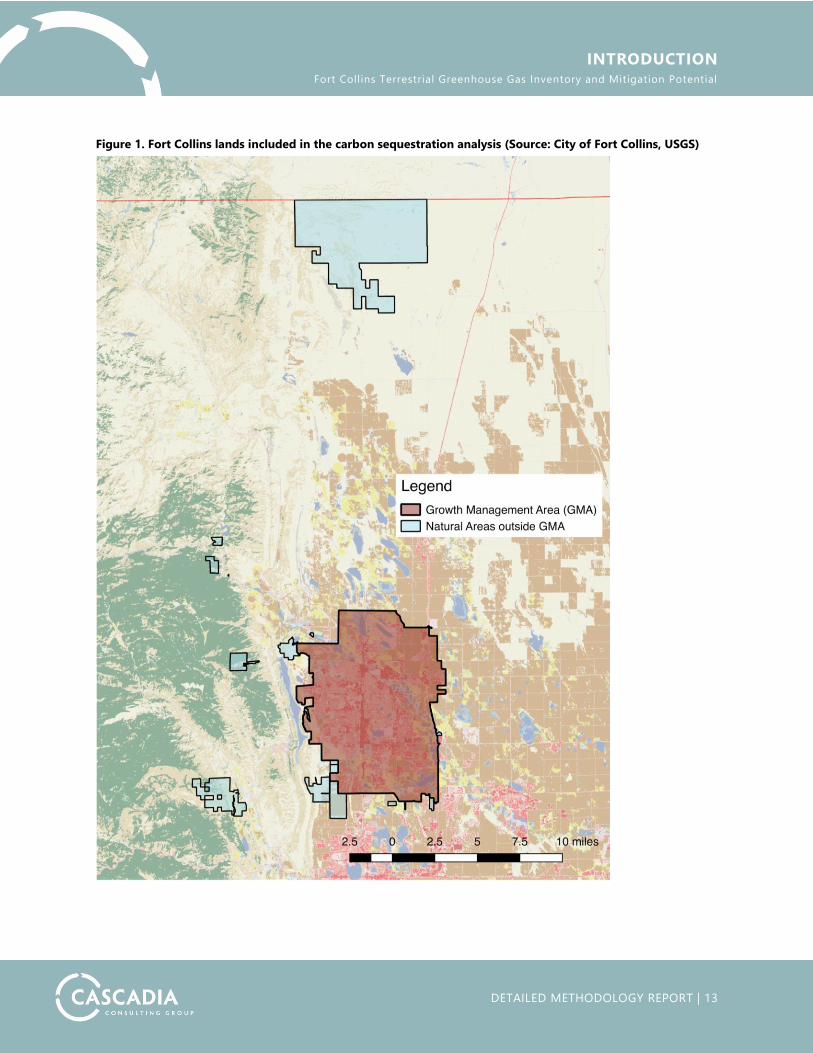
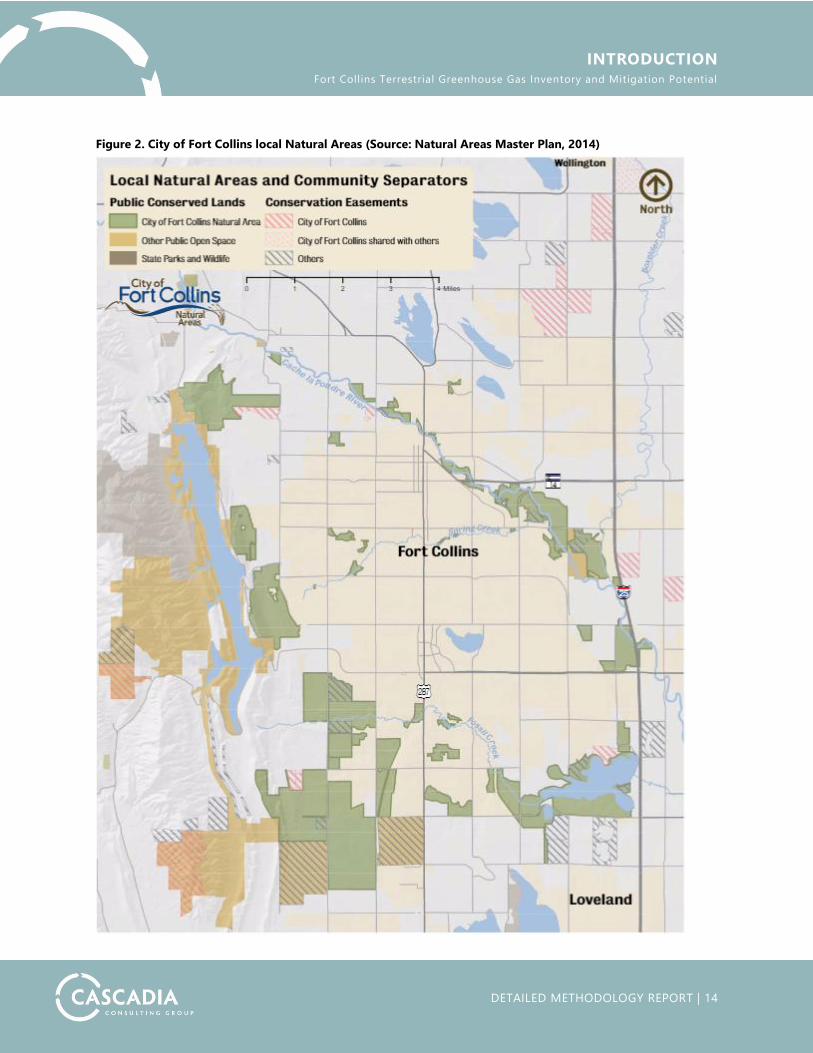
Fort Collins lands in this report is defined as all areas within the Growth Management Area
(GMA) and within the City’s natural areas outside the GMA (see a map of these areas in Figure 1
below). According to the 2014 Natural Areas Master Plan, the City owns approximately 35,000
acres within 43 local and regional natural areas of publicly conserved lands (see maps of natural
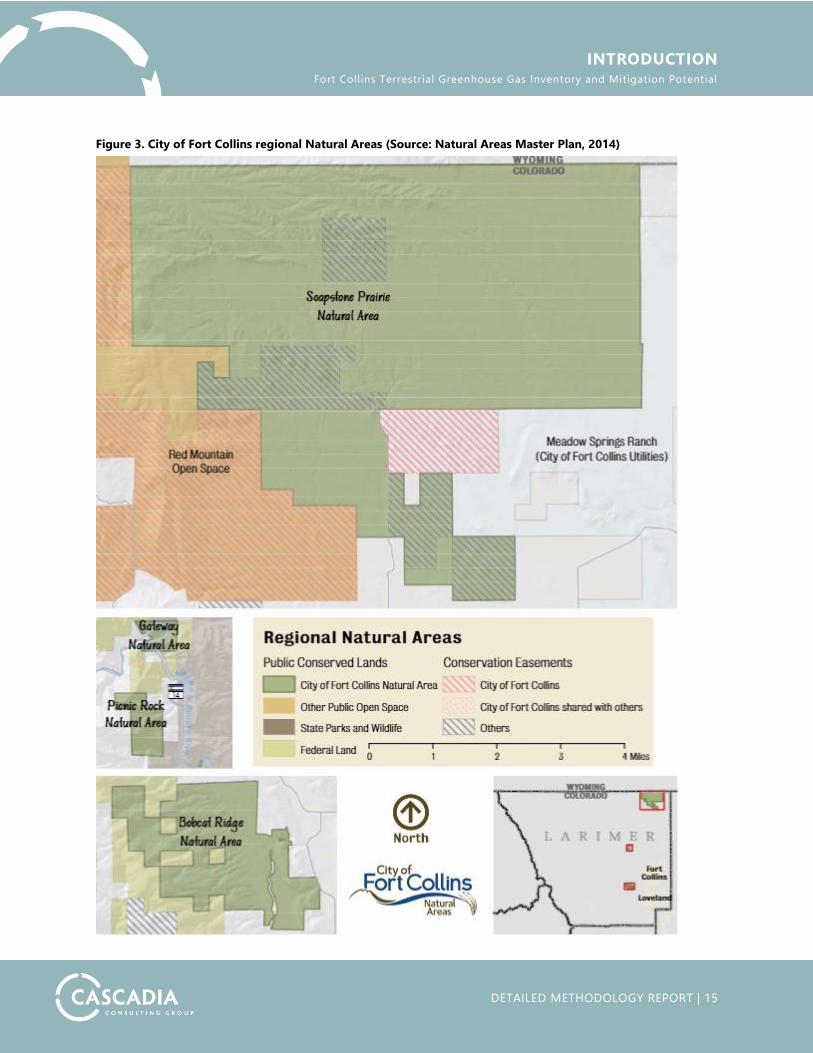
areas in Figures 2 and 3). Regional natural areas include the Gateway, Picnic Rock, Bobcat Ridge,
and Soapstone Prairie natural areas. The Soapstone Prairie Natural Area is the largest of these
areas with over 22,000 acres of grassland, shrubland, and wetland and riparian habitat. The City
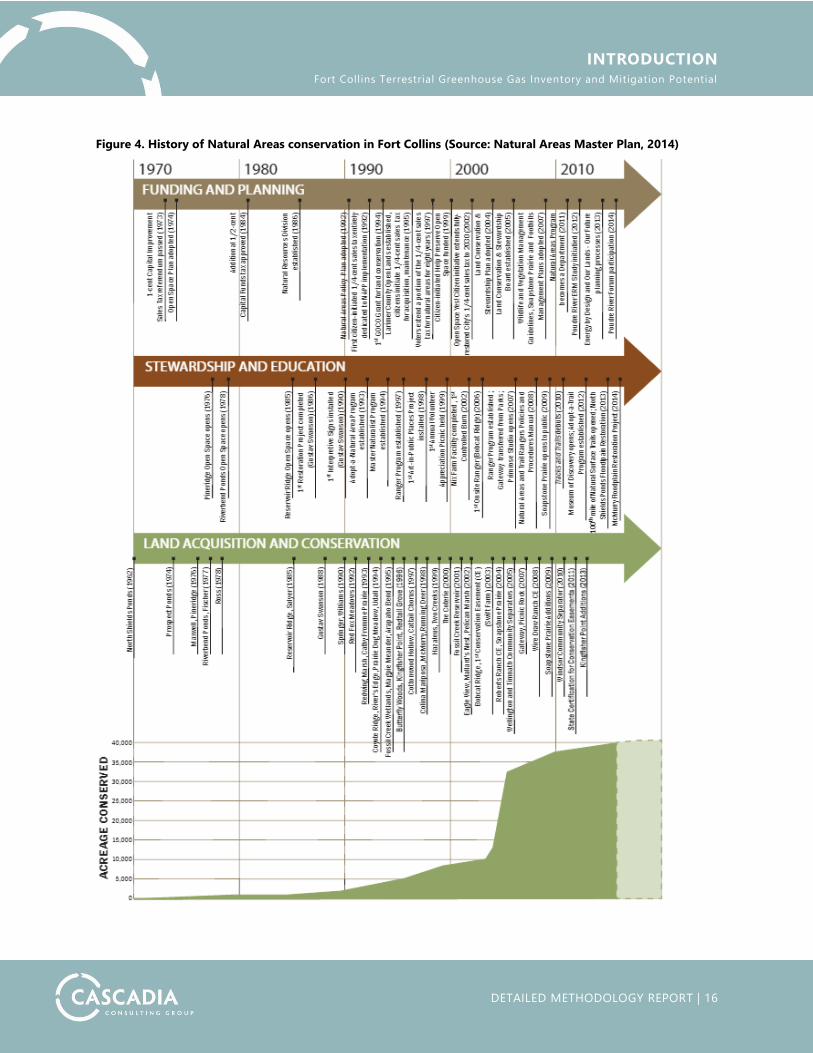
has increased its rate of land conservation over the past decade and is continuing to conserve
new lands into the future (see Figure 4).
INTRODUCTION Fort Collins Terrestrial Greenhouse Gas Inventory and Mitigation Potential
DETAILED METHODOLOGY REPORT | 13
Figure 1. Fort Collins lands included in the carbon sequestration analysis (Source: City of Fort Collins, USGS)
INTRODUCTION Fort Collins Terrestrial Greenhouse Gas Inventory and Mitigation Potential
DETAILED METHODOLOGY REPORT | 14
Figure 2. City of Fort Collins local Natural Areas (Source: Natural Areas Master Plan, 2014)
INTRODUCTION Fort Collins Terrestrial Greenhouse Gas Inventory and Mitigation Potential
DETAILED METHODOLOGY REPORT | 15
Figure 3. City of Fort Collins regional Natural Areas (Source: Natural Areas Master Plan, 2014)
INTRODUCTION Fort Collins Terrestrial Greenhouse Gas Inventory and Mitigation Potential
DETAILED METHODOLOGY REPORT | 16
Figure 4. History of Natural Areas conservation in Fort Collins (Source: Natural Areas Master Plan, 2014)
INTRODUCTION Fort Collins Terrestrial Greenhouse Gas Inventory and Mitigation Potential
DETAILED METHODOLOGY REPORT | 17
Approach
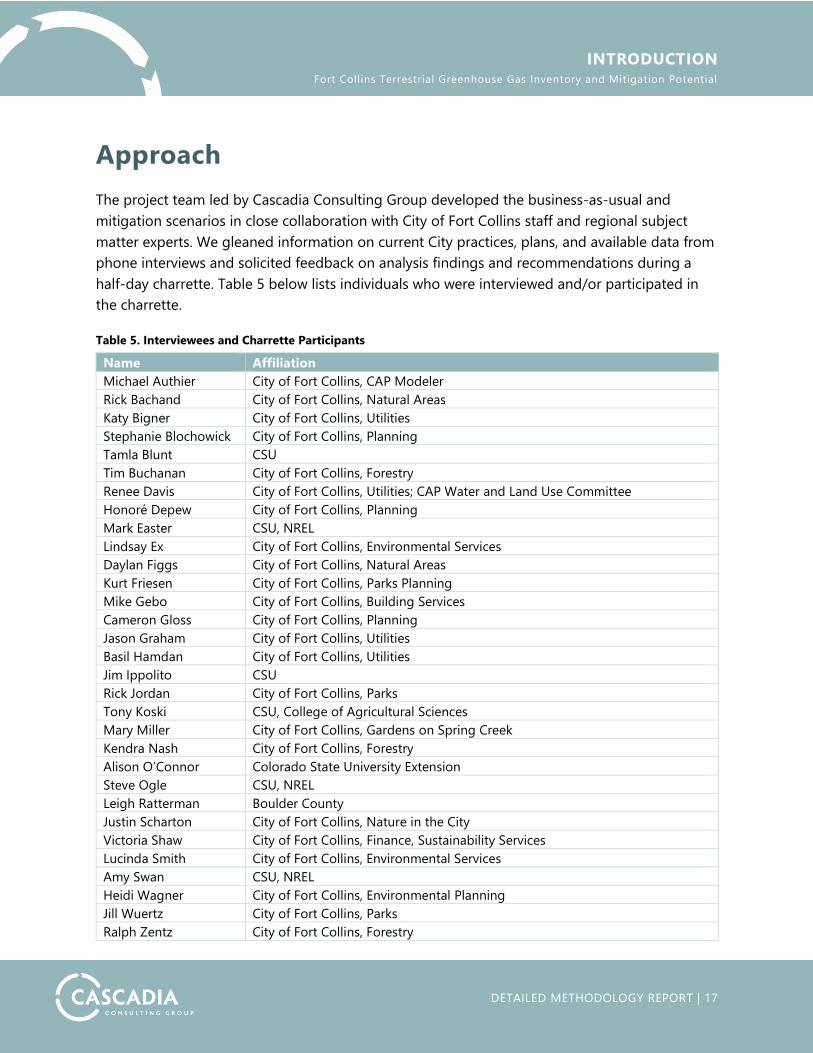
The project team led by Cascadia Consulting Group developed the business-as-usual and
mitigation scenarios in close collaboration with City of Fort Collins staff and regional subject
matter experts. We gleaned information on current City practices, plans, and available data from
phone interviews and solicited feedback on analysis findings and recommendations during a
half-day charrette. Table 5 below lists individuals who were interviewed and/or participated in
the charrette.
Table 5. Interviewees and Charrette Participants
Name Affiliation
Michael Authier City of Fort Collins, CAP Modeler
Rick Bachand City of Fort Collins, Natural Areas
Katy Bigner City of Fort Collins, Utilities
Stephanie Blochowick City of Fort Collins, Planning
Tamla Blunt CSU
Tim Buchanan City of Fort Collins, Forestry
Renee Davis City of Fort Collins, Utilities; CAP Water and Land Use Committee
Honoré Depew City of Fort Collins, Planning
Mark Easter CSU, NREL
Lindsay Ex City of Fort Collins, Environmental Services
Daylan Figgs City of Fort Collins, Natural Areas
Kurt Friesen City of Fort Collins, Parks Planning
Mike Gebo City of Fort Collins, Building Services
Cameron Gloss City of Fort Collins, Planning
Jason Graham City of Fort Collins, Utilities
Basil Hamdan City of Fort Collins, Utilities
Jim Ippolito CSU
Rick Jordan City of Fort Collins, Parks
Tony Koski CSU, College of Agricultural Sciences
Mary Miller City of Fort Collins, Gardens on Spring Creek
Kendra Nash City of Fort Collins, Forestry
Alison O’Connor Colorado State University Extension
Steve Ogle CSU, NREL
Leigh Ratterman Boulder County
Justin Scharton City of Fort Collins, Nature in the City
Victoria Shaw City of Fort Collins, Finance, Sustainability Services
Lucinda Smith City of Fort Collins, Environmental Services
Amy Swan CSU, NREL
Heidi Wagner City of Fort Collins, Environmental Planning
Jill Wuertz City of Fort Collins, Parks
Ralph Zentz City of Fort Collins, Forestry

INTRODUCTION Fort Collins Terrestrial Greenhouse Gas Inventory and Mitigation Potential
DETAILED METHODOLOGY REPORT | 18
Data collection for the analysis also included consultation of City reports, plans, and datasets, as
well as academic literature. We cite these references in this report as they were used to inform
model assumptions and outcomes. The References section provides a full list of referenced
material.
INTRODUCTION Fort Collins Terrestrial Greenhouse Gas Inventory and Mitigation Potential
DETAILED METHODOLOGY REPORT | 19
Other Considerations
To the extent possible, this analysis took into account the following potential carbon
sequestration risks, described in more detail below:
Climate change
Emerald ash borer
Climate Change
Extreme temperatures and precipitation events are expected to become more frequent in
Larimer County as a result of climate change (Saunders et al., 2016). Separate from extreme
events, total annual precipitation may increase or decrease (Woodbury et al. 2013). However,
many climate modelers believe that the interiors of continents will generally become drier,
although they may have more intense precipitation events. Increased temperatures will decrease
snowpack, which may impact water supply. Increased evapotranspiration may increase stress
experienced by plants, and increase wildfire risk. This analysis took these changes into
account by addressing options for reducing risk of loss of existing trees. In general, severe
drought stress increases tree mortality but in the city, watering may mitigate the effects of
drought, as long as watering is not limited because of water shortage. Tree growth projections
are based on measurements of tree canopy growth in the last decade and a half, and thus
incorporate the effects of recent climate change. Additional future effects of increased heat and
variability of precipitation were not modeled in this analysis, and also there in uncertainty as to
the degree to which ecosystems will be able to adapt to changes in climate. Also, water
availability is a priority in Fort Collins, so analysis of mitigation options considered water
demand during assessment of the viability of proposed mitigation activities.
Emerald Ash Borer
The emerald ash borer presents a severe threat to Fort Collins trees. According to Fort Collins’
Community Forest Assessment, about 15 percent of Fort Collins’ urban forest is made up of ash
trees (Davey Resource Group 2016), while over 60 percent of City-managed trees are ash
(Buchanan 2017, personal communication). The invasive insect is a minimal threat to the City’s
natural areas due to diverse and resilient cottonwood habitat in those areas (Buchanan 2017,
personal communication). For more urban areas within the city, however, it could only take 15
years from initial infestation for the borer to cause 100 percent mortality of Ash trees that are
not being treated to protect them from the borer.
INTRODUCTION Fort Collins Terrestrial Greenhouse Gas Inventory and Mitigation Potential
DETAILED METHODOLOGY REPORT | 20
Acknowledging this threat, the City has taken steps to mitigate tree mortality and loss of canopy
cover due to the emerald ash borer. The City is currently replacing small ash trees in poorer
condition and replacing with resilient species. Education and outreach activities inform residents
of the risks and provide alternative shade solutions such as oaks, elms, gingko, and Kentucky
coffee trees (Buchanan 2017, personal communication). Residents could be encouraged to
establish borer-resistant trees near existing ash trees, so that if the borer arrives and kills the
ash, a new tree will be established and ready to take over that space.
Arrival time of the emerald ash borer is not predictable. Based on the City tree inventory, we
calculate that the carbon stock in ash trees in Fort Collins is about 35,000 tCO2e. This amount
should be taken as an upper bound. Borers have been found less than 100 miles from Fort
Collins and City staff believe it is likely that the borer will arrive in Fort Collins in the next 2-5
years, and that within 2-3 years of arrival of the borer, nearly all ash trees will be dead unless
they are treated to protect them from the borer. Dead trees take time to decay but even if tree
death does not occur for 10 years, nearly all the wood will be decomposed by 2050 and the
carbon emitted. Replacement trees take time to grow. Even if a replacement was planted for
every ash tree in 2020, and the replacement trees grow at the same rate as ash, the new trees
would sequester only about 4,500 tCO2e by 2050 but growth would be accelerating. A strong
plan to establish replacement trees near Ash trees, before the borer arrives, over several
decades, could sequester as much carbon as is lost from ash, even with complete mortality of
ash. It is not possible to specify a time in the future that loss could occur. This analysis assumes
ash death by 2022 and that in the absence of a program promoting tree replacement,
landowners wait until after tree death to replace trees, and that only half the killed trees are
replaced, for net baseline emissions of 33,000 tCO2e by 2050.
BUSINESS-AS-USUAL EMISSIONS AND MITIGATION FROM LANDS Fort Collins Terrestrial Greenhouse Gas Inventory and Mitigation Potential
DETAILED METHODOLOGY REPORT | 21
Business-as-Usual Emissions and Mitigation
from Lands
The business-as-usual scenario sought to quantify all terrestrial GHG stocks and flows within the
GMA and City natural areas from 2015 to 2050. The scenario takes into account both historical
and likely future land use and land cover changes as indicated through City planning
documents, growth projections, and anecdotal input from City staff. This document details those
assumptions and underlying data sources.
We analyzed the business-as-usual scenario in two temporal components:
A 2015 inventory that quantifies the terrestrial GHG emissions and sinks within the
calendar year of 2015. This inventory takes into account current land cover and the
ongoing GHG effects of past land use changes, mainly from 1965 to 2014.
A 2016-2050 projection that estimates likely future terrestrial GHG sinks and emissions.
The projection takes into account sequestration and emissions from current land uses
and cover, as well as sinks and emissions anticipated to result from ongoing trends of
population change and land use changes such as development-induced conversion of
soil to impervious surfaces such as buildings and roads, and new lawns and trees
expected to result from future building development.
The project team sought to quantify GHG sinks and emissions within these time periods, across
all land within the GMA and natural areas outside the GMA. This analysis address CO2, CH4 and
N2O from land use. The main types of terrestrial GHG sinks and sources are:
Trees, including aboveground and belowground carbon storage and sequestration from
publicly managed street, park, and natural area trees, as well as those on privately owned
lands.
Impervious surface, including buildings, sidewalks, driveways, parking lots, and roads.
Grasslands, including above- and belowground carbon storage, sequestration, and
emissions.
Soils, including additional sequestration and/or emissions resulting from
compost/fertilizer application and irrigation.
Urban agriculture, including community and private “backyard” gardens.
BUSINESS-AS-USUAL EMISSIONS AND MITIGATION FROM LANDS Fort Collins Terrestrial Greenhouse Gas Inventory and Mitigation Potential
DETAILED METHODOLOGY REPORT | 22
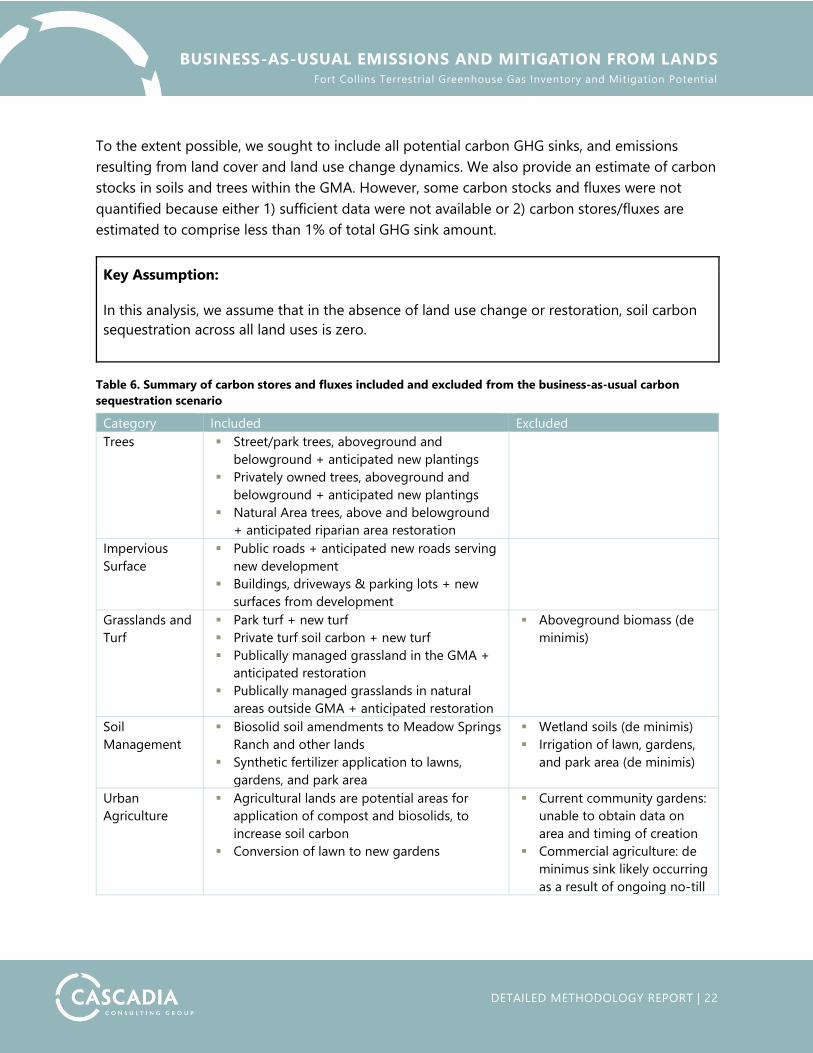
To the extent possible, we sought to include all potential carbon GHG sinks, and emissions
resulting from land cover and land use change dynamics. We also provide an estimate of carbon
stocks in soils and trees within the GMA. However, some carbon stocks and fluxes were not
quantified because either 1) sufficient data were not available or 2) carbon stores/fluxes are
estimated to comprise less than 1% of total GHG sink amount.
Key Assumption:
In this analysis, we assume that in the absence of land use change or restoration, soil carbon
sequestration across all land uses is zero.
Table 6. Summary of carbon stores and fluxes included and excluded from the business-as-usual carbon
sequestration scenario
Category Included Excluded
Trees Street/park trees, aboveground and
belowground + anticipated new plantings
Privately owned trees, aboveground and
belowground + anticipated new plantings
Natural Area trees, above and belowground
+ anticipated riparian area restoration
Impervious
Surface
Public roads + anticipated new roads serving
new development
Buildings, driveways & parking lots + new
surfaces from development
Grasslands and
Turf
Park turf + new turf
Private turf soil carbon + new turf
Publically managed grassland in the GMA +
anticipated restoration
Publically managed grasslands in natural
areas outside GMA + anticipated restoration
Aboveground biomass (de
minimis)
Soil
Management
Biosolid soil amendments to Meadow Springs
Ranch and other lands
Synthetic fertilizer application to lawns,
gardens, and park area
Wetland soils (de minimis)
Irrigation of lawn, gardens,
and park area (de minimis)
Urban
Agriculture
Agricultural lands are potential areas for
application of compost and biosolids, to
increase soil carbon
Conversion of lawn to new gardens
Current community gardens:
unable to obtain data on
area and timing of creation
Commercial agriculture: de
minimus sink likely occurring
as a result of ongoing no-till
BUSINESS-AS-USUAL EMISSIONS AND MITIGATION FROM LANDS Fort Collins Terrestrial Greenhouse Gas Inventory and Mitigation Potential
DETAILED METHODOLOGY REPORT | 23
The sections below detail assumptions, data sources, methodologies, and findings for the above
categories.
Trees
We estimated aboveground carbon storage and sequestration for both public and private trees
in the Fort Collins GMA and regional natural areas.
ASSUMPTIONS
We made the following assumptions in quantifying tree carbon sequestration potential:
Using an average DBH-crown diameter ratio across species gives an unbiased
estimate of biomass, averaged across the entire population. The actual DBH-crown
diameter ratio varies by species so this ratio should not be used to estimate biomass of
individual species. The DBH-crown diameter ratio was measured on Fort Collins street
trees. We assume that the street tree DBH-crown diameter ratio is relatively similar
to the ratio for yard trees and park trees. Some yard trees and park trees grow close
to other trees and likely have somewhat greater average DBH-crown diameter ratios
than street trees, so using one ratio for all trees probably slightly underestimates carbon
stocks in yard trees and groups of trees in parks.
Trees in natural areas outside GMA are assumed to be ponderosa pine, predominantly
80 years old, and stands are assumed to be stocked at the average rate for the region.
This is a simplification as are relatively small areas broadleaf species in riparian areas and
there may be other conifer species at the highest elevations. This is a simplification, but
it gives an approximate and conservative estimate of growth for stands of multiple ages.
City staff indicate that many of the trees originated in 1913, so assuming 80 years of age
gives a conservative estimate of carbon stock.
METHODOLOGY OVERVIEW
We used the following methodologies to quantify carbon sequestration of trees, described in
more detail below:
Trees on privately owned lands: We estimated residential (i.e., yard) tree biomass by
sampling tracts representing a range of number of years since development. Within
those tracts, we measured the canopy extent of individual trees at a recent time and a
time 10-15 years ago, and estimated carbon stock from canopy diameter. Property
parcels were selected from the Larimer County Assessor database, to give a range of
BUSINESS-AS-USUAL EMISSIONS AND MITIGATION FROM LANDS Fort Collins Terrestrial Greenhouse Gas Inventory and Mitigation Potential
DETAILED METHODOLOGY REPORT | 24
parcel sizes within each decade from 1930 on, and counting all parcels developed prior
to 1930 as a single sampling stratum. Canopy diameters of all trees on the parcel were
measured at the earlier time and at the later time, with times selected depending on the
dates of the aerial imagery that gave the best discrimination between canopies of
individual trees, but seeking to have the measurement dates as far apart as possible. If
needed, Google Street View was used to help determine how many trees are present in
clumps, and to distinguish extents of canopies of abutting trees. The biomass present on
the parcel was estimated for each observation time, and the rate change over time
calculated. Regression analysis was used to develop an equation that estimates tree
carbon stock as a function of the number of years since development. Biomass estimates
include aboveground and root biomass.
Trees on City lands: We estimated tree carbon stock on City lands using the City’s tree
inventory data. This database includes street trees, parks, and city facilities. Recently,
some trees in natural areas within the city have been added to the database, as the
Forestry Department works on them. City facilities include offices, operational sites
including stormwater detention sites, golf courses, and cemeteries. City staff have
indicated that the inventory of natural areas may be incomplete; to the extent that trees
exist in those unaccounted-for areas and are not included in the inventory, this estimate
will underestimate carbon stock.
Natural area trees outside the GMA: Due to limited data on trees in City natural areas
outside of the GMA, we used land cover fractions described in individual natural area
management plans to calculate acres of forests. In the absence of site-specific data,
forests on natural Areas outside the GMA are assumed to be dominated by ponderosa
pine. We also assume that the trees grow similarly to those measured by the US Forest
Service in the Rocky Mountains South region of the Forest Inventory and Analysis
program. Carbon stock of these forests is reported as a function of stand age as reported
in Smith et al. 2006. For these natural areas, we assume that additional future restoration
reflects that in the Fort Collins Natural Areas Department Restoration Plan (2016-2025).
Privately Managed Trees
Step 1: Estimate current canopy cover and historical change over time for single family residential
lots
Trees in cities are profoundly affected by human activities. Most trees in cities are planted. Trees
in cities are at risk of being removed, even if they are healthy, because of redevelopment of sites
or other reasons. As cities become denser, the space available for trees decreases, and tree
BUSINESS-AS-USUAL EMISSIONS AND MITIGATION FROM LANDS Fort Collins Terrestrial Greenhouse Gas Inventory and Mitigation Potential
DETAILED METHODOLOGY REPORT | 25
biomass per acre decreases. Fort Collins is semiarid with insufficient moisture to sustain most
urban tree species, without watering, especially during tree establishment. Before development,
few trees existed other than along rivers within the boundary of what is now Fort Collins.
When individual land parcels and streets are developed, trees are often planted. Over decades,
trees grow, and eventually individuals die. In forests, the biomass carbon stock can remain and
even increase, despite complete turnover of individual trees. In cities, trees face additional risks
from chemicals, physical damage, redevelopment of land, and even removal for aesthetic
reasons. Across an area, most biomass will be in the largest trees. A 24” diameter tree will have
approximately 500 times the biomass of a 2” diameter tree. 43% of the trees in the City of Fort
Collins inventory are 5” in diameter or less. The largest trees are often among the oldest, so tree
biomass on lands within Fort Collins is correlated to the length of time since the land was
developed.
Our analysis measured trees on a sample of lots across Fort Collins, with the sample well
distributed by the number of years since development and lot size. The sample focused on
detached and attached single family properties, but included a few samples of multifamily and
commercial properties. Samples were selected from the Larimer County Assessor database to
give an even distribution of observations across lot sizes and decades since development, to
give a range of parcel sizes within each decade from 1930 on, and counting all parcels
developed prior to 1930 as a single sampling stratum.
The street address was used to find the imagery for the parcel and comparison of Assessor maps
and features observable in aerial imagery was used to assess locations of parcel boundaries.
Comparison of the lot area in the Assessor database was compared to lot area calculated from
observations of aerial imagery, and boundary assignments adjusted until the area measured on
the aerial imagery matched the area reported by the Assessor.
We estimated residential (i.e., yard) tree biomass by sampling tracts of a range of number of
years since development, measuring canopy extent of individual trees at a recent time and a
time 10-15 years ago, and estimating carbon stock from canopy diameter. Canopy diameters of
all trees on the parcel were measured at the earlier time and at the later time, with times
selected depending on the dates of the aerial imagery that gave the best discrimination
between canopies of individual trees, but seeking to have the measurement dates as far apart as
possible. Historical imagery was obtained through Google Earth Pro and canopy width was
measured in two approximately perpendicular directions using the length measurement tool of
Google Earth Pro. Canopy diameter was calculated as the average of the two canopy width
measurements. If needed, Google Street View was used to help determine how many trees are
present in clumps, and to distinguish extents of canopies of abutting trees. Only tree canopy
BUSINESS-AS-USUAL EMISSIONS AND MITIGATION FROM LANDS Fort Collins Terrestrial Greenhouse Gas Inventory and Mitigation Potential
DETAILED METHODOLOGY REPORT | 26
dimensions for trees whose trunks originated within the parcel boundary were measured and
recorded for that lot. When evaluating tree canopy, images from several dates were evaluated to
determine which foliage was small trees or shrubs, or whether a foliage mass represented one or
more trees.
The entire canopy was measured, including portions of the canopy that extended outside the
parcel. For parcels with no trees present, a canopy size of zero feet was recorded. The biomass
present on the parcel was estimated for each observation time, and the rate change over time
calculated. Regression analysis (using a polynomial equation form) was used to develop an
equation that estimates tree carbon stock as a function of the number of years since
development. Biomass estimates include above ground and root biomass. For each lot, the same
methods were used to measure tree canopies in the most recent imagery, and canopies in the
oldest available imagery with sufficient resolution to discriminate between individual trees.
Our analysis developed a ratio of tree trunk diameter (at 4.5’ above the ground, called DBH) to
canopy diameter by measuring the canopy diameters of a sample of trees of known diameter.
This ratio is needed because most tree biomass equations estimate biomass as a function of
DBH. This analysis developed a ratio for predicting DBH from crown diameter by selecting a
sample of trees from the city tree inventory. The sample was evenly distributed across tree
diameters. The sample was selected so that the mix of species in the sample approximates the
mix of species reported for the city as a whole in the Community Tree Resource Assessment
(2016). Further, the sample was constrained to trees that had been inventoried in the range of
2012-2014, and that we were able to identify the tree in imagery from 2012-2014. As needed,
Google Street View imagery was used to identify the images of the specific trees selected from
the inventory database. Selecting trees so that the distribution of the species in the sample
matches the distribution of species in the population allows us to use a single crown-DBH
equation for all trees in the city, even though this ratio varies by species. As a result, this ratio
should not be used to estimate biomass of individual tree species.
When tree canopies were being measured on sample lots, sampling also measured the area of
impervious surface and the area of grass, as of the date of the most recent measured imagery.
Measurements were made using the length and polygon area tools of Google Earth Pro. To
estimate tree age and thus sequestration, Fort Collins’ GIS application and Google Earth Pro
were used to quantify surface area measurements for impervious surface, grass, gardens, and
recent trees. Parcel addresses and lot sizes were confirmed using Assessor records, and then lots
were measured in Google Earth Pro and compared to Assessor records. Surface areas for the
different categories of interest were calculated with the ruler tool or the polygon area tool in
Google Earth Pro, using feet as the unit of measurement of length and square feet as the unit of
area.
BUSINESS-AS-USUAL EMISSIONS AND MITIGATION FROM LANDS Fort Collins Terrestrial Greenhouse Gas Inventory and Mitigation Potential
DETAILED METHODOLOGY REPORT | 27
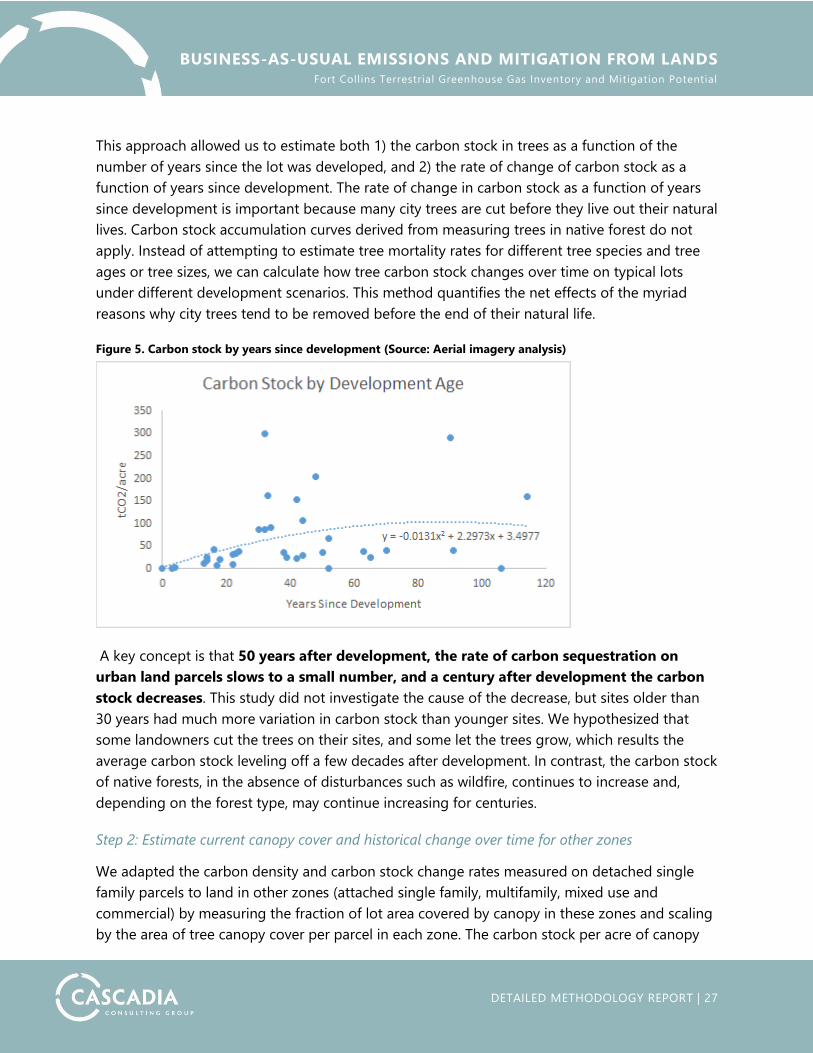
This approach allowed us to estimate both 1) the carbon stock in trees as a function of the
number of years since the lot was developed, and 2) the rate of change of carbon stock as a
function of years since development. The rate of change in carbon stock as a function of years
since development is important because many city trees are cut before they live out their natural
lives. Carbon stock accumulation curves derived from measuring trees in native forest do not
apply. Instead of attempting to estimate tree mortality rates for different tree species and tree
ages or tree sizes, we can calculate how tree carbon stock changes over time on typical lots
under different development scenarios. This method quantifies the net effects of the myriad
reasons why city trees tend to be removed before the end of their natural life.
Figure 5. Carbon stock by years since development (Source: Aerial imagery analysis)
A key concept is that 50 years after development, the rate of carbon sequestration on
urban land parcels slows to a small number, and a century after development the carbon
stock decreases. This study did not investigate the cause of the decrease, but sites older than
30 years had much more variation in carbon stock than younger sites. We hypothesized that
some landowners cut the trees on their sites, and some let the trees grow, which results the
average carbon stock leveling off a few decades after development. In contrast, the carbon stock
of native forests, in the absence of disturbances such as wildfire, continues to increase and,
depending on the forest type, may continue increasing for centuries.
Step 2: Estimate current canopy cover and historical change over time for other zones
We adapted the carbon density and carbon stock change rates measured on detached single
family parcels to land in other zones (attached single family, multifamily, mixed use and
commercial) by measuring the fraction of lot area covered by canopy in these zones and scaling
by the area of tree canopy cover per parcel in each zone. The carbon stock per acre of canopy
BUSINESS-AS-USUAL EMISSIONS AND MITIGATION FROM LANDS Fort Collins Terrestrial Greenhouse Gas Inventory and Mitigation Potential
DETAILED METHODOLOGY REPORT | 28
area is assumed to follow the same trajectory—as a function of time since development—for
these other zones as for detached single family parcels. The fraction of canopy area by zone is
taken from the Community Tree Resource Assessment (2016).
Publicly Managed Trees (Streets, City Facilities, Parks, and Natural Areas within
the GMA)
Step 1: Estimate current and historical tree canopy cover and biomass
The Fort Collins inventory of trees on City lands provides DBH measurements for all City-
managed trees within Fort Collins. City trees include street trees, trees on City facilities (including
office buildings, operational facilities, stormwater detention areas, golf courses, and cemeteries),
parks within the Growth Management Area. City staff report that the Natural Areas inventory is
incomplete, but there is not data on level of incompleteness. Natural areas encompass about 13
percent of the area within the GMA but most of the Natural Area acreage is without trees. As a
result, even a substantial undercount of trees on natural areas would cause the citywide
estimates to be only slightly low.
Historical Land Cover Analysis Methodology
Fort Collins’ GIS application and Google Earth Pro were used to quantify surface area measurements
for impervious surface, grass, gardens, and recent trees. Parcel addresses and lot sizes were
confirmed using assessor records, and then lots were measured in Google Earth Pro and compared
to assessor records. Surface areas for the different categories of interest were calculated with the
ruler tool in Google Earth Pro using feet as the unit of measurement. Impervious surface was
calculated by measuring and adding building footprints, garages or sheds, driveways, walkways and
paths, and any other impervious surface present on a property, including impervious surface under
tree canopy. If a lot abutted a street, the width of the street adjacent to the assessed property, as
well as any sidewalks on both sides of that street, were included in the total impervious surface
calculation. Grass area was calculated either by measuring discreet lot portions covered by grass, or
if the grass area was a complex shape, subtracting the non-grass areas of the property from the total
lot size. Garden area was calculated and measured in a manner similar to impervious surface.
Degree of irrigation was estimated by evaluating late summer imagery from August or September in
the historical images available on Google Earth Pro. Grass that appeared bright green was assigned
an irrigation value of 1, while pure brown grass was assigned an irrigation value of 0. If the grass was
patchy pale green and brown, it was assigned an irrigation value of 0.5, and areas of grass that
appeared partially irrigated were assigned irrigation values corresponding to the fraction of the area
that appeared irrigated ranging from 0 to 1.
BUSINESS-AS-USUAL EMISSIONS AND MITIGATION FROM LANDS Fort Collins Terrestrial Greenhouse Gas Inventory and Mitigation Potential
DETAILED METHODOLOGY REPORT | 29
We estimated biomass, carbon stock, and canopy area for each tree in the City tree inventory,
and summed to calculate the carbon stock and tree canopy area for all City lands.
Step 2: Estimate anticipated biomass changes over time
Because street and park trees are often established about the time the lands adjacent to the
streets and parks are developed, City trees are assumed to have (a) the same trajectory of area
of tree planting over time as the area of residential development over time, and (b) the same
per-acre trajectory of carbon stock change through time as measured on private land parcels,
starting at the date of development. The methodology is described above.
Trees in Natural Areas outside the GMA
Step 1: Identify extent of trees and expected change in area over time
Using the management plans for the natural areas located outside of the GMA, we identified
fractions of different Natural Areas occupied by different land covers (e.g., forests, woody
shrubland, and prairie). These fractional coverages were converted to acres based on the total
area of the specific natural area.
We assumed this forest area remains constant over time. Although the City is implementing and
plans to implement substantial ecological restoration of grasslands within natural areas, little
forest restoration is planned. Forest restoration is planned for riparian areas within the GMA.
Interviews with City staff confirmed that the City has considered but has not decided to
undertake forest restoration interventions on natural areas outside the GMA, with the possible
exception of riparian forest in the Poudre River Canyon.
Step 2: Estimate anticipated biomass changes over time
We assumed tree carbon stock and growth on natural areas outside the GMA follow trajectories
observed in forests, not cities.
Due to limited data on tree species, density, sizes, and ages in natural areas outside the GMA,
we assume that forests on natural areas outside the GMA are dominated by ponderosa pine,
and grow like plots measured by the US Forest Service in ponderosa pine forests in the Rocky
Mountains South region of the Forest Inventory and Analysis program. Carbon stock of these
forests is reported as a function of stand age, as reported in Smith et al. (2006) Table A38.
Historically, there have been major fires that have killed trees on these natural areas, and City
staff observe little natural regeneration of trees. As a result, in the future, we assume emissions
from fire and fire mortality equal growth and the carbon stock remains constant. This is an
BUSINESS-AS-USUAL EMISSIONS AND MITIGATION FROM LANDS Fort Collins Terrestrial Greenhouse Gas Inventory and Mitigation Potential
DETAILED METHODOLOGY REPORT | 30
uncertain estimate. With climate change, an intense fire could kill much of the forest on these
natural areas and cause emission of much of the existing carbon stock.
We assume trees in natural areas outside the GMA are ponderosa pine, predominantly 80 years
old, and stands are stocked at the average rate for the region. This is a great simplification, but it
gives an approximate and conservative estimate of growth for stands of multiple ages. City staff
indicate that many of the trees originated in 1913, so assuming 80 years of age gives a
conservative estimate of carbon stock.
No major fires occurred in 2015, so the 2015 inventory shows sequestration from growth in
2015. However, as noted above, we believe that there is a substantial likelihood that emissions
from future wildfires will likely cancel out sequestration from growth, and the carbon stock is
assumed to remain constant through 2050. The 2015 growth gives an indication of the rate of
sequestration that might be achieved if these forests are protected from intense fires (low
intensity fires, among other practices, may be used to remove fuels to reduce risk of stand
replacing fire). Drought is another risk. We do not have data on rates of drought-induced tree
mortality for these forests. Even if there are no intense fires, with climate change, it is possible
that tree mortality from drought will keep these forests from gaining carbon.
Loss of Ash Killed by Emerald Ash Borer
The carbon stock in ash trees is estimated using the population of ash trees estimated in the
2016 Fort Collins Community Tree Resource Assessment, and the size distribution of ash trees in
the City tree inventory. To estimate baseline emissions, the borer is assumed to arrive and kill
ash trees in 2022, and the dead trees are assumed to decompose at a rate of 10% per year. The
data of tree death does not have a large effect on the cumulative emissions by 2050 because
most carbon is emitted by then, for any likely timing of tree death. The timing of death would
affect the start of emissions from dead ash. Also, the timing and fraction of planting of
replacement ash trees has little effect on the net emissions. Even in the extreme case that all ash
trees are replaced in 2020, in 2050 the cumulative sequestration by the replacement trees is
about 4,500 tCO2e, about 13% of the cumulative ash emissions if there are no replacement trees.
TREE CARBON SEQUESTRATION BASELINE
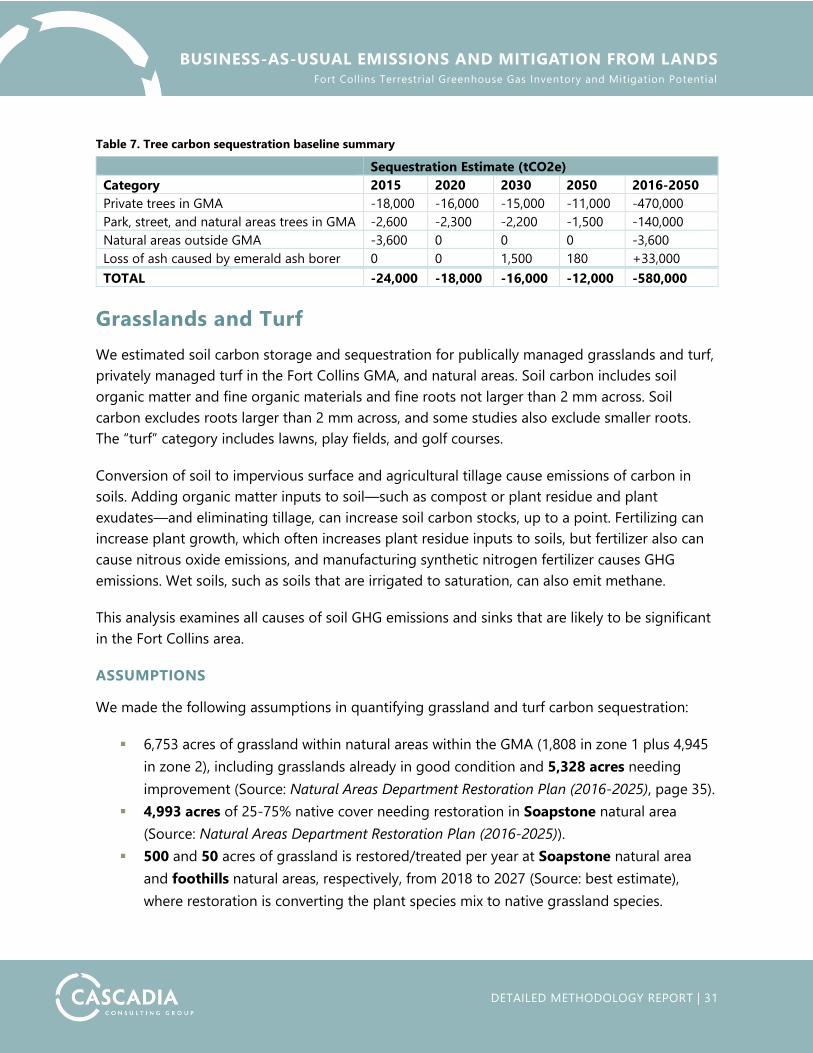
Table 7 below summarizes the business-as-usual carbon sequestration inventory for Fort Collins
trees, summarizing the categories described above. In total, we estimate that trees sequestered
24,000 tCO2e in 2015 and, under current trends, are likely to sequester an additional 580,000
tCO2e from 2016-2050.
BUSINESS-AS-USUAL EMISSIONS AND MITIGATION FROM LANDS Fort Collins Terrestrial Greenhouse Gas Inventory and Mitigation Potential
DETAILED METHODOLOGY REPORT | 31
Table 7. Tree carbon sequestration baseline summary
Sequestration Estimate (tCO2e)
Category 2015 2020 2030 2050 2016-2050
Private trees in GMA -18,000 -16,000 -15,000 -11,000 -470,000
Park, street, and natural areas trees in GMA -2,600 -2,300 -2,200 -1,500 -140,000
Natural areas outside GMA -3,600 0 0 0 -3,600
Loss of ash caused by emerald ash borer 0 0 1,500 180 +33,000
TOTAL -24,000 -18,000 -16,000 -12,000 -580,000
Grasslands and Turf
We estimated soil carbon storage and sequestration for publically managed grasslands and turf,
privately managed turf in the Fort Collins GMA, and natural areas. Soil carbon includes soil
organic matter and fine organic materials and fine roots not larger than 2 mm across. Soil
carbon excludes roots larger than 2 mm across, and some studies also exclude smaller roots.
The “turf” category includes lawns, play fields, and golf courses.
Conversion of soil to impervious surface and agricultural tillage cause emissions of carbon in
soils. Adding organic matter inputs to soil—such as compost or plant residue and plant
exudates—and eliminating tillage, can increase soil carbon stocks, up to a point. Fertilizing can
increase plant growth, which often increases plant residue inputs to soils, but fertilizer also can
cause nitrous oxide emissions, and manufacturing synthetic nitrogen fertilizer causes GHG
emissions. Wet soils, such as soils that are irrigated to saturation, can also emit methane.
This analysis examines all causes of soil GHG emissions and sinks that are likely to be significant
in the Fort Collins area.
ASSUMPTIONS
We made the following assumptions in quantifying grassland and turf carbon sequestration:
6,753 acres of grassland within natural areas within the GMA (1,808 in zone 1 plus 4,945
in zone 2), including grasslands already in good condition and 5,328 acres needing
improvement (Source: Natural Areas Department Restoration Plan (2016-2025), page 35).
4,993 acres of 25-75% native cover needing restoration in Soapstone natural area
(Source: Natural Areas Department Restoration Plan (2016-2025)).
500 and 50 acres of grassland is restored/treated per year at Soapstone natural area
and foothills natural areas, respectively, from 2018 to 2027 (Source: best estimate),
where restoration is converting the plant species mix to native grassland species.
BUSINESS-AS-USUAL EMISSIONS AND MITIGATION FROM LANDS Fort Collins Terrestrial Greenhouse Gas Inventory and Mitigation Potential
DETAILED METHODOLOGY REPORT | 32
Carbon sequestration rate resulting from the plant species change in restored grassland
is -0.34 tCO2e per acre-year for 20 years, after which the grassland no longer
sequesters carbon (Source: Easter et al. 2014).
1.1% of the grassland needing improvement within the GMA is restored/treated per year
(calculated to achieve targeted area of restoration, over the period for which restoration
plans apply).
Grassland restoration that occurred more than 10 years ago accounts for a negligible
amount of sequestration because reports indicate small acreages of restoration more
than 10 years ago.
In the absence of land use change or land management change within the last 50 years,
soil carbon stocks are assumed to be constant.
Within the GMA, conversion of undeveloped land to turf is based on the assumption that
single family residential growth is limited by the number of zoned single family lots,
calculated at 44,202 lots.
Land that is developed into housing or streets in the future is assumed to have a history
of cropping with tillage, and have the soil carbon stock of tilled soil in the region.
Development of new streets is assumed to be only streets within subdivisions, and no
new major arterials or highways.
METHODOLOGY OVERVIEW
The following methodologies were employed to quantify carbon sequestration of grasslands,
described in more detail below:
Natural Area Grasslands: We estimated soil carbon sequestration on current and future
protected grasslands in natural areas by applying emission factors from the literature to
anticipated restored acres of grassland in those areas. Initial soil carbon stocks depend
on whether the soil has a history of tillage, and sequestration rates depend on stock,
organic input rates, and nutrient input rates. In general, natural area restoration involves
removal of exotic and weedy species, and seeding of native prairie species, and does not
include application of soil amendments or fertilizer.
Public Turf: We estimated public turf area, of which parkland is a significant component,
using a combination of GIS data (i.e., land use classification from Symbiotic Engineering
and parcel-based land classification). Public turf also includes lawns around City
buildings and parking strips owned by the City.
Private Turf: We estimated private turf as a component of residential development
using measurements of the area of grass on a sample of lots within Fort Collins. The
BUSINESS-AS-USUAL EMISSIONS AND MITIGATION FROM LANDS Fort Collins Terrestrial Greenhouse Gas Inventory and Mitigation Potential
DETAILED METHODOLOGY REPORT | 33
sample was weighted to detached single family homes. This sample data was used to
construct an equation that predicts grass area as a function of lot size. Initial soil carbon
stock at the time a site is developed is assumed to be the soil carbon stock of tilled
agricultural soil in the region. Historic and future projections of population and trends in
the balance of detached single family housing versus attached single family and
multifamily housing were used to estimate future areas of conversion of land to lawns.
We also incorporate estimates of available single and multifamily dwelling units based
on GIS data (i.e., parcel-based land use classification map provided by the City). Rates of
carbon sequestration as a function of time since development were obtained from
published literature and DAYCENT modeling conducted by Colorado State University. For
land management changes that increase soil carbon, the rate is assumed to decline over
time, with no further sequestration 20-50 years after the land management change, with
the duration of sequestration depending on the type of intervention.
Natural Area Grasslands
Step 1: Estimate current grassland soil carbon stocks and flows
We assumed grassland soil carbon stocks are constant, except on acres where restoration
actions are implemented. Acreages and timing of restoration are taken from City reports of
natural areas and natural area restoration. Where an area of restoration is reported for a time
period, the timing of restoration is assumed to be a constant rate within the time period. For
example, if the restoration target is 900 acres restored over 10 years, we assume that 90 acres
are restored each year of that period.
Step 2: Estimate future grassland area and associated carbon flows associated with anticipated
grassland restoration at Soapstone natural area
According to the Natural Areas Department Restoration Plan (2016-2025), there are 22,237 acres
of grassland at Soapstone Natural Area, 4,993 of which are of 25-75% native cover needing
restoration. We assume that 500 acres of that land are treated per year from 2018 to 2027. We
also assume that restored grassland sequesters an additional -0.34 tCO2e per acre-year for 20
years, after which point the grassland stops sequestering carbon (COMET_PLANNER tool, Swan
pers. comm.). With those assumptions, we can estimate carbon sequestration at Soapstone to
total zero tCO2e in 2015 because restoration is assumed to start in 2016. Modeling estimates
sequestration of 34,000 tCO2e from 2016 to 2050.
BUSINESS-AS-USUAL EMISSIONS AND MITIGATION FROM LANDS Fort Collins Terrestrial Greenhouse Gas Inventory and Mitigation Potential
DETAILED METHODOLOGY REPORT | 34
Step 3: Estimate future grassland area and associated carbon flows associated with anticipated
grassland restoration at foothills natural areas outside the GMA
Using a similar methodology as for Soapstone, we also estimated carbon accruals associated
with restoration of other grasslands in natural areas outside the GMA, such as in the foothills.
The Natural Areas Department Restoration Plan (2016-2025) establishes a City goal to restore
500 acres of grassland on foothills natural areas by 2025, which is equivalent to approximately
50 acres per year. Using this per-year restoration rate and assuming that restored grassland
sequesters an additional -0.34 tCO2e per acre-year for 20 years, after which point the grassland
stops sequestering carbon (COMET_PLANNER tool, Swan pers. comm.), we calculated that
foothills natural areas sequestered zero tCO2e in 2015 because restoration is assumed to start in
2016. Modeling estimates sequestration of 3,400 tCO2e, from 2016 to 2050.
Step 4: Estimate future grassland area and associated carbon flows associated with anticipated
grassland restoration at grasslands within the GMA
According to the Natural Areas Department Restoration Plan (2016-2025), there are
approximately 6,753 acres of grassland within natural areas within the GMA. To meet the target
goal of restoration given for 2016-2025, we assume that the City restores/treats 4 percent of
those grasslands per year until 2025, at which point the City stops restoring grassland. We also
assume that restored grassland sequesters an additional -0.34 tCO2e per acre-year for 20 years,
after which point the grassland no longer sequesters carbon (Easter et al., 2014). With these
assumptions, we estimate that grasslands within the GMA sequestered zero tCO2e in 2015
because restoration is assumed to start in 2016. Modeling estimates sequestration of 5,700
tCO2e from 2016 to 2050.
Public Turf
Step 1: Estimate current turf area and associated carbon stocks and flows
We calculated the area of City grass from City GIS data, and then checked this calculated area
against the area estimated in the Community Tree Resource Assessment (2014).
Historical land use changes affect soil carbon stocks and flows for decades following the land
use change. Converting to impervious surface decreases carbon stock and converting to lawn
increases carbon stock. To estimate current soil carbon sequestration and emissions, we use
development and population records to estimate acres developed each year from 1965 through
2050. There were several steps taken to estimate these historic acres of conversion, back to
1965.
BUSINESS-AS-USUAL EMISSIONS AND MITIGATION FROM LANDS Fort Collins Terrestrial Greenhouse Gas Inventory and Mitigation Potential
DETAILED METHODOLOGY REPORT | 35
Many of the variables of interest have data for years 1995-2014 from the Fort Collins Climate
Action Plan Model. Where this data exists, we used it. Population before 1995 and fraction of
dwelling units that are detached single family are from the US Census Bureau. Census Bureau
data is reported for one year each decade; changes attributed to years between years with
Census Bureau data are assumed to be linear. GIS data were used to calculate average and
median lot size in Fort Collins. Anecdotal observations suggest that few lots larger than ¼ acre
remain to be developed within the Fort Collins GMA, so we assumed the average size of single
family detached lots is the size of the median lot zoned for detached single family housing,
instead of the average lot size for all lots in the city. Similarly, as land values rise, developers
seek to build as many dwelling units per acre as possible, so the average lot size of future new
attached single family dwellings is assumed to be the 25th percentile of the size of these
dwellings developed in Fort Collins from 2012-2015, inclusive, from Fort Collins building permit
records. Calculation of the number of square feet per dwelling unit in a sample of recent and
older multifamily developments was extracted from Larimer County Assessor records. This
number is quite close to the size assumed for attached single family dwellings, so attached
single family and multifamily dwellings were grouped together for analysis.
Annual change in the area of City grass and impervious surface are assumed to change as the
area of private grass changes, because roads, parking strip areas, and amenity areas correlate to
development. The area of private grass is calculated as changing largely as population changes,
adjusted by changes in the shift of the number of people per dwelling unit, the changing split of
new housing units between detached single family units versus other types of units, and the
area of new impervious surface and lawn attributed to each new dwelling unit.
For each year, we estimated the area of land converted to impervious surface by estimating the
area of feeder streets required to access lots developed that year. We estimated length of new
street per lot as a function of average lot street frontage length, plus a factor that accounts for
intersections, side streets that divide the city into blocks, and alleys. These side street
adjustment factors vary by lot size. To estimate area, length of new street is multiplied by the
average width of street impervious surface (including sidewalks) measured on aerial imagery of
Fort Collins, with half of the impervious width attributed to the development on each side of the
street.
Over the half century following conversion to lawn or impervious surface, soil carbon stock
changes are assumed to occur on those converted acres following trends reported in the
academic literature. Losses from conversion to impervious occur quickly, and gains occur slowly.
For any year, the soil GHG flux is the sum of the fluxes from lands converted in all of the
preceding 50 years.
BUSINESS-AS-USUAL EMISSIONS AND MITIGATION FROM LANDS Fort Collins Terrestrial Greenhouse Gas Inventory and Mitigation Potential
DETAILED METHODOLOGY REPORT | 36
Step 2: Estimate future turf area and associated carbon stocks and flows
Using these inputs, we estimated future carbon sinks and emissions from soils through 2050.
The number of new dwelling units is a function of the City’s estimated growth in population,
taken from the City Climate Action Plan model, and divided by the City’s forecast of future
numbers of people per dwelling unit. The future mix of detached single family units versus other
units is assumed to remain constant, as this ratio has been constant since 2012. However, the
supply of lots zoned for detached single family dwellings is forecast to be exhausted in 2026, so
after all available lots for detached single family dwellings are developed, further development is
assumed to be attached single family and multifamily.
Private Turf
Step 1: Estimate current turf area and associated carbon stocks and flows
We estimated the private turf stock as the grass area associated with single and multifamily
dwellings, and then extrapolated to grass and impervious areas on commercially and industrially
zoned lands. In order to build the carbon stock in the inventory, the model begins in 1965, and
uses population and residential data from the US Census and the Fort Collins CAP model. For all
homes in built in 1965, we assume the carbon stock starts sequestering carbon in 1965, with
subsequent new development beginning carbon storage in the year of construction. The homes
that are already built as of 1965 are ignored in terms of the change in carbon storage (given that
the carbon sequestration potential of turf declines to zero after 50 years, based on inventory
model calculations). These calculations are described above, in the Public Turf section.
Extrapolation of soil carbon sequestration in lawns on commercial and industrial properties uses
the fraction grass area reported for commercial zones in the Community Tree Resource
Assessment (2014). Because development occurs mainly on formerly tilled lands, additional loss
of carbon from conversion to impervious is only about 16 tCO2e/acre.
A substantial portion of recent commercial development in Fort Collins is redevelopment, with
minimal further soil carbon loss. Because soil carbon loss on new commercial and industrial
properties appears to be small, and the budget for this assessment is limited, the carbon stock
in these zones is estimated for 2014 and then assumed to change each year at the same rate as
the carbon stock on residential lands changes.
For single family dwellings, the average area of new turf is 3,764 square feet (of 7,964 square
feet for the total lot). For non-single family dwellings, we estimated 224 square feet of grass
per unit, given the much smaller footprint available per housing unit. The assumed initial carbon
stock for turf converted from cropland is 31.2 tCO2e per acre. The assumed increase in carbon
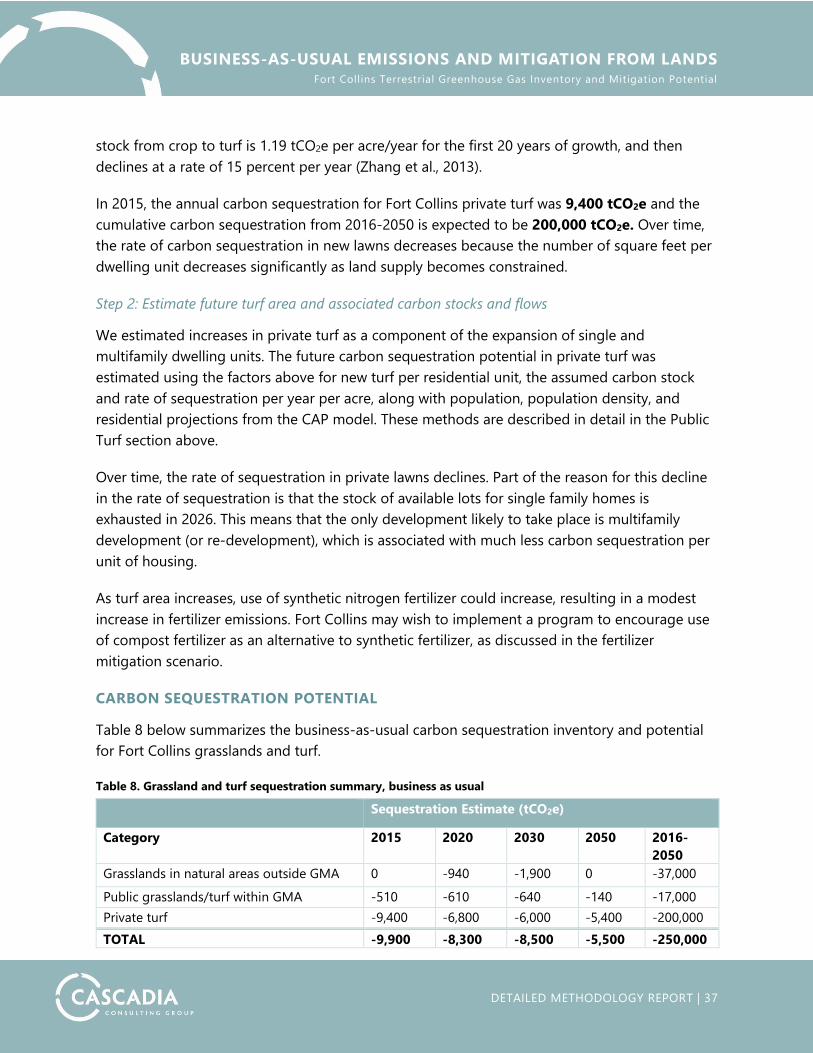
BUSINESS-AS-USUAL EMISSIONS AND MITIGATION FROM LANDS Fort Collins Terrestrial Greenhouse Gas Inventory and Mitigation Potential
DETAILED METHODOLOGY REPORT | 37
stock from crop to turf is 1.19 tCO2e per acre/year for the first 20 years of growth, and then
declines at a rate of 15 percent per year (Zhang et al., 2013).
In 2015, the annual carbon sequestration for Fort Collins private turf was 9,400 tCO2e and the
cumulative carbon sequestration from 2016-2050 is expected to be 200,000 tCO2e. Over time,
the rate of carbon sequestration in new lawns decreases because the number of square feet per
dwelling unit decreases significantly as land supply becomes constrained.
Step 2: Estimate future turf area and associated carbon stocks and flows
We estimated increases in private turf as a component of the expansion of single and
multifamily dwelling units. The future carbon sequestration potential in private turf was
estimated using the factors above for new turf per residential unit, the assumed carbon stock
and rate of sequestration per year per acre, along with population, population density, and
residential projections from the CAP model. These methods are described in detail in the Public
Turf section above.
Over time, the rate of sequestration in private lawns declines. Part of the reason for this decline
in the rate of sequestration is that the stock of available lots for single family homes is
exhausted in 2026. This means that the only development likely to take place is multifamily
development (or re-development), which is associated with much less carbon sequestration per
unit of housing.
As turf area increases, use of synthetic nitrogen fertilizer could increase, resulting in a modest
increase in fertilizer emissions. Fort Collins may wish to implement a program to encourage use
of compost fertilizer as an alternative to synthetic fertilizer, as discussed in the fertilizer
mitigation scenario.
CARBON SEQUESTRATION POTENTIAL
Table 8 below summarizes the business-as-usual carbon sequestration inventory and potential
for Fort Collins grasslands and turf.
Table 8. Grassland and turf sequestration summary, business as usual
Sequestration Estimate (tCO2e)
Category 2015 2020 2030 2050 2016-
2050
Grasslands in natural areas outside GMA 0 -940 -1,900 0 -37,000
Public grasslands/turf within GMA -510 -610 -640 -140 -17,000
Private turf -9,400 -6,800 -6,000 -5,400 -200,000
TOTAL -9,900 -8,300 -8,500 -5,500 -250,000
BUSINESS-AS-USUAL EMISSIONS AND MITIGATION FROM LANDS Fort Collins Terrestrial Greenhouse Gas Inventory and Mitigation Potential
DETAILED METHODOLOGY REPORT | 38
Impervious Surface
Our investigation of impervious surface cover includes quantification of changes in soil carbon
due to development. Namely, we estimated soil carbon changes from development of roads on
public lands and driveways and parking lots on private land. When soil is converted from
vegetation, much of the soil carbon is lost, as well as inputs of soil carbon. Soils that are
removed and stockpiled elsewhere lose much of their carbon (Wick et al., 2008).
ASSUMPTIONS
We made the following assumptions in quantifying impervious surface carbon sequestration
potential:
Developed land was formerly agricultural land with a history of tillage, and thus is
already substantially depleted of carbon. As a result, the emission from converting
cropland to impervious is only +16.1 tCO2e per acre. Emissions from converting native
prairie would be much greater.
All soil carbon loss due to development of impervious surface occurs in the year of
development.
After the first year, soil carbon flux over time for impervious surface cover is zero tCO2e
per acre-year.
Once roads and buildings are constructed they will remain for the duration of the study.
The total area of road built to serve a detached single family lot is 1.25 the area of the
road on which the lot fronts, and the total area of road built to serve an attached single
family or multifamily dwelling unit is 1.2 times the area of road on which the parcel
fronts.
METHODOLOGY OVERVIEW
We used the following methodologies to quantify carbon emissions from converting to
impervious surfaces, described in more detail below:
Roads (public land): We quantified current road surfaces using GIS data and the Larimer
County Road Design Manual (Larimer County, 2007). We estimated future road land
cover by applying estimated future development (primarily in the form of single and
multifamily dwelling units) to average road characteristics. As new subdivisions are built,
feeder roads within them are built. The area of these roads was estimated as the average
width of impervious surface (road plus sidewalks) measured in a sample, times lot
BUSINESS-AS-USUAL EMISSIONS AND MITIGATION FROM LANDS Fort Collins Terrestrial Greenhouse Gas Inventory and Mitigation Potential
DETAILED METHODOLOGY REPORT | 39
frontage length, plus a factor to account for areas of intersections, cross streets, and
alleys.
Buildings, driveways and parking lots (private land): Using a sample of property
parcels in Fort Collins, we measured area of impervious surface using aerial imagery and
the ruler and polygon area tools of Google Earth Pro. Fraction of impervious area was
calculated by zoning category, and for detached single family lots the fraction
impervious was calculated as a function of lot size.
Soil carbon loss on conversion to impervious: We used values from academic
literature and applied them to the areas expected to be converted to impervious during
future development.
Roads (Public Land)
Step 1: Estimate current surface cover and expected change in area
We estimated road surface area by taking the City-provided ‘centerline’ shapefile and assigning
road widths based on engineering standards (using the City Planning Manual). We then
calculated the surface area of the road surface within the Fort Collins GMA by adding together
these road widths, totaling approximately 8,233 acres.
During interviews, City staff suggested that there would be little to no expansion of large,
arterial roads, and that future new road development would be limited to expanding road
networks into housing subdivisions.
As new lots are developed, they will require new roads to access them. We estimate the area of
new feeder roads necessary to serve expected future land development. For each Fort Collins
land parcel used to measure tree canopy diameter, the road on which the development abuts
was assessed. We measured the width of impervious surface, including both the road surface
and sidewalks, but excluding vegetated parking strips, as well as the length of the frontage of
the parcel on the road. The average length of frontage was used as the length of road
immediately serving the parcel. We assumed the width to be half the width of the average
impervious area, because the other half is attributed to the property on the other side of the
road. This area is increased by a factor to account for road surface areas in addition to the
frontage area, including intersections, cross streets, and alleys. Based on the number of dwelling
parcels that can front on one block, this adjustment factor is 1.25 for detached single family
dwellings and 1.2 for attached single family and multifamily dwellings. Derivation of these
factors is described in the Public Turf section above. We calculated new road area for the typical
new detached single family dwelling and for the typical new attached single family or
multifamily dwelling.
BUSINESS-AS-USUAL EMISSIONS AND MITIGATION FROM LANDS Fort Collins Terrestrial Greenhouse Gas Inventory and Mitigation Potential
DETAILED METHODOLOGY REPORT | 40
We multiplied road area per dwelling unit by the expected number of dwelling units of each
type for each year modeled. The method for estimating the numbers of new dwelling units each
year are described in earlier sections of this report.
Step 2: Estimate carbon storage from future conversion to impervious
We calculated future road surface by multiplying the following four items together: (1) the
projected number of new housing units, (2) the average road length per unit (for both detached
and attached housing units), (3) the sampled road width, and (4) carbon loss per acre of new
road. We estimated the projected number of new housing units using the projected growth in
housing from the CAP model, limited by the number of lots zoned for single family dwellings.
The carbon loss per acre of new road was determined from the academic literature. Because
lands that may be developed within Fort Collins generally have a history of agriculture and
tillage, they have a low carbon stock before development. As a result, the emissions from
converting cropland to impervious are only 16.1 tCO2e per acre. Emissions from converting
native prairie would be much greater.
Buildings, Driveways, Walkways, and Parking Lots (Private Land)
Step 1: Estimate current surface cover and associated carbon storage and fluxes
Using the same sample of Fort Collins land parcels used to measure tree canopy diameters and
grass area, we measured area of impervious surface on each lot, using the same imagery, tools,
and methods described above. All of this impervious surface was assumed to be new at the time
of lot development.
Step 2: Estimate future surface cover and associated carbon storage and fluxes
We estimated the projected number of new housing units using the projected growth in
housing from the CAP model, limited by the number of lots zoned for single family dwellings.
The carbon loss per acre of new road was determined from the academic literature. Because
lands that may be developed within Fort Collins generally have a history of agriculture and
tillage, they have a low carbon stock before development. As a result, the emission from
converting cropland to impervious is only 16.1 tCO2e per acre. Emissions from converting
native prairie would be much greater.
CARBON SEQUESTRATION POTENTIAL
Table 9 below summarizes the business-as-usual carbon sequestration inventory and potential
for Fort Collins impervious surfaces.
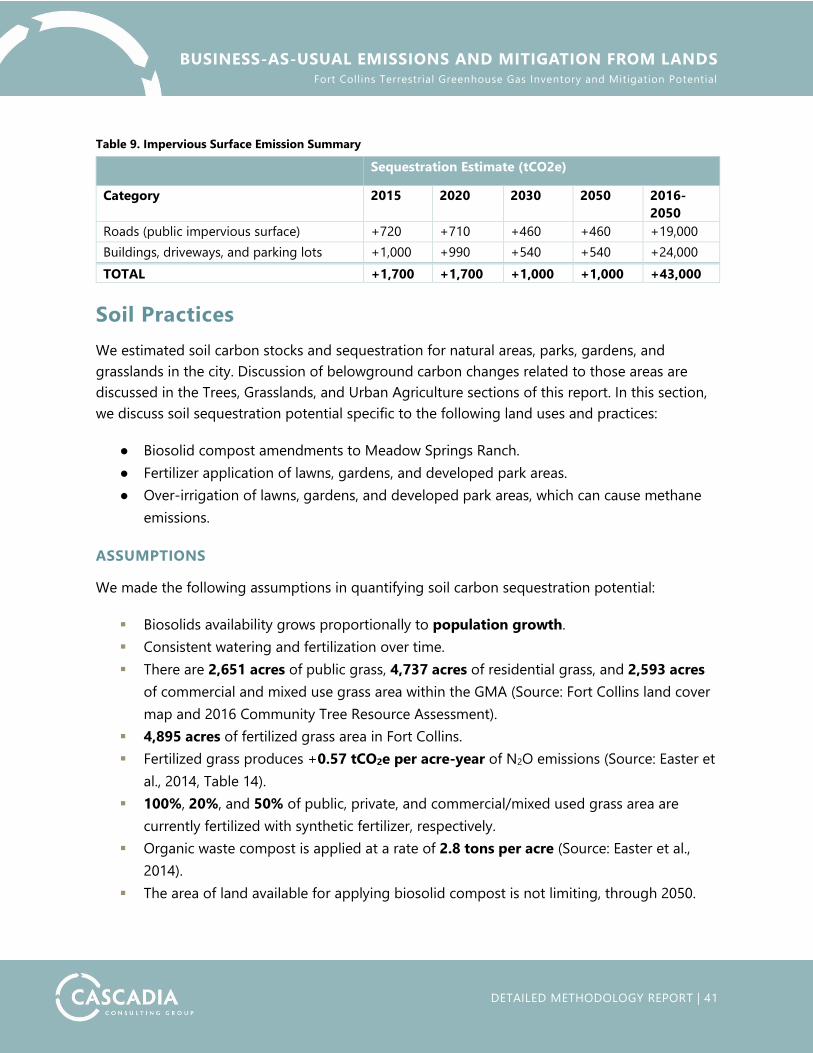
BUSINESS-AS-USUAL EMISSIONS AND MITIGATION FROM LANDS Fort Collins Terrestrial Greenhouse Gas Inventory and Mitigation Potential
DETAILED METHODOLOGY REPORT | 41
Table 9. Impervious Surface Emission Summary
Sequestration Estimate (tCO2e)
Category 2015 2020 2030 2050 2016-
2050
Roads (public impervious surface) +720 +710 +460 +460 +19,000
Buildings, driveways, and parking lots +1,000 +990 +540 +540 +24,000
TOTAL +1,700 +1,700 +1,000 +1,000 +43,000
Soil Practices
We estimated soil carbon stocks and sequestration for natural areas, parks, gardens, and
grasslands in the city. Discussion of belowground carbon changes related to those areas are
discussed in the Trees, Grasslands, and Urban Agriculture sections of this report. In this section,
we discuss soil sequestration potential specific to the following land uses and practices:
● Biosolid compost amendments to Meadow Springs Ranch.
● Fertilizer application of lawns, gardens, and developed park areas.
● Over-irrigation of lawns, gardens, and developed park areas, which can cause methane
emissions.
ASSUMPTIONS
We made the following assumptions in quantifying soil carbon sequestration potential:
Biosolids availability grows proportionally to population growth.
Consistent watering and fertilization over time.
There are 2,651 acres of public grass, 4,737 acres of residential grass, and 2,593 acres
of commercial and mixed use grass area within the GMA (Source: Fort Collins land cover
map and 2016 Community Tree Resource Assessment).
4,895 acres of fertilized grass area in Fort Collins.
Fertilized grass produces +0.57 tCO2e per acre-year of N2O emissions (Source: Easter et
al., 2014, Table 14).
100%, 20%, and 50% of public, private, and commercial/mixed used grass area are
currently fertilized with synthetic fertilizer, respectively.
Organic waste compost is applied at a rate of 2.8 tons per acre (Source: Easter et al.,
2014).
The area of land available for applying biosolid compost is not limiting, through 2050.
BUSINESS-AS-USUAL EMISSIONS AND MITIGATION FROM LANDS Fort Collins Terrestrial Greenhouse Gas Inventory and Mitigation Potential
DETAILED METHODOLOGY REPORT | 42
METHODOLOGY OVERVIEW
We used the following methodologies to quantify carbon sequestration of grasslands, described
in more detail below:
Biosolid compost amendment: We extrapolated from a published study to estimate
changes in soil carbon attributable to application of biosolid compost to Meadow
Springs Ranch and other lands where biosolids are applied.
Fertilizer application: We referenced outcomes from the CSU DAYCENT model to
estimate nitrous oxide emissions from use of fertilizer application.
Over-irrigation: We did not quantify emissions due to over-irrigation because we could
not find quantitative data documenting over irrigation; however, the DAYCENT model
would be appropriate to quantify this source.
Biosolid Compost Amendment
Step 1: Estimate available supply and application rate and area
According to the City website, Fort Collins currently produces approximately 1,900 dry tons of
solids per year, a portion of which is dried and applied to the rangeland at Meadow Springs
Ranch (70%) and private farm land (30%) at a rate of 2.8 dry tons per acre.3 Given available
supply, this rate results in the potential to amend approximately 821 acres of land with biosolid
amendments per year. Given the large area of agricultural and rangelands near Fort Collins, this
rate of biosolids application could be continued indefinitely. For biosolids to be applied to some
land uses, further treatment would be necessary beyond the current treatment conducted by
Fort Collins. We assume the mass of biosolids increases linearly with population.
Step 2: Estimate associated carbon emissions and sequestration
To estimate soil carbon accruals due to this practice, we multiplied available acres (821, see
above) by an estimated per-acre annual sequestration rate from Easter et al. (2014) of 0.37
tCO2e per acre. This calculation resulted in an estimated carbon sequestration of 300 tCO2e in
2015, and 14,000 tCO2e in cumulative sequestration from 2016 to 2050.
3 Source: http://www.fcgov.com/utilities/what-we-do/wastewater/biosolids; Easter et al. 2014
BUSINESS-AS-USUAL EMISSIONS AND MITIGATION FROM LANDS Fort Collins Terrestrial Greenhouse Gas Inventory and Mitigation Potential
DETAILED METHODOLOGY REPORT | 43
Fertilizer Application
Step 1: Estimate current fertilized areas
Applying nitrogen fertilizer in amounts, at times, or in forms that result in more available
nitrogen than plants and the soil microbial system can take up can result in nitrous oxide
emissions (N2O). N2O emissions are highly variable and depend on nitrogen availability, nitrogen
demand by plants and microbes, water status, temperature, soil chemistry, and other factors.
Recent research indicates that these emissions can rise quickly once plant and microbial demand
is exceeded, but can be very low if demand is greater than supply.
We were not able to find quantitative survey data on nitrogen application rates in Fort Collins.
City staff input and observation of late summer aerial photography suggest that 100%, 20%,
and 50% of public, private, and commercial/mixed used grass area are currently fertilized with
synthetic fertilizer, respectively, totaling 4,895 acres of total fertilized grass.
Step 2: Estimate N2O emission from fertilized areas
We used CSU’s DAYCENT model to estimate nitrous oxide emissions due to fertilization (Source:
Easter et al., 2014), which are estimated at 0.33 tCO2e per acre-year for soil N2O, after adjusting
for the fact that Easter et al. use the N2O GWP of 298 (from the IPCC Fourth Assessment Report)
and the Fort Collins GHG inventory use the N2O GWP of 310 (from the IPCC Second Assessment
Report). This is the baseline fertilizer emission, and it increases slightly over time, as the area of
lawns increases with ongoing development.
Irrigation
Step 1: Estimate current over-irrigated area
We have not found data of irrigation and soil water for Fort Collins. According to Fort Collins
Utilities, most grass area in Fort Collins is minimally irrigated or not irrigated. Irrigation in City
parks is adjusted according to weather and plant demand. We suspect that the fraction of turf
that is over watered is small to very small, and very likely less than 5 percent.
Step 2: Estimate carbon fluxes on over-irrigated areas
If soil is watered to the point of soil pore saturation, methane emissions can result. One could
use CSU’s DAYCENT model to estimate methane emissions due to over-irrigation.
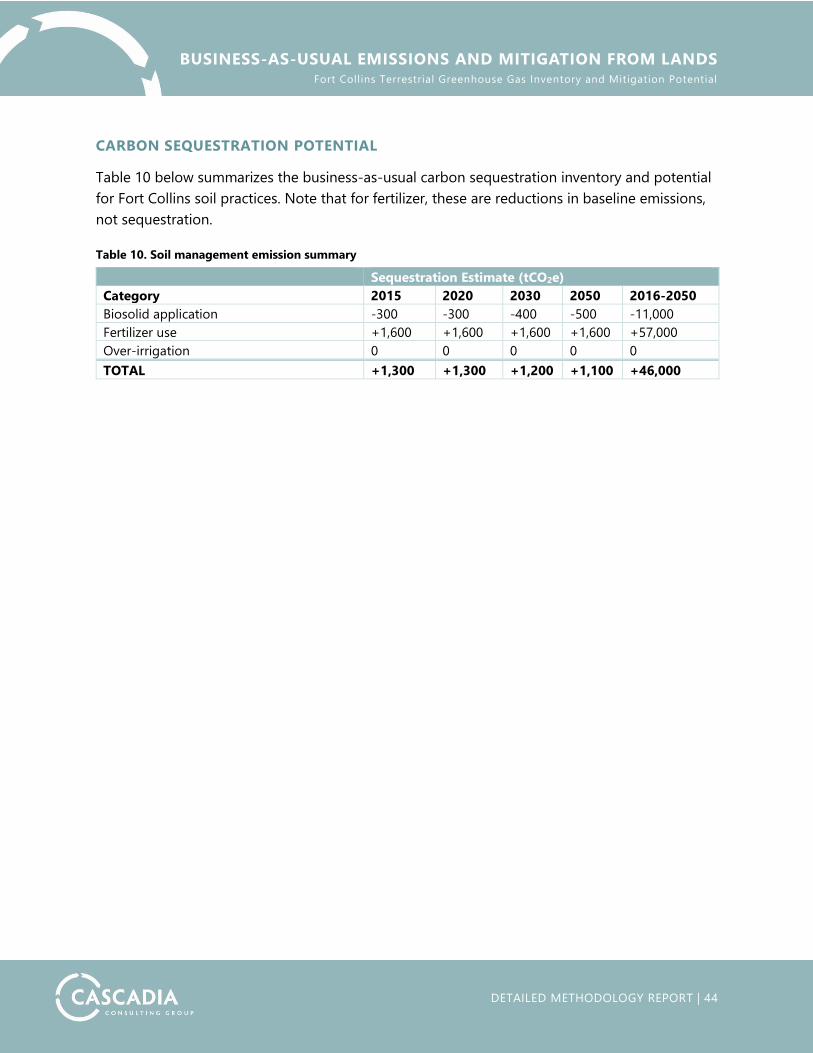
BUSINESS-AS-USUAL EMISSIONS AND MITIGATION FROM LANDS Fort Collins Terrestrial Greenhouse Gas Inventory and Mitigation Potential
DETAILED METHODOLOGY REPORT | 44
CARBON SEQUESTRATION POTENTIAL
Table 10 below summarizes the business-as-usual carbon sequestration inventory and potential
for Fort Collins soil practices. Note that for fertilizer, these are reductions in baseline emissions,
not sequestration.
Table 10. Soil management emission summary
Sequestration Estimate (tCO2e)
Category 2015 2020 2030 2050 2016-2050
Biosolid application -300 -300 -400 -500 -11,000
Fertilizer use +1,600 +1,600 +1,600 +1,600 +57,000
Over-irrigation 0 0 0 0 0
TOTAL +1,300 +1,300 +1,200 +1,100 +46,000
MITIGATION OPTIONS Fort Collins Terrestrial Greenhouse Gas Inventory and Mitigation Potential
DETAILED METHODOLOGY REPORT | 45
Mitigation Options
The business-as-usual scenario provides an informative picture of current and anticipated
carbon dynamics on Fort Collins lands. It assumes that the City and its residents will continue to
implement current and currently planned practices, programs, and approaches as indicated
through City plans, staff input, and demographic trends.
This section explores additional opportunities that the City could consider to further land carbon
sequestration and emission reduction. These mitigation options represent deviations from the
business-as-usual scenario. In other words, it provides estimated benefits for going above and
beyond what the City is currently doing or plans to do around land and natural resource
management.
The mitigation options presented in Table 11 on the following page and detailed in the
proceeding sections were generated from a literature review of demonstrated best practices,
conversations with City staff and subject matter experts, and opportunities gleaned from
inventory outcomes.
Based on expert judgment and outcomes from the inventory, we conducted an initial high level
assessment of identified options. Opportunities that were identified to have 1) little potential for
carbon sequestration accruals, or 2) limited data did not undergo a full quantitative assessment.
When possible, we provided quantitative carbon sequestration estimates on a per-unit basis
(e.g., per acre).
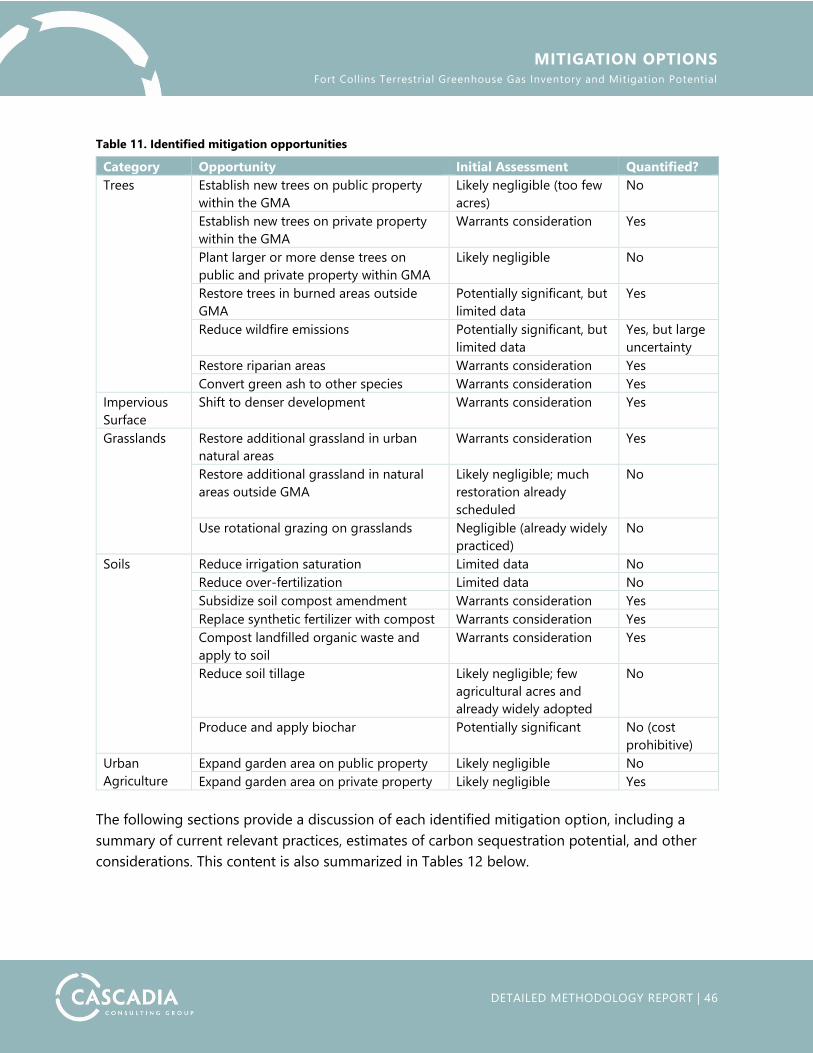
MITIGATION OPTIONS Fort Collins Terrestrial Greenhouse Gas Inventory and Mitigation Potential
DETAILED METHODOLOGY REPORT | 46
Table 11. Identified mitigation opportunities
Category Opportunity Initial Assessment Quantified?
Trees Establish new trees on public property
within the GMA
Likely negligible (too few
acres)
No
Establish new trees on private property
within the GMA
Warrants consideration Yes
Plant larger or more dense trees on
public and private property within GMA
Likely negligible No
Restore trees in burned areas outside
GMA
Potentially significant, but
limited data
Yes
Reduce wildfire emissions Potentially significant, but
limited data
Yes, but large
uncertainty
Restore riparian areas Warrants consideration Yes
Convert green ash to other species Warrants consideration Yes
Impervious
Surface
Shift to denser development Warrants consideration Yes
Grasslands Restore additional grassland in urban
natural areas
Warrants consideration Yes
Restore additional grassland in natural
areas outside GMA
Likely negligible; much
restoration already
scheduled
No
Use rotational grazing on grasslands Negligible (already widely
practiced)
No
Soils Reduce irrigation saturation Limited data No
Reduce over-fertilization Limited data No
Subsidize soil compost amendment Warrants consideration Yes
Replace synthetic fertilizer with compost Warrants consideration Yes
Compost landfilled organic waste and
apply to soil
Warrants consideration Yes
Reduce soil tillage Likely negligible; few
agricultural acres and
already widely adopted
No
Produce and apply biochar Potentially significant No (cost
prohibitive)
Urban
Agriculture
Expand garden area on public property Likely negligible No
Expand garden area on private property Likely negligible Yes
The following sections provide a discussion of each identified mitigation option, including a
summary of current relevant practices, estimates of carbon sequestration potential, and other
considerations. This content is also summarized in Tables 12 below.
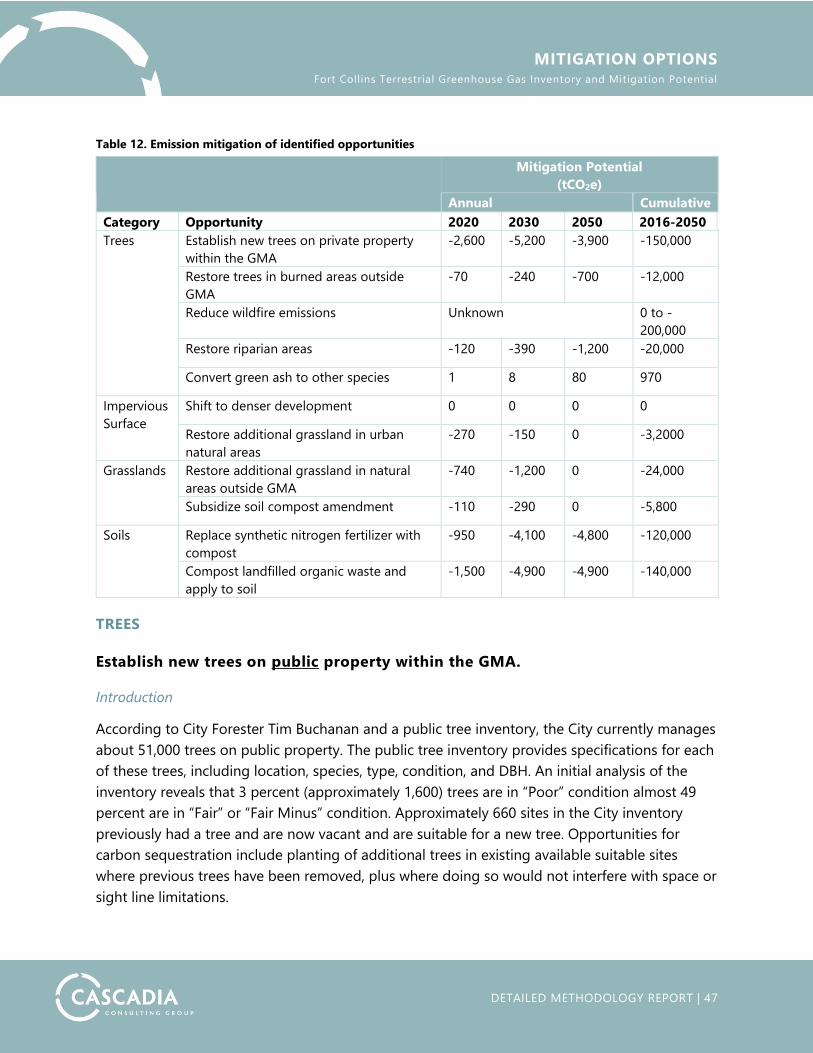
MITIGATION OPTIONS Fort Collins Terrestrial Greenhouse Gas Inventory and Mitigation Potential
DETAILED METHODOLOGY REPORT | 47
Table 12. Emission mitigation of identified opportunities
Mitigation Potential
(tCO2e)
Annual Cumulative
Category Opportunity 2020 2030 2050 2016-2050
Trees Establish new trees on private property
within the GMA
-2,600 -5,200 -3,900 -150,000
Restore trees in burned areas outside
GMA
-70 -240 -700 -12,000
Reduce wildfire emissions Unknown 0 to -
200,000
Restore riparian areas -120 -390 -1,200 -20,000
Convert green ash to other species 1 8 80 970
Impervious
Surface
Shift to denser development 0 0 0 0
Restore additional grassland in urban
natural areas
-270 -150 0 -3,2000
Grasslands Restore additional grassland in natural
areas outside GMA
-740 -1,200 0 -24,000
Subsidize soil compost amendment -110 -290 0 -5,800
Soils Replace synthetic nitrogen fertilizer with
compost
-950 -4,100 -4,800 -120,000
Compost landfilled organic waste and
apply to soil
-1,500 -4,900 -4,900 -140,000
TREES
Establish new trees on public property within the GMA.
Introduction
According to City Forester Tim Buchanan and a public tree inventory, the City currently manages
about 51,000 trees on public property. The public tree inventory provides specifications for each
of these trees, including location, species, type, condition, and DBH. An initial analysis of the
inventory reveals that 3 percent (approximately 1,600) trees are in “Poor” condition almost 49
percent are in “Fair” or “Fair Minus” condition. Approximately 660 sites in the City inventory
previously had a tree and are now vacant and are suitable for a new tree. Opportunities for
carbon sequestration include planting of additional trees in existing available suitable sites
where previous trees have been removed, plus where doing so would not interfere with space or
sight line limitations.
MITIGATION OPTIONS Fort Collins Terrestrial Greenhouse Gas Inventory and Mitigation Potential
DETAILED METHODOLOGY REPORT | 48
Carbon Sequestration Potential
An initial assessment suggests that planting new or restoring existing public street and park
trees would result in few carbon sequestration benefits due to limited available land area.
Other Considerations
Due to its semi-arid climate, planting new trees in Fort Collins may require additional irrigation,
which conflicts with City water conservation goals. Also, people want some areas of grass for
recreational and visual purposes. It may also increase resource needs for tree maintenance over
time. If irrigation is needed only for the first one or two summers to help trees establish, water
demand would be minimal. If ongoing irrigation is needed, the added demand for water may
not be acceptable to the City and the City my choose not to pursue this option.
Co-benefits of planting new trees include increased shade for residents and infrastructure
(important in the context of climate change) and aesthetic beauty, as well as other benefits
(Community Forest Assessment, 2016).
Establish new trees on private property within the GMA.
Introduction
The 2016 Community Forest Assessment used the i-Tree Eco model4 to estimate that over
443,000 trees exist within the Fort Collins community—equivalent to about 10 percent of land
area. The report also characterizes the current and future state of trees in the Fort Collins
community, including common tree genera, emerging threats, and benefits. Planting of
additional trees on private property—especially yard trees—could enhance woody biomass
carbon sequestration in the community.
Carbon Sequestration Potential
An initial assessment suggests that planting new or restoring existing private trees could
sequester an additional -150,000 tCO2e from 2016 to 2050. This assessment assumes that:
Half of the city area is “plantable space” (Source: 2016 Community Tree Assessment).
15 percent of that plantable space is feasible and desirable to plant, equivalent to
planting about 280 acres of private land per year for 10 years.
4 Version 6.0.9, developed by the US Forest Service, Northern Research Station.
MITIGATION OPTIONS Fort Collins Terrestrial Greenhouse Gas Inventory and Mitigation Potential
DETAILED METHODOLOGY REPORT | 49
Other Considerations
Like for public trees, planting of new trees on private lands would have a modest increase in
demand for water to establish new trees, but would have a community benefit and provide
enhanced aesthetics.
Restore trees in burned areas outside GMA.
Introduction
Natural areas outside the GMA such as Bobcat Ridge have endured severe wildfires that
eliminated tree stands such as ponderosa pine. The City currently manages these areas by
planting new trees where conditions can support them. Taking further action to restore these
once-forested areas can provide additional carbon sequestration benefits, though would be
limited to areas where natural water availability is sufficient to sustain growth. Collaborative
efforts with other landowners, in particular the US Forest Service, can help implement vegetation
management strategies across landscapes, to make the entire landscape more resistant to the
spread of stand replacing wildfire.
Carbon Sequestration Potential
An initial assessment suggests that restoring additional trees on burned and former agricultural
sites on the Bobcat Ridge and Poudre River Canyon natural areas could sequester an additional
-12,000 tCO2e from 2016 to 2050. This assessment assumes that:
500 acres of Bobcat Ridge are fire-killed forest that has not naturally regenerated and is
suitable for reforestation.
100 acres of Poudre River Canyon are fire-killed forest that has not naturally
regenerated and is suitable for reforestation.
The City restores 60 acres of these areas a year to ponderosa pine from 2018 to 2027.
Other Considerations
Tree survival could be challenging given natural conditions, but would add aesthetic beauty and
provide ecosystem services for native species of ponderosa pine habitat.
MITIGATION OPTIONS Fort Collins Terrestrial Greenhouse Gas Inventory and Mitigation Potential
DETAILED METHODOLOGY REPORT | 50
Avoid stand-replacing fire in natural areas.
Introduction
Best management practices can help minimize greenhouse gas emissions from catastrophic
wildfires, which are projected to become an increased threat under a changing climate. Methods
to avoid stand-replacing fire can further enhance carbon sequestration potential.
Carbon Sequestration Potential
An initial assessment suggests that approximately 200,000 tCO2e are at risk of releasing into the
atmosphere due to catastrophic wildfire. Preventing tree burning during these events would
help avoid these emissions.
Other Considerations
This action will be especially important in the context of climate change. It also preserves species
habitat.
Restore riparian areas.
Introduction
The City’s Natural Areas Department Restoration Plan (2016-2025) establishes ambitious
restoration goals, including a goal to initiate restoration of high priority natural areas along the
Poudre River by 2025. This opportunity calls for restoring even more riparian habitat in the city.
For example, the City could increase tree area and carbon density in natural areas along the
Lower Poudre River corridor.
Carbon Sequestration Potential
An initial assessment suggests that restoring additional riparian habitat in natural areas such as
the Lower Poudre River corridor could sequester an additional -20,000 tCO2e from 2016 to
2050. This assessment assumes that:
120 acres of Lower Poudre River natural areas are restored per year (compared to 20
acres under the baseline scenario) until 2027.
Other Considerations
The growth of tree species along riparian corridors requires considerable water resources, which
could strain water availability. However, restoration also enhances habitat and natural beauty.
MITIGATION OPTIONS Fort Collins Terrestrial Greenhouse Gas Inventory and Mitigation Potential
DETAILED METHODOLOGY REPORT | 51
Convert green ash to other species.
Introduction
The emerald ash borer presents a serious threat to future Ash survival and carbon sequestration
in Fort Collins. The City is already taking steps to mitigate this threat, including replacement of
lower quality ash with more resilient types of shade trees. These actions can reduce carbon
losses from ash tree mortality and disposal. This opportunity is most relevant for park, street,
and private trees, as the borer poses less of a threat in natural or restored riparian areas because
in forested areas there are generally nearby trees or tree seedlings ready to occupy any space
vacated by dying ash trees.
Carbon Sequestration Potential
An initial assessment suggests that up to 35,000 tCO2e of tree biomass are at risk from the
emerald ash borer. This carbon stock estimate is based on the number of ash trees estimated in
the Fort Collins, 2016 community tree resource assessment, assuming that the sizes of ash trees
on private lands have the same distribution as tree sizes of ash trees in the City tree inventory,
using a biomass equation developed for ash to estimate the biomass of each tree, and summing
the biomass of all trees. Planting replacement trees near existing ash would help mitigate losses
when the borer arrives, and could potentially totally avoid these net emissions. City staff
estimate that on City lands, the number of replacement trees planted on City lands could be
increased by 50 trees per year, and that an education program could get private landowners to
plant replacements of 2.5% of the ash trees in the city prior to death of ash trees caused by the
emerald ash borer. Dead trees are assumed to be removed and chipped, and the chips are
assumed to decompose at the rate of 10% per year. This advance planting prior to the arrival of
the ash borer reduces the loss of carbon stock by 970 tCO2e, through 2050.
Other Considerations
How current ash are disposed will have implications for associated carbon emissions. Also, there
could be a delay between planting and full tree development, which could result in a temporary
lapse in canopy cover and urban tree habitat.
GRASSLANDS
Restore additional grassland in urban natural areas.
Introduction
The City’s Natural Areas Department has been conserving and restoring native grasslands
throughout the region. A goal of the Natural Areas Department Restoration Plan (2016-2025) is
MITIGATION OPTIONS Fort Collins Terrestrial Greenhouse Gas Inventory and Mitigation Potential
DETAILED METHODOLOGY REPORT | 52
to initiate restoration on the Southern Grasslands by 2019—a target priority restoration area for
the City. This opportunity explores additional carbon sequestration that could be achieved
through more rapid and expansive restoration of grassland areas on publically owned and
managed properties inside the GMA. Most of the grassland restoration is shifting the plant
species mix from exotic species and annual species to native perennial species. Some restoration
is establishing grassland communities on former agricultural land.
Carbon Sequestration Potential
An initial assessment suggests that restoring additional grassland in natural areas within the
GMA at a faster rate than planned could provide an additional 3,200 tCO2e of emission
mitigation from 2016 to 2050. This assessment assumes that:
There are 14,328 acres of grassland in natural areas in poor condition in 2010 (Source:
Natural Areas Restoration Plan, Figure 3).
Six percent of degraded grassland acres will be restored from 2016 through 2024.
Restoration sequestration rates are -0.06 tCO2e per acre-year for the first 20 years and
zero thereafter (Source: Easter et al., 2014), resulting from the change in plant species.
Other Considerations
Grassland restoration also enhances habitat for native grassland species.
Restore additional grassland in natural areas outside the GMA.
Introduction
We also explored opportunities for additional restoration of grasslands at Soapstone Prairie
Natural Area and foothills natural areas. There may be additional opportunities for restoring
grassland communities on lands that serve as the source watersheds for the City. This land
outside the GMA and is not owned by the City of Fort Collins. Much of this watershed land is
administered by the US Forest Service, and a significant fraction is privately owned. Restoring
these lands would require partnerships with these other landowners.
Carbon Sequestration Potential
An initial assessment suggests that restoring additional grassland in Soapstone Prairie and
Foothills natural areas outside the GMA could sequester an additional -24,000 tCO2e from 2016
to 2050. This assessment assumes that:
MITIGATION OPTIONS Fort Collins Terrestrial Greenhouse Gas Inventory and Mitigation Potential
DETAILED METHODOLOGY REPORT | 53
There are 4,993 acres of native cover grassland in Soapstone Prairie in need of
restoration (Source: Natural Areas Restoration Plan), but these lands are already in
moderate condition, so the carbon gain per acre will be small.
500 acres of Soapstone Prairie are treated per year from 2018 to 2027.
300 acres of foothills natural areas are treated per year from 2018 to 2027.
Restoration sequestration rates for Soapstone Prairie are -0.06 tCO2e per acre-year for
the first 20 years and zero thereafter (Source: COMET-PLANNER tool, Swan pers. comm.).
Restoration sequestration rates for Foothills natural areas are -0.06 tCO2e per acre-year
for the first 20 years and zero thereafter (Source: COMET-PLANNER tool, Swan personal
communication).
Restoration is assumed to exclude fertilization or have only low levels of fertilization
(including manure from grazing).
Other Considerations
Grassland restoration also enhances habitat for native grassland species.
IMPERVIOUS SURFACE
Shift to denser development.
Introduction
Population growth in Fort Collins is projected to continue over the next 50 years, which will
bring increased demand for housing and urban growth. According to the 2011 City Plan, much
of the “greenfield” land within the GMA has been developed. As a result, there is increased
emphasis on infill and redevelopment opportunities within certain established areas of the city,
as existing development becomes outdated or underutilized. To the extent possible, promoting
denser development and minimizing additional conversion to impervious surface such as streets
and sidewalks could further enhance carbon sequestration of city lands. Smaller building
footprints and taller buildings can provide usable built space with less impervious surface.
Transportation planning may be able to reduce the impervious area of streets and sidewalks
associated with development. Driveways and parking are also substantial areas of impervious
surface. If these areas can be reduced or can me made of surfaces that incorporate plant growth
and soil microbial activity, carbon loss from impervious surfaces could be reduced.
Carbon Sequestration Potential
At the initiation of this analysis, we expected that making development more dense would
reduce GHG emissions from conversion of soil to impervious surface. It does, however, in Fort
MITIGATION OPTIONS Fort Collins Terrestrial Greenhouse Gas Inventory and Mitigation Potential
DETAILED METHODOLOGY REPORT | 54
Collins developable sites tend to have previously degraded soils from past agricultural tillage, so
additional carbon losses are small compared to converting native prairie or sites in more moist
regions. If commercial agricultural land is converted, the emission per acre may be slightly
higher because most commercial agriculture in the Fort Collins area converted from tillage to
no-till 10-20 years ago, and the soil has sequestered a modest amount of carbon as a result of
the reduction in tillage. Much of this recently sequestered carbon would be emitted upon
conversion of the land to impervious surface. Also, in dense development there is less room for
trees per dwelling unit, and in Fort Collins, lots are generally treeless before development and
trees are planted with development. This is in contrast to more moist areas where the pre-
development land cover is trees. Because of these conditions, making development more dense
reduces carbon sequestration in trees, and—per dwelling unit—this foregone sequestration is
several times larger than the avoided soil emissions.
Other Considerations
Minimizing impervious conversion can save the City development costs for sidewalk and street
infrastructure, as well as preserve existing green space and habitat.
There is interest in Fort Collins in maintaining local agriculture. A small fraction of the land area
within the GMA is agricultural and as demand for development continues, there will be
increasing pressure to convert agricultural lands to development. Opportunities for maintaining
agricultural land are greater outside the GMA. If development demand can be satisfied within
the GMA, programs to maintain agriculture around Fort Collins may be more effective. Also,
compost and soil amendments make agricultural lands more productive, and more resistant to
drought. As a result, GHG mitigation activities that include increasing compost and soil
amendments can make agriculture more resilient in the face of increased drought risk, and may
make agriculture more economically competitive.
SOIL PRACTICES
Reduce irrigation saturation.
Introduction
Over-irrigation of turf fields such as lawns, parks, and golf courses can trigger anaerobic soil
processes that produce methane and nitrous oxide, which are very potent greenhouse gases.
According to City water conservation specialist Renee Davis, there may be opportunities to
improve irrigation practices in Fort Collins. Although it is unknown what proportion of turf in the
city may be currently over-irrigated, the strength of methane and nitrous oxide as greenhouse
gases could warrant consideration of this opportunity. However, all land managers we
MITIGATION OPTIONS Fort Collins Terrestrial Greenhouse Gas Inventory and Mitigation Potential
DETAILED METHODOLOGY REPORT | 55
interviewed asserted that they irrigate to less than saturation, and we could find no
measurements of soil water content showing saturation.
Emission Mitigation Potential
An initial assessment suggests that reducing over-irrigation in the city could reduce emissions
by an additional 0.24-0.32 tCO2e per acre per year, depending on vegetation type (Easter et al.,
2014). However, our research did not reveal evidence of over irrigation. That said, on heavily
irrigated lands with substantial nitrogen input rates, emissions—and thus potential emission
mitigation—can be several times greater than the emissions estimated by Easter et al. (2014).
Other Considerations
Avoiding over-irrigation is also aligned with the City’s water conservation goals, saves water
costs, and maintains instream aquatic habitat by reducing stream water uptake for municipal
purposes.
Reduce over-fertilization.
Introduction
Over-fertilization of turf, gardens, and other green areas can produce unnecessary nitrous oxide
emissions—a potent greenhouse gas. Although it is unknown what proportion of land area in
the city may be currently over-fertilizing, the strength of nitrous oxide as a greenhouse gas
could warrant consideration of this opportunity. Furthermore, recent research shows that N2O
production increases exponentially as the nitrogen input rate rises (Shcherbak et al., 2014).
Therefore, if there are sites with extreme over fertilization, the GHG benefits of reducing fertilizer
application rates to amounts needed by plants can result in significant GHG emission reductions.
At a nitrogen application rate of 120 pounds per acre per year, N2O emissions can be 2.2
tCO2e/acre-year (rates vary by site conditions and the global average emission rate at this
fertilization rate is about ⅓ lower), and rise rapidly as the nitrogen application rate increases
(Shcherbak et al., 2014).
Emission Mitigation Potential
An initial assessment suggests that on heavily fertilized sites, reducing fertilization could reduce
N2O emissions by more than 0.32 tCO2e per acre per year. This amount is only for on-site soil
N2O emissions. Reducing fertilization would also decrease upstream emissions from fertilizer
manufacturing, but these emissions are outside the boundary of the Fort Collins GHG inventory
and are not counted here. Some experts believe that many yard services over-fertilize and
MITIGATION OPTIONS Fort Collins Terrestrial Greenhouse Gas Inventory and Mitigation Potential
DETAILED METHODOLOGY REPORT | 56
combine over-fertilization with irrigation, and soil wetness increases N2O production. However,
we have not documented over-fertilization.
Other Considerations
Reduction of fertilizer use also saves chemical costs and improves local water quality.
Replace synthetic fertilizer with compost.
Introduction
Natural compost fertilizer—especially locally produced compost—has significantly lower
lifecycle carbon emissions compared to its synthetic counterpart. Although it is unknown to
what extent the City and its businesses and residents apply synthetic fertilizer, we assume that
there could be an opportunity to reduce emissions through expanded education and outreach
to land care professionals, gardeners, and homeowners.
Carbon Sequestration Potential
An initial assessment suggests that replacing synthetic fertilizer with compost could sequester
an additional -120,000 tCO2e of soil carbon from 2016 to 2050. This assessment assumes that:
Replacing synthetic fertilizer with compost would reduce net emissions by -0.51 tCO2e
per acre-year, combining increased soil carbon sequestration resulting from compost
amendments, minus the baseline carbon sequestration that occurs with use of synthetic
fertilizers (Source: Easter et al., 2014, Table 14).
There are 2,651 acres of public grass, 4,737 acres of residential grass, and 2,593 acres
of commercial and mixed use grass area within the GMA (Source: Fort Collins land cover
map and 2016 Community Tree Resource Assessment).
7,947 acres of agricultural land could switch to compost, but 65% of agricultural
fertilization could be converted to compost.
100%, 20%, and 50% of public, private, and commercial/mixed used grass area are
currently fertilized with synthetic fertilizer, respectively.
A fertilizer switching program would take 10 years to reach full implementation
potential (growing linearly each year).
If Fort Collins were to promote production and use of compost, this activity could be done
outside the Fort Collins GMA and Fort Collins could take credit for N2O emission reductions
from fields and increased soil carbon sequestration, but the City probably should not claim
MITIGATION OPTIONS Fort Collins Terrestrial Greenhouse Gas Inventory and Mitigation Potential
DETAILED METHODOLOGY REPORT | 57
offsets in the City GHG inventory based on upstream emission reductions from reduction in
fertilizer production.
Compost amendments increase soil water holding capacity and make plants growing in those
soils more resistant to drought. The City may wish to investigate whether compost amendments
would make native prairie ecosystems on City natural areas more resistant to climate change.
Make compost from organic municipal waste and apply to soil.
Introduction
According to the 2013 Fort Collins Zero Waste Report, a commercial composting facility is
required to meet the City’s zero waste goals, and can also provide a greenhouse gas benefit by
limiting methane emissions from landfills. In 2015, 31,661 tons of food and yard waste organic
material generated by Fort Collins businesses and residents were disposed in the landfill
(additional material was recycled). This opportunity examines the additional carbon
sequestration potential that could be realized by diverting organic material that is currently
being landfilled, composting that material, and applying the compost to soils. Compost can be
applied to public or private lands.
Carbon Sequestration Potential
An initial assessment suggests that producing and applying organic waste compost to City lands
could sequester an additional soil carbon and reduce landfill emissions, jointly totaling -550,000
tCO2e from 2016 to 2050. Of this total benefit, 21% is increased sequestration of carbon in soil,
and 79% is reduction in landfill emissions, mainly reducing methane emissions from the landfills
where Fort Collins’ waste is currently being buried. This assessment assumes that:
At full implementation, the program diverts from landfilling to composting 31,661 US
wet tons per year of food waste and yard waste.
Organic waste compost is applied at a rate of 2.8 tons per acre (Source: Easter et al.,
2014).
Compost-treated soils can sequester large amounts of soil carbon. However, at the low
application rate used in Fort Collins, the soils gain carbon stock approximately 0.63
tCO2e per acre-year of compost application (Source: Easter et al., 2014). This gross
benefit includes for sequestration that would have occurred under standard (non-
compost) fertilizer application. This analysis assumes that 80% of the land where
compost is applied previously had applied standard fertilizer. The baseline carbon
sequestration with fertilizer is 0.15 tCO2e per acre-year and the net benefit of switching
from synthetic fertilizer to compost is 0.51 tCO2e per acre-year.
MITIGATION OPTIONS Fort Collins Terrestrial Greenhouse Gas Inventory and Mitigation Potential
DETAILED METHODOLOGY REPORT | 58
All currently landfilled food and yard waste are diverted to composting, with diversion of
31,661 tons (US tons, wet weight) of material each year, once the program is fully
operational. Other types of organic waste continue to be landfilled.
Landfill and composting emissions are calculated using the WARM model (version 14),
assuming that current landfill gas recovery systems remain in place. This model assumes
net landfill emissions of 1.39 and 0.21 MTCO2e per ton for food and yard waste,
respectively.
The ratio of compost mass per unit of mass of input material is assumed to be 0.71.
An organic waste composting program would take 10 years to reach full implementation
(growing linearly each year).
Other Considerations
In addition to the greenhouse gas benefits, composting and application of organics waste also
helps soil retain moisture and suppress plant diseases and pests, reduces the need for chemical
fertilizers that can harm local water quality, and reduces the need for additional landfill space.
Compost amendments increase soil water holding capacity and make plants growing in those
soils more resistant to drought. The City may wish to investigate whether compost amendments
would make native prairie ecosystems on City natural areas more resistant to climate change.
Increase area of gardens
Introduction
Fertilization, application of organic soil amendments, and inputs of crop debris typically increase
soil carbon in gardens to levels much higher than under other typical land uses in Fort Collins.
Increasing the area of gardens in the city would increase soil carbon sequestration.
Carbon Sequestration Potential
The amount of carbon sequestration in gardens depends on the area brought into new gardens.
Because the total area of new gardens is assumed to be very modest, the expected carbon
sequestration is estimated to be modest, 140 tCO2e cumulative by 2050. This assessment
assumes:
3.5% soil carbon content of garden soil after 20 years of gardening
Converting lawn to garden increases soil carbon stock by 108 tCO2e/acre over 20 years,
above the carbon stock in lawn, and this increase occurs linearly.
1% of the 36,800 single family residences in Fort Collins in 2015 establish a new garden
plot in 2019.
MITIGATION OPTIONS Fort Collins Terrestrial Greenhouse Gas Inventory and Mitigation Potential
DETAILED METHODOLOGY REPORT | 59
New garden plots average 10’ by 15’ in size.
Other Considerations
Increasing gardening increases the amount of food in Fort Collins that is locally grown. If
fertilizer application rates are excessive, nitrous oxide emissions could cancel out soil carbon
sequestration benefits. If synthetic nitrogen fertilizer is used, a portion of the GHG benefit of soil
carbon sequestration will be cancelled by emissions from fertilizer manufacturing Fertilizer
manufacturing emissions are outside the boundary of this inventory, but any program that
promotes increased gardening should favor use of compost as a source of nutrients.
Subsidize soil compost amendment
Introduction
This opportunity explores carbon sequestration that would result from increased compost
amendments to agricultural soils. The City currently applies biosolids compost to Meadow
Springs Ranch and some other private lands.
Carbon Sequestration Potential
An initial assessment suggests that increase soil compost amendments to agricultural lands
could sequester an additional -5,800 tCO2e from 2016 to 2050. This assessment assumes:
7,947 acres of agricultural area (Source: GIS analysis of land cover data).
5,086 acres treated from 2010 to 2015.
8% of eligible acres receive compost applications each year from 2018 to 2050 (with
lands receiving one application every 12.5 years).
Other Considerations
This action also enhances soil quality and may make farming more resilient in the face of climate
change.
RECOMMENDATIONS Fort Collins Terrestrial Greenhouse Gas Inventory and Mitigation Potential
DETAILED METHODOLOGY REPORT | 60
Recommendations
Outcomes from the business-as-usual and mitigation options scenario assessments revealed the
following key recommendations for City of Fort Collins consideration, in order of priority:
1. Improve soil amendments. Converting current landfill waste to compost and applying it
to soils sequesters carbon in soil. This opportunity has a high carbon benefit, could make
lands more resilient in a changing climate, conserves expensive landfill space, and is
aligned with the City’s waste reduction goals.
2. Increase tree planting, focusing on drought tolerant species. Trees on private lands
present a high potential carbon benefit for the city and add shade, habitat, and natural
aesthetic in urban and suburban areas. To the extent possible, it will be important to
focus on species that require minimal irrigation after establishment.
3. Examine the feasibility of using compost to replace synthetic nitrogen fertilizers. In
addition to its high carbon benefit, this opportunity can reduce nitrate leaching,
improves soil quality and water retention, and advances the City goal of supporting local
agriculture.
4. Restore riparian forest habitat. Although expensive, this is a City priority for improved
ecological, aesthetic, and hydrologic management on city lands. In addition to adding
woody biomass to the landscape, this opportunity can mitigate damage from stormwater
flows by stabilizing banks and providing functional floodplains. There may be additional
lands, outside the area addressed by this analysis, where the city could partner to
achieve restoration, particularly in the watershed that is the source of the City’s drinking
water.
5. Continue investigating the feasibility of re-establishing trees on burned areas
within natural areas. A stated priority in the City’s restoration plans, this opportunity
can maintain forest habitat in the face of climate change and re-establish natural habitat.
Feasibility will depend on the ability to establish trees under hotter and drier climate
conditions. The sites in the Bobcat Ridge and Poudre River Canyon natural areas where
tree restoration is needed mostly have harsh climatic conditions which make it
challenging to establish tree seedlings. Partnering with the US Forest Service may help
identify cost effective tree planting methods for sites that are near the limit of suitability
for trees, and may provide opportunities for combining tree restoration activities to
achieve economies of scale.
REFERENCES Fort Collins Terrestrial Greenhouse Gas Inventory and Mitigation Potential
DETAILED METHODOLOGY REPORT | 61
References
City of Fort Collins. (2014). Natural Areas Master Plan.
City of Fort Collins. (2016). Natural Areas Department Restoration Plan (2016-2025).
Davey Resource Group. (2016). Fort Collins, CO Community Forest Assessment.
Easter, M., Swan, A., Williams, S., & The Brendle Group. (2014). Greenhouse Gas Inventory from
Agriculture, Forestry and Other Land Uses for Boulder County, Colorado Parks, and Open Space.
Jobbágy, E. G., & Jackson, R. B. (2000). The vertical distribution of soil organic carbon and its
relation to climate and vegetation. Ecological Applications, 10(2), 423-436.
Larimer County. (2007). Street Design and Technical Criteria. In L. County, Larimer County Urban
Area Street Standards.
Saunders, Stephen, Tom Easley, and Melissa Mezger. 2016. Future Climate Extremes in Larimer
County. The Rocky Mountain Climate Organization.
http://www.rockymountainclimate.org/extremes/larimer.htm
Shcherbak, I., Millar, N., & Robertson, G. P. (2014). Global metaanalysis of the nonlinear response
of soil nitrous oxide (N2O) emissions to fertilizer nitrogen. Proceedings of the National Academy
of Sciences. 111(25), 9199-9204.
Smith, J. E., Heath, L. S., Skog, K. E., & Birdsey, R. A. (2005). Methods for Calculating Forest
Ecosystem and Harvest Carbon with Standard Estimates for Forest Types of the United States.
USDA Forest Service Northeastern Research Station.
Sullivan, Tarah S., Mary E. Stromberger, and Mark W. Paschke. 2006. Parallel shifts in plant and
soil microbial communities in response to biosolids in a semi-arid grassland. Soil Biology and
Biochemistry. 38: 449-459.
Woodbury, M., Baldo, M., Yates, D., & Kaatz, L. (2012). Joint Front Range Climate Vulnerability
Study. Denver, Colorado: Water Research Foundation.