Embed Size (px)
Citation preview
page 1
Table of Contents
Chapter 1: Welcome. . . . . . . . . . . . . . . . . . . . . . . . . . . . 1Introduction. . . . . . . . . . . . . . . . . . . . . . . . . . . . . .2
BLItz System Package . . . . . . . . . . . . . . . . . . . .2
Conventions Used in This Guide. . . . . . . . . . .4
BLItz Support Options . . . . . . . . . . . . . . . . . . . .5
Technical Support . . . . . . . . . . . . . . . . . . . .5
Depot Repair . . . . . . . . . . . . . . . . . . . . . . . . .5
Chapter 2: BLItz System Specifications . . . . . . . . . . 7
BLItz System Specifications . . . . . . . . . . . . . . .8
Basic Functions of the BLItz System . . . . . 10
Biosensors. . . . . . . . . . . . . . . . . . . . . . . . . . . . . . 12
Dip and Read Assays . . . . . . . . . . . . . . . . 12
Biosensor Types . . . . . . . . . . . . . . . . . . . . . 13
BLI Technology . . . . . . . . . . . . . . . . . . . . . 15
Chapter 3: BLItz Installation . . . . . . . . . . . . . . . . . . . 17
Installing the BLItz System . . . . . . . . . . . . . . 18
Using the BLItz Pro Software User Interface20
Toolbars . . . . . . . . . . . . . . . . . . . . . . . . . . . . 21
Menu Commands. . . . . . . . . . . . . . . . . . . 22
Icons . . . . . . . . . . . . . . . . . . . . . . . . . . . . . . . 28
Uninstalling the BLItz Pro Software . . . . . 30
Chapter 4: Working with Experiments . . . . . . . . . .31
Introduction . . . . . . . . . . . . . . . . . . . . . . . . . . . .32
Accessing Experiment Modules . . . . . . . . . .32
Hydrating Biosensors. . . . . . . . . . . . . . . . . . . .33
Running a Quick Yes/No Experiment. . . . .35
Creating a Standard Curve . . . . . . . . . . . . . .41
Running a Quantitate Sample Experiment48
Running a Basic Kinetics Experiment. . . . .54
Running an Advanced Kinetics Experiment61
Appendix A: Running the BLItz Pro Software on Computers Running Octet Systems . .67
Running Only the BLItz System on the Computer . . . . . . . . . . . . . . . . . . . . . . . . . . . . . . .68
Running Experiments on Octet and BLItz Systems on the Same Computer . . . . . . . . .68
Appendix B: Troubleshooting . . . . . . . . . . . . . . . . . . . .71
Troubleshooting BLItz System Errors with an Octet System . . . . . . . . . . . . . . . . . . . . . . . . . . . .72
Scenario 1—The BLItz System Cannot Initialize Successfully . . . . . . . . . . . . . . . .72
Scenario 2—The BLItz System Is Not Recognized . . . . . . . . . . . . . . . . . . . . . . . . . .72
Index. . . . . . . . . . . . . . . . . . . . . . . . . . . . . . . . 1
BLItz User Guide

page 2
BLItz User Guide
page 1
CHAPTER 1: WelcomeIntroduction . . . . . . . . . . . . . . . . . . . . . . . . . . . . . . . . . . . . . . . . . . . . . . . . . . . . . . . . . . . . . . . . . . . . . . . . . . . 2
BLItz System Package . . . . . . . . . . . . . . . . . . . . . . . . . . . . . . . . . . . . . . . . . . . . . . . . . . . . . . . . . . . . . . . . . . 2
Conventions Used in This Guide . . . . . . . . . . . . . . . . . . . . . . . . . . . . . . . . . . . . . . . . . . . . . . . . . . . . . . . . 4
BLItz Support Options . . . . . . . . . . . . . . . . . . . . . . . . . . . . . . . . . . . . . . . . . . . . . . . . . . . . . . . . . . . . . . . . . 5
Technical Support . . . . . . . . . . . . . . . . . . . . . . . . . . . . . . . . . . . . . . . . . . . . . . . . . . . . . . . . . . . . . . . . . 5
Depot Repair . . . . . . . . . . . . . . . . . . . . . . . . . . . . . . . . . . . . . . . . . . . . . . . . . . . . . . . . . . . . . . . . . . . . . . 5
BLItz User Guide
page 2 Chapter 1: Welcome
INTRODUCTIONWelcome to the ForteBio BLItz User Guide. This guide explains how to:
• Configure, install, and operate your BLItz system and BLItz Pro software.
• Set up and run kinetics experiments on the BLItz instrument.
The BLItz system and BLItz Pro software user guide contains information on materials required for using the BLItz system, installation procedure, setting up and running experi-ments and performing data analysis.
If you would like further information on any topic, contact technical support using informa-tion provided in “BLItz Support Options” on page 5.
The guide provides a set of specific instructions in the “Working with Experiments” on page 31 based on the Starter kit included with your BLItz system. We highly recommend to new users that they first perform the tests illustrated in this guide to familiarize themselves with BLItz system operations before embarking on their own research.
We wish you the best in your research!
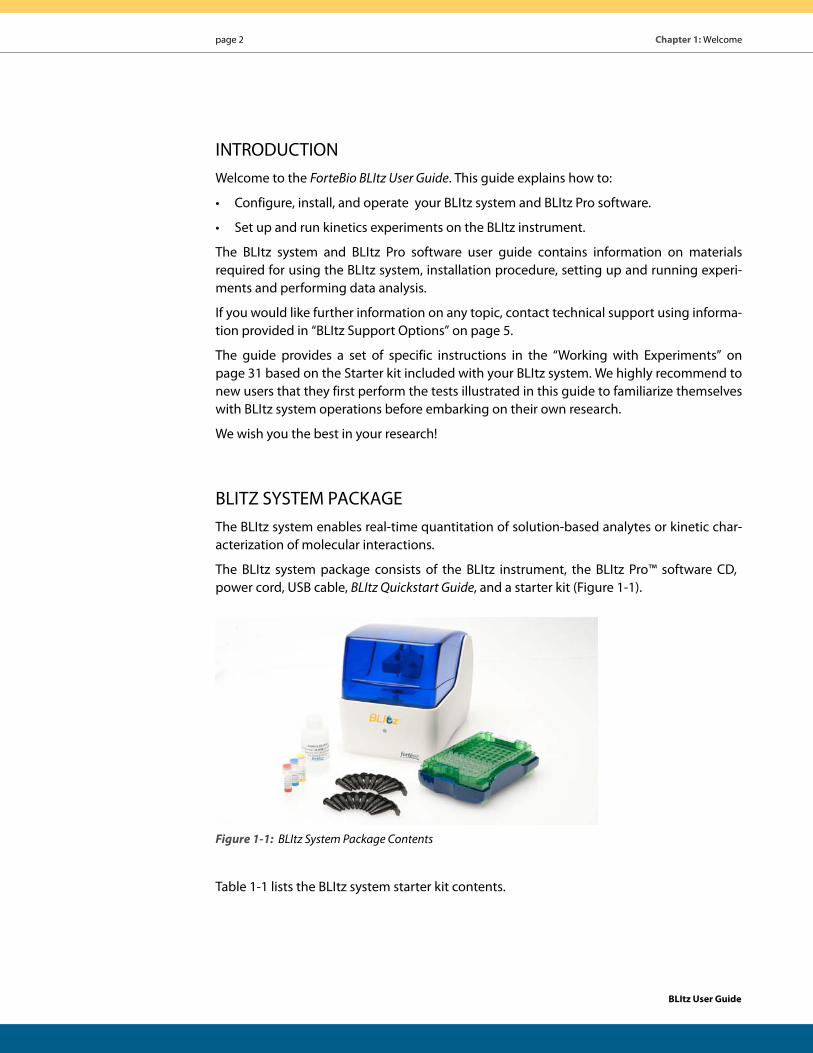
BLITZ SYSTEM PACKAGEThe BLItz system enables real-time quantitation of solution-based analytes or kinetic char-acterization of molecular interactions.
The BLItz system package consists of the BLItz instrument, the BLItz Pro™ software CD, power cord, USB cable, BLItz Quickstart Guide, and a starter kit (Figure 1-1).
Figure 1-1: BLItz System Package Contents
Table 1-1 lists the BLItz system starter kit contents.
BLItz User Guide
BLItz System Package page 3
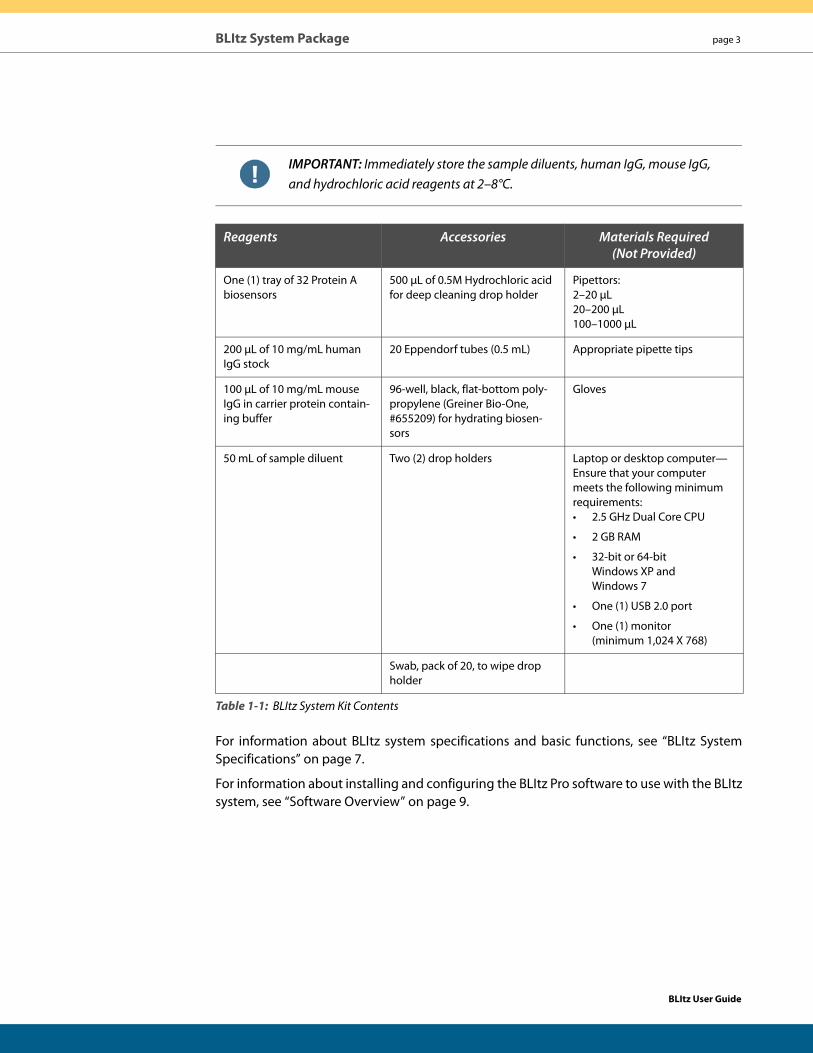
IMPORTANT: Immediately store the sample diluents, human IgG, mouse IgG, and hydrochloric acid reagents at 2–8°C.
For information about BLItz system specifications and basic functions, see “BLItz System Specifications” on page 7.
For information about installing and configuring the BLItz Pro software to use with the BLItz system, see “Software Overview” on page 9.
Reagents Accessories Materials Required (Not Provided)
One (1) tray of 32 Protein A biosensors
500 μL of 0.5M Hydrochloric acid for deep cleaning drop holder
Pipettors: 2–20 μL 20–200 μL 100–1000 μL
200 μL of 10 mg/mL human IgG stock
20 Eppendorf tubes (0.5 mL) Appropriate pipette tips
100 μL of 10 mg/mL mouse IgG in carrier protein contain-ing buffer
96-well, black, flat-bottom poly-propylene (Greiner Bio-One, #655209) for hydrating biosen-sors
Gloves
50 mL of sample diluent Two (2) drop holders Laptop or desktop computer—Ensure that your computer meets the following minimum requirements: • 2.5 GHz Dual Core CPU
• 2 GB RAM
• 32-bit or 64-bit Windows XP and Windows 7
• One (1) USB 2.0 port
• One (1) monitor (minimum 1,024 X 768)
Swab, pack of 20, to wipe drop holder
Table 1-1: BLItz System Kit Contents
BLItz User Guide
page 4 Chapter 1: Welcome
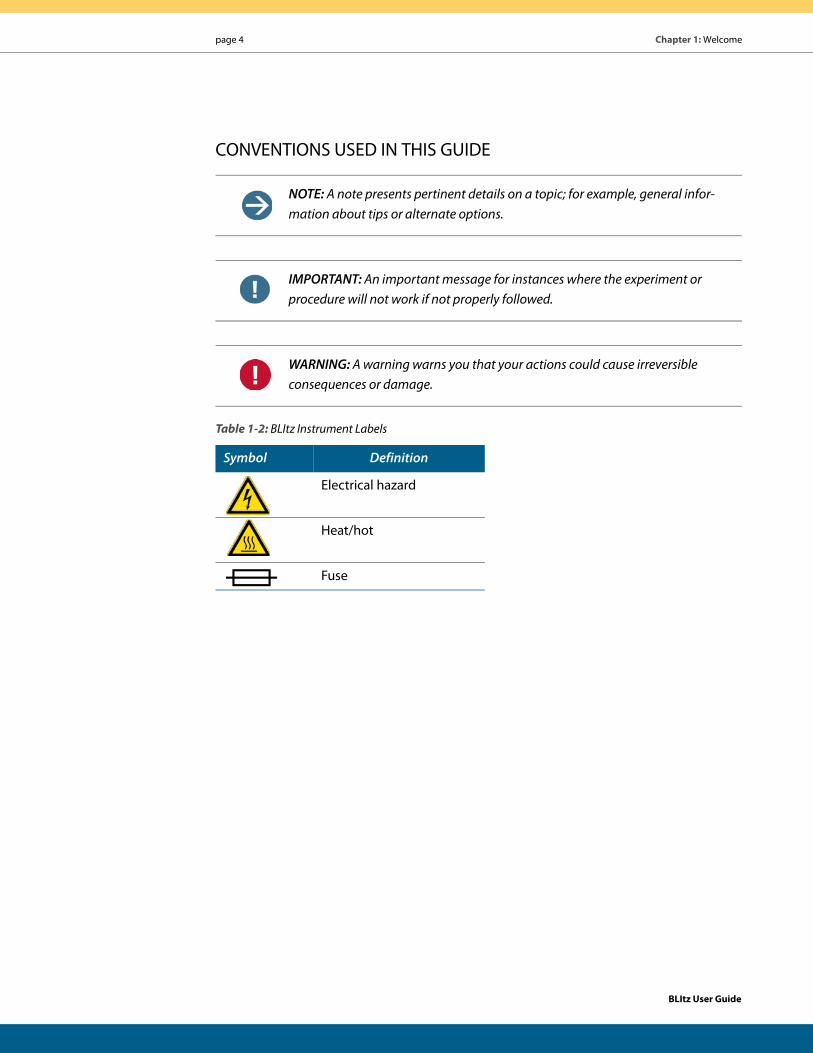
CONVENTIONS USED IN THIS GUIDE
NOTE: A note presents pertinent details on a topic; for example, general infor-mation about tips or alternate options.
IMPORTANT: An important message for instances where the experiment or procedure will not work if not properly followed.
WARNING: A warning warns you that your actions could cause irreversible consequences or damage.
Table 1-2: BLItz Instrument Labels
Symbol Definition
Electrical hazard
Heat/hot
Fuse
BLItz User Guide
BLItz Support Options page 5
BLITZ SUPPORT OPTIONSForteBio wants to ensure that you are completely satisfied with the BLItz system and soft-ware, and will address any concerns in a timely manner—it’s our way of supporting your research. We are also extremely interested in your product feedback and application needs, and would be happy to discuss either with you.
Technical SupportFor technical questions or to speak with one of our support staff, email technical support via our online form which also lets you attach files. You can contact BLItz technical support at:
ForteBio, Inc. 1360 Willow Road, Suite 201 Menlo Park, CA 94025 USA Tel: +1-855-BLITZ MEFax: +1-650-322-1370E-mail: [email protected]://www.blitzmenow.com/email_support.html
Depot RepairForteBio offers a depot repair service. If your BLItz system needs service, please contact technical support (http://www.blitzmenow.com/email_support.html) for more informa-tion.
BLItz User Guide

page 6 Chapter 1: Welcome
BLItz User Guide
page 7
CHAPTER 2: BLItz System SpecificationsBLItz System Specifications . . . . . . . . . . . . . . . . . . . . . . . . . . . . . . . . . . . . . . . . . . . . . . . . . . . . . . . . . . . . 8
Basic Functions of the BLItz System . . . . . . . . . . . . . . . . . . . . . . . . . . . . . . . . . . . . . . . . . . . . . . . . . . . . 10
Biosensors . . . . . . . . . . . . . . . . . . . . . . . . . . . . . . . . . . . . . . . . . . . . . . . . . . . . . . . . . . . . . . . . . . . . . . . . . . . . 12
Dip and Read Assays . . . . . . . . . . . . . . . . . . . . . . . . . . . . . . . . . . . . . . . . . . . . . . . . . . . . . . . . . . . . . . 12
Biosensor Types . . . . . . . . . . . . . . . . . . . . . . . . . . . . . . . . . . . . . . . . . . . . . . . . . . . . . . . . . . . . . . . . . . 13
BLI Technology . . . . . . . . . . . . . . . . . . . . . . . . . . . . . . . . . . . . . . . . . . . . . . . . . . . . . . . . . . . . . . . . . . . 15
BLItz User Guide
page 8 BLItz System Specifications
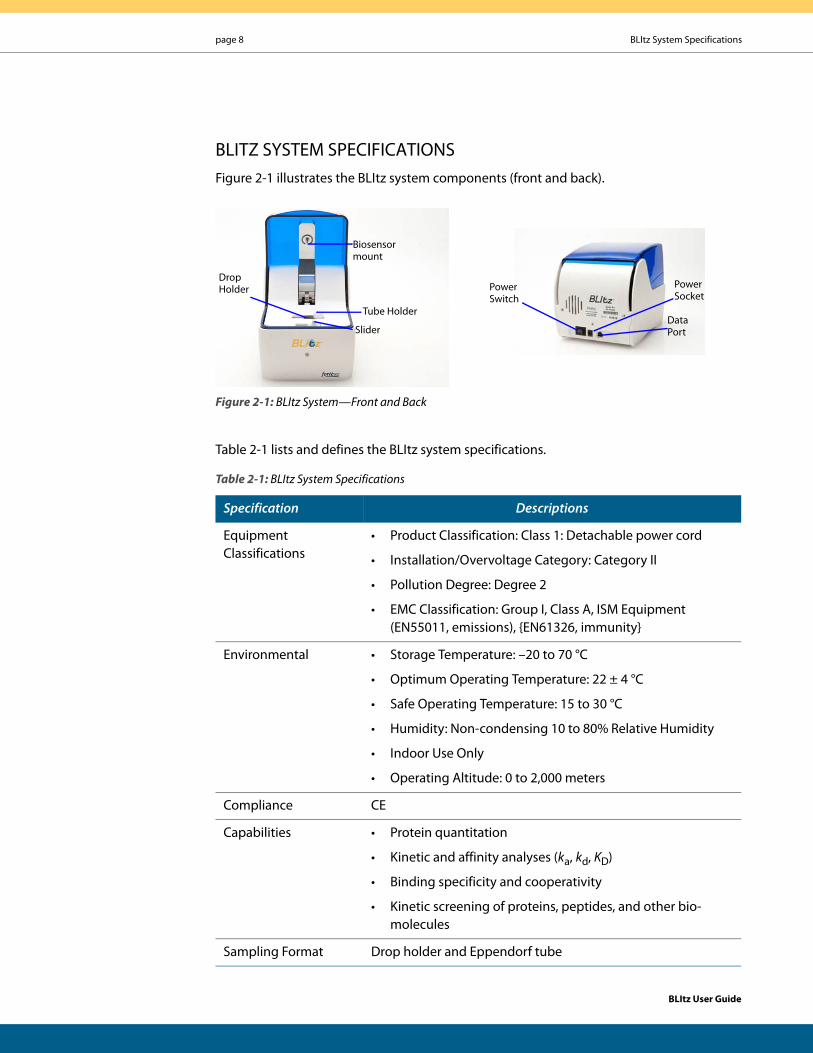
BLITZ SYSTEM SPECIFICATIONSFigure 2-1 illustrates the BLItz system components (front and back).
Figure 2-1: BLItz System—Front and Back
Table 2-1 lists and defines the BLItz system specifications.
Table 2-1: BLItz System Specifications
Specification Descriptions
Equipment Classifications
• Product Classification: Class 1: Detachable power cord
• Installation/Overvoltage Category: Category II
• Pollution Degree: Degree 2
• EMC Classification: Group I, Class A, ISM Equipment (EN55011, emissions), {EN61326, immunity}
Environmental • Storage Temperature: –20 to 70 °C
• Optimum Operating Temperature: 22 ± 4 °C
• Safe Operating Temperature: 15 to 30 °C
• Humidity: Non-condensing 10 to 80% Relative Humidity
• Indoor Use Only
• Operating Altitude: 0 to 2,000 meters
Compliance CE
Capabilities • Protein quantitation
• Kinetic and affinity analyses (ka, kd, KD)
• Binding specificity and cooperativity
• Kinetic screening of proteins, peptides, and other bio-molecules
Sampling Format Drop holder and Eppendorf tube
Biosensor mount
Slider
Tube Holder
Drop Holder
Data Port
Power Socket
Power Switch
BLItz User Guide
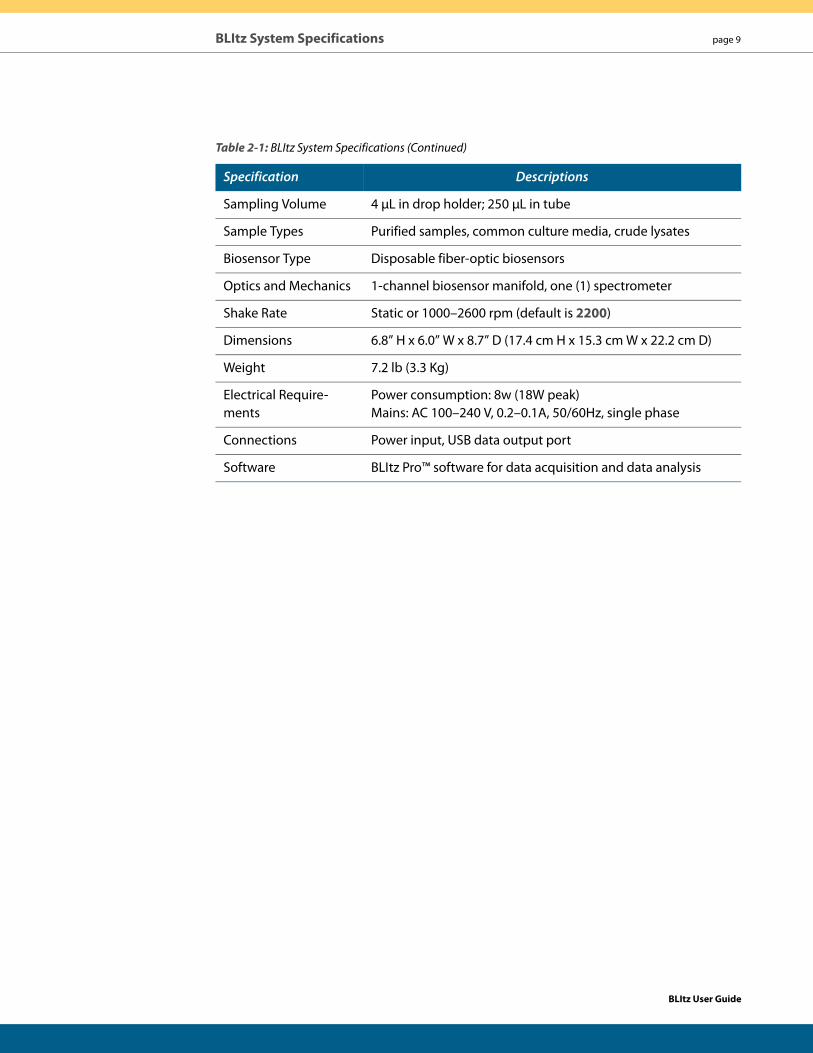
BLItz System Specifications page 9
Sampling Volume 4 μL in drop holder; 250 μL in tube
Sample Types Purified samples, common culture media, crude lysates
Biosensor Type Disposable fiber-optic biosensors
Optics and Mechanics 1-channel biosensor manifold, one (1) spectrometer
Shake Rate Static or 1000–2600 rpm (default is 2200)
Dimensions 6.8” H x 6.0” W x 8.7” D (17.4 cm H x 15.3 cm W x 22.2 cm D)
Weight 7.2 lb (3.3 Kg)
Electrical Require-ments
Power consumption: 8w (18W peak)Mains: AC 100–240 V, 0.2–0.1A, 50/60Hz, single phase
Connections Power input, USB data output port
Software BLItz Pro™ software for data acquisition and data analysis
Table 2-1: BLItz System Specifications (Continued)
Specification Descriptions
BLItz User Guide
page 10 BLItz System Specifications
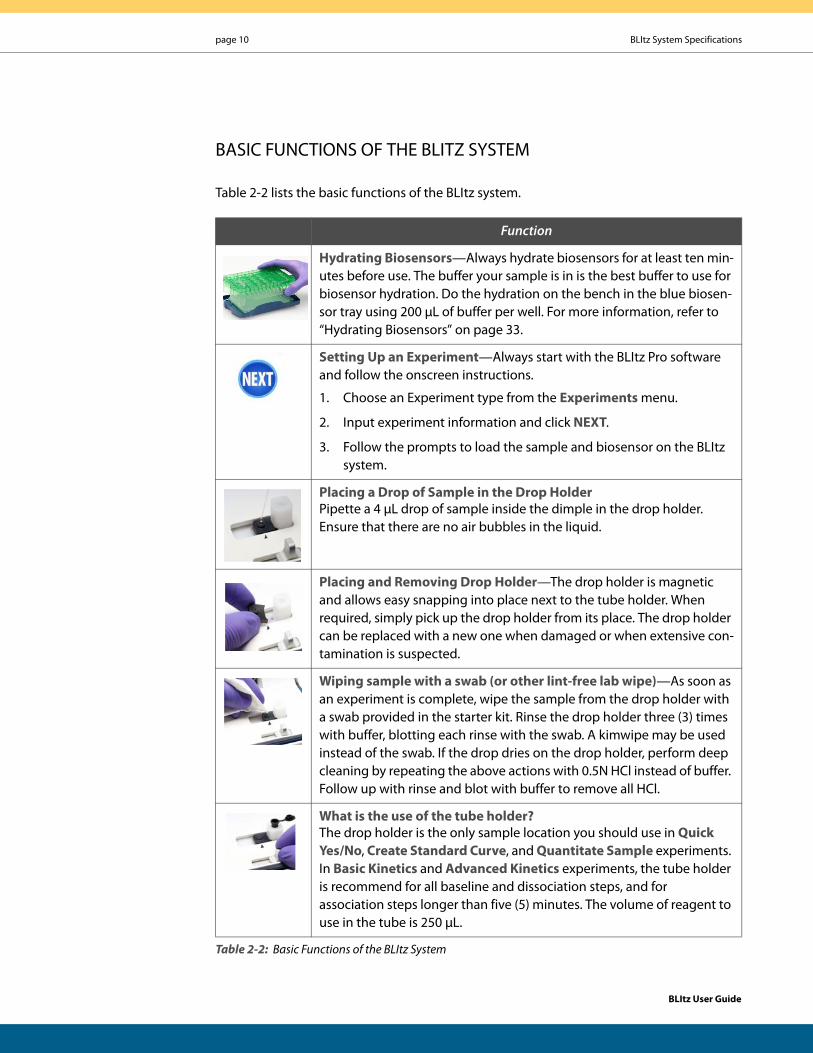
BASIC FUNCTIONS OF THE BLITZ SYSTEM
Table 2-2 lists the basic functions of the BLItz system.
Function
Hydrating Biosensors—Always hydrate biosensors for at least ten min-utes before use. The buffer your sample is in is the best buffer to use for biosensor hydration. Do the hydration on the bench in the blue biosen-sor tray using 200 μL of buffer per well. For more information, refer to “Hydrating Biosensors” on page 33.
Setting Up an Experiment—Always start with the BLItz Pro software and follow the onscreen instructions.
1. Choose an Experiment type from the Experiments menu.
2. Input experiment information and click NEXT.
3. Follow the prompts to load the sample and biosensor on the BLItz system.
Placing a Drop of Sample in the Drop HolderPipette a 4 μL drop of sample inside the dimple in the drop holder. Ensure that there are no air bubbles in the liquid.
Placing and Removing Drop Holder—The drop holder is magnetic and allows easy snapping into place next to the tube holder. When required, simply pick up the drop holder from its place. The drop holder can be replaced with a new one when damaged or when extensive con-tamination is suspected.
Wiping sample with a swab (or other lint-free lab wipe)—As soon as an experiment is complete, wipe the sample from the drop holder with a swab provided in the starter kit. Rinse the drop holder three (3) times with buffer, blotting each rinse with the swab. A kimwipe may be used instead of the swab. If the drop dries on the drop holder, perform deep cleaning by repeating the above actions with 0.5N HCl instead of buffer. Follow up with rinse and blot with buffer to remove all HCl.
What is the use of the tube holder?The drop holder is the only sample location you should use in Quick Yes/No, Create Standard Curve, and Quantitate Sample experiments. In Basic Kinetics and Advanced Kinetics experiments, the tube holder is recommend for all baseline and dissociation steps, and forassociation steps longer than five (5) minutes. The volume of reagent to use in the tube is 250 μL.
Table 2-2: Basic Functions of the BLItz System
BLItz User Guide
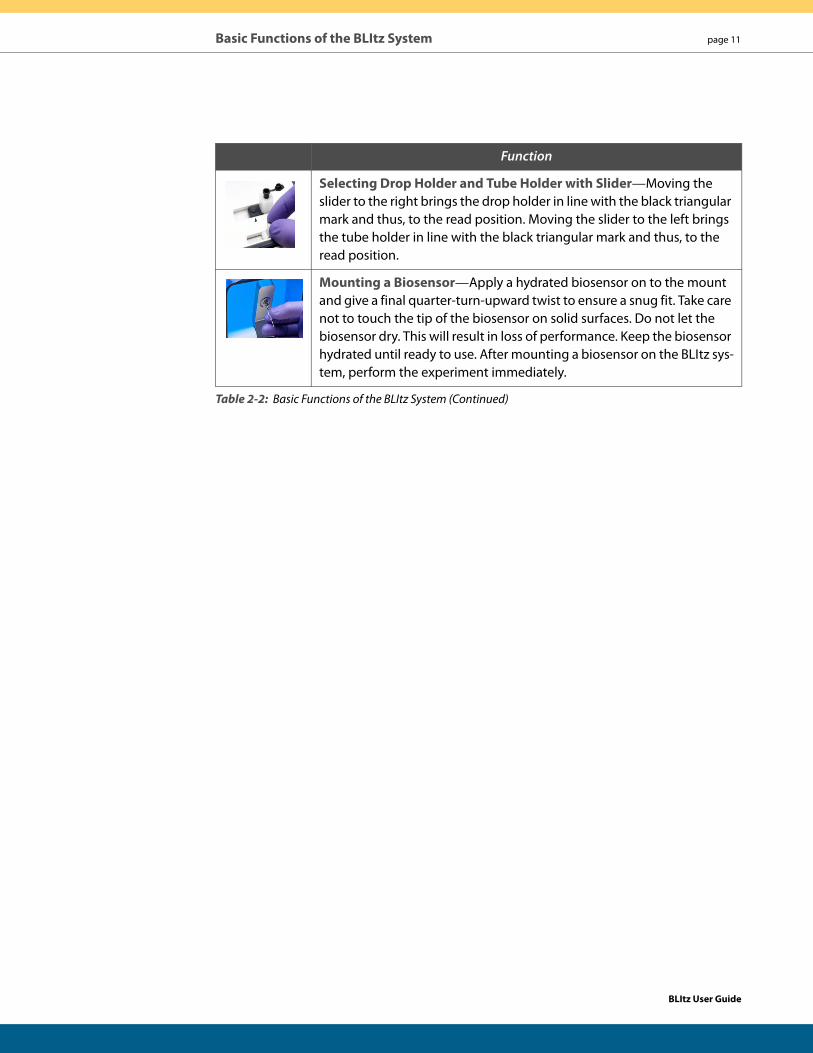
Basic Functions of the BLItz System page 11
Selecting Drop Holder and Tube Holder with Slider—Moving the slider to the right brings the drop holder in line with the black triangular mark and thus, to the read position. Moving the slider to the left brings the tube holder in line with the black triangular mark and thus, to the read position.
Mounting a Biosensor—Apply a hydrated biosensor on to the mount and give a final quarter-turn-upward twist to ensure a snug fit. Take care not to touch the tip of the biosensor on solid surfaces. Do not let the biosensor dry. This will result in loss of performance. Keep the biosensor hydrated until ready to use. After mounting a biosensor on the BLItz sys-tem, perform the experiment immediately.
Function
Table 2-2: Basic Functions of the BLItz System (Continued)
BLItz User Guide
page 12 BLItz System Specifications
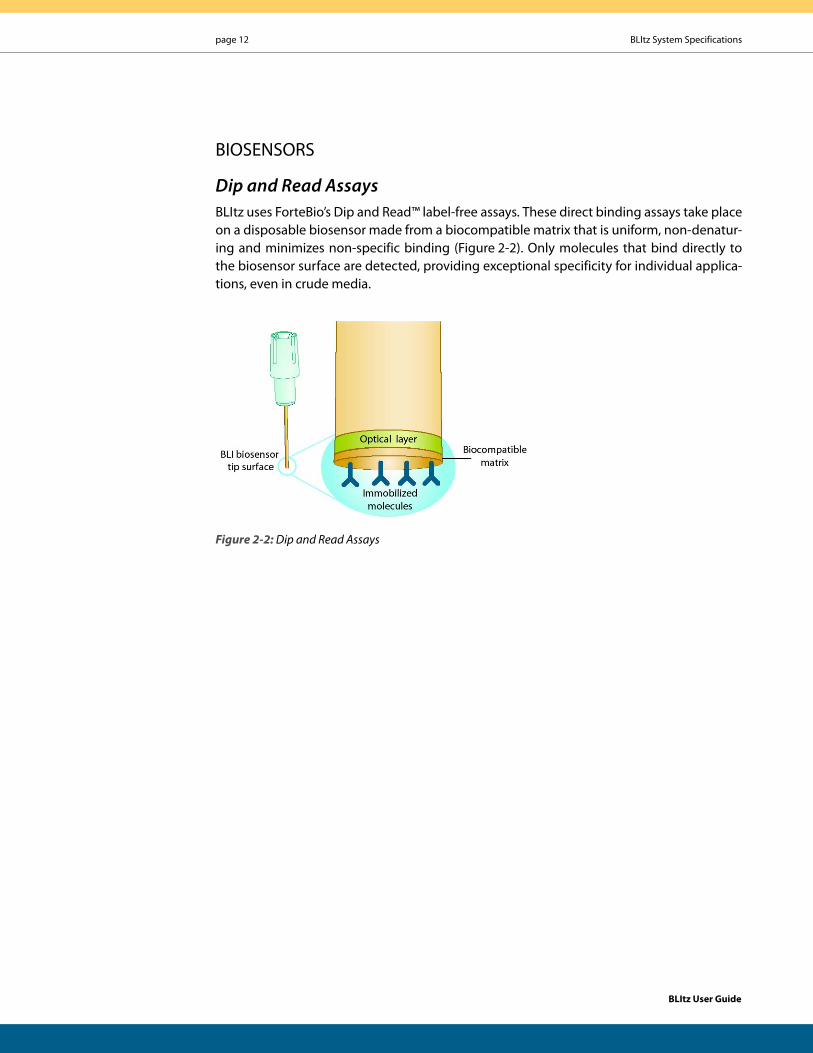
BIOSENSORS
Dip and Read AssaysBLItz uses ForteBio’s Dip and Read™ label-free assays. These direct binding assays take place on a disposable biosensor made from a biocompatible matrix that is uniform, non-denatur-ing and minimizes non-specific binding (Figure 2-2). Only molecules that bind directly to the biosensor surface are detected, providing exceptional specificity for individual applica-tions, even in crude media.
Figure 2-2: Dip and Read Assays
BLItz User Guide
Biosensors page 13
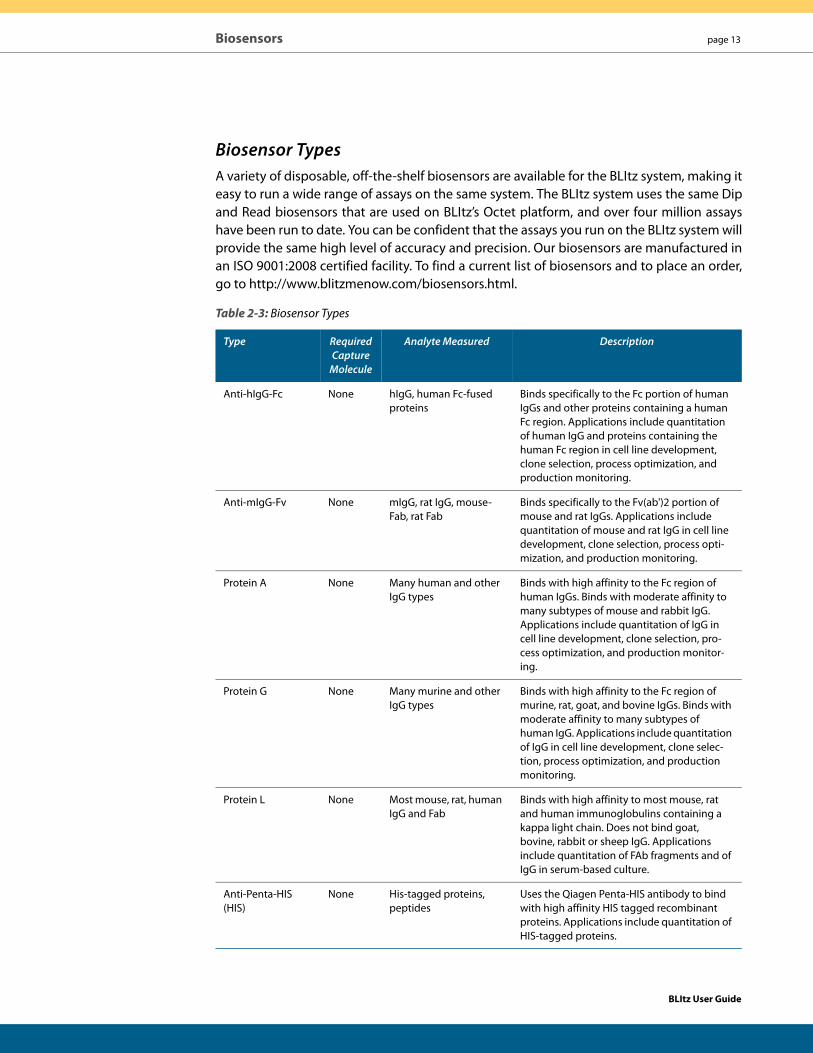
Biosensor TypesA variety of disposable, off-the-shelf biosensors are available for the BLItz system, making it easy to run a wide range of assays on the same system. The BLItz system uses the same Dip and Read biosensors that are used on BLItz’s Octet platform, and over four million assays have been run to date. You can be confident that the assays you run on the BLItz system will provide the same high level of accuracy and precision. Our biosensors are manufactured in an ISO 9001:2008 certified facility. To find a current list of biosensors and to place an order, go to http://www.blitzmenow.com/biosensors.html.
Table 2-3: Biosensor Types
Type Required Capture
Molecule
Analyte Measured Description
Anti-hIgG-Fc None hIgG, human Fc-fused proteins
Binds specifically to the Fc portion of human IgGs and other proteins containing a human Fc region. Applications include quantitation of human IgG and proteins containing the human Fc region in cell line development, clone selection, process optimization, and production monitoring.
Anti-mIgG-Fv None mIgG, rat IgG, mouse-Fab, rat Fab
Binds specifically to the Fv(ab')2 portion of mouse and rat IgGs. Applications include quantitation of mouse and rat IgG in cell line development, clone selection, process opti-mization, and production monitoring.
Protein A None Many human and other IgG types
Binds with high affinity to the Fc region of human IgGs. Binds with moderate affinity to many subtypes of mouse and rabbit IgG. Applications include quantitation of IgG in cell line development, clone selection, pro-cess optimization, and production monitor-ing.
Protein G None Many murine and other IgG types
Binds with high affinity to the Fc region of murine, rat, goat, and bovine IgGs. Binds with moderate affinity to many subtypes of human IgG. Applications include quantitation of IgG in cell line development, clone selec-tion, process optimization, and production monitoring.
Protein L None Most mouse, rat, human IgG and Fab
Binds with high affinity to most mouse, rat and human immunoglobulins containing a kappa light chain. Does not bind goat, bovine, rabbit or sheep IgG. Applications include quantitation of FAb fragments and of IgG in serum-based culture.
Anti-Penta-HIS (HIS)
None His-tagged proteins, peptides
Uses the Qiagen Penta-HIS antibody to bind with high affinity HIS tagged recombinant proteins. Applications include quantitation of HIS-tagged proteins.
BLItz User Guide
page 14 BLItz System Specifications
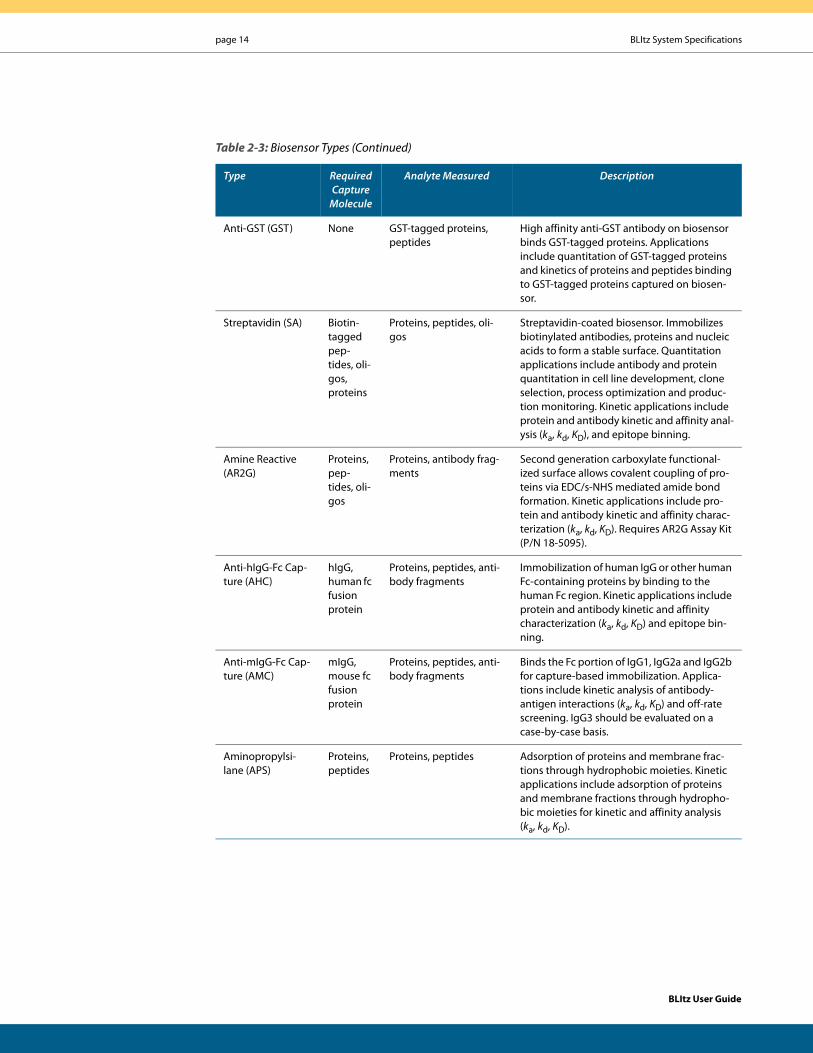
Anti-GST (GST) None GST-tagged proteins, peptides
High affinity anti-GST antibody on biosensor binds GST-tagged proteins. Applications include quantitation of GST-tagged proteins and kinetics of proteins and peptides binding to GST-tagged proteins captured on biosen-sor.
Streptavidin (SA) Biotin-tagged pep-tides, oli-gos, proteins
Proteins, peptides, oli-gos
Streptavidin-coated biosensor. Immobilizes biotinylated antibodies, proteins and nucleic acids to form a stable surface. Quantitation applications include antibody and protein quantitation in cell line development, clone selection, process optimization and produc-tion monitoring. Kinetic applications include protein and antibody kinetic and affinity anal-ysis (ka, kd, KD), and epitope binning.
Amine Reactive (AR2G)
Proteins, pep-tides, oli-gos
Proteins, antibody frag-ments
Second generation carboxylate functional-ized surface allows covalent coupling of pro-teins via EDC/s-NHS mediated amide bond formation. Kinetic applications include pro-tein and antibody kinetic and affinity charac-terization (ka, kd, KD). Requires AR2G Assay Kit (P/N 18-5095).
Anti-hIgG-Fc Cap-ture (AHC)
hIgG, human fc fusion protein
Proteins, peptides, anti-body fragments
Immobilization of human IgG or other human Fc-containing proteins by binding to the human Fc region. Kinetic applications include protein and antibody kinetic and affinity characterization (ka, kd, KD) and epitope bin-ning.
Anti-mIgG-Fc Cap-ture (AMC)
mIgG, mouse fc fusion protein
Proteins, peptides, anti-body fragments
Binds the Fc portion of IgG1, IgG2a and IgG2b for capture-based immobilization. Applica-tions include kinetic analysis of antibody-antigen interactions (ka, kd, KD) and off-rate screening. IgG3 should be evaluated on a case-by-case basis.
Aminopropylsi-lane (APS)
Proteins, peptides
Proteins, peptides Adsorption of proteins and membrane frac-tions through hydrophobic moieties. Kinetic applications include adsorption of proteins and membrane fractions through hydropho-bic moieties for kinetic and affinity analysis (ka, kd, KD).
Table 2-3: Biosensor Types (Continued)
Type Required Capture
Molecule
Analyte Measured Description
BLItz User Guide
Biosensors page 15
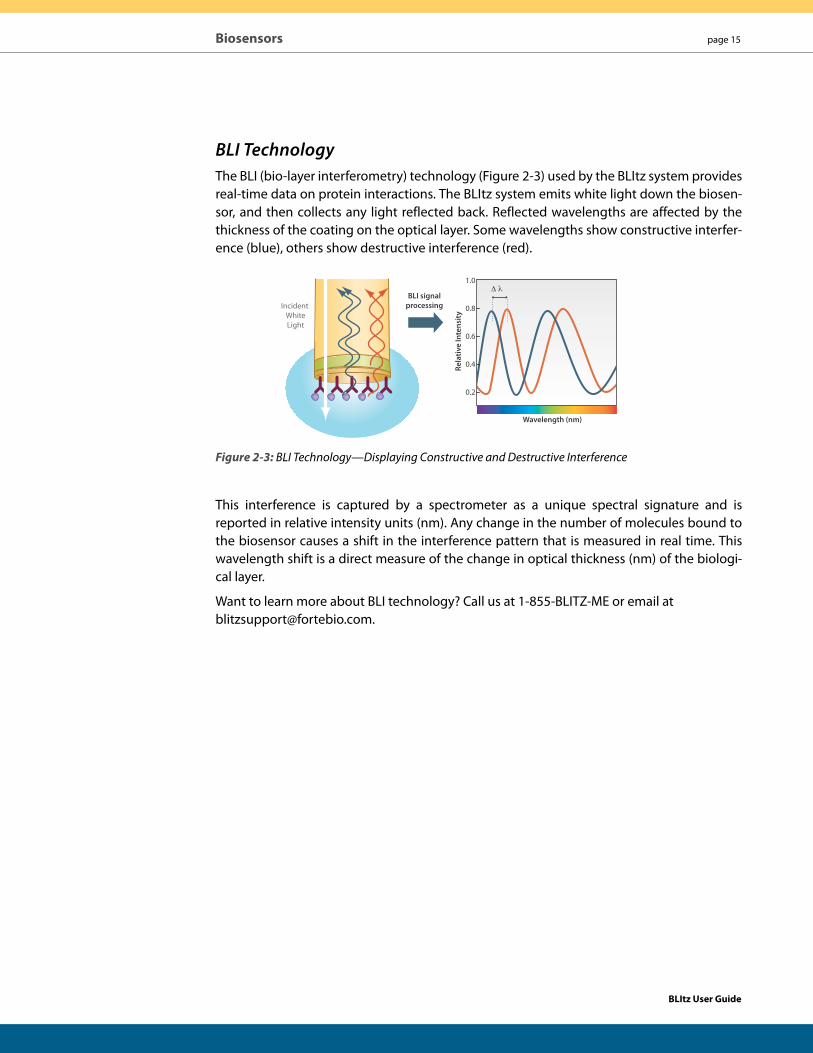
BLI TechnologyThe BLI (bio-layer interferometry) technology (Figure 2-3) used by the BLItz system provides real-time data on protein interactions. The BLItz system emits white light down the biosen-sor, and then collects any light reflected back. Reflected wavelengths are affected by the thickness of the coating on the optical layer. Some wavelengths show constructive interfer-ence (blue), others show destructive interference (red).
Figure 2-3: BLI Technology—Displaying Constructive and Destructive Interference
This interference is captured by a spectrometer as a unique spectral signature and is reported in relative intensity units (nm). Any change in the number of molecules bound to the biosensor causes a shift in the interference pattern that is measured in real time. This wavelength shift is a direct measure of the change in optical thickness (nm) of the biologi-cal layer.
Want to learn more about BLI technology? Call us at 1-855-BLITZ-ME or email at [email protected].
Incident WhiteLight
BLI signalprocessing
���
Wavelength (nm)
0.2
0.4
0.6
0.8
1.0
Rela
tive
Inte
nsit
y
BLItz User Guide

page 16 BLItz System Specifications
BLItz User Guide

page 17
CHAPTER 3: BLItz InstallationInstalling the BLItz System . . . . . . . . . . . . . . . . . . . . . . . . . . . . . . . . . . . . . . . . . . . . . . . . . . . . . . . . . . . . 18
Using the BLItz Pro Software User Interface . . . . . . . . . . . . . . . . . . . . . . . . . . . . . . . . . . . . . . . . . . . . 20
Toolbars . . . . . . . . . . . . . . . . . . . . . . . . . . . . . . . . . . . . . . . . . . . . . . . . . . . . . . . . . . . . . . . . . . . . . . . . . . 21
Menu Commands . . . . . . . . . . . . . . . . . . . . . . . . . . . . . . . . . . . . . . . . . . . . . . . . . . . . . . . . . . . . . . . . 22
Icons . . . . . . . . . . . . . . . . . . . . . . . . . . . . . . . . . . . . . . . . . . . . . . . . . . . . . . . . . . . . . . . . . . . . . . . . . . . . . 28
Uninstalling the BLItz Pro Software . . . . . . . . . . . . . . . . . . . . . . . . . . . . . . . . . . . . . . . . . . . . . . . . . . . . 30
BLItz User Guide
page 18 Chapter 3: BLItz Installation
INSTALLING THE BLITZ SYSTEM
To install and configure the BLItz system and BLItz Pro™ software in your lab:
1. Remove the BLItz system, power cord, USB cable, and BLItz Pro software CD from the box. Place the BLItz system on a dry, level surface with minimal vibration, and away from direct sunlight.
2. Insert the BLItz Pro Software CD in a laptop or desktop computer and run the BLItzIn-stallCD.exe file. For minimum computer specifications, see Table 1-1 on page 3.
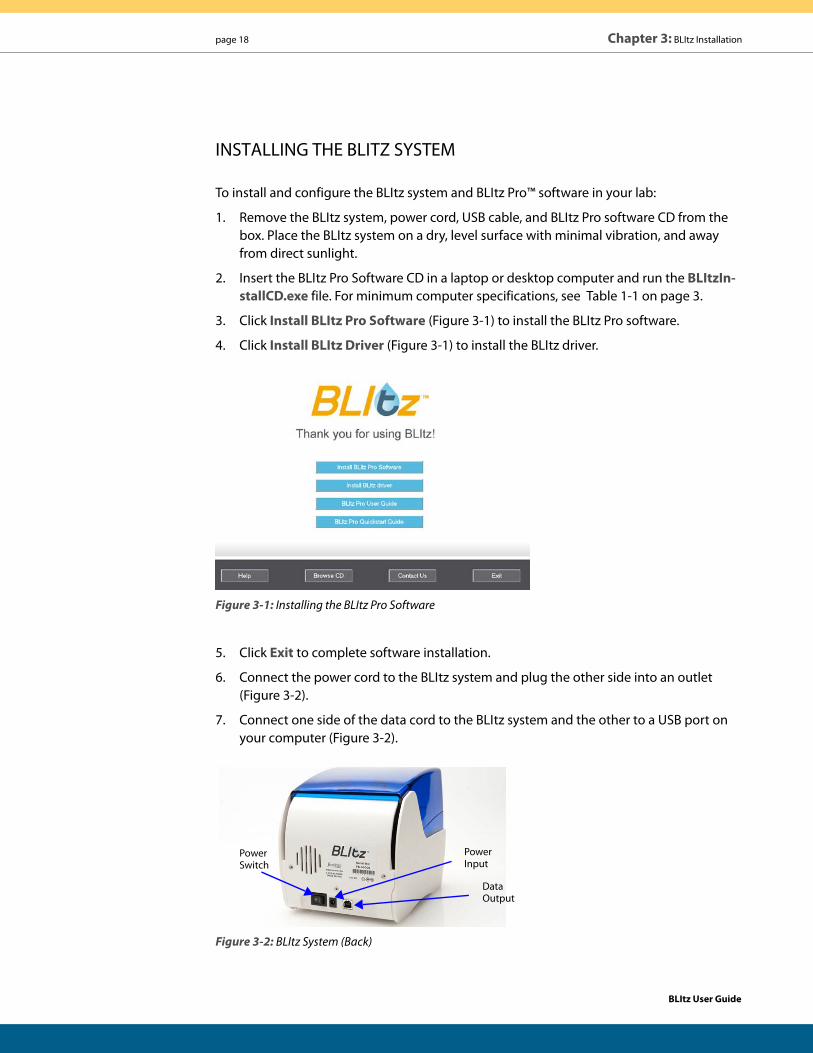
3. Click Install BLItz Pro Software (Figure 3-1) to install the BLItz Pro software.
4. Click Install BLItz Driver (Figure 3-1) to install the BLItz driver.
Figure 3-1: Installing the BLItz Pro Software
5. Click Exit to complete software installation.
6. Connect the power cord to the BLItz system and plug the other side into an outlet (Figure 3-2).
7. Connect one side of the data cord to the BLItz system and the other to a USB port on your computer (Figure 3-2).
Figure 3-2: BLItz System (Back)
Data Output
Power Input
Power Switch
BLItz User Guide
Installing the BLItz System page 19
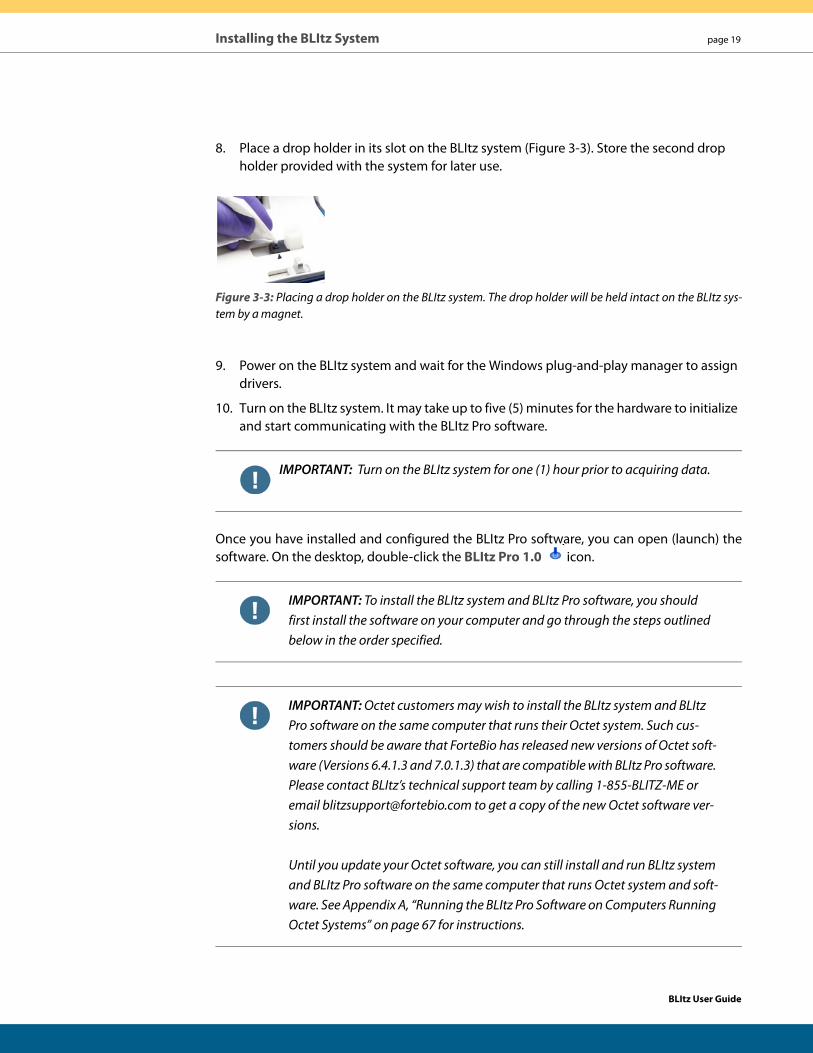
8. Place a drop holder in its slot on the BLItz system (Figure 3-3). Store the second drop holder provided with the system for later use.
Figure 3-3: Placing a drop holder on the BLItz system. The drop holder will be held intact on the BLItz sys-tem by a magnet.
9. Power on the BLItz system and wait for the Windows plug-and-play manager to assign drivers.
10. Turn on the BLItz system. It may take up to five (5) minutes for the hardware to initialize and start communicating with the BLItz Pro software.
IMPORTANT: Turn on the BLItz system for one (1) hour prior to acquiring data.
Once you have installed and configured the BLItz Pro software, you can open (launch) the software. On the desktop, double-click the BLItz Pro 1.0 icon.
IMPORTANT: To install the BLItz system and BLItz Pro software, you should first install the software on your computer and go through the steps outlined below in the order specified.
IMPORTANT: Octet customers may wish to install the BLItz system and BLItz Pro software on the same computer that runs their Octet system. Such cus-tomers should be aware that ForteBio has released new versions of Octet soft-ware (Versions 6.4.1.3 and 7.0.1.3) that are compatible with BLItz Pro software. Please contact BLItz’s technical support team by calling 1-855-BLITZ-ME or email [email protected] to get a copy of the new Octet software ver-sions. Until you update your Octet software, you can still install and run BLItz system and BLItz Pro software on the same computer that runs Octet system and soft-ware. See Appendix A, “Running the BLItz Pro Software on Computers Running Octet Systems” on page 67 for instructions.
BLItz User Guide
page 20 Chapter 3: BLItz Installation
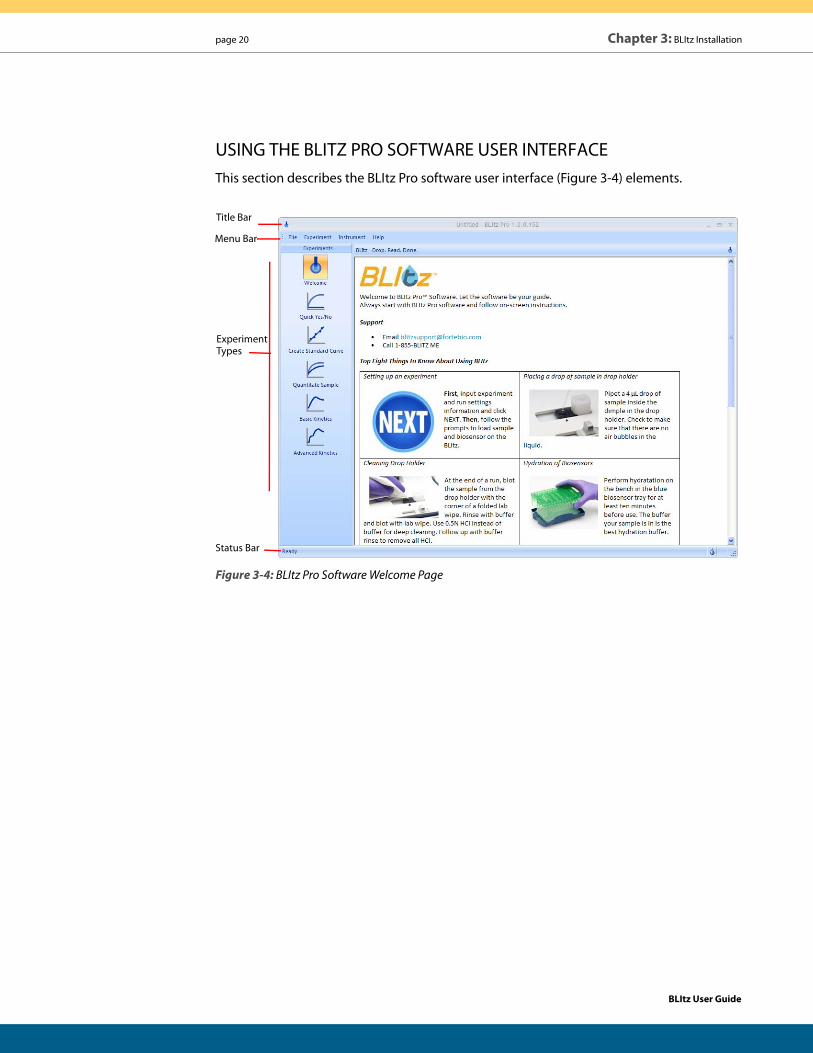
USING THE BLITZ PRO SOFTWARE USER INTERFACEThis section describes the BLItz Pro software user interface (Figure 3-4) elements.
Figure 3-4: BLItz Pro Software Welcome Page
Menu Bar
Status Bar
Experiment Types
Title Bar
BLItz User Guide
Using the BLItz Pro Software User Interface page 21
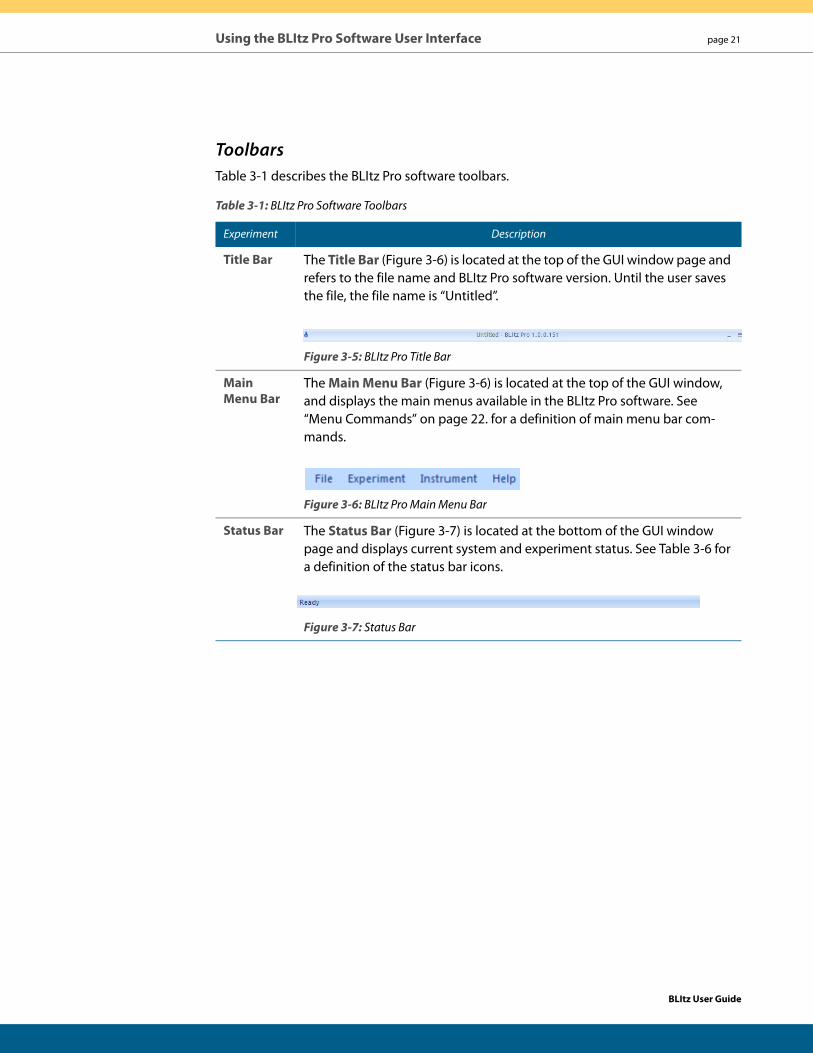
Toolbars Table 3-1 describes the BLItz Pro software toolbars.
Table 3-1: BLItz Pro Software Toolbars
Experiment Description
Title Bar The Title Bar (Figure 3-6) is located at the top of the GUI window page and refers to the file name and BLItz Pro software version. Until the user saves the file, the file name is “Untitled”.
Figure 3-5: BLItz Pro Title Bar
Main Menu Bar
The Main Menu Bar (Figure 3-6) is located at the top of the GUI window, and displays the main menus available in the BLItz Pro software. See “Menu Commands” on page 22. for a definition of main menu bar com-mands.
Figure 3-6: BLItz Pro Main Menu Bar
Status Bar The Status Bar (Figure 3-7) is located at the bottom of the GUI window page and displays current system and experiment status. See Table 3-6 for a definition of the status bar icons.
Figure 3-7: Status Bar
BLItz User Guide
page 22 Chapter 3: BLItz Installation
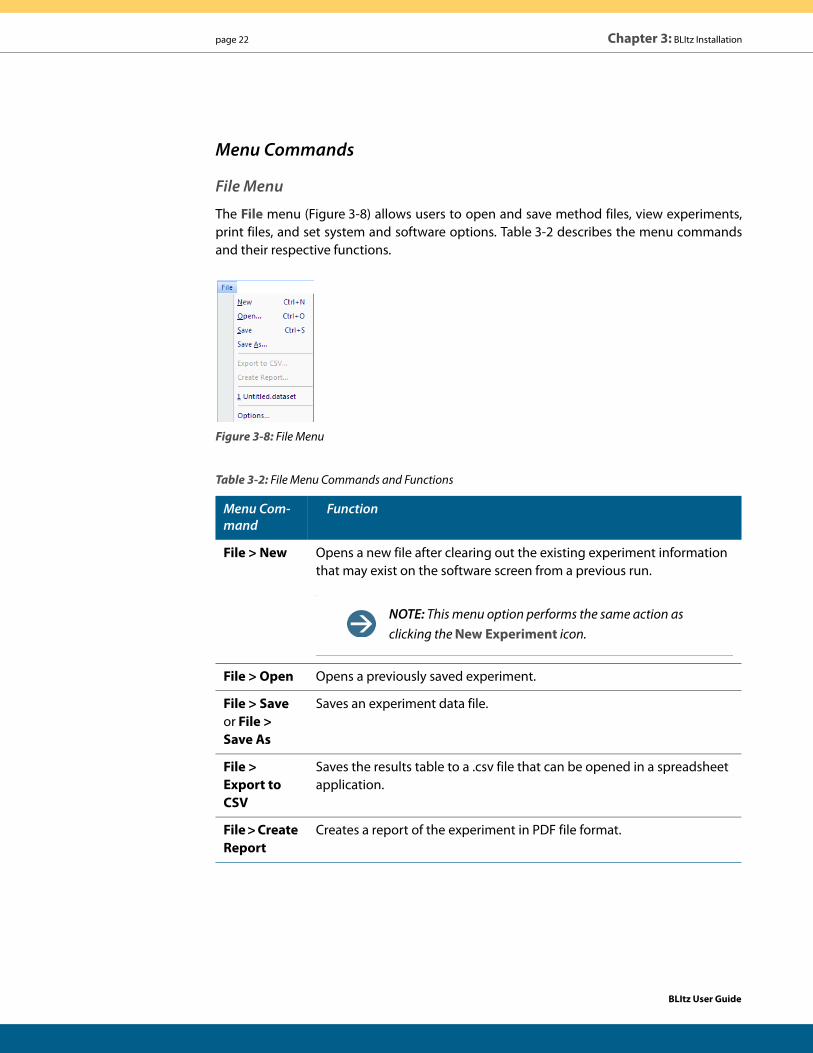
Menu Commands
File Menu
The File menu (Figure 3-8) allows users to open and save method files, view experiments, print files, and set system and software options. Table 3-2 describes the menu commands and their respective functions.
Figure 3-8: File Menu
Table 3-2: File Menu Commands and Functions
Menu Com-mand
Function
File > New Opens a new file after clearing out the existing experiment information that may exist on the software screen from a previous run.
NOTE: This menu option performs the same action as clicking the New Experiment icon.
File > Open Opens a previously saved experiment.
File > Save or File > Save As
Saves an experiment data file.
File > Export to CSV
Saves the results table to a .csv file that can be opened in a spreadsheet application.
File > Create Report
Creates a report of the experiment in PDF file format.
BLItz User Guide
Using the BLItz Pro Software User Interface page 23
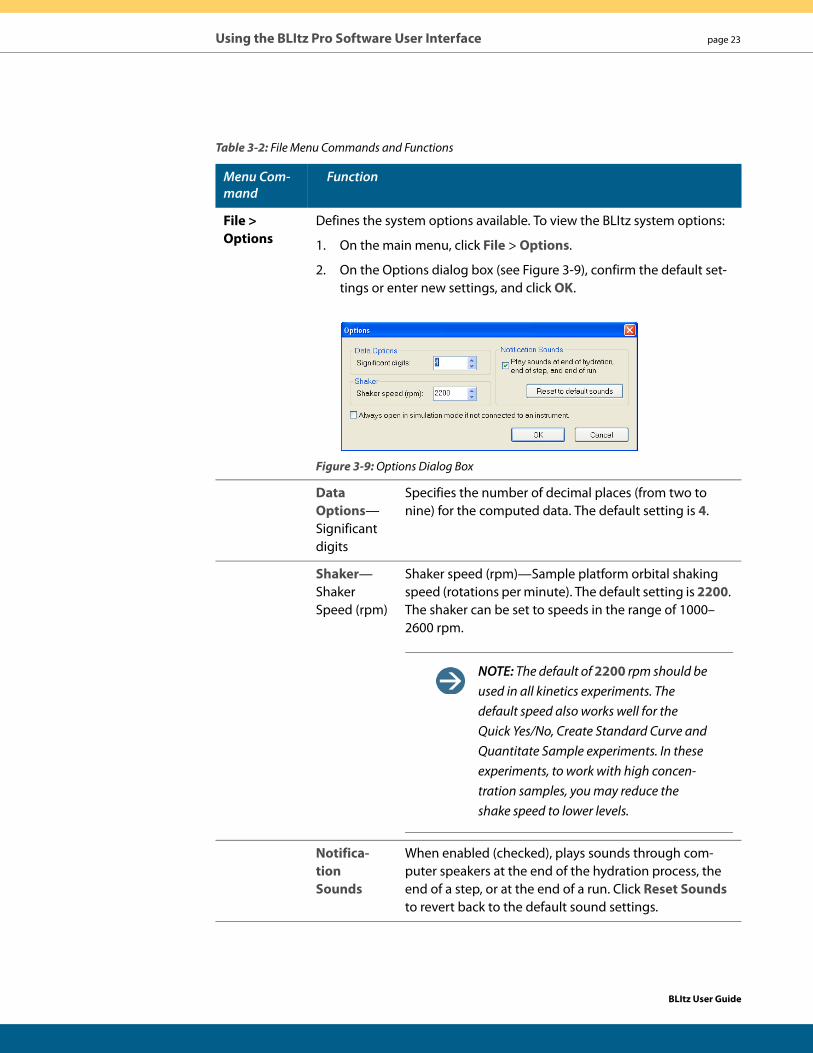
File > Options
Defines the system options available. To view the BLItz system options:
1. On the main menu, click File > Options.
2. On the Options dialog box (see Figure 3-9), confirm the default set-tings or enter new settings, and click OK.
Figure 3-9: Options Dialog Box
Data Options— Significant digits
Specifies the number of decimal places (from two to nine) for the computed data. The default setting is 4.
Shaker—Shaker Speed (rpm)
Shaker speed (rpm)—Sample platform orbital shaking speed (rotations per minute). The default setting is 2200. The shaker can be set to speeds in the range of 1000–2600 rpm.
NOTE: The default of 2200 rpm should be used in all kinetics experiments. The default speed also works well for the Quick Yes/No, Create Standard Curve and Quantitate Sample experiments. In these experiments, to work with high concen-tration samples, you may reduce the shake speed to lower levels.
Notifica-tion Sounds
When enabled (checked), plays sounds through com-puter speakers at the end of the hydration process, the end of a step, or at the end of a run. Click Reset Sounds to revert back to the default sound settings.
Table 3-2: File Menu Commands and Functions
Menu Com-mand
Function
BLItz User Guide
page 24 Chapter 3: BLItz Installation
Click the Always open in simulation mode if not con-nected to an instrument check box if you anticipate to work offline.
File > Exit Closes the software after prompting you to save any changes.
Table 3-2: File Menu Commands and Functions
Menu Com-mand
Function
BLItz User Guide
Using the BLItz Pro Software User Interface page 25
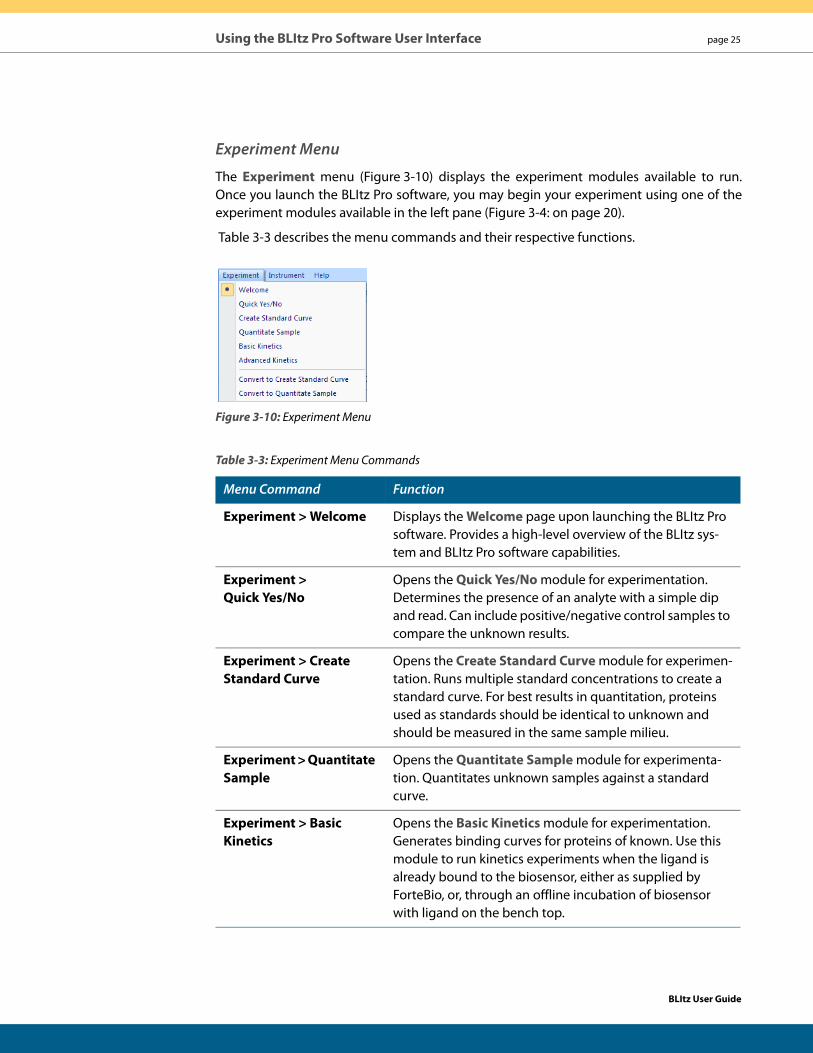
Experiment Menu
The Experiment menu (Figure 3-10) displays the experiment modules available to run. Once you launch the BLItz Pro software, you may begin your experiment using one of the experiment modules available in the left pane (Figure 3-4: on page 20).
Table 3-3 describes the menu commands and their respective functions.
Figure 3-10: Experiment Menu
Table 3-3: Experiment Menu Commands
Menu Command Function
Experiment > Welcome Displays the Welcome page upon launching the BLItz Pro software. Provides a high-level overview of the BLItz sys-tem and BLItz Pro software capabilities.
Experiment > Quick Yes/No
Opens the Quick Yes/No module for experimentation. Determines the presence of an analyte with a simple dip and read. Can include positive/negative control samples to compare the unknown results.
Experiment > Create Standard Curve
Opens the Create Standard Curve module for experimen-tation. Runs multiple standard concentrations to create a standard curve. For best results in quantitation, proteins used as standards should be identical to unknown and should be measured in the same sample milieu.
Experiment > Quantitate Sample
Opens the Quantitate Sample module for experimenta-tion. Quantitates unknown samples against a standard curve.
Experiment > Basic Kinetics
Opens the Basic Kinetics module for experimentation. Generates binding curves for proteins of known. Use this module to run kinetics experiments when the ligand is already bound to the biosensor, either as supplied by ForteBio, or, through an offline incubation of biosensor with ligand on the bench top.
BLItz User Guide
page 26 Chapter 3: BLItz Installation
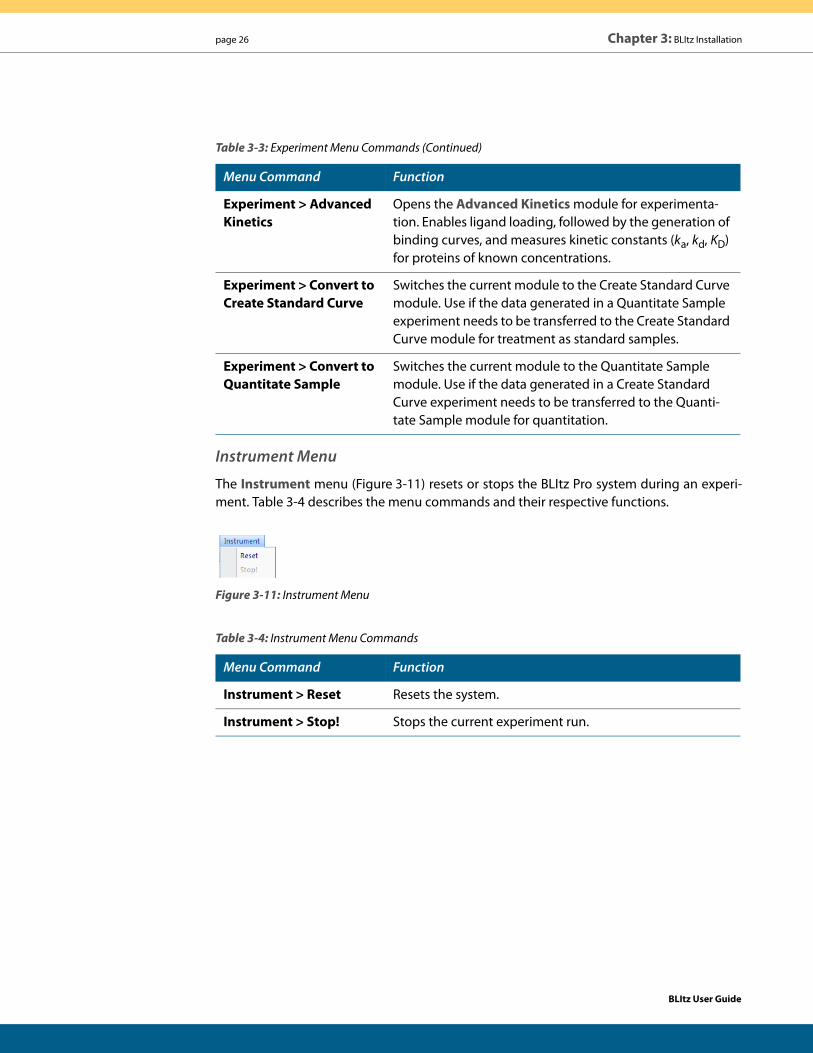
Instrument Menu
The Instrument menu (Figure 3-11) resets or stops the BLItz Pro system during an experi-ment. Table 3-4 describes the menu commands and their respective functions.
Figure 3-11: Instrument Menu
Experiment > Advanced Kinetics
Opens the Advanced Kinetics module for experimenta-tion. Enables ligand loading, followed by the generation of binding curves, and measures kinetic constants (ka, kd, KD) for proteins of known concentrations.
Experiment > Convert to Create Standard Curve
Switches the current module to the Create Standard Curve module. Use if the data generated in a Quantitate Sample experiment needs to be transferred to the Create Standard Curve module for treatment as standard samples.
Experiment > Convert to Quantitate Sample
Switches the current module to the Quantitate Sample module. Use if the data generated in a Create Standard Curve experiment needs to be transferred to the Quanti-tate Sample module for quantitation.
Table 3-4: Instrument Menu Commands
Menu Command Function
Instrument > Reset Resets the system.
Instrument > Stop! Stops the current experiment run.
Table 3-3: Experiment Menu Commands (Continued)
Menu Command Function
BLItz User Guide
Using the BLItz Pro Software User Interface page 27
Help Menu
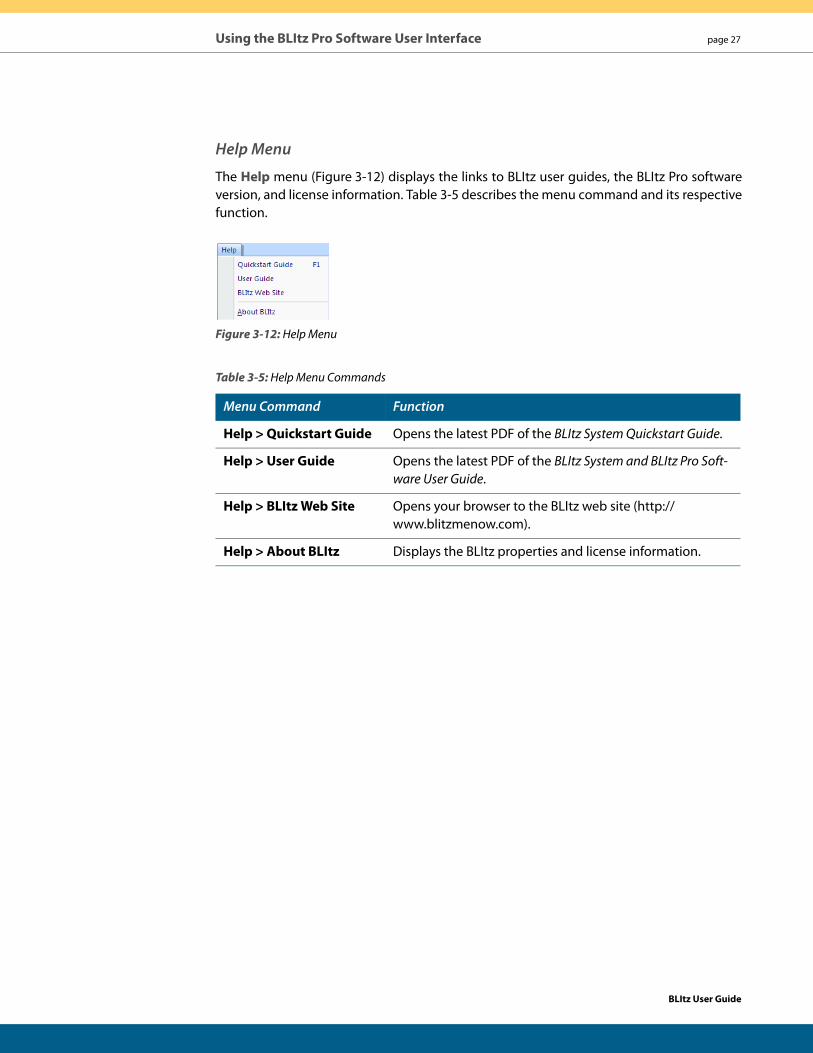
The Help menu (Figure 3-12) displays the links to BLItz user guides, the BLItz Pro software version, and license information. Table 3-5 describes the menu command and its respective function.
Figure 3-12: Help Menu
Table 3-5: Help Menu Commands
Menu Command Function
Help > Quickstart Guide Opens the latest PDF of the BLItz System Quickstart Guide.
Help > User Guide Opens the latest PDF of the BLItz System and BLItz Pro Soft-ware User Guide.
Help > BLItz Web Site Opens your browser to the BLItz web site (http://www.blitzmenow.com).
Help > About BLItz Displays the BLItz properties and license information.
BLItz User Guide
page 28 Chapter 3: BLItz Installation
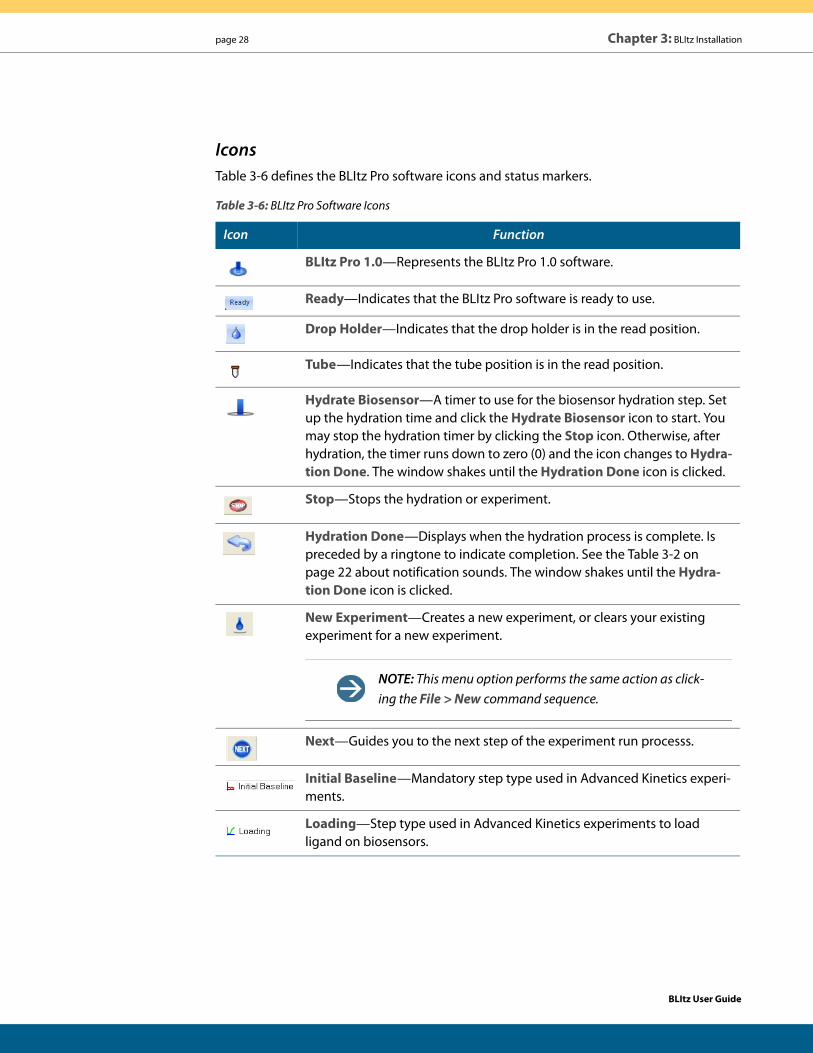
IconsTable 3-6 defines the BLItz Pro software icons and status markers.
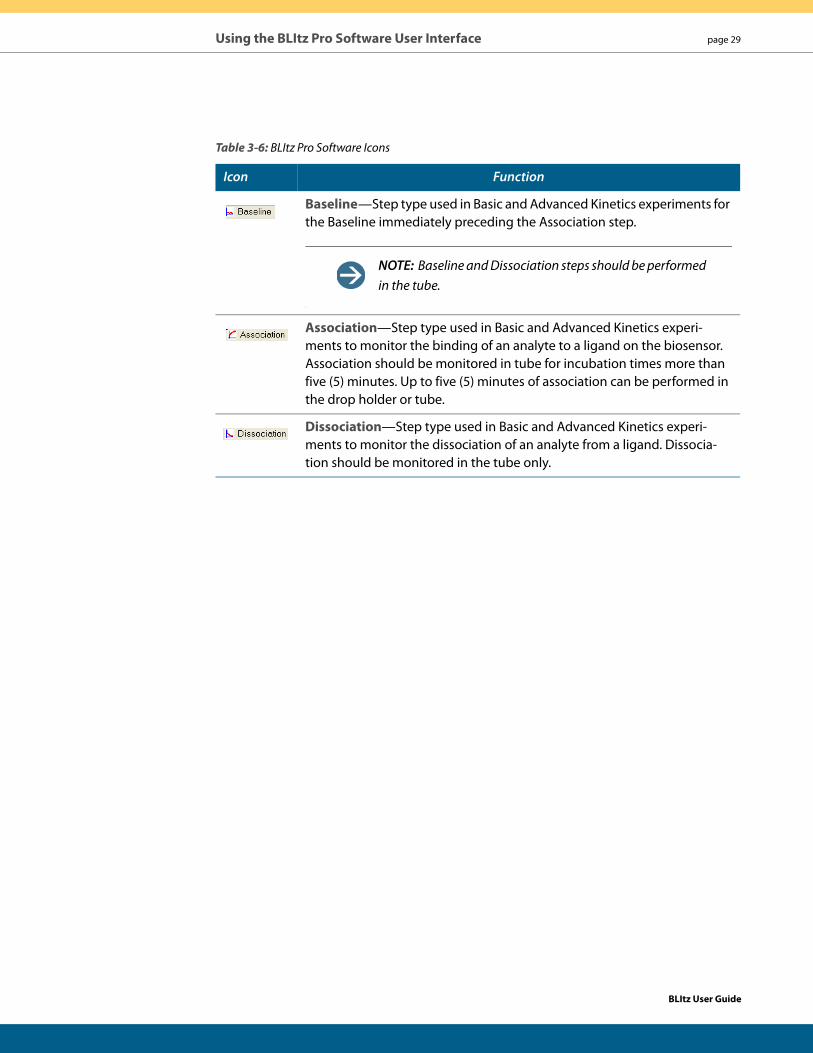
Table 3-6: BLItz Pro Software Icons
Icon Function
BLItz Pro 1.0—Represents the BLItz Pro 1.0 software.
Ready—Indicates that the BLItz Pro software is ready to use.
Drop Holder—Indicates that the drop holder is in the read position.
Tube—Indicates that the tube position is in the read position.
Hydrate Biosensor—A timer to use for the biosensor hydration step. Set up the hydration time and click the Hydrate Biosensor icon to start. You may stop the hydration timer by clicking the Stop icon. Otherwise, after hydration, the timer runs down to zero (0) and the icon changes to Hydra-tion Done. The window shakes until the Hydration Done icon is clicked.
Stop—Stops the hydration or experiment.
Hydration Done—Displays when the hydration process is complete. Is preceded by a ringtone to indicate completion. See the Table 3-2 on page 22 about notification sounds. The window shakes until the Hydra-tion Done icon is clicked.
New Experiment—Creates a new experiment, or clears your existing experiment for a new experiment.
NOTE: This menu option performs the same action as click-ing the File > New command sequence.
Next—Guides you to the next step of the experiment run processs.
Initial Baseline—Mandatory step type used in Advanced Kinetics experi-ments.
Loading—Step type used in Advanced Kinetics experiments to load ligand on biosensors.
BLItz User Guide
Using the BLItz Pro Software User Interface page 29
Baseline—Step type used in Basic and Advanced Kinetics experiments for the Baseline immediately preceding the Association step.
NOTE: Baseline and Dissociation steps should be performed in the tube.
Association—Step type used in Basic and Advanced Kinetics experi-ments to monitor the binding of an analyte to a ligand on the biosensor. Association should be monitored in tube for incubation times more than five (5) minutes. Up to five (5) minutes of association can be performed in the drop holder or tube.
Dissociation—Step type used in Basic and Advanced Kinetics experi-ments to monitor the dissociation of an analyte from a ligand. Dissocia-tion should be monitored in the tube only.
Table 3-6: BLItz Pro Software Icons
Icon Function
BLItz User Guide
page 30 Chapter 3: BLItz Installation
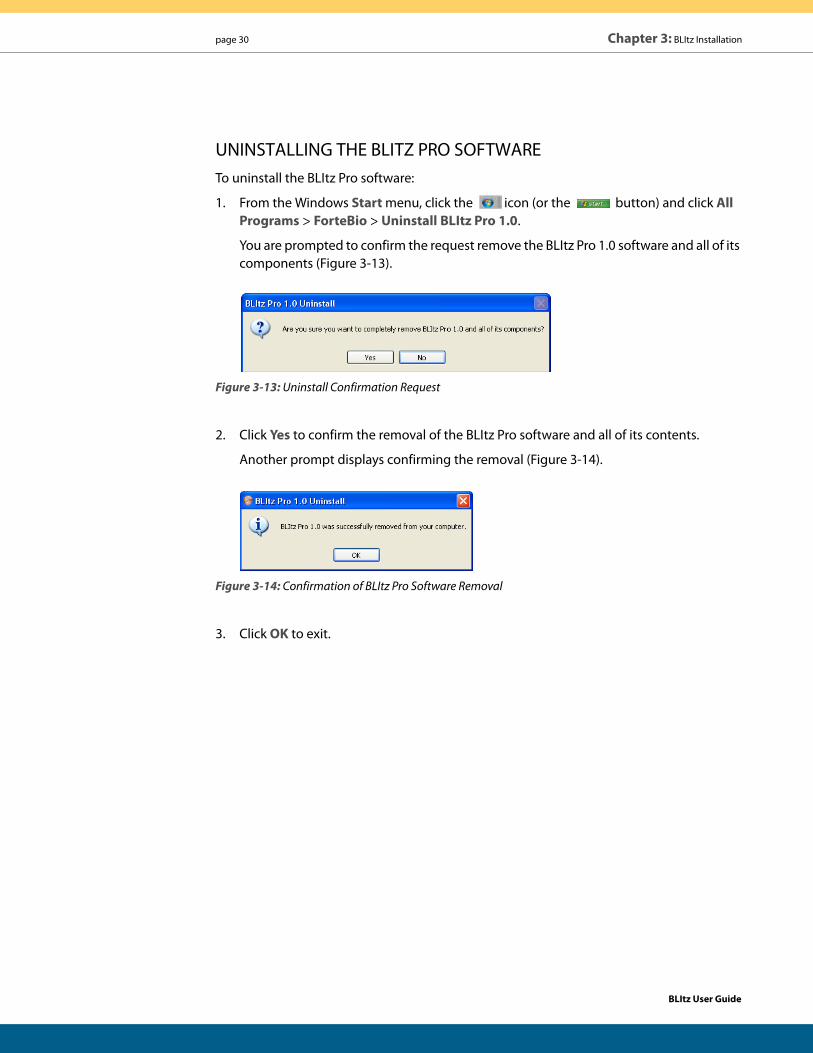
UNINSTALLING THE BLITZ PRO SOFTWARETo uninstall the BLItz Pro software:
1. From the Windows Start menu, click the icon (or the button) and click All Programs > ForteBio > Uninstall BLItz Pro 1.0.
You are prompted to confirm the request remove the BLItz Pro 1.0 software and all of its components (Figure 3-13).
Figure 3-13: Uninstall Confirmation Request
2. Click Yes to confirm the removal of the BLItz Pro software and all of its contents.
Another prompt displays confirming the removal (Figure 3-14).
Figure 3-14: Confirmation of BLItz Pro Software Removal
3. Click OK to exit.
BLItz User Guide
page 31
CHAPTER 4: Working with ExperimentsIntroduction . . . . . . . . . . . . . . . . . . . . . . . . . . . . . . . . . . . . . . . . . . . . . . . . . . . . . . . . . . . . . . . . . . . . . . . . . . 32
Accessing Experiment Modules . . . . . . . . . . . . . . . . . . . . . . . . . . . . . . . . . . . . . . . . . . . . . . . . . . . . . . . 32
Hydrating Biosensors . . . . . . . . . . . . . . . . . . . . . . . . . . . . . . . . . . . . . . . . . . . . . . . . . . . . . . . . . . . . . . . . . 33
Running a Quick Yes/No Experiment . . . . . . . . . . . . . . . . . . . . . . . . . . . . . . . . . . . . . . . . . . . . . . . . . . 35
Creating a Standard Curve . . . . . . . . . . . . . . . . . . . . . . . . . . . . . . . . . . . . . . . . . . . . . . . . . . . . . . . . . . . . 41
Running a Quantitate Sample Experiment . . . . . . . . . . . . . . . . . . . . . . . . . . . . . . . . . . . . . . . . . . . . . 48
Running a Basic Kinetics Experiment . . . . . . . . . . . . . . . . . . . . . . . . . . . . . . . . . . . . . . . . . . . . . . . . . . 54
Running an Advanced Kinetics Experiment . . . . . . . . . . . . . . . . . . . . . . . . . . . . . . . . . . . . . . . . . . . . 61
BLItz User Guide
page 32 Chapter 4: Working with Experiments
INTRODUCTIONThe section provides a set of specific instructions based on the Starter kit included with your BLItz system. We highly recommend to new users that you first perform the tests illus-trated in this guide to familiarize yourselves with BLItz system operations before embarking on your own experiments. The specific experiment instructions should help you in design-ing and running your own experiments.
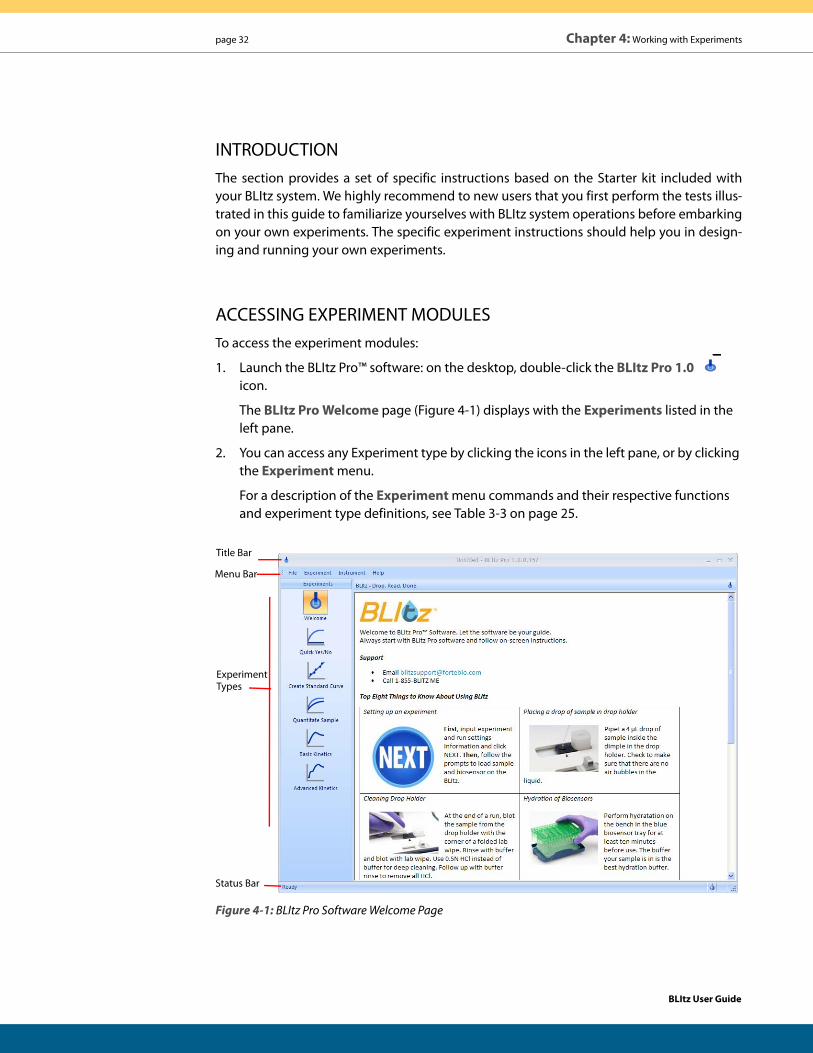
ACCESSING EXPERIMENT MODULESTo access the experiment modules:
1. Launch the BLItz Pro™ software: on the desktop, double-click the BLItz Pro 1.0 icon.
The BLItz Pro Welcome page (Figure 4-1) displays with the Experiments listed in the left pane.
2. You can access any Experiment type by clicking the icons in the left pane, or by clicking the Experiment menu.
For a description of the Experiment menu commands and their respective functions and experiment type definitions, see Table 3-3 on page 25.
Figure 4-1: BLItz Pro Software Welcome Page
Menu Bar
Status Bar
Experiment Types
Title Bar
BLItz User Guide
Hydrating Biosensors page 33
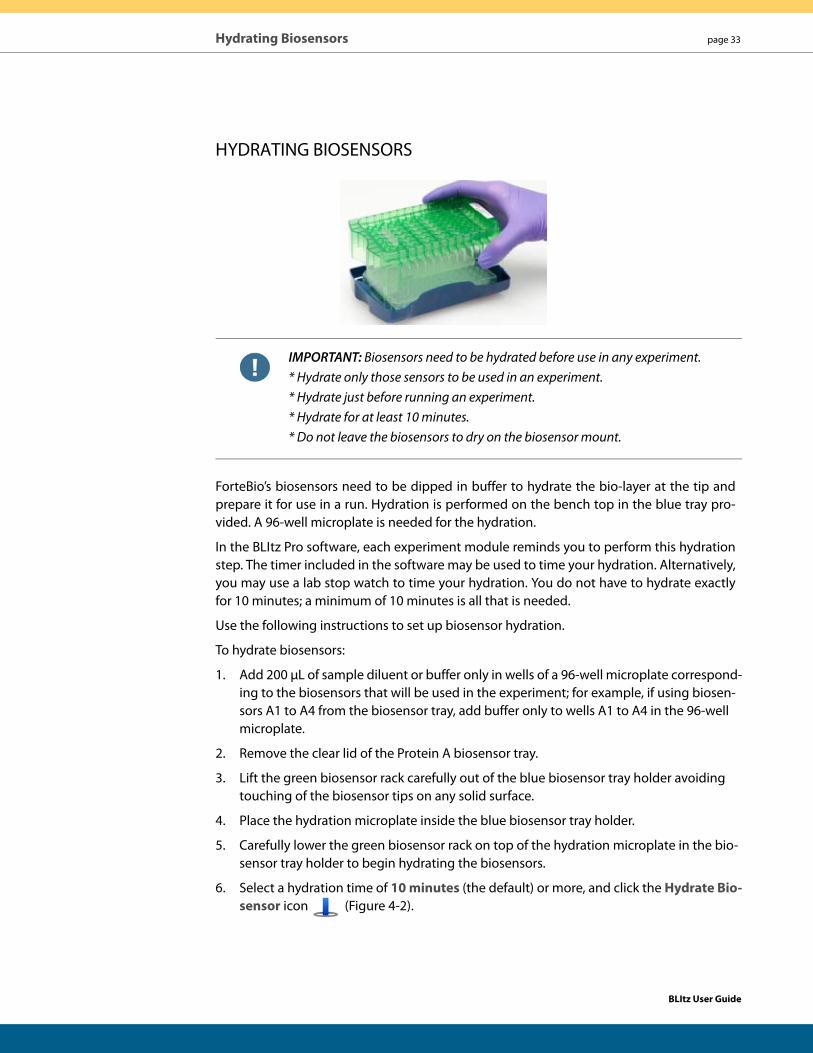
HYDRATING BIOSENSORS
IMPORTANT: Biosensors need to be hydrated before use in any experiment. * Hydrate only those sensors to be used in an experiment. * Hydrate just before running an experiment. * Hydrate for at least 10 minutes. * Do not leave the biosensors to dry on the biosensor mount.
ForteBio’s biosensors need to be dipped in buffer to hydrate the bio-layer at the tip and prepare it for use in a run. Hydration is performed on the bench top in the blue tray pro-vided. A 96-well microplate is needed for the hydration.
In the BLItz Pro software, each experiment module reminds you to perform this hydration step. The timer included in the software may be used to time your hydration. Alternatively, you may use a lab stop watch to time your hydration. You do not have to hydrate exactly for 10 minutes; a minimum of 10 minutes is all that is needed.
Use the following instructions to set up biosensor hydration.
To hydrate biosensors:
1. Add 200 μL of sample diluent or buffer only in wells of a 96-well microplate correspond-ing to the biosensors that will be used in the experiment; for example, if using biosen-sors A1 to A4 from the biosensor tray, add buffer only to wells A1 to A4 in the 96-well microplate.
2. Remove the clear lid of the Protein A biosensor tray.
3. Lift the green biosensor rack carefully out of the blue biosensor tray holder avoiding touching of the biosensor tips on any solid surface.
4. Place the hydration microplate inside the blue biosensor tray holder.
5. Carefully lower the green biosensor rack on top of the hydration microplate in the bio-sensor tray holder to begin hydrating the biosensors.
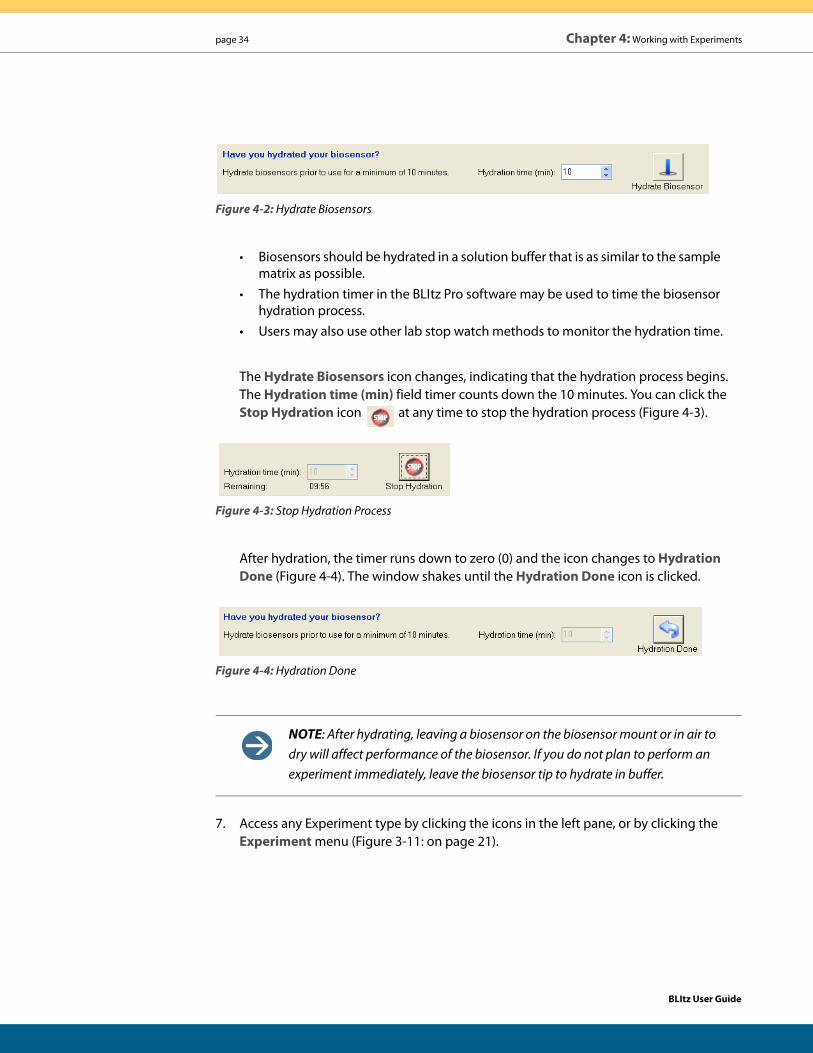
6. Select a hydration time of 10 minutes (the default) or more, and click the Hydrate Bio-sensor icon (Figure 4-2).
BLItz User Guide
page 34 Chapter 4: Working with Experiments
Figure 4-2: Hydrate Biosensors
• Biosensors should be hydrated in a solution buffer that is as similar to the sample matrix as possible.
• The hydration timer in the BLItz Pro software may be used to time the biosensor hydration process.
• Users may also use other lab stop watch methods to monitor the hydration time.
The Hydrate Biosensors icon changes, indicating that the hydration process begins. The Hydration time (min) field timer counts down the 10 minutes. You can click the Stop Hydration icon at any time to stop the hydration process (Figure 4-3).
Figure 4-3: Stop Hydration Process
After hydration, the timer runs down to zero (0) and the icon changes to Hydration Done (Figure 4-4). The window shakes until the Hydration Done icon is clicked.
Figure 4-4: Hydration Done
NOTE: After hydrating, leaving a biosensor on the biosensor mount or in air to dry will affect performance of the biosensor. If you do not plan to perform an experiment immediately, leave the biosensor tip to hydrate in buffer.
7. Access any Experiment type by clicking the icons in the left pane, or by clicking the Experiment menu (Figure 3-11: on page 21).
BLItz User Guide
Running a Quick Yes/No Experiment page 35
RUNNING A QUICK YES/NO EXPERIMENTWhen using the Starter kit to perform a Quick Yes/No experiment, perform the following steps for human IgG samples binding Protein A biosensors.
To develop a Quick Yes/No experiment for your samples on the BLItz system, consider these guidelines:
• Test a negative control and positive control sample along with your unknown.
• Use an appropriate biosensor type from ForteBio’s list of off-the-shelf biosensors. If one is not readily available, you may prepare a custom biosensor by loading your ligand on any one of the biosensors available.
• Use the drop holder for all Quick Yes/No measurements. Use 4 μL of sample diluent.
• Start with the default Run time value of 120 seconds to test your positive and nega-tive controls. You may then optimize the Run time as needed. Typically, longer run times allow more binding of analyte to the biosensor, thus providing greater signal.
• Keep the Shaker in Enable mode to allow good mixing of sample. You can tweak the shaker rate via File >Options menu to a value between 1000 and 2600 rpm to suit your needs. Typically, increasing shaker rate leads to faster binding rates.
• Always input experiment info first and click Next. Follow the onscreen prompts to load sample and biosensor on the BLItz system.
In this Quick Yes/No experiment, hIgG is the analyte you will use to prepare three (3) sam-ples: positive control (1000 μg/mL), “unknown” (100 μg/mL), and negative control (sample diluent). The 100 μg/mL hIgG sample will be considered a mock “unknown” sample to show how BLItz can evaluate the presence of your protein in a sample. The negative control (sam-ple diluent) will also be used as the sample blank (reference).
Everything you need:
• Protein A biosensors
• hIgG stock (10 mg/mL)
• sample diluent
• 96-well, black flat-bottom microplate
BLItz User Guide
page 36 Chapter 4: Working with Experiments
To run a Quick Yes/No experiment:
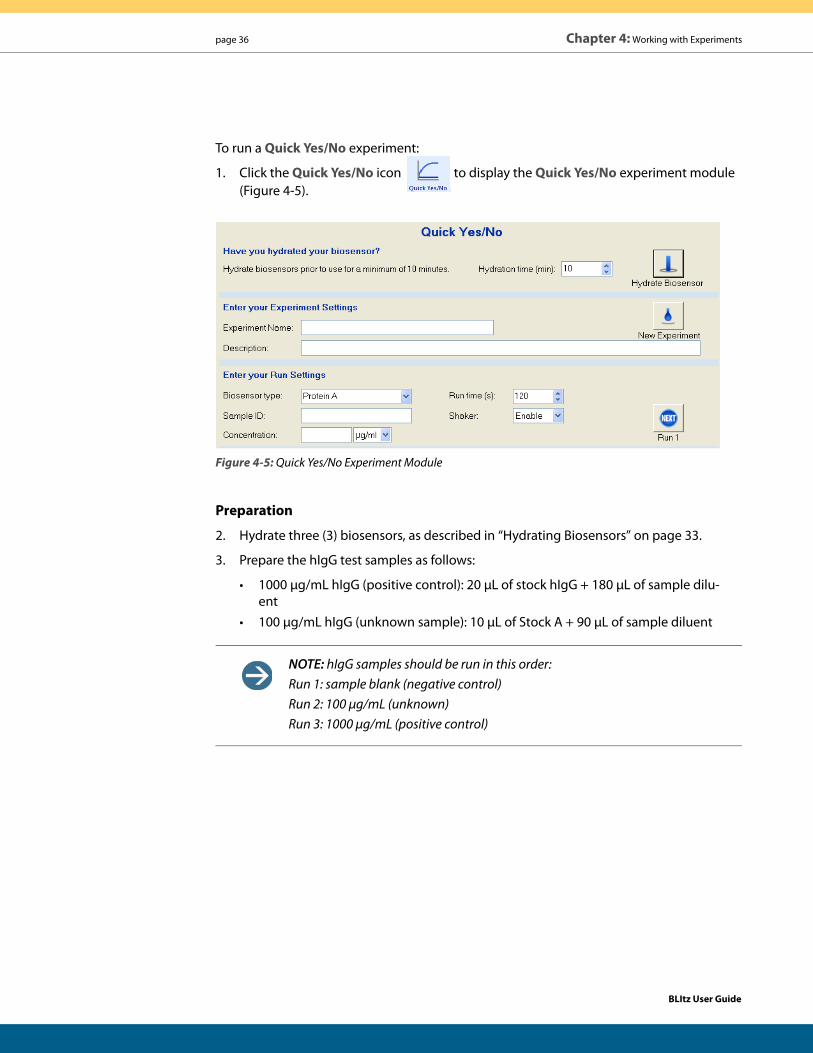
1. Click the Quick Yes/No icon to display the Quick Yes/No experiment module (Figure 4-5).
Figure 4-5: Quick Yes/No Experiment Module
Preparation
2. Hydrate three (3) biosensors, as described in “Hydrating Biosensors” on page 33.
3. Prepare the hIgG test samples as follows:
• 1000 μg/mL hIgG (positive control): 20 μL of stock hIgG + 180 μL of sample dilu-ent
• 100 μg/mL hIgG (unknown sample): 10 μL of Stock A + 90 μL of sample diluent
NOTE: hIgG samples should be run in this order: Run 1: sample blank (negative control) Run 2: 100 μg/mL (unknown) Run 3: 1000 μg/mL (positive control)
BLItz User Guide
Running a Quick Yes/No Experiment page 37
Experiment
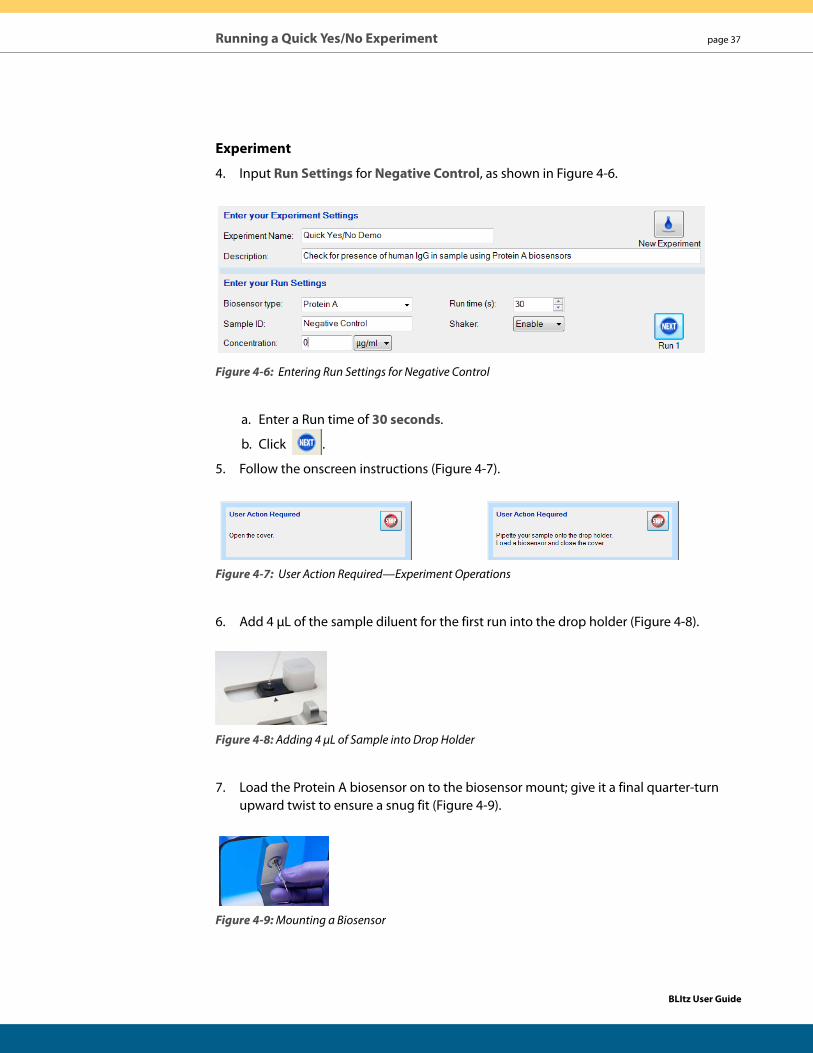
4. Input Run Settings for Negative Control, as shown in Figure 4-6.
Figure 4-6: Entering Run Settings for Negative Control
a. Enter a Run time of 30 seconds.
b. Click .
5. Follow the onscreen instructions (Figure 4-7).
Figure 4-7: User Action Required—Experiment Operations
6. Add 4 μL of the sample diluent for the first run into the drop holder (Figure 4-8).
Figure 4-8: Adding 4 μL of Sample into Drop Holder
7. Load the Protein A biosensor on to the biosensor mount; give it a final quarter-turn upward twist to ensure a snug fit (Figure 4-9).
Figure 4-9: Mounting a Biosensor
BLItz User Guide
page 38 Chapter 4: Working with Experiments
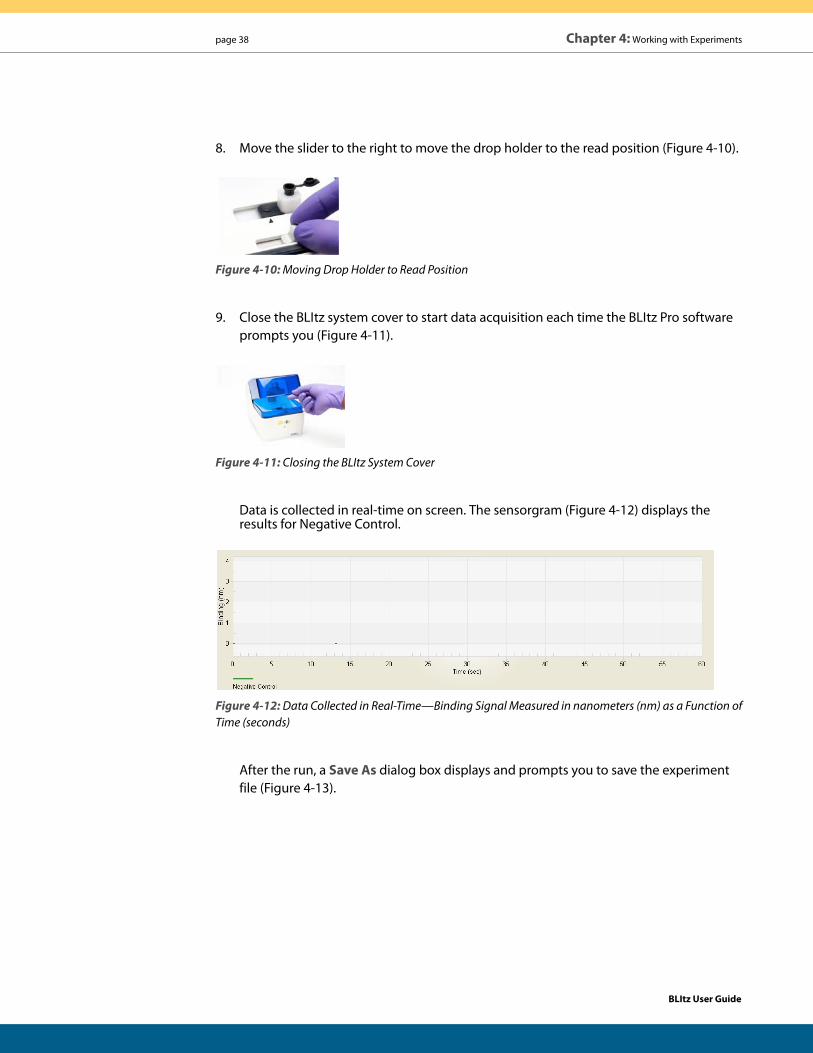
8. Move the slider to the right to move the drop holder to the read position (Figure 4-10).
Figure 4-10: Moving Drop Holder to Read Position
9. Close the BLItz system cover to start data acquisition each time the BLItz Pro software prompts you (Figure 4-11).
Figure 4-11: Closing the BLItz System Cover
Data is collected in real-time on screen. The sensorgram (Figure 4-12) displays the results for Negative Control.
Figure 4-12: Data Collected in Real-Time—Binding Signal Measured in nanometers (nm) as a Function of Time (seconds)
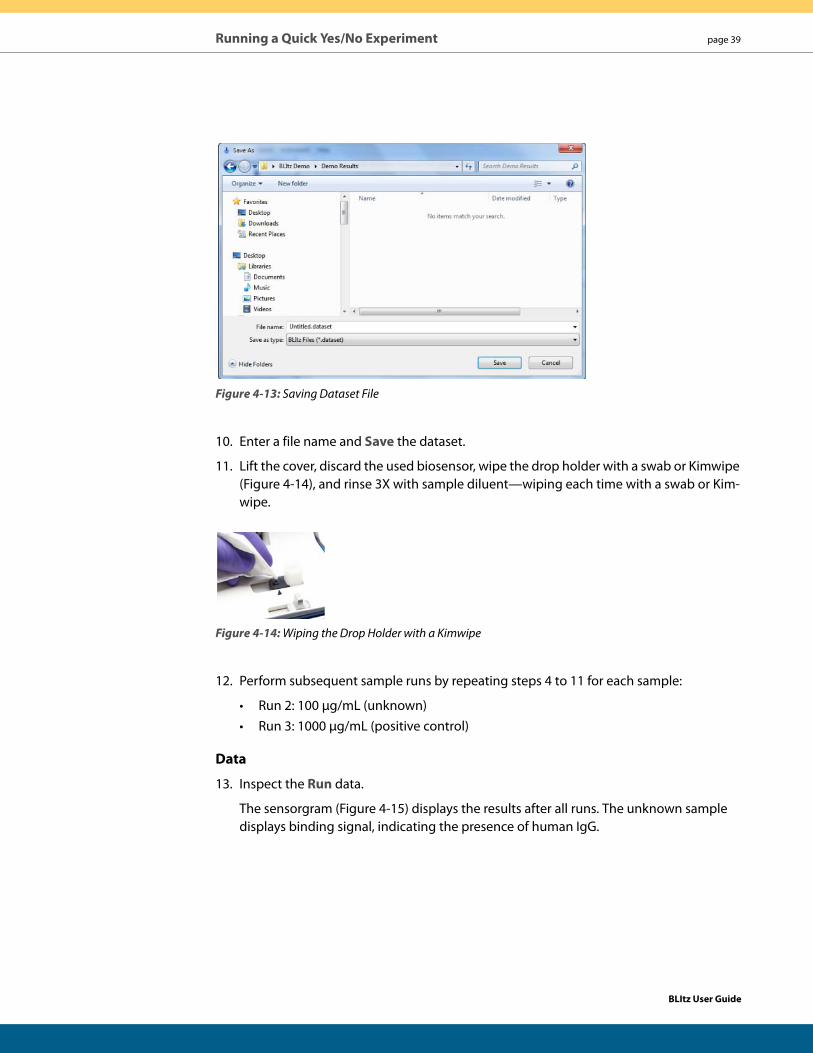
After the run, a Save As dialog box displays and prompts you to save the experiment file (Figure 4-13).
BLItz User Guide
Running a Quick Yes/No Experiment page 39
Figure 4-13: Saving Dataset File
10. Enter a file name and Save the dataset.
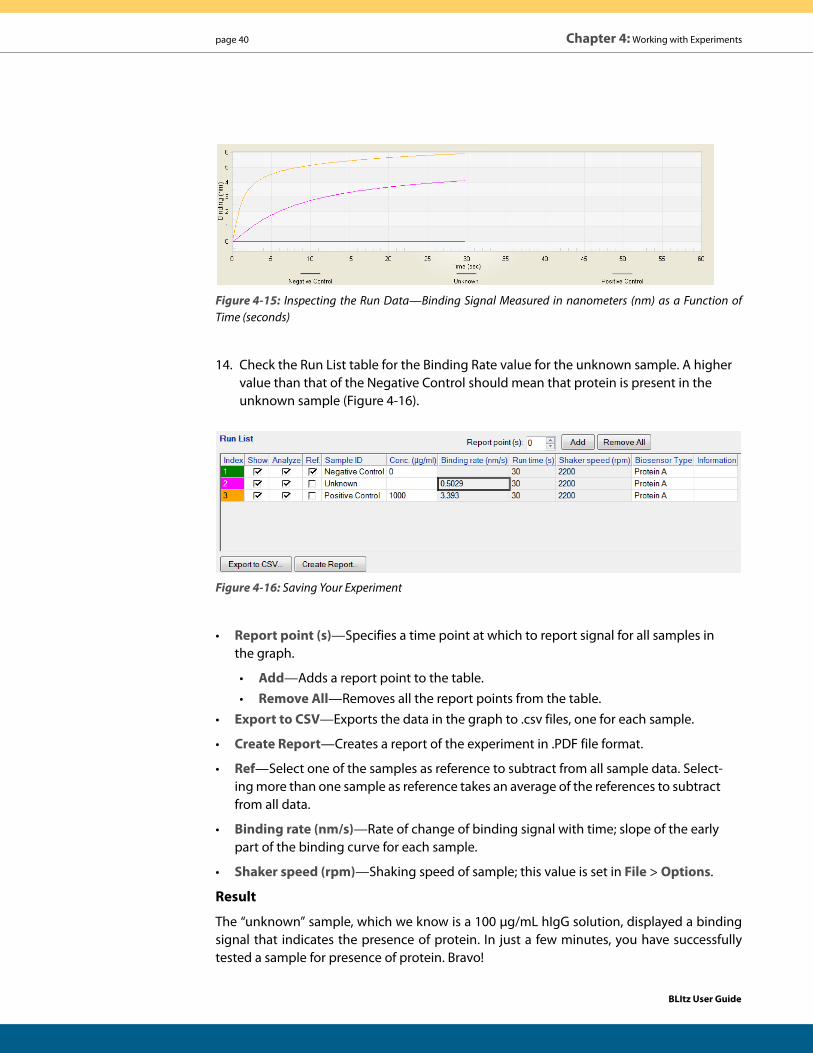
11. Lift the cover, discard the used biosensor, wipe the drop holder with a swab or Kimwipe (Figure 4-14), and rinse 3X with sample diluent—wiping each time with a swab or Kim-wipe.
Figure 4-14: Wiping the Drop Holder with a Kimwipe
12. Perform subsequent sample runs by repeating steps 4 to 11 for each sample:
• Run 2: 100 μg/mL (unknown)• Run 3: 1000 μg/mL (positive control)
Data
13. Inspect the Run data.
The sensorgram (Figure 4-15) displays the results after all runs. The unknown sample displays binding signal, indicating the presence of human IgG.
BLItz User Guide
page 40 Chapter 4: Working with Experiments
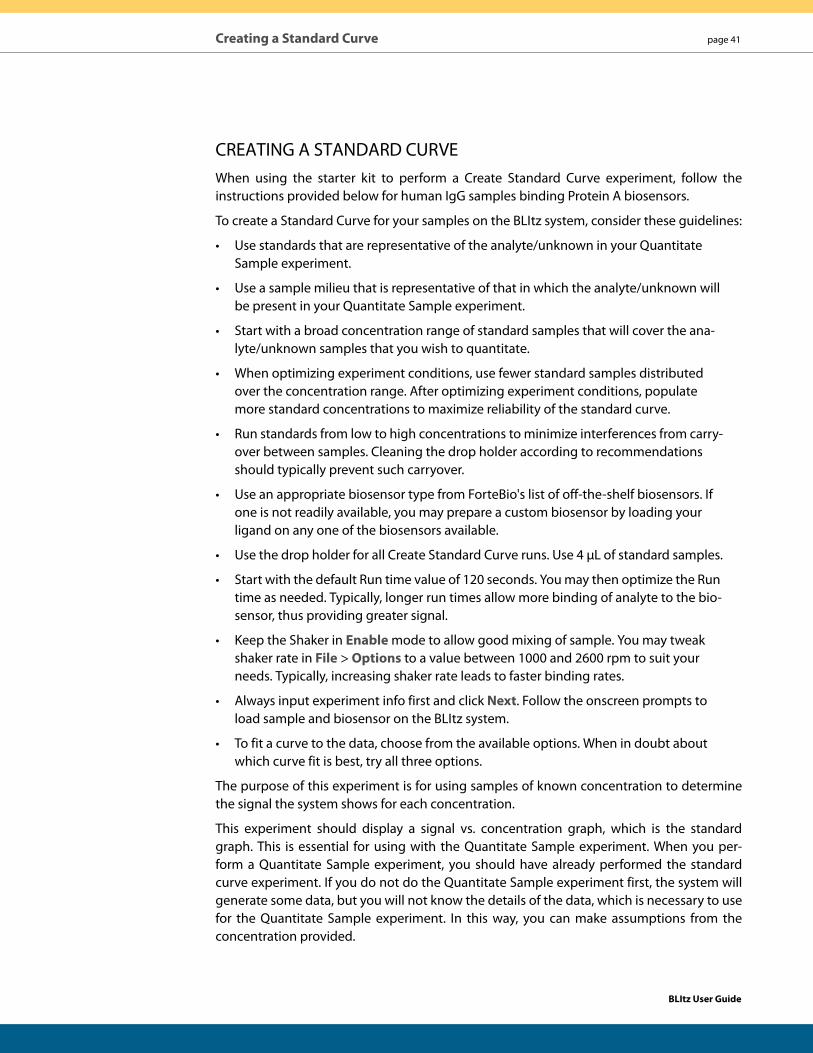
Figure 4-15: Inspecting the Run Data—Binding Signal Measured in nanometers (nm) as a Function of Time (seconds)
14. Check the Run List table for the Binding Rate value for the unknown sample. A higher value than that of the Negative Control should mean that protein is present in the unknown sample (Figure 4-16).
Figure 4-16: Saving Your Experiment
• Report point (s)—Specifies a time point at which to report signal for all samples in the graph.
• Add—Adds a report point to the table. • Remove All—Removes all the report points from the table.
• Export to CSV—Exports the data in the graph to .csv files, one for each sample.
• Create Report—Creates a report of the experiment in .PDF file format.
• Ref—Select one of the samples as reference to subtract from all sample data. Select-ing more than one sample as reference takes an average of the references to subtract from all data.
• Binding rate (nm/s)—Rate of change of binding signal with time; slope of the early part of the binding curve for each sample.
• Shaker speed (rpm)—Shaking speed of sample; this value is set in File > Options.
Result
The “unknown” sample, which we know is a 100 μg/mL hIgG solution, displayed a binding signal that indicates the presence of protein. In just a few minutes, you have successfully tested a sample for presence of protein. Bravo!
BLItz User Guide
Creating a Standard Curve page 41
CREATING A STANDARD CURVEWhen using the starter kit to perform a Create Standard Curve experiment, follow the instructions provided below for human IgG samples binding Protein A biosensors.
To create a Standard Curve for your samples on the BLItz system, consider these guidelines:
• Use standards that are representative of the analyte/unknown in your Quantitate Sample experiment.
• Use a sample milieu that is representative of that in which the analyte/unknown will be present in your Quantitate Sample experiment.
• Start with a broad concentration range of standard samples that will cover the ana-lyte/unknown samples that you wish to quantitate.
• When optimizing experiment conditions, use fewer standard samples distributed over the concentration range. After optimizing experiment conditions, populate more standard concentrations to maximize reliability of the standard curve.
• Run standards from low to high concentrations to minimize interferences from carry-over between samples. Cleaning the drop holder according to recommendations should typically prevent such carryover.
• Use an appropriate biosensor type from ForteBio's list of off-the-shelf biosensors. If one is not readily available, you may prepare a custom biosensor by loading your ligand on any one of the biosensors available.
• Use the drop holder for all Create Standard Curve runs. Use 4 μL of standard samples.
• Start with the default Run time value of 120 seconds. You may then optimize the Run time as needed. Typically, longer run times allow more binding of analyte to the bio-sensor, thus providing greater signal.
• Keep the Shaker in Enable mode to allow good mixing of sample. You may tweak shaker rate in File > Options to a value between 1000 and 2600 rpm to suit your needs. Typically, increasing shaker rate leads to faster binding rates.
• Always input experiment info first and click Next. Follow the onscreen prompts to load sample and biosensor on the BLItz system.
• To fit a curve to the data, choose from the available options. When in doubt about which curve fit is best, try all three options.
The purpose of this experiment is for using samples of known concentration to determine the signal the system shows for each concentration.
This experiment should display a signal vs. concentration graph, which is the standard graph. This is essential for using with the Quantitate Sample experiment. When you per-form a Quantitate Sample experiment, you should have already performed the standard curve experiment. If you do not do the Quantitate Sample experiment first, the system will generate some data, but you will not know the details of the data, which is necessary to use for the Quantitate Sample experiment. In this way, you can make assumptions from the concentration provided.
BLItz User Guide
page 42 Chapter 4: Working with Experiments
In this Standard Curve experiment, hIgG is the analyte you will use to prepare four (4) stan-dards ranging from 15.6–1000 μg/mL. With sample diluent as the reference, there will be a total of five (5) samples measured on the BLItz system.
Everything you need:
• Protein A biosensors
• hIgG stock (10 mg/mL)
• sample diluent
• 96-well, black flat-bottom microplate
To run a Create a Standard Curve experiment:
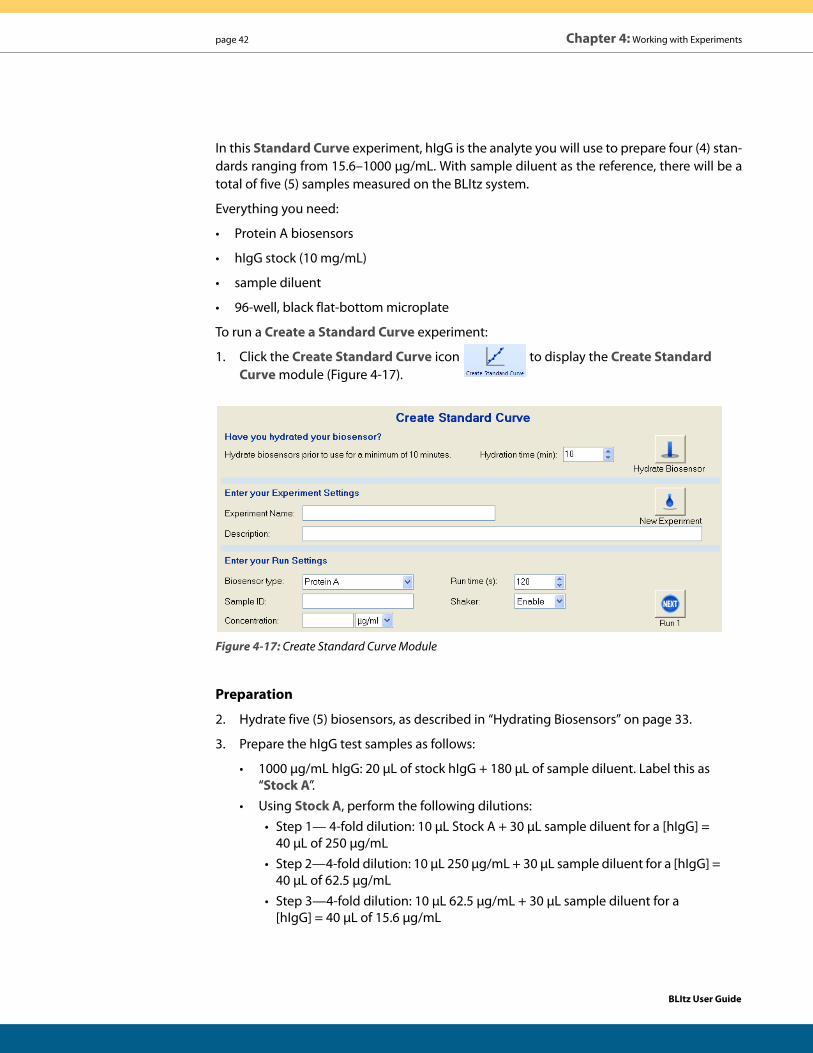
1. Click the Create Standard Curve icon to display the Create Standard Curve module (Figure 4-17).
Figure 4-17: Create Standard Curve Module
Preparation
2. Hydrate five (5) biosensors, as described in “Hydrating Biosensors” on page 33.
3. Prepare the hIgG test samples as follows:
• 1000 μg/mL hIgG: 20 μL of stock hIgG + 180 μL of sample diluent. Label this as “Stock A”.
• Using Stock A, perform the following dilutions:• Step 1— 4-fold dilution: 10 μL Stock A + 30 μL sample diluent for a [hIgG] =
40 μL of 250 μg/mL• Step 2—4-fold dilution: 10 μL 250 μg/mL + 30 μL sample diluent for a [hIgG] =
40 μL of 62.5 μg/mL• Step 3—4-fold dilution: 10 μL 62.5 μg/mL + 30 μL sample diluent for a
[hIgG] = 40 μL of 15.6 μg/mL
BLItz User Guide
Creating a Standard Curve page 43
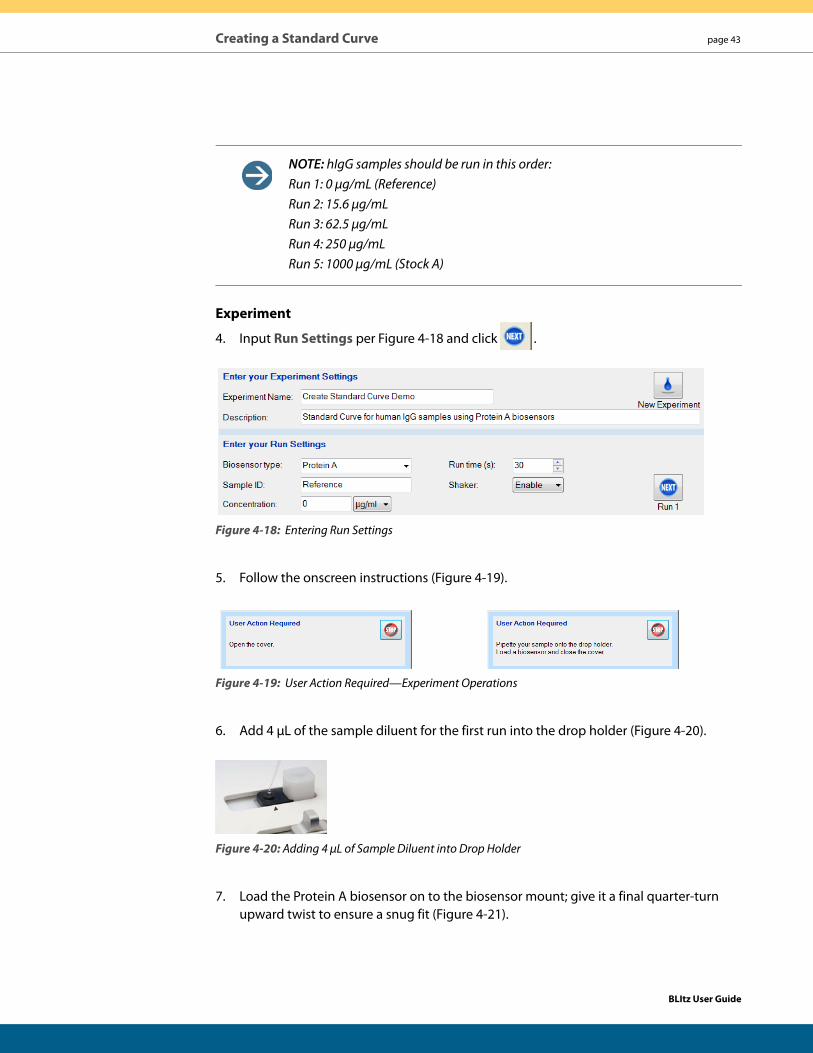
NOTE: hIgG samples should be run in this order: Run 1: 0 μg/mL (Reference) Run 2: 15.6 μg/mL Run 3: 62.5 μg/mL Run 4: 250 μg/mL Run 5: 1000 μg/mL (Stock A)
Experiment
4. Input Run Settings per Figure 4-18 and click .
Figure 4-18: Entering Run Settings
5. Follow the onscreen instructions (Figure 4-19).
Figure 4-19: User Action Required—Experiment Operations
6. Add 4 μL of the sample diluent for the first run into the drop holder (Figure 4-20).
Figure 4-20: Adding 4 μL of Sample Diluent into Drop Holder
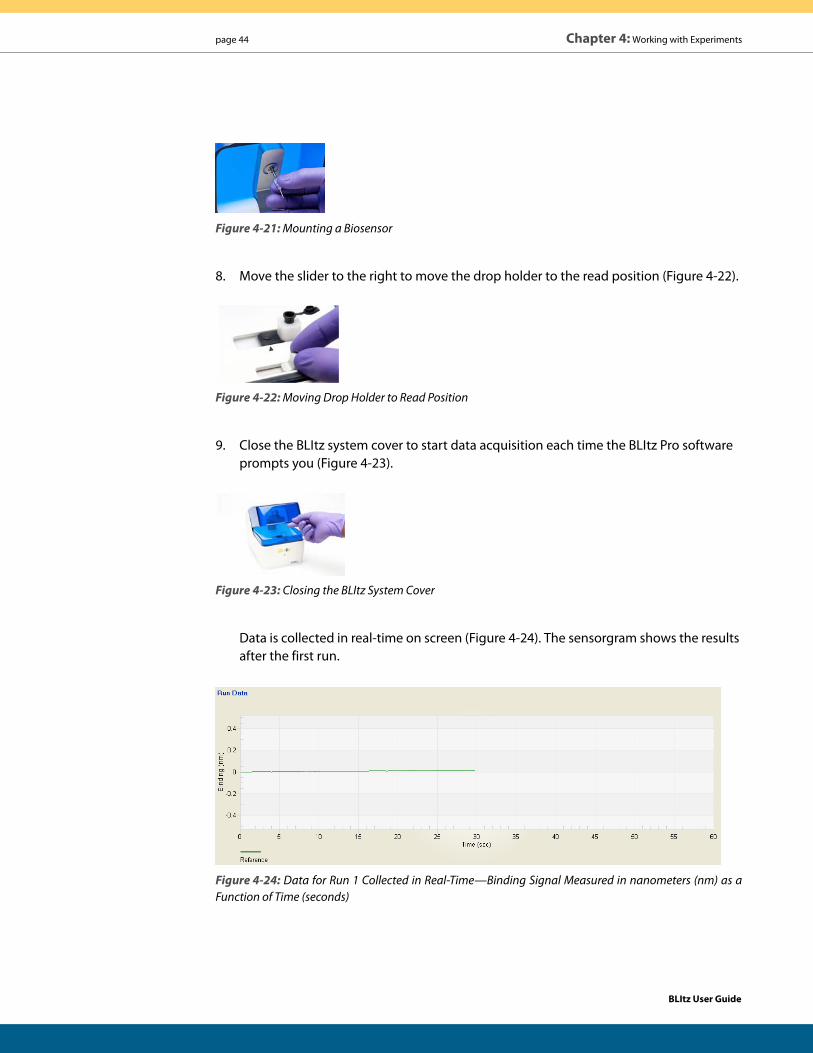
7. Load the Protein A biosensor on to the biosensor mount; give it a final quarter-turn upward twist to ensure a snug fit (Figure 4-21).
BLItz User Guide
page 44 Chapter 4: Working with Experiments
Figure 4-21: Mounting a Biosensor
8. Move the slider to the right to move the drop holder to the read position (Figure 4-22).
Figure 4-22: Moving Drop Holder to Read Position
9. Close the BLItz system cover to start data acquisition each time the BLItz Pro software prompts you (Figure 4-23).
Figure 4-23: Closing the BLItz System Cover
Data is collected in real-time on screen (Figure 4-24). The sensorgram shows the results after the first run.
Figure 4-24: Data for Run 1 Collected in Real-Time—Binding Signal Measured in nanometers (nm) as a Function of Time (seconds)
BLItz User Guide
Creating a Standard Curve page 45
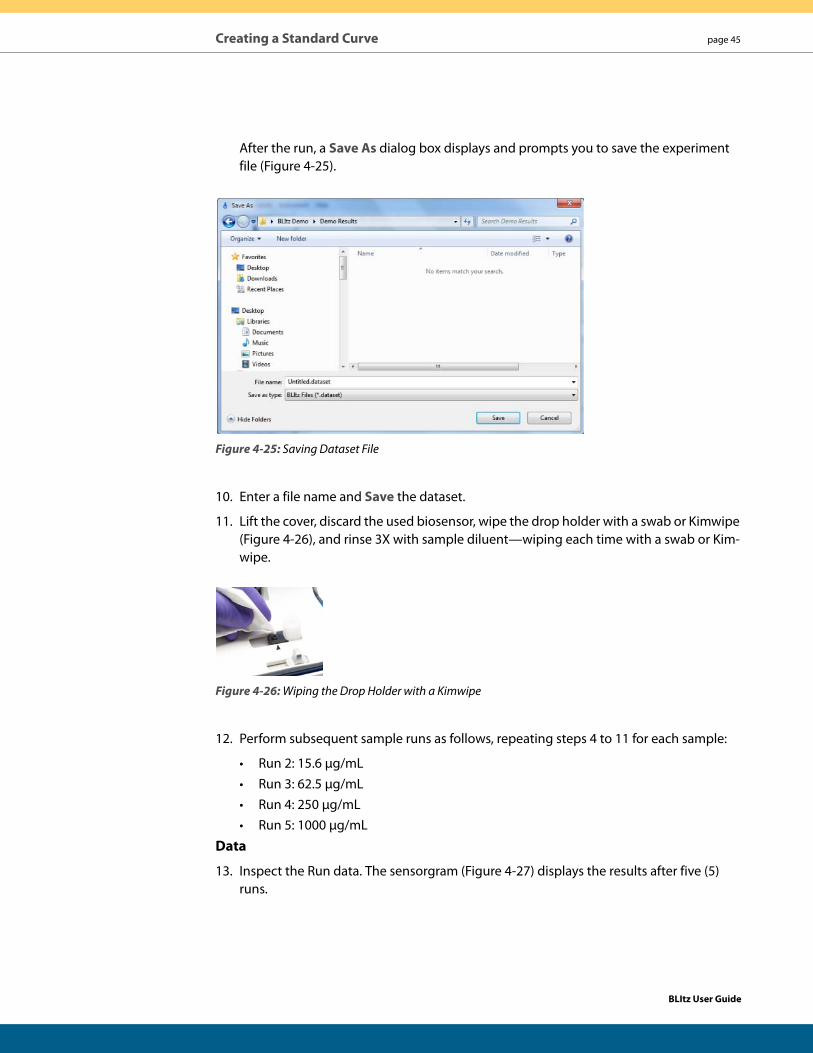
After the run, a Save As dialog box displays and prompts you to save the experiment file (Figure 4-25).
Figure 4-25: Saving Dataset File
10. Enter a file name and Save the dataset.
11. Lift the cover, discard the used biosensor, wipe the drop holder with a swab or Kimwipe (Figure 4-26), and rinse 3X with sample diluent—wiping each time with a swab or Kim-wipe.
Figure 4-26: Wiping the Drop Holder with a Kimwipe
12. Perform subsequent sample runs as follows, repeating steps 4 to 11 for each sample:
• Run 2: 15.6 μg/mL• Run 3: 62.5 μg/mL• Run 4: 250 μg/mL• Run 5: 1000 μg/mL
Data
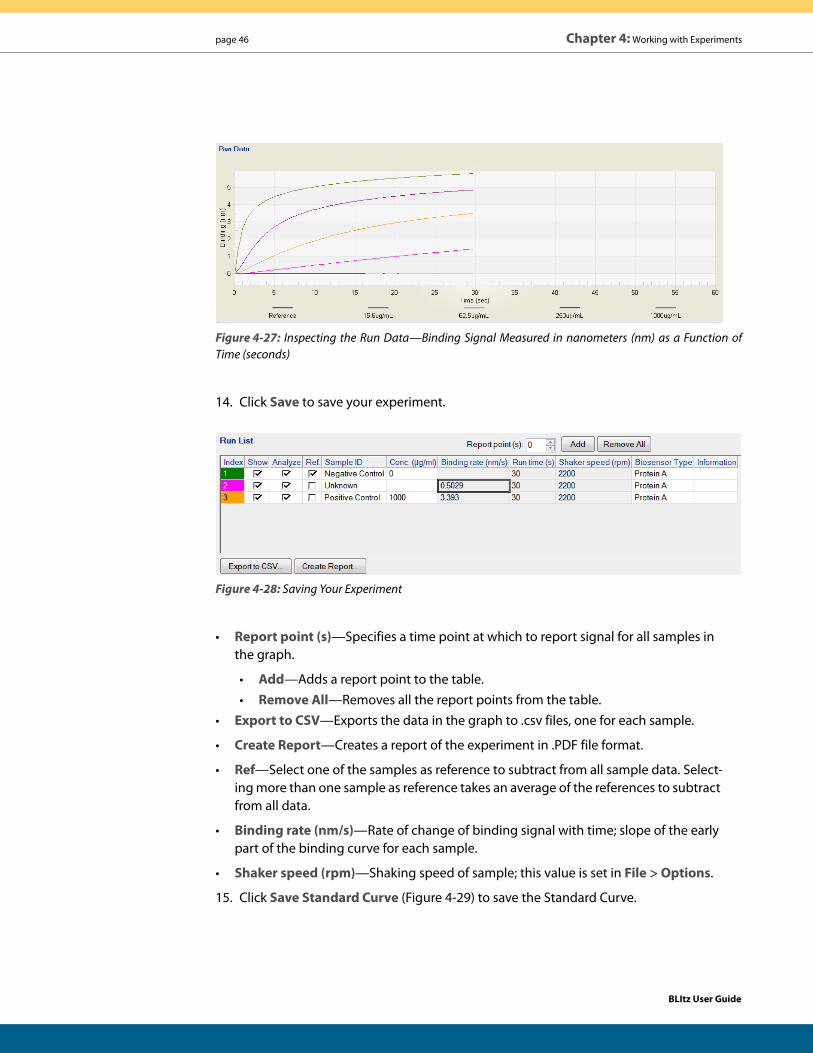
13. Inspect the Run data. The sensorgram (Figure 4-27) displays the results after five (5) runs.
BLItz User Guide
page 46 Chapter 4: Working with Experiments
Figure 4-27: Inspecting the Run Data—Binding Signal Measured in nanometers (nm) as a Function of Time (seconds)
14. Click Save to save your experiment.
Figure 4-28: Saving Your Experiment
• Report point (s)—Specifies a time point at which to report signal for all samples in the graph.
• Add—Adds a report point to the table. • Remove All—Removes all the report points from the table.
• Export to CSV—Exports the data in the graph to .csv files, one for each sample.
• Create Report—Creates a report of the experiment in .PDF file format.
• Ref—Select one of the samples as reference to subtract from all sample data. Select-ing more than one sample as reference takes an average of the references to subtract from all data.
• Binding rate (nm/s)—Rate of change of binding signal with time; slope of the early part of the binding curve for each sample.
• Shaker speed (rpm)—Shaking speed of sample; this value is set in File > Options.
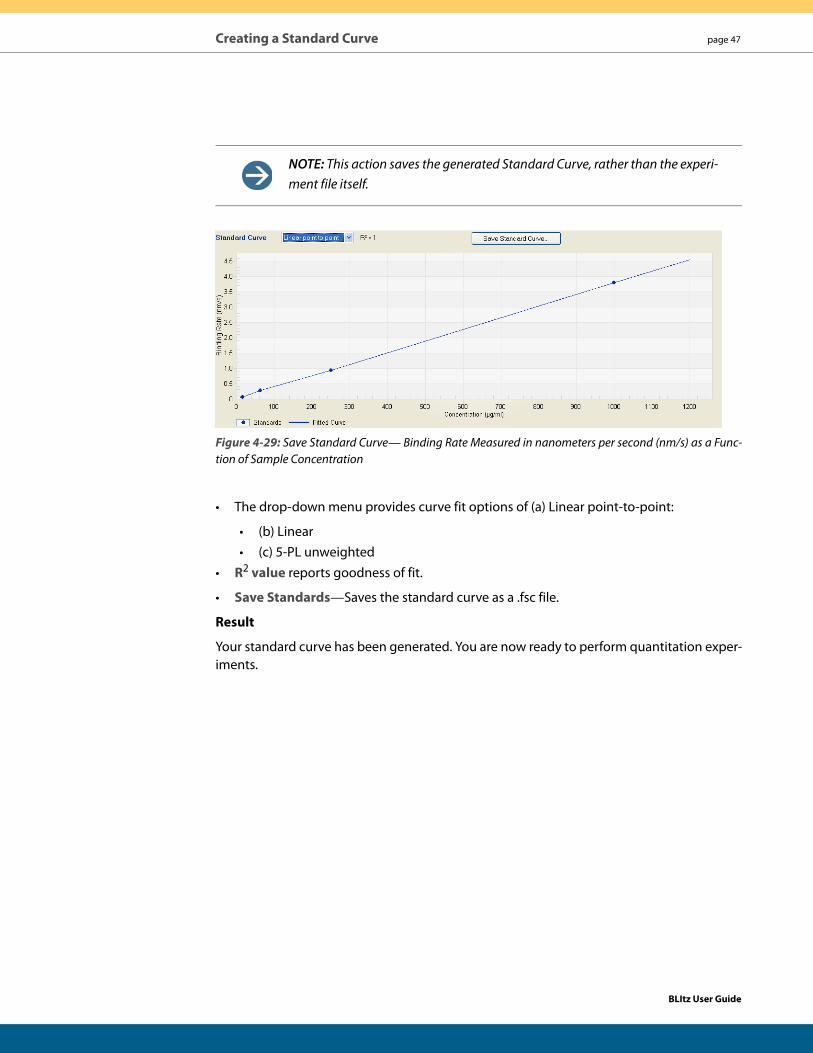
15. Click Save Standard Curve (Figure 4-29) to save the Standard Curve.
BLItz User Guide
Creating a Standard Curve page 47
NOTE: This action saves the generated Standard Curve, rather than the experi-ment file itself.
Figure 4-29: Save Standard Curve— Binding Rate Measured in nanometers per second (nm/s) as a Func-tion of Sample Concentration
• The drop-down menu provides curve fit options of (a) Linear point-to-point:
• (b) Linear• (c) 5-PL unweighted
• R2 value reports goodness of fit.
• Save Standards—Saves the standard curve as a .fsc file.
Result
Your standard curve has been generated. You are now ready to perform quantitation exper-iments.
BLItz User Guide
page 48 Chapter 4: Working with Experiments
RUNNING A QUANTITATE SAMPLE EXPERIMENTWhen using the starter kit to perform a Quantitate Sample experiment, follow the instruc-tions provided below for human IgG samples binding Protein A biosensors.
To measure concentration of proteins in your samples on the BLItz system, consider these guidelines:
• Create a Standard Curve that is representative of your unknown samples first before testing your unknowns. You may choose to perform the standard curve experiments after the Quantitate Sample experiments, but you will not be able to obtain concen-trations of your unknowns until the standard curve is available.
• Ensure that the sample milieu in the unknowns and the standards are the same.
• Use the same experiment parameters such as Run time and Shaker speed for the Quantitate Sample experiment as that used in the creating the Standard Curve.
• Use an appropriate biosensor type from ForteBio’s list of off-the-shelf biosensors. If one is not readily available, you may prepare a custom biosensor by loading your ligand on any one of the biosensors available.
• Use the drop holder for all Quantitate Sample measurements. Use 4 μL of sample.
• Always input experiment info first and click Next. Follow the onscreen prompts to load sample and biosensor on the BLItz system.
This module allows you to quantitate unknown samples against a standard curve. This experiment assumes that you have already created a Standard Curve (see “Creating a Stan-dard Curve” on page 41).
In this module, you will prepare two (2) samples of hIgG of known concentrations, and use the BLItz system to calculate their concentrations and confirm that the system reliably mea-sures protein concentrations.
Everything you need:
• Protein A biosensors
• hIgG stock (10 mg/mL)
• sample diluent
• 96-well, black flat-bottom microplate
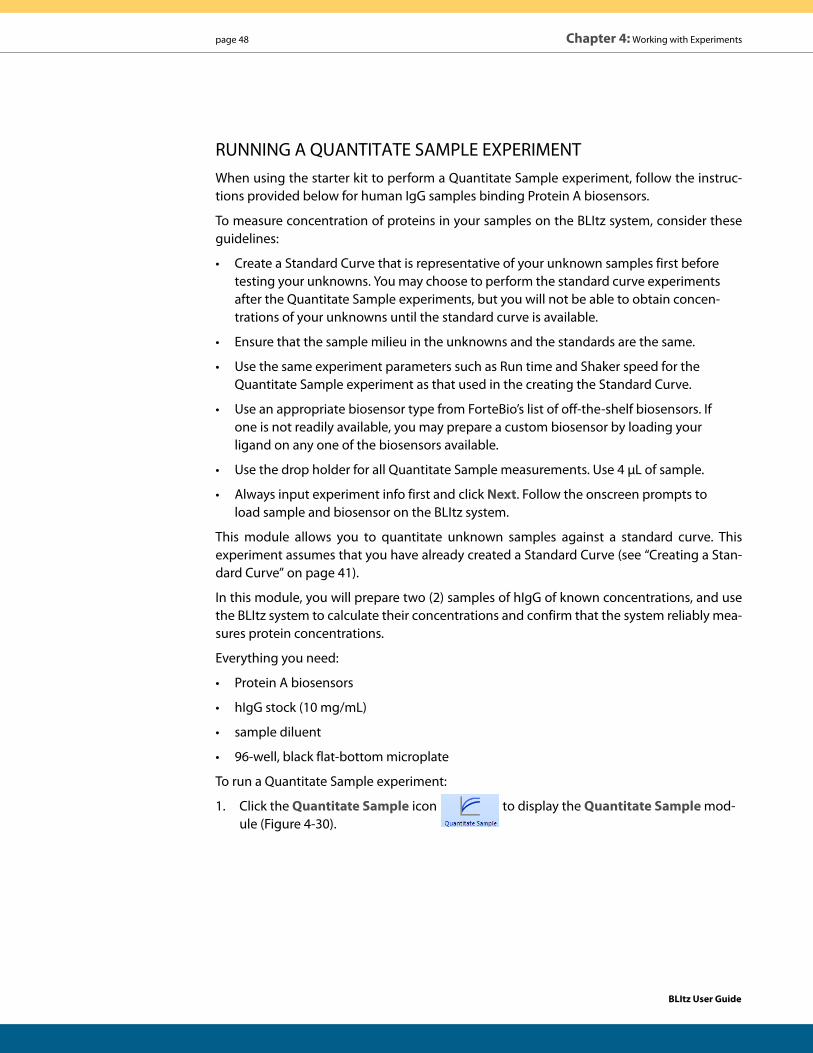
To run a Quantitate Sample experiment:
1. Click the Quantitate Sample icon to display the Quantitate Sample mod-ule (Figure 4-30).
BLItz User Guide
Running a Quantitate Sample Experiment page 49
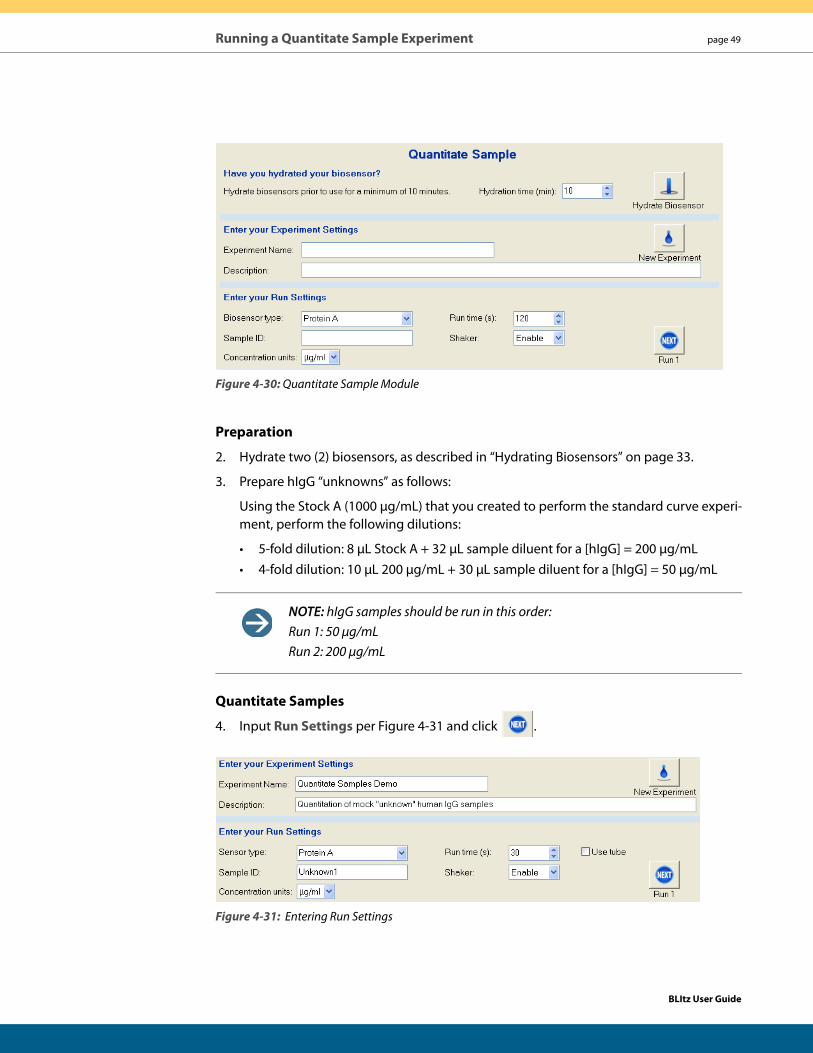
Figure 4-30: Quantitate Sample Module
Preparation
2. Hydrate two (2) biosensors, as described in “Hydrating Biosensors” on page 33.
3. Prepare hIgG “unknowns” as follows:
Using the Stock A (1000 μg/mL) that you created to perform the standard curve experi-ment, perform the following dilutions:
• 5-fold dilution: 8 μL Stock A + 32 μL sample diluent for a [hIgG] = 200 μg/mL• 4-fold dilution: 10 μL 200 μg/mL + 30 μL sample diluent for a [hIgG] = 50 μg/mL
NOTE: hIgG samples should be run in this order: Run 1: 50 μg/mL Run 2: 200 μg/mL
Quantitate Samples
4. Input Run Settings per Figure 4-31 and click .
Figure 4-31: Entering Run Settings
BLItz User Guide
page 50 Chapter 4: Working with Experiments
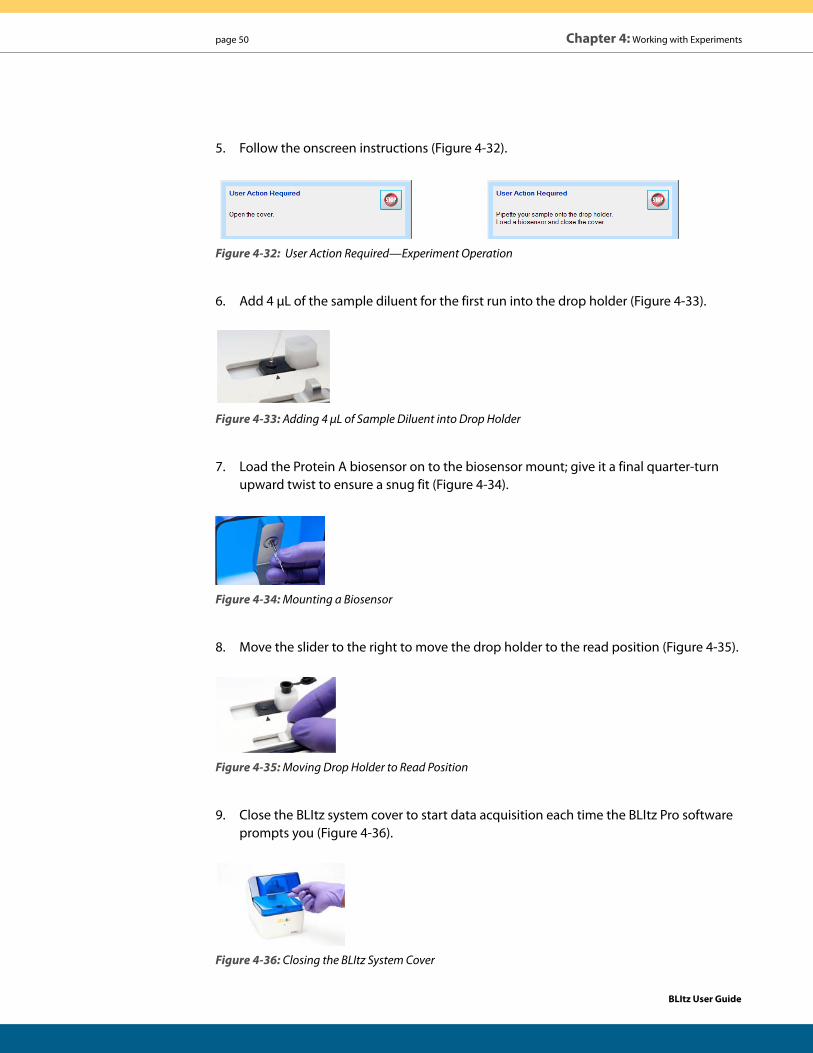
5. Follow the onscreen instructions (Figure 4-32).
Figure 4-32: User Action Required—Experiment Operation
6. Add 4 μL of the sample diluent for the first run into the drop holder (Figure 4-33).
Figure 4-33: Adding 4 μL of Sample Diluent into Drop Holder
7. Load the Protein A biosensor on to the biosensor mount; give it a final quarter-turn upward twist to ensure a snug fit (Figure 4-34).
Figure 4-34: Mounting a Biosensor
8. Move the slider to the right to move the drop holder to the read position (Figure 4-35).
Figure 4-35: Moving Drop Holder to Read Position
9. Close the BLItz system cover to start data acquisition each time the BLItz Pro software prompts you (Figure 4-36).
Figure 4-36: Closing the BLItz System Cover
BLItz User Guide
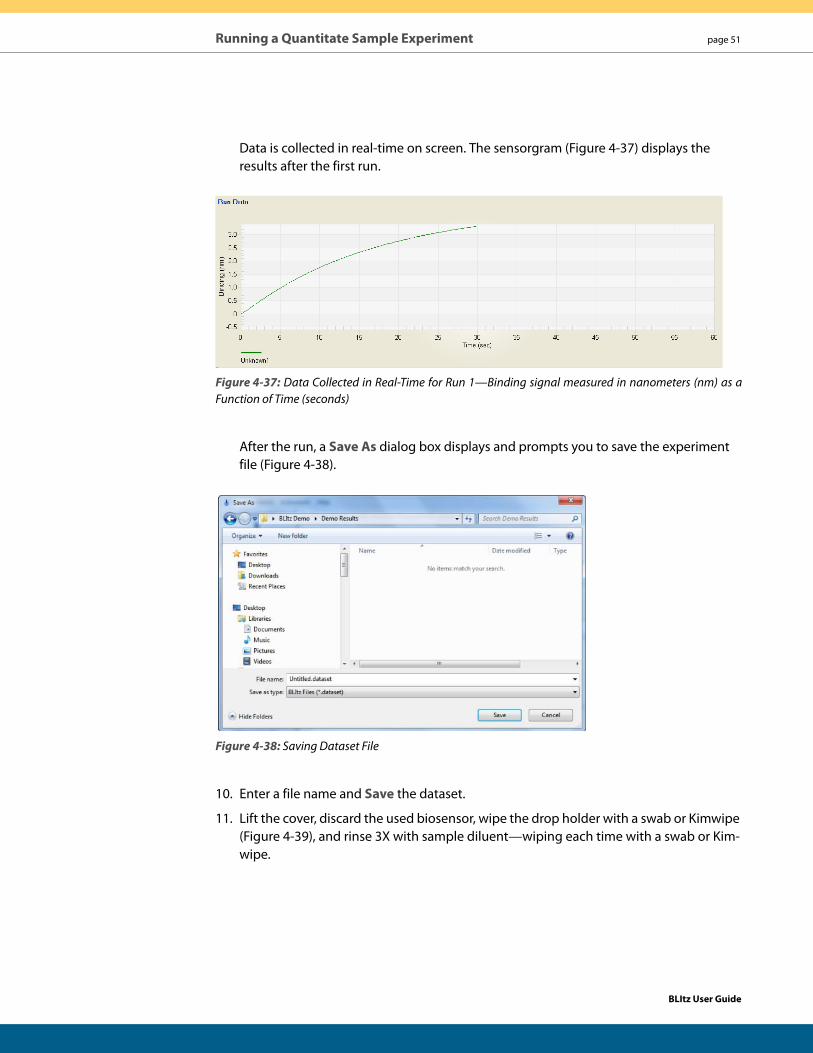
Running a Quantitate Sample Experiment page 51
Data is collected in real-time on screen. The sensorgram (Figure 4-37) displays the results after the first run.
Figure 4-37: Data Collected in Real-Time for Run 1—Binding signal measured in nanometers (nm) as a Function of Time (seconds)
After the run, a Save As dialog box displays and prompts you to save the experiment file (Figure 4-38).
Figure 4-38: Saving Dataset File
10. Enter a file name and Save the dataset.
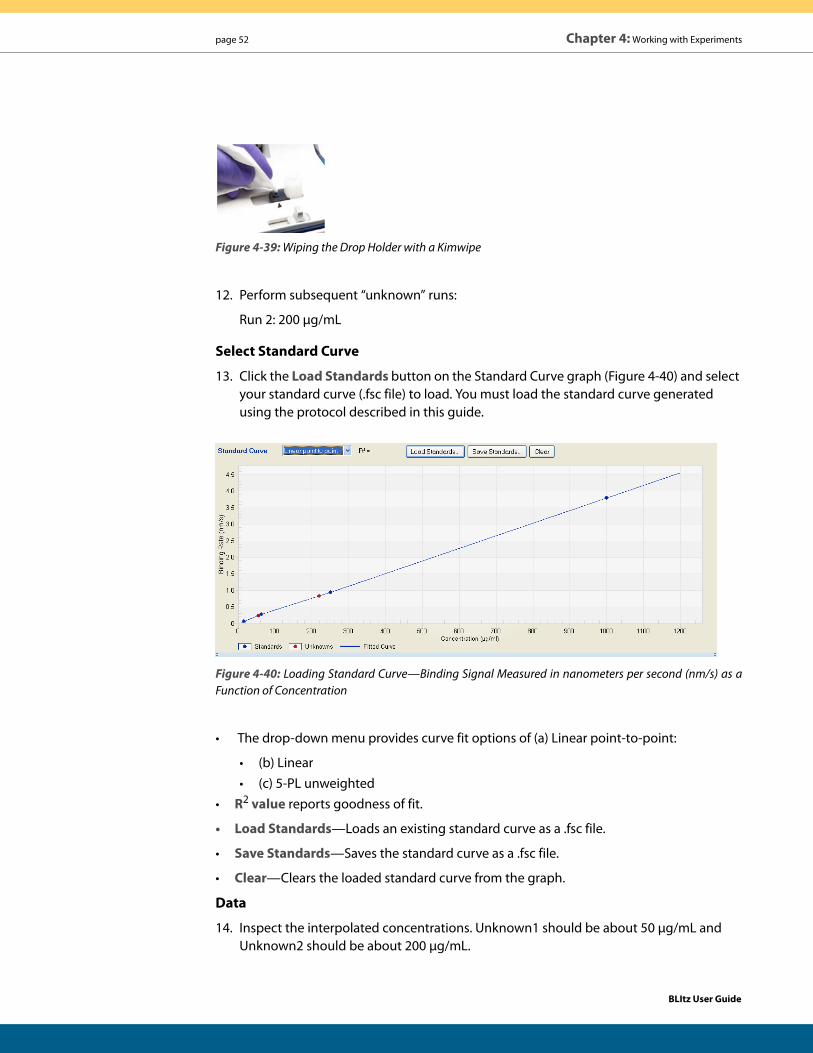
11. Lift the cover, discard the used biosensor, wipe the drop holder with a swab or Kimwipe (Figure 4-39), and rinse 3X with sample diluent—wiping each time with a swab or Kim-wipe.
BLItz User Guide
page 52 Chapter 4: Working with Experiments
Figure 4-39: Wiping the Drop Holder with a Kimwipe
12. Perform subsequent “unknown” runs:
Run 2: 200 μg/mL
Select Standard Curve
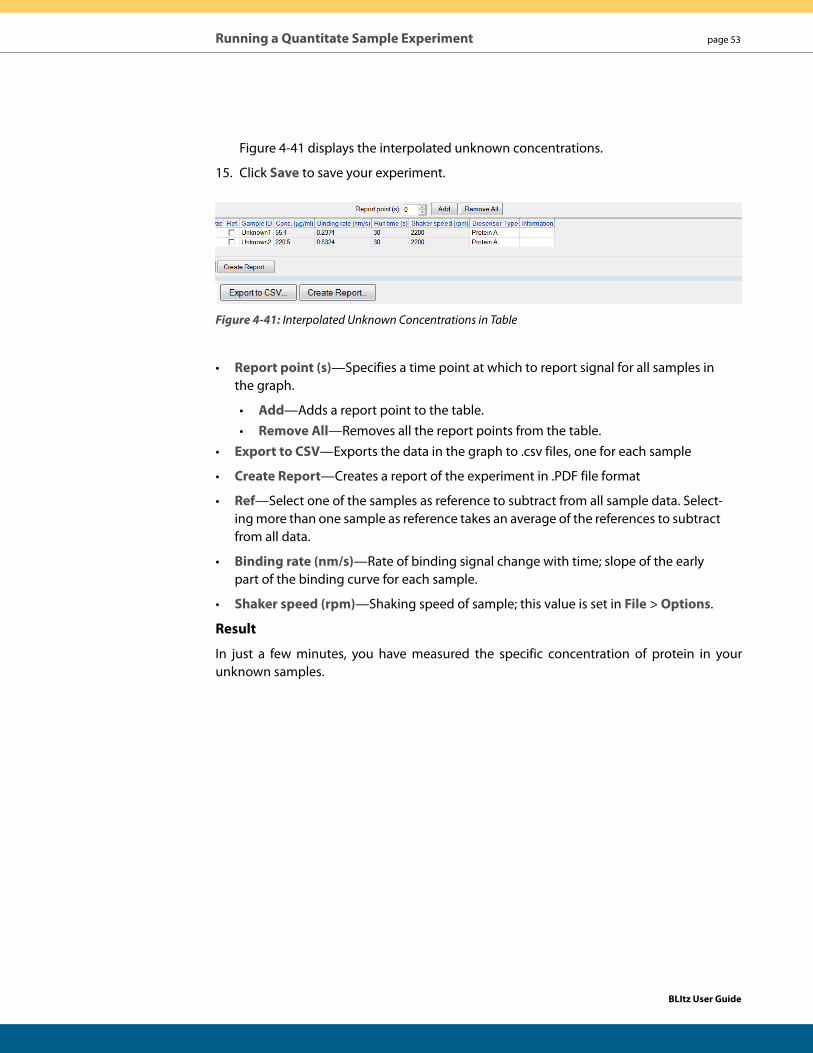
13. Click the Load Standards button on the Standard Curve graph (Figure 4-40) and select your standard curve (.fsc file) to load. You must load the standard curve generated using the protocol described in this guide.
Figure 4-40: Loading Standard Curve—Binding Signal Measured in nanometers per second (nm/s) as a Function of Concentration
• The drop-down menu provides curve fit options of (a) Linear point-to-point:
• (b) Linear• (c) 5-PL unweighted
• R2 value reports goodness of fit.
• Load Standards—Loads an existing standard curve as a .fsc file.
• Save Standards—Saves the standard curve as a .fsc file.
• Clear—Clears the loaded standard curve from the graph.
Data
14. Inspect the interpolated concentrations. Unknown1 should be about 50 μg/mL and Unknown2 should be about 200 μg/mL.
BLItz User Guide
Running a Quantitate Sample Experiment page 53
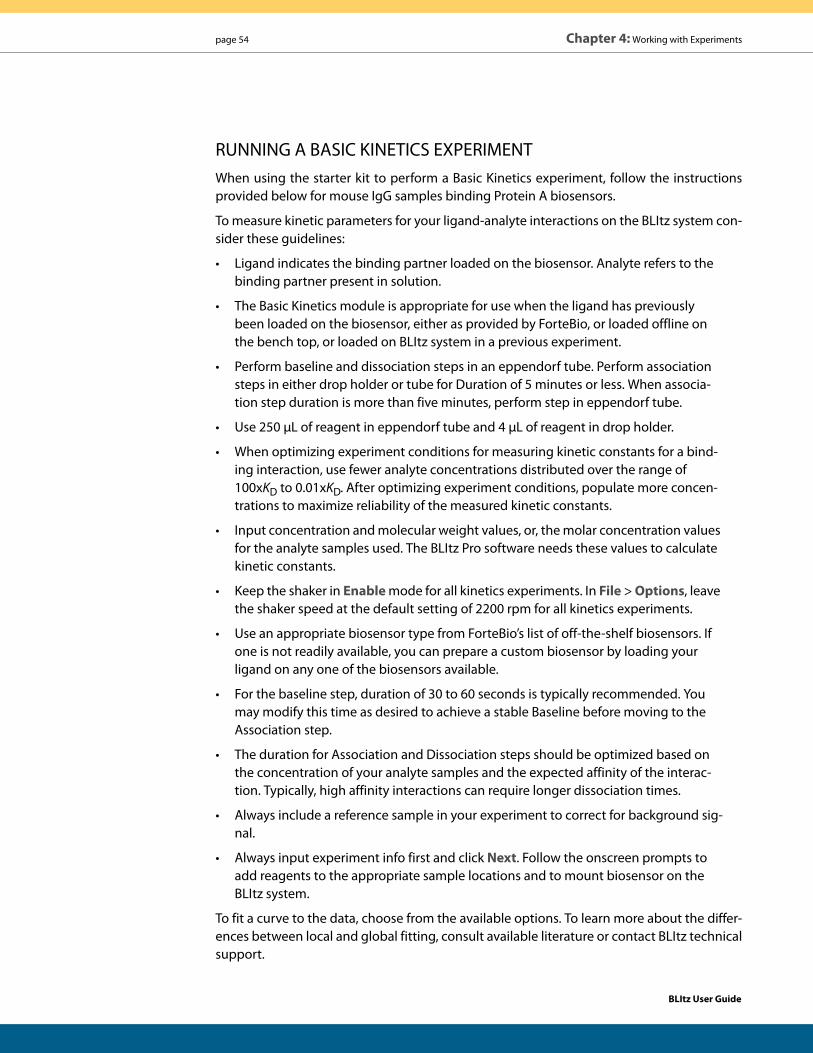
Figure 4-41 displays the interpolated unknown concentrations.
15. Click Save to save your experiment.
Figure 4-41: Interpolated Unknown Concentrations in Table
• Report point (s)—Specifies a time point at which to report signal for all samples in the graph.
• Add—Adds a report point to the table. • Remove All—Removes all the report points from the table.
• Export to CSV—Exports the data in the graph to .csv files, one for each sample
• Create Report—Creates a report of the experiment in .PDF file format
• Ref—Select one of the samples as reference to subtract from all sample data. Select-ing more than one sample as reference takes an average of the references to subtract from all data.
• Binding rate (nm/s)—Rate of binding signal change with time; slope of the early part of the binding curve for each sample.
• Shaker speed (rpm)—Shaking speed of sample; this value is set in File > Options.
Result
In just a few minutes, you have measured the specific concentration of protein in your unknown samples.
BLItz User Guide
page 54 Chapter 4: Working with Experiments
RUNNING A BASIC KINETICS EXPERIMENTWhen using the starter kit to perform a Basic Kinetics experiment, follow the instructions provided below for mouse IgG samples binding Protein A biosensors.
To measure kinetic parameters for your ligand-analyte interactions on the BLItz system con-sider these guidelines:
• Ligand indicates the binding partner loaded on the biosensor. Analyte refers to the binding partner present in solution.
• The Basic Kinetics module is appropriate for use when the ligand has previously been loaded on the biosensor, either as provided by ForteBio, or loaded offline on the bench top, or loaded on BLItz system in a previous experiment.
• Perform baseline and dissociation steps in an eppendorf tube. Perform association steps in either drop holder or tube for Duration of 5 minutes or less. When associa-tion step duration is more than five minutes, perform step in eppendorf tube.
• Use 250 μL of reagent in eppendorf tube and 4 μL of reagent in drop holder.
• When optimizing experiment conditions for measuring kinetic constants for a bind-ing interaction, use fewer analyte concentrations distributed over the range of 100xKD to 0.01xKD. After optimizing experiment conditions, populate more concen-trations to maximize reliability of the measured kinetic constants.
• Input concentration and molecular weight values, or, the molar concentration values for the analyte samples used. The BLItz Pro software needs these values to calculate kinetic constants.
• Keep the shaker in Enable mode for all kinetics experiments. In File > Options, leave the shaker speed at the default setting of 2200 rpm for all kinetics experiments.
• Use an appropriate biosensor type from ForteBio’s list of off-the-shelf biosensors. If one is not readily available, you can prepare a custom biosensor by loading your ligand on any one of the biosensors available.
• For the baseline step, duration of 30 to 60 seconds is typically recommended. You may modify this time as desired to achieve a stable Baseline before moving to the Association step.
• The duration for Association and Dissociation steps should be optimized based on the concentration of your analyte samples and the expected affinity of the interac-tion. Typically, high affinity interactions can require longer dissociation times.
• Always include a reference sample in your experiment to correct for background sig-nal.
• Always input experiment info first and click Next. Follow the onscreen prompts to add reagents to the appropriate sample locations and to mount biosensor on the BLItz system.
To fit a curve to the data, choose from the available options. To learn more about the differ-ences between local and global fitting, consult available literature or contact BLItz technical support.
BLItz User Guide
Running a Basic Kinetics Experiment page 55
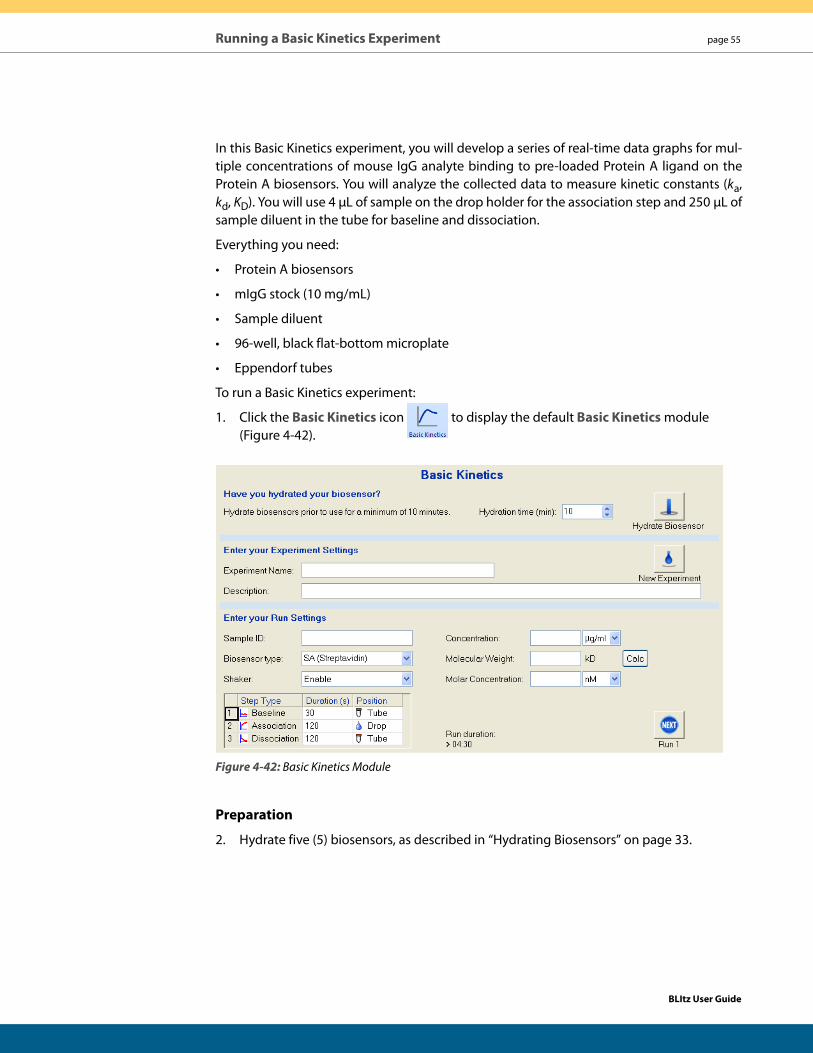
In this Basic Kinetics experiment, you will develop a series of real-time data graphs for mul-tiple concentrations of mouse IgG analyte binding to pre-loaded Protein A ligand on the Protein A biosensors. You will analyze the collected data to measure kinetic constants (ka, kd, KD). You will use 4 μL of sample on the drop holder for the association step and 250 μL of sample diluent in the tube for baseline and dissociation.
Everything you need:
• Protein A biosensors
• mIgG stock (10 mg/mL)
• Sample diluent
• 96-well, black flat-bottom microplate
• Eppendorf tubes
To run a Basic Kinetics experiment:
1. Click the Basic Kinetics icon to display the default Basic Kinetics module (Figure 4-42).
Figure 4-42: Basic Kinetics Module
Preparation
2. Hydrate five (5) biosensors, as described in “Hydrating Biosensors” on page 33.
BLItz User Guide
page 56 Chapter 4: Working with Experiments
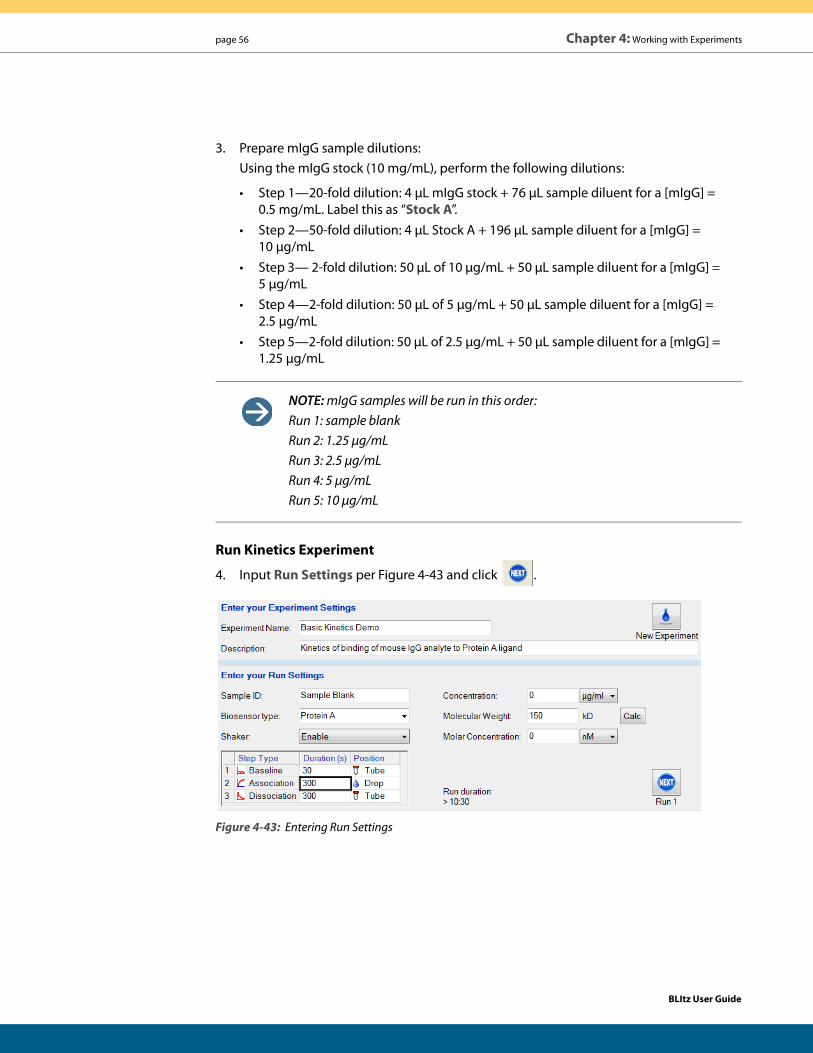
3. Prepare mIgG sample dilutions:Using the mIgG stock (10 mg/mL), perform the following dilutions:
• Step 1—20-fold dilution: 4 μL mIgG stock + 76 μL sample diluent for a [mIgG] = 0.5 mg/mL. Label this as “Stock A”.
• Step 2—50-fold dilution: 4 μL Stock A + 196 μL sample diluent for a [mIgG] = 10 μg/mL
• Step 3— 2-fold dilution: 50 μL of 10 μg/mL + 50 μL sample diluent for a [mIgG] = 5 μg/mL
• Step 4—2-fold dilution: 50 μL of 5 μg/mL + 50 μL sample diluent for a [mIgG] = 2.5 μg/mL
• Step 5—2-fold dilution: 50 μL of 2.5 μg/mL + 50 μL sample diluent for a [mIgG] = 1.25 μg/mL
NOTE: mIgG samples will be run in this order: Run 1: sample blank Run 2: 1.25 μg/mL Run 3: 2.5 μg/mL Run 4: 5 μg/mL Run 5: 10 μg/mL
Run Kinetics Experiment
4. Input Run Settings per Figure 4-43 and click .
Figure 4-43: Entering Run Settings
BLItz User Guide
Running a Basic Kinetics Experiment page 57
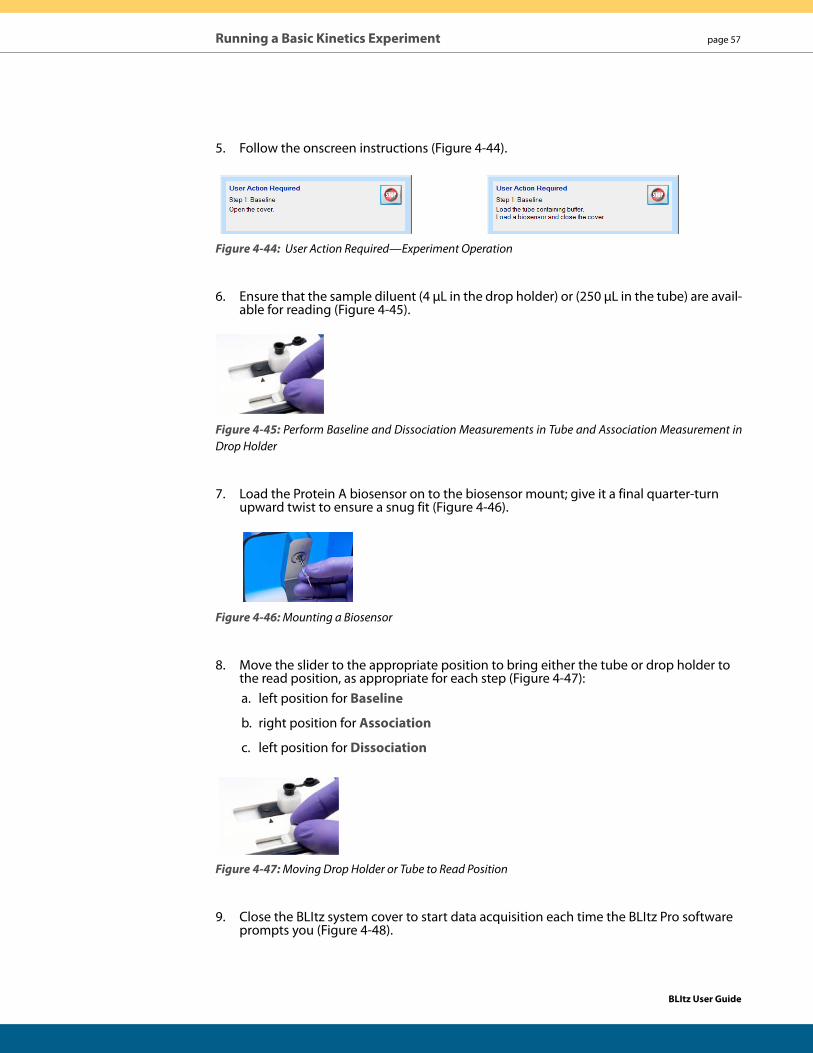
5. Follow the onscreen instructions (Figure 4-44).
Figure 4-44: User Action Required—Experiment Operation
6. Ensure that the sample diluent (4 μL in the drop holder) or (250 μL in the tube) are avail-able for reading (Figure 4-45).
Figure 4-45: Perform Baseline and Dissociation Measurements in Tube and Association Measurement in Drop Holder
7. Load the Protein A biosensor on to the biosensor mount; give it a final quarter-turn upward twist to ensure a snug fit (Figure 4-46).
Figure 4-46: Mounting a Biosensor
8. Move the slider to the appropriate position to bring either the tube or drop holder to the read position, as appropriate for each step (Figure 4-47):a. left position for Baseline
b. right position for Association
c. left position for Dissociation
Figure 4-47: Moving Drop Holder or Tube to Read Position
9. Close the BLItz system cover to start data acquisition each time the BLItz Pro software prompts you (Figure 4-48).
BLItz User Guide
page 58 Chapter 4: Working with Experiments
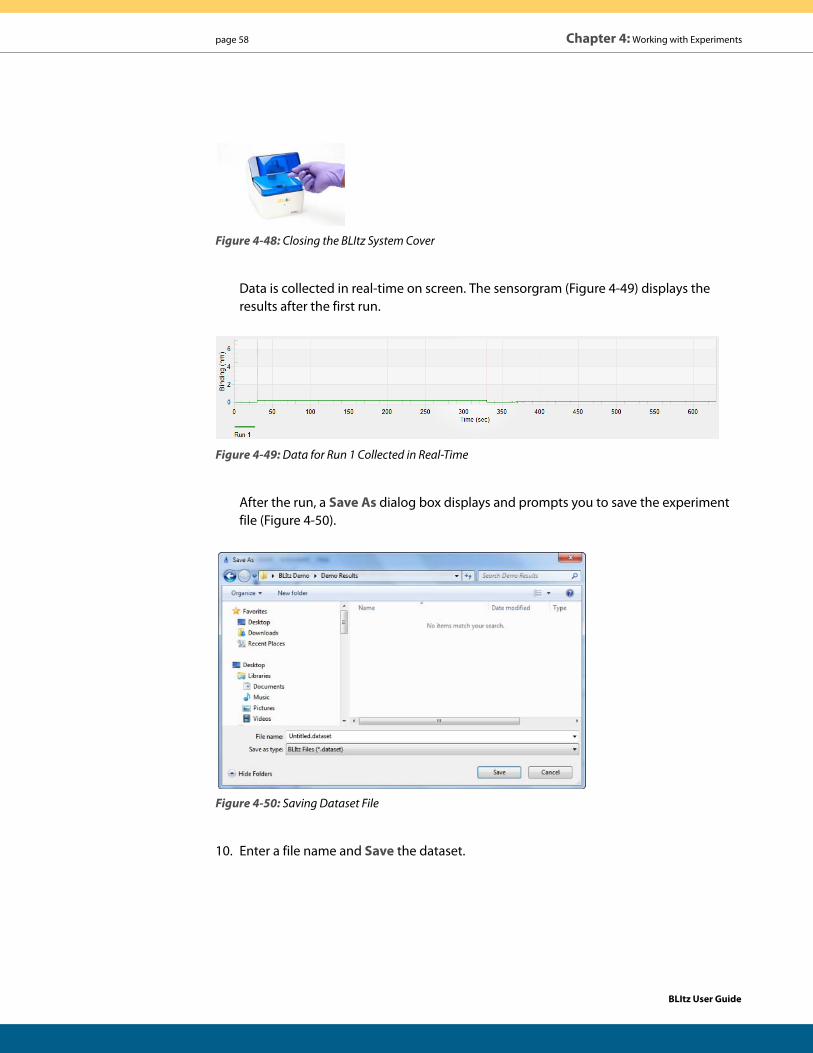
Figure 4-48: Closing the BLItz System Cover
Data is collected in real-time on screen. The sensorgram (Figure 4-49) displays the results after the first run.
Figure 4-49: Data for Run 1 Collected in Real-Time
After the run, a Save As dialog box displays and prompts you to save the experiment file (Figure 4-50).
Figure 4-50: Saving Dataset File
10. Enter a file name and Save the dataset.
BLItz User Guide
Running a Basic Kinetics Experiment page 59
11. Lift the cover, discard the used biosensor, wipe the drop holder with a swab or Kimwipe (Figure 4-51), and rinse 3X with sample diluent—wiping each time with a swab or Kim-wipe.
Figure 4-51: Wiping the Drop Holder with a Kimwipe
12. Perform subsequent sample runs, repeating steps 4 to 11 for each concentration:Run 2: 1.25 μg/mL
Run 3: 2.5 μg/mL
Run 4: 5 μg/mL
Run 5: 10 μg/mL
Data
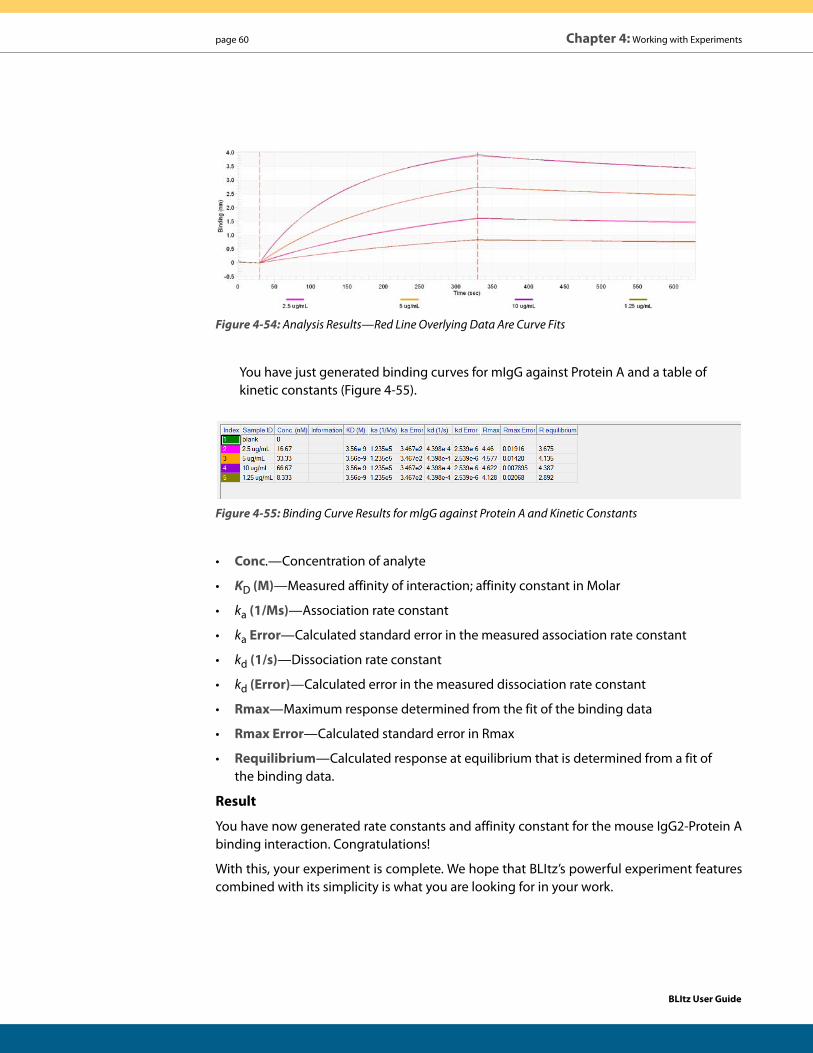
13. Observe the Run data and save. The sensorgram displays the results after five (5) runs (Figure 4-52).
Figure 4-52: Observing Run Data
14. Select the settings in Figure 4-53 and click Analyze to display the results in Figure 4-54.
Figure 4-53: Analysis Settings
The step correction feature corrects misalignment between two steps due to system arti-facts. The association step can be aligned to the dissociation step or to the baseline.
• Start of association—Moves the association step on the Y axis to align the begin-ning of the association step with the end of the adjacent baseline step.
• Start of dissociation—Moves the dissociation step on the Y axis to align the end of the adjacent association step with the beginning of the dissociation step.
BLItz User Guide
page 60 Chapter 4: Working with Experiments
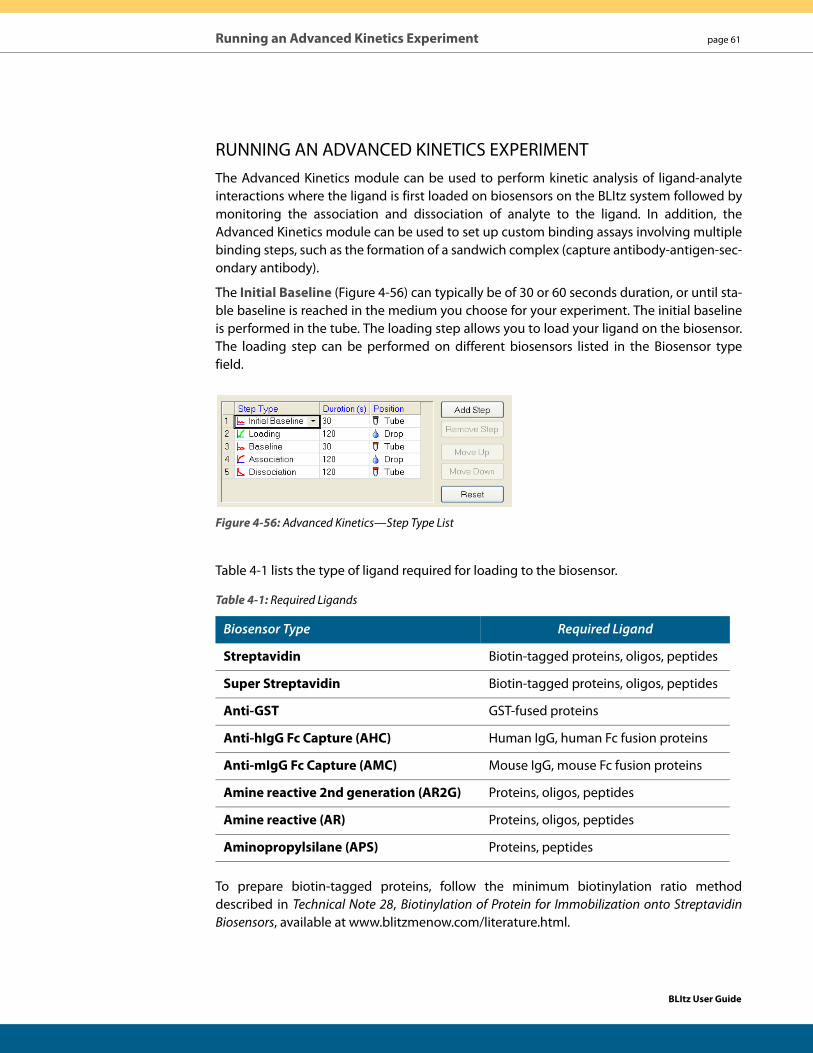
Figure 4-54: Analysis Results—Red Line Overlying Data Are Curve Fits
You have just generated binding curves for mIgG against Protein A and a table of kinetic constants (Figure 4-55).
Figure 4-55: Binding Curve Results for mlgG against Protein A and Kinetic Constants
• Conc.—Concentration of analyte
• KD (M)—Measured affinity of interaction; affinity constant in Molar
• ka (1/Ms)—Association rate constant
• ka Error—Calculated standard error in the measured association rate constant
• kd (1/s)—Dissociation rate constant
• kd (Error)—Calculated error in the measured dissociation rate constant
• Rmax—Maximum response determined from the fit of the binding data
• Rmax Error—Calculated standard error in Rmax
• Requilibrium—Calculated response at equilibrium that is determined from a fit of the binding data.
Result
You have now generated rate constants and affinity constant for the mouse IgG2-Protein A binding interaction. Congratulations!
With this, your experiment is complete. We hope that BLItz’s powerful experiment features combined with its simplicity is what you are looking for in your work.
BLItz User Guide
Running an Advanced Kinetics Experiment page 61
RUNNING AN ADVANCED KINETICS EXPERIMENTThe Advanced Kinetics module can be used to perform kinetic analysis of ligand-analyte interactions where the ligand is first loaded on biosensors on the BLItz system followed by monitoring the association and dissociation of analyte to the ligand. In addition, the Advanced Kinetics module can be used to set up custom binding assays involving multiple binding steps, such as the formation of a sandwich complex (capture antibody-antigen-sec-ondary antibody).
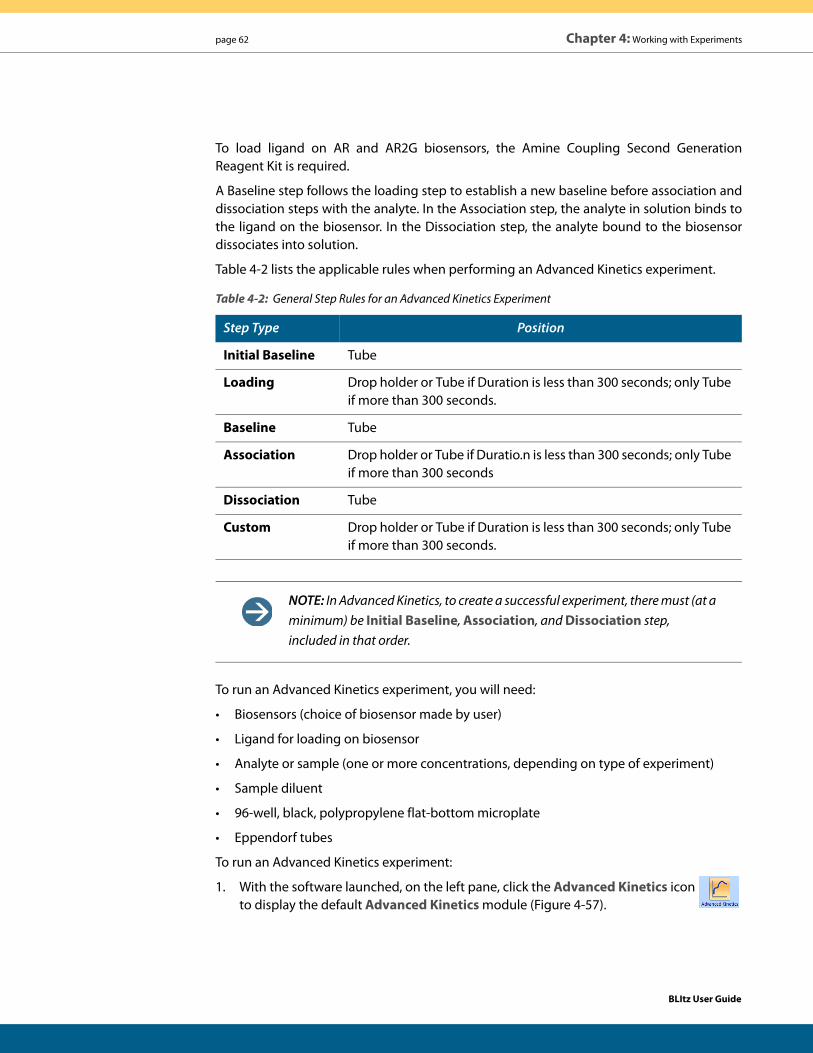
The Initial Baseline (Figure 4-56) can typically be of 30 or 60 seconds duration, or until sta-ble baseline is reached in the medium you choose for your experiment. The initial baseline is performed in the tube. The loading step allows you to load your ligand on the biosensor. The loading step can be performed on different biosensors listed in the Biosensor type field.
Figure 4-56: Advanced Kinetics—Step Type List
Table 4-1 lists the type of ligand required for loading to the biosensor.
To prepare biotin-tagged proteins, follow the minimum biotinylation ratio method described in Technical Note 28, Biotinylation of Protein for Immobilization onto Streptavidin Biosensors, available at www.blitzmenow.com/literature.html.
Table 4-1: Required Ligands
Biosensor Type Required Ligand
Streptavidin Biotin-tagged proteins, oligos, peptides
Super Streptavidin Biotin-tagged proteins, oligos, peptides
Anti-GST GST-fused proteins
Anti-hIgG Fc Capture (AHC) Human IgG, human Fc fusion proteins
Anti-mIgG Fc Capture (AMC) Mouse IgG, mouse Fc fusion proteins
Amine reactive 2nd generation (AR2G) Proteins, oligos, peptides
Amine reactive (AR) Proteins, oligos, peptides
Aminopropylsilane (APS) Proteins, peptides
BLItz User Guide
page 62 Chapter 4: Working with Experiments
To load ligand on AR and AR2G biosensors, the Amine Coupling Second Generation Reagent Kit is required.
A Baseline step follows the loading step to establish a new baseline before association and dissociation steps with the analyte. In the Association step, the analyte in solution binds to the ligand on the biosensor. In the Dissociation step, the analyte bound to the biosensor dissociates into solution.
Table 4-2 lists the applicable rules when performing an Advanced Kinetics experiment.
NOTE: In Advanced Kinetics, to create a successful experiment, there must (at a minimum) be Initial Baseline, Association, and Dissociation step, included in that order.
To run an Advanced Kinetics experiment, you will need:
• Biosensors (choice of biosensor made by user)
• Ligand for loading on biosensor
• Analyte or sample (one or more concentrations, depending on type of experiment)
• Sample diluent
• 96-well, black, polypropylene flat-bottom microplate
• Eppendorf tubes
To run an Advanced Kinetics experiment:
1. With the software launched, on the left pane, click the Advanced Kinetics icon to display the default Advanced Kinetics module (Figure 4-57).
Table 4-2: General Step Rules for an Advanced Kinetics Experiment
Step Type Position
Initial Baseline Tube
Loading Drop holder or Tube if Duration is less than 300 seconds; only Tube if more than 300 seconds.
Baseline Tube
Association Drop holder or Tube if Duratio.n is less than 300 seconds; only Tube if more than 300 seconds
Dissociation Tube
Custom Drop holder or Tube if Duration is less than 300 seconds; only Tube if more than 300 seconds.
BLItz User Guide
Running an Advanced Kinetics Experiment page 63
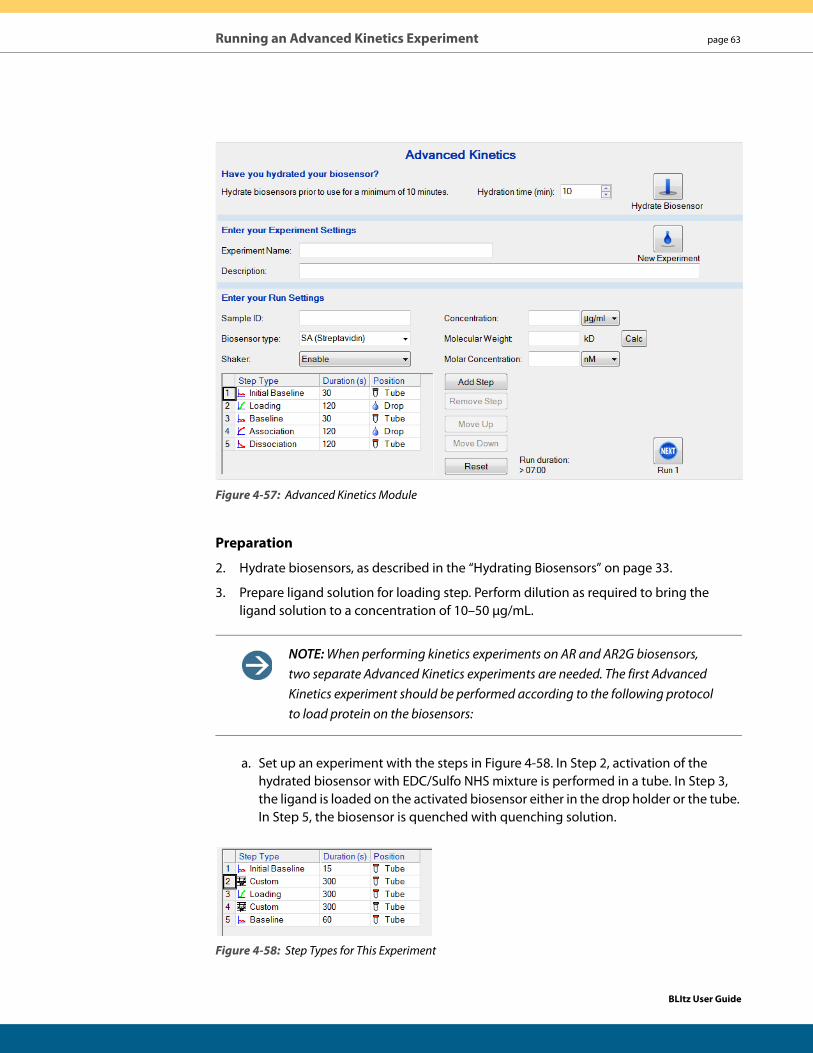
Figure 4-57: Advanced Kinetics Module
Preparation
2. Hydrate biosensors, as described in the “Hydrating Biosensors” on page 33.
3. Prepare ligand solution for loading step. Perform dilution as required to bring the ligand solution to a concentration of 10–50 μg/mL.
NOTE: When performing kinetics experiments on AR and AR2G biosensors, two separate Advanced Kinetics experiments are needed. The first Advanced Kinetics experiment should be performed according to the following protocol to load protein on the biosensors:
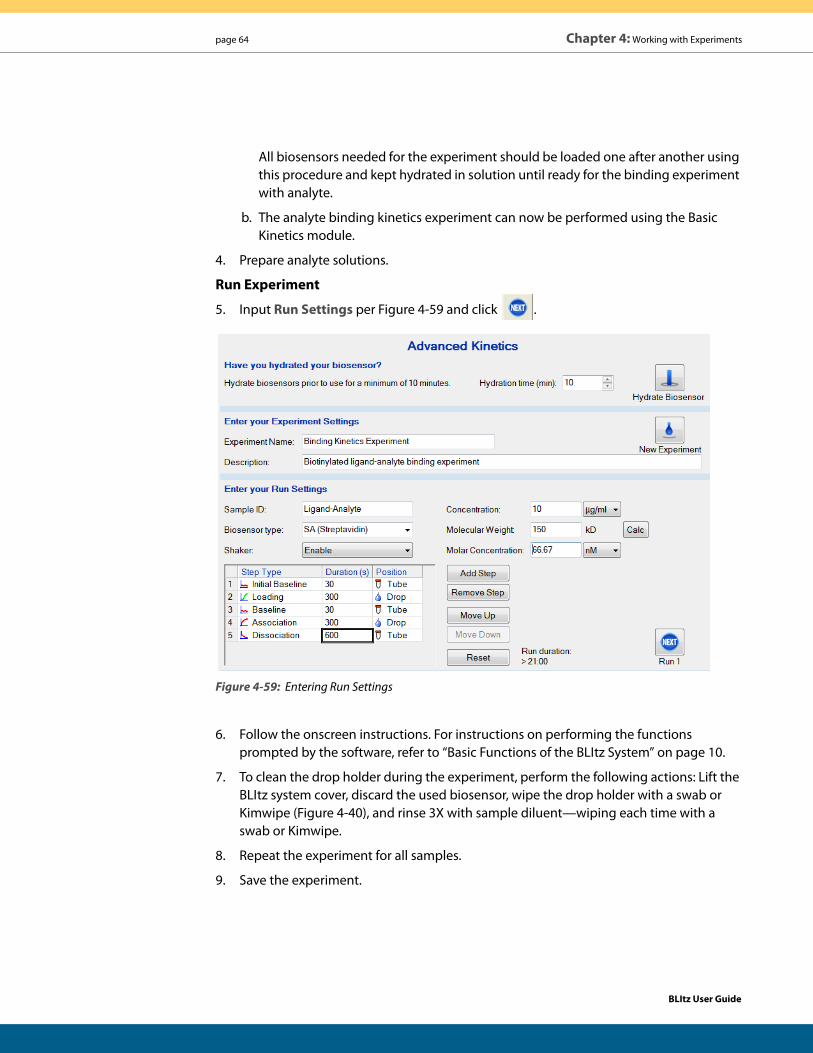
a. Set up an experiment with the steps in Figure 4-58. In Step 2, activation of the hydrated biosensor with EDC/Sulfo NHS mixture is performed in a tube. In Step 3, the ligand is loaded on the activated biosensor either in the drop holder or the tube. In Step 5, the biosensor is quenched with quenching solution.
Figure 4-58: Step Types for This Experiment
BLItz User Guide
page 64 Chapter 4: Working with Experiments
All biosensors needed for the experiment should be loaded one after another using this procedure and kept hydrated in solution until ready for the binding experiment with analyte.
b. The analyte binding kinetics experiment can now be performed using the Basic Kinetics module.
4. Prepare analyte solutions.
Run Experiment
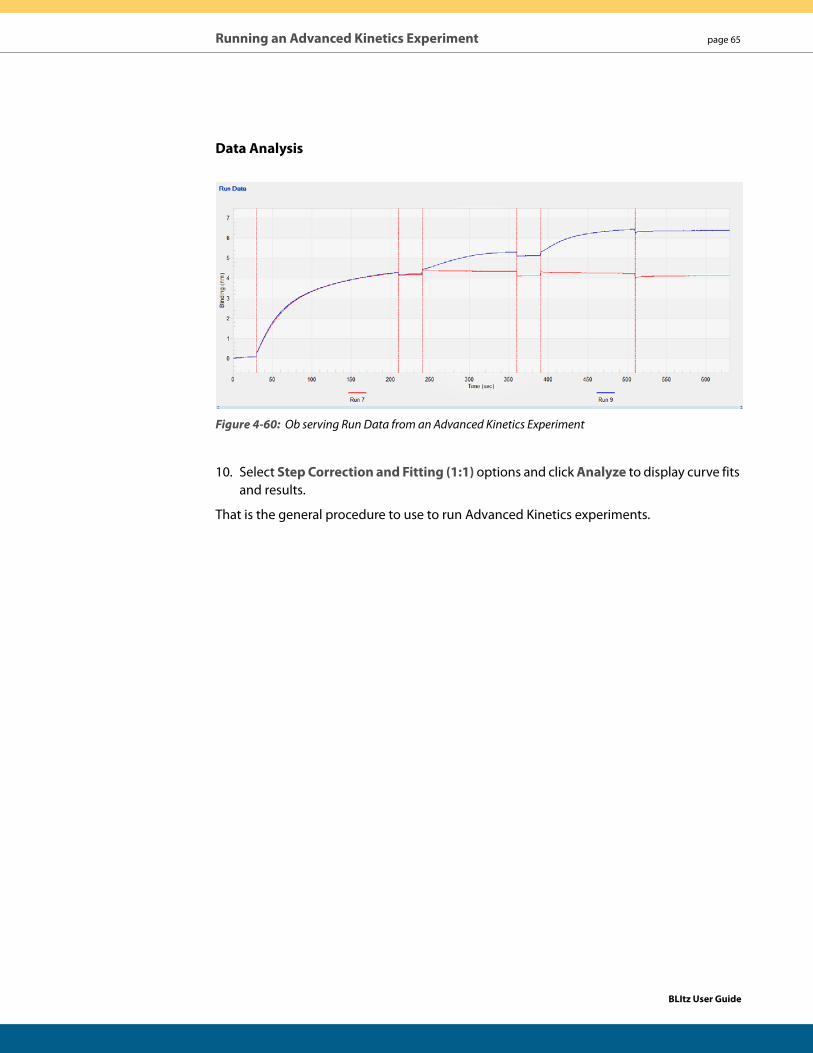
5. Input Run Settings per Figure 4-59 and click .
Figure 4-59: Entering Run Settings
6. Follow the onscreen instructions. For instructions on performing the functions prompted by the software, refer to “Basic Functions of the BLItz System” on page 10.
7. To clean the drop holder during the experiment, perform the following actions: Lift the BLItz system cover, discard the used biosensor, wipe the drop holder with a swab or Kimwipe (Figure 4-40), and rinse 3X with sample diluent—wiping each time with a swab or Kimwipe.
8. Repeat the experiment for all samples.
9. Save the experiment.
BLItz User Guide
Running an Advanced Kinetics Experiment page 65
Data Analysis
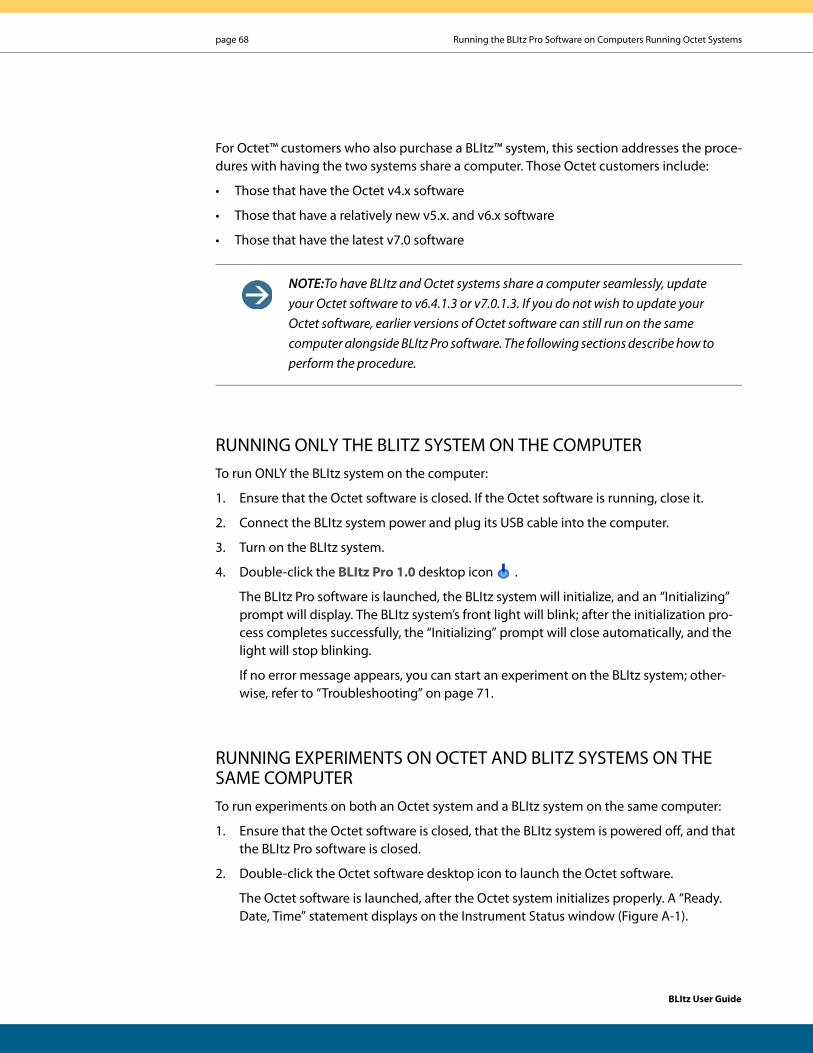
Figure 4-60: Ob serving Run Data from an Advanced Kinetics Experiment
10. Select Step Correction and Fitting (1:1) options and click Analyze to display curve fits and results.
That is the general procedure to use to run Advanced Kinetics experiments.
BLItz User Guide

page 66 Chapter 4: Working with Experiments
BLItz User Guide

page 67
APPENDIX A: Running the BLItz Pro Software on Computers Running Octet SystemsRunning Only the BLItz System on the Computer . . . . . . . . . . . . . . . . . . . . . . . . . . . . . . . . . . . . . . 68
Running Experiments on Octet and BLItz Systems on the Same Computer . . . . . . . . . . . . . . 68
BLItz User Guide
page 68 Running the BLItz Pro Software on Computers Running Octet Systems
For Octet™ customers who also purchase a BLItz™ system, this section addresses the proce-dures with having the two systems share a computer. Those Octet customers include:
• Those that have the Octet v4.x software
• Those that have a relatively new v5.x. and v6.x software
• Those that have the latest v7.0 software
NOTE:To have BLItz and Octet systems share a computer seamlessly, update your Octet software to v6.4.1.3 or v7.0.1.3. If you do not wish to update your Octet software, earlier versions of Octet software can still run on the same computer alongside BLItz Pro software. The following sections describe how to perform the procedure.
RUNNING ONLY THE BLITZ SYSTEM ON THE COMPUTERTo run ONLY the BLItz system on the computer:
1. Ensure that the Octet software is closed. If the Octet software is running, close it.
2. Connect the BLItz system power and plug its USB cable into the computer.
3. Turn on the BLItz system.
4. Double-click the BLItz Pro 1.0 desktop icon .
The BLItz Pro software is launched, the BLItz system will initialize, and an “Initializing” prompt will display. The BLItz system’s front light will blink; after the initialization pro-cess completes successfully, the “Initializing” prompt will close automatically, and the light will stop blinking.
If no error message appears, you can start an experiment on the BLItz system; other-wise, refer to “Troubleshooting” on page 71.
RUNNING EXPERIMENTS ON OCTET AND BLITZ SYSTEMS ON THE SAME COMPUTERTo run experiments on both an Octet system and a BLItz system on the same computer:
1. Ensure that the Octet software is closed, that the BLItz system is powered off, and that the BLItz Pro software is closed.
2. Double-click the Octet software desktop icon to launch the Octet software.
The Octet software is launched, after the Octet system initializes properly. A “Ready. Date, Time” statement displays on the Instrument Status window (Figure A-1).
BLItz User Guide
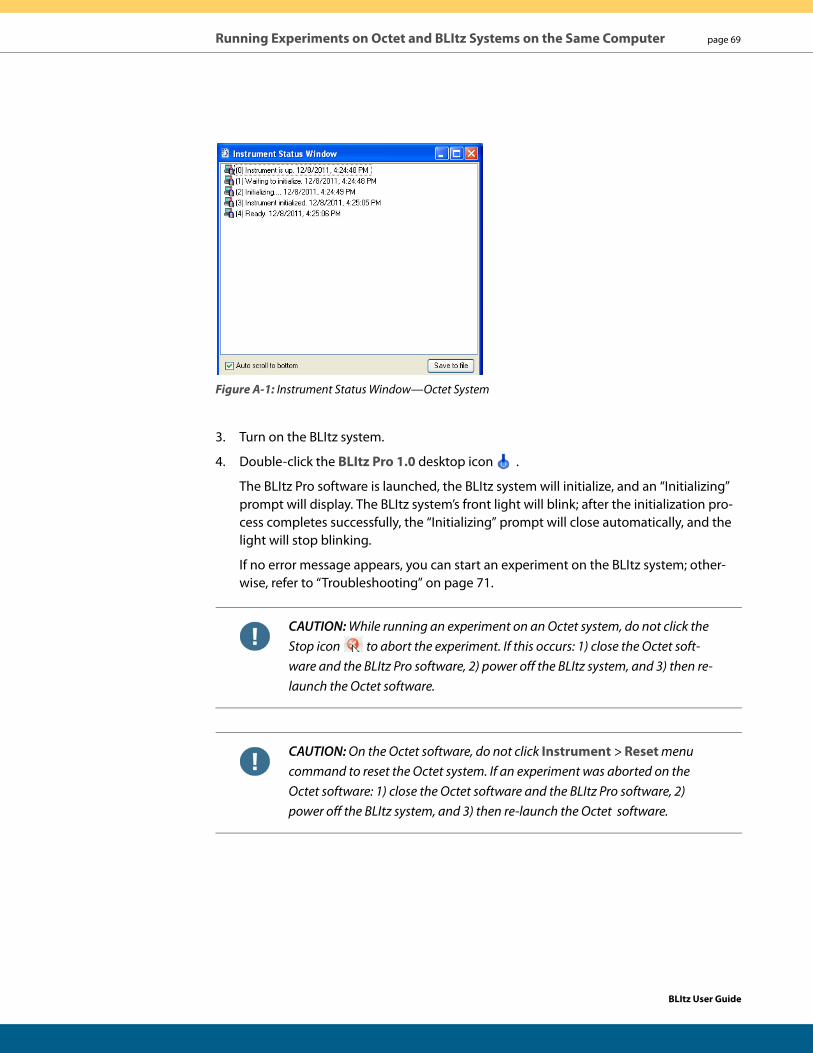
Running Experiments on Octet and BLItz Systems on the Same Computer page 69
Figure A-1: Instrument Status Window—Octet System
3. Turn on the BLItz system.
4. Double-click the BLItz Pro 1.0 desktop icon .
The BLItz Pro software is launched, the BLItz system will initialize, and an “Initializing” prompt will display. The BLItz system’s front light will blink; after the initialization pro-cess completes successfully, the “Initializing” prompt will close automatically, and the light will stop blinking.
If no error message appears, you can start an experiment on the BLItz system; other-wise, refer to “Troubleshooting” on page 71.
CAUTION: While running an experiment on an Octet system, do not click the Stop icon to abort the experiment. If this occurs: 1) close the Octet soft-ware and the BLItz Pro software, 2) power off the BLItz system, and 3) then re-launch the Octet software.
CAUTION: On the Octet software, do not click Instrument > Reset menu command to reset the Octet system. If an experiment was aborted on the Octet software: 1) close the Octet software and the BLItz Pro software, 2) power off the BLItz system, and 3) then re-launch the Octet software.
BLItz User Guide

page 70 Running the BLItz Pro Software on Computers Running Octet Systems
BLItz User Guide
page 71
APPENDIX B: TroubleshootingTroubleshooting BLItz System Errors with an Octet System . . . . . . . . . . . . . . . . . . . . . . . . . . . . . 72
Scenario 1—The BLItz System Cannot Initialize Successfully . . . . . . . . . . . . . . . . . . . . . . . . 72
Scenario 2—The BLItz System Is Not Recognized . . . . . . . . . . . . . . . . . . . . . . . . . . . . . . . . . . 72
This appendix describes how to troubleshoot some scenarios of BLItz system errors.
BLItz User Guide
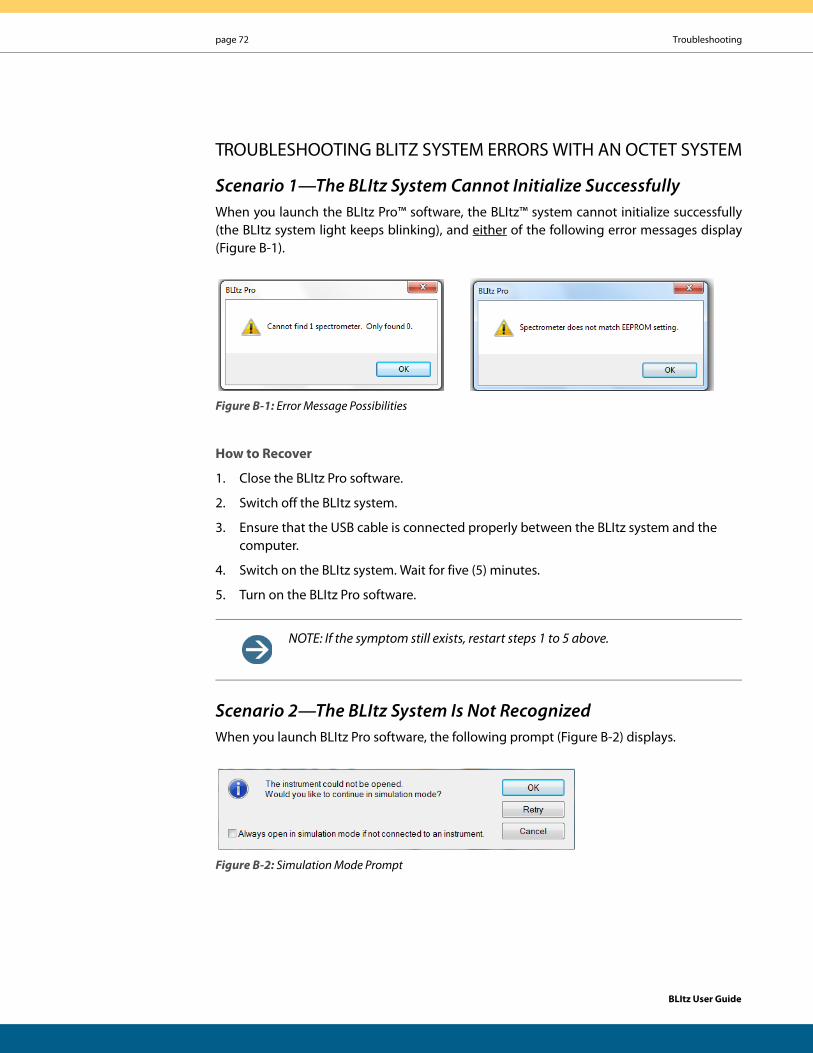
page 72 Troubleshooting
TROUBLESHOOTING BLITZ SYSTEM ERRORS WITH AN OCTET SYSTEM
Scenario 1—The BLItz System Cannot Initialize SuccessfullyWhen you launch the BLItz Pro™ software, the BLItz™ system cannot initialize successfully (the BLItz system light keeps blinking), and either of the following error messages display (Figure B-1).
Figure B-1: Error Message Possibilities
How to Recover
1. Close the BLItz Pro software.
2. Switch off the BLItz system.
3. Ensure that the USB cable is connected properly between the BLItz system and the computer.
4. Switch on the BLItz system. Wait for five (5) minutes.
5. Turn on the BLItz Pro software.
NOTE: If the symptom still exists, restart steps 1 to 5 above.
Scenario 2—The BLItz System Is Not RecognizedWhen you launch BLItz Pro software, the following prompt (Figure B-2) displays.
Figure B-2: Simulation Mode Prompt
BLItz User Guide
Troubleshooting BLItz System Errors with an Octet System page 73
How to Recover
1. Close the BLItz Pro software.
2. Ensure that the BLItz system is powered on (the light is on) and that the power and USB cable are properly connected to the BLItz system and computer.
3. Re-launch the BLItz Pro software until the system initialization completes successfully (no error message displays).
BLItz User Guide

page 74 Troubleshooting
BLItz User Guide
page 1
Index
Numerics96-well, black, flat-bottom polypropylene 3
AAbout BLItz (menu) 27
accessories, part of the BLItz system kit 3
active method file, closing 22
Advanced Kinetics (menu) 26
Advanced Kinetics experiment, running 62
Advanced Kinetics icon 62
Aminopropylsilane (APS) biosensor type 14
analytes measured, biosensor types 13
Anti-GST (GST) biosensor type 14
Anti-hIgG-Fc biosensor type 13
Anti-hlgG-Fc Capture (AHC) biosensor type 14
Anti-mIgG-Fc biosensor type 13
Anti-mlgG-Fc Capture (AMC) biosensor type 14
Anti-Penta-HIS (HIS) biosensor type 13
Association
described 29
icon (figure) 29
BBaseline
described 29
icon (figure) 29
basic functions of the BLItz system 10
Basic Kinetics (menu) 25
Basic Kinetics experiment, running 55
Basic Kinetics icon 55
binding assays 12
Binding rate (nm/s) menu 40
Biosensor Type, specification for the BLItz system 9
biosensor types
Amine Reactive (AR2G) Amine Reactive (AR2G) biosensor type 14
Aminopropylsilane (APS) 14
analytes measured, listed 13
Anti-GST (GST) 14
Anti-hIgG-Fc 13
Anti-hlgG-Fc Capture (AHC) 14
Anti-mIgG-Fc 13
Anti-mlgG-Fc Capture (AMC) 14
Anti-Penta-HIS (HIS) 13
listed (table) 13
Protein A 13
Protein G 13
Protein L 13
BLItz User Guide
page 2
required capture molecules, listed 13
Streptavidin (SA) 14
biosensors, hydrating 33
BLI (bio-layer interferometry) technology 15
BLItz driver, installing 18
BLItz Pro 1.0
described— 28
icon (figure) 28
BLItz Pro software
closing 24
configuring 18
displaying properties and license information 27
installing 18
installing on Octet instruments 68
launching 19
Main Menu bar 21
Title bar 21
toolbars 21
uninstalling 30
BLItz Pro Welcome screen (figure) 32
BLItz support options
described 5
technical support 5
BLItz system
basic functions 10
Biosensor Type specification 9
configuring 18
installing 18
package contents, listed (figure) 2
resetting 26
running only on the computer 68
specifications
Capabilities 8
Compliance 8
Connections 9
Dimensions 9
Electrical Requirements 9
Environmental 8
Equipment Classifications 8
Mechanics 9
Optics 9
Sample Types specification 9
Sampling Format 8
Sampling volume specification 9
Shake Rate 9
Software 9
Weight 9
starter kit contents
materials required 3
starter kit contents, accessories 3
system options, viewing 23
BLItz User Guide
page 3
BLItz system components, front and back (figure) 8
BLItz Web Site (menu) 27
BLItzInstallCD.exe file 18
CCapabilities, specification for the BLItz
system 8
Close Method File (menu) 22
closing
active method file 22
software 24
Compliance, specification for the BLItz system 8
configuring
BLItz Pro software 18
BLItz system 18
connecting
one side of the BLItz system to a USB port on your computer 18, 19
one side of the data cord to the BLItz system 18, 19
power cord to the BLItz system 18
Connections, specification for the BLItz system 9
contacting ForteBio technical support 5
Convert to Create Standard Curve (menu) 26
Convert to Quantitate Sample (menu) 26
Create Report (menu) 22
Create Report menu 40
Create Standard Curve (menu) 25
Create Standard Curve icon 42
Creating a Standard Curve experiment, running 42
Ddata display, significant digits 23
destructive interference 15
Dimensions, specification for the BLItz system 9
Dip and Read biosensors 13
Dip and Read label-free assays 12
displaying
BLItz software properties 27
license information 27
Dissociation
described 29
icon (figure) 29
Drop Holder
described 28
icon (figure) 28
BLItz User Guide
page 4
EElectrical hazard symbol 4
Electrical Requirements, specification for the BLItz system 9
environmental features, of the BLItz system 8
Eppendorf tubes 3
Equipment Classifications specification, for the BLItz system 8
Exit (menu) 24
Experiment menu
described 25
figure 25
list of menu commands 25
experiment method files, saving 22
experiments, setting up 10
Export to CSV menu 40
FFile menu
commands, listed (table) 22
described 22
ForteBio technical support, contacting 5
Fuse symbol 4
HHeat/hot symbol 4
Help menu
commands, listed (table) 27
described 27
figure 27
Hydrate Biosensor
described 28
icon (figure) 28
hydrating biosensors 33
Hydration Done icon (figure) 28
IInitial Baseline
described 28
icon (figure) 28
Install BLItz Driver (menu) 18
Install BLItz Pro Software (menu) 18
installing
BLItz driver 18
BLItz Pro software in your lab 18
BLItz Pro software on Octet instruments 68
BLItz system in your lab 18
Instrument menu
commands 26, 27
BLItz User Guide
page 5
commands, listed (table) 26
described 26
figure 26
Instrument Status window
figure 69
Instrument Status window, logging 26
Llaunching the BLItz Pro software 19
license information, displaying 27
lint-free lab wipe, wiping sample 10
load ligand on AR and AR2G biosensors 62
Load Standards button 52
Loading
described 28
icon (figure) 28
loading standard curve (figure) 52
logging in the Instrument Status window 26
MMain Menu bar
described 21
figure 21
materials required, part of the BLItz system starter kit 3
Mechanics, specification for the BLItz system 9
method files
closing 22
saving 22
minimum requirements, for laptop or computer 3
mounting a biosensor (figure) 11
NNew Experiment
described 28
icon (figure) 28
Next
described 28
icon (figure) 28
OOctet instruments, installing BLItz Pro
software 68
Open Method File (menu) 22
optical thickness 15
Optics, specification for the BLItz system 9
Options (menu) 23
BLItz User Guide
page 6
Ppipettors, used for the experiments 3
placing a drop of sample in the drop holder 10
plugging the BLItz system into an outlet 18
Protein A biosensor type 13
Protein G biosensor type 13
Protein L biosensor type 13
QQuantitate Sample (menu) 25
Quantitate Sample experiment, running 48
Quantitate Sample icon 48
Quick Yes/No (menu) 25
Quick Yes/No experiment, running 36
Quickstart Guide (menu) 27
RReady
described 28
status (figure) 28
Ref menu 40
removing sample drop holder (figure) 10
replacing sample drop holder (figure) 10
Report point (s) 40
required capture molecules, biosensor types 13
requirements, minimum, for laptop or computer 3
Reset (menu) 26
resetting BLItz system 26
running
Advanced Kinetics experiment 62
Basic Kinetics experiment 55
Creating a Standard Curve experiment 42
experiments on both an Octet system and a BLItz system on the same computer 68
only the BLItz system on the computer 68
Quantitate Sample experiment 48
Quick Yes/No experiment 36
Ssample drop holder, removing and
replacing 10
sample plate shaker, stopper 26
Sample Types specification, for the BLItz system 9
Sampling Format, specification for the BLItz system 8
Sampling Volume specification, BLItz system 9
BLItz User Guide
page 7
Save As dialog box 38
Save Method File (menu) 22
Save Method File As (menu) 22
saving experiment method files 22
setting up an experiment 10
Shake Rate, specification for the BLItz system 9
Shaker speed (rpm) menu 40
shifting position with slider 11
significant digits, data display 23
slider 11
Software, specification for the BLItz system 9
starter kit contents, listed 2
Status Bar
described 21
figure 21
Steptavidin (SA) biosensor type 14
Stop icon
described 28
Stop Shaker (menu) 26
stopping sample plate shaker 26
symbols
electrical hazard 4
fuse 4
heat/hot 4
used in this guide 4, 5
system options, viewing 23
Ttechnical support, contacting 5
Title bar
described 21
Title bar, BLItz Pro software 21
toolbars
available in the BLItz Pro software 21
troubleshooting BLItz system errors with an Octet system 71
Tube
described 28
icon (figure) 28
tubes, Eppendorf 3
Uuninstalling the BLItz Pro software 30
User Guide (menu) 27
Vviewing BLItz system options 23
BLItz User Guide

page 8
Wwavelength shift 15
weight, specification for the BLItz system 9
Welcome (menu) 25
wiping sample with Kimwipe (figure) 10
BLItz User Guide

page 9
BLItz User Guide

page 10
BLItz User Guide

page 11
BLItz User Guide

page 12
BLItz User Guide

page 13
BLItz User Guide

page 14
BLItz User Guide

page 15
BLItz User Guide

page 16 Chapter 1:
BLItz User Guide