Embed Size (px)
Citation preview

TM
Fortification’s Contribution to Meeting Dietary Nutrient Recommendations
Eric Hentges, PhD May 17, 2012

TM
Disclosure of interest
• Currently Executive Director of ILSI North America a non-profit research foundation with major funding from its industry members.
• Previously Executive Director of USDA’s Center for Nutrition Policy and Promotion

TM
Data Development • ILSI North America’s Fortification Committee
initiated and funded the development of data to be presented
• Data development and analysis conducted by Nutrition Impact, LLC
• Science Advisor-Johanna Dwyer, DSC, RD, Tufts University
• Gov’t Liaison- Regan Bailey, PhD, RD, NIH/ODS

TM
Background Americans are urged to meet nutrient needs through nutrient-dense food sources, while not exceeding energy needs.
However, the reality is that many individuals consume diets that are lower in one or more nutrients and higher in energy than recommended.

TM
Research Purpose
To determine total usual nutrient intakes of Americans from all sources, as well as to understand the specific nutrient contributions from:
– Enriched and fortified foods – Dietary supplements
TM
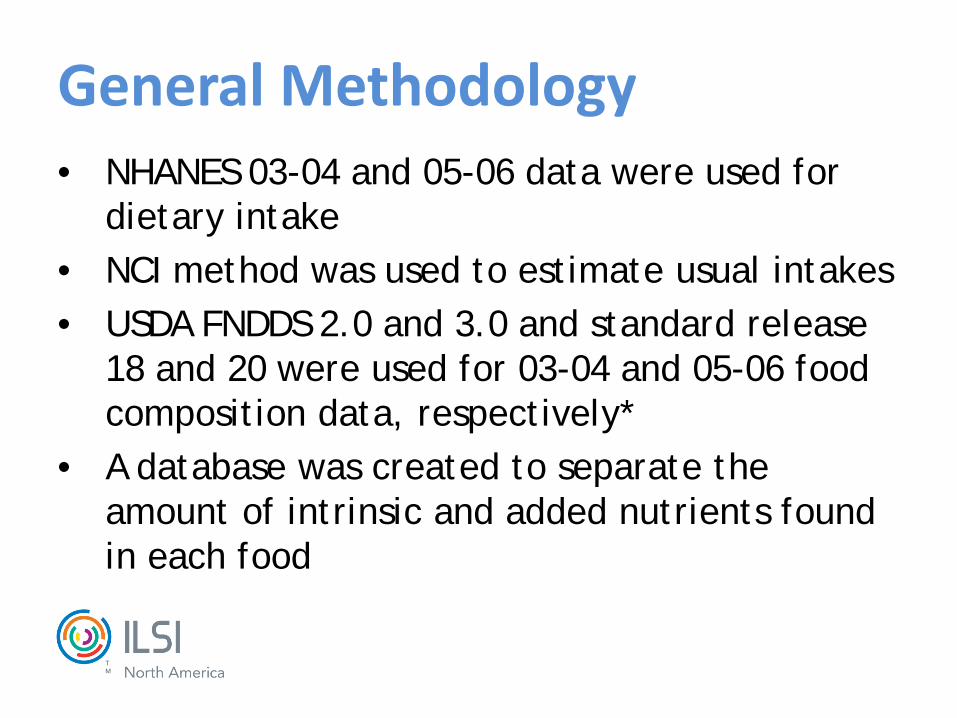
General Methodology • NHANES 03-04 and 05-06 data were used for
dietary intake • NCI method was used to estimate usual intakes • USDA FNDDS 2.0 and 3.0 and standard release
18 and 20 were used for 03-04 and 05-06 food composition data, respectively*
• A database was created to separate the amount of intrinsic and added nutrients found in each food

TM
• Nutrient intake from supplements was determined from the NHANES dietary supplement questionnaire
• Nutrient composition of supplements were determined using the NCHS dietary supplement database
• 19 micronutrients were examined
General Methodology
TM
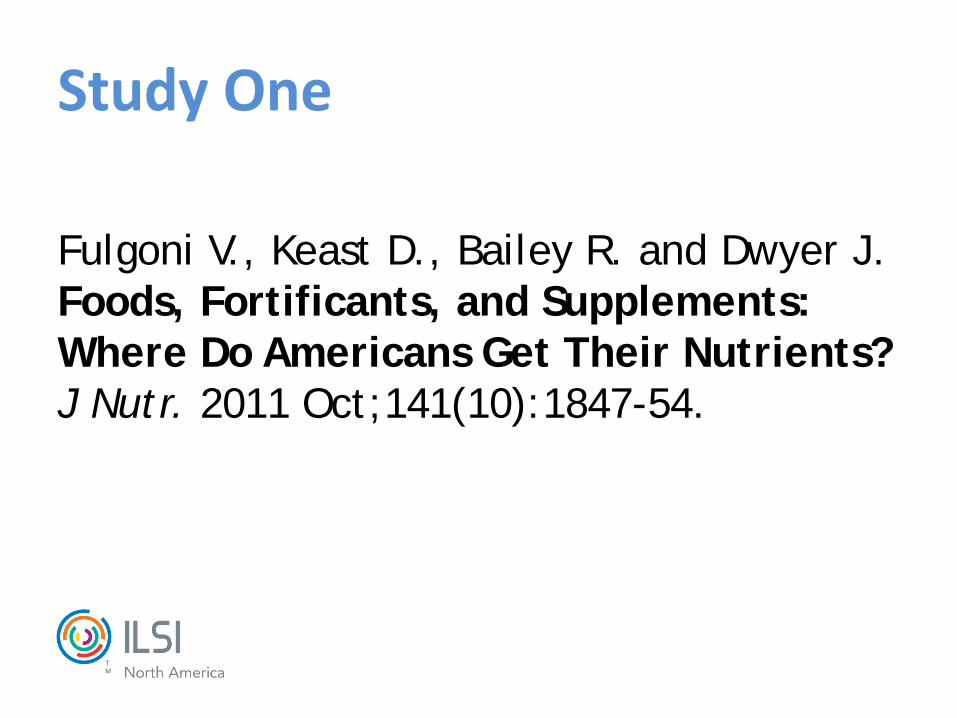
Study One
Fulgoni V., Keast D., Bailey R. and Dwyer J. Foods, Fortificants, and Supplements: Where Do Americans Get Their Nutrients? J Nutr. 2011 Oct;141(10):1847-54.

TM
To assess the contributions of micronutrients to usual intakes from all sources (intrinsic to food, fortified and enriched, and dietary supplements) and compare usual intakes to the DRIs for Americans ≥ 2 y.
Study Purpose
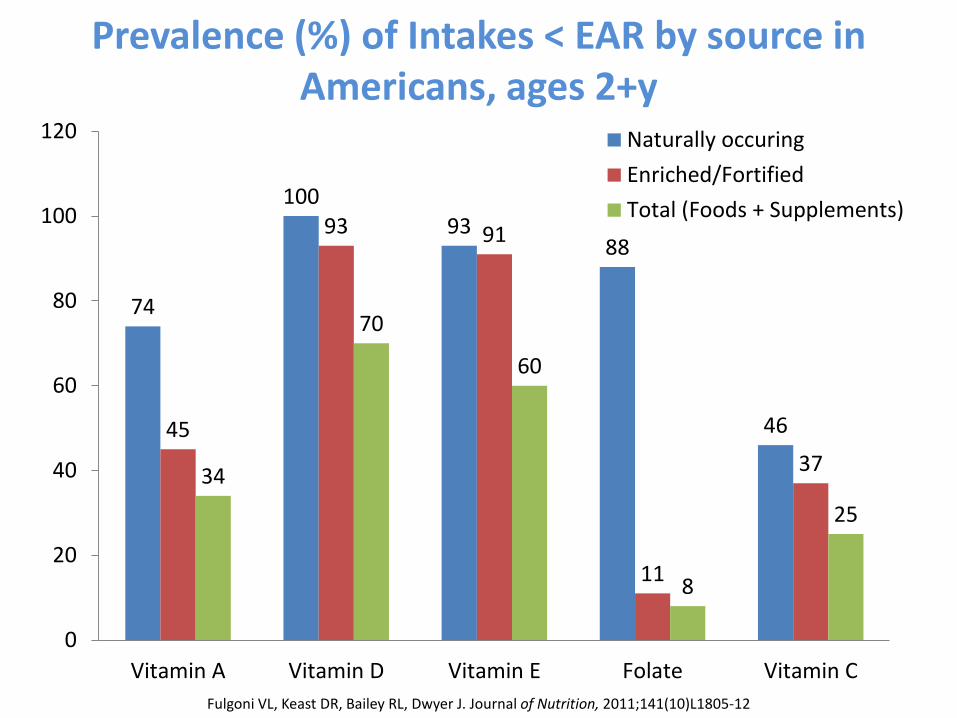
74
100 93
88
46 45
93 91
11
37 34
70
60
8
25
0
20
40
60
80
100
120
Vitamin A Vitamin D Vitamin E Folate Vitamin C
Naturally occuringEnriched/FortifiedTotal (Foods + Supplements)
Prevalence (%) of Intakes < EAR by source in Americans, ages 2+ y: NHANES 2003-2006
Fulgoni VL, Keast DR, Bailey RL, Dwyer J. Journal of Nutrition, 2011;141(10)L1805-12
Prevalence (%) of Intakes < EAR by source in Americans, ages 2+y
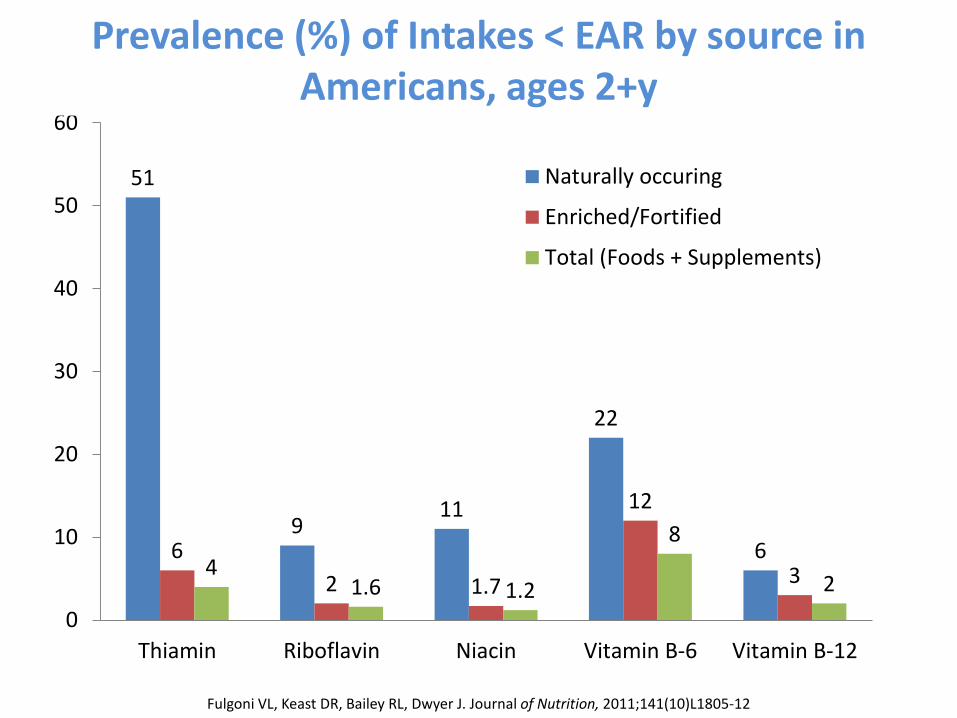
51
9 11
22
6 6 2 1.7
12
3 4 1.6 1.2
8
2 0
10
20
30
40
50
60
Thiamin Riboflavin Niacin Vitamin B-6 Vitamin B-12
Naturally occuring
Enriched/Fortified
Total (Foods + Supplements)
Prevalence (%) of Intakes < EAR by source in Americans, ages 2+y
Fulgoni VL, Keast DR, Bailey RL, Dwyer J. Journal of Nutrition, 2011;141(10)L1805-12
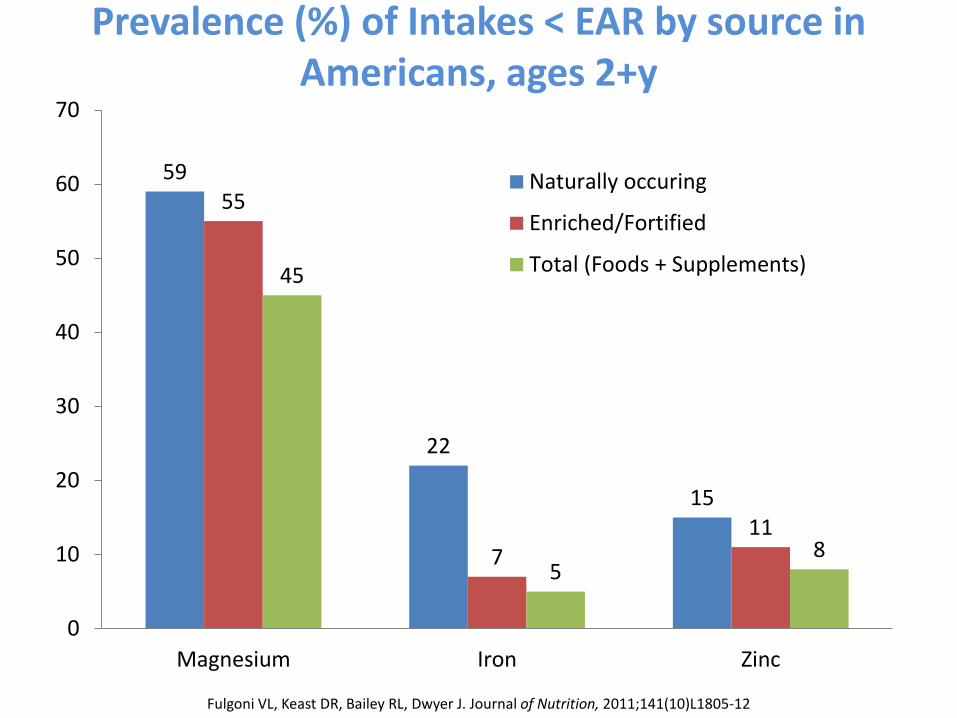
59
22
15
55
7 11
45
5 8
0
10
20
30
40
50
60
70
Magnesium Iron Zinc
Naturally occuring
Enriched/Fortified
Total (Foods + Supplements)
Fulgoni VL, Keast DR, Bailey RL, Dwyer J. Journal of Nutrition, 2011;141(10)L1805-12
Prevalence (%) of Intakes < EAR by source in Americans, ages 2+y
TM
Study One: Conclusions • Major sources of most water soluble vitamins
were enrichment/fortification and/or supplements
• Major sources of most minerals (except for iron) were intrinsic to foods
• Fortification/enrichment plays an important role in increasing the % of population >EAR for vitamins A, thiamin, folate, and iron
TM
• Supplements increase the % of the population meeting the EAR – especially for nutrients that are not
prevalent in foods (vitamins D and E)
• Supplements also increase the % > UL
Study One: Conclusions
TM
Study One: Take home • Most Americans met recommended
nutrient target for the majority (but not all) of vitamins and minerals evaluated
• However….. – far fewer individuals would have done so
without intakes of enriched and fortified foods
– and even fewer if dietary supplements are excluded
TM
Bailey RL, Fulgoni VL, Keast DR, Dwyer JT. Dietary supplement use is associated with higher intakes of minerals from food sources. Am J Clin Nutr. 2011 Nov;94(5):1376-81.
Bailey RL, Fulgoni VL, Keast DR, Dwyer J. Examination of Vitamin Intakes among US Adults by Dietary Supplement Use. J Acad Nutr Diet. 2012;112:657-663.
Studies Two and Three
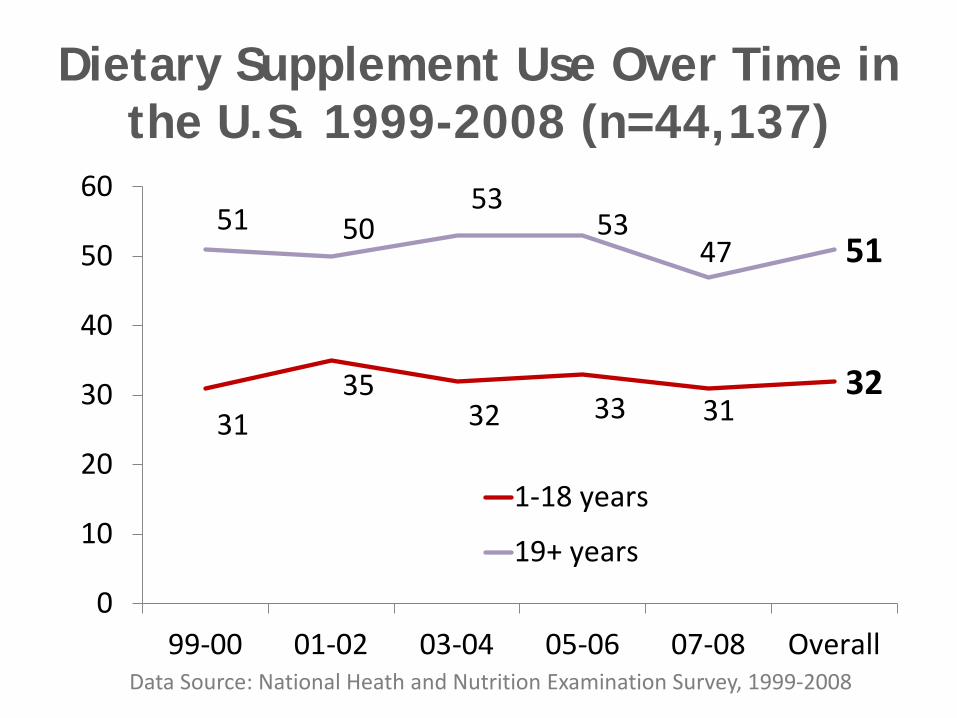
Dietary Supplement Use Over Time in the U.S. 1999-2008 (n=44,137)
31 35
32 33 31 32
51 50 53
53 47 51
0
10
20
30
40
50
60
99-00 01-02 03-04 05-06 07-08 Overall
1-18 years
19+ years
Data Source: National Heath and Nutrition Examination Survey, 1999-2008
TM
To assess the vitamin and mineral intakes of adults from the diet by supplement-use categories, and how these supplements contributed to meeting or exceeding DRIs for selected micronutrients.
Purpose (both studies combined)

TM
Users versus Non-users Defined
• Users: those who reported taking at least one dietary supplement within the previous 30 days
• Diet: food sources only • Total intakes: diet + supplements
• Non-users: no supplement use • Diet: food sources only
TM
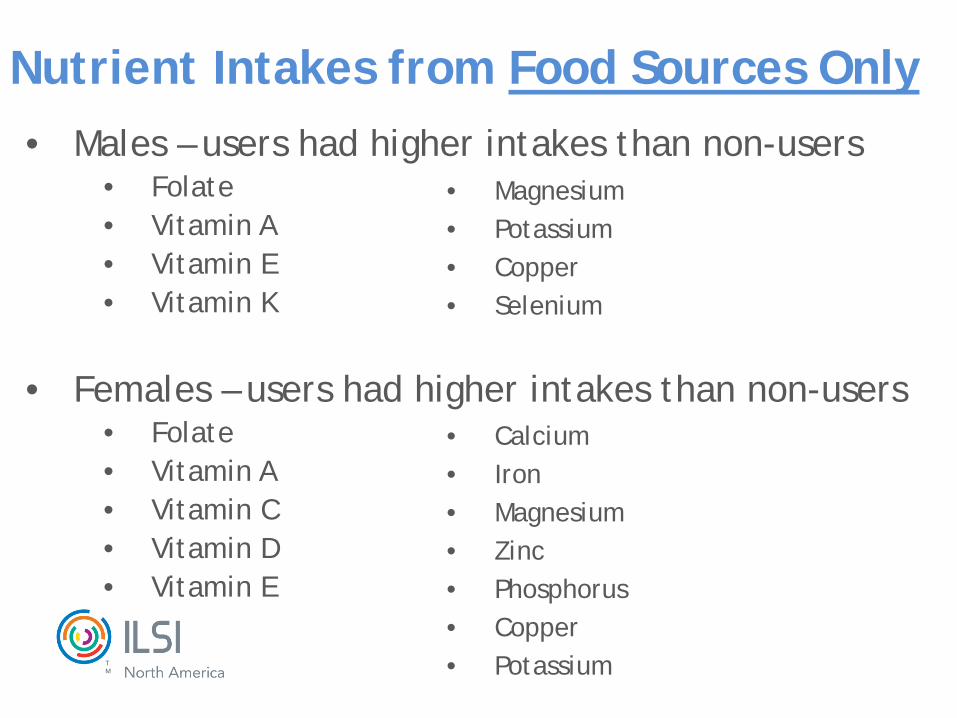
Intakes from Foods Sources Only
• Males – users had higher intakes than non-users • Folate • Vitamin A • Vitamin E • Vitamin K
• Females – users had higher intakes than non-users • Folate • Vitamin A • Vitamin C • Vitamin D • Vitamin E
• Magnesium • Potassium • Copper • Selenium
• Calcium • Iron • Magnesium • Zinc • Phosphorus • Copper • Potassium
Nutrient Intakes from Food Sources Only
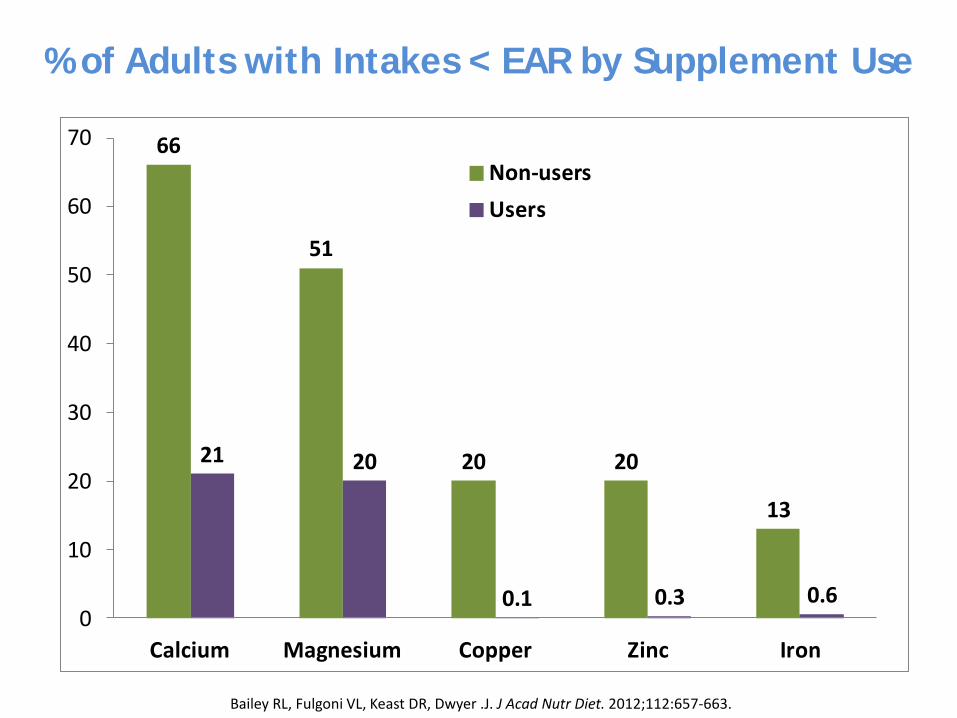
66
51
20 20
13
21 20
0.1 0.3 0.60
10
20
30
40
50
60
70
Calcium Magnesium Copper Zinc Iron
Non-usersUsers
% of Adults with Intakes < EAR by Supplement Use
Bailey RL, Fulgoni VL, Keast DR, Dwyer .J. J Acad Nutr Diet. 2012;112:657-663.

14
48
58
96 96
1 3 2
25
5
0
20
40
60
80
100
Folate Vitamin C Vitamin A Vitamin D Vitamin E
Non-usersUsers
Bailey RL, Fulgoni VL, Keast DR, Dwyer J.American Journal of Clinical Nutrition, 2011;94:1376–81.
% of Adults with Intakes < EAR by Supplement Use
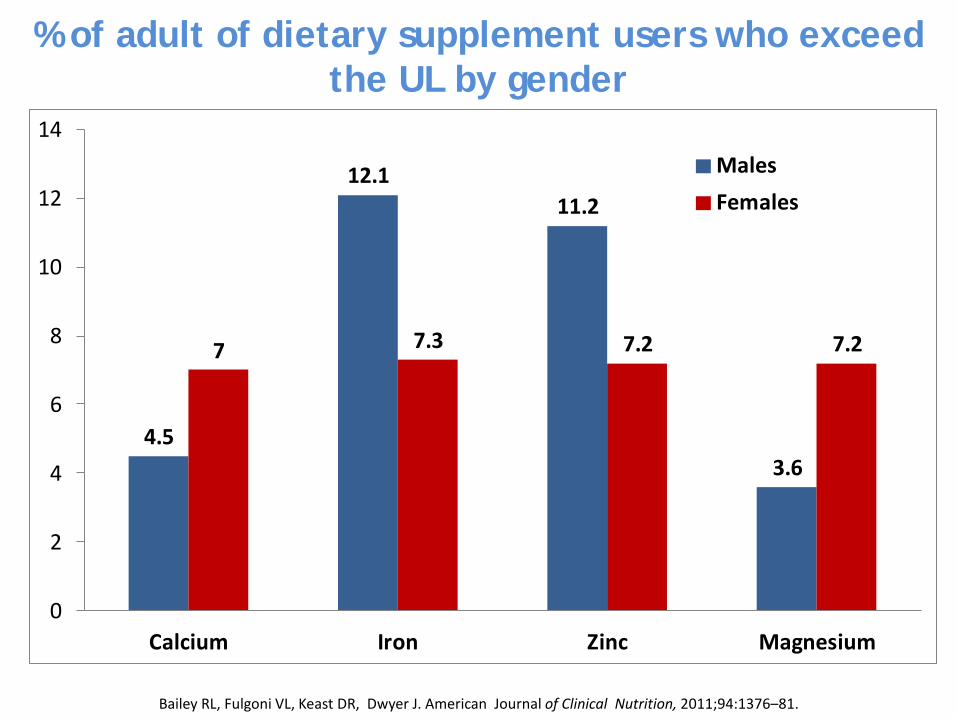
4.5
12.111.2
3.6
7 7.3 7.2 7.2
0
2
4
6
8
10
12
14
Calcium Iron Zinc Magnesium
MalesFemales
Bailey RL, Fulgoni VL, Keast DR, Dwyer J. American Journal of Clinical Nutrition, 2011;94:1376–81.
% of adult of dietary supplement users who exceed the UL by gender
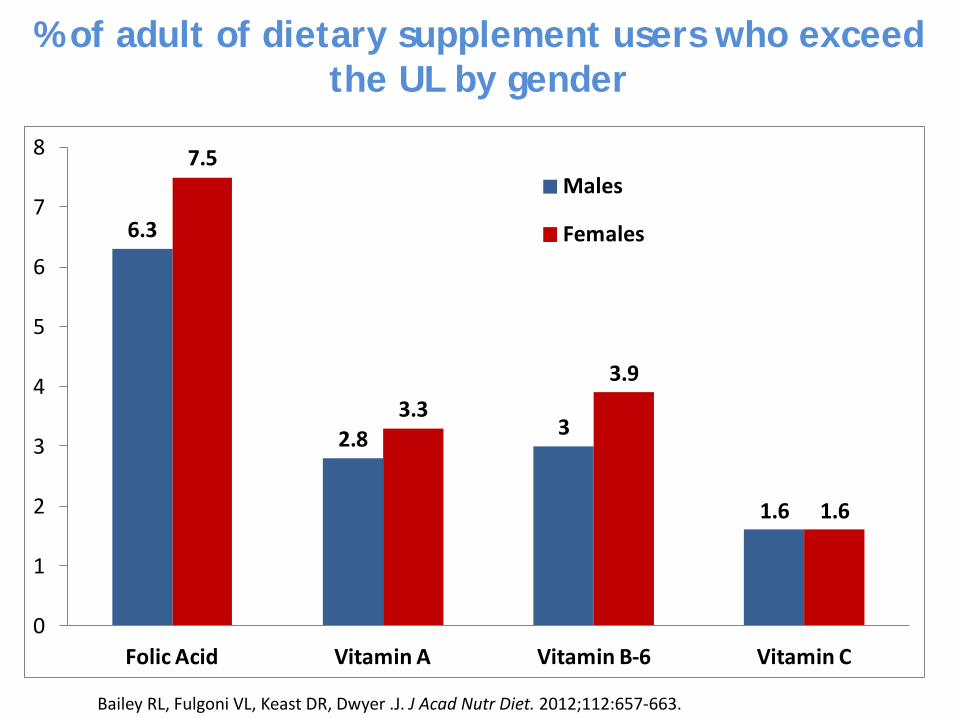
6.3
2.8 3
1.6
7.5
3.33.9
1.6
0
1
2
3
4
5
6
7
8
Folic Acid Vitamin A Vitamin B-6 Vitamin C
Males
Females
Bailey RL, Fulgoni VL, Keast DR, Dwyer .J. J Acad Nutr Diet. 2012;112:657-663.
% of adult of dietary supplement users who exceed the UL by gender

TM
• Adults who use dietary supplements tend to have higher mineral and vitamin intakes from foods than non-users
• Supplements help users meet the EAR for all micronutrients (except potassium)
• This is especially true for nutrients that are not prevalent in foods (e.g. vitamin D, vitamin E)
• Non-users had significantly higher prevalence of intakes below the EAR
• Supplement use also creates the potential for intakes above the UL for some nutrients (folic acid, vitamins A, B-6 and C and calcium, iron, zinc and magnesium)
Studies Two and Three: Conclusions
TM
• More than half of adults use dietary supplements in the U.S.
• Dietary habits of supplement users and non-users are different
• Supplement use is associated with a greater percentage of individuals exceeding the UL for some nutrients
Studies Two and Three: Take Home

TM
Bailey RL, Fulgoni VL, Keast DR, Lentino CV, DwyerJT. Do dietary supplements improve micronutrient sufficiency in U.S. children and adolescents? J of Pediatrics, in press.
Study Four

TM
To assess whether micronutrient supplements given to children help fill gaps in nutritionally inadequate diets or whether they contribute to already adequate diets and contribute to excessive micronutrient intakes from foods.
Purpose
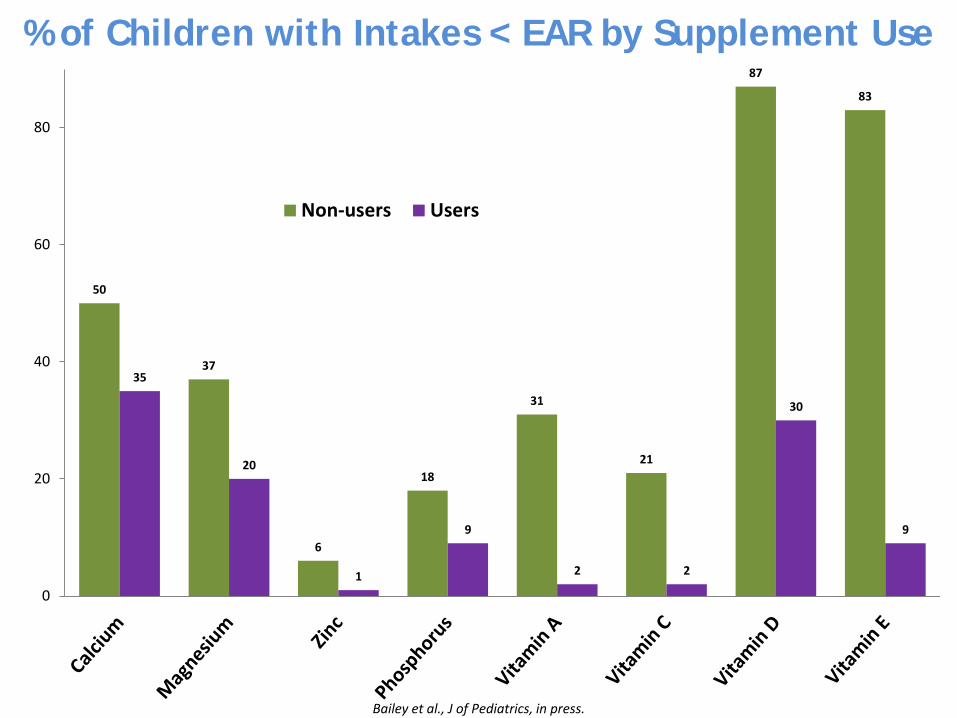
% of Children with Intakes < EAR by Supplement Use
Bailey et al., J of Pediatrics, in press.
50
37
6
18
31
21
87
83
35
20
1
9
2 2
30
9
0
20
40
60
80
Non-users Users
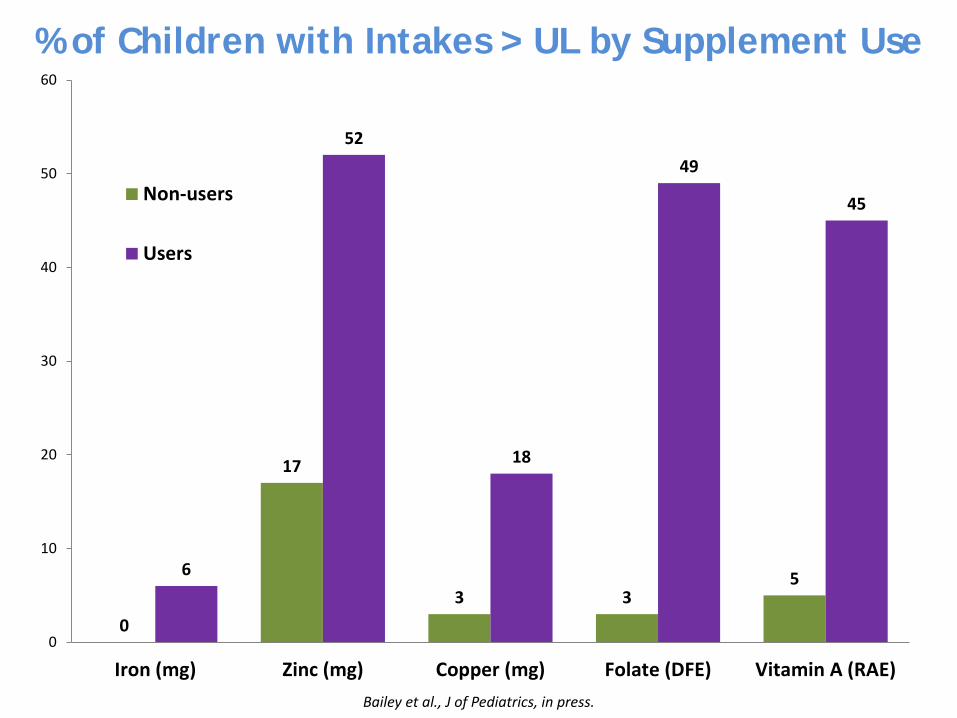
% of Children with Intakes > UL by Supplement Use
Bailey et al., J of Pediatrics, in press.
0
17
3 3 5 6
52
18
49
45
0
10
20
30
40
50
60
Iron (mg) Zinc (mg) Copper (mg) Folate (DFE) Vitamin A (RAE)
Non-users
Users

• No differences in the vitamin or mineral intakes from food sources between users and non-users
• Different than adults • Higher % of users meet the EAR, particularly for vitamin
D and E • Similar to adults
• Users have higher prevalence of intakes > UL • Both children and adult users have excessive
intakes of iron, zinc, folic acid, and vitamin A (retinol).
Summary of Supplement Use: Children’s Data
Studies Four: Conclusions

TM
• Food Sources Paper • What foods are providing micronutrients?
• Examining the Nutrition Facts Panel
Scenarios • How may changes in DV change nutrient
intakes?
Next Steps
TM
Federal Register 11/2/07
If the basis for calculating %DV changes would some products or categories be reformulated or re-labeled in order to make a claim? Do you have any information suggesting that changes in nutrient intakes and consumption behavior will result from newly reformulated or newly labeled products to make these claims?

TM
Thank you!
Eric Hentges, PhD