Embed Size (px)
Citation preview
Fortress Transportation and Infrastructure Investors LLC
Stifel 2021 Virtual Cross Sector Insight Conference
June 10, 2021
Disclaimers
1
IN GENERAL. This disclaimer applies to this document and the verbal or written comments of any person presenting it. This document, taken together with any such verbal or writtencomments, is referred to herein as the “Presentation.”
FORWARD-LOOKING STATEMENTS. Certain statements in this Presentation may constitute “forward-looking statements” within the meaning of the Private Securities Litigation ReformAct of 1995, of Fortress Transportation and Infrastructure Investors LLC (referred to in this Presentation as “FTAI,” the “Company,” or “we”), including without limitation, ability to achievekey investment objectives, expansion and growth opportunities, pipeline activity and investment of existing cash, ability to successfully close deals for which we have letters of intent or“LOIs”, actual results as compared to annualized data, expectations regarding additional Funds Available for Distribution (“FAD”) and/or EBITDA from investments, the Company’s ability togenerate cash flow for sufficient dividend coverage, and its ability to complete the acquisition of Transtar, LLC (“Transtar”), to obtain all required regulatory approvals and consummate thetransaction on a timely basis or at all and realize the anticipated benefits of the transaction, targeted, expected or projected EBITDA, cash flows, returns, annualized data and numbers, achievekey investment objectives, entry into a long-term contract with U.S. Steel to perform exclusive rail services at each facility, to develop and implement new practices and approaches whichwould improve the ESG profile of all operations, the growth of and ability to expand Jefferson Terminal, Repauno and Long Ridge, and Transtar, whether equipment will be able to be leased,completion of new infrastructure and commencement of new operations within the Infrastructure business, the availability of aviation modules, the module savings range and downtimeestimates, module benefits, bank borrowings and future debt and leverage capacity, financing activities, yield sensitivity projections, and other such matters. These statements are based onmanagement’s current expectations, estimates and beliefs and are subject to a number of trends and uncertainties that could cause actual results to differ materially from those described in theforward-looking statements, many of which are beyond our control. FTAI can give no assurance that its expectations will be attained. Accordingly, you should not place undue reliance onany forward-looking statements made in this Presentation. For a discussion of some of the risks and important factors that could affect such forward-looking statements including, but notlimited to the ongoing COVID-19 pandemic, see the sections entitled “Risk Factors” and “Management’s Discussion and Analysis of Financial Condition and Results of Operations” in theCompany’s most recent annual report on Form 10-K and quarterly report on Form 10-Q (when available) and other filings with the U.S. Securities and Exchange Commission, which areincluded on the Company’s website (www.ftandi.com). In addition, new risks and uncertainties emerge from time to time, and it is not possible for the Company to predict or assess the impactof every factor that may cause its actual results to differ from those contained in any forward-looking statements. Such forward-looking statements speak only as of the date of thisPresentation. The Company expressly disclaims any obligation to release publicly any updates or revisions to any forward-looking statements contained herein to reflect any change in theCompany's expectations with regard thereto or change in events, conditions or circumstances on which any statement is based.
PAST PERFORMANCE. Past performance is not a reliable indicator of future results and should not be relied upon for any reason. Annualized data is presented for illustrative purposesonly and should not be considered indicative of future performance or actual results for any period.
NO OFFER; NO RELIANCE. This Presentation is for informational purposes only and does not constitute an offer to sell, or a solicitation of an offer to buy, any security and may not be reliedupon in connection with the purchase or sale of any security. Any such offer would only be made by means of formal documents, the terms of which would govern in all respects. You shouldnot rely on this Presentation as the basis upon which to make any investment decision.
NON-GAAP FINANCIAL INFORMATION. This Presentation includes information based on financial measures that are not recognized under generally accepted accounting principles(GAAP), such as Adjusted EBITDA, FAD, and EBITDA. You should use Non-GAAP information in addition to, and not as an alternative to, financial information prepared in accordance withGAAP. For Adjusted EBITDA and FAD, see Reconciliation and Glossary in the Appendix the Company’s Q1 Earnings Supplement posted on the Company’s website for reconciliations to themost comparable GAAP measures and an explanation of each of our non-GAAP measures. Our Non-GAAP measures may not be identical or comparable to measures with the same namepresented by other companies. United States Steel Corporation provides a definition of EBITDA, and reconciliations of its segment EBITDA to the most comparable GAAP measure, in its mostrecent earnings call presentation, which can be accessed at https://investors.ussteel.com; the Transtar EBITDA figures presented in this Presentation have been prepared on the same basisbased on unaudited financial information of Transtar and its subsidiaries. Transtar’s Non-GAAP measures may not be identical or comparable to measures with the same name presented byother companies. Reconciliations of forward-looking Non-GAAP financial measures to their most directly comparable GAAP financial measures are not included in this Presentation becausethe most directly comparable GAAP financial measures are not available on a forward-looking basis without unreasonable effort.
′
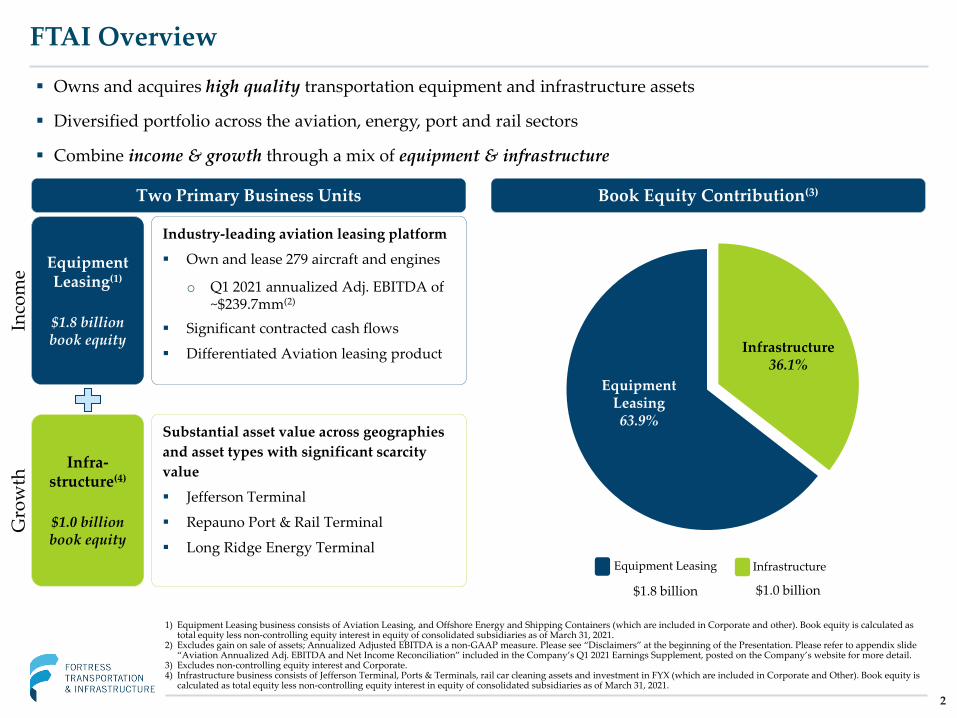
FTAI Overview
Two Primary Business Units Book Equity Contribution(3)
1) Equipment Leasing business consists of Aviation Leasing, and Offshore Energy and Shipping Containers (which are included in Corporate and other). Book equity is calculated as total equity less non-controlling equity interest in equity of consolidated subsidiaries as of March 31, 2021.
2) Excludes gain on sale of assets; Annualized Adjusted EBITDA is a non-GAAP measure. Please see “Disclaimers” at the beginning of the Presentation. Please refer to appendix slide “Aviation Annualized Adj. EBITDA and Net Income Reconciliation” included in the Company’s Q1 2021 Earnings Supplement, posted on the Company’s website for more detail.
3) Excludes non-controlling equity interest and Corporate.4) Infrastructure business consists of Jefferson Terminal, Ports & Terminals, rail car cleaning assets and investment in FYX (which are included in Corporate and Other). Book equity is
calculated as total equity less non-controlling equity interest in equity of consolidated subsidiaries as of March 31, 2021.
Equipment Leasing(1)
$1.8 billionbook equity
Infra-structure(4)
$1.0 billionbook equity
Industry-leading aviation leasing platform
Own and lease 279 aircraft and engines
o Q1 2021 annualized Adj. EBITDA of ~$239.7mm(2)
Significant contracted cash flows
Differentiated Aviation leasing product
Substantial asset value across geographies and asset types with significant scarcity value
Jefferson Terminal
Repauno Port & Rail Terminal
Long Ridge Energy Terminal
Infrastructure36.1%
EquipmentLeasing63.9%
2
Owns and acquires high quality transportation equipment and infrastructure assets
Diversified portfolio across the aviation, energy, port and rail sectors
Combine income & growth through a mix of equipment & infrastructure
Equipment Leasing Infrastructure
$1.8 billion $1.0 billion
Inco
me
Gro
wth
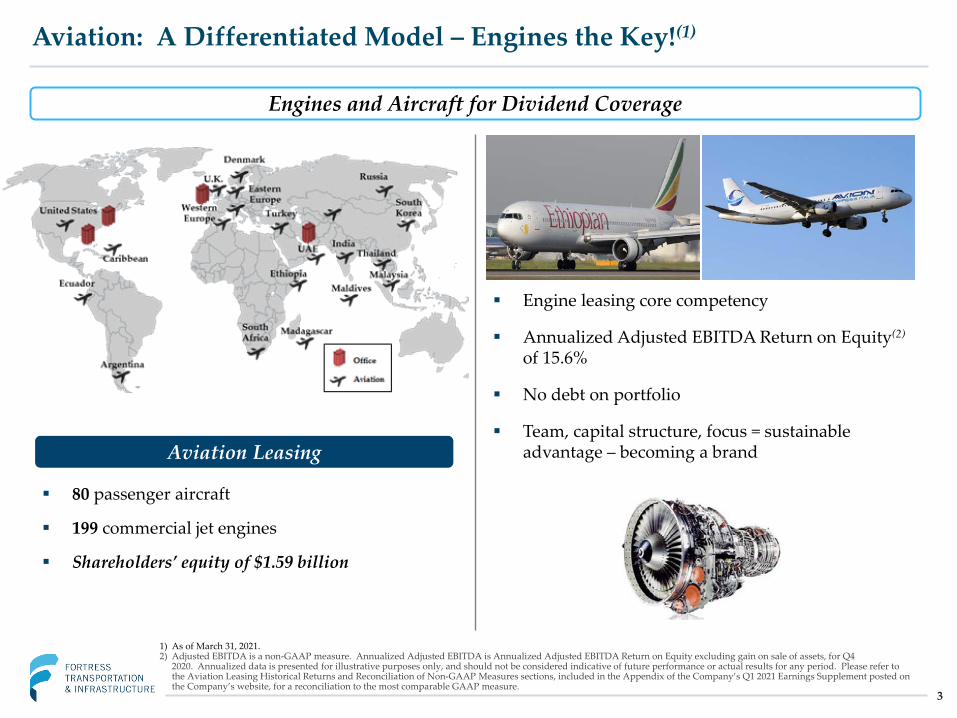
Aviation: A Differentiated Model – Engines the Key!(1)
3
1) As of March 31, 2021.2) Adjusted EBITDA is a non-GAAP measure. Annualized Adjusted EBITDA is Annualized Adjusted EBITDA Return on Equity excluding gain on sale of assets, for Q4
2020. Annualized data is presented for illustrative purposes only, and should not be considered indicative of future performance or actual results for any period. Please refer to the Aviation Leasing Historical Returns and Reconciliation of Non-GAAP Measures sections, included in the Appendix of the Company’s Q1 2021 Earnings Supplement posted on the Company’s website, for a reconciliation to the most comparable GAAP measure.
Aviation Leasing
80 passenger aircraft
199 commercial jet engines
Shareholders’ equity of $1.59 billion
Engines and Aircraft for Dividend Coverage
Engine leasing core competency
Annualized Adjusted EBITDA Return on Equity(2)
of 15.6%
No debt on portfolio
Team, capital structure, focus = sustainable advantage – becoming a brand
4
CFM56-5B/7B Engine Market Overview and Opportunity
1) Per 2017 MBA aviation report.2) Based on management’s estimates. Actuals may vary.3) Life Limited Parts. 4) Estimated annual after market overhauls; assumes 5 year mean time between removal (“MTBR”) of after market engines.
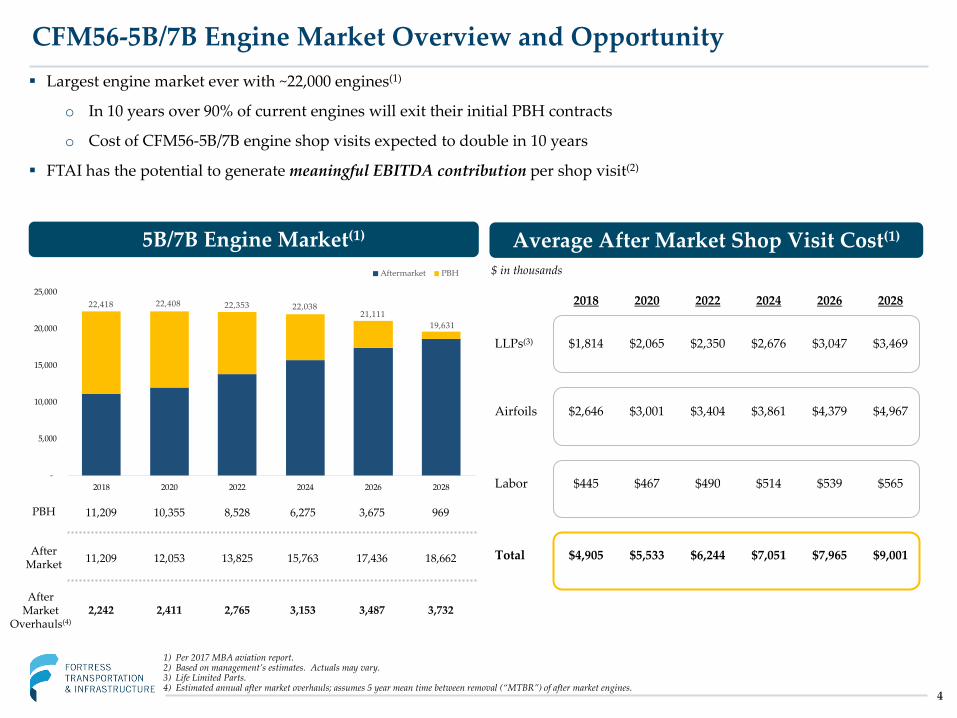
Largest engine market ever with ~22,000 engines(1)
o In 10 years over 90% of current engines will exit their initial PBH contracts
o Cost of CFM56-5B/7B engine shop visits expected to double in 10 years
FTAI has the potential to generate meaningful EBITDA contribution per shop visit(2)
5B/7B Engine Market(1)
22,418 22,408 22,353 22,038 21,111
19,631
-
5,000
10,000
15,000
20,000
25,000
2018 2020 2022 2024 2026 2028
Aftermarket PBH
PBH
After Market
After Market
Overhauls(4)
11,209
11,209
2,242
10,355 8,528 6,275 3,675 969
12,053 13,825 15,763 17,436 18,662
2,411 2,765 3,153 3,487 3,732
Average After Market Shop Visit Cost(1)
$ in thousands
2018 2020 2022 2024 2026 2028
LLPs(3) $1,814 $2,065 $2,350 $2,676 $3,047 $3,469
Airfoils $2,646 $3,001 $3,404 $3,861 $4,379 $4,967
Labor $445 $467 $490 $514 $539 $565
Total $4,905 $5,533 $6,244 $7,051 $7,965 $9,001
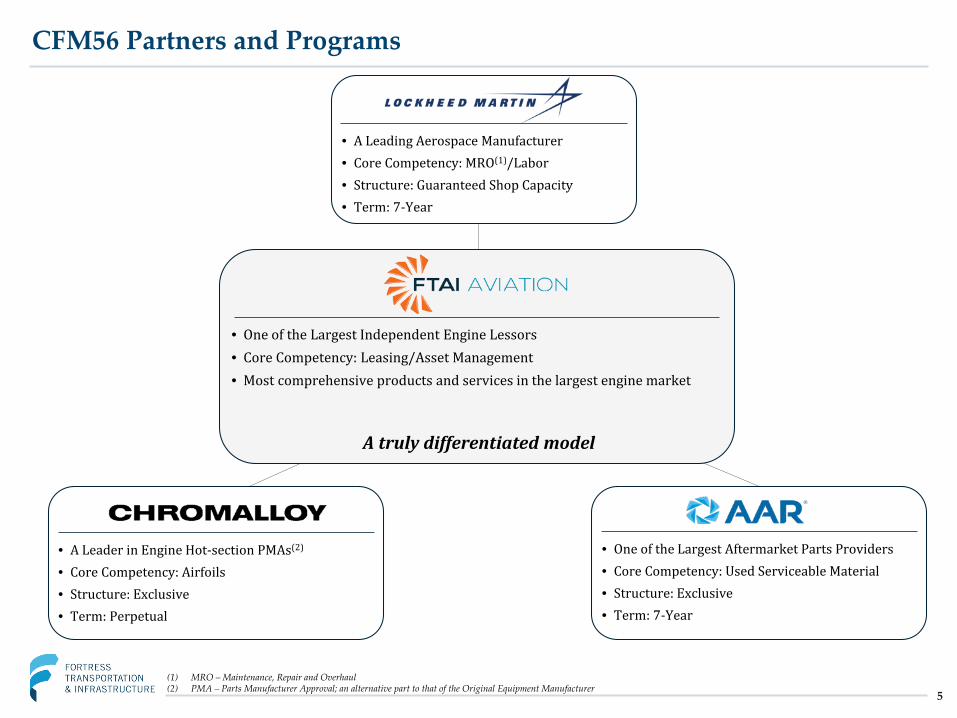
CFM56 Partners and Programs
• One of the Largest Independent Engine Lessors• Core Competency: Leasing/Asset Management• Most comprehensive products and services in the largest engine market
A truly differentiated model
• A Leading Aerospace Manufacturer• Core Competency: MRO(1)/Labor• Structure: Guaranteed Shop Capacity• Term: 7-Year
• A Leader in Engine Hot-section PMAs(2)
• Core Competency: Airfoils • Structure: Exclusive • Term: Perpetual
• One of the Largest Aftermarket Parts Providers• Core Competency: Used Serviceable Material • Structure: Exclusive • Term: 7-Year
(1) MRO – Maintenance, Repair and Overhaul(2) PMA – Parts Manufacturer Approval; an alternative part to that of the Original Equipment Manufacturer
5
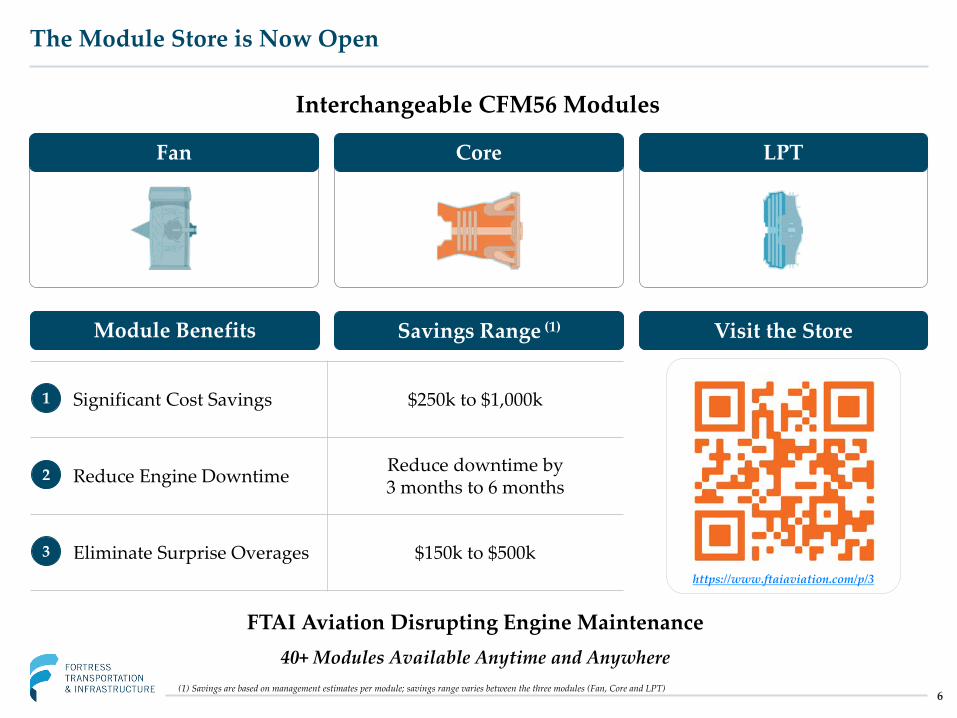
Significant Cost Savings $250k to $1,000k
Reduce Engine Downtime Reduce downtime by 3 months to 6 months
Eliminate Surprise Overages $150k to $500k
The Module Store is Now Open
Module Benefits
1
2
3
Fan Core LPT
FTAI Aviation Disrupting Engine Maintenance40+ Modules Available Anytime and Anywhere
https://www.ftaiaviation.com/p/3
Visit the Store
Interchangeable CFM56 Modules
Savings Range (1)
(1) Savings are based on management estimates per module; savings range varies between the three modules (Fan, Core and LPT)6
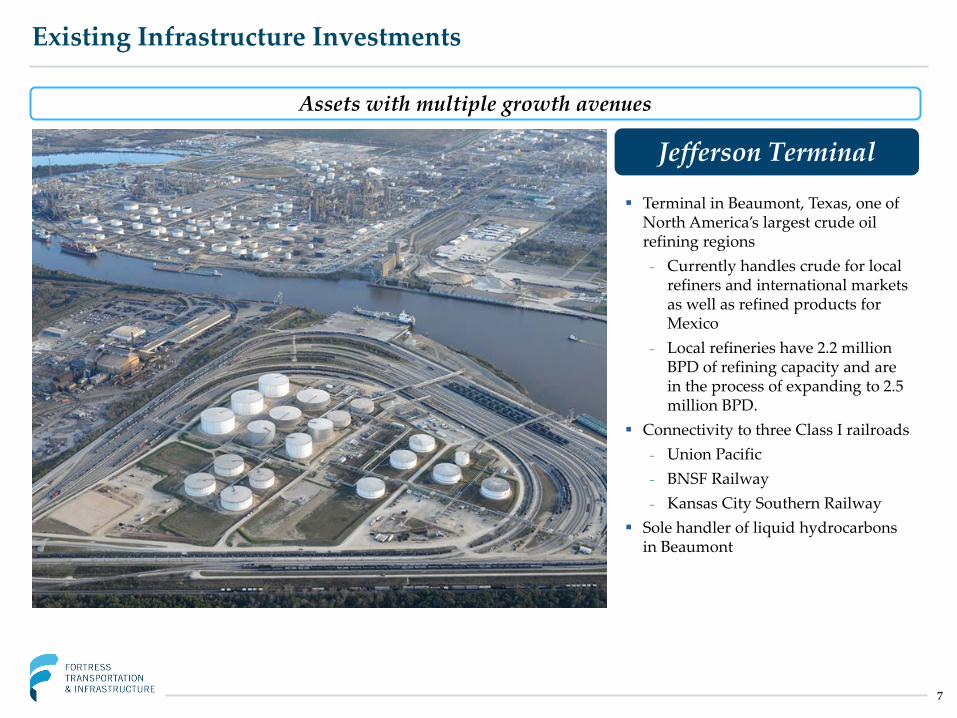
Existing Infrastructure Investments
7
Jefferson Terminal
Terminal in Beaumont, Texas, one of North America’s largest crude oil refining regions₋ Currently handles crude for local
refiners and international markets as well as refined products for Mexico
₋ Local refineries have 2.2 million BPD of refining capacity and are in the process of expanding to 2.5 million BPD.
Connectivity to three Class I railroads ₋ Union Pacific₋ BNSF Railway₋ Kansas City Southern Railway
Sole handler of liquid hydrocarbons in Beaumont
Assets with multiple growth avenues
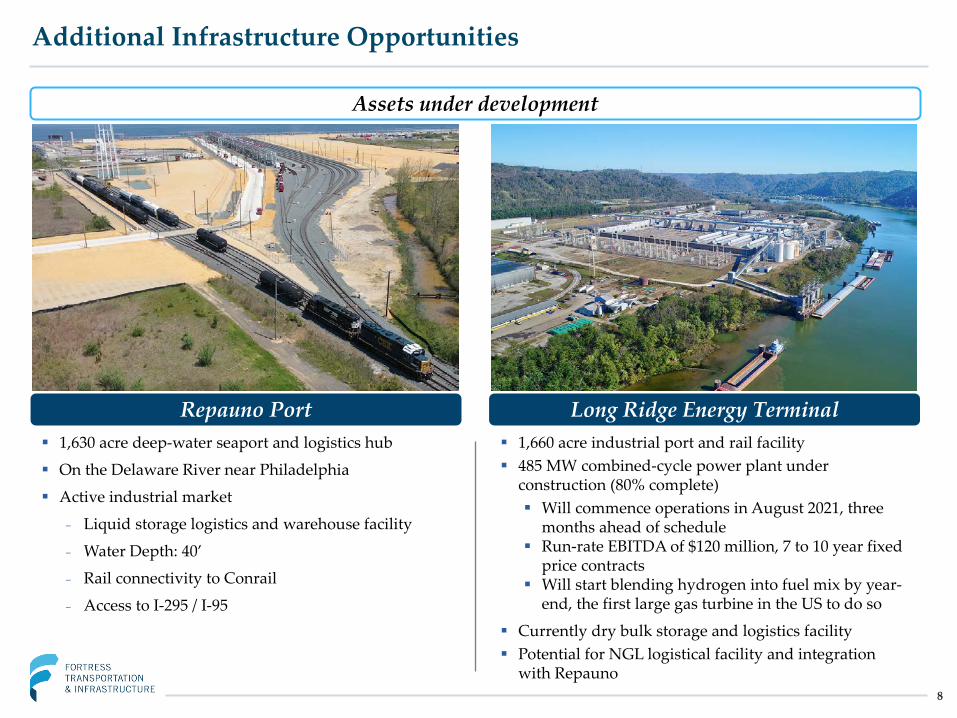
Additional Infrastructure Opportunities
8
Repauno Port Long Ridge Energy Terminal 1,630 acre deep-water seaport and logistics hub
On the Delaware River near Philadelphia
Active industrial market
₋ Liquid storage logistics and warehouse facility
₋ Water Depth: 40’
₋ Rail connectivity to Conrail
₋ Access to I-295 / I-95
Assets under development
1,660 acre industrial port and rail facility 485 MW combined-cycle power plant under
construction (80% complete) Will commence operations in August 2021, three
months ahead of schedule Run-rate EBITDA of $120 million, 7 to 10 year fixed
price contracts Will start blending hydrogen into fuel mix by year-
end, the first large gas turbine in the US to do so
Currently dry bulk storage and logistics facility Potential for NGL logistical facility and integration
with Repauno
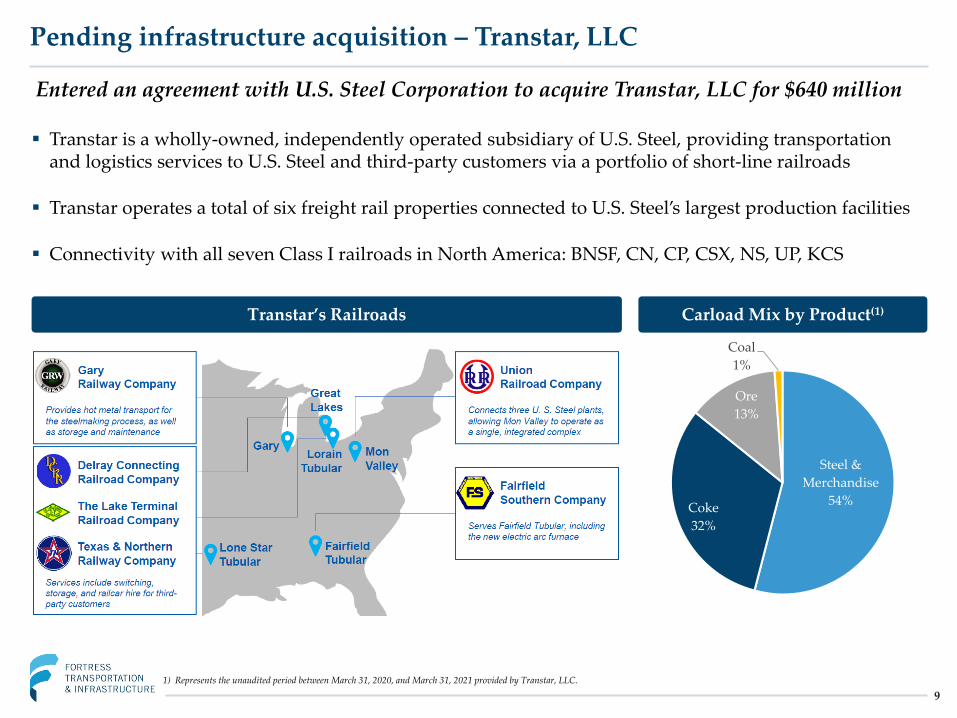
Transtar is a wholly-owned, independently operated subsidiary of U.S. Steel, providing transportation and logistics services to U.S. Steel and third-party customers via a portfolio of short-line railroads
Transtar operates a total of six freight rail properties connected to U.S. Steel’s largest production facilities
Connectivity with all seven Class I railroads in North America: BNSF, CN, CP, CSX, NS, UP, KCS
Pending infrastructure acquisition – Transtar, LLC
9
Transtar’s Railroads Carload Mix by Product(1)
Steel & Merchandise
54%Coke32%
Ore13%
Coal1%
1) Represents the unaudited period between March 31, 2020, and March 31, 2021 provided by Transtar, LLC.
Entered an agreement with U.S. Steel Corporation to acquire Transtar, LLC for $640 million
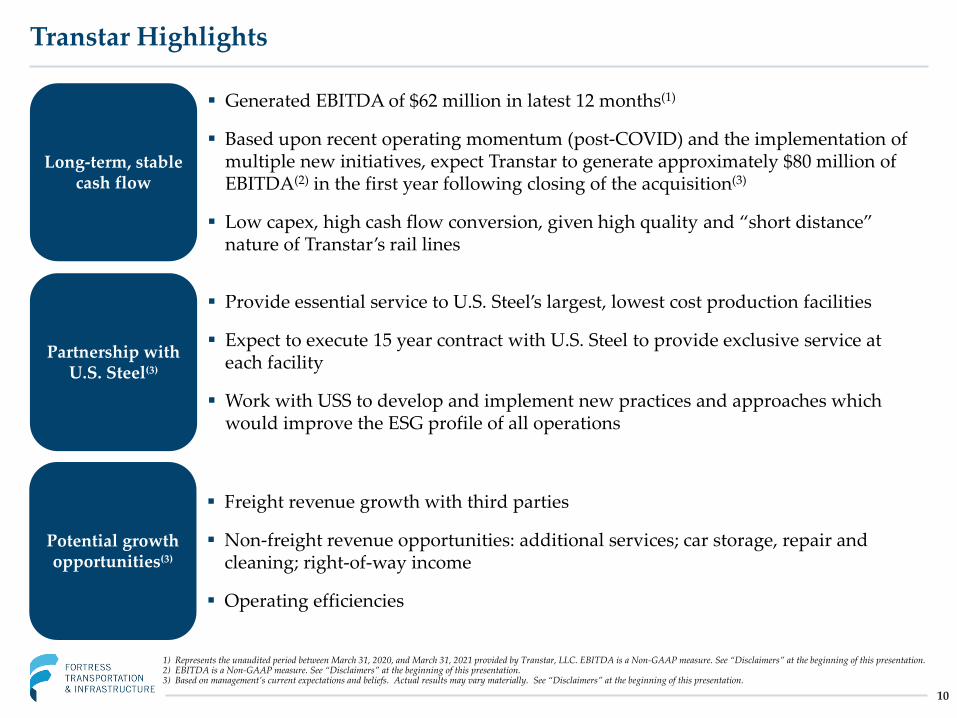
Transtar Highlights
10
Long-term, stable cash flow
Generated EBITDA of $62 million in latest 12 months(1)
Based upon recent operating momentum (post-COVID) and the implementation of multiple new initiatives, expect Transtar to generate approximately $80 million of EBITDA(2) in the first year following closing of the acquisition(3)
Low capex, high cash flow conversion, given high quality and “short distance” nature of Transtar’s rail lines
Partnership with U.S. Steel(3)
Provide essential service to U.S. Steel’s largest, lowest cost production facilities
Expect to execute 15 year contract with U.S. Steel to provide exclusive service at each facility
Work with USS to develop and implement new practices and approaches which would improve the ESG profile of all operations
Potential growth opportunities(3)
Freight revenue growth with third parties
Non-freight revenue opportunities: additional services; car storage, repair and cleaning; right-of-way income
Operating efficiencies
1) Represents the unaudited period between March 31, 2020, and March 31, 2021 provided by Transtar, LLC. EBITDA is a Non-GAAP measure. See “Disclaimers” at the beginning of this presentation. 2) EBITDA is a Non-GAAP measure. See “Disclaimers” at the beginning of this presentation. 3) Based on management’s current expectations and beliefs. Actual results may vary materially. See “Disclaimers” at the beginning of this presentation.
11
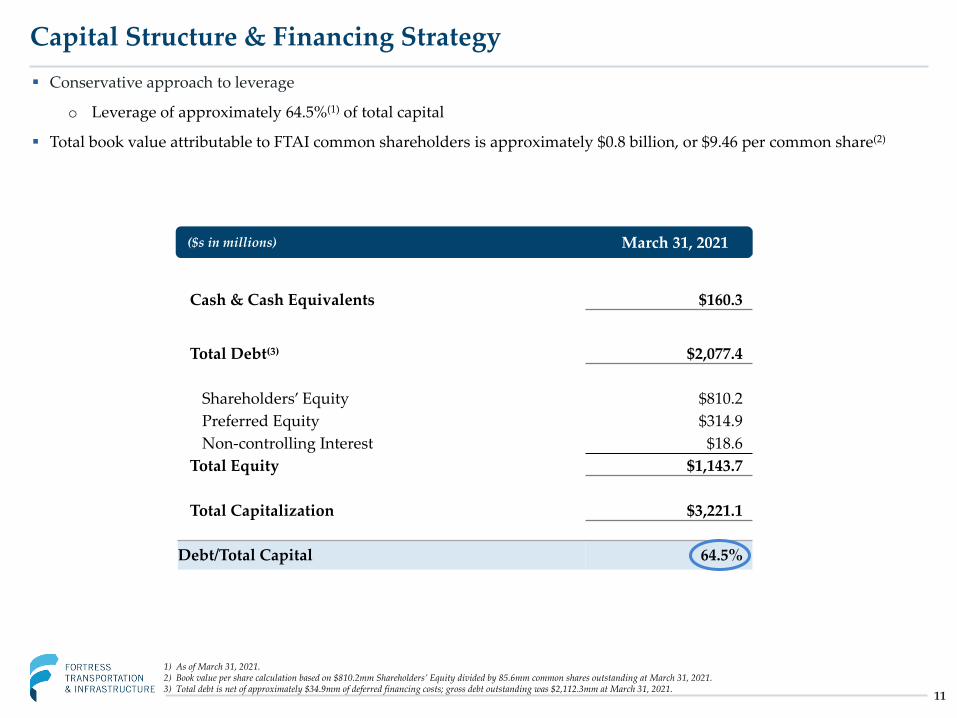
Capital Structure & Financing Strategy Conservative approach to leverage
o Leverage of approximately 64.5%(1) of total capital
Total book value attributable to FTAI common shareholders is approximately $0.8 billion, or $9.46 per common share(2)
($s in millions) September 30, 2016
Cash & Cash Equivalents $160.3
Total Debt(3) $2,077.4
Shareholders’ Equity $810.2Preferred Equity $314.9Non-controlling Interest $18.6
Total Equity $1,143.7
Total Capitalization $3,221.1
Debt/Total Capital 64.5%
($s in millions) March 31, 2021
1) As of March 31, 2021.2) Book value per share calculation based on $810.2mm Shareholders’ Equity divided by 85.6mm common shares outstanding at March 31, 2021.3) Total debt is net of approximately $34.9mm of deferred financing costs; gross debt outstanding was $2,112.3mm at March 31, 2021.