Embed Size (px)
Citation preview

1
2
Forward-looking Statement
Certain statements contained in this document may be viewed as “forward-
looking statements” within the meaning of Section 27A of the U.S. Securities Act of 1933, as amended, and Section 21E of the U.S. Securities Exchange Act of 1934, as amended. Such forward-looking statements involve known and
unknown risks, uncertainties and other factors, which may cause the actual performance, financial condition or results of operations of China Mobile Limited (the “Company”) to be materially different from those implied by such
forward-looking statements. In addition, we do not intend to update these forward-looking statements. Further information regarding these risks, uncertainties and other factors is included in the Company’s most recent
Annual Report on Form 20-F filed and other filings with the U.S. Securities and Exchange Commission.
3
Mr. SHANG Bing Executive Director & Chairman
Mr. LI Yue Executive Director & CEO
Mr. SHA Yuejia Executive Director & Vice President
Mr. LIU Aili Executive Director & Vice President
Executive Director, Vice President & CFO Mr. DONG Xin
Management Present
4
02
03
01 Overall Results
Operating Performance
Financial Results
Agenda
5
Overall Results
Mr. SHANG Bing
Executive Director & Chairman
01
6
Highlights
2
3
4
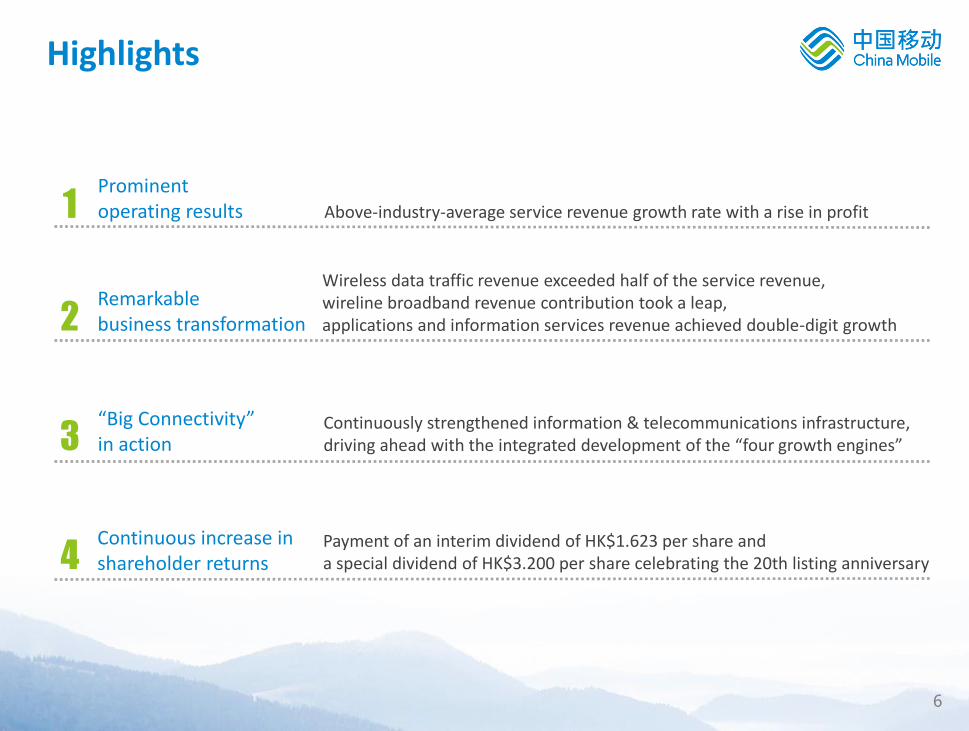
1 Prominent operating results Above-industry-average service revenue growth rate with a rise in profit
“Big Connectivity” in action
Remarkable business transformation
Wireless data traffic revenue exceeded half of the service revenue, wireline broadband revenue contribution took a leap, applications and information services revenue achieved double-digit growth
Continuous increase in shareholder returns
Payment of an interim dividend of HK$1.623 per share and a special dividend of HK$3.200 per share celebrating the 20th listing anniversary
Continuously strengthened information & telecommunications infrastructure, driving ahead with the integrated development of the “four growth engines”
7
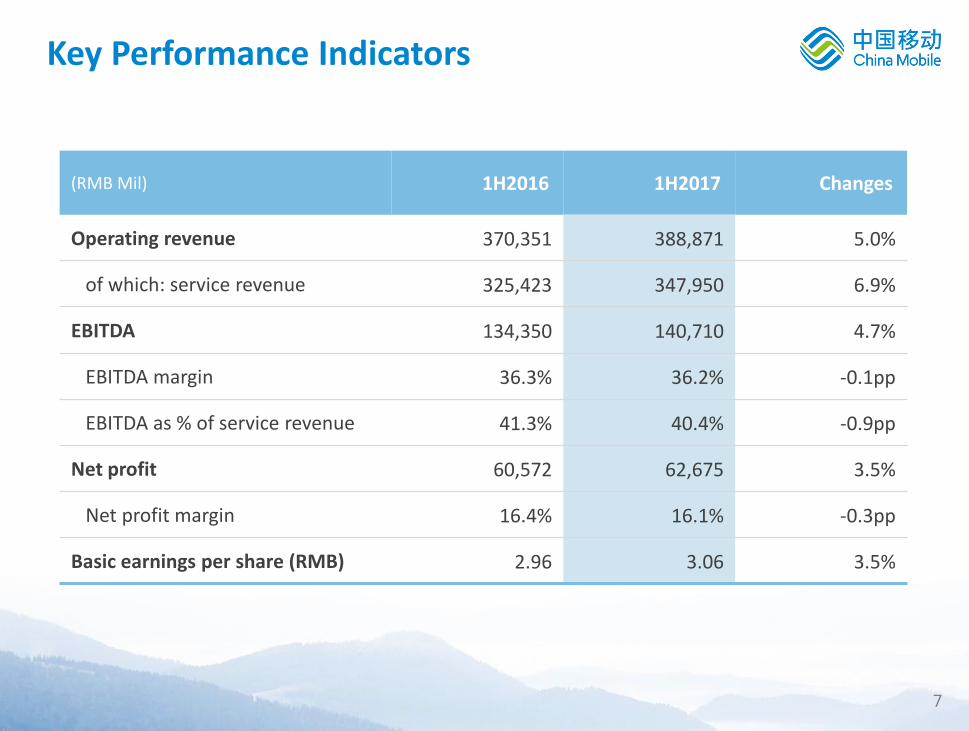
(RMB Mil) 1H2016 1H2017 Changes
Operating revenue 370,351 388,871 5.0%
of which: service revenue 325,423 347,950 6.9%
EBITDA 134,350 140,710 4.7%
EBITDA margin 36.3% 36.2% -0.1pp
EBITDA as % of service revenue 41.3% 40.4% -0.9pp
Net profit 60,572 62,675 3.5%
Net profit margin 16.4% 16.1% -0.3pp
Basic earnings per share (RMB) 2.96 3.06 3.5%
Key Performance Indicators
8
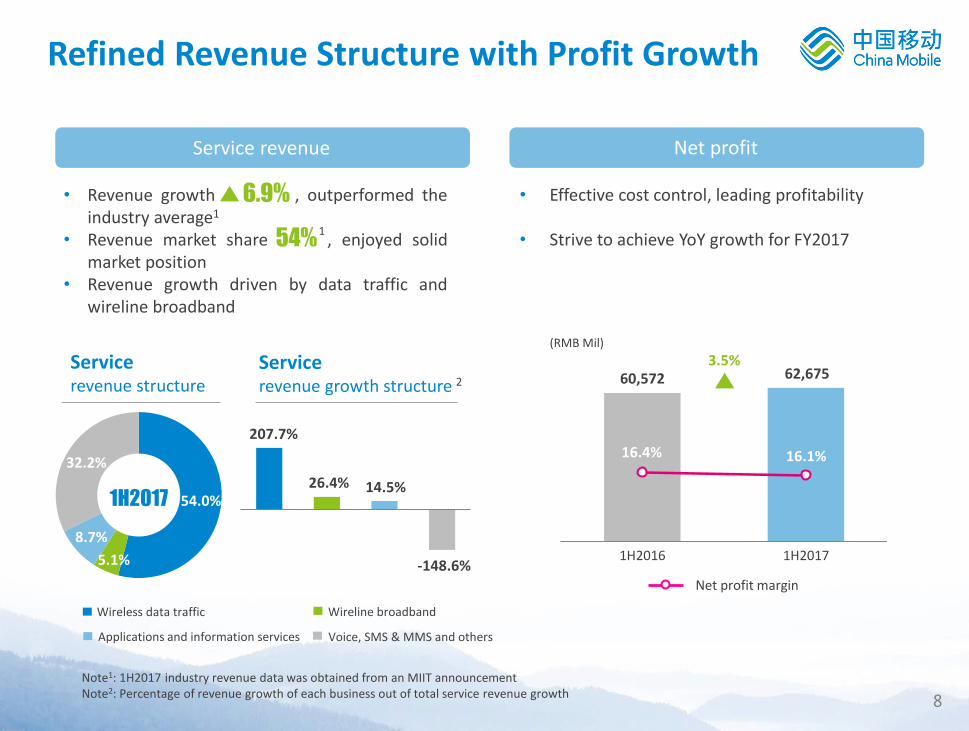
Refined Revenue Structure with Profit Growth
Net profit Service revenue
Note1: 1H2017 industry revenue data was obtained from an MIIT announcement
• Revenue growth , outperformed the industry average1
• Revenue market share , enjoyed solid market position
• Revenue growth driven by data traffic and wireline broadband
• Effective cost control, leading profitability
• Strive to achieve YoY growth for FY2017
6.9%
Service revenue structure
Service revenue growth structure
1H2016 1H2017
60,572 62,675
Net profit margin
3.5%
16.4% 16.1%
(RMB Mil)
54%
Wireline broadband
Voice, SMS & MMS and others
Wireless data traffic
Applications and information services
207.7%
26.4% 14.5%
-148.6% 5.1%
1H2017
32.2%
8.7%
1
2
Note2: Percentage of revenue growth of each business out of total service revenue growth
54.0%
9
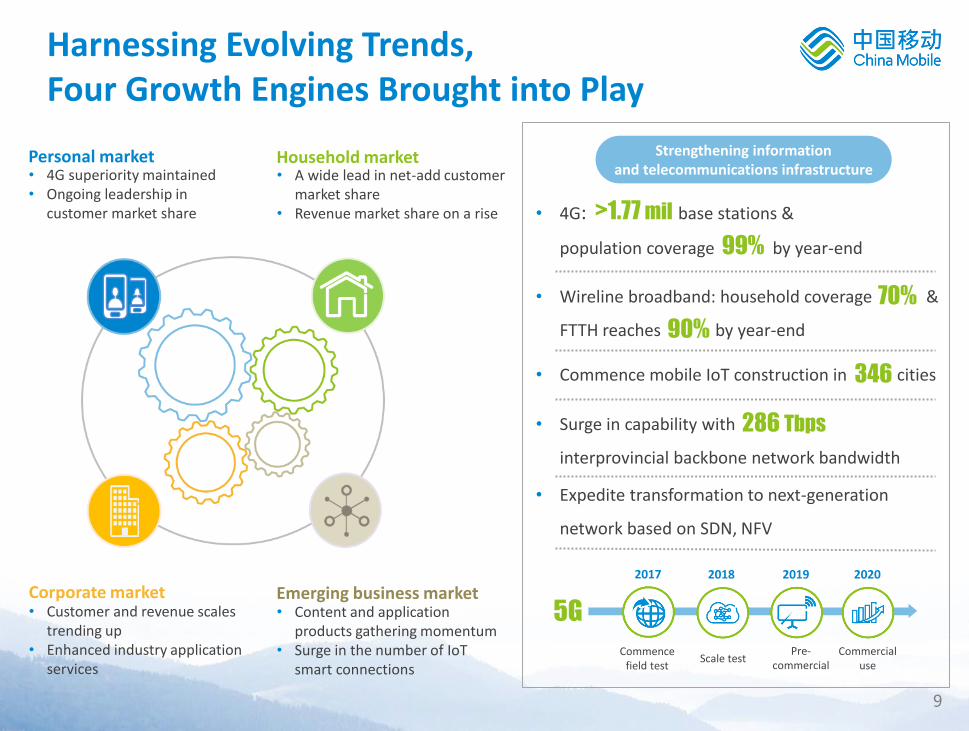
• Commence mobile IoT construction in cities
• Expedite transformation to next-generation
network based on SDN, NFV
Harnessing Evolving Trends, Four Growth Engines Brought into Play
Strengthening information and telecommunications infrastructure
• Wireline broadband: household coverage &
FTTH reaches by year-end 90%
70%
• Surge in capability with
interprovincial backbone network bandwidth
• A wide lead in net-add customer market share
• Revenue market share on a rise
Household market • 4G superiority maintained • Ongoing leadership in
customer market share
Personal market
• Customer and revenue scales trending up
• Enhanced industry application services
Corporate market • Content and application
products gathering momentum • Surge in the number of IoT
smart connections
Emerging business market
• 4G: base stations &
population coverage by year-end 99%
>1.77 mil
5G
2018 2019 2020 2017
Commence field test
Scale test Pre-
commercial Commercial
use
286 Tbps
346
10
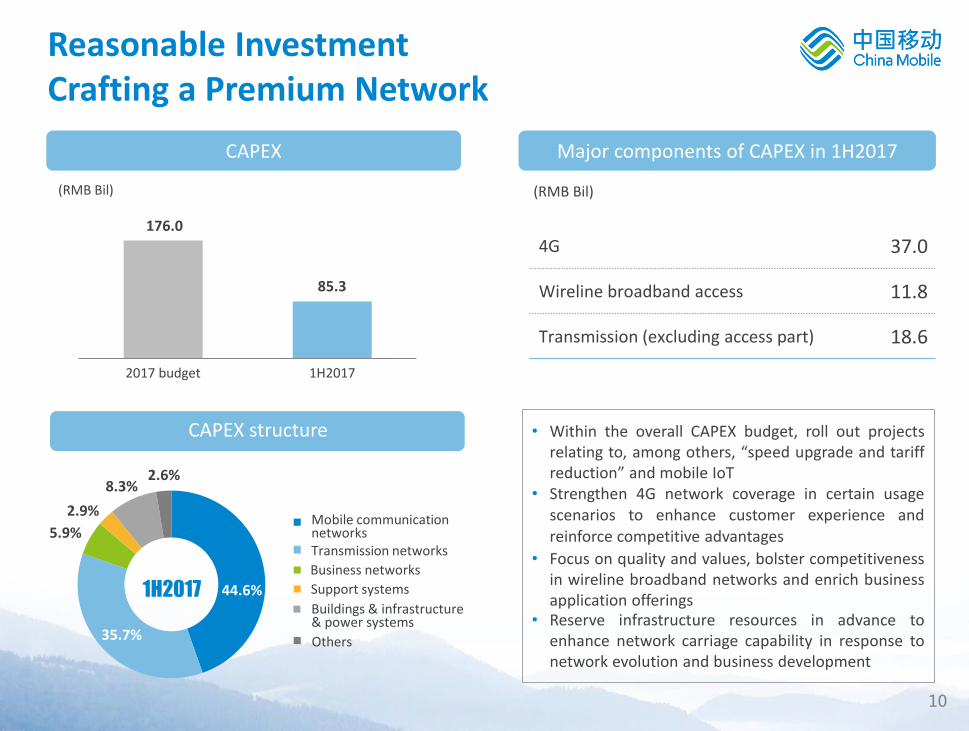
2017 budget 1H2017
CAPEX
44.6%
35.7%
1H2017
CAPEX structure
• Strengthen 4G network coverage in certain usage scenarios to enhance customer experience and reinforce competitive advantages
• Reserve infrastructure resources in advance to enhance network carriage capability in response to network evolution and business development
• Focus on quality and values, bolster competitiveness in wireline broadband networks and enrich business application offerings
• Within the overall CAPEX budget, roll out projects relating to, among others, “speed upgrade and tariff reduction” and mobile IoT
4G 37.0
Wireline broadband access 11.8
Transmission (excluding access part) 18.6
Major components of CAPEX in 1H2017
(RMB Bil) (RMB Bil)
Mobile communication networks Transmission networks
Business networks
Support systems
Buildings & infrastructure & power systems
Others
176.0
85.3
Reasonable Investment Crafting a Premium Network
2.6%
2.9%
8.3%
5.9%
11
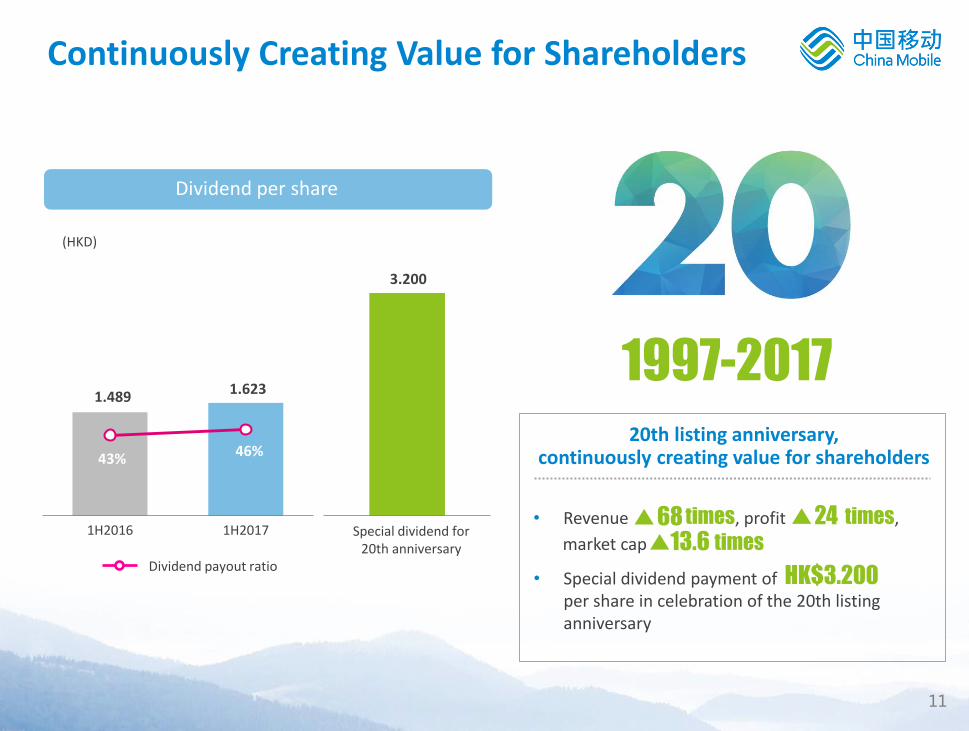
1H2016 1H2017• Revenue times, profit times,
market cap times
Continuously Creating Value for Shareholders
Dividend per share
20th listing anniversary, continuously creating value for shareholders
13.6 68 24
(HKD)
Dividend payout ratio • Special dividend payment of
per share in celebration of the 20th listing anniversary
1.489
43% 46%
3.200
1.623
Special dividend for 20th anniversary
1997-2017
HK$3.200
12
Operating Performance
Mr. LI Yue
Executive Director & CEO
02
13
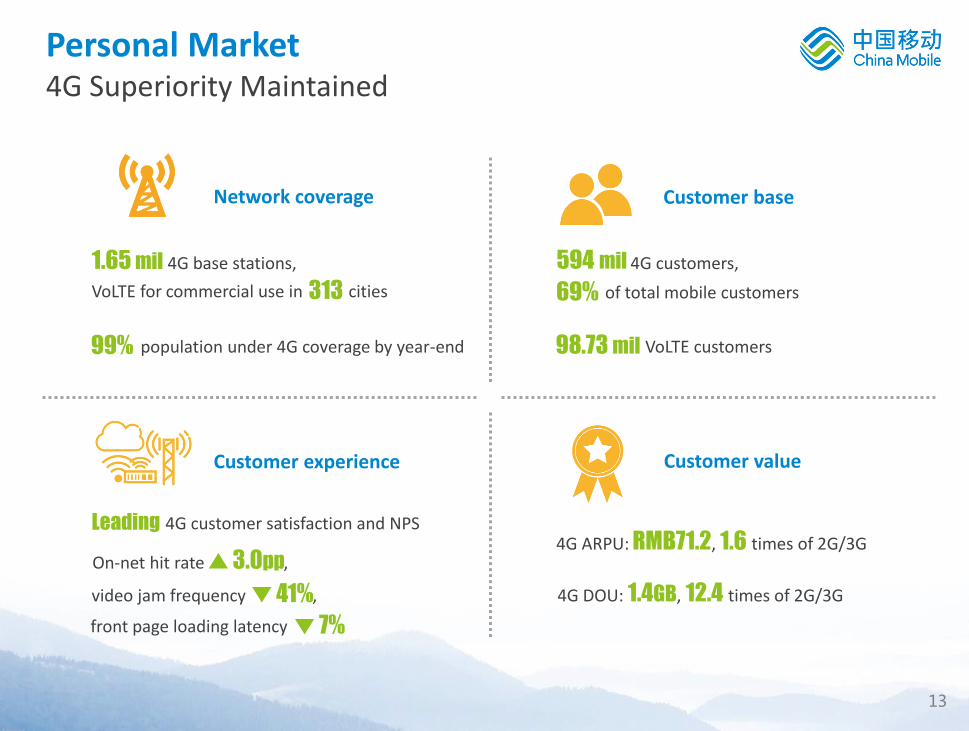
video jam frequency ,
VoLTE for commercial use in cities
4G DOU: 1.4GB, 12.4 times of 2G/3G
Personal Market 4G Superiority Maintained
mil 4G base stations, 1.65
4G ARPU: RMB71.2, 1.6 times of 2G/3G
Customer value
Network coverage Customer base
4G customers,
VoLTE customers
594 mil
98.73 mil
of total mobile customers 69%
4G customer satisfaction and NPS
Leading
population under 4G coverage by year-end 99%
313
On-net hit rate ,
41%
3.0pp
7% front page loading latency
Customer experience
14
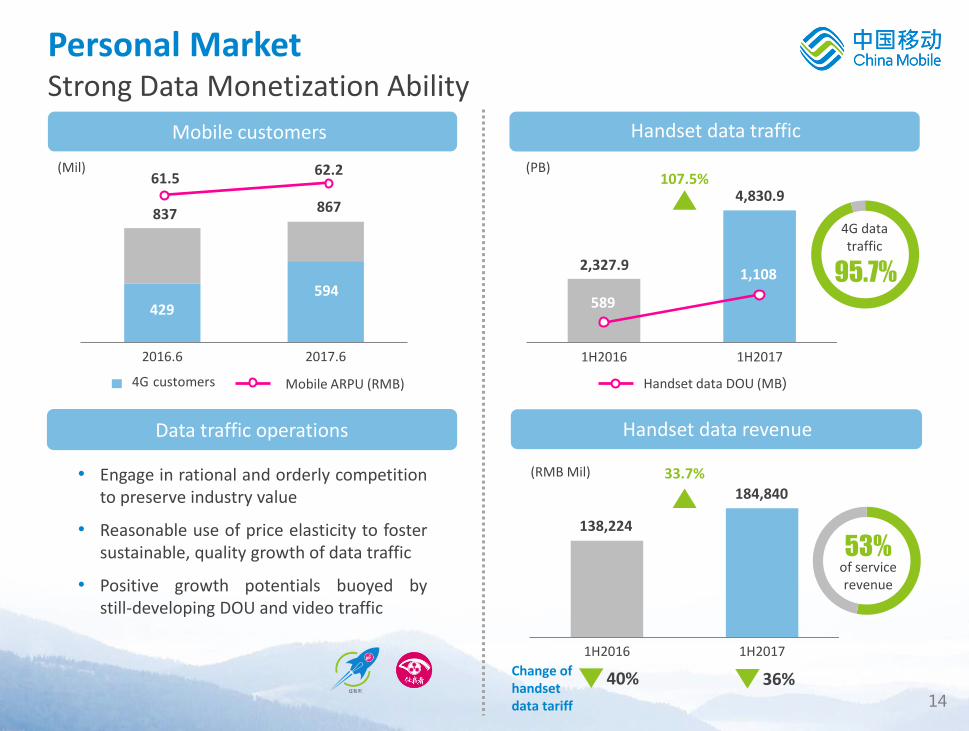
1H2016 1H2017
1H2016 1H2017
Personal Market Strong Data Monetization Ability
Handset data traffic
Handset data revenue
Mobile customers
移动业务收入
(PB)
4G data traffic
95.7% 2,327.9
4,830.9 107.5%
Handset data DOU (MB)
36% Change of handset data tariff
40%
33.7%
53% of service revenue
184,840
4G customers Mobile ARPU (RMB)
Data traffic operations
• Engage in rational and orderly competition to preserve industry value
• Reasonable use of price elasticity to foster sustainable, quality growth of data traffic
• Positive growth potentials buoyed by still-developing DOU and video traffic
(Mil)
(RMB Mil)
1,108
589
138,224
2016.6 2017.6
837 867
429 594
61.5 62.2
15
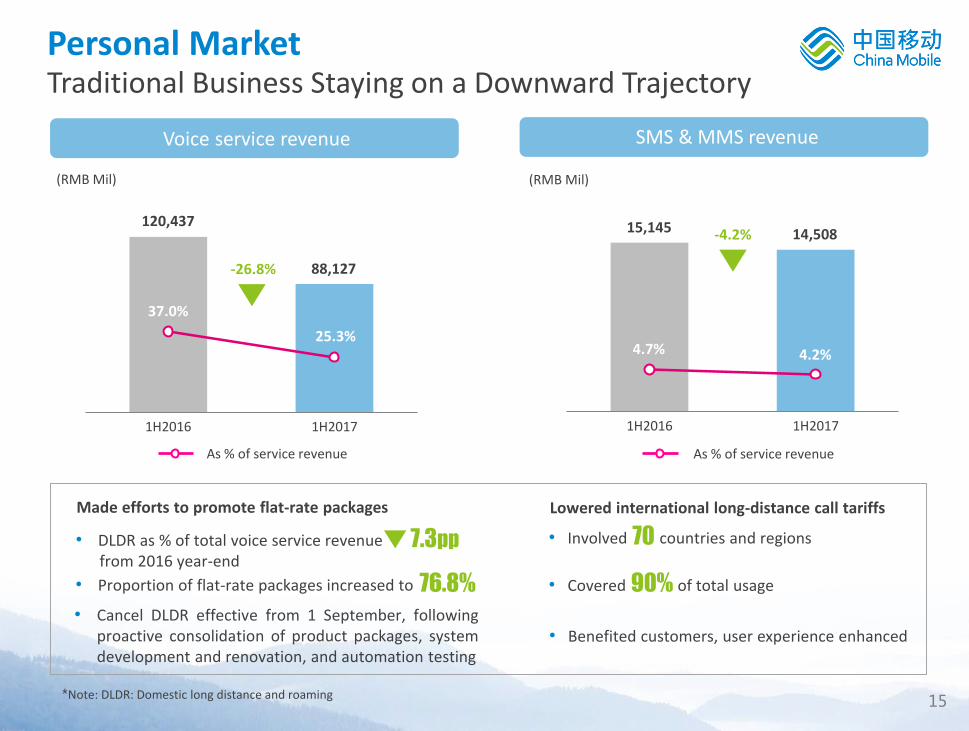
Personal Market Traditional Business Staying on a Downward Trajectory
37.0% 37.0%
4.7% 4.7%
1H2016 1H2017
-26.8% 88,127
Voice service revenue
120,437
1H2016 1H2017
(RMB Mil)
-4.2% 14,508 15,145
SMS & MMS revenue
37.0%
25.3% 4.7% 4.2%
As % of service revenue As % of service revenue
• DLDR as % of total voice service revenue from 2016 year-end
• Proportion of flat-rate packages increased to
• Cancel DLDR effective from 1 September, following proactive consolidation of product packages, system development and renovation, and automation testing
7.3pp
76.8%
Made efforts to promote flat-rate packages Lowered international long-distance call tariffs
• Involved countries and regions 70
• Covered of total usage
• Benefited customers, user experience enhanced
90%
(RMB Mil)
*Note: DLDR: Domestic long distance and roaming
16
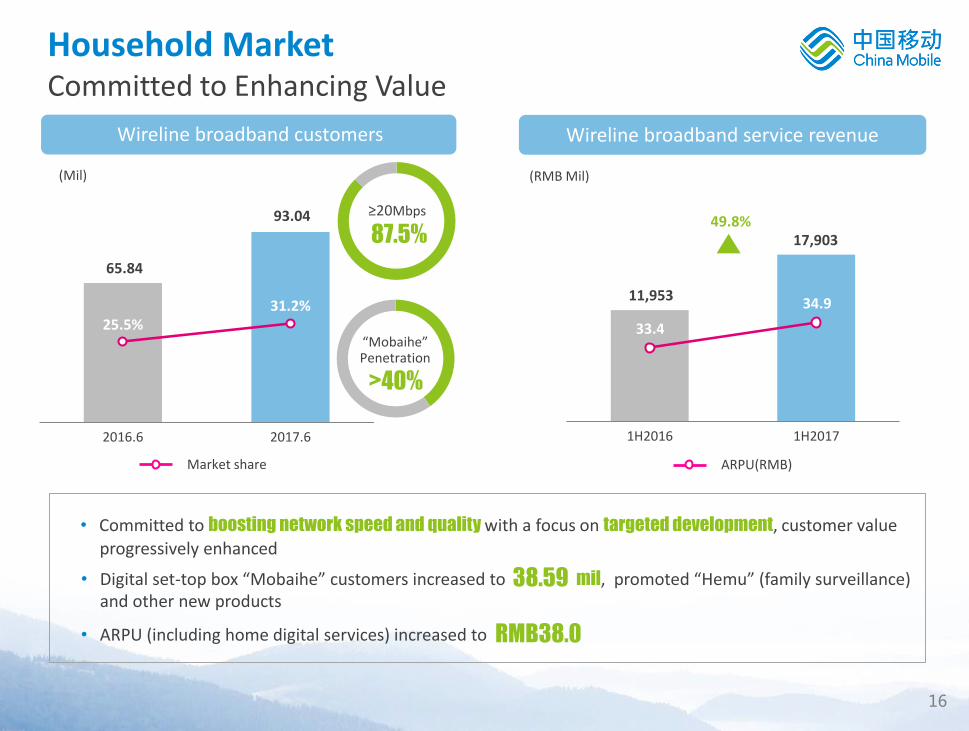
• Digital set-top box “Mobaihe” customers increased to mil, promoted “Hemu” (family surveillance) and other new products
Household Market Committed to Enhancing Value
Wireline broadband customers
≥20Mbps
2016.6 2017.6
(Mil)
65.84
93.04
25.5% 31.2%
Market share
“Mobaihe” Penetration
>40%
1H2016 1H2017
(RMB Mil)
11,953
17,903 49.8%
Wireline broadband service revenue
33.4
34.9
ARPU(RMB)
• Committed to boosting network speed and quality with a focus on targeted development, customer value
RMB38.0 • ARPU (including home digital services) increased to
38.59
progressively enhanced
87.5%
17
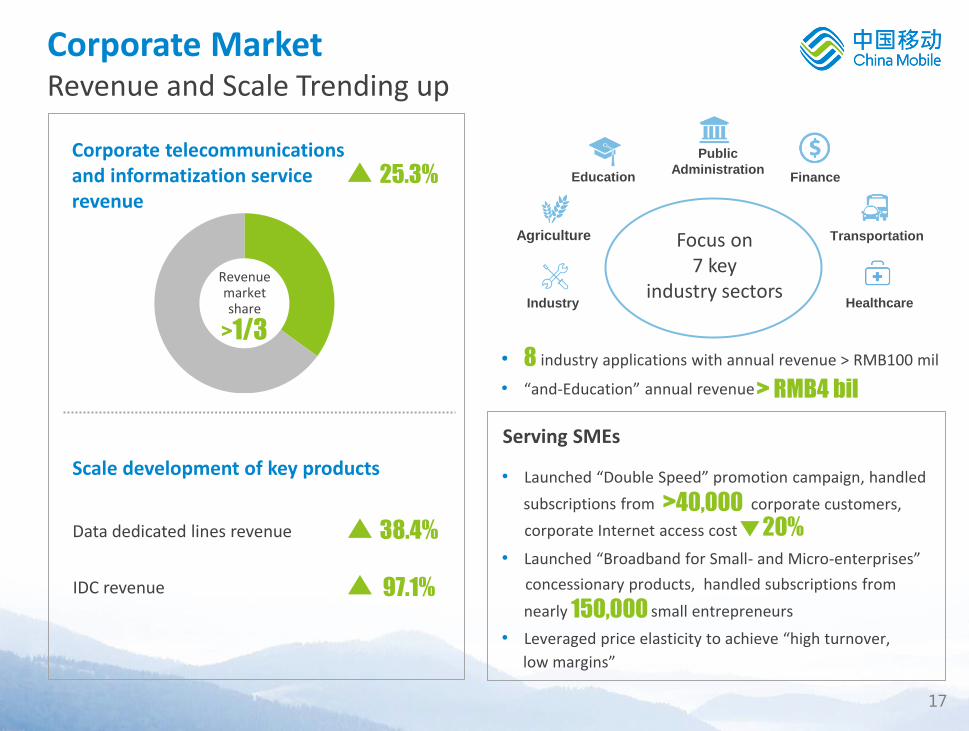
• Launched “Broadband for Small- and Micro-enterprises”
nearly small entrepreneurs
Corporate Market Revenue and Scale Trending up
Data dedicated lines revenue
IDC revenue
Corporate telecommunications and informatization service revenue
Scale development of key products
25.3%
38.4%
97.1%
• Launched “Double Speed” promotion campaign, handled
• Leveraged price elasticity to achieve “high turnover,
Serving SMEs
150,000
• industry applications with annual revenue > RMB100 mil
• “and-Education” annual revenue
8
> RMB4 bil
>1/3
Revenue market share
20% corporate Internet access cost
Education
Public
Administration
Healthcare
Finance
Transportation Focus on 7 key
industry sectors Industry
Agriculture
>40,000 subscriptions from corporate customers,
concessionary products, handled subscriptions from
low margins”
18
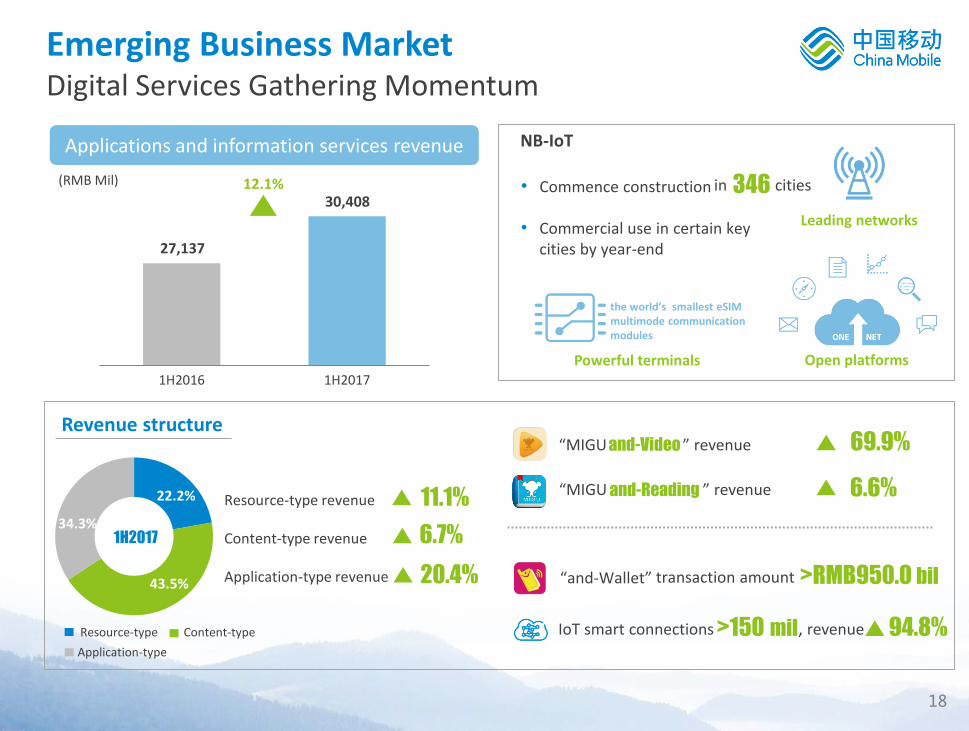
in cities
1H2016 1H2017
Emerging Business Market Digital Services Gathering Momentum
Applications and information services revenue
(RMB Mil) 12.1%
IoT smart connections , revenue >150 mil
“MIGU ” revenue
“MIGU ” revenue
“and-Wallet” >RMB950.0 bil
69.9%
6.6%
94.8%
22.2%
34.3%
43.5%
Resource-type Content-type
Application-type
Resource-type revenue Content-type revenue Application-type revenue
11.1%
6.7%
20.4%
1H2017
27,137
• Commence construction
NB-IoT
• Commercial use in certain key cities by year-end
346
Leading networks
the world’s smallest eSIM multimode communication modules
Powerful terminals
One NET
Open platforms
Revenue structure
30,408
and-Video
and-Reading
transaction amount
19
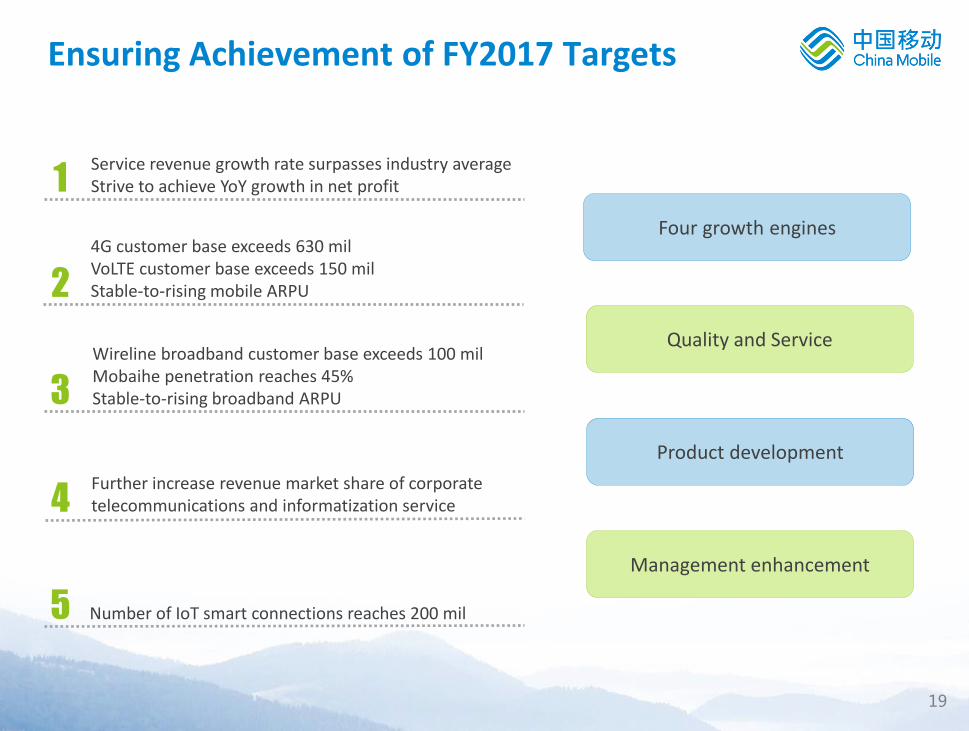
Service revenue growth rate surpasses industry average Strive to achieve YoY growth in net profit
Number of IoT smart connections reaches 200 mil
3
5
1
2
Four growth engines
Quality and Service
Product development
Management enhancement
Further increase revenue market share of corporate telecommunications and informatization service 4
Ensuring Achievement of FY2017 Targets
4G customer base exceeds 630 mil VoLTE customer base exceeds 150 mil Stable-to-rising mobile ARPU
Wireline broadband customer base exceeds 100 mil Mobaihe penetration reaches 45% Stable-to-rising broadband ARPU
20
Financial Results 03
Mr. DONG Xin
Executive Director, Vice President & CFO
21
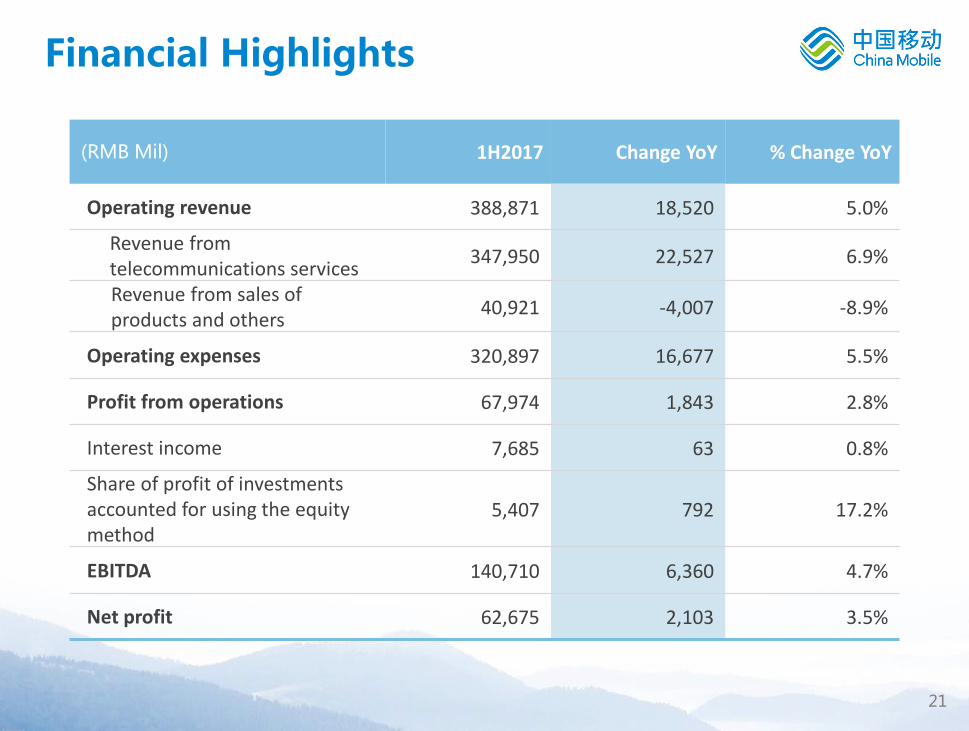
(RMB Mil) 1H2017 Change YoY % Change YoY
Operating revenue 388,871 18,520 5.0%
Revenue from telecommunications services
347,950 22,527 6.9%
Revenue from sales of products and others
40,921 -4,007 -8.9%
Operating expenses 320,897 16,677 5.5%
Profit from operations 67,974 1,843 2.8%
Interest income 7,685 63 0.8%
Share of profit of investments accounted for using the equity method
5,407 792 17.2%
EBITDA 140,710 6,360 4.7%
Net profit 62,675 2,103 3.5%
Financial Highlights
22
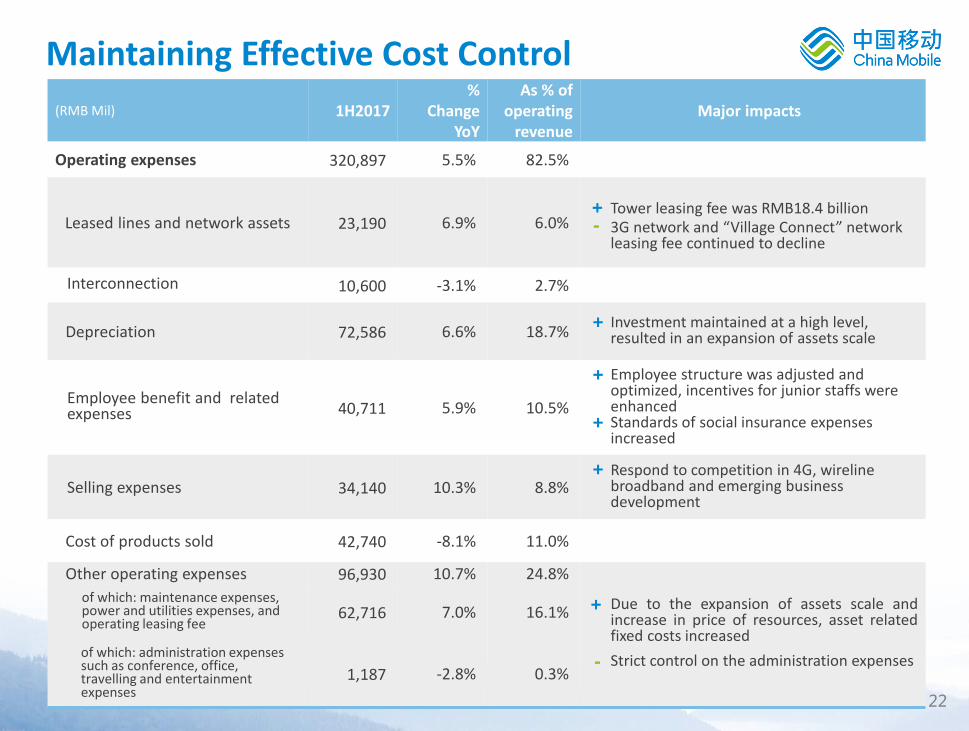
(RMB Mil) 1H2017 %
Change YoY
As % of operating
revenue Major impacts
Operating expenses 320,897 5.5% 82.5%
Leased lines and network assets 23,190 6.9% 6.0% Tower leasing fee was RMB18.4 billion 3G network and “Village Connect” network leasing fee continued to decline
Interconnection 10,600 -3.1% 2.7%
Depreciation 72,586 6.6% 18.7% Investment maintained at a high level, resulted in an expansion of assets scale
Employee benefit and related expenses 40,711 5.9% 10.5%
Employee structure was adjusted and optimized, incentives for junior staffs were enhanced Standards of social insurance expenses increased
Selling expenses 34,140 10.3% 8.8% Respond to competition in 4G, wireline broadband and emerging business development
Cost of products sold 42,740 -8.1% 11.0%
Other operating expenses 96,930 10.7% 24.8%
Due to the expansion of assets scale and increase in price of resources, asset related fixed costs increased
Strict control on the administration expenses
of which: maintenance expenses, power and utilities expenses, and operating leasing fee
62,716 7.0% 16.1%
of which: administration expenses such as conference, office, travelling and entertainment expenses
1,187 -2.8% 0.3%
+ -
+
+
+
+
+
Maintaining Effective Cost Control
-
23
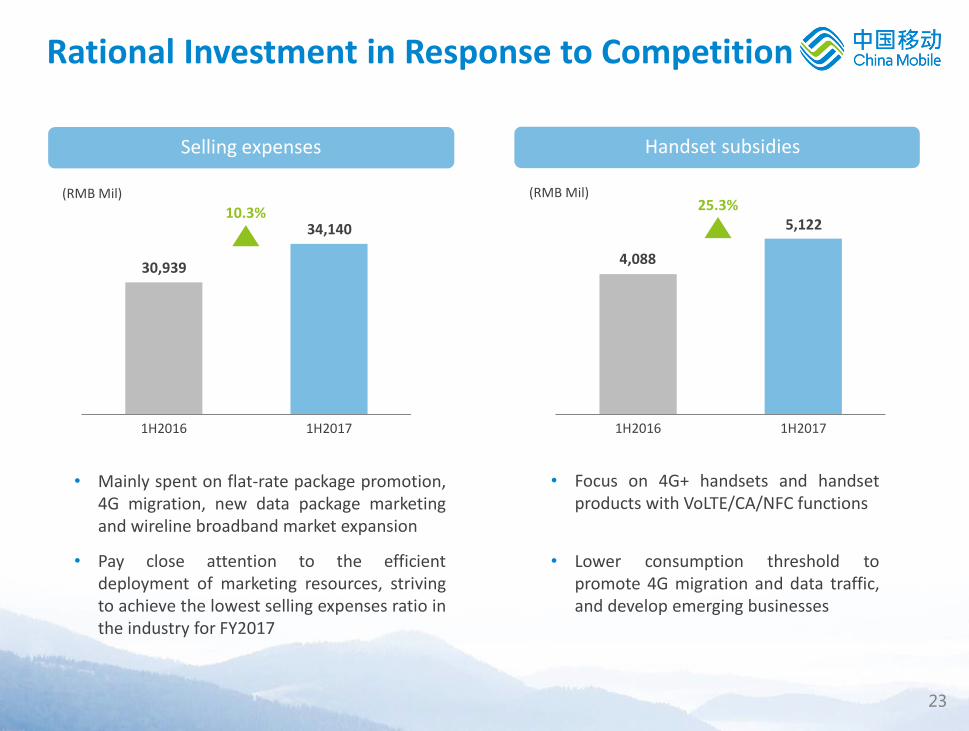
Handset subsidies Selling expenses
1H2016 1H2017
10.3% 34,140
• Mainly spent on flat-rate package promotion, 4G migration, new data package marketing and wireline broadband market expansion
• Pay close attention to the efficient deployment of marketing resources, striving to achieve the lowest selling expenses ratio in the industry for FY2017
30,939
• Focus on 4G+ handsets and handset products with VoLTE/CA/NFC functions
1H2016 1H2017
25.3% 5,122
4,088
(RMB Mil) (RMB Mil)
Rational Investment in Response to Competition
• Lower consumption threshold to promote 4G migration and data traffic, and develop emerging businesses
24
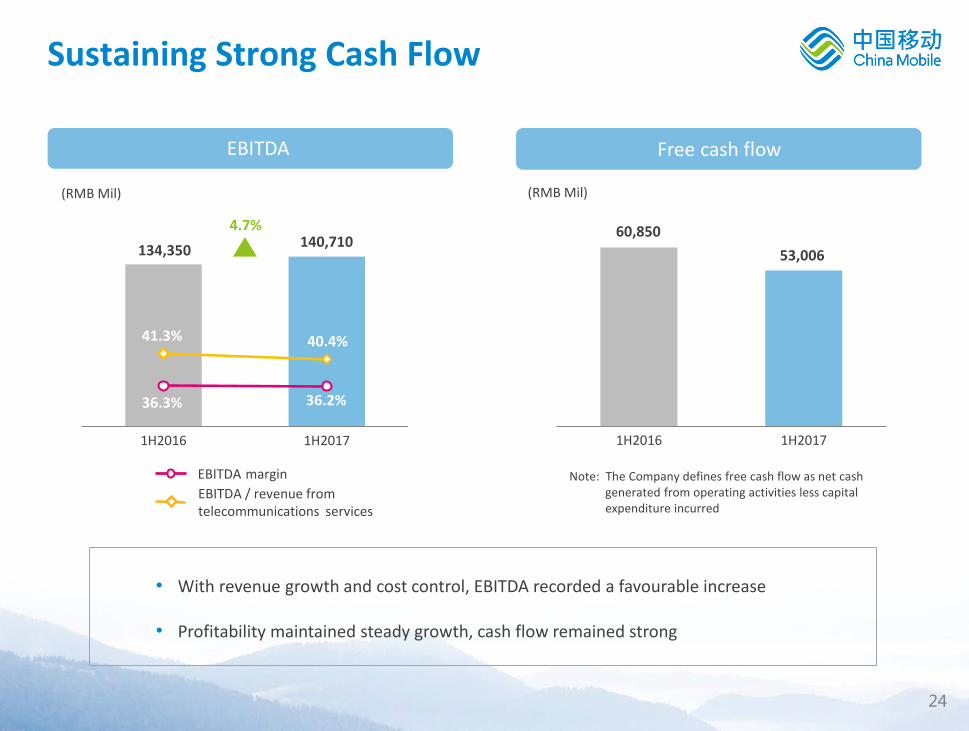
1H2016 1H2017
4.7%
1H2016 1H2017
60,850
53,006
EBITDA Free cash flow
41.3% 40.4%
36.3% 36.2%
140,710 134,350
(RMB Mil) (RMB Mil)
EBITDA / revenue from telecommunications services
EBITDA margin Note: The Company defines free cash flow as net cash generated from operating activities less capital expenditure incurred
• With revenue growth and cost control, EBITDA recorded a favourable increase
• Profitability maintained steady growth, cash flow remained strong
Sustaining Strong Cash Flow
EBITDA
25
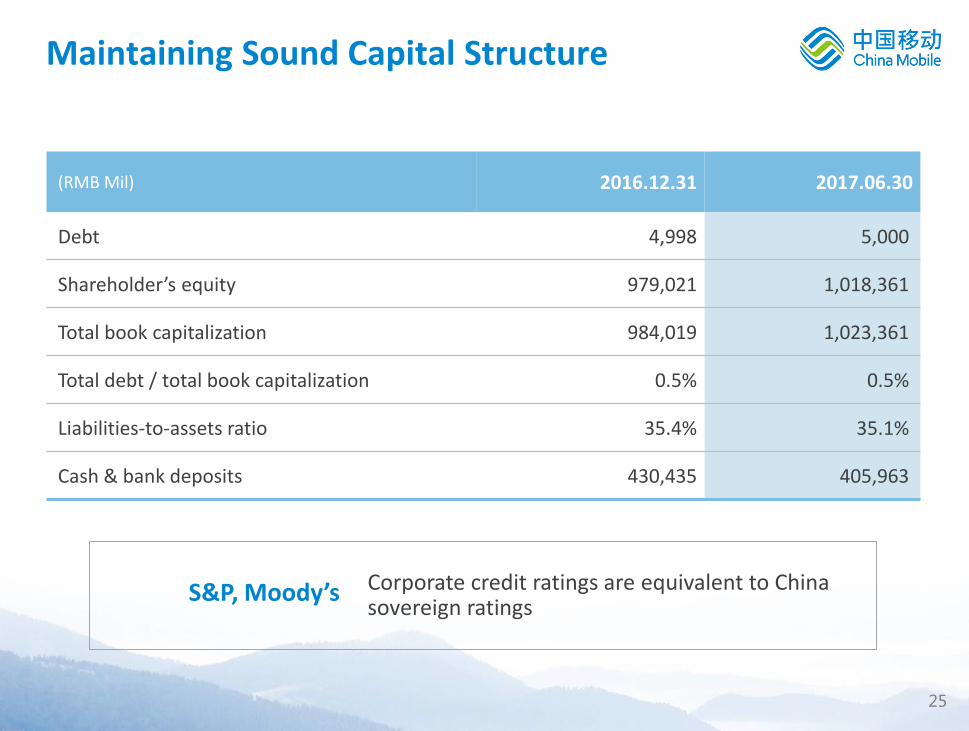
(RMB Mil) 2016.12.31 2017.06.30
Debt 4,998 5,000
Shareholder’s equity 979,021 1,018,361
Total book capitalization 984,019 1,023,361
Total debt / total book capitalization 0.5% 0.5%
Liabilities-to-assets ratio 35.4% 35.1%
Cash & bank deposits 430,435 405,963
S&P, Moody’s Corporate credit ratings are equivalent to China sovereign ratings
Maintaining Sound Capital Structure

26
Thank you
“Asia’s Outstanding Company on Corporate Governance”
“Asian Corporate Director Recognition Award”
“Best Managed Large Cap in China”
“The Asset Platinum Award”
《The Asset》
《Corporate Governance Asia》
《Asiamoney》
“Asia’s Best Investor Relations Company”
“Asia’s Best CEO”
For more information, please contact:
Investor Relations Department: [email protected]
Or visit the Company’s website: www.chinamobileltd.com
27
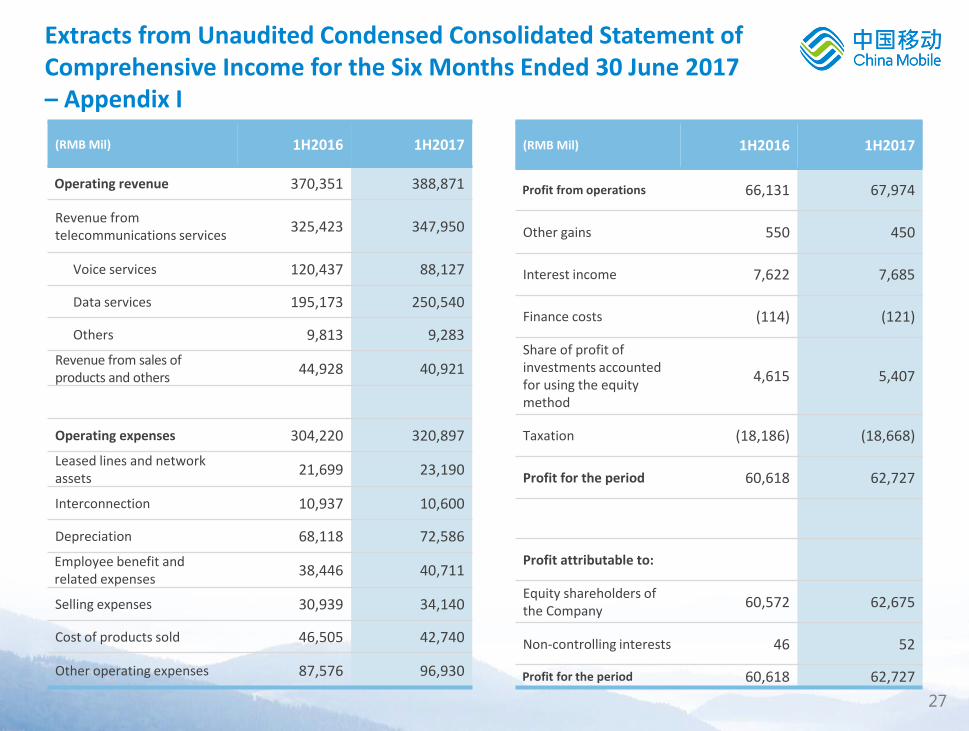
Extracts from Unaudited Condensed Consolidated Statement of Comprehensive Income for the Six Months Ended 30 June 2017 – Appendix I
(RMB Mil) 1H2016 1H2017
Operating revenue 370,351 388,871
Revenue from telecommunications services
325,423 347,950
Voice services 120,437 88,127
Data services 195,173 250,540
Others 9,813 9,283
Revenue from sales of products and others
44,928 40,921
Operating expenses 304,220 320,897
Leased lines and network assets
21,699 23,190
Interconnection 10,937 10,600
Depreciation 68,118 72,586
Employee benefit and related expenses
38,446 40,711
Selling expenses 30,939 34,140
Cost of products sold 46,505 42,740
Other operating expenses 87,576 96,930
(RMB Mil) 1H2016 1H2017
Profit from operations 66,131 67,974
Other gains 550 450
Interest income 7,622 7,685
Finance costs (114) (121)
Share of profit of investments accounted for using the equity method
4,615 5,407
Taxation (18,186) (18,668)
Profit for the period 60,618 62,727
Profit attributable to:
Equity shareholders of the Company
60,572 62,675
Non-controlling interests 46 52
Profit for the period 60,618 62,727
28
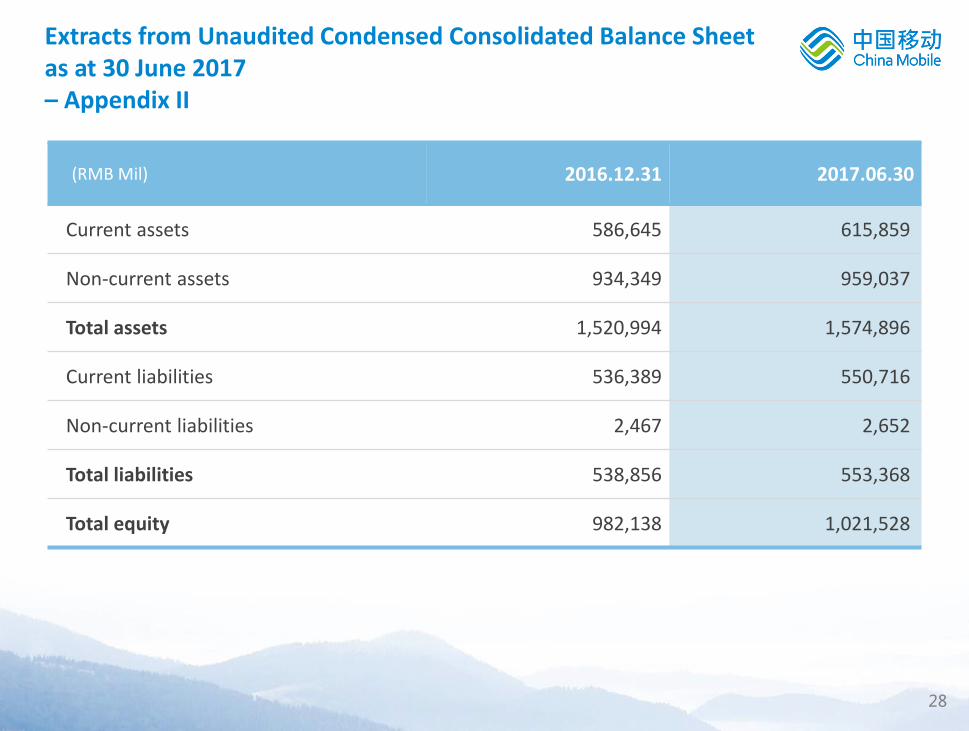
Extracts from Unaudited Condensed Consolidated Balance Sheet as at 30 June 2017 – Appendix II
(RMB Mil) 2016.12.31 2017.06.30
Current assets 586,645 615,859
Non-current assets 934,349 959,037
Total assets 1,520,994 1,574,896
Current liabilities 536,389 550,716
Non-current liabilities 2,467 2,652
Total liabilities 538,856 553,368
Total equity 982,138 1,021,528
29
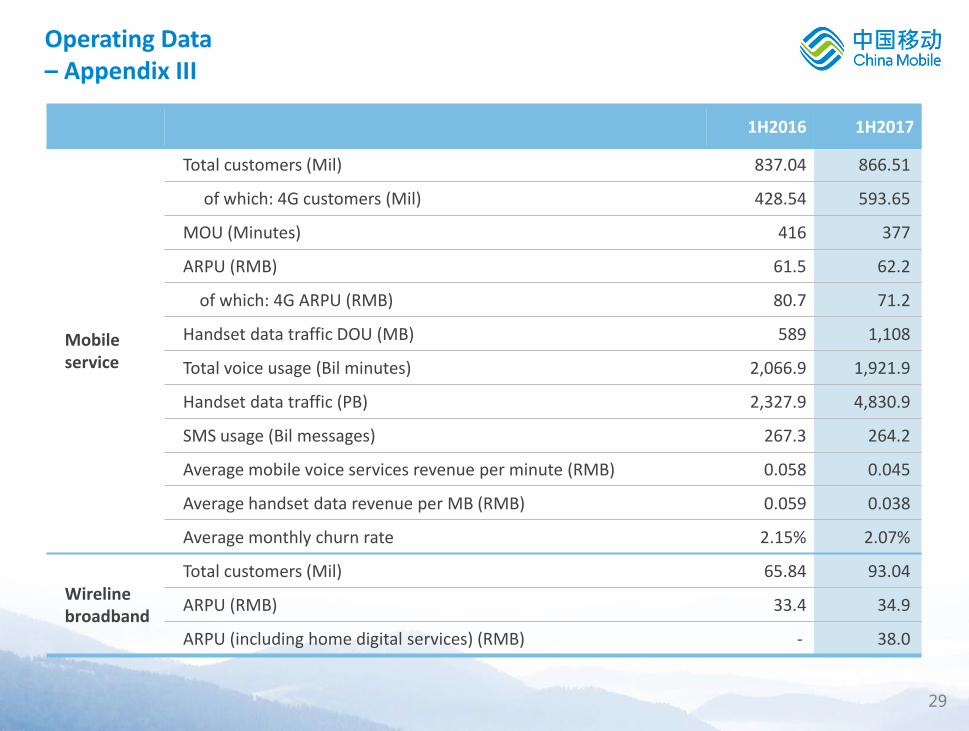
1H2016 1H2017
Mobile service
Total customers (Mil) 837.04 866.51
of which: 4G customers (Mil) 428.54 593.65
MOU (Minutes) 416 377
ARPU (RMB) 61.5 62.2
of which: 4G ARPU (RMB) 80.7 71.2
Handset data traffic DOU (MB) 589 1,108
Total voice usage (Bil minutes) 2,066.9 1,921.9
Handset data traffic (PB) 2,327.9 4,830.9
SMS usage (Bil messages) 267.3 264.2
Average mobile voice services revenue per minute (RMB) 0.058 0.045
Average handset data revenue per MB (RMB) 0.059 0.038
Average monthly churn rate 2.15% 2.07%
Wireline broadband
Total customers (Mil) 65.84 93.04
ARPU (RMB) 33.4 34.9
ARPU (including home digital services) (RMB) - 38.0
Operating Data – Appendix III