Embed Size (px)
Citation preview

FOSTER WHEELER ENVIRONMENTAL CORPORATION
October 202000 2000-17-0291 No Response Required
Mr Robert Hunt Project Manager New England District 0 ( US Army Corps of Engineers 696 Virginia Road ci Concord MA 01742-2751
Subject USACE CONTRACT NO DACW-33-94-D-0002 TOTAL ENVIRONMENTAL RESTORATION CONTRACT (TERC) TASK ORDER NO 017 -NEW BEDFORD HARBOR SUPERFUND SITE OU-1 FINAL EVALUATION OF SIDEWALL LINER ALTERNATIVES FOR CDF C AND PCB LEAKAGE RATES MODELING
Dear Mr Hunt
Enclosed are responses to comments on the Draft Technical Memorandum evaluating (1) sidewall liner alternatives for the sheet pile wall with half dike design and (2) PCB leakage rates modeling The Final Technical Memorandum which incorporates the responses to comments is also enclosed Please note that the revised cost estimate of the double sheet pile wall with exterior dike and preferred liner system design included in Section 80 of the document are associated with only the offshore portion of CDF C
If you have any questions or comments on the Final Technical Memorandum please contact me at (617) 457-8234 Thank you
Sincerely
Allen J Ikalainen PE Project Engineer
Enclosure 2000-17-0290
cc _ P CraffeyT M Beaudoin USACE (1) R Simeone USACE (3) G Willant(l) R Francisco (1 ) KHartel(l) E Griffin (1) A Tognon (1)
File PM 11 DO 17 1554
SDMS DocID 000217268
133 FEDERAL STREET 6trade FLOOR BOSTON MA 02110 TEL 617-457-8200 FAX 617-457-84988499
FOSTER WHEELER ENVIRONMENTAL CORPORATION TOTAL ENVIRONMENTAL RESTORATION CONTRACT (TERC)
CONTRACT NO DACW33-94-D-0002 TASK ORDER NO 017 NEW BEDFORD HARBOR SUPERFUND SITE - NEW BEDFORD MA
ANNOTATED RESPONSES TO REVIEW COMMENTS ON THE EVALUATION OF SIDEWALL LINER ALTERNATIVES AND PCB LEAKAGE RATES
MODELING FOR CDF C
The following are responses to US Army Corps of Engineers (USAGE) review comments on the Draft Technical Memorandum Sheet Pile Wall with Half Dike Design Evaluation of Sidewall Liner Alternatives and PCB Leakage Rates Modeling Confined Disposal Facility (CDF) C dated August 1 2000 The USAGE comments are provided in italic type followed by Foster Wheelers responses in bold type-
Reviewer Karen Schofield (USAGE) Date August 8 2000
Comment 1 Table 5-1 Soil-Based Slurry Wall shy One disadvantage seems misplaced as stated It says Cement subject to corrosion in saltwater environment This is the soil-based wall doesn t this statement belong in the cement-based wall disadvantages instead
Response Yes that statement was misplaced and has been moved to the disadvantages listed for a cement-based slurry wall
Comment 2 Table 5-1 shy In the discussions of the GSE GundWall a depth limitation of 20 feet is mentioned This depth should be specifically mentioned as a disadvantage in the table
Response The depth limitation of 20 feet has been added to the disadvantages listed for a GSE GundWallreg
Comment 3 Figure 7-1 enough
The slurry is only shown to the organic clay layer Is this shown low
Response This figure presents a preliminary conceptual design where the slurry wall would fill the space between the two steel sheets and the GundWallreg would be inserted into the slurry wall and keyed five feet into the organic clay creating the most impermeable vertical barrier In reality there would likely be some mixing of the clay-bentonite slurry and the underlying organic clay The degree of mixing is not known at this preliminary stage of the design
Comment 4 Page 14 shy In step 1 and step 5please clarify that each row of sheet piling is 1360 linear feet long Its hard to knowfor sure as written
Response Length of sheeting refers to the distance from the top of the sheet pile to the bottom of the sheet pile (ie the difference between the top elevation to the tip elevation) For clarification it has been stated that the alignment of each row of steel sheet piling as well as GundWallreg is 1360 linear feet
2000-17-0291 101700
Comment 5 Page 14 - In step 2 is 20 feet beyond toe enough distance to help create contaminant free mud wave it seems kind of short
Response For this conceptual design 20 feet is just a preliminary estimatebe refined as the design proceeds
This number will
Comment 6 Page 14 shy In step 3 please state the type of clay making up the 20200 CY Is it inorganic or organic Is there any sand mixed in Also state how clean it is As stated now its unclear Shouldnt the clean be in quotes clean Also if it is stated to need off-site disposal state the type assumed such as subtitle D etc
Response The sediment to be excavated as part of CDF C construction consists of organic clay or organic silt containing varying amounts of fine to medium sand and shell fragments This clean clay will have PCB concentrations less than the target cleanup level of 10 ppm For estimating purposes it is assumed that the excavated sediment will have a PCB concentration of at least 2 ppm and will required out-ofshystate disposal at a Subtitle D landfill
Comment 7 Page 15 shy In step 6 the first statement seems to say that the double sheet pile composite wall is being built first in the water Then the embankment is being placed Do they need to be done simultaneously for stability of the wall andor does wall have to go deeper If so please state in a little more detail
Response The embankment is being constructed to support the steel sheet pile walls once the CDF is filled and a temporary cap and surcharge have been applied The embankment is not needed for the stability of the composite wall when the CDF is empty and does not have to be constructed simultaneously with the composite wall
Comment 8 Page 15 shy In step 7 it says may It would seem from discussions that desiccation is a big deal and something undesired therefore shouldnt it be will instead of may Therefore it should be included in Figure 7-1 and in the cost estimate At the very least it should be stated on the cost estimate as a contingency in either a lump sum allowance a unit cost (if known) or an appropriate percentage Contingency is missing to begin with and should be added to the estimate
Response The material used to fill the space between the two sheet pile walls is still undetermined It may be a clay-bentonite cement-bentonite or clay-cementshybentonite slurry Because of the number of variables it is not possible to say definitely if desiccation will or will not be an issue Therefore the best statement to make is that a cap may be installed over the clay-bentonite slurry wall to prevent possible desiccation This cap has not been included as a contingency in the cost estimate since it is not known if it is needed
Foster Wheeler does not typically include a contingency with a cost estimate and to be consistent with the cost estimate prepared for the alternatives evaluation it has not been added
Comment 9 Detail Sheets are missing in Cost Estimate for Fill Between Sheets and Install GundWall please add Are they quotes or historical data If so add reference
2000-17-0291 101700
Response A detail sheet has been added to the cost estimate for these two items (both items will be performed by the same subcontractor) They are quotes and are now noted as such
Comment 10 Indirect CostMarkups of only a little more than 33 (including fee) are shown in the cost estimate This seems low FWENC budgets carry 40 Therefore 40 should be carried here at this preliminary stage
Response To be consistent with the approach used in preparing the cost estimate for the alternatives evaluation a fee of 33 is still carried A Foster Wheeler estimator is currently trying to develop a better indirect costmarkup percentage (including fee) to use in construction cost estimates
Reviewer Maurice Beaudoin (USAGE) Date August 182000
Comment 1 Paragraph 66 infers that there is a navigation channel north of the Coggeshall Street Bridge There is no marked or regulated channel north of Coggeshall Street and should not be mentioned
Response Although the widening of the embankment would not encroach upon a marked or regulated channel the mudline elevation drops is as low as -20 feet NGVD at the midpoint of this channel This depth to mudline would make the construction of the embankment costly and difficult
Comment 2 The proposed double sheet pile wall with a clay-bentonite slurry and GundWall seems to be overkill in my opinion It would make economic sense to use a single wall with a clay-bentonite slurry wall within the embankment portion on the river side of the sheeting
Response As discussed in Section 66 there are several reasons that a clay-cement-bentonite slurry wall installed into the embankment would not serve as an effective liner system (1) that the slurry wall would not be keyed into an aquitard (ie the organic clay) at any depth (2) the embankment would have to be considerably wider (3) it may be structurally infeasible and (4) saltwater would have a negative impact on the bentonite in the wall
2000-17-0291 101700
Additional changes that have been made based on internal comments are as follows
Table 5-1 Table 5-1
Table 5-1
Section 52
Section 54
Section 54
Section 54
Section 54
Section 55
Section 60 Section 63
Section 63 Section 64
Section 68
Section 68
Section 68
Figure 7-1 Section 70
Section 80 Section 80
Appendix A
Appendix A Appendix A
Cement is subject to degradation rather than corrosion in a saltwater environment Desiccation and cracking lead to increased permeability of slurry walls rather than increased porosity Corrosion of the steel sheet pile wall leads to an increase in both horizontal and vertical migration of contaminants Sealants which are injected into the interlocking joints after the sheets are driven may flow through not fill joints which have become separated Vinyl sheet pile walls are constructed by driving prefabricated interlocking Z-shaped vertical sheets of rigid polymer into the soil Vinyl sheet pile walls are used as an alternative to steel sheet pile walls where structural requirements are less A series of weep holes are usually installed to minimize rather than accelerate the dispersion of hydrostatic loads Sealants which are injected into the interlocking joints after the sheets are driven may flow through not fill joints which have become separated Once inserted into this layer the lateral migration of fluids is theoretically blocked both laterally and vertically Introduction added to Section 60 A third option would be to install a continuous vinyl sheet pile wall two to three feet in front of and anchored to the structural steel sheet piling Short-term permeability could theoretically be as high low as 107 cmsec The slurry wallwould be subject to corrosion degradation in a relatively saltwater environment because of depending on the cement content Both the slurry wall and GundWallreg would be keyed into the organic clay and would provide a system permeability ef-ti gt as low as 10 cmsec Note however that the saltwater could shrink change the structure of the bentonite clay particles slightly increasing the porosity of the barrier Because this option most closely meets the composite liner requirements specified in the ROD and the Massachusetts Solid Waste Management Regulations it is recommended as the preferred liner system Riprap added on exposed face of embankment Step 6 An external embankment to support the sheet pile walls once the CDF is filled and a temporary cap and surcharge have been applied of the CDF will be built from a foundation elevation of approximately -14 NGVD to a crest elevation of 8 NGVD The cost estimate for the double sheet pile wall with exterior half dike Bullet 1 The disposal capacity of CDF C has been reduced to an estimate of 84440 cubic yards based on the current configuration The original disposal capacity was approximately 95000 cubic yards From that number 8900 cubic yards is used for the disposal of contaminated dredged sediment Another 1660 cubic yards is lost due to the second row of steel sheet piles being installed in front of the first row Pages 1 6 and 7 Marine fill has been changed to fill below water and land fill has been changed to fill above water Page 4 Title has been changed to Pre-dredge Contaminated Sediment Page 5 Title has been changed to Excavate Organic Clay
2000-17-0291 101700
lt--n-bull-1^-_ Kecoras _enfs lt~ T
Total Environmental Restoration Contract
New England Division
USAGE Contract No DACW33-94-D-0002
FOSTER WHEELER ENVIRONMENTAL CORPORATION
USACE CONTRACT NO DACW33-94-D-0002 TASK ORDER NO 017
TOTAL ENVIRONMENTAL RESTORATION CONTRACT
FINAL TECHNICAL MEMORANDUM
SHEET PILE WALL WITH HALF DIKE DESIGN EVALUATION OF SIDEWALL LINER ALTERNATIVES
AND PCB LEAKAGE RATES MODELING
CONFINED DISPOSAL FACILITY (CDF) C NEW BEDFORD HARBOR SUPERFUND SITE
New Bedford Massachusetts October 2000
Prepared for US Army Corps of Engineers
New England District Concord Massachusetts
2000-17-0290 102300
USAGE CONTRACT NO DACW33-94-D-0002 TASK ORDER NO 017
TOTAL ENVIRONMENTAL RESTORATION CONTRACT
FINAL TECHNICAL MEMORANDUM
SHEET PILE WALL WITH HALF DIKE DESIGN EVALUATION OF SIDEWALL LINER ALTERNATIVES AND
PCB LEAKAGE RATES MODELING CONFINED DISPOSAL FACILITY (CDF) C
NEW BEDFORD HARBOR SUPERFUND SITE
New Bedford Massachusetts
October 2000
Prepared for US Army Corps of Engineers
New England District Concord Massachusetts
Prepared by Foster Wheeler Environmental Corporation
133 Federal Street Boston Massachusetts 02110
Revision Date Prepared by Approved by Paged Affected 0 101700 Erin Griffin Allen Ucalainen PE All
Andrew Tognon
2000-17-0290 101700
TABLE OF CONTENTS
10 INTRODUCTION 1
20 LINER REQUIREMENTS SPECIFIED IN THE RECORD OF DECISION 1
30 LINER SYSTEMS CONVENTIONALLY EMPLOYED IN LANDFILLS 1 31 General Requirements 1 32 Evaluation of Liner Systems 2
40 OVERVIEW OF VERTICAL BARRIERS 2
50 EXAMPLES OF VERTICAL BARRIER SYSTEMS 3 51 Slurry Wall 3 52 Steel Sheet Pile Wall 3 53 Waterloo Barrierreg 6 54 Vinyl Sheet Pile Wall 7 55 GSEGundWallreg 7
60 APPLICATIONS OF VERTICAL LINERS FOR CDF C 8 61 Steel Sheet Pile Wall with Welded I Sections and Geomembrane Liner 8 62 Steel Sheet Pile Wall with Plywood Templates and Geomembrane Liner 10 63 Vinyl Sheet Pile Wall 10 64 Two Steel Sheet Pile Walls with Clay-Cement-Bentonite Slurry Backfill 11 65 Two Steel Sheet Pile Walls with Clay-Bentonite Slurry Backfill 11 66 Clay-Cement-Bentonite Slurry Wall in Embankment 11 67 GundWallreg in Embankment 12 68 GundWallreg in Slurry Backfill between Two Steel Sheet Pile Walls 12
70 CDF C CONSTRUCTION AND INSTALLATION OF PREFERRED LINER SYSTEM 12
80 REVISED COST 14
90 LEAKAGE RATES MODELING 15 91 Previous Evaluation of Leakage Rates 15 92 Summary of HELPQ Leakage Rates 18
921 Modeling Assumptions 19 922 Properties of Contaminants and Sediments 20
93 Release of Contaminants From Solid Phase of Sediments 20 94 Limitations of HELPQ Leakage Rate Modeling 21 95 Discussion of Previous Leakage Rate Investigations 23 96 Future Considerations 24
100 CONCLUSIONS 25
110 REFERENCES 25 111 Vertical Barriers 25 112 PCB Leakage Rates Modeling 25
LIST OF TABLES
Table 5-1 Advantages and Disadvantages of Vertical Barrier Systems 4 Table 5-2 Vertical Barrier Short-term System Permeability and Design Life 6 Table 9-1 General Summary of the Leakage Rate Evaluations 19
2000-17-0290 j 101700
Table 9-2 Leakage Rate of PCB from CDF C 1997 HELPQ Analysis 22 Table 9-3 Various Permeability Testing on Dredged Organic Sediment 24
LIST OF FIGURES
Figure 5-1 GSE GundWallreg Interlock 9 Figure 7-1 CDF C with Preferred Liner System 13 Figure 9-la Pathways Considered for the CDF Filling amp Consolidation Stage 16 Figure 9-lb Pathways Considered for the CDF Final Capped Stage 17
LIST OF APPENDICES
Appendix A Revised Cost Estimate
2000-17-0290 11 101700
10 INTRODUCTION
The information contained in this Technical Memorandum provides an evaluation of (1) the vertical liner requirements of the sheet pile wall with an extenor half dike design for CDF C and (2) the computer modeling performed by the U S Army Corps of Engineers Waterways Experiment Station (WES) to estimate contaminant transport or PCB leakage rates through all four CDFs Vertical barrier systems and applications of these systems to the current design of CDF C are discussed in detail A summary of both the initial modeling assumptions used by WES and how those relate to the current CDF design are provided Also included is a discussion of modeling assumptions which have changed significantly and which may require further evaluation to more accurately determine PCB leakage rates
20 LINER REQUIREMENTS SPECIFIED IN THE RECORD OF DECISION
TSCA chemical waste landfill liner requirements which were determined to be inappropriate for shoreline CDFs were waived under TSCA Specifically requirements regarding soil synthetic bottom liner hydrogeologic conditions and leachate collection were waived The sediment underlying the CDFs however was considered to be sufficiently protective with a permeability standard equal to or less than 107 cmsec in accordance with the Record of Decision (ROD) The ROD also states that the sidewalls of these CDFs shall be lined with a synthetic impermeable material The combination of the underlying sediment and impermeable sidewall liner and cap were determined to provide sufficient impermeability so that the long-term combined PCB leakage rate from all four CDFs is limited to an estimated 37 kg over thirty years The substantive requirements of the Massachusetts Solid Waste Management Regulations that are more stringent than TSCA regulations for liners and that are relevant and appropriate shall also be met
The Massachusetts Solid Waste Management Regulations require that a landfill liner shall at a minimum be comprised of a composite liner consisting of a low permeability compacted soil layer or admixture overlain by a flexible membrane liner (FML) The compacted low permeability soil or admixture layer shall have a minimum thickness of two feet a maximum m-place saturated hydraulic conductivity of 107 cmsec throughout the entire thickness of the layer and a minimum slope of two percent The FML layer shall be of sufficient thickness as determined by the Department and constructed so that the FML material is in direct contact with the low permeability soil layer Based on discussions with the Massachusetts Department of Environmental Protection (MADEP) these requirements should be considered in the design if they can be practically applied The most important consideration however should be the PCB leakage rates
30 LINER SYSTEMS CONVENTIONALLY EMPLOYED IN LANDFILLS
31 General Requirements
In general landfills must be underlain by one or more liners and have a leachate collection and removal system above and between such liners The liners must be designed constructed and installed to minimize the migration of wastes out of the landfill to the adjacent subsurface soil or groundwater or surface water at anytime during the active life and post-closure care period of the landfill Liners may range from very thick natural clay deposits to double composite liner systems installed on the base of the landfill and composite liners installed on the sloping sidewalls Composite liner systems generally consist of a two- to three-foot layer of compacted low permeability soil such as clay overlain by welded high density polyethylene (HDPE) geomembrane
2000-17-0290 1 101700
The following requirements should be considered when assessing the performance of a composite liner system used for waste containment over the intended design life of the barrier
1 Hydrogeologic conditions in which the barrier is to function 2 Permeability or hydraulic conductivity of the system 3 Geochemical properties of the contaminants 4 Compatibility of materials used with the waste and 5 Construction quality control at the time of installation
The hydrogeologic conditions acting on the liner system form the basis from which the contaminants are transported across the barrier The geochemical properties of the waste contribute to the aqueous concentration of the contaminants and coupled with the hydrogeologic conditions influence the rate of transport across the liner system The hydraulic conductivity and compatibility of the liner system are largely dependent on the barrier materials selected and the method of installation The first four requirements are generally considered during the design and approval processes
Provided that a proper design has been approved construction quality control is perhaps the most crucial requirement for the successful performance of soil and geosynthetic barriers The installed permeability of a geomembrane liner largely depends on the level of quality control carried out during its installation Construction issues such as wrinkles poor seaming and holes all contribute to the increased permeability or higher leakage rate of the liner system
32 Evaluation of Liner Systems
In the United States landfill liner systems have traditionally been evaluated using prescriptive based standards to limit contaminant release including liner permeability standards composite liner materials and minimum slope for liner placement Performance based design standards such as leakage rates however are more frequently being used to evaluate alternative liner systems by demonstrating that the liner sufficiently limits contaminant release to a specified level These performance-based standards are necessary where site conditions limit the application of prescriptive based standards Note that the majority of the requirements specified in the ROD imply that prescriptive standards would apply to the CDF sidewall liner design The ROD however also specifies a leakage rate which would imply that performance based standards apply
40 OVERVIEW OF VERTICAL BARRIERS
Vertical barriers usually slurry walls are often installed at solid waste and hazardous waste landfills and other waste disposal sites to limit the off-site migration or horizontal flow of contamination They are almost always used in conjunction with a remedial action such as dewatering and excavation of contaminated soil groundwater extraction and treatment leachate collection bioremediation andor soil vapor extraction A vertical barrier however is most often used as a flow control device to enhance the efficiency of a groundwater extraction system by restricting inward lateral flow of water from surrounding areas and intercepting lateral off-site migration of contaminated groundwater They are also used to isolate areas of highest contamination during remedial activities and minimize off-site migration of hazardous substances When used in conjunction with a remedial action and a capping system tied directly into the barrier wall vertical barriers can be effective although a general lack of monitoring especially long-term monitoring makes containment system effectiveness difficult to determine For long-term applications usually considered to be in excess of 30 years both the hydraulic transport of contaminants and the diffusion of contaminants through vertical barriers should be
2000-17-0290 2 101700
considered Diffusion is an important component in estimating the integrity of vertical barriers when used to contain hazardous substances for extended periods of time
50 EXAMPLES OF VERTICAL BARRIER SYSTEMS
51 Slurry Wall
Slurry walls have been used for pollution control since 1970 to isolate hazardous waste and minimize the migration of contaminants Barriers installed with a slurry trenching technology consist of a vertical trench excavated two to five feet into an aquitard along the perimeter of the site filled with bentonite slurry to support the trench and subsequently backfilled with a mixture of low-permeability material which forms the hydraulic barrier Varying the composition of the backfill can alter the properties of the barrier to obtain the desired strength and permeability Backfill can be soil-based cement-based or a combination of soil and cement Note that the addition of cement increases the strength of the barrier while increasing the permeability of the backfill and subsequently the porosity of the wall
The advantages and disadvantages of the two major types of slurry cutoff walls soil-based and cement-based have been summarized in Table 5-1 The estimated system permeabilities and design lives of these slurry walls are provided in Table 5-2 In general soil-based slurry walls have a lower strength and a lower permeability while cement-based slurry walls have a higher strength and a higher permeability Soil-cement-based slurry walls which have not been included in Tables 5-1 and 5-2 have the strength of a cement-based slurry wall and the permeability of a soil-based slurry wall Cement-based slurry walls although strong do not offer the high strength of steel sheet pile walls and are prone to cracking due to shrinkage thermal stress and wetdry cycling Another disadvantage of slurry walls is that organic and inorganic contaminants in the soil and groundwater (such as strong organic and inorganic acids and bases inorganic salts and some neutral polar and nonpolar organic compounds) can have a negative impact on bentonite in the wall andor in the backfill which will lead to the increased porosity of the wall over time
52 Steel Sheet Pile Wall
Cantilever sheet pile walls are constructed by driving prefabricated interlocking vertical sheets of steel into the soil a few feet at a time to the desired depth Where hard or rocky soil is encountered their depth of penetration is limited The most common use of a sheet pile wall is to retain temporary excavations of moderate depth but they can also be used as vertical barriers Since the interlocking joints between the sheet piles are vulnerable to leakage improved interlock designs to accommodate sealing of joints have been developed In addition to different types of interlocking joints a variety of sealants including grout fly ash and cement have been used to seal the joints Patented innovative techniques such as the Waterloo Barrierreg (refer to Section 53) have also been developed to seal and test the joints between the sheet piles
The advantages and disadvantages of a conventional sheet pile vertical barrier have been summarized in Table 5-1 One major disadvantage is that the steel piling corrodes which limits its effectiveness for long-term containment and may actually provide a preferred pathway for the vertical migration of contaminants into the interbedded sands as it corrodes Another major disadvantage is that it is sometimes difficult to keep the sheets in perfect vertical alignment while driving and as a result the interlock configuration may be compromised Sealants therefore which are applied before the sheets are driven are subject to being stripped off or damaged and sealants which are injected into the interlocking joints after the sheets are driven may not fill joints which have become separated Additional interlock
2000-17-0290 3 101700
Table 5-1 Advantages and Disadvantages of Vertical Barrier Systems
Soil-based Slurry Wall
Cement-based Slurry Wall
Steel Sheet Pile Wall
bull Construction techniques well understood practiced and accepted
bull Installed to depths of up to 200 feet bull Can be installed quickly on land
Construction techniques well understood practiced and accepted Can be installed quickly on land Much stronger than soil-based slurry walls Self-hardening slurries do not require backfill so walls can be constructed m limited access areas and at a lower cost Little to no slurry displaced
Installation procedures are well established Excavation is not required High strength Chemically resistant Able to construct irregularly shaped barriers in confined area
Installation requires excavation and a mixing area Substantial quantities of spoils must be disposed of Very low strength cannot accommodate structural loading Porosity may increase over time due to contaminants in soil and groundwater Wetdry and freezethaw cycles can cause desiccation which could lead to increased permeability of wall Only moderately strong cannot accommodate large structural loading as steel sheet piling Difficult to ensure panel continuity Higher permeability than soil-based slurry walls Porosity may increase over time due to contaminants in soil and groundwater Cement subject to degradation in saltwater environment Cracking due to shrinkage thermal stress and wetdry cycling could lead to increased permeability of wall More expensive than slurry walls Limited depth of penetration Steel corrodes which would create preferred pathway for the horizontal and possibly vertical migration of contaminants Interlocking joints leak Interlocking joints may separate during installation Interlocking joints may separate due to structural loads on the wall which create significant bending moments Integrity of sealant cannot be confirmed once driven
2000-17-0290 101700
^Vertical Barrier shyWaterloo Barrierreg
Vinyl Sheet Pile Wall
GSE GundWallreg
Table 5-1 (contd)
Advantages Excavation is not required Able to construct irregularly shaped barriers in confined area Installation uses same equipment as conventional sheet piling Chemically resistant Scalable interlocking joints which provide an effective barrier Video inspection of joints ensures quality of seal Joint separation or blockage can be repaired Cost compares well with conventional sheet pile wall
bull Does not corrode bull Chemically resistant bull Vinyl has a long design life and low permeability
Excavation is not required
Does not corrode Durable and chemically resistant HOPE has a long design life and low permeability Easy to install Excavation is not required Scalable interlocking joints Integrity of the sealed interlocks can potentially be verified after installation
Limited strength compared to conventional sheet piling Limited depth of penetration Steel corrodes which would create preferred pathway for the horizontal and possibly vertical migration of contaminants Interlocking joints may separate due to structural loads on the wall which create significant bending moments
Very low strength Difficult to install in dense soils Interlocking joints leak Interlocking joints may separate during installation Integrity of sealant cannot be confirmed once driven Hydrophilic urethane-based sealant has limited resistance to chlorinated hydrocarbons which includes PCBs and will not swell to seal joints if above water table Depth limitation of 20 feet with vibratory installation Can be inserted into a slurry wall or vibrated into loose to medium dense non-cohesive soils only Chloroprene-based sealant has poor resistance to chlorinated hydrocarbons which includes PCBs
2000-17-0290 101700
Table 5-2 Vertical Barrier Short-term System Permeability and Design Life
Soil-based Slurry Wall 107tolO9cmsec0) up to 30 yrs
Cement-based Slurry Wall 105tolO6cmsec(I) up to 30 yrs
Steel Sheet Pile Wall 10 to 105 cmsec(2) up to 30 yrs
Waterloo Barrierreg 10-8tolO-degcmsec(3) up to 30 yrs
vinyl sheet pile wall up to 100 yrs(4)
Vinyl Sheet Pile Wall 105to 106cmsec(4) wales and tie-backs limited urethane sealant unknown
GSE GundWallreg 109tolO-|0cmsec(5) HDPE geomembrane 100 to 200 yrs HyperTitetrade sealant unknown
Notes 1 Pearlman Leslie (1999) 2 standard for unsealed steel sheet piling 3 Smyth David et al (1997) 4 based on manufacturers data 5 based on permeability of welded HDPE with limited quality control
separation which could occur if the wall is subjected to structural loading or is being used to act as a structural support of adjacent soils would compromise the integrity of the seal
The estimated design life as well as the short-term permeability of the sheet pile wall system which is governed by rate of flow through the interlocking joints are provided in Table 5-2 The short-term system permeability takes into account the problems associated with sealing the interlocking joints Long-term permeability is not easily quantified since the system will no longer serve as a barrier once the steel has corroded
53 Waterloo Barrierreg
Private companies such as Waterloo Barrier Inc have successfully adapted the general scalable sheet pile wall for containment uses With the Waterloo Barrierreg Waterloo Barrier Inc has developed a unique method of sealing and testing the joints between the sheet piles to reduce the overall system permeability which has been a problem in the past Installation involves driving sheet piles into the ground flushing the interlocking joint cavity to remove soil and debris and injecting sealant into the joints Depending on site conditions the cavity may be sealed with a variety of materials including clay-based cementitious polymer or mechanical sealants Video inspection of the joint cavity prior to sealing ensures that the joint can be sealed
The advantages and disadvantages of a Waterloo Barrierreg have been summarized in Table 5-1 As with the conventional steel sheet pile wall the major disadvantage is that the steel piling corrodes which limits its effectiveness for long-term containment and may actually provide a preferred pathway for the vertical migration of contaminants into the interbedded sands as it corrodes Another disadvantage is that the section modulus of the heaviest Waterloo Barrierreg sheeting is lower than that of conventional steel
2000-17-0290 101700
sheeting The major advantage of the Waterloo Earnerreg is the ability to seal the joints Video inspection of each joint cavity prior to sealing provides a level of construction quality control and ensures that the joint can be sealed If the joint cannot be sealed repair procedures which may include pulling sheets will be required Interlock separation which could occur if the wall is subjected to structural loading or is being used to act as a structural support of adjacent soils would compromise the integrity of the seal
The estimated design life as well as the short-term permeability of the Waterloo Barrierreg system which is governed by rate of flow through the interlock sealant are provided in Table 5-2 As with conventional sheeting long-term permeability is not easily quantified since the system will no longer serve as a barrier once the steel has corroded
54 Vinyl Sheet Pile Wall
Vinyl sheet pile walls are constructed by driving prefabricated interlocking Z-shaped vertical sheets of rigid polymer into the soil using conventional vibratory equipment to the desired depth They are used as an alternative to steel sheet pile walls for a variety of waterfront projects such as seawalls and bulkheads where corrosion is an issue and where structural requirements are less A vinyl sheet pile wall generally consists of vinyl sheet piles driven into loose or medium dense granular soil bolted to front and back bracing wales tied back to anchors backfilled and capped with wood or concrete The long-term allowable moment reported by the manufacturer must be used when determining the strength capabilities of vinyl sheet piling as the material tends to creep over time Vinyl sheet pile walls can accommodate only short-term increases in hydrostatic loads due to rainfall or tidal changes and a drainage system such as a series of weep holes is usually installed to minimize hydrostatic loads As with steel sheet pile walls the interlocking joints are vulnerable to leakage and hydrophihc sealants made from polymeric rubber such as urethane can be applied to seal the joints
The advantages and disadvantages of a vinyl sheet pile vertical barrier have been summarized in Table 5shy1 One major disadvantage is that the vinyl has a very low strength and cannot be used in a structural application where the wall may be subjected to moderate static or hydrostatic loads If subjected to such loading the wall may fail andor the interlocking joints may become separated Another major disadvantage is that it is sometimes difficult to keep the sheets in perfect vertical alignment while driving and as a result the interlock configuration may be compromised (i e the interlocking joints may become separated) Therefore sealants which are applied before the sheets are driven are subject to being stripped off or damaged and sealants which are injected into the interlocking joints after the sheets are driven may not fill joints which have become separated
The estimated design life as well as the short-term permeability of the system which is governed by rate of flow through the interlocking joints are provided in Table 5-2 The short-term system permeability takes into account the problems associated with sealing the interlocking joints This permeability will increase if the wall is subjected to structural loading and the interlocking joints become separated The long-term permeability of the system which is governed by rate of flow through the interlocking joints as the vinyl material creeps or flows due to constant loading over time may be one to two orders of magnitude higher than the short-term permeability
55 GSE GundWallreg
The GSE GundWallreg is a geomembrane vertical barrier constructed of interlocking HDPE panels It is designed to prevent or deflect the flow of underground containment plumes subsurface water flow and other subsurface liquid transport The HDPE geomembrane used for the vertical panels is available m thicknesses ranging from 80 to 120 mil (20 to 30 mm) and includes mechanical interlocks permanently 2000-17-0290 7 101700
attached to the vertical edges of the geomembrane panel The GSE GundWallreg interlock configuration (refer to Figure 5-1) allows for panels to be inserted into a slurry wall or vibrated into place using an insertion plate in loose to medium dense non-cohesive soils without prior excavation Panels are installed to the depth of an aquitard or naturally impermeable cohesive soil layer Once inserted into this layer the migration of fluids is theoretically blocked both laterally and vertically
The GSE GundWallreg interlock consists of male and female HDPE profiles which are fusion welded to the HDPE panel at the factory The interlock is tight and creates a mechanical seal by compressing an 8shymm extruded hydrophilic gasket into a 6-mm key cavity at the time of installation The chloropreneshybased hydrophilic rubber gasket called HyperTitetrade swells up to five times its dry volume when exposed to water Because the HyperTitetrade gasket is installed in one continuous section as the interlocks are joined the seal can be monitored for continuity as it is vibrated into the ground In addition GSE offers an optional procedure for electrical confirmation assuring full-length makeup of the joint once installed
The advantages and disadvantages of the GSE GundWallreg have been summarized in Table 5-1 The major advantages are as follows (1) HDPE will not corrode and is extremely resistant to chemical attack which theoretically provides the GundWallreg with a long service life (2) HDPE provides the GundWallreg with a low permeability and (3) the integrity of the sealed interlocks can potentially be verified after installation One major disadvantage is that the chloroprene-based rubber HyperTitetrade gasket has poor resistance to chlorinated hydrocarbons which includes PCBs Another potential disadvantage is that the GundWallreg can be installed to a depth no greater than 20 feet which may not allow for sufficient keying into an aquitard at certain sites
The estimated design life as well as the short-term permeability of the system which is governed by rate of flow through the geomembrane and interlock sealant are provided in Table 5-2 The long-term permeability of the system which is governed by rate of flow through the interlocking joints after the sealant has deteriorated may be two orders of magnitude higher than the short-term permeability
60 APPLICATIONS OF VERTICAL LINERS FOR CDF C
The following subsections discuss applications of vertical barrier systems and combinations of vertical barrier systems to provide a synthetic impermeable liner for CDF C
61 Steel Sheet Pile Wall with Welded I Sections and Geomembrane Liner
One option is to weld steel I sections onto every other sheet at the top and at the mean high water level insert steel or plywood sheets to create a continuous and generally flat surface and then fill the channels formed by pairs of sheets with a clay-cement-bentonite slurry A geomembrane would then be used to line the steel or plywood sheets by laying HDPE panels against the flat sheets weighting them so that they would key into the organic clay and attaching them at the top of the steel sheet piles Installation of the flat steel or plywood sheeting through the fabricated I sections could prove difficult if the sheet piles are out of alignment Another disadvantage of this option s that the HDPE panels would have to be welded together after being installed which would likely be difficult since portions of the HDPE would be underwater In addition there is no way to ensure that the weighted HDPE panels would drop vertically and lay flat against the steel or plywood sheets and be keyed into the organic clay If the HDPE panels do not lay flat the stresses on the geomembrane at the interface of the dredged sediment and the HDPE panels once the CDF has been filled may result in failure of the liner
2000-17-0290 101700
TM
GSE 80 MIL HOPE LINER GSE HYPERTITE SEAL
DOUBLE WEDGE WELD AIR TEST CHANNEL
FIGURE 5-1 NEW BEDFORD MASSACHUSETTS CONFINED DISPOSAL FACILITY C
regGSE GUNDWALL INTERLOCK
NOT TO SCALE
Lining flat sheets of steel or plywood also presents problems The disadvantage of lining flat steel sheets is that the geomembrane would be in direct contact with the sharp edges of the corroding steel which would lead to tears and holes in the liner compromising its integrity The disadvantages of lining flat plywood sheets is that (1) the plywood would tend to float and would have to somehow be weighted and (2) the wood would decompose over time and the geomembrane would be left to stand vertically unsupported which is not possible (ie it would slump and wrinkle) In addition placing the geomembrane across the I sections could puncture the liner as it is being or once it has been installed Because of these disadvantages the system would not serve as an effective liner
62 Steel Sheet Pile Wall with Plywood Templates and Geomembrane Liner
A second option would be to construct plywood templates to fit in the channels formed by pairs of steel sheet piles so that a continuous flat surface is created place weighted panels of HDPE geomembrane across the steel sheet piles and plywood templates and fix the top of the geomembrane to the tops of the steel sheet piles A major disadvantage of this option is that these HDPE panels would have to be welded together after being installed which would likely be difficult since portions of the HDPE would be underwater In addition there is no way to ensure that the weighted HDPE panels would drop vertically and lay flat against the plywood templates and steel sheet piles If the HDPE panels do not lay flat the stresses on the geomembrane at the interface of the dredged sediment and the HDPE panels once the CDF has been filled may result in failure of the liner Another disadvantage is that the geomembrane would be in direct contact with the sharp edges of the corroding steel which would lead to tears and holes in the liner compromising its integrity In addition the plywood would decompose over time and in combination with the corroding steel the geomembrane would be left to stand vertically unsupported which is not possible (ie it would slump and wrinkle) Because of these disadvantages the system would not serve as an effective liner The constructablity issues associated with this option including forming the plywood templates weighting the HDPE geomembrane and attaching the HDPE to the tops of the steel sheets also serve to make this option both difficult and costly
63 Vinyl Sheet Pile Wall
A third option would be to install a continuous vinyl sheet pile wall two to three feet in front of and anchored to the structural steel sheet piling If the interlocking joints could be successfully sealed then the short-term permeability could theoretically be as low as 10~7 cmsec One major disadvantage of this option is that there would be no way to ensure the integrity of the seals and as such the system permeability would likely be well above 10~7 cmsec In addition the hydrophilic urethane-based sealant would not effectively swell in those portions of the interlocking joints above the mean high tide The interlocks would therefore not be sealed and the system permeability would again be well above 10~7
cmsec The disadvantage that makes this option completely infeasible is the low strength of the vinyl material The static and hydrostatic forces exerted upon the vinyl sheet pile wall once the CDF is filled and a temporary cap and surcharge have been applied would be so great that the vinyl would fail and the wall would no longer serve as an effective liner
In an attempt to mitigate this failure the two- to three-foot space between the vinyl and steel sheet pile walls could be filled with a clay-cement-bentonite slurry An added benefit of this slurry wall would be its low permeability which would be on the order of 107 to 109 cmsec depending on the clay content and cement mix used Since the wall could not withstand the loading applied by this slurry the filling would have to be done in stages each time allowing the cement to cure The cold joints resulting from this staged filling however would contribute to the increased permeability of the slurry wall In addition the bending moment exerted on the vinyl sheet pile wall once the CDF is filled and a temporary cap and surcharge have been applied would be so great that the vinyl sheet pile wall would either fail or
2000-17-0290 10 101700
deflect so much that the clay-cement-bentonite slurry wall would crack As the cracks propagated towards the steel sheet pile wall the system would no longer serve as an effective liner
64 Two Steel Sheet Pile Walls with Clay-Cement-Bentonite Slurry Backfill
A fourth option would be to install two rows of steel sheet piling spaced roughly three feet apart and fill the space between the two rows with a clay-cement-bentonite slurry The slurry wall would be keyed into the organic clay and would have a permeability of 10~7 to 10~9 cmsec depending on the clay content and the cement mix used As an advantage the slurry wall would be strong and could potentially have a long design life It however would be subject to degradation in a relatively saltwater environment depending on the cement content The saltwater could also have a negative impact on the bentonite in the wall which would lead to its increased porosity over time The structural loading of the steel sheet piling and the resultant deflections of the walls could also be a possible disadvantage The bending moment exerted on the exterior sheet pile wall by the embankment would cause it to deflect inward and the bending moment exerted on the interior wall once the CDF is filled and a temporary cap and surcharge have been applied would cause the wall to deflect outward These deflections could lead to the cracking of the clay-cement-bentonite slurry wall Shrinkage thermal stress and wetdry cycling could also lead to cracking As the cracks became continuous between the two steel sheet pile walls the system would no longer serve as an effective liner
65 Two Steel Sheet Pile Walls with Clay-Bentonite Slurry Backfill
A fifth option would be to install two rows of steel sheet piling spaced roughly three feet apart and fill the space between the two rows with a clay-bentonite slurry The slurry wall would be keyed into the organic clay and would have a permeability of 10~7 to 109 cmsec depending on the clay content Although a clay-bentonite slurry wall would be less likely to crack as a result of the structural loading of the steel sheet piling and the resultant deflections of the walls it would not be as strong as a clay-cementshybentonite slurry wall Desiccation above the water table could lead to cracking and as the cracks became continuous between the two steel sheet pile walls the system would no longer serve as an effective liner As with the clay-cement-bentonite slurry wall the saltwater could also have a negative impact on bentonite in the wall which would lead to its increased porosity over time
66 Clay-Cement-Bentonite Slurry Wall in Embankment
A sixth option would be to install a clay-cement-bentonite slurry wall into the embankment adjacent to the steel sheet pile wall This would theoretically provide an effective low permeability vertical barrier if it could be keyed into an aquitard (ie the organic clay) Since the organic clay was removed to provide a firm foundation for the embankment this keying of the slurry wall into an aquitard is not possible A second disadvantage of this option is that the crest of the embankment would have to be wide enough to accommodate slurry trenching equipment which would make the construction of the embankment costly and difficult as the mudline drops to an elevation of-20 feet NGVD at the midpoint of the channel A third possible disadvantage is that the deflection of the steel sheet pile wall which would occur once the CDF is filled and a temporary cap and surcharge have been applied may present structural difficulties when considering the lower strength of the slurry wall The strength and section modulus of the steel sheeting may have to be increased to maintain the structural integrity of the system This increase in the structural requirements of the steel may result in a cost prohibitive andor possibly structurally unachievable liner system In addition as mentioned previously saltwater could also have a negative impact on bentonite in the wall which would lead to its increased porosity over time Because of these disadvantages the system would not serve as an effective liner
2000-17-0290 101700
67 GundWallreg in Embankment
A seventh option would be to install a GundWallreg 20 feet into the embankment parallel to and outside of the steel sheet pile wall This would theoretically provide an effective low permeability vertical barrier if it could be keyed into an aquitard (ie the organic clay) Since the organic clay was removed to provide a firm foundation for the embankment this keying of the GundWallreg into an aquitard is not possible The preferred pathway for the migration of contamination would be through the interlocking joints of the steel sheet pile wall into the embankment fill beneath the GundWallreg and out into the harbor This option would therefore not serve as an effective liner
68 GundWallreg in Slurry Backfill between Two Steel Sheet Pile Walls
An eighth option would be to install two rows of steel sheet piling spaced roughly three feet apart pump a slurry backfill into the space between the two rows and install a GundWallreg into the slurry wall to form a composite wall and provide an added level of protection Both the slurry wall and GundWallreg would be keyed into the organic clay and would provide a system permeability as low as 10deg cmsec Since cement in the slurry wall could prohibit the installation of the GundWallreg a clay-bentonite mixture would be used A high clay content in the mixture would cause the slurry wall to act as a barrier in itself and would potentially limit the amount of PCBs migrating to the GundWallreg and degrading the interlock sealant Note however that the saltwater could change the structure of the bentonite clay particles slightly increasing the porosity of the barrier Because of the absence of cement cracking of the slurry wall due to the structural loading of the steel sheet piling and the resultant deflections of the walls is less likely Any cracks that formed as a result of desiccation however would provide a preferred pathway for the migration of contaminants from the interior steel sheet pile wall to the GundWallreg Another possible disadvantage may result from the corrosion of the steel sheet pile wall installed next to the contaminated dredged sediment Since structural requirements dictate that the steel sheeting be driven through the organic clay into the underlying interbedded sands corrosion of the steel could perhaps provide a preferred pathway for the vertical migration of contaminants into this sand layer And although PCB-contaminated leachate reaching the GundWallreg could over time degrade the chloroprene-based rubber HyperTitetrade gasket flow through the interlocking joints and eventually out into the harbor this option appears to provide the vertical barrier with the lowest system permeability and longest design life Because this option most closely meets the liner requirements specified in the ROD and the Massachusetts Solid Waste Management Regulations it is recommended as the preferred liner system
70 CDF C CONSTRUCTION AND INSTALLATION OF PREFERRED LINER SYSTEM
The construction of CDF C and the installation of the preferred liner system presented as the eighth option are described below In addition a schematic diagram has been included as Figure 7-1
Step 1 Two rows of cantilever steel sheet piles spaced three feet apart will be driven from barges offshore using falsework templates to keep the sheets aligned and vertical The steel sheets will be 45-feet-long PZ35 sections installed to a bottom elevation of -34 NGVD The top of the sheets will be at elevation 11 NGVD The alignment of these two rows of offshore sheet piling will be approximately 1360 linear feet
Step 2 An area of approximately 27 acres of contaminated sediment from the outboard side of the steel sheets will be hydraulically dredged to a depth of two feet This will result in 8900 cubic yards of dredged sediment being pumped to the hot spot cell for temporary storage The majority of
2000-17-0290 12 101700
EXTERIOR SIDE INTERIOR SIDE STEEL SHEET PILE WALLS
16 16
TEMPORARY CAP AND SURCHARGE
CLAY-BENTONITE SLURRY
u_ vraquo-
z DREDGED SEDIMENT o fmdash
-4 Lul Ld
_J LJ DREDGE CONTAMINATED SEDIMENT -9
Ld
ORGANIC CLAY ORGANIC CLAY
-14 -14
INTERBEDDED SANDS INTERBEDDED SANDS
NOTE ELEVATIONS ARE IN FEET AND REFER TO NATIONAL GEODETIC VERTICAL DATUM (NGVD)
FIGURE 7-1 NEW BEDFORD MASSACHUSETTS CONFINED DISPOSAL FACILITY C
CDF C WITH PREFERRED LINER SYSTEM
NOT TO SCALE 17FC101F DGN
this sediment will be dredged from the footprint of the earthen embankment constructed to support the steel sheeting Just over 20 of the 8900 cubic yards of sediment will be dredged 20 feet beyond the toe of the embankment in the event a mudwave were to occur during the construction of that portion of the embankment overlying soft soil If this additional dredging were not performed and a mudwave were to occur it would result in the mixing of contaminated sediment with clean sediment which could result in the need for dredging to depths greater than two feet below the mudline to assure that all of the contaminated sediment is removed
Step 3 An additional 20200 cubic yards of clean organic clay containing varying amounts of fine to medium sand and shell fragments will be excavated from the footprint of the embankment to provide a generally firm foundation on which to construct This clean organic clay will have PCB concentrations less than the target cleanup level of 10 ppm and will be mechanically dewatered For estimating purposes it is assumed that the excavated organic clay will have a PCB concentration of at least 2 ppm and will require out-of-state disposal at a Subtitle D facility
Step 4 Approximately 2300 cubic yards of clay-bentonite slurry will be mixed onshore and pumped into the slot formed by the two rows of steel sheeting It is possible that the clay from the dewatered dredged sediment could be reused in the slurry mixture
Note A loose clean sand would not be placed into this slot as it is possible that the sand could densify when the GundWallreg is vibrated in This may mean that the GundWallreg would not fully penetrate and as such could not be keyed into the organic clay layer Densification of the sand fill may also cause the steel sheeting to come out of alignment
Note Excavated sediment could not be directly placed into this slot since the material would need to be raked and screened the sand would need to be separated out and the water content may need to be reduced Also the addition of bentonite to the clay is beneficial because it swells and lowers the overall permeability of the mixture
Step 5 A GundWallreg will be vibrated into the clay-bentonite slurry using an insertion plate from a barge offshore The GundWallreg will be 20-feet-long and keyed into the organic clay approximately 5 feet or to bottom elevation of -9 NGVD The alignment of this geomembrane will extend over the full length of the offshore sheet piling approximately 1360 linear feet
Step 6 An embankment to support the sheet pile walls of the CDF will be built from a foundation elevation of approximately -14 NGVD to a crest elevation of 8 NGVD The crest will have a width of 12 feet to accommodate earthmoving equipment The design of the embankment is such that it will support the CDF in the long-term condition after the steel sheet pile walls have corroded
Step 7 A cap may be installed over the clay-bentonite slurry wall to prevent desiccation This detail is not included in Figure 7-1 or in the revised cost estimate summarized in Section 80
80 REVISED COST
The cost estimate for the double sheet pile wall with exterior half dike selected as a result of the alternatives and value engineering evaluations has been revised and updated to include the preferred liner system
2000-17-0290 14 101700
bull The disposal capacity of CDF C is has been reduced to an estimate of 84440 cubic yards based on the current configuration The original disposal capacity was approximately 95000 cubic yards From that number 8900 cubic yards is used for the disposal of contaminated dredged sediment Another 1660 cubic yards is lost due to the second row of steel sheet piles being installed in front of the first row
bull Construction cost has been increased from $11339000 to $13044000 Refer to Appendix A for a complete breakdown of this revised cost estimate
bull The cost per cubic yard of disposal volume has increased from approximately $113 to just over $154
90 LEAKAGE RATES MODELING
91 Previous Evaluation of Leakage Rates
In preparation of this evaluation Foster Wheeler reviewed historical documentation of leaching analyses from 1989 to 1997 The initial leakage investigation and analysis was conducted by the US Army Corps of Engineers Waterways Experiment Station (WES) Figure 9-1 (a) and 9-l(b) present the vertical and horizontal pathways considered for the release of contaminants from the CDFs The pathway considered was essentially a vertical flow-through system where contaminants are transferred from dredged sediment to the groundwater flowing through the soil
The contaminant concentration contained in the sediment (C0 - initial concentration in the soil) and the rate at which it would leach from the soil to the water flowing through (Kd - soilwater partitioning coefficient) were estimated from batch and column leaching tests conducted as part of Feasibility Study Report 5 on composite samples of the upper estuary sediment
The critical pathway of release was qualitatively assumed as the loss of leachate from the contaminated sediment through the bottom of the facility The liners at the sides of the CDF were considered to be impermeable Assuming an impermeable horizontal liner would imply that the leakage at the horizontal boundaries is negligible in comparison with that of the vertical boundary Similarly an impermeable horizontal boundary would imply that there is no additional water flowinfiltration from either the landside groundwater gradient andor the shoreline tidal influences
Since the first leakage rate evaluation in 1989 many of the original assumptions pertaining to the design and construction of the CDFs have changed Accordingly the assumptions were revisited over time as additional design information was developed and the leakage rates were updated to reflect the new information In general two stages were typically considered for the adopted vertical flow-through system The stages were based on short-term and long-term construction and operation scenarios for the CDFs
1 Short-Term Filling amp Consolidation Stape
Dredged sediments were to be hydraulically pumped into the CDF and the solids in the dredged material would separate out from liquid by gravity After filling the CDF a temporary cap would be constructed and the sediments allowed to consolidate (ie the pore water would be squeezed out under the pressure of overlying material)
2000-17-0290 15 101700
Figure 9-1 (a)
4 Pathways Considered by Previous Leakage Evaluations
Precipitation EvapotranspirationVolatilization
Surface Water Runoff
Temporary I Cap
Dredged Sediment
Foundation Base
Pathways Considered for the CDF Filling amp Consolidation Stage
2000-017-0290 ppt 8100
Figure 9-1 (b)
Pathways Considered Precipitation E^potranspiration by Previous Leakage Evaluations
Volitilization
Unsaturaied Dredged Sediment ^(jndai Mixing
-y Grounclwatershy
FillV
Foundation Base
Pathways Considered for the CDF Final Capped Stage
2000-017-0290ppt 8100
During this stage vertical flow of contaminants was generated by two water sources
bull All pore water released from the dredged sediment during the consolidation process bull Precipitation and surface water entering the temporary cap
2 Long-Term Final Capped Stage
After the consolidation stage the temporary cap would be removed and a geocomposite cap would be constructed to minimize infiltration of precipitation and surface water The dredged material was assigned a reduced permeability that resulted from three years of consolidation Long-term leakage rates were generally evaluated after 30 years from initial dredged sediments placement (some calculated up to 100 years)
92 Summary of HELPQ Leakage Rates
The most recent WES leakage rate investigation for CDF C was conducted in 1997 Permeability and settlement data was estimated using PSDDF - Primary Consolidation and Secondary Compression and Desiccation of Dredged Fill (Stark 1996) HELP - Hydrogeologic Evaluation of Leachate Production and HELPQ - Hydrogeologic Evaluation of Leachate Production and Quality (Schroeder and Aziz 1996) were used to estimate groundwater flow and corresponding mass transfer of contaminants Limitations of the HELPQ analysis are discussed in Section 94 The following section reports the findings of previous investigations Table 9-1 presents a general summary of the leakage rates along with some pertinent changes in assumptions over time
The following documents the latest evaluation of leakage rates (1997) using HELPQ and PSDDF for CDF C The CDF modeling assumed
bull Surface area covered by the CDF was 83 acres (361050 ft2 or 1340 feet by 270 feet)
bull Placed 10 feet of dredged sediment over an existing 5-foot-thick foundation allowing for consolidation in both the dredged sediment and foundation layer
bull Soil properties of dredged sediment were identical to the foundation material
bull Underlying the foundation layer was an incompressible sandy layer (thickness unspecified)
bull Mean water table was assumed to be 3 feet above the foundation
bull Two feet of clean dredged material was to be used as a temporary cap augmenting the consolidation of the underlying dredged sediment and foundation
bull The permeability of the dredged material and base of the CDF was estimated to change from 19 x 107 to 14 x 107 cmsec after capping
bull Dredged material was assumed to desiccate 90 days after the end of disposal operations (time of disposal operation was not specified)
bull Three years after disposal the CDF was capped with 2 feet of vegetated soil and a geosynthetic liner
2000-17-0290 18 101700
Table 9-1 General Summary of the Leakage Rate Evaluations
bullfV bullbullshy Parameter-gtjlaquo8raquo -gtbullraquo bullraquobull gt^fjN^ vgt$
shy
Units |
4CDFsllB^l^ 198
jG0FsllBand2 v v 1993
bull^CDFrAjBJj^pfe
Total CDF Surface Area ft2 2400000 1500000 1800000 Insitu Estuary Sediment Volume ydj 484000 NA 450000
Total Percolation Through Bottom of CDFs 1-30 Years
in 23 NA 37
PCB Leakage Rate at Year 1 kg 150 (years 1-10) 23 50 PCB Leakage Rate at Year 3 kg NA 43 51 PCB Leakage Rate at Year 5 kg NA 00018 26 PCB Leakage Rate at Year 20 kg 40 (years 10-30) 00108 01665 Total PCB Released Over 30
Years kg 190 40 37
Total Copper Released Over 30 Years kg 6 NA 24
Leachate Concentration Maximum Batch
Leaching Concentrations
Maximum Batch Leaching
Concentrations
Reduced Leachate Concentrations wtime
Hydraulic Conductivity Of Dredge Sediment
cms lOxlO-tolOxlO7 65xlO-7 tolOxlO-7 19xlO7tol4xlO-7
Capping Times
Final Cap immediately after draining ponded
water 6 months after of disposal
Capped 2-3 years after filled with dredged
material
3 years of temporary cap
27 years of final cap
Underlain by sandy
Base Boundary Condition Free draining
No resistance to flow Free draining
No resistance to flow material more permeable than
sediment
921 Modeling Assumptions
Review of the WES modeling indicates that the following assumptions were made
bull Consolidation data used in PSDDF were obtained from the programs default database of soils and correlated with leachate permeameter tests reported in Feasibility Study Report 5
bull Conservative parameters (not specified) were reportedly selected for drainage and evaporation processes in HELPQ model
bull Soil moisture retention used in HELPQ was selected to yield the same drainage of initial moisture content as the predicted settlement from PSDDF
settlement and porosity were set to initial conditions and the field capacity was adjusted to yield the drainage from consolidation The wilting point was then adjusted to yield appropriate unsaturated drainage properties
(Note the difference between the soil field capacity and the wilting point give the water holding capacity that is available to plants The field capacity can be thought of as a full soil moisture reservoir while the wilting point can be thought of as an empty one
2000-17-0290 19 101700
bull 10 feet of dredged sediment was divided into three layers
1) Top 10 inches used to incorporate runoff evapotranspiration and infiltration 2) Below 10 inches and above mean low water (MLW) 3) Below MLW (3 feet)
9 2 2 Properties of Contaminants and Sediments
Physical and geochemical properties of contaminants and sediments used in the modeling were
bull Geoenvironmental properties of the critical contaminants were taken from Report 5 of the Feasibility Study based on batch and column leaching tests conducted on composite upper estuary samples
bull Sediment contaminant concentrations (1500 mgkg PCBs 1730 mgkg Cu and 2013 mgkg Pb) were based on the composite upper estuary sediment sample
bull Leachate concentration (C0) was ( 0 266 mg1 PCBs)
bull Soil-water partitioning coefficient (Kd) was (4863 Ikg PCBs)
bull All geotechmcal properties of contaminated sediments placed in the CDF were assumed and quantitatively verified based on the column leaching tests conducted in Report 5 of the Feasibility Study (i e water content void ratio porosity density plasticity permeability consolidation properties)
bull Select geotechmcal properties of contaminated sediments placed in the CDF included the following
1) Liquid limit (LL) 94 plasticity index (PI) 62 2) 23 sand 77 fines 3) Specific gravity was 2 4 4) Void ratio was 3 4
93 Release of Contaminants From Solid Phase of Sediments
The release of contaminants from the solid phase of the soil sediment to the water flowing through is dependant on the estimated leaching concentration (C0 ~ 0 266 mg1) defined by the soilwater partitioning coefficient (Kd ~ 4863 Ikg) It is important to note some of the findings presented in Report 5 of the Feasibility Study especially when considering the salinity of the water coming in contact with the contaminated sediments and exposure to air
bull Additional findings of the report indicate that freshwater passed through the sediments resulted in a higher leachate concentration (C0 ~ 0327 mg1) and a lower partitioning coefficient (Kd was NA) than saline water
bull It appears that the leachate concentration of 0 266 mg1 was selected from the aerobic batch leaching tests Comparison of sediment concentrations (mgkg) determined from aerobic tests exhibited lower PCB concentrations (mgkg) than similar anaerobic tests This was attributed to volatilization which allowed the release of PCB during the aerobic tests
2000-17-0290 20 101700
Table 9-2 reports the results of the leakage rates for PCB from CDF C determined in 1997
The results illustrate how the partitioning coefficient has been employed to linearly correspond with the rate of water percolation (how contaminants in the solid phase of sediment are transferred to the liquid phase) With this in mind the flow of water exiting the base of the CDF is largely dependent on (1) the pressure head of water acting on the base of the CDF (assumed to be 3 feet) (2) the infiltration of precipitation and (3) the surface water into the CDF passing through the cap and the water content of the dredged sediment
Water content will largely depend on the method of dredging andor whether dewatering of the sediment is conducted before placement Infiltration will have the greatest impact during the filling of the CDF and subsequent surchargetemporary capping stages Long-term infiltration should be reasonably reduced by a geocomposite capping system installed with adequate quality control The pressure head acting on the base of the CDF is perhaps the greatest influence on the flow of water Inherent in the assumption of a 3 feet head acting at the CDF base is a knowledge of the groundwater conditions in the sandy layer below the 5 feet foundation material In the initial leakage evaluation in 1989 it is clear this was not known and at that time it was suggested that additional hydrogeological data and modeling would be required to confirm site-specific flow patterns and rates for the CDF sites From the documentation reviewed to date it is not clear whether the groundwater levels and hydrogeologic data used in the leakage evaluation accurately reflect the site-specific conditions at each CDF
94 Limitations of HELPQ Leakage Rate Modeling
The software model HELP was initially developed for evaluating percolation of water through semishypermeable landfill caps The HELP model is known as a water balance method which computes water movement across into through and out of landfills using climatological soil and CDFlandfill design data It evaluates runoff drainage and leachate generation by taking into account water entering and exiting the CDFlandfill (ie surface storage runoff infiltration percolation and evapotranspiration) The HELPQ model is similar to the HELP model but incorporates contaminant characteristics to estimate leachate generation from waste
To determine leaching rates from the CDF HELPQ uses the contaminant concentrations and partitioning coefficients determined from batch and column leaching tests and evaluates the leakage based on a mass balance The mass of contaminants contained in the sediment is transported by the flow of water entering the CDF through the processes of infiltration percolation and evapotranspiration Hence when HELPQ balances water flow and equates a corresponding mass of contaminants with the flowrate it is modeling advective transport
Typically contaminant transport through a saturated layer consists of two mechanisms an advective (groundwater flow) component and a diffusive component (concentration flux of contaminants from high concentration to low concentration) In an advectivediffusive system it is commonly known that when advection is minimized through a low permeable material andor negligibleopposing groundwater velocities diffusion becomes the primary mechanism and can dominate the contaminant transport
Considering the permeability of the dredged material diffusion could play a role in the transport of contaminants from the CDF The relative magnitude of diffusion to advection through the base of the CDF can be evaluated by the Peclet number
dz De
2000-17-0290 21 101700
Table 9-2 Leakage Rate of PCB from CDF C 1997 HELPQ Analysis
^^CaliulatldPCBRefea^eJ] raquo Back Calculated Leachate bullbull- Xlti laquo I ^-^i^I^Alif1
Concentration (Im C2tfdd)SV V^ater Exiting CDt igt amp lt gt
Time P^BMa^s PCB ^- CB bull fiase Calculated mdash years ft3yr gyr tfg- bull mgl bull
1 168600 1090 1547 0228 2 168800 1091 1547 0228 3 173600 1123 1546 0228 4 106000 685 1547 0228 5 85200 551 1546 0228 6 72000 465 1548 0228 7 68700 444 1547 0228 8 64700 419 1544 0229 9 61000 395 1544 0229 10 57400 371 1547 0228 11 44500 288 1545 0229 12 6600 429 1538 0230 13 5800 374 1551 0228 14 5000 323 1548 0228 16 4100 267 1536 0230 18 3700 241 1535 0230 20 3400 219 1553 0227 25 2800 181 1547 0228 30 2200 14 1571 0225 35 2200 141 1560 0226 40 2300 149 1544 0229 50 2200 141 1560 0226 60 2200 141 1560 0226 80 2200 141 1560 0226 100 2100 135 1556 0227
Pe Peclet Number k Hydraulic Conductivity (cmsec) tj Effective Thickness of Barrier Layer (cm) De DiffusionDispersion Coefficient (cm2sec) dhdz Groundwater Gradient Across Barrier Layer (dimensionless)
If the magnitude of the Peclet Number is much greater than one (Peraquol) then advective transport dominates over diffusion Conversely if the value is much less than one (Pelaquol) then diffusive transport dominates over advective Peclet Numbers near unity (one) suggests a dual advectivediffusive system Aqueous phase effective diffusion coefficients typically range from ~1 x 10⁶ cnrYs to ~1 x 10~5 cm2s for saturated soils This range of De values is sufficiently narrow for many applications such that measurement of solute specific De values with specific soils may not be required to provide reasonable accuracy For cases where there is a need for greater accuracy several procedures are available for measuring De
For a 3 feet groundwater head acting on a 5 feet CDF foundation base the Peclet Numbers estimated range from approximately 94 to 094 for a typical range of effective diffusion coefficients and a dredged sediment hydraulic conductivity of 14 x 10~7 cms This implies there is potential if the effective 2000-17-0290 22 101700
diffusion coefficient is at the upper range of typical values that diffusion could result in additional flux of contaminants from the base of the CDF This will largely depend on the assumptions of groundwater head elevation For example increasing the head of water acting on the base would suggest additional transport through advection
95 Discussion of Previous Leakage Rate Investigations
The overall review of previous leakage rate investigations conveys a consistent reduction in the level of conservatism inherent in latter investigations Closer examination of Table 9-1 reveals four significant changes in the assumptions used to evaluate the leakage rates
1) Decrease in Hydraulic Conductivity
The initial hydraulic conductivity of the placed dredged sediment was incrementally reduced in each subsequent leakage rate investigation This is significant since the highest rates of contaminant loss occur during the first three years when both precipitation and surface water are allowed to infiltrate the CDF Final permeability of the foundation layer was decreased slightly from the 1993 to 1997 leakage evaluations Typically the hydraulic conductivity of insitu soils can vary an order of magnitude and generally its sensitivity should be incorporated into the evaluation of clay barrier layers Table 9-3 gives some recent evaluation of the permeability of dredged sediments and the corresponding effective stress
The results of the column consolidation tests suggest lower conductivity values would be expected for placement of a slurry-like dredged sediment Dewatering of the dredged sediment currently being evaluated will alter the hydraulic conductivity properties of the dredged material to be placed in the CDF The relative change will depend on the dewatering process itself
2) Change from Constant Concentration to Finite Mass
The 1997 modeling report (Otis MJ 1997) states that the concentration of contaminants in the dredged sediment was reduced over time (although when examining Table 9-2 it would seem that the concentration remains constant and the water flow reduced) Nevertheless in contaminant transport terminology this represents a finite mass of contaminants Previous leakage investigations assumed a constant concentration of contaminants over time The evaluation of contaminant transport using a constant concentration over time is typically viewed as a conservative assumption when representing the contaminant source The choice of appropriate boundary conditions often represents a major source of uncertainty in practical applications involving contaminant transport modeling In cases where the appropriate boundary condition is either unknown or is uncertain prudence dictates the use of a conservative boundary condition Therefore it is recommended that a constant source be initially evaluated and if necessary a finite mass evaluation may be performed based on the change of contaminant concentration over time
3) Change in Surface Area and Volume
The change in surface area and volume has been incorporated incrementally with each HELPQ modeling as the CDF sizes were changed In the latest leakage evaluation it was reported that despite greater water flow through the base of the CDFs from the 1997 evaluation the 1989 fluxes were greater by 52 for PCBs and 25 for Copper A third of the greater was attributed to the differences in surface area and volume from 1997 and 1989 The rest was attributed to the change in source sediment concentrations from a constant source to a finite mass as outlined above
2000-17-0290 23 101700
Table 9-3 Various Permeability Testing on Dredged Organic Sediment
- J5raquo34lf f-^ VKJraquoW^^^ Jfelaquolaquo- ^ raquolaquo - - Bff drauifKCSregMilii ^Effective Strlaquofitl- lf^- - 1 1 X ^lilr5^ fl 7F^ (jpsfifjf f ^ Average of Column Consolidation 206 610x10-
(Soil Technologies) 495 563 x 105
- Soil tested contained no particles greater than the 10115 207 x 106
200 sieve (ie no sand) 2099 171 xlO6
419 634 x 107
Average Of Oedometer Tests Conducted 120 624 x 107
On Samples from Column Consolidation 260 267 xlO7
(Soil Technologies) 500 307 x 107
- Soil tested contained no particles greater than the 1000 664 x 108
200 sieve (ie no sand) 2000 562 x 108
4000 272 x 108
8000 231 x 108
16000 678 xlO9
Insitu Borehole Permeability Testing (Foster Wheeler 2000) -87 105 xlO3 to 146 xlO6
Laboratory Flexible Wall Permeability Testing (Foster Wheeler 2000) 720 33 x 107
4) Change in Bottom Boundary Conditions
Another potentially significant assumption which changed from 1989 to 1997 (Otis MJ 1997) was the properties of the material underlying the 5 feet base foundation layer Initially it was assumed to be free draining and infinitely permeable This condition was later changed to reflect a more site specific sandy layer with a higher permeability than the foundation layer (layer thickness and exact conductivity not reported) While this suggests a more representative layering system the influence of the sand layer is largely dependent on the local groundwater gradients
96 Future Considerations
The following considerations should be addressed in any future CDF leakage rates modeling
bull The review of the leakage evaluation suggests that the allowable leakage rates from the horizontal boundaries (slurry wall vinyl sheeting etc) be negligible with respect to the vertical boundary (clay foundation base) Vertical barriers should be modeled if it is desired to confirm this quantitatively
bull Vertical and horizontal groundwater gradients along with respective hydraulic conductivities should be verified from current documentation to verify the assumed hydrogeologic conditions at each CDF
bull The use of the HELPQ model assumes that the contaminants are transported by advection in the absence of diffusion This assumption is largely dependent on the assumed soil permeabilities and groundwater gradients and should be quantified and documented
bull Changes in source contamination (ie dredged sediment water content density void ratio) can significantly impact the leakage rates and their impact on contaminant transport should be evaluated
2000-17-0290 24 101700
100 CONCLUSIONS
The current design configuration of CDF C a sheet pile wall supported by an earthen embankment results m the necessity to implement a vertical liner system not typically employed for permanent or even long-term containment Based on preliminary design calculations and analyses as summarized in this Memorandum the liner system will consist of two rows of steel sheet piling filled with a clayshybentomte slurry into which interlocking HDPE geomembrane panels will be inserted This composite liner system most closely meets the intent of the ROD which specifies the use of a synthetic impermeable material to line the sidewalls of the CDF and the substantive requirements of the Massachusetts Solid Waste Management Regulations Although PCB-contammated leachate reaching the HDPE geomembrane vertical liner could slowly degrade the chloroprene-based gaskets used to seal the interlocking joints and the flow through the joints would increase over time this option appears to provide the vertical barrier with the lowest system permeability and longest design life These assumptions however cannot be verified with actual data as none appears to exist
The leakage rate evaluations conducted by WES address only the vertical flow through the CDF Horizontal flow into and out of the CDF was not accounted for in the model In addition the HELPQ model assumes that the contaminants are transported by advection only The transport of contaminants by diffusion which is an important component in estimating contaminant transport for long-term applications (in excess of 30 years) was not considered Other modeling assumptions which have significantly changed based on current information require further evaluation Changes in the properties of the dredged sediment due to mechanical dewatenng m particular should be evaluated to determine their impact on contaminant transport or leakage rates
110 REFERENCES
111 Vertical Barriers
Pearlman Leslie (1999) Subsurface Containment and Monitoring Systems Barriers and Beyond National Network of Environmental Management Studies Fellow for US Environmental Protection Agency March 1999
Smyth David et al (1997) Scalable Joint Steel Sheet Piling for Groundwater Control and Remediation Case Histories Presented at the International Containment Technology Conference St Petersburg Florida February 9-12 1997
U S Environmental Protection Agency (1998) Evaluation of Subsurface Engineered Barriers at Waste Sites EPA542R-98005 August 1998
112 PCB Leakage Rates Modeling
Mark J Otis (1997) Memorandum - New Bedford Harbor Superfund Site Estimates of Contaminant Loss (through leachate) from Confined Disposal Facilities dated October 17 1997 CENAE-PDshyE
Myers TE and Brannon JM (1989) New Bedford Superfund Project Acushnet River Estuary Engineering Feasibility Study of Dredging and Dredged Material Disposal Alternatives REPORT NO 5 - Evaluation of Leachate Quality TECHNICAL REPORT EL-88-15
2000-17-0290 25 101700
Foster Wheeler Environmental Corporation (2000) Geotechnical Data Report for Design of Confined Disposal Facility C prepared for the New England US Army Corps of Engineers New Bedford Harbor Superfimd Site April 2000
Rabideau A et al (1996) Contaminant Transport Modeling Chapter 10 Assessment of Barrier Containment Technologies R R
Schroeder PR and Aziz NM (1997) Documentation of the HELPQ Model for ADDAMS Hydrogeologic Evaluation of Leachate Production and Quality for Confined Disposal Facilities Draft Technical Note EEDP-06-XX US Army Corps of Engineers Waterways Experiment Station Visksburg Mississippi
Stark TD (1996) Program Documentation and Users Guide PSDDF - Primary Consolidation and Secondary Compression and Desiccation of Dredged Fill Draft Instructional Report EL-97-XX US Army Corps of Engineers Waterways Experiment Station Visksburg Mississippi
2000-17-0290 26 101700
Appendix A
Revised Cost Estimate
w
2000-17-0290 101700
FOSTER WHEELER ENVIRONMENTAL New Bedford Harbor - CDF C
Revised by Enn Gnffin 72500
Sheet sheets with half dike option
Quantity Unit Rate Total Duration SUBTOTALS Mobilization $169000 Drive Sheets 122400 sf $2700 $3304800 5 Pre-Dredge Contaminated 8900 cy $11 1 03 $988156 1 Excavate Organic Clay 20200 cy $150 77 $3045654 125 Fill Below Water 33300 cy $3780 $1258881 225 Fill Above Water 11600 cy $2068 $239869 075 Fill Between Sheets 20400 sf $500 $102000 025 Install GundWall 27200 sf $2500 $680000 1 $9788360 Supervision amp Management 11 5 mo $1500000 $172500 Administration 115 mo $20000 00 $230000 Procurement 11 5 mo $20000 00 $230000 Engineering amp QC 11 5 mo $50000 00 $575000 Health amp Safety 115 mo $35000 00 $402500 Temporary Facilities 11 5 mo $20000 00 $230000 Project Utilities 11 5 mo $10000 00 $115000 Misc Expenses 11 5 mo $1000000 $115000 $2070000
TOTAL COST $11858360 2212 Fee 10 $1185836 TOTAL $13044000
Page 1 of 9
FOSTER WHEELER ENVIRONMENTAL New Bedford Harbor - CDF C
Mobilization
Total Cost 0 0 0 0
Total Cost 0 0 0
0
Total Cost 0 0 0 0
Total Cost 8000
80000 80000
1000 0 0 0
169000
169000
Comments
Comments
Comments
Comments
Craft Labor Operator Operator OT Laborer Laborer OT Subtotal Cost
Equipment
Subtotal Cost
Materials
Subtotal Cost
Subcontract Mobilize Equipment Mobilize Crane Mobilize Barges Mobilize Boats
Subtotal Cost
TOTAL COST
Units hrs hrs hrs hrs
Units
Units
Units 16 ea 2 ea 4 ea 2 ea
Unit Rate4315 5754 3262 4673
Unit Rate
Unit Rate
Unit Rate 500
40000 20000
500
Page 2 of 9
FOSTER WHEELER ENVIRONMENTAL New Bedford Harbor - CDF C
Drive Sheets
Craft Labor
Subtotal Cost
Operator Operator OT Laborer Laborer OT
Units hrs hrs hrs hrs
Unit Rate4315 5754 3262 4673
Total Cost 0 0 0 0
Comments
Equipment
Subtotal Cost
Units Unit Rate Total Cost0 0 0 0
0
Comments
Materials
Subtotal Cost
Units Unit Rate Total Cost0 0 0
0
Comments
Subcontract Permanent Sheets
Units122400 sf
Unit Rate 2700
Total Cost 3304800
Comments 2 rows at 61 200 sf each (quote)
Subtotal Cost 3304800
TOTAL COST 3304800
Page 3 of 9
FOSTER WHEELER ENVIRONMENTAL New Bedford Harbor - CDF C
Pre-Dredge Contaminated Sediment 8900 cy
Craft Labor Operator Operator OT Laborer Laborer OT Subtotal Cost
Units1116hrs
1116
hrshrshrs
Unit Rate 4315 5754 3262 4673
Equipment Units Unit Rate
Subtotal Cost
Materials Units Unit Rate
Subtotal Cost
Subcontract Units Unit RateWater Treatment 1 mnth 50000 Dredging 8900 cy 100
Subtotal Cost
TOTAL COST
Total Cost 48156
0 0 0
48156
Total Cost 0 0 0 0
0
Total Cost
Total Cost 50000
890000
940000
988156
Comments 1 5 Operators 247 Water Treatment
Comments
Comments
Comments PowerSampling Supplies
Page 4 of 9
FOSTER WHEELER ENVIRONMENTAL New Bedford Harbor - CDF C
Excavate Organic Clay
Craft Labor Operator Operator OT Laborer Laborer OT Subtotal Cost
Equipment Clamshell amp Barge Spoils Barge Pushboats Bottom Dump Barge Pump amp Pipeline
Subtotal Cost
Materials Fuel amp Mamt Small Tools
20200 cy
Units 600 hrs 150 hrs
1200 hrs 300 hrs
2250
Units 1 mo 1 mo 2 mo 1 mo 1 mo
Units 25
0 mo
750 cyday
Unit Rate Total Cost 4315 25890 25 5754 8630 83 3262 39138 17 4673 14020 16
87679 41
Unit Rate Total Cost 1500000 1500000 8500 00 8500 00 6000 00 1200000
1200000 1200000 20000 00 20000 00
000 67500 00
Unit Rate Total Cost 67500 00 16875 00 2500 00 000
27 days
Comments 3ea 40 hrswk x 5 weeks Sea 10hrswkx 5 weeks 6ea 40 hrswk x 5 weeks 6ea 10 hrswk x 5 weeks
Comments 1ea 1 ea 2ea 1ea
Comments
Subtotal Cost 16875 00
Subcontract Disposal Facility Research amp Approval - Regulatory Compl Clay Disposal Fees Analytical Testing Dewatering
Units
1 Is 27270 ton
55 ea 20200 cy
Unit Rate
20000 00 8000
120000 3000
Total Cost
20000 00 218160000
66000 00 606000 00
Comments
20200 cy 1 35 1 sample500 tons
tonscy
Subtotal Cost 2873600 00
TOTAL COST 304565441
Page 5 of 9
FOSTER WHEELER ENVIRONMENTAL
750 cyday
New Bedford Harbor - CDF C
Fill Below Water
Craft Labor Operator Operator OT Teamsters Teamster OT Laborer Laborer OT Subtotal Cost
Equipment 140 Material Barges Cranel W Barge 90 Deck Barges Pushboats Loaders 100 Conveyors Feed Conveyor
Subtotal Cost
Materials Fuel amp Mamt Small Tools Fill Material Armor Stone
Subtotal Cost
Subcontract Sieve amp Proctor In-Place Density Test
Subtotal Cost
TOTAL COST
33300 cy
Units 1800 hrs
450 hrs 360 hrs
90 hrs 2160 hrs
540 hrs 5400
Units 4 mo 2 mo 4 mo 4 mo 2 mo 4 mo 2 mo
Units 25
2 mo 53280 ton 3000 cy
Units 20 ea 0 hr
44 4 days
Comments 5 ea 40 hrswk x 9 weeks Sea 10 hrswk x 9 weeks 1 ea 40 hrswk x 9 weeks 1 ea 10 hrswk x 9 weeks 6 ea 40 hrswk x 9 weeks 6ea 10 hrswk x 9 weeks
Comments 2ea 1ea 2ea 2ea 1ea 2ea 1ea
Comments
33300 cy 1 6 toncy
Comments
Unit Rate 4315 5754 4315 5754 3262 4673
Unit Rate 8500 00
1880000 3800 00 6000 00
10000 00 8000 00 6000 00
Unit Rate 17480000
2500 00 1400 2200
Unit Rate 17500 7500
Total Cost 77670 75 25892 49 1553400 517860
70448 70 25236 29
21996084
Total Cost 34000 00 37600 00 1520000 24000 00 20000 00 32000 00 1200000
17480000
Total Cost 43700 00 5000 00
745920 00 66000 00
860620 00
Total Cost 3500 00
000
3500 00
125888084
Page 6 of 9
FOSTER WHEELER ENVIRONMENTAL
750 cyday
New Bedford Harbor - CDF C
Fill Above Water
Craft Labor Operator Operator OT Laborer Laborer OT
Subtotal Cost
Equipment D5 Dozer Excavator Loaders 90 Deck Barges 100 Conveyors Feed Conveyor
Subtotal Cost
Materials Fuel amp Maint Small Tools Misc Supplies Fill Material
Subtotal Cost
Subcontract Sieve amp Proctor In-Place Density Test Surveys
Subtotal Cost
TOTAL COST
11600cy
Units 720 hrs 180 hrs 480 hrs 120 hrs
1500
Units 1 mo 1 mo 1 mo 0 mo 0 mo 0 mo
Units 25
1 00 mo 1 Is
18560 ton
Units 3 ea
80 hr 1 Is
15 5 days
Comments 6 ea 40 hrswk x 3 weeks 6ea 10 hrswk x 3 weeks 4 ea 40 hrswk x 3 weeks 4 ea 10 hrswk x 3 weeks
Comments 1 -D5 1ea 1ea
Comments
1 2000 cy 1 6tncy
Comments
Unit Rate4315 5754 3262 4673
Unit Rate 5500
10000 1000000 3800 00 8000 00 6000 00
Unit Rate 25500 2500 1000 675
Unit Rate 17500 7500
10000 00
Total Cost 3106830 1035700 1565527 5608 06
62689
Total Cost 5500
10000 10000
000 0 0 0
25500
Total Cost 6375 2500 1000
12528000
135155
Total Cost 525
6000 10000
16525
239869
Page 7 of 9
FOSTER WHEELER ENVIRONMENTAL New Bedford Harbor - CDF C
Fill Between Sheets and Install GundWall
Craft Labor
Subtotal Cost
Operator Operator OT Laborer Laborer OT
Units hrs hrs hrs hrs
Unit Rate4315 5754 3262 4673
Total Cost 0 0 0 0
Comments
Equipment
Subtotal Cost
Units Unit Rate Total Cost 0 0 0 0 0
Comments
Materials Units Unit Rate Total Cost Comments
Subtotal Cost
Subcontract Fill Between Sheets (Slurry Wall) Install GundWall
Units 20400 27200
sf sf
Unit Rate500
2500
Total Cost 102000 680000
Comments quote quote
Subtotal Cost 782000
TOTAL COST 782000
Page 8 of 9
Labor Rates Decision No Equip Oper
Rate Fringe Fringe a Fringe b FICA FUTA SUTA Work Comp
Laborer - Haz
Rate Fringe Fringe a Fringe b FICA FUTA SUTA Work Comp
Craft Labor Rates
Engi0004l Group 1 Equip Oper OT
2604 Base 1062 Hlth amp Wlfreetc 0 00 Haz Premium 1 04 Holiday 2 07 7 65 0 22 0 80 1 38 5 10 1 78 6 57
4315
10 Days
Rate Fringe Fringe a Fringe b FICA FUTA SUTA Work Comp
Labo0022L Group 6 Laborer - HazOT
20 95 Base 7 45 Hlth amp Wlfreetc 0 00 Haz Premium 0 00 Holiday 1 60 7 65 017 080 107 510 1 38 6 57
3262
0 Days
Rate Fringe Fringe a Fringe b FICA FUTA SUTA Work Comp
Engi0004l Group 1
39 06 Base 1062 Hlth amp Wlfreetc 0 00 Haz Premium 0 00 Holiday 2 99 7 65 0 31 0 80 1 99 5 10 2 57 6 57
5754
10 Days
Labo0022L Group 6
31 43 Base 7 45 Hlth amp Wlfreetc 0 00 Haz Premium 0 00 Holiday 2 99 7 65 0 31 0 80 1 99 5 10 257 6 57
4673
10 Days
Page 9 of 9
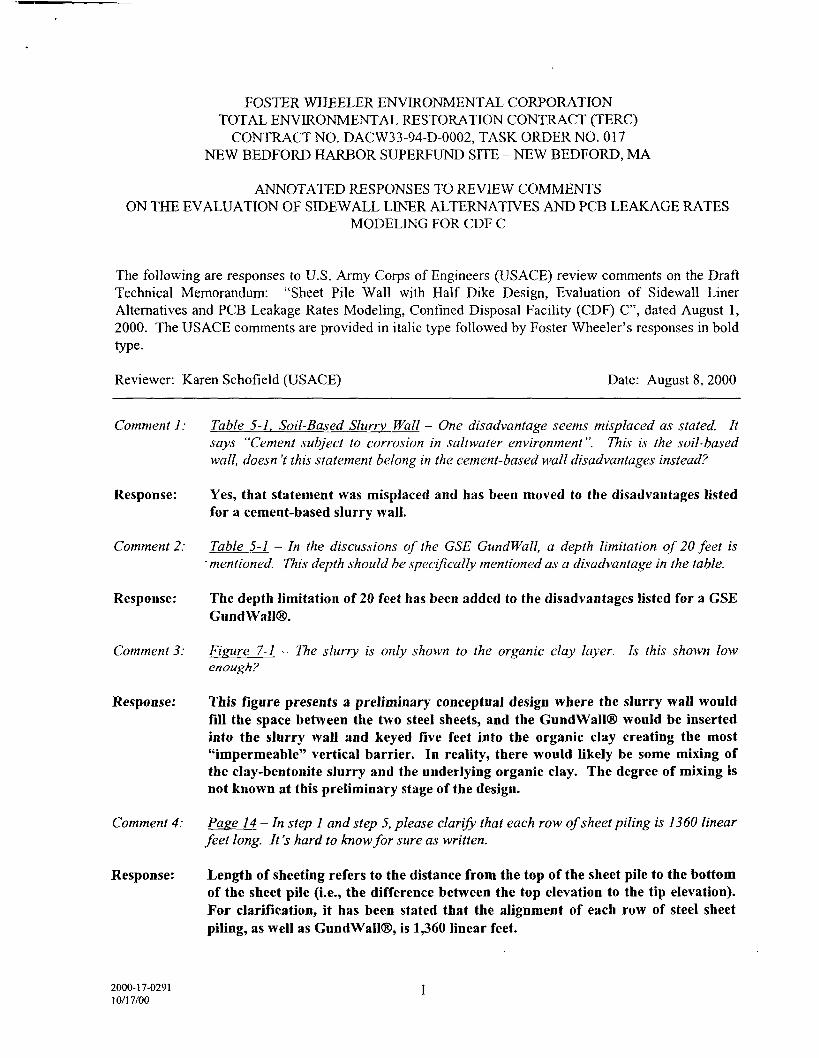
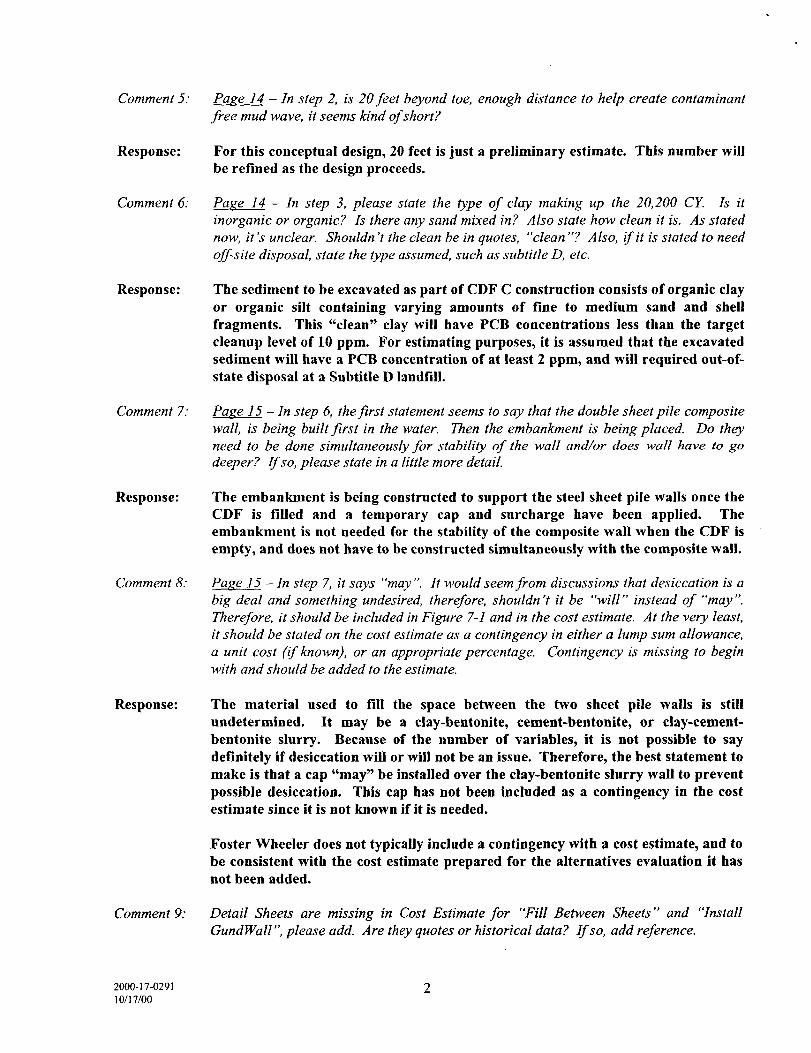
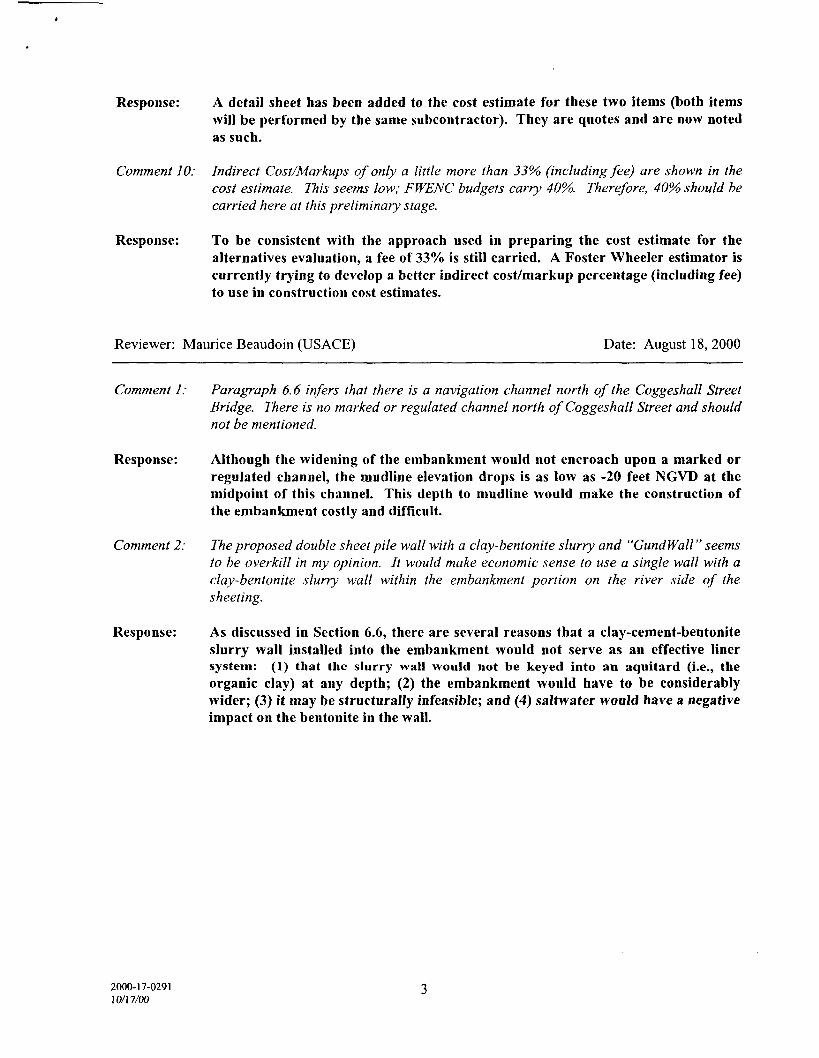
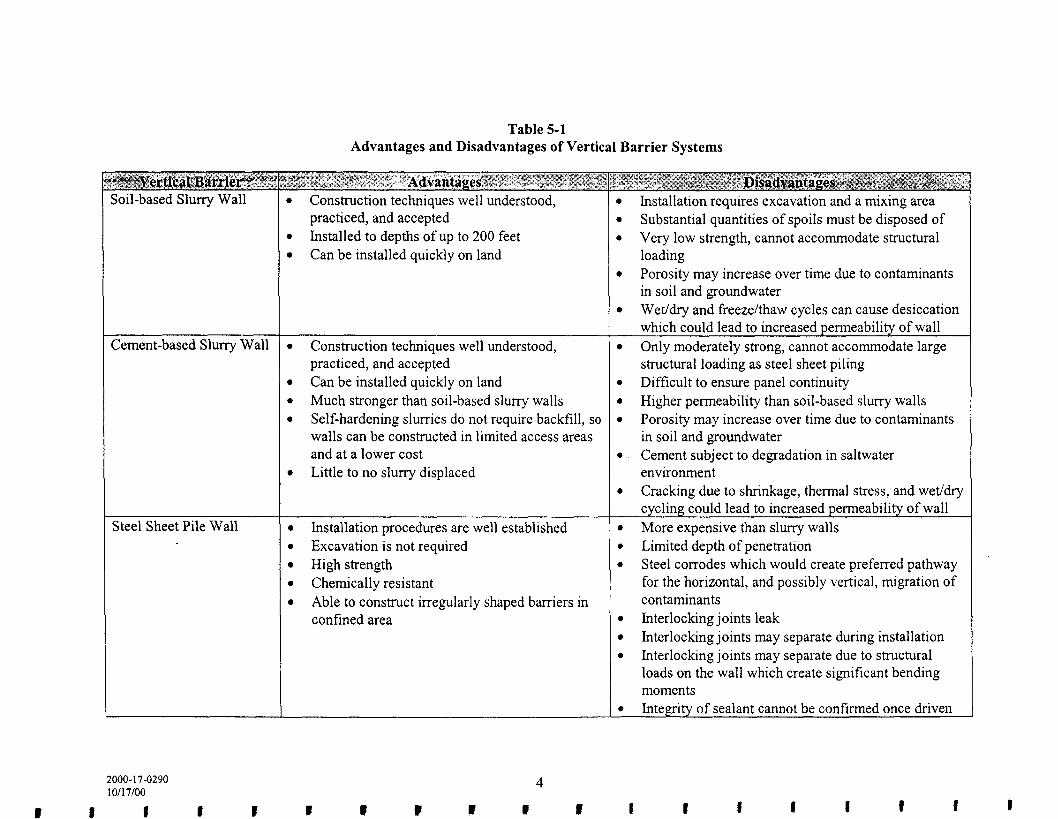
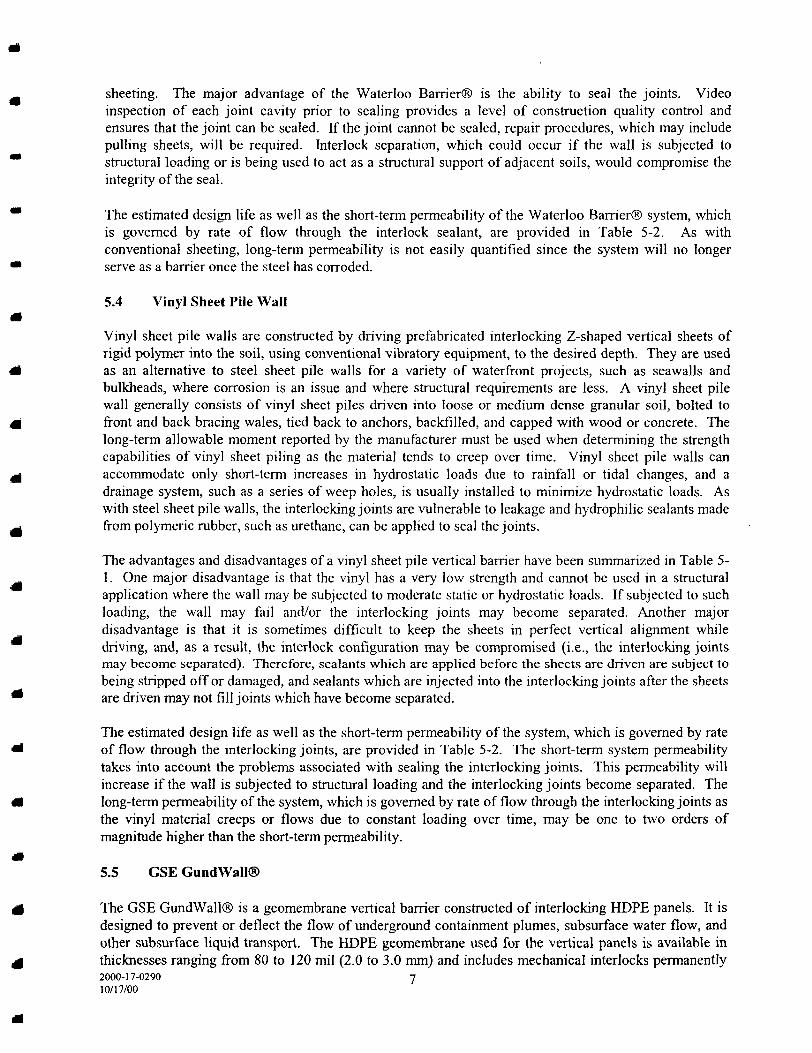
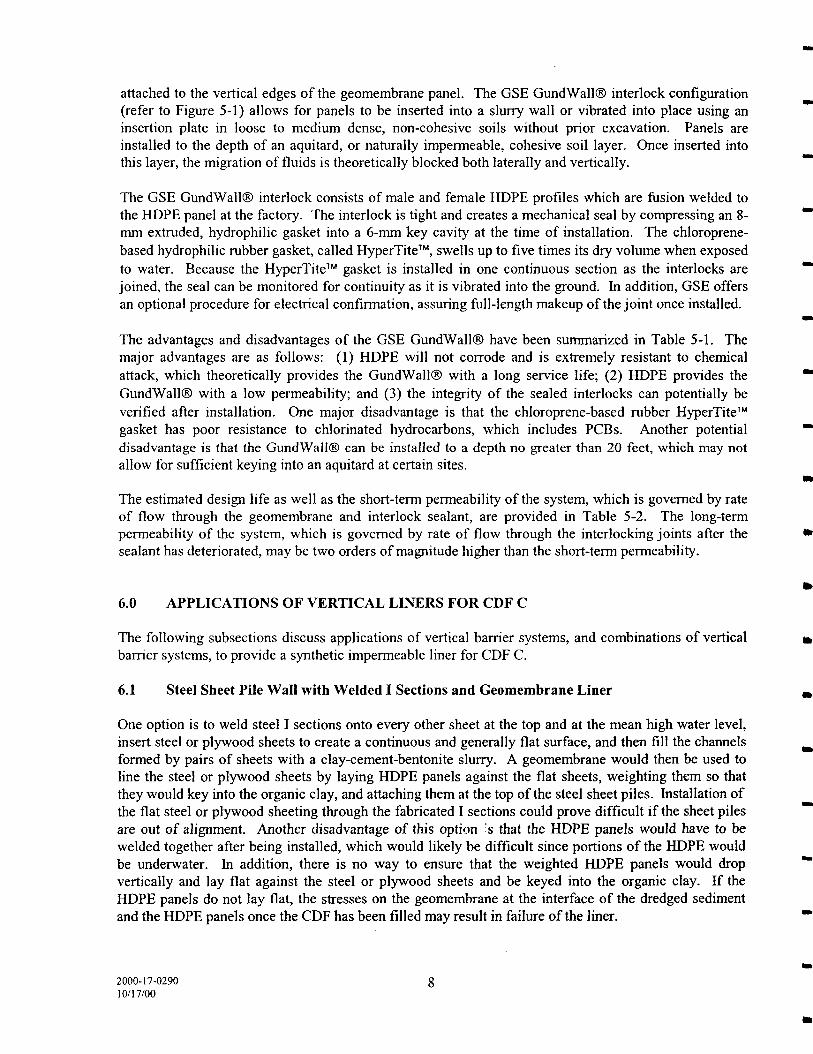
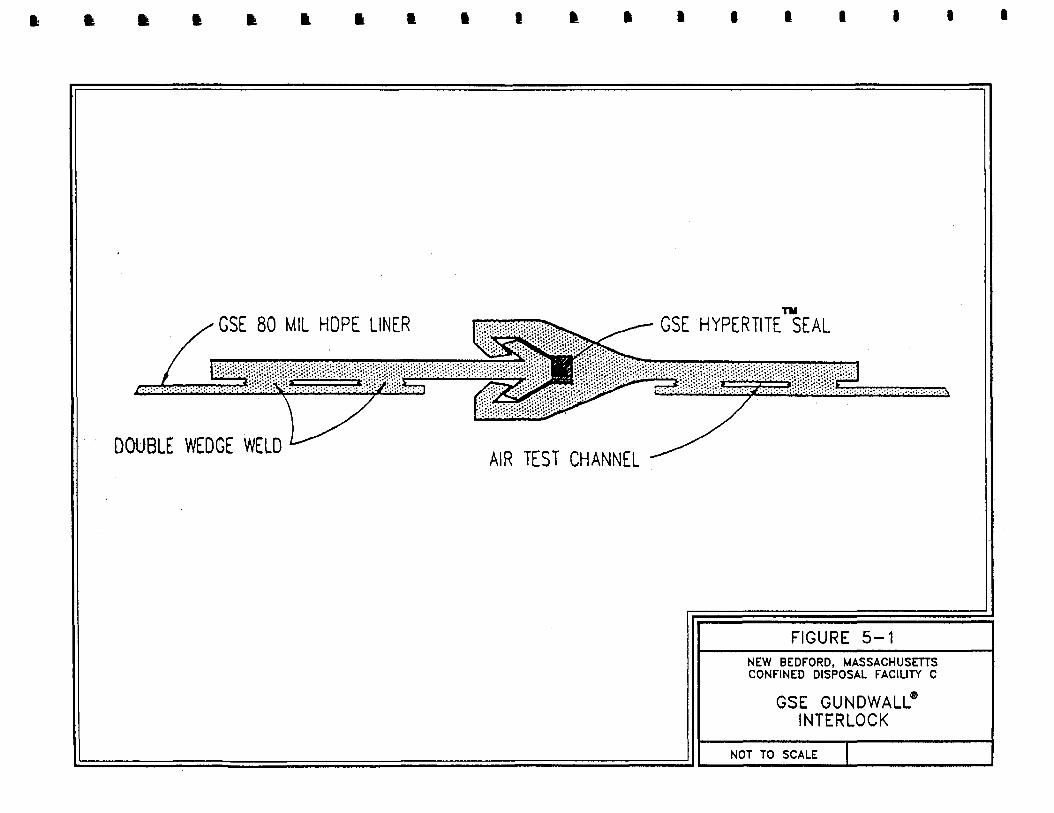
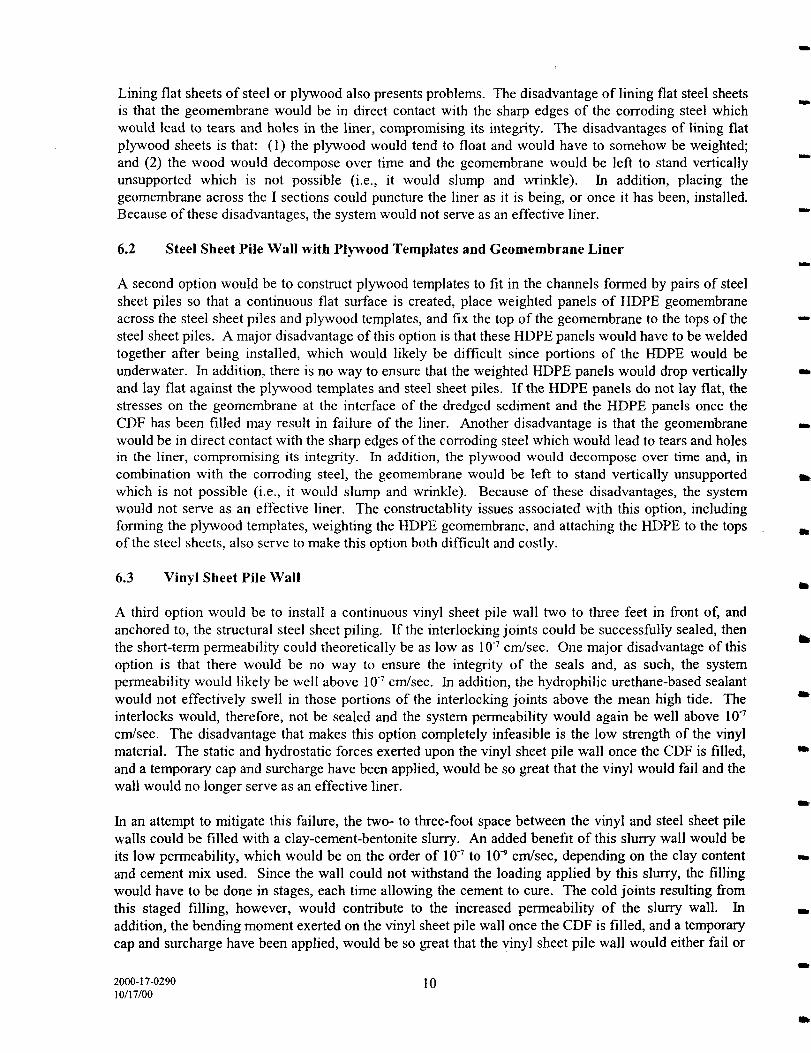
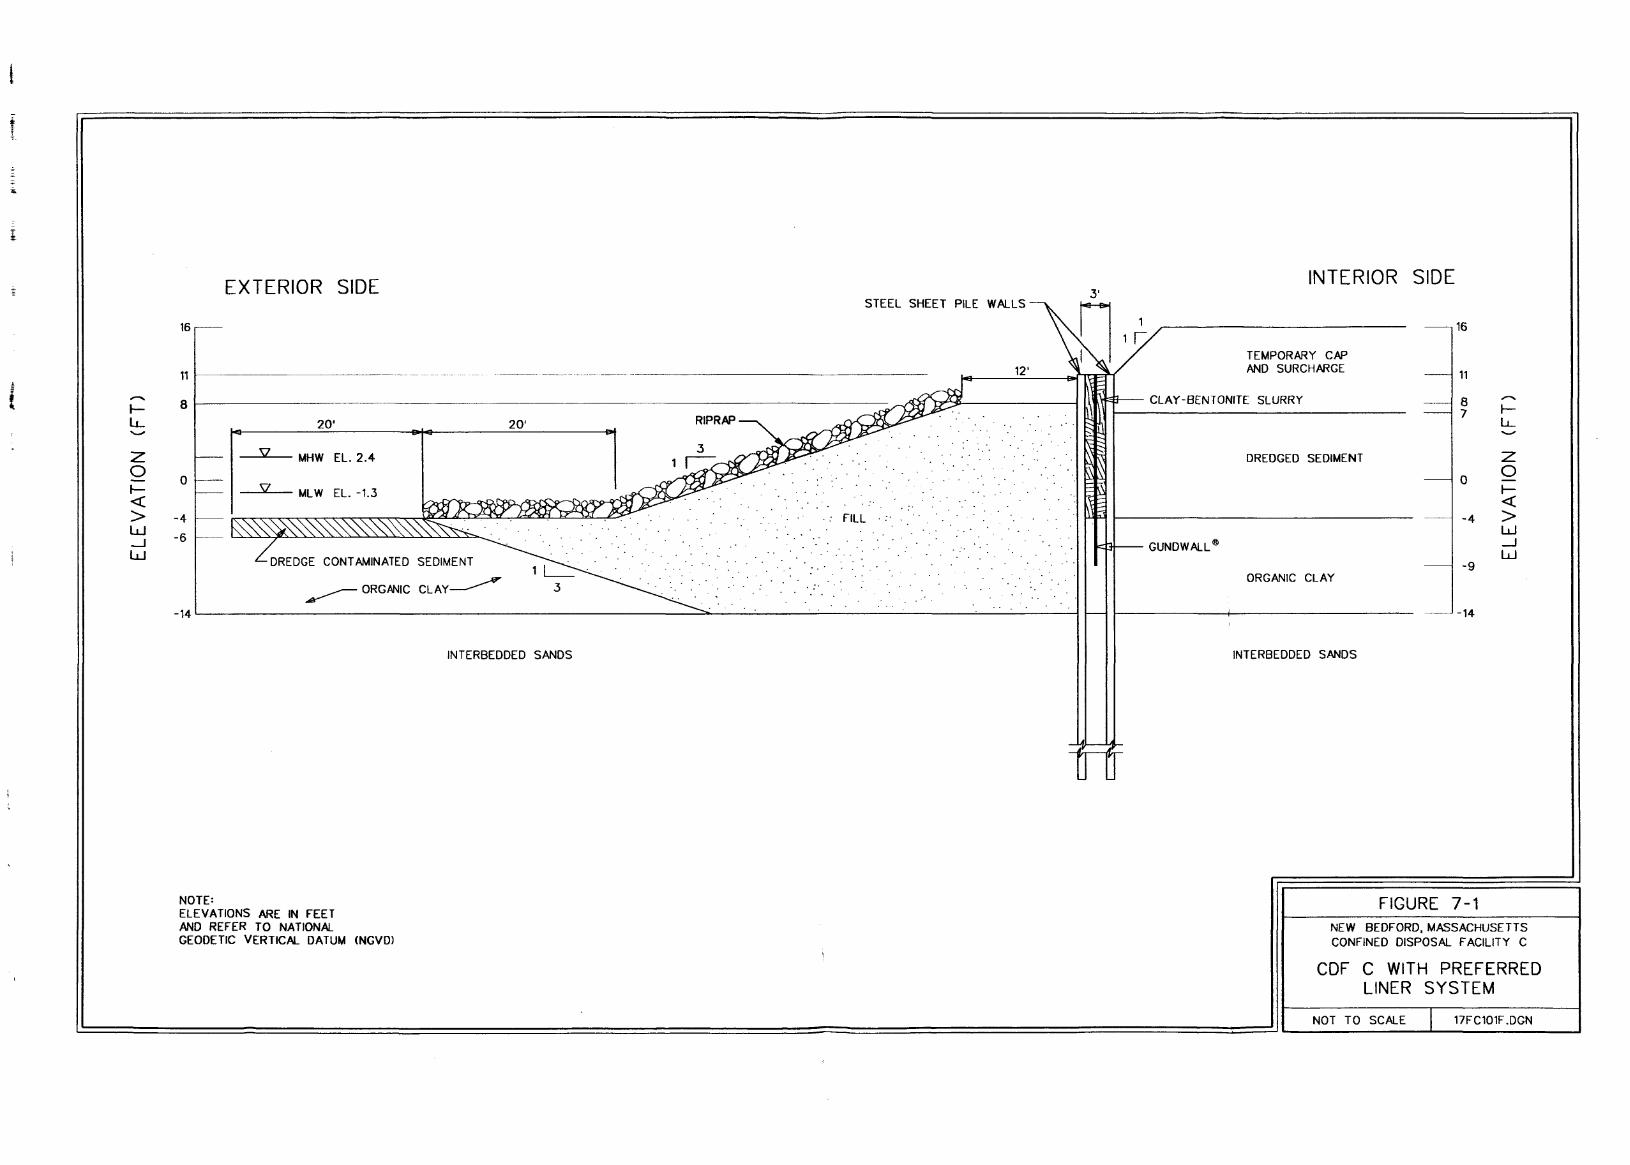
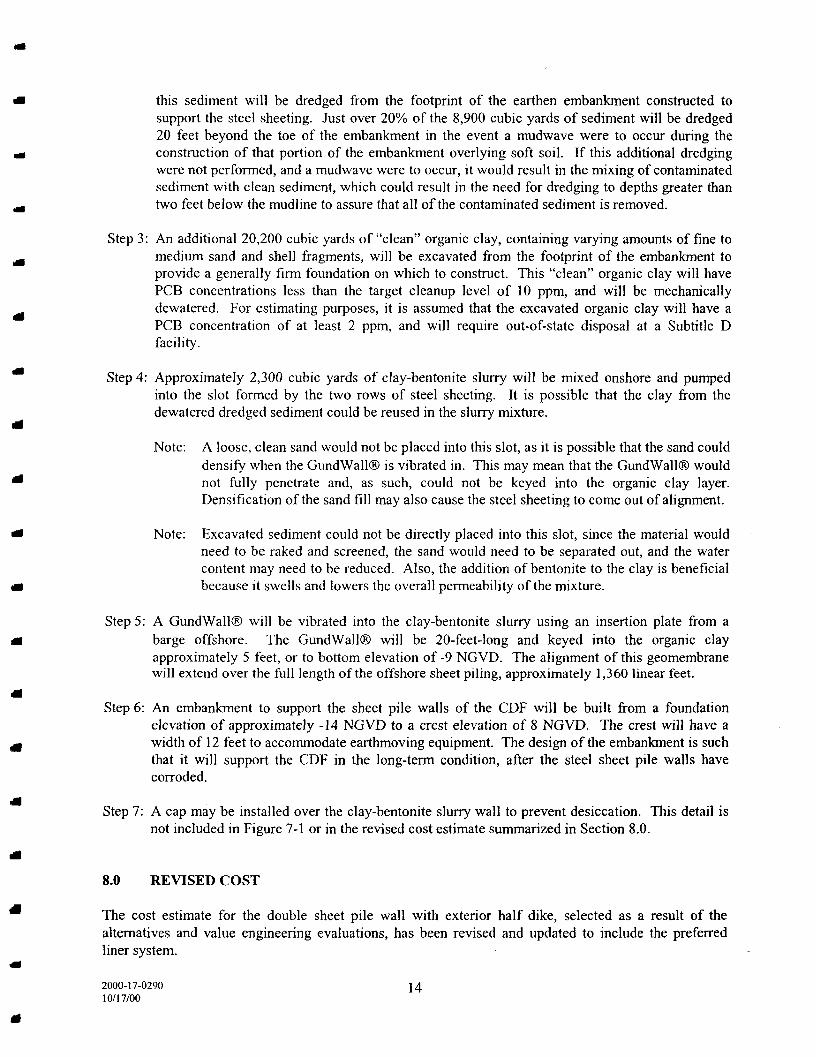
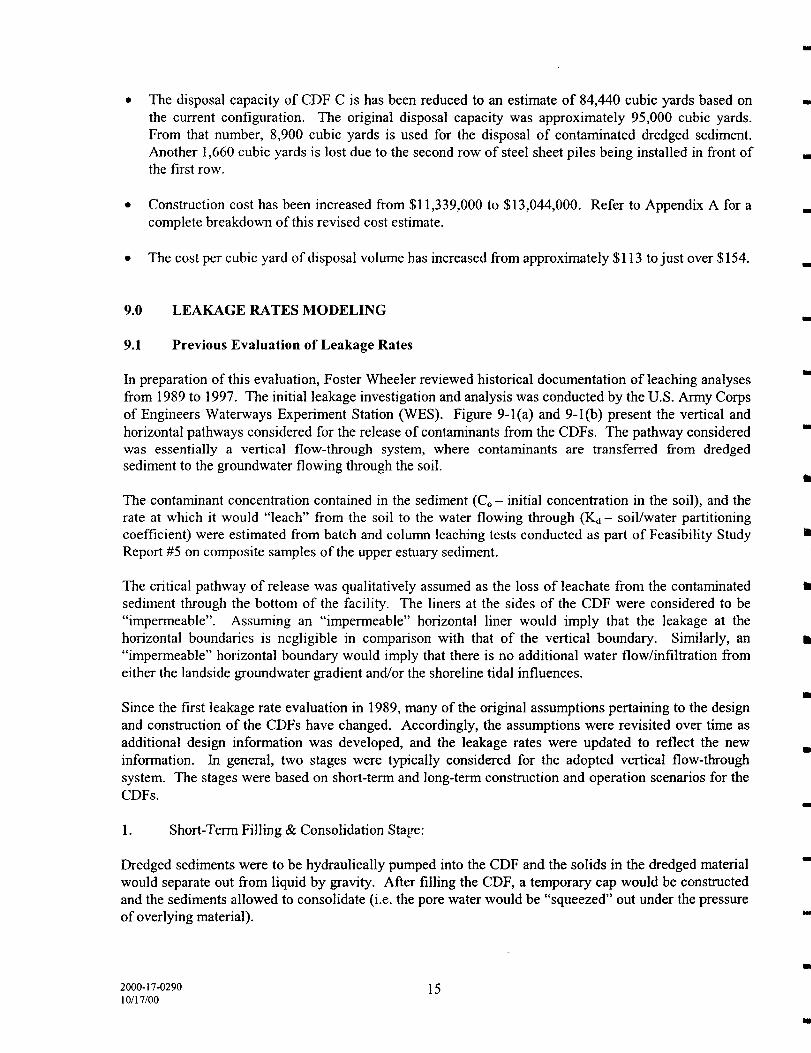
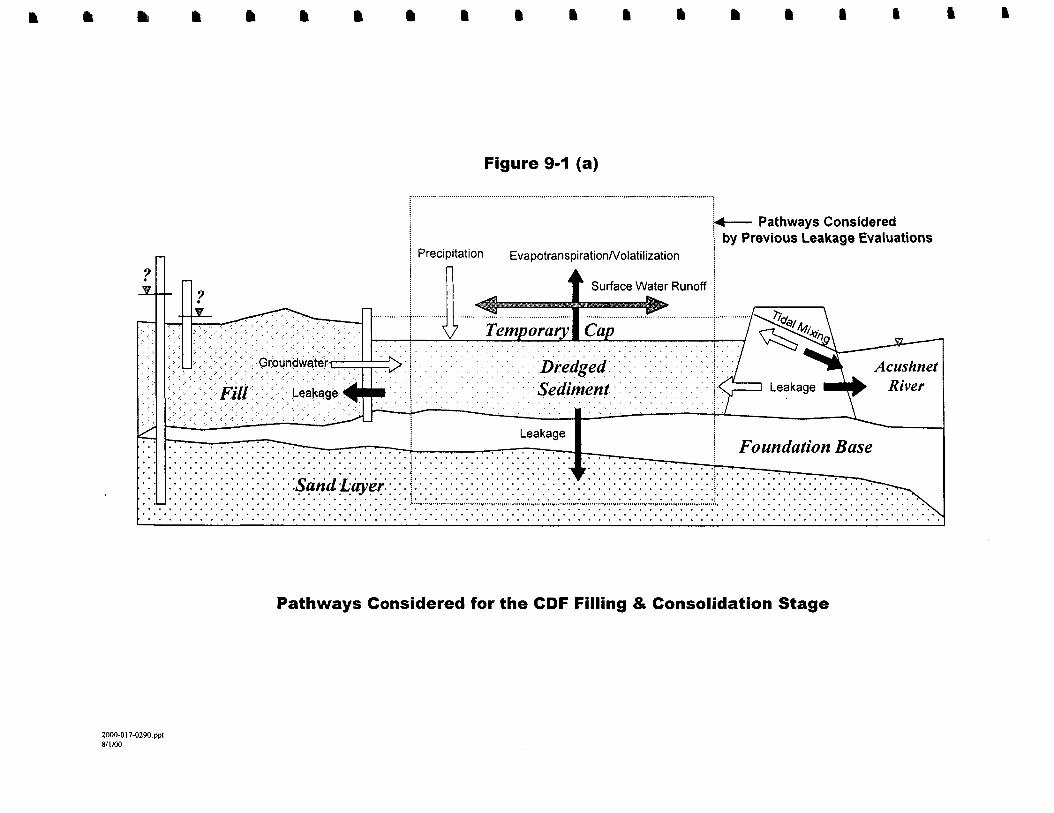
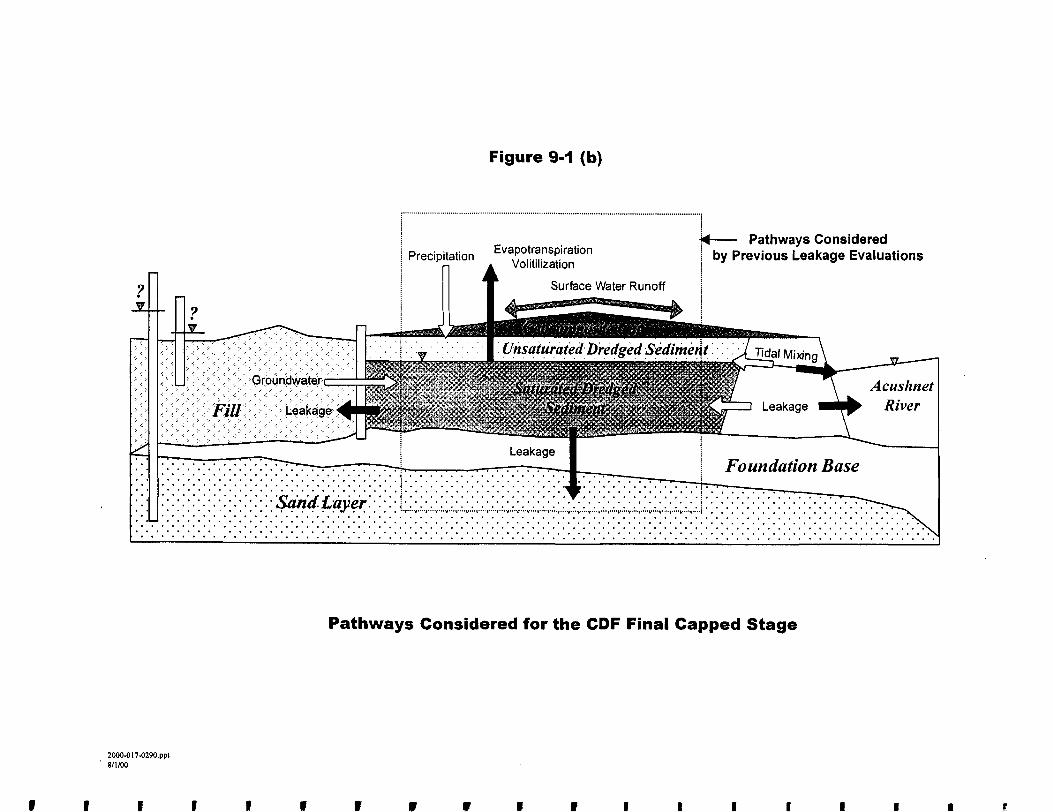
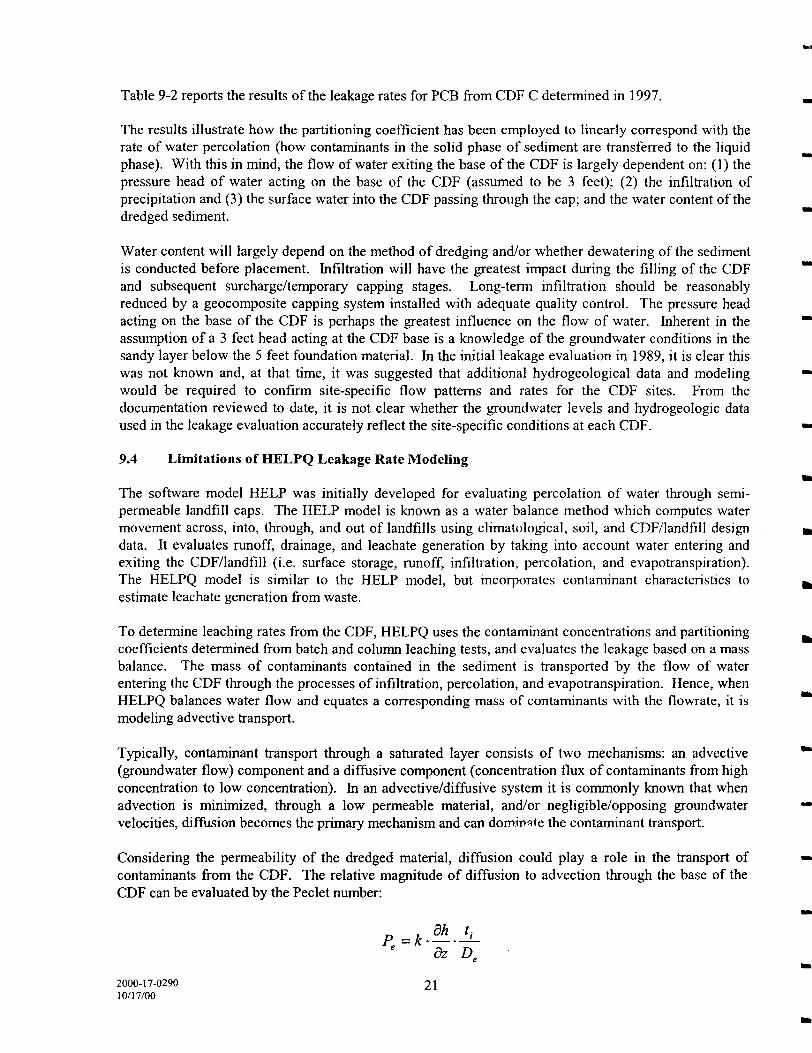
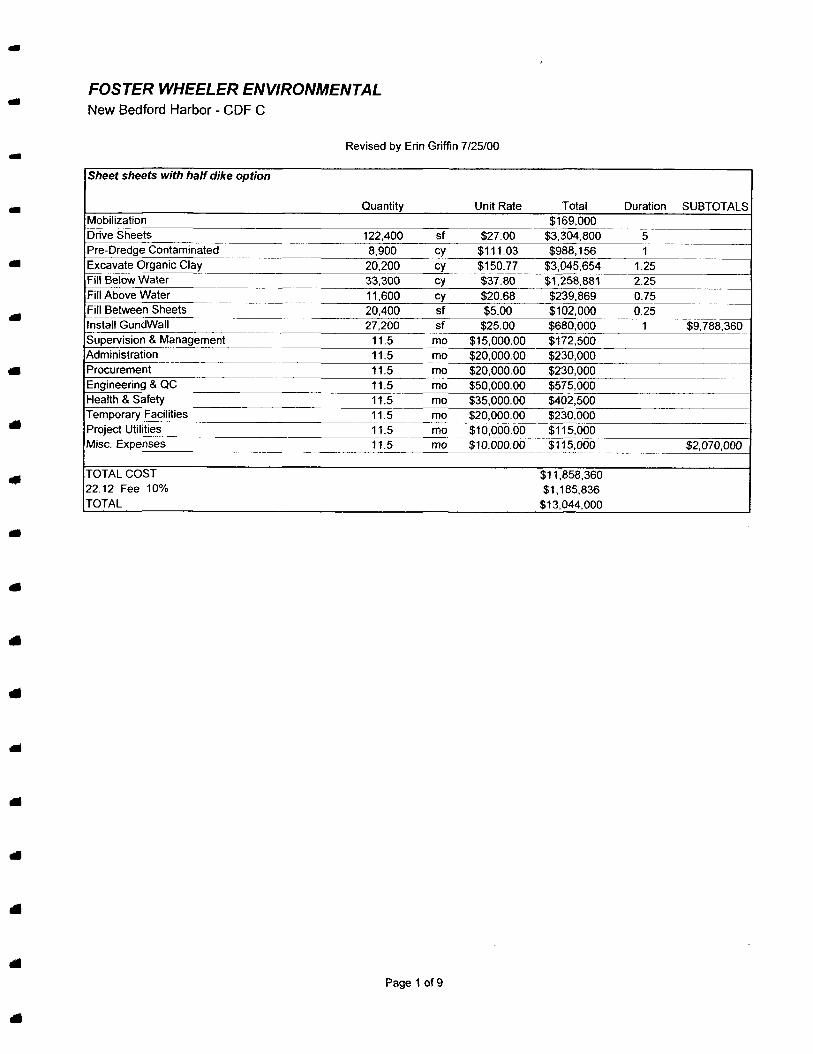
FOSTER WHEELER ENVIRONMENTAL New Bedford Harbor - CDF C
Revised by Enn Gnffin 72500
Sheet sheets with half dike option
Quantity Unit Rate Total Duration SUBTOTALS Mobilization $169000 Drive Sheets 122400 sf $2700 $3304800 5 Pre-Dredge Contaminated 8900 cy $11 1 03 $988156 1 Excavate Organic Clay 20200 cy $150 77 $3045654 125 Fill Below Water 33300 cy $3780 $1258881 225 Fill Above Water 11600 cy $2068 $239869 075 Fill Between Sheets 20400 sf $500 $102000 025 Install GundWall 27200 sf $2500 $680000 1 $9788360 Supervision amp Management 11 5 mo $1500000 $172500 Administration 115 mo $20000 00 $230000 Procurement 11 5 mo $20000 00 $230000 Engineering amp QC 11 5 mo $50000 00 $575000 Health amp Safety 115 mo $35000 00 $402500 Temporary Facilities 11 5 mo $20000 00 $230000 Project Utilities 11 5 mo $10000 00 $115000 Misc Expenses 11 5 mo $1000000 $115000 $2070000
TOTAL COST $11858360 2212 Fee 10 $1185836 TOTAL $13044000
Page 1 of 9
FOSTER WHEELER ENVIRONMENTAL New Bedford Harbor - CDF C
Mobilization
Total Cost 0 0 0 0
Total Cost 0 0 0
0
Total Cost 0 0 0 0
Total Cost 8000
80000 80000
1000 0 0 0
169000
169000
Comments
Comments
Comments
Comments
Craft Labor Operator Operator OT Laborer Laborer OT Subtotal Cost
Equipment
Subtotal Cost
Materials
Subtotal Cost
Subcontract Mobilize Equipment Mobilize Crane Mobilize Barges Mobilize Boats
Subtotal Cost
TOTAL COST
Units hrs hrs hrs hrs
Units
Units
Units 16 ea 2 ea 4 ea 2 ea
Unit Rate4315 5754 3262 4673
Unit Rate
Unit Rate
Unit Rate 500
40000 20000
500
Page 2 of 9
FOSTER WHEELER ENVIRONMENTAL New Bedford Harbor - CDF C
Drive Sheets
Craft Labor
Subtotal Cost
Operator Operator OT Laborer Laborer OT
Units hrs hrs hrs hrs
Unit Rate4315 5754 3262 4673
Total Cost 0 0 0 0
Comments
Equipment
Subtotal Cost
Units Unit Rate Total Cost0 0 0 0
0
Comments
Materials
Subtotal Cost
Units Unit Rate Total Cost0 0 0
0
Comments
Subcontract Permanent Sheets
Units122400 sf
Unit Rate 2700
Total Cost 3304800
Comments 2 rows at 61 200 sf each (quote)
Subtotal Cost 3304800
TOTAL COST 3304800
Page 3 of 9
FOSTER WHEELER ENVIRONMENTAL New Bedford Harbor - CDF C
Pre-Dredge Contaminated Sediment 8900 cy
Craft Labor Operator Operator OT Laborer Laborer OT Subtotal Cost
Units1116hrs
1116
hrshrshrs
Unit Rate 4315 5754 3262 4673
Equipment Units Unit Rate
Subtotal Cost
Materials Units Unit Rate
Subtotal Cost
Subcontract Units Unit RateWater Treatment 1 mnth 50000 Dredging 8900 cy 100
Subtotal Cost
TOTAL COST
Total Cost 48156
0 0 0
48156
Total Cost 0 0 0 0
0
Total Cost
Total Cost 50000
890000
940000
988156
Comments 1 5 Operators 247 Water Treatment
Comments
Comments
Comments PowerSampling Supplies
Page 4 of 9
FOSTER WHEELER ENVIRONMENTAL New Bedford Harbor - CDF C
Excavate Organic Clay
Craft Labor Operator Operator OT Laborer Laborer OT Subtotal Cost
Equipment Clamshell amp Barge Spoils Barge Pushboats Bottom Dump Barge Pump amp Pipeline
Subtotal Cost
Materials Fuel amp Mamt Small Tools
20200 cy
Units 600 hrs 150 hrs
1200 hrs 300 hrs
2250
Units 1 mo 1 mo 2 mo 1 mo 1 mo
Units 25
0 mo
750 cyday
Unit Rate Total Cost 4315 25890 25 5754 8630 83 3262 39138 17 4673 14020 16
87679 41
Unit Rate Total Cost 1500000 1500000 8500 00 8500 00 6000 00 1200000
1200000 1200000 20000 00 20000 00
000 67500 00
Unit Rate Total Cost 67500 00 16875 00 2500 00 000
27 days
Comments 3ea 40 hrswk x 5 weeks Sea 10hrswkx 5 weeks 6ea 40 hrswk x 5 weeks 6ea 10 hrswk x 5 weeks
Comments 1ea 1 ea 2ea 1ea
Comments
Subtotal Cost 16875 00
Subcontract Disposal Facility Research amp Approval - Regulatory Compl Clay Disposal Fees Analytical Testing Dewatering
Units
1 Is 27270 ton
55 ea 20200 cy
Unit Rate
20000 00 8000
120000 3000
Total Cost
20000 00 218160000
66000 00 606000 00
Comments
20200 cy 1 35 1 sample500 tons
tonscy
Subtotal Cost 2873600 00
TOTAL COST 304565441
Page 5 of 9
FOSTER WHEELER ENVIRONMENTAL
750 cyday
New Bedford Harbor - CDF C
Fill Below Water
Craft Labor Operator Operator OT Teamsters Teamster OT Laborer Laborer OT Subtotal Cost
Equipment 140 Material Barges Cranel W Barge 90 Deck Barges Pushboats Loaders 100 Conveyors Feed Conveyor
Subtotal Cost
Materials Fuel amp Mamt Small Tools Fill Material Armor Stone
Subtotal Cost
Subcontract Sieve amp Proctor In-Place Density Test
Subtotal Cost
TOTAL COST
33300 cy
Units 1800 hrs
450 hrs 360 hrs
90 hrs 2160 hrs
540 hrs 5400
Units 4 mo 2 mo 4 mo 4 mo 2 mo 4 mo 2 mo
Units 25
2 mo 53280 ton 3000 cy
Units 20 ea 0 hr
44 4 days
Comments 5 ea 40 hrswk x 9 weeks Sea 10 hrswk x 9 weeks 1 ea 40 hrswk x 9 weeks 1 ea 10 hrswk x 9 weeks 6 ea 40 hrswk x 9 weeks 6ea 10 hrswk x 9 weeks
Comments 2ea 1ea 2ea 2ea 1ea 2ea 1ea
Comments
33300 cy 1 6 toncy
Comments
Unit Rate 4315 5754 4315 5754 3262 4673
Unit Rate 8500 00
1880000 3800 00 6000 00
10000 00 8000 00 6000 00
Unit Rate 17480000
2500 00 1400 2200
Unit Rate 17500 7500
Total Cost 77670 75 25892 49 1553400 517860
70448 70 25236 29
21996084
Total Cost 34000 00 37600 00 1520000 24000 00 20000 00 32000 00 1200000
17480000
Total Cost 43700 00 5000 00
745920 00 66000 00
860620 00
Total Cost 3500 00
000
3500 00
125888084
Page 6 of 9
FOSTER WHEELER ENVIRONMENTAL
750 cyday
New Bedford Harbor - CDF C
Fill Above Water
Craft Labor Operator Operator OT Laborer Laborer OT
Subtotal Cost
Equipment D5 Dozer Excavator Loaders 90 Deck Barges 100 Conveyors Feed Conveyor
Subtotal Cost
Materials Fuel amp Maint Small Tools Misc Supplies Fill Material
Subtotal Cost
Subcontract Sieve amp Proctor In-Place Density Test Surveys
Subtotal Cost
TOTAL COST
11600cy
Units 720 hrs 180 hrs 480 hrs 120 hrs
1500
Units 1 mo 1 mo 1 mo 0 mo 0 mo 0 mo
Units 25
1 00 mo 1 Is
18560 ton
Units 3 ea
80 hr 1 Is
15 5 days
Comments 6 ea 40 hrswk x 3 weeks 6ea 10 hrswk x 3 weeks 4 ea 40 hrswk x 3 weeks 4 ea 10 hrswk x 3 weeks
Comments 1 -D5 1ea 1ea
Comments
1 2000 cy 1 6tncy
Comments
Unit Rate4315 5754 3262 4673
Unit Rate 5500
10000 1000000 3800 00 8000 00 6000 00
Unit Rate 25500 2500 1000 675
Unit Rate 17500 7500
10000 00
Total Cost 3106830 1035700 1565527 5608 06
62689
Total Cost 5500
10000 10000
000 0 0 0
25500
Total Cost 6375 2500 1000
12528000
135155
Total Cost 525
6000 10000
16525
239869
Page 7 of 9
FOSTER WHEELER ENVIRONMENTAL New Bedford Harbor - CDF C
Fill Between Sheets and Install GundWall
Craft Labor
Subtotal Cost
Operator Operator OT Laborer Laborer OT
Units hrs hrs hrs hrs
Unit Rate4315 5754 3262 4673
Total Cost 0 0 0 0
Comments
Equipment
Subtotal Cost
Units Unit Rate Total Cost 0 0 0 0 0
Comments
Materials Units Unit Rate Total Cost Comments
Subtotal Cost
Subcontract Fill Between Sheets (Slurry Wall) Install GundWall
Units 20400 27200
sf sf
Unit Rate500
2500
Total Cost 102000 680000
Comments quote quote
Subtotal Cost 782000
TOTAL COST 782000
Page 8 of 9
Labor Rates Decision No Equip Oper
Rate Fringe Fringe a Fringe b FICA FUTA SUTA Work Comp
Laborer - Haz
Rate Fringe Fringe a Fringe b FICA FUTA SUTA Work Comp
Craft Labor Rates
Engi0004l Group 1 Equip Oper OT
2604 Base 1062 Hlth amp Wlfreetc 0 00 Haz Premium 1 04 Holiday 2 07 7 65 0 22 0 80 1 38 5 10 1 78 6 57
4315
10 Days
Rate Fringe Fringe a Fringe b FICA FUTA SUTA Work Comp
Labo0022L Group 6 Laborer - HazOT
20 95 Base 7 45 Hlth amp Wlfreetc 0 00 Haz Premium 0 00 Holiday 1 60 7 65 017 080 107 510 1 38 6 57
3262
0 Days
Rate Fringe Fringe a Fringe b FICA FUTA SUTA Work Comp
Engi0004l Group 1
39 06 Base 1062 Hlth amp Wlfreetc 0 00 Haz Premium 0 00 Holiday 2 99 7 65 0 31 0 80 1 99 5 10 2 57 6 57
5754
10 Days
Labo0022L Group 6
31 43 Base 7 45 Hlth amp Wlfreetc 0 00 Haz Premium 0 00 Holiday 2 99 7 65 0 31 0 80 1 99 5 10 257 6 57
4673
10 Days
Page 9 of 9
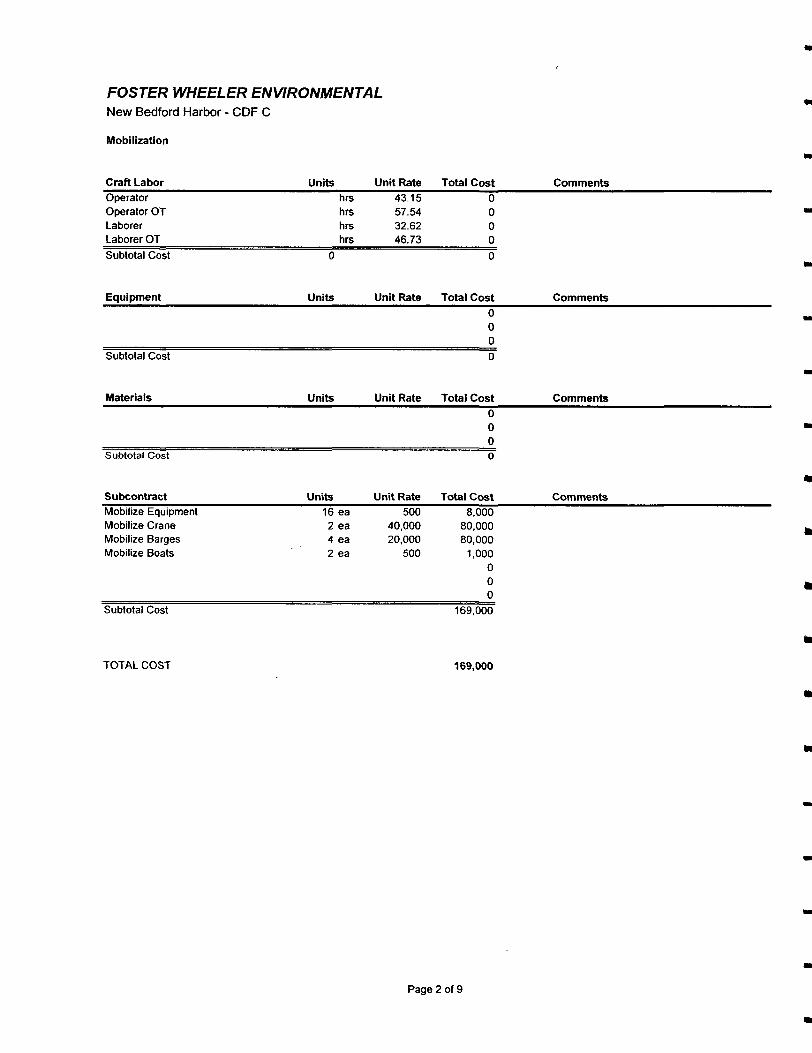
FOSTER WHEELER ENVIRONMENTAL New Bedford Harbor - CDF C
Mobilization
Total Cost 0 0 0 0
Total Cost 0 0 0
0
Total Cost 0 0 0 0
Total Cost 8000
80000 80000
1000 0 0 0
169000
169000
Comments
Comments
Comments
Comments
Craft Labor Operator Operator OT Laborer Laborer OT Subtotal Cost
Equipment
Subtotal Cost
Materials
Subtotal Cost
Subcontract Mobilize Equipment Mobilize Crane Mobilize Barges Mobilize Boats
Subtotal Cost
TOTAL COST
Units hrs hrs hrs hrs
Units
Units
Units 16 ea 2 ea 4 ea 2 ea
Unit Rate4315 5754 3262 4673
Unit Rate
Unit Rate
Unit Rate 500
40000 20000
500
Page 2 of 9
FOSTER WHEELER ENVIRONMENTAL New Bedford Harbor - CDF C
Drive Sheets
Craft Labor
Subtotal Cost
Operator Operator OT Laborer Laborer OT
Units hrs hrs hrs hrs
Unit Rate4315 5754 3262 4673
Total Cost 0 0 0 0
Comments
Equipment
Subtotal Cost
Units Unit Rate Total Cost0 0 0 0
0
Comments
Materials
Subtotal Cost
Units Unit Rate Total Cost0 0 0
0
Comments
Subcontract Permanent Sheets
Units122400 sf
Unit Rate 2700
Total Cost 3304800
Comments 2 rows at 61 200 sf each (quote)
Subtotal Cost 3304800
TOTAL COST 3304800
Page 3 of 9
FOSTER WHEELER ENVIRONMENTAL New Bedford Harbor - CDF C
Pre-Dredge Contaminated Sediment 8900 cy
Craft Labor Operator Operator OT Laborer Laborer OT Subtotal Cost
Units1116hrs
1116
hrshrshrs
Unit Rate 4315 5754 3262 4673
Equipment Units Unit Rate
Subtotal Cost
Materials Units Unit Rate
Subtotal Cost
Subcontract Units Unit RateWater Treatment 1 mnth 50000 Dredging 8900 cy 100
Subtotal Cost
TOTAL COST
Total Cost 48156
0 0 0
48156
Total Cost 0 0 0 0
0
Total Cost
Total Cost 50000
890000
940000
988156
Comments 1 5 Operators 247 Water Treatment
Comments
Comments
Comments PowerSampling Supplies
Page 4 of 9
FOSTER WHEELER ENVIRONMENTAL New Bedford Harbor - CDF C
Excavate Organic Clay
Craft Labor Operator Operator OT Laborer Laborer OT Subtotal Cost
Equipment Clamshell amp Barge Spoils Barge Pushboats Bottom Dump Barge Pump amp Pipeline
Subtotal Cost
Materials Fuel amp Mamt Small Tools
20200 cy
Units 600 hrs 150 hrs
1200 hrs 300 hrs
2250
Units 1 mo 1 mo 2 mo 1 mo 1 mo
Units 25
0 mo
750 cyday
Unit Rate Total Cost 4315 25890 25 5754 8630 83 3262 39138 17 4673 14020 16
87679 41
Unit Rate Total Cost 1500000 1500000 8500 00 8500 00 6000 00 1200000
1200000 1200000 20000 00 20000 00
000 67500 00
Unit Rate Total Cost 67500 00 16875 00 2500 00 000
27 days
Comments 3ea 40 hrswk x 5 weeks Sea 10hrswkx 5 weeks 6ea 40 hrswk x 5 weeks 6ea 10 hrswk x 5 weeks
Comments 1ea 1 ea 2ea 1ea
Comments
Subtotal Cost 16875 00
Subcontract Disposal Facility Research amp Approval - Regulatory Compl Clay Disposal Fees Analytical Testing Dewatering
Units
1 Is 27270 ton
55 ea 20200 cy
Unit Rate
20000 00 8000
120000 3000
Total Cost
20000 00 218160000
66000 00 606000 00
Comments
20200 cy 1 35 1 sample500 tons
tonscy
Subtotal Cost 2873600 00
TOTAL COST 304565441
Page 5 of 9
FOSTER WHEELER ENVIRONMENTAL
750 cyday
New Bedford Harbor - CDF C
Fill Below Water
Craft Labor Operator Operator OT Teamsters Teamster OT Laborer Laborer OT Subtotal Cost
Equipment 140 Material Barges Cranel W Barge 90 Deck Barges Pushboats Loaders 100 Conveyors Feed Conveyor
Subtotal Cost
Materials Fuel amp Mamt Small Tools Fill Material Armor Stone
Subtotal Cost
Subcontract Sieve amp Proctor In-Place Density Test
Subtotal Cost
TOTAL COST
33300 cy
Units 1800 hrs
450 hrs 360 hrs
90 hrs 2160 hrs
540 hrs 5400
Units 4 mo 2 mo 4 mo 4 mo 2 mo 4 mo 2 mo
Units 25
2 mo 53280 ton 3000 cy
Units 20 ea 0 hr
44 4 days
Comments 5 ea 40 hrswk x 9 weeks Sea 10 hrswk x 9 weeks 1 ea 40 hrswk x 9 weeks 1 ea 10 hrswk x 9 weeks 6 ea 40 hrswk x 9 weeks 6ea 10 hrswk x 9 weeks
Comments 2ea 1ea 2ea 2ea 1ea 2ea 1ea
Comments
33300 cy 1 6 toncy
Comments
Unit Rate 4315 5754 4315 5754 3262 4673
Unit Rate 8500 00
1880000 3800 00 6000 00
10000 00 8000 00 6000 00
Unit Rate 17480000
2500 00 1400 2200
Unit Rate 17500 7500
Total Cost 77670 75 25892 49 1553400 517860
70448 70 25236 29
21996084
Total Cost 34000 00 37600 00 1520000 24000 00 20000 00 32000 00 1200000
17480000
Total Cost 43700 00 5000 00
745920 00 66000 00
860620 00
Total Cost 3500 00
000
3500 00
125888084
Page 6 of 9
FOSTER WHEELER ENVIRONMENTAL
750 cyday
New Bedford Harbor - CDF C
Fill Above Water
Craft Labor Operator Operator OT Laborer Laborer OT
Subtotal Cost
Equipment D5 Dozer Excavator Loaders 90 Deck Barges 100 Conveyors Feed Conveyor
Subtotal Cost
Materials Fuel amp Maint Small Tools Misc Supplies Fill Material
Subtotal Cost
Subcontract Sieve amp Proctor In-Place Density Test Surveys
Subtotal Cost
TOTAL COST
11600cy
Units 720 hrs 180 hrs 480 hrs 120 hrs
1500
Units 1 mo 1 mo 1 mo 0 mo 0 mo 0 mo
Units 25
1 00 mo 1 Is
18560 ton
Units 3 ea
80 hr 1 Is
15 5 days
Comments 6 ea 40 hrswk x 3 weeks 6ea 10 hrswk x 3 weeks 4 ea 40 hrswk x 3 weeks 4 ea 10 hrswk x 3 weeks
Comments 1 -D5 1ea 1ea
Comments
1 2000 cy 1 6tncy
Comments
Unit Rate4315 5754 3262 4673
Unit Rate 5500
10000 1000000 3800 00 8000 00 6000 00
Unit Rate 25500 2500 1000 675
Unit Rate 17500 7500
10000 00
Total Cost 3106830 1035700 1565527 5608 06
62689
Total Cost 5500
10000 10000
000 0 0 0
25500
Total Cost 6375 2500 1000
12528000
135155
Total Cost 525
6000 10000
16525
239869
Page 7 of 9
FOSTER WHEELER ENVIRONMENTAL New Bedford Harbor - CDF C
Fill Between Sheets and Install GundWall
Craft Labor
Subtotal Cost
Operator Operator OT Laborer Laborer OT
Units hrs hrs hrs hrs
Unit Rate4315 5754 3262 4673
Total Cost 0 0 0 0
Comments
Equipment
Subtotal Cost
Units Unit Rate Total Cost 0 0 0 0 0
Comments
Materials Units Unit Rate Total Cost Comments
Subtotal Cost
Subcontract Fill Between Sheets (Slurry Wall) Install GundWall
Units 20400 27200
sf sf
Unit Rate500
2500
Total Cost 102000 680000
Comments quote quote
Subtotal Cost 782000
TOTAL COST 782000
Page 8 of 9
Labor Rates Decision No Equip Oper
Rate Fringe Fringe a Fringe b FICA FUTA SUTA Work Comp
Laborer - Haz
Rate Fringe Fringe a Fringe b FICA FUTA SUTA Work Comp
Craft Labor Rates
Engi0004l Group 1 Equip Oper OT
2604 Base 1062 Hlth amp Wlfreetc 0 00 Haz Premium 1 04 Holiday 2 07 7 65 0 22 0 80 1 38 5 10 1 78 6 57
4315
10 Days
Rate Fringe Fringe a Fringe b FICA FUTA SUTA Work Comp
Labo0022L Group 6 Laborer - HazOT
20 95 Base 7 45 Hlth amp Wlfreetc 0 00 Haz Premium 0 00 Holiday 1 60 7 65 017 080 107 510 1 38 6 57
3262
0 Days
Rate Fringe Fringe a Fringe b FICA FUTA SUTA Work Comp
Engi0004l Group 1
39 06 Base 1062 Hlth amp Wlfreetc 0 00 Haz Premium 0 00 Holiday 2 99 7 65 0 31 0 80 1 99 5 10 2 57 6 57
5754
10 Days
Labo0022L Group 6
31 43 Base 7 45 Hlth amp Wlfreetc 0 00 Haz Premium 0 00 Holiday 2 99 7 65 0 31 0 80 1 99 5 10 257 6 57
4673
10 Days
Page 9 of 9
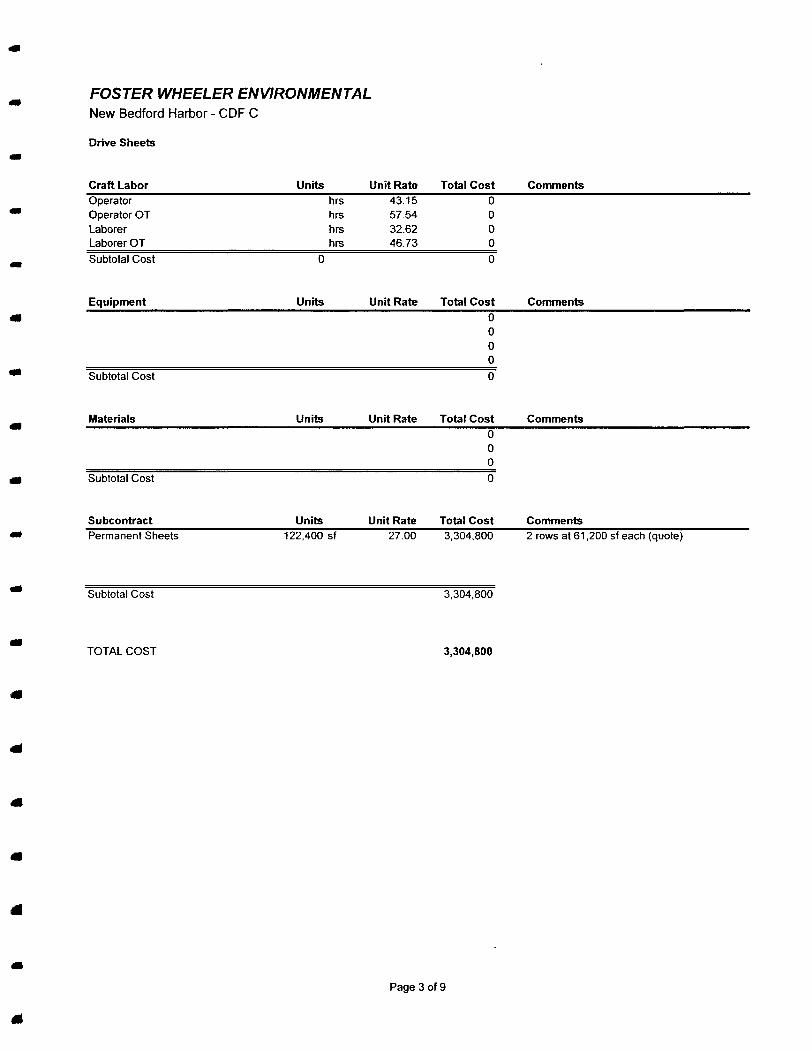
FOSTER WHEELER ENVIRONMENTAL New Bedford Harbor - CDF C
Pre-Dredge Contaminated Sediment 8900 cy
Craft Labor Operator Operator OT Laborer Laborer OT Subtotal Cost
Units1116hrs
1116
hrshrshrs
Unit Rate 4315 5754 3262 4673
Equipment Units Unit Rate
Subtotal Cost
Materials Units Unit Rate
Subtotal Cost
Subcontract Units Unit RateWater Treatment 1 mnth 50000 Dredging 8900 cy 100
Subtotal Cost
TOTAL COST
Total Cost 48156
0 0 0
48156
Total Cost 0 0 0 0
0
Total Cost
Total Cost 50000
890000
940000
988156
Comments 1 5 Operators 247 Water Treatment
Comments
Comments
Comments PowerSampling Supplies
Page 4 of 9
FOSTER WHEELER ENVIRONMENTAL New Bedford Harbor - CDF C
Excavate Organic Clay
Craft Labor Operator Operator OT Laborer Laborer OT Subtotal Cost
Equipment Clamshell amp Barge Spoils Barge Pushboats Bottom Dump Barge Pump amp Pipeline
Subtotal Cost
Materials Fuel amp Mamt Small Tools
20200 cy
Units 600 hrs 150 hrs
1200 hrs 300 hrs
2250
Units 1 mo 1 mo 2 mo 1 mo 1 mo
Units 25
0 mo
750 cyday
Unit Rate Total Cost 4315 25890 25 5754 8630 83 3262 39138 17 4673 14020 16
87679 41
Unit Rate Total Cost 1500000 1500000 8500 00 8500 00 6000 00 1200000
1200000 1200000 20000 00 20000 00
000 67500 00
Unit Rate Total Cost 67500 00 16875 00 2500 00 000
27 days
Comments 3ea 40 hrswk x 5 weeks Sea 10hrswkx 5 weeks 6ea 40 hrswk x 5 weeks 6ea 10 hrswk x 5 weeks
Comments 1ea 1 ea 2ea 1ea
Comments
Subtotal Cost 16875 00
Subcontract Disposal Facility Research amp Approval - Regulatory Compl Clay Disposal Fees Analytical Testing Dewatering
Units
1 Is 27270 ton
55 ea 20200 cy
Unit Rate
20000 00 8000
120000 3000
Total Cost
20000 00 218160000
66000 00 606000 00
Comments
20200 cy 1 35 1 sample500 tons
tonscy
Subtotal Cost 2873600 00
TOTAL COST 304565441
Page 5 of 9
FOSTER WHEELER ENVIRONMENTAL
750 cyday
New Bedford Harbor - CDF C
Fill Below Water
Craft Labor Operator Operator OT Teamsters Teamster OT Laborer Laborer OT Subtotal Cost
Equipment 140 Material Barges Cranel W Barge 90 Deck Barges Pushboats Loaders 100 Conveyors Feed Conveyor
Subtotal Cost
Materials Fuel amp Mamt Small Tools Fill Material Armor Stone
Subtotal Cost
Subcontract Sieve amp Proctor In-Place Density Test
Subtotal Cost
TOTAL COST
33300 cy
Units 1800 hrs
450 hrs 360 hrs
90 hrs 2160 hrs
540 hrs 5400
Units 4 mo 2 mo 4 mo 4 mo 2 mo 4 mo 2 mo
Units 25
2 mo 53280 ton 3000 cy
Units 20 ea 0 hr
44 4 days
Comments 5 ea 40 hrswk x 9 weeks Sea 10 hrswk x 9 weeks 1 ea 40 hrswk x 9 weeks 1 ea 10 hrswk x 9 weeks 6 ea 40 hrswk x 9 weeks 6ea 10 hrswk x 9 weeks
Comments 2ea 1ea 2ea 2ea 1ea 2ea 1ea
Comments
33300 cy 1 6 toncy
Comments
Unit Rate 4315 5754 4315 5754 3262 4673
Unit Rate 8500 00
1880000 3800 00 6000 00
10000 00 8000 00 6000 00
Unit Rate 17480000
2500 00 1400 2200
Unit Rate 17500 7500
Total Cost 77670 75 25892 49 1553400 517860
70448 70 25236 29
21996084
Total Cost 34000 00 37600 00 1520000 24000 00 20000 00 32000 00 1200000
17480000
Total Cost 43700 00 5000 00
745920 00 66000 00
860620 00
Total Cost 3500 00
000
3500 00
125888084
Page 6 of 9
FOSTER WHEELER ENVIRONMENTAL
750 cyday
New Bedford Harbor - CDF C
Fill Above Water
Craft Labor Operator Operator OT Laborer Laborer OT
Subtotal Cost
Equipment D5 Dozer Excavator Loaders 90 Deck Barges 100 Conveyors Feed Conveyor
Subtotal Cost
Materials Fuel amp Maint Small Tools Misc Supplies Fill Material
Subtotal Cost
Subcontract Sieve amp Proctor In-Place Density Test Surveys
Subtotal Cost
TOTAL COST
11600cy
Units 720 hrs 180 hrs 480 hrs 120 hrs
1500
Units 1 mo 1 mo 1 mo 0 mo 0 mo 0 mo
Units 25
1 00 mo 1 Is
18560 ton
Units 3 ea
80 hr 1 Is
15 5 days
Comments 6 ea 40 hrswk x 3 weeks 6ea 10 hrswk x 3 weeks 4 ea 40 hrswk x 3 weeks 4 ea 10 hrswk x 3 weeks
Comments 1 -D5 1ea 1ea
Comments
1 2000 cy 1 6tncy
Comments
Unit Rate4315 5754 3262 4673
Unit Rate 5500
10000 1000000 3800 00 8000 00 6000 00
Unit Rate 25500 2500 1000 675
Unit Rate 17500 7500
10000 00
Total Cost 3106830 1035700 1565527 5608 06
62689
Total Cost 5500
10000 10000
000 0 0 0
25500
Total Cost 6375 2500 1000
12528000
135155
Total Cost 525
6000 10000
16525
239869
Page 7 of 9
FOSTER WHEELER ENVIRONMENTAL New Bedford Harbor - CDF C
Fill Between Sheets and Install GundWall
Craft Labor
Subtotal Cost
Operator Operator OT Laborer Laborer OT
Units hrs hrs hrs hrs
Unit Rate4315 5754 3262 4673
Total Cost 0 0 0 0
Comments
Equipment
Subtotal Cost
Units Unit Rate Total Cost 0 0 0 0 0
Comments
Materials Units Unit Rate Total Cost Comments
Subtotal Cost
Subcontract Fill Between Sheets (Slurry Wall) Install GundWall
Units 20400 27200
sf sf
Unit Rate500
2500
Total Cost 102000 680000
Comments quote quote
Subtotal Cost 782000
TOTAL COST 782000
Page 8 of 9
Labor Rates Decision No Equip Oper
Rate Fringe Fringe a Fringe b FICA FUTA SUTA Work Comp
Laborer - Haz
Rate Fringe Fringe a Fringe b FICA FUTA SUTA Work Comp
Craft Labor Rates
Engi0004l Group 1 Equip Oper OT
2604 Base 1062 Hlth amp Wlfreetc 0 00 Haz Premium 1 04 Holiday 2 07 7 65 0 22 0 80 1 38 5 10 1 78 6 57
4315
10 Days
Rate Fringe Fringe a Fringe b FICA FUTA SUTA Work Comp
Labo0022L Group 6 Laborer - HazOT
20 95 Base 7 45 Hlth amp Wlfreetc 0 00 Haz Premium 0 00 Holiday 1 60 7 65 017 080 107 510 1 38 6 57
3262
0 Days
Rate Fringe Fringe a Fringe b FICA FUTA SUTA Work Comp
Engi0004l Group 1
39 06 Base 1062 Hlth amp Wlfreetc 0 00 Haz Premium 0 00 Holiday 2 99 7 65 0 31 0 80 1 99 5 10 2 57 6 57
5754
10 Days
Labo0022L Group 6
31 43 Base 7 45 Hlth amp Wlfreetc 0 00 Haz Premium 0 00 Holiday 2 99 7 65 0 31 0 80 1 99 5 10 257 6 57
4673
10 Days
Page 9 of 9
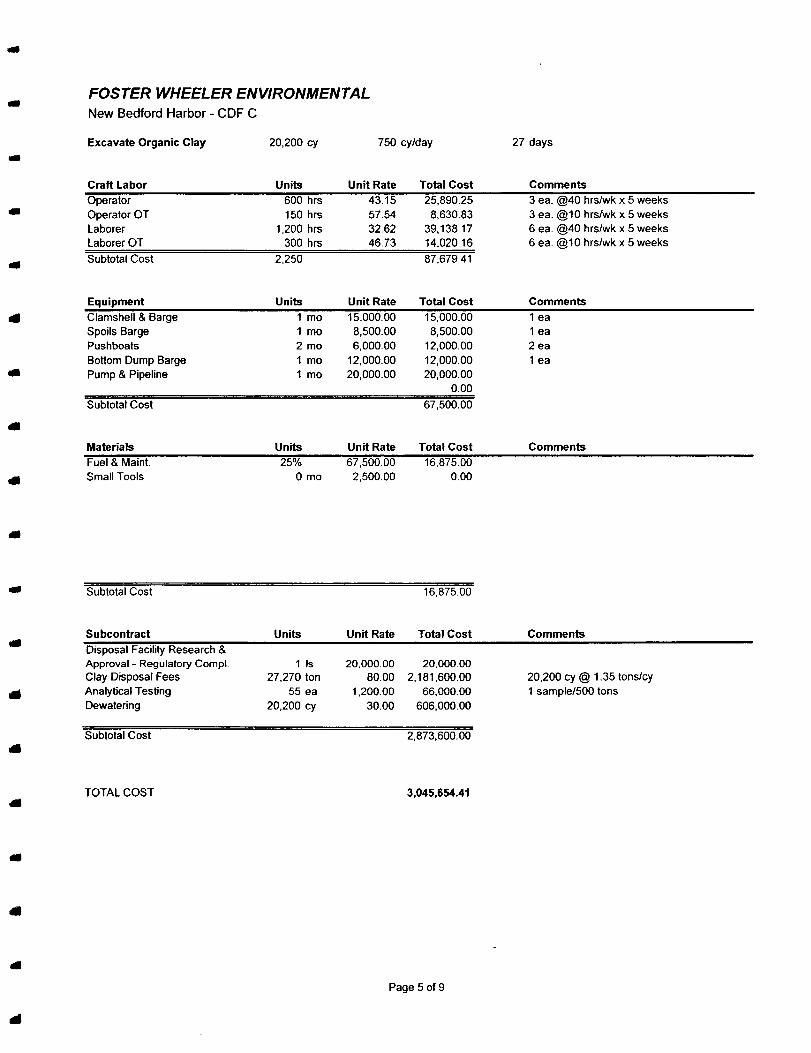
FOSTER WHEELER ENVIRONMENTAL New Bedford Harbor - CDF C
Excavate Organic Clay
Craft Labor Operator Operator OT Laborer Laborer OT Subtotal Cost
Equipment Clamshell amp Barge Spoils Barge Pushboats Bottom Dump Barge Pump amp Pipeline
Subtotal Cost
Materials Fuel amp Mamt Small Tools
20200 cy
Units 600 hrs 150 hrs
1200 hrs 300 hrs
2250
Units 1 mo 1 mo 2 mo 1 mo 1 mo
Units 25
0 mo
750 cyday
Unit Rate Total Cost 4315 25890 25 5754 8630 83 3262 39138 17 4673 14020 16
87679 41
Unit Rate Total Cost 1500000 1500000 8500 00 8500 00 6000 00 1200000
1200000 1200000 20000 00 20000 00
000 67500 00
Unit Rate Total Cost 67500 00 16875 00 2500 00 000
27 days
Comments 3ea 40 hrswk x 5 weeks Sea 10hrswkx 5 weeks 6ea 40 hrswk x 5 weeks 6ea 10 hrswk x 5 weeks
Comments 1ea 1 ea 2ea 1ea
Comments
Subtotal Cost 16875 00
Subcontract Disposal Facility Research amp Approval - Regulatory Compl Clay Disposal Fees Analytical Testing Dewatering
Units
1 Is 27270 ton
55 ea 20200 cy
Unit Rate
20000 00 8000
120000 3000
Total Cost
20000 00 218160000
66000 00 606000 00
Comments
20200 cy 1 35 1 sample500 tons
tonscy
Subtotal Cost 2873600 00
TOTAL COST 304565441
Page 5 of 9
FOSTER WHEELER ENVIRONMENTAL
750 cyday
New Bedford Harbor - CDF C
Fill Below Water
Craft Labor Operator Operator OT Teamsters Teamster OT Laborer Laborer OT Subtotal Cost
Equipment 140 Material Barges Cranel W Barge 90 Deck Barges Pushboats Loaders 100 Conveyors Feed Conveyor
Subtotal Cost
Materials Fuel amp Mamt Small Tools Fill Material Armor Stone
Subtotal Cost
Subcontract Sieve amp Proctor In-Place Density Test
Subtotal Cost
TOTAL COST
33300 cy
Units 1800 hrs
450 hrs 360 hrs
90 hrs 2160 hrs
540 hrs 5400
Units 4 mo 2 mo 4 mo 4 mo 2 mo 4 mo 2 mo
Units 25
2 mo 53280 ton 3000 cy
Units 20 ea 0 hr
44 4 days
Comments 5 ea 40 hrswk x 9 weeks Sea 10 hrswk x 9 weeks 1 ea 40 hrswk x 9 weeks 1 ea 10 hrswk x 9 weeks 6 ea 40 hrswk x 9 weeks 6ea 10 hrswk x 9 weeks
Comments 2ea 1ea 2ea 2ea 1ea 2ea 1ea
Comments
33300 cy 1 6 toncy
Comments
Unit Rate 4315 5754 4315 5754 3262 4673
Unit Rate 8500 00
1880000 3800 00 6000 00
10000 00 8000 00 6000 00
Unit Rate 17480000
2500 00 1400 2200
Unit Rate 17500 7500
Total Cost 77670 75 25892 49 1553400 517860
70448 70 25236 29
21996084
Total Cost 34000 00 37600 00 1520000 24000 00 20000 00 32000 00 1200000
17480000
Total Cost 43700 00 5000 00
745920 00 66000 00
860620 00
Total Cost 3500 00
000
3500 00
125888084
Page 6 of 9
FOSTER WHEELER ENVIRONMENTAL
750 cyday
New Bedford Harbor - CDF C
Fill Above Water
Craft Labor Operator Operator OT Laborer Laborer OT
Subtotal Cost
Equipment D5 Dozer Excavator Loaders 90 Deck Barges 100 Conveyors Feed Conveyor
Subtotal Cost
Materials Fuel amp Maint Small Tools Misc Supplies Fill Material
Subtotal Cost
Subcontract Sieve amp Proctor In-Place Density Test Surveys
Subtotal Cost
TOTAL COST
11600cy
Units 720 hrs 180 hrs 480 hrs 120 hrs
1500
Units 1 mo 1 mo 1 mo 0 mo 0 mo 0 mo
Units 25
1 00 mo 1 Is
18560 ton
Units 3 ea
80 hr 1 Is
15 5 days
Comments 6 ea 40 hrswk x 3 weeks 6ea 10 hrswk x 3 weeks 4 ea 40 hrswk x 3 weeks 4 ea 10 hrswk x 3 weeks
Comments 1 -D5 1ea 1ea
Comments
1 2000 cy 1 6tncy
Comments
Unit Rate4315 5754 3262 4673
Unit Rate 5500
10000 1000000 3800 00 8000 00 6000 00
Unit Rate 25500 2500 1000 675
Unit Rate 17500 7500
10000 00
Total Cost 3106830 1035700 1565527 5608 06
62689
Total Cost 5500
10000 10000
000 0 0 0
25500
Total Cost 6375 2500 1000
12528000
135155
Total Cost 525
6000 10000
16525
239869
Page 7 of 9
FOSTER WHEELER ENVIRONMENTAL New Bedford Harbor - CDF C
Fill Between Sheets and Install GundWall
Craft Labor
Subtotal Cost
Operator Operator OT Laborer Laborer OT
Units hrs hrs hrs hrs
Unit Rate4315 5754 3262 4673
Total Cost 0 0 0 0
Comments
Equipment
Subtotal Cost
Units Unit Rate Total Cost 0 0 0 0 0
Comments
Materials Units Unit Rate Total Cost Comments
Subtotal Cost
Subcontract Fill Between Sheets (Slurry Wall) Install GundWall
Units 20400 27200
sf sf
Unit Rate500
2500
Total Cost 102000 680000
Comments quote quote
Subtotal Cost 782000
TOTAL COST 782000
Page 8 of 9
Labor Rates Decision No Equip Oper
Rate Fringe Fringe a Fringe b FICA FUTA SUTA Work Comp
Laborer - Haz
Rate Fringe Fringe a Fringe b FICA FUTA SUTA Work Comp
Craft Labor Rates
Engi0004l Group 1 Equip Oper OT
2604 Base 1062 Hlth amp Wlfreetc 0 00 Haz Premium 1 04 Holiday 2 07 7 65 0 22 0 80 1 38 5 10 1 78 6 57
4315
10 Days
Rate Fringe Fringe a Fringe b FICA FUTA SUTA Work Comp
Labo0022L Group 6 Laborer - HazOT
20 95 Base 7 45 Hlth amp Wlfreetc 0 00 Haz Premium 0 00 Holiday 1 60 7 65 017 080 107 510 1 38 6 57
3262
0 Days
Rate Fringe Fringe a Fringe b FICA FUTA SUTA Work Comp
Engi0004l Group 1
39 06 Base 1062 Hlth amp Wlfreetc 0 00 Haz Premium 0 00 Holiday 2 99 7 65 0 31 0 80 1 99 5 10 2 57 6 57
5754
10 Days
Labo0022L Group 6
31 43 Base 7 45 Hlth amp Wlfreetc 0 00 Haz Premium 0 00 Holiday 2 99 7 65 0 31 0 80 1 99 5 10 257 6 57
4673
10 Days
Page 9 of 9
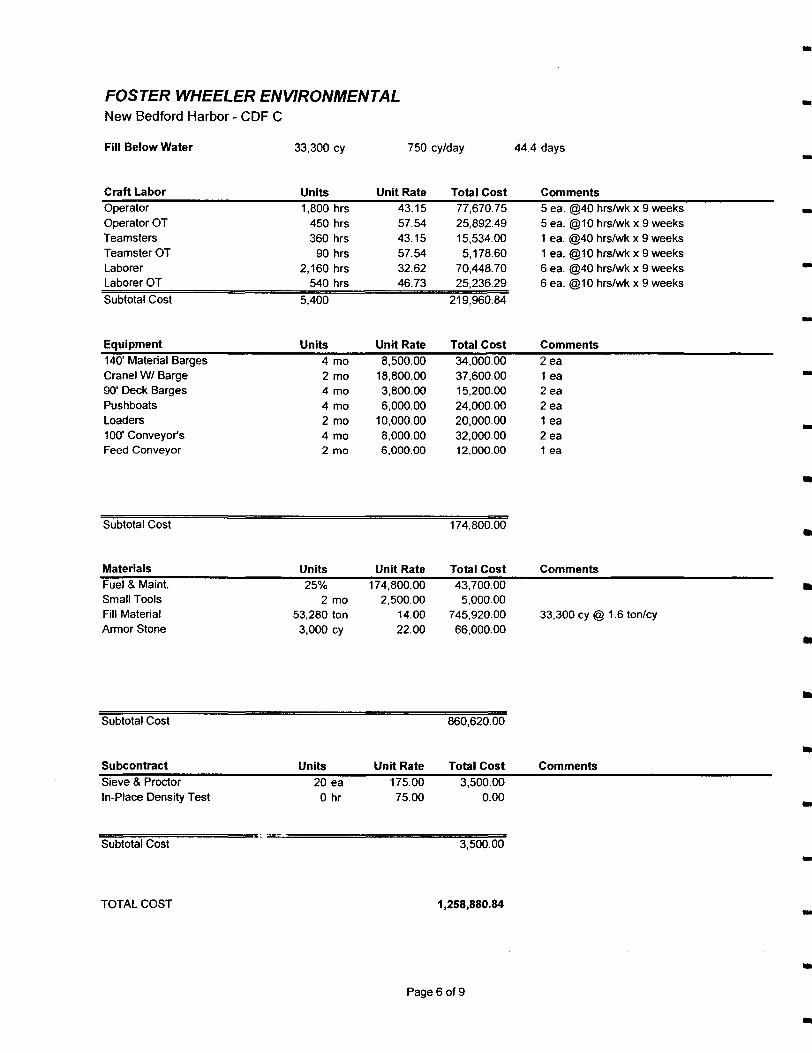
FOSTER WHEELER ENVIRONMENTAL
750 cyday
New Bedford Harbor - CDF C
Fill Below Water
Craft Labor Operator Operator OT Teamsters Teamster OT Laborer Laborer OT Subtotal Cost
Equipment 140 Material Barges Cranel W Barge 90 Deck Barges Pushboats Loaders 100 Conveyors Feed Conveyor
Subtotal Cost
Materials Fuel amp Mamt Small Tools Fill Material Armor Stone
Subtotal Cost
Subcontract Sieve amp Proctor In-Place Density Test
Subtotal Cost
TOTAL COST
33300 cy
Units 1800 hrs
450 hrs 360 hrs
90 hrs 2160 hrs
540 hrs 5400
Units 4 mo 2 mo 4 mo 4 mo 2 mo 4 mo 2 mo
Units 25
2 mo 53280 ton 3000 cy
Units 20 ea 0 hr
44 4 days
Comments 5 ea 40 hrswk x 9 weeks Sea 10 hrswk x 9 weeks 1 ea 40 hrswk x 9 weeks 1 ea 10 hrswk x 9 weeks 6 ea 40 hrswk x 9 weeks 6ea 10 hrswk x 9 weeks
Comments 2ea 1ea 2ea 2ea 1ea 2ea 1ea
Comments
33300 cy 1 6 toncy
Comments
Unit Rate 4315 5754 4315 5754 3262 4673
Unit Rate 8500 00
1880000 3800 00 6000 00
10000 00 8000 00 6000 00
Unit Rate 17480000
2500 00 1400 2200
Unit Rate 17500 7500
Total Cost 77670 75 25892 49 1553400 517860
70448 70 25236 29
21996084
Total Cost 34000 00 37600 00 1520000 24000 00 20000 00 32000 00 1200000
17480000
Total Cost 43700 00 5000 00
745920 00 66000 00
860620 00
Total Cost 3500 00
000
3500 00
125888084
Page 6 of 9
FOSTER WHEELER ENVIRONMENTAL
750 cyday
New Bedford Harbor - CDF C
Fill Above Water
Craft Labor Operator Operator OT Laborer Laborer OT
Subtotal Cost
Equipment D5 Dozer Excavator Loaders 90 Deck Barges 100 Conveyors Feed Conveyor
Subtotal Cost
Materials Fuel amp Maint Small Tools Misc Supplies Fill Material
Subtotal Cost
Subcontract Sieve amp Proctor In-Place Density Test Surveys
Subtotal Cost
TOTAL COST
11600cy
Units 720 hrs 180 hrs 480 hrs 120 hrs
1500
Units 1 mo 1 mo 1 mo 0 mo 0 mo 0 mo
Units 25
1 00 mo 1 Is
18560 ton
Units 3 ea
80 hr 1 Is
15 5 days
Comments 6 ea 40 hrswk x 3 weeks 6ea 10 hrswk x 3 weeks 4 ea 40 hrswk x 3 weeks 4 ea 10 hrswk x 3 weeks
Comments 1 -D5 1ea 1ea
Comments
1 2000 cy 1 6tncy
Comments
Unit Rate4315 5754 3262 4673
Unit Rate 5500
10000 1000000 3800 00 8000 00 6000 00
Unit Rate 25500 2500 1000 675
Unit Rate 17500 7500
10000 00
Total Cost 3106830 1035700 1565527 5608 06
62689
Total Cost 5500
10000 10000
000 0 0 0
25500
Total Cost 6375 2500 1000
12528000
135155
Total Cost 525
6000 10000
16525
239869
Page 7 of 9
FOSTER WHEELER ENVIRONMENTAL New Bedford Harbor - CDF C
Fill Between Sheets and Install GundWall
Craft Labor
Subtotal Cost
Operator Operator OT Laborer Laborer OT
Units hrs hrs hrs hrs
Unit Rate4315 5754 3262 4673
Total Cost 0 0 0 0
Comments
Equipment
Subtotal Cost
Units Unit Rate Total Cost 0 0 0 0 0
Comments
Materials Units Unit Rate Total Cost Comments
Subtotal Cost
Subcontract Fill Between Sheets (Slurry Wall) Install GundWall
Units 20400 27200
sf sf
Unit Rate500
2500
Total Cost 102000 680000
Comments quote quote
Subtotal Cost 782000
TOTAL COST 782000
Page 8 of 9
Labor Rates Decision No Equip Oper
Rate Fringe Fringe a Fringe b FICA FUTA SUTA Work Comp
Laborer - Haz
Rate Fringe Fringe a Fringe b FICA FUTA SUTA Work Comp
Craft Labor Rates
Engi0004l Group 1 Equip Oper OT
2604 Base 1062 Hlth amp Wlfreetc 0 00 Haz Premium 1 04 Holiday 2 07 7 65 0 22 0 80 1 38 5 10 1 78 6 57
4315
10 Days
Rate Fringe Fringe a Fringe b FICA FUTA SUTA Work Comp
Labo0022L Group 6 Laborer - HazOT
20 95 Base 7 45 Hlth amp Wlfreetc 0 00 Haz Premium 0 00 Holiday 1 60 7 65 017 080 107 510 1 38 6 57
3262
0 Days
Rate Fringe Fringe a Fringe b FICA FUTA SUTA Work Comp
Engi0004l Group 1
39 06 Base 1062 Hlth amp Wlfreetc 0 00 Haz Premium 0 00 Holiday 2 99 7 65 0 31 0 80 1 99 5 10 2 57 6 57
5754
10 Days
Labo0022L Group 6
31 43 Base 7 45 Hlth amp Wlfreetc 0 00 Haz Premium 0 00 Holiday 2 99 7 65 0 31 0 80 1 99 5 10 257 6 57
4673
10 Days
Page 9 of 9
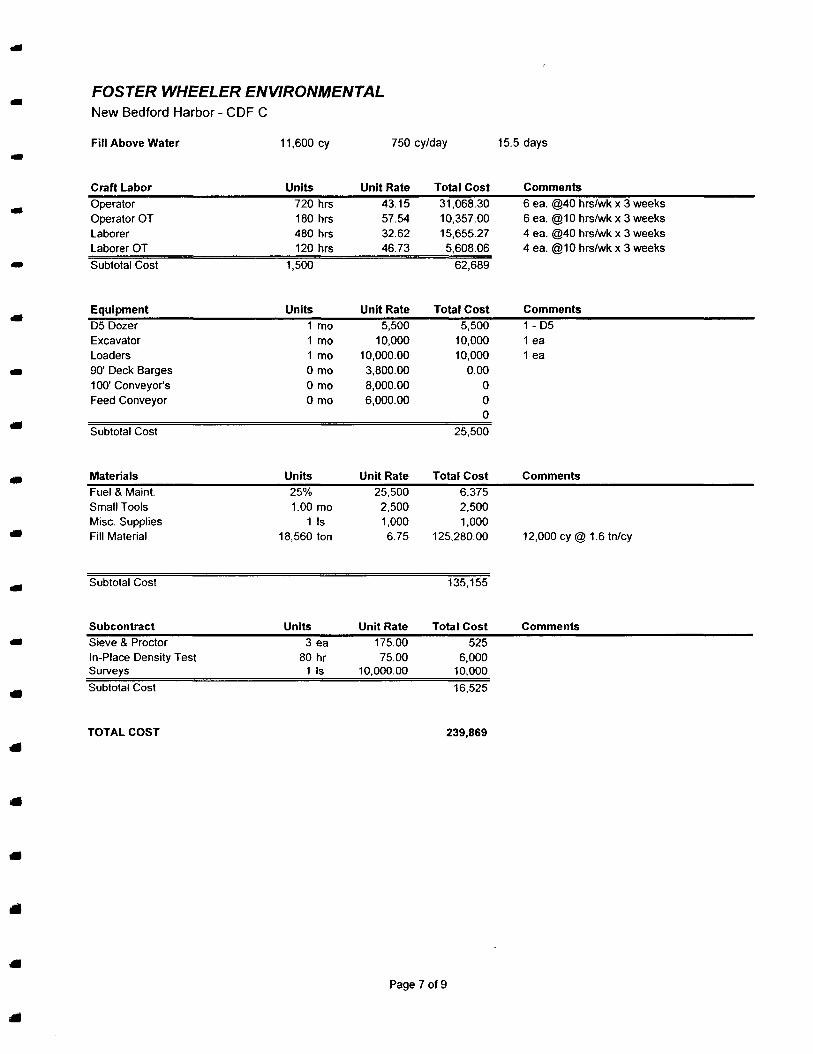
FOSTER WHEELER ENVIRONMENTAL
750 cyday
New Bedford Harbor - CDF C
Fill Above Water
Craft Labor Operator Operator OT Laborer Laborer OT
Subtotal Cost
Equipment D5 Dozer Excavator Loaders 90 Deck Barges 100 Conveyors Feed Conveyor
Subtotal Cost
Materials Fuel amp Maint Small Tools Misc Supplies Fill Material
Subtotal Cost
Subcontract Sieve amp Proctor In-Place Density Test Surveys
Subtotal Cost
TOTAL COST
11600cy
Units 720 hrs 180 hrs 480 hrs 120 hrs
1500
Units 1 mo 1 mo 1 mo 0 mo 0 mo 0 mo
Units 25
1 00 mo 1 Is
18560 ton
Units 3 ea
80 hr 1 Is
15 5 days
Comments 6 ea 40 hrswk x 3 weeks 6ea 10 hrswk x 3 weeks 4 ea 40 hrswk x 3 weeks 4 ea 10 hrswk x 3 weeks
Comments 1 -D5 1ea 1ea
Comments
1 2000 cy 1 6tncy
Comments
Unit Rate4315 5754 3262 4673
Unit Rate 5500
10000 1000000 3800 00 8000 00 6000 00
Unit Rate 25500 2500 1000 675
Unit Rate 17500 7500
10000 00
Total Cost 3106830 1035700 1565527 5608 06
62689
Total Cost 5500
10000 10000
000 0 0 0
25500
Total Cost 6375 2500 1000
12528000
135155
Total Cost 525
6000 10000
16525
239869
Page 7 of 9
FOSTER WHEELER ENVIRONMENTAL New Bedford Harbor - CDF C
Fill Between Sheets and Install GundWall
Craft Labor
Subtotal Cost
Operator Operator OT Laborer Laborer OT
Units hrs hrs hrs hrs
Unit Rate4315 5754 3262 4673
Total Cost 0 0 0 0
Comments
Equipment
Subtotal Cost
Units Unit Rate Total Cost 0 0 0 0 0
Comments
Materials Units Unit Rate Total Cost Comments
Subtotal Cost
Subcontract Fill Between Sheets (Slurry Wall) Install GundWall
Units 20400 27200
sf sf
Unit Rate500
2500
Total Cost 102000 680000
Comments quote quote
Subtotal Cost 782000
TOTAL COST 782000
Page 8 of 9
Labor Rates Decision No Equip Oper
Rate Fringe Fringe a Fringe b FICA FUTA SUTA Work Comp
Laborer - Haz
Rate Fringe Fringe a Fringe b FICA FUTA SUTA Work Comp
Craft Labor Rates
Engi0004l Group 1 Equip Oper OT
2604 Base 1062 Hlth amp Wlfreetc 0 00 Haz Premium 1 04 Holiday 2 07 7 65 0 22 0 80 1 38 5 10 1 78 6 57
4315
10 Days
Rate Fringe Fringe a Fringe b FICA FUTA SUTA Work Comp
Labo0022L Group 6 Laborer - HazOT
20 95 Base 7 45 Hlth amp Wlfreetc 0 00 Haz Premium 0 00 Holiday 1 60 7 65 017 080 107 510 1 38 6 57
3262
0 Days
Rate Fringe Fringe a Fringe b FICA FUTA SUTA Work Comp
Engi0004l Group 1
39 06 Base 1062 Hlth amp Wlfreetc 0 00 Haz Premium 0 00 Holiday 2 99 7 65 0 31 0 80 1 99 5 10 2 57 6 57
5754
10 Days
Labo0022L Group 6
31 43 Base 7 45 Hlth amp Wlfreetc 0 00 Haz Premium 0 00 Holiday 2 99 7 65 0 31 0 80 1 99 5 10 257 6 57
4673
10 Days
Page 9 of 9
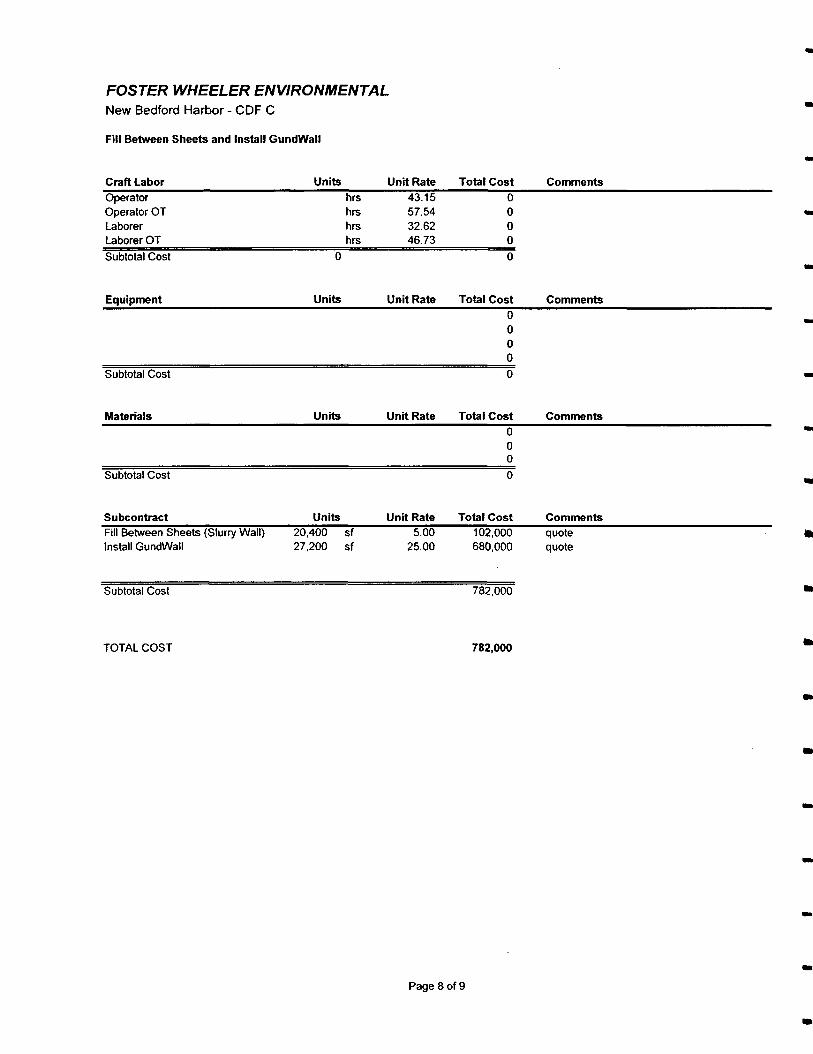