Embed Size (px)
Citation preview

9
Foundations for Designing and EvaluatingUser Interfaces Based on the CrossingParadigm
GEORG APITZ and FRANCOIS GUIMBRETIEREHCIL, University of MarylandandSHUMIN ZHAIIBM Almaden Research Center
Traditional graphical user interfaces have been designed with the desktop mouse in mind, adevice well characterized by Fitts’ law. Yet in recent years, hand-held devices and tablet personalcomputers using a pen (or fingers) as the primary mean of interaction have become more and morepopular. These new interaction modalities have pushed the traditional focus on pointing to its limit.In this paper we explore whether a different paradigm—goal crossing-based on pen strokes—maysubstitute or complement pointing as another fundamental interaction method. First we describea study in which we establish that goal crossing is dependent on an index of difficulty analogousto Fitts’ law, and that in some settings, goal crossing completion time is shorter or comparable topointing performance under the same index of difficulty. We then demonstrate the expressivenessof the crossing-based interaction paradigm by implementing CrossY, an application which onlyuses crossing for selecting commands. CrossY demonstrates that crossing-based interactions canbe more expressive than the standard point and click approach. We also show how crossing-basedinteractions encourage the fluid composition of commands. Finally after observing that users’performance could be influenced by the general direction of travel, we report on the results ofa study characterizing this effect. These latter results led us to propose a general guideline fordialog box interaction. Together, these results provide the foundation for the design of effectivecrossing-based interactions.
This work has been supported in part by Microsoft Research for the Microsoft Center for InteractionDesign and Visualization at the University of Maryland and by NSF grant #0414699.Early partial results of this work had appeared as conference publications Accot and Zhai [2002]and Apitz and Guimbretiere [2004].Authors’ addresses: G. Apitz, Human-Computer Interaction Lab, University of Maryland, A.V.Williams Building, College Park, MD, 20742; email: [email protected]; F. Guimbretiere, Cor-nell University, Information Science, 301 College Avenue, Ithaca, NY, 14850; email: [email protected]; S. Zhai, IBM Almaden Research Center, 650 Harry Road, San Jose, CA, 95120;email: [email protected] to make digital or hard copies of part or all of this work for personal or classroom useis granted without fee provided that copies are not made or distributed for profit or commercialadvantage and that copies show this notice on the first page or initial screen of a display alongwith the full citation. Copyrights for components of this work owned by others than ACM must behonored. Abstracting with credit is permitted. To copy otherwise, to republish, to post on servers,to redistribute to lists, or to use any component of this work in other works requires prior specificpermission and/or a fee. Permissions may be requested from Publications Dept., ACM, Inc., 2 PennPlaza, Suite 701, New York, NY 10121-0701 USA, fax +1 (212) 869-0481, or [email protected]© 2010 ACM 1073-0516/2010/05-ART9 $10.00DOI 10.1145/1746259.1746263 http://doi.acm.org/10.1145/1746259.1746263
ACM Transactions on Computer-Human Interaction, Vol. 17, No. 2, Article 9, Publication date: May 2010.
9:2 • G. Apitz et al.
Categories and Subject Descriptors: H.5.2 [Information Interfaces and Presentation]: Userinterfaces—Interaction styles; H.1.2 [Models and Principles]: User/Machine Systems—Humaninformation processing
General Terms: Human Factors, Performance, Theory
Additional Key Words and Phrases: Goal crossing, pointing, Fitts’ law, graphical widgets, events,input, input performance, crossing-based interfaces, command composition, fluid interaction,pen-computing
ACM Reference Format:Apitz, G., Guimbretiere, F., and Zhai, S. 2010. Foundations for designing and evaluating user inter-faces based on the crossing paradigm. ACM Trans. Comput.-Hum. Interact. 17, 2, Article 9 (May2010), 42 pages.DOI = 10.1145/1746259.1746263 http://doi.acm.org/10.1145/1746259.1746263
1. INTRODUCTION
Over the last few years, pen- and finger-based interactions have started to playan increasingly more important role in user interface design. In particularthey have been the interactions of choice for a wide variety of devices fromcell phone, to tablet computer, to table and wall interactive surfaces. Not sur-prisingly, these new modalities pushed the WIMP-interface (Windows, Icons,Menus, and Pointers) to its limit, since it was tuned to a typical desktop config-uration. In that configuration, users control a cursor on the screen by movinga mouse on their desk. This indirect setting prevents any occlusion problems,while the accuracy of the mouse makes it easy to access very small targets suchas the “close window” icon, double click, and the use of multiple buttons. Suchinteractions are often difficult to perform with a pen or a finger. Further, WIMPinterfaces often rely extensively on keyboard shortcuts for expert interactions,making them slow to use on devices such as pen-based tablet computers. Notic-ing that pens are naturally suited to draw strokes, it seems natural to consideran interface paradigm in which the basic element of interaction is to drawstrokes on a target to trigger an action. Here we are presenting an overview ofour initial work on crossing-based interfaces.
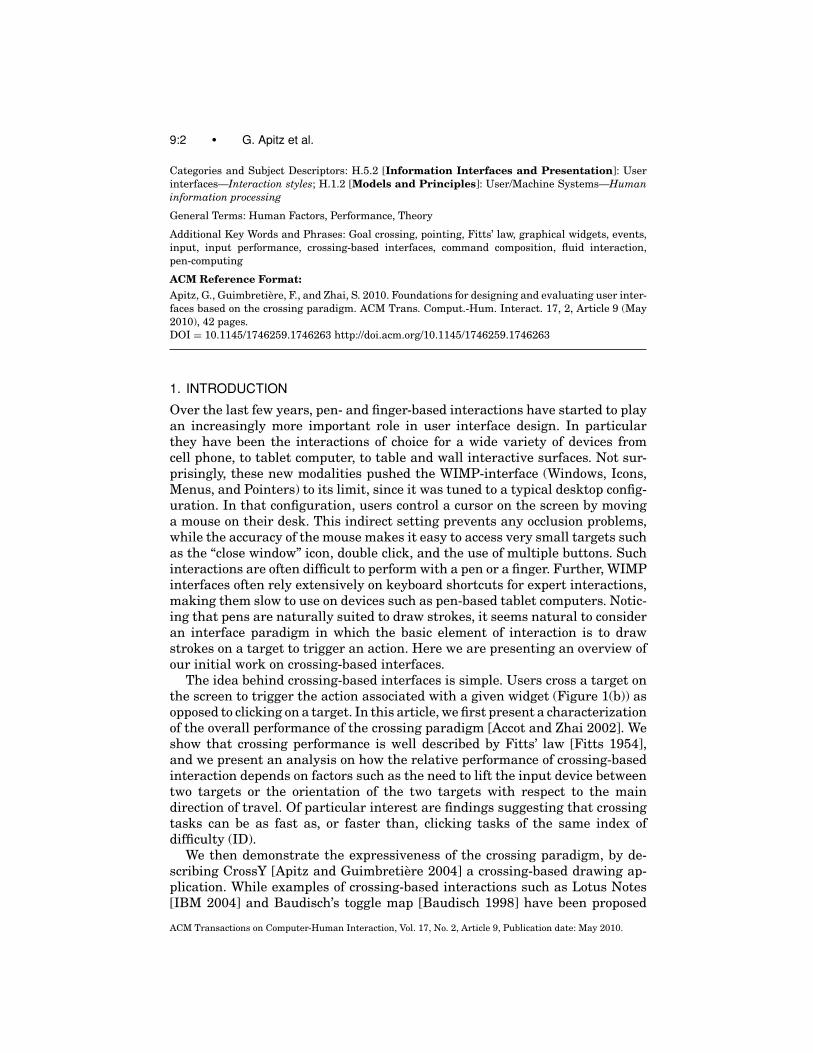
The idea behind crossing-based interfaces is simple. Users cross a target onthe screen to trigger the action associated with a given widget (Figure 1(b)) asopposed to clicking on a target. In this article, we first present a characterizationof the overall performance of the crossing paradigm [Accot and Zhai 2002]. Weshow that crossing performance is well described by Fitts’ law [Fitts 1954],and we present an analysis on how the relative performance of crossing-basedinteraction depends on factors such as the need to lift the input device betweentwo targets or the orientation of the two targets with respect to the maindirection of travel. Of particular interest are findings suggesting that crossingtasks can be as fast as, or faster than, clicking tasks of the same index ofdifficulty (ID).
We then demonstrate the expressiveness of the crossing paradigm, by de-scribing CrossY [Apitz and Guimbretiere 2004] a crossing-based drawing ap-plication. While examples of crossing-based interactions such as Lotus Notes[IBM 2004] and Baudisch’s toggle map [Baudisch 1998] have been proposed
ACM Transactions on Computer-Human Interaction, Vol. 17, No. 2, Article 9, Publication date: May 2010.
Foundations of Crossing-Based User Interfaces • 9:3
Fig. 1. Two different paradigms for triggering actions in a graphical user interface.
before, CrossY is the first application to rely exclusively on crossing to issuecommands. Our work with CrossY demonstrates that crossing- based interfacesare more expressive than standard point and click interfaces. For example theinterface can take into account the orientation and direction of the crossingstroke to distinguish between different types of commands on the same inter-face element. Crossing-based interaction also offers the option of composingseveral command invocations in a single stroke—something that is not possi-ble in the point and click paradigm. Based on our experience building CrossY,we describe our initial recommendations on how to best leverage the uniqueaspects of crossing-based interactions.
During our work on CrossY we discovered that our original empiricalcharacterization of crossing-based interactions needed refinement to betterconceptualize the impact of layout on user performance. We conducted a follow-up study examining additional parameters of the crossing task, includingtarget orientation in relation to movement direction. The empirical findings inthis study provided additional guidelines and insights for crossing-based userinterface design.
Together, this work lays the foundations needed by designers to design ef-ficient crossing-based interfaces well suited to pen- and finger-based interac-tions.
2. PREVIOUS WORK
In the process of deriving the law of steering from Fitts’ law, Accot and Zhai[1997] found that for a goal-crossing task the time to cross a goal can be deter-mined by the goal distance and goal width. In fact, this relationship takes thesame form as in Fitts’ law. More precisely, both the time needed to reach andclick on a target of width W that lies a distance D away (Figure 2(a)), and thetime needed to cross a goal of width W that lies a distance D away (Figure 2(b))are given by:
T = a + b log2
(DW
+ 1)
︸ ︷︷ ︸Index of difficulty (ID)
, (1)
where a and b are experimentally determined performance constants. The log-arithm factor in Equation (1) is called the index of difficulty (ID) of the pointingor crossing task.
This model of goal crossing first presented in Accot and Zhai [1997] consti-tutes a necessary but not a sufficient foundation for studying and designing
ACM Transactions on Computer-Human Interaction, Vol. 17, No. 2, Article 9, Publication date: May 2010.

9:4 • G. Apitz et al.
crossing-based interfaces. In order to establish crossing as a general paradigmof user interface design, more work is needed both in systematic theoreticalanalysis and in practical design exploration.
First, since the graphical targets to be crossed (goals) can be eitherorthogonal or collinear to the direction of pen’s movement, it is important tounderstand the impact of target orientation to user performance. This issuehas been at least indirectly addressed in traditional pointing tasks. SomeFitts’ law research, such as Jagacinski and Monk [1985] or MacKenzie andBuxton [1992] and Hoffmann and Sheikh [1994], has tackled situations wherethe pointing target has constraints in two dimensions, implicitly incorporatingdirectional error in pointing research. Most recently, in conjunction with thestudy presented here, one of us has conducted a study to refine Fitts’ law toaccount for both directional and amplitude constraints more completely [Accotand Zhai 2003].
Previous work on crossing also goes beyond theoretical analysis. Althoughrare, crossing as an interaction method has been used in some commercial prod-ucts. In Lotus NotesR©, multiple emails can be selected by crossing their headerin a designated area. Similar operations have been generalized to “area paint-ing” as a way of turning multiple toggle switches in a research prototype byBaudisch [1998]. Researching interaction techniques based on a laser pointer,Winograd and Guimbretiere [1999] proposed “gesture-and-sweep” instead of“point-and-click” as a selection technique in interactive rooms. Research hasshown that point-and-click is particularly difficult with a laser pointer [Myerset al. 2002]. In the context of exploring pen-based interaction, Ren and Moriya[2000] studied entering and leaving a button as alternative strategies to click-ing, and further pointed out the need for a theoretical model for studying thesestrategies.
Other examples that are well suited for pen use and show the applicationof crossing can be found in menu design. For example many pop-up menusystems are well adapted for pen-based interaction. Several systems, such asPie Menu [Hopkins 1991] and Marking Menu [Kurtenbach 1993], use directionand pen-up transition to select commands. Other menu systems such as ControlMenu [Pook et al. 2000] and FlowMenu [Guimbretiere and Winograd 2000]use crossing as a way to select commands. More recently the Scriboli system[Hinckley et al. 2005, 2006] has studied the potential of self-crossing (to createa small pigtail) as a way to segment an ink stroke into a selection stroke and acommand stroke.
In recent years, several systems also challenged the use of the point-and-click interface for whiteboard environments such as Tivoli [Pederson et al.1993], FlatLand [Mynatt et al. 1999] and PostBrainstorm [Guimbretiere et al.2001], on the desktop [Ramos and Balakrishnan 2003], or for pen comput-ing [Saund et al. 2003]. These systems are generally tuned to a certain class ofapplications (such as brainstorming, for example) and do not focus on crossingas the sole interaction paradigm. The work presented here, is an attempt todesign a general pen centric-framework that will support such applications. Fi-nally, several systems, such as SATIN [Hong and Landay 2000], have exploredgesture-based interactions. Although, gestures are important to crossing-based
ACM Transactions on Computer-Human Interaction, Vol. 17, No. 2, Article 9, Publication date: May 2010.

Foundations of Crossing-Based User Interfaces • 9:5
Fig. 2. Pointing vs. crossing: the experimental paradigms differ in the direction of the variabilityallowed in the termination of the movement.
interfaces, the gestures are relatively simple and, by adding a crossing require-ment, ambiguity is reduced. In that respect, the requirements are similar toGedrics [Geissler 1995], a system in which users can select the action performedby an icon by drawing a given gesture on top of it.
3. CROSSING AND POINTING WITH CONSTRAINTS
While Accot and Zhai (1997) have found that crossing-action follows a strongspeed (time) and accuracy (size of the goal) tradeoff relationship (Equation (1),Figure 2), more modeling work is needed to systematically understand thedifference between pointing and crossing. The two tasks in Figure 2 vary atleast in two dimensions. One of the differences is pointing versus crossing.The other difference lies in the task precision constraint, one on the amplitudeand the other on the direction of movement. When the orientation of preci-sion constraint is collinear to movement, for either pointing (Figure 3(a)) orcrossing (Figure 3(c)), the task performer has to primarily control the move-ment’s amplitude. When the orientation of precision constraint is orthogonalto movement, for either pointing (Figure 3(b)) or crossing (Figure 3(d)) tasks,the performer has to primarily control the movement’s direction. Because thetwo types of constraints could exist in both tasks, we cannot have a systematicunderstanding for crossing interfaces based on the study of Accot and Zhai[1997] alone (Figure 2). Instead, we need to understand the two types of action(pointing vs. crossing) under two types of constraint (amplitude and direction)in a factorial fashion.
Returning to the task of crossing, there is yet another task dimension thathas to be considered if a study is to be truly systematic. Crossing can be donein two ways: either discretely or continuously. When there is nothing betweenthe targeted goals, one can continuously stroke through these goals (contin-uous crossing, Figure 3(e),(f)). On the other hand, when there are nontargetobjects (distractors) between the individual goals, one has to land the stylus(or finger) before an intended goal, cross it, and then lift up (discrete crossing,Figure 3(c),(d)). This fact is of highly practical interest. Imagine a widget thathas several checkboxes, but the user only wants to select a subset of them. Inthis case discrete crossing or a combination of discrete and continuous crossingis necessary to give the user this flexibility. In addition to flexibility this aspectcan be used to support an easy transition from novice to expert users. Novicescan cross targets and issue commands in a discrete way while more advanced
ACM Transactions on Computer-Human Interaction, Vol. 17, No. 2, Article 9, Publication date: May 2010.

9:6 • G. Apitz et al.
Fig. 3. The six conditions tested. All tasks were reciprocal. Dotted lines indicate that the pen isnot in contact with the tracking surface, for example to avoid a distracter represented by a strippedarea in (c) and (d).
users can use single strokes to issue several commands and remember theshapes of the strokes that are necessary to achieve these commands. We donot see this difference in a point-and-click setting since it has to be discrete.Continuous crossing has another potential advantage which is the combina-tion of commands. If the user is able to cross several targets in one stroke, itis also possible to issue several commands this way. We therefore investigatedboth discrete and continuous crossing in a systematic experiment as well as inour prototype application. There we give users the choice to issue commandseither discretely or continuously. Finally, while we are only considering targetsplaced on the horizontal axis in this section, it is clear that this will not bealways be the case in practice. We will consider the potential impact of thegeneral direction of travel in Section 5.
Another dimension of potential interest is the input device. In principle,crossing can be done with any input device, such as a mouse, but a pen (stylus)is the most obvious choice as a crossing input device. Thus, our crossing-basedapplication was built for a pen-based setting, where users execute all interac-tions with a pen without having a keyboard or mouse at their disposal.
3.1 Experiment
We conducted an experiment involving all 6 tasks depicted in Figure 3.The two pointing tasks differed in the movement precision constraint—one
ACM Transactions on Computer-Human Interaction, Vol. 17, No. 2, Article 9, Publication date: May 2010.
Foundations of Crossing-Based User Interfaces • 9:7
directional and the other amplitude. The four goal-crossing tasks differed bothin movement precision constraint (directional/amplitude) and in the nature ofthe action (discrete/continuous). The details of each condition are as follows.
AP: Pointing with amplitude constraint (Figure 3(a)). This is the traditionalFitts’ tapping task [Fitts 1954]. Participants click alternately on two verti-cal rectangles with width W and “infinite” height. The two target centers areseparated by distance D. We call this task amplitude pointing because themovement precision (or variability) constraint (W) is imposed on the move-ment amplitude.
DP: Pointing with directional constraint (Figure 3(b)). This is a variant ofFitts’ original tapping task. Participants click alternately on two horizontalrectangles of height W and “infinite” width (to one side), separated by distanceD measured by the gap between the two targets. The precision constraint inthis task is imposed on the movement’s direction.
D/AC: Discrete crossing with amplitude constraint (Figure 3(c)). Participantsalternately cross, by a stroke, two horizontal goals of width W and distance D.For consistency, they are asked to perform the stroke downward for both goals.This crossing task is discrete since the stylus tip touches the tablet surfaceonly when crossing the goal; the rest of the time the stylus is lifted from thetablet surface. An obstacle line, causing a beep when stroked through, is drawnbetween the two goals to remind the participants to use discrete strokes forcrossing the goals.
D/DC: Discrete crossing with directional constraint (Figure 3(d)). Partici-pants alternately stroke through two vertical goals with height W and distanceD. They are asked to cross the goals from left to right for consistency. As in theprevious condition, an obstacle, that is, a distractor, is drawn between the twogoals to remind participants to lift up the stylus when traveling from one goalto the other.
C/AC: Continuous crossing with amplitude constraint (Figure 3(e)). Partici-pants alternately move the cursor through two horizontal goals of width W overdistance D. The crossing task is continuous as participants have to constantlyslide the stylus tip on the tablet surface. If the stylus is lifted during a blockof trials, the system will beep until stylus-tablet contact is resumed. Since theuser has to keep the stylus on the screen one stroke is used to cross both targetswhich is not possible with point-and-click. Note that the setting does not makeuse of the stroke direction for an easier crossing since the targets are alignedagainst the crossing direction.
C/DC: Continuous crossing with directional constraint (Figure 3(f)). Par-ticipants move the cursor reciprocally through two vertical goals of height Wover distance D. As in condition C/AC, the system will beep when the stylus islifted during a block of trials until stylus-tablet contact is resumed. This taskwas introduced in Accot and Zhai [1997] and found to follow Fitts’ law whenperformed nonreciprocally.
In all six tasks, participants were asked to perform as fast and as accuratelyas possible. When a target (or goal) was missed, a beep was played to remind
ACM Transactions on Computer-Human Interaction, Vol. 17, No. 2, Article 9, Publication date: May 2010.

9:8 • G. Apitz et al.
the participant to improve accuracy. In case of a miss, participants continuedthe trial until they hit the target and their trial completion time increasedas a result. When hit, the target changed color from green to orange. Thetime duration between the two alternate target clicks (or two goal crosses) wasrecorded as the trial completion time.
3.1.1 Experimental Design and Participants. A within-subject full fac-torial design with repeated measures was used. The independent variableswere the task type (T = AP, DP, D/AC, D/DC, C/AC, C/DC), the distanceD between targets or goals (D = 256, 1024 pixels) and the target/goal width(W = 8, 16, 32, 64, 128 pixels). For each task, participants performed three con-secutive sets of 10 D-W combinations, the first set being a practice sessionand the later two, data collection sessions. The ten D-W combinations werepresented in a random order within each session. With each D-W combination,participants performed a block of 9 trials. The order of testing of the six differ-ent tasks was balanced among six groups of participants according to a Latinsquare.
Twelve people, three female and nine male, all right-handed, participated inthe experiment. They ranged in age from 21 to 51.
3.1.2 Apparatus. The experiment was conducted on an IBM PC runningLinux, equipped with a WacomR© IntuosTM graphics tablet (model GD-0608-U,20.3 cm×15.2 cm active area, 2540lpi resolution) and a 19” IBM CRT monitor(model P76, 32 cm×24 cm visual area, 127 dpi resolution). The tablet activearea was mapped onto the display visual area, in absolute mode; the controlgain was close to 1.6. The experiment was done in full-screen mode, with ablack background color. The computer ran in single-user mode, with only a fewactive system processes. It was disconnected from the network.
3.2 Results and Analyses
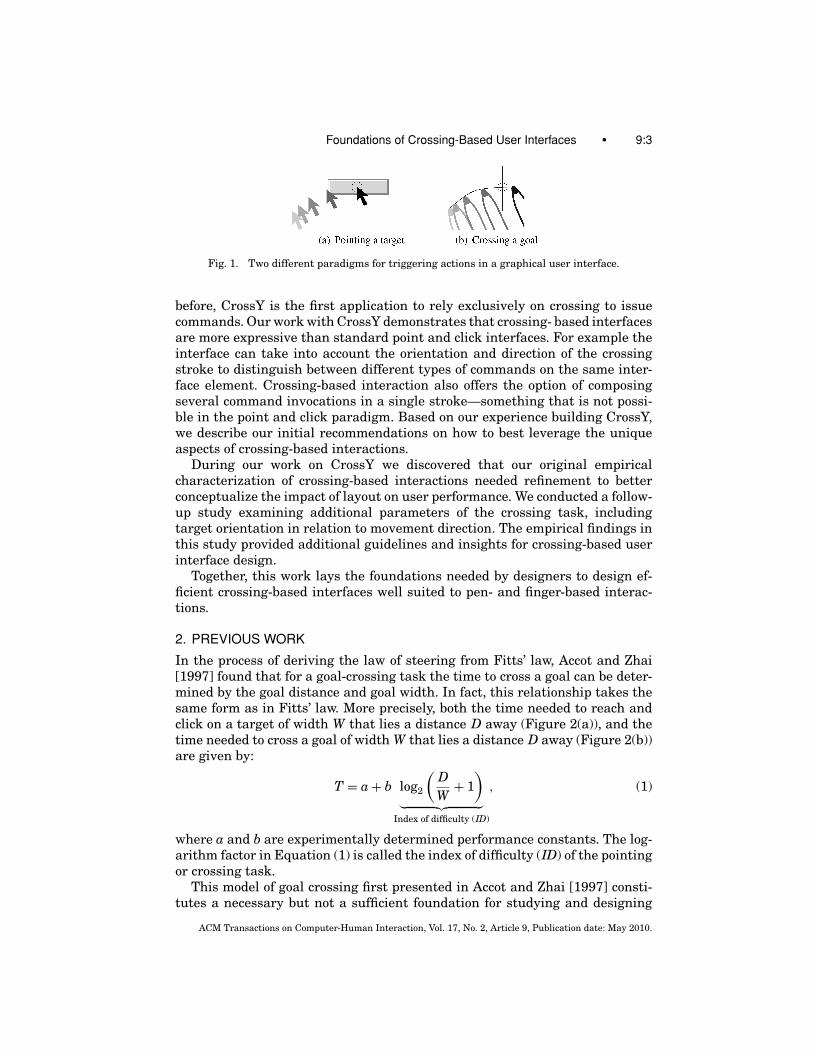
3.2.1 Learning, Time, and Error. Figure 4 shows the average trial timeover the three experimental sessions. The average trial completion time inthe practice session was longer than the time in the two data-collection ses-sions, due to participants’ inexperience and occasional experimentation withthe tablet-stylus device and task strategy. The performance difference betweenthe two data-collection sessions was relatively small, and hence both were usedin the following data analyses.
Analysis of variance showed that mean trial completion times were signif-icantly different across the six tasks (F5,55 = 12.5, p < .001). Task C/AC wasthe slowest (see Figure 4). Tasks DP and C/DC were the fastest, at least 10%faster than other tasks. The rest of the tasks, including the traditional Fitts’tapping task, fall in the middle range of performance.
Statistically, Fisher’s PLSD test shows that each pair of tasks was signifi-cantly different from each other (p < .05), except DP vs. C/DC (p = .52), andAP vs. D/AC.
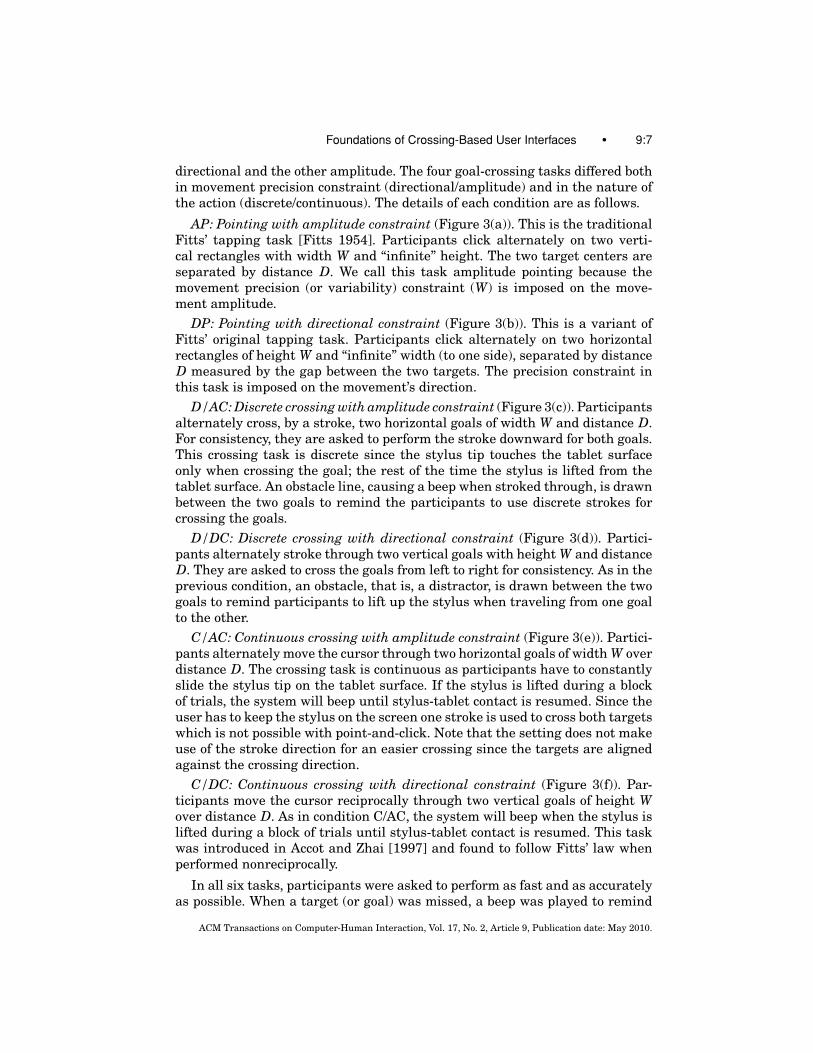
As illustrated in Figure 5(a), movement distance significantly changed meantrial completion time (F1,11 = 898, p < .0001). Across all tasks, the greater
ACM Transactions on Computer-Human Interaction, Vol. 17, No. 2, Article 9, Publication date: May 2010.
Foundations of Crossing-Based User Interfaces • 9:9
Tim
e (
ms)
800
900
1000
1100
1200
700
Practice First Trial Second Trial
Amplitude constr. (AP)
Direction constr. (DP)
Discrete, Amplitude const. (D/AC)
Discrete, Direction const. (D/DC)
Continuous, Amplitude const. (C/AC)
Continuous, Direction const. (C/DC)
Pointing
Crossing
Fig. 4. Learning effect on average completion time.
Distance between targets/goals (pixels)
Tim
e (
ms)
256 1024
400
6
00 800 1
000 1200 1400
Amplitude constr. (AP)
Direction constr. (DP)
Discrete, Amplitude const. (D/AC)
Discrete, Direction const. (D/DC)
Continuous, Amplitude const. (C/AC)
Continuous, Direction const. (C/DC)
Pointing
Crossing
(a)
400
6
00 800 1
000 1200 1400
Target/goal width (pixels)
Tim
e (
ms)
8 16 32 64 128
Amplitude constr. (AP)
Direction constr. (DP)
Discrete, Amplitude const. (D/AC)
Discrete, Direction const. (D/DC)
Continuous, Amplitude const. (C/AC)
Continuous, Direction const. (C/DC)
Pointing
Crossing
(b)
Fig. 5. Effect of distance and width on task completion time.
the distance between targets, the longer the time duration of the trial. Asillustrated in Figure 5(b), target/goal width also significantly changed meantrial completion (F4,44 = 485, p < .0001). For all tasks, the greater the width ofthe target, the shorter the duration of the trial.
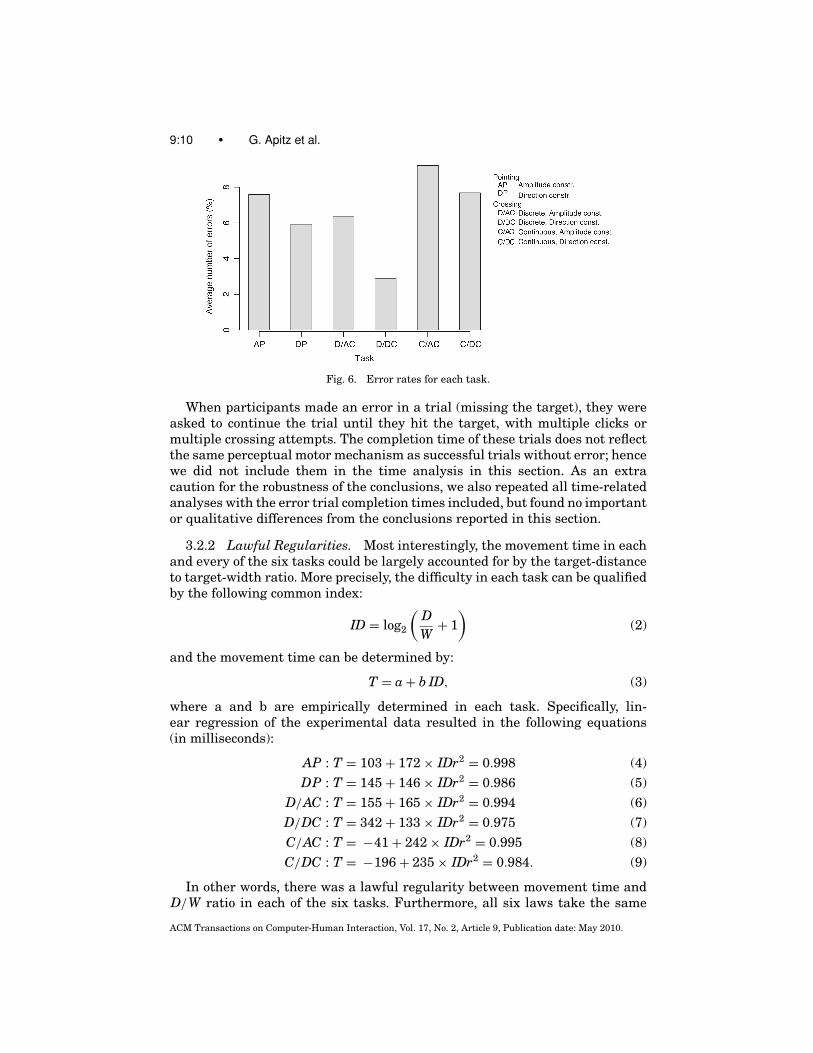
The error rate, measured by the percentage of trials that took more thanone click or crossing to hit the target, varied significantly with task (F5,55 =7.76, p < .0001), target distance (F1,11 = 16.6, p < .01) and target width(F4,44 = 38.2, p < .0001). As expected, smaller and more distant targets tendedto cause more errors. As shown in Figure 6, except for Task C/AC (9.2%), allnew tasks studied in this experiment had error rates close to and lower thanthat of Fitts’ tapping task (AP, 7.6%). D/DC has the lowest error rate with2.8%.
ACM Transactions on Computer-Human Interaction, Vol. 17, No. 2, Article 9, Publication date: May 2010.
9:10 • G. Apitz et al.
Fig. 6. Error rates for each task.
When participants made an error in a trial (missing the target), they wereasked to continue the trial until they hit the target, with multiple clicks ormultiple crossing attempts. The completion time of these trials does not reflectthe same perceptual motor mechanism as successful trials without error; hencewe did not include them in the time analysis in this section. As an extracaution for the robustness of the conclusions, we also repeated all time-relatedanalyses with the error trial completion times included, but found no importantor qualitative differences from the conclusions reported in this section.
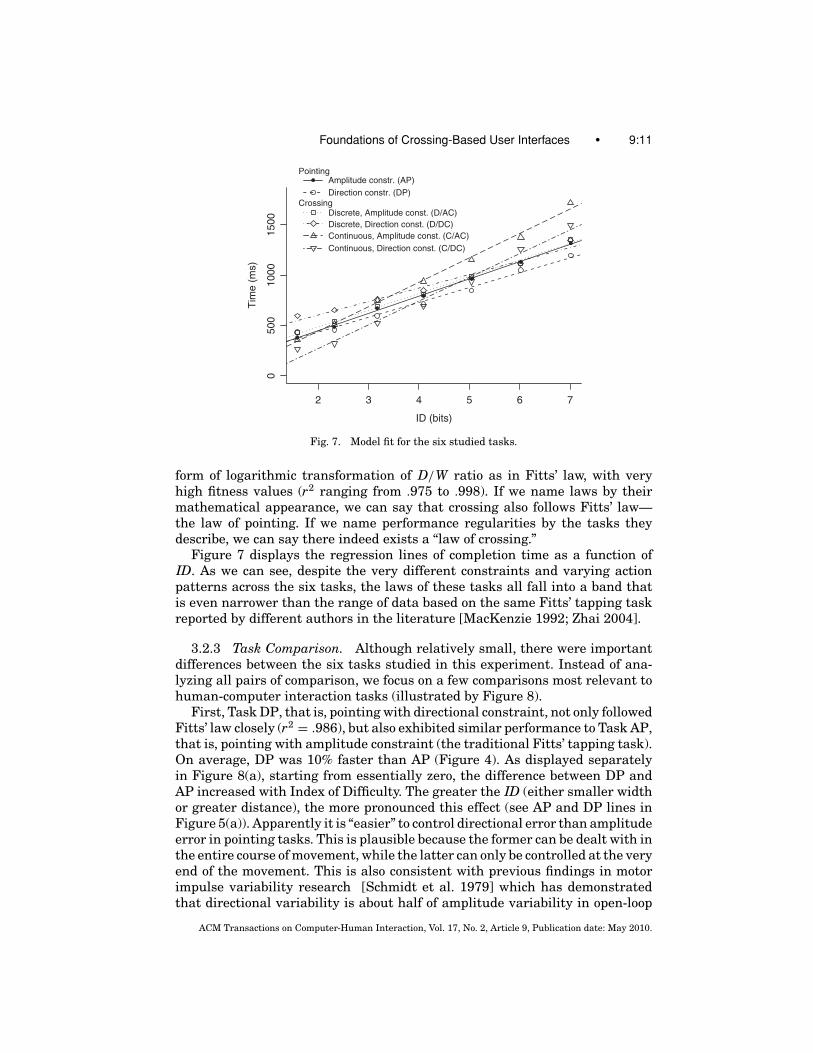
3.2.2 Lawful Regularities. Most interestingly, the movement time in eachand every of the six tasks could be largely accounted for by the target-distanceto target-width ratio. More precisely, the difficulty in each task can be qualifiedby the following common index:
ID = log2
(DW
+ 1)
(2)
and the movement time can be determined by:
T = a + b ID, (3)
where a and b are empirically determined in each task. Specifically, lin-ear regression of the experimental data resulted in the following equations(in milliseconds):
AP : T = 103 + 172 × IDr2 = 0.998 (4)
DP : T = 145 + 146 × IDr2 = 0.986 (5)
D/AC : T = 155 + 165 × IDr2 = 0.994 (6)
D/DC : T = 342 + 133 × IDr2 = 0.975 (7)
C/AC : T = −41 + 242 × IDr2 = 0.995 (8)
C/DC : T = −196 + 235 × IDr2 = 0.984. (9)
In other words, there was a lawful regularity between movement time andD/W ratio in each of the six tasks. Furthermore, all six laws take the same
ACM Transactions on Computer-Human Interaction, Vol. 17, No. 2, Article 9, Publication date: May 2010.
Foundations of Crossing-Based User Interfaces • 9:11
2 3 4 5 6 7
0500
1000
1500
ID (bits)
Tim
e (
ms)
Amplitude constr. (AP)
Direction constr. (DP)
Discrete, Amplitude const. (D/AC)
Discrete, Direction const. (D/DC)
Continuous, Amplitude const. (C/AC)
Continuous, Direction const. (C/DC)
Pointing
Crossing
Fig. 7. Model fit for the six studied tasks.
form of logarithmic transformation of D/W ratio as in Fitts’ law, with veryhigh fitness values (r2 ranging from .975 to .998). If we name laws by theirmathematical appearance, we can say that crossing also follows Fitts’ law—the law of pointing. If we name performance regularities by the tasks theydescribe, we can say there indeed exists a “law of crossing.”
Figure 7 displays the regression lines of completion time as a function ofID. As we can see, despite the very different constraints and varying actionpatterns across the six tasks, the laws of these tasks all fall into a band thatis even narrower than the range of data based on the same Fitts’ tapping taskreported by different authors in the literature [MacKenzie 1992; Zhai 2004].
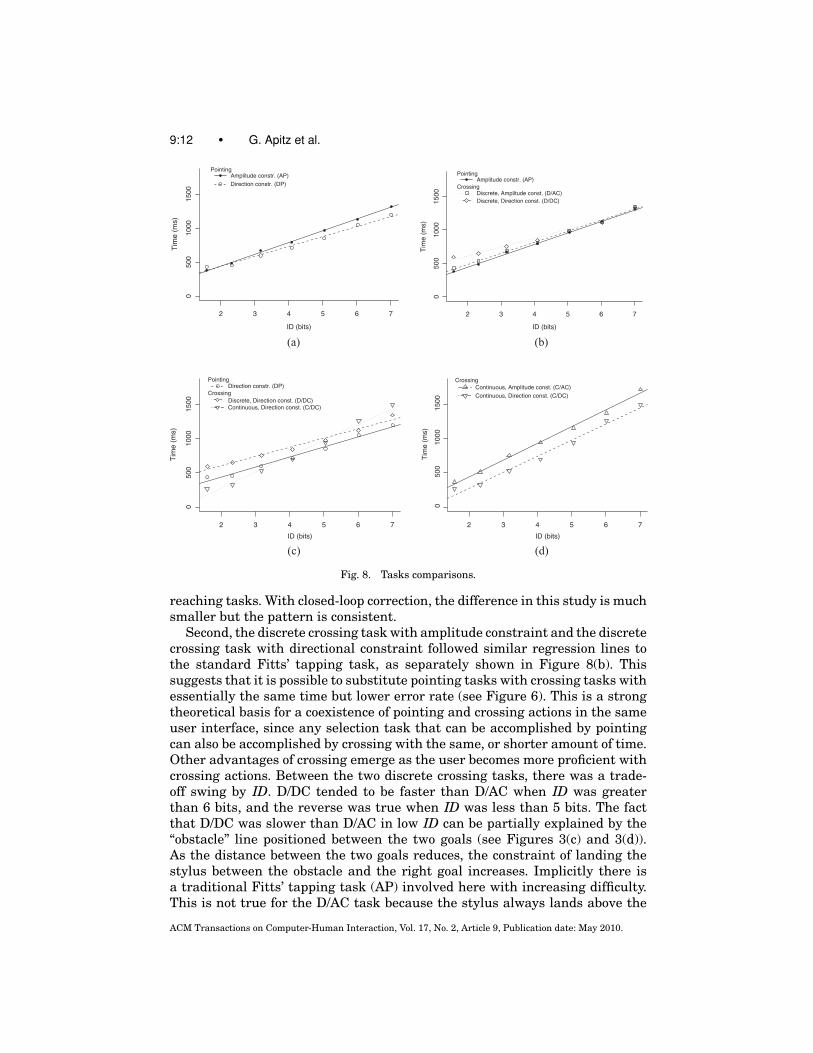
3.2.3 Task Comparison. Although relatively small, there were importantdifferences between the six tasks studied in this experiment. Instead of ana-lyzing all pairs of comparison, we focus on a few comparisons most relevant tohuman-computer interaction tasks (illustrated by Figure 8).
First, Task DP, that is, pointing with directional constraint, not only followedFitts’ law closely (r2 = .986), but also exhibited similar performance to Task AP,that is, pointing with amplitude constraint (the traditional Fitts’ tapping task).On average, DP was 10% faster than AP (Figure 4). As displayed separatelyin Figure 8(a), starting from essentially zero, the difference between DP andAP increased with Index of Difficulty. The greater the ID (either smaller widthor greater distance), the more pronounced this effect (see AP and DP lines inFigure 5(a)). Apparently it is “easier” to control directional error than amplitudeerror in pointing tasks. This is plausible because the former can be dealt with inthe entire course of movement, while the latter can only be controlled at the veryend of the movement. This is also consistent with previous findings in motorimpulse variability research [Schmidt et al. 1979] which has demonstratedthat directional variability is about half of amplitude variability in open-loop
ACM Transactions on Computer-Human Interaction, Vol. 17, No. 2, Article 9, Publication date: May 2010.
9:12 • G. Apitz et al.
2 3 4 5 6 7
0500
1000
1500
ID (bits)
Tim
e (
ms)
Amplitude constr. (AP)
Direction constr. (DP)
Pointing
(a)
2 3 4 5 6 7
05
00
10
00
15
00
ID (bits)
Tim
e (
ms)
Amplitude constr. (AP)
Discrete, Amplitude const. (D/AC)
Discrete, Direction const. (D/DC)
Pointing
Crossing
(b)
2 3 4 5 6 7
05
00
1000
1500
ID (bits)
Tim
e (
ms)
Direction constr. (DP)
Discrete, Direction const. (D/DC)Continuous, Direction const. (C/DC)
Pointing
Crossing
(c)
2 3 4 5 6 7
05
00
1000
1500
ID (bits)
Tim
e (
ms)
Continuous, Amplitude const. (C/AC)
Continuous, Direction const. (C/DC)
Crossing
(d)
Fig. 8. Tasks comparisons.
reaching tasks. With closed-loop correction, the difference in this study is muchsmaller but the pattern is consistent.
Second, the discrete crossing task with amplitude constraint and the discretecrossing task with directional constraint followed similar regression lines tothe standard Fitts’ tapping task, as separately shown in Figure 8(b). Thissuggests that it is possible to substitute pointing tasks with crossing tasks withessentially the same time but lower error rate (see Figure 6). This is a strongtheoretical basis for a coexistence of pointing and crossing actions in the sameuser interface, since any selection task that can be accomplished by pointingcan also be accomplished by crossing with the same, or shorter amount of time.Other advantages of crossing emerge as the user becomes more proficient withcrossing actions. Between the two discrete crossing tasks, there was a trade-off swing by ID. D/DC tended to be faster than D/AC when ID was greaterthan 6 bits, and the reverse was true when ID was less than 5 bits. The factthat D/DC was slower than D/AC in low ID can be partially explained by the“obstacle” line positioned between the two goals (see Figures 3(c) and 3(d)).As the distance between the two goals reduces, the constraint of landing thestylus between the obstacle and the right goal increases. Implicitly there isa traditional Fitts’ tapping task (AP) involved here with increasing difficulty.This is not true for the D/AC task because the stylus always lands above the
ACM Transactions on Computer-Human Interaction, Vol. 17, No. 2, Article 9, Publication date: May 2010.
Foundations of Crossing-Based User Interfaces • 9:13
Fig. 9. Three scenarios of crossing multiple parallel targets.
horizontal goals. This distractor effect reflects realistic situations in computerinterfaces where the target object can be surrounded by objects that are nottargets at the moment.
Another large difference between the two discrete crossing tasks was that amuch smaller number of errors was made with the D/DC task than with theD/AC task (Figure 6). This becomes an important aspect when designing lowerror rate layouts.
Third, there was a trade-off between C/DC and D/DC tasks (Figure 8(c)).C/DC was faster than D/DC when ID was lower than 5 bits, and C/DC waslonger than D/DC when ID was greater than 5 bits. This again was partly dueto the obstacle effect in the D/DC task. There was no obstacle in the C/DC task.Continuous strokes give better performance if the ID is kept low and obstaclesare avoided. When the two goals were very close to each other(Figure 5(a)),it was possible to cross two goals in one stroke with C/DC. For D/DC, on theother hand, closer goals make it more difficult to place the stylus between theobstacle and the goal to be crossed. It is also conceivable that longer distancewould give D/DC an advantage because the lifted stylus might travel fasterthan continuously sliding the stylus on the tablet surface in the D/DC condition.However, such a possibility is not supported by the data (Figure 5(a)).
Fourth, the C/AC task was uniformly slower than the C/DC task(Figure 8(d)). It also has the highest error rate (Figure 6). This suggests that,whenever possible, the goals to be crossed continuously should be positionedorthogonal to the movement direction.
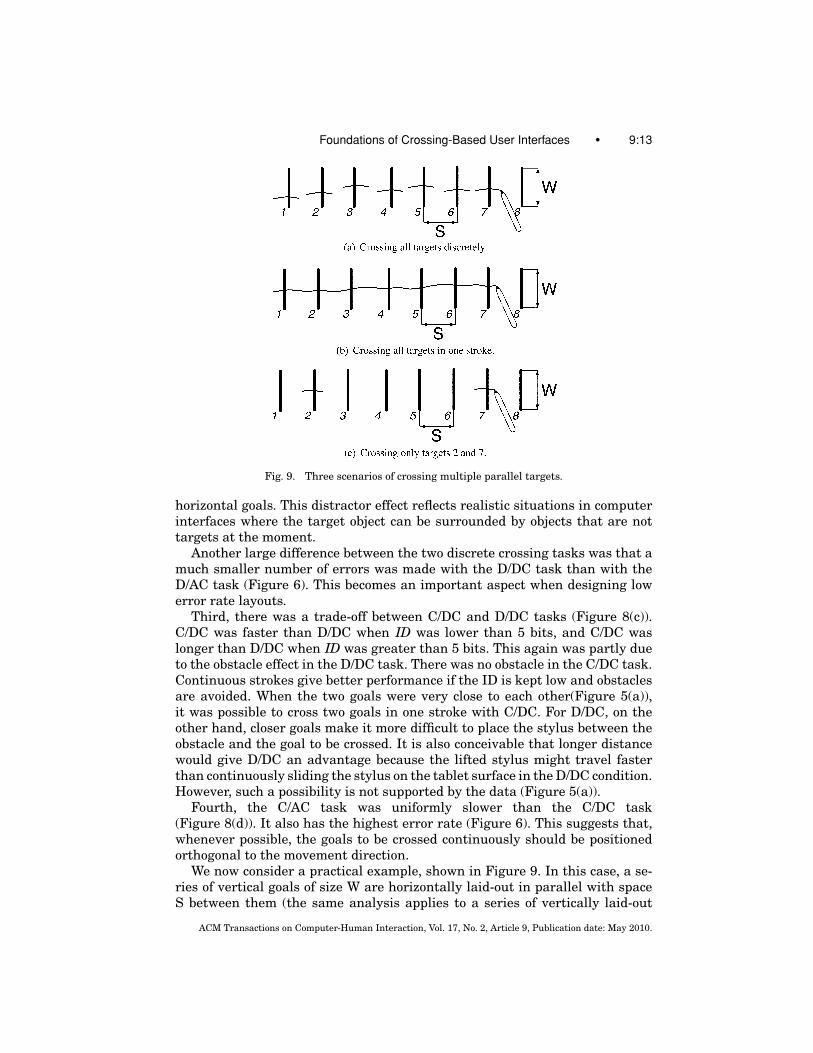
We now consider a practical example, shown in Figure 9. In this case, a se-ries of vertical goals of size W are horizontally laid-out in parallel with spaceS between them (the same analysis applies to a series of vertically laid-out
ACM Transactions on Computer-Human Interaction, Vol. 17, No. 2, Article 9, Publication date: May 2010.

9:14 • G. Apitz et al.
goals). If the task is to select all of them at once, users might select them oneby one using a series of small strokes (Figure 9(a)). This approach is similarto the discrete goal crossing with directional constraint (D/DC) condition ofour experiment. Users might also decide to select them with one continuousstroke (Figure 9(b)). This is similar to the continuous goal crossing with di-rectional constraint (C/DC) condition of our experiment. As shown before (seeFigure 8(c)), the discontinuous approach will perform better if log2( S
W + 1) isgreater than about 5 or S is greater than 31W. It is important to note also thatwhen log2( S
W +1) is smaller than 4 (see Figure 8(c)) or S smaller than 15W, con-tinuous crossing, is not only faster than discontinuous crossing, but also fasterthan consecutively clicking on a series of targets of width W. The fact that con-tinuous crossing is faster than (discrete) clicking in specific settings has beenleveraged by Lotus Notes, which lets users select a series of continuous emailsby continuously crossing check boxes.
Of course, users might also need to select non-continuous goals, for example,goal 2 and 7. In that case, the goals in-between are distractors or obstacles(Figure 9(c)). Then, the only crossing strategy one can employ is discrete cross-ing (D/DC). Of course, in order to cross goal 7, one first has to land between goal6 and 7, a task similar to the pointing with amplitude constraint condition (AP)of our experiment. So the analysis of this task requires considering both a D/DCaspect with IDD/DC = log2( 5S
W + 1) and an AP aspect with IDAP = log2( 4SS + 1).
When S is greater than 0.8W, the impact of the obstacle created by the othercrossing target(s) is less important. When S is smaller than 0.8W, the AP aspectbecomes the dominant factor and the entire task is effectively an AP task withtarget width of S. In practice, if we consider a quite common situation in whicheach target is 5 characters long with one space at the end (or S ≈ 6W), thenIDD/DC > 2IDAP. This means that in general, the constraints imposed by theD/DC aspect are predominant for design purposes.
4. APPLYING THE RESULTS TO BUILD AN APPLICATION
Drawing from the information and experience described thus far, we devel-oped a prototype application, CrossY, that gives insights about how a real lifecrossing-based application can be designed. The main goal was to create an ap-plication for which all interface elements (including menus, buttons, scrollbars,and dialog boxes) rely solely on crossing (Figure 10).
CrossY not only demonstrates the feasibility of crossing as an interactionparadigm in a real life application, it also provides initial feedback on theunique challenges of developing such a crossing-based interface. We found thatcrossing is well adapted to both pen-based and mouse-based interactions, itis more expressive than the equivalent point-and-click interfaces, and it en-courages a fluid composition of commands. We also found that, to leverage thislatter advantage, special consideration of the interface layout is required.
4.1 Requirements for a Crossing-Based Application
Based on the study reported above (see Section 3.2.3), we found that the targetfor any crossing interaction should be orthogonal to the crossing direction.
ACM Transactions on Computer-Human Interaction, Vol. 17, No. 2, Article 9, Publication date: May 2010.

Foundations of Crossing-Based User Interfaces • 9:15
Fig. 10. A screenshot of the CrossY interface.
Since we assume a general horizontal flow of interaction, the alignment of thecrossing target had to be vertical. Furthermore, as expected from Fitts’ lawand confirmed with the “law of crossing” in section 3.2.2, the distance and sizeof crossing targets was a crucial aspect as well. Based on these insights, wedecided to use a low ID for the initial design to minimize the error rate and toprovide the users with a satisfying experience.
Expressiveness. One of the most important questions to be addressed is:Can the new language express as rich a set of features as the language itmeans to replace? Therefore, we decided to examine how the key elements ofa basic WIMP interaction can be implemented in a crossing interface. As astarting point, we decided to implement standard buttons, scrollbars, menusystems, dialog boxes (including selection of items from a list) and a simpleset of window management tools. In each case, our initial goal was to mimicexisting capabilities before developing new features.
Fluid composition of commands. As illustrated by Lotus Notes [IBM 2004]and the toggle maps system [Baudisch 1998] interfaces based on goal crossingpromote the fluid, composition of commands. This allows users to issue severalactions (e.g., selecting among a group of toggle switches) in one single stroke. Asshown by systems such as Marking Menu [Kurtenbach 1993], and the SHARKsystem [Zhai and Kristensson 2003] there are advantages to encouraging tran-sition from a a visual interface to a gesture-based interface. Thus our goal wasto determine if crossing based interactions could extend this benefit to a widerset of interactions such as a search and replace task.
We also examined if the advantages of transitioning from a visual interface toa gesture-based interface (as demonstrated in the Marking Menu [Kurtenbach1993]) could be extended to the selection of several commands inside a dialogbox using continuous crossing.
ACM Transactions on Computer-Human Interaction, Vol. 17, No. 2, Article 9, Publication date: May 2010.

9:16 • G. Apitz et al.
Fig. 11. Selecting the values for find and replace and applying the command in a continuousstroke.
Efficiency. Expressiveness and fluidity are of little use if they come at theprice of an inefficient interface. Therefore, efficiency was an important consid-eration during the design process.
Visual footprint. Screen real estate is a valuable resource and the newinteraction language needs to use it efficiently. Crossing-based interfaces areunique, since the visual layout affects efficiency when a user selects severalcommands in one stroke. For the discrete case the design is as important forcrossing as it is for pointing.
4.2 CrossY in Detail
CrossY1 is a simple sketching program offering several tools (e.g., a pen, ahighlighter, an eraser). It was designed to run on the Tablet-PC platform with-out a keyboard. CrossY allows users to modify tool attributes. It also offers asimple search-and-replace feature which lets users find strokes based on theirattributes (color and thickness) and replace them. Although this drawing sys-tem is primitive by today’s standards, CrossY demonstrates how most of thestandard widgets of point-and-click interfaces can be implemented in a goalcrossing framework.
4.3 Crossing Direction
In contrast to point-and-click designs, the direction of the crossing matters andcan hold information. In the case of CrossY, we decided to use right to leftas the main crossing direction to minimize hand occlusion for right handedpeople. There is however one exception: we reverse the stroke direction whencontinuous strokes are used for command combinations. An example of this isour find-and-replace dialog where the crossing direction is reversed for someactions to allow for the composition of commands. In other words, in the upperpart of this dialogue box the selections are made by crossing from right to leftand in the lower part the selections are made by crossing from left to right.This enables users to select the stroke width and color to find, issue the findand replace commands and select the replacement values in one stroke that isshaped roughly like a “c,” see Figure 11.
1Although the descriptions in the following sections on CrossY are self-contained, a video demon-stration of CrossY is available at http://www.cs.umd.edu/hcil/crossy/.
ACM Transactions on Computer-Human Interaction, Vol. 17, No. 2, Article 9, Publication date: May 2010.

Foundations of Crossing-Based User Interfaces • 9:17
Fig. 12. A traditional scrollbar and the crossbar compared.
4.3.1 Command Selection. Like many drawing applications, the CrossYinterface implements two kinds of menu systems. Common tools are accessedthrough a tool palette placed on the right side of the display (Figure 10) and allthe crossing targets except for the checkboxes are vertical to allow a horizontalcrossing direction. This layout was adopted to limit potential hand occlusion.CrossY offers five basic tools to choose from: a pen, an eraser, a lasso, a high-lighter, and a search tool. Each of these tools can be selected by simply crossingits icon from right to left. Users can also move the palette to a more convenientplace. To do so, users cross the center of the title bar between the two blackmarks from left to right. This action starts the dragging interaction which willstop as soon as the pen is lifted from the screen. Crossing the same area fromright to left brings the palette back in its original position. This behavior ispresent for all palettes. In addition, CrossY uses FlowMenu as the primarycommand selection mechanism to control the application. This includes com-mands for lasso, open a file, save the current file, and quit the application.
4.3.2 Navigating within the Document. Users navigate the document witha crossbar, the equivalent of the standard scrollbar shown in Figure 12. Thecrossbar looks like a simple bar spanning the length of the document view-port and shows the current location inside the document. To interact with it,users perform gestures crossing the bar. Most of these gestures consist of singlestrokes to support the notion of continuous stroking. We provide several stan-dard features such as page up and page down. These commands are triggeredby open triangles drawn on top of the crossbar in the direction of the desiredmovement (see Figure 12). To start a continuous page down or page up, theuser simply crosses the bar a third time after issuing the initial command. Thedocument now scrolls continuously until the pen is lifted. To jump to a specificposition inside the document, the user crosses the bar in the vicinity of the
ACM Transactions on Computer-Human Interaction, Vol. 17, No. 2, Article 9, Publication date: May 2010.

9:18 • G. Apitz et al.
Fig. 13. Left: The CrossY palette with the pen-panel opened. A single stroke opens the pen-panel,selects width and color of the strokes, and validates the selection. By convention, the left andbottom edges of each dialog box are validation edges (colored green), and the top and right edgesare cancellation edges (colored red). Middle: The dialog box with check boxes to set the stroke-rendering attributes. A single stroke selects all items. Right: The dialog box with the check boxesto set the stroke-rendering attributes. A single stroke selects only two items.
target location and then finely adjusts the position by simple dragging motionson the right side of the bar. Because absolute access and adjustment are nowtwo different parts of the same interaction, it is possible to provide a differentgain for both phases, enabling either precision or speed amplification similarin effects to those techniques explored by Albinsson and Zhai [2003]. Whilethe initial gain is defined by the ratio of the document length to the scroll-bar length, the gain can be reduced during the adjustment phase to allow forfiner adjustments, by moving the cursor further away from the crossbar. Whilesome experimental scrollbars such as the FineSlider [Masui et al. 1995] pro-vide similar options, the fluid integration of the two phases is typically difficultto achieve in a point-and-click interface. Another advantage of the crossbar isthat users are not required to reach a given area of the bar before interacting.For example, they can initiate scrolling commands anywhere on the scrollingarea. They also do not need to acquire the crossbar’s slider before moving toan absolute position in the document; they just need to cross the crossbar atthe target position. This makes the scrolling process faster and reduces thereliance on visual feedback.
4.3.3 Selecting Pen Attributes. In CrossY, users can select pen attributesby using either the pen attribute dialog box or the brush palette.
The Pen attribute dialog box is opened by crossing the pen tool button andextending the stroke towards the left over the edge of the button. Unlike currentimplementations, which present “dual-use” in a tool palette (such as in AdobeIllustrator [Adobe 2005]), our implementation does not force the user to dwellover the button to access the extended features. This increases the fluidityof the interaction and promotes chunking. The pen attribute dialog box ispresented in Figure 13, left. It contains a set of crossing-based radio buttonsused to select the size and color of the stroke. The layout of the buttons andradio buttons was a result of the findings from the experiment that showed anadvantage of crossing targets aligned orthogonally to the pen movement for thediscrete and continuous tasks (C/DC, D/DC see Figure 8). Thus, radio buttons
ACM Transactions on Computer-Human Interaction, Vol. 17, No. 2, Article 9, Publication date: May 2010.

Foundations of Crossing-Based User Interfaces • 9:19
Fig. 14. Left: Separate strokes are shown in the find-and-replace dialog box. Users select thevalues for the target stroke in the upper panel and the replacement values in the lower panel.Middle: The separate strokes are combined into one single stroke. Right: Repeated find-and-replaceoperations are carried out with one continuous stroke.
are designed such that crossing along the horizontal axis of the label (in eitherdirection) will toggle the button. This feature is not only a performance choicebut also reinforces the notion that radio buttons represent exclusive choices(Figure 13, left). For check boxes, on the other hand, the vertically alignedlayout would work against the fact that they are not mutually exclusive andmake it more difficult to select several of them at once in a continuous stroke.Aligning them horizontally would make single choices difficult. Therefore, wedecided to use tilted crossing targets for check boxes, this way the user cancross either horizontally to make just a single selection or vertically to makeseveral selections (Figure 13, middle). Making a stroke that starts verticallyand ends horizontally or similar combinations allow the selection of a subset ofcheck boxes (Figure 13, right). An unusual aspect of the dialog boxes presentedin Figure 13 is that they do not seem to include an OK/Cancel mechanism.The corresponding buttons are in fact very close to the edge of the window.Both the bottom and left border are validating borders (shown in green inour implementation), while the top and right border are cancellation borders(shown in red in our implementation). This layout lets users select all relevantoptions and validate the selection in one stroke. Even though “the single stroke”feature is provided, the user can still use discrete strokes to make selectionsand confirm or cancel.
4.3.4 Finding and Replacing Stroke Attributes. Our application also pro-vides a simple “find-and-replace” function which lets users change the at-tributes of some strokes on the screen. The function is accessible through adialog box which is structured around two panels (Figure 14). On the toppanel, the user can select the width and color of the target strokes using aset of radio buttons. On the bottom panel, the user can select the new widthand color for the selected strokes. After setting the target attributes, the usercan find the next stroke forward by crossing the “find” button from right to left.Similarly, replacement is triggered by crossing the “replace” button from leftto right (Figure 14, left). While this layout seems somewhat unusual, it hasbeen selected to encourage command composition. For example a user can inone single gesture select “medium” and “red”, cross the “find” button to find thefirst occurrence of this type of line, cross the “replace” button to indicate theneed for replacement, and select “blue” and “thin” as the replacement values
ACM Transactions on Computer-Human Interaction, Vol. 17, No. 2, Article 9, Publication date: May 2010.

9:20 • G. Apitz et al.
(Figure 14, middle). The command is executed as the pen is lifted from thepanel. Once the parameters have been correctly selected, there is no need toreselect them, and a simple circular motion between the “find” and “replace”button will trigger the replacement (Figure 14, right). It is also easy to skipsome replacements by only circling around the “find” button without crossingthe “replace” button. Backwards search is provided by crossing the “find” but-ton from left to right. An undo for replacements is achieved by crossing the“replace” button from right to left. Since there are no distracters between thecrossing targets the performance of the continuous stroke is likely to be betterthan of single strokes since the overhead of lifting and putting the pen backon the screen is avoided. This is supported by the experimental results fromSection 3.2.2.
4.3.5 Loading an Existing Drawing. The file dialog box (Figure 15(b–d)) iscalled up through a FlowMenu. It lets users navigate the file system and loadan existing drawing. At first glance, using crossing to navigate the file systemhierarchy seems like a challenge since current interfaces rely heavily on theuse of sequential point-and-click operations for this function. In traditionalnavigation systems, users first have to search through the list of files that ispresent at the current level. This is typically achieved by using the scrollbartab for coarse adjustment and the arrow at the end of the scrollbar for lineby line movement. Next, users have to select the next directory (or the targetfile) by double-clicking on its name. For directories containing a large numberof items, this method can be quite cumbersome and is far less efficient than atext based interface with auto-completion enabled. We believe that the crossingparadigm provides ways to combine the convenience of the graphical interfacewith the speed of auto-completion.
In our directory navigation tool, the local directory is scanned and its con-tents are parsed into a hierarchy of display levels. Exploration of the file hi-erarchy works on the same basis as auto-completion in text-based systems. Atthe first level, we include all the names which are unambiguous (i.e., which donot share a common prefix with any other name) as well as the maximum com-mon prefixes for all other names in the directory. For example in Figure 15(a)top,“ClassFall03,” “ClassFall04,” “ClassSpring04,” and “ClassSpring04” will berepresented by their common prefix “Class...,” “Papers03,” “Papers04,” “Pro-posal03,” and “Proposal04” are represented by their common prefix “P...,” and“Resume” is presented as is since it is not ambiguous.
Exploration is performed by expansion of successive prefixes as users movethrough successive levels. For each prefix, we add the list of unambiguousnames and maximum common prefixes derived from that prefix by adding inturn all possible letters following this prefix (see Figure 15(a), left/middle). It isimportant to note that there are only a limited set of possible characters (256 intheory but far less in practice) that may follow a given prefix. As a consequence,moving from one level to the next only adds a small number of new options foreach prefix (often less than ten). Yet, assuming an average of 10 new words perprefix, after crossing only 3 levels 1000 elements can be accessed. Once created,this hierarchy can be navigated as follows (Figure 15(a), right): At all times,
ACM Transactions on Computer-Human Interaction, Vol. 17, No. 2, Article 9, Publication date: May 2010.

Foundations of Crossing-Based User Interfaces • 9:21
Fig. 15. The file dialog box in CrossY.
ACM Transactions on Computer-Human Interaction, Vol. 17, No. 2, Article 9, Publication date: May 2010.

9:22 • G. Apitz et al.
the currently selected item is presented highlighted at the center of the widget.Users can change the currently selected item by moving the pen up and downanywhere on the widget. To move one level downward in the display hierarchy,users simply make a left-to-right horizontal movement in the current gesture.This causes the current highlighted prefix (represented with an ellipsis, e.g.,“P...”) to extend one level. A movement to the right while an unambiguous nameis selected, loads the corresponding directory or file. To move one level upwardin the display hierarchy, users need to make a small right-to-left horizontalmovement in their gesture. Going upward at the root display level loads theparent directory. During navigation, feedback is provided in several ways: whenthe user starts a horizontal segment, a crossing goal is displayed in form of alittle bar indicating the point at which the transition to the next level will betriggered. This feedback is mostly useful for the novice. For more expert users,we also provide a “click” sound each time a transition between levels occursand a “select” sound each time a directory (or a file) is selected. To distinguishbetween files and directories, we display a slash at the end of directory names.
This system is very efficient to navigate through large directory structuresgiven that the number of levels in the prefix structure of each directory istypically small. This allows the user to navigate through several directorylevels in the space of a small window.
4.4 Dispatching Events
From our early initial experience with CrossY, we learned that the standardevent dispatch mechanism can result in the loss of crossing events. The problemis a combination of sampling rate of the pen or pointing device in general andhow the sampled events are distributed to the different recipients. Moving thedevice quickly over the screen results in just a few sparsely distributed points.Distributing only these points can result in the “loss” of crossing events. Thiscan happen if the pen is moved in such a manner that the points captured areoutside the widget that contains the line to cross. The solution we applied tothis problem is a completely customized dispatch mechanism. Starting off witha distribution of line segments2 instead of points simplifies the handling of thecrossing events since all the actions that need to be taken are encapsulatedin each widget and are based on the information passed into the widget (seeFigure 16). The central dispatch checks if the current line segment crossedany widgets and then passes the line segment information on to the widget(see Figure 17). The mechanisms encapsulated into the widget then trigger thenecessary action. This functionality is provided by a recursive descent of thewindowing hierarchy and thus reaches all involved widgets. One advantage ofthis approach is the fact that even in case where the “actual” points are noton the widget, like in the case of several option boxes in a panel, each widgetgets the information about the line segment if it somehow intersects with it.The correct receiving of all crossing activity is especially crucial when it comesto command combination, where the user issues several with one stroke. An
2These are segments rather than lines since we do not dispatch the whole current stroke but onlythe last segment of it, thus the naming.
ACM Transactions on Computer-Human Interaction, Vol. 17, No. 2, Article 9, Publication date: May 2010.

Foundations of Crossing-Based User Interfaces • 9:23
Fig. 16. An example that visualizes how the dispatch mechanism works. Boxes A–C representwidgets on the screen. Widget A receives two points P1 and P2, widgets B and C do not receive theevents directly, but the dispatch in widget A computes that the line between P1 and P2 touches Band thus dispatches the line (P1,P2) to B. The dispatch in B computes that (P1, P2) crosses C anddispatches it into C, in C the actual crossing is detected without ever receiving a direct event ofpoints within its boundaries.
Fig. 17. A pseudocode listing of the main loop in the dispatcher which notifies widgets of lineevents if they are intersecting in any way with the widget. The LineSegment class ensures thatthe translation between window and screen coordinate system is handled correctly when switchingfrom widgets to their children.
example is the toolbox where the stroke width and color are selected in onestroke. If some of the points were not on the widget, either the width or thecolor would not be selected properly and the user would be forced to reissue.
4.5 Implementation
CrossY was implemented in C# on a Tablet-PC. To achieve the intended be-havior we created our own stroke/stroke collector class which allows us to havea standard functionality of adding and removing strokes but also enables usto add crossing specific features. These are for example the possibility to treatstrokes as a sequence of lines and not as a sequence of points. The whole systemwas developed using the .NET framework [Jarett and Su 2002] as the basis forour design.
4.6 Lessons Learned in Building CrossY
From our experiences gained while implementing CrossY, it is clear that thecrossing paradigm is at least as expressive as the standard point-and-clickinterface and provides the same level of functionality as the latter. It is possible
ACM Transactions on Computer-Human Interaction, Vol. 17, No. 2, Article 9, Publication date: May 2010.
9:24 • G. Apitz et al.
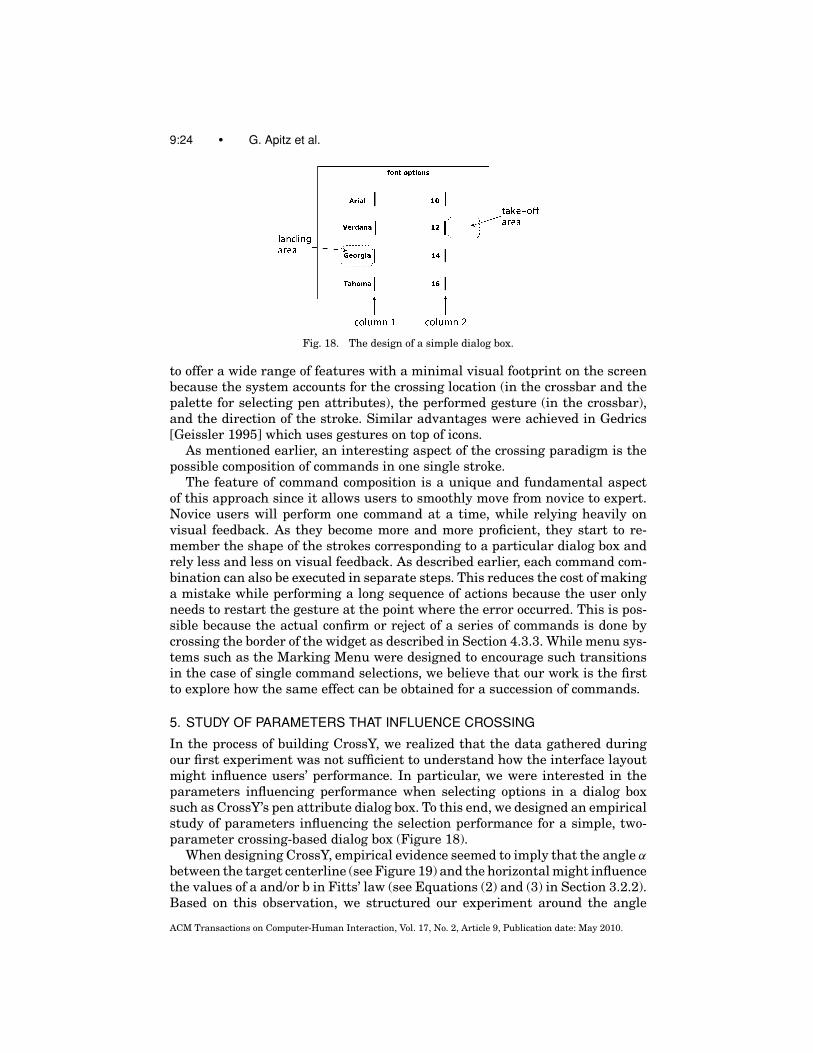
Fig. 18. The design of a simple dialog box.
to offer a wide range of features with a minimal visual footprint on the screenbecause the system accounts for the crossing location (in the crossbar and thepalette for selecting pen attributes), the performed gesture (in the crossbar),and the direction of the stroke. Similar advantages were achieved in Gedrics[Geissler 1995] which uses gestures on top of icons.
As mentioned earlier, an interesting aspect of the crossing paradigm is thepossible composition of commands in one single stroke.
The feature of command composition is a unique and fundamental aspectof this approach since it allows users to smoothly move from novice to expert.Novice users will perform one command at a time, while relying heavily onvisual feedback. As they become more and more proficient, they start to re-member the shape of the strokes corresponding to a particular dialog box andrely less and less on visual feedback. As described earlier, each command com-bination can also be executed in separate steps. This reduces the cost of makinga mistake while performing a long sequence of actions because the user onlyneeds to restart the gesture at the point where the error occurred. This is pos-sible because the actual confirm or reject of a series of commands is done bycrossing the border of the widget as described in Section 4.3.3. While menu sys-tems such as the Marking Menu were designed to encourage such transitionsin the case of single command selections, we believe that our work is the firstto explore how the same effect can be obtained for a succession of commands.
5. STUDY OF PARAMETERS THAT INFLUENCE CROSSING
In the process of building CrossY, we realized that the data gathered duringour first experiment was not sufficient to understand how the interface layoutmight influence users’ performance. In particular, we were interested in theparameters influencing performance when selecting options in a dialog boxsuch as CrossY’s pen attribute dialog box. To this end, we designed an empiricalstudy of parameters influencing the selection performance for a simple, two-parameter crossing-based dialog box (Figure 18).
When designing CrossY, empirical evidence seemed to imply that the angle α
between the target centerline (see Figure 19) and the horizontal might influencethe values of a and/or b in Fitts’ law (see Equations (2) and (3) in Section 3.2.2).Based on this observation, we structured our experiment around the angle
ACM Transactions on Computer-Human Interaction, Vol. 17, No. 2, Article 9, Publication date: May 2010.

Foundations of Crossing-Based User Interfaces • 9:25
Fig. 19. Key variables for designing crossing-based widgets.
Fig. 20. Screen shot of the two settings in our test application.
(α) between the centerline of the targets and the horizontal while taking intoaccount the index of difficulty based on height and distance of the crossingtargets. This choice allowed us to compare our results with previous studies[Jagacinski and Monk 1985; MacKenzie and Buxton 1992] and to explore theinfluence of α in the direct setting.
Another important parameter is target orientation. As discussed in Section4.3, due to layout constraints in crossing interfaces, it is advantageous to usevertical targets. Yet as α increase it might become more advantageous to havetargets orthogonal to the direction of travel, since our initial experiment showedthat the C/DC setting was faster than the C/AC setting (Section 3.2.2).
Finally, we felt it was also important to explore the possible influence of theinteraction setting (either direct or indirect). This is because while the initialempirical study was performed in the indirect setting, CrossY was designedwith a direct setting in mind (Table PC).
In summary, we identified 4 variables that may influence user performancein crossing interfaces:
(1) α, the angle between the target centerline and the horizontal line, seeFigure 19.
(2) ID, the index of difficulty based on height of targets and the distance, centerto center, between two crossing targets;
(3) orientation, which could be either vertical, or orthogonal to the targetcenterline,
(4) setting which can be either indirect setting (interaction on a tablet in frontof the display (Figure 20(a)) or direct setting (interaction directly on thedisplay, (Figure 20(b)).
ACM Transactions on Computer-Human Interaction, Vol. 17, No. 2, Article 9, Publication date: May 2010.
9:26 • G. Apitz et al.
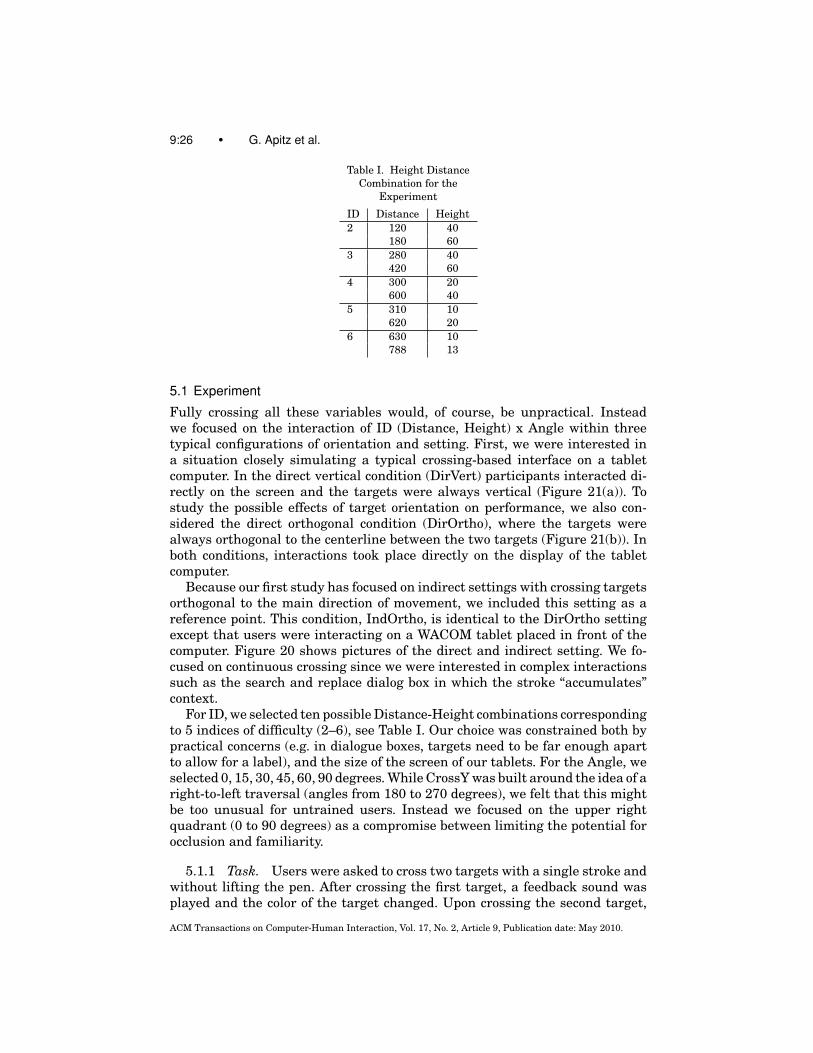
Table I. Height DistanceCombination for the
Experiment
ID Distance Height2 120 40
180 603 280 40
420 604 300 20
600 405 310 10
620 206 630 10
788 13
5.1 Experiment
Fully crossing all these variables would, of course, be unpractical. Insteadwe focused on the interaction of ID (Distance, Height) x Angle within threetypical configurations of orientation and setting. First, we were interested ina situation closely simulating a typical crossing-based interface on a tabletcomputer. In the direct vertical condition (DirVert) participants interacted di-rectly on the screen and the targets were always vertical (Figure 21(a)). Tostudy the possible effects of target orientation on performance, we also con-sidered the direct orthogonal condition (DirOrtho), where the targets werealways orthogonal to the centerline between the two targets (Figure 21(b)). Inboth conditions, interactions took place directly on the display of the tabletcomputer.
Because our first study has focused on indirect settings with crossing targetsorthogonal to the main direction of movement, we included this setting as areference point. This condition, IndOrtho, is identical to the DirOrtho settingexcept that users were interacting on a WACOM tablet placed in front of thecomputer. Figure 20 shows pictures of the direct and indirect setting. We fo-cused on continuous crossing since we were interested in complex interactionssuch as the search and replace dialog box in which the stroke “accumulates”context.
For ID, we selected ten possible Distance-Height combinations correspondingto 5 indices of difficulty (2–6), see Table I. Our choice was constrained both bypractical concerns (e.g. in dialogue boxes, targets need to be far enough apartto allow for a label), and the size of the screen of our tablets. For the Angle, weselected 0, 15, 30, 45, 60, 90 degrees. While CrossY was built around the idea of aright-to-left traversal (angles from 180 to 270 degrees), we felt that this mightbe too unusual for untrained users. Instead we focused on the upper rightquadrant (0 to 90 degrees) as a compromise between limiting the potential forocclusion and familiarity.
5.1.1 Task. Users were asked to cross two targets with a single stroke andwithout lifting the pen. After crossing the first target, a feedback sound wasplayed and the color of the target changed. Upon crossing the second target,
ACM Transactions on Computer-Human Interaction, Vol. 17, No. 2, Article 9, Publication date: May 2010.

Foundations of Crossing-Based User Interfaces • 9:27
Fig. 21. The setup for our experiment. a) indirect setting; b) direct setting.
the task was completed and the next trial appeared. An error was countedwhen the user lifted the pen before crossing the second target, crossed thetarget in the wrong direction, or did strokes that involved no crossing at all. Toavoid counting simple landing (i.e., touching the pen to the screen) as an error,we introduced a minimum stroke length of 10 pixels. Thus, a simple touchof the screen, as it may occur between blocks, did not count as an error. Toprovide the user with feedback about their performance we provided two scalesin the upper left corner of the application window (Figure 21). One representedthe cumulative error rate in the current condition and the other the completiontime for each connection. The first scale was a half-circle consisting of threeevenly sized parts colored in blue, green and red with a representation of anerror rate from 0% on the left side to 8% on the right side of the half circle. Thesecond feedback widget showed a diagram where the y-axis reflected completiontime and the x-axis represented the trial number. Parallel to the x-axis, a lineindicated the average completion time for the task (based on pilot studies).After each trial, a dot appeared on the diagram and gave feedback about thecurrent speed of the user. This was done to ensure that participants maintainedaproximately a 4% error rate to avoid possible problems with speed accuracytrade-off.
5.1.2 Method. For this experiment we adopted a within-subject design.This was based on the assumption that skill variation between subjects mightbe important and little or no asymmetrical skill transfer was expected. Thepresentation of different IDs was randomized. To reduce measurement noise,each combination was repeated 10 times in a row. As a result, participantsperformed 600 connections in each device setting. To limit the influence of skill
ACM Transactions on Computer-Human Interaction, Vol. 17, No. 2, Article 9, Publication date: May 2010.

9:28 • G. Apitz et al.
transfer, we used a fully counterbalanced design for the order of conditions(IndOrtho, DirOrtho and DirVert). In summary, the experiment collected: 5(distance) × 6 (height) × 8 (angles) × 12 (participants) × 10 (repetitions) =28’800 trials. Overall, each participant was asked to complete 2400 connections,including practice crossings.
5.1.3 Apparatus. The main apparatus of the experiment was our test ap-plication running on two Toshiba Protege Tablet PCs, both with 1.25 GB RAMand one with 1.7 GHz CPU frequency and the other with 1.5 GHz. To ensurethat the different CPU frequencies had no influence on our results we fullybalanced the tasks that were done on the different computers. The diagonalof the screen was 307mm and the resolution was set to 1400 × 1050 pixels.The tablet PCs were used in the folded configuration when they appear as aslate to users (see Figure 21). For the indirect condition, we used a WacomIntuosII tablet where the gain between pen movement and cursor movementwas set to 1.8. This value corresponds to an average of the values reported inthe literature [Accot and Zhai 2002; MacKenzie and Buxton 1992]. To preventconfusion and errors, the buttons on the pen for the Tablet PCs and the pen forthe Wacom tablet were disabled. The test application was written in C#. Apartfrom presenting the different tasks, it also logged all actions performed by theusers.
5.1.4 Protocol. The participants were 12 students at the University ofMaryland (5 female; age range 18–30 years). One of the participants was left-handed. The three configurations (IndOrtho, DirOrtho, DirVert) were presentedin blocks. Before completing the actual task, users completed a training sessionof 3 connections per ID/Angle combination. participants were asked to completethe crossing as fast and precise as possible. They were asked to keep the errorrate within the middle area of the error scale described above. This representsan error rate of 4%. Since we were measuring only the times from first crossingto second crossing, users had a chance to rest as soon as they completed acrossing. Auditory feedback was provided through headphones connected totheir tablet as some users were run in pairs in the same room. Users received$20 for their participation.
5.2 Results and Analysis
For our analysis, we focused on the average completion times for the connec-tions performed under each combination of Angle, ID, and condition. Bonferroniadjustments for multiple comparisons were used.
To evaluate the possibility of asymmetrical skill transfer [Poulton andFreeman 1966], we performed a condition (IndOrtho, DirOrtho, DirVert) x orderanalysis of variance (ANOVA). There was no main effect of presentation order(F2,15 = 1.61, p = .233) and no interaction between condition and presentationorder (F4,15 = 1.12, p = .385).
To compare the error rate across the different conditions we performed awithin-subject ANOVA on error rate for each condition. We found that therewas a significant effect (F2,22 = 5.46, p = .012), driven by a high value (8.54%) for
ACM Transactions on Computer-Human Interaction, Vol. 17, No. 2, Article 9, Publication date: May 2010.

Foundations of Crossing-Based User Interfaces • 9:29
the indirect setting (IndOrtho) compared to the direct settings (5.0% and 5.6%for DirOrtho and DirVert respectively). Yet no significant pairwise differenceswere found. This indicates that we were only moderately successful in holdingerror rates constant across conditions.
To examine the influence of different CPU frequencies we performed anANOVA with condition as a within-subject factor and CPU frequency (1.7 vs.1.5 GHz) as a between-subject factor with average crossing time as the depen-dent variable. We found no significant main effect of CPU frequency on totalcrossing time (F1,20 = 1.44, p = .244) No interaction between CPU frequencyand condition was found (F1,20 = 1.437, p = .245).
Next we performed a (Condition × ID × Angle) within-subject ANOVAon average crossing time. There was a significant main effect for condition(F2,22 = 15.7, p < .001). Post-hoc tests indicated that the indirect condi-tion was significantly slower than either of the direct conditions (p < .005).There were no significant differences between the direct conditions (p = .34).These findings are not surprising, because hand-eye coordination provides asignificant advantage in the case of the direct conditions. This is consistentwith the comments of users who reported that they felt more control overthe interaction in these settings. We also found a significant main effect ofID, (F4,44 = 656, p < .001), reflecting Fitts’ law. In addition, there was amain effect of Angle (F5,55 = 34.4, p < .001). These main effects were qual-ified by a complex interaction pattern. We observed a significant (Condition ×Angle) interaction (F10,110 = 11.3, p < .001), a (Condition × ID) interaction(F8,88 = 8.58, p < .001) as well as a significant 3-way (Condition × ID × Angle)interaction (F40,440 = 1.73, p < .005). To explocate this interactions, we are nowproceeding with an analysis on a method per method basis.
5.2.1 The Indirect Orthogonal Condition. We performed an (ID × Angle)within-subject ANOVA on average crossing time in the indirect orthogonalcondition (Figure 22(a)). It revealed a strong main effect of ID (F4,44 = 639, p <
.001) suggesting a direct linear dependency between total crossing time and IDwhich reflects Fitts’ law:
T = 292ID − 463, (r2 = 0.996).
The main effect of Angle (F5,55 = 1.62, p = .21) and the (ID × Angle) interaction(F20,220 = 1.34, p = .32) were not significant. In general, these findings oncrossing with different approaching angles are consistent with previous studiesin Fitts’ law pointing tasks [Jagacinski and Monk 1985; MacKenzie and Buxton1992], although in our case, the 45 degree angle does not seem to stand out.
5.2.2 The Direct Orthogonal Condition. We performed an (ID × Angle)within-subject ANOVA on average crossing time in the direct orthogonal con-dition (Figure 22b). There was a main effect of Angle (F5,55 = 7.89, p < .001)and a (ID × Angle) interaction (F20,220 = 1.93, p < .012). Post-hoc comparisonssuggested that the only significant differences were between angles lower than15 degrees and the 90 degree condition (p < .03; mean difference around115 ms.). Further, there was a main effect of ID (F4,44 = 332, p < .001)
ACM Transactions on Computer-Human Interaction, Vol. 17, No. 2, Article 9, Publication date: May 2010.

9:30 • G. Apitz et al.
Fig. 22. The effects of ID and angle on crossing time.
ACM Transactions on Computer-Human Interaction, Vol. 17, No. 2, Article 9, Publication date: May 2010.

Foundations of Crossing-Based User Interfaces • 9:31
Fig. 23. The influence of angle on crossing time averaged over all IDs using the crossing timeat Angle = 0 degree as a reference point. (�tre f =15deg(Angle) = 3.64(Angle − 15) + 15.9, Angle ≥15degree, r2 = 0.99 ).
reflecting that, as predicted by Fitts’ law, there was a strong linear dependencybetween the total crossing time and ID for each angle:
T = 257ID − 498, (r2 = 0.956), Angle = 0degree
T = 245ID − 444, (r2 = 0.973), Angle = 15degree
T = 274ID − 539, (r2 = 0.962), Angle = 30degree
T = 262ID − 471, (r2 = 0.964), Angle = 60degree
T = 298ID − 544, (r2 = 0.975), Angle = 90degree.
In a direct setting (and without acceleration), the two extreme directions (0and 90 degree) different directions involve different muscle groups, particularlywhen ID (and hence the distance to travel) is high. Specifically, we observedthat as the angle nears 90 degrees, the upper arm and the shoulder participatein the movement. These proximal joins have slower bit rates than more distaljoins like the wrist [Langolf and Chaffin 1976] and this may account for theslower crossing times.
5.2.3 The Direct Vertical Condition. We performed an (ID × Angle) within-subject ANOVA on average crossing time in the direct vertical condition(Figure 22c). Again, there was a main effect for Angle (F5,55 = 54.2, p < .001)and an a (ID × Angle) interaction (F20,220 = 1.80, p < .023). The effect of Anglewas considerably stronger than in the direct orthogonal condition. For examplethe difference between angle = 0 and angle = 90 degree was 262 ms (p < .001).Setting aside the special case of angle = 0 (for which we observed an unex-plained “bump” at ID 6), we observed that the difference between measuredtask completion time and the observed task completion time at angle = 15degree increase linearly as a function of Angle. (Figure 23). Again there was astrong main effect on ID (F4,44 = 380, p < .001) reflecting Fitts’ law. For eachangle we observed a strong linear dependency between the total crossing time
ACM Transactions on Computer-Human Interaction, Vol. 17, No. 2, Article 9, Publication date: May 2010.

9:32 • G. Apitz et al.
Fig. 24. Users take different paths depending on the setting and path angle. In the first andsecond column (Orthogonal setting), paths are relatively straight for all angles. In the third column(Vertical setting) we see an increasing in curvature with increasing angles. The paths shown arethe 9th and 10th strokes of each user for each setting for ID = 5 (Height = 20 pixels).
and ID:
T = 266ID − 546, (r2 = 0.942), Angle = 0degree
T = 235ID − 440, (r2 = 0.968), Angle = 15degree
T = 243ID − 404, (r2 = 0.989), Angle = 30degree
T = 254ID − 392, (r2 = 0.989), Angle = 45degree
T = 247ID − 289, (r2 = 0.989), Angle = 60degree
T = 218ID − 91, (r2 = 0.991), Angle = 90degree.
As for the DirOrtho condition, these results can be explained by the pro-gressive involvement of more proximal joints in the movement. Yet, the effectis much stronger than in the DirOrtho condition and additional factors mayplay a role. One possible explanation might lie in the dynamic of the movementitself [Viviani and Terzuolo 1982] (see Figure 24). As expected, the IndOrthocondition appears noisier than the DirOrtho—probably because of the highgain for this condition. However, the most interesting difference is between the
ACM Transactions on Computer-Human Interaction, Vol. 17, No. 2, Article 9, Publication date: May 2010.
Foundations of Crossing-Based User Interfaces • 9:33
DirOrtho and DirVert condition. Participants no longer take a straight pathbetween the two crossing targets but start to use more S-like strokes to achieveshallower entry and exit angles into the crossing targets.
5.2.4 User Feedback. The results of the user testing show that the crossingparadigm is easy to understand and to transfer into action even by novice users.Overall, the direct setting was in all cases preferred to the indirect setting. Thissuggests that direct pen-based interactions are easier to perform than indirectpen-based interactions. All participants agreed that the indirect setting wasmore difficult to handle and more error prone. This is reflected in the increasedcrossing time (see Figure 22(a)) and a higher error rate.
6. DISCUSSION AND IMPLICATIONS FOR CROSSING-BASED INTERFACES
In this section we are reporting the insights we gathered while designingCrossY and how these insights, combined with the findings from our secondstudy, can be applied to crossing-based interfaces in general. For illustrationpurposes, we use the simple case of a two-column dialog box as shown inFigure 18 as a running example, and restrict ourselves to the case of interac-tions in the first quadrant (e.g., selecting the font “Georgia” and font size “12”in sequence).
6.1 Space and Time Efficiency
When designing the dialog box in this example, one first needs to considerhow much space is required to comfortably perform selections. This includesthe space needed to land the pen before the connection, the minimum spacerequired between the two columns, and the space needed to take off the penbefore crossing the dialog box boundary. In our experience, if one considersnovice users, the space requirements of a crossing-based interface will be sim-ilar to the equivalent point-and-click interface. This is derived from the factthat the crossing efficiency is similar to that of pointing which was describedearlier (DP task, see Figure 3(b)). Thus one can simply substitute every stan-dard button with a crossing button of the same size. Yet, when one wishes toleverage command composition, a space vs. speed trade-off will appear becausesome space will be needed due to the sloppiness of rapid gestures. This meansthat we need to provide more space for each widget in order to ensure relia-bility. Based on our experience, we believe that a slightly larger footprint maybe acceptable as the expected speed benefits from command composition aresubstantial. Furthermore, natural constraints of efficient visual layout (suchas the use of negative space Mullet and Sano [1994]), may be all that is needed.
6.2 Landing and Takeoff Space
As seen in Figure 18, a certain area needs be reserved for landing and taking offbefore and after the actual crossing interaction. To better understand the userrequirements for landing and takeoff, we plotted the distribution of landing andtakeoff points from our follow-up study (Figure 25). As the target grows bigger,the users are able to comfortably land their pen further away. This can be
ACM Transactions on Computer-Human Interaction, Vol. 17, No. 2, Article 9, Publication date: May 2010.

9:34 • G. Apitz et al.
Fig. 25. Distribution of the landing points (left column) and take-off points (right column) relativeto the crossing target height and the connection angle. Black vertical lines represent the crossingtarget position. Points further than 125 pixels from target center are not shown (less than 10% ofall points).
ACM Transactions on Computer-Human Interaction, Vol. 17, No. 2, Article 9, Publication date: May 2010.

Foundations of Crossing-Based User Interfaces • 9:35
Fig. 26. Sample dialog box with measurements.
explained by the fact that they are trying to maintain a comfortable anglethrough which they are “seeing” the target upon landing [Accot 2001]. Asimilar behavior is observed for takeoff. From a design perspective, this meansthat one has to reserve a 70 pixel (12.3mm) margin to the left of the firstcolumn and a 100 pixel (17.5 mm) margin to the right of the second columnif one assumes a typical crossing target height of 30 pixels, as in CrossY. Wealso measured the maximum bounding box for the S shape connection curve.For the 90 degree angle, this box is 100 pixels (17.5mm) by 70 pixels (12.3mm),which implies that the distance between columns should be at least 200 pixels(35mm), see Figure 26. These values are based on our findings but need to bevalidated experimentally.
6.3 How Do Users Cross and React to Errors?
Based on the results from our first study, we designed CrossY so that the major-ity of crossing targets was directly orthogonal to the crossing direction. In caseswhere several commands had to be selected consecutively we used targets witha low index of difficulty. From informal interviews with our users, we learnedthat the initial layout was successful and was well perceived. We observed thatthe strategies for crossing, reacting to errors and interaction with the tiltedlines in the checkboxes (see Figure 13) varied between users. Some examples ofdifferent paths users drew are shown in Figure 24. It is important to note herethat the findings from the C/AC and C/DC settings in our first experiment wereconfirmed: performance, in term of time and error rate decreased the furtherthe crossing targets were away from being orthogonal to the crossing direction.The most extreme cases are the angles close to 90◦ where users perform a S-likestroke to cross both targets. This slows them down and increases the chance oferrors (see Section 3.2.3). Also, in terms of error correction, some users simplycontinued with a loop back after missing the second target, instead of startingover again (See Figure 24 (DirVert, 45◦), where one stroke extends longer thanthe others. This stroke was not counted as an error since, after missing thesecond target, the user traveled back and crossed it successfully. This suggeststhat a backtracking path (e.g., for checkboxes) has to be considered.
ACM Transactions on Computer-Human Interaction, Vol. 17, No. 2, Article 9, Publication date: May 2010.

9:36 • G. Apitz et al.
Fig. 27. Each contour plot shows the predicted crossing time (in ms) it will take a participantto connect two targets (with the first target at the origin and the X,Y coordinates describing thecenter of the second target).
6.4 Influence of Layout on Performance
As discussed for the DirVert condition (Section 5.2.3), the crossing time betweentwo targets whose centerline is α degree from the horizontal is given by thefollowing formula (for α ≥ 15 degree3):
T = 235ID − 440 + 3.64(α − 15).
We used this formula to draw the contour plot presented in Figure 27(b). Giventwo targets (of height 20), one with its center at the origin of the graph and onewith its center at the (x, y) coordinate, the value read at the (x, y) will providean estimation of the crossing time. For example if one places a target at (400,386) one might expect a 800ms crossing time. As a reference, we also showin Figure 27(a) the same contour plot for the indirect condition. This graphconfirms our informal observations during the development of CrossY that asthe dialog box becomes taller it also become more cumbersome to use.
6.5 Relationship to Pointing and Steering
While we have focused on performance regularities as a function of crossingtarget characteristics, it is obvious that in real system design, other constraintsmay play a role, and sometimes dominate the crossing constraints. For example,if one has to cross a goal with distracter close by, Fitts’ law for pointing (placing
3For α < 15 degrees our data were inconclusive suggesting that users performed similar as in thehorizontal condition.
ACM Transactions on Computer-Human Interaction, Vol. 17, No. 2, Article 9, Publication date: May 2010.

Foundations of Crossing-Based User Interfaces • 9:37
Fig. 28. The influence between angle and target height.
the pen between target and the distractor goals) may dominate, as we havepreviously shown in Section 3.2.3. Similarly, in the case of a two column designfor a cro in ssing dialog (Figure 18), if the two sets of goals are too closeto one another, they will form a “tunnel” users will have to negotiate (i.e.selecting Tahoma 10 in one stroke in Figure 18). In such cases the steering law[Rashevsky 1959; Drury 1971; Accot and Zhai 1997] effect may dominate thetotal task completion time. Note that the steering law effect levels off whenthe steering ID (tunnel distance to tunnel width ratio in the simple cases) isbelow 4 ([Accot and Zhai 1997], page 301). In the present set-up of CrossY, thesteering law effect therefore should not dominate the crossing effect.
6.6 Beyond Two Columns
Of course, applications may use more than 2 columns in their dialog boxes.4
We did not investigate situations in which more than two marks are crossed insuccession. Yet, our data provide us with two important pieces of information:the target entry angles and the target exit angles. These values are graphedin Figure 28. The figures show that for low angles, the entry and exit anglesroughly correspond to the angle of the target centerline. However, after theangle reaches 20 degrees, users limit the entry angles around 30 degrees. Asimple additive formula for successive connections will at least require inputand output angle to be similar (so that there will be very little influence fromthe first path to the second). Our data suggest that even within the restric-tions of the first quadrant, interactions between successive connections are tobe expected. Of course, the problem will be even more acute in the case ofconnections which require users to first go up and then go down. Additionalexperiments are needed to explore these cases.
4The empirical evaluation of the 3 columns case [Dixon et al. 2008] was published after this workwas done.
ACM Transactions on Computer-Human Interaction, Vol. 17, No. 2, Article 9, Publication date: May 2010.

9:38 • G. Apitz et al.
6.7 A Quick Reference for Designers
Based on the considerations outlined so far we now present a summary ofthe most important points to keep in mind when designing crossing-basedinterfaces for quick reference.
(1) The predominant constraints for the interface layout will be imposed byinteractions requiring discrete directional crossing. As a result, support forcontinuous crossing can lead to more compact interface design.
(2) Crossing targets that are to be crossed continuously should be positionedorthogonal to the movement direction whenever possible.
(3) The further a crossing path deviates from the horizontal, the more difficultit will be for users to perform. As a results, application designers should besure to place the most frequently used sequence on a more or less horizontalpath.
(4) The design should provide enough space to allow for “recovery” strategiesfor missed crossings during multitargets interactions.
(5) The normal dispatch of mouse events might not always provide for accuratecrossing detection during fast gestures.
(6) Crossing and pointing can be used as parallel interaction methods.(7) Crossing as an interaction method works in a direct and indirect setting,
even though our users preferred the direct setting.
7. FUTURE WORK
Although it is too early to judge the success of the command composition ap-proach, this work illustrate the potential of this technique. For example, ourimplementation demonstrates how crossing may alleviate the need for dwelltime for several types of interactions. Somewhat like the text input systemsproposed in Zhai and Kristensson [2003] and Perlin [1998], we envision a sys-tem in which, as novice users discover the interface, they also train themselvestowards generating accurate gestures for the most commonly used commands.At some point, users will be able to remember the shape of the gesture wellenough to be able to generate it on top of the interface elements without theneed for visual feedback. We believe that such a system could be implementedby having two concurrent tracking mechanisms for user input. The first mech-anism will be based on the techniques we used while implementing CrossY andwill track the crossing of each interface element. This mechanism will typicallyrequire visual feedback. The second tracking mechanism will use a gesturerecognition engine to classify user input into possible strings of commands.Depending on specific aspects such as the start of the stroke, the scale of thestroke, or its overall speed, the input of both systems can be integrated to inferusers’ commands. Relying only on visual feedback limits the performance ofcrossing to the speed of hand-eye coordination. Therefore crossing interfacescould potentially benefit from simple haptic or tactile feedback on the styluswhen a goal is crossed. There are various ways to add tactile feedback to a pen[Lee et al. 2004] or touch-screen [Poupyrev and Maruyama 2003]. With thesetactile feedback enabled digital pens, it is possible to emit a click to the pen as
ACM Transactions on Computer-Human Interaction, Vol. 17, No. 2, Article 9, Publication date: May 2010.

Foundations of Crossing-Based User Interfaces • 9:39
it crosses a graphical line, as if it crosses a physical edge. This can be partic-ularly powerful when visual appearance of the goals, such as a “raised” edge,and the form of the tactile feedback, such as a click, are consistent [Campbellet al. 1999]. With such feedback, the “tail” end of crossing could be shorter dueto the feedback effect.
7.1 Special Application Domains of Crossing Interfaces
While CrossY is a “pure” crossing-based application it is important to note thatpointing and crossing do not have to be mutually exclusive. One could havea “double representation” interface where both actions are enabled.5 First,the increased flexibility of both pointing and clicking is beneficial from theperspective of reducing repetitions of the same action. The same user maychoose either crossing or pointing depending on the idiosyncrasies of the taskat hand. Second, users may tend to use one mode or the other dependingon individual preference. Some users have gotten used to pointing and willcontinue their habitual primary mode of action. Others, including some elderlyusers and users with certain motor disabilities, may have difficulty clickingwithout moving the cursor position, or worse, double-clicking [Walker et al.1996, 1997]. For these users, crossing may become the main interaction mode.Second, hyperlinks in Web pages are especially difficult for pointing due totheir narrow height (one line of text) but easy for crossing due to the muchgreater width (one word long and often much longer). It is also possible to crossa list of links in a cascade. This, in fact, has been demonstrated in the “Elasticwindow” prototype [Kandogan and Shneiderman 1997].
Finally, traditional GUI widgets are very difficult to integrate in virtualreality types of 3D interfaces—partly because point and click is necessarilydependent on a solid 2D surface. In contrast, 1D goals (bars) can be easilycrossed (“chopped”) without having to be on a 2D surface. Similarly, actions maybe triggered when crossing a 2D surface, like a door or portal (e.g., Haisenkoand Musgrave [2001]).
8. CONCLUSION
In experiment 1, we compared human performance in both pointing and cross-ing tasks, with an emphasis on systematic variations in terms of task difficulty,the direction of movement constraint, and the nature of the task (discrete vs.continuous). We found a robust regularity among trial completion time, dis-tance between targets, and target width in all six tasks under examination.Our results show that all tasks follow Fitts’ law with parameters which aretask dependent. Observing that in some settings, crossing can be faster thanpointing and clicking, we explored crossing as the primary building block ofa graphical user interface in CrossY. We found that crossing as interactiontechnique is as expressive as the more traditional point-and-click interface andprovides designers with more flexibility than the latter because it takes into
5This idea has been explored further after the work presented here was conducted: Dixon et al.[2008] demonstrated that it can also improve the speed of interaction.
ACM Transactions on Computer-Human Interaction, Vol. 17, No. 2, Article 9, Publication date: May 2010.

9:40 • G. Apitz et al.
account the shape and direction of the strokes. We also found that a crossing-based interface can encourage the fluid composition of commands in one stroke,as illustrated in our find-and-replace dialog box. Ultimately, we believe that thefluid composition of commands will lead to more efficient and natural interfacesfor pen computing.
Our experience while designing CrossY showed us that more empirical datawas needed to better understand the design parameters influencing the per-formance of crossing based design. We explored them in experiment 2, whichshowed that that for the direct configuration with vertical targets, connectiontime depended on the angle between the centerline of the two targets andthe horizontal. We also showed how the empirical data gathered in experi-ment 2 can be applied to better understand the implications of a given layouton overall crossing performance. This work lays the foundation for designingcrossing-based user interfaces in which, crossing is used instead of or in addi-tion to pointing, as a fundamental interaction technique. The use of crossingaction may not be limited to a certain device but applicable to many pen-basedor touch-screen devices from small display smart phones to large-sized wallmounted displays.
ACKNOWLEDGMENTS
We would like to thank Anja Apitz, Corinna Lockenhoff and all other reviewersof early drafts of this article for their comments. The present work is basedon a synthesis of Accot and Zhai [2002] and Apitz and Guimbretiere [2004],with significant expansion and a new experiment. Dave Levin drew the screencontent of Figure 10.
REFERENCES
ACCOT, J. 2001. Les taches trajectorielles en interaction homme-machine—cas des taches denavigation. Ph.D. thesis, Universite de Toulouse 1, France.
ACCOT, J. AND ZHAI, S. 1997. Beyond Fitts’ law: models for trajectory-based HCI tasks. In Pro-ceedings of the SIGCHI Conference on Human Factors in Computing Systems (CHI’97). 295–302.
ACCOT, J. AND ZHAI, S. 2002. More than dotting the i’s—foundations for crossing-based interfaces.In Proceedings of the SIGCHI Conference on Human Factors in Computing Systems (CHI’02).ACM Press New York, NY, 73–80.
ACCOT, J. AND ZHAI, S. 2003. Refining Fitts’ law models for bivariate pointing. In Proceedings ofthe SIGCHI Conference on Human Factors in Computing Systems (CHI’03). ACM Press, NewYork, NY, 193–200.
ADOBE, S. I. 2005. Illustrator 10.ALBINSSON, P.-A. AND ZHAI, S. 2003. High precision touch screen interaction. In Proceedings of the
SIGCHI Conference on Human Factors in Computing Systems (CHI’03). ACM Press, New York,NY, 105–112.
APITZ, G. AND GUIMBRETIERE, F. 2004. CrossY: a crossing-based drawing application. In Proceed-ings of the ACM Symposium on User Interface Software and Technology (UIST’04). ACM Press,New York, NY, 3–12.
BAUDISCH, P. 1998. Don’t click, paint! using toggle maps to manipulate sets of toggle switches. InProceedings of the ACM Symposium on User Interface Software and Technology (UIST’98). ACMPress New York, NY, 65–66.
CAMPBELL, C. S., ZHAI, S., MAY, K. W., AND MAGLIO, P. P. 1999. What you feel must be what you see:adding tactile feedback to the trackpoint. In Proceedings of the 7th IFIP Conference on HumanComputer Interaction (INTERACT’99). 383–390.
ACM Transactions on Computer-Human Interaction, Vol. 17, No. 2, Article 9, Publication date: May 2010.

Foundations of Crossing-Based User Interfaces • 9:41
DIXON, M., GUIMBRETIERE, F., AND CHEN, N. 2008. Optimal parameters for efficient crossing-baseddialog boxes. In Proceeding of the 26th Annual SIGCHI Conference on Human Factors in Com-puting Systems (CHI’08). ACM, New York, NY, 1623–1632.
DRURY, C. G. 1971. Movements with lateral constraint. Ergonomics 14, 2, 293–305.FITTS, P. M. 1954. The information capacity of the human motor system in controlling the am-
plitude of movement. J. Exper. Psych. 47, 381–391.GEISSLER, J. 1995. Gedrics: the next generation of icons. In Proceedings of the IFIP conference on
Human Computer Interaction (INTERACT’95). 73–78.GUIMBRETIERE, F., STONE, M., AND WINOGRAD, T. 2001. Fluid interaction with high-resolution wall-
size displays. In Proceedings of the ACM Symposium on User Interface Software and Technology(UIST’01). ACM Press New York, NY, 21–30.
GUIMBRETIERE, F. AND WINOGRAD, T. 2000. Flowmenu: combining command, text, and data entry.In Proceedings of the ACM symposium on User Interface Software and Technology (UIST’00).ACM Press New York, NY, 213–216.
HAISENKO, M. AND MUSGRAVE, P. 2001. The 3Dsia project. http://threedsia.sourceforge.net.HINCKLEY, K., BAUDISCH, P., RAMOS, G., AND GUIMBRETIERE, F. 2005. Design and analysis of delim-
iters for selection-action pen gesture phrases in scriboli. In Proceedings of the SIGCHI Con-ference on Human Factors in Computing Systems (CHI’05). ACM Press, New York, NY, 451–460.
HINCKLEY, K., GUIMBRETIERE, F., AGRAWALA, M., APITZ, G., AND CHEN, N. 2006. Phrasing techniquesfor multi-stroke selection gestures. In Proceedings of the Conference on Graphics Interface (GI’06).Canadian Information Processing Society, Toronto, Ont., 147–154.
HOFFMANN, E. R. AND SHEIKH, I. H. 1994. Effect of varying target height in a Fitts’ movementtask. Ergonomics 37, 6, 1071–1088.
HONG, J. I. AND LANDAY, J. A. 2000. Satin: A toolkit for informal ink-based applications. In Pro-ceedings of the ACM symposium on User Interface Software and Technology (UIST’00). 63–72.
HOPKINS, D. 1991. The design and implementation of pie-menus. Dr. Dobb’s J. 16, 12, 16 – 26.IBM. 2004. Lotus notes (http://www.lotus.com).JAGACINSKI, R. J. AND MONK, D. L. 1985. Fitts’ law in two dimensions with hand and head move-
ments. J. Motor. Behav. 17, 77–95.JARETT, R. AND SU, P. 2002. Building Tablet PC Applications. Microsoft Press.KANDOGAN, E. AND SHNEIDERMAN, B. 1997. Elastic windows: A hierarchical multi-window world-
wide web browser. In Proceedings of the ACM Symposium on User Interface Software and Tech-nology (UIST’97). 169–177.
KURTENBACH, G. 1993. The design and evaluation of marking menus. Ph.D. thesis, University ofToronto.
LANGOLF, G. D. AND CHAFFIN, D. B. 1976. An investigation of Fitts’ law using a wide range ofmovement amplitudes. J. Motor. Behav. 8, 113–128.
LEE, J. C., DIETZ, P. H., LEIGH, D., YERAZUNIS, W. S., AND HUDSON, S. E. 2004. Haptic pen: a tactilefeedback stylus for touch screens. In Proceedings of the 17th Annual ACM Symposium on UserInterface Software and Technology (UIST’04). ACM Press, New York, NY, 291–294.
MACKENZIE, I. S. 1992. Fitts’ law as a research and design tool in human-computer interaction.Hum.-Comput. Interac. 7, 91–139.
MACKENZIE, I. S. AND BUXTON, W. 1992. Extending Fitts’ law to two-dimensional tasks. In Pro-ceedings of the Conference on Human Factors in Computing Systems. 219–226.
MASUI, T., KASHIWAGI, K., AND GEORGE, R. BORDEN, I. 1995. Elastic graphical interfaces to precisedata manipulation. In Proceedings of the SIGCHI Conference on Human Factors in ComputingSystems (CHI’95). ACM Press New York, NY, 143–144.
MULLET, K. AND SANO, D. 1994. Designing Visual Interfaces: Communication Oriented Techniques.Prentice Hall.
MYERS, B. A., BHATNAGAR, R., NICHOLS, J., PECK, C. H., KONG, D., MILLER, R., AND LONG, A. C. 2002.Interacting at a distance: Measuring the performance of laser pointers and other devices. InProceedings of the SIGCHI Conference on Human Factors in Computing Systems (CHI’02).
MYNATT, E. D., IGARASHI, T., EDWARDS, W. K., AND LAMARCA, A. 1999. Flatland: new dimensions inoffice whiteboards. In Proceedings of the SIGCHI Conference on Human Factors in ComputingSystems (CHI’99). 346–353.
ACM Transactions on Computer-Human Interaction, Vol. 17, No. 2, Article 9, Publication date: May 2010.
9:42 • G. Apitz et al.
PEDERSON, E. R., MCCALL, K., MORAN, T. P., AND HALAS, F. G. 1993. Tivoli: an electronic white-board for informal workgroup meetings. In Proceedings of the Conference on Human Factors inComputing Systems (INTERCHI’93). IOS Press, Amsterdam, Netherlands, 391–8.
PERLIN, K. 1998. Quikwriting: continuous stylus-based text entry. In Proceedings of the ACMSymposium on User Interface Software and Technology (UIST’98). ACM Press, New York, NY,215–216.
POOK, S., LECOLINET, E., VAYSSEIX, G., AND BARILLOT, E. 2000. Control menus: excecution and controlin a single interactor. In Proceedings of the SIGCHI Conference on Human Factors in ComputingSystems (Extended Abstracts) (CHI’00). ACM Press, New York, NY, 263–264.
POULTON, E. C. AND FREEMAN, P. 1966. Unwanted asymmetrical transfer effects with balancedexperimental designs. Psych. Bull. 66, 1, 1–8.
POUPYREV, I. AND MARUYAMA, S. 2003. Tactile interfaces for small touch screens. In Proceedingsof the ACM Symposium on User Interface Software and Technology (UIST’03). ACM Press, NewYork, NY, 217–220.
RAMOS, G. AND BALAKRISHNAN, R. 2003. Fluid interaction techniques for the control and annotationof digital video. In Proceedings of the ACM Symposium on User Interface Software and Technology(UIST’03). ACM Press, New York, NY, 105–114.
RASHEVSKY, N. 1959. Mathematical biophysics of automobile driving. Bull. Mathe. Biophys. 21,375–385.
REN, X. AND MORIYA, S. 2000. Improving selection performance on pen-based systems: a study ofpen-based interaction for selection tasks. ACM Trans. Comput.-Hum. Interac. 7, 3, 384–416.
SAUND, E., FLEET, D., LARNER, D., AND MAHONEY, J. 2003. Perceptually-supported image editingof text and graphics. In Proceedings of the ACM Symposium on User Interface Software andTechnology (UIST’03). 183–192.
SCHMIDT, R. A., ZELAZNIK, H. N., HAWKINS, B., AND FRANK, J. S. 1979. Motor output variability: Atheory for the accuracy of rapid motor acts. Psych. Rev. 86, 415–51.
VIVIANI, P. AND TERZUOLO, C. A. 1982. Trajectory determines movement dynamics. Neuroscience 7,431–437.
WALKER, N., MILLIANS, J., AND WORDEN, A. 1996. Mouse gain functions and cursor positioning:performance of older computer user. In Proceedings of the Annual Meeting of the Human Factorsand Ergonomics Society.
WALKER, N., PHILBIN, D., AND FISK, A. 1997. Age-related differences in movement control: adjustingsubmovement structure to optimize performance. J. Gerontol. Series B: Psych. Sci. Soc. Sci. 52, 1,40–52.
WINOGRAD, T. AND GUIMBRETIERE, F. 1999. Visual instruments for an interactive mural. In Proceed-ings of the SIGCHI Conference on Human Factors in Computing Systems (Extended Abstracts)(CHI’99). ACM Press, New York, NY, 234–235.
ZHAI, S. 2004. Characterizing computer input with fitts’ law parameters? the information andnon-information aspects of pointing. Int. J. Hum.-Comput. Stud. 61, 6, 791–809.
ZHAI, S. AND KRISTENSSON, P.-O. 2003. Shorthand writing on stylus keyboard. In Proceedings ofthe SIGCHI Conference on Human Factors in Computing Systems (CHI’03). ACM Press, NewYork, NY, 97–104.
Received March 2006; revised January 2009; accepted May 2009 by Wendy Mackay
ACM Transactions on Computer-Human Interaction, Vol. 17, No. 2, Article 9, Publication date: May 2010.