Embed Size (px)
Citation preview
General rights Copyright and moral rights for the publications made accessible in the public portal are retained by the authors and/or other copyright owners and it is a condition of accessing publications that users recognise and abide by the legal requirements associated with these rights.
Users may download and print one copy of any publication from the public portal for the purpose of private study or research.
You may not further distribute the material or use it for any profit-making activity or commercial gain
You may freely distribute the URL identifying the publication in the public portal If you believe that this document breaches copyright please contact us providing details, and we will remove access to the work immediately and investigate your claim.
Downloaded from orbit.dtu.dk on: Dec 10, 2021
Four decades of functional community change reveals gradual trends and lowinterlinkage across trophic groups in a large marine ecosystem
Törnroos, Anna; Pécuchet, Lauréne; Olsson, Jens; Gårdmark, Anna; Blomqvist, Mats; Lindegren, Martin; Bonsdorff, Erik
Published in:Global Change Biology
Link to article, DOI:10.1111/gcb.14552
Publication date:2019
Document VersionPeer reviewed version
Link back to DTU Orbit
Citation (APA):Törnroos, A., Pécuchet, L., Olsson, J., Gårdmark, A., Blomqvist, M., Lindegren, M., & Bonsdorff, E. (2019). Fourdecades of functional community change reveals gradual trends and low interlinkage across trophic groups in alarge marine ecosystem. Global Change Biology, 25(4), 1235-1246. https://doi.org/10.1111/gcb.14552
Acc
epte
d A
rtic
le
This article has been accepted for publication and undergone full peer review but has not
been through the copyediting, typesetting, pagination and proofreading process, which may
lead to differences between this version and the Version of Record. Please cite this article as
doi: 10.1111/gcb.14552
This article is protected by copyright. All rights reserved.
DR. ANNA TÖRNROOS (Orcid ID : 0000-0002-5790-2449)
PROF. ANNA GÅRDMARK (Orcid ID : 0000-0003-1803-0622)
DR. MARTIN LINDEGREN (Orcid ID : 0000-0002-9185-951X)
Article type : Primary Research Articles
Title: Four decades of functional community change reveals gradual trends and low
interlinkage across trophic groups in a large marine ecosystem
Running head: Long-term functional community change
Authors: Törnroos Anna1,3*, Pecuchet Laurene1,3, Olsson Jens2, Gårdmark Anna2, Blomqvist
Mats4, Lindegren Martin3, Bonsdorff Erik1
Author affiliation:
(1) Åbo Akademi University, Environmental and Marine Biology, Finland
(2) Swedish University of Agricultural Sciences, Dept. of Aquatic Resources, Skolgatan 6, SE-
74242 Öregrund, Sweden
(3) Centre for Ocean Life, DTU-Aqua, Denmark
(4) Hafok AB, Sweden.
*Corresponding author, email: [email protected], phone: +45 26 82 45 55
Acc
epte
d A
rtic
le
This article is protected by copyright. All rights reserved.
Keywords: temporal change, functional diversity, functional turnover, trait-based approach,
multifunctionality, community dynamics, coastal ecosystem, fish, zoobenthos, Baltic Sea.
Paper type: Primary Research
ABSTRACT
The rate at which biological diversity is altered on both land and in the sea, makes temporal
community development a critical and fundamental part of understanding global change. With
advancements in trait-based approaches, the focus on the impact of temporal change has shifted
towards its potential effects on the functioning of the ecosystems. Our mechanistic
understanding of and ability to predict community change is still impeded by the lack of
knowledge in long-term functional dynamics that span several trophic levels. To address this,
we assessed species richness and multiple dimensions of functional diversity and -dynamics of
two interacting key organism groups in the marine food web: fish and zoobenthos. We utilised
unique time series-data spanning four decades, from three environmentally distinct coastal
areas in the Baltic Sea, and assembled trait information on six traits per organism group
covering aspects of feeding, living habit, reproduction and life-history. We identified gradual
long-term trends, rather than abrupt changes in functional diversity (trait richness, evenness,
dispersion) trait turnover, and overall multi-trait community composition. The linkage between
fish and zoobenthic functional community change, in terms of correlation in long-term trends,
was weak, with timing of changes being area and trophic group specific. Developments of fish
and zoobenthos traits, particularly size (increase in small size for both groups) and feeding
habits (e.g. increase in generalist feeding for fish and scavenging or predation for zoobenthos),
suggest changes in trophic pathways. We summarise our findings by highlighting three key
aspects for understanding functional change across trophic groups: 1) decoupling of species
Acc
epte
d A
rtic
le
This article is protected by copyright. All rights reserved.
from trait richness, 2) decoupling of richness from density, and 3) determining of turnover and
multi-trait dynamics. We therefore argue for quantifying change in multiple functional
measures to help assessments of biodiversity change move beyond taxonomy and single trophic
groups.
INTRODUCTION
Ecosystems worldwide are exposed to a range of natural and human-induced pressures,
including climate change, overexploitation and habitat alteration (Hooper et al. 2005,
Cardinale et al. 2012, Halpern et al. 2015). These pressures alter biological diversity through
regional species extinctions and invasions, as well as dominance- and density (abundance
and/or biomass) shifts within communities, highlighting the importance of temporal
community adaptation as a fundamental part of global change (Hooper et al. 2005).
Furthermore, changes in biodiversity raise concerns about the effects on ecosystem
functioning and the provisioning of ecosystem services essential for human well-being (MEA
2005, Hooper et al. 2005, Cardinale et al. 2012).
Our understanding of biodiversity change at community- and ecosystem level has improved
by including functional characteristics or traits as measures of diversity (Diaz & Cabido
2001). A trait is defined as any morphological, physiological, behavioural or life history
characteristic affecting individual fitness and performance and can be either continuous (e.g.
body size) or discrete (e.g. epifaunal- or infaunal-living habit) (Diaz & Cabido 2001, Violle
et al. 2007, Laliberté & Legendre 2010). The shift towards trait-based approaches has
generated quantitative measures that integrate multiple traits into single continuous indices,
which allow for assessing multiple facets of functional change, such as richness, dominance
(i.e. evenness) and dispersion (i.e. variation) of traits (Villeger et al. 2008, Laliberté &
Acc
epte
d A
rtic
le
This article is protected by copyright. All rights reserved.
Legendre 2010, Gagic et al. 2015). However, to understand functional changes over time
such indices are not enough, as they represent “snapshots in time” and do not encompass
community dynamics (Collins et al. 2008, Hallett et al. 2016). For example, although the
overall diversity within a community (α-diversity) is not changing consistently through time,
the rate of change in community composition (temporal β-diversity, or so-called turnover)
might (Dornelas et al. 2014). Calculations of functional trait turnover, the change in trait
composition between subsequent years, have mostly relied on measures applied to capture
temporal species-based presence/absence dissimilarities (Villegér et al. 2013, Hewitt et al.
2016). But the temporal change that a community experience is a result of changes in the
abundance or biomass of each species in the community (Schimadzu et al. 2016). Recent
developments for quantifying temporal taxonomic community turnover could also be fruitful
for progressing assessments of functional trait turnover, as they encompass both identity and
density on a community level (Schimadzu et al. 2015, Hallett et al. 2016, Hillebrand et al.
2018).
Our ability to mechanistically comprehend and predict functional changes and dynamics in
real-world ecosystems, despite recognising the significance of them (Hillebrand &
Matthiassen 2009), are still impeded by several aspects. First, the focus on single trophic
levels or specific organism groups restricts us from scaling up to encompass entire food webs
and generalising across ecosystems (Thebault and Loreau 2003, Reiss et al. 2009). Only few
studies have quantified temporal changes in both marine prey- and consumer diversity
(Katano et al. 2015), and fewer still in natural marine ecosystems (Englund et al. 2008,
Olsson et al. 2013, Nordström et al. 2015). Second, adequately long time series, spanning
several decades, are required to observe community and ecosystem change but are
unfortunately often unavailable (Koslow & Courture 2015). Thus, our understanding of long-
Acc
epte
d A
rtic
le
This article is protected by copyright. All rights reserved.
term functional community change is far from complete. Here we address this knowledge
gap, with the aim of assessing long-term functional (trait) changes and potential couplings
between two key interacting trophic groups in the marine food web, namely fish and
zoobenthos. We use unique long-term quantitative data sets of fish and zoobenthos from
three different coastal areas in the Baltic Sea (HELCOM 2017), one of the world’s most
heavily exploited Large Marine Ecosystems (Sherman and Hempel 2008) and Marine
Ecoregions (Spalding et al. 2007). This ecosystem is known to be spatially and temporally
variable, with a decrease in taxonomic and functional richness following a salinity gradient
(Ojaveer et al. 2010, Törnroos et al. 2015, Griffiths et al. 2017). It thereby provides an ideal
model system for assessing long-term trends in functional diversity and dynamics within
organism and trophic groups such as fish and zoobenthos. Given the predator-prey
relationship and that the groups respond to similar local environmental drivers (Olsson et al.
2012, 2013), we explore the hypothesis that the functional community developments of fish
and zoobenthos are interlinked, or related to each other, with some time-lag. Thus, we expect
a relationship between the trends in diversity (species richness, trait richness, evenness and
dispersion) and dynamics (trait turnover and multi-trait composition) of the two groups. More
specifically we ask 1) Are there long-term changes in functional diversity and dynamics of
marine fish and zoobenthos communities? and 2) Do functional changes in zoobenthos
communities correspond to functional changes in the fish community?
MATERIALS AND METHODS
Community data
To illustrate the pronounced, natural gradient in biodiversity, and environmental
characteristics of the Baltic Sea from south to north (Griffiths et al. 2017, SuppInfo A: Table S1,
Table S2), three coastal areas: Vendelsö (hereafter “Kattegat”, 57 º 13’N; 12º 04E), Kvädofjärden
Acc
epte
d A
rtic
le
This article is protected by copyright. All rights reserved.
(hereafter “Baltic Proper” 58 º 01’N;16 º 46’E) and Forsmark (hereafter “Bothnian Sea”, 60º
26’N; 18º 09’E), with comparable long-term data series were chosen for the analysis (Olsson et
al. 2012, 2013). Although we hereafter refer to the common and larger-scale geographical
names for the areas (Kattegat, Baltic Proper and Bothnian Sea), the data is primarily
representative for the coastal parts of the basins. All three areas are used as monitoring
reference areas by the Swedish coastal monitoring programs, meaning e.g. bottom trawling has
not been allowed and other human pressures have been kept to a minimum (HELCOM 1996,
Bryhn et al. 2017, Sundqvist et al. 2017. The fish and zoobenthos sampling sites are located in
close proximity of each other (<5km), and thus trophic interactions between fish and benthos
are possible in each area (SuppInfo A: Table S1, Table S2).
Fish data (average catch in number of individuals per unit effort [net-1 night-1], CPUE, per
species per year), collected by the Department of Aquatic Resources at the Swedish University
of Agricultural Sciences (SLU), covered the time period 1976-2013 for Kattegat, 1971-2013 for
the Baltic Proper, and 1975-2013 for the Bothnian Sea, with just three years of missing data
overall (SuppInfo A: Table S1). Zoobenthic data (average number of individuals m-2 per taxa per
year of soft-bottom macrofauna) for the Bothnian Sea and the Baltic Proper were sampled by
SLU, while data for Kattegat was acquired from the Swedish Meteorological and Hydrological
Institute (SMHI). Zoobenthic data covered the time period 1972-2013 for Kattegat, 1980-2013
for the Baltic Proper, and 1976-2013 for the Bothnian Sea, with in total only five sampling-years
missing (SuppInfo A: Table S1). Both fish and zoobenthos taxa with a frequency of occurrence less
than 5%, i.e. occurring only once or twice, and not in consecutive years, over the entire 40-year time
period, were excluded from the analyses as they were not considered as an established species in the
area. In addition, for zoobenthos, all taxa contributing to in total at least 96 % of the abundance per
area were included. As the sampling gear do not catch all species in the area, the term “community”
Acc
epte
d A
rtic
le
This article is protected by copyright. All rights reserved.
used refers to the sampled part of the community for both fish and zoobenthos. All data were ln-
transformed to improve statistical normality.
Trait information
Six overall traits were used for fish and zoobenthos, respectively, to objectively assess changes
in functional diversity and trait dynamics over time (SuppInfo A: Table S3). These traits
represent aspects related to feeding (e.g. diet, feeding mode and size), reproduction (e.g.
reproductive frequency and type of development and egg type), population turnover (lifespan)
and habitat affinity (environmental position). These traits summarise the ecological niche of the
species and provide insight into the processes governing shifts in community structure. Trait
information for fish was obtained from Fishbase (Froese & Pauly 2012) and Pecuchet et al.
(2016). Zoobenthic trait information was obtained from Törnroos et al. (2015) and MARLIN
(http://www.marlin.ac.uk/biotic/), supplemented with peer-reviewed sources (collected in
Garcia 2010), and to a minor extent by expert judgement (Törnroos, Pecuchet pers. comm.). To
harmonise across different trait types, as well as level of trait knowledge across fish and
zoobenthos, we used traits in a discrete way (i.e. divided traits into categories/modalities). For
traits with multiple categories, such as diet, we adopted the fuzzy coding approach (Chevenet et
al. 1994), which meant that an affinity of a species to a trait was one if the species express only
one category, or a fraction of one if expressing several categories (Törnroos & Bonsdorff 2012).
Calculating richness and diversity
We calculated the traditional species (taxon) richness (SRic) and three complementary multi-
trait functional indices: trait richness (TRic), functional evenness (FEve) and functional
dispersion (FDis) (Schleuter et al. 2010, Laliberté et al. 2014). Trait richness describes the total
number of trait categories expressed in the community for each year, while functional evenness
Acc
epte
d A
rtic
le
This article is protected by copyright. All rights reserved.
informs on the density distribution among traits, and functional dispersion on the trait
variability, or the spread of species and their density in trait space (Laliberte´& Legendre 2010,
Mouillot et al. 2013). Higher functional evenness in a community means that density is more
evenly distributed between trait categories (less dominance of certain traits), while a higher
functional dispersion indicate that the community encompass differing densities of trait-wise
dissimilar species (Laliberté & Legendre 2010, Mouillot et al. 2013). Thus, the latter two
account for density differences between taxa in the community (SuppInfo B: Fig. S1). The reason
for using all three measures is that in combination, the indices describe key complementary
dimensions of functional (trait) diversity (Schleuter et al. 2010, Laliberté & Legendre 2010,
Mouillot et al. 2013, Laliberté et al. 2014). In addition to this, the indices differ in how rapidly
they inform on a change or disturbance, with the density-weighted indices revealing impacts
faster than trait richness (Chapin et al. 2000, Mouillot et al. 2013). The reason for this is that the
driver of community change is often not strong enough to filter out specific traits right away,
but generate significant differences in density (Boersma et al. 2016, Valdivia et al. 2017). Since
the traits used are discrete, all trait-based distance matrices used to calculate functional
evenness and dispersion were calculated using Gower distances with Podani´s extension
(Podani & Schmera 2006).
Determining functional turnover and compositional changes
In addition to the aggregated biodiversity measures, we determined functional community
(trait) turnover (Fturn) and multi-trait dynamics. These analyses were performed per group
and area on community weighted mean (CWM) traits (Laliberté et al. 2014), which were
obtained by combining traits scores with the density of individuals. To estimate community
trait turnover, we relied on the approach by Hallett et al. (2016), but instead of using taxonomic
data and calculating turnover between all points in the time series, we applied the approach on
the CWM trait data sets and calculated Euclidean distance between subsequent years, across the
Acc
epte
d A
rtic
le
This article is protected by copyright. All rights reserved.
time series. This allowed us to estimate turnover that incorporated changes both in trait
identity and density distribution from one year to the next. To obtain a measure of overall trait
compositional changes, we conducted Dynamic Factor Analysis (DFA) on each CWM trait
dataset (Holmes et al. 2018). DFA is a multivariate time-series technique especially designed for
finding common trends in a set of time series (Zuur et al. 2003). The advantage of DFA
compared to other dimension-reduction techniques like Principal Component Analysis (PCA),
that are often applied on ecological time-series (Planque & Arneberg 2017), is that the temporal
aspect (autocorrelation, stationarity) is explicitly taken into consideration (Zuur et al. 2003).
For each CWM dataset (SuppInfo B: Fig. S2), we tested different models containing from one to
three trends and three different variance-covariance matrices. The best model was selected
based on Akaike´s information criterion (AIC), which proved to contain three common trends
and an equal variance and covariance matrix. This approach allowed us to summarise multi-
trait compositional changes by capturing the most important temporal dynamics in the trends,
here only the first (T1) and the second (T2) are shown for clarity. For each trend, the loadings
were also visualised (SuppInfo B: Fig. S3).
Quantifying and comparing long-term patterns
To quantify long-term changes in diversity, we modelled the overall temporal trend in richness,
the aggregate functional diversity indices, and the multi-trait compositional changes (turnover,
scores along T1 and T2, and individual CWM trait values). We fitted linear regressions on each
measure, for each group and area separately, with year as a single predictor using either linear
(Oksanen et al. 2015) or generalized least squares with a correlation structure (Gls, AR1;
Pinheiro & Bates 2000) that accounts for temporal autocorrelation (Pinheiro et al. 2018). The
best model (including or excluding autocorrelation) was selected based on the AIC criterion
(Bartón 2018). In order to compare temporal dynamics of functional measures of fish and
zoobenthos, we performed Pearson’s paired-sample correlation analysis between the two
Acc
epte
d A
rtic
le
This article is protected by copyright. All rights reserved.
trophic groups for each measure and area. To account for potential lagged responses between
prey and predators, correlations between the measures of fish and of benthos was tested both
with and without -1 year time lag for each group. However, since lagging did not improve the
correlations, all results presented are non-lagged.
As a complement to the linear regression analysis and the correlation between groups, we also
tested for potential non-linear (step-wise) shifts in the trophic groups and assessed timing of
statistically relevant changes in each measure using change-point analysis (Killick and Eckley
2014). We determine change-points in time, related to shifted mean and variance in the time
series using the binary segmentation method with a Bayesian information criterion (BIC) as
penalty criteria (Killick and Eckley 2014). We identified both the gross change-point of a time-
series (i.e. the one point in time where the index shift to a higher or a lower state, possible
number of change-points Q restricted to one) and the detailed variability, i.e. maximum number
of points identified. Missing values were replaced by the average of the neighbouring two years.
Assessing development in this way also allowed for comparison between groups and a
reference to previously identified significant time periods of change in taxonomically-based
measures (Olsson et al. 2012, 2013).
All analyses described are conducted in the R environment (R Core Team 2017).
Acc
epte
d A
rtic
le
This article is protected by copyright. All rights reserved.
RESULTS
Long-term trends in richness and diversity
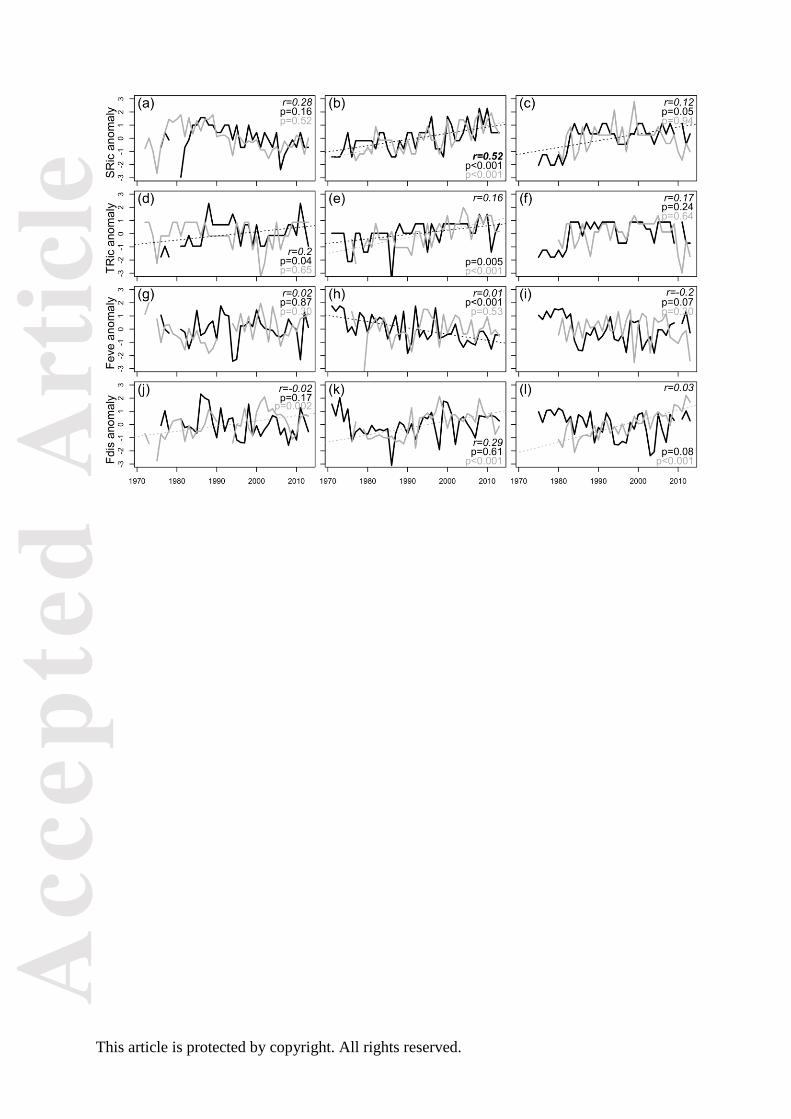
Over the roughly 40 years, fish species richness increased significantly in the Baltic Proper
(p<0.001) and Bothnian Sea (p=0.05), while no linear change was found in Kattegat (Fig. 1a- c).
Species richness of zoobenthos only increased significantly in the Baltic Proper (Fig. 1b). Trait
richness of fish increased over time both in the Kattegat and in the Baltic Proper, while trait
richness of zoobenthos increased only in the Baltic Proper (Fig. 1d-f).
The density-weighted trait evenness changed significantly (p<0.001) in the Baltic Proper fish
community, which became more uneven over time (Fig. 2g-i). Changes in functional dispersion
was only observed for zoobenthos where an increase (p<0.001) was found in all areas, hence,
indicating a change over time of the abundant zoobenthic taxa in trait space (Fig. 1j,k).
The change-point analysis identified changes for fish prior to and in the early 1980s in all areas
and diversity indices, except for functional dispersion in the Baltic Proper, for which a shift in
2007 was identified (SuppInfo A: Table S4). The changes in the zoobenthic communities were
more variable between indices, and often displayed a spatial gradient in timing of changes, from
earlier in Kattegat (late 1970s and early/mid 1990s), to later in the Baltic Proper (early and late
2000s) and the Bothnian Sea (late 1990s and 2000s) (SuppInfo A: Table S4)
Fig. 1. Long-term trends in taxonomic and functional diversity indices. Species- (a-c) and trait
richness (d-f), functional evenness (g-i) and functional dispersion (j-l) of fish (black) and
zoobenthos (grey) in Kattegat (left), Baltic Proper (middle) and the Bothnian Sea (right). To
facilitate a comparison between fish and benthos the time-series are shown as anomalies (zero
Acc
epte
d A
rtic
le
This article is protected by copyright. All rights reserved.
mean and unit variance). Correlation coefficients between indices for fish and zoobenthos as
well as p-values for linear trends are found in the top (or bottom) right corner of each panel.
Significant correlations are indicated in bold and significant trends with dashed lines.
Temporal dynamics: functional turnover and compositional changes
Turnover of traits decreased significantly in the Baltic Proper fish community (p<0.05), while an
increase in turnover was found in both the Kattegat (p<0.001) and Bothnian Sea (p<0.01)
zoobenthic communities (Fig. 2a-c). The rate of change (intercept) in overall turnover was
fastest in the northernmost area, the Bothnian Sea (Fig. 2c).
Significant linear changes in the multi-trait composition (T1 and/or T2) occurred in all areas
but were group specific (Fig. 2d-i). For fish, an increasing overall compositional change
occurred in Kattegat (p<0.05) and the Baltic Proper (p<0.05) (Fig. 2g,e). In the Kattegat fish
community, these changes were accompanied by trait-specific increases in especially small size
(10-20cm) and a generalist feeding habit (SuppInfo A: Table S5). Trait compositional changes in
zoobenthos increased in Kattegat (p<0.05) and decreased in the Bothnian Sea (p<0.01) (Fig.
2g,i). The increasing trend in Kattegat featured, similarly to the change in the fish community,
an increase in small body size (0-10 mm), a scavenging feeding and an epibenthic-living habit
(SuppInfo A: Table S5). The linear decrease in the Bothnian Sea zoobenthos was attributed to
decreases in infaunal-living and deposit-feeding habits, but also increases in categories such as
epibenthic-living and predator-feeding habits (SuppInfo A: Table S5).

Acc
epte
d A
rtic
le
This article is protected by copyright. All rights reserved.
Fig. 2. Changes in turnover and functional composition over time. Functional community
turnover (a-c) and temporal trends based on DFA on community-weighted trait values (CWM),
T1 (d-f) and T2 (g-i), for fish (black) and zoobenthos (grey) in Kattegat (left), the Baltic Proper
(middle) and the Bothnian Sea (right), respectively. Correlation coefficients between indices for
fish and zoobenthos as well as p-values for linear trends are found in the top (or bottom) right
corner of each panel. Significant correlations are indicated in bold and significant trends with
dashed lines.
Change-point analysis of turnover corresponded with the results for the diversity indices in that
shifts were found during the same time period within each group, particularly for the
zoobenthic communities (SuppInfo A: Table S4). Compared to the patterns for diversity indices,
change points in functional turnover occurred in the 1990s and 2000s, for both fish and
zoobenthos (except in the Bothnian Sea), rather than in the 1970s and 80s, as was found for the
diversity indices (SuppInfo A: Table S4).
Trophic group interlinkages in community change
Species richness of fish and zoobenthos showed positively correlated temporal dynamics in two
out of the three areas (Kattegat r=0.28, Baltic Proper r=0.52) (Fig. 1a,b). The functional
measures, on the other hand, displayed no temporal correlation or indication of linkage in
community change between the two trophic groups. For trait richness, there was low
correlation between the two groups in all areas (Fig. 1d-f). Neither were there any indication of
linkage between the trophic groups in functional evenness and dispersion (Fig. 1g-i). Functional
community turnover showed contrasting trends between fish and zoobenthos, with no
correlation in any of the areas (Fig. 2a-c). On the other hand, change-point analysis in Kattegat
showed coinciding changes in turnover for both fish and zoobenthos during the first part of the
Acc
epte
d A
rtic
le
This article is protected by copyright. All rights reserved.
1990s, while there was no correspondence between the groups in the other two areas
(SuppInfo A: Table S4). Different temporal dynamics of fish and zoobenthos were also evident in
the multi-trait compositional changes over time (Fig. 2d-i, SuppInfo B: Fig. S3). Only in Kattegat
did the first two time trends of benthos and fish correlate (T1 r=0.31, T2 r=0.38).
DISCUSSION
Long-term functional changes
By assessing long-term trends in functional diversity, as well as trait turnover and multi-trait
composition, we identified gradual changes and distinct temporal dynamics between fish and
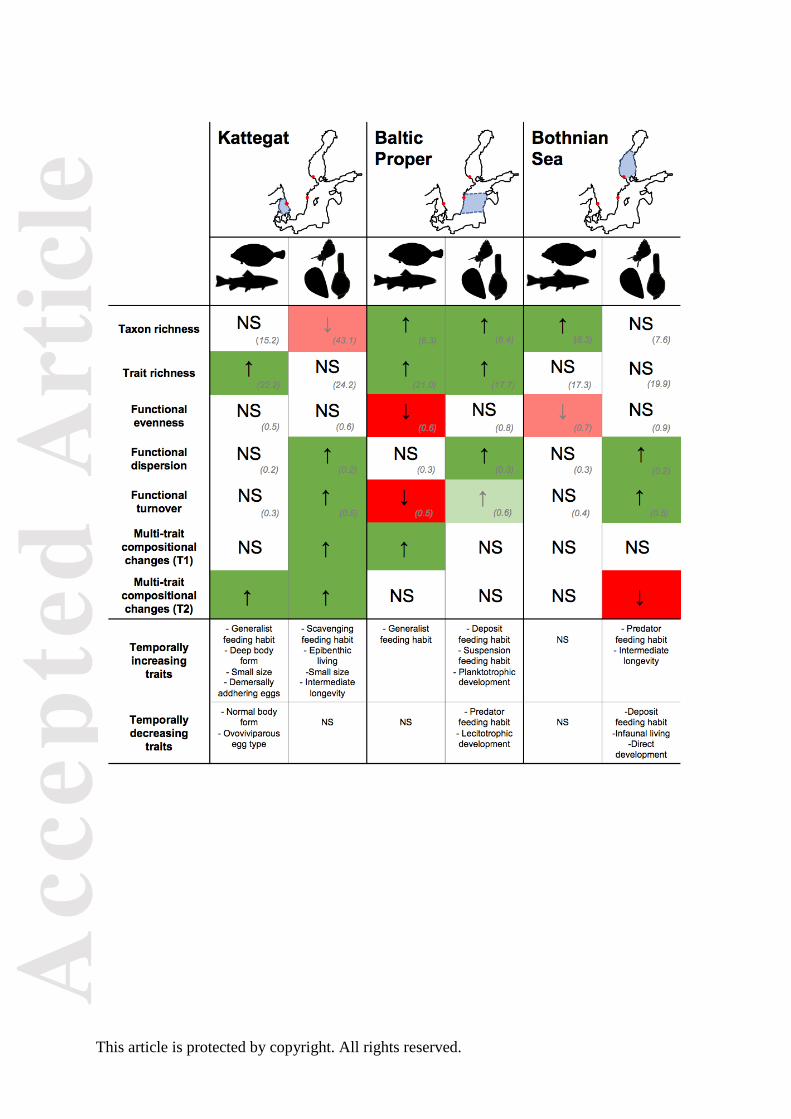
zoobenthos communities at three coastal sites in the Baltic Sea (Fig. 3). To our knowledge, this
is the first study comparing long-term trends and multi-decadal dynamics in multiple
dimensions of functional community change across trophic groups and areas. Previous trait-
based studies on long-term functional community change have focused on single organism
groups separately, either zoobenthos (Neumann & Kröncke 2011, Verissimo et al. 2012, Gogina
et al. 2014, Weigel et al. 2016) or fish (Baptista et al. 2015, Barcelo et al. 2016, Frelat et al. 2017,
Dencker et al. 2017), and particularly multi-trait compositional changes on local scale (Clare et
al. 2015, Frid & Caswell 2015).
Fig. 3. Summary of long-term changes in species richness, functional diversity, turnover and
multi-trait composition across two trophic groups and three subsystems in the Baltic Sea. Maps
show the three geographical areas with sampling area indicated in red. The data is primarily
representative of the coastal parts of the basins. Upward arrows (↑, bright green) indicate a
significant increase in a metric, while downward arrows (↓, bright red) indicate significant
decrease. Trends (grey ↑↓, pale green or pale red), linearly increasing and decreasing traits, and
non-significant changes (NS) are also given. Long-term averages for species and trait richness,
Acc
epte
d A
rtic
le
This article is protected by copyright. All rights reserved.
functional evenness and dispersion as well as functional community turnover are shown within
lower-case brackets.
In order to adequately predict and mitigate such long-term changes in biological assemblages,
and ultimately associated ecosystem services, it is essential to understand not only how changes
in species number, but also how shifts in density of organisms translates to potential functional
changes in the system (Dornelas et al. 2013, Gagic et al. 2015, Shimadzu et al. 2015, Hillebrand
et al. 2018). Our results highlight this by exemplifying and underlining the importance of
comparative, temporal assessments of different complementary measures (e.g. taxonomic vs.
functional, identity vs. density-based) across trophic groups, for understanding biodiversity and
functional change in a holistic way. More precisely, we need to know the mechanisms
underpinning the functional changes, i.e. whether changes are driven by the richness and
identity (key traits) and/or shifts in density of organisms (Hillebrand et al. 2018). These aspects
have been investigated theoretically and experimentally for both terrestrial and aquatic systems
(Cardinale et al. 2012, Morris et al. 2014), but rarely in comparison, empirically, over multi-
decadal time scales and across trophic levels, as we have done here. Our results specifically
highlight three key aspects for understanding long-term functional change and thereby the
added value of functional trait-based measures to traditional taxonomical ones. First, the results
show that changes in species richness may be decoupled from changes in trait richness. For
example, a significant increase in species richness but no significant change in trait richness was
observed for the Bothnian Sea fish community but vice versa in the Kattegat (Fig. 3). This
contrasting pattern may indicate opposite changes in functional community composition in the
two areas, potentially influencing their degree of functional redundancy (i.e., the number of
functionally similar species sharing a similar set of traits; Walker 1992) and resilience (i.e., their
capacity to recover from change; Holling 1973, Folke et al. 2004, Hillebrand et al. 2008). The
latter is a common measure of stability or the potential to remain within an ecosystem state
Acc
epte
d A
rtic
le
This article is protected by copyright. All rights reserved.
(Pimm 1984, McCann 2000). For the fish community in the Bothnian Sea, the increase in the
number of functionally similar species may serve to increase functional redundancy and
potentially also resilience as a community with more species is more likely to comprise species
with traits that allow rapid recovery (Nyström 2006, Hillebrand et al. 2008, Lindegren et al.
2016). While for the Kattegat fish community, the increase of trait-wise more dissimilar species
may have led to a decrease in functional redundancy and potentially its resilience. As loss in
resilience is difficult to detect until a community shifts to another state (Nyström 2006), a
change in the degree of resilience could potentially go unnoticed on a community level with few
indications of even sutble long-term functional trends in indices. Since the Kattegat ecosystem
has been suggested to have undergone a regime shift, based on taxonomic single species
assessments (Lindegren et al. 2012), the next steps would be to specifically investigate the link
between trait richness, redundancy and resilience for this system on a community level
(Carpenter et al. 2001, Lindegren et al. 2016, Bouska 2018). Secondly, our findings emphasise
that changes in trait richness can be decoupled from changes in density-weighted trait indices,
in the same way as with taxonomic-based indices (Hillebrand et al. 2018). This is important as
density-based indices are thought to respond more rapidly to changes than richness, and thus
might inform on ecosystem function before species disappear completely (Chapin et al. 2000,
Norberg 2004, Mouillot et al. 2013). In our study, the change in dominance of traits in the
community, rather than in the richness of expressed traits was more informative for
understanding what underpinned the functional change. This was particularly evident in the
zoobenthic community in Kattegat and Bothnian Sea, where significant long-term changes in
functional dispersion and multi-trait measures, essentially portraying shifts in the degree and
identity of dominant trait categories in trait space, were observed despite no significant change
in trait richness (Fig. 3). In turn, evenness, the direct complementary term to dominance, did
significantly only change in the Baltic Proper fish community. As the number of traits (and also
species in this case) increased over time, the frequency distribution of traits in the community
became more uneven, meaning dominance increased, potentially increasing community
Acc
epte
d A
rtic
le
This article is protected by copyright. All rights reserved.
resilience. Strong evidence from real-world ecosystems for the conceptual link between
evenness and resilience is lacking (Hillebrand et al. 2008), but experimental findings have
linked decreases in evenness, i.e. increases in dominance, to community-wide resilience in algal
microcosm communities (Steiner et al. 2006). Third, our results also show that an assessment of
dynamics, that is trait turnover and multi-trait compositional changes, in addition to the
functional indices, is of importance for understanding the potential rate of change and type of
functional change (identity of traits) that has occurred. Changes in trait composition have
proven valuable for informing on long-term changes in potential functioning in previous single
trophic group studies, for example in North Sea zoobenthic infauna (Clare et al. 2015) and
epifauna communities (Neumann & Kröncke 2011) or coastal fish assemblages (Barcelo et al.
2016). In this study, long-term changes in feeding habit and size where generally observed,
suggesting potential shifts in the benthic and pelagic energy pathway (SuppInfo A: Table S5),
specifically during certain time periods (SuppInfo B: Fig. S3). In particular, zoobenthic
communities showed increases in either epibenthic predation and scavenging, or infaunal
deposit- and suspension-feeding, representing different trophic pathways (Fig. 3). Thus, a
combination of non-weighted and density-weighted indices, as well as turnover is critical for
detection and mechanistic understanding of complex spatiotemporal functional community
changes. Disentangling such multiple dimensions of diversity and dynamics is therefore an
important step in any type of ecological assessment (Levin & Lubchenco 2008, Hillebrand et al.
2018).
Interlinkages across trophic groups
Individuals within the two trophic groups (fish and zoobenthos) have, in our case, had the
potential to interact directly, through predatory-prey and/or other non-trophic interactions
through time, although this remains to be specifically assessed. A large portion of the fish
community in the assembled data is benthivorous, or feeds on both zoobenthos and other fish
Acc
epte
d A
rtic
le
This article is protected by copyright. All rights reserved.
species, especially in the Kattegat and Baltic Proper (Suppl. Table 2). However, contrary to our
hypothesis, we did not observe any strong relationship between the functional development of
fish and zoobenthos communities, although similar trends were found for some biodiversity
indices (Fig. 3). This does not mean that trophic interactions do not influence functional
community composition and the aspects of food-web structure studied here, but that this was
not identifiable using such broad community-wide metrics. However, signs of functional
changes related to food-web interactions were observed in the measure of multi-trait
composition and individual trait changes. The similarity between fish and zoobenthos in
individual traits showing long-term changes, especially traits relating to size and feeding,
suggests that the functional aspects of the cross-trophic group linkages are worth investigating
further. This applies especially in an ecosystem such as the Baltic Sea, showing large spatial
variation in physicochemical and biological characteristics, as well as human impact (HELCOM
2010, 2017, Griffiths et al. 2017). The key environmental drivers affecting community
composition and food-web dynamics in the Baltic Sea are salinity, temperature and oxygen
(Leppäranta & Myrberg 2009, BACC II 2015, Lindegren et al. 2009, 2014, Pecuchet et al. 2016).
These drivers have been shown to affect also the taxonomic composition of coastal communities
in Kattegat (Rosenberg et al. 1995, Olsson et al. 2012), Baltic Proper (Olsson et al. 2012, 2013)
and Bothnian Sea (Olsson et al. 2012, 2013, Kuosa et al. 2017), but in different ways. Hence,
these drivers are primary candidates for affecting the temporal patterns in the functional
diversity indices of fish and zoobenthos presented here, and may also be reasons for the weak
relationship between the trends in fish and zoobenthos found. A future study focused on the
environmental linkage with particularly the density-based functional indices and multi-metric
measures of community dynamics that showed significant long-term changes is warranted.
This type of multi-trophic assessment of different facets of temporal community change is also
important for identifying, understanding and predicting larger ecosystem changes and
dynamics, such as potential regime shifts that propagate across food web compartments (Folke
Acc
epte
d A
rtic
le
This article is protected by copyright. All rights reserved.
et al. 2004, Spencer et al. 2011). In the Baltic Sea, studies on single species and taxonomic
community composition have demonstrated abrupt changes in coastal areas (Olsson et al. 2012,
2013) or regime shifts in the offshore ecosystem (Österblom et al. 2007, Möllmann et al. 2009,
Casini et al. 2012, Lindegren et al. 2012, Blenckner et al. 2015, Kuosa et al. 2017), suggesting
changes in the functioning of the system. In comparison, the long-term gradual (step-wise),
linear trends and the low functional interlinkage we found in this study, provide no evidence for
such abrupt changes in these coastal areas. This is in line with the study by Yletyinen et al.
(2016) that found remarkable similarities of both coastal and offshore empirical food webs
prior to and after the suggested Baltic Sea regime shift in 1980s. The coastal food webs
maintained the dominant species interactions and showed no major shift at a community level
despite changes in species composition (Yletyinen et al. 2016). These findings based on
complexity theory and network modelling were suggested to be caused by high connectivity and
absence of compartmentalisation in the food webs, providing little support for system-wide
regime shifts. It is plausible that these are also the underlying mechanisms in the coastal
communities studied here, reflected in maintenance of dominant traits (functional evenness)
and/or trait variability (functional dispersion), especially in the zoobenthic prey community,
which is then reflected in the gradual rather than abrupt changes in functional diversity and
community dynamics (Fig. 3). The link between long-term changes in functional diversity,
dynamics, and food web structure and abiotic drivers remains to be further explored, as these
are all measures that provide an indication of the adaptive capacity, resilience and stability of
the coastal assemblages and the ecosystem to future change.
To conclude, we have identified gradual long-term trends in functional diversity (trait richness,
evenness, dispersion), trait turnover, and overall multi-trait community composition spanning a
period of 40 years and two key trophic groups in three coastal marine areas. Although the
linkage between fish and zoobenthic functional community change was weak, with timing of
Acc
epte
d A
rtic
le
This article is protected by copyright. All rights reserved.
changes being area and trophic group specific, developments in specific fish and zoobenthos
community traits, particularly size and feeding habits, suggest changes in trophic pathways.
Apart from serving a baseline for functional change in the region and other coastal and
estuarine ecosystems worldwide, the results highlight the need for multiple measures and
cross-trophic level assessments to understand empirical functional (trait) change. Thereby, our
findings contribute to the general understanding of biodiversity change and can be useful for
developing predictions and models of community change.
ACKNOWLEDGMENTS
This work resulted from the BIO-C3 project and has received funding from BONUS, the joint
Baltic Sea research and development programme (Art 185), funded jointly from the European
Union’s Seventh Programme for research, technological development and demonstration and
from national funding institutions. AT and EB also acknowledge the support of the Åbo Akademi
University Foundation. ML acknowledge support from the VKR Center for Ocean Life and a
VILLUM fonden research grant (13159). LP has received funding from BONUS BLUEWEBS
project (Art 185). We are also grateful to all staff at SLU that was involved in collecting the data
that are used in the study. The authors declare no conflict of interest.
Acc
epte
d A
rtic
le
This article is protected by copyright. All rights reserved.
REFERENCES
BACC II Author Team (2015). Second Assessment of Climate Change for the Baltic Sea
Basin. Springer International Publishing, Switzerland.
Baptista, J., Martinho, F., Nyjtrai, D., Pardal, M. A., Dolbeth, M. (2015). Long-term functional
changes in an estuarine fish assemblage. Marine Pollution Bulletin, 97, 125-134.
Barcelo, C., Ciannelli, L., Olsen, E. M., Johannessen, T., Knutsen, H. (2016). Eight decades of
sampling reveal a contemporary novel fish assemblage in coastal nursery habitats. Global
Change Biology, 22, 1155-1167.
Bartón, K. (2018). MuMIn: Multi-Model Interface, https://CRAN.R-project.org/package=MuMIn
Bates, A. E., Pecl, G. T., Frusher, S., Hobday, A. J., Wernberg, T., Smale, D. A., Sunday, J. M., Hill, N.
A., Dulvy, N., K., Colwell, R. K., Holbrook, N. J., Fulton, E. A., Slawinski, D., Feng, M., Edgar, G. J.,
Radford, B. T., Thompson, P. A., Watson, A., R. (2014). Defining and observing stages of climate-
mediated range shifts in marine systems. Global Environmental Change, 26, 27-38.
Blenckner, T., Llope, M., Möllmann, C., Voss, R., Quaas, M.F., Casini, M., Lindegren, M., Folke, C.,
Stenseth, N.C. (2015). Climate and fishing steer ecosystem regeneration to uncertain economic
futures. Proceedings of the Royal Society B-Biological Sciences. 282: 20142809.
http://dx.doi.org/10.1098/rspb.2014.2809
Acc
epte
d A
rtic
le
This article is protected by copyright. All rights reserved.
Boersma, K.S., Dee, L.E., Miller, S.J., Bogan, M.T., Lytle, D.A., Gitelman, A.I. (2016). Linking
multidimensional functional diversity to quantitative methods: A graphical
hypothesis‐evaluation framework. Ecology, 97, 583–593.
Botta-Dukát, Z. (2005). Rao's quadratic entropy as a measure of functional diversity
based on multiple traits. Journal of Vegetation Science, 16, 533–540.
Bouska, K.L. (2018). Discontinuities and functional resilience of large river fish
assemblages. Ecosphere, 9, e02351
Bryhn, ., Fran e n, F., Jonsson, A-L., Lingman, A. (2017). Biologisk recipientkontroll vid
skarshamns ka rnkraftverk. rsrapport fo r 2016. Aqua reports 2017:4. Sveriges
lantbruksuniversitet, nstit tionen fo r akvatiska res rser, regr nd. 63 p.,
http://pub.epsilon.slu.se/
Cardinale, B. J., Duffy, E. J., Gonzalez, A., Hooper, D. U., Perrings, C., Venail, P., Narwani, A.,
Mace, G. M., Tilman, D., Wardle, D. A., Kinzig, A. P., Daily, G. C., Loreau, M., Grace, J. B.,
Larigauderie, A., Srivastava, D. S., Naeem, S. (2012). Biodiversity loss and its impact on
humanity. Nature, 486, 59-67.
Acc
epte
d A
rtic
le
This article is protected by copyright. All rights reserved.
Carpenter, S., Walker, B., Anderies, M., Abel, N. (2001). From Metaphor to Measurement:
Resilience of What to What? Ecosystems, 4, 765–781.
Casini, M., Blenckner, T., Möllmann, C., Gårdmark, A., Lindegren, M., Llope, M., Kornilovs, G.,
Plikshs, M., Stenseth, N.C. (2012). Predator transitory spillover induces trophic cascades in
ecological sinks. Proceedings of the National Academy of Sciences of the United States of America,
109:8185-8189.
Chapin, F.S., Zavaleta, E.S., Eviner, V.T., Naylor, R.L., Vitousek, P.M., Reynolds, H.L., Hooper, D.U.,
Lavorel, S., Sala, O.E., Hobbie, S.E., Mack, M.C., Diaz, S. (2000). Consequences of changing
biodiversity. Nature, 405, 234–242.
Chevenet, F., Doledec, S., Chessel. D. (1994). A fuzzy coding approach for the analysis of long-
term ecological data. Freshwater Biology, 43, 277–296.
Clare, D. S., Robinson, L. A., Frid, C. L. J. (2015). Community variability and ecological
functioning: 40 years of change in the North Sea benthos. Marine Environmental Research, 107,
24-34.
Collins, S.L., Suding, K.N., Cleland, E.E., Batty,M.,Pennings, S.C.,Gross,K.L.
et al. (2008) Rank clocks and plant community dynamics. Ecology, 89, 3534–3541.
Acc
epte
d A
rtic
le
This article is protected by copyright. All rights reserved.
Dencker, T., Beukhof, E., Pecuchet, L., Richardson, K., Payne, M., Lindegren, M. (2017)
Temporal and spatial differences between taxonomic and trait biodiversity in a large marine
ecosystem: causes and consequences. PLoS ONE. 12(12): e0189731.
https://doi.org/10.1371/journal.pone.0189731
Diaz, S., Cabido, M. (2001). Vive la différence: plant functional diversity matters to ecosystem
processes. Trends in Ecology and Evolution, 16, 646-655.
Dornelas, M., Magurran, A. E., Buckland, S. T., Chao, A., Chazdon, R. L., Colwell, R. K.,
Curtis, T., Gaston, K. J., Gotelli, N. J., Kosnik, M.A., McGill, B., McCune, J. L., Morlon, H., Mumby, P. J.,
Øvreås, L., Studeny, A., Vellend, M. (2013). Quantifying
temporal change in biodiversity: challenges and opportunities. Proceedings of the Royal Society
B Series, 280, 20121931.
Englund, G., Rydberg, C., Leonardsson, K. (2008). Long-term variation of link strength in a
simple benthic food web. Journal of Animal Ecology, 77, 883-890.
Folke, C., Carpenter, S., Walker, B., Schefffer, M., Elmqvist, T., Gunderson, L., Holling, C.
S. (2004). Regime shifts, resilience and biodiversity in ecosystem management. Annual
Review of Ecology, Evolution and Systematics, 35, 557-581.
Frelat, R., Lindegren, M., Denker, T.S., Floeter, J., Fock, H.O., Sguotti, C, et al. (2017)
Community ecology in 3D: Tensor decomposition reveals spatio-temporal dynamics of large
Acc
epte
d A
rtic
le
This article is protected by copyright. All rights reserved.
ecological communities. PLoS ONE 12(11): e0188205.
Frid, C. L. J., Caswell B. A. (2015). Is long-term ecological functioning stable: The case of
the marine benthos? Journal of Sea Research, 94, 15-23.
Froese, R., Pauly, D. (eds) (2012). FishBase. www.fishbase.ca
Gagic, V., Bartomeus, I., Jonsson, T., Taylor, A., Winqvist, C., Fischer, C., Slade, E. M., Steffan-
Dewenter, I., Emmerson, M., Potts, S. G., Tscharntke, T., Weisser, W., Bommarco, R. (2015).
Functional identity and diversity of animals predict ecosystem functioning better than species-
based indices. Proceedings of the Royal Society B Series, 282, 26-20.
Garcia, C. (2010). Approche fonctionnelles des communautés benthiques du bassin oriental de
la Manche et du sud de la mer du Nord. Ph.D Thesis. Université de Lille. 1-351.
Gogina, M.A., Darr, A., Zettler, M.L. (2014). Approach to assess con- sequences of hypoxia
disturbance events for benthic ecosystem func- tioning. Journal of Marine Systems, 129, 203–
213.
Griffiths, J. R., Kadin, M., Nascimento, F. J. A., Tamelander, T. Törnroos A., Bonaglia, S.,
Bonsdorff, E., Brüchert, V., Gårdmark, A., Järnström, M., Kotta, J., Lindegren, M.,
Nordström, M.C., Norkko, A., Olsson, J., Weigel, B., Žydelis, R., Blenckner, T., Niiranen, S.,
Acc
epte
d A
rtic
le
This article is protected by copyright. All rights reserved.
Winder, M. (2017). The importance of benthic-pelagic coupling for marine ecosystem
functioning in a changing world. Global Change Biology, 23, 2179-2196.
Hallett, L. M., Jones, S. K., Andrew, A., MacDonald, M., Jones, B., M., Flynn, D. F. B., Ripplinger, J.,
Slaughter, P., Gries, G., Collins S. L. (2016). CODYN: AnR package of community dynamics
metrics. Methods in Ecology and Evolution, 7, 1146–115.
Halpern, B. S., Frazier, M., Potapenko, J., Casey, K. S., Koenig, K., Longo, C., Lowndes,
J. S., Cotton Rockwood, R., Selig, E. R., Selkoe K. A., Walbridge, S. (2015). Spatial and
temporal changes in cumulative human impacts on the world’s ocean. Nature
Communications, 6, 7615.
HELCOM, (1996). Third Periodic Assessment of the State of the Marine Environment of the
Baltic Sea, 1989–1993; Background Document. Baltic Sea Environment Proceedings, No 64B.
HELCOM, (2010). Ecosystem Health of the Baltic Sea 2003–2007: HELCOM Initial Holistic
Assessment. Baltic Sea Environmental Proceedings, No., 122.
HELCOM, (2017). First version of the ‘State of the Baltic Sea’ report – June 2017 – to be updated
in 2018. Available at: http://stateofthebalticsea.helcom.fi
Acc
epte
d A
rtic
le
This article is protected by copyright. All rights reserved.
Hewitt, J. E., Norkko, J., Kauppi, L., Villnäs, A., Norkko, A. (2016) Species and functional trait
turnover in response to broad‐scale change and an invasive species. Ecosphere, 7, e01289.
Hillebrand, H., Bennett, D.M., Cadotte, M.W. (2008). Consequences of dominance: a review of
evenness effects on local and regional ecosystem processes. Ecology, 86, 1510-1520.
Hillebrand, H., Matthiessen, B. (2009). Biodiversity in a complex world: consolidation and
progress in functional biodiversity research. Ecology Letters, 12, 1405-1419.
Hillebrand, H., Blasius, B., Borer, E. T., Chase, J. M., Downing, J. A., Klemens Eriksson, B., Filstrup,
C. T., Harpoles, S. W., Hodapp, D., Larsen, S., Lewandowska, A. M., Seabloom, E. W., Van de Waal,
D. B., Ryabov, A. B. (2018). Biodiversity change is uncoupled from species richness trends:
Consequences for conservation and monitoring. Journal of Applied Ecology, 55, 169-184.
Holling, C.S. (1973). Resilience and stability of ecological systems. Annual Review of Ecology and
Systematics, 4, 1–23.
Holmes, E., Ward, E., Wills, K. (2018). MARSS: Multivariate Autoregressive State-Space Modeling.
R package version 3.10.8.
Hooper, D. U., Chapin III, F. S., Ewel, J. J., Hector, A., Inchausti, P., Lavorel, S., Lawton, J.
H., Lodge, D. M., Loreau, M., Naeem, S., Schmid, B., Setälä, H., Symstad, A. J.,
Acc
epte
d A
rtic
le
This article is protected by copyright. All rights reserved.
Vandermeer, J., Wardle, D. A. (2005). Effects of biodiversity on ecosystem functioning a
consensus of current knowledge. Ecological Monographs, 75, 3–35.
Katano, I., Doi, H., Eriksson, B. K. and Hillebrand, H. (2015). A cross-system meta-analysis
reveals coupled predation effects on prey biomass and diversity. Oikos, 124, 1427-1435
Koslow, J. A., Couture, J. (2015). Pacific Ocean observation program: gaps in ecological time
series. Marine Policy, 51, 408-414.
Kuosa, H., Fleming-Lehtinen, V., Lehtinen, S., Lehtiniemi, M., Nygård, H., Raateoja, M., Riataniemi,
J., Tuimala, J., Uusitalo, L., Suikkanen, S. (2017). A retrospective view of the development of the
Gulf of Bothnia ecosystem. Journal of Marine Systems, 167, 78-92.
Laliberte´, E., Legendre, P. (2010). A distance-based framework for measuring functional
diversity from multiple traits. Ecology, 91, 299–305.
Laliberté, E., Legendre, P., Shipley, B. (2014). FD: measuring functional diversity from multiple
traits, and other tools for functional ecology. R package version 10-12, https: //cran.r-
project.org/web/packages/FD/index.html.
Leppäranta, M., Myrberg, K. (2009) Physical oceanography of the Baltic Sea. Praxis Publishing,
Chichester, UK.
Acc
epte
d A
rtic
le
This article is protected by copyright. All rights reserved.
Lindegren M., Möllmann, C., Nielsen, A., Stenseth, N.C. (2009). Preventing the collapse of the
Baltic cod stock through an ecosystem-based management approach. Proceedings of the
National Academy of Sciences of the United States of America, 106:14722-14727.
Lindegren, M., Blenckner, T., Stenseth, N. C. (2012). Nutrient reduction and climate change
causes a potential shift from pelagic to benthic pathways in a eutrophic marine ecosystem.
Global Change Biology, 18, 3491-3503.
Lindegren, M., Andersen, K.H., Casini, M., Neuenfeldt, S. (2014). A metacommunity perspective
on source-sink dynamics and management: the Baltic Sea as a case study. Ecological
Applications, 24(7):1820-1832.
Lindegren, M., Checkley, D.M., Ohman, M.D., Koslow, J.A., Goericke, R. (2016). Resilience
and stability of a pelagic marine ecosystem. Proceedings of the Royal Society B: Biological
Sciences, 283: 20151931
Levin, S., Lubchenco, J. (2008). Resilience, Robustness, and Marine Ecosystem-based
Management. BioScience, 58, 27-32.
McCann, K.S. (2000). The diversity-stability debate. Nature, 405, 228-233.
Acc
epte
d A
rtic
le
This article is protected by copyright. All rights reserved.
Millennium Ecosystem Assessment (2005). Ecosystems and human well being: biodiversity
synthesis. World Resources Institute, Washington, D.C., USA.
Morris, K. E., Caruso, T., Buscot, F., Fischer, M., Hancock, C., Maier, T. S., Meiners, T.,
Müller, C., Obermaier, E., Prati, D., Socher, S. A., Sonnemann, I., Wäschke, N., Wubet, T.,
Wurst, S., Rillig, M. C. (2014). Choosing and using diversity indices: insights for ecological
applications from the German Biodiversity Exploratories. Ecology and Evolution, 4, 3514-
3524.
Mouillot, D., Nicholas, A.J.G., Villéger, S., Mason, N.W.H., Bellwood, D.R. (2013). A functional
approach reveals community responses to disturbances. Trends in Ecology and Evolution, 28,
167-177.
Möllman, C., Diekmann, R., Muller-Karulis, B., Kornilov, G., Plikshs, M., Axe, P. (2009).
Reorganization of a large marine ecosystem due to atmospheric and anthropogenic pressure: a
discontinuous regime shift in the Central Baltic Sea. Global Change Biology, 13, 1377-1393.
Neumann, H., Kröncke, I. (2011). The effect of temperature variability on ecological
functioning of epifauna in the German Bight. Marine Ecology, 32, 49e57.
Norberg, J. (2004). Biodiversity and ecosystem functioning: a complex adaptive systems
approach. Limnology and Oceanography, 49, 1269–1277.
Acc
epte
d A
rtic
le
This article is protected by copyright. All rights reserved.
Nordström, M. C., Aarnio, K., Törnroos, A., Bonsdorff, E. (2015). Nestedness of trophic links and
biological traits in a marine food web. Ecosphere, 6, 1-14.
Nyström, M. (2006). Redundancy and response diversity of functional groups: implications for
the resilience of coral reefs. AMBIO, 35, 30-35.
Ojaveer H, Jaanus A, MacKenzie BR, Martin G, Olenin S, et al. (2010) Status of Biodiversity in the
Baltic Sea. PLoS ONE 5(9): e12467. doi:10.1371/journal.pone.0012467
Oksanen, F., Blanchet, G., Kindt, R., Legendre, P., Minchin, P. R., O'Hara, R. B., Simpson, G., L.,
Solymos, P.,Henry, M., Stevens, H., Wagner, H. (2015). Community Ecology Package,
http://cran.r-project.org, https://github.com/vegandevs/vegan
Olsson, J., Bergström, L., Gårdmark, A. (2012). Abiotic drivers of coastal fish community change
during four decades in the Baltic Sea. ICES Journal of Marine Science, 69, 961-970.
Olsson, J., Bergström, L., Gårdmark, A. (2013) Top-Down regulation, climate and multi-decadal
changes in coastal zoobenthos communities in two Baltic Sea areas. PLoSONE 8(5):e64767.
Österblom, H., Hansson, S., Larsson, U., Hjerne, O., Wulff, F., Elmgren, R., Folke, C. (2007).
Human-induced trophic cascades and ecological regime shifts in the Baltic Sea. Ecosystems, 10,
Acc
epte
d A
rtic
le
This article is protected by copyright. All rights reserved.
877-889.
Pecuchet, L., Törnroos, A., Lindegren, M. (2016). Patterns and drivers of fish community
assembly in a large marine ecosystem. Marine Ecology Progress Series, 546, 239–248.
Pimm, S.L. (1984). The complexity and stability of ecosystems. Nature, 307,321-326.
Pinheiro, J, Bates, D. (2000). Mixed effects models in S and S-Plus. New York: Springer-Verlag.
Planque, B., Arneberg, P. (2017). Principal component analyses for integrated ecosystem
assessments may primarily reflect methodological artefacts. ICES Journal of Marine Science, 75,
1021-1028.
Podani, J., Schmera, D. (2006). On dendrogram-based measures of functional diversity. Oikos,
115, 179 185.
R Core Team 2017. R: A Language and Environment for Statistical Computing. R Foundation for
Statistical Computing, Vienna, Austria. URL https://www.r-project.org/.
Reiss, J., Birdle, J. R., Montoy, J. M., Woodward, G. (2009). Emerging horizons in biodiversity and
ecosystem functioning research. Trends in Ecology and Evolution, 24, 505–514.
Acc
epte
d A
rtic
le
This article is protected by copyright. All rights reserved.
Rosenberg, R., Loo, L.-O., Möller, P. (1995). Hypoxia, salinity and temperature as structuring
factors for marine benthic communities in a eutrophic area. Netherlands. Journal of. Sea
Research. 30, 121-129.
Schleuter, D., Daufresne, M., Massol, F., Argillier, C. (2010). ser’s g ide to f nctional diversity
indices. Ecological Monographs, 80, 469-484.
Shimadzu, H., Dornelas, M., Magurran, A. E. (2015). Measuring temporal turnover in
ecological communities. Methods in Ecology and Evolution, 6, 1384-1394.
Sherman, K., Hempel, G. (2008). The UNEP large marine ecosystem report: a perspective on
changing conditions in LMEs of the world’s regional seas. UNEP Regional Seas
Report and Studies No. 182. United Nations Environment Programme, Nairobi
Steiner, C.F., Long, Z.T., Krumins, J.A., Morin, P.J. (2006). Population and community resilience in
multitrophic communities. Ecology 87:996–1007.
Sundqvist, F., Svanfeldt, K., Svensson, L. (2018). Biologisk recipientkontroll vid Ringhals
ka rnkraftverk, rsrapport fo r 2017. Aqua reports 2018:6. Sveriges lantbruksuniversitet,
nstit tionen fo r akvatiska res rser, regr nd rottningholm Lysekil. 49 p.
http://pub.epsilon.slu.se/
Acc
epte
d A
rtic
le
This article is protected by copyright. All rights reserved.
Thebault, E., Loreau, M. (2003). Food-web constraints on biodiversity-ecosystem functioning
relationships. Proceedings of the National Academy of Science, 100, 14949–14954.
Törnroos, A., Bonsdorff, E. (2012). Developing the multitrait concept for functional diversity:
lessons from a system rich in functions but poor in species. Ecological Applications, 22, 2221-
2236.
Törnroos, A., Bonsdorff, E., Bremner, J., Blomqvist, M., Josefson, A. B., Garcia, C.,
Warzocha, J. (2015). Marine benthic ecological functioning over decreasing taxonomic richness.
Journal of Sea Research, 98, 49-56.
Valdivia, N., Segovia-Rivera, V., Fica, E., Bonta, C.C., Aguilera, M.A., Broitman, B.R. (2017).
Context-dependent functional dispersion across similar ranges of trait space covered by
intertidal rocky shore communities. Ecology and Evolution, 7, 1882-1891.
Veríssimo, H., Bremner, J., Garcia, C., Patrício, J., van der Linden, P., Marques, J.C.
(2012). Assessment of the subtidal macrobenthic community functioning of a
temperate estuary following environmental restoration. Ecological Indicators, 23,
312e322.
Acc
epte
d A
rtic
le
This article is protected by copyright. All rights reserved.
Villéger, S., Mason N.W. H., Mouillot, D. (2008). New multidimensional functional diversity
indices for a multifaceted framework in functional ecology. Ecology, 89, 2290–2301.
Villéger, S., Grenouillet, G., Brosse, S. (2013). Decomposing functional β‐diversity reveals
that low functional β‐diversity is driven by low functional turnover in European fish
assemblages. Global Ecology and Biogeography, 22, 671-681.
Violle, C., Navas, M. L., Vile, D., Kazakou, E., Fortunel, C., Hummel, I., Garnier, E. (2007). Let the
concept of trait be functional! Oikos, 116, 882–892.
Walker, B.H. (1992). Biodiversity and ecological redundancy. Conservation biology, 6:18–23.
Weigel, B., Blenckner, T., Bonsdorff, E. (2016). Maintained functional diversity in benthic
communities in spite of diverging functional identities. Oikos, 125, 1421-1433.
Yletyinen, J, Bodin, O., Weigel, B., Nordström, M.C., Bonsdorff, E., Blenckner, T. (2016). Regime
shifts in marine communities: a complex systems perspective on food web dynamics.
Proceedings of the Royal Society B Series, 283, 2015-2569.
Zuur, A. F., Tuck, I. D., Bailey, N. (2003). Dynamic factor analysis to estimate common trends in
fisheries time series. Canadian Journal of Fish and Aquatic Science, 60, 542–552.
Acc
epte
d A
rtic
le
This article is protected by copyright. All rights reserved.
SUPPLEMENTARY INFORMATION
Supplementary information A: Tables.
Supplementary information B: Figures
FIGURE CAPTIONS
Fig. 1. Long-term trends in taxonomic and functional diversity indices. Species- (a-c) and trait
richness (d-f), functional evenness (g-i) and functional dispersion (j-l) of fish (black) and
zoobenthos (grey) in Kattegat (left), Baltic Proper (middle) and the Bothnian Sea (right). To
facilitate a comparison between fish and benthos the time-series are shown as anomalies (zero
mean and unit variance). Correlation coefficients between indices for fish and zoobenthos as
well as p-values for linear trends are found in the top (or bottom) right corner of each panel.
Significant correlations are indicated in bold and significant trends with dashed lines.
Fig. 2. Changes in turnover and functional composition over time. Functional community
turnover (a-c) and temporal trends based on DFA on community-weighted trait values (CWM),
T1 (d-f) and T2 (g-i), for fish (black) and zoobenthos (grey) in Kattegat (left), the Baltic Proper
(middle) and the Bothnian Sea (right), respectively. Correlation coefficients between indices for
fish and zoobenthos as well as p-values for linear trends are found in the top (or bottom) right
corner of each panel. Significant correlations are indicated in bold and significant trends with
dashed lines.
Fig. 3. Summary of long-term changes in species richness, functional diversity, turnover and
multi-trait composition across two trophic groups and three subsystems in the Baltic Sea. Maps
show the three geographical areas with sampling area indicated in red. The data is primarily
Acc
epte
d A
rtic
le
This article is protected by copyright. All rights reserved.
representative of the coastal parts of the basins. Upward arrows (↑, bright green) indicate a
significant increase in a metric, while downward arrows (↓, bright red) indicate significant
decrease. Trends (grey ↑↓, pale green or pale red), linearly increasing and decreasing traits, and
non-significant changes (NS) are also given. Long-term averages for species and trait richness,
functional evenness and dispersion as well as functional community turnover are shown within
lower-case brackets.
Acc
epte
d A
rtic
le
This article is protected by copyright. All rights reserved.
Acc
epte
d A
rtic
le
This article is protected by copyright. All rights reserved.
Acc
epte
d A
rtic
le
This article is protected by copyright. All rights reserved.