Embed Size (px)
Citation preview

Four Hour Rule ProgramProgress and Issues Review
Professor Bryant Stokes AM
December 2011
ISBN: 978-1-921841-04-0
This report is available online at:www.health.wa.gov.au
For further information please contact:
Department of Health, Western Australia189 Royal Street, EASt PERtH, Western Australia 6004telephone: (08) 9222 4222
Disclaimer
All information and content in this material is provided in good faith by the Department of Health WA, and is based on sources believed to be reliable and accurate at the time of development. the State of Western Australia, the Department of Health WA and their respective officers, employees and agents, do not accept legal liability or responsibility for the material, or any consequences from its use.
Suggested Citation:
Four Hour Rule Program Progress and Issues Review. December 2011. Perth: Department of Health WA.
Copyright © 2011
Acknowledgements
Acknowledgement is made of the commitment and dedication of the Review team, Ms Marea Gent (RN, BSc Nurs, Dip CCU&CT, MRCNA), Ms Hannah Moss (BHSc) and Mrs Jaynie Kirkpatrick (RN, BHSc Nurs, MHSc Nurs) without whom this task would have been impossible to complete.
I would like to recognise the valuable contribution made by the Review Working Reference Group in completing this Review:
* Professor David Fletcher, Head of General Surgery, Clinical Director of Surgical Services, Fremantle Hospital
* Dr Mark Monaghan, State Clinical Lead, Four Hour Rule Program
* Ms Marani Hutton, Allied Health Advisor, South Metropolitan Area Health Service
* Dr Mark Platell, Director of Clinical Services, Royal Perth Hospital
* Ms tanya Basile, Nurse Co-Director, Sir Charles Gairdner Hospital
* Dr Dror Maor, Co-Chair, Doctors in training, Australian Medical Association
* Mr Mathew Szabo, Clinical Nurse Emergency Department, Princess Margaret Hospital
* Dr Caroline Rhodes, Doctors in training, Australian Medical Association
* Dr David Blacker, Neurologist, Sir Charles Gairdner Hospital.
Thank you to the individuals at the hospitals and departments who provided data at the request of the review team.
I also thank Ms Anne Donaldson from the Health and Disability Services Complaints Office (HaDSCO) and Ms Michele Kosky from the Health Consumers’ Council (HCC) together with the 314 other stakeholders who so freely provided of their time for interviews and staff forums.
i
Four Hour Rule Program Progress and Issues Review
Professor Bryant Stokes AM
December 2011
ii
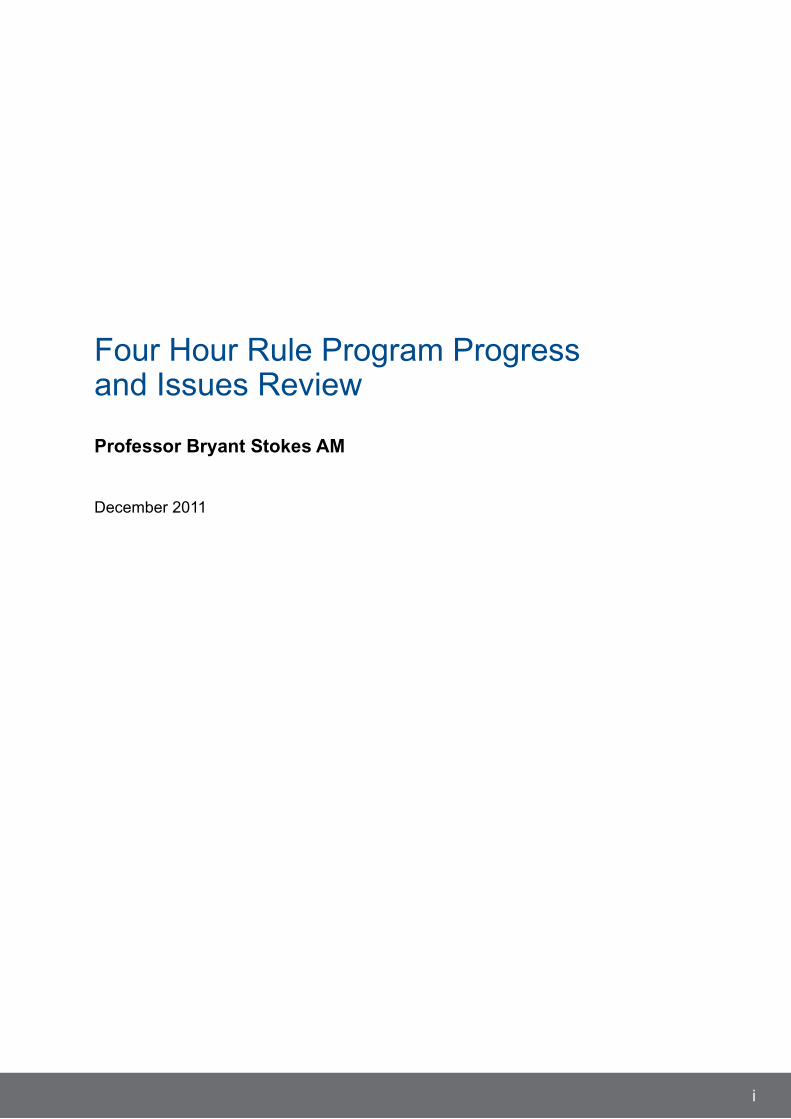
Acronyms
Accident and Emergency A&EAcute Admission Unit AAUAcute Surgical Assessment ASUAmbulatory Care Sensitive Conditions ACSCAustralasian College for Emergency Medicine ACEMClinical Service Redesign CSRCouncil of Australian Governments COAGComputer Assisted Radio Personnel System CARPSDepartment of Health DoHDefine, Measure, Analyse, Improve and Control DMAICEmergency Department EDEmergency Department Information System EDISFour Hour Rule Program FHRPFremantle Hospital FHFull Time Equivalent FTEGlobal Financial Crisis GFCHealth and Disability Services Complaints Office HaDSCOHealth Consumers’ Council HCCHealth service assistants HSAHealth System Improvement Unit HSIU Hospital in the Home HITHImplementation Plan IPInformation Technology ITJunior Medical Officer JMOKey Performance Indicator KPILength of Stay LOSMedical Emergency Team METMethicillin-Resistant Staphylococcus Aureus MRSAMinister for Health MfHNational Health Service NHSNational Elective Surgery Target NESTNational Emergency Access Target NEATOther Goods and Services OGSPatient Care Assistants PCAPerformance Activity and Quality Division PAQPharmaceutical Benefits Scheme PBSPrincess Margaret Hospital PMHRehabilitation in the Home RITHResident Medical Officer RMORoyal Australasian College of Surgeons RACSRoyal Perth Hospital RPHSt John Ambulance Association SJAASir Charles Gairdner Hospital SCGHState Health Executive Forum SHEFStrategic Health Authorities SHATerms of Reference TORUnited Kingdom UKThe electronic discharge summary TEDSVancomycin-resistant Enterococci VREVoice of the Patient VOPVoice of the Staff VOSWestern Australia WA
iii
Contents
1. Executive summary ............................................................................................ 1
2. Recommendations ............................................................................................. 7
2.1 Rebrand and embed .................................................................................... 7
2.2 Refresh and re-engage to build capacity and sustainability ....................... 7
2.3 Realigning workforce investment ................................................................ 8
2.4 Review and revisit solutions to improve patient safety and quality ............. 9
2.5 Patient navigator role (or equivalent) .......................................................... 10
2.6 Discharge ..................................................................................................... 10
2.7 Clinical training ............................................................................................ 10
2.8 Information technology ................................................................................ 11
3. Background ......................................................................................................... 12
3.1 Increased demand in tertiary hospitals ....................................................... 12
3.2 Four Hour Rule in the NHS – context and delivery ..................................... 14
3.3 Learning from the UK tour ........................................................................... 14
3.4 Key differences to Western Australia .......................................................... 15
3.5 Program targets ........................................................................................... 16
3.6 Monitoring change and quality .................................................................... 18
4. Rationale for the review ..................................................................................... 19
5. Investigation ....................................................................................................... 21
5.1 Ministerial consultation ................................................................................ 21
5.2 The Four Hour Rule Program Review ......................................................... 21
6. Findings ............................................................................................................... 23
6.1 Four hour timeframe .................................................................................... 24
6.2 Safety and quality in patient care ................................................................ 26
6.3 Acute assessment units ............................................................................... 46
6.4 Acute surgical units ...................................................................................... 48
6.5 Leadership and accountability ..................................................................... 51
6.6 Clinical training and development ............................................................... 52
6.7 Communication ............................................................................................ 54
6.8 Service interdependencies .......................................................................... 54
6.9 Assessment of implementation based on program methodology ............... 56
6.10 Desktop audit findings ................................................................................. 59
6.11 Solution implementation by site ................................................................... 62
6.12 COAG funding rounds stage on hospitals 2011 .......................................... 64
6.13 Desktop audit conclusion ............................................................................. 66
7. References .......................................................................................................... 67
8. Appendices ......................................................................................................... 69
A. Four Hour Rule Program Governance Structure ........................................ 69
B. Terms of Reference ..................................................................................... 71
iv
List of Tables
Table 1: Percentage of ED attendances with a length of episode less than or equal to four hours
Table 2: Stage one targets
Table 3: FHRP dashboard indicators
Table 4: FTE trends for nursing workforce
Table 5: FTE trends for orderlies and PCAs workforce
Table 6: FTE trends for cleaning workforce
Table 7: Consultant clinicians by hospital
Table 8: Number of solutions by area/process by hospital as of October 2009
Table 9: Solutions implemented by solutions area by each hospital as of December 2010
Table 10: Initial solutions proposed but not fully implemented by November 2011
Table 11: Solutions funded in 2011 by hospital and area and FTE
v
List of Figures
Figure 1: Percentage of ED attendances with a length of episode less than or equal to four hours
Figure 2: Number of monthly ED attendances at the four WA tertiary hospitals combined 2005-2011
Figure 3: Access block 2007-2011
Figure 4: Representation of the consultation by hospitals
Figure 5: Representation of consultation by position description
Figure 6: Number of monthly ED attendances at RPH, SCGH, FH and PMH during January 2005 to October 2011
Figure 7: Triage category 1-3, monthly admissions at RPH, SCGH, FH and PMH during January 2005 to October 2011
Figure 8: Number of patient complaints for Stage One Hospitals January 2008 to October 2011
Figure 9: In hospital mortality Stage One Sites 2009-2011
Figure 10: Patients admitted with a change of speciality within 24 hours at Stage One Hospitals (July 2008-June 2011)
Figure 11: Percentage of admissions with a change of ward within 24 hours of admission
Figure 12: FH inpatient discharges within 12 hours by speciality
Figure 13: RPH inpatient discharges within 12 hours by speciality
Figure 14: SCGH inpatient discharges within 12 hours by speciality
Figure 15: PMH inpatient discharges in less than 12 hours by speciality
Figure 16: Comparison of capacity at midnight census at stage one sites: 2009 and 2011
Figure 17: FHHS unplanned representations in under 48 hours 2009-2011
Figure 18: RPH unplanned representations in under 48 hours 2009-2011
Figure 19: SCGH unplanned representations in under 48 hours 2009-2011
Figure 20: PMH unplanned representations in under 48 hours 2009-2011
Figure 21: Representations in 7 and 30 days
Figure 22: Rate of MRSA infections in Stage One Hospitals July 2010 to September 2011
Figure 23: Stage One Hospitals number of VRE cases 2008-2011
Figure 24: The DMAIC cycle
Figure 25: Four Hour Rule Program Governance Structure – 2011
Figure 26: Four Hour Rule Program Governance Structure – Original

vi
This page has been left blank intentionally.
1. Executive summary
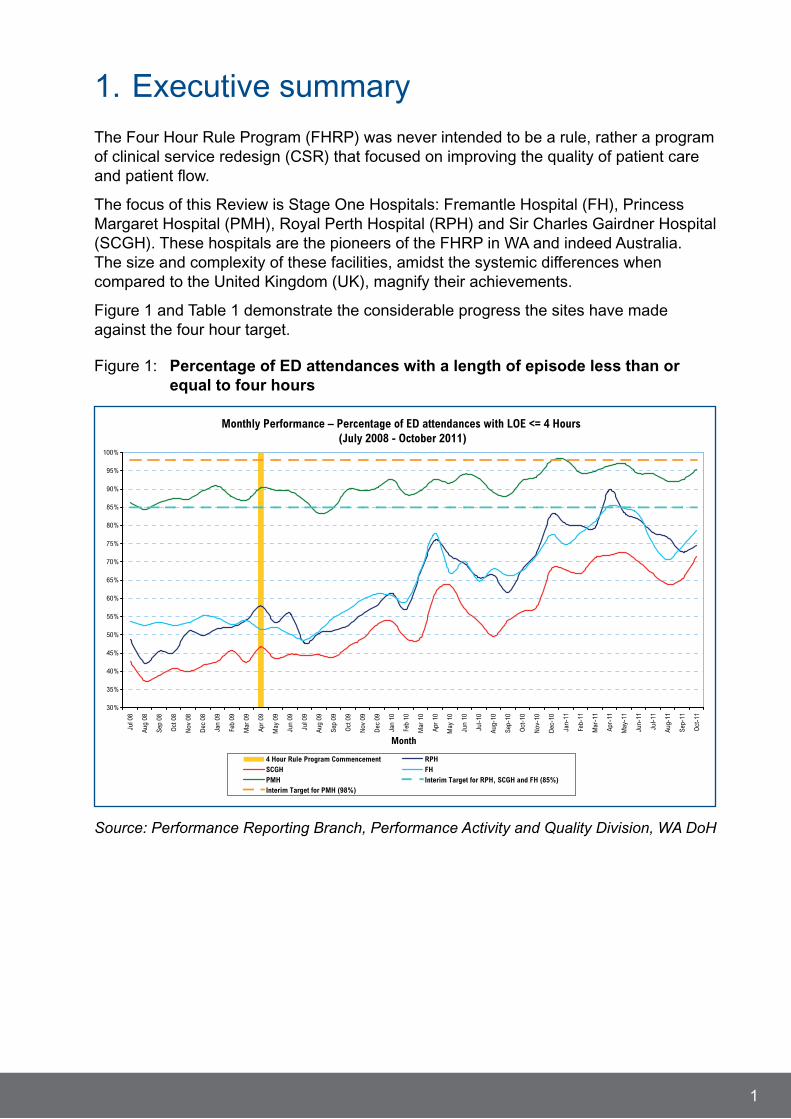
The Four Hour Rule Program (FHRP) was never intended to be a rule, rather a program of clinical service redesign (CSR) that focused on improving the quality of patient care and patient flow.
The focus of this Review is Stage One Hospitals: Fremantle Hospital (FH), Princess Margaret Hospital (PMH), Royal Perth Hospital (RPH) and Sir Charles Gairdner Hospital (SCGH). These hospitals are the pioneers of the FHRP in WA and indeed Australia. The size and complexity of these facilities, amidst the systemic differences when compared to the United Kingdom (UK), magnify their achievements.
Figure 1 and Table 1 demonstrate the considerable progress the sites have made against the four hour target.
Figure 1: Percentage of ED attendances with a length of episode less than or equal to four hours
1
Monthly Performance – Percentage of ED attendances with LOE <= 4 Hours(July 2008 - October 2011)
30%
35%
40%
45%
50%
55%
60%
65%
70%
75%
80%
85%
90%
95%
100%
Jul 0
8
Aug
08
Sep
08
Oct
08
Nov
08
Dec
08
Jan
09
Feb
09
Mar
09
Apr
09
May
09
Jun
09
Jul 0
9
Aug
09
Sep
09
Oct
09
Nov
09
Dec
09
Jan
10
Feb
10
Mar
10
Apr
10
May
10
Jun
10
Jul-1
0
Aug-
10
Sep-
10
Oct
-10
Nov
-10
Dec
-10
Jan-
11
Feb-
11
Mar
-11
Apr-
11
May
-11
Jun-
11
Jul-1
1
Aug-
11
Sep-
11
Oct
-11
Month
4 Hour Rule Program Commencement RPHSCGH FHPMH Interim Target for RPH, SCGH and FH (85%)Interim Target for PMH (98%)
Source: Performance Reporting Branch, Performance Activity and Quality Division, WA DoH

Table 1: Percentage of ED attendances with a length of episode less than or equal to four hours
October 2008 October 2009 October 2010 October 2011
FH 52.7% 57.0% 67.6% 78.6%
PMH 87.4% 89.9% 92.3% 95.4%
RPH 45.1% 52.3% 68.1% 74.6%
SCGH 40.8% 44.5% 56.4% 71.6%
Source: Performance Reporting Branch, Performance Activity and Quality Division, WA DoH
Access block, defined as the percentage of patients who wait longer than eight hours for an inpatient bed, has also decreased dramatically. In August 2008, total access block for all Stage One sites peaked at 49.5% (refer to Figure 3). By August 2010 this was down to 25.9%, and it reached an all time low of 7% in April 2011. In October 2011, total access block was at 11.2%.
The Reviewer found that growth in demand in emergency, elective and outpatient services across the Stage One hospitals, combined with recent spikes in Vancomycin-resistant Enterococci (VRE) cases and the associated screening and ward cleaning made it difficult for staff to separate out the elements of stress or pressure related to the FHRP from that purely related to demand and complexity. In the last two years emergency department (ED) presentations have increased by 7.1% and 8.8% respectively (Figure 2).
The four hour target was a key reform of the National Health Service (NHS) in the UK and the implementation of the FHRP in Western Australia (WA) was certainly ambitious given the significant difference between the two health systems.
While the NHS is a single public funded entity covering the spectrum of health care, the WA health system is characterised by a set of complex funding arrangements between the Commonwealth and State funded services. Prior to the introduction of the FHRP in the UK, the NHS had invested significant funds in the health system, including infrastructure for acute, community and residential aged care services. Another key difference is that consultant clinicians in the UK are mostly employed by the NHS on a full time basis, while in WA a large proportion of consultant clinicians are part time or sessional.
In Australia, Commonwealth arrangements for general practice and primary health care are funded through Medicare. The infrastructure and funding arrangements for aged care services is managed between private providers and the Commonwealth. WA continues to have inadequate aged care infrastructure to meet population growth and demand for residential aged care services, and this has a significant impact on hospital occupancy rates. The matrix of health services in WA is complemented by non-government and not-for-profit organisations for other key elements of the health service.
2

Lord Darzi’s review of the NHS in 20081 shared similar concerns to WA regarding the growth in demand for emergency services. The NHS recognised that consumers utilise EDs for non-urgent care due to the limited access to general practice clinics after hours. While it is acknowledged that some of these health issues would be more appropriately addressed by an experienced general practitioner as opposed to a junior doctor in ED1, the Australian Medicare Agreement states that every person has a right to be seen in an ED.
Medical staff consulted in this review consistently believe general practice type presentations are an issue for WA tertiary hospitals. While access to after hours GP services has improved, there are limited locations where there are extended hours, and most services require a gap payment to be made by the patient, in addition to the Medicare levy charged.
In the face of these system differences, the magnitude of the achievements in the WA Stage One hospitals cannot be under estimated. Prior to the implementation of the FHRP, ED overcrowding, access block and ambulance ramping posed considerable risks to patient safety and quality.
In 2006, Sprivulis et al 2 demonstrated that ED overcrowding is associated with increased mortality and that, “reducing overcrowding may improve outcomes for patients requiring emergency hospital admission.” Mortality has been decreasing in Stage One hospitals since the implementation of the FHRP (see Figure 9).
The FHRP has seen significant improvement in patient flow across all Stage One Hospitals. The Reviewer consulted with over 315 health workers and no one indicated a desire to return to pre-FHRP processes. However, many areas are struggling with the changes it has brought, and this requires revisiting some key reform concepts.
Reform of this scale requires significant sustained executive support and accountability. It is vital the status and governance of the FHRP is part of every hospital executive committee’s core business for change to be achieved and sustained. The findings of the Review indicate that this is not the case consistently across all hospitals.
Ongoing engagement with all levels of staff is essential for successful reform. Staff concerns and issues must be acknowledged and investigated in a timely fashion if engagement is to be maintained. With steady staff turnover in the system, regular face to face forums are valuable to share successes, communicate targeted strategies for improvement and listen to any staff issues that may arise. Feedback channels must be readily accessible for all staff.
A constant theme from many staff was that there appeared to be no robust complaints mechanism by which issues which they felt important could be voiced and a response obtained in a timely fashion. This requires attention and while the Reviewer understands that this is being addressed, emphasises that it needs to be well communicated to staff.
It is important that the compelling need for change and the root causes of issues are consistently communicated at all levels. It is evident that the responsibility for driving the change has rested with FHRP staff and a small group of committed change champions. These clinicians and administrators are committed, resilient and resolute in their commitment to improving the safety and quality of the patient care. Unfortunately, this has not been embraced by everyone across the Stage One hospitals.
3

There has clearly been a disproportionate burden of the change management and reform required for the FHRP in WA. There is considerable pressure on senior nurses to push and pull patients along the care continuum. There is a substantial flow-on to the support staff related to administrative, cleaning and transport processes along a truncated length of stay. The essential patient support services appear to be under considerable pressure to manage an increased volume of work in the same or shorter time frame.
Many of the interviewed staff shared their disappointment or frustration that agreed solutions to root causes were either not consistently adopted or were changed without any evaluation. All staff members need to understand the vital role they play in providing safe and appropriate patient care, and need to be committed to the process of improving the safety and quality of patient care.
The implementation of the FHRP has seen the advent of a range of short stay type units in EDs. These include Short Stay Units, Emergency Medical Wards, Observation Wards, Clinical Decision Units, etc. Although inpatient admission rates have not increased, the creation of such wards has driven up the overall admission rate technically, and thus the burden of work across all staffing groups. This has caused increased pressure on support services to process the admission and discharge transactions.
In the opinion of the Reviewer, more effort needs to be made with consultant clinician-led discharge from ED. Consultant clinicians need to lead the redirection of ambulatory care sensitive conditions (ACSC) such as infections (i.e. cellulitis, pneumonia and urinary tract infections) and deep vein thrombosis into ambulatory care programs3.
These are critical success factors for sustainable bed management, particularly with increasing demand. It is essential that performance indicators regarding the admission of ACSC are included as part of the ED key performance indicators, to monitor the department’s effectiveness at employing hospital substitution strategies.
The concerns of junior doctors with regard to training and development were heard at all Stage One hospitals. The Reviewer learned that the quality of clinical placement for junior doctors varied considerably within and between hospitals. A set of principles and minimum criteria for junior doctor placements will provide a range of experiences in a structured way to enable the junior doctor to be supervised, supported and developed in their role as a clinician.
Clinical Service Redesign (CSR) is a rigorous, validated methodology that has been used nationally and internationally to improve the timeliness, quality and safety of patient care4, 5. The UK experience highlighted that the most effective solutions did not necessarily require additional resources6. To successfully reduce blockages and delays, teams must critically examine customs and practices, looking at ways to streamline processes and work in the most efficient and effective way, across the whole hospital. Careful attention must be paid to the practice of discharge planning and organisation, which goes to the heart of good patient care and bed management.
The most difficult elements to change are those which are enmeshed in the culture of hospitals, which challenge clinicians’ personal way of going about their every day work.
4
The Review learned about hospital areas that had been audited but when recommendations were presented to the Head of Department, they were able to selectively implement only the agreeable ones. This approach lacks the executive commitment and accountability required to improved quality of care. There appears to be a lack of consistent executive leadership and consultant clinician engagement in CSR, and this potentially compromises patient care and staff safety.
Particular concerns include:
* Rostering of sub speciality registrars as individual units with some covering multiple hospitals could compromise occupational and safety health requirements due to inadequate sleep and fatigue. This particularly was drawn to the Reviewer's attention concerning RPH and SCGH.
* Roster configurations and patient flow processes in high turnover areas such as Acute Assessment Units (AAU). After hours staffing in the AAUs and similar surgical units must have senior doctors with a mixture of consultant clinicians and registrars on site for the 24 hour period. The workload and complexity are too heavy and acute for JMOs.
* Absence of progress towards improved surgical pathways in some hospitals.
At this point in the FHRP it is concerning to see that the reform process through CSR has not been embraced by the whole organisation, or indeed embedded into the hearts and minds of all health leaders across the Stage One hospitals.
The concerns about stress and apparent intimidation of junior medical officers (JMOs) that were expressed in forums with the Minister for Health (MfH) were strongly reinforced to the Reviewer. This is in need of urgent address.
Also clear was the stress under which nursing and allied health staff have been placed. A significant responsibility for the implementation of the FHRP has been placed on nursing staff, resulting in nurse managers and clinical nurse specialists spending less time on nursing and teaching and more on complex administration, with little assistance.
The review found that allied health staff are having difficulty in attending, assessing and treating patients both in ED and on the wards because of the reduced ED length of stay and more rapid ward turnover. In essence, this means that discharge plans are not being activated in a timely way. This requires further attention.
Patient support staff, including PCAs, PSAs, HSAs, cleaners and orderlies are stressed with more work to do in the same or shorter time period. The numbers of personnel have actually declined over the past few years and in the FHRP more patients per unit time are presenting to ward areas. The Reviewer is aware that there has been some configuration change in the types of support staff in some hospitals over this period. This group of backbone staff require immediate support.
Administrative staff, particularly ward, ED and coding clerks, also have an enormous work load with more units of work per unit time occurring and with apparent duplication of forms for admission and discharge.
5
The Reviewer interviewed many patient support and administrative staff at all hospitals and it appears that the introduction of the FHRP did not plan for the impact it would have on their work load. One cleaner reported it was not uncommon to clean as many as 12 rooms in a shift, and once cleaned the same room four times in one shift.
The shift in radiology activity from ED to the wards is very clear, with the number of examinations referred from ED decreasing by 11% from March 2009 to September 2011; while those referred from the wards have increased by 191% over the same period7. Significant improvements have been made to the median wait times for examinations; however the improvement is more marked for those referred from the ED.
Pharmacy processes have also been made more timely but there is still much to be done in the area. This is just one service which would benefit from a more robust IT system.
Teaching and training of medical staff and graduate nursing staff needs very careful attention to avoid the diminishing of skill mix and learning. It is here that appropriate rostering, especially of senior staff after hours is essential. It is not satisfactory for AAUs and Surgical Assessment Units (SAUs) to be staffed by a predominance of junior Resident Medical Officers (RMOs) when more senior RMOs, Registrars and available consultant clinicians will produce a safer environment, especially after hours.
In summary, the FHRP has produced many benefits to patients in timely access to services and of the staff interviewed, no one wants to return to the scenario before the FHRP introduction. However, the Reviewer concludes that more attention needs to be paid to the effects of more patients per unit time being presented to the inpatient environment and the resultant increase in staff workload in the inpatient wards. The FHRP has delivered more acute patients to the inpatient wards and in most areas of the Stage One hospitals there has not been a corresponding appropriate increase in staffing and other resources to deal with it.
Recommending site specific solutions without a robust CSR process is a perversion of the methodology and undermines the work that has been put into the FHRP over the last three years. The review can only recommend that the CSR process is supported and sustained, and that the barriers to solutions that have already been identified are addressed before implementing new ones.
6
2. Recommendations
2.1 Rebrand and embed
While the Reviewer understands that it was a Cabinet decision to call the program the Four Hour Rule Program, the name in the practical setting has focused attention on the clock instead of patient safety and quality. Discussion with UK experts Professor Mathew Cooke and Hon Alan Milburn (previous UK Parliamentary Secretary of Health) confirmed that this was also a problem in the UK.
FHRP branding should be removed and hospital based Clinical Service Redesign (CSR) offices should be established, with recurrent resourcing, building on the work that has already been done by the FHRP. The aim of these units will be to continue to support CSR throughout the hospital in order to:
* meet national targets for the National Emergency Access Target (NEAT), National Elective Surgery Target (NEST), and outpatient reform
* support positive sustainable change in areas of the hospital that have not yet engaged in CSR
* initiate other reform priorities as identified by the hospital and health service
* ensure alignment of reform priorities.
Strong executive leadership and consultant clinician support is essential to ensure participation from all areas of the hospital. The engagement and performance management of individuals who refuse to implement strategies to improve the safety and quality of the patient need to be addressed.
The Health System Improvement Unit (HSIU) should maintain a centralised role in supporting statewide reform, including CSR.
2.2 Refresh and re-engage to build capacity and sustainability
The Reviewer has established that a disproportionate level of burden and responsibility has fallen to a small group of dedicated staff. These people cannot keep ‘carrying’ the FHRP in the Stage One Hospitals; it is not sustainable and this must be recognised if the health services are to be expected to reach and maintain a target under NEAT of 90% by 2015.
Re-engagement with consultant clinicians is essential in the value they can add with CSR through providing clinical leadership, teaching and training support, timely patient decisions and advice which would expedite patient care and appropriate treatment and discharge.
The Reviewer supports a strong commitment towards more full time consultant clinicians in the public sector, and particularly in the positions of Heads of Department. This would improve accountability, leadership and communication for patient and staff safety and quality initiatives.
7
At the same time it is essential that hospital Executive Groups become much more engaged and drive the process with solid support for the clinicians. Without this engagement there is a major ongoing risk to the governance of the FHRP post April 2012. The negative culture/disengagement which has been created at some sites by the emphasis on time and targets poses an ongoing significant risk to the FHRP.
2.3 Realigning workforce investment
Many staff and patient safety issues were raised over the consultation period, in relation to staffing. Almost all professional groups raised the issue of being understaffed, but it is very difficult to say this has been caused by the FHRP in the context of the significant increases in demand.
It is clear to see that the FHRP has resulted in a shift of work in these hospitals from ED to the inpatient teams, as wards are starting to shoulder some of the burden that has sat squarely with the ED for the last 10 years. Hospitals have not fully recognised the impact of this shift. Areas that need re-examination and significant improvement as a matter of urgency are:
* The ED and ward interface to address workload concerns, increased patient acuity and ward skill mix.
* After hours staffing across the hospitals, with particular focus on on-call medical and surgical sub-specialty staffing solutions to address occupational safety and health which could lead to concerns about fatigue and safe working hours.
* Junior medical staff across the inpatient units.
* Patient support services workload and resourcing needs to maintain these essential functions as a satisfactory standard.
* Cleaning processes need to be standardised across the hospitals, with particular reference to the procedures for VRE and MRSA. The Reviewer noted that there are two types of cleaning procedures for ward areas which are carried out at different hospitals, both with microbiological approval.
* The mix of fulltime to part time consultant clinician staff, with a greater emphasis on full time staff in AAUs and SAUs (or similar units). The UK system has a very high percentage of full time consultant clinician staff which allows for better rostering and more consistent care.
Focused effort is required for:
* Radiology departments – the analysis of rostering within the available workforce is required to ensure it is distributed to match demand.
* Allied health – the rapid turnover of patients in both the ED and AAU's means there is often insufficient time to organise allied health care plans which are essential to patient care. Rostering needs to be re-considered in ED and ward areas, including the down stream demand for services from speech pathology, nutrition and podiatry through outpatients.
8
2.4 Review and revisit solutions to improve patient safety and quality
Hospitals should be revisiting the Define, Measure, Analyse, Improve and Control (DMAIC) cycle regularly, including a focus on the voice of the patient and voice of the staff. This requires the genuine involvement of all stakeholders, looking at original root causes to determine if they have been addressed.
The Reviewer has identified a number of organisational risks which could compromise patient safety and quality. These risks require targeted project resources to drive CSR in specific areas to achieve service reform and further enhance safety and quality of patient care. The following areas have been identified and are considered ‘in scope’:
* Review operating theatre accessibility at RPH to provide a robust and sustainable service for emergent surgery. The existing physical resources are considered to be adequate however they are not being used to their full capacity. This will require a significant functional review by the Executive Director of RPH with direct reporting to the Chief Executive of the South Metropolitan Area Health Service.
* Review of the AAU at RPH to provide improved senior clinician continuity of care.
* The need for urgent development of ASUs or Surgical Assessment Rapid Access (SARA) at RPH and SCGH to improve the management of emergent surgical cases. The ASU at Fremantle Hospital is an excellent example of what can be achieved in this area.
* Flexibility for ASUs or SARAs to provide after hours care for certain plastics, urology and facio-maxillary patients to be safely monitored over night (as was previously done when they were retained overnight in EDs).
* Royal Perth Hospital needs to abolish the once a month Low Activity Day in order to maintain services at required levels.
The financial implications cannot be quantified until the CSR process is completed and hospitals have identified tailored solutions for these priority areas. In addition the following team based philosophies need to be fully embedded in ED:
* Commitment to team ED triage and management for medical and nursing staff in ED, to ensure early senior clinician involvement in patient assessment.
* The early engagement of the allied health teams which can add significant value to the complex patient’s care through assessment, treatment and discharge planning is essential.
In most key areas, resources have not increased in line with demand. However, the appropriateness of increased resources needs to be evidenced by a robust CSR process showing that all process improvements have been achieved, and that additional resources are warranted.
Stage One hospitals need to operate safe and appropriate tertiary services 24 hours a day, seven days a week. Some difficult decisions need to be made to enable redistribution of resources, for example, from ED to AAU or other ward areas. Major change is required that will almost certainly challenge the customs and practices of individual units, and this will test the executive and clinical staff commitment to patient safety and quality within each hospital.
9
2.5 Patient navigator role (or equivalent)
This role has been created in all hospitals to ensure patient movement through ED is done in an appropriate time frame. Unfortunately this position has been blamed for stress creation within the ED environment. Anecdotes presented to the Reviewer indicated that some persons in this role were either over zealous or may be intimidating towards staff. The latter cannot be tolerated in any environment. The Reviewer has also learned of examples of persons in this role being supportive and explicitly helpful to ED staff.
It is recommended that this role be re-examined, its function clearly defined and those placed in this position to be educated in working cooperatively with all staff.
2.6 Discharge
Discharge planning in a timely fashion is imperative to the success of the FHRP and the quality of patient care. The elements of discharge planning should commence the moment the patient appears at the ED triage desk and this process must be continuously placed before staff, especially medical staff. This process is vital to the success of patient care. The use of community and Hospital in the Home (HITH) services must be continually in the forefront of the minds of ED staff as well as inpatient ward staff10.
An obvious issue which adds to the poor utilisation of some inpatient beds is the reluctance of metropolitan and rural hospitals to accept the return of patients they have referred to the tertiary hospitals when treatment in the latter setting is finished and the patients could be cared for in a less acute environment. It is understood however, that the infrastructure and staffing of the original referring hospital needs to be adequate to accept the earliest transfer for care close to home.
* A KPI for discharge planning should be developed and reported on by all clinical departments.
* Area Health Service CEs must ensure that referring hospitals in their area are supportive of the system by taking back the patients they have referred to a tertiary hospital for less acute or convalescent care.
2.7 Clinical training
A two pronged approach is required in hospitals between training units and the medical colleges to develop a set of:
* principles upon which junior doctor placements are developed which provide a range of training in a structured way, across the care continuum (i.e. patient case studies), to enable the junior doctor to be supervised, supported and developed as a clinician
* minimum criteria for training and development for each placement, identifying which procedural elements can be achieved through simulation technology.
10
2.8 Information Technology (IT)
It is inexplicable and tiring to patients to have their history recorded three to four times on the same day of admission and so a robust system that is reliable and secure needs to be developed and this would need to be in line with the development of the Electronic Medical Record (EMR).
* There needs to be a robust reporting system by which patient movement can be accurately recorded in real time and that confidence must be able to be placed in this system.
The Reviewer is aware that there is a WebPAS system currently being trialled, which may address some of these requirements.
CSR is a data driven methodology that relies on existing systems for data collection. The Emergency Department Information System (EDIS) was not designed to be a reporting system and the Reviewer was concerned by the security of the system at individual sites and in the reporting that appears to occur of the patient’s stay in ED. Also it was noted that there was the potential for changes to information to be made in a retrospective manner.
* The reporting of FHRP information and the robust nature of that information needs further analysis.
Solutions in and out of scope
Terms of Reference 6 and 7 ask the Reviewer to consider additional solutions that may be in or out of scope of the current FHRP business rules. The Reviewer has considered this carefully.
While at times stakeholders, and the review team, have felt compelled to offer specific solutions to the complex issues faced by the hospitals, it is the Reviewer’s opinion that it would be inappropriate to circumvent the CSR processes which have been initiated.
Therefore the Reviewer offers no recommendations for solutions which are ‘out of scope’ in isolation from CSR in any Stage One hospital.
11
3. Background
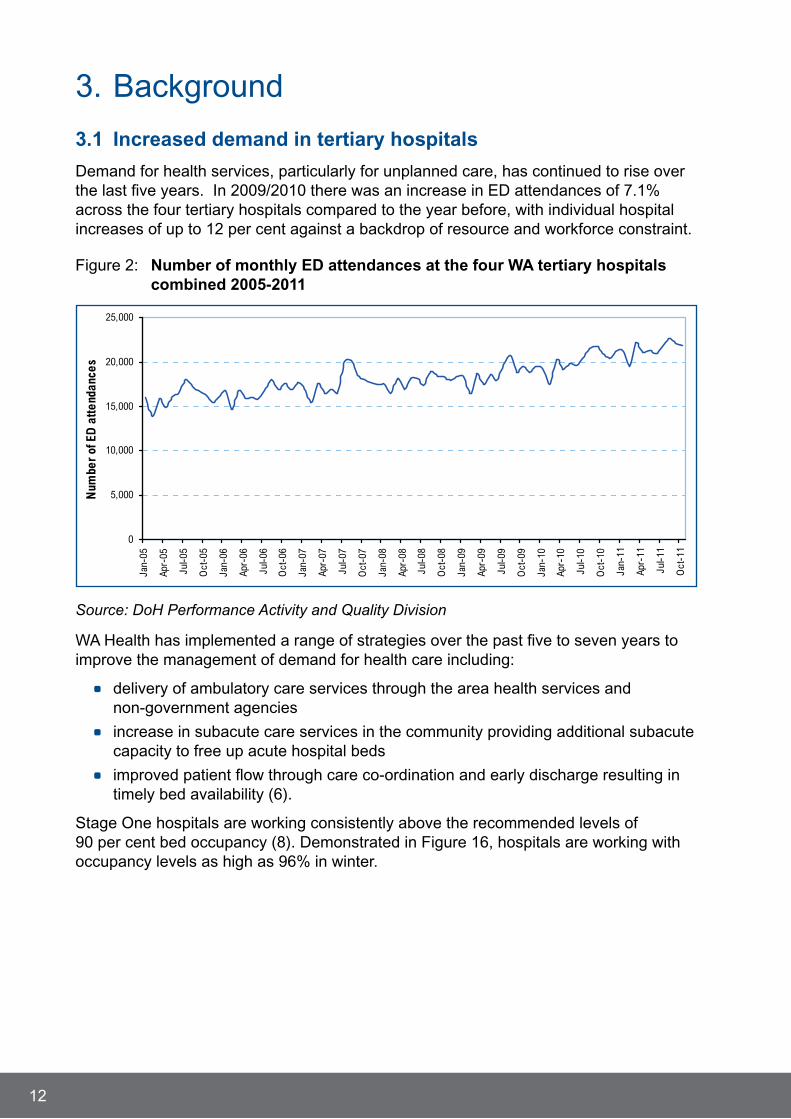
3.1 Increased demand in tertiary hospitals
Demand for health services, particularly for unplanned care, has continued to rise over the last five years. In 2009/2010 there was an increase in ED attendances of 7.1% across the four tertiary hospitals compared to the year before, with individual hospital increases of up to 12 per cent against a backdrop of resource and workforce constraint.
Figure 2: Number of monthly ED attendances at the four WA tertiary hospitals combined 2005-2011
Source: DoH Performance Activity and Quality Division
WA Health has implemented a range of strategies over the past five to seven years to improve the management of demand for health care including:
* delivery of ambulatory care services through the area health services and non-government agencies
* increase in subacute care services in the community providing additional subacute capacity to free up acute hospital beds
* improved patient flow through care co-ordination and early discharge resulting in timely bed availability (6).
Stage One hospitals are working consistently above the recommended levels of 90 per cent bed occupancy (8). Demonstrated in Figure 16, hospitals are working with occupancy levels as high as 96% in winter.
12
0
5,000
10,000
15,000
20,000
25,000
Jan-
05
Apr-
05
Jul-0
5
Oct
-05
Jan-
06
Apr-
06
Jul-0
6
Oct
-06
Jan-
07
Apr-
07
Jul-0
7
Oct
-07
Jan-
08
Apr-
08
Jul-0
8
Oct
-08
Jan-
09
Apr-
09
Jul-0
9
Oct
-09
Jan-
10
Apr-
10
Jul-1
0
Oct
-10
Jan-
11
Apr-
11
Jul-1
1
Oct
-11
Num
ber
of E
D a
ttend
ance
s
Prior to the introduction to the FHRP, some of the strategies that had been introduced to manage unplanned or emergency care included:
* the CSR to some elements of health service delivery
* working in partnership with St John Ambulance Association (SJAA) to reduce ramping, including a trial to increase referrals of non-urgent SJAA ‘000’ calls to Health Direct Australia for triage by a nurse6.
In 2006, Sprivulis and colleagues2 demonstrated that hospital and ED overcrowding is associated with increased mortality and that “reducing overcrowding may improve outcomes for patients requiring emergency hospital admission.”
In winter 2007, delays in ambulance turnaround time became a major issue for WA tertiary hospitals. This delay is reported as ambulance ramping time, which is defined as the sum of time from ambulance arrival to ambulance departure less 20 minutes for all ambulances that were identified as ramped.
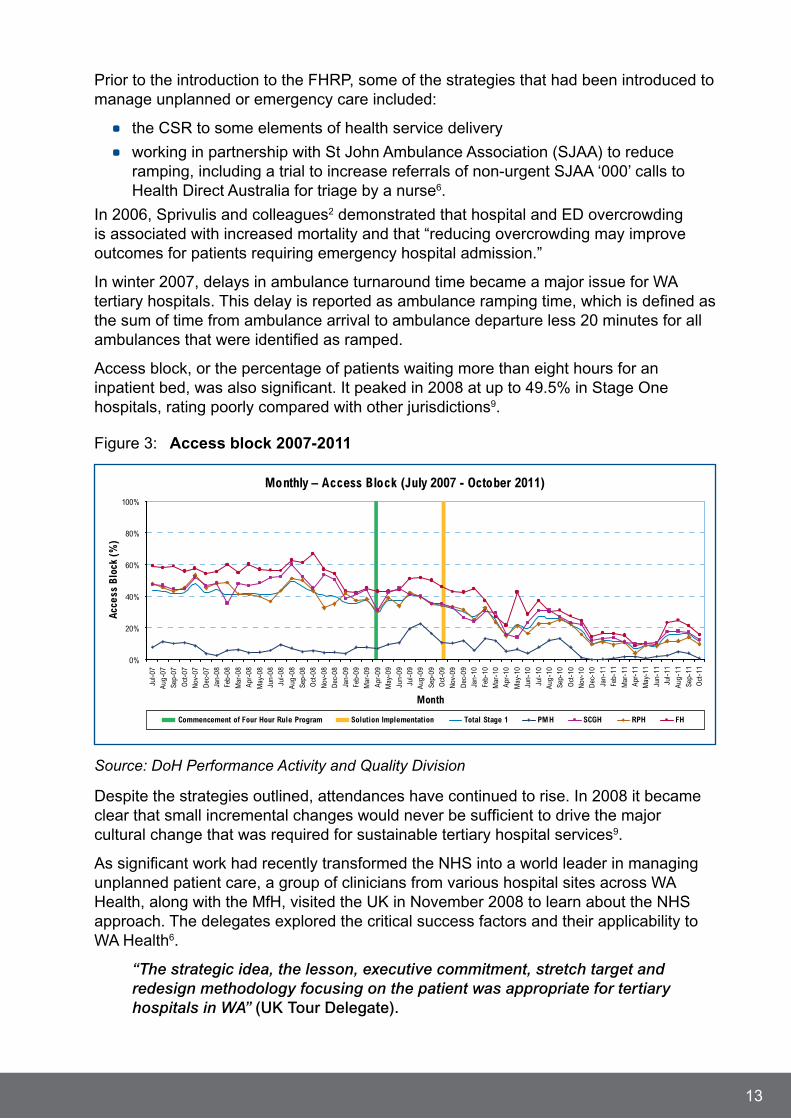
Access block, or the percentage of patients waiting more than eight hours for an inpatient bed, was also significant. It peaked in 2008 at up to 49.5% in Stage One hospitals, rating poorly compared with other jurisdictions9.
Figure 3: Access block 2007-2011
Source: DoH Performance Activity and Quality Division
Despite the strategies outlined, attendances have continued to rise. In 2008 it became clear that small incremental changes would never be sufficient to drive the major cultural change that was required for sustainable tertiary hospital services9.
As significant work had recently transformed the NHS into a world leader in managing unplanned patient care, a group of clinicians from various hospital sites across WA Health, along with the MfH, visited the UK in November 2008 to learn about the NHS approach. The delegates explored the critical success factors and their applicability to WA Health6.
“The strategic idea, the lesson, executive commitment, stretch target and redesign methodology focusing on the patient was appropriate for tertiary hospitals in WA” (UK Tour Delegate).
13
Monthly – Access Block (July 2007 - October 2011)
0%
20%
40%
60%
80%
100%
Jul-0
7Au
g-07
Sep-
07
Oct
-07
Nov-
07
Dec
-07
Jan-
08Fe
b-08
Mar
-08
Apr-
08
May
-08
Jun-
08Ju
l-08
Aug-
08Se
p-08
Oct
-08
Nov-
08D
ec-0
8
Jan-
09Fe
b-09
Mar
-09
Apr-
09M
ay-0
9
Jun-
09Ju
l-09
Aug-
09
Sep-
09O
ct-0
9No
v-09
Dec
-09
Jan-
10
Feb-
10M
ar-1
0Ap
r-10
May
-10
Jun-
10
Jul-1
0Au
g-10
Sep-
10
Oct
-10
Nov-
10D
ec-1
0
Jan-
11Fe
b-11
Mar
-11
Apr-
11M
ay-1
1
Jun-
11Ju
l-11
Aug-
11Se
p-11
Oct
-11
Month
Acce
ss B
lock
(%
)
Commencement of Four Hour Rule Program Solution Implementation Total Stage 1 PMH SCGH RPH FH

The group agreed that a similar strategy to the NHS Four Hour Rule would assist WA Health to better manage unplanned patient care. The proposal to develop a Four Hour Rule model that would fit WA conditions and community needs was endorsed by the Director General (DG) in December 2008 and subsequently by the MfH and Cabinet in January 2009.
“The overall performance and quality of care given to patients in hospitals is highly related and proportional to the degree of leadership and engagement shown by senior clinicians in hospitals” (UK Tour Delegate).
3.2 Four Hour Rule in the NHS – context and delivery
The NHS was set up in 1948 and initially EDs were staffed mainly by junior doctors, with a focus on dealing with trauma. This evolved over the decades to a consultant clinician-supervised service and the emerging specialty of emergency medicine, dealing with more medical and major trauma patients. By 2000, EDs had generally become overcrowded and had very long waiting times.
In 2000 “The NHS Plan”11 was released, a historic commitment by the NHS to modernise the public health system. This included a large, sustained investment into NHS funding and a plan for major reform. The document was the first mention of a four hour rule, stating that by 2004, 90% of all people attending emergency departments should be seen and admitted, discharged or transferred within four hours. The reform became known as the four hour rule and led to system wide change in the NHS. It was recognised that problems in EDs were often created by processes inside hospital such as poor bed management12 and discharge planning. It is noted that most hospitals achieved this target by 2005.
In 2006 Lord Darzi conducted a review of the NHS which was different to any previous review in that it was run in partnership with patients, frontline staff and the public. In 2008, High Quality Care for All – The NHS Next Stage Review Final Report1 was published. This provided a vision for the NHS moving from a focus on increasing the quantity of care to one of improving the quality of care.
In June 2010, the UK Health Secretary announced the relaxation of the Four Hour Accident and Emergency (A&E) target, to be replaced with a set of clinical quality indicators. This still includes an A&E target, however the operational standard was changed from 98% to 95%13. The purpose of the new set of indicators was to broaden the measurement of quality to cover effectiveness of treatment and the overall patient experience.
3.3 Learning from the UK tour
Hospitals across the UK had undertaken a redesign process which resulted in the ability to reach and maintain the A&E target, with staff expressing positive support. There was unanimous agreement among leaders and clinicians in the NHS that this FHRP of reform was much preferred over the previous system. WA delegates were advised that successful implementation of the project would require hospitals to be directed in what needed to be achieved, but not in how to achieve it6.
14

Project implementation and the redesign of clinical services required strong leadership and relentless commitment at a local level. Clinical leaders in each institution were empowered to analyse current processes and decide how to achieve the target. This involved identifying champions and leaders at all levels; engaging clinicians and patients; and shifting hospital culture to bring diagnosis, management and consultant clinician review forward.
One outcome of the redesign process in the NHS is that patients are now seen by more experienced staff members early in their presentation to ED. This resulted in early decision making and was supported by prioritised access to pathology and radiology for emergency patients. The common element for success was the focus on the patient throughout the care process. Some common approaches used to redesign care included:
* a modified approach to triage which enabled patients to be directed to different pathways for minor injuries, major trauma, medical and surgical streams
* use of AAUs and Clinical Decision Units (CDU)
* discharge improvement initiatives, with safe and effective discharge of patients supported by community linkage and ambulatory care initiatives.
3.4 Key differences to Western Australia
Governance and control
The NHS is a large public funded health system, which has significant control across the care continuum administering primary care, acute care, aged care and rehabilitation.
The WA health system presents a contrast to the NHS with complex funding arrangements between the Commonwealth, State, not-for-profit and non-government organisations and privately funded services.
Financial environment
The NHS FHRP was initiated in 2000 amidst strong financial investment in the NHS. Health funding essentially doubled in the next four years, including £600 million investment in social care, infrastructure and extra residential care beds.
The WA FHRP commenced in 2009, just as the Global Financial Crisis (GFC) was significantly impacting on the WA community. While WA had a one-off payment of $75.285 million to implement specific initiatives to manage emergency demand, the whole government sector was experiencing budget constraints. This impacted on the implementation of the FHRP at the Stage One hospitals.
Workforce configuration
WA delegates who visited UK hospitals observed the variation in the workforce models within the hospital systems. The EDs uniformly have a small number of consultant clinicians while a larger proportion are working in acute care areas. The reverse is evident in WA, where ED has a significant number of consultant clinicians and the acute care areas are more modestly resourced. This is largely due to history and the lead role WA played in developing the Australasian College for Emergency Medicine (ACEM) and the specialty of emergency medicine.
15

Another key difference is that consultant clinicians in the UK are employed by the NHS on a full time basis, while in WA a large proportion of consultant clinicians are part time or sessional.
Incentives and sanctions
The other area of clear difference between the NHS and WA Programs was the development and application of incentives and sanctions for hospitals in the UK, based on performance, including the achievement of the targets. No incentives or sanctions were introduced in WA for the FHRP.
Design and implementation of the Four Hour Rule Program in WA
The key objective of the FHRP is to improve the quality of patient care provided in the public health system by aiming to ensure the majority of patients arriving at EDs are seen and admitted, discharged or transferred within a four-hour timeframe. The FHRP utilises the WA Health Clinical Services Redesign (CSR) methodology to drive whole of hospital change, to improve the quality and timeliness of patient care. The methodology is discussed in more detail in Section 6.
Implementation of the FHRP occurred in three stages:
* Stage One consists of the tertiary hospitals RPH, SCGH, FH and PMH.
* Stage Two includes WA’s metropolitan general hospitals (Armadale Kelmscott Memorial Hospital, Swan District Hospital and Rockingham General Hospital) as well as Bunbury Hospital and Joondalup Health Campus.
* Stage Three includes the remaining Regional Resource Centres (Albany Hospital, Broome Hospital, Geraldton Hospital, Hedland Health Campus and Kalgoorlie Hospital) plus Nickol Bay Hospital, King Edward Memorial Hospital and Peel Health Campus.
The scope of this review is confined to Stage One.
The FHRP Implementation Plan9 outlines the specific in-scope elements as ‘all unplanned medical, surgical, paediatric and mental health patients who arrive at Emergency Departments; unplanned patients who are transferred between hospitals by referral; and unplanned patients who are admitted to hospital from outpatient clinics.’
Funding for the FHRP comes from a Commonwealth Government National Partnership Agreement (NPA) project payment, earmarked to improve the operations of EDs. All funding is non-recurrent. WA was allocated $75.285 million to implement specific initiatives to manage emergency demand as a one off payment. Of the total, $56 million was allocated to the FHRP9; in addition to annual Area Health Service budget allocation based on activity based funding methodology.
3.5 FHRP targets
Original targets
Commencing in April 2009, Stage One hospital sites were expected to reach the target of 98% of patients arriving at EDs being seen and admitted, discharged or transferred within a four-hour timeframe by April 2011.
16
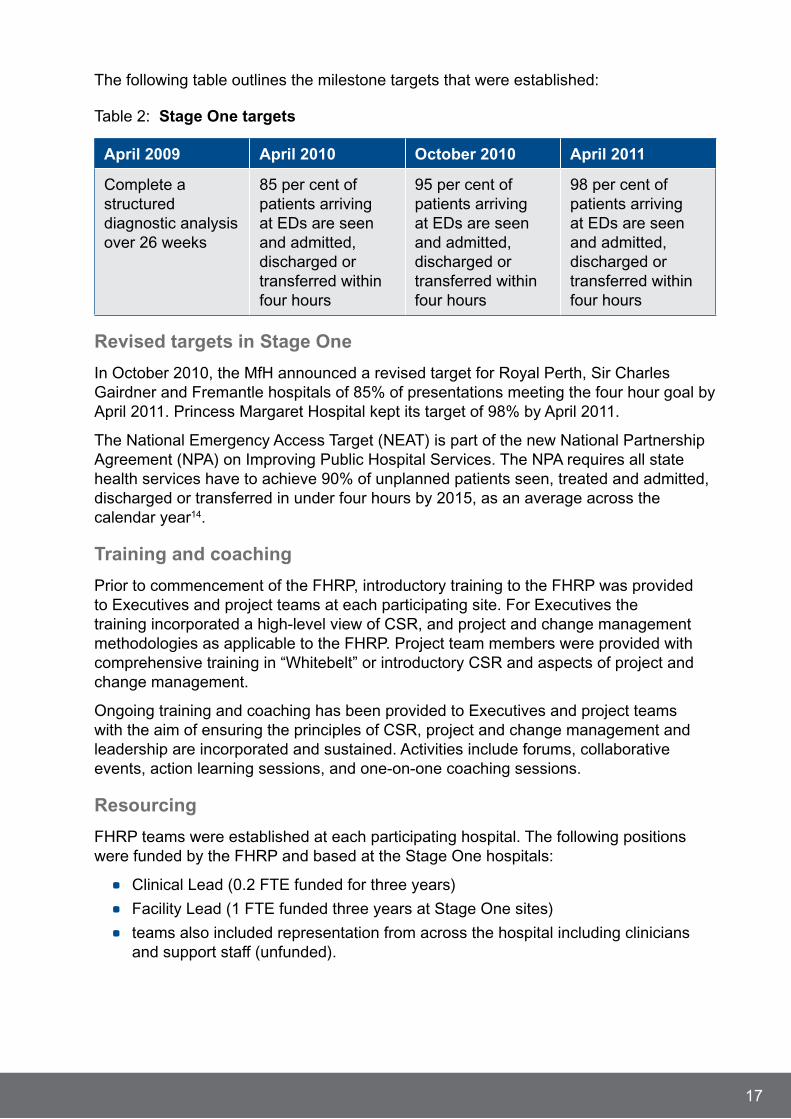
The following table outlines the milestone targets that were established:
Table 2: Stage One targets
April 2009 April 2010 October 2010 April 2011
Complete a structured diagnostic analysis over 26 weeks
85 per cent of patients arriving at EDs are seen and admitted, discharged or transferred within four hours
95 per cent of patients arriving at EDs are seen and admitted, discharged or transferred within four hours
98 per cent of patients arriving at EDs are seen and admitted, discharged or transferred within four hours
Revised targets in Stage One
In October 2010, the MfH announced a revised target for Royal Perth, Sir Charles Gairdner and Fremantle hospitals of 85% of presentations meeting the four hour goal by April 2011. Princess Margaret Hospital kept its target of 98% by April 2011.
The National Emergency Access Target (NEAT) is part of the new National Partnership Agreement (NPA) on Improving Public Hospital Services. The NPA requires all state health services have to achieve 90% of unplanned patients seen, treated and admitted, discharged or transferred in under four hours by 2015, as an average across the calendar year14.
Training and coaching
Prior to commencement of the FHRP, introductory training to the FHRP was provided to Executives and project teams at each participating site. For Executives the training incorporated a high-level view of CSR, and project and change management methodologies as applicable to the FHRP. Project team members were provided with comprehensive training in “Whitebelt” or introductory CSR and aspects of project and change management.
Ongoing training and coaching has been provided to Executives and project teams with the aim of ensuring the principles of CSR, project and change management and leadership are incorporated and sustained. Activities include forums, collaborative events, action learning sessions, and one-on-one coaching sessions.
Resourcing
FHRP teams were established at each participating hospital. The following positions were funded by the FHRP and based at the Stage One hospitals:
* Clinical Lead (0.2 FTE funded for three years)
* Facility Lead (1 FTE funded three years at Stage One sites)
* teams also included representation from across the hospital including clinicians and support staff (unfunded).
17
Each hospital was provided with centrally based:
* program advisory/coaching support (26 weeks)
* data support (26 weeks).
Non-recurrent funding was available for approved site-based and statewide solutions.
Solutions
In order to reach the FHRP targets, sites were required to use the CSR methodology to improve hospital services for the patient. Solutions were developed to address the root causes they have identified in the diagnostic phase of the FHRP. Many solutions are process changes that do not require any additional funding. For those that do require funding, sites have the opportunity to apply through the business case process.
To acquire Commonwealth of Australia Government (COAG) funds for solutions, hospitals were required to submit a business case, using a template that has been tailored to the FHRP. To be successful business cases must address all of the selection criteria, and demonstrate adherence to the CSR methodology. Stage One hospitals have had access to four business case rounds.
The types of solutions that have been implemented at each site (both funded and unfunded) are described in more detail in Section 6. An assessment of the application of the CSR process, hospital adherence to the methodology and the implementation of the solutions has been undertaken as part of this Review and is outlined in Section 6.
3.6 Monitoring change and quality
Statewide FHRP dashboard
A Statewide Program Dashboard monitors the progress of hospital sites against the overall target as well as a number of safety and quality indicators. It is a high-level system monitoring tool and was developed in consultation with the FHRP Working Group, the WA Health Operations Review Committee and the Performance Activity and Quality Division (PAQ).
The Performance Reporting Branch of PAQ is responsible for generating the Statewide Dashboard for the FHRP. Definitions for each of the Key Performance Indicators (KPIs) are Western Australian Health Management Information Group (WAHMIG) approved.
Sites are encouraged to develop and monitor their own more detailed and specific KPIs and have access to a site-specific dashboard for the purposes of internal reporting, developed by the HSIU Data Analysts.
Program governance
The DG is ultimately accountable for the success of the FHRP. The FHRP is governed by a Statewide FHRP Steering Committee and is a standing item on State Health Executive Forum’s Operations Review Committee agenda. The FHRP Control Group meets regularly and representatives from the FHRP management and implementation groups report to it. Please refer to Appendix A for the governance structure.
18
4. Rationale for the review
In June and July 2011, complaints were made by the Australian Medical Association (AMA) and the Royal Australasian College of Surgeons (RACS) regarding the FHRP.
The key issues published in The West Australian newspaper in June 2011 outlined the AMA’s concerns following a survey of 200 junior doctors as:
* eight out of ten junior doctors said it was compromising their ability to care for patients properly
* the FHRP was affecting their training
* 89 per cent said they were feeling pressure from other staff.
In the same month concerns were raised by the RACS with the following issues also published in The West Australian in June 2011:
* the FHRP had shifted the problem of access block out of ED and into the ward areas
* patients were being sent to the wrong wards which could compromise patient care
* on call medical staff, notably surgical registrars working across sites, were working unsafe hours
* patients being allocated to wards where a bed was not immediately available had their privacy compromised by being placed in the circulation space of a four bed room or in the corridor.
The MfH, the DG of Health and key stakeholders of the FHRP attended staff forums held at the tertiary hospitals to hear staff concerns in July 2011.
The main concerns that were raised at the staff forums include but are not limited to:
* pressure on emergency staff to make decisions too quickly without sufficient time to create a management plan before admission
* general increase in workloads and the need for additional FTE to cope with increased demand and the FHRP was expressed by all employee groups
* access to services such as imaging and pharmacy, especially outside of ‘business hours’ was perceived to be a barrier to meeting the targets
* bed occupancy at tertiary hospitals
* availability of community resources such as residential care.
* inappropriate admissions and referrals
* decreased medical officer training, especially in ED
* shift of work from ED to wards, and issue of resources following that shift to respond to higher patient acuity.
In a media release from July 2011, the MfH stated that staff forums held at Perth’s major hospitals in the past week had shown strong support for the FHRP but there were areas and pressure points that needed to be addressed8, warranting review.
19
While it is important to address issues of clinician dissatisfaction with resourcing and peer or supervisor pressure, the WA Department of Health (DoH) values the quality and safety of patient care as the highest priority8. For this reason the DG of Health commissioned this independent review of the FHRP across Western Australia’s Stage One public hospitals, announced on July 21, 2011. Professor Bryant Stokes was appointed as an independent authority to undertake the Review.
The Four Hour Rule Program Progress and Issues Review Terms of Reference (TOR) are:
1. Review the key issues from the staff forums of July 2011 and ascertain the scope and impact of these issues.
2. Review the integrity of the existing reporting of data of the Four Hour Dashboard Measures and recommend what if any additional Safety and Quality Measures could be incorporated into the Statewide Dashboard to monitor areas of particular concern.
3. Investigate whether the implementation of the Four Hour Rule Program is being implemented as per the agreed methodology.
4. Examine the impact of agreed solutions being implemented for the hospitals in-scope and specifically whether there have been unforeseen negative impacts as noted in staff forums. In addition ascertain whether any risk mitigation strategies have been developed and employed.
5. If occurring, examine why agreed solutions as per the signed-off implementation plan have not been implemented at the hospitals in-scope.
6. Review what additional solutions should be considered and supported within scope of the current Four Hour Rule business rules.
7. Review what additional solutions could be considered that are not within scope of the current Four Hour Rule business rules.
8. Comment re any financial implications of service 6 and 7.
9. Review stakeholder engagement strategies at sites and recommend additional strategies to be considered.
A Review Working Group with representatives from across the Stage One hospitals and health professions was convened to provide advice to the Reviewer. For the full TOR see Appendix B.
20
5. Investigation
5.1 Ministerial consultation
Staff forums were held in July 2011 at each of the Stage One hospitals to enable the MfH to meet with staff and hear their concerns about the FHRP. Unfortunately the meetings were scheduled at short notice, to coincide with the Minister’s availability and some staff expressed concern that they were unable to attend these forums.
The MfH made verbal commitments to fund a range of initiatives at the forums and it was perceived by some employees that the resources that were committed were granted without a robust CSR approach. A subsequent business case round was opened, with the aim of addressing the problems raised at the forums. The Reviewer was advised that to be successful, these business cases still needed evidence that funding would address root causes identified through CSR.
5.2 The Four Hour Rule Program Review
This Review was established in response to staff concerns raised following initial consultation with the MfH to more fully investigate staff issues and concerns.
The Reviewer adopted a consultative approach to thoroughly investigate the matters raised by staff, in accordance with the TOR. Key positions and professional groups were identified, and representatives were contacted from each hospital. Many of these interviews resulted in referrals for the Reviewer to meet with other representatives, to gain a more comprehensive appreciation of the issues with the FHRP. A proportion of those consulted approached the review team independently to contribute their views on the FHRP.
The majority of the interviews were recorded using a digital voice recorder, and then transcribed by a private contractor. Some were not recorded at the request of representatives. In these instances notes were taken during the meeting. The transcripts and notes were used for the purpose of the Review in order to enable key themes and issues to be identified and carefully considered.
Wherever possible the Review has sought to clarify issues of concern raised by staff, for example analysing data to see if it supports perceptions of increased admissions or Medical Emergency Team (MET) calls. In addition the review team received phone calls and written submissions from staff and community members.
There was a much higher level of interest in contributing to the Review than was originally anticipated, with 316 staff consulted throughout the process. The review database shows that 93 per cent of staff engaged were from the Stage One hospitals. This is shown in Figure 4.
Others consulted included the AMA, RACS, Area Health Service representatives, members of the public and health consumer agencies, totalling seven per cent. Figure 5 shows the range of staff consulted by position.
21
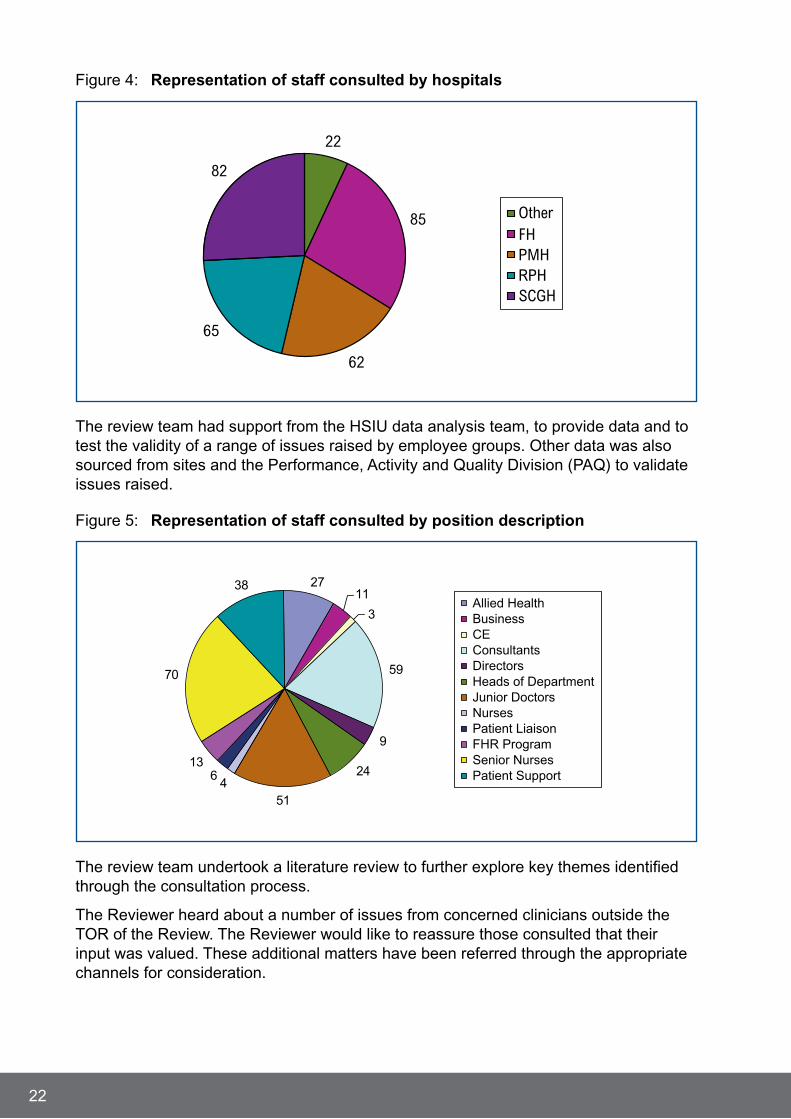
Figure 4: Representation of staff consulted by hospitals
The review team had support from the HSIU data analysis team, to provide data and to test the validity of a range of issues raised by employee groups. Other data was also sourced from sites and the Performance, Activity and Quality Division (PAQ) to validate issues raised.
Figure 5: Representation of staff consulted by position description
The review team undertook a literature review to further explore key themes identified through the consultation process.
The Reviewer heard about a number of issues from concerned clinicians outside the TOR of the Review. The Reviewer would like to reassure those consulted that their input was valued. These additional matters have been referred through the appropriate channels for consideration.
22
22
85
62
65
82
OtherFHPMHRPHSCGH
2711
3
59
9
24
5146
13
70
38Allied HealthBusinessCEConsultantsDirectorsHeads of DepartmentJunior DoctorsNursesPatient LiaisonFHR Program Senior NursesPatient Support
6. Findings
The FHRP has been one of the largest reform initiatives undertaken by WA Health. The hospitals in Stage One of the FHRP are large, complex, tertiary institutions, and the magnitude of the change required to address access block should not be underestimated. Political and media attention has been focused on the clock and in the Reviewer’s opinion has detracted from the intention to redesign processes across the whole hospital to improve the quality of patient care. The focus has subsequently been placed on the ED while improvements further within the hospital do not appear to be so adequately addressed.
Through consultation with staff from across the Stage One hospitals, the review team gained a wealth of knowledge on current issues and the themes that arose from all professional groups were clear and consistent. Despite a common perception that these issues have been caused by the FHRP, the review team has found that the reform process has butted up against entrenched attitudes and behaviours and systematic issues that have existed long before the reform was implemented and with an increasing demand on services.
Activity and demand
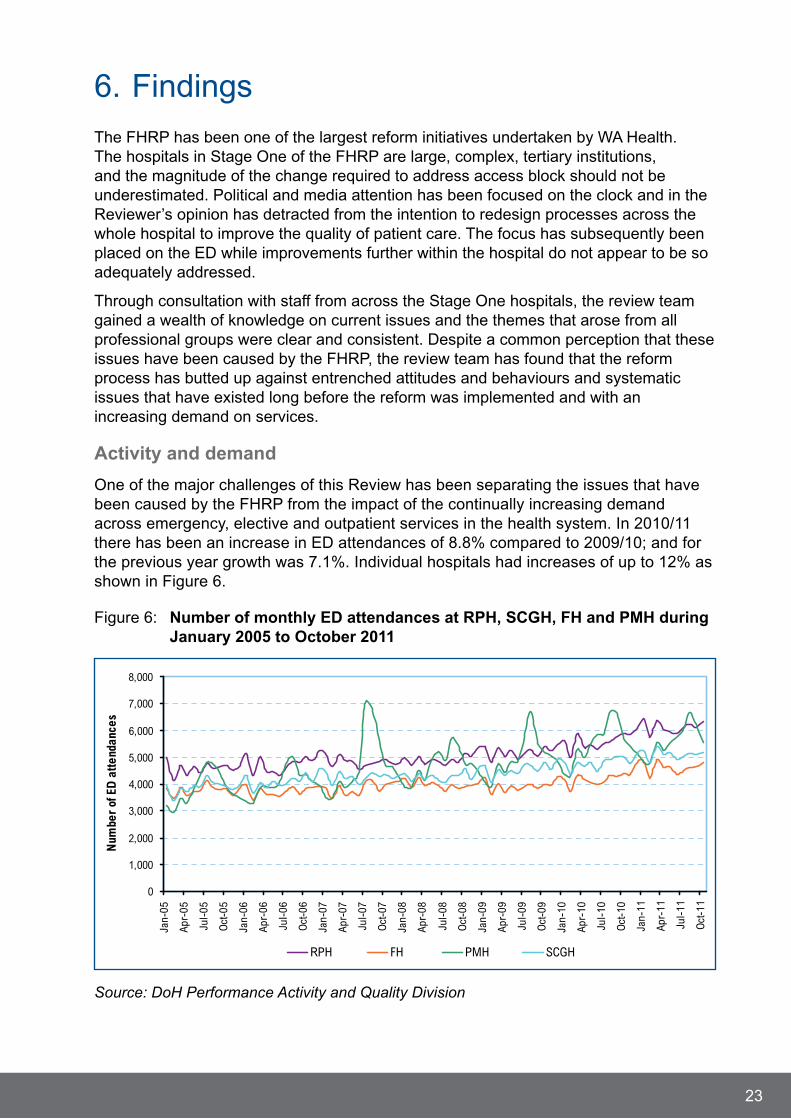
One of the major challenges of this Review has been separating the issues that have been caused by the FHRP from the impact of the continually increasing demand across emergency, elective and outpatient services in the health system. In 2010/11 there has been an increase in ED attendances of 8.8% compared to 2009/10; and for the previous year growth was 7.1%. Individual hospitals had increases of up to 12% as shown in Figure 6.
Figure 6: Number of monthly ED attendances at RPH, SCGH, FH and PMH during January 2005 to October 2011
23
Source: DoH Performance Activity and Quality Division
0
1,000
2,000
3,000
4,000
5,000
6,000
7,000
8,000
Jan-05
Apr-05
Jul-05
Oct-05
Jan-06
Apr-06
Jul-06
Oct-06
Jan-07
Apr-07
Jul-07
Oct-07
Jan-08
Apr-08
Jul-08
Oct-08
Jan-09
Apr-09
Jul-09
Oct-09
Jan-10
Apr-10
Jul-10
Oct-10
Jan-11
Apr-11
Jul-11
Oct-11
Num
ber
of E
D a
ttend
ance
s
RPH FH PMH SCGH
Many of the issues that have been raised are due to the demand for services increasing at a much quicker rate than infrastructure or workforce resources. This is especially true in the absence of CSR to ensure hospital processes and work practices are engineered around providing safe, timely and high quality patient care.
It is evident that the increasing demand is impacting on the workload of staff across the hospitals, and this is causing stress for staff. The FHRP appears to be magnifying this stress by putting timeframes on staff.
6.1 Four hour timeframe
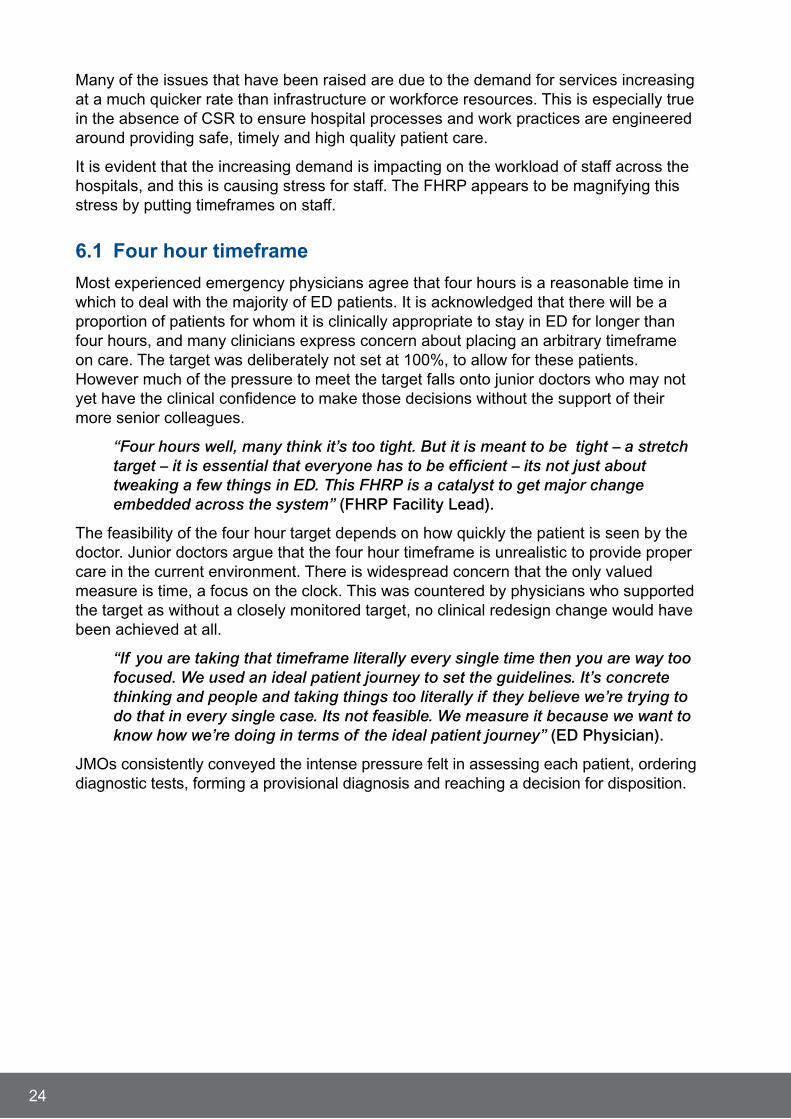
Most experienced emergency physicians agree that four hours is a reasonable time in which to deal with the majority of ED patients. It is acknowledged that there will be a proportion of patients for whom it is clinically appropriate to stay in ED for longer than four hours, and many clinicians express concern about placing an arbitrary timeframe on care. The target was deliberately not set at 100%, to allow for these patients. However much of the pressure to meet the target falls onto junior doctors who may not yet have the clinical confidence to make those decisions without the support of their more senior colleagues.
“Four hours well, many think it’s too tight. But it is meant to be tight – a stretch target – it is essential that everyone has to be efficient – its not just about tweaking a few things in ED. This FHRP is a catalyst to get major change embedded across the system” (FHRP Facility Lead).
The feasibility of the four hour target depends on how quickly the patient is seen by the doctor. Junior doctors argue that the four hour timeframe is unrealistic to provide proper care in the current environment. There is widespread concern that the only valued measure is time, a focus on the clock. This was countered by physicians who supported the target as without a closely monitored target, no clinical redesign change would have been achieved at all.
“If you are taking that timeframe literally every single time then you are way too focused. We used an ideal patient journey to set the guidelines. It’s concrete thinking and people and taking things too literally if they believe we’re trying to do that in every single case. Its not feasible. We measure it because we want to know how we’re doing in terms of the ideal patient journey” (ED Physician).
JMOs consistently conveyed the intense pressure felt in assessing each patient, ordering diagnostic tests, forming a provisional diagnosis and reaching a decision for disposition.
24

There was concern about the development of a “two hour rule” which refers to a guideline for bed bookings, where a decision regarding the patient’s disposition (admission or discharge) from ED needs to be made in two hours.
It has also been claimed that the four hour time frame is reducing training opportunities for junior doctors. Representatives stated that there is no longer time for them to practise procedures or come to diagnoses themselves, or if there is an interesting case for everyone to stop what they’re doing and come and learn from the case.
Junior doctors expressed concern that the ED was just one part of the patient’s journey, now truncated to four hours. There was a clear perception that the ED was now just a triaging point, ‘patch and dispatch’. ED was formerly seen as a stand alone identity at each hospital and now it is a more integrated part of the hospital.
The Reviewer strongly supports consultant clinician led ED teams to provide early senior clinician involvement in patient triage, assessment and management and essential guidance and support for medical and nursing staff in ED. This will facilitate the early engagement of the allied health teams who can add significant value to the patient’s care.
Clerical staff felt constant pressure on work practices and not being able to take the time to get important details right. Co-ordinators have observed an increase in the frequency of unintended errors in administration processes, such as allocating the wrong patient identification, new medical records being generated instead of pulling the patient’s existing records (due to time constraints) and misfiled documentation.
Allied health co-ordinators and allied health staff were supportive of CSR and considered that the FHRP had improved the patient’s experience in ED. There was a clear perception from all allied health forums that patients could be discharged from ED with a little more time to form the best plan for care in the community. Clinicians have perceived an increase in inappropriate decisions regarding support options that were not in the best interest of the patient, “Just get the patient into respite” as opposed undertaking a detailed assessment and tailoring a supported discharge with the lowest level of care required.
Complex care teams and allied health representatives felt that the observation wards or CDUs could be used to address therapy interventions in a timely and appropriate manner within EDs. The teams were aware of the down stream impact of unnecessary admissions on support staff.
The ED target implies that it is only ED that needs to change. This is misguided as issues with patient flow in ED are impacted by processes within the hospitals. The FHR Program was implemented with a hospital wide perspective; it is about using WA Health’s CSR methodology to re-engineer processes across the whole hospital.
25

The FHR Program office staff believe that too much emphasis has been placed on the ED:
“One of the problems here (in ED) is that because of the existence of EDIS, staff can track what’s happening in ED. When the patient hits the ward, there is much less data available about the patient journey. We can’t see or measure critical milestones” (FHRP Facility Lead).
ED physicians were generally satisfied with the achievements that have resulted from the FHRP in addressing overcrowding.
Before the FHRP was implemented, the burden of increasing demand for unplanned services rested with ED. Inpatient teams are now required to accept responsibility for these patients by planning for emergency activity.
6.2 Safety and quality in patient care
Many staff raised concerns around the effect of the FHRP on patient care. Staff perceive that patients are being pushed through the ED too quickly and that there has been a shift in the workload traditionally managed in ED, to the ward. Undoubtedly if patients are being admitted after spending less time in the ED, patients are arriving on the ward sicker and ED may have had less opportunity to complete the usual suite of investigations and procedures. Junior doctors described the situation as ‘patients not being fully worked up or packaged’.
Clinical staff agreed that the acuity of patients had increased in the ward areas. There was a shift of work from ED to the wards which had increased pressure on ward staff. It is essential that roster configurations reflect the shift in acuity from ED to the wards, cognisant of the skill mix required to manage the more complex caseload. The review team considered patient acuity by examining the triage category 1-3 admitted to the Stage One hospitals (Figure 7).
The data shows that Stage One overall show an increase in the proportion of higher acuity admissions by approximately 6-9% in two years. With a shift in patient acuity, ward resources would need to be reviewed in the context of CSR and augmented.
26

Figure 7: Triage category 1-3 monthly, admissions at RPH, SCGH, FH and PMH during January 2005 to October 2011
Source: DoH HSIU Data Unit
To investigate the issues raised, the review team considered data from a range of sources including the FHRP Dashboard, WA Health central data collections, health consumer agencies and hospital sites.
The Four Hour Rule Program dashboard
The dashboard is a high level monitoring tool. It may not be particularly sensitive at a patient or departmental level; however it is useful for hospital and health service leaders to monitor how their service is performing across a broad range of indicators. A common concern of junior doctors is that these measures are not relevant, especially in terms of capturing acuity and morbidity on the ward. Hospitals and the units within them need to determine what measures are important and meaningful to them and monitor this at a unit level. The dashboard provides a list of indicators as outlined in Table 3.
During the life of the FHRP, there has been ongoing discussion about what indicators should be used to monitor the impact of the FHRP. There appears to have been difficulty in agreeing about what is feasible to collect and what may be shared and published. The FHRP has an established set of 25 indicators which are outlined in Table 3. All definitions are developed by Western Australian Health Management Information Group.
27
Higher acuity presentations (triage 1-3): Per cent admitted by month
30%
35%
40%
45%
50%
55%
60%
65%
70%O
ctob
er
Nove
mbe
r
Dec
embe
r
Janu
ary
Febr
uary
Mar
ch
April
May
June
July
Augu
st
Sept
embe
r
Oct
ober
Nove
mbe
r
Dec
embe
r
Janu
ary
Febr
uary
Mar
ch
April
May
June
July
Augu
st
Sept
embe
r
Oct
ober
Nove
mbe
r
2009 2010 2011
Royal Perth Hospital Fremantle Hospital Princess Margaret Hospital Sir Charles Gairdner Hospital Stage 1
Per
cent
age

Table 3: FHRP Dashboard Indicators
Activity and utilisation measures
1. ED attendances
2. Admissions from ED – total
3. Percentage of emergency department attendances admitted
4. Admissions from emergency department (mental health)
5. Percentage of emergency department attendances transferred to another hospital
System integration and change measures
6. Percentage of emergency department attendances that were seen and admitted, discharged or transferred in four hours or less (length of episode ≤ 4 hours)
7. Percentage of emergency department attendances with a length of episode (LOE) > 12 hours
8. Percentage of emergency department admissions with a length of episode (LOE) ≤ 4 hours
9. Percentage of emergency department transfers in four hours or less (length of episode ≤ four hours) – total
10. Percentage of emergency department transfers in four hours or less (length of episode ≤ four hours) – admitted
11. Percentage of emergency department transfers in four hours or less (length of episode ≤ four hours) – departure
12. Percentage of emergency department departures in four hours or less (length of episode ≤ four hours)
13. Percentage of admitted patients discharged before 10:00am
14. Percentage of emergency department attendances which are unplanned re-attendances (≤ 48 hours of previous attendance) – attendances
15. Percentage of emergency department attendances which are unplanned re-attendances (≤ 48 hours of previous attendance) – patients
Quality and clinical outcome measures
16. Percentage of hospital mortality from emergency department (ED) admissions
17. Health care associated infection rate
18. Number of reported sentinel events
19. Reported complaints
20. Average number of available active sameday beds/chairs (weekday)
21. Average number of available active sameday beds/chairs (weekend)
22. Average number of available active multiday (overnight) beds/chairs
23. Multiday bed occupancy
24. Percentage of multiday beds occupied by patients admitted from emergency department (ED)
25. Hours of ambulance ramping
28
The UK also had this problem identifying indicators, encapsulated by Lord Darzi in his paper High Quality Care for All (2008)1:
“Commitments have been made over a number of years to publish information on clinical effectiveness. Too often these commitments have been held up by uncertainties about what was needed to make progress and disagreements about who should be in charge. This is unacceptable; we should be seeking to create a more transparent NHS.”
Many junior doctors and doctors in training expressed concerns about the lack of data available on inpatients to measure care and delays in care.
“We can’t measure time to first review by a consultant or a senior registrar for ward admissions if they haven’t been reviewed in ED prior to admission. It is definitely hours and for consultants is more likely days. How can we improve care if we have no data to tell us where the delays are?” (JMO).
Patient satisfaction
To investigate the issue of patient satisfaction with the FHRP, the review team consulted with the Executive Director of the Health Consumers’ Council (HCC) and the Chief Executive Officer of Health and Disability Services Complaints Office (HaDSCO). The patient liaison officers working in each hospital were consulted and complaints data was analysed.
Generally patients are satisfied with the impact the FHRP has had on their care. The feedback from the HCC has been very positive. In the last 12 months, the HCC received 489 complaints and only three were related to the FHRP. None of these related to patient care or treatment. HADSCO indicated that there was no evidence of an increase or change in profile of complaints related to the FHRP.
Patient liaison officers indicated that patients or their carers were often concerned about the manner in which information was conveyed to them. There was a sense that clinical staff had perhaps been abrupt or rude in conveying information. Evidence could not be found to link these concerns to the FHRP.
Main complaints related to:
* arriving on the ward and the bed is not ready and/or staff unaware that they would be coming
* multiple bed moves
* discharge delays and long waits in discharge lounges, that may not be staffed out of hours.
29

Complaints data, available on the FHRP Dashboard, are from across the hospital and are not specific to the FHRP. A complaint is defined as the number of documented complaints made by or on behalf of an individual expressing dissatisfaction regarding any aspect of service provided. The data presented in Figure 8 shows that the number of patient complaints has remained stable over the 2008 to 2011 period. It must be noted these are raw numbers not rates. Hospitals cannot be compared without taking the number of presentations into account.
Figure 8: Number of patient complaints for Stage One Hospitals January 2008 to October 2011
Source: DoH Performance Activity and Quality Division
Clinical incidents
The review team heard a number of anecdotes about clinical incidents that were perceived to be due to the FHRP. A number of clinical staff indicated that there was no point reporting clinical concerns or incidents as the process of reporting did not result in prompt investigation and follow up to the reporter. Staff reported ‘there’s no point – nothing happens when you complete a form’.
This is a serious matter that goes beyond the FHRP. There must be an effective system in place for reporting and addressing clinical incidents in a timely fashion, or the fundamental principles of quality and safety in the hospital is compromised.
WA has a voluntary reporting system for clinical incidents. Following consultation with the DoH Office of Safety and Quality the trend data over the last three years (2008-2010) doesn’t show a change in reporting behaviour and severe adverse events continue to be reported. It is noted that 78% of reports were documented by nurses and this figure is quite consistent over the period.
30
0
20
40
60
80
100
120
140
Jan-
08Fe
b-08
Mar
-08
Apr-
08M
ay-0
8Ju
n-08
Jul-0
8Au
g-08
Sep-
08O
ct-0
8N
ov-0
8D
ec-0
8Ja
n-09
Feb-
09M
ar-0
9Ap
r-09
May
-09
Jun-
09Ju
l-09
Aug-
09Se
p-09
Oct
-09
Nov
-09
Dec
-09
Jan-
10Fe
b-10
Mar
-10
Apr-
10M
ay-1
0Ju
n-10
Jul-1
0Au
g-10
Sep-
10O
ct-1
0N
ov-1
0D
ec-1
0Ja
n-11
Feb-
11M
ar-1
1Ap
r-11
May
-11
Jun-
11Ju
l-11
Aug-
11Se
p-11
Oct
-11
Num
ber
of r
epor
ted
com
plai
nts
SCGH RPH FH PMH Total (RPH, SCGH, FH and PMH)
Months

Medical Emergency Team (MET) calls
Through the consultation process junior doctors, nurses and support staff indicated that MET calls had increased since the introduction of the FHRP. It was suggested this was one way to measure morbidity on the ward. The data provided to the review team by the hospitals shows that MET calls have been increasing since 2008/2009. It is difficult to assess the impact of the FHRP implementation on these figures, as there has been a considerable focus in the hospitals to improve the MET system in recent years.
Education and training has been provided to clinicians to encourage the application of MET criteria in identifying the deteriorating patient with the activation criteria being widely distributed and enforced at unit level. Hospitals have initiated multi-disciplinary MET simulation training as well as other programs to improve recognition and management of the deteriorating patient.
Research indicates that the rate of MET calls in a hospital is inversely related to cardiac arrest and or respiratory arrest calls (i.e. increased sensitivity) to the deteriorating patient is a positive safety and quality outcome for the hospital. Jones et al 200915 discussed the concept of MET ‘dose’ and code blue calls as indicators of safety and quality. The concept of ‘dose’ was proposed as a calculation of the number of MET events per 1000 admissions. The application of this approach was considered by the review team, however MET and code blue data are not collected contemporaneously or in a consistent format across the Stage One hospitals to enable analysis.
It is noted that increased MET calls will have resource implications for the hospitals and this must be considered in future resourcing strategies.
Mortality
There has been discussion around how useful a crude mortality measure is, given that admissions are also increasing. Use of a hospital standardised mortality ratio would be more meaningful, however the Review Team understands that this cannot be provided in the contemporaneous fashion required of a dashboard. The FHRP dashboard measures crude mortality rates. The data clearly shows that mortality has reduced over the FHRP for stage one hospitals (see Figure 9).
31
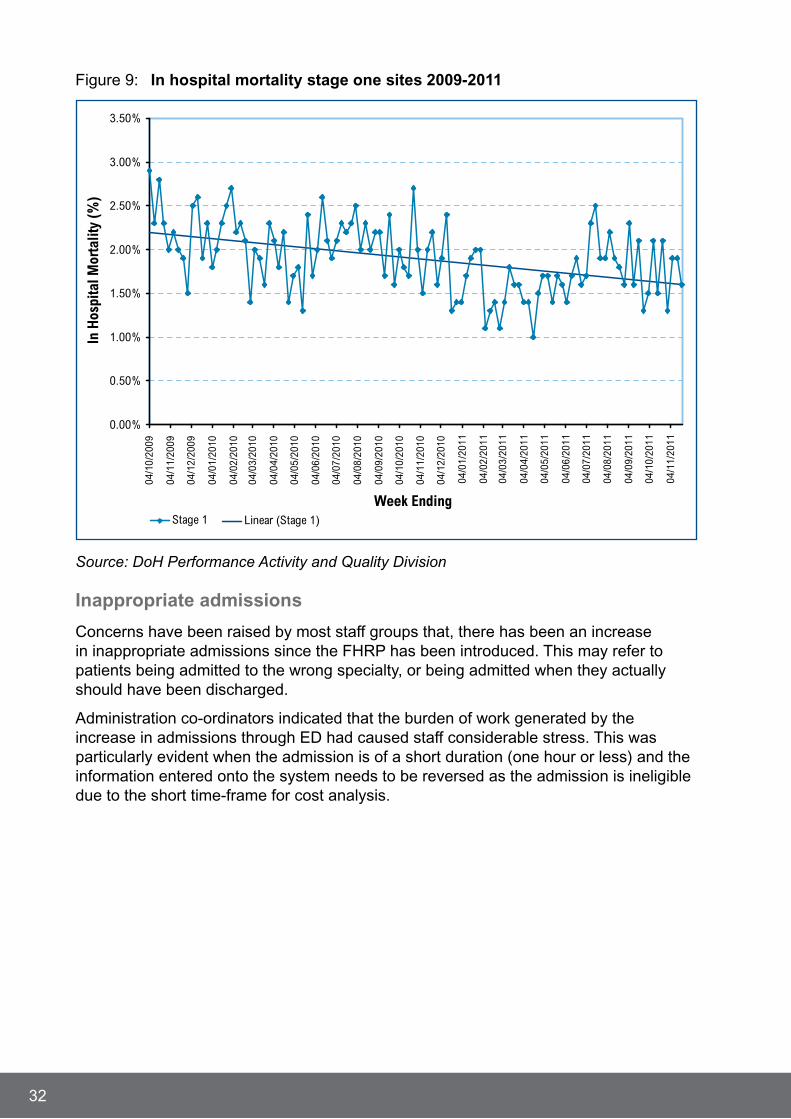
Figure 9: In hospital mortality stage one sites 2009-2011
Source: DoH Performance Activity and Quality Division
Inappropriate admissions
Concerns have been raised by most staff groups that, there has been an increase in inappropriate admissions since the FHRP has been introduced. This may refer to patients being admitted to the wrong specialty, or being admitted when they actually should have been discharged.
Administration co-ordinators indicated that the burden of work generated by the increase in admissions through ED had caused staff considerable stress. This was particularly evident when the admission is of a short duration (one hour or less) and the information entered onto the system needs to be reversed as the admission is ineligible due to the short time-frame for cost analysis.
32
0.00%
0.50%
1.00%
1.50%
2.00%
2.50%
3.00%
3.50%
04/1
0/20
09
04/1
1/20
09
04/1
2/20
09
04/0
1/20
10
04/0
2/20
10
04/0
3/20
10
04/0
4/20
10
04/0
5/20
10
04/0
6/20
10
04/0
7/20
10
04/0
8/20
10
04/0
9/20
10
04/1
0/20
10
04/1
1/20
10
04/1
2/20
10
04/0
1/20
11
04/0
2/20
11
04/0
3/20
11
04/0
4/20
11
04/0
5/20
11
04/0
6/20
11
04/0
7/20
11
04/0
8/20
11
04/0
9/20
11
04/1
0/20
11
04/1
1/20
11
Stage 1 Linear (Stage 1)
Week Ending
In H
ospi
tal M
orta
lity
(%)

There is a general perception that this is happening to prevent breaches of the four hour target.
“The patient is about to breach, just get them into a bed, any bed, instead of taking a little bit longer to make an accurate disposition decision” (Senior Clinician).
Unnecessary bed moves are not in the best interests of quality patient care. The patient should go to a unit with the correct skill mix and equipment for their condition, the first time. Increased handovers increase the potential for error. Inappropriate admissions also cause extra work for all staff across clinical and support services in terms of time, paperwork, cleaning, clerking and so on. Once a patient is an outlier it can be difficult to get them back to the right ward. This is further complicated by an overarching ‘silo’ culture that is present in some of the hospitals; the review team heard accounts of specialties refusing to take patients considered to be appropriate.
“Outliers are identified as a clinical risk as patients placed in wards where the nursing and allied health teams are often unfamiliar with their clinical condition and could miss the more subtle signs of patient deterioration” (Senior Clinician).
To investigate if the FHRP has impacted on inappropriate admissions, the review team looked at changes in speciality and ward moves, discharges within 12 and 24 hours, and inpatient specialty length of stay. Overall, there is no evidence to support perceptions that the FHRP has increased inappropriate admissions in the Stage One hospitals.
The Reviewer discussed the higher than expected admission rate observed in Stage One hospitals with visiting UK delegates Professor Matthew Cooke, National Clinical Director Urgent and Emergency Care England and Hon Alan Milburn, Former Health Secretary, who were unable to explain this considerable variance from the UK experience. One suggestion is that community resources, especially residential care, are well resourced in the UK compared to WA. This position was validated by:
“The discharge practices and the ability to move clients in to the community need to be streamlined. Patients live in the community; a hospital event is a sentinel event... you’ve really got to strengthen the back door community approach. Their (UK) community sector which includes aged care is so much more advanced than ours, due to geography and population density” (WA Health Senior Manager).
Change of specialty within 24 hours
The data shows that there has been no overall increase in the proportion of specialty movements across the Stage One hospitals. This is outlined in Figure 10. PMH has experienced a very slight increase, while the other sites show no significant change.
33
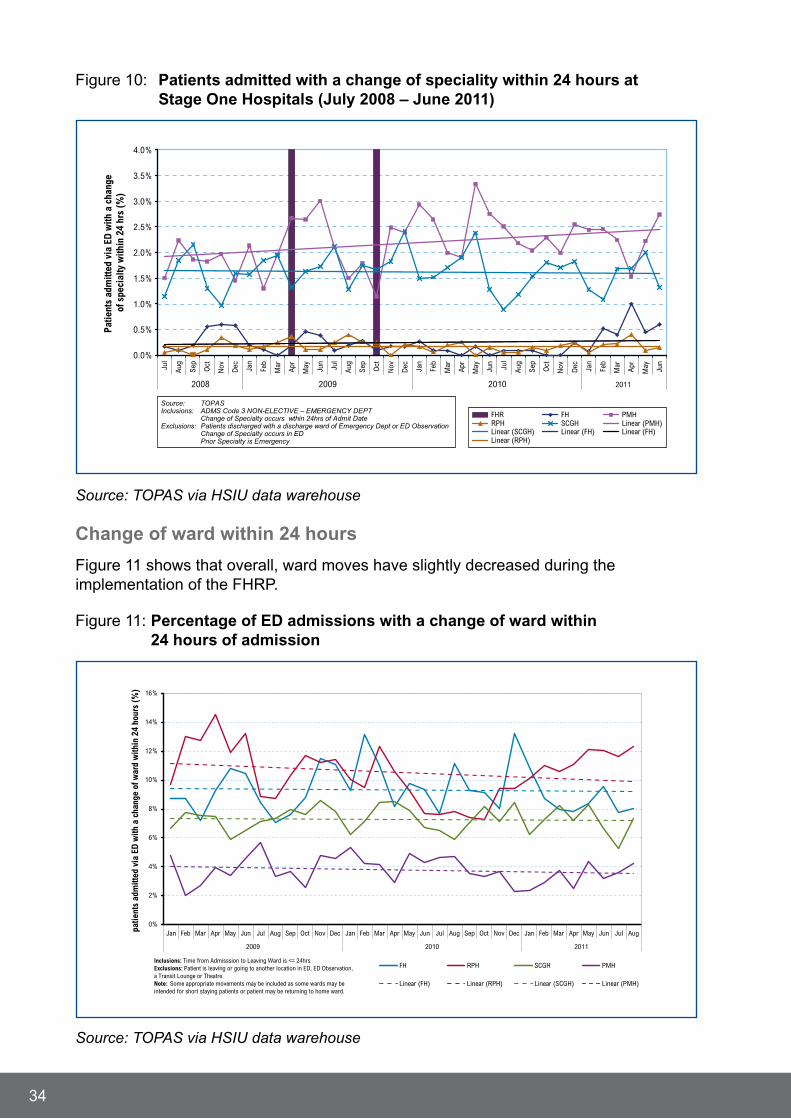
Figure 10: Patients admitted with a change of speciality within 24 hours at Stage One Hospitals (July 2008 – June 2011)
Source: TOPAS via HSIU data warehouse
Change of ward within 24 hours
Figure 11 shows that overall, ward moves have slightly decreased during the implementation of the FHRP.
Figure 11: Percentage of ED admissions with a change of ward within 24 hours of admission
Source: TOPAS via HSIU data warehouse
34
0.0%
0.5%
1.0%
1.5%
2.0%
2.5%
3.0%
3.5%
4.0%Ju
l
Aug
Sep
Oct
Nov Dec Jan
Feb
Mar
Apr
May Jun
Jul
Aug
Sep
Oct
Nov Dec Jan
Feb
Mar
Apr
May Jun
Jul
Aug
Sep
Oct
Nov Dec Jan
Feb
Mar
Apr
May Jun
2008 2009 2010 2011
FHSCGHLinear (FH)
PMHLinear (PMH)Linear (FH)
FHRRPHLinear (SCGH)Linear (RPH)
Source: TOPASInclusions: ADMS Code 3 NON-ELECTIVE – EMERGENCY DEPT Change of Specialty occurs wthin 24hrs of Admit DateExclusions: Patients discharged with a discharge ward of Emergency Dept or ED Observation Change of Specialty occurs in ED Prior Specialty is Emergency
Patie
nts
adm
itted
via
ED
with
a c
hang
e of
spe
cial
ty w
ithin
24
hrs
(%)
0%
2%
4%
6%
8%
10%
12%
14%
16%
Jan Feb Mar Apr May Jun Jul Aug Sep Oct Nov Dec Jan Feb Mar Apr May Jun Jul Aug Sep Oct Nov Dec Jan Feb Mar Apr May Jun Jul Aug
2009 2010 2011
FH RPH SCGH PMH
Linear (FH) Linear (RPH) Linear (SCGH) Linear (PMH)
Inclusions: Time from Admisssion to Leaving Ward is <= 24hrs Exclusions: Patient is leaving or going to another location in ED, ED Observation, a Transit Lounge or Theatre. Note: Some appropriate movements may be included as some wards may be intended for short staying patients or patient may be returning to home ward.
patie
nts
adm
itted
via
ED
with
a c
hang
e of
war
d w
ithin
24
hour
s (%
)
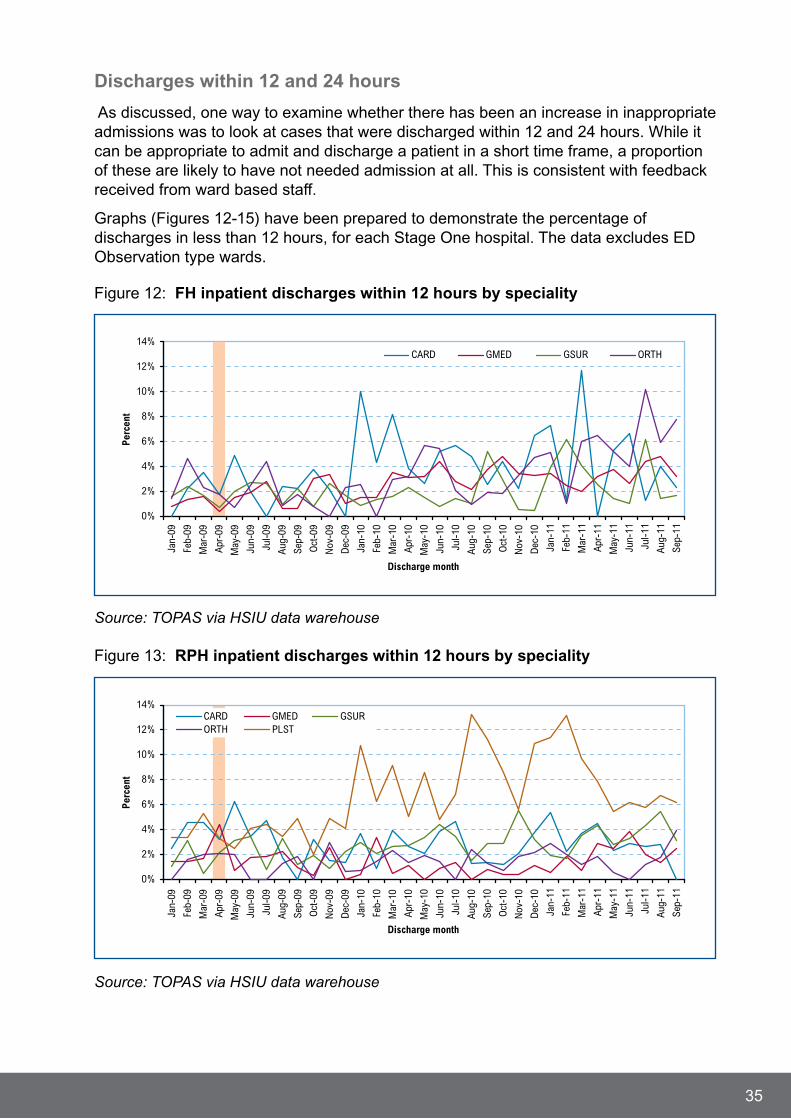
Discharges within 12 and 24 hours
As discussed, one way to examine whether there has been an increase in inappropriate admissions was to look at cases that were discharged within 12 and 24 hours. While it can be appropriate to admit and discharge a patient in a short time frame, a proportion of these are likely to have not needed admission at all. This is consistent with feedback received from ward based staff.
Graphs (Figures 12-15) have been prepared to demonstrate the percentage of discharges in less than 12 hours, for each Stage One hospital. The data excludes ED Observation type wards.
Figure 12: FH inpatient discharges within 12 hours by speciality
Source: TOPAS via HSIU data warehouse
Figure 13: RPH inpatient discharges within 12 hours by speciality
Source: TOPAS via HSIU data warehouse
35
0%
2%
4%
6%
8%
10%
12%
14%
Jan-09
Feb-09
Mar-09
Apr-09
May-09
Jun-09
Jul-09
Aug-09
Sep-09
Oct-09
Nov-09
Dec-09
Jan-10
Feb-10
Mar-10
Apr-10
May-10
Jun-10
Jul-10
Aug-10
Sep-10
Oct-10
Nov-10
Dec-10
Jan-11
Feb-11
Mar-11
Apr-11
May-11
Jun-11
Jul-11
Aug-11
Sep-11
Perc
ent
Discharge month
CARD GMED GSUR ORTH
0%
2%
4%
6%
8%
10%
12%
14%
Jan-09
Feb-09
Mar-09
Apr-09
May-09
Jun-09
Jul-09
Aug-09
Sep-09
Oct-09
Nov-09
Dec-09
Jan-10
Feb-10
Mar-10
Apr-10
May-10
Jun-10
Jul-10
Aug-10
Sep-10
Oct-10
Nov-10
Dec-10
Jan-11
Feb-11
Mar-11
Apr-11
May-11
Jun-11
Jul-11
Aug-11
Sep-11
Perc
ent
Discharge month
CARD GMED GSURORTH PLST
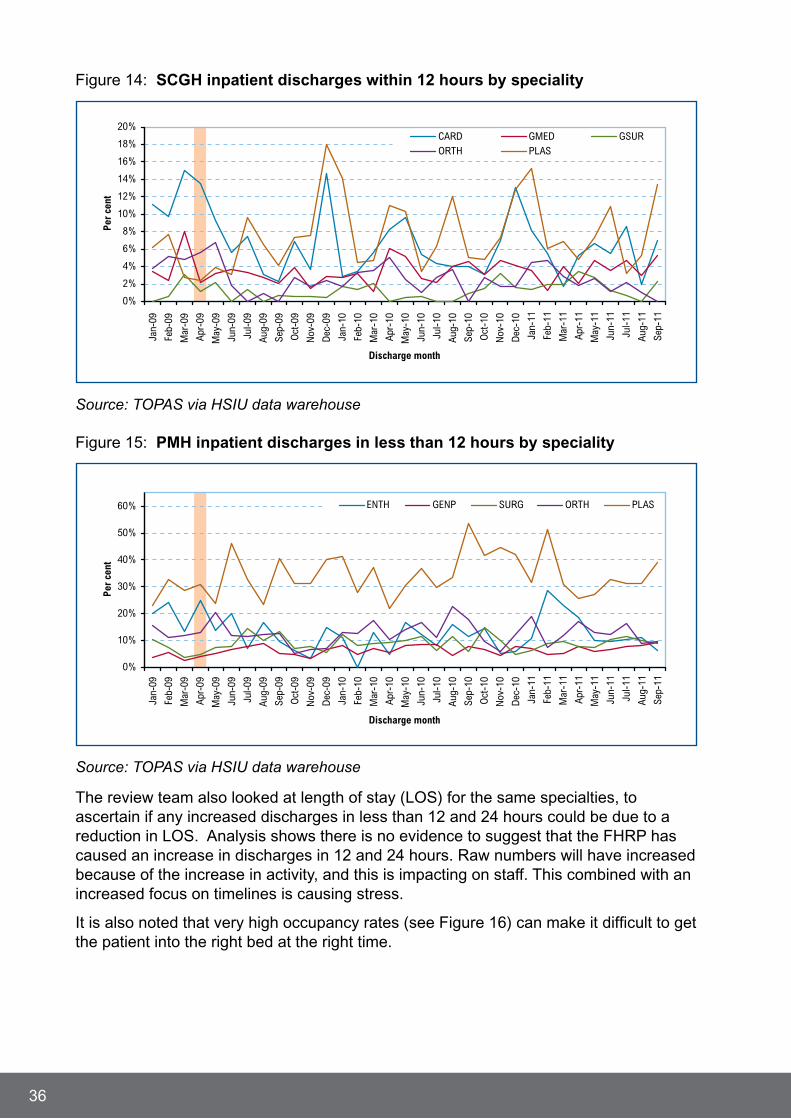
Figure 14: SCGH inpatient discharges within 12 hours by speciality
Source: TOPAS via HSIU data warehouse
Figure 15: PMH inpatient discharges in less than 12 hours by speciality
Source: TOPAS via HSIU data warehouse
The review team also looked at length of stay (LOS) for the same specialties, to ascertain if any increased discharges in less than 12 and 24 hours could be due to a reduction in LOS. Analysis shows there is no evidence to suggest that the FHRP has caused an increase in discharges in 12 and 24 hours. Raw numbers will have increased because of the increase in activity, and this is impacting on staff. This combined with an increased focus on timelines is causing stress.
It is also noted that very high occupancy rates (see Figure 16) can make it difficult to get the patient into the right bed at the right time.
36
0%
2%
4%
6%
8%
10%
12%
14%
16%
18%
20%
Jan-09
Feb-09
Mar-09
Apr-09
May-09
Jun-09
Jul-09
Aug-09
Sep-09
Oct-09
Nov-09
Dec-09
Jan-10
Feb-10
Mar-10
Apr-10
May-10
Jun-10
Jul-10
Aug-10
Sep-10
Oct-10
Nov-10
Dec-10
Jan-11
Feb-11
Mar-11
Apr-11
May-11
Jun-11
Jul-11
Aug-11
Sep-11
Per
cent
Discharge month
CARD GMED GSURORTH PLAS
0%
10%
20%
30%
40%
50%
60%
Jan-09
Feb-09
Mar-09
Apr-09
May-09
Jun-09
Jul-09
Aug-09
Sep-09
Oct-09
Nov-09
Dec-09
Jan-10
Feb-10
Mar-10
Apr-10
May-10
Jun-10
Jul-10
Aug-10
Sep-10
Oct-10
Nov-10
Dec-10
Jan-11
Feb-11
Mar-11
Apr-11
May-11
Jun-11
Jul-11
Aug-11
Sep-11
Per
cent
Discharge month
ENTH GENP SURG ORTH PLAS

Analysis of the occupancy data did not show a significant effect when comparing February and August across 2009 and 2011. However, it is clear from the data that the very high occupancy rates in our hospitals have not improved and this places considerable constraints on staff in accommodating patients. It also must be noted that the occupancy data provided includes the whole hospital, and there will be areas that are under more pressure than others.
Figure 16: Comparison of capacity at midnight census at stage one sites: 2009 and 2011
Source: TOPAS via HSIU data warehouse
While the trend analysis of wards moves does not demonstrate any significant change since the implementation of FHRP. Support staff consistently described significant patient moves within wards or departments to accommodate the FHR timelines. The Review acknowledges that intra-ward moves cannot be measured in the current information system.
The fact that there is no evidence that the FHRP has increased bed moves between wards does not mean that the current number of bed moves is appropriate. The review team heard anecdotes about patients being moved multiple times, inappropriately, with the general perception being that this happens in order to meet timeframes.
The position of the Reviewer is that any unnecessary bed moves are inappropriate. The patient should go to the right ward the first time to receive appropriate clinical care in a timely fashion.
The Reviewer supports the full implementation of ‘home ward’ solutions developed as part of the FHRP.
37
85%
92%
87%
96%
78%
80%
82%
84%
86%
88%
90%
92%
94%
96%
98%
Feb Aug Feb Aug
2009 2011
Time Period
Per
cent
of a
vaila
ble
capa
city
occ
upie
d
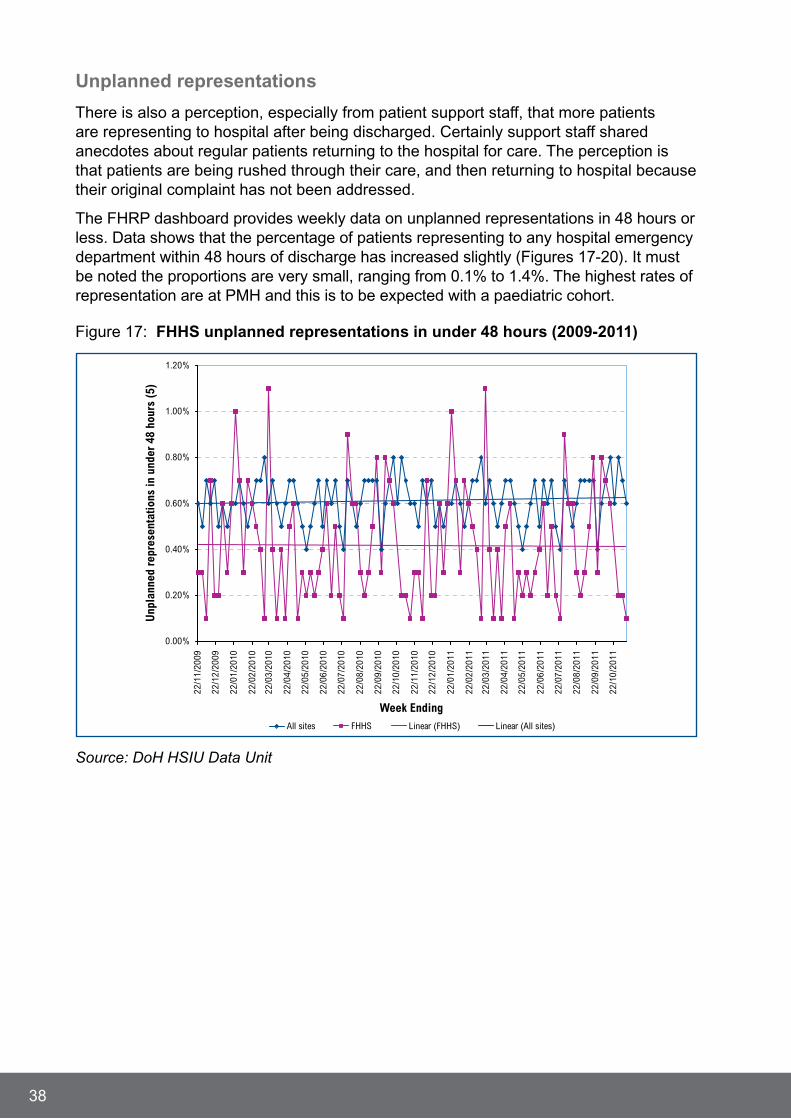
Unplanned representations
There is also a perception, especially from patient support staff, that more patients are representing to hospital after being discharged. Certainly support staff shared anecdotes about regular patients returning to the hospital for care. The perception is that patients are being rushed through their care, and then returning to hospital because their original complaint has not been addressed.
The FHRP dashboard provides weekly data on unplanned representations in 48 hours or less. Data shows that the percentage of patients representing to any hospital emergency department within 48 hours of discharge has increased slightly (Figures 17-20). It must be noted the proportions are very small, ranging from 0.1% to 1.4%. The highest rates of representation are at PMH and this is to be expected with a paediatric cohort.
Figure 17: FHHS unplanned representations in under 48 hours (2009-2011)
Source: DoH HSIU Data Unit
38
0.00%
0.20%
0.40%
0.60%
0.80%
1.00%
1.20%
All sites FHHS Linear (FHHS) Linear (All sites)
22/1
1/20
09
22/1
2/20
09
22/0
1/20
10
22/0
2/20
10
22/0
3/20
10
22/0
4/20
10
22/0
5/20
10
22/0
6/20
10
22/0
7/20
10
22/0
8/20
10
22/0
9/20
10
22/1
0/20
10
22/1
1/20
10
22/1
2/20
10
22/0
1/20
11
22/0
2/20
11
22/0
3/20
11
22/0
4/20
11
22/0
5/20
11
22/0
6/20
11
22/0
7/20
11
22/0
8/20
11
22/0
9/20
11
22/1
0/20
11
Unp
lann
ed r
epre
sent
atio
ns in
und
er 4
8 ho
urs
(5)
Week Ending
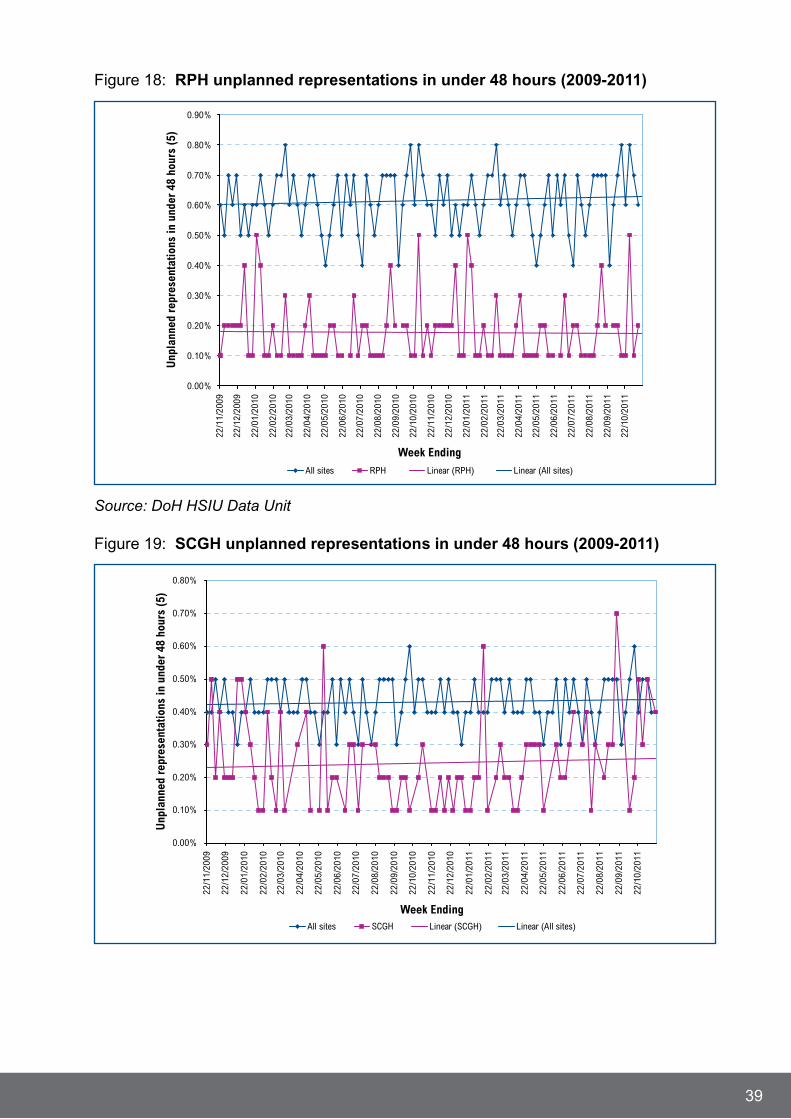
Figure 18: RPH unplanned representations in under 48 hours (2009-2011)
Source: DoH HSIU Data Unit
Figure 19: SCGH unplanned representations in under 48 hours (2009-2011)
39
0.00%
0.10%
0.20%
0.30%
0.40%
0.50%
0.60%
0.70%
0.80%
0.90%
22/1
1/20
09
22/1
2/20
09
22/0
1/20
10
22/0
2/20
10
22/0
3/20
10
22/0
4/20
10
22/0
5/20
10
22/0
6/20
10
22/0
7/20
10
22/0
8/20
10
22/0
9/20
10
22/1
0/20
10
22/1
1/20
10
22/1
2/20
10
22/0
1/20
11
22/0
2/20
11
22/0
3/20
11
22/0
4/20
11
22/0
5/20
11
22/0
6/20
11
22/0
7/20
11
22/0
8/20
11
22/0
9/20
11
22/1
0/20
11
All sites RPH Linear (RPH) Linear (All sites)
Unp
lann
ed r
epre
sent
atio
ns in
und
er 4
8 ho
urs
(5)
Week Ending
0.00%
0.10%
0.20%
0.30%
0.40%
0.50%
0.60%
0.70%
0.80%
22/1
1/20
09
22/1
2/20
09
22/0
1/20
10
22/0
2/20
10
22/0
3/20
10
22/0
4/20
10
22/0
5/20
10
22/0
6/20
10
22/0
7/20
10
22/0
8/20
10
22/0
9/20
10
22/1
0/20
10
22/1
1/20
10
22/1
2/20
10
22/0
1/20
11
22/0
2/20
11
22/0
3/20
11
22/0
4/20
11
22/0
5/20
11
22/0
6/20
11
22/0
7/20
11
22/0
8/20
11
22/0
9/20
11
22/1
0/20
11
All sites SCGH Linear (SCGH) Linear (All sites)
Unp
lann
ed r
epre
sent
atio
ns in
und
er 4
8 ho
urs
(5)
Week Ending
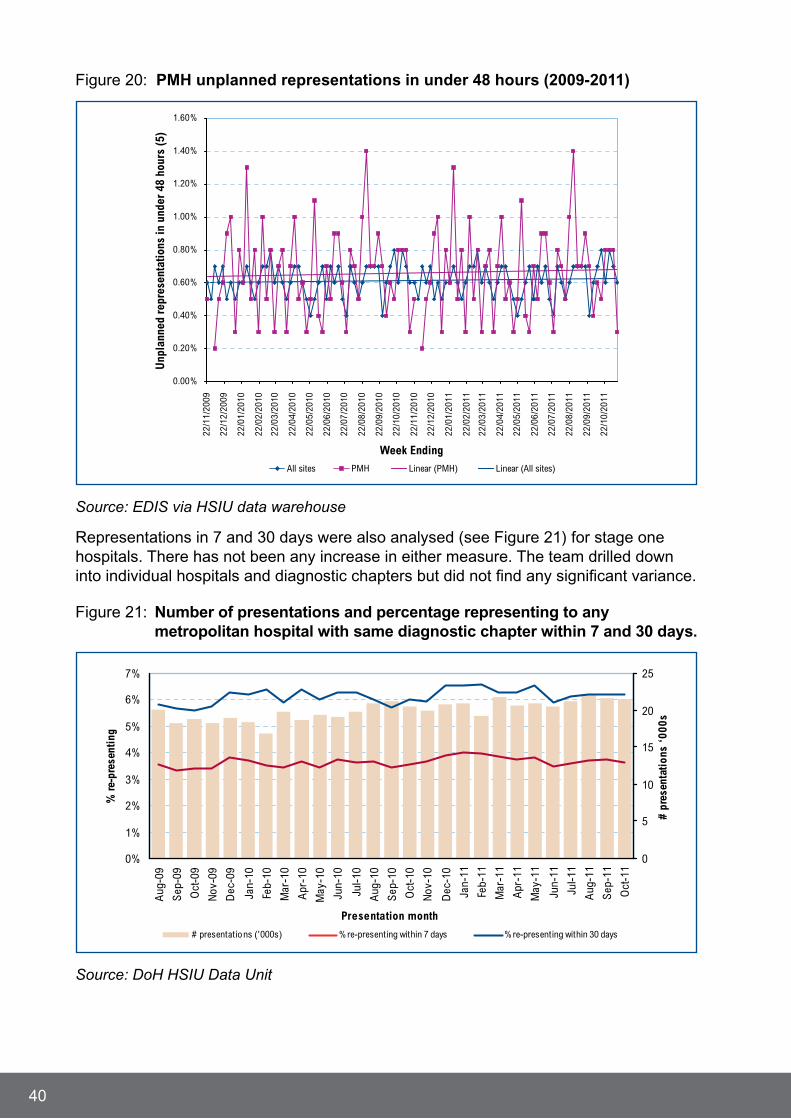
Figure 20: PMH unplanned representations in under 48 hours (2009-2011)
Source: EDIS via HSIU data warehouse
Representations in 7 and 30 days were also analysed (see Figure 21) for stage one hospitals. There has not been any increase in either measure. The team drilled down into individual hospitals and diagnostic chapters but did not find any significant variance.
Figure 21: Number of presentations and percentage representing to any metropolitan hospital with same diagnostic chapter within 7 and 30 days.
Source: DoH HSIU Data Unit
40
0.00%
0.20%
0.40%
0.60%
0.80%
1.00%
1.20%
1.40%
1.60%
22/1
1/20
09
22/1
2/20
09
22/0
1/20
10
22/0
2/20
10
22/0
3/20
10
22/0
4/20
10
22/0
5/20
10
22/0
6/20
10
22/0
7/20
10
22/0
8/20
10
22/0
9/20
10
22/1
0/20
10
22/1
1/20
10
22/1
2/20
10
22/0
1/20
11
22/0
2/20
11
22/0
3/20
11
22/0
4/20
11
22/0
5/20
11
22/0
6/20
11
22/0
7/20
11
22/0
8/20
11
22/0
9/20
11
22/1
0/20
11
All sites PMH Linear (PMH) Linear (All sites)
Unp
lann
ed r
epre
sent
atio
ns in
und
er 4
8 ho
urs
(5)
Week Ending
0%
1%
2%
3%
4%
5%
6%
7%
Aug
-09
Sep
-09
Oct
-09
Nov-
09
Dec
-09
Jan-
10
Feb-
10
Mar
-10
Apr
-10
May
-10
Jun-
10
Jul-1
0
Aug
-10
Sep
-10
Oct
-10
Nov-
10
Dec
-10
Jan-
11
Feb-
11
Mar
-11
Apr
-11
May
-11
Jun-
11
Jul-1
1
Aug
-11
Sep
-11
Oct
-11
Presentation month
% re
-pre
sent
ing
0
5
10
15
20
25#
pres
enta
tions
‘00
0s
# presentations ('000s) % re-presenting within 7 days % re-presenting within 30 days

The evidence does not support a significant increase in the proportion of patients re-presenting to emergency departments because of the FHRP.
The Review also analysed the percentage of inpatient discharges that were readmitted to the same hospitals within 28 days. This demonstrated that there has been a small increase in total readmissions, but those re-admitted within the same specialty has remains unchanged.
Hospital acquired infection
A number of staff, particularly hospital support workers, raised concerns about infection rates associated with increased bed moves of patients through the hospital. While the review team found no increase in the percentage of bed moves, staff perceive that the number of ‘infectious cleans’ required has increased, which has impacted on staff workload and fatigue.
The FHRP dashboard measures the rate of Methicillin-Resistant Staphylococcus Aureus (MRSA) infection. Figure 22 demonstrates that there has been a reduction in the rate of MRSA infection in the Stage One Hospitals over the last 12 months.
Figure 22: Rate of MRSA infections in Stage One Hospitals July 2010 to September 2011
A number of employee groups drew attention to the increased numbers of Vancomycin-resistant Enterococci (VRE) infection. VRE is an emergent antibiotic resistant organism which is growing endemic in the community. It is difficult to say what the impact of the FHRP is on VRE rates, however the detrimental effect of the outbreak on staff workloads and patient flow is clear. It is causing stress particularly on patient support staff as they are critical in the preparation of patient rooms, impacting directly on timely bed availability. Figure 23 shows a large increase in the number of VRE cases from 2008 to 2011, however this is not a rate and it does not take increased activity into account.
41
0.00
0.50
1.00
1.50
2.00
2.50
3.00
3.50
4.00
4.50
5.00
Jul-10 Aug-10 Sep-10 Oct-10 Nov-10 Dec-10 Jan-11 Feb-11 Mar-11 Apr-11 May-11 Jun-11 Jul-11 Aug-11 Sep-11
RPH
SCGH
FHHS
PMH
Linear (PMH)
Linear (SCGH)
Linear (FHHS)
Linear (RPH)
No.
infe
ctio
ns /
10,0
00 b
edda
ys
Month
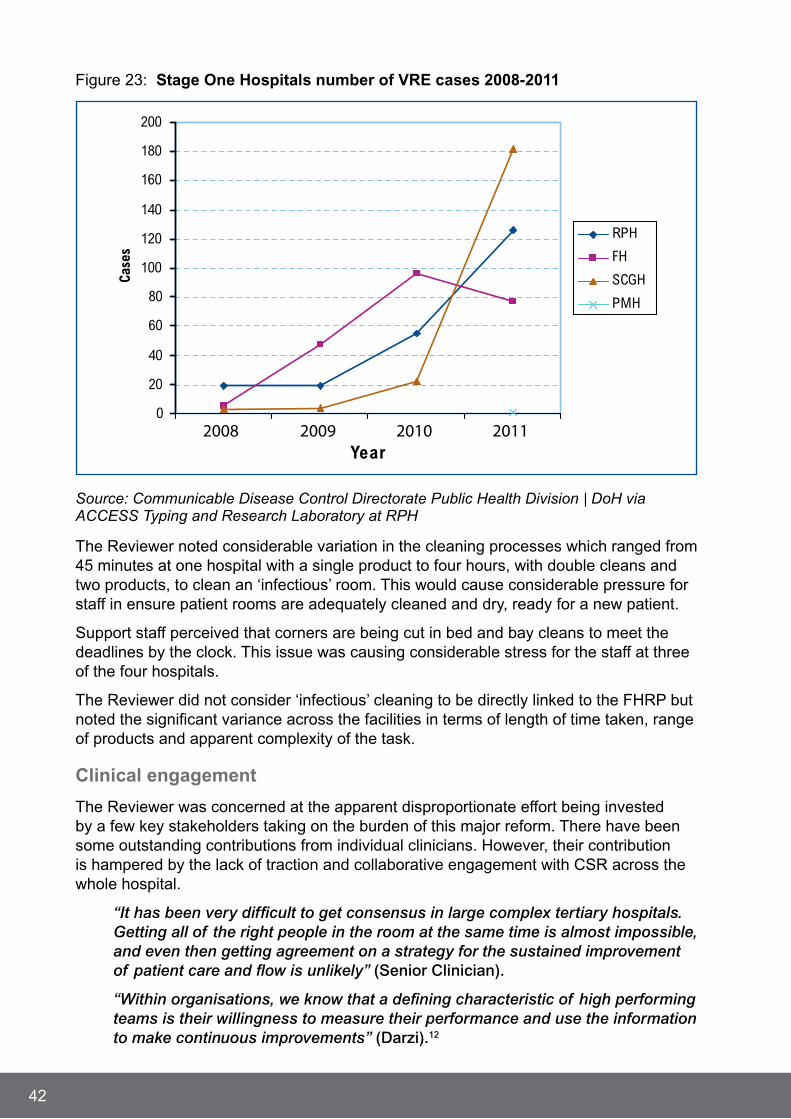
Figure 23: Stage One Hospitals number of VRE cases 2008-2011
Source: Communicable Disease Control Directorate Public Health Division | DoH via ACCESS Typing and Research Laboratory at RPH
The Reviewer noted considerable variation in the cleaning processes which ranged from 45 minutes at one hospital with a single product to four hours, with double cleans and two products, to clean an ‘infectious’ room. This would cause considerable pressure for staff in ensure patient rooms are adequately cleaned and dry, ready for a new patient.
Support staff perceived that corners are being cut in bed and bay cleans to meet the deadlines by the clock. This issue was causing considerable stress for the staff at three of the four hospitals.
The Reviewer did not consider ‘infectious’ cleaning to be directly linked to the FHRP but noted the significant variance across the facilities in terms of length of time taken, range of products and apparent complexity of the task.
Clinical engagement
The Reviewer was concerned at the apparent disproportionate effort being invested by a few key stakeholders taking on the burden of this major reform. There have been some outstanding contributions from individual clinicians. However, their contribution is hampered by the lack of traction and collaborative engagement with CSR across the whole hospital.
“It has been very difficult to get consensus in large complex tertiary hospitals. Getting all of the right people in the room at the same time is almost impossible, and even then getting agreement on a strategy for the sustained improvement of patient care and flow is unlikely” (Senior Clinician).
“Within organisations, we know that a defining characteristic of high performing teams is their willingness to measure their performance and use the information to make continuous improvements” (Darzi).12
42
0
20
40
60
80
100
120
140
160
180
200
Year
Case
s
RPH
FH
SCGH
PMH
2008 2009 2010 2011
The focus of the FHRP has always been to reduce the clinical risks to patients and improve the quality of the patient’s care. ED physicians were frustrated that some departments integral to timely assessment and decisions about patient management have not undertaken CSR. Processes should be improved to provide a more patient focused service. This extends to the theatres, medical and surgical services, and subspecialty units.
One of the key issues raised by nurses is the inadequate level of medical engagement in CSR across the hospitals.
“Some consultants have been brilliant however the medical model has remained largely unchanged” (Senior Nurse).
Nurses believed that the responsibility for driving change rested with them. Sustainable process changes would be significantly improved with better medical engagement.
Unfortunately there is little evidence to demonstrate that the FHRP has been incorporated into the hearts and minds of the majority of senior clinicians and administrators. This was very evident during the consultation phase of the Review. On making contact with hospital staff, the response would often be:
“You are talking to the wrong person. You need to speak with the FHRP office; they do all the things in relation to FHRP” (Review Team).
It is evident that a disproportionate effort by a small number of stakeholders is carrying the burden of change.
All facility and clinical leads stated that there have been some outstanding contributions from a number of clinicians, committed to improving safety and quality. The problem is that the majority of staff do not accept that the FHRP is part of everyone’s everyday business.
There are some groups who have been highly motivated and engaged in clinical service redesign and done a lot of work. When solutions don’t progress these staff become frustrated and understandably disengaged. There are also those groups who have actively refused to participate in any redesign, and actively undermine the efforts of others to improve patient flow.
ED Navigator role
The role of ‘ED Navigator’, or ‘ED Operations Manager’ or ‘ED Patient Flow Co-ordinator’ has been developed independently at each of the hospitals. For the purpose of the Review, the term ‘navigator’ will be applied. Navigators are responsible for coordinating patient movements through the ED, and facilitating timely disposition.
“You need to maintain situational awareness in the emergency department and more junior staff can sometimes get very focused on one thing – again we don’t want anyone to be forgotten. [ED Navigator’s] job should be to be an advocate for the patient” (Senior Clinician).
Many junior doctors reported feeling harassed by the navigators, and the Review heard anecdotes about patient assessments being interrupted to facilitate a bed move within the ED or pressure for a decision regarding another patient.
43
There have been a number of claims from junior doctors about perceived bullying and most refer to the navigator role. The effectiveness of these positions is dependent on interpersonal skills and ED clinical expertise, in one who can exercise judgement on when to interrupt and when to provide support.
In the Reviewer’s opinion, the frequency of incidents or perceptions of alleged bullying across the Stage One hospitals warrants closer monitoring by managers to ensure that professional behaviours are being exhibited by all staff in the workplace. WA Health has a clear position on bullying:
Workplace bullying constitutes a breach of the expected standards of behaviour and is misconduct and will not be tolerated in the Department of Health. All managers and supervisors are responsible for promoting a workplace free of bullying and managing incidents involving bullying behaviour in the workplace.16
The role of the navigator requires further consideration both in the value of investing in this resource over other resourcing requirements and in the context of supporting the medical team, taking guidance from the consultant clinician on duty, who has the ultimate responsibility for managing the department.
Ward issues
Ward staff shared many of the concerns previously outlined in this section. In addition, wards reported a high level of staff fatigue and stress particularly in relation to trying to manage a reform focused on patient safety and quality in a largely disengaged environment.
Consultant clinicians indicated that some inpatient units continue to manage their work load with competing demands on the workforce. This can be illustrated through a medical team endeavouring to cover ward work, outpatient clinics or theatre lists concurrently.
“Specialties can predict how many admissions they are likely to get in a day, and it is their responsibility to plan for it” (Consultant Clinician).
Ward staff were concerned about over census patients on the wards, particularly the lack of privacy afforded and the safety and quality considerations for these patients. The review team were concerned at the level of anxiety caused by a single over census patient on a ward area, in view of the concurrent situation in ED where there would be a number of patients over census, and greater safety and quality risks2.
Allied health forums supported the Ward Journey Board initiative, which are very effective when every member of the multi-disciplinary team is committed to making the process patient and outcome focused. Unfortunately there is a lack of senior medical commitment to the processes and some nurse managers are not committed to the co-ordination role.
44

Allied health staff also identified that there was considerable pressure on discharge processes. This was compounded by community based options for patient support not being geared to address the growth in demand or complexity. The processes for step-down to other facilities or services have become clumsy with the pressure for discharge. Clinicians were signalling that patients were being pushed towards higher levels of service than required. One example was more frequent requests for respite because:
“A respite bed was easy to source, rather than properly planning a supported discharge in the patient’s home” (Allied health representative).
Staff believed that the pressure of discharge had led members of the health care team to inadequately consult with allied health services, minimise patient risks identified or inadvertently discharge a patient prior to essential discharge education being provided.
Clerical staff conveyed nursing frustration where there are multiple medical teams involved in a patient’s care. It is more difficult to get one team to take responsibility for the general discharge processes such as follow up appointments and medications and finalising the discharge summary.
Additional systems implemented to improve communication have been added to the ward clerk’s duties such as booking jobs on Computer Assisted Radio Personnel System (CARPS) for support staff and managing the “push and pull” of patients through the electronic bed management system. There had also been an increase in the number of phone calls, liaising with relatives about ward moves or inter-hospital transfers.
The review considered the workforce trend data for various employee groups over the period of FHRP implementation. Nursing FTE increased by approximately 3% from 2008/2009 to 2010/2011.
Table 4: FTE trends for nursing workforce
Year 2008/2009 2009/2010 2010/2011
Fremantle 1182.52 1196.02 1183.34
PMH 615.81 662.74 672.20
Royal Perth 1532.02 1547.20 1572.62
SCGH 1492.73 1562.08 1549.38
Total 4823.07 4968.04 4977.54
Support staff, including Patient Care Assistants (PCAs), Health Service Assistants (HSAs), cleaners and orderlies, were anxious about staff burn out and the level of sick leave and holiday leave being requested. Co-ordinators reported difficulty in finding relief staff to fill roster short falls for unplanned sick leave. It was acknowledged that this situation placed the staff on duty under additional stress. There was a perception that ED has been well resourced to cater for the FHRP, but this resourcing had not flowed on to the wards where there was increased pressure to discharge patients before 10am.
Workforce trends for orderlies and PCAs are outlined in Table 5. There has been a decrease in FTE of approximately 8% from 2008/2009 to 2010/2011, despite the increase in demand.
45
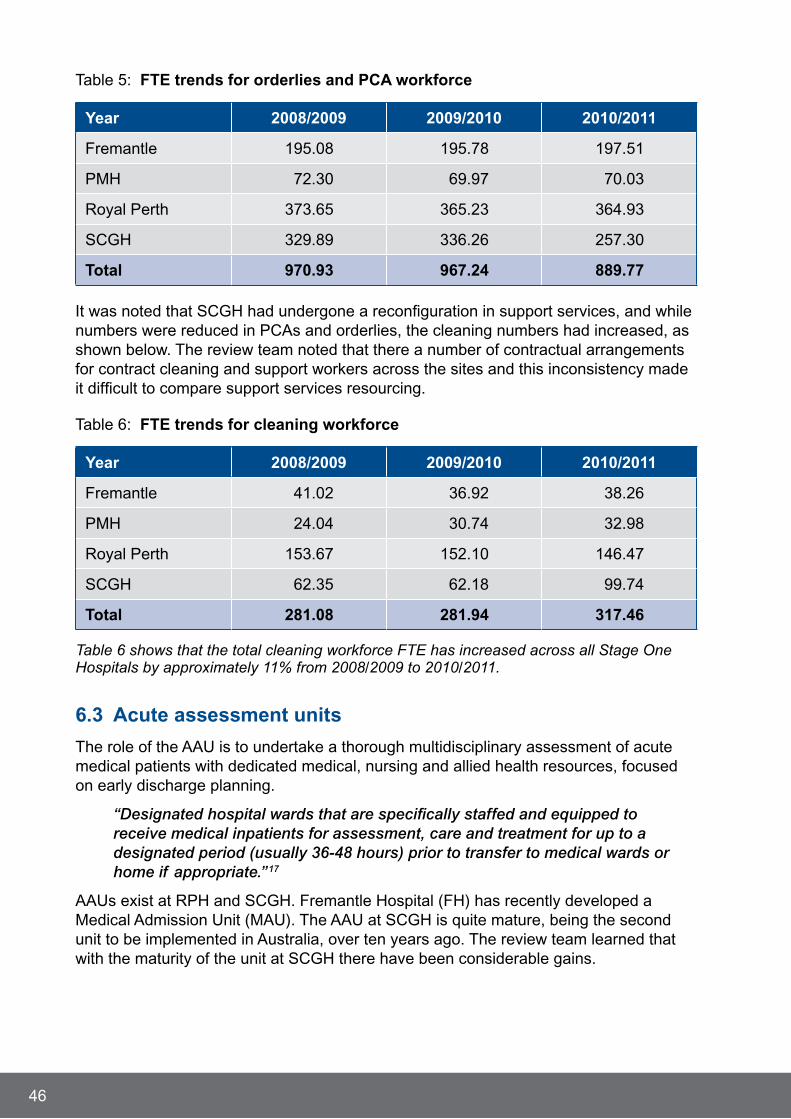
Table 5: FTE trends for orderlies and PCA workforce
Year 2008/2009 2009/2010 2010/2011
Fremantle 195.08 195.78 197.51
PMH 72.30 69.97 70.03
Royal Perth 373.65 365.23 364.93
SCGH 329.89 336.26 257.30
Total 970.93 967.24 889.77
It was noted that SCGH had undergone a reconfiguration in support services, and while numbers were reduced in PCAs and orderlies, the cleaning numbers had increased, as shown below. The review team noted that there a number of contractual arrangements for contract cleaning and support workers across the sites and this inconsistency made it difficult to compare support services resourcing.
Table 6: FTE trends for cleaning workforce
Year 2008/2009 2009/2010 2010/2011
Fremantle 41.02 36.92 38.26
PMH 24.04 30.74 32.98
Royal Perth 153.67 152.10 146.47
SCGH 62.35 62.18 99.74
Total 281.08 281.94 317.46
Table 6 shows that the total cleaning workforce FTE has increased across all Stage One Hospitals by approximately 11% from 2008/2009 to 2010/2011.
6.3 Acute assessment units
The role of the AAU is to undertake a thorough multidisciplinary assessment of acute medical patients with dedicated medical, nursing and allied health resources, focused on early discharge planning.
“Designated hospital wards that are specifically staffed and equipped to receive medical inpatients for assessment, care and treatment for up to a designated period (usually 36-48 hours) prior to transfer to medical wards or home if appropriate.”17
AAUs exist at RPH and SCGH. Fremantle Hospital (FH) has recently developed a Medical Admission Unit (MAU). The AAU at SCGH is quite mature, being the second unit to be implemented in Australia, over ten years ago. The review team learned that with the maturity of the unit at SCGH there have been considerable gains.
46

The rostering of medical teams at SCGH ensures there is continuity of consultant clinician led care over four days. The AAU has made investment in designated allied health team resources; the commitment to multidisciplinary team processes has enhanced patient outcomes despite an increase in separations. The unit has one of the highest turnover rates and has managed to reduce the average length of stay for most diagnostic related groups.
The medical intake model at FH with all medical admissions reviewed, triaged and admitted to the MAU has been the most successful with a medical registrar assigned to ED to assess all medical presentations.
The co-location of the medical ward with the MAU to facilitate access to senior consultant clinicians and registrars and the right medical staffing model similar to the ASU has worked well. Consultant clinicians at FH told the Review that they believe after several iterative models, “we have now got it right.”
The units at SCGH and FH have seen significant improvements in patient outcomes and rosters may be modelled on these examples to improve continuity of care, supervision and support for junior medical staff. This may require a redistribution of the existing hospital medical workforce in the short term. Additional resources should only be considered following evidence from a comprehensive CSR process.
“The reality is that we are getting a lot of sick, frail, elderly patients with lots of co-morbidities who are exactly the sort of patients that our units (AAU) are designed to take, and we’re getting more and more of them, and all of the demographic projections would suggest that that’s going to continue. So you might ask, well, is there a different model of care that can handle these patients?” (Senior Physician).
The Reviewer noted that roster configuration in the AAUs across Stage One sites were not comparable. Issues were raised by consultant clinicians, nursing and allied health staff around a lack of continuity of care and capacity in some units. JMOs provided the review team with strong views regarding workplace pressure and stress.
“AAU was set up in a hurry, not properly thought out, staff were not properly trained and unfortunately the most junior Registrars in the hospital, covers the unit because nobody wants to do it. You’re at the front line receiving all the medical admissions or acute medical admissions that come from Emergency” (JMOs).
It is important that the medical divisions at the adult tertiary hospitals collaborate to urgently review and improve the continuity of consultant clinician coverage in the AAUs.
The concept of a shared care model between AAUs and the ED was posed by the Reviewer, to physicians in both AAU and ED, to gauge their views on the concept. Some ED physicians and junior medical staff expressed a desire to manage more complex patients beyond the four hours that now confines practice to the ED. This shared care arrangement could see existing resources across ED and AAUs redistributed. While some clinicians were opposed to the idea for a range of reasons, others felt this could definitely add value with the higher acuity of patients being transferred to AAUs in a shorter timeframe.
47
Administrative personnel are frustrated by the number of perceived meaningless administrative transactions which are causing additional stress in high turnover areas such as the AAU. Examples included changing the doctor on the bed card of a patient every shift (due to frequent medical team changes) in the high turnover areas; supporting the electronic bed management system and increased phone calls.
6.4 Acute surgical units
The Review was interested to understand innovative models of service delivery that improved the timeliness of specialist surgical review for patients with acute general surgical conditions and addressed entrenched patient flow practices, which can compromise patient outcomes. In 2007, the Royal College of Surgeons of England18 describe a surgical assessment unit (SAU) as:
“A dedicated and centralised area where acutely ill surgical patients can be assessed and monitored prior to being admitted to hospital or otherwise treated. SAUs may be stand alone or part of a wider emergency assessment unit. These units need to be staffed by senior nurses and experienced doctors.” (p.4)
Through the literature, it is evident that SAUs have become a contemporary model for the management of acute surgical patients. Journal articles are reporting more timely surgical review19, improved admission avoidance20 earlier operative intervention and reduced lengths of stay. Cox et al 21 noted that “The traditional on-call system for the management of acute general surgical admissions is inefficient and outdated” (p.1445).
Fremantle Hospital developed a collaborative model for general surgery in 2009. The Acute Surgical Unit (ASU) has a dedicated, consultant clinician led team rostered every day. The development of the ASU model predates the FHRP, with key drivers being to minimise waiting time for patients referred from ED and to move semi-urgent general surgery cases from after hours to normal working hours.
The underlying principles of the ASU at FH are outlined by Dr von Conrady and colleagues22 as:
* consultant lead care
* dedicated team responsibilities (three teams continue elective activity and the fourth team covers the ASU)
* improved the timeliness of specialist surgical review (from 3.2 to 2.1 hours)
* reduced after hours emergency surgery cases (by 14% in the audit period of 2009)
* dedicated access for emergency theatre seven days a week
* safe working hours for all members of the medical workforce
* cost neutral service model for the hospital.
While the Reviewer understands that the ASU was being implemented at about the same time as the FHRP at FH, the development has seen significant improvements in patient care, in an environment of increasing demand (19%) for general surgery. Other improvements have been identified in a further publication by Sundarajan and colleagues23 which outlines:
48
* an increase in weekend discharges by 35%, which has improved access to inpatient beds
* a reduction in after hours general surgery cases from 9.0 to 7.6%
* a reduction in the cancellation of emergency cases by 50%
* a reduction in the cancellation of elective cases by 16%.
Tertiary adult hospitals require clear pathways for acute general surgical patients. Fremantle Hospital has the only functional ASU out of the Stage One tertiary hospitals. The absence of such pathways represents a significant risk to the safety and quality of the patient’s journey.
If we can do four of one type of procedure in a day in the private sector can we at least try and get two a day done here and I’ll meet you halfway? But we literally have people with their hands up saying “its all hopeless, we’re not going to do anything until you show us the money” (Consultant Clinician).
A number of consultant clinicians who met with the Reviewer indicated that there had been some discussions about the development of an ASU at RPH. SCGH currently have Surgical Assessment Unit (SAU) with similar objectives to the ASU at FH, however a number of improvements have been recommended to make it work more effectively. The hospital plans to co-locate the SAU with the AAU, with beds identified as part of the bed reallocation process. However, progress has been delayed as the designated 8 bed ward area is temporarily being used for VRE care.
Access to timely general surgical assessment with a designated area and access to emergency theatre are critical factors.
Emergency admissions make up almost 50% of the workload in some surgical specialities. Despite this the service is often planned around elective admissions and this has a detrimental effect on the deliver of emergency care. (p.4)18
The New South Wales DoH published a CSR for Surgical Acute Rapid Assessment (SARA) in 2008. The FHRP was born out of ED congestion and access block.
A dedicated surgical acute rapid assessment (SARA) unit has been established to support the ED in its efforts to reduce access block, improve hospital processes and provide a higher quality of care. The SARA unit operates under strict business rules and caters for acute surgical admissions from the ED, specialist clinics and hospital transfers. (p.5)24
The review team notes that the scope of a SARA deals with most acute areas of surgical specialties when compared to an SAU which targets acute general surgical patients.
The Reviewer has formed the position that RPH and SCGH need to map out the key processes utilising CSR methodology, to initiate the planning for an SAU or SARA, as a matter of urgency.
A concerted effort on the part of Executives and consultant clinicians is required to bring surgical teams from across hospital directorates together, to work in collaborative manner. The magnitude of this change is acknowledged.
49
The CSR process will enable significant patient safety risks, junior medical staff dissatisfaction with working arrangements and entrenched inefficient patient flow processes to be addressed.
“The productivity from our operating theatres could be better because we need better teamwork between anaesthetists, nurses and surgeons. There is no doubt that our operating theatres could be much more efficient. If we can realise some opportunities through redesign and looking at the way our theatre list is structured, then I can see its worthwhile investing” (Consultant Clinician).
It is felt that this approach will foster expedient general surgical review for ED referrals, improve timeliness of diagnosis and disposition decisions and guide patient care along safe and appropriate pathways.
Theatre access
RPH has operating theatres that are not presently functioning effectively to allow timely access for surgical procedures. This is due to under utilisation of physical theatre resources over the 24 hours of the day and seven days of the week, because of staff rostering practices. It would seem that CSR has not been embraced in this essential area of the hospital. This may be contributing to unacceptable delays in emergency surgical care. This is an area that requires CSR to address staffing at all levels, elective and emergency access.
Waiting longer than clinically appropriate for emergent surgery poses a significant risk to the safety and quality of that patient’s care18. This issue is equally important in dealing with the normal activities of the elective surgery waiting list.
Intensive care units
Nurses and doctors raised a serious patient safety risk with regard to the transfer of ICU patients to acute wards after hours. Research shows that this is associated with increased mortality25, 26, 27, 28. There is evidence of an increasing trend of shifting patients after hours and overnight. There is a perception that more needs to be done to ensure patients can be transferred during the day, when home ward teams are more accessible.
ICU exit block was raised through the consultation with clinicians across the hospital services. The issue is potentially compromising access for acute admissions and complex elective cases. This is a symptom of capacity, high occupancy and discharging practices. The use of an ICU bed, for a patient who is suitable for the home ward present iatrogenic risks for the patient and is not cost effective.
50
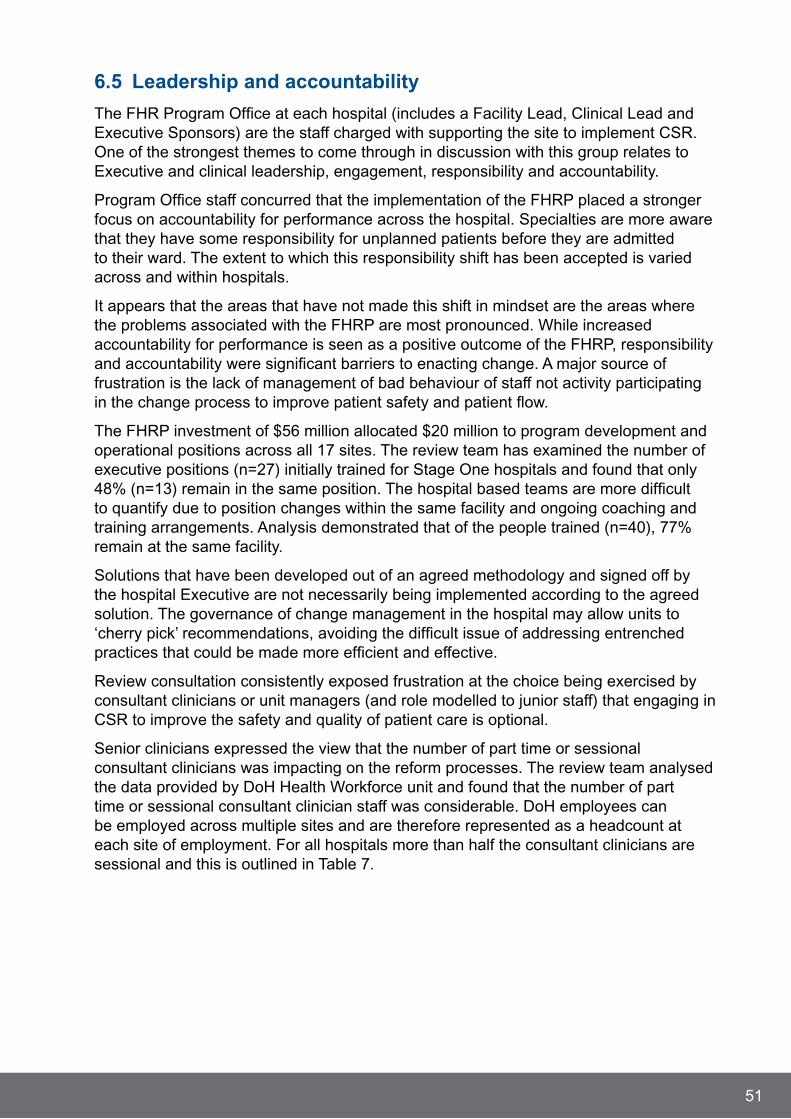
6.5 Leadership and accountability
The FHR Program Office at each hospital (includes a Facility Lead, Clinical Lead and Executive Sponsors) are the staff charged with supporting the site to implement CSR. One of the strongest themes to come through in discussion with this group relates to Executive and clinical leadership, engagement, responsibility and accountability.
Program Office staff concurred that the implementation of the FHRP placed a stronger focus on accountability for performance across the hospital. Specialties are more aware that they have some responsibility for unplanned patients before they are admitted to their ward. The extent to which this responsibility shift has been accepted is varied across and within hospitals.
It appears that the areas that have not made this shift in mindset are the areas where the problems associated with the FHRP are most pronounced. While increased accountability for performance is seen as a positive outcome of the FHRP, responsibility and accountability were significant barriers to enacting change. A major source of frustration is the lack of management of bad behaviour of staff not activity participating in the change process to improve patient safety and patient flow.
The FHRP investment of $56 million allocated $20 million to program development and operational positions across all 17 sites. The review team has examined the number of executive positions (n=27) initially trained for Stage One hospitals and found that only 48% (n=13) remain in the same position. The hospital based teams are more difficult to quantify due to position changes within the same facility and ongoing coaching and training arrangements. Analysis demonstrated that of the people trained (n=40), 77% remain at the same facility.
Solutions that have been developed out of an agreed methodology and signed off by the hospital Executive are not necessarily being implemented according to the agreed solution. The governance of change management in the hospital may allow units to ‘cherry pick’ recommendations, avoiding the difficult issue of addressing entrenched practices that could be made more efficient and effective.
Review consultation consistently exposed frustration at the choice being exercised by consultant clinicians or unit managers (and role modelled to junior staff) that engaging in CSR to improve the safety and quality of patient care is optional.
Senior clinicians expressed the view that the number of part time or sessional consultant clinicians was impacting on the reform processes. The review team analysed the data provided by DoH Health Workforce unit and found that the number of part time or sessional consultant clinician staff was considerable. DoH employees can be employed across multiple sites and are therefore represented as a headcount at each site of employment. For all hospitals more than half the consultant clinicians are sessional and this is outlined in Table 7.
51
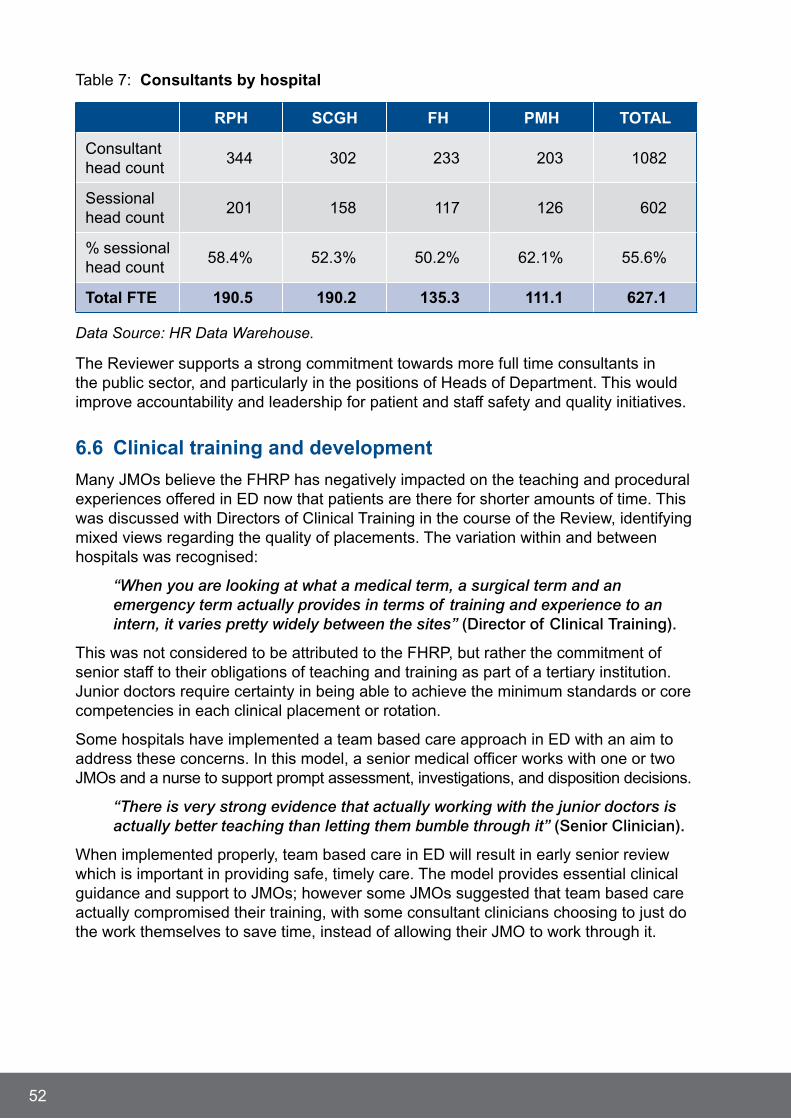
Table 7: Consultants by hospital
RPH SCGH FH PMH TOTAL
Consultant head count
344 302 233 203 1082
Sessional head count
201 158 117 126 602
% sessional head count
58.4% 52.3% 50.2% 62.1% 55.6%
Total FTE 190.5 190.2 135.3 111.1 627.1
Data Source: HR Data Warehouse.
The Reviewer supports a strong commitment towards more full time consultants in the public sector, and particularly in the positions of Heads of Department. This would improve accountability and leadership for patient and staff safety and quality initiatives.
6.6 Clinical training and development
Many JMOs believe the FHRP has negatively impacted on the teaching and procedural experiences offered in ED now that patients are there for shorter amounts of time. This was discussed with Directors of Clinical Training in the course of the Review, identifying mixed views regarding the quality of placements. The variation within and between hospitals was recognised:
“When you are looking at what a medical term, a surgical term and an emergency term actually provides in terms of training and experience to an intern, it varies pretty widely between the sites” (Director of Clinical Training).
This was not considered to be attributed to the FHRP, but rather the commitment of senior staff to their obligations of teaching and training as part of a tertiary institution. Junior doctors require certainty in being able to achieve the minimum standards or core competencies in each clinical placement or rotation.
Some hospitals have implemented a team based care approach in ED with an aim to address these concerns. In this model, a senior medical officer works with one or two JMOs and a nurse to support prompt assessment, investigations, and disposition decisions.
“There is very strong evidence that actually working with the junior doctors is actually better teaching than letting them bumble through it” (Senior Clinician).
When implemented properly, team based care in ED will result in early senior review which is important in providing safe, timely care. The model provides essential clinical guidance and support to JMOs; however some JMOs suggested that team based care actually compromised their training, with some consultant clinicians choosing to just do the work themselves to save time, instead of allowing their JMO to work through it.
52
While there was considerable discussion at JMO forums about ED no longer being a desirable placement or career pathway, the attractions for this route are the rostered shift arrangements, structured study leave and annual leave, no on call obligations, day to day access to consultant clinician support and a designated teaching and training resource within the department. There is considerably more supervision and support provided for ED medical officers than for any other speciality.
The Review also noted the emerging role of simulation in medial training and this warrants further discussion with colleges and training units to more fully explore these opportunities.
Directors of Clinical Training were concerned about the level of pressure being conveyed through their normal survey feedback processes from JMO and trainees. The issues identified in the survey feedback are consistent with what the review team has learned through the consultation process.
There was divided opinion amongst the Directors of Clinical Training about FHRP impact on training. This matter requires further consideration by the Colleges and training units, particularly with the need to re-engineer clinical services to meet demand.
Senior nurses were concerned about the scope of the role of ward managers and their ability to provide graduate nurses with support and ongoing training due to their occupation with time, clock and patient movement. Nurses expressed a view that the focus on patient care had been diluted. However, this is probably more perception than fact looking at the quality indicators of patient care. None the less there is no question that nursing staff are significantly stressed by the increase in activity.
The Navigators role in ED requires the person to have understanding, tact and excellent interpersonal skills in order to build trust and respect. The selection process must carefully assess applicants to ensure they display these qualities.
Allied health co-ordinators raised the issue of graduate staff expectations and providing satisfactory levels of ongoing professional development for junior therapy staff. Graduates were constrained by the truncated length of stay and the therapeutic interventions to be provided in that timeframe.
Radiology staff interviewed as part of the review identified workforce as a key risk, with limited training places available in WA. Ultrasound was sighted as the most significant area of concern, with private sector opportunities being more lucrative for graduates than the public sector.
Hospital administration co-ordinators were concerned about the adequacy of training and support for new clerical staff members. Managers are finding that after some limited training and support on the ward or in ED, new staff find the roles too stressful and move on to another job.
The Reviewer offers the perspective that if patient safety and quality issues could be systematically considered through CSR by every team, the efficiencies gained would enable more time for teaching and training across all workforce groups.
53
6.7 Communication
Junior doctors did not appear to be aware of a clear communication pathway to raise their issues and have their concerns investigated and resolved in a timely manner. One consultant clinician succinctly conveys the views of JMOs:
“They don’t feel that they are heard well enough by the senior people – they’ve not been made part of the decision process and they think they are working for a goal that they didn’t agree with or they hadn’t been consulted about and so they do not feel any ownership” (Consultant Clinician).
JMOs were concerned about the tensions between ED and ward staff, with the perception being that relationships had broken down due to the implementation of the FHRP. This is in contrast with other groups, including senior ED physicians and consultants, who felt the FHRP had actually increased the integration of ED with the rest of the hospital. Senior clinicians indicated that tension between ED and the wards predates the FHRP.
Representative Heads of Department recalled being included in the FHRP consultation and development process. Some reported being quite disconnected from the solutions developed and those solutions which were prioritised to meet the FHRP targets.
6.8 Service interdependencies
Emergency physicians expressed concern that while EDs are running 24 hours a day, seven days a week, other clinical care areas are not. Tertiary hospitals are complex systems with critical functional interdependencies and services need to review and augment the way they do business to ensure services are provided to best meet demand.
Pharmacy
Pharmacy was perceived by some staff to be causing delays in discharge, identified through consultation with a number of forums, including health consumer agencies.
The Reviewer spoke with Pharmacy representatives from all hospitals and found that they had been involved to various extents with the FHRP. They have considered their systems and processes in relation to the FHRP and extended their opening hours. The Review has come to the conclusion that discharge delays on the ward are more like to be due to a lack of proactive discharge planning from admission, rather than delays at the dispensary.
The representatives also observed increased staff stress due to the pressure of discharge. A shared perception was that incorrect or incomplete prescriptions had increased and this caused delays where information had to be clarified (the chart is sent back to the ward). The recent Pharmaceutical Benefits Scheme (PBS) reform is a contributing factor to errors in discharge prescriptions, unrelated to the FHRP.
Radiology
Two issues in relation to radiology were raised through the consultation process. Firstly, that there were delays in accessing radiological investigations which was contributing to the delay in ED. Secondly, if a patient was transferred to the ward, then their radiology request was no longer considered at the same level of priority as a patient in ED.
54

The Reviewer met with Heads of Department for radiology for the adult tertiary hospitals. All departments appeared to have recently considered some internal processes and made some changes as to how they do business with ED and other areas of the hospital services. Examples of service changes were noted with earlier ultrasound slots to accommodate emergency surgery and additional MRI availability.
Imaging examinations, including computed tomography, magnetic resonance imaging, and ultrasonography has increased by 15% across all Stage One Hospitals from September 2009 to September 2011. Individual hospital growth varies from 12% to 27%.
There has been an 11% decrease in ED referred exams, and a 191% increase in ward referred exams. It is clear there has been a change in work practices that has shifted activity from the ED to the wards since the implementation of the FHRP, but to investigate the impact this has had on patients, further analysis looking at individual hospitals, examination type, triage codes and diagnostic versus treatment related imaging is required.
There have been some significant reductions in the median time between ED arrival and exam completion over the life of the FHRP, however improvements are most marked in ED referred examinations. For example, the median time between ED arrival and completion of an ED-referred MRI for ATI Category 3 patients at Fremantle has decreased from 17.8 hours in March 2009 to 3.9 hours in September 2011. For the same category of examinations referred from the ward, it has reduced from 20.4 hours to 15.3 hours over the same time period.
Staff representatives confirmed that while departments received referrals from multiple streams (ED, outpatients and the wards); ED patients take priority over admitted patients who are then seen in order of clinical priority.
An initiative to improve discharge timeliness has been the introduction of a ‘blue form’ which identified a patient due for discharge and these cases are completed on the same day.
Information Technology
Pharmacists identified e-prescribing as the preferred solution to streamline the prescribing processes across hospitals. This would reduce errors and increase efficiency. The group was advised that an enterprise wide solution is desirable but not feasible in the near future, a position conveyed by the Health Information Network.
The electronic discharge summary (TEDS) is considered to be a viable interim solution for discharge medication dispensing, with 3 of the 4 hospitals currently using this application. The Review understands that current version of TEDS requires upgrading to be compliant with the PBS reform in order to be useful
Consultant clinicians discussed patient rounding practices and how these could be more efficient. Some had previous experiences using wireless access and laptops to access imaging, initiate TEDS and order pathology contemporaneously, which saved time.
There was considerable discussion regarding the ‘clerking’ of patients and the repetitive nature of assessment processes across, ED, CDU and ward areas. If there was an integrated and patient information system this would considerable reduce duplication, errors and the associated administrative tasks.
55
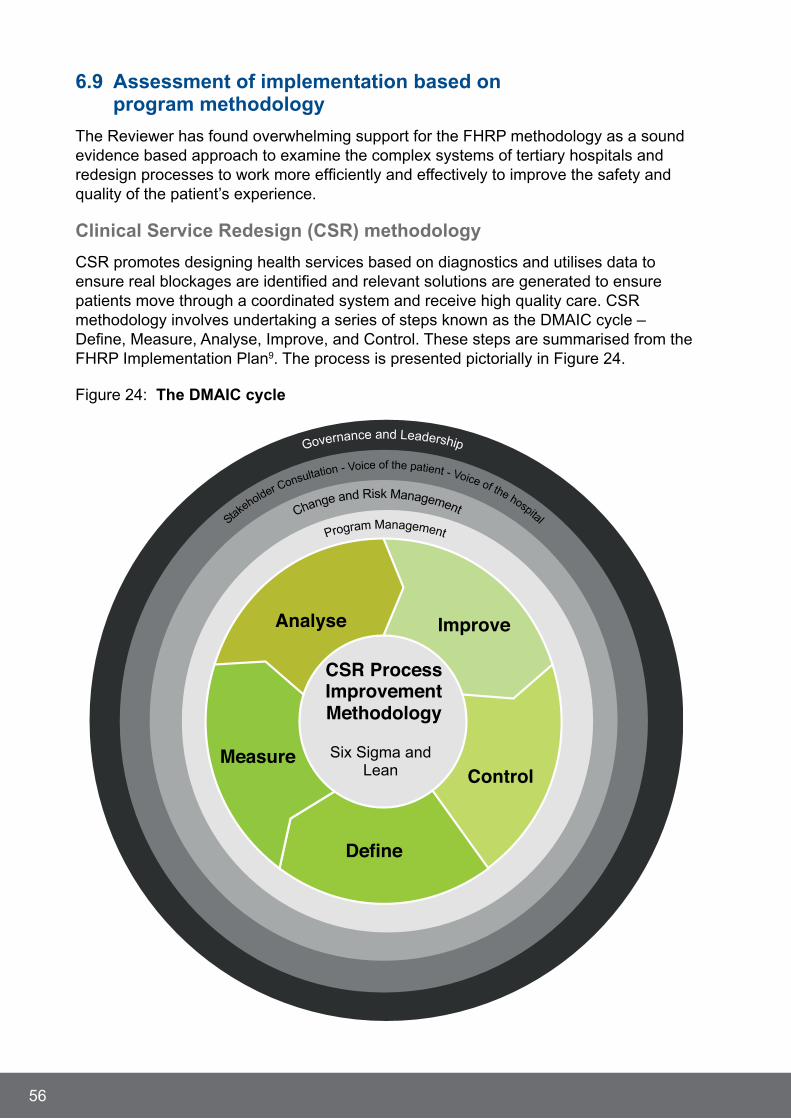
6.9 Assessment of implementation based on program methodology
The Reviewer has found overwhelming support for the FHRP methodology as a sound evidence based approach to examine the complex systems of tertiary hospitals and redesign processes to work more efficiently and effectively to improve the safety and quality of the patient’s experience.
Clinical Service Redesign (CSR) methodology
CSR promotes designing health services based on diagnostics and utilises data to ensure real blockages are identified and relevant solutions are generated to ensure patients move through a coordinated system and receive high quality care. CSR methodology involves undertaking a series of steps known as the DMAIC cycle – Define, Measure, Analyse, Improve, and Control. These steps are summarised from the FHRP Implementation Plan9. The process is presented pictorially in Figure 24.
Figure 24: The DMAIC cycle
56
Six Sigma and Lean
CSR Process Improvement Methodology
Control
Define
Analyse Improve
Measure
Define
The first step in the redesign process involves defining the problem or improvement opportunity. Critical requirements of the project are defined, such as goals, project team role allocation and process mapping. The voice of the patient is fundamental and should be built into the facility’s redesign plan. Stage One hospitals were given 4-5 weeks to complete this step.
The Voice of the patient (VOP) and voice of the staff (VOS) are fundamental components of the CSR process. While collection of VOP and VOS begins in Define, it should be an ongoing part of the entire cycle.
VOP identifies attributes of the care that are important to patients, as the patient is the only person who moves across the hospital silos. To truly redesign care, understanding the patient experience is essential. Collection methods used by hospitals for VOP included patient surveys, patient interviews and existing consumer information such as patient satisfaction surveys.
VOS involves provides the important employee perspective in redesigning care. Collecting VOS begins in Define where staff are involved in mapping processes. A successful CSR FHRP will closely involve staff at all stages.
Measure
Process data is collected to measure the performance of the core business process involved. Key outputs from this step include developing metrics, a data collection plan, and a baseline of current performance. Sites had 5-7 weeks to complete Measure.
Analyse
This step involves analysing the data collected in Measure and using a variety of tools to assess gaps between current performance and goal performance. The tools allow staff to determine the root causes of defects, establish factors of causality and relationships and test hypotheses. Findings are then presented to stakeholders in the form of a Data Fair. Hospitals had 6-8 weeks to complete Analyse.
Improve
In this step, creative and innovative solutions need to be generated to address the tested and proven root causes. In identifying probable solutions an assessment of their interaction with other input variables is required to determine the likely impact. A Solution Fair presents these ideas to stakeholders. A cost/benefit analysis of solutions may be undertaken to estimate the contribution of the solution to the overall target. Implementation Plans are to be completed for each solution. Hospitals had 6-8 weeks to complete Improve.
Control
In Control, solutions are implemented and monitored to ensure that any outstanding variances can be corrected. To ensure sustainability, they are operationalised through modifications of systems, structures and processes. It is critical that DMAI is iterative to maintain or extend the required improvements.
57
Desktop audit
The review team has undertaken a desktop audit of the Stage One hospitals’ documentation to determine of the FHRP methodology was adhered to throughout the DMAIC cycle. The review team considered the following:
* Did each hospital implement the FHRP following the agreed methodology?
* Were the identified agreed solutions supported in the ‘improve’ phase?
* Examine the impact of the Agreed Solutions and the ongoing monitoring of these strategies, with reference to negative impacts.
* Whether risks with solution implementation were identified and if management strategies were developed to mitigate the risks?
* The existence of signed off solution implementation plans.
The desktop audit utilised the following data sources and documented evidence to inform findings:
* Original Solutions Log as of January 2010 provided by Stage One sites
* Solutions Audit Reports conducted by Stage One sites as of January 2011
* Control Reports for Stage One sites for October 2011
* evaluation of the fortnightly reporting provided by Stage One sites to HSIU over the period leading up to the April 2009 target of 85% for the Minster for Health
* review of the status of the solutions funded under FHR Business Rules. To achieve funding these solutions will have needed to have followed CSR to achieve funding
* Data and Solutions Fairs 2009
* Business Cases October 2009
* Solutions Audit Reports December 2010-January 2011
* Business Case Funding Round Documents April 2011-August 2011
* Status Reports for MfH January-May 2010
* Site Monthly Control Reports 2009-2011.
The audit considered the baseline for assessment as the list of solutions developed for implementation, during Improve and Control phases for each site as at October 2009. Status reports from January 2011 provide an interim point for an assessment on the progress of implementation. For the purpose of this audit the end point was the status of implementation in October 2011.
The review team consulted with site FHRP Offices as appropriate to source copies of Implementation Plans and verify status of the developed solutions. Implementation Plans as proposed in October 2009 and agreed and signed off by Area Chief Executives were verified via the Control Reports submitted from November 2009 to January 2010.
The Reviewer has sought the views of FHRP Office staff on what may have caused any delay or failure in solution implementation. Also of interest were the existence of any FHRP variables which could be elucidated (i.e. maturity of the FHRP, site support, available resources) which may have impacted on implementation at Stage One sites.
58

6.10 Desktop audit findings
Diagnostic phases of the Four Hour Rule Program
The FHRP records provided unequivocal evidence that for the Stage One hospitals, the CSR methodology was implemented consistently at the four hospitals for the Define, Measure, Analyse and Improve (DMAI) phases of the FHRP.
All the hospitals have acknowledged that medical staff engagement in the DMAI phase, particularly junior doctors, was difficult. Reasons provided by sites were the competing nature of clinical work for JMOs and their belief that the FHRP did not involve them. It appears that PMH and FH both had greater success with engagement of their medical workforce in the activities of FHRP and the redesign.
Control phase and implementation of solutions
In October 2009, approximately 108 solutions were developed across the four teaching hospitals to address the root causes identified in the DMAI phases of the FHRP.
The solutions as developed are shown in Tables 8-10 below and have been grouped by the areas of the patient journey or processes identified for improvement or reform as linked to the identified root causes of delays or factors contributing to delays in the admission, transfer or discharge of patients from Emergency Departments.
Solutions included changes or reform around patient processes, medical speciality accommodation and bed allocation; capital works to enhance or create patient care areas or wards; and policy and protocol changes for bed management, diagnostic services and support services.
Of the 108 Solutions developed, 34 were approved for funding from the COAG Four Hour Rule Funds in January 2009. The remaining 74 solutions were approved by the Hospital or Area Service Chief Executive to go forward and would be resourced or funded by the Area Health Services.
Table 8 (p60) shows the numbers of solutions developed to address root causes at each hospital by the area or department of the patient journey as of October 2009.
59

Table 8: Number of solutions by area/process by hospital as of October 2009
Solution Area RPH SCGH FHHS PMH Total
Admissions (Whole of Hospital) 4 3 5 3 15
Admissions Medicine 2 0 2 0 4
Admissions Surgical 5 0 1 1 7
Admissions – Psych 5 0 0 0 5
Allied Health – Patient Support 0 0 0 1 1
Diagnostics (Radiology) 4 0 2 2 8
Emergency Department 8 3 4 11 26
Patient Flow (Emergency Department)
1 0 4 5 10
Ward Discharge 5 4 9 11 29
Patient Support 1 0 1 1 3
Totals* 35 10 28 35 108
*Note: these totals include project officers as part of solutions funding (RPH x 3, Fremantle Hospital x 2 and Princess Margaret Hospital x 1, SCGH x1 – March 2011)
Table 9: Solutions implemented by solutions area by each hospital as of December 2010
Solutions implemented November 2010
RPH SCGH FHHS PMH Total
Admissions (Whole of Hospital)
2 1 2 5
Admissions Medicine 0
Admissions Surgical 1 1 2
Admissions – Psych 0
Allied Health – Patient Support
0
Diagnostics (Radiology) 1 1 1 3
Emergency Department 6 1 2 3 12
Patient Flow (Whole of Hospital)
1 1 2
Ward Discharge 1 1 6 8
Totals 10 (of 35) 3 (of 10) 8 (of 28) 11 (of 35) 32 (of 108)
60
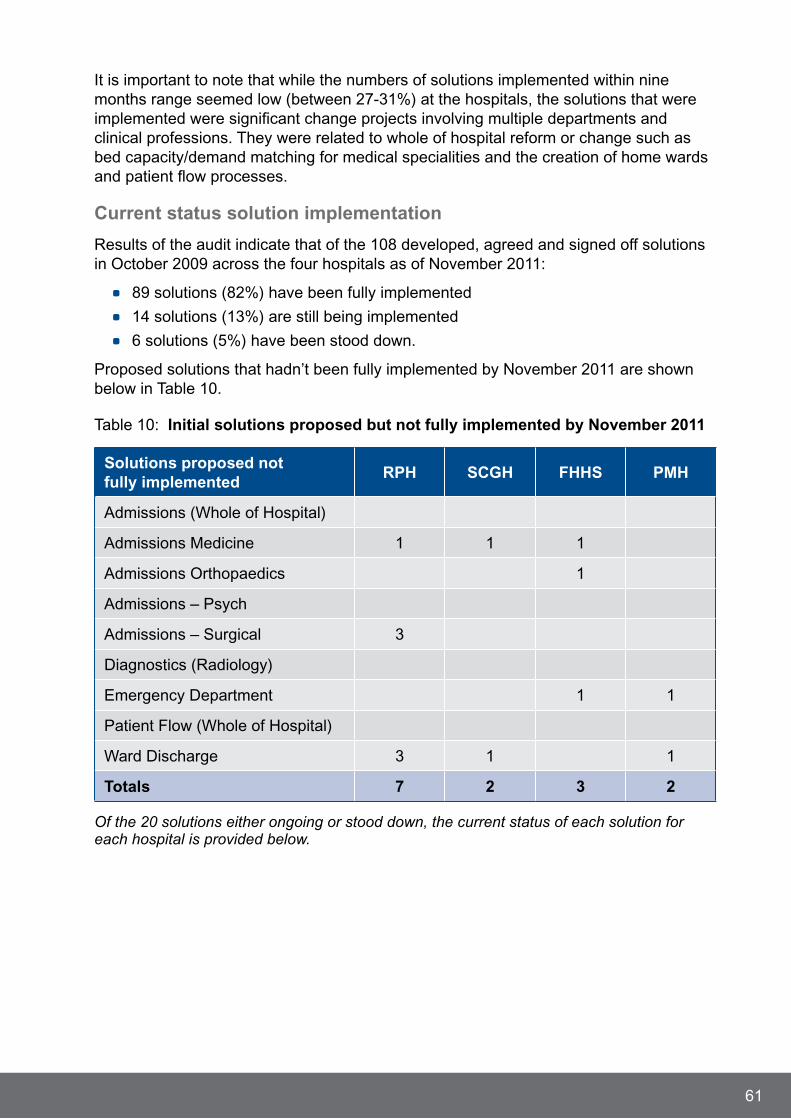
It is important to note that while the numbers of solutions implemented within nine months range seemed low (between 27-31%) at the hospitals, the solutions that were implemented were significant change projects involving multiple departments and clinical professions. They were related to whole of hospital reform or change such as bed capacity/demand matching for medical specialities and the creation of home wards and patient flow processes.
Current status solution implementation
Results of the audit indicate that of the 108 developed, agreed and signed off solutions in October 2009 across the four hospitals as of November 2011:
* 89 solutions (82%) have been fully implemented
* 14 solutions (13%) are still being implemented
* 6 solutions (5%) have been stood down.
Proposed solutions that hadn’t been fully implemented by November 2011 are shown below in Table 10.
Table 10: Initial solutions proposed but not fully implemented by November 2011
Solutions proposed not fully implemented
RPH SCGH FHHS PMH
Admissions (Whole of Hospital)
Admissions Medicine 1 1 1
Admissions Orthopaedics 1
Admissions – Psych
Admissions – Surgical 3
Diagnostics (Radiology)
Emergency Department 1 1
Patient Flow (Whole of Hospital)
Ward Discharge 3 1 1
Totals 7 2 3 2
Of the 20 solutions either ongoing or stood down, the current status of each solution for each hospital is provided below.
61

6.11 Solution implementation by site
Royal Perth Hospital
Ongoing:
* Acute Assessment Unit model processes and structure. Issues related to this unit are the medical staff allocation with respect to senior consultant clinician cover and after hours and weekend cover, patient turnover, admission rate.
* There are three Surgical Admission solutions still progressing; Theatre utilisation (emergency cases); modelling analysis demand capacity matching elective/emergency surgery and; a team based model for anaesthetists and surgeon teams.
* There are three ward discharge solutions still progressing; Criteria led discharge incorporated into standard discharge documentation; standardised discharge documentation for doctors; and Hospital Visual Bed Management System.
Stood down:
* Review and Agreement for all Specialities Admission Criteria – this solution was adopted by some specialities but not agreed to by others. The FHRP Board stood this solution down in favour of other whole of hospital solutions for admissions.
* Senior decision maker with consultant clinician led service in ED (Surgical Registrar/Consultant in ED) to facilitate triage, review and admission surgical patients. This solution was not supported by the surgical specialities as theatre utilisation was seen as the greater priority. Stood down due to lack of engagement by surgical specialities and limitations of existing rosters.
* Voice Reporting of X-Rays; this solution was stood down and handed over to Imaging Department as a future initiative; it was not able to be achieved within existing budget resources.
* There were two Psychiatric Team Solutions; criteria led discharge on the ward and clinical protocols to improve LOS for inpatients. These were both low priority initiatives for the team due to small volume of inpatients and were stood down in favour of emphasis on implementing other mental health solutions for Emergency Department presentations.
Princess Margaret Hospital
Ongoing:
* Criteria Led Discharge which is currently being rolled out across other medical specialities after successful trial in one ward.
* Redesign of the Psychiatric Assessment Process in the Emergency Department.
62
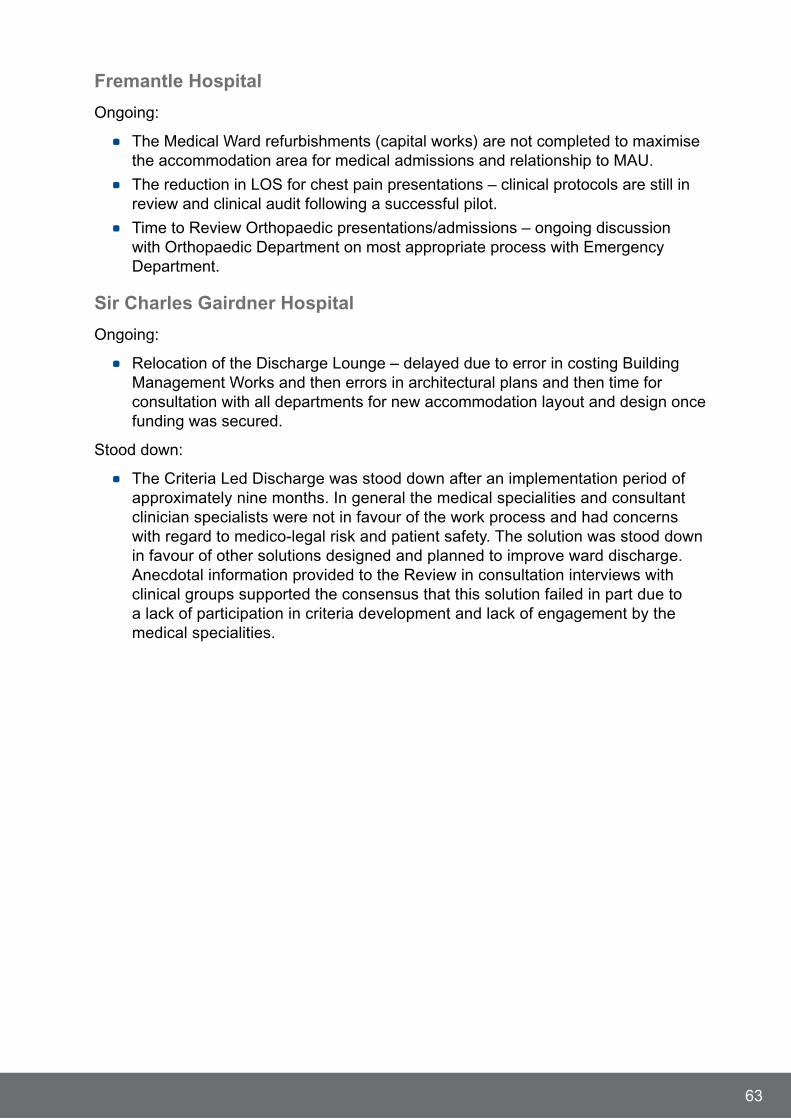
Fremantle Hospital
Ongoing:
* The Medical Ward refurbishments (capital works) are not completed to maximise the accommodation area for medical admissions and relationship to MAU.
* The reduction in LOS for chest pain presentations – clinical protocols are still in review and clinical audit following a successful pilot.
* Time to Review Orthopaedic presentations/admissions – ongoing discussion with Orthopaedic Department on most appropriate process with Emergency Department.
Sir Charles Gairdner Hospital
Ongoing:
* Relocation of the Discharge Lounge – delayed due to error in costing Building Management Works and then errors in architectural plans and then time for consultation with all departments for new accommodation layout and design once funding was secured.
Stood down:
* The Criteria Led Discharge was stood down after an implementation period of approximately nine months. In general the medical specialities and consultant clinician specialists were not in favour of the work process and had concerns with regard to medico-legal risk and patient safety. The solution was stood down in favour of other solutions designed and planned to improve ward discharge. Anecdotal information provided to the Review in consultation interviews with clinical groups supported the consensus that this solution failed in part due to a lack of participation in criteria development and lack of engagement by the medical specialities.
63
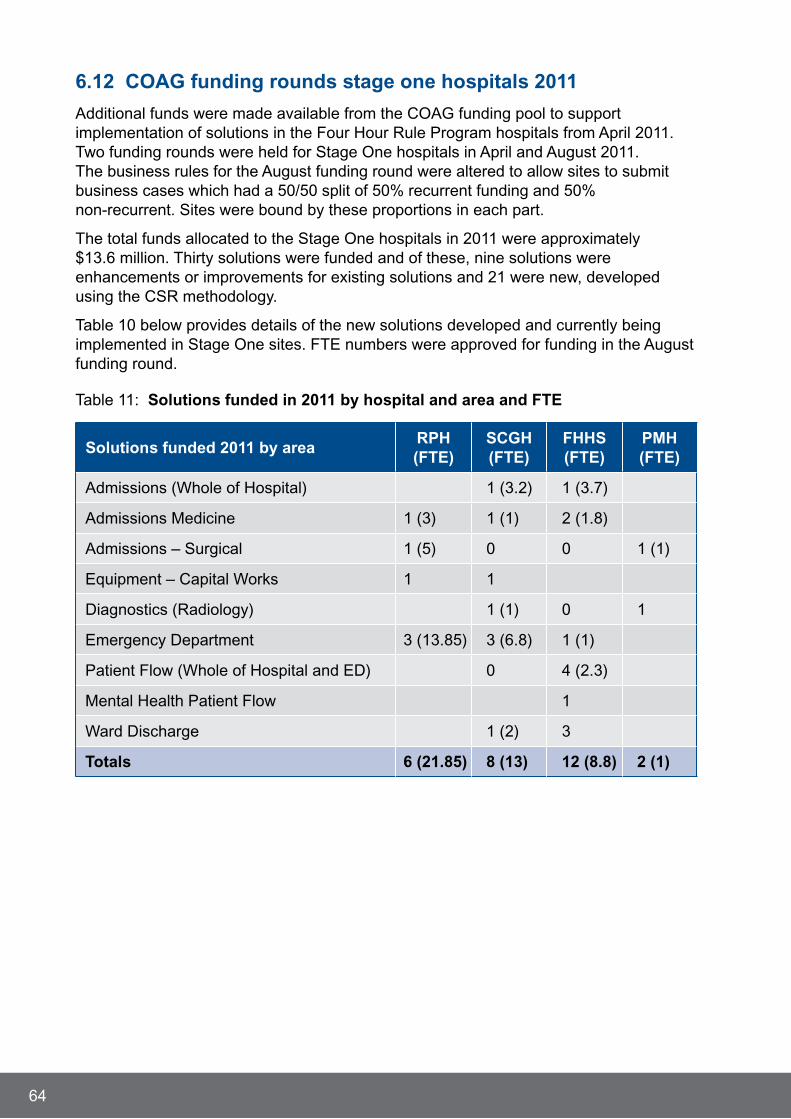
6.12 COAG funding rounds stage one hospitals 2011
Additional funds were made available from the COAG funding pool to support implementation of solutions in the Four Hour Rule Program hospitals from April 2011. Two funding rounds were held for Stage One hospitals in April and August 2011. The business rules for the August funding round were altered to allow sites to submit business cases which had a 50/50 split of 50% recurrent funding and 50% non-recurrent. Sites were bound by these proportions in each part.
The total funds allocated to the Stage One hospitals in 2011 were approximately $13.6 million. Thirty solutions were funded and of these, nine solutions were enhancements or improvements for existing solutions and 21 were new, developed using the CSR methodology.
Table 10 below provides details of the new solutions developed and currently being implemented in Stage One sites. FTE numbers were approved for funding in the August funding round.
Table 11: Solutions funded in 2011 by hospital and area and FTE
Solutions funded 2011 by areaRPH (FTE)
SCGH (FTE)
FHHS (FTE)
PMH (FTE)
Admissions (Whole of Hospital) 1 (3.2) 1 (3.7)
Admissions Medicine 1 (3) 1 (1) 2 (1.8)
Admissions – Surgical 1 (5) 0 0 1 (1)
Equipment – Capital Works 1 1
Diagnostics (Radiology) 1 (1) 0 1
Emergency Department 3 (13.85) 3 (6.8) 1 (1)
Patient Flow (Whole of Hospital and ED) 0 4 (2.3)
Mental Health Patient Flow 1
Ward Discharge 1 (2) 3
Totals 6 (21.85) 8 (13) 12 (8.8) 2 (1)
64
A total of 44.65 FTE were approved for funding in August 2011. Of these, 14.6 FTE were for clinical staff consultant clinicians and registrar positions to support after hours rosters for medical and surgical cover. The remaining FTE were nursing staff to support increased after hours services, clerical support staff, patient care assistants, radiology FTE to increase after hours imaging at SCGH and a phlebotomist position in ED at FHHS to improve delays to blood results. Additionally, project officer support at FHHS, PMH and SCGH has been extended.
The appointments of additional clinical FTE for senior after hours coverage on rosters may go some way to addressing concerns raised by JMOs regarding after hours supervision, workload and unsafe hours. This does not obviate the need for hospitals to review the medical and surgical patient intake models and AAU/ASU structures as recommended by the Reviewer.
The following factors contributed to solutions not all being fully implemented:
* The time and resources required for the implementation of significant whole of hospital change projects was under estimated and the change programs may have been somewhat ambitious within the time frames.
* The FTE resources allocated to the Program Offices at each hospital (2 FTE DoH advisor and analyst site support) ceased at a time of high level activity to commence implementation of solutions and major reform changes. The impact of this was a loss of momentum in the reform process and loss of critical skill mix in hospitals to support clinical solution teams to develop implementation plans and implement reform.
* The COAG Funds available for solutions implementation precluded the approval of any funding for any solutions with recurrent budget implications (FTE or OSG). The impact of this limitation required hospitals to implement reform and change in setting of existing budgets at a time when government required a 3% budget reduction. This was a limiting factor for the hospitals trying to achieve budget restraint.
* Not all the hospitals maximised the use of the available site advisor support of four hours per week in the first three months of Control which was contracted from external consultancy Price Waterhouse Cooper, this may have contributed to variation in how projects were implemented occurring and was probably an lost opportunity for the hospitals.
* The need for project officer support at the hospitals was delayed through the funding process. It was evident to the Reviewer that once short term project officer resources were provided to support clinical teams. The hospitals were able to gain immediate traction on the implementation of solutions.
65

6.13 Desktop audit conclusion
The Reviewer found that the Control Phase of the FHRP was in general implemented in line within the agreed methodology, albeit with variances across hospitals. Areas that could be improved include:
Voice of the staff
It is clear to the Reviewer that while VOS was collected early in the CSR process, this was not adequately continued into the Control phase. This Review was necessitated by complaints to the MfH and the DG. If the VOS had been adequately collected and addressed in an ongoing fashion at a site level, the Review may not have been required.
Voice of the patient
The methods, consistency, regularity and subsequent strategies for addressing the VOP varied greatly across the hospitals sites. It was done very well in some hospitals, while others seemed to forget about VOP after the Define phase. This has significant implications for monitoring solutions and their effect on the patient experience.
Risk management
The evidence found by the review team with respect to management of risks identified in relation to solutions was lacking in the documentation formats developed by the DoH. From the documented risks, it is opinion of the Reviewer that the methodology of risk management was not done well and mitigation strategies reported by sites to deal with particular risks were not described as actions nor was responsibility assigned to the appropriate executive sponsor.
The Reviewer has identified concerns with three key areas where the safety and quality of patient care could be compromised and this presents a considerable risk to these facilities:
* Emergency theatre access at RPH
* Surgical admission pathways
* Criteria Led Discharge to enhance timeliness of patient discharge.
Despite these factors hospitals have progressed and implemented the majority of solutions developed to address root causes of delays for patients as identified in 2009. The FHRP offices have become a critical factor in supporting hospitals and clinical departments to develop robust and rigorous processes for the delivery of patient care and services and this should be continued, given the limited capacity in the facilities.
66
7. References
1. Darzi, A. High Quality Care for All – NHS Next Stage Review Final Report. England: National Health Service; 2008 June.
2. Sprivulis P, Da Silva J, Jacobs I, Frazer A, Jelinek G. The association between hospital overcrowding and mortality among patients admitted via Western Australian emergency departments. Med J Aust. 2006 Mar 6; 184(5):208-12.
3. Cooke M, targets and indicators in emergency care Department of Health NHS UK (WA presentation October 2011).
4. Ben-Tovim D, Dougherty M, O’Connell T, McGrath K. Patient journeys; the process of clinical redesign. Med J Aust. 2008; 188 (6):14-17.
5. Ham C, Kipping R, McLeod H. Redesigning work processes in health care: Lessons from the National Health Service. Milbank Quarterly. 2003 Sep; 81(3): 415-439.
6. Government of Western Australia: Department of Health. WA Health Emergency Demand UK Tour. Perth Western Australia. 2009 January.
7. Radiological data for the four stage one hospitals 2009-2011. AgfaRIS. Imaging West 2011 November.
8. Minister for Health Dr Kim Hames: Ministerial Media Release Four Hour Hospital Rule to be reviewed. The West Australian newspaper. 2011 July 21.
9. Government of Western Australia: Department of Health. WA Four Hour Rule Program Implementation Plan v1. Perth Western Australia 2009 March.
10. Stokes B. Review of admission and discharge referral practices from the metropolitan hospital emergency departments. Government of Western Australia: Department of Health 2011 July.
11. Department of Health. The NHS Plan: A plan for reform, a plan for investment. England. 2000 July.
12. Darzi, A. Healthcare for London – A Framework for action. London 2007 July.
13. Department of Health/National Health Service. The Operating Framework for the NHS in England 2011/12. England. 2010 December.
14. Council of Australian Governments. National Health Reform Agreement – National Partnership Agreement on improving public hospital services 2011-2016. Australia 2011.
15. Jones D, Bellomo R, DeVita M. Effectiveness of the Medical Emergency Team: the importance of dose. Critical Care 2009 Oct 6; 13:313 1-5.
16. Government of Western Australia: Department of Health. Prevention of Bullying in the Workplace policy. 2004.
17. Henley J, Bennett, C, Williamson, J and Scott, I. Standards for medical assessment and planning units in public and private hospitals for the IMSANZ medical assessment planning unit working group (May 2006) for the International Medicine Society of Australia and New Zealand.
67
18. Separating emergency and elective surgical care: recommendations for practice. The Royal College of Surgeons of England 2007 September www.rcseng.ac.uk/publications/docs.
19. Mohammed M S and Mufti, G R. The surgical assessment unit – effective strategy for improvement of the emergency surgical pathway? Journal of the Royal Society of Medicine 2005 January 98 (1) 14-17.
20. NHS National Workforce Projects, Surgical Assessment Unit 09/01/06-04/03/07 Results to date, 2007, accessed 15 November 2011 from http://www.healthcareworkforce.nhs.uk/wtd_pilot_pages/scarborough_pilot/work_package_3/
21. Cox M R, Cook L, Dobson J, Lambakis P, Ganesh S and Cregan P. Acute surgical unit: a new model of care. ANZ Journal of Surgery 2010 June Volume 80 (6) 414-424.
22. von Conrady D, Hamza S, Weber D, Kalani K, Epari K, Wallace M and Fletcher D. The acute surgical unit: improving emergency care. ANZ Journal of Surgery 2010 February (manuscript).
23. Sundararajan s, Mamza s, Epari K and Fletcher D. Acute Surgical unit – the future of emergency surgery. RACS presentation 2011 May.
24. Surgical acute rapid assessment unit (SARA) clinical service redesign program. Department of Health New South Wales 2009 March. http://www.archi.net.au/e-library/build/moc
25. Tobin A and Santamaria, J D. After hours discharge from intensive care are associated with increased mortality. Medical Journal of Australia 2006 April 184 (7) 334-337.
26. Hanane T, Keegan M T, Segerian EG, Garjic O and Bekele A. The association between night time transfer from the intensive care unit and patient outcome. Critical care medicine 2008 March 36 (8) 2232-2237.
27. Duke D J and Briedis, J H. Night shift discharge for intensive care unit increases the mortality-risk of ICU survivors. Anaesthesia and Intensive Care 2004 October 32 (5) 697-701.
28. Priestap F A and Martin C M. Impact of intensive care unit discharge time on patient outcome Critical care medicine 2006 34 (12) 2946-2951.
68
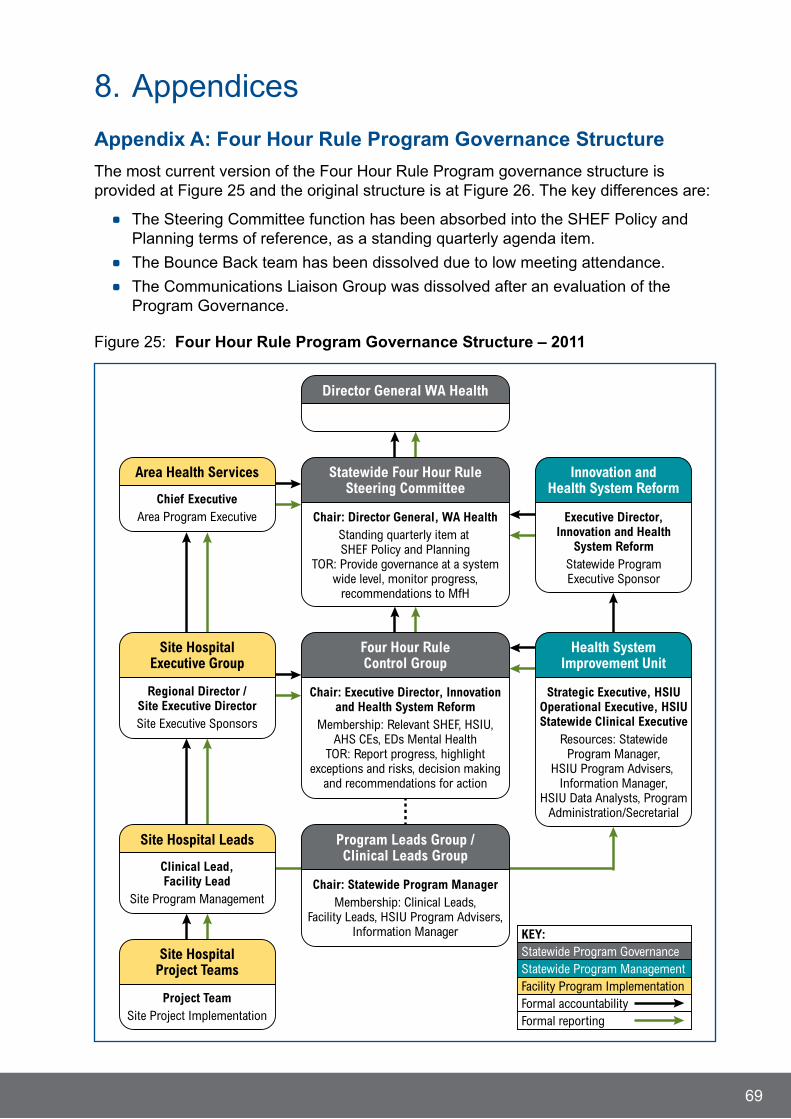
8. Appendices
Appendix A: Four Hour Rule Program Governance Structure
The most current version of the Four Hour Rule Program governance structure is provided at Figure 25 and the original structure is at Figure 26. The key differences are:
* The Steering Committee function has been absorbed into the SHEF Policy and Planning terms of reference, as a standing quarterly agenda item.
* The Bounce Back team has been dissolved due to low meeting attendance.
* The Communications Liaison Group was dissolved after an evaluation of the Program Governance.
Figure 25: Four Hour Rule Program Governance Structure – 2011
69
Director General WA Health
Statewide Four Hour RuleSteering Committee
Area Health Services
Chair: Director General, WA HealthStanding quarterly item at SHEF Policy and Planning
TOR: Provide governance at a systemwide level, monitor progress,
recommendations to MfH
Four Hour RuleControl Group
Chair: Executive Director, Innovationand Health System Reform
Membership: Relevant SHEF, HSIU,AHS CEs, EDs Mental Health
TOR: Report progress, highlightexceptions and risks, decision making
and recommendations for action
Program Leads Group /Clinical Leads Group
Chair: Statewide Program ManagerMembership: Clinical Leads,
Facility Leads, HSIU Program Advisers,Information Manager
Innovation andHealth System Reform
Executive Director,Innovation and Health
System ReformStatewide ProgramExecutive Sponsor
Chief ExecutiveArea Program Executive
Site Hospital Leads
Clinical Lead,Facility Lead
Site Program Management
Site HospitalExecutive Group
Regional Director /Site Executive DirectorSite Executive Sponsors
Site HospitalProject Teams
Project TeamSite Project Implementation
Health SystemImprovement Unit
Strategic Executive, HSIUOperational Executive, HSIUStatewide Clinical Executive
Resources: StatewideProgram Manager,
HSIU Program Advisers, Information Manager,
HSIU Data Analysts, ProgramAdministration/Secretarial
KEY:Statewide Program GovernanceStatewide Program ManagementFacility Program ImplementationFormal accountabilityFormal reporting
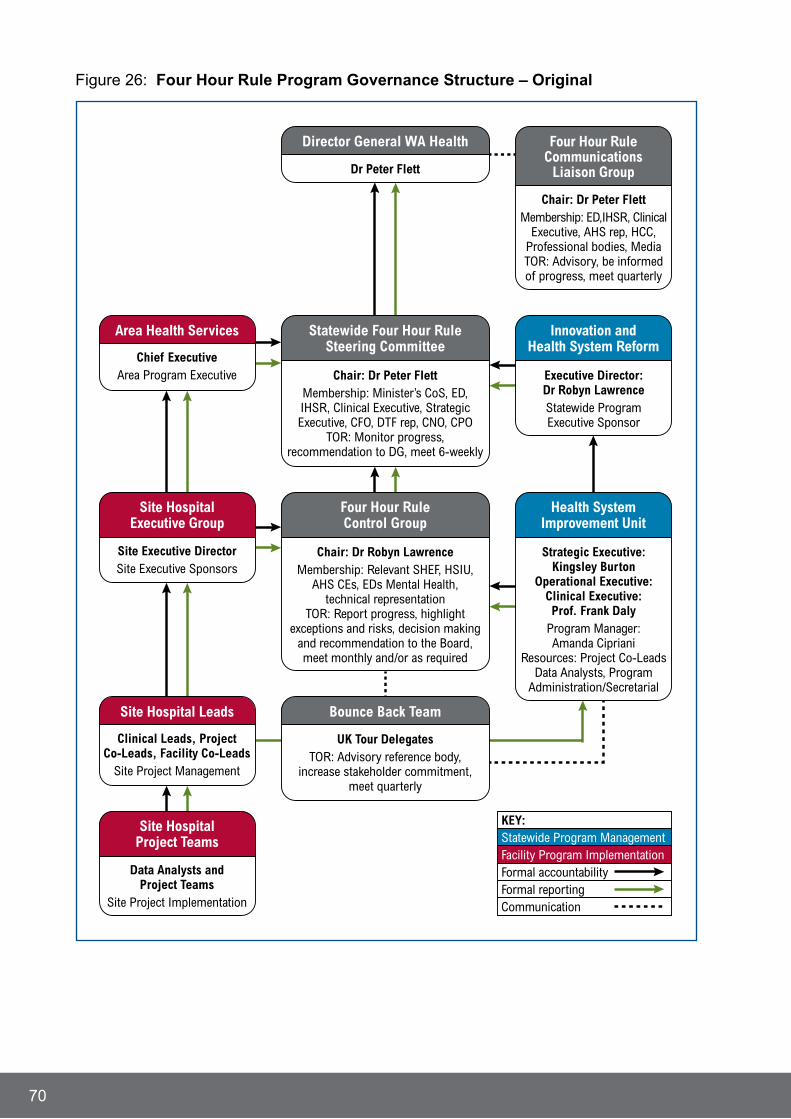
Figure 26: Four Hour Rule Program Governance Structure – Original
70
Director General WA Health
Statewide Four Hour RuleSteering Committee
Area Health Services
Chair: Dr Peter FlettMembership: Minister’s CoS, ED,IHSR, Clinical Executive, StrategicExecutive, CFO, DTF rep, CNO, CPO
TOR: Monitor progress,recommendation to DG, meet 6-weekly
Dr Peter Flett
Four Hour RuleControl Group
Chair: Dr Robyn LawrenceMembership: Relevant SHEF, HSIU,
AHS CEs, EDs Mental Health,technical representation
TOR: Report progress, highlightexceptions and risks, decision making
and recommendation to the Board,meet monthly and/or as required
Bounce Back Team
UK Tour DelegatesTOR: Advisory reference body,
increase stakeholder commitment,meet quarterly
Innovation andHealth System Reform
Executive Director:Dr Robyn LawrenceStatewide ProgramExecutive Sponsor
Four Hour RuleCommunications
Liaison Group
Chair: Dr Peter FlettMembership: ED,IHSR, Clinical
Executive, AHS rep, HCC,Professional bodies, MediaTOR: Advisory, be informedof progress, meet quarterly
Chief ExecutiveArea Program Executive
Site Hospital Leads
Clinical Leads, ProjectCo-Leads, Facility Co-Leads
Site Project Management
Site HospitalExecutive Group
Site Executive DirectorSite Executive Sponsors
Site HospitalProject Teams
Data Analysts andProject Teams
Site Project Implementation
Health SystemImprovement Unit
Strategic Executive:Kingsley Burton
Operational Executive:Clinical Executive:Prof. Frank Daly
Program Manager:Amanda Cipriani
Resources: Project Co-LeadsData Analysts, Program
Administration/Secretarial
KEY:Statewide Program ManagementFacility Program ImplementationFormal accountabilityFormal reportingCommunication

Appendix B
Terms of Reference
Four Hour Rule Issues and Progress Review
1. Name
The Review shall be known as the Four Hour Rule Issues and Progress Review (the Review) and will be led by Professor Bryant Stokes AM who has been engaged by the Director General Health.
2. Goal and scope
The principal goal of the Review is to consider and assess matters raised in Staff Forums and by Doctors in Training Meetings in relation to the Four Hour Rule Program and recommend to the Department those strategies that will improve the delivery of safe patient care.
Scope
The scope of the Review is to examine the status of implementation of the Four Hour Rule Program at Stage One sites, namely Royal Perth Hospital (RPH), Sir Charles Gairdner Hospital (SCGH), Fremantle Hospital (FHHS) and Princess Margaret Hospital (PMH) Hospital.
Process
Professor Stokes will be supported by the Review Team and a Review Working Reference Group and will achieve the goal by consultation with key stakeholders to gather views, information and evidence sufficient to achieve the goal.
The key stakeholders will include:
Internal: key staff at all hospitals in-scope and associated Area Health Services personnel including but not exclusively the Chief Executives, the Executive Directors of the hospitals, Clinical Leads, Facility Leads, Executive Sponsors, Heads of Departments and any staff groups.
The A/Executive Director, Innovation and Health System Reform, Four Hour Rule Central Program Staff, Central Data Analyst Team, and Health System Improvement Unit personnel.
External: The Review Team will consult with external Staff Representation Groups, Consumer, Carer and Community Groups and others as deemed appropriate.
Accountability
The Review Team led By Professor Stokes is accountable to the Director General Health.
71
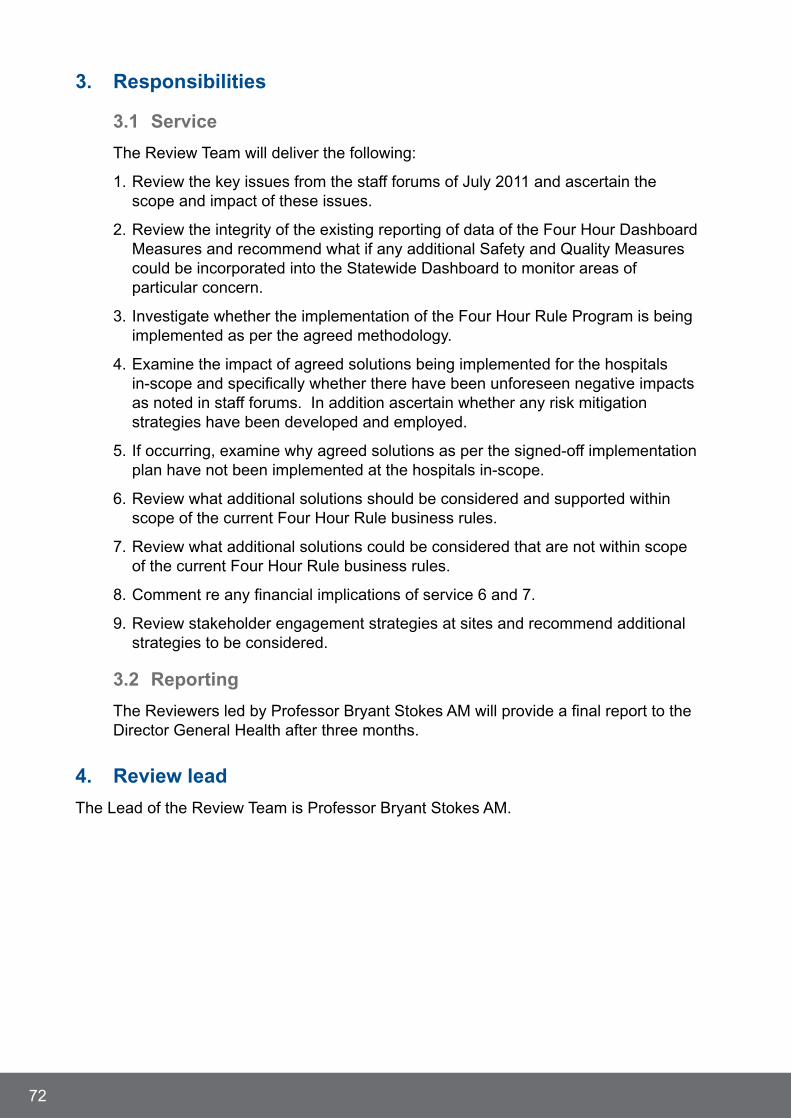
3. Responsibilities
3.1 Service
The Review Team will deliver the following:
1. Review the key issues from the staff forums of July 2011 and ascertain the scope and impact of these issues.
2. Review the integrity of the existing reporting of data of the Four Hour Dashboard Measures and recommend what if any additional Safety and Quality Measures could be incorporated into the Statewide Dashboard to monitor areas of particular concern.
3. Investigate whether the implementation of the Four Hour Rule Program is being implemented as per the agreed methodology.
4. Examine the impact of agreed solutions being implemented for the hospitals in-scope and specifically whether there have been unforeseen negative impacts as noted in staff forums. In addition ascertain whether any risk mitigation strategies have been developed and employed.
5. If occurring, examine why agreed solutions as per the signed-off implementation plan have not been implemented at the hospitals in-scope.
6. Review what additional solutions should be considered and supported within scope of the current Four Hour Rule business rules.
7. Review what additional solutions could be considered that are not within scope of the current Four Hour Rule business rules.
8. Comment re any financial implications of service 6 and 7.
9. Review stakeholder engagement strategies at sites and recommend additional strategies to be considered.
3.2 Reporting
The Reviewers led by Professor Bryant Stokes AM will provide a final report to the Director General Health after three months.
4. Review lead
The Lead of the Review Team is Professor Bryant Stokes AM.
72

5. Membership – Review Working Reference Group
Professor Bryant Stokes AM will be supported as required by a Review Working Reference Group.
The following hospital and health service personnel will form the working reference group. Members are not appointed as individuals but by virtue of the positions they hold to provide expert content advice to the Review Lead.
Review working reference group
Professor David Fletcher, Head of General Surgery, Clinical Director of Surgical Servcies, Fremantle Hospital
Dr Mark Monaghan, State Clinical Lead, Four Hour Rule Program
Ms Marani Hutton, Allied Health Advisor; South Metropolitan Area Health Service
Dr Mark Platell, Director of Clinical Services, Royal Perth Hospital
Ms Tanya Basile, Nurse Co-Director, Sir Charles Gairdner Hospital
Dr Dror Maor, Co-Chair, Doctors in Training, Australian Medical Association
Dr Caroline Rhodes, Doctors in Training, Australian Medical Association
Mr Matthew Szabo, Clinical Nurse Emergency Department, Princess Margaret Hospital
Dr David Blacker, Neurologist, Sir Charles Gairdner Hospital.
The Review Lead may co-opt additional members to the Group and/or convene expert working groups as required.
6. Records
The Secretariat shall be provided by the Health System Improvement Unit, Department of Health and maintain all departmental records in relation to the Review.
The Secretariat shall issue agendas and supporting material at least four days in advance and prepare minutes from each meeting.
The secretariat shall keep separate files of at least the following:
* agendas, minutes and papers circulated with them; and
* correspondence, papers tabled at meetings and papers circulated other than with agendas.
These files are the property of the Department of Health Western Australia and must be preserved in accordance with the Library Board Act and the Freedom of Information Act 1992. The Health Services (Quality Improvement) Act 1994 may also apply to the documents.
7. Adoption and amendment of Terms of Reference
These Terms of Reference shall be endorsed by the Director General Health.
73

74
This page has been left blank intentionally.


Produced by© Department of Health 2011 H
P12
320
DE
C’1
1