Embed Size (px)
Citation preview

Fourth Quarter 2008 Report to Shareholders
BMO Financial Group Reports Fourth Quarter Net Income of $560 Million
Good Overall Performance in the Context of Current Economic and Market Conditions
P&C Canada Demonstrates Tangible Progress on its Strategic Agenda, Earning Annual Net Income of More
than $1.3 billion with Strong Quarterly Results
Private Client Group’s Results Reflect Good Underlying Performance as Annual Earnings Match Record
Results of a Year Ago
BMO Capital Markets Earns $285 Million for the Quarter, Reflecting Good Results in a Number of Core
Businesses
Financial Results Highlights:
Fourth Quarter 2008 Compared with Fourth Quarter 2007: • Net income of $560 million compared with $452 million • EPS1 of $1.06 compared with $0.87 and cash EPS2 of $1.08 compared with $0.89 • Strong Tier 1 Capital Ratio, at 9.77% on a Basel II basis • Return on equity at 14.0% reflects the benefits of our diversified businesses • Transferred $2.0 Billion of Securities from our Trading Portfolio to our Available-for-Sale Portfolio and Recognized $123 Million After-Tax of Unrealized
Losses in Shareholders’ Equity
Fiscal 2008 Compared with a Year Ago: • Net income of $1,978 million compared with $2,131 million • EPS of $3.76 compared with $4.11 and cash EPS of $3.83 compared with $4.18 • Return on equity of 13.0% compared with 14.4% in 2007
Toronto, November 25, 2008 -For the fourth quarter ended October 31, 2008, BMO Financial Group reported a 24% year-over-year increase in net income, earning $560 million. Earnings per share were $1.06, up $0.19 or 22%. “We have maintained our strong Tier 1 Capital Ratio and earned a return on equity of 14% in the quarter and 13% for the year. These results reflect BMO’s relative strength and stability among global financial institutions,” said Bill Downe, President and Chief Executive Officer, BMO Financial Group. “Our overall performance in the quarter was good and while we are not immune to the difficulties of the current market environment, we are focused on our core operations and serving our customers. This is reflected in our results this quarter and further gains in market share in our priority businesses in Canadian retail banking. “P&C Canada, our Canadian personal and commercial banking unit, again reported very good results, increasing both revenues and earnings in each quarter of the year and capping off a solid performance in 2008 with year-over-year earnings growth of 19% for the quarter. “We have a well-earned reputation for working together with our customers through the different phases of the credit cycle. In today’s economic environment, we continue to apply our consistent underwriting standards to make credit available to Canadians and their businesses. Customers and prospects alike have recognized our commitment and this approach strengthens our relationships and positions our Canadian retail bank well for the future. Personal loans were up a strong 21% year over year, due in part to our successful HomeOwner Readiline, and commercial loans were up a healthy 12% in the $1-to-$5 million segment. Our market share of personal loans and personal deposits increased year over year and quarter over quarter. “Private Client Group’s results for the fiscal year matched the record performance of a year ago. Results were down in the quarter, having been affected by charges related to our offer to purchase certain holdings from clients in the difficult market environment. Adjusted for those charges, results in the quarter and underlying operating performance were good,” added Mr. Downe.

BMO Financial Group Fourth Quarter Report 2008 • 1
Results in our U.S. personal and commercial banking group were lower, having been affected by higher levels of integration costs, as we completed the integration of our Wisconsin acquisitions, and by an increase to a previously-disclosed Visa litigation reserve and the impact on revenues and expenses of the difficult market environment. Net income fell to US$11 million in the quarter or to US$24 million adjusted for the litigation charge and integration costs, reflecting the challenging environment. We continue to focus on meeting our customers’ needs in the difficult environment and strengthening our relationships to build a solid base for when the U.S. economy recovers. “Results in BMO Capital Markets improved for the third consecutive quarter and were up significantly from a year ago. Although some businesses are clearly affected by low activity levels and charges related to current market conditions, a number of our core businesses have benefited from solid growth in the quarter, including our interest-rate-sensitive businesses, foreign exchange trading business and the structured-products trading business within Trading Products,” concluded Mr. Downe. Detail on charges recorded in the quarter is provided in the Effects of the Capital Markets Environment on Fourth Quarter Results section. BMO’s revenues increased 28% year over year, compared with 10% expense growth. Net income growth was affected by higher credit losses. Provisions for credit losses totalled $465 million for the quarter, of which $333 million was recorded in Corporate Services under our expected loss provisioning methodology. There was a $150 million increase in the general allowance. Specific provisions of $315 million were down quarter over quarter but up appreciably relative to a year ago due to U.S. economic weakness, particularly in U.S. real estate markets. The effective tax rate in the quarter was a recovery rate of 9.2%, and included the benefit of $73 million of recoveries of prior-period income taxes. Excluding the impact of the increase in the general allowance, tax recoveries, and a higher proportion of income from lower-tax-rate jurisdictions, the effective tax rate in the current quarter would be within the expected sustainable range of 16% to 20%. 1 All Earnings per Share (EPS) measures in this document refer to diluted EPS unless specified otherwise. 2 The adjustments that change results under generally accepted accounting principles (GAAP) to cash results are outlined in the Non-GAAP Measures section at the end of Management’s Discussion and Analysis
(MD&A), where all non-GAAP measures and their closest GAAP counterparts are outlined.

Financial Highlights
(Unaudited) (Canadian $ in millions, except as noted) For the three months ended For the twelve months ended
October 31, 2008
July 31,
2008
April 30,
2008
January 31,
2008
October 31,
2007
Change from
October 31, 2007
October 31,2008
October 31,
2007
Change from
October 31, 2007
Income Statement Highlights Total revenue $ 2,813 $ 2,746 $ 2,620 $ 2,026 $ 2,200 27.9 % $ 10,205 $ 9,349 9.2 % Provision for credit losses 465 484 151 230 151 +100 1,330 353 +100 Non-interest expense 1,818 1,782 1,680 1,614 1,655 9.9 6,894 6,601 4.4 Net income 560 521 642 255 452 23.9 1,978 2,131 (7.2)
Common Share Data ($) Diluted earnings per share $ 1.06 $ 0.98 $ 1.25 $ 0.47 $ 0.87 $ 0.19 $ 3.76 $ 4.11 $ (0.35)Diluted cash earnings per share (a) 1.08 1.00 1.26 0.49 0.89 0.19 3.83 4.18 (0.35)Dividends declared per share 0.70 0.70 0.70 0.70 0.70 0.00 2.80 2.71 0.09 Book value per share 32.02 30.15 29.71 28.64 28.29 3.73 32.02 28.29 3.73 Closing share price 43.02 47.94 50.10 56.75 63.00 (19.98) 43.02 63.00 (19.98)Total market value of common shares ($ billions) 21.7 24.2 25.2 28.3 31.4 (9.7) 21.7 31.4 (9.7)
As at
October 31, 2008
July 31,
2008
April 30,
2008
January 31,
2008
October 31,
2007
Change from
October 31, 2007
Balance Sheet Highlights Assets $ 416,050 $ 375,047 $ 375,158 $ 376,825 $ 366,524 13.5 %Net loans and acceptances 214,995 208,315 205,422 211,931 201,188 6.9 Deposits 257,670 248,657 238,580 242,911 232,050 11.0 Common shareholders’ equity 16,158 15,207 14,954 14,304 14,102 14.6
For the three months ended For the twelve months ended
October 31, 2008
July 31,
2008
April 30,
2008
January 31,
2008
October 31,
2007
October 31,2008
October 31,
2007
Primary Financial Measures (%) (b) Average annual five year total shareholder return 0.9 5.1 8.2 10.1 14.2 0.9 14.2 Diluted earnings per share growth 21.8 (23.4) (3.1) (29.9) (35.6) (8.5) (20.2)Diluted cash earnings per share growth (a) 21.3 (23.1) (3.8) (27.9) (35.0) (8.4) (20.1)Return on equity 14.0 13.5 17.9 6.7 12.2 13.0 14.4 Cash return on equity (a) 14.3 13.7 18.1 6.9 12.5 13.3 14.7 Net economic profit (NEP) growth (a) +100 (56.5) (7.9) (+100) (78.1) (32.8) (51.0)Operating leverage 18.0 0.1 (0.5) 1.5 (13.2) 4.8 (10.3)Cash operating leverage (a) 18.0 0.0 (0.7) 1.5 (13.2) 4.7 (10.3)Revenue growth 27.9 7.5 3.6 (2.0) (10.6) 9.2 (6.4)Non-interest expense-to-revenue ratio 64.6 64.9 64.1 79.7 75.2 67.6 70.6 Cash non-interest expense-to-revenue ratio (a) 64.2 64.5 63.8 79.2 74.7 67.1 70.1 Provision for credit losses-to-average loans and acceptances (annualized) 0.81 0.89 0.28 0.42 0.29 0.60 0.17 Gross impaired loans and acceptances-to-equity and allowance for credit losses 11.34 9.09 9.54 7.46 4.07 11.34 4.07 Cash and securities-to-total assets ratio 29.1 29.6 29.6 30.7 33.1 29.1 33.1 Tier 1 capital ratio – Basel II 9.77 9.90 9.42 9.48 n/a 9.77 n/a Tier 1 capital ratio – Basel I 9.41 9.45 9.03 9.05 9.51 9.41 9.51 Credit rating Standard & Poor’s A+ A+ A+ A+ A+ A+ A+ Moody’s Aa1 Aa1 Aa1 Aa1 Aa1 Aa1 Aa1 Fitch AA- AA- AA- AA- AA- AA- AA- DBRS AA AA AA AA AA AA AA
Other Financial Ratios (% except as noted) (b) Twelve month total shareholder return (27.9) (24.4) (24.6) (15.6) (5.8) (27.9) (5.8)Dividend yield 6.51 5.84 5.59 4.93 4.44 6.51 4.30 Price-to-earnings ratio (times) 11.4 13.4 12.9 14.5 15.3 11.4 15.3 Market-to-book value (times) 1.34 1.59 1.69 1.98 2.23 1.34 2.23 Net economic profit ($ millions) (a) 145 122 266 (127) 71 405 603 Return on average assets 0.54 0.52 0.66 0.26 0.48 0.50 0.59 Net interest margin on average earning assets 1.71 1.59 1.48 1.45 1.47 1.56 1.59 Non-interest revenue-to-total revenue 49.8 53.2 55.2 40.1 45.7 50.2 48.2 Non-interest expense growth 9.9 7.4 4.1 (3.5) 2.6 4.4 3.9 Cash non-interest expense growth (a) 9.9 7.5 4.3 (3.5) 2.6 4.5 3.9 Total capital ratio – Basel II 12.17 12.29 11.64 11.26 n/a 12.17 n/a Total capital ratio – Basel I 12.06 12.07 11.47 11.09 11.74 12.06 11.74 Equity-to-assets ratio 4.3 4.5 4.4 4.1 4.2 4.3 4.2
All ratios in this report are based on unrounded numbers. (a) Refer to the “Non-GAAP Measures” section of Management’s Discussion and Analysis for an explanation
of cash results and net economic profit. Securities regulators require that companies caution readers that earnings and other measures adjusted to a basis other than generally accepted accounting
principles (GAAP) do not have standardized meanings under GAAP and are unlikely to be comparable to similar measures used by other companies.
(b) For the period ended, or as at, as appropriate. n/a – not applicable.

2 • BMO Financial Group Fourth Quarter Report 2008
Operating Segment Overview P&C Canada
Net income was $344 million, up $57 million or 19% from a year ago. Results were strong and revenues and net income have risen in each quarter of 2008. There was good volume growth across most products. We earned net income of $1,320 million in fiscal 2008, up $53 million or 4.1% from a year ago. Net income a year ago included $6 million arising from three items, a $43 million recovery of prior year income taxes and two items that lowered revenue by a net $78 million ($37 million after-tax): a MasterCard gain and an adjustment to the liability for customer redemptions related to our credit card loyalty rewards program. Revenue in the fourth quarter rose $202 million or 18% year over year. Adjusted for the above items, revenue rose $124 million or 10%. Volume growth remained strong notwithstanding the emergence of weakness in the economy. There were improved revenues in each of personal banking, commercial banking and especially cards and payment services. Net interest margin was up year over year but was unchanged from the third quarter. Compared to the prior year, margin benefited from the interest on tax refunds, favourable product mix changes and increased product yields, partially offset by higher funding costs and lower mortgage refinancing fees. Expenses increased $38 million or 5.7% from a year ago due to higher employee costs and higher capital taxes. We continue to invest strategically in the business, including the expansion and renovation of our branch network, credit and debit card chip technology, as well as increasing the size of our mortgage specialist and financial planner workforce. In fiscal 2008, we opened 16 new branches, closed 10, relocated 11 and expanded seven. In personal banking, there continues to be growth in most products. Our personal loan growth was a strong 21% year over year with market share increasing 89 basis points from the prior year and 33 basis points from the third quarter. Our HomeOwner Readiline remains an important contributor to our accelerating personal loan growth. Our mortgage portfolio grew as new originations outpaced the impact of exiting from the broker mortgage channels. Personal deposit balances were up slightly from a year ago, with the number of active chequing account customers continuing to rise and the number of products per household showing positive trends. Personal deposits market share was up 6 basis points from a year ago and 1 basis point from the third quarter as competition remains intense. In commercial banking, there was solid loan growth at 7.2% in softer market conditions. Market share of business banking improved 67 basis points from the prior year but fell 5 basis points from the third quarter. BMO ranks second in Canadian business banking market share at 19.84% and our objective is to be the market leader. In the deposit category, year-over-year balance growth of 4.9% was accompanied by steady growth in the number of commercial operating deposit customers. We are pleased with our improved loyalty scores in personal and commercial banking where we have made broad-based gains relative to our competition. Cards and payment services revenues grew a strong 15% year over year, adjusted for last year’s unusual items. The growth was driven by transactions and accelerating balance growth as well as higher revenues from Moneris, our investment in a joint venture, and one of North America’s leading processors of debit and credit
payment transactions. Our most recent AIR MILES and Cashback rewards offers have broad appeal to customers which, combined with our pricing and credit strategies, have continued to drive strong revenue growth in a highly competitive environment. Cards and payment services are also seeing improvements in customer loyalty. In 2008, the group was awarded the Global Quality Platinum award from MasterCard Worldwide, which acknowledges performance in the key areas that affect the customer experience when making a purchase, including satisfaction at the point of sale through issuer availability and satisfaction with the authorization process.
P&C U.S. (all amounts in U.S.$)
Net income was $11 million, compared with a particularly strong $33 million a year ago. Results included $15 million of integration costs, lower than the $16 million to $18 million we estimated last quarter, as we focus on expense efficiency. Acquisition-integration costs were $13 million ($9 million after tax) higher than a year ago. Results were also affected by an additional $4 million after-tax charge for a Visa litigation reserve. Adjusted for the impact of these items, net income was $24 million in the quarter. The weak credit environment is affecting results as there are higher levels of non-performing loans and costs of managing our portfolio have increased. Revenue was up $23 million or 11%, with the Wisconsin acquisitions contributing three-quarters of the growth and the balance attributable to core revenue improvements. Net interest margin decreased due to a portfolio transfer earlier in the year, the higher levels of non-performing loans and product mix.

BMO Financial Group Fourth Quarter Report 2008 • 3
Private Client Group
Net income was $78 million, compared with $103 million a year ago. Results were affected by $31 million ($19 million after tax) of charges in respect of actions taken to support U.S. clients in the weak capital markets environment. They included charges related to securities of Lehman Brothers Holdings Inc. (Lehman’s) and in respect of the valuation of auction-rate securities that we have offered to purchase from client accounts. Adjusted for the charges, underlying performance in the quarter was good. Notwithstanding the charges, net income for the year was very strong, at $395 million, matching the record levels of a year ago. Revenue for the quarter rose $17 million or 2.9% from a year ago, excluding the foregoing charges. Deposit balances have increased in the brokerage businesses and term investment products. There were also increases in loans and deposits in North American Private Banking. Assets under management and administration and term deposits have been affected by softer market conditions and decreased $27.4 billion or 9.7%, excluding the impact of foreign exchange.
BMO Capital Markets
Net income of $285 million increased $239 million from a year ago. Results for the quarter were lowered by $14 million ($8 million after tax) of charges related to the capital markets environment. Net income a year ago was lowered by $227 million after tax for similar charges and commodities losses. See the Effects of the Capital Markets Environment on Fourth Quarter Results section for more details of the capital markets environment charges. Results for the quarter were raised by the group’s $52 million share of BMO’s recovery of prior-period income taxes. Revenue rose $294 million to $715 million due in part to strong performance from our interest-rate-sensitive businesses and higher trading revenue. The charges noted above lowered revenue by $14 million in the current period and $342 million a year ago. We continued to focus on improving our risk-return profile by lowering the volatility of our earnings and by concentrating on our core, profitable client relationships. In response to market conditions, certain trading strategies were adjusted to reduce our risk exposures. As explained in note 5 to the attached financial statements, during the quarter, the Canadian Institute of Chartered Accountants (CICA) amended accounting and reporting rules on transfers of financial instruments. Since we intend to hold certain securities impacted by current market issues for the foreseeable future rather than trading them in the short term, we elected to transfer the securities from our trading portfolio to our available-for-sale portfolio. This aligns well with our previously-stated strategy of reducing the volatility of our group’s results. The value of the transferred securities on August 1, 2008 was $2.0 billion. The transfer resulted in $183 million of pre-tax mark-to-market valuation charges being recognized in other comprehensive income rather than the income statement. BMO Capital Markets was involved in 49 new issues in the quarter including 21 corporate debt deals, nine government debt deals, seven issues of preferred shares and 12 common equity transactions, raising $23.5 billion.
Performance Targets
We achieved one of our five performance targets in 2008, maintaining a strong Tier 1 Capital Ratio. We indicated at the end of the first quarter that we did not expect to achieve four of our five annual targets given the challenging economic environment. The weak economic environment as well as difficult credit and capital market conditions create added uncertainty in the estimation of future financial performance. Therefore, we will not be disclosing financial targets for 2009. However, BMO has a rigorous business planning process that considers many potential economic scenarios. There is clear and direct accountability for performance against internal benchmarks and progress against strategic priorities including financial measures. This is aligned with our medium-term objectives of, over time, increasing EPS by an average of 10% per year, earning average ROE of between 17% and 20%, achieving average annual cash operating leverage of at least 2%, and maintaining a strong regulatory capital position.
Annual Targets for 2008 � 10% to 15% EPS growth from a base
of $5.241
Performance to October 31, 2008* � EPS of $4.08, down 22% from
$5.24 a year ago
� ROE of 18% to 20% � ROE of 14.1% � Specific provision for credit losses
of $475 million or less
� Specific provision for credit losses of $1,070 million
� Tier 1 Capital Ratio of at least 8.0%
on a Basel II basis
� Tier 1 Capital Ratio of 9.77% on a Basel II basis
� Cash operating leverage of at least 2.0%
� Cash operating leverage of - 5.3%
* Excluding changes in the general allowance
1) The 2007 base excluded the impact of restructuring, changes in the general allowance and
commodities losses. Performance excludes the increase in the general allowance and is
measured relative to the base, as appropriate.

4 • BMO Financial Group Fourth Quarter Report 2008
Management’s Discussion and Analysis MD&A commentary is as of November 25, 2008. Unless otherwise indicated, all amounts are in Canadian dollars and have been derived from financial
statements prepared in accordance with Canadian generally accepted accounting principles (GAAP). The MD&A should be read in conjunction with the unaudited
consolidated financial statements for the period ended October 31, 2008, included in this document, and the annual MD&A for the year ended October 31, 2007,
included in BMO’s 2007 Annual Report. The material that precedes this section comprises part of this MD&A.
Bank of Montreal uses a unified branding approach that links all of the organization’s member companies. Bank of Montreal, together with its subsidiaries, is known as BMO Financial Group. As such, in this document, the names BMO and BMO Financial Group mean Bank of Montreal together with its subsidiaries.
Summary Data
(Unaudited) (Canadian $ in millions, except as noted) Q4-2008
Increase (Decrease)
vs. Q4-2007
Increase (Decrease)
vs. Q3-2008 Fiscal-2008
Increase (Decrease)
vs. Fiscal-2007
Net interest income 1,413 217 18% 127 10% 5,087 244 5%Non interest revenue 1,400 396 39% (60) (4%) 5,118 612 14%
Revenue 2,813 613 28% 67 2% 10,205 856 9%Specific provision for credit losses 315 214 +100% (119) (27%) 1,070 767 +100%Increase in the general allowance 150 100 +100% 100 +100% 260 210 +100%
Total provision for credit losses 465 314 +100% (19) (4%) 1,330 977 +100%Non-interest expense 1,826 195 12% 44 2% 6,902 460 7%Restructuring charge (recovery) (8) (32) (+100%) (8) (100%) (8) (167) (+100%)
Total non-interest expense 1,818 163 10% 36 2% 6,894 293 4%Income taxes (49) 28 36% 10 16% (71) (260) (+100%)Non-controlling interest in subsidiaries 19 - - 1 2% 74 (1) (2%)
Net income 560 108 24% 39 8% 1,978 (153) (7%) Amortization of intangible assets (after tax) 10 1 8% 1 7% 35 (3) (9%)Cash net income (1) 570 109 24% 40 8% 2,013 (156) (7%)Earnings per share – basic ($) 1.06 0.17 19% 0.06 6% 3.79 (0.39) (9%)Earnings per share – diluted ($) 1.06 0.19 22% 0.08 8% 3.76 (0.35) (9%)Cash earnings per share – diluted ($) (1) 1.08 0.19 21% 0.08 8% 3.83 (0.35) (8%)Return on equity (ROE) 14.0% 1.8% 0.5% 13.0% (1.4%)Cash ROE (1) 14.3% 1.8% 0.6% 13.3% (1.4%)Productivity ratio 64.6% (10.6%) (0.3%) 67.6% (3.0%)Cash productivity ratio (1) 64.2% (10.5%) (0.3%) 67.1% (3.0%)Operating leverage 18.0% nm nm 4.8% nmCash operating leverage (1) 18.0% nm nm 4.7% nmNet interest margin on earning assets 1.71% 0.24% 0.12% 1.56% (0.03%)Effective tax rate (9.2%) 10.1% 3.0% (3.6%) (11.5%) Capital Ratios (2) Tier 1 Capital Ratio 9.77% nm (0.13%) 9.77% nm Total Capital Ratio 12.17% nm (0.12%) 12.17% nmNet income: Personal and Commercial Banking 356 36 11% (15) (4%) 1,416 33 2% P&C Canada 344 57 19% 1 - 1,320 53 4% P&C U.S. 12 (21) (63%) (16) (57%) 96 (20) (17%)Private Client Group 78 (25) (25%) (32) (30%) 395 - -BMO Capital Markets 285 239 +100% 26 10% 692 275 66%Corporate Services, including Technology and Operations (159) (142) (+100%) 60 28% (525) (461) (+100%)
BMO Financial Group Net Income 560 108 24% 39 8% 1,978 (153) (7%)
(1) These are non-GAAP amounts or non-GAAP measures. Please see the Non-GAAP Measures section at the end of the MD&A, which outlines the use of non-GAAP measures in this document. (2) Variances to the prior year have not been provided as the basis of computation is no longer comparable. In 2008, capital ratios are computed under Basel II versus on a Basel I basis in prior periods. On a Basel I basis, at the end of the current quarter, the Tier 1 capital ratio was 9.41% and the total capital ratio was 12.06 (Q3 2008: 9.45% and 12.07%; Q4 2007: 9.51% and 11.74%). See the Capital Management
section. nm – not meaningful.

BMO Financial Group Fourth Quarter Report 2008 • 5
Management’s Responsibility for Financial Information BMO’s 2008 Annual Report will contain a statement signed by the President & Chief Executive Officer (CEO) and the Interim Chief Financial Officer (Interim CFO) outlining management’s responsibility for financial information contained in the report. In addition, BMO’s CEO and Interim CFO are expecting to sign certifications relating to the appropriateness of the financial disclosures in our annual filings and the design and effectiveness of our disclosure controls and procedures and internal control over financial reporting. BMO’s internal control over financial reporting includes policies and procedures that: pertain to the maintenance of records that in reasonable detail accurately and fairly reflect the transactions and dispositions of the assets of BMO; provide reasonable assurance that transactions are recorded as necessary to permit preparation of the financial statements in accordance with Canadian generally accepted accounting principles and the requirements of the Securities and Exchange Commission (SEC) in the United States, as applicable, and that receipts and expenditures of BMO are being made only in accordance with authorizations of management and directors of BMO; and provide reasonable assurance regarding prevention or timely detection of unauthorized acquisition, use or disposition of BMO’s assets that could have a material effect on the financial statements. Because of its inherent limitations, internal control over financial reporting can provide only reasonable assurance and may not prevent or detect misstatements. Further, projections of any evaluation of effectiveness to future periods are subject to the risk that controls may become inadequate because of changes in conditions, or that the degree of compliance with the policies or procedures may deteriorate. There were no changes in our internal control over financial reporting in fiscal 2008 that have materially affected, or are reasonably likely to materially affect, our internal control over financial reporting. BMO Financial Group’s management, under the supervision of the CEO and Interim CFO, has evaluated the effectiveness of our internal control over financial reporting using the framework and criteria established in Internal Control – Integrated Framework, issued by the Committee of Sponsoring Organizations of the Treadway Commission. Based on this evaluation, management is expecting to conclude that internal control over financial reporting was effective as of October 31, 2008. BMO will file the applicable Canadian and U.S. CEO and CFO certifications with the Canadian Securities Administrators and the SEC in the United States in December 2008 when we file our Annual Report and other annual disclosure documents. As in prior quarters, BMO’s audit committee reviewed this document, including the attached unaudited interim consolidated financial statements, and BMO’s Board of Directors approved the document prior to its release. A comprehensive discussion of our businesses, strategies and objectives can be found in Management’s Discussion and Analysis in BMO’s 2007 Annual Report, which can be accessed on our web site at www.bmo.com/investorrelations. Readers are also encouraged to visit the site to view other quarterly financial information.
Caution Regarding Forward-Looking Statements Bank of Montreal’s public communications often include written or oral forward-looking statements. Statements of this type are included in this document, and may be included in other filings with Canadian securities regulators or the U.S. Securities and Exchange Commission, or in other communications. All such statements are made pursuant to the ‘safe harbor’ provisions of, and are intended to be forward-looking statements under, the United States Private Securities Litigation Reform Act of 1995 and any applicable Canadian securities legislation. Forward-looking statements may involve, but are not limited to, comments with respect to our objectives and priorities for 2009 and beyond, our strategies or future actions, our targets, expectations for our financial condition or share price, and the results of or outlook for our operations or for the Canadian and U.S. economies. By their nature, forward-looking statements require us to make assumptions and are subject to inherent risks and uncertainties. There is significant risk that predictions, forecasts, conclusions or projections will not prove to be accurate, that our assumptions may not be correct and that actual results may differ materially from such predictions, forecasts, conclusions or projections. We caution readers of this document not to place undue reliance on our forward-looking statements as a number of factors could cause actual future results, conditions, actions or events to differ materially from the targets, expectations, estimates or intentions expressed in the forward-looking statements. The future outcomes that relate to forward-looking statements may be influenced by many factors, including but not limited to: general economic and market conditions in the countries in which we operate; weak capital and/or credit markets; interest rate and currency value fluctuations; changes in monetary policy; the degree of competition in the geographic and business areas in which we operate; changes in laws; judicial or regulatory proceedings; the accuracy and completeness of the information we obtain with respect to our customers and counterparties; our ability to execute our strategic plans and to complete and integrate acquisitions; critical accounting estimates; operational and infrastructure risks; general political conditions; global capital market activities; the possible effects on our business of war or terrorist activities; disease or illness that impacts on local, national or international economies; disruptions to public infrastructure, such as transportation, communications, power or water supply; and technological changes. We caution that the foregoing list is not exhaustive of all possible factors. Other factors could adversely affect our results. For more information, please see the discussion on pages 28 and 29 of BMO’s 2007 Annual Report, which outlines in detail certain key factors that may affect BMO’s future results. When relying on forward-looking statements to make decisions with respect to Bank of Montreal, investors and others should carefully consider these factors, as well as other uncertainties and potential events, and the inherent uncertainty of forward-looking statements. Bank of Montreal does not undertake to update any forward-looking statement, whether written or oral, that may be made, from time to time, by the organization or on its behalf, except as required by law. The forward-looking information contained in this document is presented for the purpose of assisting our shareholders in understanding our financial position as at and for the periods ended on the dates presented and our strategic priorities and objectives, and may not be appropriate for other purposes. Assumptions about the level of asset sales, expected asset sale prices, net funding cost, credit quality and risk of default and losses on default of the underlying assets of the structured investment vehicles were material factors we considered when establishing our expectations regarding the structured investment vehicles discussed in this document including the amount to be drawn under the BMO liquidity facilities and the expectation that the first-loss protection provided by the subordinate capital notes will exceed future losses. Key assumptions included that assets would continue to be sold with a view to reducing the size of the structured-investment vehicles, under various asset price scenarios, that the level of defaults and losses will be consistent with the credit quality of the underlying assets and our current expectations regarding continuing difficult market conditions. Assumptions about the level of defaults and losses on defaults were material factors we considered when establishing our expectation of the future performance of the transactions that Apex Trust has entered into. Key assumptions included that the level of defaults and losses on defaults would be consistent with historical experience. Material factors which were taken into account when establishing our expectations of the future risk of credit losses in Apex Trust included industry diversification in the portfolio, initial credit quality by portfolio and the first-loss protection incorporated into the structure. Assumptions about the performance of the Canadian and U.S. economies in 2009 and how that will affect our businesses were material factors we considered when setting our strategic priorities and objectives, and our outlook for our businesses. Key assumptions included that the Canadian and the U.S. economies will contract in the first half of 2009, and that interest rates and inflation will remain low. We also assumed that housing markets in Canada will weaken in 2009 and strengthen in the second half of the year in the United States. We assumed that capital markets will improve somewhat in the second half of 2009 and that the Canadian dollar will strengthen modestly relative to the U.S. dollar. In determining our expectations for economic growth, both broadly and in the financial services sector, we primarily consider historical economic data provided by the Canadian and U.S. governments and their agencies. Tax laws in the countries in which we operate, primarily Canada and the United States, are material factors we consider when determining our sustainable effective tax rate.
Regulatory Filings Our continuous disclosure materials, including our interim filings, annual MD&A and audited consolidated financial statements, our Annual Information Form and the Notice of Annual Meeting of Shareholders and Proxy Circular are available on our web site at www.bmo.com/investorrelations, on the Canadian Securities Administrators’ web site at www.sedar.com and on the EDGAR section of the SEC’s web site at www.sec.gov. We expect to file our fiscal 2008 year end continuous disclosure materials on or about December 10, 2008.

6 • BMO Financial Group Fourth Quarter Report 2008
Economic Review and Outlook The Canadian economy grew at a modest pace in 2008, as exports continued to decline in response to weak U.S. demand. Growth in consumer spending moderated from last year’s rapid pace, as employment growth and confidence weakened. Business investment also slowed in response to persistent uncertainty about the impact of the global credit crisis on the economy. Housing sales declined from last year’s record levels, reflecting reduced affordability. The softer economy led to some slowing in residential mortgages and business and personal credit in the second half of the year, although growth remained relatively brisk. Rising commodity prices in the first half of the year lifted inflation to the highest level in five years; however, most prices continue to rise modestly and in some cases (such as books and motor vehicles) are falling. The Bank of Canada reduced overnight lending rates 225 basis points in the fiscal year to address the economic slowdown, the recent downturn in commodity prices and credit concerns in the market. The U.S. economy grew modestly in the first half of 2008 and likely contracted in the second half, despite aggressive monetary and fiscal stimulus and strong export gains. The worsening credit conditions and housing slump, coupled with record-high energy costs, significantly affected consumers and businesses. Interbank lending spreads widened to all-time highs in early October amid the collapse or forced takeover of a number of banks and Wall Street brokers, severely curtailing the availability of credit and raising borrowing costs for businesses and consumers. While the downward trend in housing sales appears to have stabilized, the large number of unsold homes continues to weigh on prices. Growth in residential mortgages and personal and business loans slowed in 2008. The Federal Reserve aggressively reduced interest rates and expanded its liquidity provisions to support bank lending and the economy. The Canadian economy is expected to contract moderately in the first half of 2009 as exports decline further, before recovering modestly in the second half of the year in response to low interest rates and recent weakness in the currency. The unemployment rate is expected to remain low but climb about one percentage point in late 2009 to just above 7%. Consumer and business spending will likely remain soft, further moderating credit growth. Housing activity should continue to decline, dampening demand for residential mortgages. The Bank of Canada is expected to reduce interest rates further as inflation falls and the Canadian dollar is expected to strengthen modestly relative to the U.S. dollar in the second half of the year, supported by steadier commodity prices. The U.S. economy is expected to continue contracting in the first half of 2009, before improving slightly as the housing market stabilizes and credit conditions ease. Personal and business credit and residential mortgage demand will likely remain weak, at least in the first half of the year. U.S. unemployment has climbed steadily in the past year and is expected to rise about two percentage points to 8.5 % in 2009, well above Canada’s rate. The Federal Reserve may continue to reduce interest rates to support the economy. Weakness in capital markets is expected to extend into early 2009, with some improvement expected in the second half of the year as the economy recovers and housing prices stabilize.
This Economic Review and Outlook section contains forward-looking statements. Please see the Caution Regarding Forward-Looking Statements. Effects of the Capital Markets Environment on Fourth Quarter Results
Financial markets remain unsettled with continuing concerns in respect of capital markets and the extent and severity of the economic downturn. In the fourth quarter, capital markets continued to be affected by volatility in credit spreads, impacting mark-to-market valuations. Equity valuations in the quarter were especially hard hit with many sectors recording significant declines. BMO’s results in the fourth quarter were affected by capital markets environment charges of $45 million ($27 million after tax and $0.06 per share) reflected in BMO Capital Markets and Private Client Group. The charges in BMO Capital Markets included $14 million ($8 million after tax) comprised of: • charges of $258 million ($173 million after tax) in respect of
exposures related to Apex, a Canadian credit protection vehicle ($170 million pre-tax), and mark-to-market valuations on counterparty credit exposures on derivative contracts largely as a result of corporate counterparties credit spreads widening relative to BMO’s ($88 million pre-tax);
• a charge of $49 million ($33 million after tax) for other-than-temporary impairment on securities in our portfolios including $29 million in respect of securities transferred from the trading to available-for-sale portfolio;
• a benefit of $133 million ($90 million after tax) for mark-to-market valuations on credit default swaps related to BMO Capital Markets’ loan portfolio;
• a benefit of $89 million ($60 million after tax) related to our liabilities recorded at fair value as a result of our credit spreads widening; and
• a number of other valuation adjustments and trading activities resulting in a net benefit of $71 million ($48 million after tax), including an $81 million pre-tax gain primarily related to portfolios where certain securities were transferred to the available-for-sale portfolio.
The charges in Private Client Group included Cdn$31 million (Cdn$19 million after tax) in respect of management actions taken to support our U.S. clients in the weak capital markets environment including: • a net charge of Cdn$19 million related to securities of
Lehman’s; and • a charge of Cdn$12 million in respect of the valuation of
auction rate securities that we expect to be tendered to our offer to purchase them from client accounts.
The above capital markets environment charges of $45 million were all reflected in non-interest revenue. There was $181 million of losses in securities gains (losses), other than trading, a reduction of $30 million in other revenue and a $166 million increase in trading non-interest revenue. As explained in the preceding BMO Capital markets section, during the quarter, the CICA amended accounting and reporting rules applicable to financial instruments. As a result of the amendments, we elected to transfer certain securities from our trading portfolio to our available-for-sale portfolio. We subsequently recorded mark-to-market charges on these securities totalling $212 million ($143 million after tax), of which

BMO Financial Group Fourth Quarter Report 2008 • 7
$29 million ($20 million after tax) was charged to earnings, as part of the other-than-temporary impairments outlined above, and $183 million ($123 million after tax) was charged to other comprehensive income rather than trading revenue in the statement of income. The effects of notable items affecting comparative period results are discussed at the end of this MD&A. Given the uncertainty in the capital markets environment, our investments in asset-backed commercial paper (ABCP), structured investment vehicles (SIVs), structured finance vehicles and mark-to-market investments could experience further gains and losses. This Effects of the Capital Markets Environment on Fourth Quarter Results section contains forward-looking statements. Please see the Caution Regarding Forward-Looking Statements. Foreign Exchange
The Canadian dollar equivalents of BMO’s U.S. dollar-denominated net income, revenues, expenses, provisions for credit losses and income taxes were raised relative to the fourth quarter of 2007 and the third quarter of 2008 by the strengthening of the U.S. dollar. They were lowered in fiscal 2008 relative to fiscal 2007 by a weaker U.S. dollar, on average, over the course of the year. The average Canadian/U.S. dollar exchange rate in the fourth quarter, expressed in terms of the Canadian dollar cost of a U.S. dollar, rose by 11% from a year ago and 10% from the prior quarter. The following table indicates the relevant average Canadian/U.S. dollar exchange rates and the impact of changes in the rates. Effects of U.S. Dollar Exchange Rate Fluctuations on BMO’s Results Q4-2008
(Canadian $ in millions, except as noted) vs. Q4-2007 vs. Q3-2008
Fiscal-2008 vs
Fiscal-2007
Canadian/U.S. dollar exchange rate (average)
Current period 1.1107 1.1107 1.0321 Prior period 0.9986 1.0122 1.0926Increased (Decreased) revenue 55 48 (63)Decreased (Increased) expense (45) (40) 93Decreased (Increased) provision for credit losses (30) (26) 28Decreased (Increased) income taxes 6 5 (6)
Increased (Decreased) net income (14) (13) 52
At the start of each quarter, BMO enters into hedging transactions that are expected to partially offset the pre-tax effects of exchange rate fluctuations in the quarter on our expected U.S. dollar net income for that quarter. As such, these activities partially mitigate the impact of exchange rate fluctuations within a single quarter; however, the hedging transactions are not designed to offset the impact of year-over-year or quarter-over-quarter fluctuations in exchange rates. The U.S. dollar strengthened moderately in the first and second quarters, more modestly in the third quarter and dramatically in the fourth quarter as the exchange rate increased from Cdn$1.0240 per U.S. dollar at July 31, 2008 to an average over the fourth quarter of Cdn$1.1107. Hedging transactions resulted in an after-tax loss of $4 million in the quarter and an after-tax loss of $11 million for fiscal 2008. The gain or loss from hedging transactions in future periods will be determined by both future currency fluctuations and the amount of underlying future hedging transactions, since the transactions are entered into each quarter in relation to expected U.S.-dollar-denominated net income for the next three months.
The effect of currency fluctuations on our investments in foreign operations is discussed in the Income Taxes section. Net Income Q4 2008 vs Q4 2007
Net income was $560 million for the fourth quarter of 2008, up $108 million or 24% from a year ago. Earnings per share were $1.06, compared with $0.87. Results for the quarter include $27 million after tax ($0.06 per share) in respect of the capital markets environment charges as set out in the preceding Effects of the Capital Markets Environment on Fourth Quarter Results section. Results a year ago included $227 million after tax ($0.45 per share) in aggregate for capital markets environment charges and a small charge for commodities losses in BMO Capital Markets as set out in the Notable Items section that follows at the end of the MD&A. Provisions for credit losses increased $314 million from a year ago to $465 million. Specific provisions of $315 million increased $214 million from a year ago due to higher levels of impaired loans and the overall deterioration in credit conditions. There was a $150 million increase in the general allowance, compared with a $50 million increase in the fourth quarter of 2007. P&C Canada net income increased $57 million or 19% from a year ago. While we continue to experience strong volume growth across most products, in particular cards and consumer lending, the current market conditions and interest rate environment have put pressures on our revenue growth. There were also increases in trading non-interest revenue from securitization activities as well as higher Moneris revenue and net interest margin, partially offset by net investment securities losses. Margin improved due to the interest on tax refunds. The impact of improved product mix and yields was offset by higher funding costs and lower mortgage-refinancing fees. As anticipated, expenses rose due to higher employee costs and higher capital taxes. P&C U.S. net income decreased US$22 million or 66% from strong results a year ago. As expected, results were affected by higher levels of integration costs, as we completed the integration of our Wisconsin acquisitions. In addition, net income was lowered by an additional charge for the Visa litigation reserve and was affected by reduced revenues and increased costs in the difficult credit environment. Private Client Group net income decreased $25 million or 25%. Results reflect charges of $31 million ($19 million after tax) in respect of actions taken to support U.S. clients in the weak capital markets environment. Excluding the charges, net income was $97 million, down $6 million or 6.9% from a year ago. Operating performance was good, especially in the context of the more difficult environment. BMO Capital Markets net income increased $239 million to $285 million. The capital markets environment remains challenging, but our interest-rate-sensitive businesses continue to perform well and there have been improvements from the prior year in several of our trading businesses. Merger and acquisition fees and underwriting fees were down from the strong levels of a year ago. Results were affected by charges related to the capital markets environment of $8 million after tax in the current quarter and $211 million after tax a year ago. As explained in note 5 to the attached financial statements, during the quarter, the CICA amended accounting and reporting rules on transfers of financial instruments. Since we intend to hold certain securities impacted

8 • BMO Financial Group Fourth Quarter Report 2008
by current market issues for the foreseeable future rather than trading them in the short term, we elected to transfer the securities from our trading portfolio to our available-for-sale portfolio. Because the securities were held in the available-for-sale portfolio, mark-to-market valuation charges of $183 million ($123 million after tax) were recorded in other comprehensive income rather than trading revenue in the statement of income. Results for the quarter were raised by the group’s $52 million share of BMO’s recovery of prior-period income taxes. Corporate Services results were $142 million lower than in the prior year primarily due to higher specific and general provisions for credit losses, partially offset by increased mark-to-market gains on hedging activities. BMO charges the operating groups with expected credit losses and charges/credits the balance of actual provisions for credit losses to Corporate Services. Results include the remaining $21 million share of BMO’s recovery of prior-period income taxes. Q4 2008 vs Q3 2008
Net income increased $39 million or 7.5%. The increase was largely attributable to improved trading revenues and better results in Corporate Services. Results in the third quarter were affected by capital markets environment charges of $134 million ($96 million after tax) and a $50 million ($33 million after tax) increase in the general allowance. See the Notable Items section for more details. In P&C Canada, net income increased $1 million or 0.2%. Revenue growth was driven by volume growth across most products and higher revenues included in trading non-interest revenue from securitization activities, partially offset by net investment securities losses. Net interest margin remained flat as interest on tax refunds was offset by higher funding costs. Non-interest expense rose due to increased strategic initiative spending and advertising. P&C U.S. net income fell US$17 million to US$11 million and by US$9 million excluding acquisition-integration costs in both periods. The decline was largely attributable to the impact of credit markets on revenues and expenses as well as the additional Visa litigation reserve. Private Client Group net income decreased $32 million or 30% and $13 million or 13% excluding the charges previously outlined. Revenue decreased $50 million or 9.1% and $19 million or 3.5% excluding the impact of the charges, primarily driven by lower commission revenue in Full-Service Investing and lower fee-based revenue across our businesses. Revenues increased in term investment products. BMO Capital Markets net income increased $26 million or 10%. Conditions in the fourth quarter remained challenging but there was strength in our trading and interest-rate-sensitive businesses and higher merger and acquisition activity. There were increased net securities losses and lower debt and equity underwriting fees. Results in both periods were affected by charges related to the capital markets environment and recoveries of prior periods’ income taxes. Corporate Services results improved by $60 million due primarily to improved revenues from mark-to-market gains on hedging activities and a higher gain from a credit card securitization in the current quarter, as well as reduced provisions for credit losses.
Fiscal 2008 vs Fiscal 2007
Net income decreased $153 million or 7.2% to $1,978 million. Net income for the current year was lowered by the $585 million after tax impact of notable items consisting of $625 million ($419 million after-tax) of charges related to the capital markets environment and a $260 million ($166 million after-tax) increase in the general allowance for credit losses. Net income for fiscal 2007 was reduced by the $787 million after-tax impact of notable items. They included $440 million after tax in respect of commodities losses of $853 million net of $120 million of reduced performance-based compensation. They also included $318 million ($211 million after tax) of charges related to the capital markets environment, a $159 million ($103 million after-tax) restructuring charge and a $50 million ($33 million after tax) increase in the general allowance for credit losses. Specific provisions for credit losses were up $767 million from a year ago due to the credit environment and weakness in U.S. housing markets. P&C Canada net income of $1,320 million increased $53 million or 4.1%, but increased $105 million or 8.6% adjusted for the $52 million net impact in 2007 of an insurance gain, investment gains, an adjustment to the loyalty rewards program liability and a recovery of prior-period income taxes. Revenue included solid volume growth in most product areas, while net interest margin increased by 1 basis point as better volumes in more profitable products were offset by increased funding costs. Expenses were higher due to increased initiatives spending, including expansion and renovation of the branch network, credit and debit card chip technology; as well as higher operating costs and higher Moneris costs. P&C U.S. net income of US$95 million fell US$12 million or 11%, largely due to the more difficult credit environment. Results also included the US$9 million after-tax impact of the gain on the Visa IPO (net of litigation costs) and increased acquisition-integration costs of US$9 million (US$6 million after tax). Private Client Group net income of $395 million was unchanged from the record results of a year ago, but increased $19 million or 4.7% excluding the impact of the charges taken in the fourth quarter. Market conditions were softer and the year-over-year revenue increase was lowered by the impact of the weaker U.S. dollar and a $7 million investment gain in 2007. There was growth in revenues from mutual fund fees, North American Private Banking and term investment products. BMO Capital Markets net income of $692 million increased $275 million. Capital markets conditions were more challenging for many of our businesses in 2008 than in 2007 but interest-rate-sensitive businesses continued to perform well. Results in 2008 were affected by charges of $594 million ($400 million after tax) related to deterioration in capital markets but benefited from a recovery of prior years’ income taxes. Results in 2007 were affected by charges of $1,171 million ($651 million after tax) comprised of the net impact of $318 million ($211 million after tax) of charges related to the capital markets environment and $853 million of losses in our commodities business ($440 million after tax and associated performance-based compensation). Corporate Services net loss was $525 million, primarily due to higher provisions for credit losses including increases in the general allowance for credit losses. Results in 2007 included a $159 million ($103 million after tax) restructuring charge.

BMO Financial Group Fourth Quarter Report 2008 • 9
Revenue BMO analyzes consolidated revenues on a GAAP basis. However, like many banks, BMO analyzes revenue of its operating groups and associated ratios computed using revenue on a taxable equivalent basis (teb). This basis includes an adjustment that increases GAAP revenues and the GAAP provision for income taxes by an amount that would raise revenues on certain tax-exempt securities to a level equivalent to amounts that would incur tax at the statutory rate. The offset to the group teb adjustments is reflected in Corporate Services revenues. Total revenue of $2,813 million for the fourth quarter of 2008 increased $613 million or 28% from a year ago. There was strong revenue growth in P&C Canada and BMO Capital Markets. Revenue growth benefited from reduced charges related to the capital markets environment in the current quarter. A stronger U.S. dollar raised revenue growth by $55 million or 2.5 percentage points. Revenue increased $67 million or 2.4% from the third quarter. There were lower charges related to the capital markets environment in the current quarter. A stronger U.S. dollar raised revenue growth by $48 million or 1.8 percentage points. Revenue of $10,205 million for fiscal 2008 increased $856 million or 9.2% from the prior year. Growth benefited from reduced charges in respect of the capital markets environment and commodities losses and there was solid growth in P&C Canada and P&C U.S. A weaker U.S. dollar lowered revenue growth by $63 million or 0.7 percentage points. Changes in net interest income and non-interest revenue are reviewed in the sections that follow.
Net Interest Income
Net interest income of $1,413 million increased $217 million or 18% from a year ago. There was growth in each of the operating groups and a reduction in Corporate Services. Average earning assets increased $7 billion to $329 billion with growth in P&C Canada, P&C U.S. and Private Client Group. P&C Canada earning assets increased by $6 billion with growth in all lines of business. There was comparable growth in P&C U.S. as average earning assets increased $8 billion due to a portfolio transfer in the first quarter, acquisitions and organic loan growth. BMO Capital Markets average earning assets decreased $4 billion due to a reduction in trading assets, partially offset by increased corporate loans. Corporate Services average earning assets decreased due to securitization activity. The stronger U.S. dollar was a significant contributor to increased average assets, but has no impact on net interest margin. Relative to the third quarter, net interest income increased $127 million or 10%. There was growth in each of the operating groups including Corporate Services. BMO’s average earning assets increased $7 billion with growth in all groups except Corporate Services, which decreased due to securitization activity. The stronger U.S. dollar contributed significantly to increased average assets. During the quarter, we securitized $4.2 billion of mortgage loans and $1.6 billion of credit card loans. In fiscal 2008, net interest income of $5,087 million increased $244 million or 5.0%. There was growth in each of the operating
groups and a reduction in Corporate Services. Average earning assets increased $22 billion. P&C Canada earning assets increased $6 billion. BMO Capital Markets average earning assets increased $14 billion due to growth in corporate loans and money market assets. The stronger U.S. dollar contributed significantly to increased average assets. Corporate Services net interest income declined due to higher net funding costs. BMO’s overall net interest margin on earning assets for the fourth quarter of 2008 was 1.71%, or 24 basis points higher than in the fourth quarter of the prior year and 12 basis points higher than in the third quarter. The two main drivers of a change in total bank margin are the individual group margins and the changes in the magnitude of each operating group’s assets. The year-over-year increase of 24 basis points was mainly due to increased spread in our interest-rate-sensitive businesses in BMO Capital Markets, improved product mix in P&C Canada and improved margin in Private Client Group. As in the first through third quarters, P&C U.S. net interest margin was significantly lower, in large part due to a portfolio transfer, but its effect on the total change in BMO’s overall margin was minimal. Relative to a year ago, net interest margin in P&C Canada of 2.68% increased 8 basis points due to the interest on tax refunds. The impact of improved product mix and improved product yields were offset by higher funding costs and lower mortgage refinancing fees. P&C Canada net interest margin remained flat relative to the third quarter, as the interest on tax refunds was offset by higher funding costs. In P&C U.S., net interest margin of 3.00% declined by 34 basis points from a year ago, of which 22 basis points related to a portfolio transfer in the first quarter, and declined by 11 basis points from the third quarter. Net interest margin was affected by higher levels of non-performing loans, the effects of product mix and continued competitive pressures, largely in deposits. BMO Capital Markets margin of 0.81% improved appreciably from a year ago due to higher trading spreads and higher spreads in our interest-rate-sensitive businesses. Its margin also improved from the third quarter due to higher spreads on trading assets and cash management deposits. In fiscal 2008, BMO’s overall net interest margin of 1.56% fell 3 basis points. The decline was primarily due to growth in BMO Capital Markets asset levels and reduced net interest income in Corporate Services. There was lower margin in P&C U.S. and Private Client Group but the effect on BMO’s overall margin was small due to the relative size of their assets.
10 • BMO Financial Group Fourth Quarter Report 2008
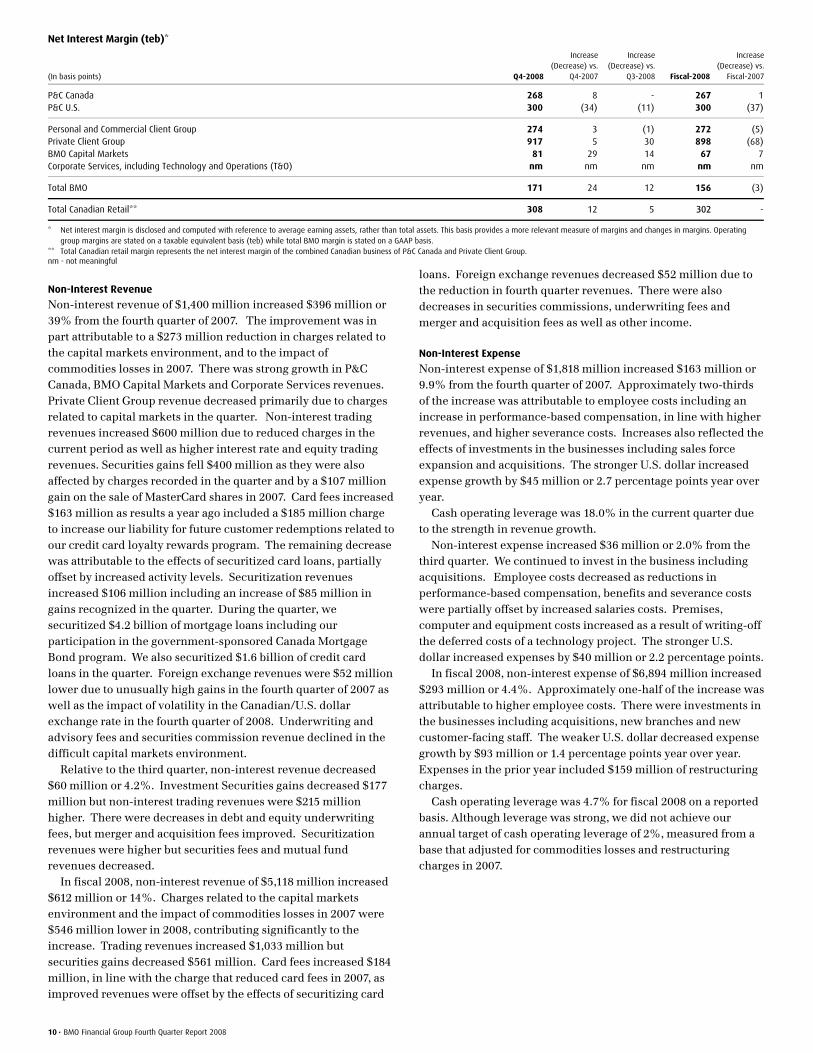
Net Interest Margin (teb)*
(In basis points) Q4-2008
Increase (Decrease) vs.
Q4-2007
Increase(Decrease) vs.
Q3-2008 Fiscal-2008
Increase (Decrease) vs.
Fiscal-2007
P&C Canada 268 8 - 267 1P&C U.S. 300 (34) (11) 300 (37)
Personal and Commercial Client Group 274 3 (1) 272 (5)Private Client Group 917 5 30 898 (68)BMO Capital Markets 81 29 14 67 7Corporate Services, including Technology and Operations (T&O) nm nm nm nm nm
Total BMO 171 24 12 156 (3)
Total Canadian Retail** 308 12 5 302 -
* Net interest margin is disclosed and computed with reference to average earning assets, rather than total assets. This basis provides a more relevant measure of margins and changes in margins. Operating group margins are stated on a taxable equivalent basis (teb) while total BMO margin is stated on a GAAP basis.
** Total Canadian retail margin represents the net interest margin of the combined Canadian business of P&C Canada and Private Client Group. nm - not meaningful
Non-Interest Revenue
Non-interest revenue of $1,400 million increased $396 million or 39% from the fourth quarter of 2007. The improvement was in part attributable to a $273 million reduction in charges related to the capital markets environment, and to the impact of commodities losses in 2007. There was strong growth in P&C Canada, BMO Capital Markets and Corporate Services revenues. Private Client Group revenue decreased primarily due to charges related to capital markets in the quarter. Non-interest trading revenues increased $600 million due to reduced charges in the current period as well as higher interest rate and equity trading revenues. Securities gains fell $400 million as they were also affected by charges recorded in the quarter and by a $107 million gain on the sale of MasterCard shares in 2007. Card fees increased $163 million as results a year ago included a $185 million charge to increase our liability for future customer redemptions related to our credit card loyalty rewards program. The remaining decrease was attributable to the effects of securitized card loans, partially offset by increased activity levels. Securitization revenues increased $106 million including an increase of $85 million in gains recognized in the quarter. During the quarter, we securitized $4.2 billion of mortgage loans including our participation in the government-sponsored Canada Mortgage Bond program. We also securitized $1.6 billion of credit card loans in the quarter. Foreign exchange revenues were $52 million lower due to unusually high gains in the fourth quarter of 2007 as well as the impact of volatility in the Canadian/U.S. dollar exchange rate in the fourth quarter of 2008. Underwriting and advisory fees and securities commission revenue declined in the difficult capital markets environment. Relative to the third quarter, non-interest revenue decreased $60 million or 4.2%. Investment Securities gains decreased $177 million but non-interest trading revenues were $215 million higher. There were decreases in debt and equity underwriting fees, but merger and acquisition fees improved. Securitization revenues were higher but securities fees and mutual fund revenues decreased. In fiscal 2008, non-interest revenue of $5,118 million increased $612 million or 14%. Charges related to the capital markets environment and the impact of commodities losses in 2007 were $546 million lower in 2008, contributing significantly to the increase. Trading revenues increased $1,033 million but securities gains decreased $561 million. Card fees increased $184 million, in line with the charge that reduced card fees in 2007, as improved revenues were offset by the effects of securitizing card
loans. Foreign exchange revenues decreased $52 million due to the reduction in fourth quarter revenues. There were also decreases in securities commissions, underwriting fees and merger and acquisition fees as well as other income. Non-Interest Expense
Non-interest expense of $1,818 million increased $163 million or 9.9% from the fourth quarter of 2007. Approximately two-thirds of the increase was attributable to employee costs including an increase in performance-based compensation, in line with higher revenues, and higher severance costs. Increases also reflected the effects of investments in the businesses including sales force expansion and acquisitions. The stronger U.S. dollar increased expense growth by $45 million or 2.7 percentage points year over year. Cash operating leverage was 18.0% in the current quarter due to the strength in revenue growth. Non-interest expense increased $36 million or 2.0% from the third quarter. We continued to invest in the business including acquisitions. Employee costs decreased as reductions in performance-based compensation, benefits and severance costs were partially offset by increased salaries costs. Premises, computer and equipment costs increased as a result of writing-off the deferred costs of a technology project. The stronger U.S. dollar increased expenses by $40 million or 2.2 percentage points. In fiscal 2008, non-interest expense of $6,894 million increased $293 million or 4.4%. Approximately one-half of the increase was attributable to higher employee costs. There were investments in the businesses including acquisitions, new branches and new customer-facing staff. The weaker U.S. dollar decreased expense growth by $93 million or 1.4 percentage points year over year. Expenses in the prior year included $159 million of restructuring charges. Cash operating leverage was 4.7% for fiscal 2008 on a reported basis. Although leverage was strong, we did not achieve our annual target of cash operating leverage of 2%, measured from a base that adjusted for commodities losses and restructuring charges in 2007.

BMO Financial Group Fourth Quarter Report 2008 • 11
Risk Management
Market conditions remained extremely volatile over the past several months, due to ongoing concerns related to the U.S. real estate market and global recessionary pressures. The difficult conditions have led to a continued weakness in the credit environment and a tightening of the credit markets. Provisions for credit losses totalled $465 million, comprised of $315 million of specific provisions and a $150 million increase in the general allowance. Provisions were $196 million in Canada and $269 million in the United States. Fourth quarter provisions were up $314 million from a year ago (specific provisions up $214 million and the general allowance up $100 million) but down $19 million from the prior quarter (specific provisions down $119 million and the increase in the general allowance up $100 million). The fourth quarter increase in the general allowance reflects the significantly weaker economic outlook that now exists. The provision for credit losses in fiscal 2008 totalled $1,330 million, comprised of $1,070 million of specific provisions and a $260 million increase in the general allowance. In the comparable period of fiscal 2007, provisions totalled $353 million with $303 million of specific provisions and a $50 million increase in the general allowance. Specific provisions in fiscal 2008 represented 48 basis points of average net loans and acceptances, including securities borrowed or purchased under resale agreements, compared with 15 basis points a year ago and an 18 basis point average over the past five years. New impaired loan formations totalled $806 million in the quarter, up from $438 million in the previous quarter and $238 million a year ago. The U.S. commercial real estate, manufacturing and financial institution sectors accounted for the majority of fourth-quarter formations. There were no impaired loan sales in the fourth quarter, compared with $5 million in the prior quarter and $11 million a year ago. Gross impaired loans were $2,387 million at the end of the fourth quarter, up from $1,798 million at the end of the prior quarter due to the formations discussed above. The total allowance for credit losses increased by $253 million in the quarter to $1,747 million, and was comprised of a specific allowance of $426 million and a general allowance of $1,321 million. The general allowance is maintained to absorb impairment in the existing credit portfolio that cannot yet be associated with specific credit assets. It is assessed on a quarterly basis and increased $423 million from the end of the previous fiscal year. Of this, $260 million was due to increases in the general allowance during fiscal 2008, with the remainder attributable to the acquisition of the Wisconsin-area banks and the impact of the change in the Canadian/U.S. dollar exchange rate. BMO’s loan book continues to be comprised largely of more stable consumer and commercial portfolios, which, excluding securities borrowed or purchased under resale agreements, represented 73.8% of the loan portfolio at the end of the quarter,
down from 77.8% in the previous quarter and 78.6% a year ago. The declines were due to strong growth in corporate loans. Approximately 88% of the consumer portfolio, including credit cards and residential mortgages, is comprised of secured loans. Excluding credit card loans and residential mortgages, approximately 79% of the consumer loans are secured. We expect the credit environment to continue to be challenging through the first half of 2009 as the global economy continues to experience a significant slowdown. BMO’s market risk and liquidity and funding management practices and key measures are outlined on pages 68 to 71 of BMO’s 2007 Annual Report. Trading and Underwriting Market Value Exposure (MVE) and Earnings Volatility (EV) increased quarter over quarter and year over year, primarily as a result of higher observed market volatilities for credit spreads and interest rates. To align with the regulatory definition of risk classifications, effective earlier this fiscal year, the general credit spread risk and interest rate risk have been combined and are now reported in the 'Interest Rate Risk (Mark-to-Market)' line in the Total Trading and Underwriting MVE Summary. This change does not impact the Total MVE result but only the way in which the results are reported. MVE data for October 31, 2007 has been restated to reflect this change. There were no significant changes to our market risk management practices in the fourth quarter. There were no significant changes to the level of structural market risk or to structural market risk management practices during the quarter. Global wholesale funding markets have been affected by reduced confidence since mid-September when increased concerns developed regarding the credit quality of financial institutions and the economic outlook. Available money market funding maturity terms have shortened and access to longer-term capital market funding has been reduced for all banks. Wholesale funding market spreads are elevated given the heightened credit concerns. Governments and central banks are taking steps to restore market confidence and stability. The Government of Canada has offered a number of programs to provide market liquidity and the Canadian financial industry, including BMO, has participated in these programs. We remain satisfied that our liquidity and funding management framework provides us with a sound position despite market developments. This Risk Management section and the following Income Taxes section contain forward-looking statements. Please see the Caution Regarding Forward-Looking Statements.

12 • BMO Financial Group Fourth Quarter Report 2008
Provisions for Credit Losses (PCL) (Canadian $ in millions, except as noted) Q4-2008 Q3-2008 Q4-2007 Fiscal-2008 Fiscal-2007
New specific provisions 361 475 152 1,242 460Reversals of previously established allowances (23) (7) (27) (58) (66)Recoveries of loans previously written-off (23) (34) (24) (114) (91)
Specific provision for credit losses 315 434 101 1,070 303Increase in the general allowance 150 50 50 260 50
Provision for credit losses 465 484 151 1,330 353
Specific PCL as a % of average net loans and acceptances (annualized) 0.55% 0.80% 0.19% 0.48% 0.15%PCL as a % of average net loans and acceptances (annualized) 0.81% 0.89% 0.29% 0.60% 0.17%
Changes in Gross Impaired Loans and Acceptances (GIL) (Canadian $ in millions, except as noted)
GIL, Beginning of Period 1,798 1,820 618 720 666Additions to impaired loans & acceptances 806 438 238 2,506 588Reductions in impaired loans & acceptances (1) 170 (91) (19) 131 (143)Write-offs (387) (369) (117) (970) (391)
GIL, End of Period 2,387 1,798 720 2,387 720
GIL as a % of gross loans & acceptances 1.10% 0.86% 0.36% 1.10% 0.36%GIL as a % of equity and allowances for credit losses 11.34% 9.09% 4.07% 11.34% 4.07%
(1) Includes impaired amounts returned to performing status, loan sales, repayments, the impact of foreign exchange fluctuations and offsets for consumer write-offs which have not been recognized as formations (Q4-08 $137MM; Q3-08 $106MM; and Q4-07 $73MM).
Aggregate Market Value Exposure and Earnings Volatility for Trading and Underwriting and Structural Positions ($ millions)* (After-tax Canadian equivalent) Market value exposure (MVE) 12-month earnings volatility
Oct. 31 2008 July 31 2008 Oct. 31 2007 Oct. 31 2008 July 31 2008 Oct. 31 2007
Trading and Underwriting (33.4) (24.0) (18.2) (28.7) (21.5) (12.6)Structural (267.9) (256.8) (231.6) (30.2) (21.7) (24.2)
BMO Financial Group (301.3) (280.8) (249.8) (58.9) (43.2) (36.8)
* Measured at a 99% confidence interval. Losses are in brackets.
Total Trading and Underwriting MVE Summary ($ millions)* For the quarter ended October 31, 2008 As at July 31, 2008 As at October 31, 2007
(Pre-tax Canadian equivalent) Quarter-end Average High Low Quarter-end Quarter-end
Commodities Risk (0.9) (1.5) (4.4) (0.9) (1.2) (2.7)Equity Risk (7.3) (9.3) (19.6) (5.6) (9.3) (9.5)Foreign Exchange Risk (1.4) (1.8) (2.6) (0.8) (1.9) (0.9)Interest Rate Risk (Mark-to-Market) (30.6) (25.4) (35.0) (18.4) (22.7) (10.0)Diversification (note1) 6.4 8.4 nm nm 8.3 9.1
Comprehensive Risk (33.8) (29.6) (41.6) (21.4) (26.8) (14.0)Interest Rate Risk (accrual) (11.6) (8.6) (12.5) (6.0) (6.3) (9.1)Issuer Risk (6.1) (5.1) (7.4) (3.6) (3.9) (4.9)
Total MVE (51.5) (43.3) (59.5) (34.3) (37.0) (28.0)
nm - not meaningful
* One-day measure using a 99% confidence interval. Losses are in brackets and benefits are presented as positive numbers. (1) Computation of a diversification effect for the high and low is not considered meaningful.
Structural Balance Sheet Earnings and Value Sensitivity to Changes in Interest Rates ($ millions)*
(After-tax Canadian equivalent) Economic value sensitivity
Earnings sensitivity over the next
12 months
Oct. 31 2008 July 31 2008 Oct. 31 2007 Oct. 31 2008 July 31 2008 Oct. 31 2007
100 basis point increase (220.8) (212.7) (201.1) (4.4) 2.5 6.6100 basis point decrease 169.2 152.8 138.6 (21.0) (4.2) (15.4) 200 basis point increase (488.6) (476.9) (438.1) (16.2) (8.3) 0.4200 basis point decrease 328.4 280.0 234.0 (177.6) (111.4) (17.0)
* Losses are in brackets and benefits are presented as positive numbers.

BMO Financial Group Fourth Quarter Report 2008 • 13
Income Taxes As explained in the Revenue section, in fiscal 2008, management assesses BMO’s consolidated results and associated provisions for income taxes on a GAAP basis. We continue to assess the performance of the operating groups and associated income taxes on a taxable equivalent basis and to report accordingly. The recovery of income taxes decreased $28 million from the fourth quarter a year ago and $10 million from the third quarter, to a recovery of $49 million. The effective tax rate for the quarter was a recovery rate of 9.2%, compared with a tax recovery rate of 19.3% in the fourth quarter a year ago and 12.2% in the third quarter of 2008. The effective tax rate for the year was a recovery rate of 3.6%, compared with a tax expense rate of 7.9% a year ago. The low effective rate for the quarter was mainly attributable to $73 million of recoveries of prior-period income taxes and a higher proportion of income from lower-tax-rate jurisdictions as compared to prior quarters. Excluding the impact of the increase in the general allowance, tax recoveries and a higher proportion of income from lower-tax-rate jurisdictions, the effective tax rate in the current quarter would be in our expected sustainable range. While rates will vary from quarter to quarter due to one-time adjustments and significant items, our current estimate is that the sustainable effective tax rate for 2009 will be in the range of 16% to 20% due to statutory rate reduction.
BMO hedges the foreign exchange risk arising from its investments in U.S. operations by funding the investments in U.S. dollars. Under this program, the gain or loss from hedging and the unrealized gain or loss from translation of the investments in U.S. operations are charged or credited to shareholders’ equity. For income tax purposes, the gain or loss on the hedging activities attracts an income tax charge or credit in the current period, which is charged or credited to shareholders’ equity, while the associated unrealized gain or loss on the investments in U.S. operations does not attract income taxes until the investments are liquidated. The income tax charge/benefit arising from a hedging gain/loss is a function of the fluctuation in U.S. rates from period to period. Hedging of the investments in U.S. operations has given rise to income tax recoveries in shareholders’ equity of $628 million for the quarter and $881 million for the year. Refer to the Consolidated Statement of Changes in Shareholders’ Equity included in the attached unaudited consolidated financial statements for further details.

14 • BMO Financial Group Fourth Quarter Report 2008
Capital Management Effective November 1, 2007, BMO began calculating its regulatory capital requirements under a new capital management framework. The new framework, Basel II, replaced Basel I, the framework utilized for the past 20 years. BMO uses the Advanced Internal Ratings Based (AIRB) approach to measure credit risk in our portfolio and the Standardized Approach to measure operational risk. The Office of the Superintendent of Financial Institutions (OSFI), our regulator, has granted a waiver to apply the Standardized Approach to determine the credit risk-weighted assets of our subsidiary, Harris Bankcorp, Inc. The methodology for determining risk-weighted assets for market risk did not change materially between Basel I and Basel II. At October 31, 2008, BMO’s Tier 1 Capital Ratio was 9.77%, with risk-weighted assets (RWA) of $191.6 billion and Tier 1 capital of $18.7 billion. The ratio decreased 13 basis points from 9.90% in the third quarter due to growth in RWA partially offset by growth in capital. RWA increased primarily due to the impact of the stronger U.S. dollar on U.S. dollar-denominated RWA. Capital grew due to growth in common shareholders’ equity. The ratio remains strong and is well above our minimum target of 8.0%. BMO’s Total Capital Ratio was 12.17% at October 31, 2008. The ratio decreased 12 basis points from 12.29% in the third quarter due to higher RWA, partially offset by growth in capital as noted above. Basel II and Basel I are not comparable. Relative to 2007 and for comparison purposes only, the Basel I Tier 1 Capital Ratio was 9.41% and the Total Capital Ratio was 12.06% at October 31, 2008, compared with 9.51% and 11.74%, respectively, at the end of 2007. On September 19, 2008, we announced our intention to redeem $250 million of Preferred Shares, Series 6 on November 25, 2008. During the quarter, 1,599,525 shares were issued due to the exercise of stock options, share exchanges and the dividend reinvestment plan. We did not repurchase any Bank of Montreal common shares under our common share repurchase program during the quarter or for the fiscal year. On September 4, 2008, we announced that the Toronto Stock Exchange had accepted BMO’s notice of intention to make a new normal course issuer bid under which we may purchase up to 15 million common shares, being approximately 3% of the public float, between September 8, 2008 and September 7, 2009. Our share repurchase program is primarily used to offset, over time, the impact of dilution caused by issuing shares through the exercise of stock options, our dividend reinvestment plan and convertible shares. On November 25, 2008, we announced that BMO’s Board of Directors declared a quarterly dividend payable to common shareholders of $0.70 per share, unchanged from a year ago and from the preceding quarter. Until we have a better understanding of the likely length and extent of the current economic slowdown, we do not anticipate increasing common share dividends. We believe the current dividend rate is appropriate, based on BMO’s earning power, and we continue to focus on improving our core business performance to return the dividend payout ratio to our target range.
Qualifying Regulatory Capital Basel II Regulatory Capital and Risk-Weighted Assets
(Canadian $ in millions) Q4 2008 Q3 2008
Common shareholders’ equity 15,974 15,120Non-cumulative preferred shares 1,996 1,996Innovative Tier 1 Capital Instruments 2,486 2,442Non-controlling interest in subsidiaries 39 37Goodwill and excess intangible assets (1,635) (1,449)Accumulated net after-tax unrealized losses from available-for-
sale equity securities (15) -Net Tier 1 Capital 18,845 18,146Securitization-related deductions (115) (96)Expected loss in excess of allowance – AIRB approach - -Other deductions (1) (3)Adjusted Tier 1 Capital 18,729 18,047Subordinated debt 4,175 4,065Trust subordinated notes 800 800Accumulated net after-tax unrealized gain from available-for-
sale equity securities - 7Eligible general allowance for credit losses 494 293Total Tier 2 Capital 5,469 5,165Securitization-related deductions (6) (10)Expected loss in excess of allowance – AIRB approach - -Investment in non-consolidated subsidiaries/substantial
investments (871) (799)Other deductions - (3)Adjusted Tier 2 Capital 4,592 4,353Total Capital 23,321 22,400
Risk-Weighted Assets (RWA)
(Canadian $ in millions) Q4 2008 Q3 2008
Credit risk 163,616 146,535Market risk 11,293 16,207Operational risk 16,699 16,426Total risk-weighted assets 191,608 179,168Regulatory floor - 3,090
Total Transitional Risk-Weighted Assets 191,608 182,258
Eligible Dividends Designation
For the purposes of the Income Tax Act (Canada) and any similar provincial and territorial legislation, BMO designates all dividends paid on both its common and preferred shares after December 31, 2005, and all dividends (including deemed dividends) paid thereafter, as “eligible dividends” unless BMO indicates otherwise.

BMO Financial Group Fourth Quarter Report 2008 • 15
Financial Instruments in the Difficult Credit Environment At the request of the G7 finance ministers and central bank governors, The Financial Stability Forum issued a report in April 2008 on enhancing market and institutional resilience. Among its recommendations, it encouraged enhanced disclosure related to financial instruments that markets now consider to carry higher risk. Effective in the second quarter of 2008, we expanded our discussion of certain financial instruments in keeping with these developments. Subprime First Mortgage Loans
In the United States, subprime loans are typically considered to be those made to borrowers with credit bureau scores of 620 or less. We do not originate subprime mortgages through a subprime mortgage program in the United States; however, we make loans available in the United States to individuals with credit scores below 620 as part of our lending requirements under the Community Reinvestment Act. We also occasionally lend to parties with credit scores of less than 620 when there are other strong qualification criteria. As a result, we have authorized US$0.25 billion of first mortgage loans that had subprime characteristics at the date of authorization, of which US$0.25 billion was outstanding at October 31, 2008 (US$0.23 billion at July 31, 2008). Of this, $5.4 million or 2.14% was 90 days or more in arrears at the end of October ($4.8 million or 2.11% at July 31, 2008). This compares with a rate of 0.94% on BMO’s total U.S. first mortgage loan portfolio. In Canada, BMO does not have any subprime mortgage programs, nor do we purchase subprime mortgage loans from third-party lenders. BMO mortgage lending decisions incorporate a full assessment of the customer and loan structure. Credit score is only one component of the adjudication process and consequently we do not categorize loans based upon credit scores alone. There is a nominal amount of Canadian residential mortgage loans with subprime characteristics held in certain BMO-sponsored Canadian securitization conduits that hold third-party client assets, as described in the discussion of those conduits that follows. We also have net exposure of US$159 million at October 31, 2008 (US$208 million at July 31, 2008) to a business that buys distressed mortgages (including subprime mortgages) at a discounted price. Alt-A First Mortgage Loans
In the United States, Alt-A loans are generally considered to be loans for which borrower qualifications are subject to limited verification. The U.S. loan portfolio had two loan programs that met this definition – our Easy Doc and No Doc programs. Loans under the No Doc program, which comprise most of the exposure in this class, required minimum credit bureau scores of 660 and maximum loan-to-value ratios of 80% (90% with private mortgage insurance). Due to these lending requirements, the credit quality of our Alt - A portfolio is strong and the loans have performed well. Our direct Alt-A loans totalled US$1.6 billion at October 31, 2008 (US$1.6 billion at July 31, 2008). Of this, $10 million or 0.62% was 90 days or more in arrears ($6 million or 0.35% at July 31, 2008). This compares with a rate of 0.94% for BMO’s total U.S. first mortgage loan portfolio. We discontinued the Easy Doc and No Doc programs in the third quarter of 2008.
Subprime and Alt-A loans are generally considered to carry higher risk than traditional prime loans. We also consider loans to customers with credit scores between 620 and 660 and a loan-to-value ratio above 80% (without private mortgage insurance) to be a higher-risk component of our portfolio. This component of the U.S. loan portfolio was negligible. In Canada, we do not have a mortgage program that we consider Alt-A. As part of our credit adjudication process, we may choose not to verify income or employment for certain customers when there are other strong characteristics that support the creditworthiness of the loan. We also have a Newcomers to Canada/non-resident mortgage program that permits limited income verification but has other strong qualification criteria. At October 31, 2008, there was approximately $2.2 billion ($2.3 billion at July 31, 2008) (restated from previous report to exclude securitized assets) outstanding under this program. Of this, only $11 million or 0.51% was 90 days or more in arrears ($10 million or 0.42% at July 31, 2008, excluding securitized assets), reflecting the strong credit quality of these loans. Home Equity Products
Home equity products are secured by the homeowner’s equity and rank subordinate to any existing first mortgage on the property. In the United States, we have a US$5.0 billion home equity loan portfolio, which amounted to 2% of BMO’s total loan portfolio as of October 31, 2008. Of the total portfolio, loans of US$351 million (US$352 million at July 31, 2008) were extended to customers with original credit bureau scores of less than 620, and would be categorized as subprime loans. Of this amount, only US$3 million or 0.8% was 90 days or more in arrears at October 31, 2008 (US$4 million and 1.3% at July 31, 2008). BMO also offered two limited documentation programs within the home equity portfolio in the United States, which would be categorized as Alt-A if they were in the first mortgage loans portfolio. As at October 31, 2008, the amount authorized under these programs was US$1.0 billion, and US$0.6 billion was outstanding. Loans made under these programs have the same strong credit score and loan-to-value requirements as the first mortgage portfolio, and as such the portfolio has performed well. As at October 31, 2008, US$4 million or 0.68% of the portfolio was greater than 90 days in arrears (US$4 million and 0.66% at July 31, 2008). This compares with a rate of 0.57% for BMO’s total U.S. home equity loan portfolio. We discontinued these programs in the third quarter of 2008. We also consider home equity loans to customers with credit bureau scores above 620 but below 660 to be a higher-risk component of the loan portfolio. This component of the portfolio was US$0.3 billion as of October 31, 2008 (US$0.3 billion at July 31, 2008). As of October 31, 2008, US$3 million or 0.88% of these loans were greater than 90 days in arrears (US$5 million and 1.87% at July 31, 2008). Loans having a loan-to-value ratio higher than 90% at issuance represent US$0.4 billion or 7% of the U.S. home equity loan portfolio as at October 31, 2008. Loans having a loan-to-value ratio higher than 80% to customers with a credit bureau score below 660 at the time of issuance represent just $0.3 billion. In Canada, we have a $13.8 billion home equity line of credit portfolio ($30.1 billion authorized). The portfolio is high-quality, with only 0.08% of the loans in the portfolio in arrears 90 days or more. Of these lines of credit, one product line is offered only in first mortgage position and represents approximately 54% of the

16 • BMO Financial Group Fourth Quarter Report 2008
total portfolio. We also have a $0.3 billion home equity instalment loan portfolio on which less than $2 million of loans are in arrears 90 days or more. Leveraged Finance
Leveraged finance loans are defined by BMO as loans to private equity businesses and mezzanine financings where our assessment indicates a higher level of credit risk. BMO has limited exposure to leveraged finance loans, representing less than 1% of our total assets, with $3.6 billion outstanding as at October 31, 2008 ($5.8 billion authorized), compared with $3.0 billion outstanding ($4.4 billion authorized) at July 31, 2008. Monoline Insurers and Credit Derivative Product Companies
At October 31, 2008, BMO’s direct exposure to companies that specialize in providing default protection amounted to $573 million ($242 million at July 31, 2008) in respect of the mark-to-market value of counterparty derivatives and $19 million ($10 million at July 31, 2008) in respect of the mark-to-market value of traded credits. An adjustment for counterparty credit risk of $60 million was recorded against these exposures. Approximately 88% of the $573 million exposure is related to counterparties rated AA or better and the remainder is related to BB rated counterparties. Approximately 53% of the $19 million exposure is related to counterparties rated BBB- or better and the remainder is related to BB rated counterparties. The notional value of direct contracts involving monoline insurers and credit derivative product companies was approximately $4.5 billion, substantially unchanged from July 31, 2008. Most contracts with these companies related to collateralized debt obligations and credit default swaps within our trading portfolio and provided protection against losses arising from defaults. These instruments have minimal subprime exposure. BMO also held $1,176 million ($924 million at July 31, 2008) of securities insured by monoline insurers, of which $795 million were municipal bonds. Approximately 79% of the municipal bond portfolio is rated investment grade, including the benefits of the insurance guarantees. Approximately 68% of the municipal bond holdings have ratings exclusive of the insurance guarantees and all of those are rated investment grade. BMO-Sponsored Canadian Securitization Conduits BMO provided liquidity support facilities to six of the non-consolidated conduits it sponsors in Canada totalling $16.1 billion at October 31, 2008 ($18.2 billion at July 31, 2008). All of these facilities remain undrawn. Notes issued by all six of these programs are rated R-1 (high) by DBRS and Prime-1 by Moody’s. Two of these conduits hold only Canadian prime residential mortgages transferred from BMO and account for $5.1 billion of BMO’s funding commitment. The other four non-consolidated conduits hold third-party client assets and account for $11.0 billion of BMO’s liquidity support facility. The assets of each of the four third-party client funding conduits consist primarily of diversified pools of Canadian auto receivables and Canadian residential mortgages. These two asset classes, combined, account for 67% to 92% of the assets of these four conduits. Assets in the four client-funding conduits include a nominal $111 million of Canadian residential mortgage loans with subprime characteristics, $948 million of Canadian residential mortgage loans with Alt-A characteristics and $233 million of
small commercial mortgage loans. There are no collateralized debt obligations (CDOs) and no exposure to monoline insurers in these conduits. BMO’s investment in the asset-backed commercial paper (ABCP) of the six non-consolidated conduits totalled $2.6 billion at October 31, 2008, compared with $1.3 billion at July 31, 2008 and $5.9 billion at October 31, 2007. No losses have been recorded on BMO’s investment in the ABCP of these conduits . BMO consolidates the accounts of two vehicles it sponsors in Canada where the majority of the expected gain or loss of the vehicles has been deemed as accruing to BMO. One of the vehicles holds the series of notes rated R-1 (low) by DBRS of one of the six conduits discussed above. The other vehicle is a conduit whose notes are rated R-1 (mid) by DBRS. These two vehicles had $65 million and $200 million of assets, respectively, at October 31, 2008. The combined assets include exposure to $8 million of Canadian residential mortgage loans with subprime characteristics, $66 million of Canadian residential mortgage loans with Alt-A characteristics and $13 million of small commercial mortgage loans. No losses have been recorded on BMO’s exposure to these vehicles. BMO-Sponsored U.S. Securitization Conduit
BMO provided committed liquidity support facilities of US$8.2 billion to our U.S. multi-seller ABCP conduit at October 31, 2008 (US$9.2 billion at July 31, 2008). The conduit provides funding to diversified pools of portfolios through 91 individual securitization transactions with an average facility size of approximately US$90 million. At present, the size of the pools ranges from approximately US$1.9 million to US$450 million. The ten largest pools comprise 33% of the portfolio. Committed amounts comprise a wide range of asset classes including mid-market corporate loans (24%), auto loans and leases (12%), commercial real estate loans and leases (13%), corporate loans (12%), consumer instalment loans (8%) and equipment loans and leases (8%). Residential mortgages comprise 2.5% of the portfolio, of which 0.3% are classified as subprime or Alt-A. Approximately 60% of the conduit’s commitments have been rated by Moody’s or S&P, and all of those are rated A or higher. Approximately US$1.5 billion of the commitments are insured by monolines, primarily MBIA and Ambac, the ratings of which, while recently downgraded to Baa1 by Moody’s and AA by S&P have no impact on the performance of the underlying assets. None of the monoline guarantees involve mortgages or ABS/structured-finance CDOs. All of the underlying transactions are performing in accordance with their terms and conditions. The conduit had US$6.5 billion of commercial paper outstanding at October 31, 2008, down from US$6.8 billion at July 31, 2008. The ABCP of the conduit is rated A1 by S&P and P1 by Moody’s. BMO has not invested in the conduit’s ABCP. Outstanding commercial paper has consistently been purchased by third-party investors, notwithstanding market disruptions and pricing levels are in line with those of top-tier ABCP conduits in the United States.
In the first half of this fiscal year, as a result of the deterioration in credit conditions and in accordance with the terms of the supporting liquidity agreements, BMO directly funded three commercial accounts that have exposure to the U.S. housing sector totalling US$851 million. The net book value of the three accounts was reduced to US$296 million at October 31, 2008,

BMO Financial Group Fourth Quarter Report 2008 • 17
having been lowered by payments of US$228 million and loss provisions. The credit quality of two of the accounts deteriorated and specific provisions were recorded. BMO’s provision for credit losses related to these two accounts reflects a modest amount for the quarter and US$331 million for the year. It has not been necessary to record any provisions on the third account. In the fourth quarter, given the weaker economy, we noted some deterioration in certain of the conduit’s portfolios; however, all of them were performing as at the end of October. Non-Bank Sponsored Canadian Securitization Conduits
We hold ABCP of six non-bank-sponsored Canadian conduits with a carrying value of $187 million as at October 31, 2008 ($201 million as at July 31, 2008). We have not provided backstop liquidity commitments to these conduits. We recorded a decline in fair value of $14 million in the fourth quarter ($28 million in the third quarter). Our investments were transferred from our trading portfolio to our available-for-sale portfolio in the fourth quarter; as a result, the $14 million decline in fair value recorded in the fourth quarter was charged against other comprehensive income rather than income. Our investments in the ABCP reflect a cumulative mark-to-market loss in fair value of $138 million. Realization on our investment in the ABCP of the non-bank-sponsored conduits will be affected by the terms of the agreement reached among certain non-bank-sponsored Canadian ABCP conduits and investors known as the Montreal Accord. BMO is fully supportive of the Montreal Accord. Credit Protection Vehicle
We also sponsor Apex Trust (Apex), a Canadian special purpose vehicle that provides credit protection via credit default swaps through 12 investment-grade-rated leveraged super-senior tranches of diversified pools of U.S. and European corporate credits. Apex has exposure to approximately 450 corporate credits that are diversified by geographic region and industry, and of which 74% are rated investment grade. On May 13, 2008, Apex was restructured and investors exchanged their original holdings for mid-term notes issued by Apex with terms of five and eight years (the “Notes”). Apex issued $2.2 billion of Notes, of which BMO’s exposure is $815 million. Another party to the restructuring has a $600 million exposure to the Notes through a total return swap with BMO. The total return swap has a price reset in September, 2009 based on a reference index and BMO has the option to terminate the swap at that time. The cost of the total return swap will increase if BMO chooses to extend the option due to the price reset, depending on market conditions at that time. A senior funding facility of $1.13 billion (the “Senior Facility”) was also put in place pursuant to the restructuring, with BMO providing $1.03 billion of that facility. Advances under the Senior Facility rank ahead of the Notes. As of October 31, 2008, $553 million ($124 million at July 31, 2008) had been drawn against BMO’s committed share of the Senior Facility to fund collateral calls arising from declining mark-to-market values of the underlying credit default swaps. The Notes and the Senior Facility total approximately $3.3 billion and represent about 16% of the approximately $21 billion of net notional credit positions held by the vehicle. Under the terms of the restructuring, BMO also entered into credit default swap contracts with the swap counterparties and
into offsetting swaps with Apex. BMO has exposure to the swap counterparties for realized credit losses on the notional credit positions if those credit losses exceed the aggregate $3.3 billion value of the Notes and the Senior Facility. In the third quarter we reversed $40 million of the charges that had been previously recorded in relation to our $815 million exposure to the Notes and recorded a $55 million charge in relation to the total return swap transaction, resulting in a net loss of $15 million in the quarter. In the fourth quarter, we recorded an additional charge of $105 million on our Notes exposure, reducing the carrying value of our Notes to $625 million ($730 million at July 31, 2008). We also recorded an additional $65 million charge in relation to the total return swap transaction for a total charge of $170 million in the quarter. The decline in fair value in the fourth quarter resulted from deterioration in the credit quality of the underlying portfolios and significant increases in credit spreads given current market conditions. Realized credit losses on the Apex Notes will only be incurred should losses on defaults in the underlying credits exceed the first-loss protection on a tranche. There were a number of credit events in the underlying portfolios that resulted in a reduction in Apex’s first-loss protection on nine of the tranches. The two tranches with lower levels of first-loss protection experienced reductions in first-loss protection from 12.0% to an estimated 11.2% on a tranche with a notional amount of $342 million, and from 8.3% to an estimated 7.0% on a tranche with a notional amount of $875 million. These two tranches were rated A and A (high), respectively by DBRS at the end of the fourth quarter. Each of the other 10 tranches has first-loss protection, ranging from 14.4% to 30.3%, and all were rated AAA. This substantial first loss protection from future defaults is significantly higher than the historical credit loss experience of the corporate credits. Structured Investment Vehicles
On March 3, 2008, we agreed to provide senior-ranked funding support through BMO liquidity facilities for two BMO-managed Structured Investment Vehicles (SIVs), Links Finance Corporation (Links) and Parkland Finance Corporation (Parkland). The facilities backstop the repayment of senior note obligations to facilitate the SIVs’ access to further senior funding, provide supplemental funding and permit the SIVs to continue the strategy of selling assets in an orderly manner. Consistent with the strategy of selling assets in an orderly manner, the pace of asset sales slowed during the quarter as a result of market conditions. The amount drawn under the facilities is expected to be less than the current maximum committed amount for both SIVs and is expected to be at its highest level in July 2009. It is currently anticipated that the SIVs will continue the strategy of selling assets in an orderly manner based upon market conditions. However, for illustrative purposes: if there were no further asset sales and assets were repaid as we anticipate given their terms, by July 2009, we would expect that draws under the Links facility would be US$3.0 billion higher than at October 31, 2008 and draws under the Parkland facility would be €160 million higher. At October 31, 2008, amounts drawn on the facilities totalled US$3.7 billion and €477 million (US$3.3 billion and €420 million at July 31, 2008). The liquidity facilities total a maximum of approximately US$7.7 billion for Links and €672 million for Parkland at October 31, 2008, down from US$7.9 billion and €686 million at July 31,

18 • BMO Financial Group Fourth Quarter Report 2008
2008. Advances under the liquidity facilities rank ahead of the SIVs’ subordinated capital notes. The total amount drawn under the liquidity facilities is impacted by a number of factors including the pace and price of asset sales, the maturity profile of the senior notes and asset maturities. While the assets of the SIVs mature over time, the majority of the assets mature in the period between 2010 and 2012. The SIVs' capital noteholders will continue to bear the economic risk from actual losses up to the full amount of their investment. The par value of the subordinate capital notes less realized losses in Links and Parkland at October 31, 2008 was US$1.17 billion and €158 million, respectively, and BMO holds a nominal amount of capital notes with a carrying value of Cdn$nil million (Cdn$8 million at July 31, 2008). The market value of the assets held by Links and Parkland at October 31, 2008 totalled US$6.8 billion and €698 million, respectively, reduced from US$8.2 billion and €780 million at July 31, 2008. While the market value of the SIVs' assets is currently lower than the amount of senior debt outstanding, BMO believes that the first-loss protection provided by the subordinate capital notes exceeds future expected losses. Although the credit quality of the assets in the SIVs has weakened due to market conditions and some of the debt securities in the SIVs were downgraded during the quarter, the asset quality of Links and Parkland remains high, with approximately 84% of debt securities rated Aa or better by Moody’s (86% at July 31, 2008), 73% rated AA or better by S&P (75% at July 31, 2008) and 98% rated investment grade. Certain of the debt security ratings are on credit watch, for downgrade. The senior notes of the SIVs are rated AA- by S&P and Aaa by Moody’s (on review for downgrade). The SIVs hold no direct exposure to U.S. subprime mortgages. Links holds a diversified mix of debt securities, including senior and subordinated commercial bank debt (33.4%), collateralized bond obligations and collateralized loan obligations whose underlying assets are primarily corporate obligations (19.3%), debt securities wrapped by monolines (Ambac, FGIC, FSA and MBIA) (10.0%), residential mortgage-backed securities (13.7%) and commercial mortgage-backed securities (6.4%). Collateralized bond obligations include US$83 million (1.2% of assets) backed primarily by U.S. subprime and Alt-A RMBS collateral. Parkland’s asset diversification is broadly in line with that of Links.
Auction-Rate Securities
Auction-rate securities (ARS) are typically short-term notes issued by trusts in the United States to fund long-term, fixed-rate debt instruments (corporate or municipal bonds primarily issued by municipalities, student loan authorities and other sponsors). The interest rate on ARS is regularly reset every 7 to 35 days through auctions managed by financial institutions. A disruption in the market for ARS occurred in the early part of 2008. There are no BMO-sponsored ARS programs in the market and BMO did not hold any ARS in its trading portfolio at the end of the quarter. However, in the fourth quarter, BMO offered to purchase from client accounts US$143 million of ARS at par value plus accrued interest. During the quarter, BMO recorded a charge of $12 million ($8 million after tax) in respect of the valuation of ARS expected to be tendered to our offer.
Exposure to Major Financial Institutions In recent months, there have been significant developments affecting U.S. and European based financial institutions, causing governments in many jurisdictions across the globe to take steps to support their financial systems. During the quarter, BMO did not incur any significant losses from financial institutions. BMO has closed all positions with Lehman’s, who sought bankruptcy protection in the quarter, and incurred a $32 million charge. It consisted of the $19 million charge for PCG previously disclosed in our Effects of the Capital Markets Environment on Fourth Quarter Results section and, in BMO Capital Markets, a $13 million charge recorded net of recoveries on credit default swap hedges. We also recorded a US$31 million specific provision on a US$62 million loan to the European subsidiary of an Icelandic bank.
In addition, given the current environment, we are monitoring exposures to financial institution counterparties in non-investment-grade countries. At October 31, 2008, BMO’s direct exposure to these financial institutions amounted to a modest $73 million in respect of the uncollateralized mark-to-market value of counterparty derivatives, after deduction of $8 million of collateral received in respect of our $81 million gross exposure. There were no such exposures in respect of the mark-to-market value of traded credits. A nominal adjustment for counterparty credit risk was recorded against these exposures. Exposure to Other Select Financial Instruments including Collateralized Debt Obligations (CDOs)
CDOs are obligations of a special purpose vehicle (SPV) that is created for a specific financing transaction. The SPV typically has a nominal amount of equity and issues various tranches of rated and unrated debt securities (usually AAA to BB) that have well-defined rights to cash generated from the operation and liquidation of the vehicle’s assets. The risk of loss on the SPV’s portfolio varies by tranche. Losses will first affect the equity tranche, next the mezzanine tranches and finally the senior tranche. Super-senior is generally the most secure of all tranches. The SPV uses the cash raised through the issuance of the CDOs to invest in one or more different types of assets including bonds, loans and mortgages. The corresponding obligations of the SPV would be, respectively, collateralized bond obligations (CBOs), collateralized loan obligations (CLOs) and collateralized mortgage obligations (CMOs). CMOs for which the underlying assets are residential properties are referred to as residential mortgage-backed securities (RMBS); CMOs for which the underlying assets are commercial properties are referred to as commercial mortgage-backed securities (CMBS). Exposures to CDO’s are outlined in the following table. Caution Given the uncertainty in the capital markets environment, our capital markets instruments could experience further valuation gains and losses due to changes in market value. This Financial Instruments in the Difficult Credit Environment section contains forward-looking statements. Please see the Caution Regarding Forward-Looking Statements.

BMO Financial Group Fourth Quarter Report 2008 • 19
The following table provides additional detail on other select financial instruments that are held in our investment and trading books. Most of our CDOs and CLOs are fully hedged with other large financial institutions. Net CDO exposure is minimal at $29 million, consisting of the $12 million carrying value of unhedged and wrapped instruments and a $17 million cumulative net loss on hedged investments. Net CLO exposure is also modest, at $107 million, consisting of the $83 million carrying value of unhedged and wrapped investments and a $24 million net loss on hedged instruments. BMO has invested only in senior and super-senior tranches of CDOs and CLOs. Tranche ratings in the table use the lowest external rating available provided by S&P, Moody’s or Fitch. The difference between hedged investment amounts and carrying value of hedged investment amounts reflect mark-to-market adjustments, which are generally recoverable through total return or credit default swaps. The underlying securities are a wide range of assets. BMO’s investments typically represent about 20% of the pool but can be as low as 5% and as high as 50%. Approximately 70% of the hedged investment amounts have been hedged through swaps with three financial institution counterparties rated A- to AA. The value of BMO’s interest in those hedges is supported by collateral held, with the exception of relatively modest amounts as permitted under counterparty agreements. The remainder of the hedged investment amounts is hedged through three monoline insurer counterparties rated A to AAA. Exposures to Other Select Financial Instruments
$million (Cdn) as at October 31, 2008
(note 1)Tranche
Rating
Carrying Value of
Unhedged &Wrapped
Investments
HedgedInvestment
Amounts
CarryingValue of Hedged
Investment Amounts
Cumulative Loss in Value
of Hedged Investments
Cumulative Gain on Hedges
Net Losses on Hedged
Investments
CDO’s* AAA 12 Sundry securities
AAA 805 542 (263) 263 - Hedged with FI’s rated A- or better
AAA 308 274 (34) 17 (17) Hedged with monolines rated AAA***
A- to AA+ 1,250 724 (526) 526 - Hedged with FI’s rated A- or better
B- to BB+ 184 117 (67) 67 - Hedged with FI’s rated A- or better
CCC or worse 18 (18) 18 - Hedged with FI’s rated AA- or better
12 2,565 1,657 (908) 891 (17)
CLO’s AAA 83 Mostly U.K. and European mid-size corporate loans
AAA 836 773 (63) 63 - Hedged with FI’s rated A or better***
AAA 1,201 1,082 (119) 95 (24) Hedged with monolines rated A or better***
83 2,037 1,855 (182) 158 (24)
Residential MBS No subprime AAA 37 Mostly U.K. and Australian mortgages
U.S. subprime – wrapped** AAA 4 Wrapped with monolines rated AAA***
A- to AA+ 17 Wrapped with monolines rated A
B- to BB+ 9 Wrapped with Monolines rated BB*
U.S. subprime AAA 257 184 (73) 73 - Hedged with FI’s rated AA or better
A- to AA+ 110 76 (34) (34) Hedged with FI’s rated AA or better
B- to BB+ 2 Mostly low loan-to-value or older U.S. mortgages
69 367 260 (107) 73 (34)
CMBS AAA 49 European, U.K. and U.S. commercial real estate loans
A- to AA+ 95 Mostly Canadian commercial and multi-use residential loans
144
ABS’s AAA 220 Mostly Canadian credit card receivables and auto loans
AAA 120 120 - Hedged with Monolines rated AAA
A- to AA+ 111 Mostly Canadian credit card receivables and auto loans
BBB- to BBB+ 68 Collateral notes on Canadian credit card receivables
399 120 120 -
FI’s = Financial Institutions
Note 1 Most of the unhedged and wrapped investments were transferred to the available-for-sale portfolio effective August 1, 2008. * CDOs include indirect exposure to approximately $0.7 billion of U.S. subprime residential mortgages. As noted above, this exposure is hedged via total return
swaps with three large non-monoline financial institutions. Amounts exclude the $1.5 billion notional value of CDO credit default swap (CDS) protection purchases from two credit derivative product company counterparties and corresponding CDS protection provided to other financial institutions in our role as intermediary.
** Wrapped MBS have an insurance guarantee attached and are rated inclusive of the wrap protection. RMBS included in the hedged investment amounts of $367 million have exposure to approximately $179 million of underlying U.S. subprime loans.
*** Certain ratings are under review

20 • BMO Financial Group Fourth Quarter Report 2008
Review of Operating Groups’ Performance
Operating Groups’ Summary Income Statements and Statistics for Q4-2008 Q4-2008 Fiscal-2008
(Canadian $ in millions, except as noted) P&C PCG BMO CM
Corporate
including T&O Total BMO P&C PCG BMO CM
Corporate
including T&O Total BMO
Net interest income (teb) (1) 1,047 184 355 (173) 1,413 3,984 671 1,179 (747) 5,087Non-interest revenue 539 310 360 191 1,400 2,043 1,396 1,233 446 5,118
Total revenue (teb) (1) 1,586 494 715 18 2,813 6,027 2,067 2,412 (301) 10,205Provision for credit losses 101 1 30 333 465 384 4 117 825 1,330Non-interest expense 971 381 451 23 1,826 3,592 1,477 1,752 81 6,902Restructuring charge - - - (8) (8) - - - (8) (8)
Total non-interest expense 971 381 451 15 1,818 3,592 1,477 1,752 73 6,894Income before income taxes and non- controlling interest in subsidiaries 514 112 234 (330) 530 2,051 586 543 (1,199) 1,981Income taxes (recovery) (teb) (1) 158 34 (51) (190) (49) 635 191 (149) (748) (71)Non-controlling interest in subsidiaries - - - 19 19 - - - 74 74
Net income Q4-2008 356 78 285 (159) 560 1,416 395 692 (525) 1,978
Net income Q3-2008 371 110 259 (219) 521
Net income Q4-2007 320 103 46 (17) 452 1,383 395 417 (64) 2,131
Other statistics
Net economic profit 159 48 132 (194) 145 678 281 91 (645) 405Return on equity 18.7% 27.5% 20.2% nm 14.0% 20.0% 36.4% 12.2% nm 13.0%Cash return on equity 19.2% 27.8% 20.3% nm 14.3% 20.4% 36.7% 12.2% nm 13.3%Operating leverage 4.8% (9.9%) 57.1% nm 18.0% (1.0%) (1.5%) 11.2% nm 4.8%Cash operating leverage 4.7% (9.9%) 57.1% nm 18.0% (1.1%) (1.6%) 11.2% nm 4.7%Productivity ratio (teb) 61.2% 77.0% 63.1% nm 64.6% 59.6% 71.5% 72.6% nm 67.6%Cash productivity ratio (teb) 60.6% 76.8% 63.0% nm 64.2% 59.0% 71.2% 72.6% nm 67.1%Net interest margin on earning assets (1) 2.74% 9.17% 0.81% nm 1.71% 2.72% 8.98% 0.67% nm 1.56%Average common equity 7,275 1,100 5,376 1,402 15,153 6,849 1,070 5,305 1,388 14,612Average earning assets ($ billions) 151.9 8.0 173.8 (5.0) 328.7 146.3 7.5 176.1 (3.1) 326.8Full-time equivalent staff 20,697 4,535 2,465 9,376 37,073
nm – not meaningful (1) Operating group revenues, income taxes and net interest margin are stated on a taxable equivalent basis (teb). The group teb adjustments are offset in Corporate, and Total BMO revenue, income taxes and net
interest margin are stated on a GAAP basis. See the Non-GAAP Measures section.
The following sections review the financial results of each of our operating segments and operating groups for the fourth quarter of 2008. Periodically, certain business lines and units within the business lines are transferred between client groups to more closely align BMO’s organizational structure and its strategic priorities. All comparative figures are reclassified to reflect these transfers.
Note 15 to the attached unaudited interim consolidated financial statements outlines how income statement items requiring allocation are distributed among the operating groups, including the allocation of the provision for credit losses. Corporate Services is generally charged (or credited) with differences between the periodic provisions for credit losses charged to the client groups under our expected loss provisioning methodology and the periodic provisions required under GAAP.

BMO Financial Group Fourth Quarter Report 2008 • 21
Personal and Commercial Banking (P&C)
(Canadian $ in millions, except as noted) Q4-2008
Increase (Decrease)
vs. Q4-2007
Increase (Decrease)
vs. Q3-2008 Fiscal-2008
Increase (Decrease)
vs. Fiscal-2007
+
Net interest income (teb) 1,047 105 11% 28 3% 3,984 188 5%Non-interest revenue 539 149 38% 18 3% 2,043 187 10%
Total revenue (teb) 1,586 254 19% 46 3% 6,027 375 7%Provision for credit losses 101 12 14% 2 3% 384 26 7%Non-interest expense 971 120 14% 67 8% 3,592 255 8%
Income before income taxes and non-controlling interest in subsidiaries 514 122 30% (23) (5%) 2,051 94 5%Income taxes (teb) 158 86 +100% (8) (6%) 635 61 11%Non-controlling interest in subsidiaries - - - - - - - -
Net income 356 36 11% (15) (4%) 1,416 33 2%
Amortization of intangible assets (after tax) 8 - - - - 30 (3) (10%)
Cash net income 364 36 11% (15) (4%) 1,446 30 2%
Return on equity 18.7% 0.6% (1.3%) 20.0% (0.8%)Cash return on equity 19.2% 0.6% (1.2%) 20.4% (0.9%)Operating leverage 4.8% nm nm (1.0%) nmCash operating leverage 4.7% nm nm (1.1%) nmProductivity ratio (teb) 61.2% (2.6%) 2.5% 59.6% 0.6%Cash productivity ratio (teb) 60.6% (2.5%) 2.6% 59.0% 0.6%Net interest margin on earning assets (teb) 2.74% 0.03% (0.01%) 2.72% (0.05%)Average earning assets 151,921 14,156 10% 4,305 3% 146,294 9,489 7%
nm – not meaningful
Personal and Commercial Banking (P&C) represents the sum of our two retail and business banking operating segments, Personal and Commercial Banking Canada (P&C Canada) and Personal and Commercial Banking U.S. (P&C U.S.). These operating segments are reviewed separately in the sections that follow.
Personal and Commercial Banking Canada (P&C Canada)
(Canadian $ in millions, except as noted) Q4-2008
Increase (Decrease)
vs. Q4-2007
Increase (Decrease)
vs. Q3-2008 Fiscal-2008
Increase (Decrease)
vs. Fiscal-2007
Net interest income (teb) 835 65 8% 13 2% 3,236 170 6%Non-interest revenue 481 137 40% 12 3% 1,801 123 7%
Total revenue (teb) 1,316 202 18% 25 2% 5,037 293 6%Provision for credit losses 89 8 10% 2 2% 341 18 6%Non-interest expense 728 38 6% 18 3% 2,790 146 6%
Income before income taxes and non-controlling interest in subsidiaries 499 156 45% 5 1% 1,906 129 7%Income taxes (teb) 155 99 +100% 4 2% 586 76 15%Non-controlling interest in subsidiaries - - - - - - - -
Net income 344 57 19% 1 - 1,320 53 4%
Amortization of intangible assets (after tax) - (3) nm 1 nm 2 (6) nm
Cash net income 344 54 19% 2 - 1,322 47 4%
Personal, Insurance & Other revenue 680 83 14% 26 4% 2,565 101 4%Commercial revenue 338 2 1% (5) (1%) 1,364 13 1%Cards revenue 298 117 65% 4 1% 1,108 179 19%Operating leverage 12.4% nm nm 0.7% nmCash operating leverage 12.2% nm nm 0.4% nmProductivity ratio (teb) 55.4% (6.5%) 0.5% 55.4% (0.3%)Cash productivity ratio (teb) 55.3% (6.4%) 0.4% 55.3% (0.3%)Net interest margin on earning assets (teb) 2.68% 0.08% - 2.67% 0.01%Average earning assets 123,807 6,482 6% 1,654 1% 121,381 6,234 5%
nm – not meaningful

22 • BMO Financial Group Fourth Quarter Report 2008
Q4 2008 vs Q4 2007 Net income of $344 million increased $57 million or 19% from a year ago. Net income a year ago included $6 million arising from a $43 million recovery of prior year income taxes and the net impact of two items that lowered revenue. They were a $107 million ($83 million after tax) gain on sale of MasterCard International Inc. shares as we chose to realize on the value inherent in our investment, less a $185 million ($120 million after tax) adjustment to increase the liability for future customer redemptions related to our credit card loyalty rewards program. Net income increased $63 million or 22% adjusted for the items above. Revenue rose $202 million or 18%. Adjusted for the above prior year items, revenue grew $124 million or 10%. The revenue increase was driven by volume growth across most products and particularly in cards and consumer lending, and by an improved net interest margin, higher revenues in trading non-interest revenue from securitization activities and higher Moneris revenue. These factors were partially offset by net investment securities losses in softer market conditions. Net interest margin increased by 8 basis points due to interest on tax refunds. The impact of more favourable product mix and improved product yields was offset by higher funding costs and lower mortgage refinancing fees. In the personal banking segment, revenue increased $83 million or 14% with growth in most products. Personal loan growth from the fourth quarter of 2007 was a strong 21%. Market share increased 89 basis points from the prior year and 33 basis points from the third quarter to 11.98%. In 2009 we expect market growth to ease. Our objective remains to increase market share under any market conditions. Our HomeOwner Readiline product has been an important part of our accelerating personal loan growth. However, in a slower housing market, growth in housing related products is expected to dampen. We continue to runoff our mortgage broker portfolio. Balance growth is positive as this run-off is more than being replaced with growth from our proprietary channels; however as expected, we continue to experience market share declines. Mortgage market share decreased 113 basis points from a year ago and 24 basis points from the third quarter. Personal deposits increased 1.6% from the fourth quarter of 2007 as the number of active chequing customers and the percentage of households retained are on the rise. We are pleased with our growth in new accounts and are now focused on attracting balances into those accounts. Market share increased 1 basis point relative to the third quarter and 6 basis points year over year to 12.02% in a highly competitive environment. Within the commercial banking segment, revenue increased $2 million or 0.8%. Revenue growth was negatively impacted by $9 million in net investment securities losses due to softer equity markets. There was loan growth of 7.2% from a year ago despite economic weakness and continued intense competition; however, the revenue benefit from loan growth was largely offset by higher funding costs in 2008. BMO ranks second in Canadian business banking market share at 19.84%. This quarter, market share increased by 67 basis points from the prior year and decreased 5 basis points from the third quarter. In the $1 to $5 million commercial loan segment, there was loan growth of 12.0% year over year and market share growth of 106 basis points year over year and 8 basis points relative to the third quarter. On the
deposit side of the business, balance growth of 4.9% was accompanied by a steady increase in the number of commercial operating account customers. We are pleased with our improved loyalty scores in personal and commercial banking where we have made broad-based gains relative to our competition. Cards and payments service revenue increased $117 million or 65%. Adjusted for the net $78 million impact of the prior year’s MasterCard gain and adjustment of the loyalty rewards program liability, revenue increased $39 million or 15% with growth in transactions and accelerating balance growth, as well as higher Moneris revenues. This was another quarter with consistent, strong growth from our cards products. Our most recent AIR MILES and Cashback rewards offers have broad appeal to customers. The coordinated AIR MILES offering on both our credit and debit cards complement each other, driving increasing cards volumes as well as active chequing customers. Cards and payment services are also seeing improvements in customer loyalty. In 2008, the group was awarded the Global Quality Platinum award from MasterCard Worldwide, which acknowledges performance in the key areas that affect the customer experience when making a purchase. Non-interest expense increased $38 million or 5.7%, primarily due to higher employee costs and higher capital taxes. We continue to invest strategically in the business including the expansion and renovation of our branch network, credit and debit card chip technology, and the expansion of our mortgage specialist and financial planner workforce to drive incremental sales. In fiscal 2008, we opened 16 new branches, closed 10, relocated 11 and expanded seven. Average loans and acceptances, including securitized loans, increased $8.1 billion or 6.5% from the fourth quarter of 2007 and personal and commercial deposits grew $1.1 billion or 2.4%. The group’s cash operating leverage was 12.2%. Excluding the impact of last year’s MasterCard gain and the adjustment to the loyalty rewards liability, cash operating leverage was 4.5%. Q4 2008 vs Q3 2008
Net income increased $1 million. Revenue increased $25 million or 1.9% from the third quarter. Revenue growth was driven by volume growth across most products and higher revenue included in trading non-interest revenue from securitization activities, partially offset by net investment securities losses. Net interest margin was unchanged as the interest on tax refunds was offset by higher funding costs. Non-interest expense increased $18 million or 2.8% due to an increase in initiative spending and advertising. Average loans and acceptances, including securitized loans, increased $1.5 billion or 1.1% from the third quarter, while personal and commercial deposits remained stable. Fiscal 2008 vs Fiscal 2007
P&C Canada net income increased $53 million or 4.1%, but increased $105 million or 8.6% adjusted for the $52 million effect in 2007 of: the $6 million impact of the three items discussed above, a separate $14 million recovery of prior years’ income taxes recorded in the third quarter of 2007, a $26 million ($23 million after tax) insurance gain and a $14 million ($9 million after tax) investment security gain.

BMO Financial Group Fourth Quarter Report 2008 • 23
Revenue increased $293 million or 6.2%, but increased $255 million or 5.4% adjusted for last year’s unusual items. Revenue growth was driven by volume growth across most products, positive mix, one more calendar day, higher revenues included in trading non-interest revenue from securitization activities and higher cards revenue. These factors were partially offset by higher cost of funds, investment securities losses, higher insurance claims and lower mortgage refinancing fees. Net interest margin improved 1 basis point from last year as the effect
of better volumes in more profitable products was largely offset by increased funding costs. Non-interest expense increased $146 million or 5.5% primarily due to initiatives spending including expansion and renovation of the branch network and credit and debit card chip technology, as well as higher operating and Moneris costs.
Personal and Commercial Banking U.S. (P&C U.S.)
(Canadian $ in millions, except as noted) Q4-2008
Increase (Decrease)
vs. Q4-2007
Increase (Decrease)
vs. Q3-2008 Fiscal-2008
Increase (Decrease)
vs. Fiscal-2007
Net interest income (teb) 212 40 23% 15 8% 748 18 3%Non-interest revenue 58 12 25% 6 12% 242 64 36%
Total revenue (teb) 270 52 24% 21 9% 990 82 9%Provision for credit losses 12 4 52% - - 43 8 23%Non-interest expense 243 82 52% 49 25% 802 109 16%
Income before income taxes and non-controlling interest in subsidiaries 15 (34) (70%) (28)
(66%)
145 (35) (19%)
Income taxes (teb) 3 (13) (85%) (12) (82%) 49 (15) (23%)Non-controlling interest in subsidiaries - - - - - - - -
Net income 12 (21) (63%) (16) (57%) 96 (20) (17%)
Amortization of intangible assets (after tax) 8 3 nm (1) nm 28 3 nm
Cash net income 20 (18) (48%) (17) (44%) 124 (17) (12%)
Operating leverage (27.7%) nm nm (6.7%) nmCash operating leverage (28.6%) nm nm (7.0%) nmProductivity ratio (teb) 89.8% 16.4% 11.7% 81.0% 4.7%Cash productivity ratio (teb) 86.2% 16.2% 11.7% 77.5% 4.7%Net interest margin on earning assets (teb) 3.00% (0.34%) (0.11%) 3.00% (0.37%)Average earning assets 28,114 7,674 38% 2,651 10% 24,913 3,255 15%
U.S. Select Financial Data (US$ in millions)
Net interest income (teb) 191 18 11% (4) (2%) 724 55 8%Non-interest revenue 52 5 11% 1 1% 235 71 43%
Total revenue (teb) 243 23 11% (3) (1%) 959 126 15%Non-interest expense 217 57 36% 25 13% 773 139 22%Net income 11 (22) (66%) (17) (60%) 95 (12) (11%)Average earning assets 25,313 4,840 24% 157 1% 24,103 4,248 21%
nm – not meaningful
Q4 2008 vs Q4 2007
Net income decreased $21 million to $12 million. On a U.S. dollar basis, net income fell $22 million to $11 million. As expected, integration costs were higher than in the comparable period, at US$15 million, but lower than our estimate of US$16 to US$18 million. Excluding the after-tax impact of integration costs in both periods and an additional Visa litigation reserve, net income was US$24 million, down US$9 million from a year ago. Net income was also affected by the US$7 million impact of the credit market environment on revenues and expenses. Revenue rose US$23 million or 11% primarily due to the US$18 million impact of the Wisconsin acquisitions. Net interest margin decreased by 34 basis points, of which 22 basis points related to a portfolio transfer in the first quarter. Net interest margin was also affected by higher levels of non-performing loans, which reduced revenue by US$5 million, and the effects of product mix. Non-interest expense increased US$57 million or 36%. The increase was attributable to the operating and integration costs of acquisitions (US$30 million), the Visa litigation charge (US$7
million), increased costs in the weaker credit environment (US$6 million) and business expansion (US$6 million), including previously committed new branches and costs to support business volume growth (US$8 million). Cash operating leverage was -28.6%.
Q4 2008 vs Q3 2008
Net income decreased $16 million. On a U.S. dollar basis, net income fell $17 million. Excluding integration costs in both periods, net income decreased US$9 million. Revenue decreased US$3 million or 1.3% due to lower net interest margin that fell 11 basis points due to the impact of non-performing loans, which reduced revenue by US$2 million, and changes in product mix. Non-interest expense rose US$25 million or 13% due largely to the US$12 million increase in integration costs, the Visa litigation charge and US$4 million of increased costs of managing in the weaker credit environment.

24 • BMO Financial Group Fourth Quarter Report 2008
Our Retail Net Promoter Score, a measure of the strength of customer loyalty, was unchanged from the third quarter at 42, but improved from 41 a year ago.
Fiscal 2008 vs Fiscal 2007
Net income of $96 million decreased $20 million. On a U.S. dollar basis, net income fell $12 million or 11%. Results included a US$9 million after-tax gain on the sale of a portion of our investment in Visa, net of related litigation reserves, and US$22 million after tax related to higher levels of non-performing loans and related credit market costs. Revenue increased US$126 million or 15%. The increase was attributable to the US$38 million gain on the Visa transaction, the US$51 million impact of acquisitions, and core revenue improvement of US$37 million including volume growth, deposit spread improvement and increases in fee and other non-interest revenue. Net interest margin fell by 37 basis points due to the 22 basis point impact of the portfolio transfer, higher levels of non-
performing loans and the highly competitive environment. The overall decline was mitigated by pricing actions in certain loan and deposit categories. Non-interest expense rose US$139 million or 22% due to the US$24 million Visa litigation reserve and the US$55 million impact of operating and integration costs of acquired businesses. The remaining increase reflects our continued targeted business investment including previously-committed new branches, sales force expansion and advertising, increased costs of managing in the difficult credit market environment and costs associated with higher business volumes. These factors were partially offset by the impact of our expense management initiatives.
Private Client Group (PCG)
(Canadian $ in millions, except as noted) Q4-2008
Increase (Decrease)
vs. Q4-2007
Increase (Decrease)
vs. Q3-2008 Fiscal-2008
Increase (Decrease)
vs. Fiscal-2007
Net interest income (teb) 184 30 19% 17 11% 671 59 9%Non-interest revenue 310 (44) (13%) (67) (18%) 1,396 (44) (3%)
Total revenue (teb) 494 (14) (3%) (50) (9%) 2,067 15 1%Provision for credit losses 1 - - - - 4 1 32%Non-interest expense 381 25 7% 1 - 1,477 31 2%
Income before income taxes 112 (39) (26%) (51) (31%) 586 (17) (3%)Income taxes (teb) 34 (14) (30%) (19) (34%) 191 (17) (9%)
Net income 78 (25) (25%) (32) (30%) 395 - -
Amortization of intangible assets (after tax) 1 - - - - 4 - -
Cash net income 79 (25) (25%) (32) (30%) 399 - -
Return on equity 27.5% (7.2%) (12.1%) 36.4% 2.4%Cash return on equity 27.8% (7.2%) (12.1%) 36.7% 2.4%Operating leverage (9.9%) nm nm (1.5%) nmCash operating leverage (9.9%) nm nm (1.6%) nmProductivity ratio (teb) 77.0% 7.1% 7.1% 71.5% 1.1%Cash productivity ratio (teb) 76.8% 7.2% 7.1% 71.2% 1.0%Net interest margin on earning assets (teb) 9.17% 0.05% 0.30% 8.98% (0.68%)Average earning assets 8,013 1,243 18% 520 7% 7,474 1,122 18%
U.S. Select Financial Data (US$ in millions) Total revenue (teb) 34 (28) (45%) (28) (46%) 217 (26) (11%)Non-interest expense 60 (6) (11%) 2 2% 230 (13) (6%)Net income (15) (12) (+100%) (18) (+100%) (6) (6) (+100%)Cash net income (15) (13) (+100%) (18) (+100%) (5) (7) (+100%)Average earning assets 2,211 164 8% 77 4% 2,142 197 10%
nm – not meaningful
Q4 2008 vs Q4 2007
Net income decreased $25 million or 25% to $78 million, and $6 million or 6.9% excluding the impact of charges associated with actions taken to support U.S. clients in the weak capital markets environment. Revenue decreased $14 million or 3.1%, but increased $17 million or 2.9% excluding the impact of the above charges. The stronger U.S. dollar increased revenues by $3 million or 0.5 percentage points relative to a year ago. Net interest income increased primarily due to higher deposit balances in the brokerage businesses and term investment products. Higher loans and deposits in North American Private Banking also
contributed to the growth. Non-interest revenue decreased primarily due to lower commission revenue in Full-Service Investing and lower mutual fund revenue. The effect of strong growth in transaction volume in BMO InvestorLine was largely offset by pricing changes resulting from competitive pricing pressures in the industry. The implementation of a fixed administration fee by BMO Mutual Funds in the first quarter of 2008 contributed to non-interest revenue growth. Non-interest expense increased $25 million or 6.8%, primarily due to the impact of the fixed administration fee and the expansion of the sales force, partially offset by lower revenue-based costs. The stronger U.S. dollar increased expenses by $7

BMO Financial Group Fourth Quarter Report 2008 • 25
million or 1.9 percentage points relative to a year ago. Cash operating leverage was -9.9% or -3.9% excluding the impact of the above-mentioned charges. The Group’s $275 billion of assets under management and administration and term deposits were significantly impacted by the market conditions. They decreased $8.4 billion or 3.0% year over year, despite the benefit of growth of $19 billion or 6.7% related to the stronger U.S. dollar.
Q4 2008 vs Q3 2008
Net income decreased $32 million or 30%, and $13 million or 13% excluding the charges outlined above. Revenue decreased $50 million or 9.1%, and $19 million or 3.5% excluding the impact of the charges. The reduction was primarily due to lower commission revenue in Full-Service Investing and lower fee-based revenue on lower client assets. This was partially offset by the effects of higher spread and balances in term investment products. Market conditions were difficult in the quarter and the Group’s total assets decreased $11 billion or 3.8%, despite the benefit of $13 billion or 4.5% growth related to the stronger U.S. dollar. Non-interest expense was relatively unchanged from the prior quarter as lower revenue-based costs were offset by increased investment spending. Fiscal 2008 vs Fiscal 2007
Net income of $395 million matched the record results of 2007, and increased $19 million or 4.7% excluding the impact of the charges taken in the current quarter.
Revenue increased $15 million or 0.6%, and $46 million or 2.1% excluding the impact of the charges. The weaker U.S. dollar lowered revenue growth by $19 million or 0.9 percentage points. Market conditions were softer and results in the prior year included a $7 million gain on the sale of Montreal Stock Exchange common shares. Net interest income increased primarily due to higher deposit balances in the brokerage businesses and in term investment products. Non-interest revenue, adjusted for the charges, the prior year gain and the weaker U.S. dollar, improved slightly due to higher trust and investment revenue in North American Private Banking and the fixed administration fee in BMO Mutual Funds. These effects were largely offset by lower commission revenue in the brokerage businesses.
Non-interest expense increased $31 million or 2.1%. The weaker U.S. dollar lowered expense growth by $12 million or 0.9 percentage points. Increased expenses were primarily attributable to the impact of the fixed administration fee, partially offset by lower revenue-based costs in line with lower revenue. The group continues to focus on expense management in the current market environment, balanced with investment in the sales force and supporting technology to drive future revenue growth.
Cash operating leverage was -1.6%.
BMO Capital Markets (BMO CM)
(Canadian $ in millions, except as noted) Q4-2008
Increase (Decrease)
vs. Q4-2007
Increase (Decrease)
vs. Q3-2008 Fiscal-2008
Increase (Decrease)
vs. Fiscal-2007
Net interest income (teb) 355 122 53% 68 24% 1,179 205 21%Non-interest revenue 360 172 92% (99) (21%) 1,233 238 24%
Total revenue (teb) 715 294 70% (31) (4%) 2,412 443 23%Provision for credit losses 30 11 65% 1 5% 117 40 52%Non-interest expense 451 52 13% (26) (5%) 1,752 178 11%
Income (loss) before income taxes 234 231 +100% (6) (2%) 543 225 71%Income taxes (recovery) (teb) (51) (8) (19%) (32) (+100%) (149) (50) (50%)
Net income 285 239 +100% 26 10% 692 275 66%
Amortization of intangible assets (after tax) 1 1 100% 1 100% 1 - -
Cash net income 286 240 +100% 27 10% 693 275 66%
Trading Products revenue 228 230 +100% (162) (42%) 993 712 +100%Investment and Corporate Banking and Other revenue 487 64 15% 131 37% 1,419 (269) (16%)Return on equity 20.2% 17.4% 1.7% 12.2% 4.5%Cash return on equity 20.3% 17.4% 1.8% 12.2% 4.5%Operating leverage 57.1% nm nm 11.2% nmCash operating leverage 57.1% nm nm 11.2% nmProductivity ratio (teb) 63.1% (31.9%) (0.9%) 72.6% (7.3%)Cash productivity ratio (teb) 63.0% (31.9%) (1.0%) 72.6% (7.3%)Net interest margin on earning assets (teb) 0.81% 0.29% 0.14% 0.67% 0.07%Average earning assets 173,820 (4,280) (2%) 4,410 3% 176,080 13,771 8%
U.S. Select Financial Data (US$ in millions)
Total revenue (teb) 335 (22) (6%) 38 12% 1,173 683 +100%Non-interest expense 165 (25) (14%) (32) (17%) 721 86 14%Net income 100 (14) (13%) 41 69% 279 324 +100%Average earning assets 65,069 (723) (1%) (1,899) (3%) 69,411 16,173 30%
nm – not meaningful
26 • BMO Financial Group Fourth Quarter Report 2008
Q4 2008 vs Q4 2007
Net income was $285 million, up $239 million from a year ago. Revenue rose $294 million to $715 million. Certain charges discussed below lowered revenue in the current period by $14 million and in the fourth quarter a year ago by $342 million. There was significantly higher trading revenue and continued strong performance in our interest-rate-sensitive businesses, the effects of which were partially offset by net securities losses, lower underwriting revenue, and lower merger and acquisition fees. Results included charges in respect of the capital markets environment, totalling $14 million ($8 million after tax) in the current quarter and $318 million ($211 million after tax) a year ago. See the preceding Effects of the Capital Markets Environment on Fourth Quarter Results section for more details of charges affecting the current quarter and the following Notable Items section for details of charges affecting results a year ago. Trading Products revenue increased significantly, rising $230 million from a prior-year net loss of $2 million due to improved trading revenues and continued strength in our interest-rate-sensitive businesses, partially offset by net securities losses. There has been continued volatility in our trading businesses; however, management remains focused on reducing the volatility of the group’s results. Investment and Corporate Banking and Other revenue increased by $64 million or 15% in large part due to increased trading revenues from mark-to-market gains on credit default swaps used to hedge our loan portfolio. This was partially offset by reductions in merger and acquisition fees, debt and equity underwriting fees and securities gains, which are reflective of the difficult market environment. Net interest income rose from a year ago due to higher revenues from our interest-rate-sensitive businesses and higher trading net interest income. Trading net interest income consists of interest earned on trading assets less the costs of funding the assets. Net interest margin improved 29 basis points from the prior year due to higher trading spreads and higher spreads in our interest-rate-sensitive businesses. As explained in note 5 to the attached financial statements, during the quarter, the CICA amended accounting and reporting rules on transfers of financial instruments. Since we intend to hold certain securities impacted by current market issues for the foreseeable future rather than trading them in the short term, we elected to transfer the securities from our trading portfolio to our available-for-sale portfolio. This aligns well with our previously-stated strategy of reducing the volatility of our group’s results and as a result of the transfer, the charges for mark-to-market valuations of $183 million ($123 million after tax) were recorded in BMO’s other comprehensive income rather than trading revenue in BMO Capital Markets. Non-interest expense increased $52 million or 13%, mainly due to higher employee costs, primarily higher variable compensation as a result of improved revenue performance. The Group’s cash operating leverage was 57.1%. Results for the quarter were raised by the group’s $52 million share of BMO’s recovery of prior-period income taxes and by higher tax-exempt income.
Q4 2008 vs Q3 2008
Net income increased $26 million or 10%. Results in the third quarter were lowered by the net $33 million impact of: capital markets environment charges of $96 million after tax, a severance charge of $19 million after tax and the group’s $82 million share of a recovery of prior-period income taxes. See the following Notable Items section for details. Revenue declined $31 million or 4.0%. The capital markets environment charges lowered third quarter revenues by $134 million. There were increased net securities losses and reductions in debt and equity underwriting fees and lending fees. Merger and acquisition fees improved considerably notwithstanding the difficult environment. Non-interest expense was $26 million or 5.4% lower, primarily due to the $28 million charge for severance costs in the prior quarter.
Fiscal 2008 vs Fiscal 2007 Net income increased $275 million or 66%. Results in 2008 were affected by charges of $594 million ($400 million after tax) related to deterioration in capital markets. Results in 2007 were affected by charges of $1,171 million ($651 million after tax) comprised of the net impact of $318 million ($211 million after tax) of charges related to the capital markets environment and $853 million of losses in our commodities business ($440 million after tax and associated performance-based compensation). Revenue rose $443 million or 23%. The preceding charges lowered 2008 revenues by $594 million and 2007 revenues by $1,171 million. There was very favourable performance in our interest-rate-sensitive businesses and improved trading revenues in our interest rate and foreign exchange trading businesses. There were net securities losses compared to net securities gains a year ago and lower lending revenue including decreased collections on impaired loans. There were also large reductions in merger and acquisition and equity underwriting fees from record levels in the prior year. Non-interest expense was $178 million or 11% higher, due to increased employee-based costs, including performance-based compensation and charges for severance, and higher allocated costs. Results for the year were raised by recoveries of prior-period income taxes, which were $119 million higher than in 2007.

BMO Financial Group Fourth Quarter Report 2008 • 27
Corporate Services, Including Technology and Operations
(Canadian $ in millions, except as noted) Q4-2008
Increase (Decrease)
vs. Q4-2007
Increase (Decrease)
vs. Q3-2008 Fiscal-2008
Increase (Decrease)
vs. Fiscal-2007
Net interest income (teb) (173) (40) (28%) 14 8% (747) (208) (39%)Non-interest revenue 191 119 +100% 88 83% 446 231 +100%
Total revenue (teb) 18 79 +100% 102 +100% (301) 23 7%Provision for credit losses 333 291 +100% (22) (7%) 825 910 +100%Non-interest expense 23 (2) (9%) 2 10% 81 (4) (5%)Restructuring charge (8) (32) (+100%) (8) (100%) (8) (167) (+100%)
Total non-interest expense 15 (34) (70%) (6) (28%) 73 (171) (70%)Income (loss) before income taxes and non-controlling interest in subsidiaries (330) (178) (+100%) 130 28% (1,199) (716) (+100%)Income taxes (recovery) (teb) (190) (36) (22%) 69 27% (748) (254) (52%)Non-controlling interest in subsidiaries 19 - - 1 2% 74 (1) (2%)
Net income (loss) (159) (142) (+100%) 60 28% (525) (461) (+100%)
U.S. Select Financial Data (US$ in millions) Total revenue (teb) (10) 27 76% 25 77% (144) (2) (2%)Provision for credit losses 209 165 +100% (203) (49%) 783 766 +100%Non-interest expense (21) (13) (+100%) (1) (5%) (66) (49) (+100%)Restructuring charge (2) (10) (+100%) (2) (100%) (2) (28) (+100%)
Total non-interest expense (23) (23) (+100%) (3) (9%) (68) (77) (+100%)Income taxes (recovery) (teb) (71) (37) (+100%) 81 53% (327) (246) (+100%)Net income (loss) (129) (78) (+100%) 151 54% (550) (445) (+100%)
Corporate Services
Corporate Services includes the corporate units that provide expertise and governance support to BMO Financial Group in areas such as strategic planning, law, finance, internal audit, risk management, corporate communications, corporate marketing, human resources and learning. Operating results include revenues and expenses associated with certain securitization activities, the hedging of foreign-source earnings, and activities related to the management of certain balance sheet positions and BMO’s overall asset-liability structure. Corporate Services is generally charged (or credited) with differences between the periodic provisions for credit losses charged to the client groups under our expected loss provisioning methodology and the required periodic provisions charged by the consolidated organization under GAAP.
Technology and Operations
Technology and Operations (T&O) manages, maintains and provides governance over information technology, operations services, real estate and sourcing for BMO Financial Group. T&O focuses on enterprise-wide priorities that improve service quality and efficiency to deliver an excellent customer experience.
Financial Performance Review
Technology and Operations operating results are included with Corporate Services for reporting purposes. Costs of T&O’s services are transferred to the client groups (P&C, PCG and BMO Capital Markets) and only relatively minor amounts are retained within T&O. As such, results in this section largely reflect the other corporate units outlined above. There was a net loss of $159 million in the quarter compared with a net loss of $17 million a year ago, primarily due to high provisions for credit losses. Results include Corporate Services’ $21 million share of BMO’s recovery of prior-period income taxes. Under BMO’s expected loss provisioning methodology, expected losses are charged to the operating groups and the balance of charges for required losses under GAAP are charged to Corporate Services. The net loss for the quarter decreased $60 million from the third quarter, primarily due to a $102 million increase in revenue due to mark-to-market gains on hedging activities and a larger gain on credit card securitizations. Results in the current quarter included a $150 million ($98 million after tax) increase in the general allowance while results in the third quarter included a $50 million increase ($33 million after tax). The overall charge for credit losses was reduced due to high specific provisions in the third quarter. The net loss for fiscal 2008 was $525 million, compared with a net loss of $64 million a year ago. The increase was driven primarily by higher provisions for credit losses, including a $260 million ($166 million after tax) increase in the general allowance, compared with a $50 million increase ($33 million after tax) in the prior year. Revenues were $23 million higher, primarily due to mark-to-market gains on hedging activities and securitization-related revenues partially offset by higher net funding costs. Expenses were $4 million lower than a year ago, excluding the impact of the restructuring charges of $159 million last year and an $8 million recovery of the restructuring charge in the current year.

28 • BMO Financial Group Fourth Quarter Report 2008
Notable items (Canadian $ in millions, except as noted) Q4-2008 Q3-2008 Q4-2007 Fiscal-2008 Fiscal-2007
Restructuring charge - - 24 - 159Related income taxes - - 9 - 56
Net impact of restructuring (a) (note 1) - - 15 - 103
Commodities losses (note 2) - - 24 - 853Performance – based compensation - - - - (120)Related income taxes - - 8 - 293
Net impact of commodities losses (b) (note 2) - - 16 - 440
Charges related to deterioration in capital markets environment 45 134 318 625 318Related income taxes 18 38 107 206 107
Net impact of charges related to capital markets environment (c) 27 96 211 419 211
Increase in general allowance 150 50 50 260 50Related income taxes 52 20 17 94 17
Net impact of increase in general allowance (d) 98 30 33 166 33
Net impact of notable items (a+b+c+d) 125 126 275 585 787
Note 1: Restructuring charge recoveries were $8 million ($5 million after tax) in Q4 2008 and for the year. Note 2: Commodities gains were $25 million ($17 million after tax) in Q4 2008; losses were $15 million ($10 million after tax) in Q3 2008 and $20 million ($13 million after tax) for
the year.
Notable Items Q4 2008
Charges related to the capital markets environment in the fourth quarter are detailed in the Effects of the Capital Markets Environment on Fourth Quarter Results section. Results also reflected a $150 million ($98 million after tax) increase in the general allowance for credit losses.
Q3 2008
BMO’s results in the third quarter were affected by capital markets environment charges of $134 million ($96 million after tax), or $0.19 per share in respect of: • a charge of $88 million ($65 million after tax) including:
o a charge of $58 million ($39 million after tax) for mark-to-market valuations on counterparty credit exposures on derivative contracts largely as a result of corporate counterparty credit spreads widening relative to BMO’s;
o a charge of $55 million ($43 million after tax) for other than temporary impairments and valuation adjustments on preferred shares held in our trading portfolio;
o a recovery of $25 million ($17 million after tax) for other trading and structured-credit related positions;
• a $28 million ($19 million after tax) impairment charge for asset-backed commercial paper held that is subject to the Montreal Accord;
• a net charge of $15 million ($10 million after tax) related to Apex; and
• a $3 million ($2 million after tax) charge for our capital notes investment in SIVs.
Results also reflected a $50 million ($30 million after tax) increase in the general allowance for credit losses. The capital markets environment charges of $134 million above were all reflected in non-interest revenue with $61 million in securities gains (losses) other than trading, $76 million in trading non-interest revenue and a recovery of $3 million in other revenue.
Q2 2008
BMO’s results in the second quarter included a net benefit of $42 million ($28 million after tax) in respect of charges/recoveries related to the capital markets environment. The charges/recoveries consisted of:
• a net recovery of $26 million ($18 million after tax) in respect of: o a mark-to-market recovery of $85 million ($57 million
after tax) for Apex/Sitka Trust in recognition during the quarter of the increased likelihood of a successful restructuring;
o a mark-to-market charge of $36 million ($24 million after tax) for our holdings of commercial paper of third-party Canadian conduits affected by the Montreal Accord;
o a charge of $23 million ($15 million after tax) for the capital notes in the Links and Parkland SIVs;
• a recovery of $35 million ($24 million after tax) for items impacted by credit spreads, specifically mark-to-market adjustments, consisting of a benefit of $128 million ($86 million after tax) for mark-to-market gains on counterparty credit exposures on derivatives contracts as BMO’s credit spreads moved out relative to various counterparties; less a charge of $93 million ($62 million after tax) for other trading and structured-credit related positions; and
• a charge of $19 million ($14 million after tax) related to four smaller items, each with a net income impact of $10 million or less and including mark-to-market charges on our preferred share trading portfolio and monoline exposures.
The net benefit of $42 million above was reflected in trading non-interest revenue ($71 million), other revenue ($6 million) and securities gains/losses other than trading (-$35 million).

BMO Financial Group Fourth Quarter Report 2008 • 29
Q1 2008
In the first quarter of 2008, BMO recorded $548 million ($362 million after tax and $0.72 per share) of charges for certain trading activities and valuation adjustments and an increase in the general allowance for credit losses. They included $488 million ($324 million after tax) in BMO Capital Markets in respect of: losses on exiting positions related to monoline insurer ACA Financial Guarantee Corporation ($158 million); trading and structured-credit related positions, preferred shares, third party Canadian conduits and other mark-to-market losses ($177 million); investments in Apex ($130 million); and capital notes in the Links and Parkland SIVs ($23 million). BMO has no further exposure to ACA. Reduced performance-based compensation associated with the charges was not included in the determination of the impact of significant items. The $177 million charge above was primarily due to the impact of widening credit spreads on a number of our trading portfolios. The charge was comprised of a number of items, the largest of which was $78 million for counterparty credit risk on our derivatives, with approximately half related to monoline insurers (other than ACA) and similar credit derivative product companies. The $488 million charge included reductions in trading non-interest revenue ($420 million), investment securities gains ($23 million) and other income ($45 million). Corporate Services results included a $60 million ($38 million after tax) increase in the general allowance for credit losses to reflect portfolio growth and risk migration.
Q4 2007
In the fourth quarter of 2007, net income was reduced by $275 million after tax ($0.55 per share) of notable items. They included $318 million ($211 million after tax) of charges for certain trading activities and valuation adjustments related to deterioration in capital markets, $16 million after tax in respect of commodities losses, $33 million after tax as a result of an increase in the general allowance and the $15 million after-tax impact of a restructuring charge. The charges included $169 million in respect of trading and structured-credit related positions and preferred shares; $134 million related to Canadian asset-backed commercial paper (ABCP); and $15 million related to capital notes in the Links Finance Corporation (Links) and Parkland Finance Corporation (Parkland) structured investment vehicles (SIVs). The Canadian ABCP charges reflect $80 million for our investment in commercial paper issued by one of our BMO-sponsored conduits, and $54 million for our investment in commercial paper issued by non-bank sponsored conduits.
Fiscal 2008
Notable items in 2008 are detailed above.
Fiscal 2007
Net income for fiscal 2007 was reduced by $787 million of notable items. They included $440 million after tax in respect of commodities losses of $853 million net of $120 million of reduced performance-based compensation. They also included $318 million ($211 million after tax) in respect of charges related to the capital markets environment, the $103 million after-tax impact of a $159 million restructuring charge and an increase in the general allowance of $33 million after tax.

30 • BMO Financial Group Fourth Quarter Report 2008
GAAP and Related Non-GAAP Measures used in the MD&A (Canadian $ in millions, except as noted) Q4-2008 Q3-2008 Q4-2007 Fiscal-2008 Fiscal-2007
Total non-interest expense (a) 1,818 1,782 1,655 6,894 6,601Amortization of intangible assets (11) (11) (11) (42) (46)
Cash-based non-interest expense (b) (note 1) 1,807 1,771 1,644 6,852 6,555
Net income 560 521 452 1,978 2,131Amortization of intangible assets, net of income taxes 10 9 9 35 38
Cash net income (note 1) 570 530 461 2,013 2,169Preferred share dividends (25) (19) (12) (73) (43)Charge for capital (note 1) (400) (389) (378) (1,535) (1,523)
Net economic profit (note 1) 145 122 71 405 603
Revenue (c) 2,813 2,746 2,200 10,205 9,349Revenue growth (%) (d) 27.9 7.5 (10.6) 9.2 (6.4)Productivity ratio (%) ((a/c) x 100) 64.6 64.9 75.2 67.6 70.6Cash productivity ratio (%) ((b/c) x 100) (note 1) 64.2 64.5 74.7 67.1 70.1Non-interest expense growth (%) (e) 9.9 7.4 2.6 4.4 3.9Cash-based Non-expense growth (%) (f) (note 1) 9.9 7.5 2.6 4.5 3.9Operating leverage (%) (d-e) 18.0 0.1 (13.2) 4.8 (10.3)Cash Operating leverage (%) (d-f) (note 1) 18.0 - (13.2) 4.7 (10.3)EPS (uses net income) ($) 1.06 0.98 0.87 3.76 4.11Cash EPS (note 1) (uses cash net income) ($) 1.08 1.00 0.89 3.83 4.18 Note 1: These are non-GAAP amounts or non-GAAP measures.
Non-GAAP Measures
BMO uses both GAAP and certain non-GAAP measures to assess performance. Securities regulators require that companies caution readers that earnings and other measures adjusted to a basis other than GAAP do not have standardized meanings under GAAP and are unlikely to be comparable to similar measures used by other companies. The above table reconciles the non-GAAP measures, which management regularly monitors, to their GAAP counterparts. Management sometimes discloses amounts on a basis that adjusts for certain significant items. Amounts and measures stated on a basis that excludes the significant items are considered useful as they would be expected to be more reflective of ongoing operating results. Since such charges tend to be irregular and vary in magnitude, adjusting for them is helpful in assessing quarterly trends in results. This quarter, we have chosen to discontinue categorizing certain capital markets related items as significant and highlighting results on a basis that excludes such items as they have been incurred for longer than we expected when we began to categorize such charges as significant items. Similarly, we have discontinued categorizing changes in the general allowance for credit losses as significant items and stating results on a basis that excludes those charges as changes in the general allowance have become more frequent in recent periods. At times, we indicate certain measures excluding the effects of items but generally do so in conjunction with disclosure of the nearest GAAP measure and provide detail of the reconciling item. To assist readers, this quarter we have also provided a schedule that summarizes notable items that have affected results in the reporting periods. Cash earnings, cash productivity and cash operating leverage measures may enhance comparisons between periods when
there has been an acquisition, particularly because the purchase decision may not consider the amortization of intangible assets to be a relevant expense. Cash EPS measures are also disclosed because analysts often focus on this measure, and cash EPS is used by Thomson First Call to track third-party earnings estimates that are frequently reported in the media. Cash measures add the after-tax amortization of intangible assets to GAAP earnings to derive cash net income (and associated cash EPS) and deduct the amortization of intangible assets from non-interest expense to derive cash productivity and cash operating leverage measures. BMO analyzes consolidated revenues on a GAAP basis. However, like many banks, BMO analyzes revenue of its operating groups, and ratios of the groups computed using revenue, on a taxable equivalent basis (teb). This basis includes an adjustment that increases GAAP revenues and the GAAP provision for income taxes by an amount that would raise revenues on certain tax-exempt securities to a level equivalent to amounts that would incur tax at the statutory rate. The effective income tax rate is also analyzed on a taxable equivalent basis for consistency of approach. The offset to the group teb adjustments is reflected in Corporate Services. Analysis on a taxable equivalent basis neutralizes the impact on ratios of investing in tax-exempt or tax-advantaged securities rather than fully-taxable securities with higher yields. It reduces distortions in ratios between periods and between institutions related to the choice of tax-advantaged and taxable investments. In this MD&A, all revenues and tax amounts and related ratios of our operating groups are stated on a taxable equivalent basis, unless indicated otherwise. Net economic profit represents cash net income available to common shareholders, less a charge for capital, and is considered an effective measure of economic value added.

BMO Financial Group Fourth Quarter Report 2008 • 31
Interim Consolidated Financial Statements
Consolidated Statement of Income
(Unaudited) (Canadian $ in millions, except as noted) For the three months ended For the twelve months ended
October 31, 2008
July 31,
2008
April 30,
2008
January 31,
2008
October 31,
2007
October 31,2008
October 31,
2007
Interest, Dividend and Fee Income Loans $ 2,554 $ 2,467 $ 2,609 $ 2,984 $ 2,971 $ 10,614 $ 11,557 Securities 748 705 805 948 910 3,206 3,153 Deposits with banks 182 203 230 315 387 930 1,128
3,484 3,375 3,644 4,247 4,268 14,750 15,838
Interest Expense Deposits 1,590 1,612 1,842 2,297 2,328 7,341 7,905 Subordinated debt 61 61 51 49 51 222 180 Capital trust securities and preferred shares 23 22 23 23 24 91 99 Other liabilities 397 394 554 664 669 2,009 2,811
2,071 2,089 2,470 3,033 3,072 9,663 10,995
Net Interest Income 1,413 1,286 1,174 1,214 1,196 5,087 4,843 Provision for credit losses (Note 2) 465 484 151 230 151 1,330 353
Net Interest Income After Provision for Credit Losses 948 802 1,023 984 1,045 3,757 4,490 Non-Interest Revenue Securities commissions and fees 270 294 270 271 265 1,105 1,145 Deposit and payment service charges 203 190 181 182 183 756 728 Trading revenues (losses) 435 220 192 (301) (165) 546 (487) Lending fees 120 116 101 92 105 429 406 Card fees 58 88 78 67 (105) 291 107 Investment management and custodial fees 87 86 85 81 83 339 322 Mutual fund revenues 140 151 144 154 148 589 576 Securitization revenues 167 133 133 80 61 513 296 Underwriting and advisory fees 66 97 98 92 103 353 528 Securities gains (losses), other than trading (252) (75) 14 (2) 148 (315) 246 Foreign exchange, other than trading (4) 25 30 29 48 80 132 Insurance income 52 56 52 62 52 222 230 Other 58 79 68 5 78 210 277
1,400 1,460 1,446 812 1,004 5,118 4,506
Net Interest Income and Non-Interest Revenue 2,348 2,262 2,469 1,796 2,049 8,875 8,996
Non-Interest Expense Employee compensation (Note 8) 1,007 1,044 980 945 901 3,976 3,825 Premises and equipment 375 346 335 326 350 1,382 1,303 Amortization of intangible assets 11 11 10 10 11 42 46 Travel and business development 95 87 74 72 92 328 287 Communications 57 50 53 42 36 202 149 Business and capital taxes 11 20 (1) 12 6 42 47 Professional fees 113 102 90 79 108 384 301 Other 157 122 139 128 127 546 484
1,826 1,782 1,680 1,614 1,631 6,902 6,442
Restructuring Charge (Reversal) (Note 9) (8) - - - 24 (8) 159
Income Before Provision for (Recovery of) Income Taxes and Non-Controlling Interest in Subsidiaries 530 480 789 182 394 1,981 2,395 Income taxes (49) (59) 128 (91) (77) (71) 189
579 539 661 273 471 2,052 2,206 Non-controlling interest in subsidiaries 19 18 19 18 19 74 75
Net Income $ 560 $ 521 $ 642 $ 255 $ 452 $ 1,978 $ 2,131
Preferred share dividends $ 25 $ 19 $ 14 $ 15 $ 12 $ 73 $ 43 Net income available to common shareholders $ 535 $ 502 $ 628 $ 240 $ 440 $ 1,905 $ 2,088 Average common shares (in thousands) 503,004 504,124 502,054 499,067 498,379 502,062 499,950 Average diluted common shares (in thousands) 506,591 508,032 506,638 505,572 506,173 506,697 508,614
Earnings Per Share (Canadian $) Basic $ 1.06 $ 1.00 $ 1.25 $ 0.48 $ 0.89 $ 3.79 $ 4.18 Diluted 1.06 0.98 1.25 0.47 0.87 3.76 4.11 Dividends Declared Per Common Share 0.70 0.70 0.70 0.70 0.70 2.80 2.71
The accompanying notes are an integral part of these interim consolidated financial statements.

32 • BMO Financial Group Fourth Quarter Report 2008
Interim Consolidated Financial Statements
Consolidated Balance Sheet
(Unaudited) (Canadian $ in millions) As at
October 31,2008
July 31,
2008
April 30,
2008
January 31,
2008
October 31,
2007
Assets Cash Resources $ 21,105 $ 22,054 $ 22,237 $ 26,122 $ 22,890
Securities Trading 66,032 63,628 64,443 63,377 70,773 Available-for-sale 32,115 23,426 22,453 24,341 26,010 Other 1,991 1,821 1,774 1,747 1,494
100,138 88,875 88,670 89,465 98,277
Loans Residential mortgages 49,343 51,757 52,583 53,224 52,429 Consumer instalment and other personal 43,737 40,292 37,954 34,517 33,189 Credit cards 2,120 3,532 4,338 4,685 4,493 Businesses and governments 84,151 71,961 67,942 66,205 62,650 Securities borrowed or purchased under resale agreements 28,033 32,433 33,596 42,937 37,093
207,384 199,975 196,413 201,568 189,854 Customers’ liability under acceptances 9,358 9,834 10,345 11,590 12,389 Allowance for credit losses (Note 2) (1,747) (1,494) (1,336) (1,227) (1,055)
214,995 208,315 205,422 211,931 201,188
Other Assets Derivative instruments 65,586 43,167 44,557 36,857 32,585 Premises and equipment 2,227 2,051 2,024 1,977 1,980 Goodwill 1,635 1,449 1,398 1,189 1,140 Intangible assets 204 189 208 152 124 Other 10,160 8,947 10,642 9,132 8,340
79,812 55,803 58,829 49,307 44,169
Total Assets $ 416,050 $ 375,047 $ 375,158 $ 376,825 $ 366,524
Liabilities and Shareholders’ Equity Deposits
Banks $ 30,346 $ 29,988 $ 30,938 $ 34,991 $ 34,100 Businesses and governments 136,111 131,748 122,707 125,312 121,748 Individuals 91,213 86,921 84,935 82,608 76,202
257,670 248,657 238,580 242,911 232,050
Other Liabilities Derivative instruments 60,048 36,786 40,347 32,776 33,584 Acceptances 9,358 9,834 10,345 11,590 12,389 Securities sold but not yet purchased 18,792 17,415 20,053 28,393 25,039 Securities lent or sold under repurchase agreements 32,492 28,148 29,894 28,331 31,263 Other 14,071 11,650 13,940 12,478 12,055
134,761 103,833 114,579 113,568 114,330
Subordinated Debt (Note 10) 4,315 4,204 4,199 3,446 3,446
Capital Trust Securities 1,150 1,150 1,150 1,150 1,150
1
Preferred Share Liability (Note 11) 250 250 250 250 250
Shareholders’ Equity Share capital (Note 11) 6,454 6,458 6,114 5,648 5,607 Contributed surplus 69 68 67 65 58 Retained earnings 11,632 11,471 11,327 11,056 11,166 Accumulated other comprehensive loss (251) (1,044) (1,108) (1,269) (1,533)
17,904 16,953 16,400 15,500 15,298
Total Liabilities and Shareholders’ Equity $ 416,050 $ 375,047 $ 375,158 $ 376,825 $ 366,524
The accompanying notes are an integral part of these interim consolidated financial statements.

BMO Financial Group Fourth Quarter Report 2008 • 33
Interim Consolidated Financial Statements
Consolidated Statement of Comprehensive Income (Unaudited) (Canadian $ in millions) For the three months ended For the twelve months ended
October 31, 2008
October 31,
2007
October 31, 2008
October 31,
2007
Net income $ 560 $ 452 $ 1,978 $ 2,131 Other Comprehensive Income Net change in unrealized gains (losses) on available-for-sale securities (133) 87 (109) 32 Net change in unrealized gains (losses) on cash flow hedges 230 39 424 (115) Net gain (loss) on translation of net foreign operations 696 (447) 967 (613)
Total Comprehensive Income $ 1,353 $ 131 $ 3,260 $ 1,435
Consolidated Statement of Changes in Shareholders’ Equity
(Unaudited) (Canadian $ in millions) For the three months ended For the twelve months ended
October 31, 2008
October 31,
2007
October 31, 2008
October 31,
2007
Preferred Shares Balance at beginning of period $ 1,746 $ 946 $ 1,196 $ 596 Issued during the period (Note 11) - 250 550 600
Balance at End of Period 1,746 1,196 1,746 1,196
Common Shares Balance at beginning of period 4,712 4,372 4,411 4,231 Issued under the Shareholder Dividend Reinvestment and Share Purchase Plan 35 28 122 113 Issued under the Stock Option Plan 26 23 60 132 Issued on the exchange of shares of a subsidiary corporation - - - 1 Issued on the acquisition of a business (Note 7) - - 180 - Repurchased for cancellation (Note 11) - (12) - (66)
Balance at End of Period 4,773 4,411 4,773 4,411
Treasury Shares (Note 11) (65) - (65) -
Contributed Surplus Balance at beginning of period 68 56 58 49 Stock option expense 1 2 11 9
Balance at End of Period 69 58 69 58
Retained Earnings Balance at beginning of period 11,471 11,158 11,166 10,974 Cumulative impact of adopting new accounting requirements for financial instruments (net of income taxes of $39) - - - (71)Net income 560 452 1,978 2,131 Dividends – Preferred shares (25) (12) (73) (43)
– Common shares (355) (348) (1,410) (1,353)Common shares repurchased for cancellation (Note 11) - (79) - (458)Share issue expense - (5) (10) (14)Net discount on treasury shares (19) - (19) -
Balance at End of Period 11,632 11,166 11,632 11,166
Accumulated Other Comprehensive Income (Loss) on Available-for-Sale Securities Balance at beginning of period 59 (52) 35 - Impact of remeasuring available-for-sale securities to market value on November 1, 2006 (net of income taxes of $1) - - - 3 Unrealized gains (losses) on available-for-sale securities arising during the period (net of income taxes of $112, $41, $137 and $6) (226) 80 (280) 15 Reclassification to earnings of losses in the period (net of income taxes of $47, $4, $84 and $12) 93 7 171 17
Balance at End of Period (74) 35 (74) 35
Accumulated Other Comprehensive Income (Loss) on Cash Flow Hedges Balance at beginning of period 28 (205) (166) - Impact of adopting new cash flow hedge accounting rules on November 1, 2006 (net of income taxes of $28) - - - (51)Gains (losses) on cash flow hedges arising during the period (net of income taxes of $101, $15, $173 and $64) 222 28 363 (128)Reclassification to earnings of losses on cash flow hedges (net of income taxes of $6, $5, $31 and $6) 8 11 61 13
Balance at End of Period 258 (166) 258 (166)
Accumulated Other Comprehensive Loss on Translation of Net Foreign Operations Balance at beginning of period (1,131) (955) (1,402) (789)Unrealized gain (loss) on translation of net foreign operations 1,926 (1,196) 2,726 (1,697)Impact of hedging unrealized gain (loss) on translation of net foreign operations (net of income taxes of $628, $397, $881 and $575) (1,230) 749 (1,759) 1,084
Balance at End of Period (435) (1,402) (435) (1,402)
Total Accumulated Other Comprehensive Loss (251) (1,533) (251) (1,533)
Total Shareholders’ Equity $ 17,904 $ 15,298 $ 17,904 $ 15,298
The accompanying notes are an integral part of these interim consolidated financial statements.

34 • BMO Financial Group Fourth Quarter Report 2008
Interim Consolidated Financial Statements
Consolidated Statement of Cash Flows
(Unaudited) (Canadian $ in millions) For the three months ended For the twelve months ended
October 31,2008
October 31,
2007
October 31,2008
October 31,
2007
Cash Flows from Operating Activities Net income $ 560 $ 452 $ 1,978 $ 2,131 Adjustments to determine net cash flows provided by (used in) operating activities Write-down of securities, other than trading 189 18 324 18 Net loss (gain) on securities, other than trading 63 (166) (9) (264) Net (increase) decrease in trading securities (1,235) (5,986) 8,275 (23,028) Provision for credit losses 465 151 1,330 353 (Gain) on sale of securitized loans (Note 3) (132) (47) (420) (202) Change in derivative instruments – (Increase) in derivative asset (20,421) (3,861) (29,370) (4,991) Change in derivative instrument – Increase in derivative liability 19,174 4,927 20,645 5,807 Amortization of premises and equipment 102 99 393 390 Amortization of intangible assets 11 11 42 46 Net decrease in future income taxes (309) (36) (157) (176) Net increase (decrease) in current income taxes 554 (211) (314) (800) Change in accrued interest – (Increase) decrease in interest receivable (132) (255) 303 (129)
– Increase (decrease) in interest payable 22 378 (351) 537 Changes in other items and accruals, net 3,519 178 1,590 (1,243) (Gain) on sale of land and buildings - (6) (13) (6)
Net Cash Provided by (Used in) Operating Activities 2,430 (4,354) 4,246 (21,557)
Cash Flows from Financing Activities Net increase (decrease) in deposits (7,336) 16,926 (1,412) 45,222 Net increase (decrease) in securities sold but not yet purchased 711 (2,981) (7,251) 10,328 Net increase (decrease) in securities lent or sold under repurchase agreements 1,155 2,363 (3,731) 2,325 Net increase (decrease) in liabilities of subsidiaries (9) (27) 2,045 335 Repayment of subordinated debt (Note 10) - - (150) (483)Proceeds from issuance of subordinated debt (Note 10) - - 900 1,200 Redemption of preferred share liability (Note 11) - (200) - (200)Proceeds from issuance of preferred shares (Note 11) - 250 550 600 Proceeds from issuance of common shares 61 51 182 245 Share issue expense - (5) (10) (14)Common shares repurchased for cancellation (Note 11) - (91) - (524)Dividends paid (380) (360) (1,483) (1,396)
Net Cash Provided by (Used in) Financing Activities (5,798) 15,926 (10,360) 57,638
Cash Flows from Investing Activities Net (increase) decrease in interest bearing deposits with banks 8,153 (339) 10,077 (5,709)Purchases of securities, other than trading (9,173) (17,716) (26,423) (50,366)Maturities of securities, other than trading 2,796 3,736 16,984 24,635 Proceeds from sales of securities, other than trading 1,301 3,469 8,268 11,824 Net (increase) decrease in loans and loan substitute securities (8,062) 4,522 (23,387) (9,265)Proceeds from securitization of loans (Note 3) 5,677 694 11,448 3,330 Net (increase) decrease in securities borrowed or purchased under resale agreements 8,333 (4,736) 14,665 (8,280)Proceeds from sale of land and buildings - 45 19 45 Premises and equipment – net purchases (167) (167) (449) (405)Acquisitions (Note 7) (2) 1 (155) (301)
Net Cash Provided by (Used in) Investing Activities 8,856 (10,491) 11,047 (34,492)
Effect of Exchange Rate Changes on Cash and Cash Equivalents 402 (374) 551 (397)
Net Increase in Cash and Cash Equivalents 5,890 707 5,484 1,192 Cash and Cash Equivalents at Beginning of Period 3,244 2,943 3,650 2,458
Cash and Cash Equivalents at End of Period $ 9,134 $ 3,650 $ 9,134 $ 3,650
Represented by: Cash and non-interest bearing deposits with Bank of Canada and other banks $ 6,936 $ 2,264 $ 6,936 $ 2,264 Cheques and other items in transit, net 2,198 1,386 2,198 1,386
$ 9,134 $ 3,650 $ 9,134 $ 3,650
Supplemental Disclosure of Cash Flow Information Amount of interest paid in the period $ 2,001 $ 2,766 $ 9,900 $ 10,543 Amount of income taxes paid (refunded) in the period $ (284) $ 138 $ 456 $ 940 ff The accompanying notes are an integral part of these interim consolidated financial statements. Certain comparative figures have been reclassified to conform with the current period’s presentation.

BMO Financial Group Fourth Quarter Report 2008 • 35
Notes to Consolidated Financial Statements October 31, 2008 (Unaudited)
Note 1: Basis of Presentation
These interim consolidated financial statements should be read in conjunction with the notes to our annual consolidated financial statements for the year ended October 31, 2007 as set out on pages 96 to 137 of our 2007 Annual Report. These interim consolidated financial statements have been prepared in accordance with
Canadian generally accepted accounting principles (“GAAP”) using the same accounting policies and methods of computation as were used for our annual consolidated financial statements for the year ended October 31, 2007, except as disclosed in Note 5.
Note 2: Allowance for Credit Losses
The allowance for credit losses recorded in our Consolidated Balance Sheet is maintained at a level which we consider adequate to absorb credit-related losses on our loans, customers’ liability under acceptances and other credit instruments. The portion related to other credit instruments is recorded in other liabilities
in our Consolidated Balance Sheet. As at October 31, 2008 and October 31, 2007 there was no allowance for credit losses related to other credit instruments included in other liabilities. A continuity of our allowance for credit losses is as follows:
(Canadian $ in millions) For the three months ended
Residential mortgages
Credit card, consumer instalment and other
personal loans Business and
government loans Customers’ liability under acceptances Total
October 31,
2008
October 31,
2007
October 31, 2008
October 31,
2007
October 31, 2008
October 31,
2007
October 31, 2008
October 31,
2007
October 31, 2008
October 31,
2007
Specific Allowance at beginning of period $ 15 $ 20 $ 1 $ 1 $ 411 $ 136 $ - $ - $ 427 $ 157 Provision for credit losses 2 (5) 113 58 200 48 - - 315 101 Recoveries - - 21 17 2 7 - - 23 24 Write-offs (4) (1) (133) (72) (250) (44) - - (387) (117)Foreign exchange and other - - - (3) 48 (5) - - 48 (8)
Specific Allowance at end of period 13 14 2 1 411 142 - - 426 157
General Allowance at beginning of period 8 12 349 337 661 502 49 37 1,067 888 Provision for credit losses - (1) (107) (10) 265 55 (8) 6 150 50 Foreign exchange and other - - - - 104 (40) - - 104 (40)
General Allowance at end of period 8 11 242 327 1,030 517 41 43 1,321 898
Total Allowance $ 21 $ 25 $ 244 $ 328 $ 1,441 $ 659 $ 41 $ 43 $ 1,747 $ 1,055
(Canadian $ in millions) For the twelve months ended
Residential mortgages
Credit card, consumer instalment and other
personal loans Business and
government loans Customers’ liability under acceptances Total
October 31,
2008
October 31,
2007
October 31, 2008
October 31,
2007
October 31, 2008
October 31,
2007
October 31, 2008
October 31,
2007
October 31, 2008
October 31,
2007
Specific Allowance at beginning of period $ 14 $ 5 $ 1 $ 1 $ 142 $ 147 $ - $ - $ 157 $ 153 Provision for credit losses 5 11 332 218 733 74 - - 1,070 303 Recoveries - - 91 72 23 19 - - 114 91 Write-offs (6) (2) (422) (287) (542) (102) - - (970) (391)Foreign exchange and other - - - (3) 55 4 - - 55 1
Specific Allowance at end of period 13 14 2 1 411 142 - - 426 157
General Allowance at beginning of period 11 23 327 340 517 506 43 36 898 905 Provision for credit losses (3) (12) (85) (13) 350 68 (2) 7 260 50 Foreign exchange and other - - - - 163 (57) - - 163 (57)
General Allowance at end of period 8 11 242 327 1,030 517 41 43 1,321 898
Total Allowance $ 21 $ 25 $ 244 $ 328 $ 1,441 $ 659 $ 41 $ 43 $ 1,747 $ 1,055
Sale of Impaired Loans
During the quarter ended October 31, 2008, we recorded a net gain on the sale of impaired loans of $nil ($1 million for the quarter
ended October 31, 2007). For the twelve months ended October 31, 2008, the net gain on sale of impaired loans was $2 million ($12 million for the twelve months ended October 31, 2007).

36 • BMO Financial Group Fourth Quarter Report 2008
Note 3: Securitization
The following tables summarize our securitization activity for our assets and its impact on our Consolidated Statement of Income for the three and twelve months ended October 31, 2008 and 2007:
(Canadian $ in millions) For the twelve months ended
Residential mortgages Credit card loans Total
October 31, 2008
October 31,
2007
October 31, 2008
October 31,
2007
October 31, 2008
October 31,
2007
Net cash proceeds (1) $ 8,330 $ 3,312 $ 3,024 $ - $ 11,354 $ 3,312 Investment in securitization vehicles (2) - - 190 - 190 - Deferred purchase price 331 125 73 - 404 125 Servicing liability (55) (26) (14) - (69) (26)
8,606 3,411 3,273 - 11,879 3,411 Loans sold 8,524 3,400 3,219 - 11,743 3,400
Gain on sale of loans from new securitizations $ 82 $ 11 $ 54 $ - $ 136 $ 11
Gain on sale of loans sold to revolving securitization vehicles $ 72 $ 28 $ 212 $ 163 $ 284 $ 191
(1) Net cash proceeds represent cash proceeds less issuance costs. (2) Includes credit card securities retained on-balance sheet by the Bank.
The key weighted average assumptions used to value the deferred purchase price for these securitizations were as follows:
For the three months ended For the twelve months ended
Residential mortgages Credit card loans (1) Residential mortgages Credit card loans (1)
October 31, 2008
October 31,
2007
October 31, 2008
October 31,
2007
October 31, 2008
October 31,
2007
October 31, 2008
October 31,
2007
Weighted average life (years) 4.71 4.92 0.27 - 4.43 4.61 0.36 - Prepayment rate (%) 14.00 10.00 39.99 - 13.74 9.72 40.34 - Interest rate (%) 5.34 5.41 21.37 - 5.38 5.24 21.32 - Expected credit losses (2) - - 2.53 - - - 2.43 - Discount rate (%) 3.83 4.79 10.21 - 4.04 4.62 10.23 -
(1) There were no credit card securitization transactions in the quarter and twelve months ended October 31, 2007.
(2) As the residential mortgages are fully insured, there are no expected credit losses.
Note 4: Variable Interest Entities
Canadian Customer Securitization Vehicles
Customer securitization vehicles (also referred to as bank-sponsored multi-seller conduits) assist our customers with the securitization of their assets to provide them with alternate sources of funding. Assets held by our unconsolidated Canadian customer securitization vehicles amounted to $11,106 million as at October 31, 2008 ($17,536 million in 2007). Our exposure to losses relates to our investment in commercial paper issued by the vehicles, derivative contracts we have entered into with the vehicles and the liquidity support we provide through commitments to extend credit. As at October 31, 2008, we had an exposure of $2,139 million from commercial paper held ($5,564
million in 2007) classified as trading securities, and undrawn backstop liquidity facilities of $11,040 million ($20,756 million in 2007). No amounts have been drawn against the facilities as at October 31, 2008 and 2007. The fair value of derivatives we have outstanding with these Variable Interest Entities (“VIEs”) was recorded in our Consolidated Balance Sheet as a derivative asset of $55 million as at October 31, 2008 (derivative liability of $20 million in 2007). Included in our Consolidated Balance Sheet as at October 31, 2008 were assets of $265 million classified as other assets, and commercial paper of $nil classified as a deposit liability ($311 million and $65 million, respectively, in 2007) as a result of consolidating two Canadian customer securitization vehicles.
(Canadian $ in millions) For the three months ended
Residential mortgages Credit card loans Total
October 31, 2008
October 31,
2007
October 31, 2008
October 31,
2007
October 31, 2008
October 31,
2007
Net cash proceeds (1) $ 4,097 $ 688 $ 1,500 $ - $ 5,597 $ 688 Investment in securitization vehicles (2) - - 119 - 119 - Deferred purchase price 138 25 35 - 173 25 Servicing liability (27) (6) (8) - (35) (6)
4,208 707 1,646 - 5,854 707 Loans sold 4,198 708 1,622 - 5,820 708
Gain (loss) on sale of loans from new securitizations $ 10 $ (1) $ 24 $ - $ 34 $ (1)
Gain on sale of loans sold to revolving securitization vehicles $ 18 $ 8 $ 80 $ 40 $ 98 $ 48

BMO Financial Group Fourth Quarter Report 2008 • 37
U.S. Customer Securitization Vehicle
Assets held by our unconsolidated U.S. customer securitization vehicle amounted to $7,993 million as at October 31, 2008 ($7,929 million in 2007). Our exposure to losses in our U.S. customer securitization vehicle relates to liquidity support we provide through backstop liquidity facilities. As at October 31, 2008, our exposure related to undrawn backstop liquidity facilities amounted to $10,015 million ($10,719 million in 2007). As at October 31, 2008, the Bank has provided funding of US$851 million in accordance with the terms of these liquidity facilities ($nil in 2007). We are not required to consolidate our U.S. customer securitization vehicle.
Bank Securitization Vehicles
We use bank securitization vehicles to securitize our Canadian mortgage loans and Canadian credit card loans to obtain alternate sources of funding. Total assets held by these vehicles amounted to $9,719 million as at October 31, 2008 ($6,552 million in 2007). We are not required to consolidate our bank securitization vehicles. More information on our investments related to these vehicles can be found in Note 3. As at October 31, 2008, we held $509 million of the commercial paper issued by these vehicles ($367 million in 2007) which was classified as trading securities. We also provide liquidity support to certain of our bank securitization vehicles for the face value of the commercial paper outstanding. The total contract amount of the liquidity support was $5,100 million as at October 31, 2008 and 2007. No amounts were drawn as at October 31, 2008 and 2007. The fair value of derivatives we have outstanding with these vehicles was recorded in our Consolidated Balance Sheet as a derivative asset of $121 million as at October 31, 2008 (derivative liability of $52 million in 2007).
Credit Protection Vehicle
We sponsor Apex Trust (“Apex”), (formerly Apex/Sitka Trusts), a VIE that provides credit protection to investors on investments in corporate debt portfolios through credit default swaps. Assets held by Apex were $2,794 million as at October 31, 2008 ($2,012 million in 2007). A senior funding facility of $1,130 million is available to Apex, of which we provide $1,030 million. As at October 31, 2008, $553 million had been drawn against our facility. Under the terms of the restructuring, we also entered into credit default swaps with swap counterparties and offsetting swaps with Apex. In May 2008, upon the restructuring of Apex, we purchased mid-term notes (“MTNs”) with a face value of $815 million which are classified as available-for sale securities. As at October 31, 2008, we had recorded the MTNs at a fair value of $625 million. A third party holds its exposure to Apex through a total return swap with us on $600 million of MTNs. The total return swap and underlying MTNs are classified as trading instruments. We are not required to consolidate Apex.
Structured Finance Vehicles
We facilitate development of investment products by third parties including mutual funds, unit investment trusts and other investment funds that are sold to retail investors. We enter into derivatives with these funds to provide the investors their desired exposure and hedge our exposure related to these derivatives by investing in other funds. We consolidate those VIEs where our
interests expose us to a majority of the expected losses or residual returns, or both. Total assets and our exposure to losses in these consolidated VIEs were $450 million as at October 31, 2008 ($440 million in 2007). Assets held by the VIEs in which we have a significant variable interest but which we do not consolidate totalled $132 million as at October 31, 2008 ($353 million in 2007). Our exposure to loss from non-consolidated VIEs is limited to the amount of our investment, which totalled $40 million as at October 31, 2008 ($99 million in 2007).
Structured Investment Vehicles
Structured Investment Vehicles (“SIVs”) provide investment opportunities in customized, diversified debt portfolios in a variety of asset and rating classes. We hold interests in two SIVs and act as asset manager. Assets held by these SIVs totalled $9,291 million as at October 31, 2008, including cash of $nil (total assets of $22,754 million in 2007, including cash of $697 million). Our exposure to loss relates to our investments in these vehicles, derivative contracts we have entered into with the vehicles and senior funding we provide through a liquidity facility in order to fund the repayment of senior notes. Our investment in the capital notes of the SIVs is recorded in available-for-sale securities in our Consolidated Balance Sheet, and was $nil as at October 31, 2008 ($53 million in 2007), net of write-downs of $8 million for the quarter ended October 31, 2008 and $57 million for the twelve months ended October 31, 2008 ($13 million for the quarter ended October 31, 2007). Amounts drawn on the liquidity facility provided to the SIVs totalled $5,208 million as at October 31, 2008 ($350 million in 2007). Our exposure includes undrawn facilities of $5,063 million as at October 31, 2008 ($1,158 million in 2007). The fair value of the derivative contracts we have outstanding with the SIVs was recorded in our Consolidated Balance Sheet as a derivative asset of $57 million as at October 31, 2008 (derivative liability of $11 million in 2007). We are not required to consolidate these VIEs.
Capital Trusts
BMO Covered Bond Trust (the “CB Trust”) was created in 2007 to guarantee payments due to the bondholders in respect of €1 billion BMO Covered Bonds we issued in the first quarter of 2008. The guarantee is secured by the assets of the CB Trust. The CB Trust is a VIE which we are required to consolidate as we are exposed to the majority of its expected losses and residual returns. Total assets in the vehicle as at October 31, 2008 were $6.0 billion. Our exposure includes drawn facilities of $5,849 million and undrawn facilities of $5,151 million as at October 31, 2008. The fair value of derivative contracts outstanding with the CB Trust was a derivative asset of $112 million as at October 31, 2008. The Bank is also involved with two VIEs that are used to issue subordinated notes of BMO Subordinated Notes Trust (“SN Trust”) and securities of BMO Capital Trust, respectively. We are not required to consolidate SN Trust. See Note 10 for further information related to SN Trust. We are required to consolidate BMO Capital Trust. As at October 31, 2008, total assets in the vehicle were $3.2 billion. Securities of $2.2 billion issued by BMO Capital Trust are reported as either non-controlling interest or capital trust securities in our Consolidated Balance Sheet.

38 • BMO Financial Group Fourth Quarter Report 2008
Note 5: Financial Instruments Change in Accounting Policy
During October 2008, the Canadian Institute of Chartered Accountants issued amendments to Handbook section 3855 “Financial Instruments – Recognition and Measurement”, section 3861 “Financial Instruments – Disclosure and Presentation” and section 3862 “Financial Instruments – Disclosure”. The amendments permit, in rare circumstances, certain reclassifications of non-derivative financial assets from the trading category to either the available-for-sale or held-to-maturity categories. It also permits the reclassification of certain available-for-sale loans to loans and receivables. We elected to transfer securities from trading to available-for-sale for which we had a change in intent caused by current market circumstances to hold the securities for the foreseeable future rather than to exit or trade them in the short term. In accordance with the amendments, we elected to recognize the transfers at the fair value of the securities on August 1, 2008. A continuity of the transferred securities is as follows:
(Canadian $ in millions)
Impact on trading revenues for the quarter ended July 31, 2008 $ (60)
Fair value of securities as at August 1, 2008 $ 2,078 Net sales/purchases (52)Fair value change recorded in Other Comprehensive Income (183)Other than temporary impairment recorded in income (29)Impact of foreign exchange 141
Fair value of securities as at October 31, 2008 $ 1,955
As of the reclassification date, effective interest rates on reclassified trading assets ranged from 2% to 17%, with expected recoverable cash flows of $2.2 billion. Ranges of effective interest rates were determined based on weighted-average rates of the portfolios transferred.
Fair Value Option
Management can elect to measure financial instruments that would not otherwise be accounted for at fair value as trading instruments, with changes in fair value recorded in income provided they meet certain criteria. We designated bonds purchased to support our Municipal Tender Option Bond Program as trading securities under the fair value option. These bonds would otherwise be accounted for as available-for-sale securities with unrealized gains and losses recorded in Other Comprehensive Income. In managing this program, we enter into derivatives to hedge against changes in the fair value of those bonds that arise due to changes in interest rates. Electing the fair value option for the bonds better aligns the accounting result with the way the program is managed. The impact of recording the bonds as trading securities was a decrease in non-interest revenue, trading revenues of less than $1 million for the quarter and twelve months ended October 31, 2008. The bonds were sold in September 2008. The change in fair value of our structured notes designated as held for trading was an increase in non-interest revenue, trading revenues of $73 million for the quarter ended October 31, 2008 and an increase in non-interest revenue, trading revenues of $84 million for the twelve months ended October 31, 2008. The portion of the change in fair value attributable to changes in our own credit risk was an unrealized gain of $89 million for the quarter ended October 31, 2008 and $108 million for the twelve months ended October 31, 2008.
Fair Value Measurement
In limited circumstances, we use internal models where the inputs are not based on observable market data. Sensitivity analysis for the most significant items valued using internal models without observable inputs is described below. Within available-for-sale securities as at October 31, 2008 was $625 million of Apex MTNs with a face value of $815 million. The valuation of these MTNs has been determined by management based on expected discounted cash flows. The determination of the discount rate used in the discounted cash flow model has the most significant impact on the valuation and is impacted by changes in credit spreads and the ratings of the underlying credit default swaps. The impact of assuming the discount rate increased or decreased by 50 basis points would result in a change in fair value of $14 million and $(14) million, respectively. The impact on income for the quarter ended October 31, 2008 related to changes in the fair value of our investment in Apex MTNs was a charge of $105 million before tax. A third party holds its exposure to the Apex MTNs through a total return swap with us. The valuation of this swap and the related underlying MTNs have been determined by management based on expected discounted cash flows. The determination of the discount rate used in the discounted cash flow model has the most significant impact on the valuation of the swap and underlying securities and is impacted by changes in credit spreads and the ratings of the underlying credit default swaps. The impact of assuming the discount rate increased or decreased by 50 basis points would result in a change in fair value of $7 million and $(8) million, respectively. The impact on net income for the quarter ended October 31, 2008 related to changes in the fair value of the swap and underlying MTNs was a charge of $65 million before tax. Within available-for-sale securities as at October 31, 2008 was $187 million of third party asset-backed commercial paper (“ABCP”) with a face value of $325 million. The valuation of this ABCP has been determined by management based on expected discounted cash flows and expectations of the probability of restructuring the vehicles in accordance with the Montreal Accord versus the liquidation value. The determination of the discount rate used in the discounted cash flow model has the most significant impact on the valuation of the ABCP and is impacted by changes in credit spreads and the expected rating of the new notes. The impact of assuming the discount rate increased or decreased by 50 basis points would result in a change in fair value of $5 million and $(5) million, respectively. This third party ABCP was transferred from trading to available-for-sale securities in accordance with the change in accounting policy described above. For the quarter ended October 31, 2008, $14 million before tax was recorded in Other Comprehensive Income, and for the nine months ended July 31, 2008, $125 million before tax was recorded in income related to declines in the fair value of this investment. Within derivative assets and derivative liabilities as at October 31, 2008 was $1,250 million and $52 million, respectively, related to the mark-to-market of credit default swaps and total return swaps on structured products. The valuation of these derivatives has been determined by management, based on estimates of current market spreads for similar structured products. The impact of assuming a 10 basis point increase or decrease in that spread would result in a change in fair value of $10 million and

BMO Financial Group Fourth Quarter Report 2008 • 39
$(10) million, respectively. The impact on net income in the quarter ended October 31, 2008 related to the change in the fair
value of these derivatives was income of $13 million before tax.
Note 6: Guarantees
In the normal course of business we enter into a variety of guarantees, the most significant of which are as follows:
Standby Letters of Credit and Guarantees
Standby letters of credit and guarantees represent our obligation to make payments to third parties on behalf of another party if that party is unable to make the required payments or meet other contractual requirements. The maximum amount payable under standby letters of credit and guarantees totalled $15,270 million as at October 31, 2008 ($12,395 million in 2007). Collateral requirements for standby letters of credit and guarantees are consistent with our collateral requirements for loans. No amount was included in our Consolidated Balance Sheet as at October 31, 2008 and 2007 related to these standby letters of credit and guarantees.
Backstop and Other Liquidity Facilities
Backstop liquidity facilities are provided to ABCP programs administered by either us or third parties as an alternative source of financing in the event that such programs are unable to access ABCP markets or when predetermined performance measures of the financial assets owned by these programs are not met. The terms of the backstop liquidity facilities do not require us to advance money to these programs in the event of
bankruptcy of the borrower. The facilities’ terms are generally no longer than one year, but can be several years. The maximum amount payable under these backstop and other liquidity facilities totalled $32,806 million as at October 31, 2008 ($39,428 million in 2007). As at October 31, 2008, $1,143 million was drawn ($16 million in 2007) in accordance with the terms of the backstop liquidity facilities, of which $1,025 million (US$851 million) ($nil in 2007) relates to the VIEs discussed in Note 4.
Credit Enhancement Facilities
Where warranted, we provide partial credit enhancement facilities to transactions within ABCP programs administered by either us or third parties. Credit enhancement facilities of $6,243 million ($5,449 million in 2007) are included in backstop liquidity facilities. The facilities’ terms are generally no longer than one year, but can be several years.
Senior Funding Facilities
We also provide senior funding support to our SIVs and our credit protection vehicle. The majority of these facilities support the repayment of senior note obligations of the SIVs. As at October 31, 2008, $5,761 million was drawn ($350 million in 2007), in accordance with the terms of the funding facilities related to the VIEs discussed in Note 4.

40 • BMO Financial Group Fourth Quarter Report 2008
Note 7: Acquisitions
We account for acquisitions of businesses using the purchase method. This involves allocating the purchase price paid for a business to the assets acquired, including identifiable intangible assets, and the liabilities assumed, based on their fair values at the date of acquisition. Any excess is then recorded as goodwill. The results of operations of acquired businesses are included in our consolidated financial statements beginning on the date of acquisition.
Griffin, Kubik, Stephens & Thompson, Inc.
On May 1, 2008, we completed the acquisition of Chicago-based Griffin, Kubik, Stephens & Thompson, Inc. (“GKST”), for cash consideration of $31 million, subject to a post-closing adjustment based on net equity. The acquisition of GKST provides us with the opportunity to significantly expand our presence in the U.S. municipal bond market. Goodwill related to this acquisition is deductible for tax purposes. GKST is part of our BMO Capital Markets reporting segment.
Merchants and Manufacturers Bancorporation, Inc.
On February 29, 2008, we completed the acquisition of Wisconsin-based Merchants and Manufacturers Bancorporation, Inc. (“Merchants and Manufacturers”), for total cash consideration of $135 million. The acquisition of Merchants and Manufacturers provides us with the opportunity to expand our banking network into Wisconsin. As part of this acquisition, we acquired a core deposit intangible asset, which is being amortized on an accelerated basis over a period not to exceed 10 years. Goodwill related to this acquisition is not deductible for tax purposes. Merchants and Manufacturers is part of our Personal and Commercial Banking U.S. reporting segment.
Ozaukee Bank
On February 29, 2008, we completed the acquisition of Ozaukee Bank (“Ozaukee”), a Wisconsin-based community bank, for 3,283,190 shares of Bank of Montreal with a market value of $54.97 per share for total consideration of $180 million. The acquisition of Ozaukee provides us with the opportunity to expand our banking network into Wisconsin. As part of this acquisition, we acquired a core deposit intangible asset, which is being amortized on an accelerated basis over a period not to exceed 10 years.
Goodwill related to this acquisition is not deductible for tax purposes. Ozaukee is part of our Personal and Commercial Banking U.S. reporting segment.
Pyrford International plc
On December 14, 2007, we completed the acquisition of Pyrford International plc (“Pyrford”), a London, U.K.-based asset manager, for total cash consideration of $41 million, plus contingent consideration up to $10 million based on our retention of the assets under management one year from the closing date. The acquisition of Pyrford provides us with the opportunity to expand our investment management capabilities outside of North America. As part of this acquisition, we acquired a customer relationship intangible asset, which is being amortized on a straight line basis over a period not to exceed 15 years. Goodwill related to this acquisition is not deductible for tax purposes. Pyrford is part of our Private Client Group reporting segment.
First National Bank & Trust
On January 4, 2007, we completed the acquisition of First National Bank & Trust (“First National”) for total cash consideration of $345 million. The acquisition of First National provides us with the opportunity to expand our banking services into the Indianapolis, Indiana market. As part of this acquisition, we acquired a core deposit intangible asset, which is being amortized on an accelerated basis over a period not to exceed 10 years. Goodwill and other intangibles related to this acquisition are deductible for tax purposes. First National is part of our Personal and Commercial Banking U.S. reporting segment.
bcpbank Canada
On December 4, 2006, we completed the acquisition of bcpbank Canada, a full-service chartered bank, for total cash consideration of $41 million. The acquisition of bcpbank Canada expands our branch network and provides our customers with greater access to banking services across the greater Toronto area. As part of this acquisition, we acquired a core deposit intangible asset, which is being amortized on an accelerated basis over 10 years. Goodwill related to this acquisition is not deductible for tax purposes. bcpbank Canada is part of our Personal and Commercial Banking Canada reporting segment.
The estimated fair values of the assets acquired and the liabilities assumed at the dates of acquisition are as follows:
(Canadian $ in millions)
October 31,
2008 October 31,
2007
GKST
Merchants and
Manufacturers Ozaukee Pyrford
First
National
bcpbank
Canada
Cash resources $ - $ 47 $ 54 $ 1 $ 110 $ 47 Securities 63 133 115 - 317 23 Loans - 1,013 517 - 1,009 293 Premises and equipment 1 34 14 1 30 9 Goodwill 8 100 120 20 175 13 Core deposit/Customer relationship intangible asset - 39 24 17 37 5 Other assets 24 16 11 4 52 2
Total assets 96 1,382 855 43 1,730 392
Deposits - 1,029 584 - 1,375 339 Other liabilities 65 218 91 2 10 12
Total liabilities 65 1,247 675 2 1,385 351
Purchase price $ 31 $ 135 $ 180 $ 41 $ 345 $ 41
The allocations of the purchase price for GKST, Merchants and Manufacturers, Ozaukee and Pyrford are subject to refinement as we complete the valuation of the assets acquired and liabilities assumed.

BMO Financial Group Fourth Quarter Report 2008 • 41
Note 8: Employee Compensation
Stock Options
During the twelve months ended October 31, 2008, we granted a total of 1,442,833 stock options. The weighted-average fair value of these options was $8.24 per option and was determined using a trinomial option pricing model, based on the following weighted-average assumptions.
For stock options granted during the twelve months ended October 31, 2008
Expected dividend yield 4.1%Expected share price volatility 19.5%Risk-free rate of return 4.0%Expected period until exercise 7.3 years
Pension and Other Employee Future Benefit Expenses
We recorded pension and other employee future benefit expenses in our Consolidated Statement of Income as follows:
(Canadian $ in millions) For the three months ended
Pension benefit plans Other employee future benefit plans
October 31,2008
October 31,
2007
October 31,2008
October 31,
2007
Benefits earned by employees $ 27 $ 35 $ 5 $ 6 Interest cost on accrued benefit liability 65 53 12 12 Actuarial loss recognized in expense 2 13 4 6 Amortization of plan amendment costs 6 3 (4) (4)Expected return on plan assets (80) (68) (2) (1)
Benefits expense 20 36 15 19
Canada and Quebec pension plan expense 9 8 - - Defined contribution expense (2) 2 - -
Total pension and other employee future benefit expenses $ 27 $ 46 $ 15 $ 19
Note 9: Restructuring Charge
The continuity of our restructuring charge is as follows:
(Canadian $ in millions) Severance-
related charges Premises-
related charges Other Total
Year Ended October 31, 2007
Opening Balance $ 117 $ 11 $ 7 $ 135 Paid in the year (46) (10) (7) (63)Reversal in the year (15) (1) - (16)Additional charge in the year 40 - - 40
Balance as at October 31, 2007 96 - - 96
Paid in the quarter ended January 31, 2008 (12) - - (12)
Balance as at January 31, 2008 84 - - 84 Paid in the quarter ended April 30, 2008 (12) - - (12)
Balance as at April 30, 2008 72 - - 72 Paid in the quarter ended July 31, 2008 (11) - - (11)
Balance as at July 31, 2008 61 - - 61 Paid in the quarter ended October 31, 2008 (10) - - (10)Reversal in the quarter ended October 31, 2008 (8) - - (8)
Balance as at October 31, 2008 $ 43 $ - $ - $ 43
(Canadian $ in millions) For the twelve months ended
Pension benefit plans Other employee future benefit plans
October 31,2008
October 31,
2007
October 31,2008
October 31,
2007
Benefits earned by employees $ 141 $ 149 $ 19 $ 22 Interest cost on accrued benefit liability 236 217 51 49 Actuarial loss recognized in expense 10 59 12 18 Amortization of plan amendment costs 14 11 (8) (7)Expected return on plan assets (298) (277) (6) (5)77
Benefits expense 103 159 68 77
Canada and Quebec pension plan expense 56 52 - - Defined contribution expense 9 13 - - 77
Total pension and other employee future benefit expenses $ 168 $ 224 $ 68 $ 77
42 • BMO Financial Group Fourth Quarter Report 2008
Note 10: Subordinated Debt
During the quarter ended April 30, 2008, we issued $900 million of subordinated debt under our Canadian Medium-Term Note Program. The issue, Series F Medium-Term Notes, Tranche 1, is due March 2023. Interest on this issue is payable semi-annually at a fixed rate of 6.17% until March 28, 2018, and at a floating rate equal to the rate on three month Bankers’ Acceptances plus 2.50%, paid quarterly, thereafter to maturity. During the quarter ended April 30, 2008, we redeemed all of our 5.75% Series A Medium-Term Notes, Tranche 2, due 2013, totalling $150 million. The notes were redeemed at a redemption price of 100 percent of the principal amount plus unpaid accrued interest to the redemption date. During the quarter ended October 31, 2007, we issued $800 million of innovative subordinated debentures, BMO Trust Subordinated Notes (BMO TSNs – Series A), through BMO Subordinated Notes Trust (“SN Trust”). SN Trust is a variable interest entity which we are not required to consolidate (see Note 4); therefore, the BMO TSNs – Series A issued by SN Trust are not reported in our Consolidated Balance Sheet. SN Trust used the proceeds of the issuance to purchase a senior deposit note from us which is reported as a business and government deposit liability in our Consolidated Balance Sheet. All the BMO TSNs – Series A will be exchanged automatically, without the consent of the holders, into our Series E Subordinated Notes upon the occurrence of specific events, such as a wind-up of Bank of Montreal, a regulatory requirement to increase capital, violations of regulatory capital requirements, or changes to tax legislation.
We have guaranteed the payments of principal, interest and redemption price, if any, and any other amounts on the BMO TSNs – Series A when they become due and payable. This guarantee is subordinate to our deposit liabilities and all other liabilities, except for other guarantees, obligations or liabilities that are designated as ranking either equally with or subordinate to the subordinated indebtedness. The senior deposit note bears interest at an annual rate of 5.90% and will mature on September 26, 2022. We require approval from the Superintendent of Financial Institutions Canada before we can redeem any part of our subordinated debt. During the quarter ended July 31, 2007, we issued $1.2 billion of subordinated debt under our Canadian Medium-Term Note Program. The issue, Series D Medium-Term Notes, Tranche 2, is due June 2017. Interest on this issue is payable semi-annually at a fixed rate of 5.20% until June 21, 2012, and at a floating rate equal to the rate on three month Bankers’ Acceptances plus 1.00%, paid quarterly, thereafter to maturity. During the quarter ended July 31, 2007, we redeemed all of our 7.92% Debentures, Series 22, due 2012, totalling $150 million. The debentures were redeemed at a redemption price of 100 percent of the principal amount plus unpaid accrued interest to the redemption date. During the quarter ended April 30, 2007, our US$300 million 7.80% Notes matured.
Note 11: Share Capital
On November 25, 2008, we redeemed all our 10,000,000 Non-Cumulative Class B Preferred Shares, Series 6 that were classified as preferred share liabilities, at a price of $25.00 per share, together with declared and unpaid dividends to the date of redemption. This represents an aggregate redemption price of approximately $250 million. During the quarter ended July 31, 2008, we issued 12,000,000 5.2% Non-Cumulative Rate Reset Class B Preferred Shares, Series 16, at a price of $25.00 per share, representing an aggregate issue price of $300 million. During the quarter ended April 30, 2008, we issued 10,000,000 5.8% Non-Cumulative Perpetual Class B Preferred Shares, Series 15, at a price of $25.00 per share, representing an aggregate issue price of $250 million. During the quarter ended October 31, 2007, we issued 10,000,000 5.25% Non-Cumulative Perpetual Class B Preferred Shares, Series 14, at a price of $25.00 per share, representing an aggregate issue price of $250 million. During the quarter ended October 31, 2007, we redeemed all our 8,000,000 Non-Cumulative Class B Preferred Shares, Series 4 that were classified as preferred share liabilities, at a price of $25.00 per share, together with declared and unpaid dividends to the date of redemption. This represented an aggregate redemption price of approximately $200 million. During the quarter ended January 31, 2007, we issued 14,000,000 4.5% Non-Cumulative Perpetual Class B Preferred Shares, Series 13, at a price of $25.00 per share, representing an aggregate issue price of $350 million.
On September 8, 2008, we commenced a normal course issuer bid, effective for one year. Under this bid, we may repurchase up to 15,000,000 common shares, approximately 3% of our outstanding common shares. We participated in a normal course issuer bid during the period from September 6, 2007 to September 7, 2008 under which we were able to repurchase up to 25,000,000 common shares, approximately 5% of our common shares then outstanding. During the quarter ended October 31, 2008, we did not repurchase any common shares. During the quarter ended October 31, 2007, we repurchased 1,406,300 common shares at an average cost of $64.83 per share, totalling $91 million. During the twelve months ended October 31, 2008, we did not repurchase any common shares. During the twelve months ended October 31, 2007, we repurchased 7,621,600 common shares at an average cost of $68.80 per share, totalling $524 million.
Treasury Shares
When we purchase our common shares, we record the cost of those shares as a reduction in shareholders’ equity. If those shares are resold at a value higher than their cost, the premium is recorded as an increase in contributed surplus. If those shares are resold at a value below their cost, the discount is recorded as a reduction first to contributed surplus and then to retained earnings for any amounts in excess of total contributed surplus related to treasury shares.

BMO Financial Group Fourth Quarter Report 2008 • 43
Share Capital Outstanding (a)
(a) For additional information refer to Notes 21 and 22 to our consolidated financial statements for the year ended October 31, 2007 on pages 121 to 124 of our 2007 Annual Report. (b) The number of shares issuable on conversion is not determinable until the date of conversion.
(c) Face value is US$300 million. n/a – not applicable
Note 12: Capital Management
Our capital management framework is designed to maintain the level of capital that: meets our target regulatory capital ratios; meets our internal assessment of required economic capital; is consistent with our targeted credit ratings; underpins our operating groups’ business strategies; and builds long-term shareholder value. Our policies and processes for managing capital as well as the nature of our capital are outlined in the Enterprise-Wide Capital Management section of Management’s Discussion and Analysis on page 57 of our 2007 Annual Report.
Effective November 1, 2007, a new regulatory capital management framework was implemented in Canada. The new framework, Basel II, replaced Basel I, the framework utilized for the past 20 years. Basel II is an improvement over Basel I in that it establishes regulatory capital requirements that are more sensitive to a bank’s risk profile. We have met our capital targets as at October 31, 2008. Our capital position as at October 31, 2008 is detailed in the Capital Management section on page 14 of Management’s Discussion and Analysis of the Fourth Quarter Report to Shareholders.
Note 13: Risk Management
We have an enterprise-wide approach to the identification, measurement, monitoring and management of risks faced across the organization. The key financial instrument risks are classified as credit and counterparty, and market, liquidity and funding risk.
Credit and Counterparty Risk
We are exposed to credit risk from the possibility that counterparties may default on their financial obligations to us. Credit risk arises predominantly with respect to loans, over-the-counter derivatives and other credit instruments. This is the most significant measurable risk that we face. Our risk management practices and key measures are disclosed in Management’s Discussion and Analysis on pages 67 to 68 of our 2007 Annual Report. Key measures as at October 31, 2008 are outlined in the Risk Management section on pages 11 to 12 of Management’s Discussion and Analysis of the Fourth Quarter Report to Shareholders.
Market, Liquidity and Funding Risk
Market risk is the potential for a negative impact on the balance sheet and/or income statement resulting from adverse changes in the value of financial instruments as a result of changes in certain market variables. These variables include interest rates, foreign
exchange rates, equity and commodity prices and their implied volatilities, as well as credit spreads, credit migration and default. We incur market risk in our trading and underwriting activities and structural banking activities. Liquidity and funding risk is the potential for loss if we are unable to meet financial commitments in a timely manner at reasonable prices as they fall due. It is our policy to ensure that sufficient liquid assets and funding capacity are available to meet financial commitments, including liabilities to depositors and suppliers, and lending, investment and pledging commitments, even in times of stress. Managing liquidity and funding risk is essential to maintaining both depositor confidence and stability in earnings. Our market risk and liquidity funding management practices and key measures are outlined on pages 68 to 71 of our 2007 Annual Report. Key measures as at October 31, 2008 are outlined in the Risk Management section on pages 11 to 12 of Management’s Discussion and Analysis of the Fourth Quarter Report to Shareholders. Financial liabilities are comprised of trading and non-trading liabilities. As liabilities in trading portfolios are typically held for short periods of time, they are not included in the table below.
(Canadian $ in millions, except as noted) October 31, 2008
Number of shares Amount Convertible into...
Preferred Shares – Classified as Liabilities Class B – Series 6 10,000,000 $ 250 common shares (b)
250
Preferred Shares – Classified as Equity Class B – Series 5 8,000,000 200 – Class B – Series 10 (c) 12,000,000 396 common shares (b) Class B – Series 13 14,000,000 350 – Class B – Series 14 10,000,000 250 – Class B – Series 15 10,000,000 250 – Class B – Series 16 12,000,000 300 –
1,746 Common Shares 506,044,982 4,773 – Treasury Shares (1,469,949) (65) –
Share Capital $ 6,454
Stock options issued under stock option plan n/a 20,055,702 common shares

44 • BMO Financial Group Fourth Quarter Report 2008
Contractual maturities of non-trading financial liabilities and commitments to extend credit as at October 31, 2008 were as follows:
(Canadian $ in millions)
Less than
1 year 1 to 3 years 4 to 5 years Over 5 years
No fixed
maturity Total
Deposits (1) $ 116,297 $ 26,146 $ 8,942 $ 5,767 $ 99,448 $ 256,600
Subordinated debt 368 693 434 5,408 - 6,903 Capital trust securities 78 868 413 - - 1,359 Preferred share liability 253 - - - - 253 Other financial liabilities 41,167 228 265 3,560 42 45,262 Commitments to extend credit 41,113 21,270 16,953 1,772 - 81,108
Total $ 199,276 $ 49,205 $ 27,007 $ 16,507 $ 99,490 $ 391,485
(1) Excludes interest payments. The balances in the above table will not agree with those in our consolidated financial statements as this table incorporates all cash flows, on an undiscounted basis, including both principal and interest.
Note 14: Contingent Liabilities
Following our disclosures of mark-to-market losses in our commodities trading businesses on April 27, 2007 and May 17, 2007, aggregating $680 million (pre-tax) as of April 30, 2007, we have received inquiries, requests for documents or subpoenas pertaining to those trading losses from securities, commodities,
banking and law enforcement authorities. On November 18, 2008, a number of proceedings were commenced by these authorities against certain parties that were involved in the commodities trading losses. We are not a party to these proceedings. We are cooperating with all of these authorities.
Note 15: United States Generally Accepted Accounting Principles
Reporting under United States GAAP would have resulted in the following:
(Canadian $ in millions, except earnings per share figures) For the three months ended For the twelve months ended
October 31, 2008
October 31,
2007
October 31, 2008
October 31,
2007
Net Income – Canadian GAAP $ 560 $ 452 $ 1,978 $ 2,131 United States GAAP adjustments (133) 12 (110) (16)
Net Income – United States GAAP $ 427 $ 464 $ 1,868 $ 2,115
Earnings Per Share Basic – Canadian GAAP $ 1.06 $ 0.89 $ 3.79 $ 4.18 Basic – United States GAAP 0.79 0.90 3.57 4.14 Diluted – Canadian GAAP 1.06 0.87 3.76 4.11 Diluted – United States GAAP 0.79 0.90 3.54 4.08
Fair Value Option
During the quarter ended January 31, 2008, we adopted the new United States accounting standard which allows us to elect to report selected financial assets and liabilities at fair value and establishes new disclosure requirements for assets and liabilities to which the fair value option is applied. The new standard eliminated a difference between Canadian and United States GAAP.
Reclassification from Trading Securities to Available-For-Sale Securities
During the quarter ended October 31, 2008, we adopted new Canadian accounting guidance which allows, in rare circumstances, certain reclassifications of non-derivative financial assets from the trading category to either the available-for-sale or held-to-maturity categories. This new guidance is consistent with United States GAAP. We elected to transfer securities from trading to available-for-sale for which we had a change in intent caused by current market circumstances to hold the securities for the foreseeable future rather than to exit or trade them in the short term. The Canadian accounting guidance was applicable on a retroactive basis to August 1, 2008 for us and the transfers took place at the fair value of the securities on August 1, 2008. We did not reclassify these securities under United States GAAP. This difference would reverse as these securities are sold.

BMO Financial Group Fourth Quarter Report 2008 • 45
Note 16: Operating and Geographic Segmentation Operating Groups
We conduct our business through operating groups, each of which has a distinct mandate. We determine our operating groups based on our management structure and therefore our groups, and results attributed to them, may not be comparable with those of other financial services companies. We evaluate the performance of our groups using measures such as net income, revenue growth, return on equity, net economic profit and non-interest expense-to-revenue (productivity) ratio as well as cash operating leverage.
Personal and Commercial Banking
Personal and Commercial Banking (“P&C”) is comprised of two operating segments: Personal and Commercial Banking Canada and Personal and Commercial Banking U.S.
Personal and Commercial Banking Canada
Personal and Commercial Banking Canada (“P&C Canada”) offers a full range of consumer and business products and services, including: everyday banking, financing, investing, credit cards and insurance, as well as a full suite of commercial and capital market products and financial advisory services, through a network of branches, telephone banking, online banking, mortgage specialists and automated banking machines.
Personal and Commercial Banking U.S.
Personal and Commercial Banking U.S. (“P&C U.S.”) offers a full range of products and services to personal and business clients in select markets of the U.S. Midwest through branches and direct banking channels such as telephone banking, online banking and a network of automated banking machines.
Private Client Group
Private Client Group (“PCG”) brings together all of our wealth management businesses. Operating under the BMO brand in Canada and Harris in the United States, PCG serves a full range of client segments, from mainstream to ultra-high net worth, as well as select institutional market segments. We offer our clients a broad range of wealth management products and solutions, including full-service and online brokerage in Canada, and private banking and investment products in Canada and the United States.
BMO Capital Markets
BMO Capital Markets (“BMO CM”) combines all of our businesses serving corporate, institutional and government clients. In Canada and the United States, its clients span a broad range of industry sectors. BMO CM also serves clients in the United Kingdom, Europe, Asia and Australia. It offers clients complete financial solutions, including equity and debt underwriting, corporate lending and project financing, mergers and acquisitions, advisory services, merchant banking, securitization, treasury and market risk management, debt and equity research and institutional sales and trading.
Corporate Services
Corporate Services includes the corporate units that provide expertise and governance support in areas such as strategic planning, law, finance, internal audit, risk management, corporate communications, economics, corporate marketing, human resources and learning. Operating results include revenues and expenses associated with certain securitization activities, the hedging of foreign-source earnings and activities related to the management of certain balance sheet positions and our overall asset liability structure.
Technology and Operations (“T&O”) manages, maintains and provides governance over our information technology, real estate, operations services and sourcing. T&O focuses on enterprise-wide priorities that improve quality and efficiency to deliver an excellent customer experience. Operating results for T&O are included with Corporate Services for reporting purposes. However, costs of T&O services are transferred to three operating groups. As such, results for Corporate Services largely reflect the activities outlined above. Corporate Services also includes residual revenues and expenses representing the differences between actual amounts earned or incurred and the amounts allocated to operating groups.
Basis of Presentation
The results of these operating segments are based on our internal financial reporting systems. The accounting policies used in these segments are generally consistent with those followed in the preparation of our consolidated financial statements as disclosed in Note 1. Notable accounting measurement differences are the taxable equivalent basis adjustment and the provision for credit losses, as described below.
Taxable Equivalent Basis
We analyze net interest income on a taxable equivalent basis (“teb”) at the operating group level. This basis includes an adjustment which increases GAAP revenues and the GAAP provision for income taxes by an amount that would raise revenues on certain tax-exempt securities to a level that would incur tax at the statutory rate. The operating groups’ teb adjustments are eliminated in Corporate Services. Analysis on a teb basis neutralizes the impact of investing in tax-exempt or tax-advantaged securities rather than fully taxable securities with higher yields. It reduces distortions in net interest income related to the choice of tax-advantaged and taxable investments.
Provisions for Credit Losses
Provisions for credit losses are generally allocated to each group based on expected losses for that group over an economic cycle. Differences between expected loss provisions and provisions required under GAAP are included in Corporate Services.
Inter-Group Allocations
Various estimates and allocation methodologies are used in the preparation of the operating groups’ financial information. We allocate expenses directly related to earning revenue to the groups that earned the related revenue. Expenses not directly related to earning revenue, such as overhead expenses, are allocated to operating groups using allocation formulas applied on a consistent basis. Operating group net interest income reflects internal funding charges and credits on the groups’ assets, liabilities and capital, at market rates, taking into account relevant terms and currency considerations. The offset of the net impact of these charges and credits is reflected in Corporate Services.
Geographic Information
We operate primarily in Canada and the United States but also have operations in the United Kingdom, Europe, the Caribbean and Asia, which are grouped in Other countries. We allocate our results by geographic region based on the location of the unit responsible for managing the related assets, liabilities, revenues and expenses, except for the consolidated provision for credit losses, which is allocated based upon the country of ultimate risk.

46 • BMO Financial Group Fourth Quarter Report 2008
Our results and average assets, allocated by operating segment, are as follows:
(Canadian $ in millions)
For the three months ended October 31, 2008 (2)
P&C
Canada
P&C
U.S. PCG BMO CM
Corporate
Services (1)
Total
(GAAP basis)
Net interest income $ 835 $ 212 $ 184 $ 355 $ (173) $ 1,413
Non-interest revenue 481 58 310 360 191 1,400
Total Revenue 1,316 270 494 715 18 2,813 Provision for credit losses 89 12 1 30 333 465 Non-interest expense 728 243 381 451 15 1,818
Income before taxes and non-controlling interest in subsidiaries 499 15 112 234 (330) 530 Income taxes 155 3 34 (51) (190) (49)Non-controlling interest in subsidiaries - - - - 19 19
Net Income $ 344 $ 12 $ 78 $ 285 $ (159) $ 560
Average Assets $ 128,274 $ 30,438 $ 8,802 $ 239,380 $ 2,165 $ 409,059
Goodwill (As At) $ 105 $ 1,070 $ 349 $ 109 $ 2 $ 1,635
For the three months ended October 31, 2007 (2)
P&C
Canada
P&C
U.S. PCG BMO CM
Corporate
Services (1)
Total
(GAAP basis)
Net interest income $ 770 $ 172 $ 154 $ 233 $ (133) $ 1,196 Non-interest revenue 344 46 354 188 72 1,004
Total Revenue 1,114 218 508 421 (61) 2,200 Provision for credit losses 81 8 1 19 42 151 Non-interest expense 690 161 356 399 49 1,655
Income before taxes and non-controlling interest in subsidiaries 343 49 151 3 (152) 394 Income taxes 56 16 48 (43) (154) (77)Non-controlling interest in subsidiaries - - - - 19 19
Net Income $ 287 $ 33 $ 103 $ 46 $ (17) $ 452
Average Assets $ 121,706 $ 22,159 $ 7,480 $ 220,232 $ 4,308 $ 375,885
Goodwill (As At) $ 106 $ 628 $ 313 $ 91 $ 2 $ 1,140
For the twelve months ended October 31, 2007 (2)
P&C
Canada
P&C
U.S. PCG BMO CM
Corporate
Services (1)
Total
(GAAP basis)
Net interest income $ 3,066 $ 730 $ 612 $ 974 $ (539) $ 4,843 Non-interest revenue 1,678 178 1,440 995 215 4,506
Total Revenue 4,744 908 2,052 1,969 (324) 9,349 Provision for credit losses 323 35 3 77 (85) 353 Non-interest expense 2,644 693 1,446 1,574 244 6,601
Income before taxes and non-controlling interest in subsidiaries 1,777 180 603 318 (483) 2,395 Income taxes 510 64 208 (99) (494) 189 Non-controlling interest in subsidiaries - - - - 75 75
Net Income $ 1,267 $ 116 $ 395 $ 417 $ (64) $ 2,131
Average Assets $ 119,164 $ 23,477 $ 7,091 $ 207,084 $ 3,759 $ 360,575
Goodwill (As At) $ 106 $ 628 $ 313 $ 91 $ 2 $ 1,140
(1) Corporate Services includes Technology and Operations. (2) Operating groups report on a taxable equivalent basis – see Basis of Presentation section.
Prior periods have been restated to give effect to the current period’s organization structure and presentation changes.
For the twelve months ended October 31, 2008 (2)
P&C
Canada
P&C
U.S. PCG BMO CM
Corporate
Services (1)
Total
(GAAP basis)
Net interest income $ 3,236 $ 748 $ 671 $ 1,179 $ (747) $ 5,087 Non-interest revenue 1,801 242 1,396 1,233 446 5,118 Total Revenue 5,037 990 2,067 2,412 (301) 10,205 Provision for credit losses 341 43 4 117 825 1,330 Non-interest expense 2,790 802 1,477 1,752 73 6,894 Income before taxes and non-controlling interest in subsidiaries 1,906 145 586 543 (1,199) 1,981 Income taxes 586 49 191 (149) (748) (71)Non-controlling interest in subsidiaries - - - - 74 74 Net Income $ 1,320 $ 96 $ 395 $ 692 $ (525) $ 1,978 Average Assets $ 125,763 $ 26,924 $ 8,237 $ 233,873 $ 2,812 $ 397,609 Goodwill (As At) $ 105 $ 1,070 $ 349 $ 109 $ 2 $ 1,635

BMO Financial Group Fourth Quarter Report 2008 • 47
Our results and average assets, allocated by geographic region, are as follows:
(Canadian $ in millions)
For the three months ended October 31, 2008 Canada United States
Other
countries Total
Net interest income $ 968 $ 366 $ 79 $ 1,413
Non-interest revenue 1,052 312 36 1,400
Total Revenue 2,020 678 115 2,813 Provision for credit losses 155 269 41 465 Non-interest expense 1,317 466 35 1,818
Income before taxes and non-controlling interest in subsidiaries 548 (57) 39 530 Income taxes 5 (32) (22) (49)Non-controlling interest in subsidiaries 14 5 - 19
Net Income $ 529 $ (30) $ 61 $ 560
Average Assets $ 243,736 $ 134,035 $ 31,288 $ 409,059
Goodwill (As At) $ 424 $ 1,192 $ 19 $ 1,635
For the three months ended October 31, 2007 Canada United States
Other
countries Total
Net interest income $ 905 $ 221 $ 70 $ 1,196 Non-interest revenue 750 374 (120) 1,004
Total Revenue 1,655 595 (50) 2,200 Provision for credit losses 87 63 1 151 Non-interest expense 1,203 414 38 1,655
Income before taxes and non-controlling interest in subsidiaries 365 118 (89) 394 Income taxes (18) 21 (80) (77)Non-controlling interest in subsidiaries 15 4 - 19
Net Income $ 368 $ 93 $ (9) $ 452
Average Assets $ 233,006 $ 109,894 $ 32,985 $ 375,885
Goodwill (As At) $ 423 $ 717 $ - $ 1,140
For the twelve months ended October 31, 2007 Canada United States
Other
countries Total
Net interest income $ 3,615 $ 923 $ 305 $ 4,843 Non-interest revenue 3,843 589 74 4,506
Total Revenue 7,458 1,512 379 9,349 Provision for credit losses 257 99 (3) 353 Non-interest expense 4,788 1,656 157 6,601
Income before taxes and non-controlling interest in subsidiaries 2,413 (243) 225 2,395 Income taxes 415 (199) (27) 189 Non-controlling interest in subsidiaries 55 20 - 75
Net Income $ 1,943 $ (64) $ 252 $ 2,131
Average Assets $ 216,572 $ 111,150 $ 32,853 $ 360,575
Goodwill (As At) $ 423 $ 717 $ - $ 1,140
Prior periods have been restated to give effect to the current period’s organization structure and presentation changes.
For the twelve months ended October 31, 2008 Canada United States
Other
countries Total
Net interest income $ 3,662 $ 1,110 $ 315 $ 5,087 Non-interest revenue 3,951 1,181 (14) 5,118
Total Revenue 7,613 2,291 301 10,205
Provision for credit losses 340 942 48 1,330
Non-interest expense 5,011 1,710 173 6,894
Income before taxes and non-controlling interest in subsidiaries 2,262 (361) 80 1,981 Income taxes 199 (196) (74) (71)Non-controlling interest in subsidiaries 55 19 - 74
Net Income $ 2,008 $ (184) $ 154 $ 1,978
Average Assets $ 236,495 $ 129,260 $ 31,854 $ 397,609
Goodwill (As At) $ 424 $ 1,192 $ 19 $ 1,635

INVESTOR AND MEDIA PRESENTATION
Investor Presentation Materials Interested parties are invited to visit our web site at www.bmo.com/investorrelations to review this quarterly news release, presentation materials and a supplementary financial information package online. Copies of these documents are also available at BMO Financial Group’s offices at 100 King Street West, 18th Floor, 1 First Canadian Place, Toronto, Ontario, M5X 1A1.
Quarterly Conference Call and Webcast Presentations Interested parties are also invited to listen to our quarterly conference call on Tuesday, November 25, 2008 at 2:00 p.m. (EST). At that time, senior BMO executives will comment on results for the quarter and respond to questions from the investor community. The call may be accessed by telephone at 416-695-9753 (from within Toronto) or 1-888-789-0089 (toll-free outside Toronto). A replay of the conference call can be accessed until Monday, March 2, 2009 by calling 416-695-5800 (from within Toronto) or 1-800-408-3053 (toll-free outside Toronto) and entering passcode 648306. A live webcast of the call can be accessed on our web site at www.bmo.com/investorrelations. A replay can be accessed on the site until Monday, March 2, 2009.
Media Relations Contacts Ralph Marranca, Toronto, [email protected], 416-867-3996 Ronald Monet, Montreal, [email protected], 514-877-1873
Investor Relations Contacts Viki Lazaris, Senior Vice-President, [email protected], 416-867-6656 Steven Bonin, Director, [email protected], 416-867-5452 Krista White, Senior Manager, [email protected], 416-867-7019
Chief Financial Officer Russel Robertson, Interim Chief Financial Officer [email protected], 416-867-7360
Corporate Secretary Blair Morrison, Vice-President & Corporate Secretary [email protected], 416-867-6785
Shareholder Dividend Reinvestment and Share Purchase Plan Average market price August 2008 $ 44.93 September 2008 $ 46.40 October 2008 $ 42.85 For dividend information, change in shareholder address or to advise of duplicate mailings, please contact Computershare Trust Company of Canada 100 University Avenue, 9th Floor Toronto, Ontario M5J 2Y1 Telephone: 1-800-340-5021 (Canada and the United States) Telephone: (514) 982-7800 (international) Fax: 1-888-453-0330 (Canada and the United States) Fax: (416) 263-9394 (international) E-mail: [email protected]
For other shareholder information, please contact Bank of Montreal Shareholder Services Corporate Secretary’s Department One First Canadian Place, 19th Floor Toronto, Ontario M5X 1A1 Telephone: (416) 867-6785 Fax: (416) 867-6793 E-mail: [email protected] For further information on this report, please contact Bank of Montreal Investor Relations Department P.O. Box 1, One First Canadian Place, 18th Floor Toronto, Ontario M5X 1A1 To review financial results online, please visit our web site at www.bmo.com
® Registered trade-mark of Bank of Montreal