Embed Size (px)
Citation preview
www.KeeleyFunds.com | 800.533.5344
To Our Shareholders,
For the quarter ended December 31, 2017, the KEELEY Small Mid Cap Value Fund’s net asset value (“NAV”) per Class A share rose 5.60% versus a gain of 4.25% for the Russell 2500 Value Index. For the year, the Fund gained 17.76% compared with a 10.36% gain for the Index.
Commentary
�e markets ended the year on a strong note, with the major US equity indices at or near all-time highs. �e holiday cheer was not con�ned to the US as stock markets in the UK, France, Germany, Japan, India, and Brazil all closed the year at or close to highs. Equity markets, however, were not the only places displaying strength.
Commodities also advanced into the end of the year with the Goldman Sachs Commodity Index closing near its year-high, as underlying components such as oil, aluminum, and nickel exhibited strength. �is global optimism led the yields on the 3-month treasury bill and 5-year treasury note to close 2017 at near highs, even though there was little evidence of in�ation. In fact, the only major benchmark seeing a signi�cant retreat in 2017 was the CBOE Volatility index – also known as the VIX Index – which tends to decline when US equities rally.
�e global stock rally appears to have been fueled by improving corporate earnings, strengthening economies around the world, and supportive monetary policy from the global central banks. Many of these factors have driven gains in US stocks, as domestic economic data has been setting six-year records. And with the passage of a new tax law that will reduce corporate tax burdens, investors remain bullish that economic expansion will continue in 2018.
Taking a closer look at economic
Small Mid Cap Value FundFourth Quarter 2017 Commentary
trends both in the US and overseas, one sees that economic expansion has been broad-based by sector. Business con�dence surveys such as the purchasing manager indices (PMI) reveal that 96 percent of the 28 countries tracked showed expansion of their manufacturing sectors and that 83 percent saw services sector expansion. Recent data suggest business spending is also starting to increase. Although tax reform was the sole item on the Trump agenda that successfully passed, the new Administration has been quietly reducing regulation which in turn is giving companies heightened con�dence to invest.
�is strong economic expansion has produced continued job growth. �e Eurozone jobless rate of 8.8% is at its lowest level in nine years. �e picture is even rosier in the US, where the unemployment rate remains historically low and the US continues to add jobs at a brisk clip: December’s unemployment rate held at 4.1%, the lowest in 17 years.
�is labor-market strength has helped drive growth in US consumer con�dence during the year, despite a small decline in December. Although wage growth has been slow, consumers have remained con�dent amid low unemployment and record job openings. Con�dence may improve further as many companies have announced measures to share some of the bene�ts of lower corporate taxes with employees through wage increases, one-time bonuses and bene�ts improvements.
Overall, the global economy appears to be on solid ground heading into 2018, with strong business and consumer con�dence, further strength in labor markets, higher wages and low borrowing costs. All this should set a backdrop for growth in consumer spending.
With lower corporate taxes, companies should have greater earnings and operating cash �ow leading to other interesting capital allocation options besides stock buy-backs and dividend increases, which have been used more frequently over the past few years. �e new tax law encourages capital spending, so we expect a rebound from current low levels of corporate investment. In addition, limits on interest deductibility will likely encourage certain companies to pay down debt or spur highly levered private companies to sell. Other companies will look to use the cash to grow via acquisition, thereby increasing M&A opportunities.
Worldwide merger and acquisition activity has exceeded $3 trillion for the fourth consecutive year, extending an unprecedented wave of deal making that should accelerate under new US tax reform. �e US remains the most active region with a record 12,400 deals, amounting to $1.4 trillion. As small and mid-cap value investors, we search for companies that are neglected or overlooked, snd selling at discounts to our calculation of intrinsic value. We also seek companies that present restructuring opportunities to improve their outlook, making them attractive consolidation candidates. A major historical performance driver for the Fund has been merger and acquisition activity. In the Fund, we had three companies acquired this past year: Tribune Media (TRCO), a broadcast network company; Allied World Assurance Corp., (AWH), a global insurance company; and Orbital ATK, Inc. (OA), an aerospace and defense company, and we believe that this activity will increase further in 2018.
We do, however, see three potential threats to further stock market gains - higher in�ation, elevated valuations and geopolitical risk. Oil and other commodity prices have ticked up, and this could push prices higher. In addition, the tighter labor market may ultimately drive higher wages and more in�ation. So far, these factors look manageable, but if they accelerate, the Fed and other central banks may tighten more aggressively. Valuation is the second challenge. We are eight years into a stock market recovery. Over the last several years, earnings gains have failed to keep pace with stock price appreciation. At year-end, the S&P 500 traded at 18.2x estimated 2018 earnings, well above the 15.7x average since 1999. Small-Mid caps, as measured by the Russell 2500, trade at 21.2x vs. the long-term average of 15.5x. At this point in the business cycle, the market has
historically had a di�cult time exceeding 19x forward earnings. However, we think that valuations are not as high as they appear because the impact of tax reform is not yet fully re�ected in analyst estimates, and many strategists think that the new lower tax rate will add 5%-10% to corporate earnings. For our smaller, mid-sized companies, we think the positive impact could be double this amount, largely owing to the more domestic sources of earnings for these companies vs. those in the S&P 500. �ere remain many unanswered questions, such as how much of the bene�t will be shared with employees and/or customers, how much will be reinvested and how much will be competed away. In addition, even adjusted for the impact of tax reform, valuations remain above average.
Finally, unexpected geopolitical developments now seem likely to be more of a challenge than an opportunity.
For the fourth quarter, the Fund’s strong outperformance was primarily driven by positive stock selection in Financials, Utilities, Industrials and Consumer Staples. Voya Financial announced a transformative transaction to sell both its closed block variable and �xed annuities businesses simplifying the company and strengthening its capital position. Within Utilities, NRG began announcing asset sales demonstrating that it is executing its business transformation strategy. Better than expected earnings at ITT and Copart led to outperformance in Industrials while within Consumer Staples, Lamb Weston delivered its �fth consecutive earnings beat since being spun o� from Conagra. �e only sector with negative attribution was Consumer Discretionary as Del Taco Restaurants tempered new store and earnings growth expectations. On the sector allocation side, positive allocation was driven by our overweight in Industrials, the third best performing sector, and our underweight the second to worst performing sector, Healthcare.
Contributors and Detractors
�e top three performing stocks in the quarter were:
Voya Financial Inc. (VOYA) is a leading provider of retirement and investment services such as life insurance, annuities, and 401(k) plans. It was carved out of Dutch �nancial services conglomerate ING in 2013 and has worked to lower its risk, change its product mix, and improve returns in recent years. Despite its operating improvements, the stock traded at a discounted valuation due to the overhang from a large closed-block of older, riskier variable annuities. Late in the fourth quarter, Voya announced that it had sold this block and an annuities business to a new private-equity backed company. We believe the transaction will further reduce risk, improve returns, and remove the overhang. �e company has already bought back ~ 40% of the outstanding shares since going public in 2013, and has announced that they will buy back another $1.5 Bill of stock in 2018.
ITT, Inc. (ITT) is a diversi�ed industrial manufacturer of critical components for a wide variety of end markets. Two factors propelled the stock’s outperformance during the fourth quarter. First, the company began to see an improvement in orders from oil & gas customers in the third quarter and noted a signi�cant improvement in segment operating margins versus a year ago due to ongoing restructuring e�orts. Second, the company saw another strong quarter in its brake pad business as it won awards on fourteen new platforms from Chinese OEMs which helped drive a 22% increase in orders.
NRG Energy, Inc. (NRG) is an independent producer of electricity with a portfolio of 44 Gigawatts (GW) of conventional generation and 4.8GW of renewable assets, wholly-owned and through its controlling ownership in NRG Yield (NYLD). NRG was a main contributor to performance for the second quarter in a row. Last quarter, we mentioned the company’s restructuring e�orts and our positive view of such e�orts. �is was once again rea�rmed this quarter as the company continues to execute on these plans, which continue to run ahead of schedule. We expect the next upcoming catalyst to be further announcements on asset sales, including its ownership of NRG
KEELEY Funds |
Yield (NYLD).
�e bottom three performing stocks in the quarter were:
Del Taco Restaurants, Inc. (TACO) engages in developing, franchising, owning, and operating Del Taco quick-service Mexican-American restaurants. Led by recently promoted CEO, John Cappasola, the California based company has been successful at revitalizing the brand and introducing new products as evident by sixteen consecutive quarters of systemwide sales growth. Despite reporting sales growth of 4.1% in the third quarter, the stock sold o� on concerns regarding future margin headwinds stemming from both food and labor in�ation. In addition, the industry continues to �ght for market share by pushing “value bundles” led by the larger brands such as McDonalds. We continue to believe the company is well positioned to weather this environment and will continue to prudently grow outside its core West Coast roots utilizing a barbell menu strategy of new entrees combined with compelling “buck and under” menu items.
Sabra Health Care REIT, Inc. (SBRA) is a company that invests in real estate within the health care space, speci�cally skilled nursing and senior housing facilities. For the second quarter in a row, Sabra �nds its way to the bottom contributors as investors remain skeptical of the recently completed acquisition of larger rival Care Capital Properties (CCP) and two other transformative acquisitions. Additionally, the company announced the complete disposition of a legacy struggling operator. We feel that management has been making the right moves to diversify its portfolio mix and the stock is inexpensive especially supported by the 11%+ dividend yield.
Wright Medical Group, NV (WMGI) is a global orthopedic medical device company focused on upper/lower extremities and biologics. �e company underperformed as it su�ered disruption from a sizable sales force expansion that ultimately resulted in a reduction of earnings guidance. While it is taking much longer for the new sales representatives to reach full productivity, the 50% increase in the size of the salesforce will ultimately be bene�cial for the company as it results in accelerating sales and earnings growth.
Conclusion
In conclusion, thank you for investing alongside us in the KEELEY Small Mid Cap Value Fund. We will continue to work hard to justify your con�dence and trust.
The performance re�ected herein is for the Class A shares without load. “Without load” does not re�ect the deduction of the maximum 4.50% sales fee (load), which reduces the performance quoted. Past performance does not guarantee future results. The performance data quoted represents past performance and current returns may be lower or higher. The investment return and principal will �uctuate so that an investor’s shares, when redeemed, may be worth more or less than the original cost. Current to most recent month-end performance data may be obtained at www.KeeleyFunds.com
This summary represents the views of the portfolio managers as of 12/31/17. Those views may change, and the Fund disclaims any obligation to advise investors of such changes. For the purpose of determining the Fund’s holdings, securities of the same issuer are aggregated to determine the weight in the Fund. Portfolio holdings are subject to change without notice and are not intended as recommendations of individual securities.
*The Fund’s Inception date is August 15, 2007.
Risks: Smaller and medium-sized company stocks are more volatile and less liquid than larger, more established company securities.
Prior to investing, investors should carefully consider the Fund’s invest-ment objective, risks, charges and expenses as detailed in the prospectus and summary prospectus. To obtain a prospectus or a summary prospectus, call us at 800.533.5344 or visit www.keeleyfunds.com. The prospec-tus/summary prospectus should be read carefully before investing.
Source: U.S. Bureau of Economic Analysis, Factset. Grey represents recession periods.
Market Performance
As of December 31, 2017 3 Months YTD 1-Year
S&P 500 Index 6.6% 21.8% 21.8%
Russell 3000 Value Index 5.1% 13.2% 13.2%
Russell 3000 Index 6.3% 21.1% 21.1%
Russell 2500 Value Index 4.3% 10.4% 10.4%
Russell Midcap Value Index 5.5% 13.3% 13.3%
Russell 2000 Index 3.3% 14.6% 14.6%
Russell 2000 Value Index 2.0% 7.8% 7.8%
Bloomberg Barclays Agg. Bond Index 0.4% 3.5% 3.5%
USA Real GDP Growth (Q1 2008 - Q4 2017)
To Our Shareholders,
For the quarter ended December 31, 2017, the KEELEY Small Mid Cap Value Fund’s net asset value (“NAV”) per Class A share rose 5.60% versus a gain of 4.25% for the Russell 2500 Value Index. For the year, the Fund gained 17.76% compared with a 10.36% gain for the Index.
Commentary
�e markets ended the year on a strong note, with the major US equity indices at or near all-time highs. �e holiday cheer was not con�ned to the US as stock markets in the UK, France, Germany, Japan, India, and Brazil all closed the year at or close to highs. Equity markets, however, were not the only places displaying strength.
Commodities also advanced into the end of the year with the Goldman Sachs Commodity Index closing near its year-high, as underlying components such as oil, aluminum, and nickel exhibited strength. �is global optimism led the yields on the 3-month treasury bill and 5-year treasury note to close 2017 at near highs, even though there was little evidence of in�ation. In fact, the only major benchmark seeing a signi�cant retreat in 2017 was the CBOE Volatility index – also known as the VIX Index – which tends to decline when US equities rally.
�e global stock rally appears to have been fueled by improving corporate earnings, strengthening economies around the world, and supportive monetary policy from the global central banks. Many of these factors have driven gains in US stocks, as domestic economic data has been setting six-year records. And with the passage of a new tax law that will reduce corporate tax burdens, investors remain bullish that economic expansion will continue in 2018.
Taking a closer look at economic
www.KeeleyFunds.com | 800.533.5344
Small Mid Cap Value Fund
trends both in the US and overseas, one sees that economic expansion has been broad-based by sector. Business con�dence surveys such as the purchasing manager indices (PMI) reveal that 96 percent of the 28 countries tracked showed expansion of their manufacturing sectors and that 83 percent saw services sector expansion. Recent data suggest business spending is also starting to increase. Although tax reform was the sole item on the Trump agenda that successfully passed, the new Administration has been quietly reducing regulation which in turn is giving companies heightened con�dence to invest.
�is strong economic expansion has produced continued job growth. �e Eurozone jobless rate of 8.8% is at its lowest level in nine years. �e picture is even rosier in the US, where the unemployment rate remains historically low and the US continues to add jobs at a brisk clip: December’s unemployment rate held at 4.1%, the lowest in 17 years.
�is labor-market strength has helped drive growth in US consumer con�dence during the year, despite a small decline in December. Although wage growth has been slow, consumers have remained con�dent amid low unemployment and record job openings. Con�dence may improve further as many companies have announced measures to share some of the bene�ts of lower corporate taxes with employees through wage increases, one-time bonuses and bene�ts improvements.
Overall, the global economy appears to be on solid ground heading into 2018, with strong business and consumer con�dence, further strength in labor markets, higher wages and low borrowing costs. All this should set a backdrop for growth in consumer spending.
With lower corporate taxes, companies should have greater earnings and operating cash �ow leading to other interesting capital allocation options besides stock buy-backs and dividend increases, which have been used more frequently over the past few years. �e new tax law encourages capital spending, so we expect a rebound from current low levels of corporate investment. In addition, limits on interest deductibility will likely encourage certain companies to pay down debt or spur highly levered private companies to sell. Other companies will look to use the cash to grow via acquisition, thereby increasing M&A opportunities.
Worldwide merger and acquisition activity has exceeded $3 trillion for the fourth consecutive year, extending an unprecedented wave of deal making that should accelerate under new US tax reform. �e US remains the most active region with a record 12,400 deals, amounting to $1.4 trillion. As small and mid-cap value investors, we search for companies that are neglected or overlooked, snd selling at discounts to our calculation of intrinsic value. We also seek companies that present restructuring opportunities to improve their outlook, making them attractive consolidation candidates. A major historical performance driver for the Fund has been merger and acquisition activity. In the Fund, we had three companies acquired this past year: Tribune Media (TRCO), a broadcast network company; Allied World Assurance Corp., (AWH), a global insurance company; and Orbital ATK, Inc. (OA), an aerospace and defense company, and we believe that this activity will increase further in 2018.
We do, however, see three potential threats to further stock market gains - higher in�ation, elevated valuations and geopolitical risk. Oil and other commodity prices have ticked up, and this could push prices higher. In addition, the tighter labor market may ultimately drive higher wages and more in�ation. So far, these factors look manageable, but if they accelerate, the Fed and other central banks may tighten more aggressively. Valuation is the second challenge. We are eight years into a stock market recovery. Over the last several years, earnings gains have failed to keep pace with stock price appreciation. At year-end, the S&P 500 traded at 18.2x estimated 2018 earnings, well above the 15.7x average since 1999. Small-Mid caps, as measured by the Russell 2500, trade at 21.2x vs. the long-term average of 15.5x. At this point in the business cycle, the market has
historically had a di�cult time exceeding 19x forward earnings. However, we think that valuations are not as high as they appear because the impact of tax reform is not yet fully re�ected in analyst estimates, and many strategists think that the new lower tax rate will add 5%-10% to corporate earnings. For our smaller, mid-sized companies, we think the positive impact could be double this amount, largely owing to the more domestic sources of earnings for these companies vs. those in the S&P 500. �ere remain many unanswered questions, such as how much of the bene�t will be shared with employees and/or customers, how much will be reinvested and how much will be competed away. In addition, even adjusted for the impact of tax reform, valuations remain above average.
Finally, unexpected geopolitical developments now seem likely to be more of a challenge than an opportunity.
For the fourth quarter, the Fund’s strong outperformance was primarily driven by positive stock selection in Financials, Utilities, Industrials and Consumer Staples. Voya Financial announced a transformative transaction to sell both its closed block variable and �xed annuities businesses simplifying the company and strengthening its capital position. Within Utilities, NRG began announcing asset sales demonstrating that it is executing its business transformation strategy. Better than expected earnings at ITT and Copart led to outperformance in Industrials while within Consumer Staples, Lamb Weston delivered its �fth consecutive earnings beat since being spun o� from Conagra. �e only sector with negative attribution was Consumer Discretionary as Del Taco Restaurants tempered new store and earnings growth expectations. On the sector allocation side, positive allocation was driven by our overweight in Industrials, the third best performing sector, and our underweight the second to worst performing sector, Healthcare.
Contributors and Detractors
�e top three performing stocks in the quarter were:
Voya Financial Inc. (VOYA) is a leading provider of retirement and investment services such as life insurance, annuities, and 401(k) plans. It was carved out of Dutch �nancial services conglomerate ING in 2013 and has worked to lower its risk, change its product mix, and improve returns in recent years. Despite its operating improvements, the stock traded at a discounted valuation due to the overhang from a large closed-block of older, riskier variable annuities. Late in the fourth quarter, Voya announced that it had sold this block and an annuities business to a new private-equity backed company. We believe the transaction will further reduce risk, improve returns, and remove the overhang. �e company has already bought back ~ 40% of the outstanding shares since going public in 2013, and has announced that they will buy back another $1.5 Bill of stock in 2018.
ITT, Inc. (ITT) is a diversi�ed industrial manufacturer of critical components for a wide variety of end markets. Two factors propelled the stock’s outperformance during the fourth quarter. First, the company began to see an improvement in orders from oil & gas customers in the third quarter and noted a signi�cant improvement in segment operating margins versus a year ago due to ongoing restructuring e�orts. Second, the company saw another strong quarter in its brake pad business as it won awards on fourteen new platforms from Chinese OEMs which helped drive a 22% increase in orders.
NRG Energy, Inc. (NRG) is an independent producer of electricity with a portfolio of 44 Gigawatts (GW) of conventional generation and 4.8GW of renewable assets, wholly-owned and through its controlling ownership in NRG Yield (NYLD). NRG was a main contributor to performance for the second quarter in a row. Last quarter, we mentioned the company’s restructuring e�orts and our positive view of such e�orts. �is was once again rea�rmed this quarter as the company continues to execute on these plans, which continue to run ahead of schedule. We expect the next upcoming catalyst to be further announcements on asset sales, including its ownership of NRG
Fourth Quarter 2017 Commentary
KEELEY Funds |
Yield (NYLD).
�e bottom three performing stocks in the quarter were:
Del Taco Restaurants, Inc. (TACO) engages in developing, franchising, owning, and operating Del Taco quick-service Mexican-American restaurants. Led by recently promoted CEO, John Cappasola, the California based company has been successful at revitalizing the brand and introducing new products as evident by sixteen consecutive quarters of systemwide sales growth. Despite reporting sales growth of 4.1% in the third quarter, the stock sold o� on concerns regarding future margin headwinds stemming from both food and labor in�ation. In addition, the industry continues to �ght for market share by pushing “value bundles” led by the larger brands such as McDonalds. We continue to believe the company is well positioned to weather this environment and will continue to prudently grow outside its core West Coast roots utilizing a barbell menu strategy of new entrees combined with compelling “buck and under” menu items.
Sabra Health Care REIT, Inc. (SBRA) is a company that invests in real estate within the health care space, speci�cally skilled nursing and senior housing facilities. For the second quarter in a row, Sabra �nds its way to the bottom contributors as investors remain skeptical of the recently completed acquisition of larger rival Care Capital Properties (CCP) and two other transformative acquisitions. Additionally, the company announced the complete disposition of a legacy struggling operator. We feel that management has been making the right moves to diversify its portfolio mix and the stock is inexpensive especially supported by the 11%+ dividend yield.
Wright Medical Group, NV (WMGI) is a global orthopedic medical device company focused on upper/lower extremities and biologics. �e company underperformed as it su�ered disruption from a sizable sales force expansion that ultimately resulted in a reduction of earnings guidance. While it is taking much longer for the new sales representatives to reach full productivity, the 50% increase in the size of the salesforce will ultimately be bene�cial for the company as it results in accelerating sales and earnings growth.
Conclusion
In conclusion, thank you for investing alongside us in the KEELEY Small Mid Cap Value Fund. We will continue to work hard to justify your con�dence and trust.

To Our Shareholders,
For the quarter ended December 31, 2017, the KEELEY Small Mid Cap Value Fund’s net asset value (“NAV”) per Class A share rose 5.60% versus a gain of 4.25% for the Russell 2500 Value Index. For the year, the Fund gained 17.76% compared with a 10.36% gain for the Index.
Commentary
�e markets ended the year on a strong note, with the major US equity indices at or near all-time highs. �e holiday cheer was not con�ned to the US as stock markets in the UK, France, Germany, Japan, India, and Brazil all closed the year at or close to highs. Equity markets, however, were not the only places displaying strength.
Commodities also advanced into the end of the year with the Goldman Sachs Commodity Index closing near its year-high, as underlying components such as oil, aluminum, and nickel exhibited strength. �is global optimism led the yields on the 3-month treasury bill and 5-year treasury note to close 2017 at near highs, even though there was little evidence of in�ation. In fact, the only major benchmark seeing a signi�cant retreat in 2017 was the CBOE Volatility index – also known as the VIX Index – which tends to decline when US equities rally.
�e global stock rally appears to have been fueled by improving corporate earnings, strengthening economies around the world, and supportive monetary policy from the global central banks. Many of these factors have driven gains in US stocks, as domestic economic data has been setting six-year records. And with the passage of a new tax law that will reduce corporate tax burdens, investors remain bullish that economic expansion will continue in 2018.
Taking a closer look at economic
trends both in the US and overseas, one sees that economic expansion has been broad-based by sector. Business con�dence surveys such as the purchasing manager indices (PMI) reveal that 96 percent of the 28 countries tracked showed expansion of their manufacturing sectors and that 83 percent saw services sector expansion. Recent data suggest business spending is also starting to increase. Although tax reform was the sole item on the Trump agenda that successfully passed, the new Administration has been quietly reducing regulation which in turn is giving companies heightened con�dence to invest.
�is strong economic expansion has produced continued job growth. �e Eurozone jobless rate of 8.8% is at its lowest level in nine years. �e picture is even rosier in the US, where the unemployment rate remains historically low and the US continues to add jobs at a brisk clip: December’s unemployment rate held at 4.1%, the lowest in 17 years.
�is labor-market strength has helped drive growth in US consumer con�dence during the year, despite a small decline in December. Although wage growth has been slow, consumers have remained con�dent amid low unemployment and record job openings. Con�dence may improve further as many companies have announced measures to share some of the bene�ts of lower corporate taxes with employees through wage increases, one-time bonuses and bene�ts improvements.
Overall, the global economy appears to be on solid ground heading into 2018, with strong business and consumer con�dence, further strength in labor markets, higher wages and low borrowing costs. All this should set a backdrop for growth in consumer spending.
With lower corporate taxes, companies should have greater earnings and operating cash �ow leading to other interesting capital allocation options besides stock buy-backs and dividend increases, which have been used more frequently over the past few years. �e new tax law encourages capital spending, so we expect a rebound from current low levels of corporate investment. In addition, limits on interest deductibility will likely encourage certain companies to pay down debt or spur highly levered private companies to sell. Other companies will look to use the cash to grow via acquisition, thereby increasing M&A opportunities.
Worldwide merger and acquisition activity has exceeded $3 trillion for the fourth consecutive year, extending an unprecedented wave of deal making that should accelerate under new US tax reform. �e US remains the most active region with a record 12,400 deals, amounting to $1.4 trillion. As small and mid-cap value investors, we search for companies that are neglected or overlooked, snd selling at discounts to our calculation of intrinsic value. We also seek companies that present restructuring opportunities to improve their outlook, making them attractive consolidation candidates. A major historical performance driver for the Fund has been merger and acquisition activity. In the Fund, we had three companies acquired this past year: Tribune Media (TRCO), a broadcast network company; Allied World Assurance Corp., (AWH), a global insurance company; and Orbital ATK, Inc. (OA), an aerospace and defense company, and we believe that this activity will increase further in 2018.
We do, however, see three potential threats to further stock market gains - higher in�ation, elevated valuations and geopolitical risk. Oil and other commodity prices have ticked up, and this could push prices higher. In addition, the tighter labor market may ultimately drive higher wages and more in�ation. So far, these factors look manageable, but if they accelerate, the Fed and other central banks may tighten more aggressively. Valuation is the second challenge. We are eight years into a stock market recovery. Over the last several years, earnings gains have failed to keep pace with stock price appreciation. At year-end, the S&P 500 traded at 18.2x estimated 2018 earnings, well above the 15.7x average since 1999. Small-Mid caps, as measured by the Russell 2500, trade at 21.2x vs. the long-term average of 15.5x. At this point in the business cycle, the market has
historically had a di�cult time exceeding 19x forward earnings. However, we think that valuations are not as high as they appear because the impact of tax reform is not yet fully re�ected in analyst estimates, and many strategists think that the new lower tax rate will add 5%-10% to corporate earnings. For our smaller, mid-sized companies, we think the positive impact could be double this amount, largely owing to the more domestic sources of earnings for these companies vs. those in the S&P 500. �ere remain many unanswered questions, such as how much of the bene�t will be shared with employees and/or customers, how much will be reinvested and how much will be competed away. In addition, even adjusted for the impact of tax reform, valuations remain above average.
Finally, unexpected geopolitical developments now seem likely to be more of a challenge than an opportunity.
For the fourth quarter, the Fund’s strong outperformance was primarily driven by positive stock selection in Financials, Utilities, Industrials and Consumer Staples. Voya Financial announced a transformative transaction to sell both its closed block variable and �xed annuities businesses simplifying the company and strengthening its capital position. Within Utilities, NRG began announcing asset sales demonstrating that it is executing its business transformation strategy. Better than expected earnings at ITT and Copart led to outperformance in Industrials while within Consumer Staples, Lamb Weston delivered its �fth consecutive earnings beat since being spun o� from Conagra. �e only sector with negative attribution was Consumer Discretionary as Del Taco Restaurants tempered new store and earnings growth expectations. On the sector allocation side, positive allocation was driven by our overweight in Industrials, the third best performing sector, and our underweight the second to worst performing sector, Healthcare.
Contributors and Detractors
�e top three performing stocks in the quarter were:
Voya Financial Inc. (VOYA) is a leading provider of retirement and investment services such as life insurance, annuities, and 401(k) plans. It was carved out of Dutch �nancial services conglomerate ING in 2013 and has worked to lower its risk, change its product mix, and improve returns in recent years. Despite its operating improvements, the stock traded at a discounted valuation due to the overhang from a large closed-block of older, riskier variable annuities. Late in the fourth quarter, Voya announced that it had sold this block and an annuities business to a new private-equity backed company. We believe the transaction will further reduce risk, improve returns, and remove the overhang. �e company has already bought back ~ 40% of the outstanding shares since going public in 2013, and has announced that they will buy back another $1.5 Bill of stock in 2018.
ITT, Inc. (ITT) is a diversi�ed industrial manufacturer of critical components for a wide variety of end markets. Two factors propelled the stock’s outperformance during the fourth quarter. First, the company began to see an improvement in orders from oil & gas customers in the third quarter and noted a signi�cant improvement in segment operating margins versus a year ago due to ongoing restructuring e�orts. Second, the company saw another strong quarter in its brake pad business as it won awards on fourteen new platforms from Chinese OEMs which helped drive a 22% increase in orders.
NRG Energy, Inc. (NRG) is an independent producer of electricity with a portfolio of 44 Gigawatts (GW) of conventional generation and 4.8GW of renewable assets, wholly-owned and through its controlling ownership in NRG Yield (NYLD). NRG was a main contributor to performance for the second quarter in a row. Last quarter, we mentioned the company’s restructuring e�orts and our positive view of such e�orts. �is was once again rea�rmed this quarter as the company continues to execute on these plans, which continue to run ahead of schedule. We expect the next upcoming catalyst to be further announcements on asset sales, including its ownership of NRG
Yield (NYLD).
�e bottom three performing stocks in the quarter were:
Del Taco Restaurants, Inc. (TACO) engages in developing, franchising, owning, and operating Del Taco quick-service Mexican-American restaurants. Led by recently promoted CEO, John Cappasola, the California based company has been successful at revitalizing the brand and introducing new products as evident by sixteen consecutive quarters of systemwide sales growth. Despite reporting sales growth of 4.1% in the third quarter, the stock sold o� on concerns regarding future margin headwinds stemming from both food and labor in�ation. In addition, the industry continues to �ght for market share by pushing “value bundles” led by the larger brands such as McDonalds. We continue to believe the company is well positioned to weather this environment and will continue to prudently grow outside its core West Coast roots utilizing a barbell menu strategy of new entrees combined with compelling “buck and under” menu items.
Sabra Health Care REIT, Inc. (SBRA) is a company that invests in real estate within the health care space, speci�cally skilled nursing and senior housing facilities. For the second quarter in a row, Sabra �nds its way to the bottom contributors as investors remain skeptical of the recently completed acquisition of larger rival Care Capital Properties (CCP) and two other transformative acquisitions. Additionally, the company announced the complete disposition of a legacy struggling operator. We feel that management has been making the right moves to diversify its portfolio mix and the stock is inexpensive especially supported by the 11%+ dividend yield.
Wright Medical Group, NV (WMGI) is a global orthopedic medical device company focused on upper/lower extremities and biologics. �e company underperformed as it su�ered disruption from a sizable sales force expansion that ultimately resulted in a reduction of earnings guidance. While it is taking much longer for the new sales representatives to reach full productivity, the 50% increase in the size of the salesforce will ultimately be bene�cial for the company as it results in accelerating sales and earnings growth.
Conclusion
In conclusion, thank you for investing alongside us in the KEELEY Small Mid Cap Value Fund. We will continue to work hard to justify your con�dence and trust.
www.KeeleyFunds.com | 800.533.5344
Small Mid Cap Value FundFourth Quarter 2017 Commentary
KEELEY Funds |
To Our Shareholders,
For the quarter ended December 31, 2017, the KEELEY Small Mid Cap Value Fund’s net asset value (“NAV”) per Class A share rose 5.60% versus a gain of 4.25% for the Russell 2500 Value Index. For the year, the Fund gained 17.76% compared with a 10.36% gain for the Index.
Commentary
�e markets ended the year on a strong note, with the major US equity indices at or near all-time highs. �e holiday cheer was not con�ned to the US as stock markets in the UK, France, Germany, Japan, India, and Brazil all closed the year at or close to highs. Equity markets, however, were not the only places displaying strength.
Commodities also advanced into the end of the year with the Goldman Sachs Commodity Index closing near its year-high, as underlying components such as oil, aluminum, and nickel exhibited strength. �is global optimism led the yields on the 3-month treasury bill and 5-year treasury note to close 2017 at near highs, even though there was little evidence of in�ation. In fact, the only major benchmark seeing a signi�cant retreat in 2017 was the CBOE Volatility index – also known as the VIX Index – which tends to decline when US equities rally.
�e global stock rally appears to have been fueled by improving corporate earnings, strengthening economies around the world, and supportive monetary policy from the global central banks. Many of these factors have driven gains in US stocks, as domestic economic data has been setting six-year records. And with the passage of a new tax law that will reduce corporate tax burdens, investors remain bullish that economic expansion will continue in 2018.
Taking a closer look at economic
trends both in the US and overseas, one sees that economic expansion has been broad-based by sector. Business con�dence surveys such as the purchasing manager indices (PMI) reveal that 96 percent of the 28 countries tracked showed expansion of their manufacturing sectors and that 83 percent saw services sector expansion. Recent data suggest business spending is also starting to increase. Although tax reform was the sole item on the Trump agenda that successfully passed, the new Administration has been quietly reducing regulation which in turn is giving companies heightened con�dence to invest.
�is strong economic expansion has produced continued job growth. �e Eurozone jobless rate of 8.8% is at its lowest level in nine years. �e picture is even rosier in the US, where the unemployment rate remains historically low and the US continues to add jobs at a brisk clip: December’s unemployment rate held at 4.1%, the lowest in 17 years.
�is labor-market strength has helped drive growth in US consumer con�dence during the year, despite a small decline in December. Although wage growth has been slow, consumers have remained con�dent amid low unemployment and record job openings. Con�dence may improve further as many companies have announced measures to share some of the bene�ts of lower corporate taxes with employees through wage increases, one-time bonuses and bene�ts improvements.
Overall, the global economy appears to be on solid ground heading into 2018, with strong business and consumer con�dence, further strength in labor markets, higher wages and low borrowing costs. All this should set a backdrop for growth in consumer spending.
With lower corporate taxes, companies should have greater earnings and operating cash �ow leading to other interesting capital allocation options besides stock buy-backs and dividend increases, which have been used more frequently over the past few years. �e new tax law encourages capital spending, so we expect a rebound from current low levels of corporate investment. In addition, limits on interest deductibility will likely encourage certain companies to pay down debt or spur highly levered private companies to sell. Other companies will look to use the cash to grow via acquisition, thereby increasing M&A opportunities.
Worldwide merger and acquisition activity has exceeded $3 trillion for the fourth consecutive year, extending an unprecedented wave of deal making that should accelerate under new US tax reform. �e US remains the most active region with a record 12,400 deals, amounting to $1.4 trillion. As small and mid-cap value investors, we search for companies that are neglected or overlooked, snd selling at discounts to our calculation of intrinsic value. We also seek companies that present restructuring opportunities to improve their outlook, making them attractive consolidation candidates. A major historical performance driver for the Fund has been merger and acquisition activity. In the Fund, we had three companies acquired this past year: Tribune Media (TRCO), a broadcast network company; Allied World Assurance Corp., (AWH), a global insurance company; and Orbital ATK, Inc. (OA), an aerospace and defense company, and we believe that this activity will increase further in 2018.
We do, however, see three potential threats to further stock market gains - higher in�ation, elevated valuations and geopolitical risk. Oil and other commodity prices have ticked up, and this could push prices higher. In addition, the tighter labor market may ultimately drive higher wages and more in�ation. So far, these factors look manageable, but if they accelerate, the Fed and other central banks may tighten more aggressively. Valuation is the second challenge. We are eight years into a stock market recovery. Over the last several years, earnings gains have failed to keep pace with stock price appreciation. At year-end, the S&P 500 traded at 18.2x estimated 2018 earnings, well above the 15.7x average since 1999. Small-Mid caps, as measured by the Russell 2500, trade at 21.2x vs. the long-term average of 15.5x. At this point in the business cycle, the market has
historically had a di�cult time exceeding 19x forward earnings. However, we think that valuations are not as high as they appear because the impact of tax reform is not yet fully re�ected in analyst estimates, and many strategists think that the new lower tax rate will add 5%-10% to corporate earnings. For our smaller, mid-sized companies, we think the positive impact could be double this amount, largely owing to the more domestic sources of earnings for these companies vs. those in the S&P 500. �ere remain many unanswered questions, such as how much of the bene�t will be shared with employees and/or customers, how much will be reinvested and how much will be competed away. In addition, even adjusted for the impact of tax reform, valuations remain above average.
Finally, unexpected geopolitical developments now seem likely to be more of a challenge than an opportunity.
For the fourth quarter, the Fund’s strong outperformance was primarily driven by positive stock selection in Financials, Utilities, Industrials and Consumer Staples. Voya Financial announced a transformative transaction to sell both its closed block variable and �xed annuities businesses simplifying the company and strengthening its capital position. Within Utilities, NRG began announcing asset sales demonstrating that it is executing its business transformation strategy. Better than expected earnings at ITT and Copart led to outperformance in Industrials while within Consumer Staples, Lamb Weston delivered its �fth consecutive earnings beat since being spun o� from Conagra. �e only sector with negative attribution was Consumer Discretionary as Del Taco Restaurants tempered new store and earnings growth expectations. On the sector allocation side, positive allocation was driven by our overweight in Industrials, the third best performing sector, and our underweight the second to worst performing sector, Healthcare.
Contributors and Detractors
�e top three performing stocks in the quarter were:
Voya Financial Inc. (VOYA) is a leading provider of retirement and investment services such as life insurance, annuities, and 401(k) plans. It was carved out of Dutch �nancial services conglomerate ING in 2013 and has worked to lower its risk, change its product mix, and improve returns in recent years. Despite its operating improvements, the stock traded at a discounted valuation due to the overhang from a large closed-block of older, riskier variable annuities. Late in the fourth quarter, Voya announced that it had sold this block and an annuities business to a new private-equity backed company. We believe the transaction will further reduce risk, improve returns, and remove the overhang. �e company has already bought back ~ 40% of the outstanding shares since going public in 2013, and has announced that they will buy back another $1.5 Bill of stock in 2018.
ITT, Inc. (ITT) is a diversi�ed industrial manufacturer of critical components for a wide variety of end markets. Two factors propelled the stock’s outperformance during the fourth quarter. First, the company began to see an improvement in orders from oil & gas customers in the third quarter and noted a signi�cant improvement in segment operating margins versus a year ago due to ongoing restructuring e�orts. Second, the company saw another strong quarter in its brake pad business as it won awards on fourteen new platforms from Chinese OEMs which helped drive a 22% increase in orders.
NRG Energy, Inc. (NRG) is an independent producer of electricity with a portfolio of 44 Gigawatts (GW) of conventional generation and 4.8GW of renewable assets, wholly-owned and through its controlling ownership in NRG Yield (NYLD). NRG was a main contributor to performance for the second quarter in a row. Last quarter, we mentioned the company’s restructuring e�orts and our positive view of such e�orts. �is was once again rea�rmed this quarter as the company continues to execute on these plans, which continue to run ahead of schedule. We expect the next upcoming catalyst to be further announcements on asset sales, including its ownership of NRG
Yield (NYLD).
�e bottom three performing stocks in the quarter were:
Del Taco Restaurants, Inc. (TACO) engages in developing, franchising, owning, and operating Del Taco quick-service Mexican-American restaurants. Led by recently promoted CEO, John Cappasola, the California based company has been successful at revitalizing the brand and introducing new products as evident by sixteen consecutive quarters of systemwide sales growth. Despite reporting sales growth of 4.1% in the third quarter, the stock sold o� on concerns regarding future margin headwinds stemming from both food and labor in�ation. In addition, the industry continues to �ght for market share by pushing “value bundles” led by the larger brands such as McDonalds. We continue to believe the company is well positioned to weather this environment and will continue to prudently grow outside its core West Coast roots utilizing a barbell menu strategy of new entrees combined with compelling “buck and under” menu items.
Sabra Health Care REIT, Inc. (SBRA) is a company that invests in real estate within the health care space, speci�cally skilled nursing and senior housing facilities. For the second quarter in a row, Sabra �nds its way to the bottom contributors as investors remain skeptical of the recently completed acquisition of larger rival Care Capital Properties (CCP) and two other transformative acquisitions. Additionally, the company announced the complete disposition of a legacy struggling operator. We feel that management has been making the right moves to diversify its portfolio mix and the stock is inexpensive especially supported by the 11%+ dividend yield.
Wright Medical Group, NV (WMGI) is a global orthopedic medical device company focused on upper/lower extremities and biologics. �e company underperformed as it su�ered disruption from a sizable sales force expansion that ultimately resulted in a reduction of earnings guidance. While it is taking much longer for the new sales representatives to reach full productivity, the 50% increase in the size of the salesforce will ultimately be bene�cial for the company as it results in accelerating sales and earnings growth.
Conclusion
In conclusion, thank you for investing alongside us in the KEELEY Small Mid Cap Value Fund. We will continue to work hard to justify your con�dence and trust.
www.KeeleyFunds.com | 800.533.5344
Small Mid Cap Value FundFourth Quarter 2017 Commentary
www.KeeleyFunds.com | 800.533.5344
Small Mid Cap Value FundFourth Quarter 2017 Commentary
KEELEY Funds |
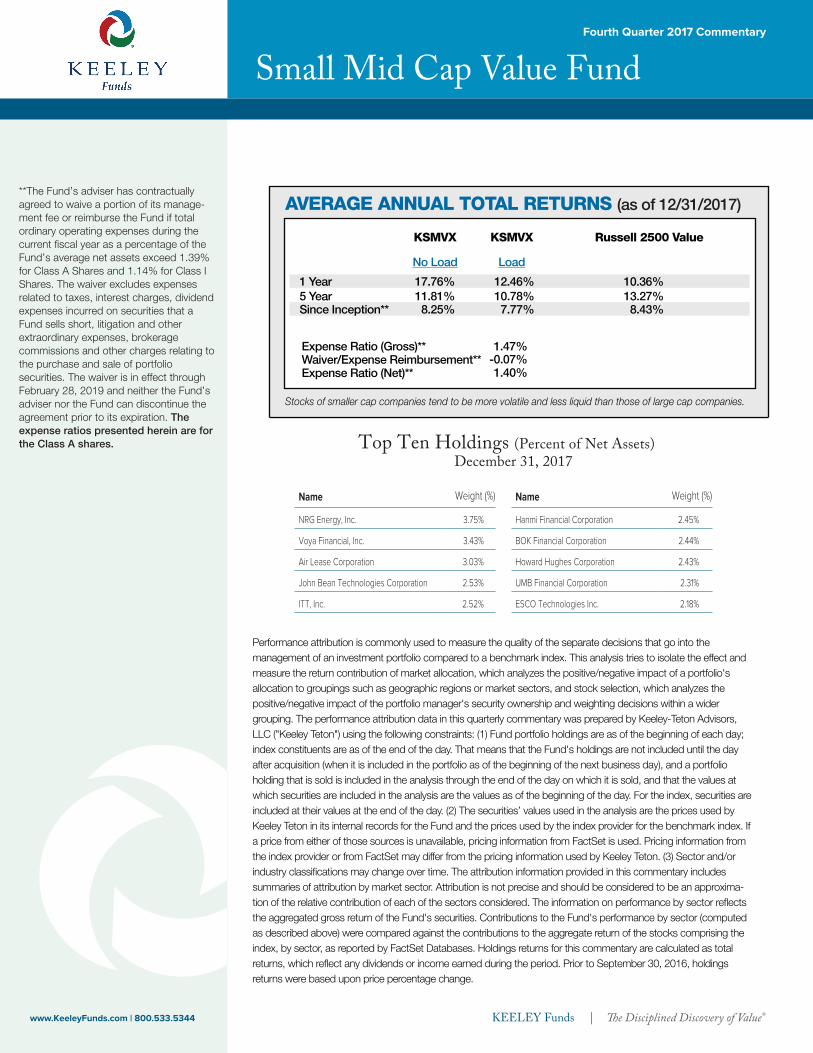
Name Weight (%)
NRG Energy, Inc. 3.75%
Voya Financial, Inc. 3.43%
Air Lease Corporation 3.03%
John Bean Technologies Corporation 2.53%
ITT, Inc. 2.52%
Top Ten Holdings (Percent of Net Assets) December 31, 2017
Name Weight (%)
Hanmi Financial Corporation 2.45%
BOK Financial Corporation 2.44%
Howard Hughes Corporation 2.43%
UMB Financial Corporation 2.31%
ESCO Technologies Inc. 2.18%
Stocks of smaller cap companies tend to be more volatile and less liquid than those of large cap companies.
KSMVX KSMVX
No Load Load
17.76% 12.46%11.81% 10.78%8.25% 7.77%
1 Year5 YearSince Inception**
1.40%Expense Ratio (Net)**
AVERAGE ANNUAL TOTAL RETURNS (as of 12/31/2017)
Russell 2500 Value
10.36%13.27%8.43%
**The Fund’s adviser has contractually agreed to waive a portion of its manage-ment fee or reimburse the Fund if total ordinary operating expenses during the current �scal year as a percentage of the Fund’s average net assets exceed 1.39% for Class A Shares and 1.14% for Class I Shares. The waiver excludes expenses related to taxes, interest charges, dividend expenses incurred on securities that a Fund sells short, litigation and other extraordinary expenses, brokerage commissions and other charges relating to the purchase and sale of portfolio securities. The waiver is in effect through February 28, 2019 and neither the Fund’s adviser nor the Fund can discontinue the agreement prior to its expiration. The expense ratios presented herein are for the Class A shares.
Performance attribution is commonly used to measure the quality of the separate decisions that go into the management of an investment portfolio compared to a benchmark index. This analysis tries to isolate the effect and measure the return contribution of market allocation, which analyzes the positive/negative impact of a portfolio's allocation to groupings such as geographic regions or market sectors, and stock selection, which analyzes the positive/negative impact of the portfolio manager's security ownership and weighting decisions within a wider grouping. The performance attribution data in this quarterly commentary was prepared by Keeley-Teton Advisors, LLC ("Keeley Teton") using the following constraints: (1) Fund portfolio holdings are as of the beginning of each day; index constituents are as of the end of the day. That means that the Fund's holdings are not included until the day after acquisition (when it is included in the portfolio as of the beginning of the next business day), and a portfolio holding that is sold is included in the analysis through the end of the day on which it is sold, and that the values at which securities are included in the analysis are the values as of the beginning of the day. For the index, securities are included at their values at the end of the day. (2) The securities’ values used in the analysis are the prices used by Keeley Teton in its internal records for the Fund and the prices used by the index provider for the benchmark index. If a price from either of those sources is unavailable, pricing information from FactSet is used. Pricing information from the index provider or from FactSet may differ from the pricing information used by Keeley Teton. (3) Sector and/or industry classi�cations may change over time. The attribution information provided in this commentary includes summaries of attribution by market sector. Attribution is not precise and should be considered to be an approxima-tion of the relative contribution of each of the sectors considered. The information on performance by sector re�ects the aggregated gross return of the Fund's securities. Contributions to the Fund's performance by sector (computed as described above) were compared against the contributions to the aggregate return of the stocks comprising the index, by sector, as reported by FactSet Databases. Holdings returns for this commentary are calculated as total returns, which re�ect any dividends or income earned during the period. Prior to September 30, 2016, holdings returns were based upon price percentage change.
The Global Industry Classi�cation Standard (“GICS”) was developed by and is the exclusive property and a service mark of MSCI Inc. ("MSCI") and Standard & Poor's, a division of The McGraw-Hill Companies, Inc. ("S&P") and is licensed for use by Keeley Teton. Neither MSCI, S&P nor any third party involved in making or compiling the GICS or any GICS classi�cations makes any express or implied warranties or representations with respect to such standard or classi�cation (or the results to be obtained by the use thereof), and all such parties hereby expressly disclaim all warranties of originality, accuracy, completeness, merchantability and �tness for a particular purpose with respect to any of such standard or classi�cation. Without limiting any of the foregoing, in no event shall MSCI, S&P, any of their af�liates or any third party involved in making or compiling the GICS or any GICS classi�cations have any liability for any direct, indirect, special, punitive, consequential or any other damages (including lost pro�ts) even if noti�ed of the possibility of such damages.
Data provided for performance attribution are estimates based on unaudited portfolio results. Performance contributors and detractors were not realized gains or losses for the Fund during the quarter. Market performance presented solely for informational purposes. The S&P 500 Index is designed to act as a barometer for the overall U.S. stock market. The index is unmanaged, consisting of 500 stocks that are chosen on the basis of market size, liquidity, and industry grouping. The S&P 500 is a market value weighted index with each stock’s weight in the index proportionate to its market value. The Russell 2000® Value Index is an unmanaged index that measures the performance of the small-cap value segment of the U.S. equity universe and includes those Russell 2000 companies with lower price-to-book ratios and lower forecasted growth values. The Russell 2000® Index is an unmanaged index that measures the performance of the smallest 2,000 companies by market capitalization of the Russell 3000® Index. The Russell 2500® Value Index is an unmanaged index that measures the performance of the small to mid-cap value segment of the U.S. equity universe and includes those Russell 2500 companies with lower price-to-book ratios and lower forecasted growth values. The Russell 2500® Index is an unmanaged index that measures the performance of the 2,500 smallest companies by market capitalization of the Russell 3000® Index. The Russell Midcap® Value Index is an unmanaged index that measures the performance of the mid-cap value segment of the U.S. equity universe and includes those Russell Midcap companies with lower price-to-book ratios and lower forecasted growth values. The Russell Midcap® Index is an unmanaged index that measures the performance of the 800 smallest companies by market capitalization of the Russell 1000® Index. The Russell 1000® Index is an unmanaged index that measures the performance of the 1,000 largest companies by market capitaliza-tion of the Russell 3000® Index. The Russell 3000® Value Index is an unmanaged index that measures the performance of the broad value segment of the U.S. equity universe and includes those Russell 3000 companies with lower price-to-book ratios and lower forecasted growth values. The Russell 3000® Index is an unmanaged
index that measures the performance of the 3,000 largest U.S. companies by market capitalization. The Barclays
U.S. Aggregate Bond Index is a broad-based benchmark that measures the investment grade, U.S.
dollar-denominated, �xed-rate taxable bond market, including Treasuries, government-related and corporate
securities, MBS (agency �xed-rate and hybrid ARM passthroughs), ABS, and CMBS. These Index �gures do not re�ect any deduction for fees, expenses or taxes, and are not available for direct investment. Securities in the Fund may not match those in the indexes and performance of the Fund will differ. The KEELEY All Cap Value Fund, KEELEY Small-Mid Cap Value Fund, KEELEY Small Cap Value Fund, KEELEY Small Cap Dividend Value Fund and KEELEY Mid Cap Dividend Value Fund are distributed by G.distributors, LLC.
Waiver/Expense Reimbursement**Expense Ratio (Gross)**
-0.07%1.47%
www.KeeleyFunds.com | 800.533.5344 KEELEY Funds |
Performance attribution is commonly used to measure the quality of the separate decisions that go into the management of an investment portfolio compared to a benchmark index. This analysis tries to isolate the effect and measure the return contribution of market allocation, which analyzes the positive/negative impact of a portfolio's allocation to groupings such as geographic regions or market sectors, and stock selection, which analyzes the positive/negative impact of the portfolio manager's security ownership and weighting decisions within a wider grouping. The performance attribution data in this quarterly commentary was prepared by Keeley-Teton Advisors, LLC ("Keeley Teton") using the following constraints: (1) Fund portfolio holdings are as of the beginning of each day; index constituents are as of the end of the day. That means that the Fund's holdings are not included until the day after acquisition (when it is included in the portfolio as of the beginning of the next business day), and a portfolio holding that is sold is included in the analysis through the end of the day on which it is sold, and that the values at which securities are included in the analysis are the values as of the beginning of the day. For the index, securities are included at their values at the end of the day. (2) The securities’ values used in the analysis are the prices used by Keeley Teton in its internal records for the Fund and the prices used by the index provider for the benchmark index. If a price from either of those sources is unavailable, pricing information from FactSet is used. Pricing information from the index provider or from FactSet may differ from the pricing information used by Keeley Teton. (3) Sector and/or industry classi�cations may change over time. The attribution information provided in this commentary includes summaries of attribution by market sector. Attribution is not precise and should be considered to be an approxima-tion of the relative contribution of each of the sectors considered. The information on performance by sector re�ects the aggregated gross return of the Fund's securities. Contributions to the Fund's performance by sector (computed as described above) were compared against the contributions to the aggregate return of the stocks comprising the index, by sector, as reported by FactSet Databases. Holdings returns for this commentary are calculated as total returns, which re�ect any dividends or income earned during the period. Prior to September 30, 2016, holdings returns were based upon price percentage change.
Direct Shareholders: 888-933-5391Investment Professionals: 800-422-2274National Accounts: [email protected]
G.distributors LLCMember FINRA800-422-2274
KEELEY Funds Distributed By:
The Global Industry Classi�cation Standard (“GICS”) was developed by and is the exclusive property and a service mark of MSCI Inc. ("MSCI") and Standard & Poor's, a division of The McGraw-Hill Companies, Inc. ("S&P") and is licensed for use by Keeley Teton. Neither MSCI, S&P nor any third party involved in making or compiling the GICS or any GICS classi�cations makes any express or implied warranties or representations with respect to such standard or classi�cation (or the results to be obtained by the use thereof), and all such parties hereby expressly disclaim all warranties of originality, accuracy, completeness, merchantability and �tness for a particular purpose with respect to any of such standard or classi�cation. Without limiting any of the foregoing, in no event shall MSCI, S&P, any of their af�liates or any third party involved in making or compiling the GICS or any GICS classi�cations have any liability for any direct, indirect, special, punitive, consequential or any other damages (including lost pro�ts) even if noti�ed of the possibility of such damages.
Data provided for performance attribution are estimates based on unaudited portfolio results. Performance contributors and detractors were not realized gains or losses for the Fund during the quarter. Market performance presented solely for informational purposes. The S&P 500 Index is designed to act as a barometer for the overall U.S. stock market. The index is unmanaged, consisting of 500 stocks that are chosen on the basis of market size, liquidity, and industry grouping. The S&P 500 is a market value weighted index with each stock’s weight in the index proportionate to its market value. The Russell 2000® Value Index is an unmanaged index that measures the performance of the small-cap value segment of the U.S. equity universe and includes those Russell 2000 companies with lower price-to-book ratios and lower forecasted growth values. The Russell 2000® Index is an unmanaged index that measures the performance of the smallest 2,000 companies by market capitalization of the Russell 3000® Index. The Russell 2500® Value Index is an unmanaged index that measures the performance of the small to mid-cap value segment of the U.S. equity universe and includes those Russell 2500 companies with lower price-to-book ratios and lower forecasted growth values. The Russell 2500® Index is an unmanaged index that measures the performance of the 2,500 smallest companies by market capitalization of the Russell 3000® Index. The Russell Midcap® Value Index is an unmanaged index that measures the performance of the mid-cap value segment of the U.S. equity universe and includes those Russell Midcap companies with lower price-to-book ratios and lower forecasted growth values. The Russell Midcap® Index is an unmanaged index that measures the performance of the 800 smallest companies by market capitalization of the Russell 1000® Index. The Russell 1000® Index is an unmanaged index that measures the performance of the 1,000 largest companies by market capitaliza-tion of the Russell 3000® Index. The Russell 3000® Value Index is an unmanaged index that measures the performance of the broad value segment of the U.S. equity universe and includes those Russell 3000 companies with lower price-to-book ratios and lower forecasted growth values. The Russell 3000® Index is an unmanaged
index that measures the performance of the 3,000 largest U.S. companies by market capitalization. The Barclays
U.S. Aggregate Bond Index is a broad-based benchmark that measures the investment grade, U.S.
dollar-denominated, �xed-rate taxable bond market, including Treasuries, government-related and corporate
securities, MBS (agency �xed-rate and hybrid ARM passthroughs), ABS, and CMBS. These Index �gures do not re�ect any deduction for fees, expenses or taxes, and are not available for direct investment. Securities in the Fund may not match those in the indexes and performance of the Fund will differ. The KEELEY All Cap Value Fund, KEELEY Small-Mid Cap Value Fund, KEELEY Small Cap Value Fund, KEELEY Small Cap Dividend Value Fund and KEELEY Mid Cap Dividend Value Fund are distributed by G.distributors, LLC.
Small Mid Cap Value FundFourth Quarter 2017 Commentary


![upk w atk plenum box - Teknocalor...4 Fig. 3, ATK-B Fig. 5, ATK-LS Fig. 4, ATK-S DIMENSIONSANDWEIGHT ATK,SANDLS ATK Dim. BFxHF D A Weight[kg] 125 200x100 124 180 2,8 160 300x100 159](https://img.pdfslide.net/doc/110x75/60d1222cb73d421fbe7fe348/upk-w-atk-plenum-box-teknocalor-4-fig-3-atk-b-fig-5-atk-ls-fig-4-atk-s.jpg)