Embed Size (px)
Citation preview

1
February 9, 2018
Fourth Quarter 2017Earnings Presentation

2
Strategic Review Edward Tilly
Chairman and Chief Executive Officer
Financial Review Brian Schell
Executive Vice President, CFO and Treasurer
Questions and Answers Edward Tilly
Brian Schell
Chris Concannon
President and Chief Operating Officer
John Deters
Chief Strategy Officer and Head of Multi-Asset Solutions
Agenda

3
This presentation contains forward-looking statements within the meaning of the Private Securities Litigation Reform Act of 1995 that involve a number of risks and uncertainties. You can identify these statements by forward-looking words such as “may,” “might,” “should,” “expect,” “plan,” “anticipate,” “believe,” “estimate,” “predict,” “potential” or “continue,” and the negative of these terms and other comparable terminology. All statements that reflect our expectations, assumptions or projections about the future other than statements of historical fact are forward-looking statements. These forward-looking statements, which are subject to known and unknown risks, uncertainties and assumptions about us, may include projections of our future financial performance based on our growth strategies and anticipated trends in our business. These statements are only predictions based on our current expectations and projections about future events. There are important factors that could cause our actual results, level of activity, performance or achievements to differ materially from those expressed or implied by the forward-looking statements.
We operate in a very competitive and rapidly changing environment. New risks and uncertainties emerge from time to time, and it is not possible to predict all risks and uncertainties, nor can we assess the impact of all factors on our business or the extent to which any factor, or combination of factors, may cause actual results to differ materially from those contained in any forward-looking statements.
Some factors that could cause actual results to differ include: the loss of our right to exclusively list and trade certain index options and futures products; economic, political and market conditions; compliance with legal and regulatory obligations; price competition and consolidation in our industry; decreases in trading volumes, market data fees or a shift in the mix of products traded on our exchanges; legislative or regulatory changes; increasing competition by foreign and domestic entities; our dependence on and exposure to risk from third parties; our index providers’ ability to maintain the quality and integrity of their indexes and to perform under our agreements; our ability to operate our business without violating the intellectual property rights of others and the costs associated with protecting our intellectual property rights; our ability to attract and retain skilled management and other personnel, including those experienced with post-acquisition integration; our ability to accommodate trading volume and transaction traffic, including significant increases, without failure or degradation of performance of our systems; our ability to protect our systems and communication networks from security risks, including cyber-attacks and unauthorized disclosure of confidential information; challenges to our use of open source software code; our ability to meet our compliance obligations, including managing potential conflicts between our regulatory responsibilities and our for-profit status; damage to our reputation; the ability of our compliance and risk management methods to effectively monitor and manage our risks; our ability to manage our growth and strategic acquisitions or alliances effectively; unanticipated difficulties or expenditures relating to the acquisition of Bats Global Markets, Inc., including, without limitation, difficulties that result in the failure to realize expected synergies, accretion, efficiencies and cost savings from the acquisition within the expected time period (if at all), whether in connection with integration, migrating trading platforms, broadening distribution of product offerings or otherwise; restrictions imposed by our debt obligations; our ability to maintain an investment grade credit rating; potential difficulties in our migration of trading platforms and our ability to retain employees as a result of the acquisition; and the accuracy of our estimates and expectations. More detailed information about factors that may affect our actual results to differ may be found in our filings with the SEC, including in our Annual Report on Form 10-K for the year ended December 31, 2016 and other filings made from time to time with the SEC.
We do not undertake, and we expressly disclaim, any duty to update any forward-looking statement whether as a result of new information, future events or otherwise, except as required by law. Readers are cautioned not to place undue reliance on these forward-looking statements, which speak only as of the date hereof.
Trademarks: Cboe®, Bats®, BZX®, BYX®, EDGX®, EDGA®, Cboe Volatility Index® and VIX® are registered trademarks and Cboe Global MarketsSM and C2SM are service marks of Cboe Global Markets, Inc. and its subsidiaries. All other trademarks and service marks are the property of their respective owners. © 2017 Cboe Global Markets, Inc. All rights reserved.
Cautionary Statements Regarding Forward-Looking Information

4
Strategic ReviewEdward TillyChairman and CEO

5
Strong 4Q17 caps year of tremendous growth
Total options ADV increased 11% over 2016¹
Annual record highs for VIX options and futures, each up 23% over 2016
New all-time high in SPX Weeklys trading drove record year in SPX options
ETP listings increased by 82% over 2016, bringing total listings to 250 at year end
Record trading in European LIS block trading platform and Periodic Auctions order book
Record market share and ADNV for Cboe FX fueled by increased volume in our London matching engine
¹Based on combined results from January 1, 2016
Growth in Proprietary Index Suite Continued to Drive Revenue and Earnings
95
159
201 205239
294
2012 2013 2014 2015 2016 2017
VIX OptionsVIX Futures Annual ADV(in thousands)
698 823 888 939 1,024 1,164
443567 632 573 588
722
2012 2013 2014 2015 2016 2017
SPX Options VIX Options Other Index Options
Index Options Annual ADV(in thousands)
1,4781,6201,613
1,247
1,9771,720
6
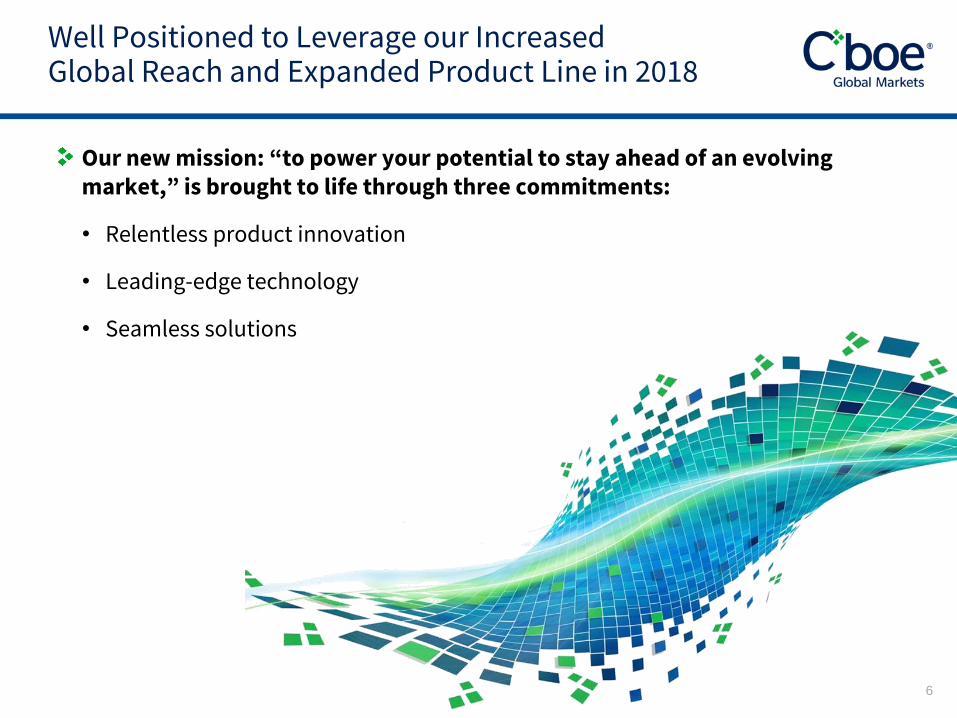
Well Positioned to Leverage our IncreasedGlobal Reach and Expanded Product Line in 2018
Our new mission: “to power your potential to stay ahead of an evolving market,” is brought to life through three commitments:
• Relentless product innovation
• Leading-edge technology
• Seamless solutions

7
XBT futures, the first of their kind, provide a risk management tool for market participants seeking to hedge their underlying bitcoin holdings
XBT futures create:
• An exchange-listed, regulated and surveilled bitcoin product available nearly 24 hours a day, five days per week
• Efficient price discovery and transparency
• Access to the bitcoin sector without a digital wallet requirement
Successful first settlement auction – worked as designed
Anticipate a growing market in 2018 – in terms of volume and products traded
Product Innovation: Launched XBT Futures on December 10, 2017
0
2,000
4,000
6,000
8,000
10,000
12,000
14,000
16,000
18,000 Dec. 2017- Jan. 2018
XBT Volume XBT Open Interest
Cboe Bitcoin Futures Daily Volume and Open Interest

8
Migrating trading technology onto Bats’ proven platform to gain scale and efficiency; Launched new index platform
Leading-Edge, State-of-the-Art Technology
Working closely with customers to achieve seamless technology migrations
CFE migration on track for February 25, 2018
C2 Options migration planned for May 14, 2018
Launched new index platform on January 22, 2018
EDGX Options Complex Order Book launched in 3Q17 – expected to underpin each of our exchanges as we migrate to Bats technology
Leading-EdgeTechnology

9
Cboe Market Close (CMC) auction, a closing match process for non-Cboe securities, was approved by SEC on January 17, 2018
• Subsequent appeals by competitors will delay the benefits of CMC for investors in U.S. equity markets
• Plan to continue to work proactively with the SEC on a favorable resolution
Cboe Global Markets’ U.S. Equities recognized in Japan and Hong Kong as approved stock exchange - expected to clear the way for additional ETP transfers to Cboe
Providing Seamless Trading Solutions
We are committed to enhancing the customer’s trading experience through regulatory advocacy, new technologies and education

1010
Providing value-added products and services, helping customers navigate MiFID II
Cboe LIS
• Record volumes since MiFID II in effect
• Block trading platform that leverages BIDS technology
• Average trade size of €1 million
Periodic Auctions book
• Record volumes since MiFID II in effect
• Lit order book operating periodic auctions throughout the day
• Orders allocated on price/size basis and executed within EBBO
• Not subject to the double volume caps
Delivered Seamless Trading Solutions for a Post-MiFID II Landscape
€ 0
€ 50,000,000
€ 100,000,000
€ 150,000,000
€ 200,000,000
€ 250,000,000
4Q17 Jan-18
Cboe LIS: Average Daily Value Traded (In Euros, single counted)
€ 0
€ 50,000,000
€ 100,000,000
€ 150,000,000
€ 200,000,000
€ 250,000,000
€ 300,000,000
€ 350,000,000
4Q17 Jan-18
Cboe Periodic Auctions: Average Daily Value Traded(In Euros)

11
Focused on executing on our growth initiatives
Growing our proprietary products
Expanding our global reach across asset classes
Migrating our technology to Bats
Achieving our acquisition synergy targets
Look Forward to Building on StrongFoundation Established in 2017

12
Financial Overview and GuidanceBrian SchellEVP, CFO and Treasurer

13
$144
$161
$249
$266
4Q16
4Q17
Combined Net Revenue¹ up 7%; Adjusted Combined Margin¹ up 260 bps
(in millions)
Net Revenue Adjusted Combined Operating Income
Margin 57.9%
Margin 60.5%
Business Highlights – Key Growth Drivers
1,741
2,058
236
284
4Q16
4Q17
ADV in Index Suite up 18% Driving of organic revenue growth
(In thousands)
VIX Futures Index Options
1,977
2,342
$0.78
$0.87
4Q16
4Q17
Combined Adjusted EPS¹ up 12%
$566
$617
$143
$154
Year 2016
Year 2017
4Q16
4Q17
Organic Revenue Growth¹(in millions)
+9%
+8%
Continued strength of proprietary index products
Growth from non-transaction fees
Expense discipline and overachievement of expense synergies
Resulting in margin expansion and earnings growth
¹See Appendix for “Non-GAAP Information.”
14
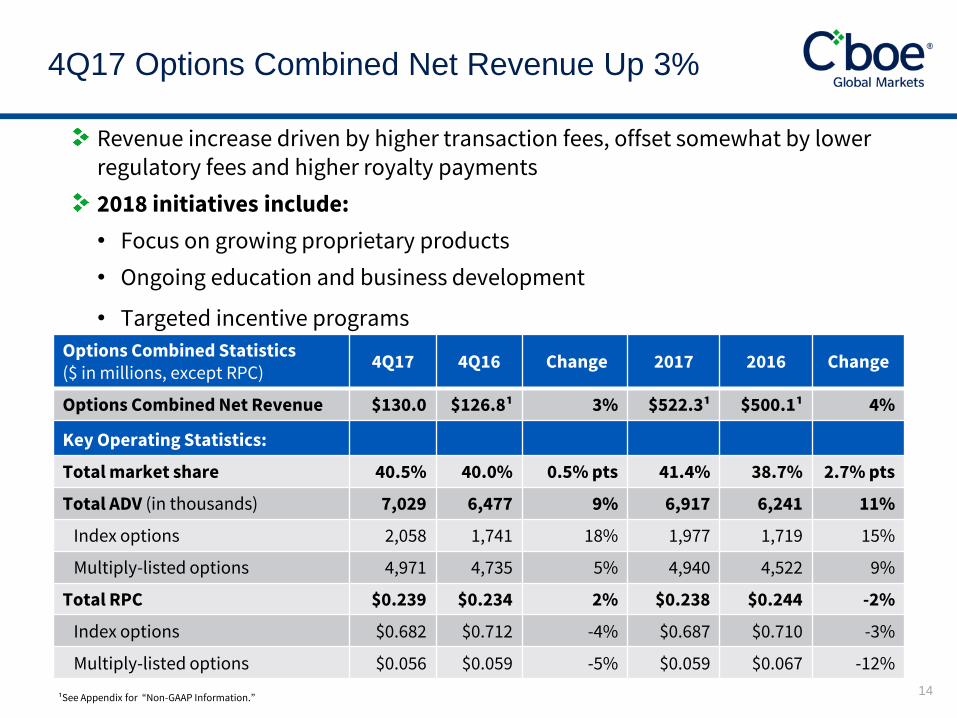
Revenue increase driven by higher transaction fees, offset somewhat by lower regulatory fees and higher royalty payments
2018 initiatives include:
• Focus on growing proprietary products
• Ongoing education and business development
• Targeted incentive programs
4Q17 Options Combined Net Revenue Up 3%
Options Combined Statistics ($ in millions, except RPC)
4Q17 4Q16 Change 2017 2016 Change
Options Combined Net Revenue $130.0 $126.8¹ 3% $522.3¹ $500.1¹ 4%
Key Operating Statistics:
Total market share 40.5% 40.0% 0.5% pts 41.4% 38.7% 2.7% pts
Total ADV (in thousands) 7,029 6,477 9% 6,917 6,241 11%
Index options 2,058 1,741 18% 1,977 1,719 15%
Multiply-listed options 4,971 4,735 5% 4,940 4,522 9%
Total RPC $0.239 $0.234 2% $0.238 $0.244 -2%
Index options $0.682 $0.712 -4% $0.687 $0.710 -3%
Multiply-listed options $0.056 $0.059 -5% $0.059 $0.067 -12%
¹See Appendix for “Non-GAAP Information.”

15
4Q17 Futures Net Revenue Up 31% - 2017 Marked13th Consecutive Year of Record ADV for VIX Futures
Futures Statistics 4Q17 4Q16 Change 2017 2016 Change
Futures Net Revenue (in millions) $35.6 $27.1 31% $139.5 $109.4 28%
Key Operating Statistics:
Total ADV (in thousands) 285 236 21% 295 239 23%
Total RPC $1.799 $1.683 7% $1.779 $1.681 6%
Revenue increase driven by transaction fees, reflecting higher ADV and RPC
RPC increase primarily due to fee changes implemented in January 2017
2018 initiatives include:
• Optimistic that CFE technology migration will improve trading experience
• Leverage global business development team to expand customer base
• Adding new products

16
Persistent low volatility environment dampened trading volumes in 2017
Growth in non-transaction revenue offset decline in net transaction fees
Increase in market data revenue driven by both pricing changes and expanded usage
2018 initiatives include:
• Continued growth in ETF listings and market share; proprietary market data
• Expect downward pressure on SIP market data revenue due to industry consolidation and off-exchange trading
U.S. EquitiesCombined Net Revenue Up 1%
U.S. Equities Combined Statistics 4Q17 4Q16 Change 2017 2016 Change
U.S. Equities Net Revenue (in millions) $69.0 $68.4 1% $286.5 $284.6 1%
Market data - SIP 25.8 25.8 -- 130.7 130.7 --
Market data - Proprietary 7.1 5.1 39% 59.5 48.1 24%
Key Operating Statistics:
Total market share 18.5% 20.0% -1.5% pts 19.0% 20.6% -1.6% pts
Market ADV (shares in billions) 6.4 7.1 -10% 6.5 7.3 -11%
ADV (matched shares in billions) 1.2 1.4 -14% 1.2 1.5 -20%
Net revenue capture (per 100 touched shares) $0.022 $0.021 5% $0.023 $0.021 10%

17
Net revenue increase reflects growth in net transaction fees and non-transaction revenue and a benefit from foreign currency translation; Net revenue up 10% on local currency basis
Ready day one with full suite of products and services to address the new requirements of MiFID II
2018 Initiatives include:
• Continue to look for additional revenue opportunities under MiFID II
European Equities Combined Net Revenue Up 17%
European Equities Combined Statistics 4Q17 4Q16 Change 2017 2016 Change
European Equities Net Revenue (in millions) $18.8 $16.1 17% $73.5 $68.5 7%
Key Operating Statistics:
Total market share 20.3% 21.9% -1.6% pts 21.1% 22.9% -1.8% pts
Market ADNV (Euros, in billions) €43.8 €44.6 -2% €44.7 €46.1 -3%
Net capture (per matched notional value, inbasis points) 0.177 0.160 11% 0.168 0.152 11%

18
Fourth quarter marked a high point for both market share and ADNV traded
Growth driven by increased volume on our London matching engine and better fill rates
2018 initiative include:
• Growing core FX Spot offering while diversifying revenue by adding new products and expanding market data offerings
Global FXCombined Net Revenue Up 18%
Global FX Combined Statistics 4Q17 4Q16 Change 2017 2016 Change
Global FX Net Revenue (in millions) $12.0 $10.2 18% $45.0 $40.0 13%
Key Operating Statistics:
Market share 14.9% 11.6% 3.3% pts 13.4% 12.0% 1.4% pts
Average Daily Notional Value
($ in billions) $32.5 $26.7 22% $29.4 $26.9 9%
Net revenue (per one million dollars traded) $2.57 $2.65 -3% $2.60 $2.68 -3%

19
Adjusted Combined Operating Expenses Flat for 4Q and Down 1% for Year
4Q17 vs 4Q16:
Compensation and benefits up due to increase in incentive-based compensation
Travel and promotional up due to increase in costs for travel and marketing and promotional events
Professional fees declined due to realization of synergies
Adjusted Combined Operating Expenses¹(in millions)
4Q17 4Q16 % Chg 2017 2016 % Chg
Compensation and benefits $53.2 $52.4 2% $208.4 $203.9 2%
Depreciation and amortization¹ 12.9 13.3 -3% 52.6 57.2 -8%
Technology support services 11.2 11.2 -- 46.1 45.3 2%
Professional fees and outside services 17.1 17.5 -2% 68.4 73.3 7%
Travel and promotional 5.2 4.6 13% 17.8 16.4 9%
Facilities costs 2.6 2.5 4% 10.9 9.9 10%
Other expenses 2.8 3.1 -10% 9.9 11.6 -4%
Total¹ $105.0 $104.6 -- $415.3 $417.6 -1%
¹Adjusted to reflect the impact of certain items. See Appendix for “Non-GAAP Information”

20
Finished 2017 with run-rate expense synergies of $33MM pre-tax
Incremental year 1 run-rate expense synergies primarily a result of better utilization of technology resources
Increasing 2018 targeted annualized run-rate expense synergies to $50MM
Projected expense synergies heavily weighted to Cboe Options technology migration
Expense synergies realized of $7.5MM pre-tax in 4Q17; $24.6MM for 2017
Realization of Year 1 Expense Synergies Running Ahead of Initial Projections
$15
$35
$50
$60$65
$33
$50
YR 1 YR 2 YR 3 YR 4 YR 5
Targeted Run-Rate Expense Synergies as of February 9, 2018 (in millions)
Target as of Sept. '16 Target as of Feb. '18

21
2018 Full-Year Guidance
As of February 9, 2018($ in millions) 2018 Full-Year Guidance
2017 AdjustedCombined Actual¹
Adjusted combined operating expenses² $420 to $428 $415¹
Depreciation and amortization (excluding amortization of acquired intangible assets)
$53 to $58 $53
Capital expenditures $50 to $55 $43
¹See “Non-GAAP Information” in the appendix for reconciliation.2Adjusted operating expenses for 2017 exclude:
• acquisition-related expenses of $84.4 million • accelerated stock-based compensation of $9.1 million - recognized in 1Q17• amortization of acquired intangible assets of $169 million for 2017 and $157 for 2018
Adjustments included in the non-GAAP reconciliation

22
U.S. Corporate Tax Reform Enacted in December:
• Reduces statutory tax rate from 35% to 21%
• Repeals a number of deductions relevant to Cboe, such as Section 199
• Introduces incremental taxes on foreign earnings
• Results in net reduction to our effective tax rate of 8 to 10 percentage points
¹See “Non-GAAP Information” in the appendix for reconciliation.
Tax Rate Guidance and Impact of Tax Reform
For the years ended December 31,($ in millions) 2017 Tax Rate
2018 Guidanceas of Feb. 9, 2018
Effective tax rate on GAAP earnings (19.8)%
Impact on tax rate of:
• $192MM re-measurement of deferred tax positions
57.2%
• Other non-GAAP adjustments (1.1)%
Effective tax rate on adjusted earnings 36.3%¹ 26.5% to 28.5%

23
Preserving balance sheet flexibility is a priority
Invest in the growth of our business
De-lever – reduced debt by $75 million in 4Q17; $400 million in 2017
Return capital through dividends
Continue to evaluate share repurchases
¹Adjusted to reflect the impact of certain items. See Appendix for “Non-GAAP Information.”
Focused on Efficient Allocation of Capital to Create Long-Term Shareholder Value
Debt Outstanding($ in millions)
Dec. 31, 2017
3.650% Senior Notes (10Y; Due 2027) $ 650
1.950% Senior Notes (2Y; Due 2019) 300
Term Loan Facility 300
Total Debt (Gross) $ 1,250
Debt to EBITDA TTM¹ 1.8x
Adjusted Cash & Financial Investments¹ $120

24
Footnotes applied here
Delivering on Sources of Operating Leverage and Key Strategic Initiatives
• Focused on growing proprietary products
• Generated strong organic growth
Growth of Core
Proprietary Products
• Grew base of non-transaction revenueDiversification and
Stabilization of Revenue Stream
• Disciplined expense management
• Provided higher operating marginsScale of Business Model
• Continued to realize expense synergies and
accelerate run rate Synergies Realization
• De-levered to enhance balance sheet flexibility
• Leverage ratio of 1.8x
• Returned capital through quarterly dividendsCapital Allocation

25
150,000
200,000
250,000
300,000
350,000
$0
$1,000
$2,000
$3,000
$4,000
$5,000
4Q 2015 1Q 2016 2Q 2016 3Q 2016 4Q 2016 1Q 2017 2Q 2017 3Q 2017 4Q 2017 Jan-18
VIX
Fu
ture
s A
DV
ET
P A
sset
s $M
Ms
VIX Futures ADV vs. VIX ETP Assets
Short VIX ETPs (SVXY, XIV) Long VIX ETPs (VXX, UVXY, TVIX) VIX Futures ADV
VIX Futures Growth vs VIX ETP Assets
VIX Futures ADV: 82% Growth
Source: Cboe and Bloomberg

26
Growth in CFE User Accounts
4,495
5,706
3,000
3,500
4,000
4,500
5,000
5,500
6,000
Q4 2015 Q4 2017
Unique CFE User Accounts
27% Growth
Source: Cboe
27
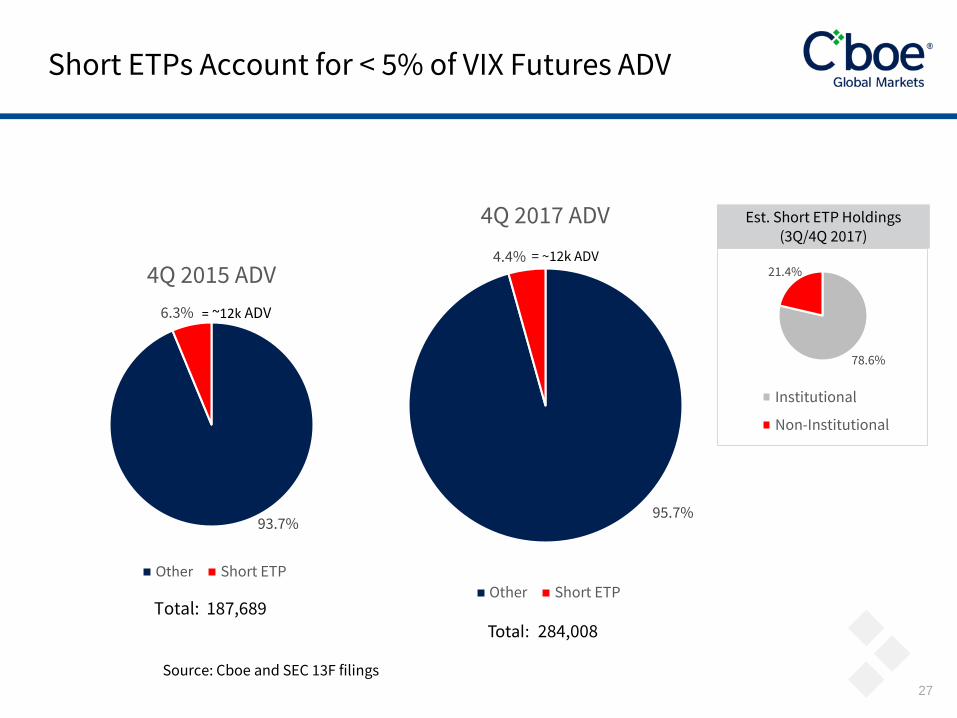
Short ETPs Account for < 5% of VIX Futures ADV
95.7%
4.4%
4Q 2017 ADV
Other Short ETP
93.7%
6.3%
4Q 2015 ADV
Other Short ETP
Total: 187,689Total: 284,008
78.6%
21.4%
Institutional
Non-Institutional
= ~12k ADV
Est. Short ETP Holdings(3Q/4Q 2017)
= ~12k ADV
Source: Cboe and SEC 13F filings

2828
Questions & Answers

29
Appendix Materials

30
4Q17 and 2017 Financial Overview
Adjusted Combined Financial Results¹($ in millions, except per share)
4Q17 4Q16 % Chg 2017 2016 % Chg
Net Revenue¹,² $265.6 $248.6 10% $1,067.5 $1,002.8 6%
Adjusted Operating Expenses¹ 105.0 104.6 -2% 415.3 417.6 -1%
Adjusted Operating Income¹ $160.6 $144.0 19% $652.2 $585.2 11%
Adjusted Operating Margin¹ 60.5% 57.9% 440 bps 61.1% 58.4% 270 bps
Adjusted Net Income Allocated to Common Stockholders¹ $97.7 $ 86.5 25% $397.7 $337.6 18%
Adjusted Diluted EPS¹ $ 0.87 $ 0.78 24% $3.57 $3.00 19%
Adjusted EBITDA¹ $176.8 $163.4 16% $708.5 $650.2 9%
Adjusted EBITDA Margin¹ 66.6% 65.7% 350 bps 66.4% 64.8% 160 bps
¹Adjusted to reflect the impact of certain items. See Appendix for “Non-GAAP Information.”
²Net revenue referenced in this presentation represents revenue less cost of revenue.

31
4Q17 net transaction fees up 11%; non-transaction revenue up 2%
Net Revenue Growth Supported by BothTransaction and Non-Transaction Revenue
Adjusted CombinedNet Revenue¹(in millions)
4Q17 4Q16 % Chg 2017 2016 % Chg
Net transaction fees $178.0 $160.5 11% $705.4 $653.7 8%
Access fees 29.2 29.6 -1% 118.7 119.3 -1%
Exchange services and other fees 19.5 17.9 10% 79.8 69.6 15%
Market data fees 47.2 44.2 7% 190.2 179.0 6%
Regulatory fees 6.9 9.7 -29% 32.0 38.8 -18%
Royalty fees (22.3) (20.2) 11% (86.2) (78.0) 11%
Other revenue 7.1 6.9 4% 27.6 20.4 35%
Total¹ $265.6 $248.6 7% $1,067.5 $1,002.8 6%
¹Adjusted to reflect the impact of certain items. See Appendix for “Non-GAAP Information.”

32
Supplemental Segment Information
4Q17 Supplemental Net Revenue by Segment (in millions)
OptionsU.S.
EquitiesFutures
European Equities
Global FX
Total¹
Net transaction fees² $105.9 $17.4 $32.4 $11.6 $10.7 $178.0
Access fees $14.1 $11.9 $0.5 $2.0 $0.7 $29.2
Exchange services and other fees $9.6 $5.6 $2.5 $1.3 $0.5 $19.5
Market data fees $10.2 $32.9 $0.9 $3.1 $0.1 $47.2
4Q16 Supplemental CombinedNet Revenue by Segment (in millions)
OptionsU.S.
EquitiesFutures
European Equities
Global FX
Total¹,²
Net transaction fees² $95.7 $19.7 $25.0 $10.9 $9.2 $160.5
Access fees $15.2 $12.3 $0.2 $1.3 $0.6 $29.6
Exchange services and other fees $10.0 $4.2 $2.0 $1.2 $0.4 $17.9
Market data fees $10.4 $30.9 $0.8 $2.2 $44.3
¹Totals may not foot due to rounding²A full reconciliation of our non-GAAP and combined results to our GAAP results is included in the following tables. See "Non-GAAP Information” in the accompanying financial tables.

33
Revenue Growth
32.1% 35.7%
18.2% 15.6%
49.7% 48.7%
4Q17 4Q16Non-proprietary Futures Index options
Growing Mix of Proprietary Products asPercentage of Total Net Transaction Fees
64.3%67.9%
Proprietary Products Drove Revenue Growth in 4Q17

34
2017 Highlights:
• Increased ETP listings by 82%
• Captured 32% of new listings and 62% of transfers
• Executed 22% of trades
• Grew market share to 12% of all U.S. ETPs from 7% in 2016
Received approval of designated listing exchange in Japan and Hong Kong
Optimistic about growth prospects
U.S. Equities: Growing ETF Market Listings
2856
137
250
2014 2015 2016 2017
Number of Cboe U.S. ETPs
30% 32%
25% 14%
45% 54%
2016 2017
Cboe Nasdaq NYSE
Share of New ETP Launches
Growing ETF listings market share enhances benefits for issuing firms and provides deeper liquidity to market participants

35
Non-GAAP Information

Non-GAAP Information
In addition to disclosing results determined in accordance with GAAP, Cboe Global Markets has disclosed certain non-GAAP measures of operating performance. These measures are not in accordance with, or a substitute for, GAAP, and may be different from or inconsistent with non-GAAP financial measures used by other companies. The non-GAAP measures provided in this press release include net transaction fees, adjusted operating expenses, adjusted operating income, organic net revenue, adjusted operating margin, adjusted net income allocated to common stockholders and adjusted diluted earnings per share, adjusted tax rate, EBITDA, EBITDA margin, adjusted EBITDA and adjusted EBITDA margin. The non-GAAP measures provided in this press release also include combined company financial measures that are discussed in further detail below under the sub-section "Combined Reconciliations."
Management believes that the non-GAAP financial measures presented in this press release, including adjusted net revenue, organic net revenue and adjusted operating expenses, provide additional and comparative information to assess trends in our core operations and a means to evaluate period-to-period comparisons. Non-GAAP financial measures disclosed by management are provided as additional information to investors in order to provide them with an alternative method for assessing our financial condition and operating results.
Organic net revenue: Is a non-GAAP financial measure that excludes or has otherwise been adjusted for the impact of our acquisition of Bats. Management believes the organic net revenue growth measure provides users with supplemental information regarding the company's ongoing revenue performance and trends by presenting revenue growth excluding the impact of the Bats acquisition.
Amortization expense of acquired intangible assets: We amortize intangible assets acquired in connection with various acquisitions. Amortization of intangible assets is inconsistent in amount and frequency and is significantly affected by the timing and size of our acquisitions. As such, if intangible asset amortization is included in performance measures, it is more difficult to assess the day-to-day operating performance of the businesses, the relative operating performance of the businesses between periods and the earnings power of the company. Therefore, we believe performance measures excluding intangible asset amortization expense provide investors with an additional basis for comparison across accounting periods.
Acquisition-related expenses: From time to time, we have pursued small bolt-on acquisitions and in 2017 completed a larger transformative acquisition, which have resulted in expenses which would not otherwise have been incurred in the normal course of the company's business operations. These expenses include integration costs, as well as legal, due diligence and other third party transaction costs. The frequency and the amount of such expenses vary significantly based on the size, timing and complexity of the transaction. Accordingly, we exclude these costs for purposes of calculating non-GAAP measures which provide an additional analysis of Cboe’s ongoing operating performance or comparisons in Cboe’s performance between periods.
Other significant items: We have excluded certain other charges that are the result of other non-comparable events to measure operating performance. For 2017, other significant items primarily included interest and other borrowing costs incurred prior to the close of the Bats transaction and accelerated stock-based compensation that was incurred due to a change in the vesting schedule for equity award grants. In addition to disclosing results determined in accordance with GAAP, Cboe Holdings has disclosed certain non-GAAP measures of operating performance.
36

37
Organic Net Revenue Reconciliation
Three Months Ended Twelve Months Ended
December 31, December 31,
(in millions) 2017 2016 2017 2016
Reconciliation of Revenue Less Cost of Revenue to Organic Net Revenue
Revenue less cost of revenue (net revenue) $ 265.6 $ 143.0 $ 995.6 $ 566.4
Recent acquisitions:
Bats revenue less cost of revenue (111.5) — (378.2) —
Organic net revenue $ 154.1 $ 143.0 $ 617.4 $ 566.4
Non-GAAP Information
Three Months Ended December 31,
2017 2016
Transaction fees $ 431.3 $ 441.7
Liquidity payments (243.6) (271.3)
Routing and clearing (9.7) (9.9)
Net transaction fees $ 178.0 $ 160.5
Transaction Net Revenue –Three Months Ended December 31, 2017 and 2016
Note: There are no reconciliations applicable for the other segments.
Combined
(in millions) Cboe Historical Bats Historical (Per Table 2)
Total net revenue $ 115.9 $ 10.9 $ 126.8
Options Net Revenue - Three Months Ended December 31, 2016

Non-GAAP Information
¹A full reconciliation of our non-GAAP and combined results to our GAAP results are available in this section.
38

39
Non-GAAP Information

Non-GAAP Information (See slide 43 for footnotes) Three Months Ended Twelve Months Ended
Table 6 December 31, December 31,
(in millions, except per share amounts) 2017 2016 2017 2016
Reconciliation of Net Income Allocated to Common Stockholders to Non-GAAP (As shown on Table 1)
Net income allocated to common stockholders $ 254.6 $ 44.7 $ 396.7 $ 184.9
Non-GAAP adjustments
Compensation and benefits (1) — 0.2 9.1 1.5
Acquisition-related expenses (2) 9.0 4.2 84.4 13.5
Amortization of acquired intangible assets (3) 43.0 0.3 142.6 1.2
Assessment of computer-based lease taxes for prior period use — — — 0.3
Change in contingent consideration (0.1) — 1.0 —
Debt issuance costs — — 5.2 —
Provision for uncollectable convertible notes receivable — — 3.8 —
Change in redemption value of noncontrolling interests 0.3 0.5 1.1 1.1
Interest and other borrowing costs (4) — 5.5 — 5.7
Less: Legal settlement (5) — — — (5.5)
Less: Gain on settlement of contingent consideration — — — (1.4)
Total Non-GAAP adjustments 52.2 10.7 247.2 16.4
Income tax expense related to the items above (19.2) (3.9) (92.3) (5.7)
Re-measurement of deferred tax assets and liabilities as a result of corporate rate increase in Illinois — — 7.4 —
Effect of tax reform law (191.5) — (191.5) —
Uncertain tax position related to research and development credits — — — 1.7
Net income allocated to participating securities - effect on reconciling items 1.6 — 0.5 —
Adjusted net income allocated to common stockholders $ 97.7 $ 51.5 $ 368.0 $ 197.3
Reconciliation of Diluted EPS to Non-GAAP
Diluted earnings per common share $ 2.26 $ 0.55 $ 3.69 $ 2.27
Per share impact of non-GAAP adjustments noted above (1.39) 0.08 (0.27) 0.15
Adjusted diluted earnings per common share $ 0.87 $ 0.63 $ 3.42 $ 2.42
Reconciliation of Operating Margin to Non-GAAP
Revenue less cost of revenue $ 265.6 $ 143.0 $ 995.6 $ 566.4
Non-GAAP adjustments noted above — — — —
Adjusted revenue less cost of revenue $ 265.6 $ 143.0 $ 995.6 $ 566.4
Operating expenses $ 156.9 $ 68.1 $ 623.7 $ 268.2
Non-GAAP adjustments noted above 51.9 4.7 237.1 16.5
Adjusted operating expenses $ 105.0 $ 63.4 $ 386.6 $ 251.7
Operating income $ 108.7 $ 74.9 $ 371.9 $ 298.2
Non-GAAP adjustments noted above 51.9 4.7 237.1 16.5
Adjusted operating income $ 160.6 $ 79.6 $ 609.0 $ 314.7
Adjusted operating margin (6) 60.5 % 55.7 % 61.2 % 55.6 %
Reconciliation of Income Tax Rate to Non-GAAP
Income before income taxes 104.1 74.9 334.4 306.6
Non-GAAP adjustments noted above 52.2 10.7 247.2 16.4
Adjusted income before income taxes $ 156.3 $ 85.6 $ 581.6 $ 323.0
Income tax (benefit) expense (153.0) 29.8 (66.2) 120.9
Non-GAAP adjustments noted above 210.7 3.9 276.4 4.0
Adjusted income tax (benefit) expense $ 57.7 $ 33.7 $ 210.2 $ 124.9
Adjusted income tax rate 37.0 % 39.4 % 36.3 % 38.7 %
40

Non-GAAP Information
EBITDA Reconciliations
EBITDA (earnings before interest, income taxes, depreciation and amortization) is a widely used non-GAAP financial measure of operating performance. EBITDA margin represents EBITDA divided by revenues less cost of revenues (net revenue). It is presented as supplemental information that the company believes is useful to investors to evaluate its results because it excludes certain items that are not directly related to the company’s core operating performance. EBITDA is calculated by adding back to net income interest expense, income tax expense, depreciation and amortization. EBITDA should not be considered as substitutes either for net income, as an indicator of the company’s operating performance, or for cash flow, as a measure of the company’s liquidity. In addition, because EBITDA may not be calculated identically by all companies, the presentation here may not be comparable to other similarly titled measures of other companies.
EBITDA margin represents EBITDA divided by net revenue.
41

42
Non-GAAP Information
¹EBITDA margin represents the respective EBITDA divided by the respective net revenue as shown in the non-GAAP reconciliations provided.2Combined results for the three months ended December 31, 2017 are the same as the financial results reported as the company was operating as a combined entity for the entire quarter.

43
Non-GAAP InformationTable 6 Footnotes:
(1) For the fourth quarter of 2016, this amount includes $0.2 million for accelerated stock-based compensation expenses. For the year ended December 31, 2017, this amount includes $9.1 million for accelerated stock-based compensation expense. For the year ended December 31, 2016, this amount includes $0.9 million for accelerated stock-based compensation expenses and $0.6 million in additional bonus accrual resulting from legal settlement income.(2) This amount includes professional fees and outside services, severance, and other costs related to the company’s acquisition of Bats.(3) This amount represents the amortization of acquired intangible assets for Bats.(4) This amount represents interest and other borrowing costs incurred prior to the close of the Bats acquisition.(5) Settlement received for attorney fees and expenses relating to a litigation matter, reported in investment and other income.(6) Adjusted operating margin represents adjusted operating income divided by adjusted revenue less cost of revenue.
Table 8 Footnotes:
¹Bats historical activity for 2016 reflects activity for the period beginning October 1, 2016 through December 31, 2016.
(1) Reflects adjustments to reduce Bats historical amortization of acquired intangibles by $6.7 million and increase amortization of acquired intangibles by $42.0
million.
(2) Reflects adjustments to remove acquisition costs as if the acquisition had occurred on January 1, 2016.
(3) Reflects net other income of $1.2 million resulting from interest expense on Cboe debt less Bats historical interest expense.
(4) Reflects adjustment of amortization of purchased intangibles totaling $42.4 million.
(5) Operating margin represents operating income divided by revenue less cost of revenue.
(6) Total non-transaction revenue represents the sum of access fees, exchange services and other fees, market data fees, regulatory fees (net of Section 31 fees)
and other revenue
(7) The percentage of non-transaction revenue represents total non-transaction revenue divided by revenue less cost of revenue
Table 9 Footnotes:¹Bats historical activity for 2016 reflects activity for the period beginning January 1, 2016 through December 31, 2016.(1) Reflects adjustments to reduce Bats historical amortization of acquired intangibles by $24.7 million and increase amortization of acquired intangibles by $168.2 million.(2) Reflects adjustments to remove acquisition costs as if the acquisition had occurred on January 1, 2016.(3) Reflects net other income of $16.5 million resulting from interest expense on Cboe debt less Bats historical interest expense.(4) Reflects adjustment of amortization of purchased intangibles totaling $169.6 million.(5) Operating margin represents operating income divided by revenue less cost of revenue.(6) Total non-transaction revenue represents the sum of access fees, exchange services and other fees, market data fees, regulatory fees (net of Section 31 fees) and other revenue(7) The percentage of non-transaction revenue represents total non-transaction revenue divided by revenue less cost of revenue.
Table 10 Footnotes:¹Bats historical activity for 2017 reflects activity for the period beginning January 1, 2017 through February 28, 2017.(1) Reflects adjustments to reduce Bats historical amortization of acquired intangibles by $4.5 million and increase amortization of acquired intangibles by $28.0 million.(2) Reflects adjustments to remove acquisition costs as if the acquisition had occurred on January 1, 2016.(3) Reflects net other income of $13.6 million resulting from Bats historical interest expense and loss of extinguishment of debt.(4) Reflects adjustment of amortization of purchased intangibles totaling $169.8 million.(5) Operating margin represents operating income divided by revenue less cost of revenue.(6) Total non-transaction revenue represents the sum of access fees, exchange services and other fees, market data fees, regulatory fees (net of Section 31 fees) and other revenue(7) The percentage of non-transaction revenue represents total non-transaction revenue divided by revenue less cost of revenue.

Non-GAAP Information (see slide 43 for footnotes)
44

Non-GAAP Information (see footnotes on slide 43)
45

Non-GAAP Information (see slide 43 for footnotes)
46

Non-GAAP Information
47
¹A full reconciliation of our non-GAAP and combined results to our GAAP results are available in this section.

48
Non-GAAP Information
Adjusted cash is a non-GAAP measure and represents cash and cash equivalents plus financial investments minus cash collected for Section 31 fees, which will need to be remitted in the near term. We have presented adjusted cash because we consider it an important supplemental measure of our liquidity and believe that it is frequently used by analysts, investors and other interested parties in the evaluation of companies.
Adjusted Cash as of December 31, 2017 - Table 12(in millions)Cash and cash equivalents $ 143.5
Financial investments 47.3
Cash collected for Section 31 fees (70.6)
Adjusted cash $ 120.2

49
Cboe Global Markets400 South LaSalle StreetChicago, IL 60605www.cboe.com
49