Embed Size (px)
Citation preview

Earnings Conference Call
Fourth Quarter and Full Year 2014
2
Cautionary Statement
Information Current as of February 13, 2015
Except as expressly noted, the information in this presentation is current as of February 13, 2015 — the date on which PGE filed its Annual Report on Form 10-K for the year ended December 31, 2014 — and should not be relied upon as being current as of any subsequent date. PGE undertakes no duty to update the presentation, except as may be required by law. Forward-Looking Statements Statements in this news release that relate to future plans, objectives, expectations, performance, events and the like may constitute “forward-looking statements” within the meaning of the Private Securities Litigation Reform Act of 1995, Section 27A of the Securities Act of 1933, as amended, and Section 21E of the Securities Exchange Act of 1934, as amended. Forward-looking statements include statements regarding earnings guidance; statements regarding future load, hydro conditions and operating and maintenance costs; statements concerning implementation of the company’s integrated resource plan; statements concerning future compliance with regulations limiting emissions from generation facilities and the costs to achieve such compliance; as well as other statements containing words such as “anticipates,” “believes,” “intends,” “estimates,” “promises,” “expects,” “should,” “conditioned upon,” and similar expressions. Investors are cautioned that any such forward-looking statements are subject to risks and uncertainties, including reductions in demand for electricity; the sale of excess energy during periods of low demand or low wholesale market prices; operational risks relating to the company’s generation facilities, including hydro conditions, wind conditions, disruption of fuel supply, and unscheduled plant outages, which may result in unanticipated operating, maintenance and repair costs, as well as replacement power costs; failure to complete capital projects on schedule or within budget, or the abandonment of capital projects, which could result in the company’s inability to recover project costs; the costs of compliance with environmental laws and regulations, including those that govern emissions from thermal power plants; changes in weather, hydroelectric and energy markets conditions, which could affect the availability and cost of purchased power and fuel; changes in capital market conditions, which could affect the availability and cost of capital and result in delay or cancellation of capital projects; the outcome of various legal and regulatory proceedings; and general economic and financial market conditions. As a result, actual results may differ materially from those projected in the forward-looking statements. All forward-looking statements included in this news release are based on information available to the company on the date hereof and such statements speak only as of the date hereof. The company assumes no obligation to update any such forward-looking statement. Prospective investors should also review the risks and uncertainties listed in the company’s most recent annual report on form 10-K and the company’s reports on forms 8-K and 10-Q filed with the United States Securities and Exchange Commission, including management’s discussion and analysis of financial condition and results of operations and the risks described therein from time to time.
3
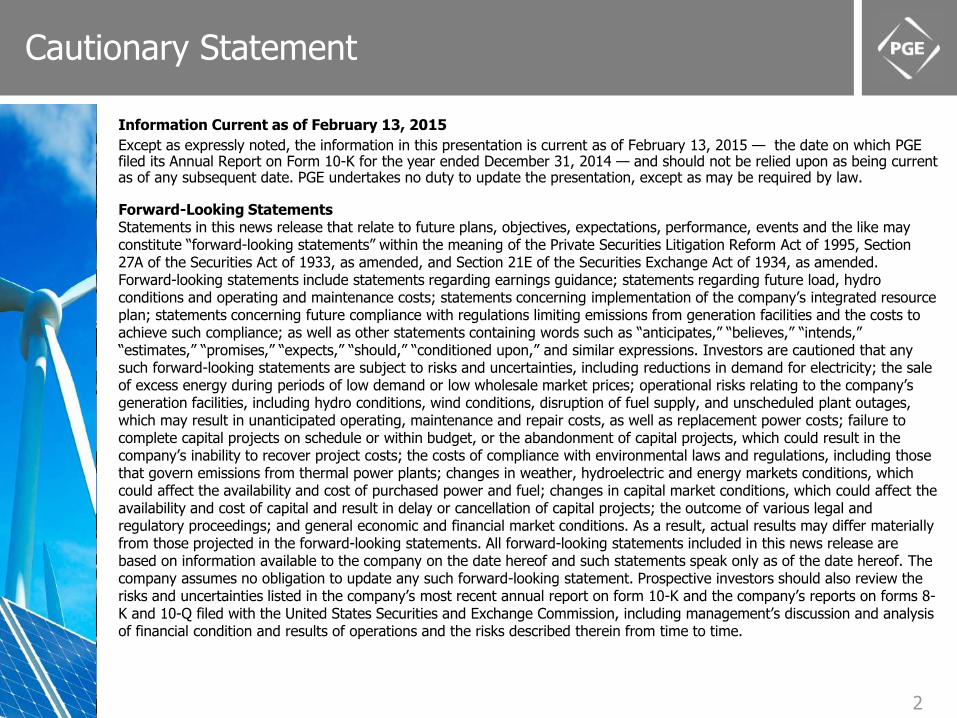
Leadership Presenting Today
Jim Lobdell Senior VP of Finance,
CFO & Treasurer
Jim Piro President & CEO
On Today’s Call
▪ Operational Update
▪ Economy and Customers
▪ Strategic Initiatives
▪ Financial Update
▪ Regulatory Update
4
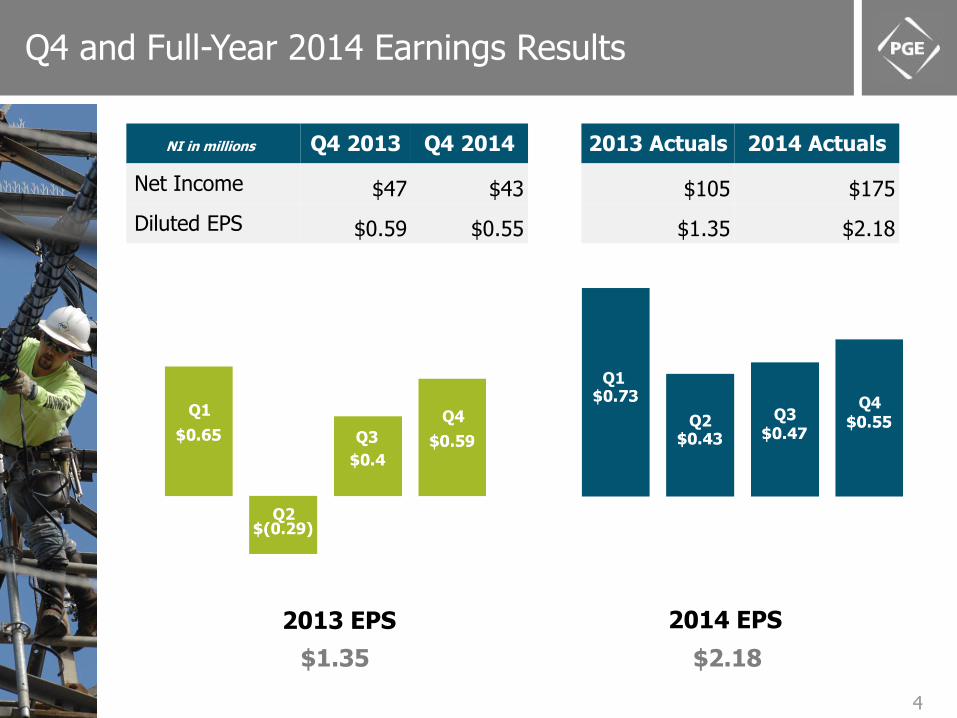
Q4 and Full-Year 2014 Earnings Results
$1.35
NI in millions Q4 2013 Q4 2014
Net Income $47 $43
Diluted EPS $0.59 $0.55
$2.18
2013 EPS 2014 EPS
2013 Actuals 2014 Actuals
$105 $175
$1.35 $2.18
Q1
Q2
Q3
Q4
Q1
Q2 Q3 Q4
5
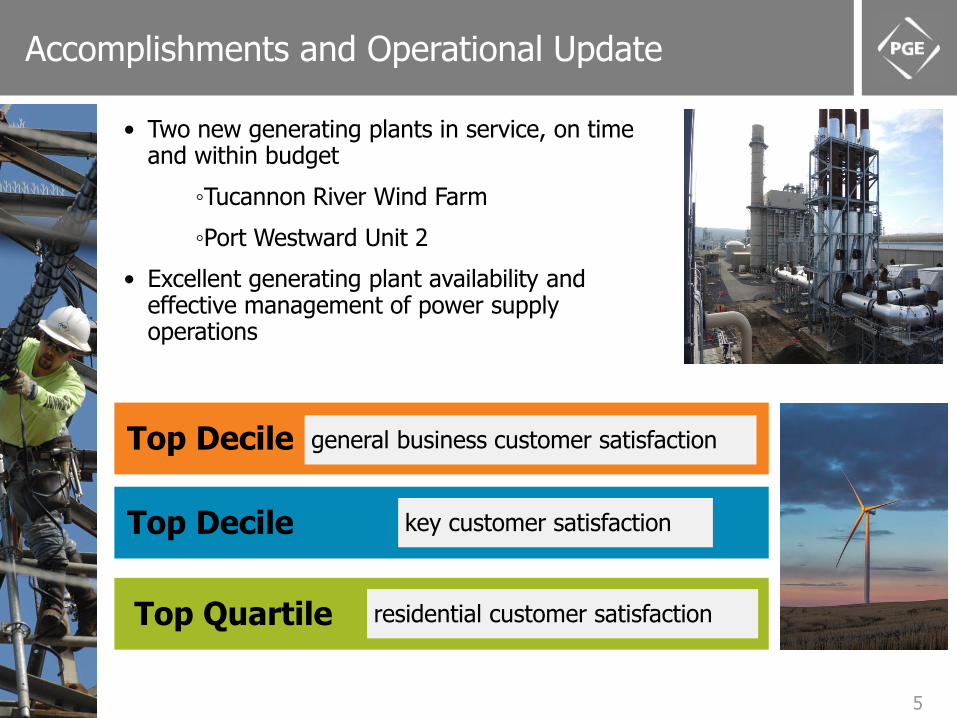
Accomplishments and Operational Update
general business customer satisfaction
key customer satisfaction
residential customer satisfaction
Top Decile
Top Decile
Top Quartile
• Two new generating plants in service, on time and within budget
◦Tucannon River Wind Farm
◦Port Westward Unit 2
• Excellent generating plant availability and effective management of power supply operations
6
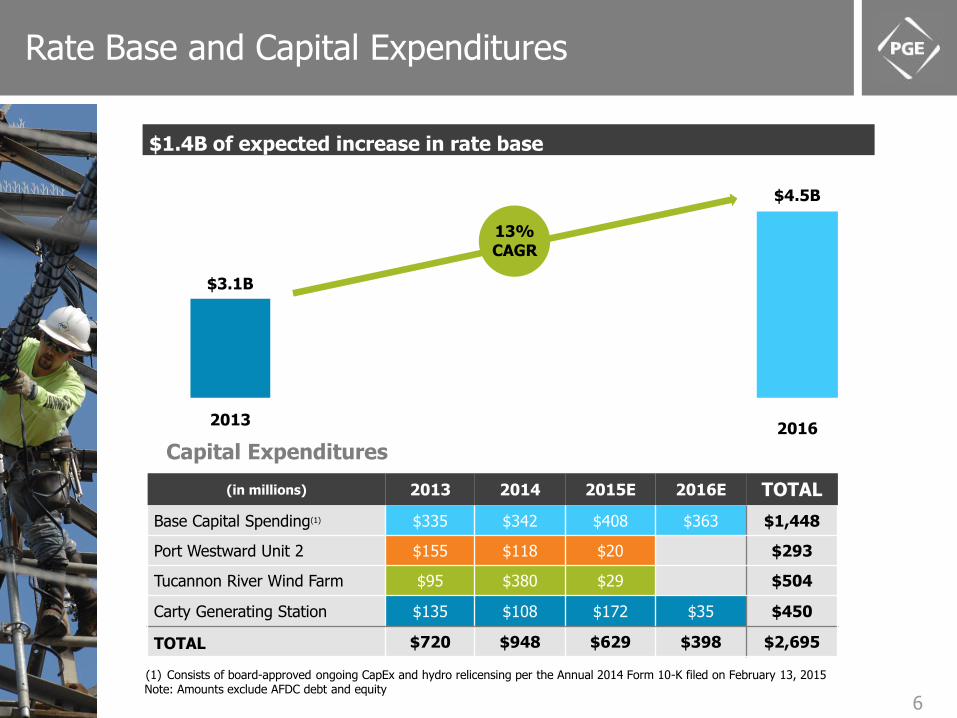
Rate Base and Capital Expenditures
(in millions) 2013 2014 2015E 2016E TOTAL
Base Capital Spending(1) $335 $342 $408 $363 $1,448
Port Westward Unit 2 $155 $118 $20 $293
Tucannon River Wind Farm $95 $380 $29 $504
Carty Generating Station $135 $108 $172 $35 $450
TOTAL $720 $948 $629 $398 $2,695
(1) Consists of board-approved ongoing CapEx and hydro relicensing per the Annual 2014 Form 10-K filed on February 13, 2015 Note: Amounts exclude AFDC debt and equity
Capital Expenditures
$3.1B
2013 2016
13% CAGR
$4.5B
$1.4B of expected increase in rate base
7
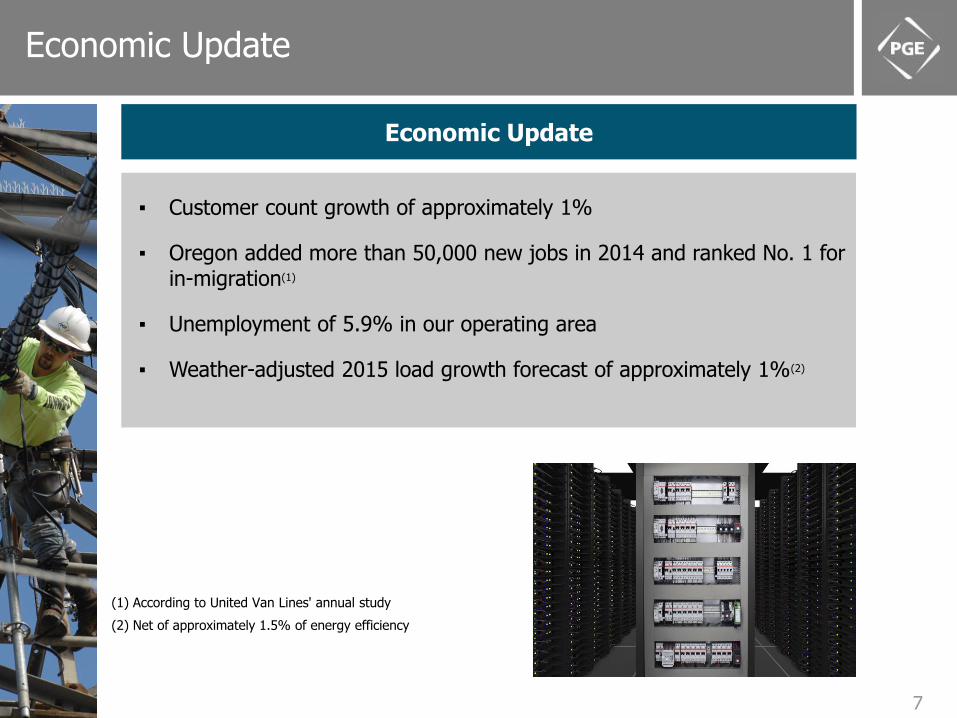
Economic Update
(1) According to United Van Lines' annual study
(2) Net of approximately 1.5% of energy efficiency
Economic Update
▪ Customer count growth of approximately 1%
▪ Oregon added more than 50,000 new jobs in 2014 and ranked No. 1 for in-migration(1)
▪ Unemployment of 5.9% in our operating area
▪ Weather-adjusted 2015 load growth forecast of approximately 1%(2)
8
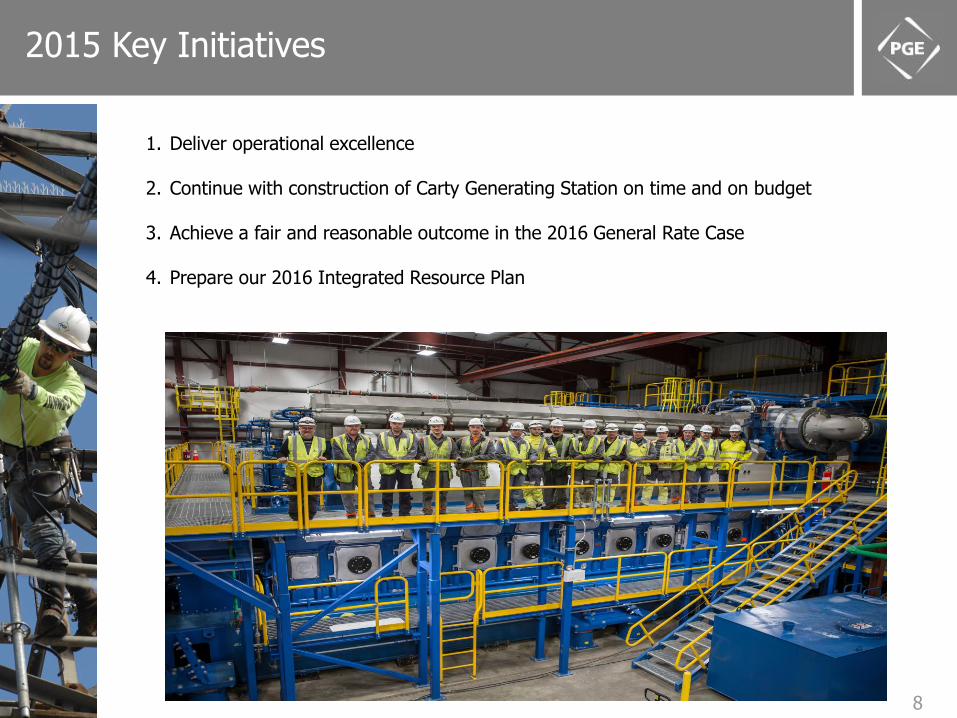
2015 Key Initiatives
1. Deliver operational excellence
2. Continue with construction of Carty Generating Station on time and on budget
3. Achieve a fair and reasonable outcome in the 2016 General Rate Case
4. Prepare our 2016 Integrated Resource Plan
9
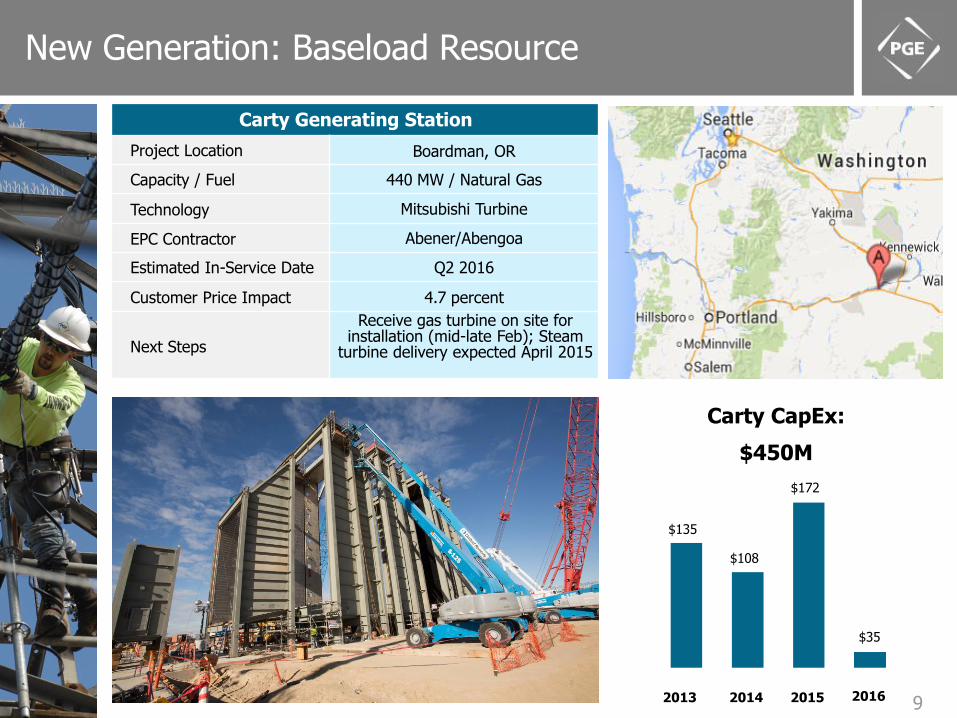
New Generation: Baseload Resource
Carty CapEx:
$450M
Carty Generating Station
Project Location Boardman, OR
Capacity / Fuel 440 MW / Natural Gas
Technology Mitsubishi Turbine
EPC Contractor Abener/Abengoa
Estimated In-Service Date Q2 2016
Customer Price Impact 4.7 percent
Next Steps
Receive gas turbine on site for installation (mid-late Feb); Steam
turbine delivery expected April 2015
$135
$108
$172
$35
2013 2014 2015 2016
10
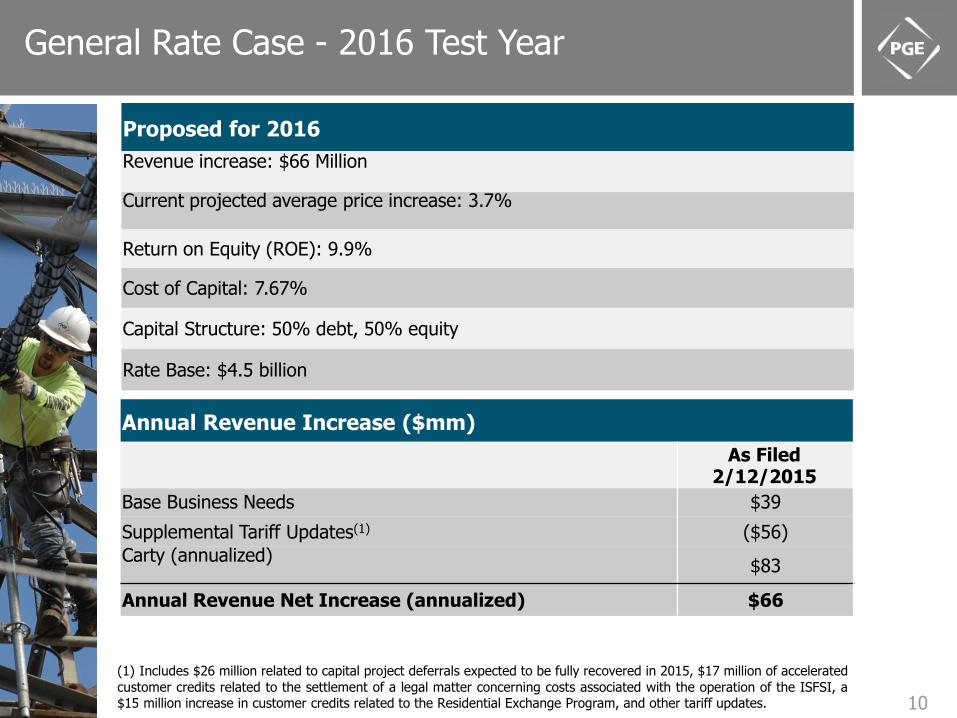
General Rate Case - 2016 Test Year
Proposed for 2016
Revenue increase: $66 Million Current projected average price increase: 3.7%
Return on Equity (ROE): 9.9%
Cost of Capital: 7.67%
Capital Structure: 50% debt, 50% equity
Rate Base: $4.5 billion
Annual Revenue Increase ($mm)
As Filed 2/12/2015
Base Business Needs $39
Supplemental Tariff Updates(1) ($56)
Carty (annualized) $83
Annual Revenue Net Increase (annualized) $66
(1) Includes $26 million related to capital project deferrals expected to be fully recovered in 2015, $17 million of accelerated
customer credits related to the settlement of a legal matter concerning costs associated with the operation of the ISFSI, a $15 million increase in customer credits related to the Residential Exchange Program, and other tariff updates.
11
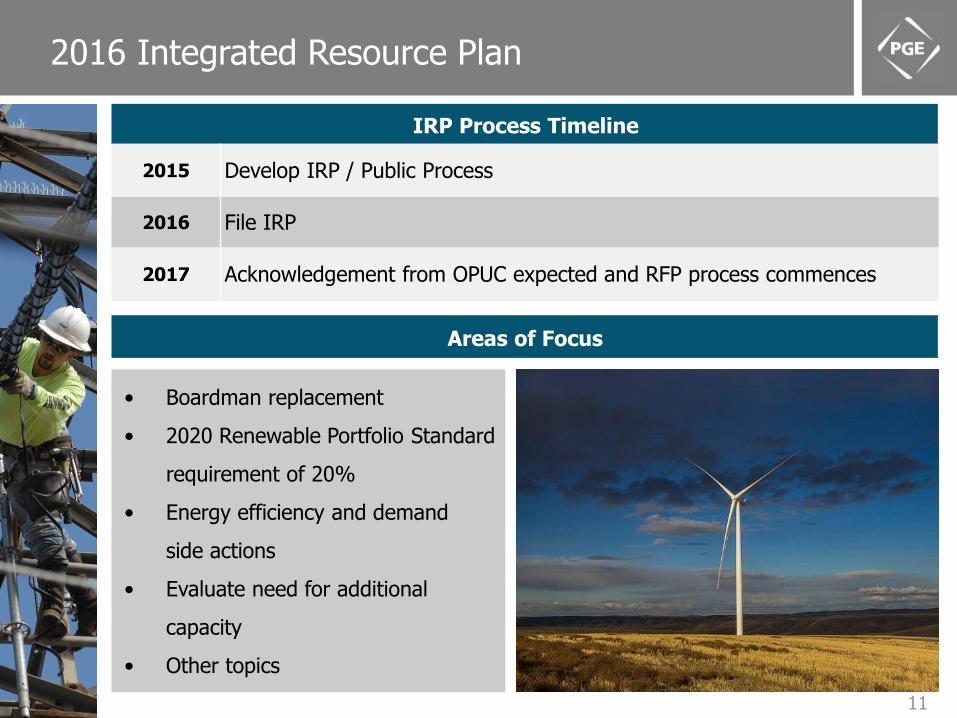
2016 Integrated Resource Plan
IRP Process Timeline
2015 Develop IRP / Public Process
2016 File IRP
2017 Acknowledgement from OPUC expected and RFP process commences
Areas of Focus
• Boardman replacement
• 2020 Renewable Portfolio Standard
requirement of 20%
• Energy efficiency and demand
side actions
• Evaluate need for additional
capacity
• Other topics
12
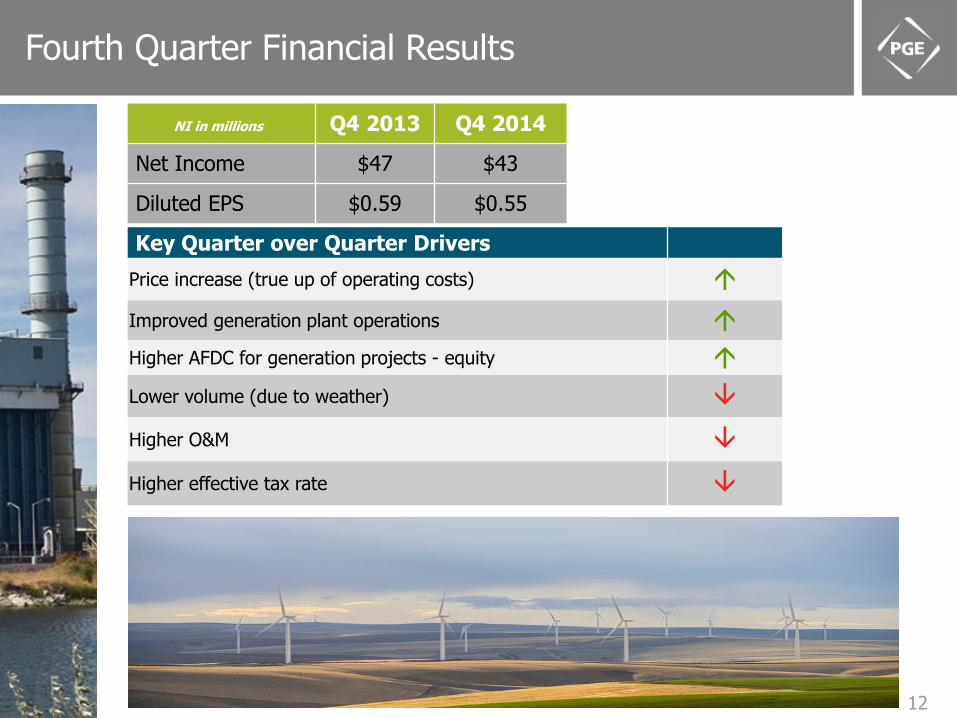
Fourth Quarter Financial Results
NI in millions Q4 2013 Q4 2014
Net Income $47 $43
Diluted EPS $0.59 $0.55
Key Quarter over Quarter Drivers
Price increase (true up of operating costs)
Improved generation plant operations
Higher AFDC for generation projects - equity
Lower volume (due to weather)
Higher O&M
Higher effective tax rate
13
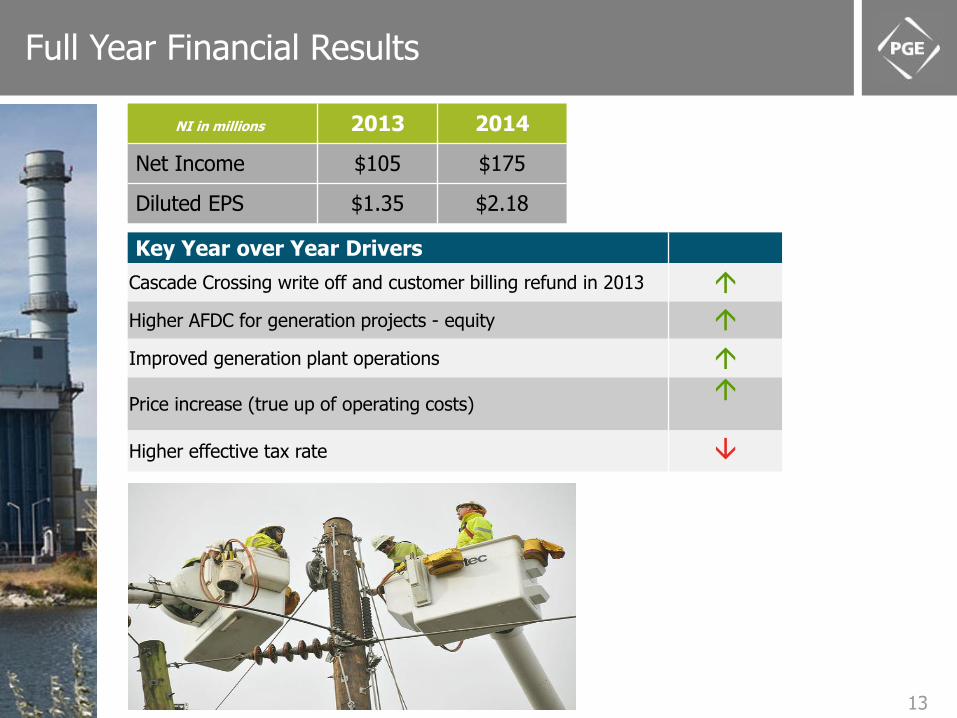
Full Year Financial Results
NI in millions 2013 2014
Net Income $105 $175
Diluted EPS $1.35 $2.18
Key Year over Year Drivers
Cascade Crossing write off and customer billing refund in 2013
Higher AFDC for generation projects - equity
Improved generation plant operations
Price increase (true up of operating costs)
Higher effective tax rate
14
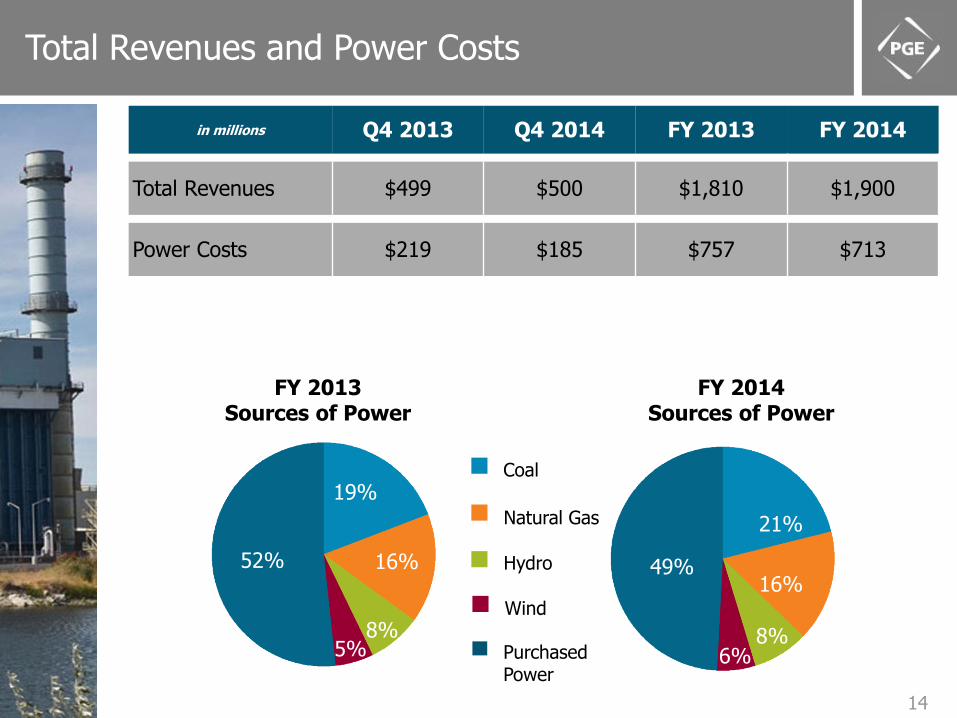
FY 2014 Sources of Power
Total Revenues and Power Costs
in millions Q4 2013 Q4 2014 FY 2013 FY 2014
Total Revenues $499 $500 $1,810 $1,900
Power Costs $219 $185 $757 $713
52%
19%
8%
16%
5%
49%
21%
8%
16%
Coal
Natural Gas
Hydro
Wind
Purchased Power
FY 2013 Sources of Power
6%
15
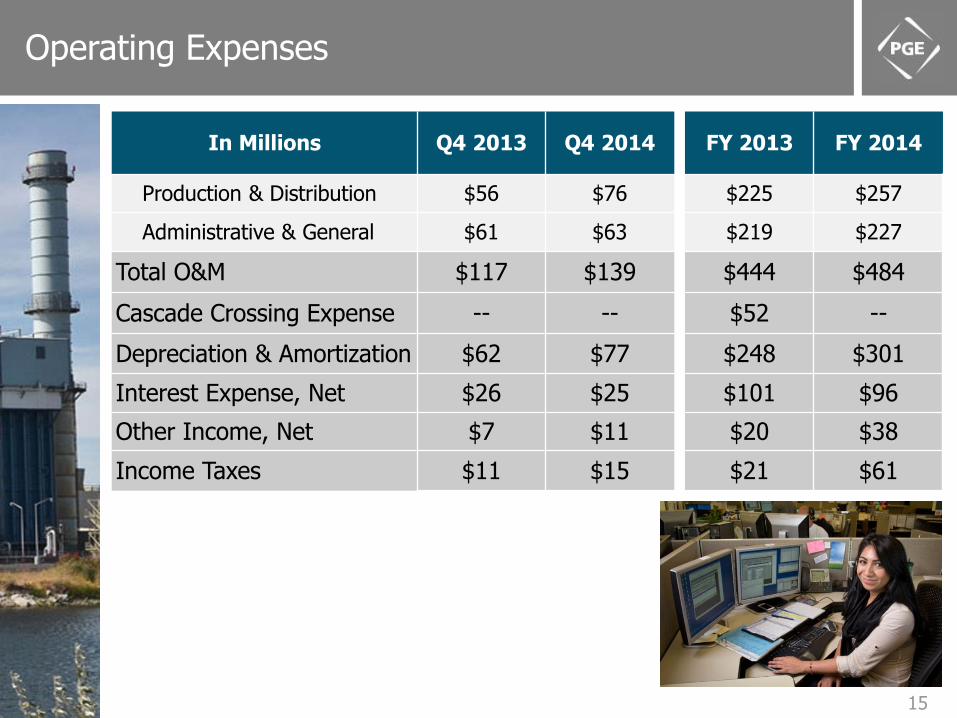
Operating Expenses
In Millions Q4 2013 Q4 2014 FY 2013 FY 2014
Production & Distribution $56 $76 $225 $257
Administrative & General $61 $63 $219 $227
Total O&M $117 $139 $444 $484
Cascade Crossing Expense -- -- $52 --
Depreciation & Amortization $62 $77 $248 $301
Interest Expense, Net $26 $25 $101 $96
Other Income, Net $7 $11 $20 $38
Income Taxes $11 $15 $21 $61
16
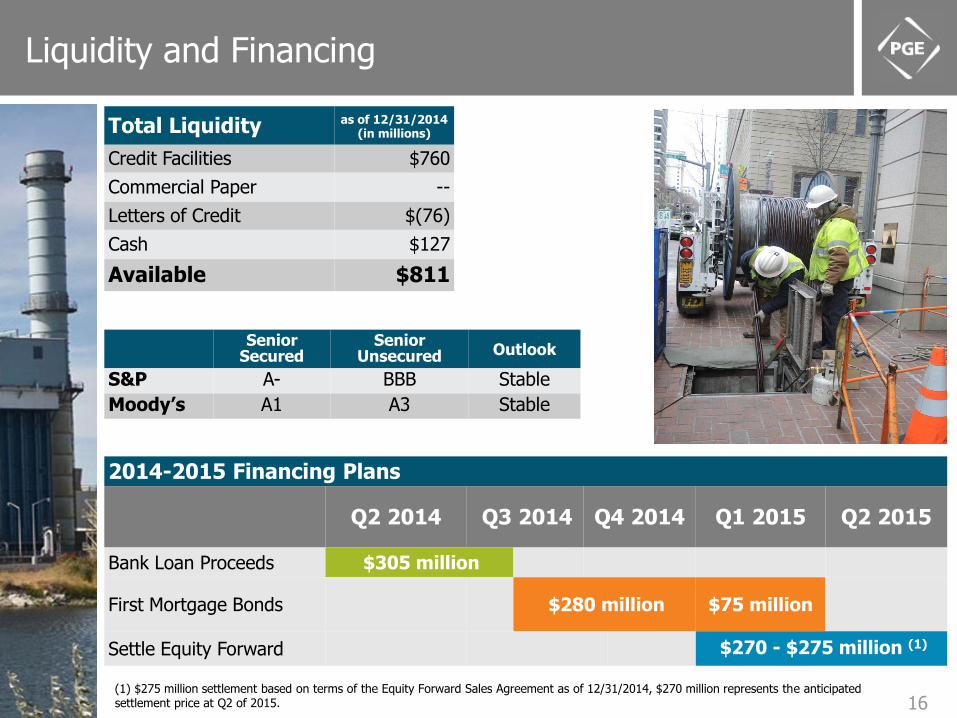
Liquidity and Financing
Senior Secured
Senior Unsecured Outlook
S&P A- BBB Stable
Moody’s A1 A3 Stable
Total Liquidity as of 12/31/2014 (in millions)
Credit Facilities $760
Commercial Paper --
Letters of Credit $(76)
Cash $127
Available $811
2014-2015 Financing Plans
Q2 2014 Q3 2014 Q4 2014 Q1 2015 Q2 2015
Bank Loan Proceeds $305 million
First Mortgage Bonds $280 million $75 million
Settle Equity Forward $270 - $275 million (1)
(1) $275 million settlement based on terms of the Equity Forward Sales Agreement as of 12/31/2014, $270 million represents the anticipated settlement price at Q2 of 2015.
17
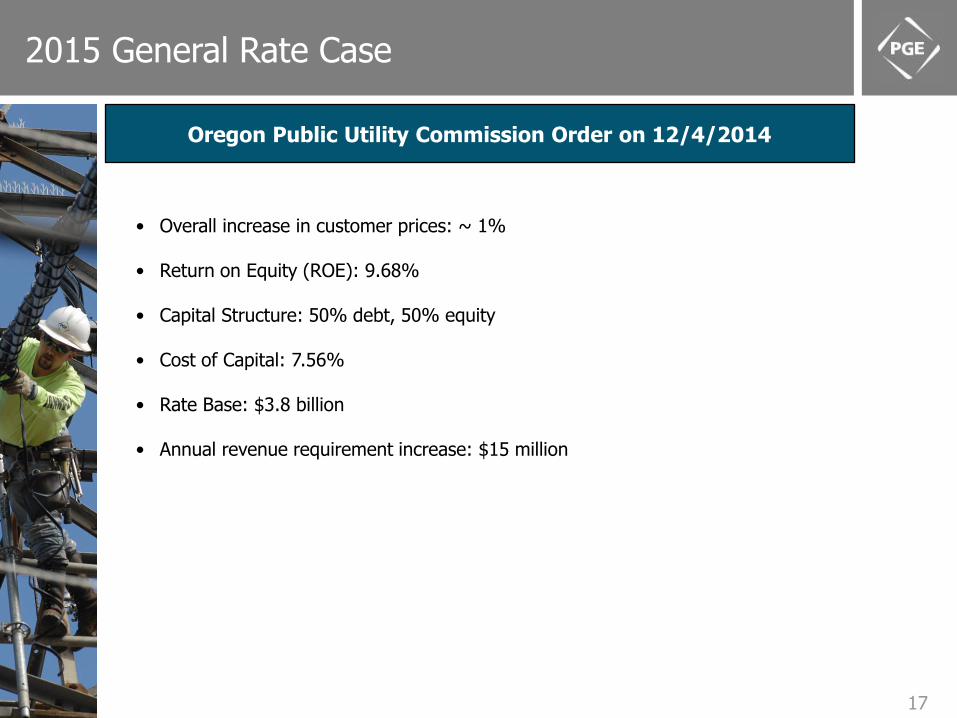
2015 General Rate Case
Oregon Public Utility Commission Order on 12/4/2014
• Overall increase in customer prices: ~ 1%
• Return on Equity (ROE): 9.68%
• Capital Structure: 50% debt, 50% equity
• Cost of Capital: 7.56%
• Rate Base: $3.8 billion
• Annual revenue requirement increase: $15 million
18
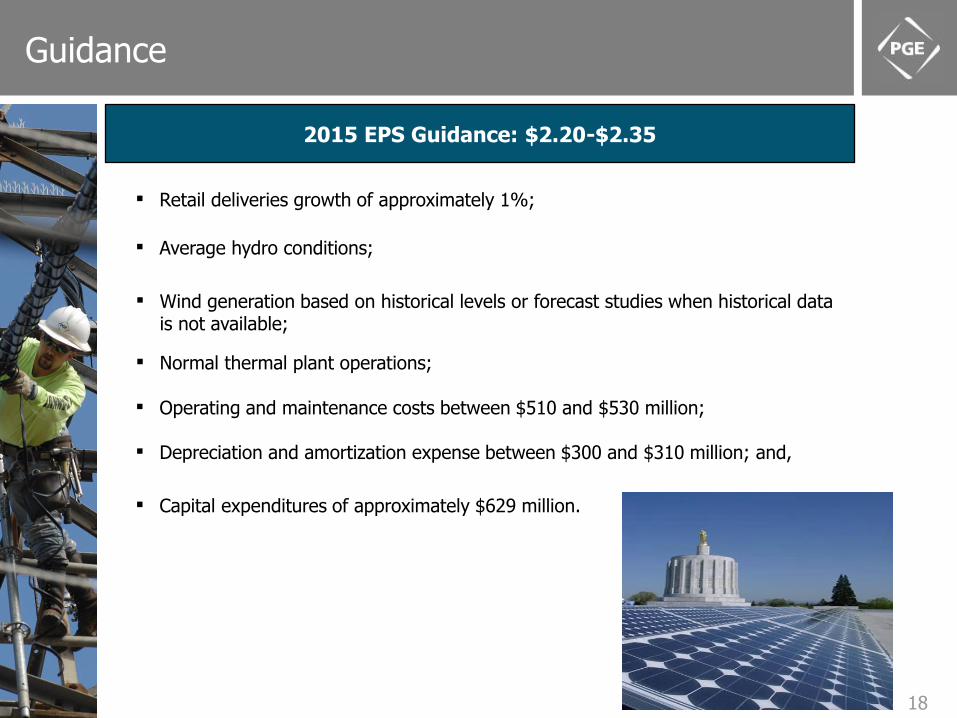
Guidance
2015 EPS Guidance: $2.20-$2.35
▪ Retail deliveries growth of approximately 1%;
▪ Average hydro conditions;
▪ Wind generation based on historical levels or forecast studies when historical data is not available;
▪ Normal thermal plant operations;
▪ Operating and maintenance costs between $510 and $530 million;
▪ Depreciation and amortization expense between $300 and $310 million; and,
▪ Capital expenditures of approximately $629 million.