Embed Size (px)
Citation preview
1
Contacts in Mexico City: Francisco Martinez Investor Relations Officer Tel: +52 (55) 5279-8107 E-mail: [email protected]
Contacts in New York: Maria Barona i-advize Corporate Communications, Inc. Tel: +(212) 406-3691 E-mail: [email protected]
FOURTHQUARTERANDFULLYEAR2017EARNINGSREPORT
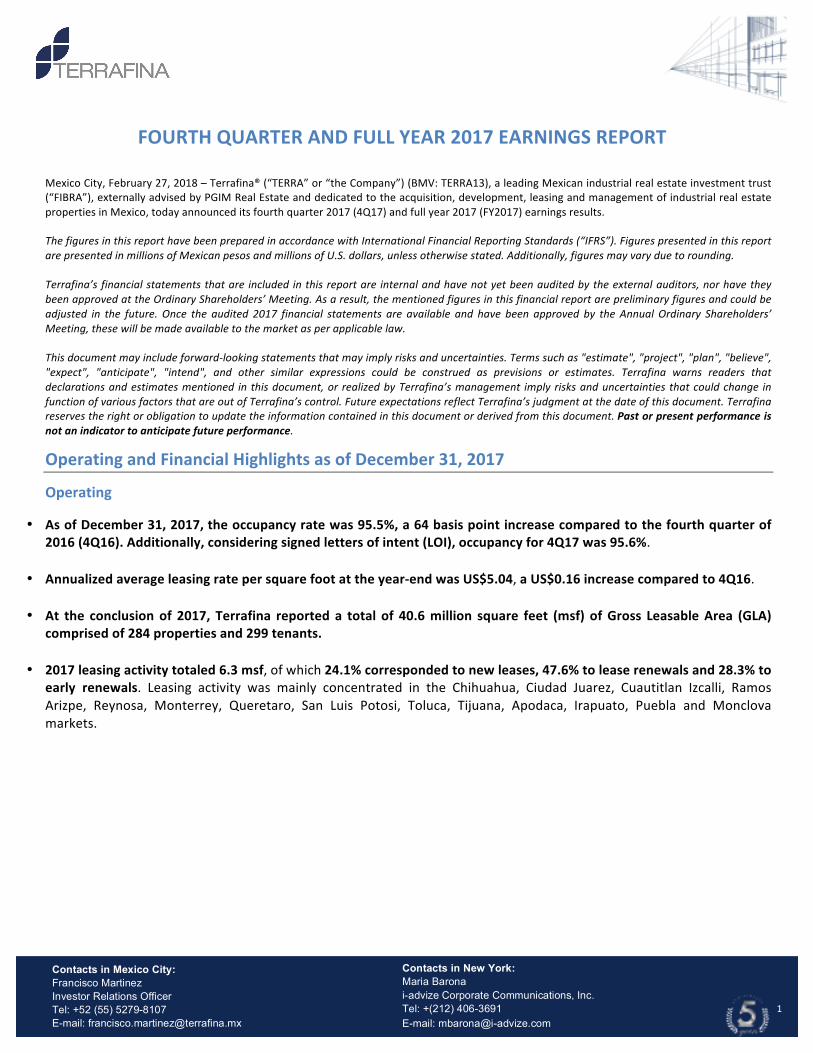
MexicoCity,February27,2018–Terrafina®(“TERRA”or“theCompany”)(BMV:TERRA13),aleadingMexicanindustrialrealestateinvestmenttrust(“FIBRA”),externallyadvisedbyPGIMRealEstateanddedicatedtotheacquisition,development,leasingandmanagementofindustrialrealestatepropertiesinMexico,todayannounceditsfourthquarter2017(4Q17)andfullyear2017(FY2017)earningsresults.ThefiguresinthisreporthavebeenpreparedinaccordancewithInternationalFinancialReportingStandards(“IFRS”).FigurespresentedinthisreportarepresentedinmillionsofMexicanpesosandmillionsofU.S.dollars,unlessotherwisestated.Additionally,figuresmayvaryduetorounding.Terrafina’sfinancialstatementsthatare includedinthisreportare internalandhavenotyetbeenauditedbytheexternalauditors,norhavetheybeenapprovedattheOrdinaryShareholders’Meeting.Asaresult,thementionedfiguresinthisfinancialreportarepreliminaryfiguresandcouldbeadjusted in the future. Once the audited 2017 financial statements are available and have been approved by the AnnualOrdinary Shareholders’Meeting,thesewillbemadeavailabletothemarketasperapplicablelaw.Thisdocumentmayincludeforward-lookingstatementsthatmayimplyrisksanduncertainties.Termssuchas"estimate","project","plan","believe","expect", "anticipate", "intend", and other similar expressions could be construed as previsions or estimates. Terrafina warns readers thatdeclarationsandestimatesmentioned in thisdocument,or realizedbyTerrafina’smanagement implyrisksanduncertainties thatcouldchange infunctionofvariousfactorsthatareoutofTerrafina’scontrol.FutureexpectationsreflectTerrafina’sjudgmentatthedateofthisdocument.Terrafinareservestherightorobligationtoupdatetheinformationcontainedinthisdocumentorderivedfromthisdocument.Pastorpresentperformanceisnotanindicatortoanticipatefutureperformance.
OperatingandFinancialHighlightsasofDecember31,2017
Operating
• AsofDecember31,2017,theoccupancyratewas95.5%,a64basispointincreasecomparedtothefourthquarterof2016(4Q16).Additionally,consideringsignedlettersofintent(LOI),occupancyfor4Q17was95.6%.
• Annualizedaverageleasingratepersquarefootattheyear-endwasUS$5.04,aUS$0.16increasecomparedto4Q16.
• At the conclusionof 2017, Terrafina reported a total of 40.6million square feet (msf) ofGross LeasableArea (GLA)comprisedof284propertiesand299tenants.
• 2017leasingactivitytotaled6.3msf,ofwhich24.1%correspondedtonewleases,47.6%toleaserenewalsand28.3%to
early renewals. Leasing activity was mainly concentrated in the Chihuahua, Ciudad Juarez, Cuautitlan Izcalli, RamosArizpe, Reynosa, Monterrey, Queretaro, San Luis Potosi, Toluca, Tijuana, Apodaca, Irapuato, Puebla and Monclovamarkets.
2
Financial• FY2017rentalrevenuesreachedUS$166.9million,ofwhichUS$43.8millionweregeneratedduring4Q17;a31.2%
orUS$10.4millionincreasecomparedto4Q16.
• FY2017NOIwasUS$166.8million,ofwhichUS$44.0millionwasgeneratedduring4Q17;a32.9%orUS$10.9millionincreasecomparedto4Q16.
• TheNOImarginreached92.0%inFY2017and93.0%in4Q17,a7basispointincreasecomparedto4Q16.• FY2017EBITDAreachedUS$150.3million,ofwhichUS$39.6millionwasgeneratedin4Q17,anincreaseof33.9%or
US$10.0millioncomparedto4Q16.
• TheEBITDAmarginfor2017was83.0%and83.6%for4Q17,a67basispointincreasecomparedto4Q16.• FY2017adjustedfundsforoperations(AFFO)reachedUS$95.0million,ofwhichUS$25.6millionwasgenerated in
4Q17,anincreaseof25.8%orUS$5.3millioncomparedto4Q16.
• TheAFFOmarginwas52.4%for2017and54.1%in4Q17,a276basispointdecreasecomparedto4Q16.• TotaldistributionforFY2017wereUS$95.0million;distributionsperCBFIwereUS$0.1286.Consideringtheaverage
sharepricefor2017ofUS$1.62(Ps.30.65),Terrafina’sdividendyieldfortheyearwas8.0%.
• 4Q17distributionstotaledUS$25.6million.Asaresult,TerrafinawilldistributePs.0.6130perCBFI (US$0.0324perCBFI) for the October 1 to December 31, 2017 period; considering the average share price of US$1.59 for 4Q17(Ps.30.20),Terrafina’sdividendyieldforthequarterwas8.1%.
FiguresindollarsintheIncomeStatementwereconvertedintopesosusingtheaverageexchangeratefortheperiod.(1)Millionsofsquarefeet.(2)Occupancyattheendoftheperiod.(3)Indicatestheleaserenewalrateoftheleases,includesearlyrenewals.(4)Excludingaccruedincomeasitisanon-cashitem.(5)Earningsbeforeinterest,taxes, depreciation and amortization. (6) Certificados Bursátiles Fiduciarios Inmobiliarios - Real Estate Investment Certificates. (*) Revenues and expenses have beenadjustedforthecalculationoftheabovementionedmetrics.FiguresindollarsintheBalanceSheetwereconvertedusingtheclosingexchangerateoftheperiod.Pleaserefertothe“2017FinancialPerformance"and"Appendices"sectionavailableinthisdocument.Source:PGIMRealEstate–AssetManagementandFundAccounting
3
OperatingandFinancialHighlights
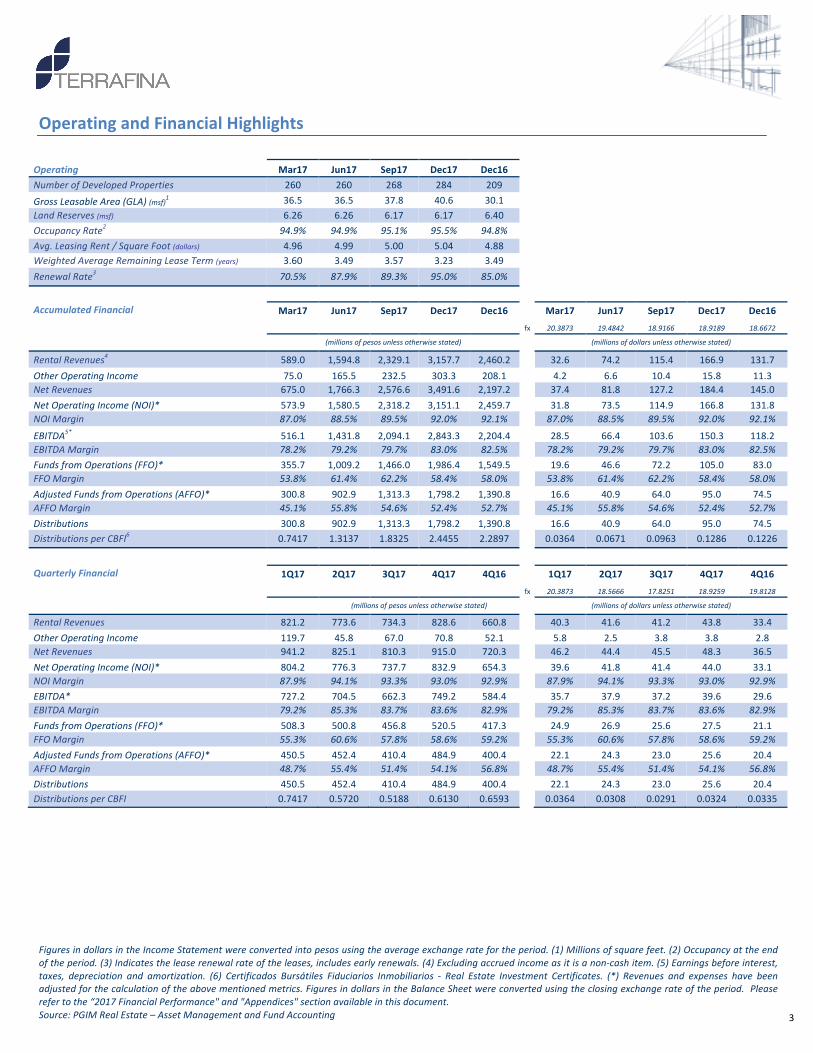
Operating Mar17 Jun17 Sep17 Dec17 Dec16 NumberofDevelopedProperties 260 260 268 284 209 GrossLeasableArea(GLA)(msf)
1 36.5 36.5 37.8 40.6 30.1 LandReserves(msf) 6.26 6.26 6.17 6.17 6.40 OccupancyRate2 94.9% 94.9% 95.1% 95.5% 94.8% Avg.LeasingRent/SquareFoot(dollars) 4.96 4.99 5.00 5.04 4.88 WeightedAverageRemainingLeaseTerm(years) 3.60 3.49 3.57 3.23 3.49 RenewalRate3 70.5% 87.9% 89.3% 95.0% 85.0%
AccumulatedFinancial Mar17 Jun17 Sep17 Dec17 Dec16 Mar17 Jun17 Sep17 Dec17 Dec16
fx 20.3873 19.4842 18.9166 18.9189 18.6672
(millionsofpesosunlessotherwisestated) (millionsofdollarsunlessotherwisestated)
RentalRevenues4 589.0 1,594.8 2,329.1 3,157.7 2,460.2 32.6 74.2 115.4 166.9 131.7OtherOperatingIncome 75.0 165.5 232.5 303.3 208.1 4.2 6.6 10.4 15.8 11.3NetRevenues 675.0 1,766.3 2,576.6 3,491.6 2,197.2 37.4 81.8 127.2 184.4 145.0NetOperatingIncome(NOI)* 573.9 1,580.5 2,318.2 3,151.1 2,459.7 31.8 73.5 114.9 166.8 131.8NOIMargin 87.0% 88.5% 89.5% 92.0% 92.1% 87.0% 88.5% 89.5% 92.0% 92.1%
EBITDA5* 516.1 1,431.8 2,094.1 2,843.3 2,204.4 28.5 66.4 103.6 150.3 118.2EBITDAMargin 78.2% 79.2% 79.7% 83.0% 82.5% 78.2% 79.2% 79.7% 83.0% 82.5%FundsfromOperations(FFO)* 355.7 1,009.2 1,466.0 1,986.4 1,549.5 19.6 46.6 72.2 105.0 83.0FFOMargin 53.8% 61.4% 62.2% 58.4% 58.0% 53.8% 61.4% 62.2% 58.4% 58.0%AdjustedFundsfromOperations(AFFO)* 300.8 902.9 1,313.3 1,798.2 1,390.8 16.6 40.9 64.0 95.0 74.5AFFOMargin 45.1% 55.8% 54.6% 52.4% 52.7% 45.1% 55.8% 54.6% 52.4% 52.7%Distributions 300.8 902.9 1,313.3 1,798.2 1,390.8 16.6 40.9 64.0 95.0 74.5DistributionsperCBFI6 0.7417 1.3137 1.8325 2.4455 2.2897 0.0364 0.0671 0.0963 0.1286 0.1226
QuarterlyFinancial 1Q17 2Q17 3Q17 4Q17 4Q16 1Q17 2Q17 3Q17 4Q17 4Q16
fx 20.3873 18.5666 17.8251 18.9259 19.8128
(millionsofpesosunlessotherwisestated) (millionsofdollarsunlessotherwisestated)
RentalRevenues 821.2 773.6 734.3 828.6 660.8 40.3 41.6 41.2 43.8 33.4OtherOperatingIncome 119.7 45.8 67.0 70.8 52.1 5.8 2.5 3.8 3.8 2.8NetRevenues 941.2 825.1 810.3 915.0 720.3 46.2 44.4 45.5 48.3 36.5NetOperatingIncome(NOI)* 804.2 776.3 737.7 832.9 654.3 39.6 41.8 41.4 44.0 33.1NOIMargin 87.9% 94.1% 93.3% 93.0% 92.9% 87.9% 94.1% 93.3% 93.0% 92.9%EBITDA* 727.2 704.5 662.3 749.2 584.4 35.7 37.9 37.2 39.6 29.6EBITDAMargin 79.2% 85.3% 83.7% 83.6% 82.9% 79.2% 85.3% 83.7% 83.6% 82.9%FundsfromOperations(FFO)* 508.3 500.8 456.8 520.5 417.3 24.9 26.9 25.6 27.5 21.1FFOMargin 55.3% 60.6% 57.8% 58.6% 59.2% 55.3% 60.6% 57.8% 58.6% 59.2%AdjustedFundsfromOperations(AFFO)* 450.5 452.4 410.4 484.9 400.4 22.1 24.3 23.0 25.6 20.4AFFOMargin 48.7% 55.4% 51.4% 54.1% 56.8% 48.7% 55.4% 51.4% 54.1% 56.8%Distributions 450.5 452.4 410.4 484.9 400.4 22.1 24.3 23.0 25.6 20.4DistributionsperCBFI 0.7417 0.5720 0.5188 0.6130 0.6593 0.0364 0.0308 0.0291 0.0324 0.0335
FiguresindollarsintheBalanceSheetwereconvertedintopesosusingtheclosingexchangerateoftheperiod.Source:PGIMRealEstate–AssetManagement–FundAccounting
4
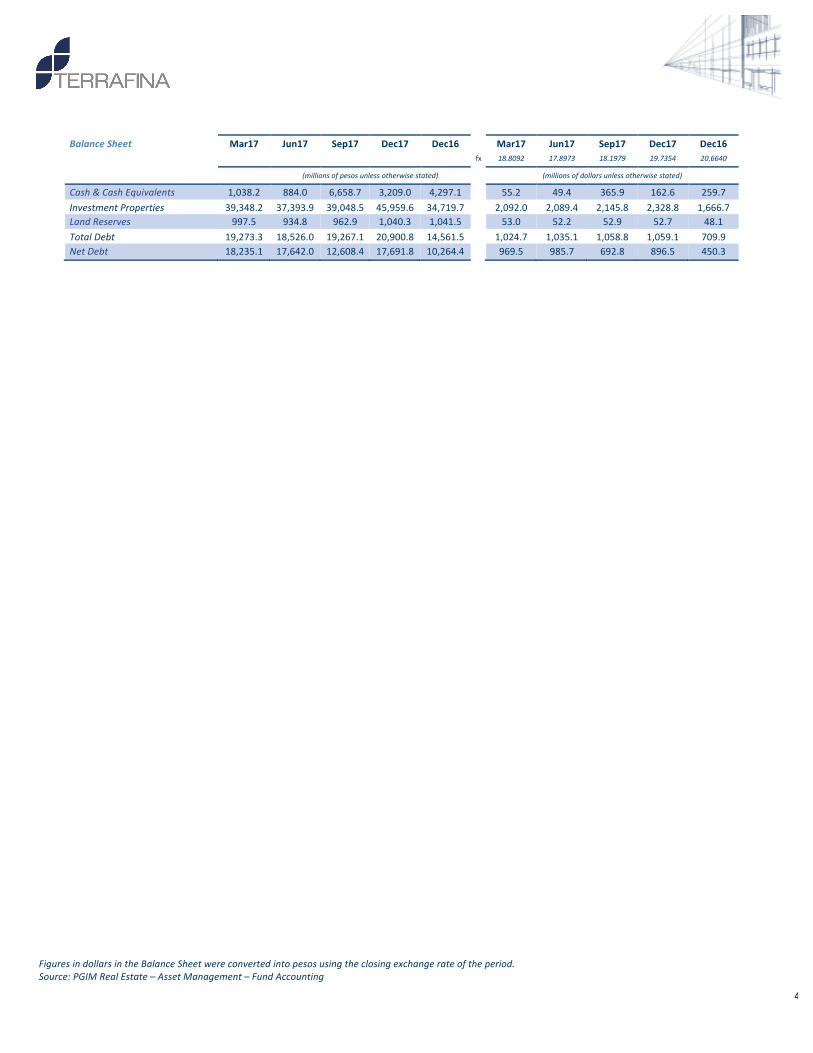
BalanceSheet Mar17 Jun17 Sep17 Dec17 Dec16 Mar17 Jun17 Sep17 Dec17 Dec16
fx 18.8092 17.8973 18.1979 19.7354 20.6640
(millionsofpesosunlessotherwisestated) (millionsofdollarsunlessotherwisestated)
Cash&CashEquivalents 1,038.2 884.0 6,658.7 3,209.0 4,297.1 55.2 49.4 365.9 162.6 259.7InvestmentProperties 39,348.2 37,393.9 39,048.5 45,959.6 34,719.7 2,092.0 2,089.4 2,145.8 2,328.8 1,666.7LandReserves 997.5 934.8 962.9 1,040.3 1,041.5 53.0 52.2 52.9 52.7 48.1TotalDebt 19,273.3 18,526.0 19,267.1 20,900.8 14,561.5 1,024.7 1,035.1 1,058.8 1,059.1 709.9NetDebt 18,235.1 17,642.0 12,608.4 17,691.8 10,264.4 969.5 985.7 692.8 896.5 450.3
F
5
CommentbyAlbertoChretin,ChiefExecutiveOfficerandChairmanoftheBoard2017was a year of great achievements for Terrafina.We reached record-highoccupancy levels of 95.5%and leasingactivityof6.3millionsquare feet, supportedbyanaverageannual renewal rateof87.0%.Leasingactivitywasmainlylocated in themarketsofChihuahua,Ciudad Juarez,Cuautitlan Izcalli,RamosArizpe,Reynosa,Monterrey,Queretaro,San Luis Potosi, Toluca, Tijuana, Apodaca, Irapuato, Puebla and Monclova. Moreover, the Company’s high renewalactivityof4.8millionsquare feetconfirms the importanceof themanufacturing-for-export sector in thecountry,andhighlightsthesolidoperationsofourmultinationaltenants.Thisresultwassupportedbyoursuccessfulbusinessmodelandthetalentandexpertisefromourpropertymanagerswhoarefocusedonprovidingservicelevelsofexcellenceofourclients.Theaveragerentalratefor2017closedatUS$5.04,increasingUS$0.14comparedtofourthquarterof2016andUS$0.04comparedtothirdquarterof2017.Averagerentalratesperregionremainedstablethroughouttheyear:theNorthernregionreachedUS$4.96persquarefoot,theBajioregionUS$5.12persquarefootandtheCentralregionUS$5.23persquarefoot.Furthermore,acquisitionactivitywasquitedynamicthroughouttheyear.WeclosedatotalofUS$661millioninClassAindustrialportfolios,increasingourexposuretokeyindustrialsectorssuchasaviation,automotiveandelectronics.Thecharacteristics of these properties contributed to the Company’s cash flow stability, as the properties representedoccupancy levelsof100%and long-termmaturity leaseterms.Additionally, theymaintainedourhighexposuretoUS-dollarrevenue;currently97%ofthecontractsaredenominatedinthiscurrency.Withtheseacquisitions,wereachedatotal of 40.6million square feet of Gross Leasable Area (GLA), which allows us to continue consolidating Terrafina’sleadershippositionintheMexicanindustrialsector.Intermsofourfinancialstrategyobjectives,werefinancedatotalofUS$500millionindebt–whichrepresentshalfofthe Company’s total debt, improving interest rate terms and increasing the average leasing term. With theseaccomplishments,weconcludedtheyearwithasolidbalancesheet,permittingustosettleourcreditobligationsataloweraveragecost.Withregardstothemainfinancialmetricsof2017,weattainedsignificantincreasescomparedto2016,suchas:rentalrevenuesofUS$166.9million,NetOperating IncomeofUS$166.8millionwithanNOImarginof93.0%, aswell as anAFFOofUS$95.0million.CBFIdistributionlevelsfor2017reachedPs.2.45,orUS$0.1286percertificateandadividendyieldof8.0%,consideringtheaverageCBFIpriceduring2017.We have a positive outlook for 2018, both for Terrafina as well as the industry as a whole. We aim to continuestrengtheningourbusinessplanwithadisciplinedapproachedtoexecuteonopportunitiesthatcontributetothegrowthofouroperationshappen.Withthis, I reiterateourcommitmenttogeneratinggreaterprofitability forTerrafinawhilemaintainingoperatingstabilityinthelongterm.
ThankyouforyourinterestinTerrafina.Sincerely,
AlbertoChretin
F
6
OperatingHighlights
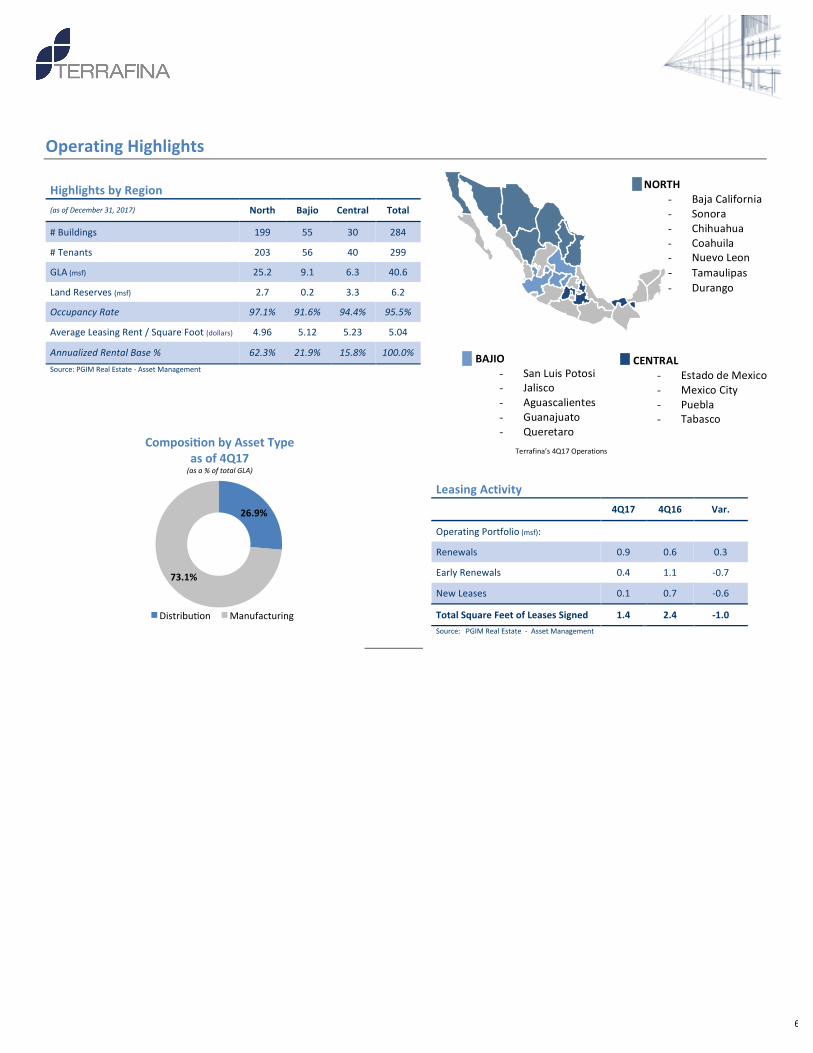
HighlightsbyRegion
(asofDecember31,2017) North Bajio Central Total
#Buildings 199 55 30 284
#Tenants 203 56 40 299
GLA(msf) 25.2 9.1 6.3 40.6
LandReserves(msf) 2.7 0.2 3.3 6.2
OccupancyRate 97.1% 91.6% 94.4% 95.5%
AverageLeasingRent/SquareFoot(dollars) 4.96 5.12 5.23 5.04
AnnualizedRentalBase% 62.3% 21.9% 15.8% 100.0%Source:PGIMRealEstate-AssetManagement
LeasingActivity 4Q17 4Q16 Var.
OperatingPortfolio(msf): Renewals 0.9 0.6 0.3
EarlyRenewals 0.4 1.1 -0.7
NewLeases 0.1 0.7 -0.6
TotalSquareFeetofLeasesSigned 1.4 2.4 -1.0Source:PGIMRealEstate-AssetManagement
NORTH - BajaCalifornia- Sonora- Chihuahua- Coahuila- NuevoLeon- Tamaulipas- Durango
BAJIO - SanLuisPotosi- Jalisco- Aguascalientes- Guanajuato- Queretaro
CENTRAL - EstadodeMexico- MexicoCity- Puebla- Tabasco
Terrafina’s4Q17Operations
26.9%
73.1%
ComposidonbyAssetTypeasof4Q17(asa%oftotalGLA)
Distribulon Manufacturing
7
OperatingHighlights(continued)
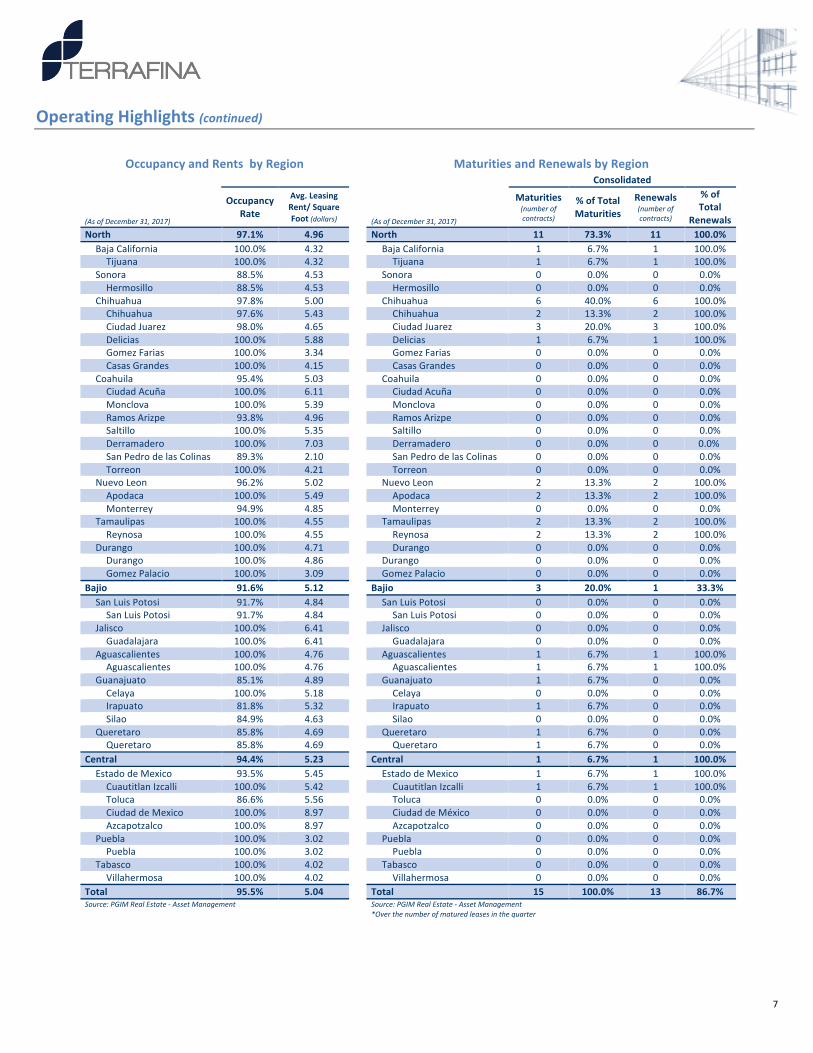
OccupancyandRentsbyRegion MaturitiesandRenewalsbyRegion
0
Consolidated
(AsofDecember31,2017)
OccupancyRate
Avg.LeasingRent/SquareFoot(dollars) (AsofDecember31,2017)
Maturities(numberofcontracts)
%ofTotalMaturities
Renewals(numberofcontracts)
%ofTotal
RenewalsNorth 97.1% 4.96 North 11 73.3% 11 100.0%BajaCalifornia 100.0% 4.32 BajaCalifornia 1 6.7% 1 100.0%Tijuana 100.0% 4.32 Tijuana 1 6.7% 1 100.0%
Sonora 88.5% 4.53 Sonora 0 0.0% 0 0.0%Hermosillo 88.5% 4.53 Hermosillo 0 0.0% 0 0.0%
Chihuahua 97.8% 5.00 Chihuahua 6 40.0% 6 100.0%Chihuahua 97.6% 5.43 Chihuahua 2 13.3% 2 100.0%CiudadJuarez 98.0% 4.65 CiudadJuarez 3 20.0% 3 100.0%Delicias 100.0% 5.88 Delicias 1 6.7% 1 100.0%GomezFarias 100.0% 3.34 GomezFarias 0 0.0% 0 0.0%CasasGrandes 100.0% 4.15 CasasGrandes 0 0.0% 0 0.0%
Coahuila 95.4% 5.03 Coahuila 0 0.0% 0 0.0%CiudadAcuña 100.0% 6.11 CiudadAcuña 0 0.0% 0 0.0%Monclova 100.0% 5.39 Monclova 0 0.0% 0 0.0%RamosArizpe 93.8% 4.96 RamosArizpe 0 0.0% 0 0.0%Saltillo 100.0% 5.35 Saltillo 0 0.0% 0 0.0%Derramadero 100.0% 7.03 Derramadero 0 0.0% 0 0.0%SanPedrodelasColinas 89.3% 2.10 SanPedrodelasColinas 0 0.0% 0 0.0%Torreon 100.0% 4.21 Torreon 0 0.0% 0 0.0%
NuevoLeon 96.2% 5.02 NuevoLeon 2 13.3% 2 100.0%Apodaca 100.0% 5.49 Apodaca 2 13.3% 2 100.0%Monterrey 94.9% 4.85 Monterrey 0 0.0% 0 0.0%
Tamaulipas 100.0% 4.55 Tamaulipas 2 13.3% 2 100.0%Reynosa 100.0% 4.55 Reynosa 2 13.3% 2 100.0%
Durango 100.0% 4.71 Durango 0 0.0% 0 0.0%Durango 100.0% 4.86 Durango 0 0.0% 0 0.0%GomezPalacio 100.0% 3.09 GomezPalacio 0 0.0% 0 0.0%
Bajio 91.6% 5.12 Bajio 3 20.0% 1 33.3%SanLuisPotosi 91.7% 4.84 SanLuisPotosi 0 0.0% 0 0.0%SanLuisPotosi 91.7% 4.84 SanLuisPotosi 0 0.0% 0 0.0%
Jalisco 100.0% 6.41 Jalisco 0 0.0% 0 0.0%Guadalajara 100.0% 6.41 Guadalajara 0 0.0% 0 0.0%
Aguascalientes 100.0% 4.76 Aguascalientes 1 6.7% 1 100.0%Aguascalientes 100.0% 4.76 Aguascalientes 1 6.7% 1 100.0%
Guanajuato 85.1% 4.89 Guanajuato 1 6.7% 0 0.0%Celaya 100.0% 5.18 Celaya 0 0.0% 0 0.0%Irapuato 81.8% 5.32 Irapuato 1 6.7% 0 0.0%Silao 84.9% 4.63 Silao 0 0.0% 0 0.0%
Queretaro 85.8% 4.69 Queretaro 1 6.7% 0 0.0%Queretaro 85.8% 4.69 Queretaro 1 6.7% 0 0.0%
Central 94.4% 5.23 Central 1 6.7% 1 100.0%EstadodeMexico 93.5% 5.45 EstadodeMexico 1 6.7% 1 100.0%CuautitlanIzcalli 100.0% 5.42 CuautitlanIzcalli 1 6.7% 1 100.0%Toluca 86.6% 5.56 Toluca 0 0.0% 0 0.0%CiudaddeMexico 100.0% 8.97 CiudaddeMéxico 0 0.0% 0 0.0%Azcapotzalco 100.0% 8.97 Azcapotzalco 0 0.0% 0 0.0%
Puebla 100.0% 3.02 Puebla 0 0.0% 0 0.0%Puebla 100.0% 3.02 Puebla 0 0.0% 0 0.0%
Tabasco 100.0% 4.02 Tabasco 0 0.0% 0 0.0%Villahermosa 100.0% 4.02 Villahermosa 0 0.0% 0 0.0%
Total 95.5% 5.04 Total 15 100.0% 13 86.7%Source:PGIMRealEstate-AssetManagement
Source:PGIMRealEstate-AssetManagement*Overthenumberofmaturedleasesinthequarter
8
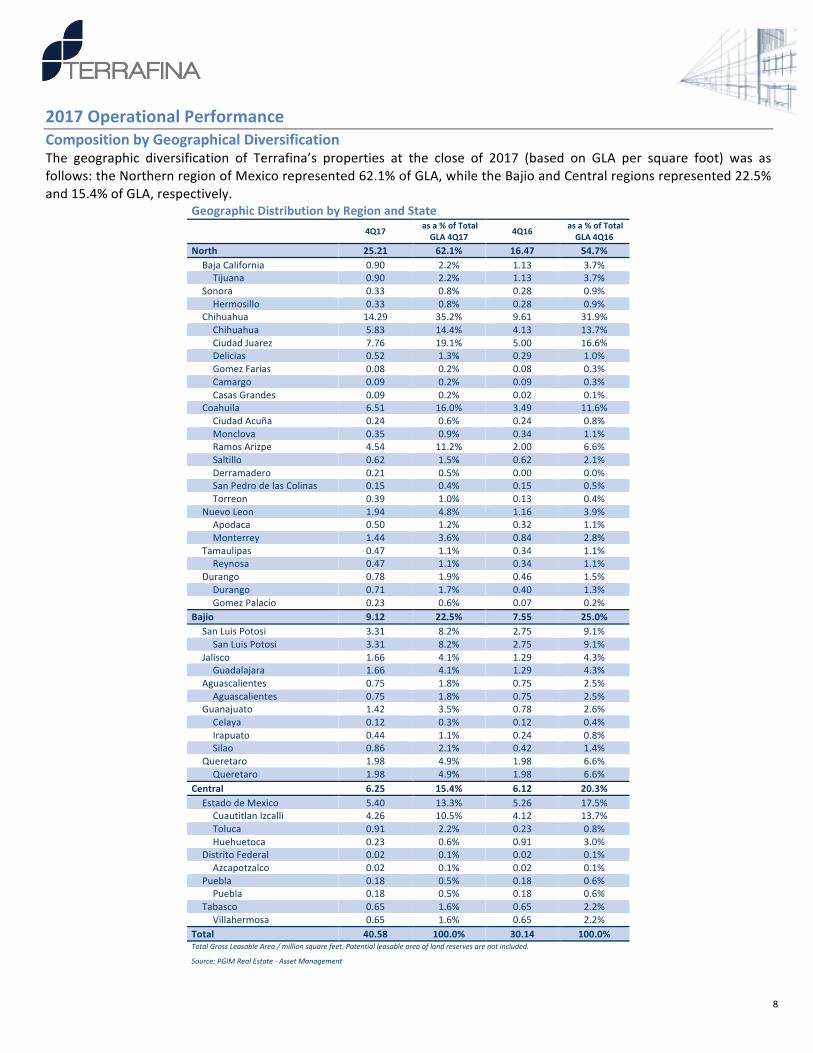
2017OperationalPerformanceCompositionbyGeographicalDiversificationThe geographic diversification of Terrafina’s properties at the close of 2017 (based on GLA per square foot) was asfollows:theNorthernregionofMexicorepresented62.1%ofGLA,whiletheBajioandCentralregionsrepresented22.5%and15.4%ofGLA,respectively.
GeographicDistributionbyRegionandState
4Q17 asa%ofTotal
GLA4Q17 4Q16 asa%ofTotalGLA4Q16
North 25.21 62.1% 16.47 54.7%BajaCalifornia 0.90 2.2% 1.13 3.7%Tijuana 0.90 2.2% 1.13 3.7%
Sonora 0.33 0.8% 0.28 0.9%Hermosillo 0.33 0.8% 0.28 0.9%
Chihuahua 14.29 35.2% 9.61 31.9%Chihuahua 5.83 14.4% 4.13 13.7%CiudadJuarez 7.76 19.1% 5.00 16.6%Delicias 0.52 1.3% 0.29 1.0%GomezFarias 0.08 0.2% 0.08 0.3%Camargo 0.09 0.2% 0.09 0.3%CasasGrandes 0.09 0.2% 0.02 0.1%
Coahuila 6.51 16.0% 3.49 11.6%CiudadAcuña 0.24 0.6% 0.24 0.8%Monclova 0.35 0.9% 0.34 1.1%RamosArizpe 4.54 11.2% 2.00 6.6%Saltillo 0.62 1.5% 0.62 2.1%Derramadero 0.21 0.5% 0.00 0.0%SanPedrodelasColinas 0.15 0.4% 0.15 0.5%Torreon 0.39 1.0% 0.13 0.4%
NuevoLeon 1.94 4.8% 1.16 3.9%Apodaca 0.50 1.2% 0.32 1.1%Monterrey 1.44 3.6% 0.84 2.8%
Tamaulipas 0.47 1.1% 0.34 1.1%Reynosa 0.47 1.1% 0.34 1.1%
Durango 0.78 1.9% 0.46 1.5%Durango 0.71 1.7% 0.40 1.3%GomezPalacio 0.23 0.6% 0.07 0.2%
Bajio 9.12 22.5% 7.55 25.0%SanLuisPotosi 3.31 8.2% 2.75 9.1%SanLuisPotosi 3.31 8.2% 2.75 9.1%
Jalisco 1.66 4.1% 1.29 4.3%Guadalajara 1.66 4.1% 1.29 4.3%
Aguascalientes 0.75 1.8% 0.75 2.5%Aguascalientes 0.75 1.8% 0.75 2.5%
Guanajuato 1.42 3.5% 0.78 2.6%Celaya 0.12 0.3% 0.12 0.4%Irapuato 0.44 1.1% 0.24 0.8%Silao 0.86 2.1% 0.42 1.4%
Queretaro 1.98 4.9% 1.98 6.6%Queretaro 1.98 4.9% 1.98 6.6%
Central 6.25 15.4% 6.12 20.3%EstadodeMexico 5.40 13.3% 5.26 17.5%CuautitlanIzcalli 4.26 10.5% 4.12 13.7%Toluca 0.91 2.2% 0.23 0.8%Huehuetoca 0.23 0.6% 0.91 3.0%
DistritoFederal 0.02 0.1% 0.02 0.1%Azcapotzalco 0.02 0.1% 0.02 0.1%
Puebla 0.18 0.5% 0.18 0.6%Puebla 0.18 0.5% 0.18 0.6%
Tabasco 0.65 1.6% 0.65 2.2%Villahermosa 0.65 1.6% 0.65 2.2%
Total 40.58 100.0% 30.14 100.0%TotalGrossLeasableArea/millionsquarefeet.Potentialleasableareaoflandreservesarenotincluded.
Source:PGIMRealEstate-AssetManagement
9
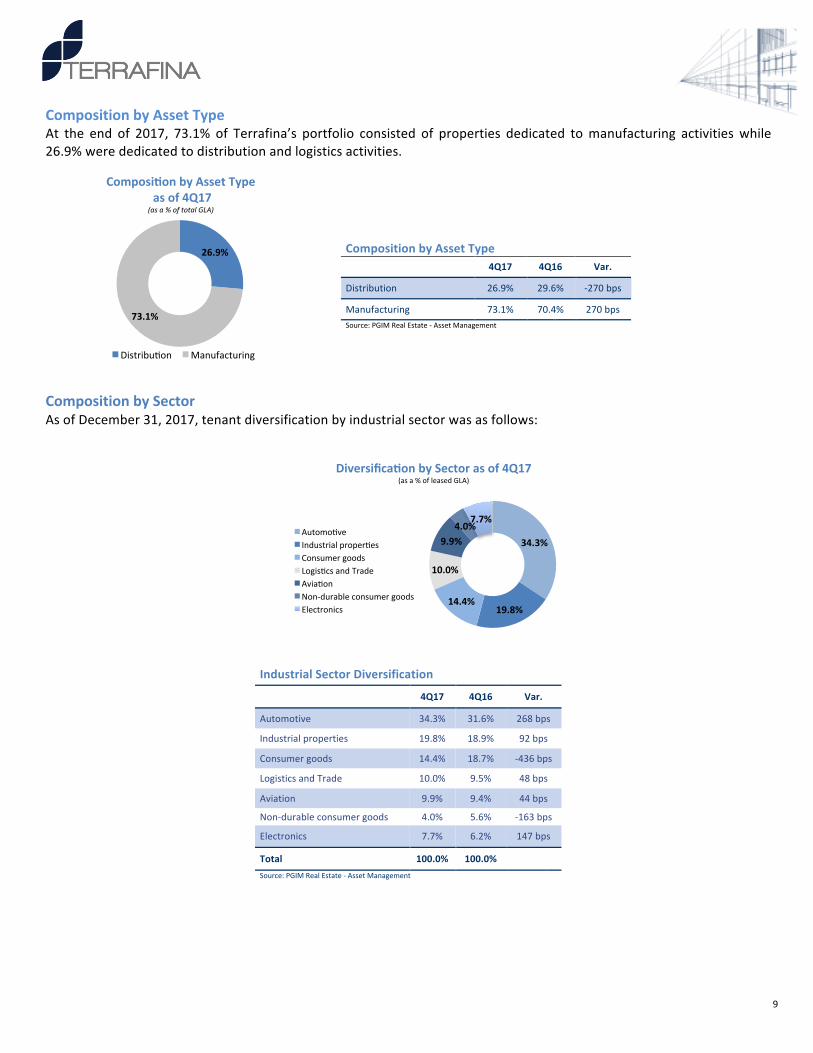
CompositionbyAssetTypeAt the end of 2017, 73.1% of Terrafina’s portfolio consisted of properties dedicated tomanufacturing activitieswhile26.9%werededicatedtodistributionandlogisticsactivities.
CompositionbySectorAsofDecember31,2017,tenantdiversificationbyindustrialsectorwasasfollows:
IndustrialSectorDiversification 4Q17 4Q16 Var.
Automotive 34.3% 31.6% 268bps
Industrialproperties 19.8% 18.9% 92bps
Consumergoods 14.4% 18.7% -436bps
LogisticsandTrade 10.0% 9.5% 48bps
Aviation 9.9% 9.4% 44bps
Non-durableconsumergoods 4.0% 5.6% -163bps
Electronics 7.7% 6.2% 147bps
Total 100.0% 100.0% Source:PGIMRealEstate-AssetManagement
26.9%
73.1%
ComposidonbyAssetTypeasof4Q17(asa%oftotalGLA)
Distribulon Manufacturing
CompositionbyAssetType
4Q17 4Q16 Var.
Distribution 26.9% 29.6% -270bps
Manufacturing 73.1% 70.4% 270bpsSource:PGIMRealEstate-AssetManagement
34.3%
19.8%14.4%
10.0%
9.9%4.0%
7.7%
DiversificadonbySectorasof4Q17(asa%ofleasedGLA)
AutomolveIndustrialproperlesConsumergoodsLogislcsandTradeAvialonNon-durableconsumergoodsElectronics
10
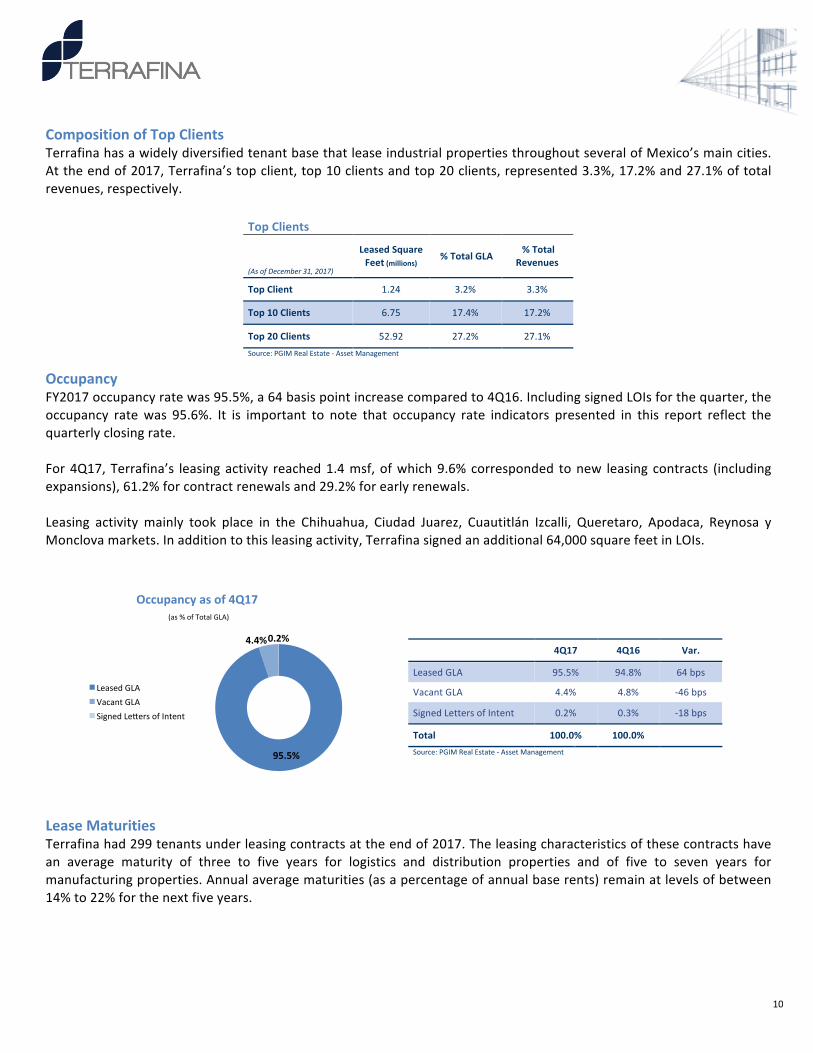
CompositionofTopClientsTerrafinahasawidelydiversifiedtenantbasethatleaseindustrialpropertiesthroughoutseveralofMexico’smaincities.Attheendof2017,Terrafina’stopclient,top10clientsandtop20clients,represented3.3%,17.2%and27.1%oftotalrevenues,respectively.
TopClients
(AsofDecember31,2017)
LeasedSquareFeet(millions) %TotalGLA
%TotalRevenues
TopClient 1.24 3.2% 3.3%
Top10Clients 6.75 17.4% 17.2%
Top20Clients 52.92 27.2% 27.1%Source:PGIMRealEstate-AssetManagement
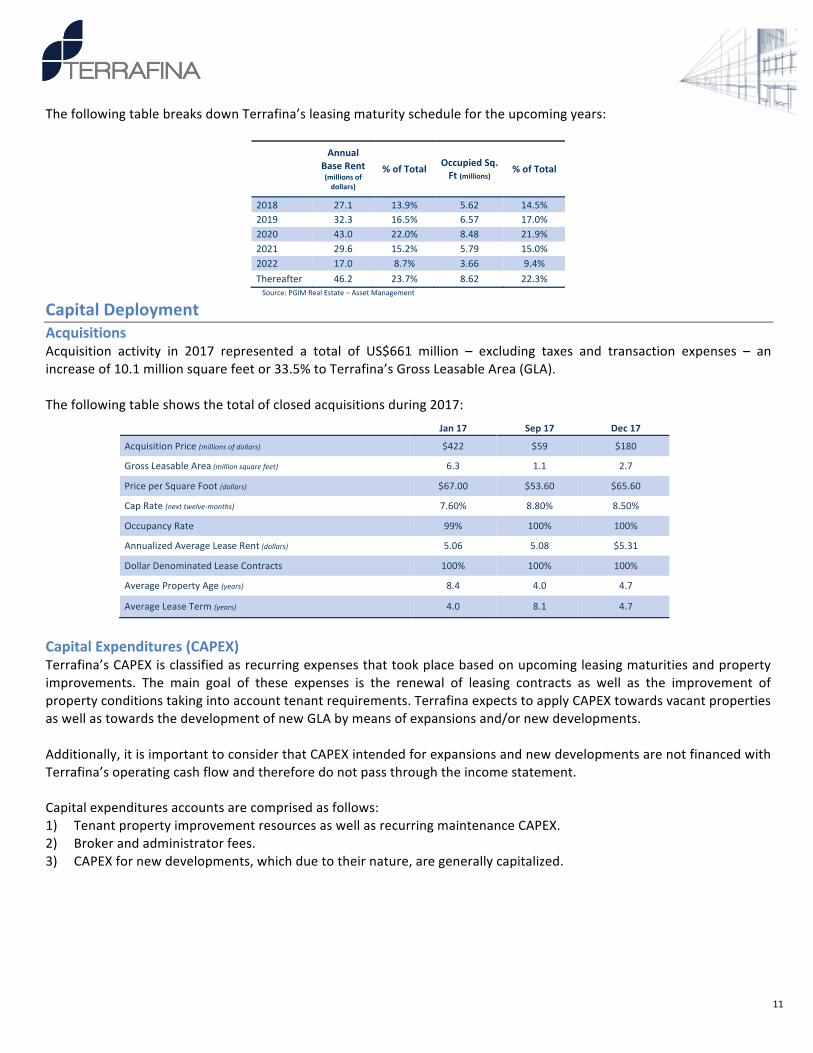
OccupancyFY2017occupancyratewas95.5%,a64basispointincreasecomparedto4Q16.IncludingsignedLOIsforthequarter,theoccupancy ratewas 95.6%. It is important to note that occupancy rate indicators presented in this report reflect thequarterlyclosingrate.For4Q17,Terrafina’s leasingactivity reached1.4msf,ofwhich9.6%corresponded tonew leasing contracts (includingexpansions),61.2%forcontractrenewalsand29.2%forearlyrenewals.
Leasing activity mainly took place in the Chihuahua, Ciudad Juarez, Cuautitlán Izcalli, Queretaro, Apodaca, Reynosa yMonclovamarkets.Inadditiontothisleasingactivity,Terrafinasignedanadditional64,000squarefeetinLOIs.
LeaseMaturitiesTerrafinahad299tenantsunderleasingcontractsattheendof2017.Theleasingcharacteristicsofthesecontractshavean average maturity of three to five years for logistics and distribution properties and of five to seven years formanufacturingproperties.Annualaveragematurities(asapercentageofannualbaserents)remainatlevelsofbetween14%to22%forthenextfiveyears.
95.5%
4.4%0.2%
Occupancyasof4Q17(as%ofTotalGLA)
LeasedGLAVacantGLASignedLeqersofIntent
4Q17 4Q16 Var.
LeasedGLA 95.5% 94.8% 64bps
VacantGLA 4.4% 4.8% -46bps
SignedLettersofIntent 0.2% 0.3% -18bps
Total 100.0% 100.0% Source:PGIMRealEstate-AssetManagement
11
ThefollowingtablebreaksdownTerrafina’sleasingmaturityschedulefortheupcomingyears:
Annual
BaseRent(millionsofdollars)
%ofTotal OccupiedSq.Ft(millions) %ofTotal
2018 27.1 13.9% 5.62 14.5%2019 32.3 16.5% 6.57 17.0%2020 43.0 22.0% 8.48 21.9%2021 29.6 15.2% 5.79 15.0%2022 17.0 8.7% 3.66 9.4%Thereafter 46.2 23.7% 8.62 22.3%Source:PGIMRealEstate–AssetManagement
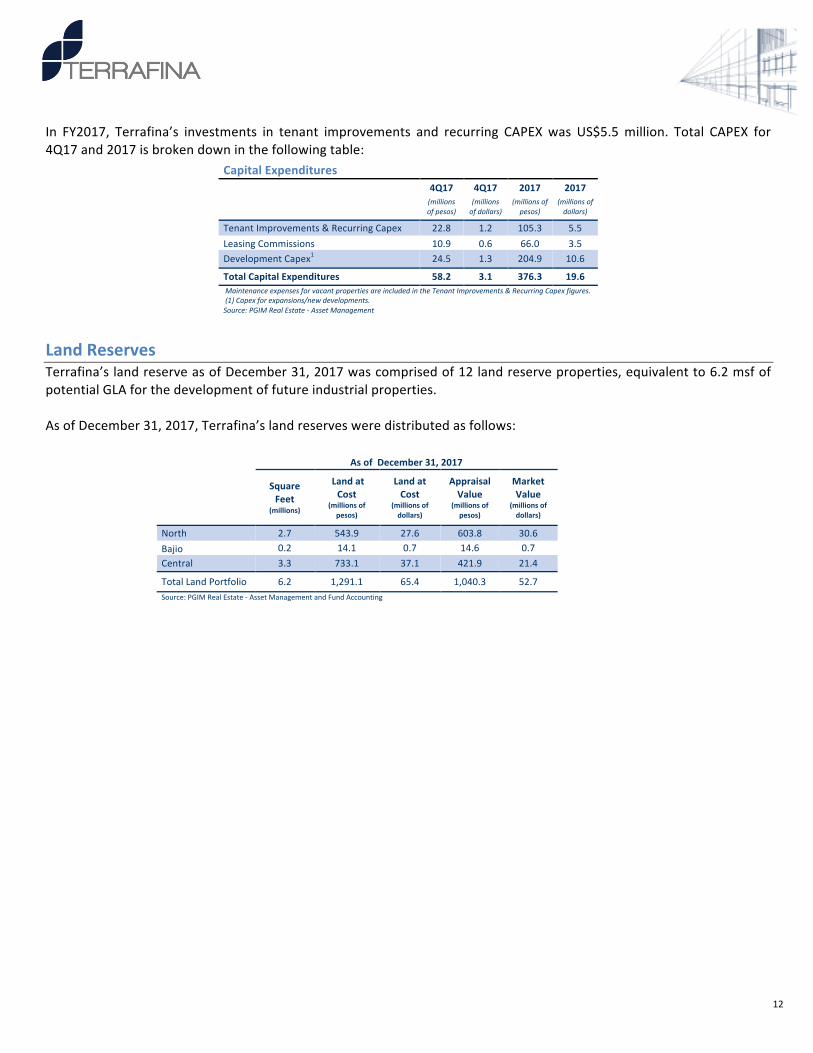
CapitalDeploymentAcquisitionsAcquisition activity in 2017 represented a total of US$661 million – excluding taxes and transaction expenses – anincreaseof10.1millionsquarefeetor33.5%toTerrafina’sGrossLeasableArea(GLA).Thefollowingtableshowsthetotalofclosedacquisitionsduring2017:
Jan17 Sep17 Dec17
AcquisitionPrice(millionsofdollars) $422 $59 $180
GrossLeasableArea(millionsquarefeet) 6.3 1.1 2.7
PriceperSquareFoot(dollars) $67.00 $53.60 $65.60
CapRate(nexttwelve-months) 7.60% 8.80% 8.50%
OccupancyRate 99% 100% 100%
AnnualizedAverageLeaseRent(dollars) 5.06 5.08 $5.31
DollarDenominatedLeaseContracts 100% 100% 100%
AveragePropertyAge(years) 8.4 4.0 4.7
AverageLeaseTerm(years) 4.0 8.1 4.7
CapitalExpenditures(CAPEX)Terrafina’sCAPEXisclassifiedasrecurringexpensesthattookplacebasedonupcomingleasingmaturitiesandpropertyimprovements. The main goal of these expenses is the renewal of leasing contracts as well as the improvement ofpropertyconditionstakingintoaccounttenantrequirements.TerrafinaexpectstoapplyCAPEXtowardsvacantpropertiesaswellastowardsthedevelopmentofnewGLAbymeansofexpansionsand/ornewdevelopments.
Additionally,itisimportanttoconsiderthatCAPEXintendedforexpansionsandnewdevelopmentsarenotfinancedwithTerrafina’soperatingcashflowandthereforedonotpassthroughtheincomestatement.
Capitalexpendituresaccountsarecomprisedasfollows:1) TenantpropertyimprovementresourcesaswellasrecurringmaintenanceCAPEX.2) Brokerandadministratorfees.3) CAPEXfornewdevelopments,whichduetotheirnature,aregenerallycapitalized.
12
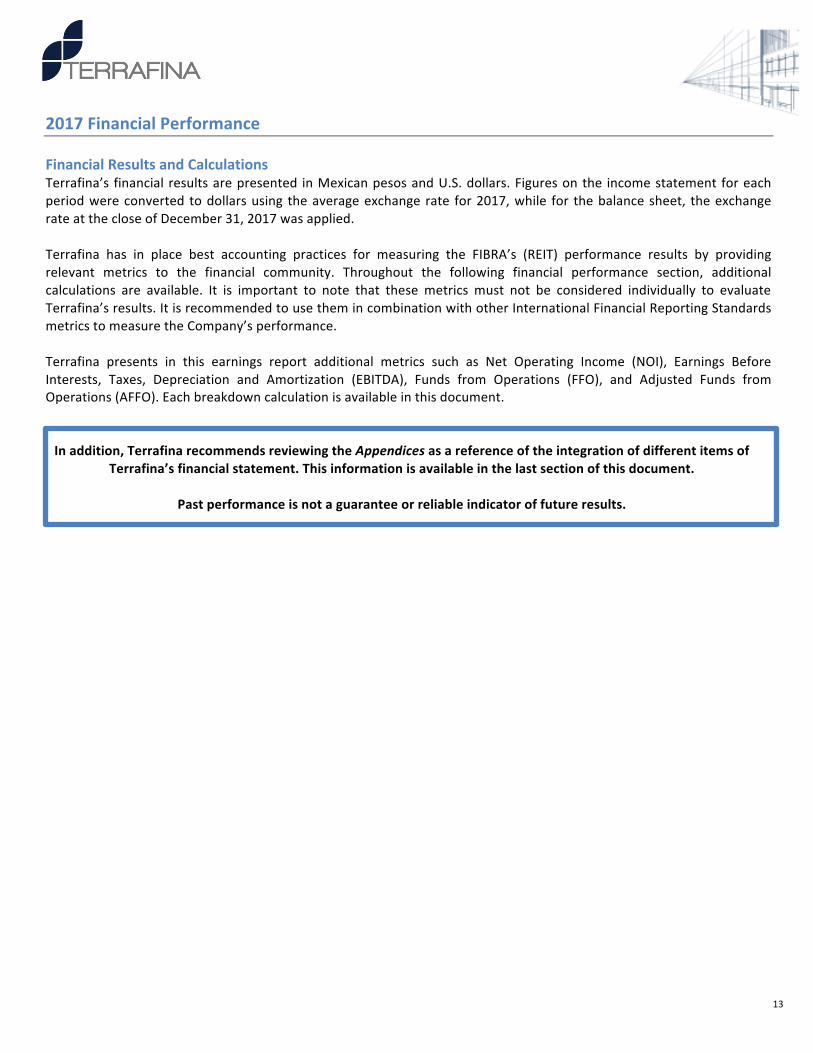
In FY2017, Terrafina’s investments in tenant improvements and recurring CAPEXwas US$5.5million. Total CAPEX for4Q17and2017isbrokendowninthefollowingtable:
CapitalExpenditures 4Q17 4Q17 2017 2017
(millionsofpesos)
(millionsofdollars)
(millionsofpesos)
(millionsofdollars)
TenantImprovements&RecurringCapex 22.8 1.2 105.3 5.5LeasingCommissions 10.9 0.6 66.0 3.5DevelopmentCapex1 24.5 1.3 204.9 10.6
TotalCapitalExpenditures 58.2 3.1 376.3 19.6MaintenanceexpensesforvacantpropertiesareincludedintheTenantImprovements&RecurringCapexfigures.(1)Capexforexpansions/newdevelopments.Source:PGIMRealEstate-AssetManagement
LandReservesTerrafina’slandreserveasofDecember31,2017wascomprisedof12landreserveproperties,equivalentto6.2msfofpotentialGLAforthedevelopmentoffutureindustrialproperties.AsofDecember31,2017,Terrafina’slandreservesweredistributedasfollows:
AsofDecember31,2017
SquareFeet
(millions)
LandatCost
(millionsofpesos)
LandatCost
(millionsofdollars)
AppraisalValue
(millionsofpesos)
MarketValue
(millionsofdollars)
North 2.7 543.9 27.6 603.8 30.6Bajio 0.2 14.1 0.7 14.6 0.7Central 3.3 733.1 37.1 421.9 21.4
TotalLandPortfolio 6.2 1,291.1 65.4 1,040.3 52.7Source:PGIMRealEstate-AssetManagementandFundAccounting
13
2017FinancialPerformanceFinancialResultsandCalculationsTerrafina’s financial resultsarepresented inMexicanpesosandU.S.dollars.Figuresonthe incomestatement foreachperiodwereconverted todollarsusing theaverageexchange rate for2017,while for thebalancesheet, theexchangerateatthecloseofDecember31,2017wasapplied.Terrafina has in place best accounting practices for measuring the FIBRA’s (REIT) performance results by providingrelevant metrics to the financial community. Throughout the following financial performance section, additionalcalculations are available. It is important to note that these metrics must not be considered individually to evaluateTerrafina’sresults.ItisrecommendedtousethemincombinationwithotherInternationalFinancialReportingStandardsmetricstomeasuretheCompany’sperformance.Terrafina presents in this earnings report additional metrics such as Net Operating Income (NOI), Earnings BeforeInterests, Taxes, Depreciation and Amortization (EBITDA), Funds from Operations (FFO), and Adjusted Funds fromOperations(AFFO).Eachbreakdowncalculationisavailableinthisdocument.
Inaddition,TerrafinarecommendsreviewingtheAppendicesasareferenceoftheintegrationofdifferentitemsof
Terrafina’sfinancialstatement.Thisinformationisavailableinthelastsectionofthisdocument.
Pastperformanceisnotaguaranteeorreliableindicatoroffutureresults.
14
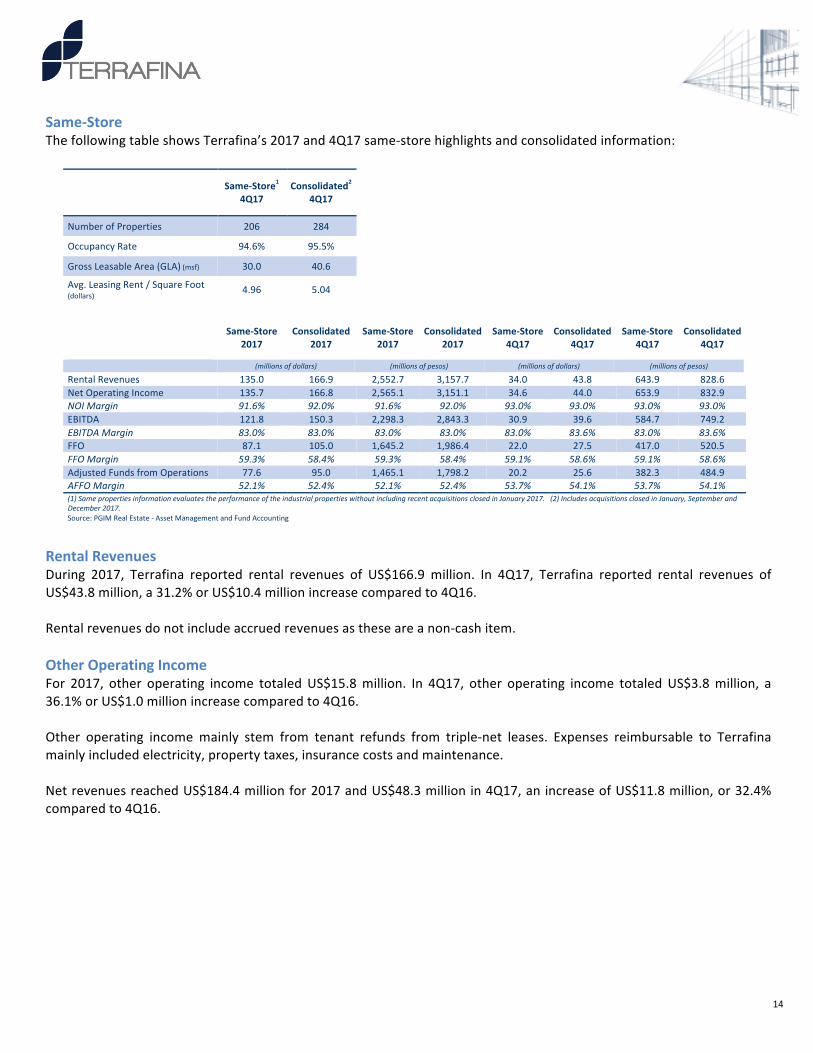
Same-StoreThefollowingtableshowsTerrafina’s2017and4Q17same-storehighlightsandconsolidatedinformation:
Same-Store1
4Q17Consolidated2
4Q17
NumberofProperties 206 284
OccupancyRate 94.6% 95.5%
GrossLeasableArea(GLA)(msf) 30.0 40.6
Avg.LeasingRent/SquareFoot(dollars) 4.96 5.04
Same-Store
2017Consolidated
2017Same-Store
2017Consolidated
2017Same-Store
4Q17Consolidated
4Q17Same-Store
4Q17Consolidated
4Q17
(millionsofdollars) (millionsofpesos) (millionsofdollars) (millionsofpesos)
RentalRevenues 135.0 166.9 2,552.7 3,157.7 34.0 43.8 643.9 828.6NetOperatingIncome 135.7 166.8 2,565.1 3,151.1 34.6 44.0 653.9 832.9NOIMargin 91.6% 92.0% 91.6% 92.0% 93.0% 93.0% 93.0% 93.0%EBITDA 121.8 150.3 2,298.3 2,843.3 30.9 39.6 584.7 749.2EBITDAMargin 83.0% 83.0% 83.0% 83.0% 83.0% 83.6% 83.0% 83.6%FFO 87.1 105.0 1,645.2 1,986.4 22.0 27.5 417.0 520.5FFOMargin 59.3% 58.4% 59.3% 58.4% 59.1% 58.6% 59.1% 58.6%AdjustedFundsfromOperations 77.6 95.0 1,465.1 1,798.2 20.2 25.6 382.3 484.9AFFOMargin 52.1% 52.4% 52.1% 52.4% 53.7% 54.1% 53.7% 54.1%(1)SamepropertiesinformationevaluatestheperformanceoftheindustrialpropertieswithoutincludingrecentacquisitionsclosedinJanuary2017.(2)IncludesacquisitionsclosedinJanuary,SeptemberandDecember2017.Source:PGIMRealEstate-AssetManagementandFundAccounting
RentalRevenuesDuring 2017, Terrafina reported rental revenues of US$166.9 million. In 4Q17, Terrafina reported rental revenues ofUS$43.8million,a31.2%orUS$10.4millionincreasecomparedto4Q16.Rentalrevenuesdonotincludeaccruedrevenuesastheseareanon-cashitem.OtherOperatingIncomeFor 2017, other operating income totaledUS$15.8million. In 4Q17, other operating income totaledUS$3.8million, a36.1%orUS$1.0millionincreasecomparedto4Q16.Other operating incomemainly stem from tenant refunds from triple-net leases. Expenses reimbursable to Terrafinamainlyincludedelectricity,propertytaxes,insurancecostsandmaintenance.
NetrevenuesreachedUS$184.4millionfor2017andUS$48.3millionin4Q17,anincreaseofUS$11.8million,or32.4%comparedto4Q16.
15
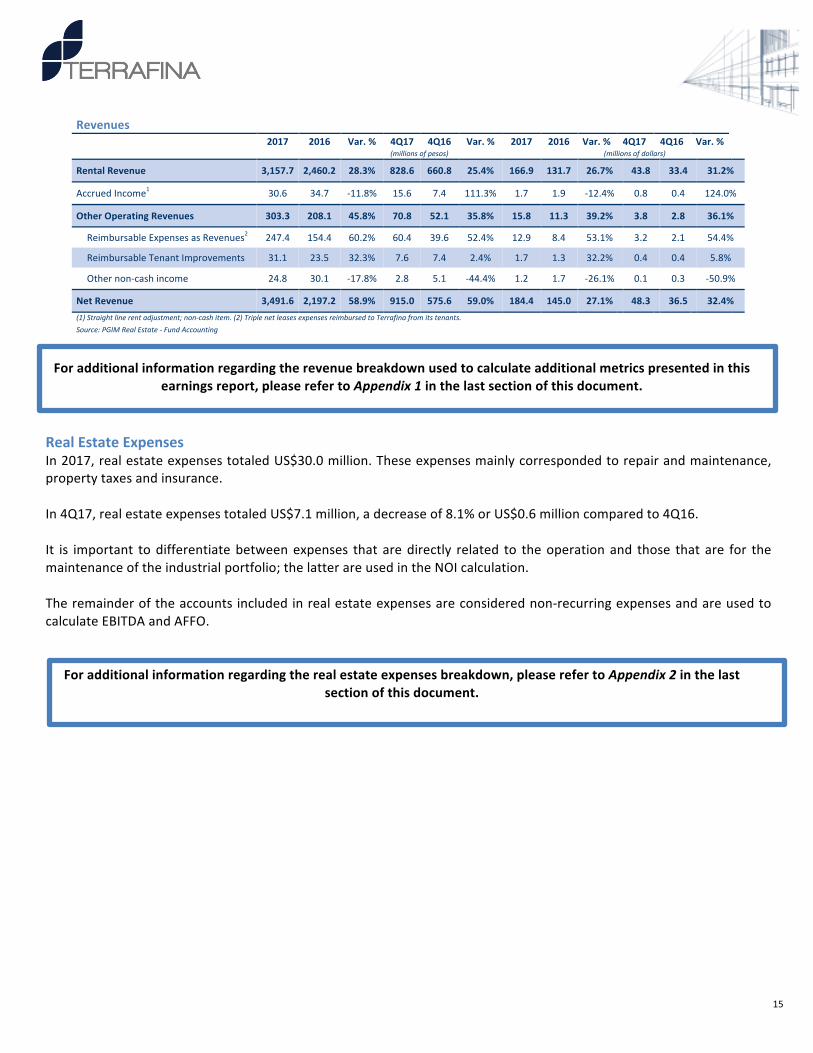
Revenues 2017 2016 Var.% 4Q17 4Q16 Var.% 2017 2016 Var.% 4Q17 4Q16 Var.%
(millionsofpesos) (millionsofdollars)
RentalRevenue 3,157.7 2,460.2 28.3% 828.6 660.8 25.4% 166.9 131.7 26.7% 43.8 33.4 31.2%
AccruedIncome1 30.6 34.7 -11.8% 15.6 7.4 111.3% 1.7 1.9 -12.4% 0.8 0.4 124.0%
OtherOperatingRevenues 303.3 208.1 45.8% 70.8 52.1 35.8% 15.8 11.3 39.2% 3.8 2.8 36.1%
ReimbursableExpensesasRevenues2 247.4 154.4 60.2% 60.4 39.6 52.4% 12.9 8.4 53.1% 3.2 2.1 54.4%
ReimbursableTenantImprovements 31.1 23.5 32.3% 7.6 7.4 2.4% 1.7 1.3 32.2% 0.4 0.4 5.8%
Othernon-cashincome 24.8 30.1 -17.8% 2.8 5.1 -44.4% 1.2 1.7 -26.1% 0.1 0.3 -50.9%
NetRevenue 3,491.6 2,197.2 58.9% 915.0 575.6 59.0% 184.4 145.0 27.1% 48.3 36.5 32.4%(1)Straightlinerentadjustment;non-cashitem.(2)TriplenetleasesexpensesreimbursedtoTerrafinafromitstenants.
Source:PGIMRealEstate-FundAccounting
Foradditionalinformationregardingtherevenuebreakdownusedtocalculateadditionalmetricspresentedinthis
earningsreport,pleaserefertoAppendix1inthelastsectionofthisdocument.
RealEstateExpensesIn2017,realestateexpensestotaledUS$30.0million.Theseexpensesmainlycorrespondedtorepairandmaintenance,propertytaxesandinsurance.In4Q17,realestateexpensestotaledUS$7.1million,adecreaseof8.1%orUS$0.6millioncomparedto4Q16.It is important todifferentiatebetweenexpenses that aredirectly related to theoperationand those that are for themaintenanceoftheindustrialportfolio;thelatterareusedintheNOIcalculation.
Theremainderoftheaccountsincludedinrealestateexpensesareconsiderednon-recurringexpensesandareusedtocalculateEBITDAandAFFO.
Foradditionalinformationregardingtherealestateexpensesbreakdown,pleaserefertoAppendix2inthelastsectionofthisdocument.
16
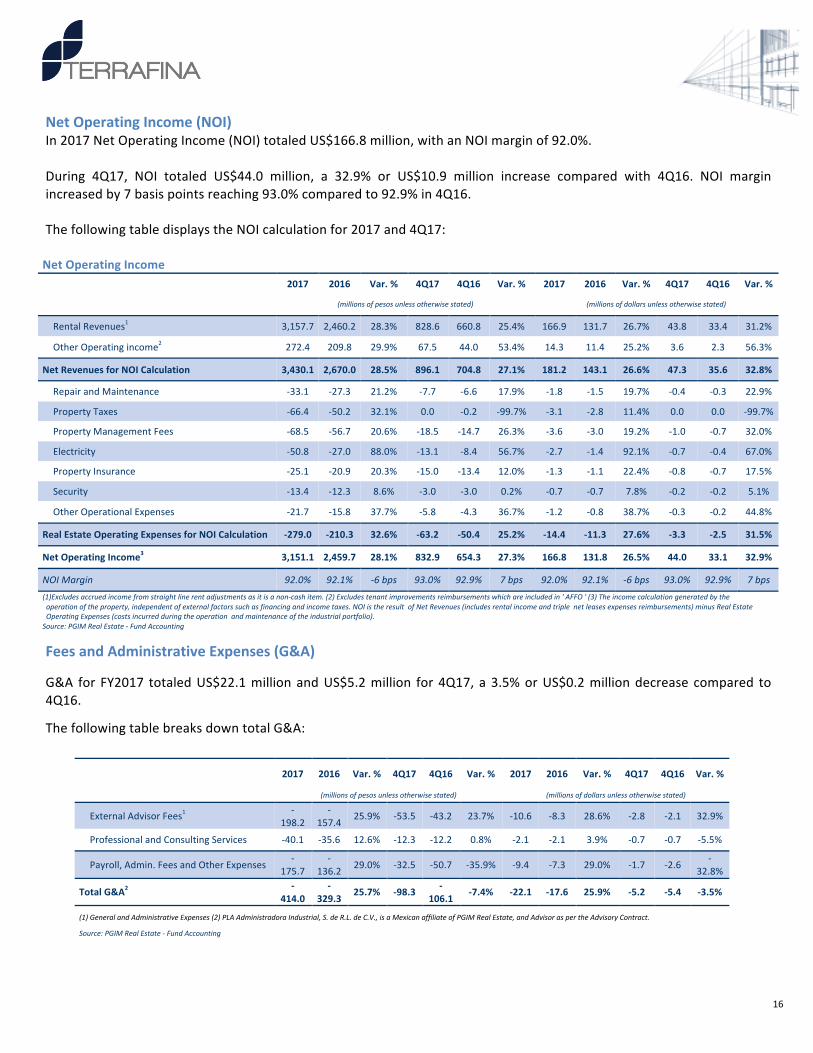
NetOperatingIncome(NOI)In2017NetOperatingIncome(NOI)totaledUS$166.8million,withanNOImarginof92.0%.During 4Q17, NOI totaled US$44.0 million, a 32.9% or US$10.9 million increase compared with 4Q16. NOI marginincreasedby7basispointsreaching93.0%comparedto92.9%in4Q16.ThefollowingtabledisplaystheNOIcalculationfor2017and4Q17:
NetOperatingIncome 2017 2016 Var.% 4Q17 4Q16 Var.% 2017 2016 Var.% 4Q17 4Q16 Var.%
(millionsofpesosunlessotherwisestated) (millionsofdollarsunlessotherwisestated)
RentalRevenues1 3,157.7 2,460.2 28.3% 828.6 660.8 25.4% 166.9 131.7 26.7% 43.8 33.4 31.2%
OtherOperatingincome2 272.4 209.8 29.9% 67.5 44.0 53.4% 14.3 11.4 25.2% 3.6 2.3 56.3%
NetRevenuesforNOICalculation 3,430.1 2,670.0 28.5% 896.1 704.8 27.1% 181.2 143.1 26.6% 47.3 35.6 32.8%
RepairandMaintenance -33.1 -27.3 21.2% -7.7 -6.6 17.9% -1.8 -1.5 19.7% -0.4 -0.3 22.9%
PropertyTaxes -66.4 -50.2 32.1% 0.0 -0.2 -99.7% -3.1 -2.8 11.4% 0.0 0.0 -99.7%
PropertyManagementFees -68.5 -56.7 20.6% -18.5 -14.7 26.3% -3.6 -3.0 19.2% -1.0 -0.7 32.0%
Electricity -50.8 -27.0 88.0% -13.1 -8.4 56.7% -2.7 -1.4 92.1% -0.7 -0.4 67.0%
PropertyInsurance -25.1 -20.9 20.3% -15.0 -13.4 12.0% -1.3 -1.1 22.4% -0.8 -0.7 17.5%
Security -13.4 -12.3 8.6% -3.0 -3.0 0.2% -0.7 -0.7 7.8% -0.2 -0.2 5.1%
OtherOperationalExpenses -21.7 -15.8 37.7% -5.8 -4.3 36.7% -1.2 -0.8 38.7% -0.3 -0.2 44.8%
RealEstateOperatingExpensesforNOICalculation -279.0 -210.3 32.6% -63.2 -50.4 25.2% -14.4 -11.3 27.6% -3.3 -2.5 31.5%
NetOperatingIncome3 3,151.1 2,459.7 28.1% 832.9 654.3 27.3% 166.8 131.8 26.5% 44.0 33.1 32.9%
NOIMargin 92.0% 92.1% -6bps 93.0% 92.9% 7bps 92.0% 92.1% -6bps 93.0% 92.9% 7bps(1)Excludesaccruedincomefromstraightlinerentadjustmentsasitisanon-cashitem.(2)Excludestenantimprovementsreimbursementswhichareincludedin'AFFO'(3)Theincomecalculationgeneratedbytheoperationoftheproperty,independentofexternalfactorssuchasfinancingandincometaxes.NOIistheresultofNetRevenues(includesrentalincomeandtriplenetleasesexpensesreimbursements)minusRealEstateOperatingExpenses(costsincurredduringtheoperationandmaintenanceoftheindustrialportfolio).Source:PGIMRealEstate-FundAccounting
FeesandAdministrativeExpenses(G&A)G&A for FY2017 totaledUS$22.1millionandUS$5.2million for4Q17,a3.5%orUS$0.2milliondecrease compared to4Q16.
ThefollowingtablebreaksdowntotalG&A:
2017 2016 Var.% 4Q17 4Q16 Var.% 2017 2016 Var.% 4Q17 4Q16 Var.%
(millionsofpesosunlessotherwisestated) (millionsofdollarsunlessotherwisestated)
ExternalAdvisorFees1 -198.2
-157.4
25.9% -53.5 -43.2 23.7% -10.6 -8.3 28.6% -2.8 -2.1 32.9%
ProfessionalandConsultingServices -40.1 -35.6 12.6% -12.3 -12.2 0.8% -2.1 -2.1 3.9% -0.7 -0.7 -5.5%
Payroll,Admin.FeesandOtherExpenses-
175.7-
136.2 29.0% -32.5 -50.7 -35.9% -9.4 -7.3 29.0% -1.7 -2.6-
32.8%
TotalG&A2 -414.0
-329.3
25.7% -98.3 -106.1
-7.4% -22.1 -17.6 25.9% -5.2 -5.4 -3.5%
(1)GeneralandAdministrativeExpenses(2)PLAAdministradoraIndustrial,S.deR.L.deC.V.,isaMexicanaffiliateofPGIMRealEstate,andAdvisoraspertheAdvisoryContract.
Source:PGIMRealEstate-FundAccounting
17
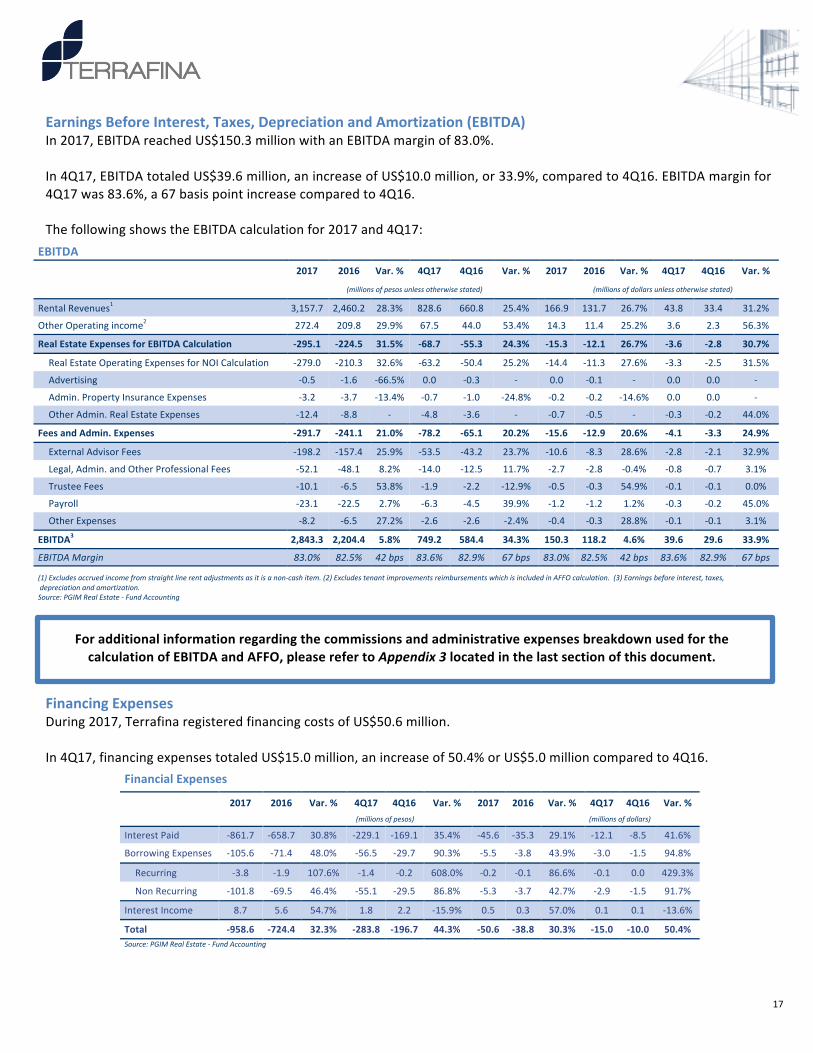
EarningsBeforeInterest,Taxes,DepreciationandAmortization(EBITDA)In2017,EBITDAreachedUS$150.3millionwithanEBITDAmarginof83.0%.In4Q17,EBITDAtotaledUS$39.6million,anincreaseofUS$10.0million,or33.9%,comparedto4Q16.EBITDAmarginfor4Q17was83.6%,a67basispointincreasecomparedto4Q16.ThefollowingshowstheEBITDAcalculationfor2017and4Q17:
EBITDA 2017 2016 Var.% 4Q17 4Q16 Var.% 2017 2016 Var.% 4Q17 4Q16 Var.%
(millionsofpesosunlessotherwisestated) (millionsofdollarsunlessotherwisestated)
RentalRevenues1 3,157.7 2,460.2 28.3% 828.6 660.8 25.4% 166.9 131.7 26.7% 43.8 33.4 31.2%
OtherOperatingincome2 272.4 209.8 29.9% 67.5 44.0 53.4% 14.3 11.4 25.2% 3.6 2.3 56.3%
RealEstateExpensesforEBITDACalculation -295.1 -224.5 31.5% -68.7 -55.3 24.3% -15.3 -12.1 26.7% -3.6 -2.8 30.7%
RealEstateOperatingExpensesforNOICalculation -279.0 -210.3 32.6% -63.2 -50.4 25.2% -14.4 -11.3 27.6% -3.3 -2.5 31.5%
Advertising -0.5 -1.6 -66.5% 0.0 -0.3 - 0.0 -0.1 - 0.0 0.0 -
Admin.PropertyInsuranceExpenses -3.2 -3.7 -13.4% -0.7 -1.0 -24.8% -0.2 -0.2 -14.6% 0.0 0.0 -
OtherAdmin.RealEstateExpenses -12.4 -8.8 - -4.8 -3.6 - -0.7 -0.5 - -0.3 -0.2 44.0%
FeesandAdmin.Expenses -291.7 -241.1 21.0% -78.2 -65.1 20.2% -15.6 -12.9 20.6% -4.1 -3.3 24.9%
ExternalAdvisorFees -198.2 -157.4 25.9% -53.5 -43.2 23.7% -10.6 -8.3 28.6% -2.8 -2.1 32.9%
Legal,Admin.andOtherProfessionalFees -52.1 -48.1 8.2% -14.0 -12.5 11.7% -2.7 -2.8 -0.4% -0.8 -0.7 3.1%
TrusteeFees -10.1 -6.5 53.8% -1.9 -2.2 -12.9% -0.5 -0.3 54.9% -0.1 -0.1 0.0%
Payroll -23.1 -22.5 2.7% -6.3 -4.5 39.9% -1.2 -1.2 1.2% -0.3 -0.2 45.0%
OtherExpenses -8.2 -6.5 27.2% -2.6 -2.6 -2.4% -0.4 -0.3 28.8% -0.1 -0.1 3.1%
EBITDA3 2,843.3 2,204.4 5.8% 749.2 584.4 34.3% 150.3 118.2 4.6% 39.6 29.6 33.9%
EBITDAMargin 83.0% 82.5% 42bps 83.6% 82.9% 67bps 83.0% 82.5% 42bps 83.6% 82.9% 67bps
(1)Excludesaccruedincomefromstraightlinerentadjustmentsasitisanon-cashitem.(2)ExcludestenantimprovementsreimbursementswhichisincludedinAFFOcalculation.(3)Earningsbeforeinterest,taxes,depreciationandamortization.Source:PGIMRealEstate-FundAccounting
ForadditionalinformationregardingthecommissionsandadministrativeexpensesbreakdownusedforthecalculationofEBITDAandAFFO,pleaserefertoAppendix3locatedinthelastsectionofthisdocument.
FinancingExpensesDuring2017,TerrafinaregisteredfinancingcostsofUS$50.6million.In4Q17,financingexpensestotaledUS$15.0million,anincreaseof50.4%orUS$5.0millioncomparedto4Q16.
FinancialExpenses 2017 2016 Var.% 4Q17 4Q16 Var.% 2017 2016 Var.% 4Q17 4Q16 Var.%
(millionsofpesos) 0
(millionsofdollars) 0
InterestPaid -861.7 -658.7 30.8% -229.1 -169.1 35.4% -45.6 -35.3 29.1% -12.1 -8.5 41.6%
BorrowingExpenses -105.6 -71.4 48.0% -56.5 -29.7 90.3% -5.5 -3.8 43.9% -3.0 -1.5 94.8%
Recurring -3.8 -1.9 107.6% -1.4 -0.2 608.0% -0.2 -0.1 86.6% -0.1 0.0 429.3%
NonRecurring -101.8 -69.5 46.4% -55.1 -29.5 86.8% -5.3 -3.7 42.7% -2.9 -1.5 91.7%
InterestIncome 8.7 5.6 54.7% 1.8 2.2 -15.9% 0.5 0.3 57.0% 0.1 0.1 -13.6%
Total -958.6 -724.4 32.3% -283.8 -196.7 44.3% -50.6 -38.8 30.3% -15.0 -10.0 50.4%Source:PGIMRealEstate-FundAccounting
18
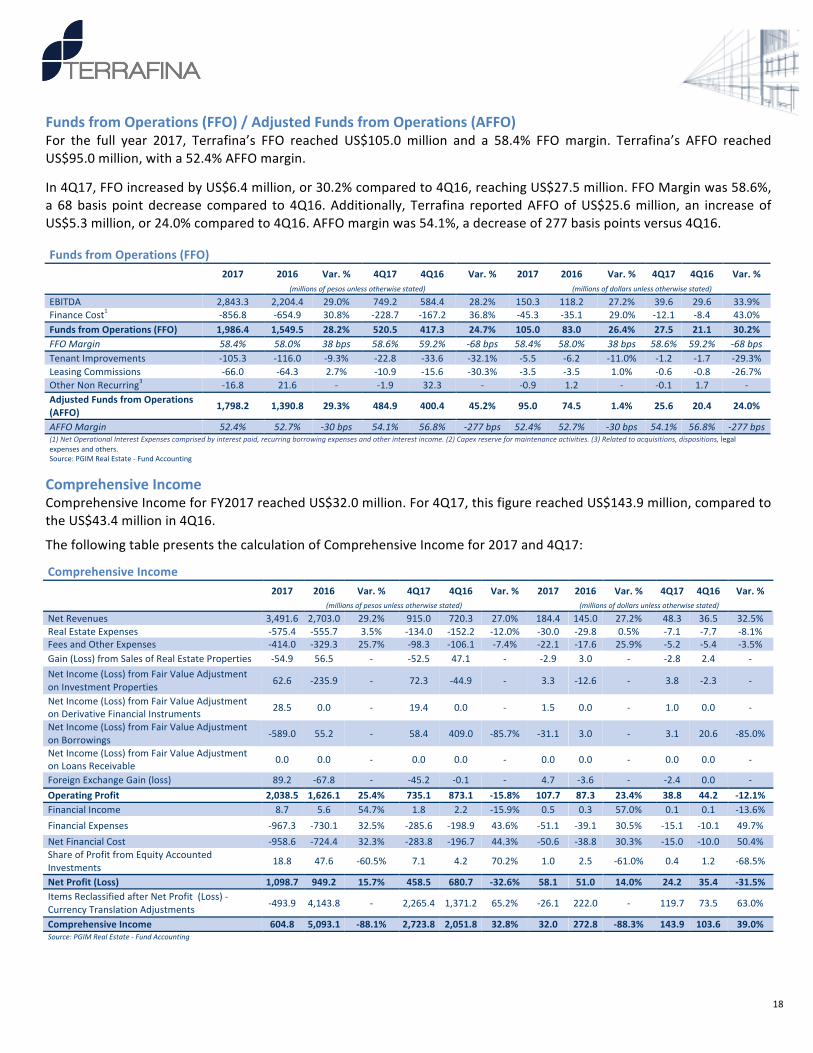
FundsfromOperations(FFO)/AdjustedFundsfromOperations(AFFO)For the full year 2017, Terrafina’s FFO reached US$105.0 million and a 58.4% FFOmargin. Terrafina’s AFFO reachedUS$95.0million,witha52.4%AFFOmargin.
In4Q17,FFOincreasedbyUS$6.4million,or30.2%comparedto4Q16,reachingUS$27.5million.FFOMarginwas58.6%,a 68basis pointdecrease compared to 4Q16.Additionally, Terrafina reportedAFFOofUS$25.6million, an increaseofUS$5.3million,or24.0%comparedto4Q16.AFFOmarginwas54.1%,adecreaseof277basispointsversus4Q16.
FundsfromOperations(FFO) 2017 2016 Var.% 4Q17 4Q16 Var.% 2017 2016 Var.% 4Q17 4Q16 Var.%
(millionsofpesosunlessotherwisestated) (millionsofdollarsunlessotherwisestated)
EBITDA 2,843.3 2,204.4 29.0% 749.2 584.4 28.2% 150.3 118.2 27.2% 39.6 29.6 33.9%FinanceCost1 -856.8 -654.9 30.8% -228.7 -167.2 36.8% -45.3 -35.1 29.0% -12.1 -8.4 43.0%FundsfromOperations(FFO) 1,986.4 1,549.5 28.2% 520.5 417.3 24.7% 105.0 83.0 26.4% 27.5 21.1 30.2%FFOMargin 58.4% 58.0% 38bps 58.6% 59.2% -68bps 58.4% 58.0% 38bps 58.6% 59.2% -68bpsTenantImprovements -105.3 -116.0 -9.3% -22.8 -33.6 -32.1% -5.5 -6.2 -11.0% -1.2 -1.7 -29.3%LeasingCommissions -66.0 -64.3 2.7% -10.9 -15.6 -30.3% -3.5 -3.5 1.0% -0.6 -0.8 -26.7%OtherNonRecurring3 -16.8 21.6 - -1.9 32.3 - -0.9 1.2 - -0.1 1.7 -AdjustedFundsfromOperations(AFFO)
1,798.2 1,390.8 29.3% 484.9 400.4 45.2% 95.0 74.5 1.4% 25.6 20.4 24.0%
AFFOMargin 52.4% 52.7% -30bps 54.1% 56.8% -277bps 52.4% 52.7% -30bps 54.1% 56.8% -277bps(1)NetOperationalInterestExpensescomprisedbyinterestpaid,recurringborrowingexpensesandotherinterestincome.(2)Capexreserveformaintenanceactivities.(3)Relatedtoacquisitions,dispositions,legalexpensesandothers.Source:PGIMRealEstate-FundAccounting
ComprehensiveIncomeComprehensiveIncomeforFY2017reachedUS$32.0million.For4Q17,thisfigurereachedUS$143.9million,comparedtotheUS$43.4millionin4Q16.
ThefollowingtablepresentsthecalculationofComprehensiveIncomefor2017and4Q17:
ComprehensiveIncome 2017 2016 Var.% 4Q17 4Q16 Var.% 2017 2016 Var.% 4Q17 4Q16 Var.%
(millionsofpesosunlessotherwisestated) (millionsofdollarsunlessotherwisestated)
NetRevenues 3,491.6 2,703.0 29.2% 915.0 720.3 27.0% 184.4 145.0 27.2% 48.3 36.5 32.5%RealEstateExpenses -575.4 -555.7 3.5% -134.0 -152.2 -12.0% -30.0 -29.8 0.5% -7.1 -7.7 -8.1%FeesandOtherExpenses -414.0 -329.3 25.7% -98.3 -106.1 -7.4% -22.1 -17.6 25.9% -5.2 -5.4 -3.5%Gain(Loss)fromSalesofRealEstateProperties -54.9 56.5 - -52.5 47.1 - -2.9 3.0 - -2.8 2.4 -NetIncome(Loss)fromFairValueAdjustmentonInvestmentProperties 62.6 -235.9 - 72.3 -44.9 - 3.3 -12.6 - 3.8 -2.3 -
NetIncome(Loss)fromFairValueAdjustmentonDerivativeFinancialInstruments 28.5 0.0 - 19.4 0.0 - 1.5 0.0 - 1.0 0.0 -
NetIncome(Loss)fromFairValueAdjustmentonBorrowings -589.0 55.2 - 58.4 409.0 -85.7% -31.1 3.0 - 3.1 20.6 -85.0%
NetIncome(Loss)fromFairValueAdjustmentonLoansReceivable 0.0 0.0 - 0.0 0.0 - 0.0 0.0 - 0.0 0.0 -
ForeignExchangeGain(loss) 89.2 -67.8 - -45.2 -0.1 - 4.7 -3.6 - -2.4 0.0 -OperatingProfit 2,038.5 1,626.1 25.4% 735.1 873.1 -15.8% 107.7 87.3 23.4% 38.8 44.2 -12.1%FinancialIncome 8.7 5.6 54.7% 1.8 2.2 -15.9% 0.5 0.3 57.0% 0.1 0.1 -13.6%FinancialExpenses -967.3 -730.1 32.5% -285.6 -198.9 43.6% -51.1 -39.1 30.5% -15.1 -10.1 49.7%NetFinancialCost -958.6 -724.4 32.3% -283.8 -196.7 44.3% -50.6 -38.8 30.3% -15.0 -10.0 50.4%ShareofProfitfromEquityAccountedInvestments
18.8 47.6 -60.5% 7.1 4.2 70.2% 1.0 2.5 -61.0% 0.4 1.2 -68.5%
NetProfit(Loss) 1,098.7 949.2 15.7% 458.5 680.7 -32.6% 58.1 51.0 14.0% 24.2 35.4 -31.5%ItemsReclassifiedafterNetProfit(Loss)-CurrencyTranslationAdjustments -493.9 4,143.8 - 2,265.4 1,371.2 65.2% -26.1 222.0 - 119.7 73.5 63.0%
ComprehensiveIncome 604.8 5,093.1 -88.1% 2,723.8 2,051.8 32.8% 32.0 272.8 -88.3% 143.9 103.6 39.0%Source:PGIMRealEstate-FundAccounting
19
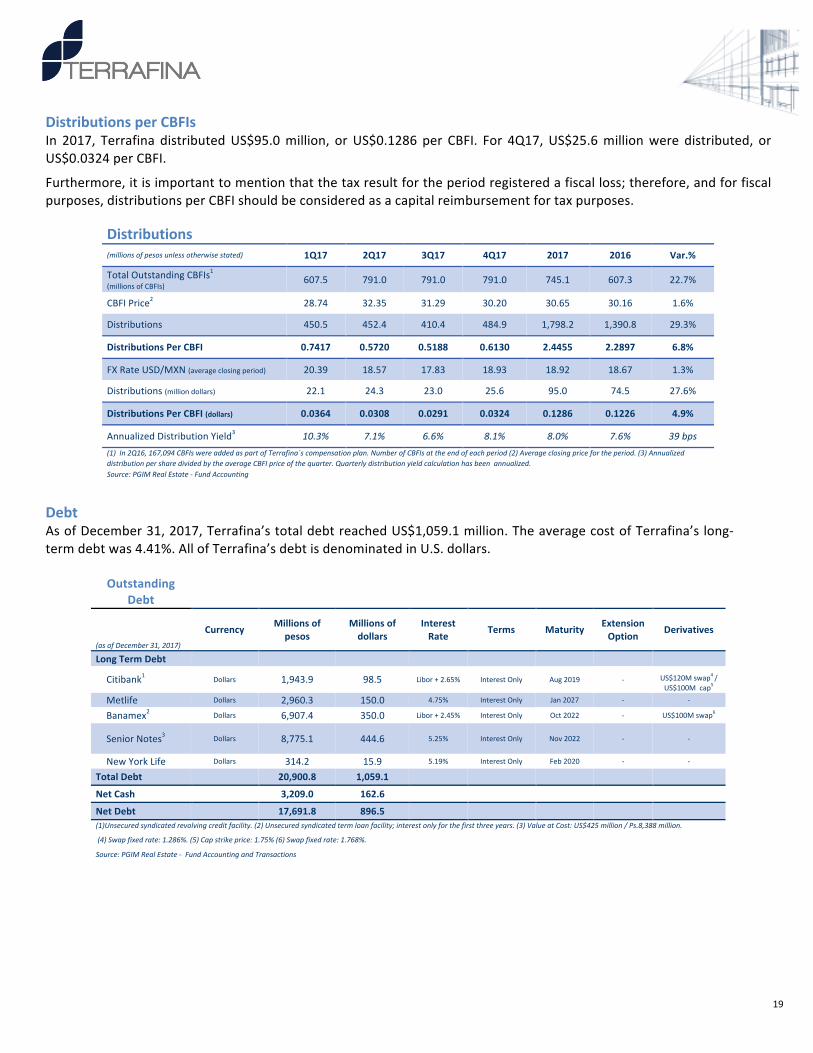
DistributionsperCBFIsIn 2017, Terrafina distributedUS$95.0million, orUS$0.1286 per CBFI. For 4Q17,US$25.6millionwere distributed, orUS$0.0324perCBFI.
Furthermore,itisimportanttomentionthatthetaxresultfortheperiodregisteredafiscalloss;therefore,andforfiscalpurposes,distributionsperCBFIshouldbeconsideredasacapitalreimbursementfortaxpurposes.
Distributions (millionsofpesosunlessotherwisestated) 1Q17 2Q17 3Q17 4Q17 2017 2016 Var.%
TotalOutstandingCBFIs1(millionsofCBFIs) 607.5 791.0 791.0 791.0 745.1 607.3 22.7%
CBFIPrice2 28.74 32.35 31.29 30.20 30.65 30.16 1.6%
Distributions 450.5 452.4 410.4 484.9 1,798.2 1,390.8 29.3%
DistributionsPerCBFI 0.7417 0.5720 0.5188 0.6130 2.4455 2.2897 6.8%
FXRateUSD/MXN(averageclosingperiod) 20.39 18.57 17.83 18.93 18.92 18.67 1.3%
Distributions(milliondollars) 22.1 24.3 23.0 25.6 95.0 74.5 27.6%
DistributionsPerCBFI(dollars) 0.0364 0.0308 0.0291 0.0324 0.1286 0.1226 4.9%
AnnualizedDistributionYield3 10.3% 7.1% 6.6% 8.1% 8.0% 7.6% 39bps(1)In2Q16,167,094CBFIswereaddedaspartofTerrafina´scompensationplan.NumberofCBFIsattheendofeachperiod(2)Averageclosingpricefortheperiod.(3)AnnualizeddistributionpersharedividedbytheaverageCBFIpriceofthequarter.Quarterlydistributionyieldcalculationhasbeenannualized.Source:PGIMRealEstate-FundAccounting
DebtAsofDecember31,2017,Terrafina’stotaldebtreachedUS$1,059.1million.TheaveragecostofTerrafina’slong-termdebtwas4.41%.AllofTerrafina’sdebtisdenominatedinU.S.dollars.
OutstandingDebt
(asofDecember31,2017)
Currency Millionsofpesos
Millionsofdollars
InterestRate
Terms Maturity ExtensionOption
Derivatives
LongTermDebt
Citibank1 Dollars 1,943.9 98.5 Libor+2.65% InterestOnly Aug2019 - US$120Mswap4/US$100Mcap5
Metlife Dollars 2,960.3 150.0 4.75% InterestOnly Jan2027 - -
Banamex2 Dollars 6,907.4 350.0 Libor+2.45% InterestOnly Oct2022 - US$100Mswap6
SeniorNotes3 Dollars 8,775.1 444.6 5.25% InterestOnly Nov2022 - -
NewYorkLife Dollars 314.2 15.9 5.19% InterestOnly Feb2020 - -
TotalDebt 20,900.8 1,059.1
NetCash 3,209.0 162.6
NetDebt 17,691.8 896.5 (1)Unsecuredsyndicatedrevolvingcreditfacility.(2)Unsecuredsyndicatedtermloanfacility;interestonlyforthefirstthreeyears.(3)ValueatCost:US$425million/Ps.8,388million.
(4)Swapfixedrate:1.286%.(5)Capstrikeprice:1.75%(6)Swapfixedrate:1.768%.
Source:PGIMRealEstate-FundAccountingandTransactions
20
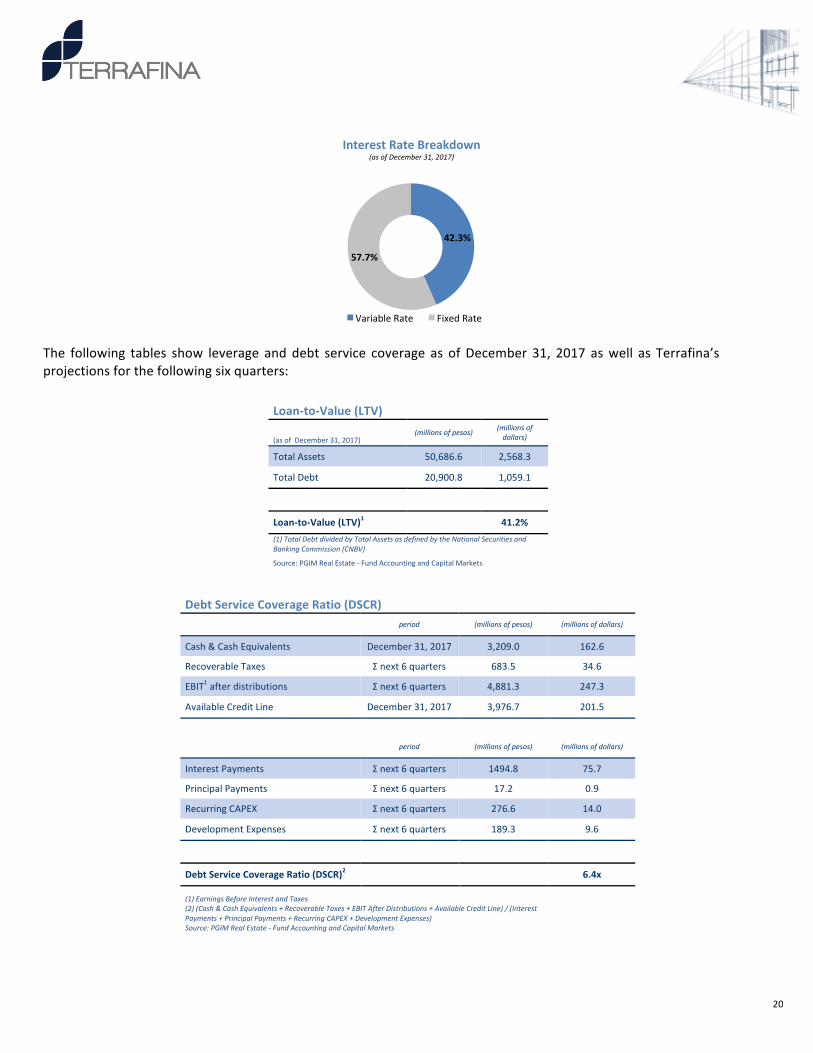
The following tables show leverage anddebt service coverage as ofDecember 31, 2017 aswell as Terrafina’sprojectionsforthefollowingsixquarters:
Loan-to-Value(LTV)
(asofDecember31,2017)(millionsofpesos) (millionsof
dollars)
TotalAssets 50,686.6 2,568.3
TotalDebt 20,900.8 1,059.1
Loan-to-Value(LTV)1 41.2%(1)TotalDebtdividedbyTotalAssetsasdefinedbytheNationalSecuritiesandBankingCommission(CNBV)
Source:PGIMRealEstate-FundAccountingandCapitalMarkets
DebtServiceCoverageRatio(DSCR)
period (millionsofpesos) (millionsofdollars)
Cash&CashEquivalents December31,2017 3,209.0 162.6
RecoverableTaxes Σnext6quarters 683.5 34.6
EBIT1afterdistributions Σnext6quarters 4,881.3 247.3
AvailableCreditLine December31,2017 3,976.7 201.5
period (millionsofpesos) (millionsofdollars)
InterestPayments Σnext6quarters 1494.8 75.7
PrincipalPayments Σnext6quarters 17.2 0.9
RecurringCAPEX Σnext6quarters 276.6 14.0
DevelopmentExpenses Σnext6quarters 189.3 9.6
DebtServiceCoverageRatio(DSCR)2 6.4x
(1)EarningsBeforeInterestandTaxes(2)(Cash&CashEquivalents+RecoverableTaxes+EBITAfterDistributions+AvailableCreditLine)/(InterestPayments+PrincipalPayments+RecurringCAPEX+DevelopmentExpenses)Source:PGIMRealEstate-FundAccountingandCapitalMarkets
42.3%
57.7%
InterestRateBreakdown(asofDecember31,2017)
VariableRate FixedRate
21
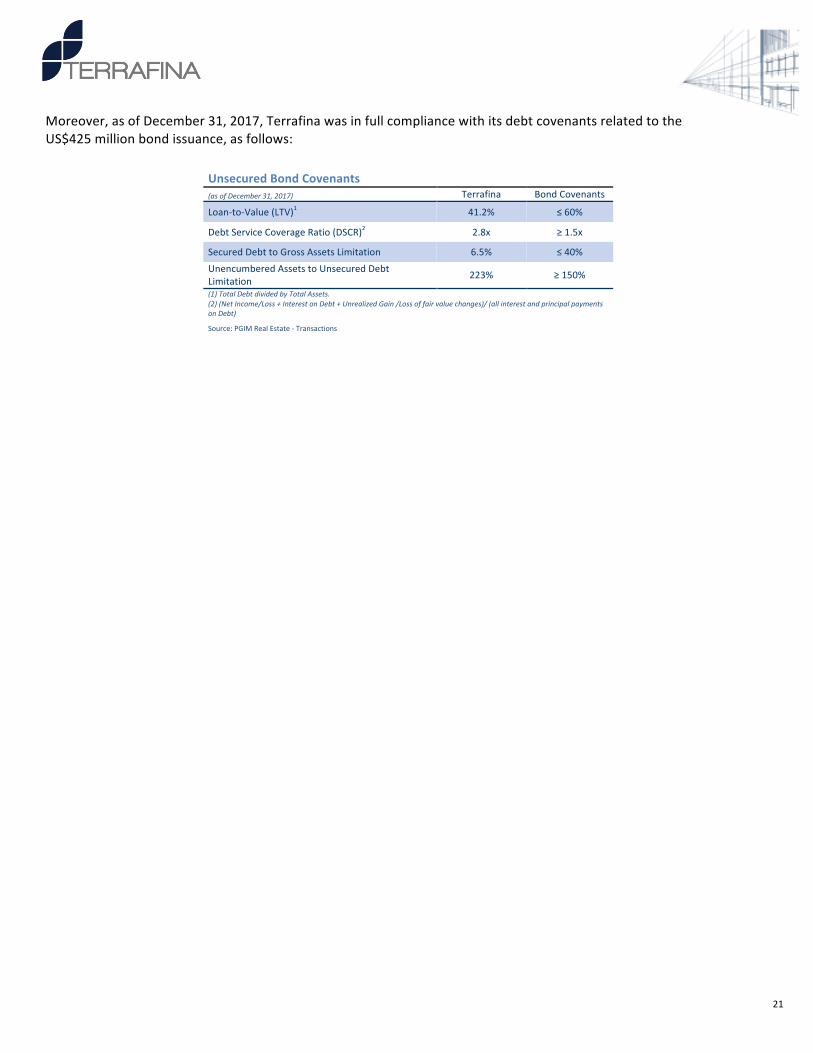
Moreover,asofDecember31,2017,TerrafinawasinfullcompliancewithitsdebtcovenantsrelatedtotheUS$425millionbondissuance,asfollows:
UnsecuredBondCovenants (asofDecember31,2017) Terrafina BondCovenants
Loan-to-Value(LTV)1 41.2% ≤60%
DebtServiceCoverageRatio(DSCR)2 2.8x ≥1.5x
SecuredDebttoGrossAssetsLimitation 6.5% ≤40%UnencumberedAssetstoUnsecuredDebtLimitation 223% ≥150%
(1)TotalDebtdividedbyTotalAssets.(2)(NetIncome/Loss+InterestonDebt+UnrealizedGain/Lossoffairvaluechanges)/(allinterestandprincipalpaymentsonDebt)
Source:PGIMRealEstate-Transactions
22
AnalystCoverageThefollowingisalistofbanksandinstitutionsthatregularlypublishresearchreportsonTerrafina:-Barclays -Invex-BBVABancomer -ItaúBBA-Bradesco -JPMorgan-BofAML -Monex-BTGPactual -MorganStanley-BX+ -NAUSecurities-CitiBanamex -Scotiabank-CreditSuisse -Vector-GBM -Santander-HSBC -UBS-Interacciones
23
AboutTerrafinaTerrafina (BMV:TERRA13) is a Mexican real estate investment trust formed primarily to acquire, develop, lease andmanage industrial real estate properties in Mexico. Terrafina’s portfolio consists of attractive, strategically locatedwarehousesandotherlightmanufacturingpropertiesthroughouttheCentral,BajioandNorthernregionsofMexico.Itisinternallymanagedbyhighly-qualifiedindustryspecialistsandexternallyadvisedbyPGIMRealEstate.Terrafina owns 296 real estate properties, including 284 developed industrial facilities with a collective GLA ofapproximately40.6millionsquarefeetand12landreserveparcels,designedtopreservetheorganicgrowthcapabilityoftheportfolio.Terrafina’s objective is to provide attractive risk-adjusted returns for the holders of its certificates through stabledistributionsandcapitalappreciations.Terrafinaaimstoachievethisobjective throughasuccessfulperformanceof itsindustrialrealestateandcomplementaryproperties,strategicacquisitions,accesstoahighlevelofinstitutionalsupport,andtoitsmanagementandcorporategovernancestructure.Formoreinformation,pleasevisitwww.terrafina.mxPGIMRealEstatePGIMReal Estate is the real estate investment business of PGIM Inc., the global investmentmanagement business ofPrudentialFinancial, Inc. (NYSE:PRU). Redefining therealestate investing landscapesince1970,PGIMRealEstatehasprofessionals in 18 cities in theAmericas, EuropeandAsiaPacificwithdeep local knowledgeandexpertise, andgrossassetsundermanagementofUS$69.6billion(US$49.9billionnet)asofDecember31,2017.PGIMRealEstate’stenuredteamoffers to itsglobal clientbaseabroad rangeof realestateequity,debtandsecurities investment strategies thatspantherisk/returnspectrum.Formoreinformation,visitwww.pgimrealestate.comAboutPrudentialFinancial,Inc.PrudentialFinancial,Inc.(NYSE:PRU),afinancialservicesleaderwithmorethanUS$1trillionofassetsundermanagementasofDecember31,2017,hasoperationsintheUnitedStates,Asia,Europe,andLatinAmerica.Prudential’sdiverseandtalented employees are committed to helping individual and institutional customers grow and protect their wealththroughavarietyofproductsandservices, includinglife insurance,annuities,retirement-relatedservices,mutualfundsandinvestmentmanagement.IntheU.S.,Prudential’siconicRocksymbolhasstoodforstrength,stability,expertiseandinnovationformorethanacentury.Formoreinformation,pleasevisitwww.news.prudential.comForwardLookingStatementsThisdocumentmayincludeforward-lookingstatementsthatmayimplyrisksanduncertainties.Termssuchas"estimate","project", "plan", "believe", "expect", "anticipate", "intend", and other similar expressions could be construed asprevisionsorestimates.Terrafinawarnsreadersthatdeclarationsandestimatesmentionedinthisdocument,orrealizedbyTerrafina’smanagementimplyrisksanduncertaintiesthatcouldchangeinfunctionofvariousfactorsthatareoutofTerrafina’scontrol.FutureexpectationsreflectTerrafina’sjudgmentatthedateofthisdocument.Terrafinareservestherightorobligationtoupdatetheinformationcontainedinthisdocumentorderivedfromthisdocument.Pastorpresentperformanceisnotanindicatortoanticipatefutureperformance.
24
ConferenceCall
(BMV:TERRA13)Cordiallyinvitesyoutoparticipateinits
FourthQuarter2017Results
Wednesday,February28,201811:00a.m.EasternTime10:00a.m.CentralTime
***
Toaccessthecall,pleasedial:fromwithintheU.S.1-877-888-4291fromoutsidetheU.S.1-785-424-1878ConferenceIDNumber:Terrafina
AudioWebcastLink:https://www.webcaster4.com/Webcast/Page/1111/24202
ConferenceReplayU.S.1-844-488-7474
International(outsidetheUS)1-862-902-0129Passcode:19181332
25
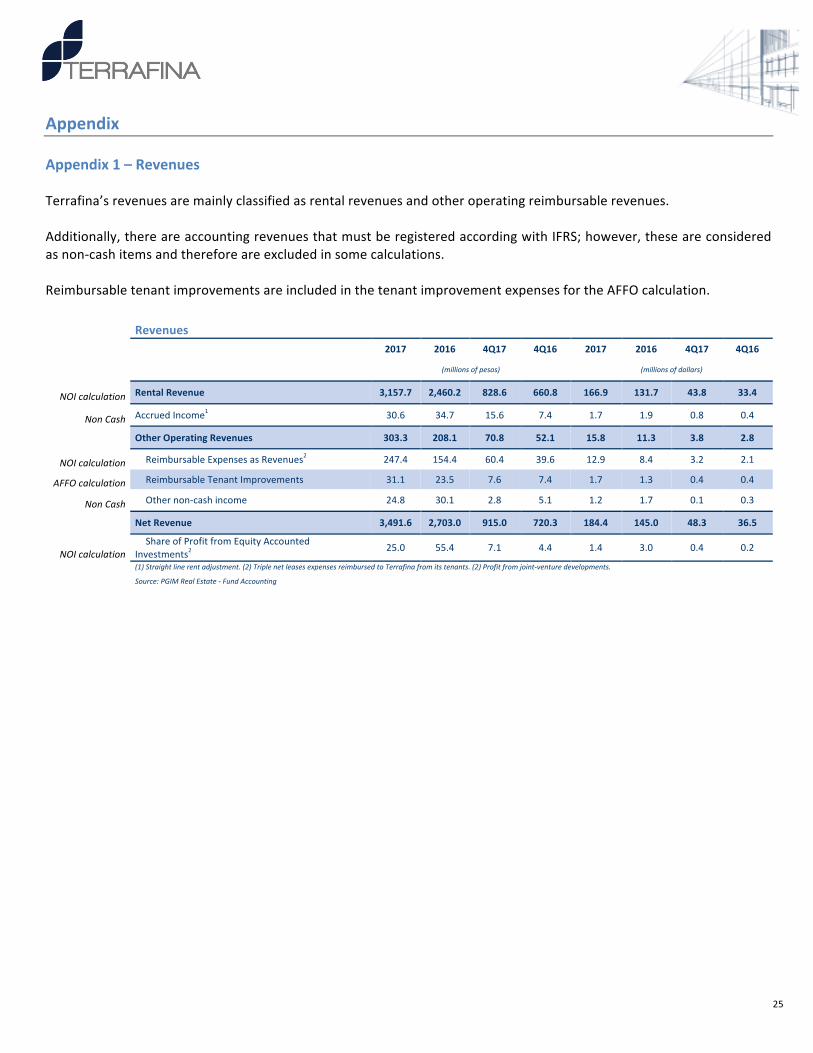
AppendixAppendix1–RevenuesTerrafina’srevenuesaremainlyclassifiedasrentalrevenuesandotheroperatingreimbursablerevenues.Additionally,thereareaccountingrevenuesthatmustberegisteredaccordingwithIFRS;however,theseareconsideredasnon-cashitemsandthereforeareexcludedinsomecalculations.ReimbursabletenantimprovementsareincludedinthetenantimprovementexpensesfortheAFFOcalculation.
Revenues
2017 2016 4Q17 4Q16 2017 2016 4Q17 4Q16
(millionsofpesos) (millionsofdollars)
NOIcalculation RentalRevenue 3,157.7 2,460.2 828.6 660.8 166.9 131.7 43.8 33.4
NonCash AccruedIncome1 30.6 34.7 15.6 7.4 1.7 1.9 0.8 0.4
OtherOperatingRevenues 303.3 208.1 70.8 52.1 15.8 11.3 3.8 2.8
NOIcalculation ReimbursableExpensesasRevenues2 247.4 154.4 60.4 39.6 12.9 8.4 3.2 2.1
AFFOcalculation ReimbursableTenantImprovements 31.1 23.5 7.6 7.4 1.7 1.3 0.4 0.4
NonCash Othernon-cashincome 24.8 30.1 2.8 5.1 1.2 1.7 0.1 0.3
NetRevenue 3,491.6 2,703.0 915.0 720.3 184.4 145.0 48.3 36.5
NOIcalculationShareofProfitfromEquityAccounted
Investments225.0 55.4 7.1 4.4 1.4 3.0 0.4 0.2
(1)Straightlinerentadjustment.(2)TriplenetleasesexpensesreimbursedtoTerrafinafromitstenants.(2)Profitfromjoint-venturedevelopments.
Source:PGIMRealEstate-FundAccounting
26
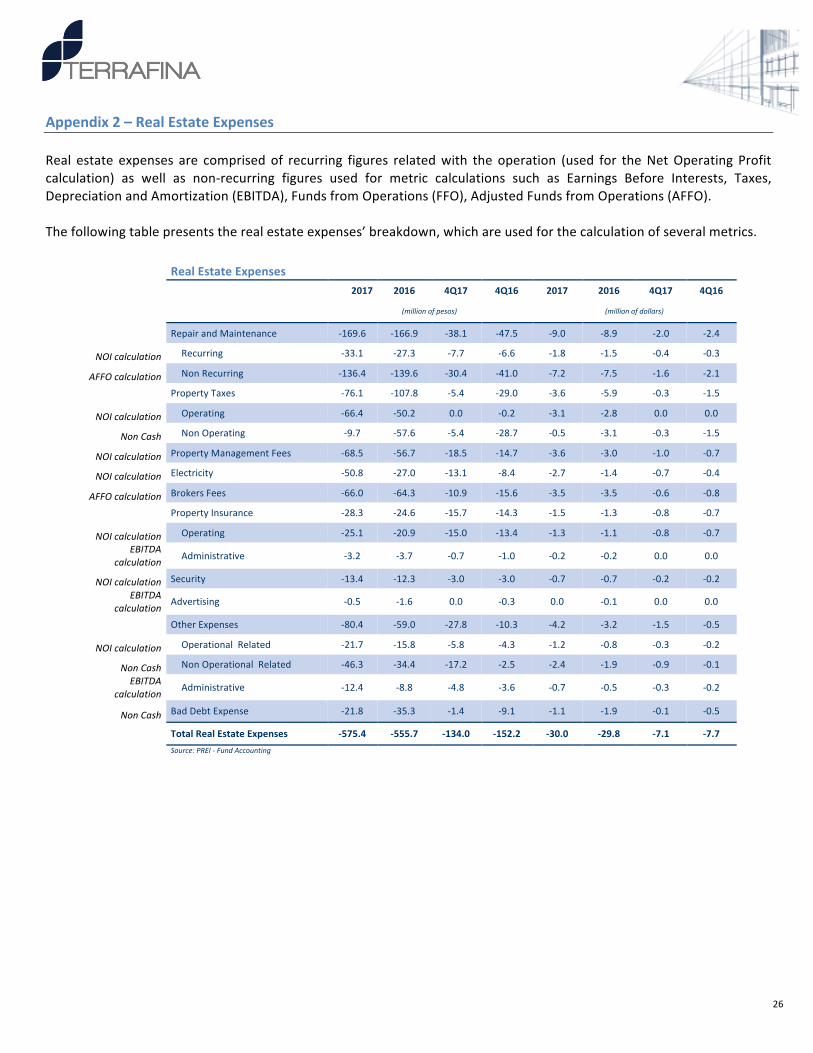
Appendix2–RealEstateExpensesReal estate expenses are comprised of recurring figures relatedwith the operation (used for theNetOperating Profitcalculation) as well as non-recurring figures used for metric calculations such as Earnings Before Interests, Taxes,DepreciationandAmortization(EBITDA),FundsfromOperations(FFO),AdjustedFundsfromOperations(AFFO).Thefollowingtablepresentstherealestateexpenses’breakdown,whichareusedforthecalculationofseveralmetrics.
RealEstateExpenses
2017 2016 4Q17 4Q16 2017 2016 4Q17 4Q16
(millionofpesos) (millionofdollars)
RepairandMaintenance -169.6 -166.9 -38.1 -47.5 -9.0 -8.9 -2.0 -2.4
NOIcalculation Recurring -33.1 -27.3 -7.7 -6.6 -1.8 -1.5 -0.4 -0.3
AFFOcalculation NonRecurring -136.4 -139.6 -30.4 -41.0 -7.2 -7.5 -1.6 -2.1
PropertyTaxes -76.1 -107.8 -5.4 -29.0 -3.6 -5.9 -0.3 -1.5
NOIcalculation Operating -66.4 -50.2 0.0 -0.2 -3.1 -2.8 0.0 0.0
NonCash NonOperating -9.7 -57.6 -5.4 -28.7 -0.5 -3.1 -0.3 -1.5
NOIcalculation PropertyManagementFees -68.5 -56.7 -18.5 -14.7 -3.6 -3.0 -1.0 -0.7
NOIcalculation Electricity -50.8 -27.0 -13.1 -8.4 -2.7 -1.4 -0.7 -0.4
AFFOcalculation BrokersFees -66.0 -64.3 -10.9 -15.6 -3.5 -3.5 -0.6 -0.8
PropertyInsurance -28.3 -24.6 -15.7 -14.3 -1.5 -1.3 -0.8 -0.7
NOIcalculation Operating -25.1 -20.9 -15.0 -13.4 -1.3 -1.1 -0.8 -0.7EBITDA
calculation Administrative -3.2 -3.7 -0.7 -1.0 -0.2 -0.2 0.0 0.0
NOIcalculation Security -13.4 -12.3 -3.0 -3.0 -0.7 -0.7 -0.2 -0.2EBITDA
calculationAdvertising -0.5 -1.6 0.0 -0.3 0.0 -0.1 0.0 0.0
OtherExpenses -80.4 -59.0 -27.8 -10.3 -4.2 -3.2 -1.5 -0.5
NOIcalculation OperationalRelated -21.7 -15.8 -5.8 -4.3 -1.2 -0.8 -0.3 -0.2
NonCash NonOperationalRelated -46.3 -34.4 -17.2 -2.5 -2.4 -1.9 -0.9 -0.1EBITDA
calculationAdministrative -12.4 -8.8 -4.8 -3.6 -0.7 -0.5 -0.3 -0.2
NonCash BadDebtExpense -21.8 -35.3 -1.4 -9.1 -1.1 -1.9 -0.1 -0.5
TotalRealEstateExpenses -575.4 -555.7 -134.0 -152.2 -30.0 -29.8 -7.1 -7.7
Source:PREI-FundAccounting
27
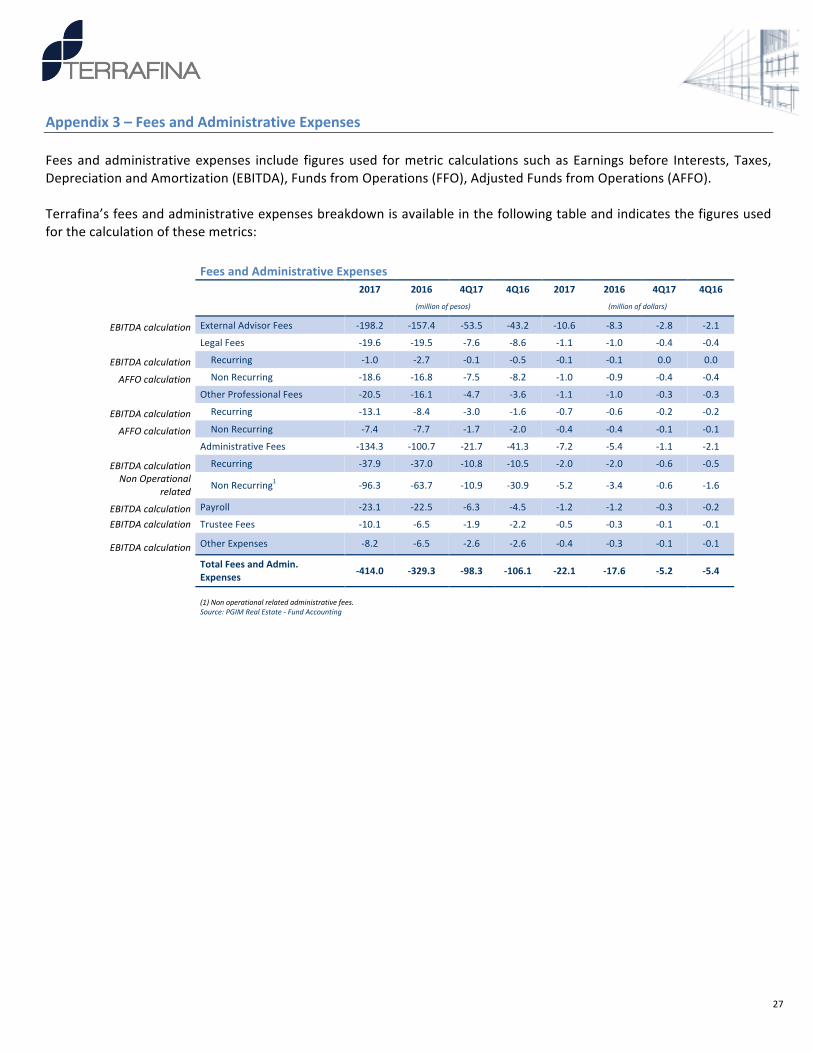
Appendix3–FeesandAdministrativeExpensesFeesandadministrativeexpenses include figuresused formetric calculations suchasEarningsbefore Interests, Taxes,DepreciationandAmortization(EBITDA),FundsfromOperations(FFO),AdjustedFundsfromOperations(AFFO).Terrafina’sfeesandadministrativeexpensesbreakdownisavailableinthefollowingtableandindicatesthefiguresusedforthecalculationofthesemetrics:
FeesandAdministrativeExpenses
2017 2016 4Q17 4Q16 2017 2016 4Q17 4Q16
(millionofpesos) (millionofdollars)
EBITDAcalculation ExternalAdvisorFees -198.2 -157.4 -53.5 -43.2 -10.6 -8.3 -2.8 -2.1
LegalFees -19.6 -19.5 -7.6 -8.6 -1.1 -1.0 -0.4 -0.4
EBITDAcalculation Recurring -1.0 -2.7 -0.1 -0.5 -0.1 -0.1 0.0 0.0
AFFOcalculation NonRecurring -18.6 -16.8 -7.5 -8.2 -1.0 -0.9 -0.4 -0.4
OtherProfessionalFees -20.5 -16.1 -4.7 -3.6 -1.1 -1.0 -0.3 -0.3
EBITDAcalculation Recurring -13.1 -8.4 -3.0 -1.6 -0.7 -0.6 -0.2 -0.2
AFFOcalculation NonRecurring -7.4 -7.7 -1.7 -2.0 -0.4 -0.4 -0.1 -0.1
AdministrativeFees -134.3 -100.7 -21.7 -41.3 -7.2 -5.4 -1.1 -2.1
EBITDAcalculation Recurring -37.9 -37.0 -10.8 -10.5 -2.0 -2.0 -0.6 -0.5NonOperational
related NonRecurring1 -96.3 -63.7 -10.9 -30.9 -5.2 -3.4 -0.6 -1.6
EBITDAcalculation Payroll -23.1 -22.5 -6.3 -4.5 -1.2 -1.2 -0.3 -0.2
EBITDAcalculation TrusteeFees -10.1 -6.5 -1.9 -2.2 -0.5 -0.3 -0.1 -0.1
EBITDAcalculation OtherExpenses -8.2 -6.5 -2.6 -2.6 -0.4 -0.3 -0.1 -0.1
TotalFeesandAdmin.Expenses -414.0 -329.3 -98.3 -106.1 -22.1 -17.6 -5.2 -5.4
(1)Nonoperationalrelatedadministrativefees.
Source:PGIMRealEstate-FundAccounting
28
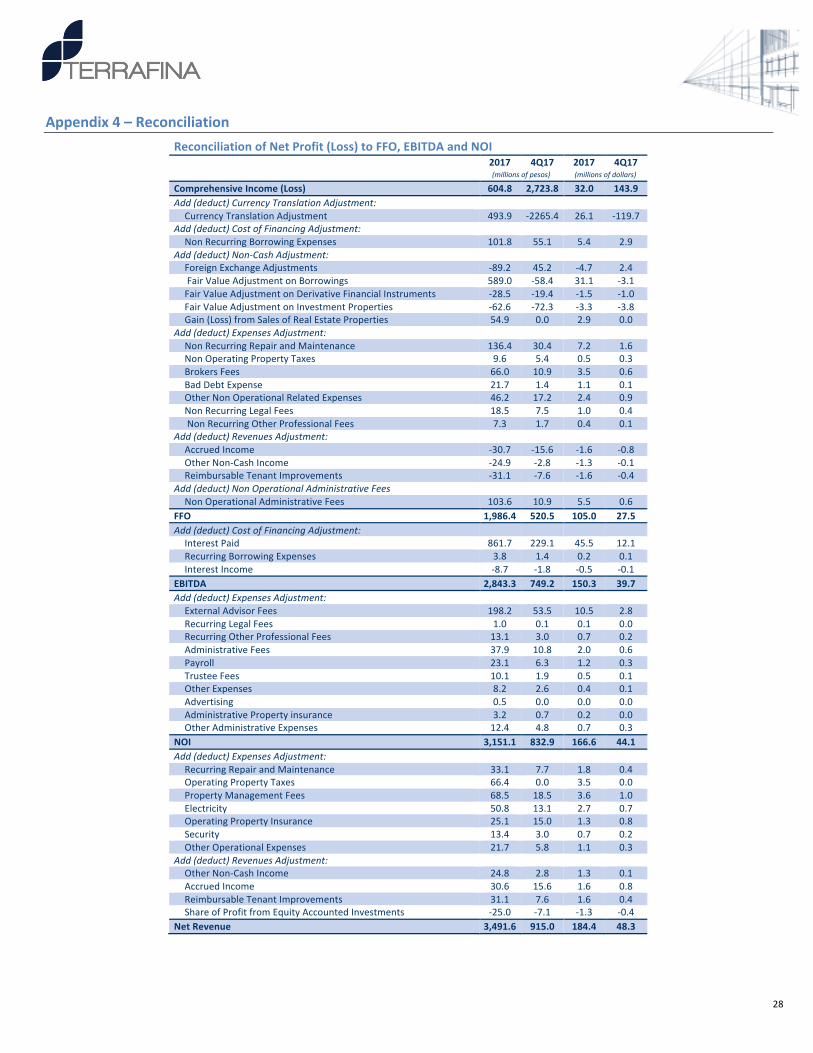
Appendix4–ReconciliationReconciliationofNetProfit(Loss)toFFO,EBITDAandNOI
2017 4Q17 2017 4Q17 (millionsofpesos) (millionsofdollars)
ComprehensiveIncome(Loss) 604.8 2,723.8 32.0 143.9Add(deduct)CurrencyTranslationAdjustment: CurrencyTranslationAdjustment 493.9 -2265.4 26.1 -119.7
Add(deduct)CostofFinancingAdjustment: NonRecurringBorrowingExpenses 101.8 55.1 5.4 2.9
Add(deduct)Non-CashAdjustment: ForeignExchangeAdjustments -89.2 45.2 -4.7 2.4FairValueAdjustmentonBorrowings 589.0 -58.4 31.1 -3.1FairValueAdjustmentonDerivativeFinancialInstruments -28.5 -19.4 -1.5 -1.0FairValueAdjustmentonInvestmentProperties -62.6 -72.3 -3.3 -3.8Gain(Loss)fromSalesofRealEstateProperties 54.9 0.0 2.9 0.0
Add(deduct)ExpensesAdjustment: NonRecurringRepairandMaintenance 136.4 30.4 7.2 1.6NonOperatingPropertyTaxes 9.6 5.4 0.5 0.3BrokersFees 66.0 10.9 3.5 0.6BadDebtExpense 21.7 1.4 1.1 0.1OtherNonOperationalRelatedExpenses 46.2 17.2 2.4 0.9NonRecurringLegalFees 18.5 7.5 1.0 0.4NonRecurringOtherProfessionalFees 7.3 1.7 0.4 0.1
Add(deduct)RevenuesAdjustment: AccruedIncome -30.7 -15.6 -1.6 -0.8OtherNon-CashIncome -24.9 -2.8 -1.3 -0.1ReimbursableTenantImprovements -31.1 -7.6 -1.6 -0.4
Add(deduct)NonOperationalAdministrativeFees NonOperationalAdministrativeFees 103.6 10.9 5.5 0.6
FFO 1,986.4 520.5 105.0 27.5Add(deduct)CostofFinancingAdjustment: InterestPaid 861.7 229.1 45.5 12.1RecurringBorrowingExpenses 3.8 1.4 0.2 0.1InterestIncome -8.7 -1.8 -0.5 -0.1
EBITDA 2,843.3 749.2 150.3 39.7Add(deduct)ExpensesAdjustment: ExternalAdvisorFees 198.2 53.5 10.5 2.8RecurringLegalFees 1.0 0.1 0.1 0.0RecurringOtherProfessionalFees 13.1 3.0 0.7 0.2AdministrativeFees 37.9 10.8 2.0 0.6Payroll 23.1 6.3 1.2 0.3TrusteeFees 10.1 1.9 0.5 0.1OtherExpenses 8.2 2.6 0.4 0.1Advertising 0.5 0.0 0.0 0.0AdministrativePropertyinsurance 3.2 0.7 0.2 0.0OtherAdministrativeExpenses 12.4 4.8 0.7 0.3
NOI 3,151.1 832.9 166.6 44.1Add(deduct)ExpensesAdjustment: RecurringRepairandMaintenance 33.1 7.7 1.8 0.4OperatingPropertyTaxes 66.4 0.0 3.5 0.0PropertyManagementFees 68.5 18.5 3.6 1.0Electricity 50.8 13.1 2.7 0.7OperatingPropertyInsurance 25.1 15.0 1.3 0.8Security 13.4 3.0 0.7 0.2OtherOperationalExpenses 21.7 5.8 1.1 0.3
Add(deduct)RevenuesAdjustment: OtherNon-CashIncome 24.8 2.8 1.3 0.1AccruedIncome 30.6 15.6 1.6 0.8ReimbursableTenantImprovements 31.1 7.6 1.6 0.4ShareofProfitfromEquityAccountedInvestments -25.0 -7.1 -1.3 -0.4
NetRevenue 3,491.6 915.0 184.4 48.3
29
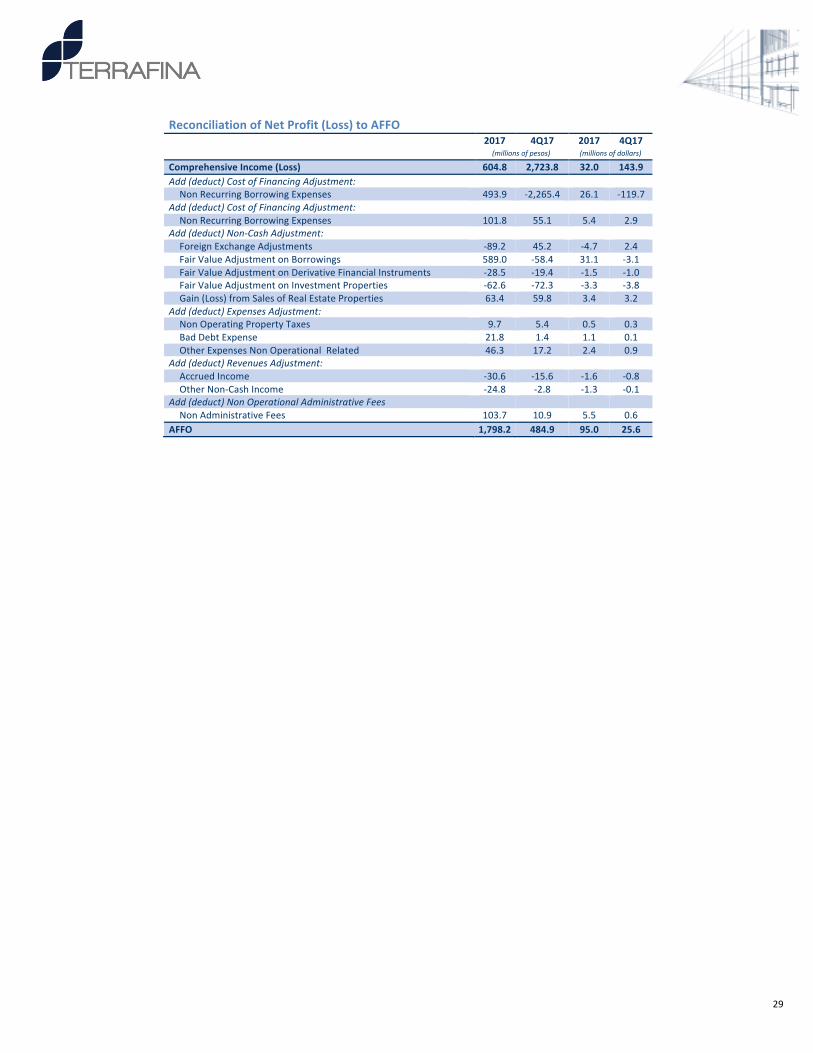
ReconciliationofNetProfit(Loss)toAFFO 2017 4Q17 2017 4Q17
(millionsofpesos) (millionsofdollars)
ComprehensiveIncome(Loss) 604.8 2,723.8 32.0 143.9Add(deduct)CostofFinancingAdjustment: NonRecurringBorrowingExpenses 493.9 -2,265.4 26.1 -119.7
Add(deduct)CostofFinancingAdjustment: NonRecurringBorrowingExpenses 101.8 55.1 5.4 2.9
Add(deduct)Non-CashAdjustment: ForeignExchangeAdjustments -89.2 45.2 -4.7 2.4FairValueAdjustmentonBorrowings 589.0 -58.4 31.1 -3.1FairValueAdjustmentonDerivativeFinancialInstruments -28.5 -19.4 -1.5 -1.0FairValueAdjustmentonInvestmentProperties -62.6 -72.3 -3.3 -3.8Gain(Loss)fromSalesofRealEstateProperties 63.4 59.8 3.4 3.2
Add(deduct)ExpensesAdjustment: NonOperatingPropertyTaxes 9.7 5.4 0.5 0.3BadDebtExpense 21.8 1.4 1.1 0.1OtherExpensesNonOperationalRelated 46.3 17.2 2.4 0.9
Add(deduct)RevenuesAdjustment: AccruedIncome -30.6 -15.6 -1.6 -0.8OtherNon-CashIncome -24.8 -2.8 -1.3 -0.1
Add(deduct)NonOperationalAdministrativeFees NonAdministrativeFees 103.7 10.9 5.5 0.6
AFFO 1,798.2 484.9 95.0 25.6
30
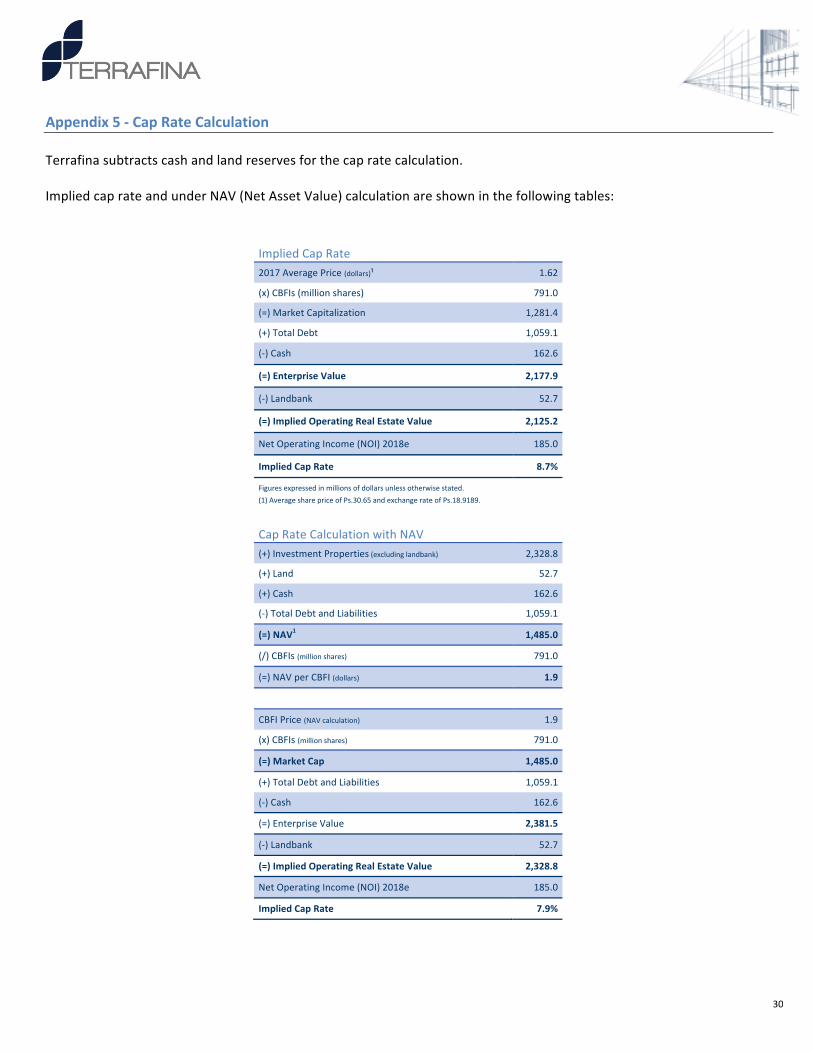
Appendix5-CapRateCalculationTerrafinasubtractscashandlandreservesforthecapratecalculation.ImpliedcaprateandunderNAV(NetAssetValue)calculationareshowninthefollowingtables:
ImpliedCapRate
2017AveragePrice(dollars)¹ 1.62
(x)CBFIs(millionshares) 791.0
(=)MarketCapitalization 1,281.4
(+)TotalDebt 1,059.1
(-)Cash 162.6
(=)EnterpriseValue 2,177.9
(-)Landbank 52.7
(=)ImpliedOperatingRealEstateValue 2,125.2
NetOperatingIncome(NOI)2018e 185.0
ImpliedCapRate 8.7%
Figuresexpressedinmillionsofdollarsunlessotherwisestated.
(1)AveragesharepriceofPs.30.65andexchangerateofPs.18.9189.
CapRateCalculationwithNAV
(+)InvestmentProperties(excludinglandbank) 2,328.8
(+)Land 52.7
(+)Cash 162.6
(-)TotalDebtandLiabilities 1,059.1
(=)NAV1 1,485.0
(/)CBFIs(millionshares) 791.0
(=)NAVperCBFI(dollars) 1.9
CBFIPrice(NAVcalculation) 1.9
(x)CBFIs(millionshares) 791.0
(=)MarketCap 1,485.0
(+)TotalDebtandLiabilities 1,059.1
(-)Cash 162.6
(=)EnterpriseValue 2,381.5
(-)Landbank 52.7
(=)ImpliedOperatingRealEstateValue 2,328.8
NetOperatingIncome(NOI)2018e 185.0
ImpliedCapRate 7.9%
31
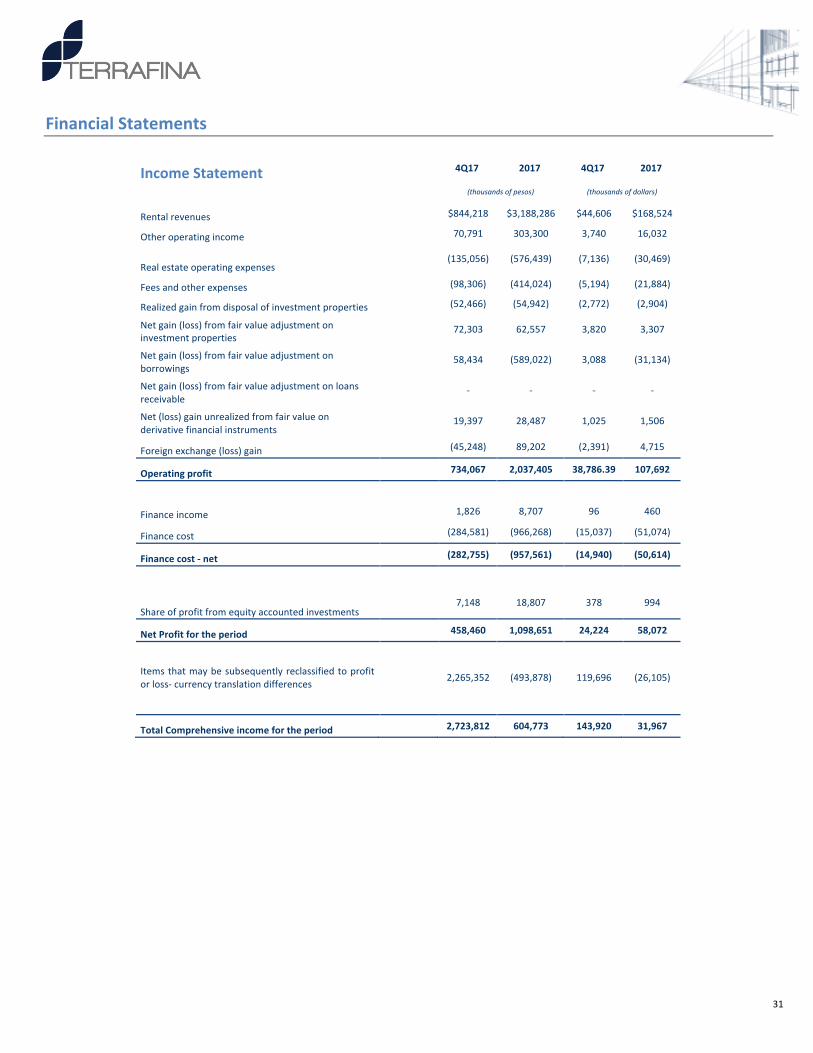
FinancialStatements
IncomeStatement
4Q17 2017 4Q17 2017
(thousandsofpesos) (thousandsofdollars)
Rentalrevenues
$844,218 $3,188,286 $44,606 $168,524
Otheroperatingincome
70,791 303,300 3,740 16,032
Realestateoperatingexpenses
(135,056) (576,439) (7,136) (30,469)
Feesandotherexpenses
(98,306) (414,024) (5,194) (21,884)
Realizedgainfromdisposalofinvestmentproperties
(52,466) (54,942) (2,772) (2,904)
Netgain(loss)fromfairvalueadjustmentoninvestmentproperties
72,303 62,557 3,820 3,307
Netgain(loss)fromfairvalueadjustmentonborrowings
58,434 (589,022) 3,088 (31,134)
Netgain(loss)fromfairvalueadjustmentonloansreceivable
- - - -
Net(loss)gainunrealizedfromfairvalueonderivativefinancialinstruments
19,397 28,487 1,025 1,506
Foreignexchange(loss)gain
(45,248) 89,202 (2,391) 4,715
Operatingprofit 734,067 2,037,405 38,786.39 107,692
Financeincome
1,826 8,707 96 460
Financecost
(284,581) (966,268) (15,037) (51,074)
Financecost-net (282,755) (957,561) (14,940) (50,614)
Shareofprofitfromequityaccountedinvestments
7,148 18,807 378 994
NetProfitfortheperiod 458,460 1,098,651 24,224 58,072
Itemsthatmaybesubsequentlyreclassifiedtoprofitorloss-currencytranslationdifferences 2,265,352 (493,878) 119,696 (26,105)
TotalComprehensiveincomefortheperiod 2,723,812 604,773 143,920 31,967
32
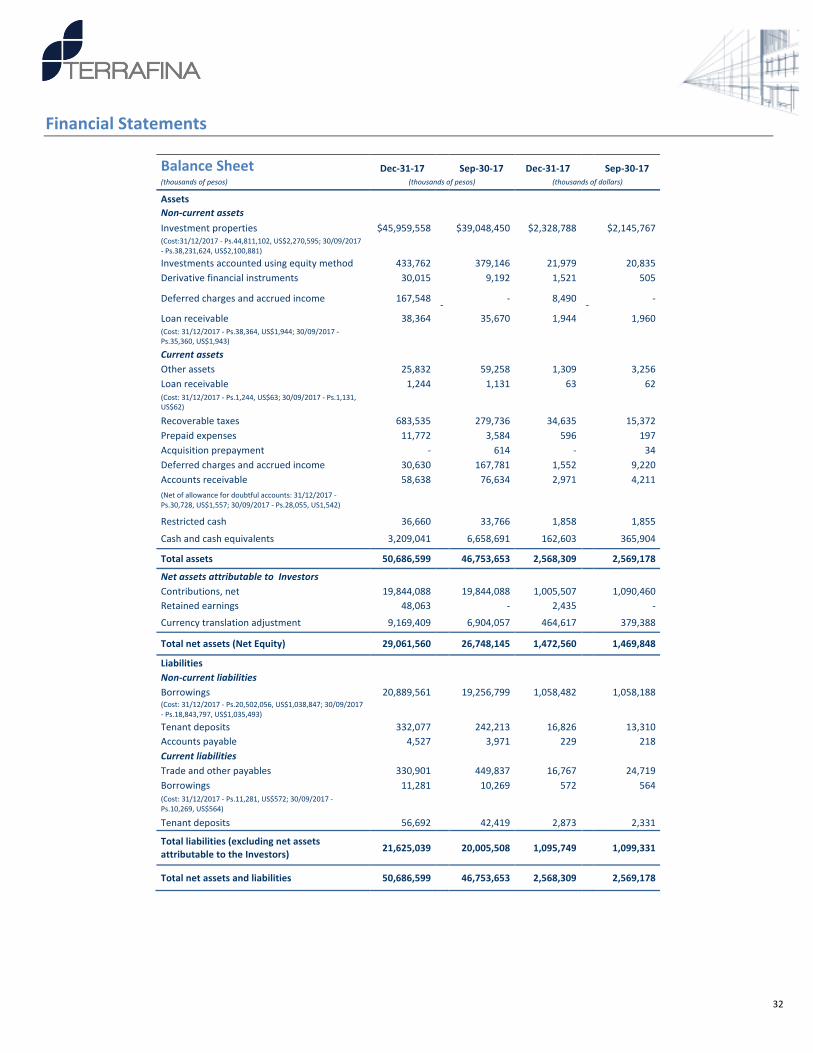
FinancialStatements
BalanceSheet Dec-31-17 Sep-30-17 Dec-31-17 Sep-30-17(thousandsofpesos) (thousandsofpesos) (thousandsofdollars)
Assets Non-currentassets
Investmentproperties $45,959,558 $39,048,450 $2,328,788 $2,145,767(Cost:31/12/2017-Ps.44,811,102,US$2,270,595;30/09/2017-Ps.38,231,624,US$2,100,881)
Investmentsaccountedusingequitymethod 433,762
379,146 21,979
20,835Derivativefinancialinstruments 30,015
9,192 1,521
505
Deferredchargesandaccruedincome 167,548- - 8,490
- -
Loanreceivable 38,364
35,670 1,944
1,960(Cost:31/12/2017-Ps.38,364,US$1,944;30/09/2017-Ps.35,360,US$1,943) Currentassets Otherassets 25,832 59,258 1,309 3,256Loanreceivable 1,244 1,131 63 62(Cost:31/12/2017-Ps.1,244,US$63;30/09/2017-Ps.1,131,US$62) Recoverabletaxes 683,535
279,736 34,635
15,372
Prepaidexpenses 11,772 3,584 596 197Acquisitionprepayment - 614 - 34Deferredchargesandaccruedincome 30,630 167,781 1,552 9,220Accountsreceivable 58,638 76,634 2,971 4,211(Netofallowancefordoubtfulaccounts:31/12/2017-Ps.30,728,US$1,557;30/09/2017-Ps.28,055,US1,542)
Restrictedcash 36,660 33,766 1,858 1,855
Cashandcashequivalents 3,209,041 6,658,691 162,603 365,904
Totalassets 50,686,599 46,753,653 2,568,309 2,569,178
NetassetsattributabletoInvestors Contributions,net 19,844,088 19,844,088 1,005,507 1,090,460Retainedearnings 48,063
- 2,435
-
Currencytranslationadjustment 9,169,409 6,904,057 464,617 379,388
Totalnetassets(NetEquity) 29,061,560 26,748,145 1,472,560 1,469,848
Liabilities Non-currentliabilities
Borrowings 20,889,561
19,256,799 1,058,482
1,058,188
(Cost:31/12/2017-Ps.20,502,056,US$1,038,847;30/09/2017-Ps.18,843,797,US$1,035,493) Tenantdeposits 332,077 242,213 16,826 13,310Accountspayable 4,527
3,971 229
218
Currentliabilities
Tradeandotherpayables 330,901 449,837 16,767 24,719Borrowings 11,281 10,269 572 564(Cost:31/12/2017-Ps.11,281,US$572;30/09/2017-Ps.10,269,US$564) Tenantdeposits 56,692 42,419 2,873 2,331
Totalliabilities(excludingnetassetsattributabletotheInvestors) 21,625,039 20,005,508 1,095,749 1,099,331
Totalnetassetsandliabilities 50,686,599 46,753,653 2,568,309 2,569,178
33
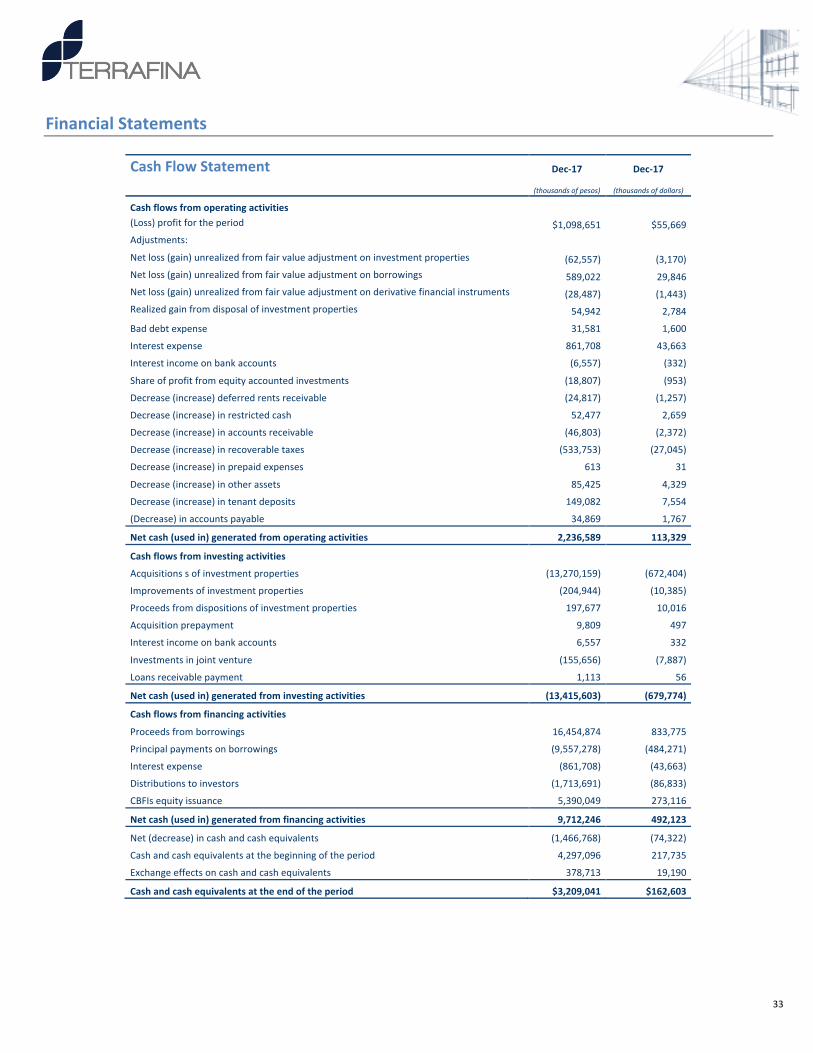
FinancialStatements
CashFlowStatement Dec-17 Dec-17
(thousandsofpesos) (thousandsofdollars)
Cashflowsfromoperatingactivities (Loss)profitfortheperiod $1,098,651 $55,669
Adjustments: Netloss(gain)unrealizedfromfairvalueadjustmentoninvestmentproperties (62,557) (3,170)
Netloss(gain)unrealizedfromfairvalueadjustmentonborrowings 589,022 29,846Netloss(gain)unrealizedfromfairvalueadjustmentonderivativefinancialinstruments (28,487) (1,443)Realizedgainfromdisposalofinvestmentproperties 54,942 2,784
Baddebtexpense 31,581 1,600
Interestexpense 861,708 43,663
Interestincomeonbankaccounts (6,557) (332)
Shareofprofitfromequityaccountedinvestments (18,807) (953)
Decrease(increase)deferredrentsreceivable (24,817) (1,257)
Decrease(increase)inrestrictedcash 52,477 2,659
Decrease(increase)inaccountsreceivable (46,803) (2,372)
Decrease(increase)inrecoverabletaxes (533,753) (27,045)
Decrease(increase)inprepaidexpenses 613 31
Decrease(increase)inotherassets 85,425 4,329
Decrease(increase)intenantdeposits 149,082 7,554
(Decrease)inaccountspayable 34,869 1,767
Netcash(usedin)generatedfromoperatingactivities 2,236,589 113,329
Cashflowsfrominvestingactivities Acquisitionssofinvestmentproperties (13,270,159) (672,404)
Improvementsofinvestmentproperties (204,944) (10,385)
Proceedsfromdispositionsofinvestmentproperties 197,677 10,016
Acquisitionprepayment 9,809 497
Interestincomeonbankaccounts 6,557 332
Investmentsinjointventure (155,656) (7,887)
Loansreceivablepayment 1,113 56
Netcash(usedin)generatedfrominvestingactivities (13,415,603) (679,774)
Cashflowsfromfinancingactivities Proceedsfromborrowings 16,454,874 833,775
Principalpaymentsonborrowings (9,557,278) (484,271)
Interestexpense (861,708) (43,663)
Distributionstoinvestors (1,713,691) (86,833)
CBFIsequityissuance 5,390,049 273,116
Netcash(usedin)generatedfromfinancingactivities 9,712,246 492,123
Net(decrease)incashandcashequivalents (1,466,768) (74,322)
Cashandcashequivalentsatthebeginningoftheperiod 4,297,096 217,735
Exchangeeffectsoncashandcashequivalents 378,713 19,190
Cashandcashequivalentsattheendoftheperiod $3,209,041 $162,603
34
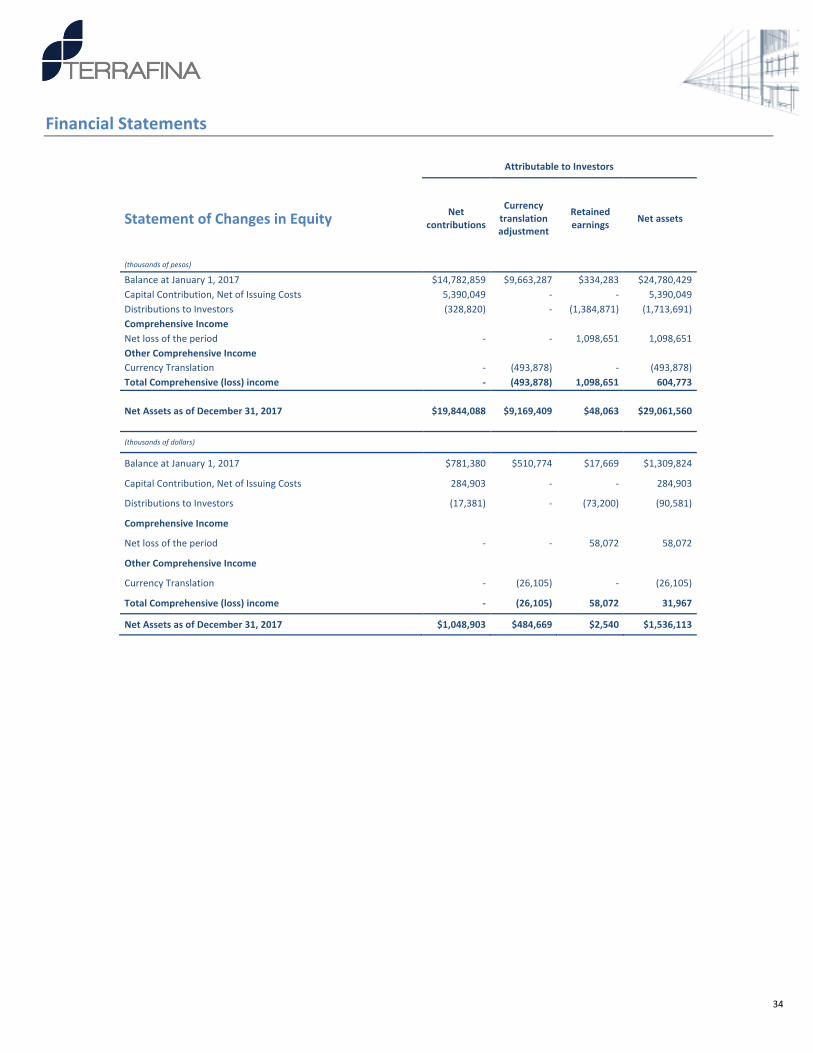
FinancialStatements AttributabletoInvestors
StatementofChangesinEquity Netcontributions
Currencytranslationadjustment
Retainedearnings Netassets
(thousandsofpesos) BalanceatJanuary1,2017 $14,782,859 $9,663,287 $334,283 $24,780,429CapitalContribution,NetofIssuingCosts 5,390,049 - - 5,390,049DistributionstoInvestors (328,820) - (1,384,871) (1,713,691)ComprehensiveIncome Netlossoftheperiod - - 1,098,651 1,098,651OtherComprehensiveIncome CurrencyTranslation - (493,878) - (493,878)TotalComprehensive(loss)income - (493,878) 1,098,651 604,773
NetAssetsasofDecember31,2017 $19,844,088 $9,169,409 $48,063 $29,061,560
(thousandsofdollars)
BalanceatJanuary1,2017 $781,380 $510,774 $17,669 $1,309,824
CapitalContribution,NetofIssuingCosts 284,903 - - 284,903
DistributionstoInvestors (17,381) - (73,200) (90,581)
ComprehensiveIncome Netlossoftheperiod - - 58,072 58,072
OtherComprehensiveIncome CurrencyTranslation - (26,105) - (26,105)
TotalComprehensive(loss)income - (26,105) 58,072 31,967
NetAssetsasofDecember31,2017 $1,048,903 $484,669 $2,540 $1,536,113