Embed Size (px)
Citation preview
Fourth Quarter and Full
Year 2017 Earnings Call
February 22, 2018

Fourth Quarter and Full Year 2017 – Earnings Call
Certain statements contained in this presentation may constitute forward-looking statements within the meaning of the Private Securities
Litigation Reform Act of 1995. This presentation may contain “forward-looking statements” with respect to our business, results of
operations and financial condition, and our expectations or beliefs concerning future events and conditions. You can identify forward-
looking statements because they contain words such as, but not limited to, “believes,” “expects,” “may,” “should,” “approximately,”
“anticipates,” “estimates,” “intends,” “plans,” “targets,” likely,” “will,” “would,” “could” and similar expressions (or the negative of these
terminologies or expressions). All forward-looking statements involve risks and uncertainties. Many risks and uncertainties are inherent in
our industry and markets. Others are more specific to our business and operations. These risks and uncertainties include, but are not
limited to, economic downturn, the loss of key customers, suppliers or other business relationships; disruption to business operations; the
inability to meet customer quality requirements; delayed readiness for the North American Auto Body Sheet market, the capacity and
effectiveness of our hedging policy activities, failure to retain key employees, and other risk factors set forth under the heading “Risk
Factors” in our Annual Report on Form 20-F, and our registration statement on Form F-3 filed on October 30, 2017, and as described from
time to time in subsequent reports filed with the U.S. Securities and Exchange Commission. The occurrence of the events described and
the achievement of the expected results depend on many events, some or all of which are not predictable or within our control.
Consequently, actual results may differ materially from the forward-looking statements contained in this presentation. We undertake no
obligation to update or revise any forward-looking statement as a result of new information, future events or otherwise, except as required
by law.
Forward-looking statements
2

Fourth Quarter and Full Year 2017 – Earnings Call
Non-GAAP measures
This presentation includes information regarding certain non-GAAP financial measures, including Adjusted EBITDA, Adjusted EBITDA
per metric ton, Free Cash Flow and Net debt. These measures are presented because management uses this information to monitor
and evaluate financial results and trends and believes this information to also be useful for investors. Adjusted EBITDA measures are
frequently used by securities analysts, investors and other interested parties in their evaluation of Constellium and in comparison to
other companies, many of which present an adjusted EBITDA-related performance measure when reporting their results. Adjusted
EBITDA, Adjusted EBITDA per Metric Ton, Free Cash Flow and Net debt are not presentations made in accordance with IFRS and
may not be comparable to similarly titled measures of other companies. These non-GAAP financial measures supplement our IFRS
disclosures and should not be considered an alternative to the IFRS measures. This presentation provides a reconciliation of non-
GAAP financial measures to the most directly comparable GAAP financial measures. We are not able to provide a reconciliation of
Adjusted EBITDA guidance to net income, the comparable GAAP measure, because certain items that are excluded from Adjusted
EBITDA cannot be reasonably predicted or are not in our control. In particular, we are unable to forecast the timing or magnitude of
realized and unrealized gains and losses on derivative instruments, metal lag, impairment or restructuring charges, or taxes without
unreasonable efforts, and these items could significantly impact, either individually or in the aggregate, our net income in the future.
3

Jean-Marc GermainChief Executive Officer

Fourth Quarter and Full Year 2017 – Earnings Call 5
Q4 2017 Highlights
► Total Shipments up 2% compared to Q4 2016
► Automotive shipments increased 35%
► Revenue increased 8% YoY to €1.2 billion on higher aluminium prices
► Net Loss of €80 million compared to a net loss of €20 million in Q4 2016
► Adjusted EBITDA increased 22% YoY to €100 million
► Adjusted EBITDA increased 14% YoY in 2017
► Net Debt / LTM Adjusted EBITDA down to 4.4x
► Completed recapitalization transaction reducing leverage and interest expense
► In February, announced a binding agreement to sell Sierre North Building Assets for €200 million
Strong Q4 results; Significant progress on deleveraging

Fourth Quarter and Full Year 2017 – Earnings Call
A&T
► Adjusted EBITDA of €34 million
► Continued progress in developing
Transportation, Industry and Defense end
markets
► Announced multi-year agreement with
Bombardier
6
Q4 2017 Segment Highlights
P&ARP
► Adjusted EBITDA of €44 million
► Automotive rolled product shipments
increased 52% YoY
► FT3 ramp up in Neuf-Brisach on track
► U.S. automotive readiness program
progressing
► Focused on Bowling Green ramp up
AS&I
► Adjusted EBITDA of €27 million; up 31% YoY
► End market demand remained strong
► Automotive and Other extruded
product shipments up 15% and 12%,
respectively
► Major growth programs on track
► Nominations of €1.1 billion in 2017
Corporate
► Completed refinancing, including debt and
equity issuances
► Project 2019 achieved €22 million of annual
run rate cost savings YTD

Peter Matt
Chief Financial Officer

Fourth Quarter and Full Year 2017 – Earnings Call
FY 2017 vs. FY 2016
Q4 2017 vs. Q4 2016
8
Adjusted EBITDA Bridges
€ millions
+22%
+14%€ millions

Fourth Quarter and Full Year 2017 – Earnings Call
Q4 2017 Performance Highlights Adjusted EBITDA of €44 million
Higher Automotive shipments partially
offset by lower Packaging shipments
Slightly weaker packaging price and mix
Good cost performance offset by
incremental costs from the ramp up of
automotive programs and FX translation
9
Packaging and Automotive Rolled Products
Adjusted EBITDA Bridge
€ in millions
Q4
2017
Q4
2016 Var.
Shipments (kt) 238 236 1%
Revenues (€m) 666 611 9%
Adj. EBITDA (€m) 44 43 0%
Adj. EBITDA (€ / t) 182 183 (1)%

Fourth Quarter and Full Year 2017 – Earnings Call
Q4 2017 Performance Highlights Adjusted EBITDA of €34 million
Lower Aerospace rolled product
shipments
Continuing benefit from aerospace
price and mix effect
Solid operating cost performance
offset by FX translation
10
Aerospace and Transportation
Adjusted EBITDA Bridge
€ in millions
Q4
2017
Q4
2016 Var.
Shipments (kt) 56 59 (6)%
Revenues (€m) 319 323 (1)%
Adj. EBITDA (€m) 34 22 51%
Adj. EBITDA (€ / t) 615 384 60%
Fourth Quarter and Full Year 2017 – Earnings Call
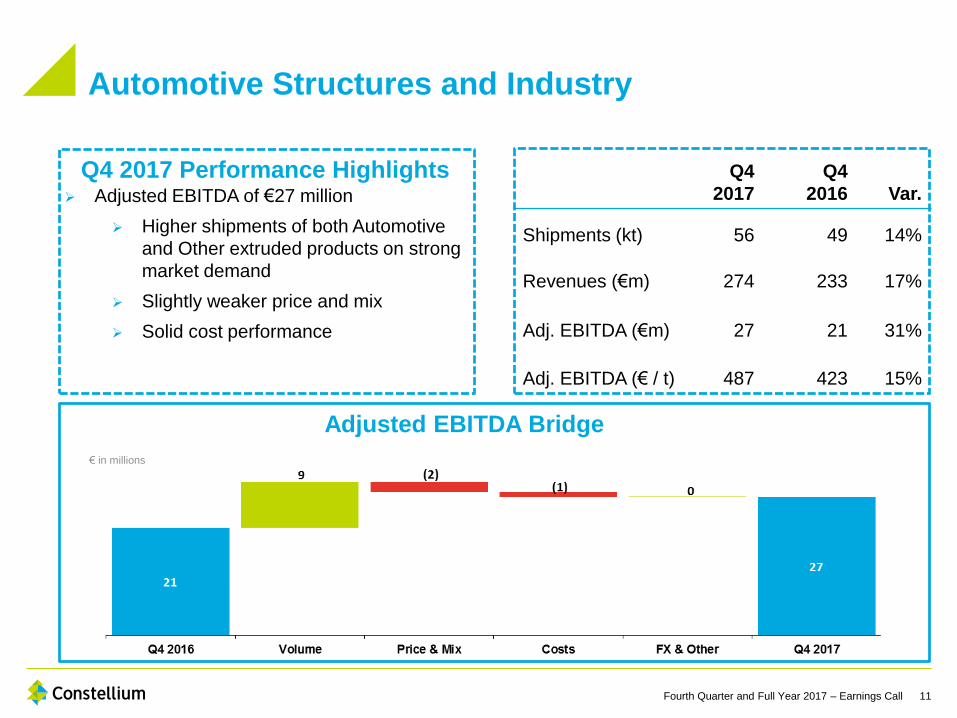
Q4 2017 Performance Highlights
11
Automotive Structures and Industry
Adjusted EBITDA Bridge
€ in millions
Adjusted EBITDA of €27 million
Higher shipments of both Automotive
and Other extruded products on strong
market demand
Slightly weaker price and mix
Solid cost performance
Q4
2017
Q4
2016 Var.
Shipments (kt) 56 49 14%
Revenues (€m) 274 233 17%
Adj. EBITDA (€m) 27 21 31%
Adj. EBITDA (€ / t) 487 423 15%

Fourth Quarter and Full Year 2017 – Earnings Call
Project 2019
12
Three
Pillars
Cost
Reduction
€22 million of annual run rate cost savings achieved
as of December 31, 2017
Wide range of additional cost reduction
initiatives underway
Working
Capital
Improvement
Better working capital performance in 2017
Committed to further working capital improvement
Capital
Discipline
Capex in line with 2017 target of €275 million
€79 million reduction YoY
Capex guidance of €275 million for 2018
Maintenance spending of €150-175 million
Project 2019 initiatives underway and providing benefits

Fourth Quarter and Full Year 2017 – Earnings Call
Net Debt and Liquidity
13
€ in millions
Net Debt and Leverage
Liquidity Maturity Profile
Debt / Liquidity Highlights
Leverage of 4.4x
Reduced by 1.0x in 2017
No bond maturities until 2021
2021 bond only ~0.7x LTM Adjusted
EBITDA
Ample liquidity at over €500 million
Reduced leverage, ample liquidity and no bond maturities until 2021
€ in millions € in millions
Leverage: Net Debt / LTM Adjusted EBITDA

Fourth Quarter and Full Year 2017 – Earnings Call
Expect to be FCF negative
Cash interest: ~€130 million
Cash taxes: ~€20-25 million
Minimal cash impact from the U.S.
Tax Cuts and Jobs Act of 2017
Expect working capital investments
related to the ramp up our growth
projects
Capex: €275 million
FX Rate Sensitivity (+0.10 USD/EUR)
FCF: minimal
Adjusted EBITDA: ~€(15) million
Significant improvement in Free Cash
Flow; €159 million better than 2016
Increased Adjusted EBITDA, lower
trade working capital and reduced
capital expenditures
FCF – Current 2018 Expectations
Free Cash Flow
14
FY
2017
FY
2016
Net cash flows from operating
activities160 88
Purchases of property, plant and
equipment(276) (355)
Equity contributions and loans to
joint-ventures(41) (37)
Other investing activities 23 11
Free Cash Flow (134) (293)
€ in millions
Solid improvement in 2017; Targeting Free Cash Flow positive in 2019

Jean-Marc GermainChief Executive Officer

Fourth Quarter and Full Year 2017 – Earnings Call 16
End-market Updates
Automotive:
► North America: Slight decline in auto sales in
2017; Q4 rebound off summer lows
► Europe: Market grew in 2017; Q4 strong
► Demand for luxury cars, light trucks, and
SUVs remains strong
Aerospace:
► Sustained OEM build rates
► OEM backlogs remain near record highs
Packaging:
► Market remains stable
► BiW/ABS conversions expected to help
North American market balance over the
long term
► Conversion from steel to aluminium
driving growth in Europe
Other Markets
► Transportation, Industry and Defense
► Strong industry and defense markets
in Europe and North America
► North American transportation market
improving
► European Industry: Demand for extrusions
remains very strong across end markets

Fourth Quarter and Full Year 2017 – Earnings Call
Sale of Assets at Sierre
17
► Signed a binding agreement with Novelis to sell the North Building Assets of Sierre
plant in Switzerland, which have been leased and operated by Novelis since 2005, and
to contribute the plant’s shared infrastructure to a 50-50 joint venture
► No impact to Constellium’s current production processes, including cast houses, plate
and extrusion manufacturing plants, and other manufacturing assets
► Constellium and Novelis agreed to enter into long-term production and metal supply
agreements
► Transaction closing expected in Q2 2018, subject to customary closing conditions
► Total purchase price of €200 million

Fourth Quarter and Full Year 2017 – Earnings Call
Financial Guidance and Outlook
18
► High single digit Adjusted EBITDA growth in 2018
► High single digit Adjusted EBITDA growth annually through 2020, leading to over €500
million of Adjusted EBITDA in 2020
► Targeting positive Free Cash Flow in 2019
► Net Debt / Adjusted EBITDA target of below 4.0x
Focused on delivering on our strategy and increasing shareholder value

Fourth Quarter and Full Year 2017 – Earnings Call
Q&A
19

Fourth Quarter and Full Year 2017 – Earnings Call
Appendix
20

Fourth Quarter and Full Year 2017 – Earnings Call
Shipments by Product Line (000’s metric tons)
21
Three months
ended
December 31,
2017
Three months
ended
December 31,
2016
Year ended
December 31,
2017
Year ended
December 31,
2016
Packaging rolled products 185 198 807 856
Automotive rolled products 44 28 158 113
Specialty and other thin-rolled products 9 10 43 44
Aerospace rolled products 26 30 106 118
Transportation, industry, and other
rolled products30 29 132 125
Automotive extruded products 26 23 109 99
Other extruded products 30 26 127 118
Other — — — (3)
Total 350 344 1,482 1,470
k metric tons

Fourth Quarter and Full Year 2017 – Earnings Call
IFRS – Income Statement
Three months
ended
December 31,
2017
Three months
ended
December 31,
2016
Year ended
December
31, 2017
Year ended
December
31, 2016
Revenue 1,248 1,161 5,237 4,743
Income from operations 68 29 321 246
Finance costs – net (116) (37) (243) (167)
Share of loss of joint-ventures (8) (6) (29) (14)
Income / (loss) before income tax (56) (14) 49 65
Income tax expense (24) (6) (80) (69)
Net loss (80) (20) (31) (4)
22
€ millions

Fourth Quarter and Full Year 2017 – Earnings Call
IFRS – Statement of Financial Position
At December
31, 2017
At December
31, 2016
Current assets 1,400 1,410
Non-current assets 2,311 2,377
Total Assets 3,711 3,787
Current liabilities 1,110 1,035
Non-current liabilities 2,920 3,322
Equity (319) (570)
Total Equity and Liabilities 3,711 3,787
23
€ millions

Fourth Quarter and Full Year 2017 – Earnings Call
Net Debt Reconciliation
December 31,
2017
September
30, 2017
June 30,
2017
March 31,
2017
December 31,
2016
Borrowings 2,127 2,257 2,326 2,433 2,468
Fair value of cross currency
basis swaps, net of margin calls32 31 11 (38) (77)
Cash and cash equivalents (269) (300) (286) (309) (347)
Cash pledged for issuance of
guarantees(1) (1) (7) (9) (9)
Net Debt 1,889 1,987 2,044 2,077 2,035
LTM Adjusted EBITDA 431 412 398 378 377
Leverage 4.4x 4.8x 5.1x 5.5x 5.4x
24
€ millions

Fourth Quarter and Full Year 2017 – Earnings Call
Reconciliation of Net Income to Adjusted EBITDA
25
€ millions
Three
months
ended
December 31,
2017
Three
months
ended
December 31,
2016
Year ended
December 31,
2017
Year ended
December 31,
2016
Net loss (80) (20) (31) (4)
Income tax expense 24 6 80 69
Income / (loss) before income tax (56) (14) 49 65
Finance costs – net 116 37 243 167
Share of loss of joint-ventures 8 6 29 14
Income from operations 68 29 321 246
Depreciation and amortization 46 46 171 155
Restructuring costs 1 — 4 5
Unrealized losses / (gains) on derivatives (17) (6) (57) (71)
Unrealized exchange losses / (gains) from remeasurement of monetary assets
and liabilities – net1 (2) 4 (3)
Loss / (gain) on pension plan amendments — — (20) —
Share based compensation 2 1 8 6
Metal price lag (6) (7) (22) (4)
Start-up and development costs 3 9 17 25
Manufacturing system and process transformation costs 1 1 2 5
Wise integration and acquisition costs — — — 2
Wise one-time costs — — — 20
Wise purchase price adjustment — (1) — (20)
Losses on disposals 1 10 3 10
Other — 1 — 1
Adjusted EBITDA 100 81 431 377

Fourth Quarter and Full Year 2017 – Earnings Call
Reconciliation of Net Income to Adjusted EBITDA
26
€ millions
Twelve months
ended
September 30,
2017
Twelve months
ended
June 30, 2017
Twelve months
ended
March 31, 2017
Net income 29 23 17
Income tax expense 62 63 77
Income before income tax 91 86 94
Finance costs – net 164 175 180
Share of loss of joint-ventures 27 25 19
Income from operations 282 286 293
Depreciation and amortization 171 167 164
Restructuring costs 3 3 7
Unrealized losses / (gains) on derivatives (46) (36) (69)
Unrealized exchange losses / (gains) from remeasurement of monetary assets and liabilities
– net1 4 —
Loss / (gain) on pension plan amendments (20) (22) (22)
Share based compensation 7 6 7
Metal price lag (23) (29) (20)
Start-up and development costs 23 22 25
Manufacturing system and process transformation costs 2 2 2
Wise integration and acquisition costs — — —
Wise one-time costs — — —
Wise purchase price adjustment (1) (20) (20)
Losses on disposals 12 12 11
Other 1 3 —
Adjusted EBITDA 412 398 378

Fourth Quarter and Full Year 2017 – Earnings Call
Borrowings Table
27
€ millions December 31,
2017
December 31,
2016
Nominal
Value in
Currency
Nominal
Rate
Effective
Rate
Nominal
Value in
Euros
(Arrangement
fees)
Accrued
Interests
Carrying
Value
Carrying
Value
Secured ABL
Ravenswood (due 2018) — Floating — — — — — 46
Muscle Shoals (due 2020) — Floating — — — — — —
Pan US (due 2022) $78 Floating 3.79% 65 — — 65 —
Secured Inventory Based Facility
(due 2019) — Floating — — — — — —
Senior Secured Notes
Constellium N.V. (Issued March 2016, due 2021) $425 7.88% 8.94% — — — — 401
Muscle Shoals $650 8.75% 7.45% — — — — 635
Senior Unsecured Notes
Constellium N.V. (Issued May 2014, due 2024) $400 5.75% 6.26% 334 (4) 2 332 377
Constellium N.V. (Issued May 2014, due 2021) €300 4.63% 5.16% 300 (4) 2 298 298
Constellium N.V. (Issued December 2014, due 2023) $400 8.00% 8.61% — — — — 387
Constellium N.V. (Issued December 2014, due 2023) €240 7.00% 7.54% — — — — 244
Constellium N.V. (Issued February 2017, due 2025) $650 6.63% 7.13% 542 (13) 12 541 —
Constellium N.V. (Issued November 2017, due 2026) $500 5.88% 6.26% 417 (8) 4 413 —
Constellium N.V. (Issued November 2017, due 2026) €400 4.25% 4.57% 400 (7) 2 395 —
Other loans (including Finance leases) 82 — 1 83 80
Total Borrowings 2,140 (36) 23 2,127 2,468
Of which non-current 2,021 2,361
Of which current 106 107