Embed Size (px)
Citation preview

S ECU RE LOG IST ICS. WORLDW ID E.
Fourth-Quarter& Full-Year 2017
Fe b ruary 7 , 2018
Safe Harbor Statement and Non-GAAP Results
These materials contain forward-looking information. Words such as "anticipate," "assume," "estimate," "expect," “target” "project," "predict," "intend," "plan," "believe," "potential," "may," "should" and similar expressions may identify forward-looking information. Forward-looking information in these materials includes, but is not limited to information regarding: 2018 non-GAAP outlook, including revenue, operating profit, margin rate, earnings per share, capital expenses and adjusted EBITDA; 2019 adjusted EBITDA target; expected results from breakthrough initiatives; 2018 and 2019 margin rate targets for the U.S. business; expected impact of U.S. Tax Reform; expected contributions to the U.S. pension plan, forecasted weighted average cost of debt, leverage outlook and future investment in and results of acquisitions.
Forward-looking information in this document is subject to known and unknown risks, uncertainties and contingencies, which are difficult to predict or quantify, and which could cause actual results, performance or achievements to differ materially from those that are anticipated. These risks, uncertainties and contingencies, many of which are beyond our control, include, but are not limited to: our ability to improve profitability and execute further cost and operational improvement and efficiencies in our core businesses; our ability to improve service levels and quality in our core businesses; market volatility and commodity price fluctuations; seasonality, pricing and other competitive industry factors; investment in information technology and its impact on revenue and profit growth; our ability to maintain an effective IT infrastructure and safeguard confidential information; our ability to effectively develop and implement solutions for our customers; risks associated with operating in foreign countries, including changing political, labor and economic conditions, regulatory issues, currency restrictions and devaluations, restrictions on and cost of repatriating earnings and capital, impact on the Company’s financial results as a result of jurisdictions determined to be highly inflationary, and restrictive government actions, including nationalization; labor issues, including negotiations with organized labor and work stoppages; the strength of the U.S. dollar relative to foreign currencies and foreign currency exchange rates; our ability to identify, evaluate and complete acquisitions and other strategic transactions (including those in the home security industry) and to successfully integrate acquired companies; costs related to dispositions and market exits; our ability to obtain appropriate insurance coverage, positions taken by insurers relative to claims and the financial condition of insurers; safety and security performance and loss experience; employee, environmental and other liabilities in connection with former coal operations, including black lung claims ; the impact of the Patient Protection and Affordable Care Act on legacy liabilities and ongoing operations; funding requirements, accounting treatment, and investment performance of our pension plans, the VEBA and other employee benefits; changes to estimated liabilities and assets in actuarial assumptions; the nature of hedging relationships and counterparty risk; access to the capital and credit markets; our ability to realize deferred tax assets; the outcome of pending and future claims, litigation, and administrative proceedings; public perception of our business, reputation and brand; changes in estimates and assumptions underlying critical accounting policies; the promulgation and adoption of new accounting standards, new government regulations and interpretation of existing standards and regulations.
This list of risks, uncertainties and contingencies is not intended to be exhaustive. Additional factors that could cause our results to differ materially from those described in the forward-looking statements can be found under "Risk Factors" in Item 1A of our Annual Report on Form 10-K for the period ended December 31, 2016, and in our other public filings with the Securities and Exchange Commission. The forward-looking information discussed today and included in these materials is representative as of today only and The Brink's Company undertakes no obligation to update any information contained in this document.
These materials are copyrighted and may not be used without written permission from Brink's.
Today’s presentation is focused primarily on non-GAAP results. Detailed reconciliations of non-GAAP to GAAP results are included in the appendix and in the Fourth Quarter 2017 Earnings Release available in the Quarterly Results section of the Brink’s website: www.brinks.com.
2
CEO Overview
Doug Pertz
CEO OverviewToday’s Agenda
• Strong 4Q and 2017 non-GAAP results
• Outlook – increased 2018 and 2019 targets
• Strong U.S. results – “breakthrough initiatives” on track
• Strategy – organic growth + core acquisitions driving shareholder value
• Financial review and tax reform
• Questions
4
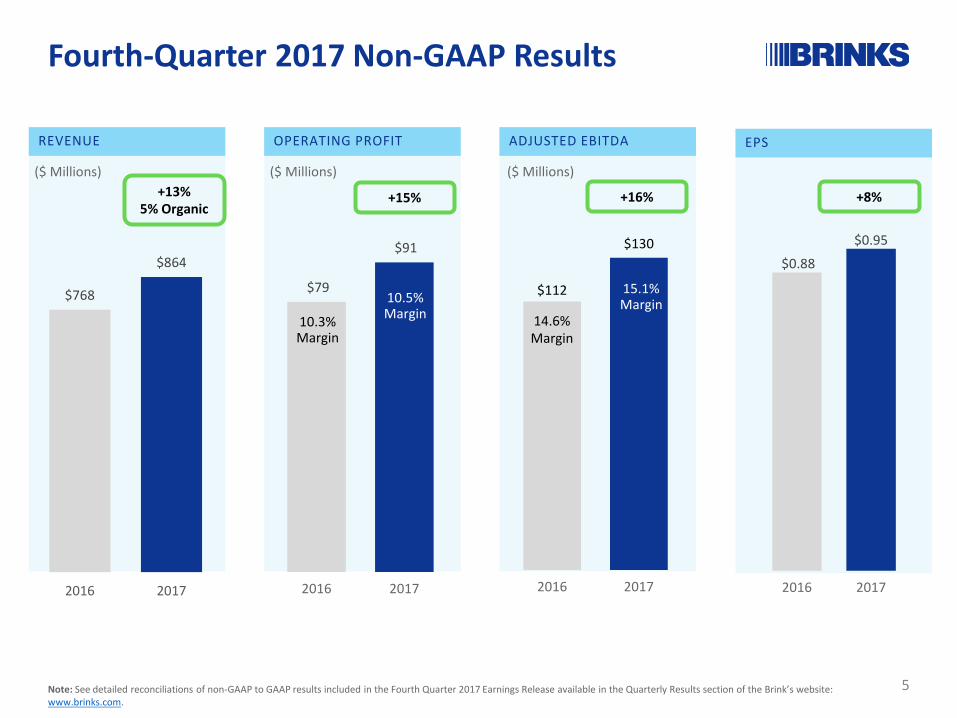
Fourth-Quarter 2017 Non-GAAP Results
($ in millions)
$768
$864
2016 2017
REVENUE
($ Millions)+13%
5% Organic
$79
$91
2016 2017
10.3%Margin
OPERATING PROFIT
10.5% Margin
ADJUSTED EBITDA
$112
$130
2016 2017
14.6%Margin
15.1%Margin
($ Millions)
EPS
$0.88
$0.95
2016 2017
($ Millions)
+15%
5
+16% +8%
Note: See detailed reconciliations of non-GAAP to GAAP results included in the Fourth Quarter 2017 Earnings Release available in the Quarterly Results section of the Brink’s website: www.brinks.com.
OPERATING PROFIT
8.2% Margin
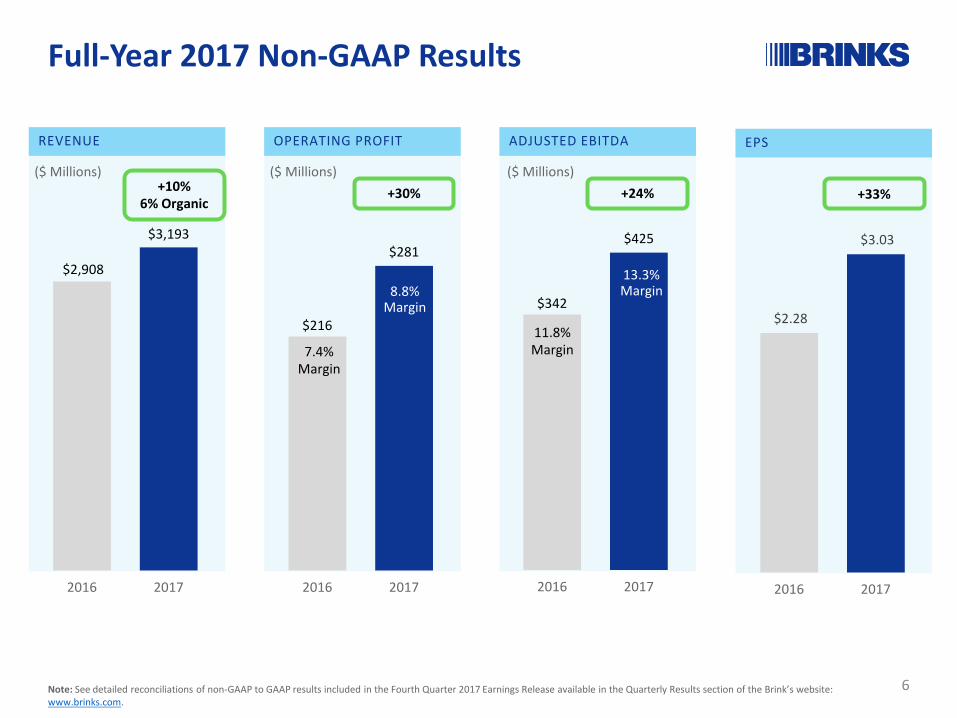
Full-Year 2017 Non-GAAP Results
REVENUE
($ Millions)
ADJUSTED EBITDA
($ Millions)
EPS
($ Millions)+24% +33%
$2,908
$3,193
2016 2017
$216
$281
2016 2017
7.4%Margin
8.8%Margin $342
$425
2016 2017
11.8%Margin
13.3%Margin
$2.28
$3.03
2016 2017
+10%6% Organic
+30%
6Note: See detailed reconciliations of non-GAAP to GAAP results included in the Fourth Quarter 2017 Earnings Release available in the Quarterly Results section of the Brink’s website: www.brinks.com.
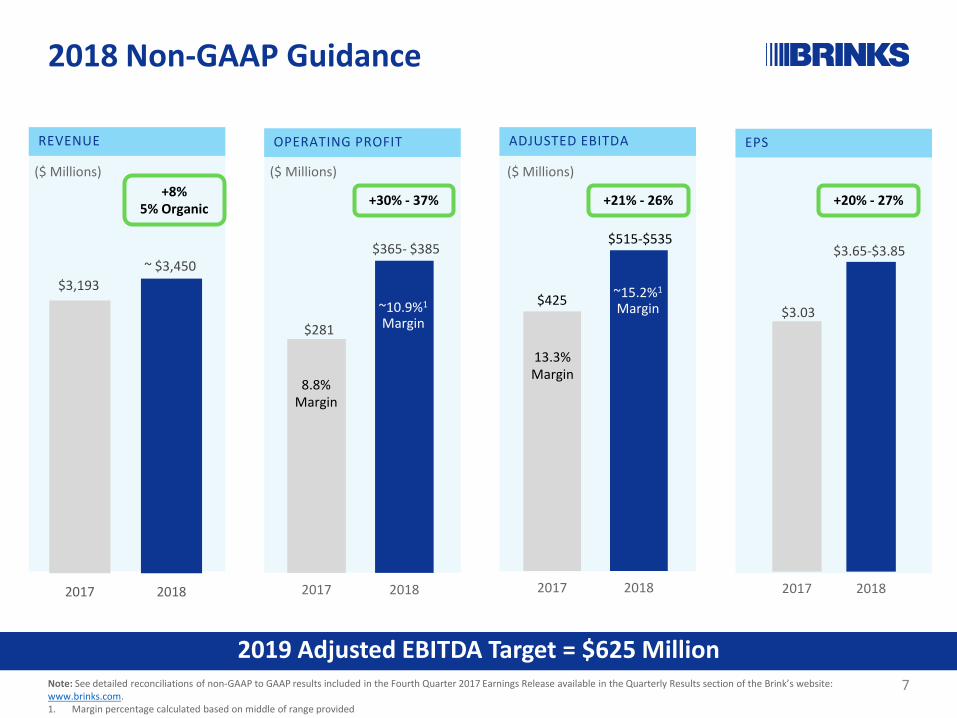
2018 Non-GAAP Guidance
($ in millions)
$3,193 ~ $3,450
2017 2018
REVENUE
($ Millions)+8%
5% Organic
$281
$365- $385
2017 2018
OPERATING PROFIT
~10.9%1
Margin
ADJUSTED EBITDA
$425
$515-$535
2017 2018
13.3%Margin
~15.2%1
Margin
($ Millions)
EPS
$3.03
$3.65-$3.85
2017 2018
($ Millions)
+30% - 37% +21% - 26% +20% - 27%
2019 Adjusted EBITDA Target = $625 Million
8.8%Margin
7Note: See detailed reconciliations of non-GAAP to GAAP results included in the Fourth Quarter 2017 Earnings Release available in the Quarterly Results section of the Brink’s website: www.brinks.com. 1. Margin percentage calculated based on middle of range provided
8
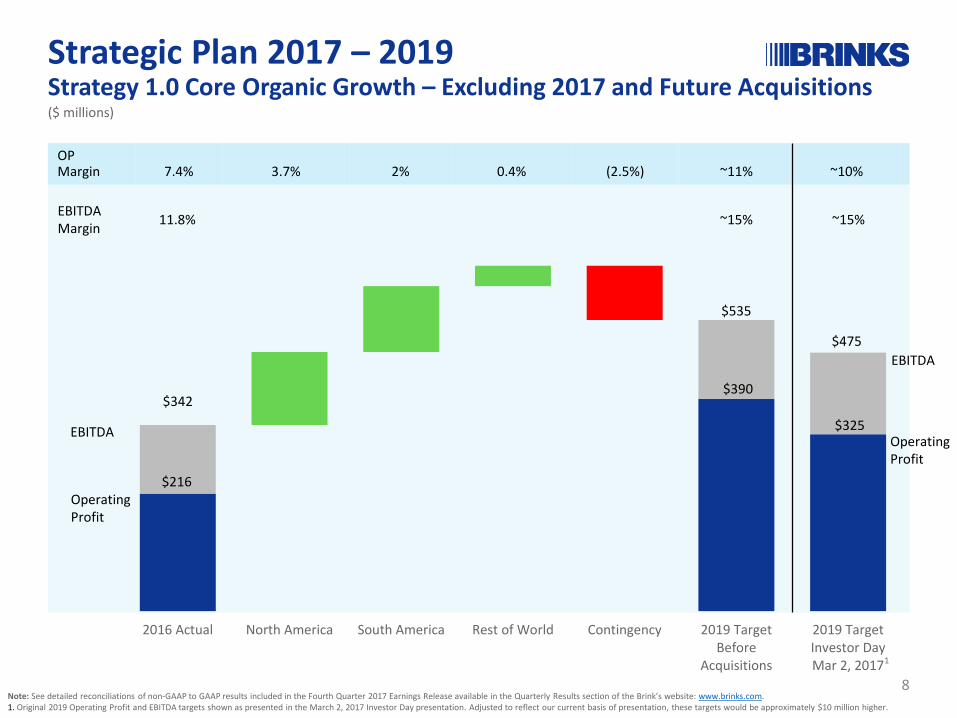
($ millions)
OPMargin 7.4% 3.7% 2% 0.4% (2.5%) ~11% ~10%
$216
$390
$325
2016 Actual North America South America Rest of World Contingency 2019 TargetBefore
Acquisitions
2019 TargetInvestor DayMar 2, 2017
EBITDAMargin 11.8% ~15%
$535
EBITDA
Operating Profit
Note: See detailed reconciliations of non-GAAP to GAAP results included in the Fourth Quarter 2017 Earnings Release available in the Quarterly Results section of the Brink’s website: www.brinks.com. 1. Original 2019 Operating Profit and EBITDA targets shown as presented in the March 2, 2017 Investor Day presentation. Adjusted to reflect our current basis of presentation, these targets would be approximately $10 million higher.
EBITDA
Operating Profit
$342
Strategic Plan 2017 – 2019Strategy 1.0 Core Organic Growth – Excluding 2017 and Future Acquisitions
$475
~15%
1
9
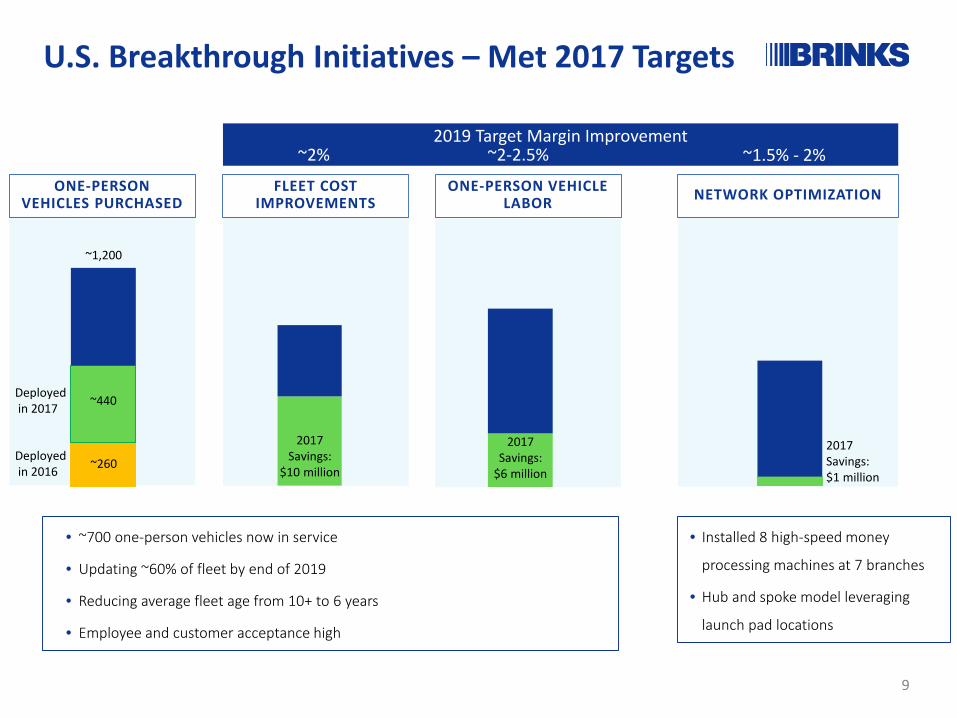
FLEET COST IMPROVEMENTS
ONE-PERSON VEHICLES PURCHASED
ONE-PERSON VEHICLE LABOR
• ~700 one-person vehicles now in service
• Updating ~60% of fleet by end of 2019
• Reducing average fleet age from 10+ to 6 years
• Employee and customer acceptance high
2017 Savings:
$10 million
NETWORK OPTIMIZATION
2017 Savings: $1 million
• Installed 8 high-speed money
processing machines at 7 branches
• Hub and spoke model leveraging
launch pad locations
U.S. Breakthrough Initiatives – Met 2017 Targets
2017 Savings:
$6 million
~1,200
2019 Target Margin Improvement~2% ~2-2.5% ~1.5% - 2%
Deployedin 2017
Deployedin 2016
~440
~260
10
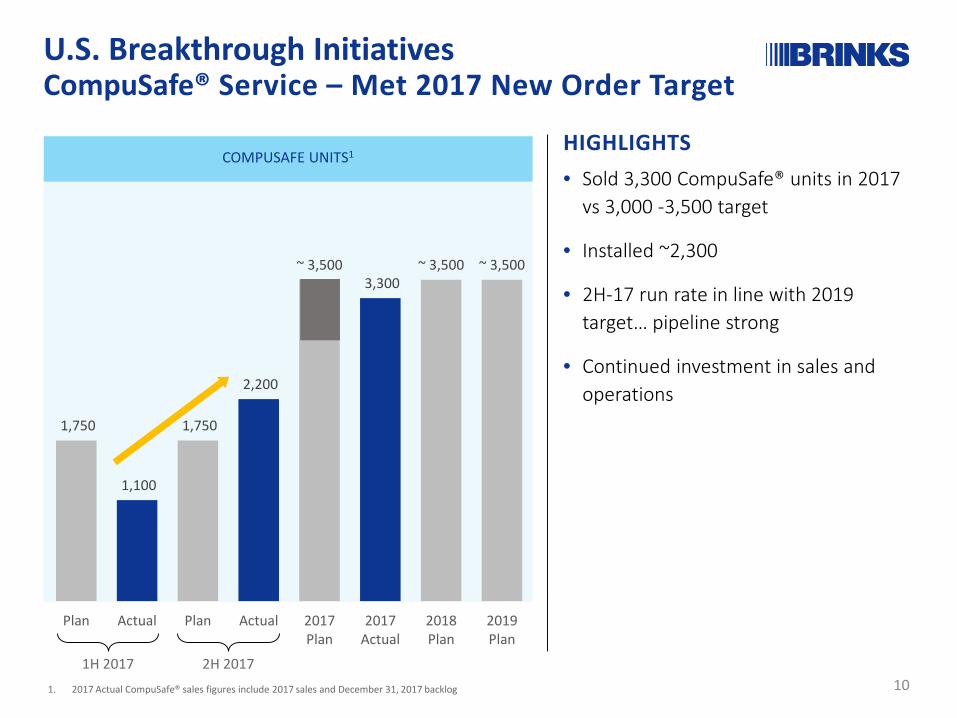
U.S. Breakthrough InitiativesCompuSafe® Service – Met 2017 New Order Target
HIGHLIGHTS• Sold 3,300 CompuSafe® units in 2017
vs 3,000 -3,500 target
• Installed ~2,300
• 2H-17 run rate in line with 2019 target… pipeline strong
• Continued investment in sales and operations
COMPUSAFE UNITS1
1,750
1,100
1,750
2,200
~ 3,500 3,300
~ 3,500 ~ 3,500
Plan Actual Plan Actual 2017Plan
2017Actual
2018Plan
2019Plan
1H 2017 2H 20171. 2017 Actual CompuSafe® sales figures include 2017 sales and December 31, 2017 backlog
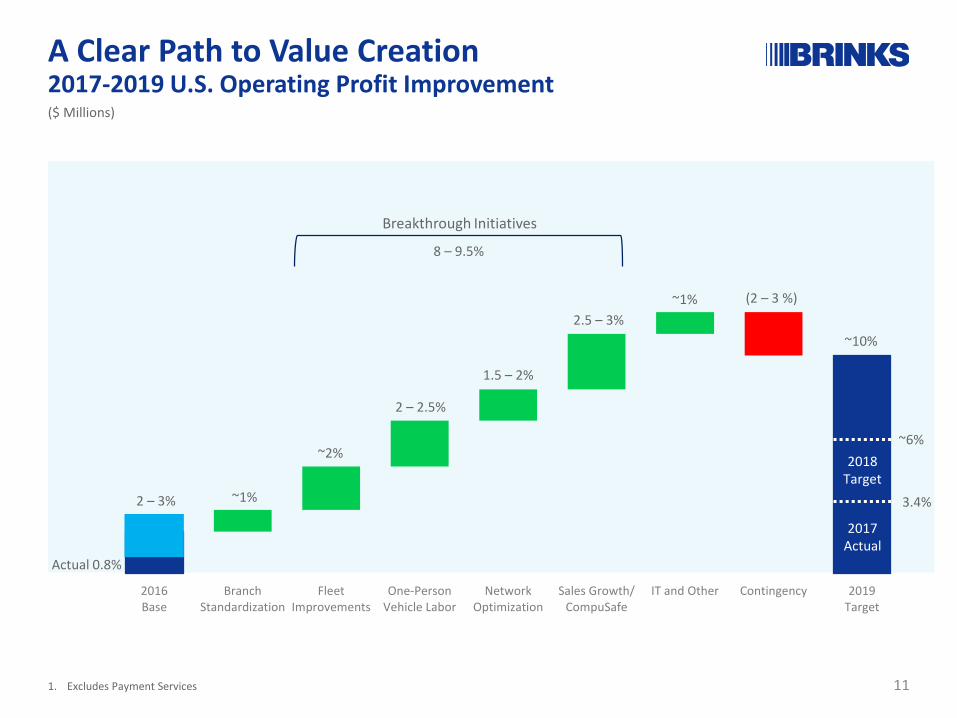
2016Base
BranchStandardization
FleetImprovements
One-PersonVehicle Labor
NetworkOptimization
Sales Growth/CompuSafe
IT and Other Contingency 2019Target
11
Actual 0.8%
~10%
Breakthrough Initiatives
1. Excludes Payment Services
(2 – 3 %)~1%
2 – 2.5%
~2%
~1%2 – 3%
($ Millions)
1.5 – 2%
2.5 – 3%
3.4%
2017Actual
A Clear Path to Value Creation2017-2019 U.S. Operating Profit Improvement
8 – 9.5%
~6%2018
Target
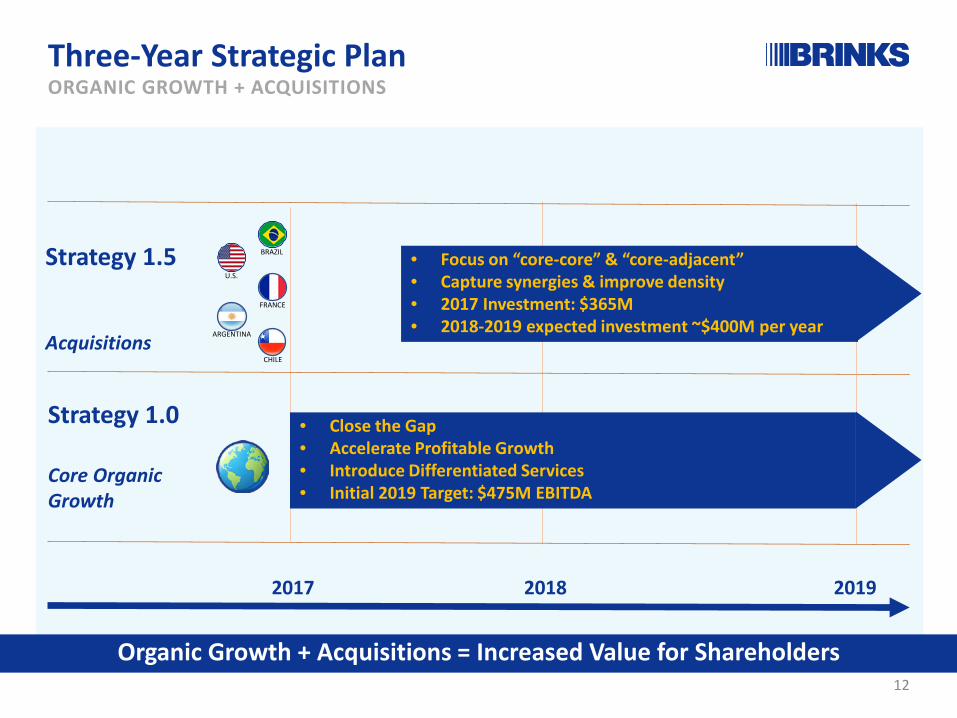
Three-Year Strategic Plan ORGANIC GROWTH + ACQUISITIONS
Strategy 1.0
Core Organic Growth
20182017 2019
12
• Focus on “core-core” & “core-adjacent”• Capture synergies & improve density • 2017 Investment: $365M• 2018-2019 expected investment ~$400M per year
• Close the Gap• Accelerate Profitable Growth• Introduce Differentiated Services• Initial 2019 Target: $475M EBITDA
Organic Growth + Acquisitions = Increased Value for Shareholders
U.S.
BRAZIL
CHILE
ARGENTINA
FRANCE
Strategy 1.5
Acquisitions
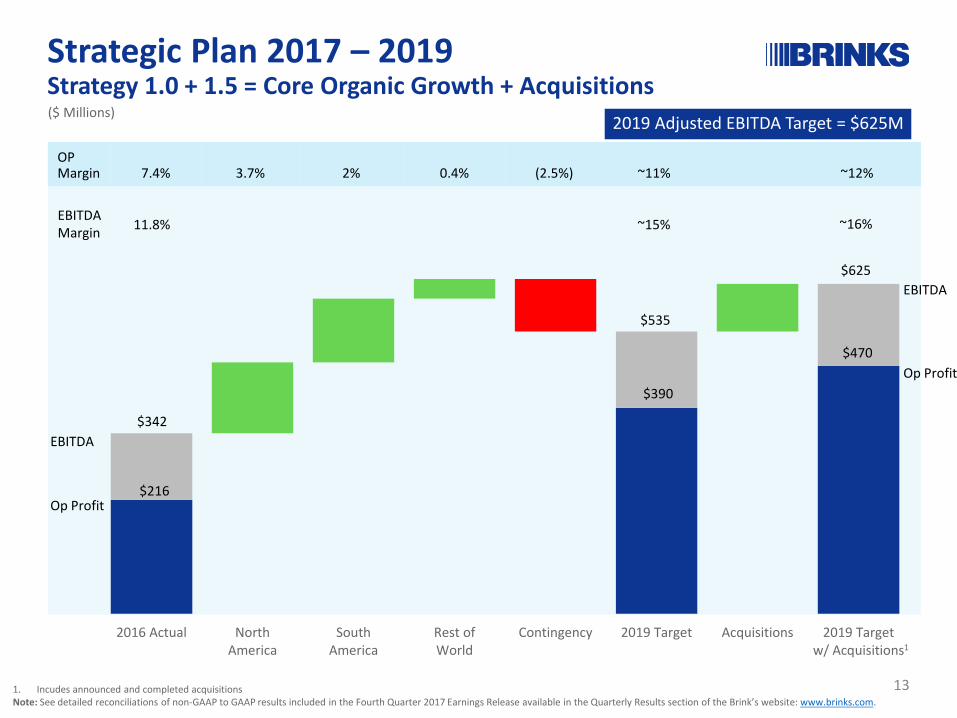
OPMargin 7.4% 3.7% 2% 0.4% (2.5%) ~11% ~12%
13
$216
$390
$470
2016 Actual NorthAmerica
SouthAmerica
Rest ofWorld
Contingency 2019 Target Acquisitions 2019 Targetw/ Acquisitions
($ Millions)
EBITDAMargin 11.8% ~15% ~16%
$625
$535
EBITDA
Op Profit
EBITDA
Op Profit
1. Incudes announced and completed acquisitionsNote: See detailed reconciliations of non-GAAP to GAAP results included in the Fourth Quarter 2017 Earnings Release available in the Quarterly Results section of the Brink’s website: www.brinks.com.
$342
2019 Adjusted EBITDA Target = $625M
Strategic Plan 2017 – 2019Strategy 1.0 + 1.5 = Core Organic Growth + Acquisitions
1

Ron DomanicoFinancial Review
($ Millions)
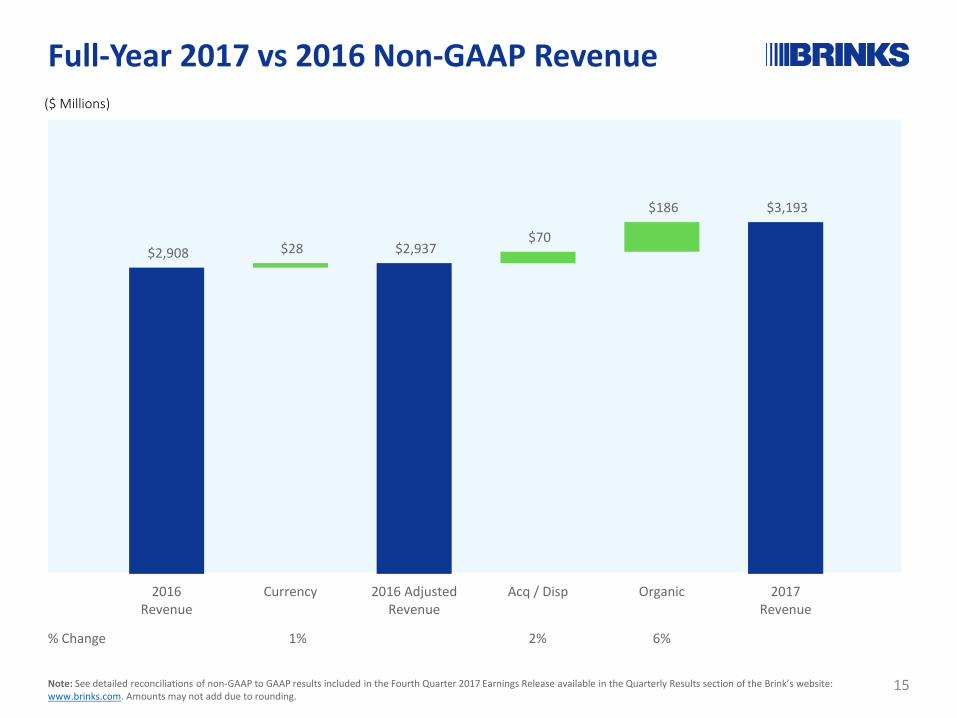
1% 6%2%% Change
Full-Year 2017 vs 2016 Non-GAAP Revenue
$2,908 $28 $2,937 $70
$186 $3,193
2016Revenue
Currency 2016 AdjustedRevenue
Acq / Disp Organic 2017Revenue
15Note: See detailed reconciliations of non-GAAP to GAAP results included in the Fourth Quarter 2017 Earnings Release available in the Quarterly Results section of the Brink’s website: www.brinks.com. Amounts may not add due to rounding.
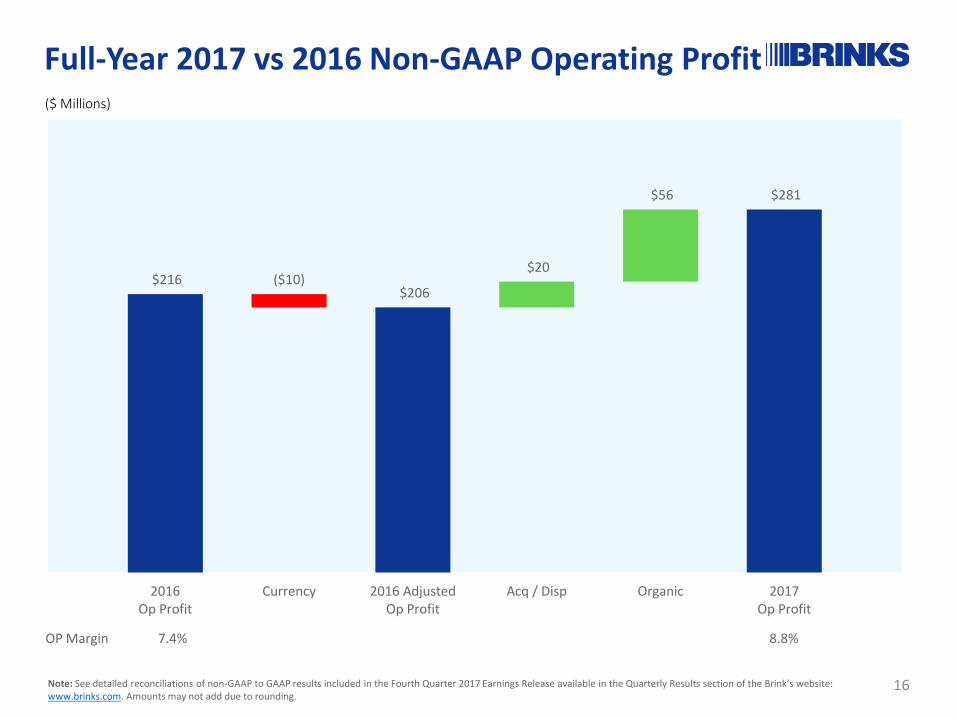
7.4% 8.8%OP Margin
Full-Year 2017 vs 2016 Non-GAAP Operating Profit($ Millions)
16Note: See detailed reconciliations of non-GAAP to GAAP results included in the Fourth Quarter 2017 Earnings Release available in the Quarterly Results section of the Brink’s website: www.brinks.com. Amounts may not add due to rounding.
$216 ($10)$206
$20
$56 $281
2016Op Profit
Currency 2016 AdjustedOp Profit
Acq / Disp Organic 2017Op Profit
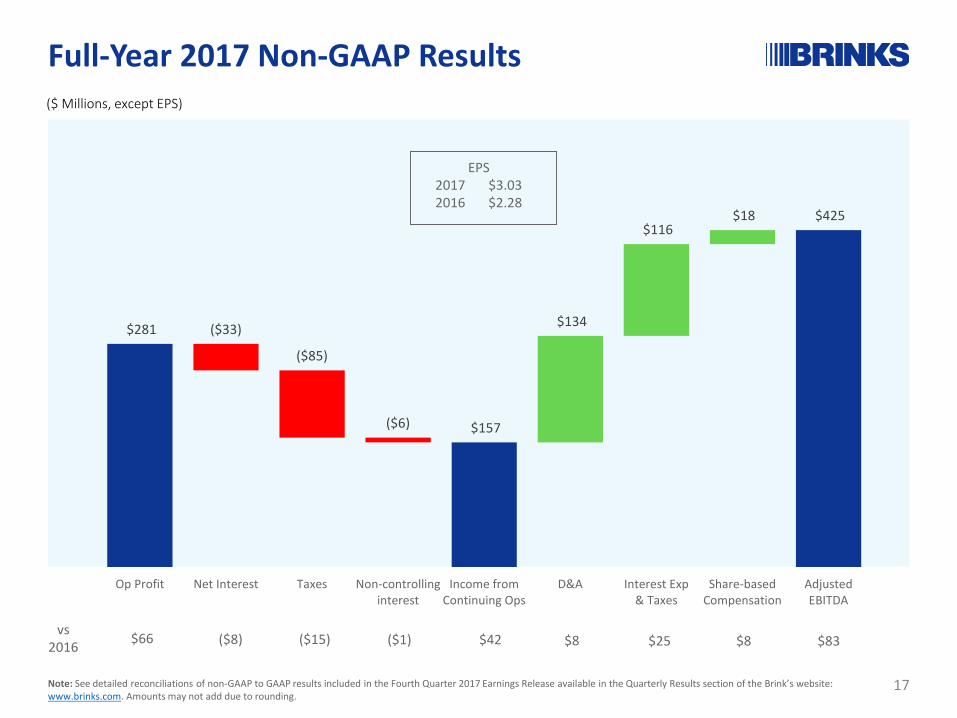
$281 ($33)
($85)
($6) $157
$134
$116 $18 $425
Op Profit Net Interest Taxes Non-controllinginterest
Income fromContinuing Ops
D&A Interest Exp& Taxes
Share-basedCompensation
AdjustedEBITDA
($ Millions, except EPS)
EPS2017 $3.032016 $2.28
($8) ($15)$66 $42 $8($1) $25 $83vs
2016
Full-Year 2017 Non-GAAP Results
$8
17Note: See detailed reconciliations of non-GAAP to GAAP results included in the Fourth Quarter 2017 Earnings Release available in the Quarterly Results section of the Brink’s website: www.brinks.com. Amounts may not add due to rounding.
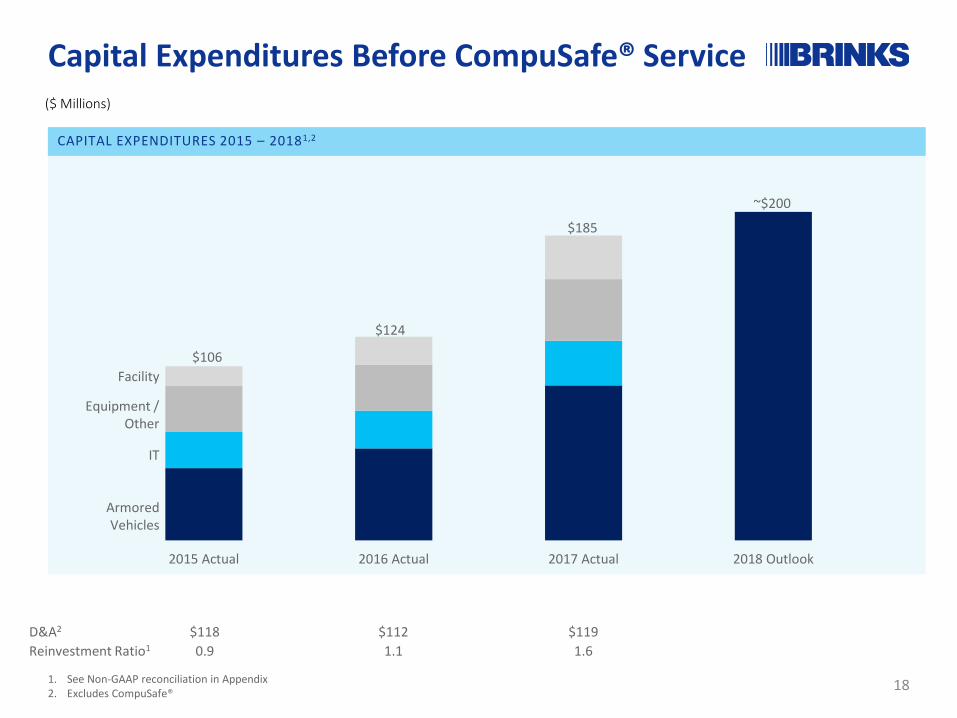
2015 Actual 2016 Actual 2017 Actual 2018 Outlook
Capital Expenditures Before CompuSafe® Service
18
CAPITAL EXPENDITURES 2015 – 20181,2
Facility
Equipment / Other
IT
ArmoredVehicles
D&A2 $118 $112 $119Reinvestment Ratio1 0.9 1.1 1.6
$124
1. See Non-GAAP reconciliation in Appendix2. Excludes CompuSafe®
$106
($ Millions)
$185
~$200
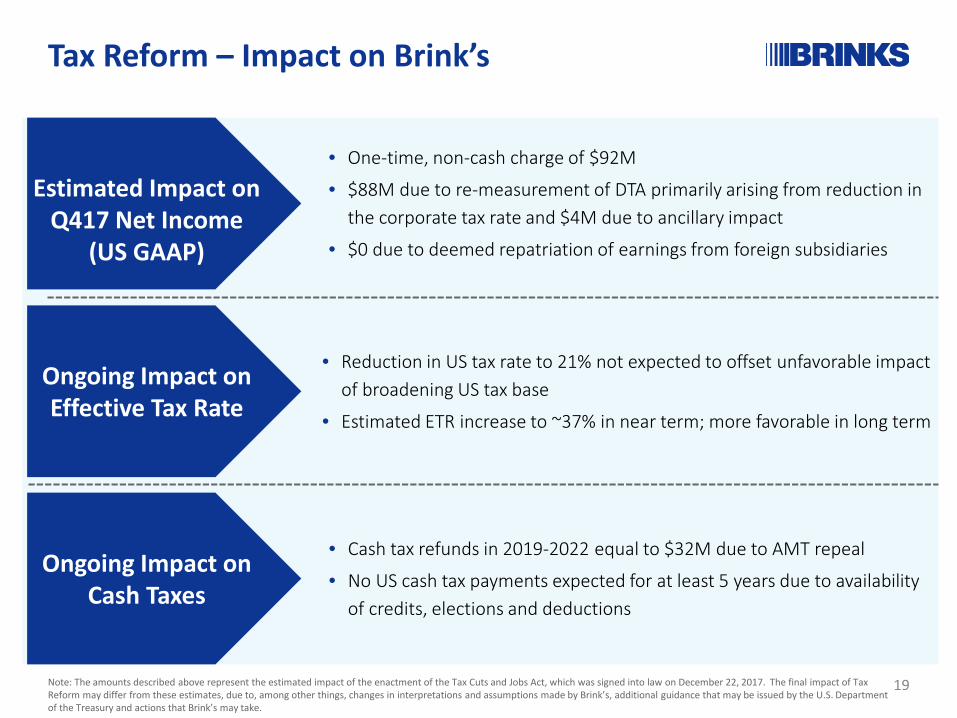
Tax Reform – Impact on Brink’s
19Note: The amounts described above represent the estimated impact of the enactment of the Tax Cuts and Jobs Act, which was signed into law on December 22, 2017. The final impact of Tax Reform may differ from these estimates, due to, among other things, changes in interpretations and assumptions made by Brink’s, additional guidance that may be issued by the U.S. Department of the Treasury and actions that Brink’s may take.
Estimated Impact onQ417 Net Income
(US GAAP)
Ongoing Impact onEffective Tax Rate
Ongoing Impact onCash Taxes
• One-time, non-cash charge of $92M
• $88M due to re-measurement of DTA primarily arising from reduction in the corporate tax rate and $4M due to ancillary impact
• $0 due to deemed repatriation of earnings from foreign subsidiaries
• Reduction in US tax rate to 21% not expected to offset unfavorable impact of broadening US tax base
• Estimated ETR increase to ~37% in near term; more favorable in long term
• Cash tax refunds in 2019-2022 equal to $32M due to AMT repeal
• No US cash tax payments expected for at least 5 years due to availability of credits, elections and deductions
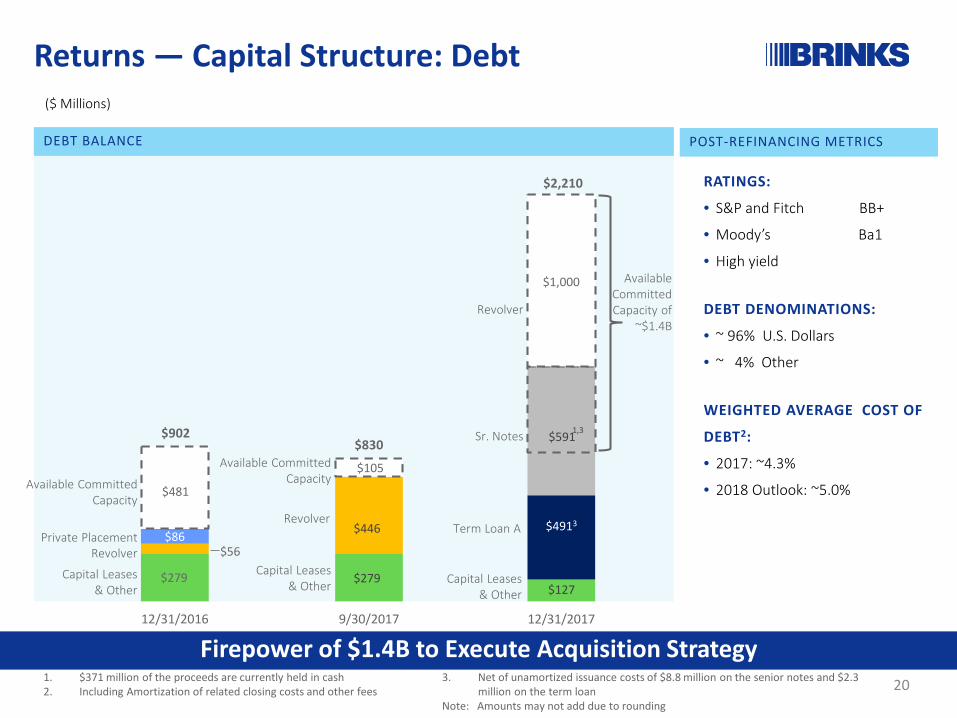
$1,000
12/31/2017
Returns — Capital Structure: Debt
DEBT BALANCE
RATINGS:
• S&P and Fitch BB+
• Moody’s Ba1
• High yield
DEBT DENOMINATIONS:
• ~ 96% U.S. Dollars
• ~ 4% Other
WEIGHTED AVERAGE COST OF
DEBT2:
• 2017: ~4.3%
• 2018 Outlook: ~5.0%$105
9/30/2017
Sr. Notes
Term Loan ARevolver
Revolver
$279
$56$86
12/31/2016
RevolverPrivate Placement
Available Committed Capacity
Capital Leases& Other
Capital Leases& Other
Available Committed Capacity
$902$830
$2,210
POST-REFINANCING METRICS
1. $371 million of the proceeds are currently held in cash2. Including Amortization of related closing costs and other fees
Capital Leases& Other
($ Millions)
Available Committed Capacity of
~$1.4B
$5911,3
Firepower of $1.4B to Execute Acquisition Strategy20
$481
$446
$279
$4913
$127
3. Net of unamortized issuance costs of $8.8 million on the senior notes and $2.3 million on the term loan
Note: Amounts may not add due to rounding
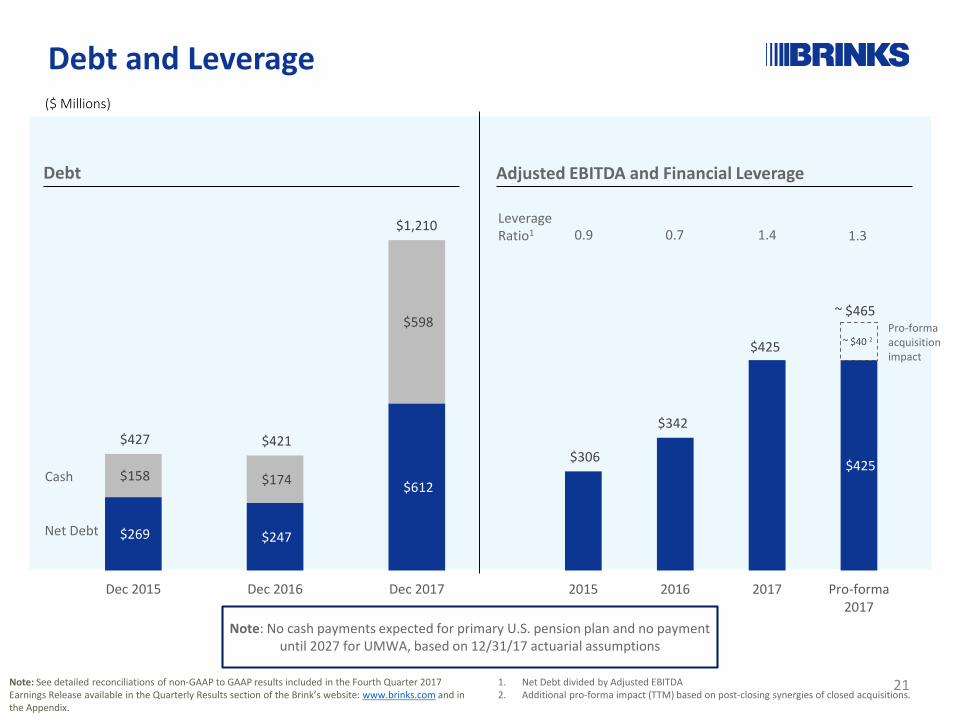
$425
~ $40 2
$306
$342
$425
~ $465
2015 2016 2017 Pro-forma2017
$269 $247
$612 $158 $174
$598
$427 $421
$1,210
Dec 2015 Dec 2016 Dec 2017
($ Millions)
LeverageRatio1 0.9 0.7 1.4
Note: No cash payments expected for primary U.S. pension plan and no payment until 2027 for UMWA, based on 12/31/17 actuarial assumptions
Cash
Net Debt
Debt Adjusted EBITDA and Financial Leverage
1. Net Debt divided by Adjusted EBITDA2. Additional pro-forma impact (TTM) based on post-closing synergies of closed acquisitions.
Debt and Leverage
21
1.3
Note: See detailed reconciliations of non-GAAP to GAAP results included in the Fourth Quarter 2017 Earnings Release available in the Quarterly Results section of the Brink’s website: www.brinks.com and in the Appendix.
Pro-forma acquisition impact
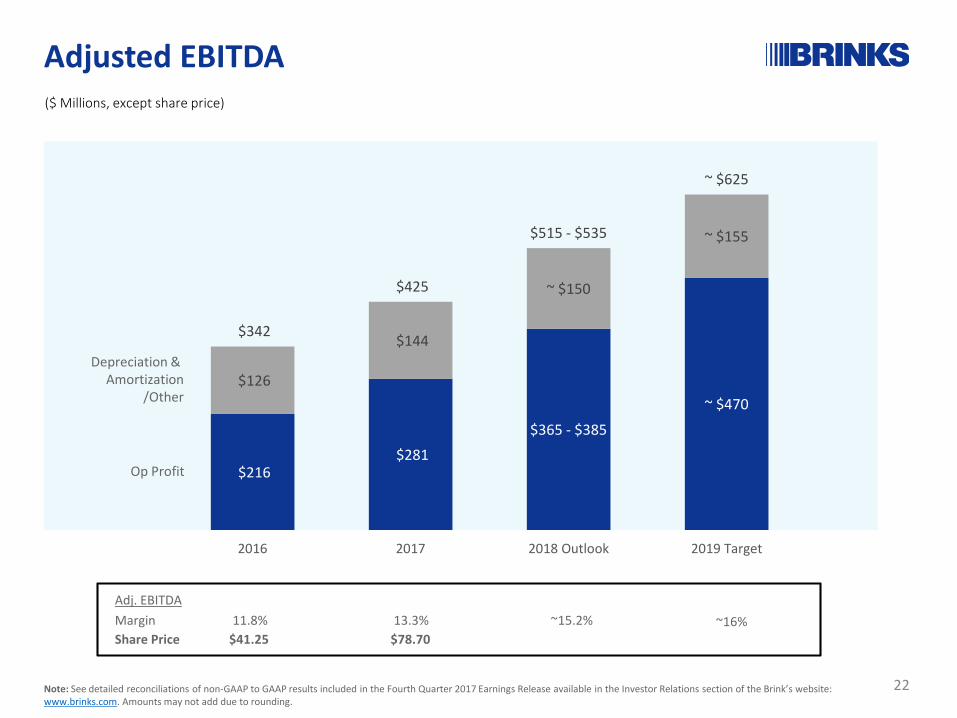
$216 $281
$365 - $385
~ $470 $126
$144
~ $150
~ $155
$342
$425
$515 - $535
~ $625
2016 2017 2018 Outlook 2019 Target
($ Millions, except share price)
11.8%Margin 13.3%Share Price $41.25
Adj. EBITDA
Adjusted EBITDA
22
Depreciation & Amortization
/Other
Op Profit
$78.70~15.2%
Note: See detailed reconciliations of non-GAAP to GAAP results included in the Fourth Quarter 2017 Earnings Release available in the Investor Relations section of the Brink’s website:www.brinks.com. Amounts may not add due to rounding.
~16%
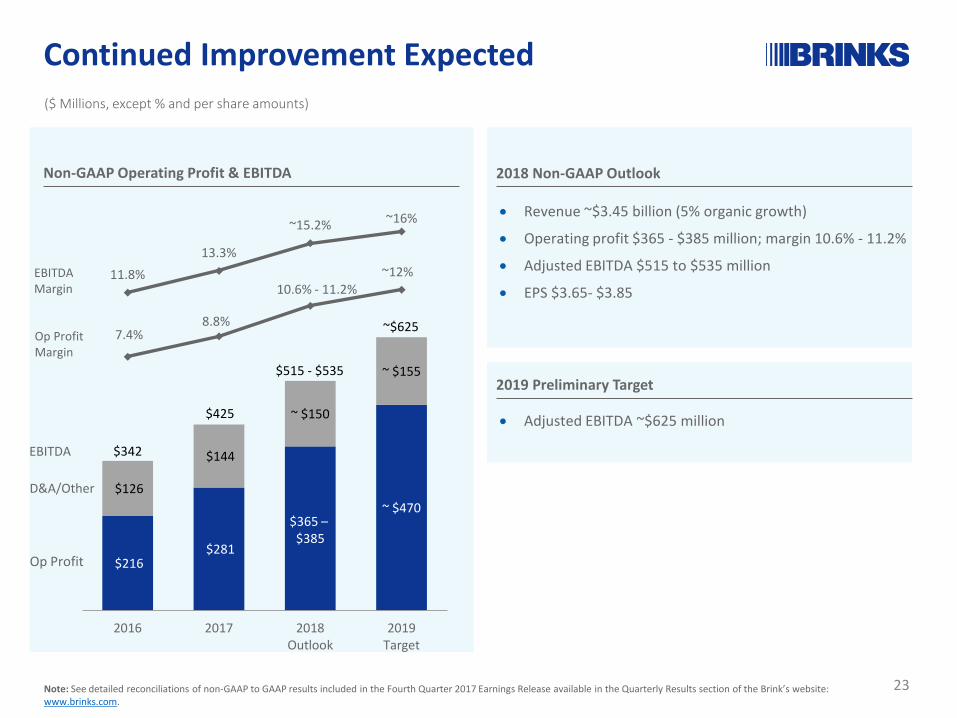
$216 $281
$365 –$385
~ $470 $126
$144
~ $150
~ $155
7.4%8.8%
10.6% - 11.2%~12%11.8%
13.3%
~15.2% ~16%
2016 2017 2018Outlook
2019Target
Continued Improvement Expected
Non-GAAP Operating Profit & EBITDA 2018 Non-GAAP Outlook
• Revenue ~$3.45 billion (5% organic growth)
• Operating profit $365 - $385 million; margin 10.6% - 11.2%
• Adjusted EBITDA $515 to $535 million
• EPS $3.65- $3.85
($ Millions, except % and per share amounts)
2019 Preliminary Target
• Adjusted EBITDA ~$625 million
23Note: See detailed reconciliations of non-GAAP to GAAP results included in the Fourth Quarter 2017 Earnings Release available in the Quarterly Results section of the Brink’s website: www.brinks.com.
$342
$425
$515 - $535
~$625
D&A/Other
Op Profit
EBITDA
EBITDAMargin
Op ProfitMargin

Appendix
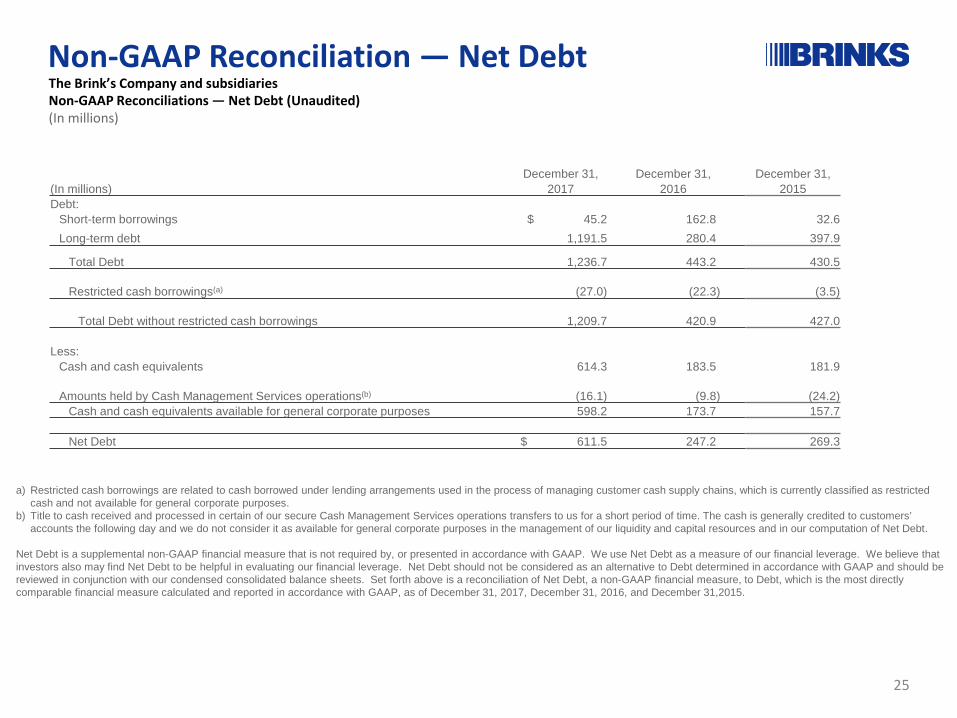
Non-GAAP Reconciliation — Net DebtThe Brink’s Company and subsidiariesNon-GAAP Reconciliations — Net Debt (Unaudited) (In millions)
a) Restricted cash borrowings are related to cash borrowed under lending arrangements used in the process of managing customer cash supply chains, which is currently classified as restricted cash and not available for general corporate purposes.
b) Title to cash received and processed in certain of our secure Cash Management Services operations transfers to us for a short period of time. The cash is generally credited to customers’ accounts the following day and we do not consider it as available for general corporate purposes in the management of our liquidity and capital resources and in our computation of Net Debt.
Net Debt is a supplemental non-GAAP financial measure that is not required by, or presented in accordance with GAAP. We use Net Debt as a measure of our financial leverage. We believe that investors also may find Net Debt to be helpful in evaluating our financial leverage. Net Debt should not be considered as an alternative to Debt determined in accordance with GAAP and should be reviewed in conjunction with our condensed consolidated balance sheets. Set forth above is a reconciliation of Net Debt, a non-GAAP financial measure, to Debt, which is the most directly comparable financial measure calculated and reported in accordance with GAAP, as of December 31, 2017, December 31, 2016, and December 31,2015.
December 31, December 31, December 31,(In millions) 2017 2016 2015Debt:
Short-term borrowings $ 45.2 162.8 32.6Long-term debt 1,191.5 280.4 397.9
Total Debt 1,236.7 443.2 430.5
Restricted cash borrowings(a) (27.0) (22.3) (3.5)
Total Debt without restricted cash borrowings 1,209.7 420.9 427.0
Less:Cash and cash equivalents 614.3 183.5 181.9
Amounts held by Cash Management Services operations(b) (16.1) (9.8) (24.2)Cash and cash equivalents available for general corporate purposes 598.2 173.7 157.7
Net Debt $ 611.5 247.2 269.3
25
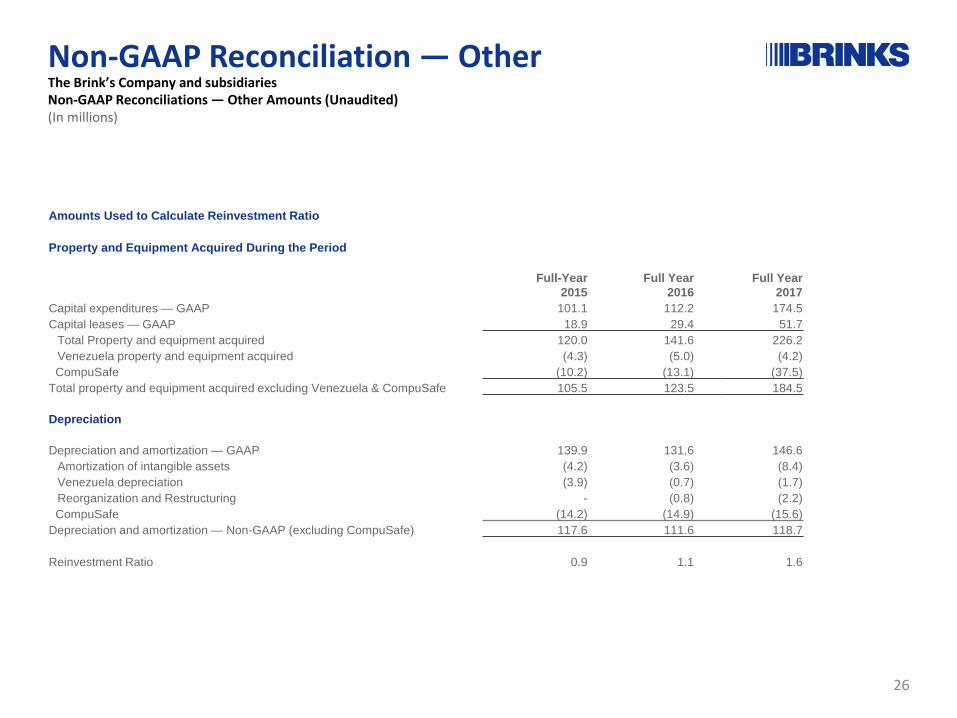
Non-GAAP Reconciliation — OtherThe Brink’s Company and subsidiariesNon-GAAP Reconciliations — Other Amounts (Unaudited) (In millions)
Amounts Used to Calculate Reinvestment Ratio
Property and Equipment Acquired During the Period
Full-Year2015
Full Year2016
Full Year2017
Capital expenditures — GAAP 101.1 112.2 174.5Capital leases — GAAP 18.9 29.4 51.7
Total Property and equipment acquired 120.0 141.6 226.2Venezuela property and equipment acquired (4.3) (5.0) (4.2)CompuSafe (10.2) (13.1) (37.5)
Total property and equipment acquired excluding Venezuela & CompuSafe 105.5 123.5 184.5
Depreciation
Depreciation and amortization — GAAP 139.9 131.6 146.6Amortization of intangible assets (4.2) (3.6) (8.4)Venezuela depreciation (3.9) (0.7) (1.7)Reorganization and Restructuring - (0.8) (2.2)CompuSafe (14.2) (14.9) (15.6)
Depreciation and amortization — Non-GAAP (excluding CompuSafe) 117.6 111.6 118.7
Reinvestment Ratio 0.9 1.1 1.6
26
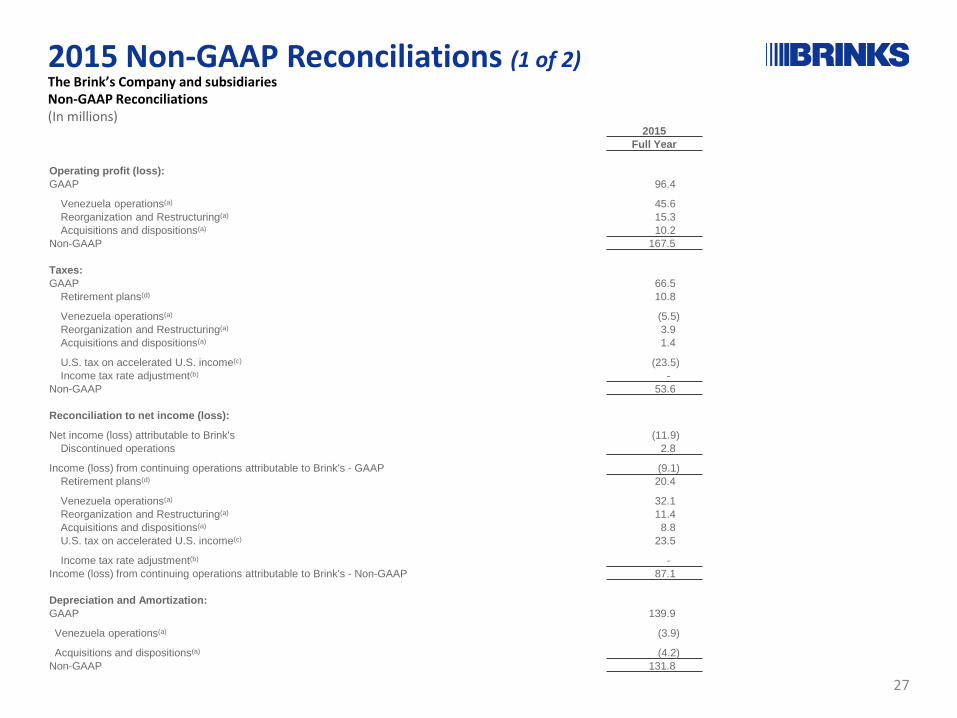
2015 Non-GAAP Reconciliations (1 of 2)The Brink’s Company and subsidiariesNon-GAAP Reconciliations (In millions)
2015Full Year
Operating profit (loss):GAAP 96.4
Venezuela operations(a) 45.6 Reorganization and Restructuring(a) 15.3 Acquisitions and dispositions(a) 10.2
Non-GAAP 167.5
Taxes:GAAP 66.5
Retirement plans(d) 10.8
Venezuela operations(a) (5.5)Reorganization and Restructuring(a) 3.9 Acquisitions and dispositions(a) 1.4
U.S. tax on accelerated U.S. income(c) (23.5)Income tax rate adjustment(b) -
Non-GAAP 53.6
Reconciliation to net income (loss):
Net income (loss) attributable to Brink's (11.9)Discontinued operations 2.8
Income (loss) from continuing operations attributable to Brink's - GAAP (9.1)Retirement plans(d) 20.4
Venezuela operations(a) 32.1 Reorganization and Restructuring(a) 11.4 Acquisitions and dispositions(a) 8.8 U.S. tax on accelerated U.S. income(c) 23.5
Income tax rate adjustment(b) -Income (loss) from continuing operations attributable to Brink's - Non-GAAP 87.1
Depreciation and Amortization:GAAP 139.9
Venezuela operations(a) (3.9)
Acquisitions and dispositions(a) (4.2)Non-GAAP 131.8
27
2015 Non-GAAP Reconciliations (2 of 2)The Brink’s Company and subsidiariesNon-GAAP Reconciliations (In millions)
2015Full Year
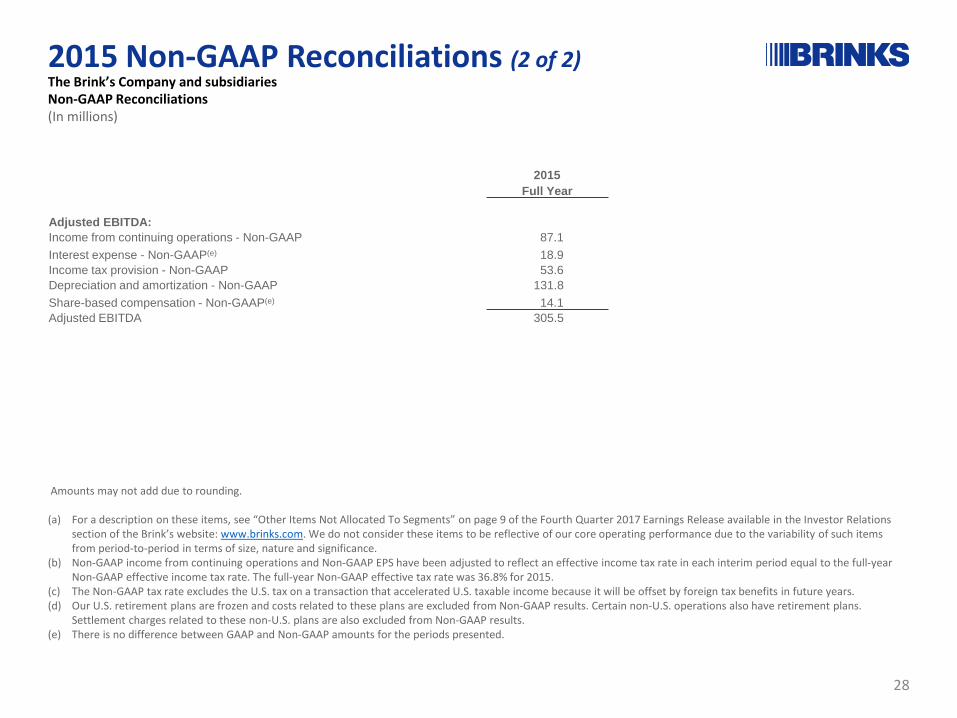
Adjusted EBITDA:Income from continuing operations - Non-GAAP 87.1 Interest expense - Non-GAAP(e) 18.9 Income tax provision - Non-GAAP 53.6 Depreciation and amortization - Non-GAAP 131.8 Share-based compensation - Non-GAAP(e) 14.1 Adjusted EBITDA 305.5
Amounts may not add due to rounding.
(a) For a description on these items, see “Other Items Not Allocated To Segments” on page 9 of the Fourth Quarter 2017 Earnings Release available in the Investor Relations section of the Brink’s website: www.brinks.com. We do not consider these items to be reflective of our core operating performance due to the variability of such items from period-to-period in terms of size, nature and significance.
(b) Non-GAAP income from continuing operations and Non-GAAP EPS have been adjusted to reflect an effective income tax rate in each interim period equal to the full-year Non-GAAP effective income tax rate. The full-year Non-GAAP effective tax rate was 36.8% for 2015.
(c) The Non-GAAP tax rate excludes the U.S. tax on a transaction that accelerated U.S. taxable income because it will be offset by foreign tax benefits in future years. (d) Our U.S. retirement plans are frozen and costs related to these plans are excluded from Non-GAAP results. Certain non-U.S. operations also have retirement plans.
Settlement charges related to these non-U.S. plans are also excluded from Non-GAAP results.(e) There is no difference between GAAP and Non-GAAP amounts for the periods presented.
28