Embed Size (px)
Citation preview
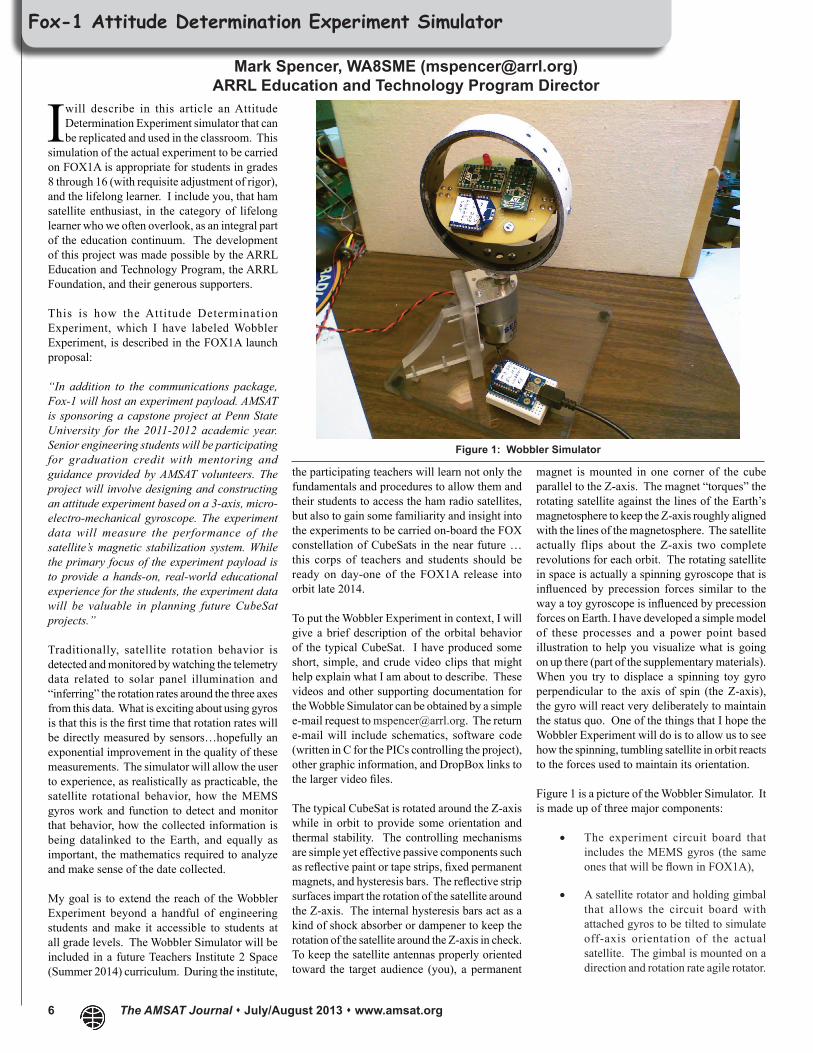
6 The AMSAT Journal July/August 2013 www.amsat.org
I will describe in this article an Attitude Determination Experiment simulator that can be replicated and used in the classroom. This
simulation of the actual experiment to be carried on FOX1A is appropriate for students in grades 8 through 16 (with requisite adjustment of rigor), and the lifelong learner. I include you, that ham satellite enthusiast, in the category of lifelong learner who we often overlook, as an integral part of the education continuum. The development of this project was made possible by the ARRL Education and Technology Program, the ARRL Foundation, and their generous supporters.
This is how the Attitude Determination Experiment, which I have labeled Wobbler Experiment, is described in the FOX1A launch proposal:
“In addition to the communications package, Fox-1 will host an experiment payload. AMSAT is sponsoring a capstone project at Penn State University for the 2011-2012 academic year. Senior engineering students will be participating for graduation credit with mentoring and guidance provided by AMSAT volunteers. The project will involve designing and constructing an attitude experiment based on a 3-axis, micro-electro-mechanical gyroscope. The experiment data will measure the performance of the satellite’s magnetic stabilization system. While the primary focus of the experiment payload is to provide a hands-on, real-world educational experience for the students, the experiment data will be valuable in planning future CubeSat projects.”
Traditionally, satellite rotation behavior is detected and monitored by watching the telemetry data related to solar panel illumination and “inferring” the rotation rates around the three axes from this data. What is exciting about using gyros is that this is the first time that rotation rates will be directly measured by sensors…hopefully an exponential improvement in the quality of these measurements. The simulator will allow the user to experience, as realistically as practicable, the satellite rotational behavior, how the MEMS gyros work and function to detect and monitor that behavior, how the collected information is being datalinked to the Earth, and equally as important, the mathematics required to analyze and make sense of the date collected.
My goal is to extend the reach of the Wobbler Experiment beyond a handful of engineering students and make it accessible to students at all grade levels. The Wobbler Simulator will be included in a future Teachers Institute 2 Space (Summer 2014) curriculum. During the institute,
the participating teachers will learn not only the fundamentals and procedures to allow them and their students to access the ham radio satellites, but also to gain some familiarity and insight into the experiments to be carried on-board the FOX constellation of CubeSats in the near future … this corps of teachers and students should be ready on day-one of the FOX1A release into orbit late 2014.
To put the Wobbler Experiment in context, I will give a brief description of the orbital behavior of the typical CubeSat. I have produced some short, simple, and crude video clips that might help explain what I am about to describe. These videos and other supporting documentation for the Wobble Simulator can be obtained by a simple e-mail request to [email protected]. The return e-mail will include schematics, software code (written in C for the PICs controlling the project), other graphic information, and DropBox links to the larger video files.
The typical CubeSat is rotated around the Z-axis while in orbit to provide some orientation and thermal stability. The controlling mechanisms are simple yet effective passive components such as reflective paint or tape strips, fixed permanent magnets, and hysteresis bars. The reflective strip surfaces impart the rotation of the satellite around the Z-axis. The internal hysteresis bars act as a kind of shock absorber or dampener to keep the rotation of the satellite around the Z-axis in check. To keep the satellite antennas properly oriented toward the target audience (you), a permanent
magnet is mounted in one corner of the cube parallel to the Z-axis. The magnet “torques” the rotating satellite against the lines of the Earth’s magnetosphere to keep the Z-axis roughly aligned with the lines of the magnetosphere. The satellite actually flips about the Z-axis two complete revolutions for each orbit. The rotating satellite in space is actually a spinning gyroscope that is influenced by precession forces similar to the way a toy gyroscope is influenced by precession forces on Earth. I have developed a simple model of these processes and a power point based illustration to help you visualize what is going on up there (part of the supplementary materials). When you try to displace a spinning toy gyro perpendicular to the axis of spin (the Z-axis), the gyro will react very deliberately to maintain the status quo. One of the things that I hope the Wobbler Experiment will do is to allow us to see how the spinning, tumbling satellite in orbit reacts to the forces used to maintain its orientation.
Figure 1 is a picture of the Wobbler Simulator. It is made up of three major components:
• The experiment circuit board that includes the MEMS gyros (the same ones that will be flown in FOX1A),
• A satellite rotator and holding gimbal that allows the circuit board with attached gyros to be tilted to simulate off-axis orientation of the actual satellite. The gimbal is mounted on a direction and rotation rate agile rotator.
Fox-1 Attitude Determination Experiment Simulator
Mark Spencer, WA8SME ([email protected])ARRL Education and Technology Program Director
Figure 1: Wobbler Simulator
The AMSAT Journal July/August 2013 www.amsat.org 7
• A datalink connection to a personal computer running Excel to receive and then manipulate and analyze the collected simulator data.
The heart of the Wobbler Experiment is the LPY403AL micro-electro-mechanical system (MEMS) dual axis gyro integrated circuit. The LPY403 is a low-power, dual axis micro-machined gyroscope capable of measuring angular rates up to + or – 30 degrees per second (dps). The sensing elements inside the gyro are driven masses kept in continuous oscillation that react to angular rate changes through the Coriolis principle. There is one sensor perpendicular (Z) and one sensor parallel (X or Y) to the device body. The output of these oscillating elements is a voltage that is proportional to the direction and rate of rotation, with a voltage of approximately 1.56 volts at rest (zero rotation), above the reference voltage for counter clockwise rotation (CCW) and below the reference voltage for clockwise rotation (CW). The angular rate is proportional to the deviation from the resting or reference voltage.
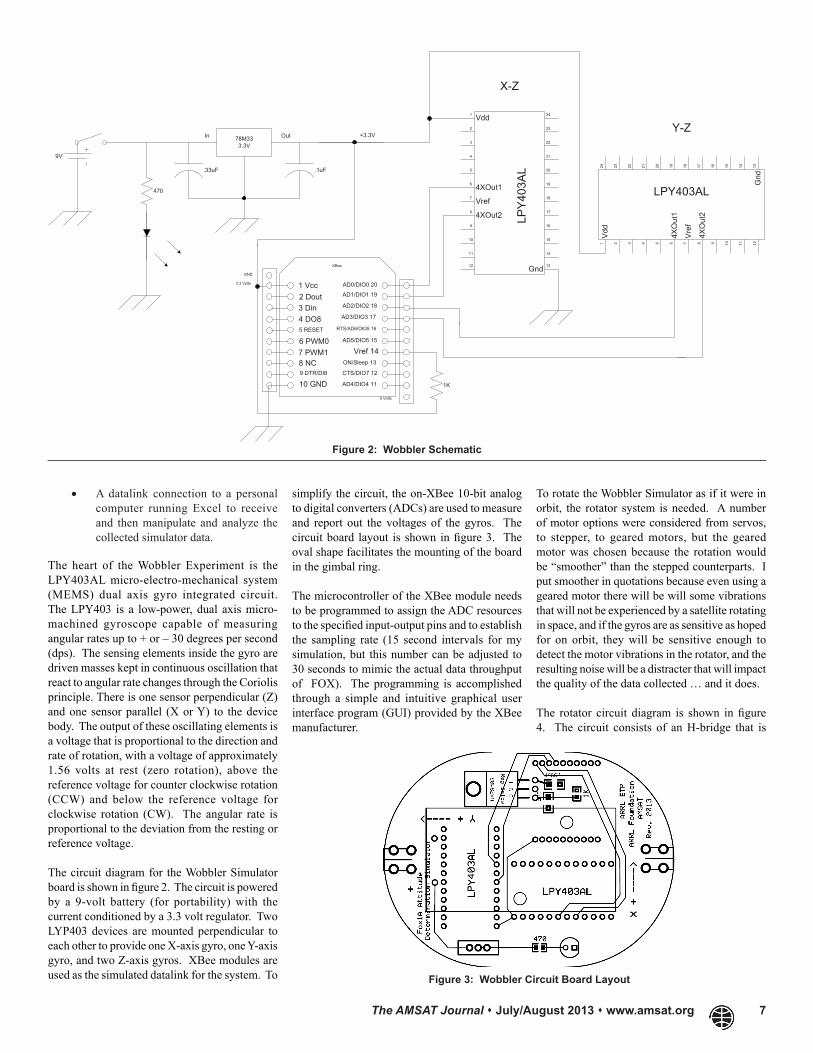
The circuit diagram for the Wobbler Simulator board is shown in figure 2. The circuit is powered by a 9-volt battery (for portability) with the current conditioned by a 3.3 volt regulator. Two LYP403 devices are mounted perpendicular to each other to provide one X-axis gyro, one Y-axis gyro, and two Z-axis gyros. XBee modules are used as the simulated datalink for the system. To
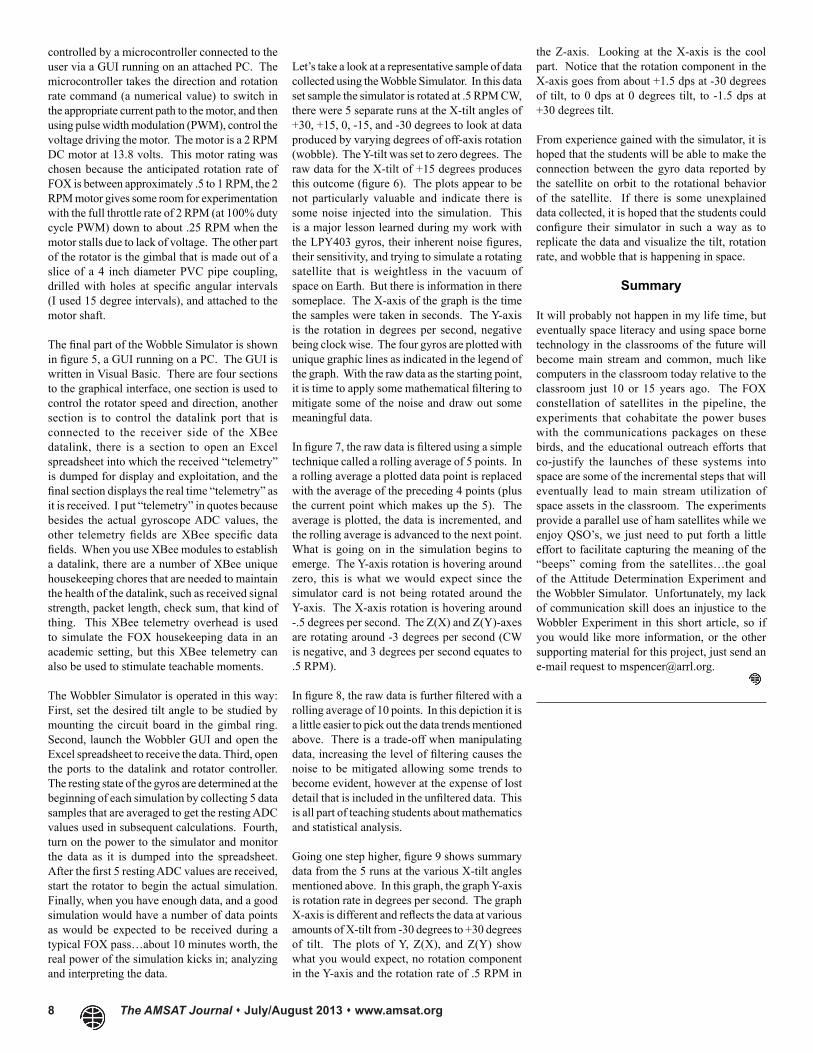
simplify the circuit, the on-XBee 10-bit analog to digital converters (ADCs) are used to measure and report out the voltages of the gyros. The circuit board layout is shown in figure 3. The oval shape facilitates the mounting of the board in the gimbal ring.
The microcontroller of the XBee module needs to be programmed to assign the ADC resources to the specified input-output pins and to establish the sampling rate (15 second intervals for my simulation, but this number can be adjusted to 30 seconds to mimic the actual data throughput of FOX). The programming is accomplished through a simple and intuitive graphical user interface program (GUI) provided by the XBee manufacturer.
To rotate the Wobbler Simulator as if it were in orbit, the rotator system is needed. A number of motor options were considered from servos, to stepper, to geared motors, but the geared motor was chosen because the rotation would be “smoother” than the stepped counterparts. I put smoother in quotations because even using a geared motor there will be will some vibrations that will not be experienced by a satellite rotating in space, and if the gyros are as sensitive as hoped for on orbit, they will be sensitive enough to detect the motor vibrations in the rotator, and the resulting noise will be a distracter that will impact the quality of the data collected … and it does.
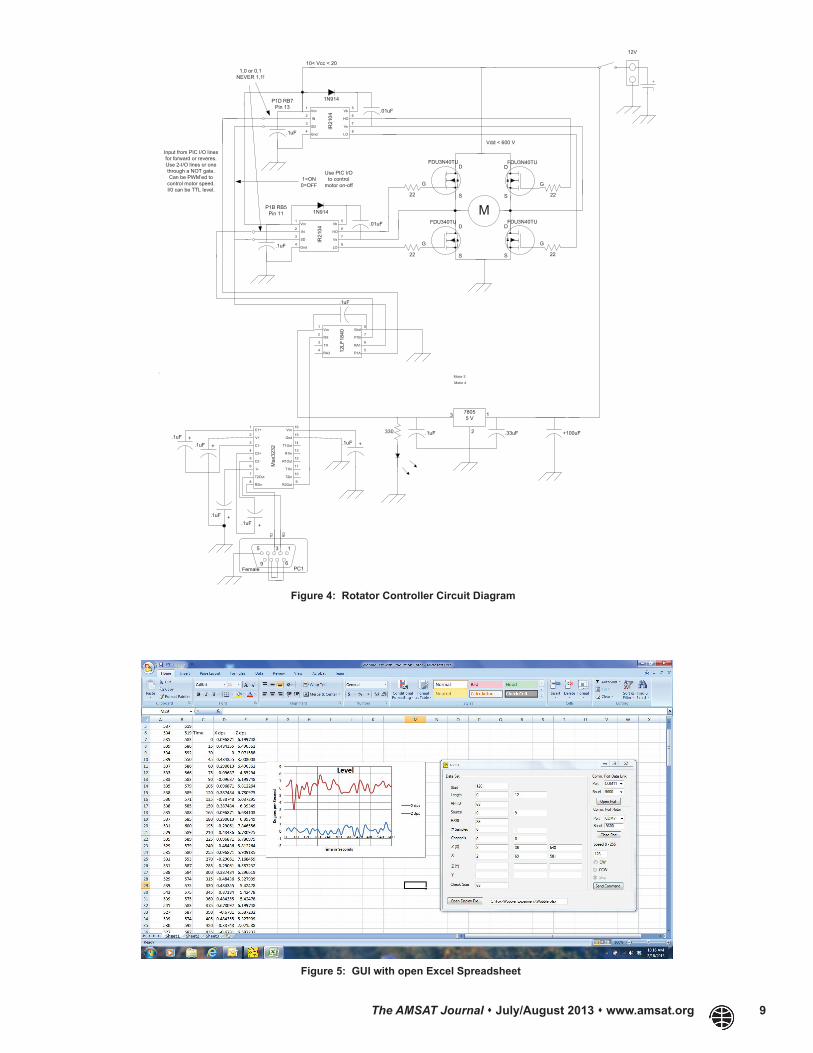
The rotator circuit diagram is shown in figure 4. The circuit consists of an H-bridge that is
1 Vcc
AD4/DIO4 1110 GND9 DTR/DI88 NC7 PWM16 PWM05 RESET
4 DO83 Din2 Dout
ON/Sleep 13
Vref 14
AD2/DIO2 18
AD0/DIO0 20
AD5/DIO5 15
RTS/AD6/DIO5 16
AD3/DIO3 17
AD1/DIO1 19
CTS/DIO7 12
XBee
GND
3.3 Volts
5 Volts
78M333.3V
.33uF .1uF
In Out +3.3V
9V
470
X-Z
1K
4
5
6 4XOut17 Vref
21
20
19
18
4XOut28
9
10
11
17
16
15
14
3 22
12 Gnd 13
2 23
Vdd1 24
LPY
403A
L
4 5 64X
Out
17
Vre
f
21 20 19 18
4XO
ut2
8 9 10 11
17 16 15 14
322
12G
nd13
223
Vdd
124
LPY403AL
Y-Z
Figure 2: Wobbler Schematic
Figure 3: Wobbler Circuit Board Layout
8 The AMSAT Journal July/August 2013 www.amsat.org
controlled by a microcontroller connected to the user via a GUI running on an attached PC. The microcontroller takes the direction and rotation rate command (a numerical value) to switch in the appropriate current path to the motor, and then using pulse width modulation (PWM), control the voltage driving the motor. The motor is a 2 RPM DC motor at 13.8 volts. This motor rating was chosen because the anticipated rotation rate of FOX is between approximately .5 to 1 RPM, the 2 RPM motor gives some room for experimentation with the full throttle rate of 2 RPM (at 100% duty cycle PWM) down to about .25 RPM when the motor stalls due to lack of voltage. The other part of the rotator is the gimbal that is made out of a slice of a 4 inch diameter PVC pipe coupling, drilled with holes at specific angular intervals (I used 15 degree intervals), and attached to the motor shaft.
The final part of the Wobble Simulator is shown in figure 5, a GUI running on a PC. The GUI is written in Visual Basic. There are four sections to the graphical interface, one section is used to control the rotator speed and direction, another section is to control the datalink port that is connected to the receiver side of the XBee datalink, there is a section to open an Excel spreadsheet into which the received “telemetry” is dumped for display and exploitation, and the final section displays the real time “telemetry” as it is received. I put “telemetry” in quotes because besides the actual gyroscope ADC values, the other telemetry fields are XBee specific data fields. When you use XBee modules to establish a datalink, there are a number of XBee unique housekeeping chores that are needed to maintain the health of the datalink, such as received signal strength, packet length, check sum, that kind of thing. This XBee telemetry overhead is used to simulate the FOX housekeeping data in an academic setting, but this XBee telemetry can also be used to stimulate teachable moments.
The Wobbler Simulator is operated in this way: First, set the desired tilt angle to be studied by mounting the circuit board in the gimbal ring. Second, launch the Wobbler GUI and open the Excel spreadsheet to receive the data. Third, open the ports to the datalink and rotator controller. The resting state of the gyros are determined at the beginning of each simulation by collecting 5 data samples that are averaged to get the resting ADC values used in subsequent calculations. Fourth, turn on the power to the simulator and monitor the data as it is dumped into the spreadsheet. After the first 5 resting ADC values are received, start the rotator to begin the actual simulation. Finally, when you have enough data, and a good simulation would have a number of data points as would be expected to be received during a typical FOX pass…about 10 minutes worth, the real power of the simulation kicks in; analyzing and interpreting the data.
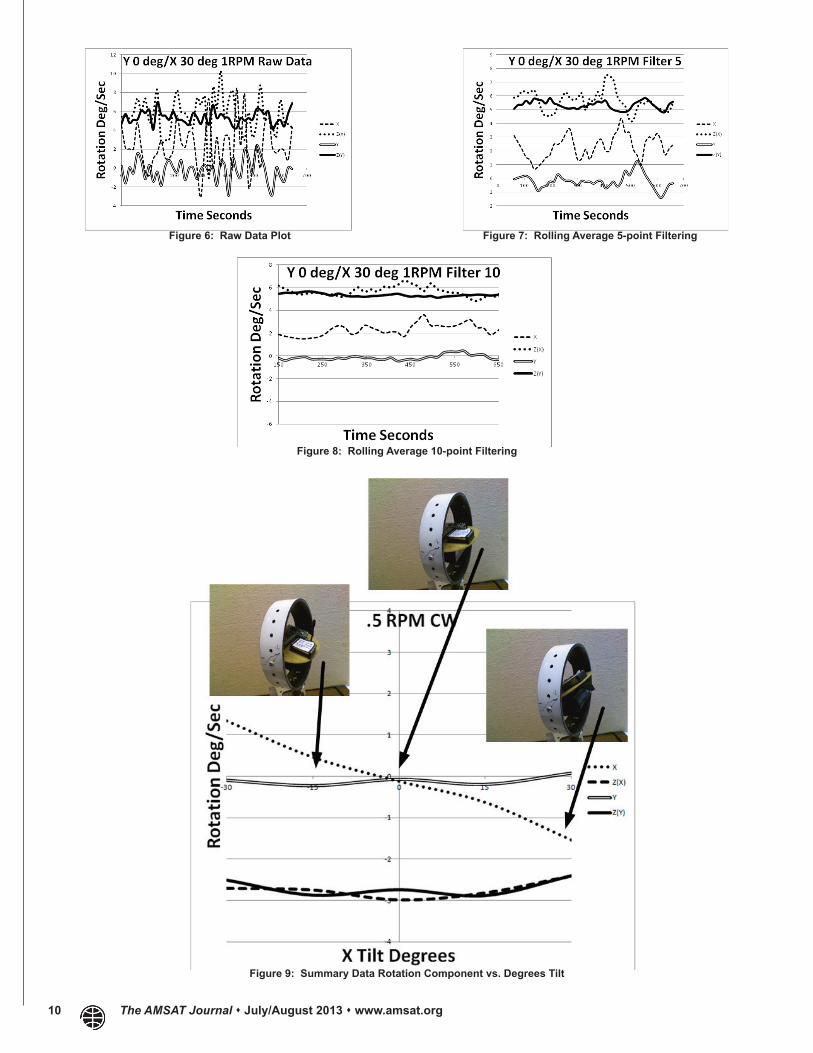
Let’s take a look at a representative sample of data collected using the Wobble Simulator. In this data set sample the simulator is rotated at .5 RPM CW, there were 5 separate runs at the X-tilt angles of +30, +15, 0, -15, and -30 degrees to look at data produced by varying degrees of off-axis rotation (wobble). The Y-tilt was set to zero degrees. The raw data for the X-tilt of +15 degrees produces this outcome (figure 6). The plots appear to be not particularly valuable and indicate there is some noise injected into the simulation. This is a major lesson learned during my work with the LPY403 gyros, their inherent noise figures, their sensitivity, and trying to simulate a rotating satellite that is weightless in the vacuum of space on Earth. But there is information in there someplace. The X-axis of the graph is the time the samples were taken in seconds. The Y-axis is the rotation in degrees per second, negative being clock wise. The four gyros are plotted with unique graphic lines as indicated in the legend of the graph. With the raw data as the starting point, it is time to apply some mathematical filtering to mitigate some of the noise and draw out some meaningful data.
In figure 7, the raw data is filtered using a simple technique called a rolling average of 5 points. In a rolling average a plotted data point is replaced with the average of the preceding 4 points (plus the current point which makes up the 5). The average is plotted, the data is incremented, and the rolling average is advanced to the next point. What is going on in the simulation begins to emerge. The Y-axis rotation is hovering around zero, this is what we would expect since the simulator card is not being rotated around the Y-axis. The X-axis rotation is hovering around -.5 degrees per second. The Z(X) and Z(Y)-axes are rotating around -3 degrees per second (CW is negative, and 3 degrees per second equates to .5 RPM).
In figure 8, the raw data is further filtered with a rolling average of 10 points. In this depiction it is a little easier to pick out the data trends mentioned above. There is a trade-off when manipulating data, increasing the level of filtering causes the noise to be mitigated allowing some trends to become evident, however at the expense of lost detail that is included in the unfiltered data. This is all part of teaching students about mathematics and statistical analysis.
Going one step higher, figure 9 shows summary data from the 5 runs at the various X-tilt angles mentioned above. In this graph, the graph Y-axis is rotation rate in degrees per second. The graph X-axis is different and reflects the data at various amounts of X-tilt from -30 degrees to +30 degrees of tilt. The plots of Y, Z(X), and Z(Y) show what you would expect, no rotation component in the Y-axis and the rotation rate of .5 RPM in
the Z-axis. Looking at the X-axis is the cool part. Notice that the rotation component in the X-axis goes from about +1.5 dps at -30 degrees of tilt, to 0 dps at 0 degrees tilt, to -1.5 dps at +30 degrees tilt.
From experience gained with the simulator, it is hoped that the students will be able to make the connection between the gyro data reported by the satellite on orbit to the rotational behavior of the satellite. If there is some unexplained data collected, it is hoped that the students could configure their simulator in such a way as to replicate the data and visualize the tilt, rotation rate, and wobble that is happening in space.
Summary
It will probably not happen in my life time, but eventually space literacy and using space borne technology in the classrooms of the future will become main stream and common, much like computers in the classroom today relative to the classroom just 10 or 15 years ago. The FOX constellation of satellites in the pipeline, the experiments that cohabitate the power buses with the communications packages on these birds, and the educational outreach efforts that co-justify the launches of these systems into space are some of the incremental steps that will eventually lead to main stream utilization of space assets in the classroom. The experiments provide a parallel use of ham satellites while we enjoy QSO’s, we just need to put forth a little effort to facilitate capturing the meaning of the “beeps” coming from the satellites…the goal of the Attitude Determination Experiment and the Wobbler Simulator. Unfortunately, my lack of communication skill does an injustice to the Wobbler Experiment in this short article, so if you would like more information, or the other supporting material for this project, just send an e-mail request to [email protected].
The AMSAT Journal July/August 2013 www.amsat.org 9
Vcc1
IN2
3SD
4Gnd
Vb
HO
Vs
LO
5
6
7
8
IR21
04
.01uF
1N914
.1uF
G
D
S
FDU3N40TU
22
G
D
S
FDU340TU
22
G
D
S
FDU3N40TU
22
G
D
S
FDU3N40TU
22
M
Vdd < 600 V
Vcc1
IN2
3SD
4Gnd
Vb
HO
Vs
LO
5
6
7
8
IR21
04
.01uF
1N914
.1uF
10< Vcc < 20
1=ON0=OFF
1,0 or 0,1NEVER 1,1!
Input from PIC I/O linesfor forward or reveres.Use 2-I/O lines or onethrough a NOT gate.Can be PWM’ed to
control motor speed.I/0 can be TTL level.
Use PIC I/Oto control
motor on-off
P1B RB5Pin 11
P1D RB7Pin 13
78055 V
.33uF2
13
.1uF
12V
Vcc1
Gnd8
RX2
P1B7
TX3
RA16
RA34
P1A512
LF18
40
C1+1
V+2
3C1-
4C2+
Vcc
Gnd
T1Out
R1In
16
15
14
13
C2-5
V-6
7T2Out
8R2In
R1Out
T1In
T2In
R2Out
12
11
10
9
Max
3232+.1uF
+.1uF
+.1uF
+.1uF
+.1uF
135
9 6
RD
TD
PC1Female
330
Motor 4
Motor 2
+100uF
.1uF
Figure 4: Rotator Controller Circuit Diagram
Figure 5: GUI with open Excel Spreadsheet
10 The AMSAT Journal July/August 2013 www.amsat.org
Figure 6: Raw Data Plot Figure 7: Rolling Average 5-point Filtering
Figure 8: Rolling Average 10-point Filtering
Figure 9: Summary Data Rotation Component vs. Degrees Tilt